Embed Size (px)
Citation preview
This article appeared in a journal published by Elsevier. The attachedcopy is furnished to the author for internal non-commercial researchand education use, including for instruction at the authors institution
and sharing with colleagues.
Other uses, including reproduction and distribution, or selling orlicensing copies, or posting to personal, institutional or third party
websites are prohibited.
In most cases authors are permitted to post their version of thearticle (e.g. in Word or Tex form) to their personal website orinstitutional repository. Authors requiring further information
regarding Elsevier’s archiving and manuscript policies areencouraged to visit:
http://www.elsevier.com/authorsrights
Author's personal copy
Investigation on supercritical CO2 extraction of phenolic-phytochemicals from an epiphytic plant tuber (Myrmecodia pendans)
Rebeca E. Sanjaya a,b,1, Yanuar Y. Tedjo a,1, Alfin Kurniawan a,1, Yi-Hsu Ju b, Aning Ayucitra a,Suryadi Ismadji a,*a Department of Chemical Engineering, Widya Mandala Surabaya Catholic University, Kalijudan 37, Surabaya 60114, Indonesiab Department of Chemical Engineering, National Taiwan University of Science and Technology, 43 Sec. 4, Keelung Road, Taipei 106, Taiwan
Introduction
Myrmecodia pendans (genus of Myrmecophytes), also locallyknown by indigenous Papuans as ant-nest is native to SoutheastAsia and it has now widely distributed to Australasian regions. Ant-nest has proven to be rich in bioactive constituents such asflavonoids, tocopherols, tannins and a variety of essential minerals,which are an important part of our diet. This tropical plant is highlyvalued as an alternative choice for cancer/tumor treatments and anefficacious herbal drug to prevent and cure various illnessesinclude hemorrhoid, ulcer, nosebleed, backache, skin rashes,allergy, gout, uric acid disorder, stroke, prostate, coronary heart,lung tuberculosis, rheumatism and diarrhea [1]. Many pharmacol-ogists and botanists strongly believe that the nutritional values aswell as powerful in vitro anti-cancer and antioxidant properties of
ant-nest are sourced from flavonoid compounds. The isolationtechnique of these compounds is therefore the primary interest tofully exploit this natural remedy for modern therapeutics and alsofor advances in the phytochemistry science.
The isolation of flavonoid compounds from M. pendans
employing various organic solvents has been conducted [2–4].Soeksmanto et al. extracted ant-nest with n-butanol, ethyl acetateand water and the anti-cancer activity of organic extracts wastested for inhibiting cancer cells derived from human cervix (HeLacells) and canine breast (MCM-B2 cells) [2]. Hertiani et al. studiedbioactivity of ant-nest extracts in vitro as an immunomodulatoryagent against Balb/c mice lymphocytes proliferation and macro-phage phagocytosis [3]. Engida and colleagues had successfullyidentified five flavonoids of ant-nest extract by HPLC technique,which includes kaempferol, luteolin, rutin, quercetin and apigenin[4]. They also studied antioxidant potential (IC50) of the extract andobtained comparable DPPH-scavenging performance with com-mercial ascorbic acid.
The conventional extraction operation of flavonoid compoundsusing organic solvents, although simple, possesses limitations suchas cost-prohibitive, unenvironmentally benign and non-selective,
Journal of CO2 Utilization 6 (2014) 26–33
A R T I C L E I N F O
Article history:
Received 3 July 2013
Received in revised form 1 March 2014
Accepted 14 March 2014
Available online
Keywords:
Ant-nest
Supercritical extraction
Antioxidant
Solubility
DPPH scavenging
A B S T R A C T
Myrmecodia pendans (ant-nest) is an epiphytic plant with rich content of phytochemicals. In this work,
the application of supercritical carbon dioxide (SC-CO2) for extracting several polyphenol and flavonoid
compounds from ant-nest tuber include gallic acid, catechin, ferulic acid, caffeic acid, p-coumaric acid,
quercetin, luteolin and kaempferol was investigated. Static-analytical extraction experiments were
performed at pressures ranged between 9–22.5 MPa and temperatures of 313.15–343.15 K for 6–7 h.
Solubility data of total polyphenols (gram gallic acid equivalent (GAE)/L CO2) and total flavonoids (gram
quercetin equivalent (QE)/L CO2) were modeled using Chrastil and Del Valle–Aguilera density-based
equations. Both equations were able to represent actual solubilities satisfactorily in terms of correlation
coefficient and parameter consistency. DPPH-scavenging test showed high antioxidant capacity of
supercritical extract with an IC50 level of 3.62 � 0.12 mg/mL. It was observed a positive linear correlation
between bioactive contents of antioxidant extract and the potency of scavenger activity against DPPH free
radical.
� 2014 Elsevier Ltd. All rights reserved.
* Corresponding author. Tel.: +62 31 389 1264; fax: +62 31 389 1267.
E-mail addresses: [email protected], [email protected]
(S. Ismadji).1 These authors contributed equally to this work.
Contents lists available at ScienceDirect
Journal of CO2 Utilization
jo ur n al ho m ep ag e: www .e ls evier . c om / lo cat e/ jc o u
http://dx.doi.org/10.1016/j.jcou.2014.03.001
2212-9820/� 2014 Elsevier Ltd. All rights reserved.
Author's personal copy
which requires post-treatment stages for purification of theproduct. The disposal of unrecyclable organic solvent may alsopose a risk to health and the environment. On the other hand, theextraction of flavonoid compounds using supercritical fluids is analternative viable for effective and greener extraction technologyon laboratory- and pilot-scale. The working procedure is relativelysimple and high purity extract can be easily obtained. The practicaladvantages of carbon dioxide as a supercritical fluid include cheap,inert, readily available in high purity, non-toxic, non-flammableand non-explosive have made it highly desired for isolating variousheat-labile compounds from various plant and animal materialssuch as antioxidants [5], pigments [6], flavors [7], fragrances [8],lipids [9] and essential oils [10] at near-ambient temperature. Also,the recovery process of product is accomplished by simplepressure reduction and leaving no solvent residue thus does notaffect the aroma or taste of the final product.
Considering SC-CO2 extraction of polyphenolic compoundsfrom plant materials, a nearly complete recovery can be achievedwithout adding a modifier (co-solvent). Gelmez et al. extractedphenolics and tocopherols from roasted wheat germ where 91% ofphenolics and tocopherols in wheat germ oil were recovered usingpure SC-CO2 at 442 bar and 313.15 K [11]. In the study conductedby Piantino et al. [12], four phenolic compounds in Baccharis
dracunculifolia leaves were extracted by SC-CO2 without a co-solvent and they obtained higher yields of individual phenolics inthe supercritical extract than that from conventional ethanolicextraction. It has been shown that some phenolic acids and theiresters are readily soluble in SC-CO2 [13–15] while the addition ofco-solvents would be required to increase solubilities of highmolecular weight phenolics. Since there is no single study dealingwith SC-CO2 utilization for extraction of phenolic-phytochemicalcompounds from ant-nest tuber, this study aims to evaluate the co-solvent free SC-CO2 extraction performance and determine totalcontents of polyphenols and flavonoids in the antioxidant extracts.The effects of extraction parameters (pressure and temperature)on the extraction yields and compositions are studied. Mathemat-ical modeling of solubility data of total polyphenol content andtotal flavonoid content by Chrastil and Del Valle–Aguilera density-based models was conducted. The scavenging activity of antioxi-dant extract against stable 2,2-diphenyl-1-picrylhydrazyl (DPPH)free radical was assayed and the scavenging performance wascompared with commercial gallic acid.
Experimental
Materials
Dried ant-nest tuber was purchased from a local medicine storein Wamena city, Papua, Indonesia. This plant material wascollected by indigenous Papuans from forest areas of CentralMountains in Jayawijaya district (1388300–1398400 east longitudeand 38450–48200 south latitude). The chemical compositions of ant-nest tuber were determined as per standard methods: moisture of4.36% (vacuum oven-drying method, AOAC 934.01), crude proteinof 2.75% (Kjeldahl method, AOAC 984.13), crude fat of 2.68% (acidhydrolysis method, AOAC 954.02), crude fiber of 4.84% (soxhletmethod, AOAC 962.09), ash of 3.22% (ash oven method, AOAC920.153) and total carbohydrates of 82.15% (by difference). Prior toextraction, dried ant-nest tuber was pulverized by a laboratory-scale grinder and sieved through 30/40 mesh screens. The productwas then stored in a cold storage at 4–5 8C. Food grade liquid CO2
with a minimum purity of 99.9% was supplied by a local gascompany. Folin-Ciocalteu’s phenol reagent, 2,2-diphenyl-1-picryl-hydrazyl (DPPH), gallic acid (99%), caffeic acid (HPLC grade, 98%),p-coumaric acid (HPLC grade, 98%), ferulic acid (99%), (�)-epicatechin (HPLC grade, 90%), (+)-catechin hydrate (HPLC grade,
98%), rutin (HPLC grade, 94%), kaempferol (HPLC grade, 97%),apigenin (HPLC grade, 95%), luteolin (TLC grade, 98%) and quercetin(HPLC grade, 95%) were obtained from Sigma Aldrich Co.,Singapore. Other chemicals such as ethanol, potassium acetate,anhydrous sodium carbonate, acetonitrile, aluminum chloride andacetic acid glacial were obtained from Merck, Germany. Distilledwater was used throughout the experiments.
Supercritical extraction apparatus
Bench-scale supercritical extractor in this work was custom-manufactured, consisting of a 150 mL high-pressure double-endedextraction vessel, horizontal reciprocating pump with dual inletports (Eldex AA-100-S-2), a pressure transducer (Druck PTX 611)connected to digital pressure indicator (Druck DPI 280), atemperature-controlled oven as the heating chamber (MemmertUNB500), a vacuum pump (GAST DOA-P504-BN) and a calibratedwet gas flow meter (ZEAL DM3B). All tube fittings and micro-metering valves were made of 316SS-grade stainless steel(Swagelok, USA). The maximum working pressure and workingtemperature of supercritical extraction unit are 40 MPa and473.15 K, respectively.
Extraction procedures
Soxhlet extraction experiments were conducted at atmosphericpressure and 343.15 K. Ten grams of dried powdered plant werewrapped with a filter paper and placed in the glass extractionthimble. Then, 250 mL 96% ethanol was transferred into a three-neck round bottom flask and heated by an electrothermal heatingmantle (Barnstead EMA500/CEB). Both the flask and thimble weresealed tightly with Al foil to prevent light interference. A seven-bulb condenser filled with flowing water at 20–25 8C was used as acooling media to condense solvent vapor and a thermometer forsensing temperature. The extraction process was carried out for 4–5 h until clear liquid was obtained in the glass capillary column.Afterward, the system was cooled and the extract was removedfrom the flask. The product was stored in an amber bottle undercold condition prior to analysis.
Supercritical CO2 extraction experiments were performed in astatic-analytical mode because it is simpler and allowed to conductextraction with less fluid than with dynamic extraction. Briefly, aknown amount of ant-nest powder (�10 g) was introduced intohigh-pressure equilibration vessel packed with clean glass beads. Atboth ends of the vessel, sintered stainless steel filters (50 mm) wereinstalled to prevent any carryover of the solid particles. Prior toextraction, the vessel was evacuated using a vacuum pump. Then, thevessel was heated from room temperature to operating temperatures(313.15 K, 323.15 K, 333.15 K and 343.15 K). Once the operatingtemperature was reached, liquid CO2 was charged to the system by areciprocating pump at constant flow rate of 10 mL/min andcompressed to desired pressures in the range of 9–22.5 MPa. Theextraction process was performed for 6–7 h to attain equilibrium.Determination of equilibrium time was based on the condition whenthe amounts of extracted analytes in SC-CO2 no longer change withtime. During this period, temperature was controlled with a precisionof �1 K and pressure was monitored electronically by a digitaltransducer system to establish isobar and isothermal conditions.After a given extraction period was accomplished, the outletmicrometering valve was opened to depressurize saturated CO2-richphase while pressure was maintained constant inside the vessel. Aprecipitated fraction was collected in a trapping flask containingsome volume of 96% ethanol. To prevent freezing and possible soluteprecipitation during depressurization, the discharge channel wasgently heated with an electrical heating mantle. The expanded gaswas escaped through a vent needle mounted on the trapping flask and
R.E. Sanjaya et al. / Journal of CO2 Utilization 6 (2014) 26–33 27
Author's personal copy
total volume of analytes-free ambient gas was measured by acalibrated wet gas flow meter at a known pressure and temperature(�0.05 L). The collected samples were stored in an amber bottle at4 8C for further use. Tubings and valves throughout the extractionapparatus were cleaned with ethanol at the end of each run to ensuregood quantification. The equilibrium loading (solubility) at a givenpressure and temperature was determined by quantifying the mass ofanalytes collected in the trapping solvent for a given volume of CO2.Extraction yield was determined gravimetrically and expressed aspercentage of weight of the extract collected to the original sample.
Determination of total polyphenol content (TPC)
Total polyphenol content was determined by Folin-Ciocalteuspectrophotometric assay [16]. Briefly, 1 mL aliquot (ethanolicsolution of extract) was mixed with 5 mL 1:10 dilution of Folin-Ciocalteu’s phenol reagent and vortexed for 5 min. Then, 4 mLsaturated Na2CO3 solution (75 g/L) was added and the mixture wasincubated in dark for 2 h at room temperature. Blank wasconcomitantly prepared, containing 0.5 mL ethanol, 2.5 mL 10%(v/v) Folin-Ciocalteu’s phenol reagent and 2.5 mL 7.5% Na2CO3
solution by the same procedure. Dilutions were made whenneeded. The absorbance was read at 764.6 nm on a Shimadzu 1700UV/vis spectrophotometer. The standard solutions of gallic acid atfive different concentrations (0.4–2 mM) were used to prepare thecalibration curve. Three replications were performed for each run.The results were expressed as milligram gallic acid equivalent (mgGAE) per gram dry plant. Here, the justification for expressing amixture of polyphenols as a single number (GAE) is because gallicacid is the significant phenolic unit in most macromolecularcomplexes; also this hydroxybenzoic acid is inexpensive, watersoluble, readily dried, recrystallized easily from water and stable indry form [16].
Determination of total flavonoid content (TFC)
Total flavonoid content was assayed by modified aluminumchloride colorimetric assay [17]. The procedure was described asfollows: 1 mL of aliquot was separately mixed with 3 mL 95%ethanol, 0.2 mL 10% aluminum chloride, 0.2 mL 1 M potassiumacetate and 5.6 mL distilled water in a series of test tubes. Themixtures were allowed to stand for 30 min at room temperatureprior to spectrophotometric determination. The absorbance wasread at 415.2 nm. Blank was prepared in similar way withoutadding aluminum chloride (the volume of 10% AlCl3 solution wasreplaced by the same volume of distilled water). The calibrationcurve was prepared from standard solutions of quercetin atvarying concentrations of 12.5 mg/mL, 25 mg/mL, 50 mg/mL,75 mg/mL and 100 mg/mL in ethanol. The results were expressedas milligram quercetin equivalent (mg QE)/g dry plant. Here,quercetin was selected as a standard for calibration and torepresent total flavonoids as a single number (QE) because thecomplex formed between quercetin and aluminum chloride gave amore sensitive absorbance reading at 415 nm among otherflavonoid standards such as rutin, apigenin, morin or luteolin[17]. Additionally, quercetin belongs to flavonols which are widelyfound in plant materials.
Determination of total antioxidant capacity
Total antioxidant capacity was estimated by DPPH scavengingactivity using the modified method of Blois [18]. A known amountof aliquot (0.1 mL) was mixed with 0.5 mL of 0.5 mM DPPHsolution in ethanol and 0.4 mL of 0.1 M Tris–CIH buffer (pH 7.4).The mixture was aged for 30 min in a dark chamber. Theabsorbance of the mixture was measured at 517.3 nm. The
following equation was applied to determine the deteriorationrate of stable free radical DPPH species at a characteristicwavelength in presence of the sample:
Scavenging percentageð%Þ ¼ 1 � As
A0
� �� 100 (1)
where As and A0 are the absorbance of extract and DPPH solution ascontrol, respectively. Gallic acid solutions of different concentra-tions ranging from 0.1 mg/mL to 10 mg/mL were employed aspositive control.
Quantification of polyphenol compounds
High performance liquid chromatography (HPLC) is one ofversatile instrumental techniques in analytical chemistry andbiochemistry with the purposes of separating, identifying andquantifying individual components contained in a sample that canbe dissolved in HPLC compatible liquid [19]. The chromatographicinstrument consists of a quaternary low pressure gradient pump(Jasco PU-2089 Plus), a dual/multi-wavelength intelligent UV/visdetector (Jasco UV-2077 Plus) and a LC-NetII/ADC hardwareinterface system for data acquisition. The analysis was performedfollowing a method described by Weiss et al. [20] with somemodifications. All samples were filtered through a 0.22 mm PVDFsyringe filter prior to injection. The chromatogram was acquired ina SGE Enduro C18-5 mm-120 A reversed-phase HPLC column(250 mm � 4.6 mm ID). The samples were eluted with a lineargradient elution of mobile phases A and B. Solvent A was consistedof 3% (v/v) acetic acid in distilled water and solvent B was consistedof a mixture of acetonitrile and 3% acetic acid in water (97:3, v/v).Acetic acid was added to increase the peak resolution. Flow ratewas set at 1.0 mL/min and 30 8C. The gradient elution wasprogrammed as follows: isocratic at 10% phase B (10 min), linearincrease of phase B from 10% to 20% (5 min), isocratic at 20% phaseB (10 min), 20% B–32% B (13 min), 32% B–46% B (12 min), 46% B–55% B (5 min), 55% B–100% B (5 min), 100% B isocratic (8 min),100% B–10% B (2 min) and 10% B isocratic (5 min). Total run timewas 75 min. The injection volume was 20 mL. Polyphenolcompounds were separately monitored at 280 nm (hydroxyben-zoic acids), 320 nm (hydroxycinnamic acids) and 360 nm (flavonesand flavonols) for maximizing detection sensitivity. Identificationof peaks was conducted by matching retention time and UV/visspectra with those previously obtained from the injection ofauthentic standards of known identity and purity. Calibrationcurves were used to quantify the concentrations of eachcompound. Data were recorded and processed using a JascoChromNav software system (Version 1.18.04, build 6) availablewithin the instrument.
Statistical analysis
All measurements were reported as mean � standard deviation(SD) for three replications. One-way analysis of variance (ANOVA)using Minitab 16 software was conducted to examine statisticalsignificance and post hoc comparisons between means were obtainedby means of Duncan’s multiple range tests. Significant differencebetween groups was statistically considered at 95% confidence level(p-values <5%).
Results and discussion
Densities of SC-CO2 at various pressures and temperatures
The liquid-like solvent power and gas-like diffusion ability aretwo main attracting features of supercritical fluids which allow
R.E. Sanjaya et al. / Journal of CO2 Utilization 6 (2014) 26–3328
Author's personal copy
such fluids to have an exceptional extraction capability. The cubicequation of state proposed by Peng and Robinson [21] was appliedto compute density of SC-CO2 in dependence on pressure andtemperature with the aid of ChemCAD software (Version 6.4,ChemstationsTM). Details about calculation procedure can be foundelsewhere [22]. The values of Tc, Pc and v for CO2 are 304.25 K,7.39 MPa and 0.225, respectively.
It is well-reported that the density of SC-CO2 increased withincreasing pressures at a given temperature. At higher pressure,the available volume occupied by the molecules becomes lesserdue to compression action, causing the intermolecular spaces to becloser and consequently greater density of the fluid. The density ofSC-CO2 ranged between 549.98 g/L and 879.26 g/L at pressures of9–22.5 MPa and 313.15 K. As comparison, the density of liquidethanol at ambient pressure and temperature is 789.0 g/L.Therefore, higher densities of SC-CO2 at nearly ambient tempera-ture (313.15 K) were noted in the range of pressures from 1.65 MPato 2.25 MPa. An opposite behavior was observed between densityand temperature in which higher temperature causes the fluiddensity to decrease. This phenomenon may be ascribed to greatermolar volume at higher temperature. Since molar volume anddensity are inversely proportional hence the higher the molarvolume, the lower is the density and vice versa.
Chemical compositions and extraction yields of antioxidant extracts
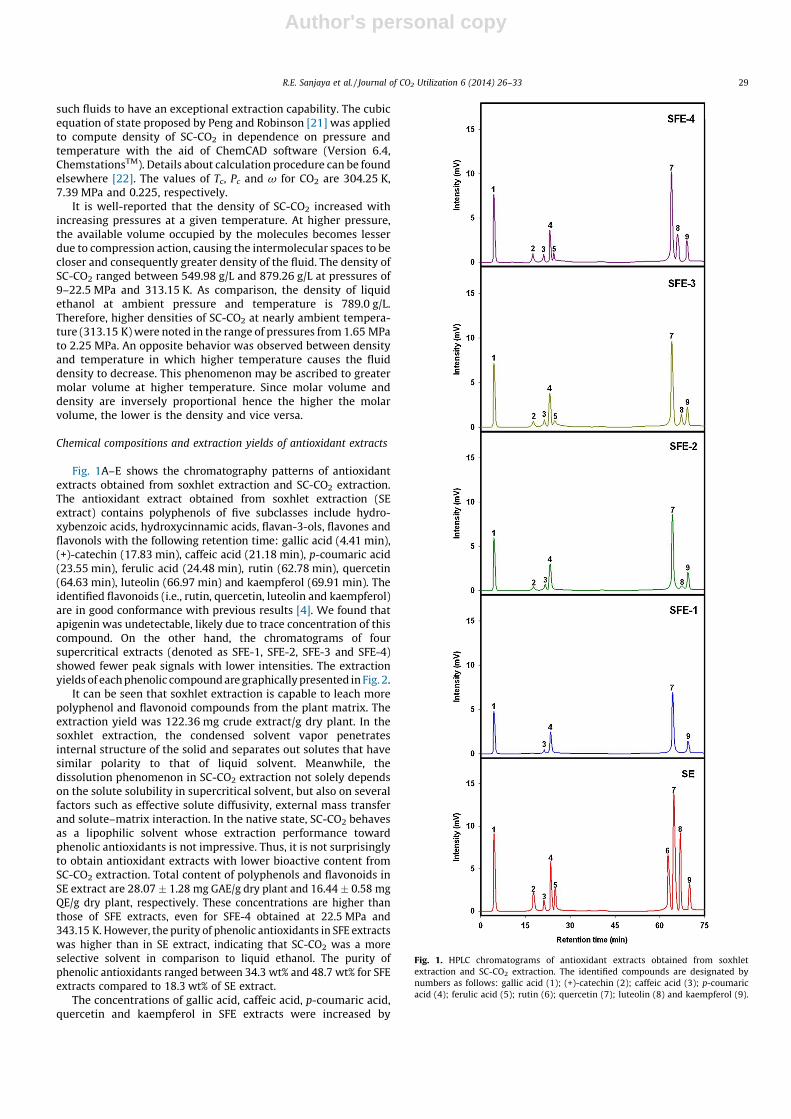
Fig. 1A–E shows the chromatography patterns of antioxidantextracts obtained from soxhlet extraction and SC-CO2 extraction.The antioxidant extract obtained from soxhlet extraction (SEextract) contains polyphenols of five subclasses include hydro-xybenzoic acids, hydroxycinnamic acids, flavan-3-ols, flavones andflavonols with the following retention time: gallic acid (4.41 min),(+)-catechin (17.83 min), caffeic acid (21.18 min), p-coumaric acid(23.55 min), ferulic acid (24.48 min), rutin (62.78 min), quercetin(64.63 min), luteolin (66.97 min) and kaempferol (69.91 min). Theidentified flavonoids (i.e., rutin, quercetin, luteolin and kaempferol)are in good conformance with previous results [4]. We found thatapigenin was undetectable, likely due to trace concentration of thiscompound. On the other hand, the chromatograms of foursupercritical extracts (denoted as SFE-1, SFE-2, SFE-3 and SFE-4)showed fewer peak signals with lower intensities. The extractionyields of each phenolic compound are graphically presented in Fig. 2.
It can be seen that soxhlet extraction is capable to leach morepolyphenol and flavonoid compounds from the plant matrix. Theextraction yield was 122.36 mg crude extract/g dry plant. In thesoxhlet extraction, the condensed solvent vapor penetratesinternal structure of the solid and separates out solutes that havesimilar polarity to that of liquid solvent. Meanwhile, thedissolution phenomenon in SC-CO2 extraction not solely dependson the solute solubility in supercritical solvent, but also on severalfactors such as effective solute diffusivity, external mass transferand solute–matrix interaction. In the native state, SC-CO2 behavesas a lipophilic solvent whose extraction performance towardphenolic antioxidants is not impressive. Thus, it is not surprisinglyto obtain antioxidant extracts with lower bioactive content fromSC-CO2 extraction. Total content of polyphenols and flavonoids inSE extract are 28.07 � 1.28 mg GAE/g dry plant and 16.44 � 0.58 mgQE/g dry plant, respectively. These concentrations are higher thanthose of SFE extracts, even for SFE-4 obtained at 22.5 MPa and343.15 K. However, the purity of phenolic antioxidants in SFE extractswas higher than in SE extract, indicating that SC-CO2 was a moreselective solvent in comparison to liquid ethanol. The purity ofphenolic antioxidants ranged between 34.3 wt% and 48.7 wt% for SFEextracts compared to 18.3 wt% of SE extract.
The concentrations of gallic acid, caffeic acid, p-coumaric acid,quercetin and kaempferol in SFE extracts were increased by
Fig. 1. HPLC chromatograms of antioxidant extracts obtained from soxhlet
extraction and SC-CO2 extraction. The identified compounds are designated by
numbers as follows: gallic acid (1); (+)-catechin (2); caffeic acid (3); p-coumaric
acid (4); ferulic acid (5); rutin (6); quercetin (7); luteolin (8) and kaempferol (9).
R.E. Sanjaya et al. / Journal of CO2 Utilization 6 (2014) 26–33 29
Author's personal copy
increasing extraction temperature. Interestingly, two or morephenolic compounds such as (+)-catechin, ferulic acid and luteolinwere detected in SFE-2, SFE-3 and SFE-4 chromatograms, whichmight be attributed to improved extraction performance of SC-CO2
toward more polar and high molecular weight compounds as aresult of synergistic action between pressure and temperature. Inthis work, the use of co-solvent to improve extractability ofphenolic antioxidants is not considered because it would compli-cate further downstream processing and also several co-solvents(e.g., methanol, propylene glycol, chloroform or ethyl acetate) maynot be environmentally acceptable. Another explanation is thatseveral phenolic acids include gallic acid, ferulic acid, kaempferoland p-coumaric acid is readily soluble in SC-CO2 according toprevious studies [13–15].
Analysis of TPC and TFC of antioxidant extracts
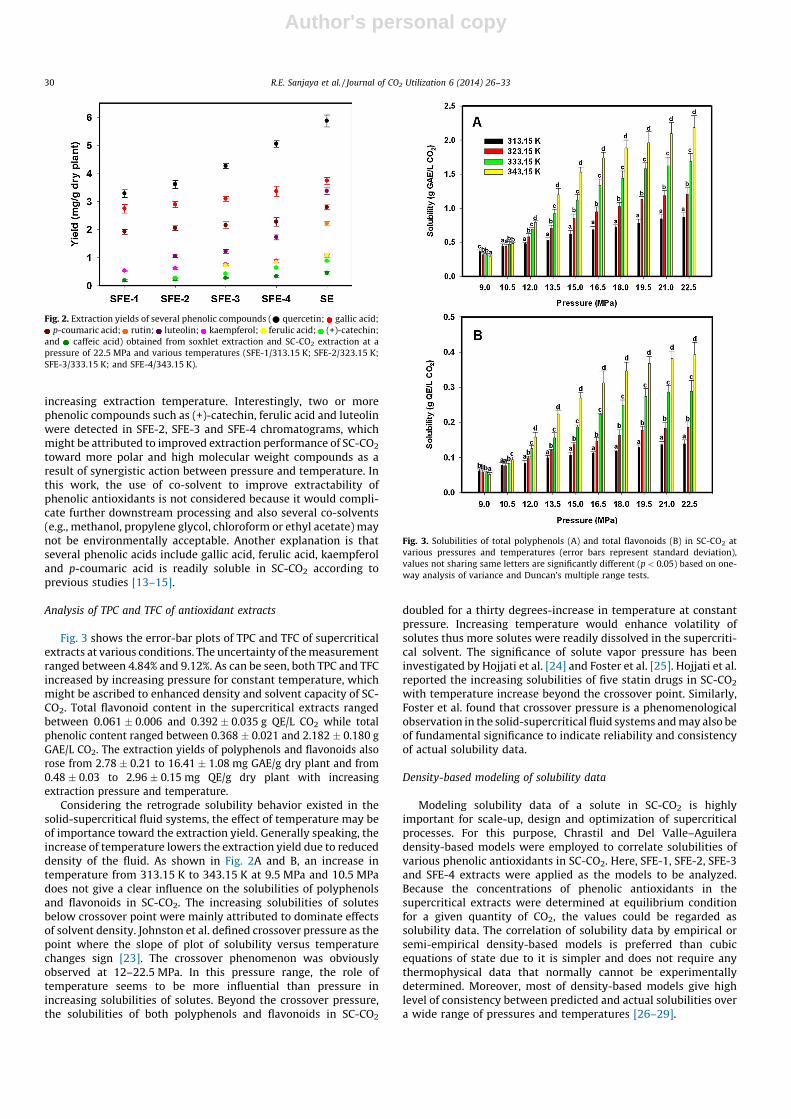
Fig. 3 shows the error-bar plots of TPC and TFC of supercriticalextracts at various conditions. The uncertainty of the measurementranged between 4.84% and 9.12%. As can be seen, both TPC and TFCincreased by increasing pressure for constant temperature, whichmight be ascribed to enhanced density and solvent capacity of SC-CO2. Total flavonoid content in the supercritical extracts rangedbetween 0.061 � 0.006 and 0.392 � 0.035 g QE/L CO2 while totalphenolic content ranged between 0.368 � 0.021 and 2.182 � 0.180 gGAE/L CO2. The extraction yields of polyphenols and flavonoids alsorose from 2.78 � 0.21 to 16.41 � 1.08 mg GAE/g dry plant and from0.48 � 0.03 to 2.96 � 0.15 mg QE/g dry plant with increasingextraction pressure and temperature.
Considering the retrograde solubility behavior existed in thesolid-supercritical fluid systems, the effect of temperature may beof importance toward the extraction yield. Generally speaking, theincrease of temperature lowers the extraction yield due to reduceddensity of the fluid. As shown in Fig. 2A and B, an increase intemperature from 313.15 K to 343.15 K at 9.5 MPa and 10.5 MPadoes not give a clear influence on the solubilities of polyphenolsand flavonoids in SC-CO2. The increasing solubilities of solutesbelow crossover point were mainly attributed to dominate effectsof solvent density. Johnston et al. defined crossover pressure as thepoint where the slope of plot of solubility versus temperaturechanges sign [23]. The crossover phenomenon was obviouslyobserved at 12–22.5 MPa. In this pressure range, the role oftemperature seems to be more influential than pressure inincreasing solubilities of solutes. Beyond the crossover pressure,the solubilities of both polyphenols and flavonoids in SC-CO2
doubled for a thirty degrees-increase in temperature at constantpressure. Increasing temperature would enhance volatility ofsolutes thus more solutes were readily dissolved in the supercriti-cal solvent. The significance of solute vapor pressure has beeninvestigated by Hojjati et al. [24] and Foster et al. [25]. Hojjati et al.reported the increasing solubilities of five statin drugs in SC-CO2
with temperature increase beyond the crossover point. Similarly,Foster et al. found that crossover pressure is a phenomenologicalobservation in the solid-supercritical fluid systems and may also beof fundamental significance to indicate reliability and consistencyof actual solubility data.
Density-based modeling of solubility data
Modeling solubility data of a solute in SC-CO2 is highlyimportant for scale-up, design and optimization of supercriticalprocesses. For this purpose, Chrastil and Del Valle–Aguileradensity-based models were employed to correlate solubilities ofvarious phenolic antioxidants in SC-CO2. Here, SFE-1, SFE-2, SFE-3and SFE-4 extracts were applied as the models to be analyzed.Because the concentrations of phenolic antioxidants in thesupercritical extracts were determined at equilibrium conditionfor a given quantity of CO2, the values could be regarded assolubility data. The correlation of solubility data by empirical orsemi-empirical density-based models is preferred than cubicequations of state due to it is simpler and does not require anythermophysical data that normally cannot be experimentallydetermined. Moreover, most of density-based models give highlevel of consistency between predicted and actual solubilities overa wide range of pressures and temperatures [26–29].
Fig. 2. Extraction yields of several phenolic compounds (* quercetin; gallic acid;
p-coumaric acid; rutin; luteolin; kaempferol; ferulic acid; (+)-catechin;
and caffeic acid) obtained from soxhlet extraction and SC-CO2 extraction at a
pressure of 22.5 MPa and various temperatures (SFE-1/313.15 K; SFE-2/323.15 K;
SFE-3/333.15 K; and SFE-4/343.15 K).
Fig. 3. Solubilities of total polyphenols (A) and total flavonoids (B) in SC-CO2 at
various pressures and temperatures (error bars represent standard deviation),
values not sharing same letters are significantly different (p < 0.05) based on one-
way analysis of variance and Duncan’s multiple range tests.
R.E. Sanjaya et al. / Journal of CO2 Utilization 6 (2014) 26–3330
Author's personal copy
Chrastil was the first who developed a density-based modelfrom the conception of chemical association laws and/or entropiesof the components for correlating solubility of solids and liquids indense gases [30]. He suggested that solute and solvent moleculesare interacted each other to form a solvato complex, which is inequilibrium with supercritical solvent, according to the followingreaction:
A þ kB $ ðABÞk (2)
From reaction above, one molecule of solute A associates with k
molecules of solvent B to form a solvato complex of (ABk) atequilibrium. The values of constant k are not an integer and oftendefined as an average association number for a given solute-supercritical solvent pair. This model expressed a linear relation-ship between logarithmic solubility of solute in pure supercriticalsolvent and that of solvent density and temperature as follows:
c ¼ rkexpa
T þ b
� �(3)
where c is the solubility of solute (kg/m3), r is solvent density (kg/m3), T is temperature (K), a is a function of enthalpy of solvation(DHsolv) and enthalpy of vaporization (DHvap) and b is a function ofaverage association number that depends on molecular weight ofsolute and solvent. The values of adjustable constants a, b and k arespecific for each solute-solvent pair and independent on tempera-ture and pressure.
The second semi-empirical density-based model used was DelValle and Aguilera. They proposed a modification to Chrastilmodel to compensate for variation of vaporizing enthalpy withtemperature [31]. The model has a mathematical expression as
follows:
c ¼ rkexpa
Tþ b þ c
T2
� �(4)
where c/T2 is an adjustable term added to account for variation ofsolute’s vaporizing heat with temperature. This four-parametermodel has proven to adequately predict solubility data under100 g/L within 293–353 K and 150–880 atm [31]. The agreementbetween the model predictions and experimental solubility data isevaluated based on the absolute average relative deviation (AARD)as an objective function:
AARDð%Þ ¼ 100
N
XN
i¼1
yicalc � yi
exp
yiexp
�������� (5)
where N is the number of experimental data, ycalci and yexp
i are thecalculated and actual solubility values, respectively.
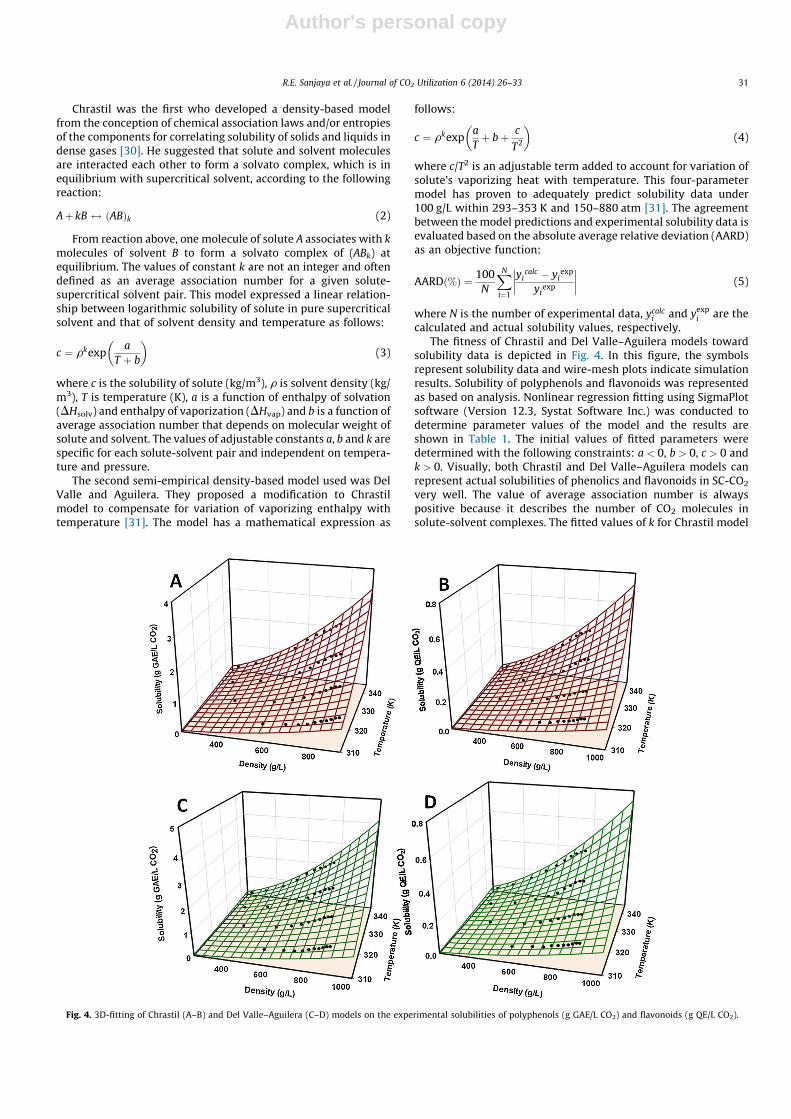
The fitness of Chrastil and Del Valle–Aguilera models towardsolubility data is depicted in Fig. 4. In this figure, the symbolsrepresent solubility data and wire-mesh plots indicate simulationresults. Solubility of polyphenols and flavonoids was representedas based on analysis. Nonlinear regression fitting using SigmaPlotsoftware (Version 12.3, Systat Software Inc.) was conducted todetermine parameter values of the model and the results areshown in Table 1. The initial values of fitted parameters weredetermined with the following constraints: a < 0, b > 0, c > 0 andk > 0. Visually, both Chrastil and Del Valle–Aguilera models canrepresent actual solubilities of phenolics and flavonoids in SC-CO2
very well. The value of average association number is alwayspositive because it describes the number of CO2 molecules insolute-solvent complexes. The fitted values of k for Chrastil model
Fig. 4. 3D-fitting of Chrastil (A–B) and Del Valle–Aguilera (C–D) models on the experimental solubilities of polyphenols (g GAE/L CO2) and flavonoids (g QE/L CO2).
R.E. Sanjaya et al. / Journal of CO2 Utilization 6 (2014) 26–33 31
Author's personal copy
are 1.93 for polyphenols/SC-CO2 and 1.84 for flavonoids/SC-CO2,which is comparable to that of Del Valle–Aguilera model. Thevalues of adjustable constant a are �4621.05 for polyphenols and�5089.02 for flavonoids from Chrastil fitting. As aforesaid, theadjustable constant a is the function of total reaction heat, whichequals to the sum of vaporization heat of solute and heat ofsolvation. For Chrastil model, the constant a is expressed as DHsoln/R while for Del Valle and Aguilera is DHsoln/R – 2d/T. Total reactionheat for the dissolution of polyphenols and flavonoids in SC-CO2
was �38.42 kJ/mol and �42.31 kJ/mol for Chrastil model and�44.23 kJ/mol and �51.07 kJ/mol for Del Valle and Aguilera model,respectively. The negative sign indicates the exothermicity of theassociating process between solute and supercritical solvent, inwhich the magnitude of solvation heat is much greater than heat ofvaporization. By judging the AARD values (%), both Chrastil and DelValle and Aguilera model give satisfactory agreement for solubility
correlations at studied pressures and temperatures. The adjustableconstant q in both models can be calculated using followingexpression:
q ¼ b þ klnMB � lnðMA þ kMBÞ (6)
In Eq. (6), MA and MB refer to the molecular weight of solute andcarbon dioxide, respectively. The values of MA are taken as themolecular weight of gallic acid (170.12 g/mol) to representpolyphenols and quercetin (302.23 g/mol) to represent flavonoids.The calculated values of constant q for polyphenols/SC-CO2 andflavonoids/SC-CO2 systems are 5.45 and 5.73 (Chrastil model) and3.22 and 26.08 (Del Valle–Aguilera model).
DPPH free radical scavenging potential of antioxidant extracts
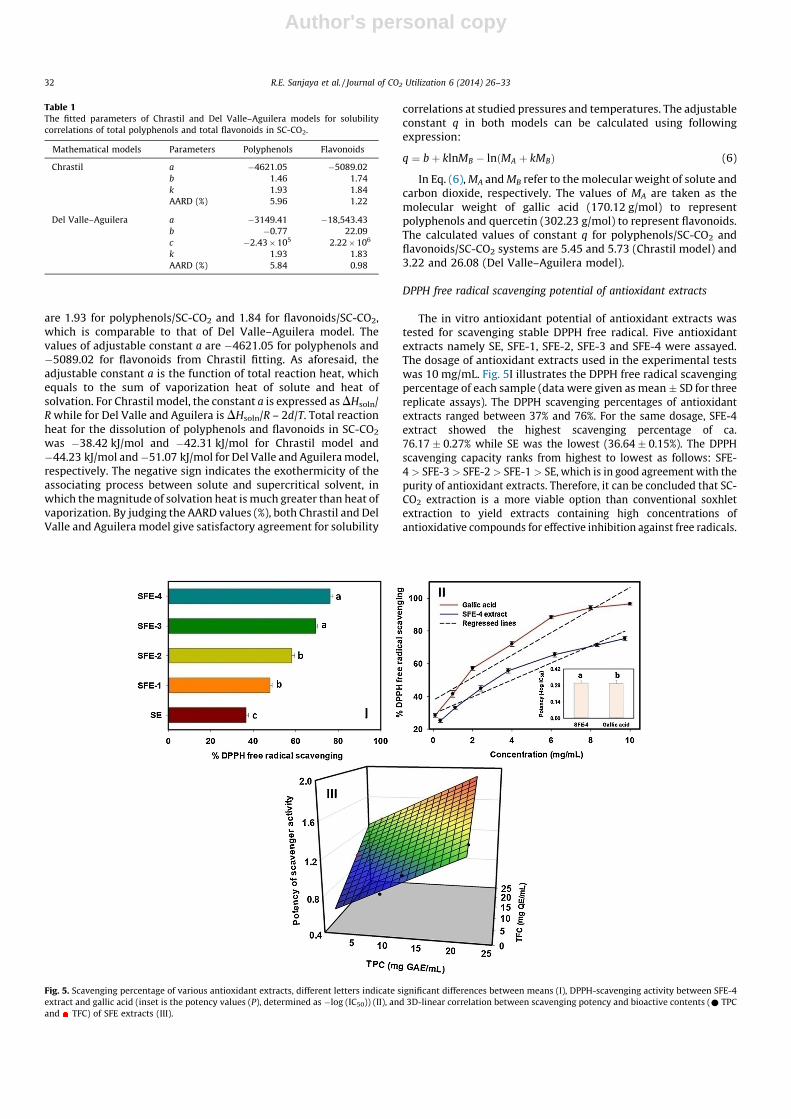
The in vitro antioxidant potential of antioxidant extracts wastested for scavenging stable DPPH free radical. Five antioxidantextracts namely SE, SFE-1, SFE-2, SFE-3 and SFE-4 were assayed.The dosage of antioxidant extracts used in the experimental testswas 10 mg/mL. Fig. 5I illustrates the DPPH free radical scavengingpercentage of each sample (data were given as mean � SD for threereplicate assays). The DPPH scavenging percentages of antioxidantextracts ranged between 37% and 76%. For the same dosage, SFE-4extract showed the highest scavenging percentage of ca.76.17 � 0.27% while SE was the lowest (36.64 � 0.15%). The DPPHscavenging capacity ranks from highest to lowest as follows: SFE-4 > SFE-3 > SFE-2 > SFE-1 > SE, which is in good agreement with thepurity of antioxidant extracts. Therefore, it can be concluded that SC-CO2 extraction is a more viable option than conventional soxhletextraction to yield extracts containing high concentrations ofantioxidative compounds for effective inhibition against free radicals.
Table 1The fitted parameters of Chrastil and Del Valle–Aguilera models for solubility
correlations of total polyphenols and total flavonoids in SC-CO2.
Mathematical models Parameters Polyphenols Flavonoids
Chrastil a �4621.05 �5089.02
b 1.46 1.74
k 1.93 1.84
AARD (%) 5.96 1.22
Del Valle–Aguilera a �3149.41 �18,543.43
b �0.77 22.09
c �2.43 � 105 2.22 � 106
k 1.93 1.83
AARD (%) 5.84 0.98
Fig. 5. Scavenging percentage of various antioxidant extracts, different letters indicate significant differences between means (I), DPPH-scavenging activity between SFE-4
extract and gallic acid (inset is the potency values (P), determined as �log (IC50)) (II), and 3D-linear correlation between scavenging potency and bioactive contents (* TPC
and TFC) of SFE extracts (III).
R.E. Sanjaya et al. / Journal of CO2 Utilization 6 (2014) 26–3332
Author's personal copy
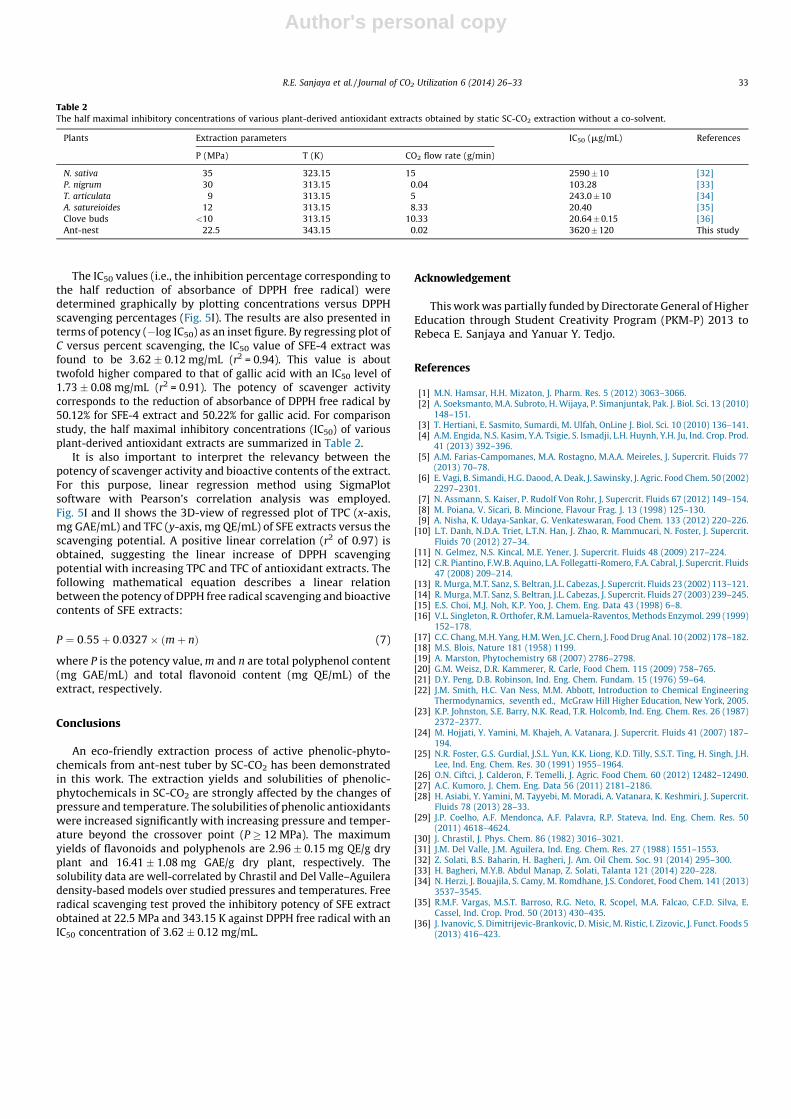
The IC50 values (i.e., the inhibition percentage corresponding tothe half reduction of absorbance of DPPH free radical) weredetermined graphically by plotting concentrations versus DPPHscavenging percentages (Fig. 5I). The results are also presented interms of potency (�log IC50) as an inset figure. By regressing plot ofC versus percent scavenging, the IC50 value of SFE-4 extract wasfound to be 3.62 � 0.12 mg/mL (r2 = 0.94). This value is abouttwofold higher compared to that of gallic acid with an IC50 level of1.73 � 0.08 mg/mL (r2 = 0.91). The potency of scavenger activitycorresponds to the reduction of absorbance of DPPH free radical by50.12% for SFE-4 extract and 50.22% for gallic acid. For comparisonstudy, the half maximal inhibitory concentrations (IC50) of variousplant-derived antioxidant extracts are summarized in Table 2.
It is also important to interpret the relevancy between thepotency of scavenger activity and bioactive contents of the extract.For this purpose, linear regression method using SigmaPlotsoftware with Pearson’s correlation analysis was employed.Fig. 5I and II shows the 3D-view of regressed plot of TPC (x-axis,mg GAE/mL) and TFC (y-axis, mg QE/mL) of SFE extracts versus thescavenging potential. A positive linear correlation (r2 of 0.97) isobtained, suggesting the linear increase of DPPH scavengingpotential with increasing TPC and TFC of antioxidant extracts. Thefollowing mathematical equation describes a linear relationbetween the potency of DPPH free radical scavenging and bioactivecontents of SFE extracts:
P ¼ 0:55 þ 0:0327 � ðm þ nÞ (7)
where P is the potency value, m and n are total polyphenol content(mg GAE/mL) and total flavonoid content (mg QE/mL) of theextract, respectively.
Conclusions
An eco-friendly extraction process of active phenolic-phyto-chemicals from ant-nest tuber by SC-CO2 has been demonstratedin this work. The extraction yields and solubilities of phenolic-phytochemicals in SC-CO2 are strongly affected by the changes ofpressure and temperature. The solubilities of phenolic antioxidantswere increased significantly with increasing pressure and temper-ature beyond the crossover point (P � 12 MPa). The maximumyields of flavonoids and polyphenols are 2.96 � 0.15 mg QE/g dryplant and 16.41 � 1.08 mg GAE/g dry plant, respectively. Thesolubility data are well-correlated by Chrastil and Del Valle–Aguileradensity-based models over studied pressures and temperatures. Freeradical scavenging test proved the inhibitory potency of SFE extractobtained at 22.5 MPa and 343.15 K against DPPH free radical with anIC50 concentration of 3.62 � 0.12 mg/mL.
Acknowledgement
This work was partially funded by Directorate General of HigherEducation through Student Creativity Program (PKM-P) 2013 toRebeca E. Sanjaya and Yanuar Y. Tedjo.
References
[1] M.N. Hamsar, H.H. Mizaton, J. Pharm. Res. 5 (2012) 3063–3066.[2] A. Soeksmanto, M.A. Subroto, H. Wijaya, P. Simanjuntak, Pak. J. Biol. Sci. 13 (2010)
148–151.[3] T. Hertiani, E. Sasmito, Sumardi, M. Ulfah, OnLine J. Biol. Sci. 10 (2010) 136–141.[4] A.M. Engida, N.S. Kasim, Y.A. Tsigie, S. Ismadji, L.H. Huynh, Y.H. Ju, Ind. Crop. Prod.
41 (2013) 392–396.[5] A.M. Farias-Campomanes, M.A. Rostagno, M.A.A. Meireles, J. Supercrit. Fluids 77
(2013) 70–78.[6] E. Vagi, B. Simandi, H.G. Daood, A. Deak, J. Sawinsky, J. Agric. Food Chem. 50 (2002)
2297–2301.[7] N. Assmann, S. Kaiser, P. Rudolf Von Rohr, J. Supercrit. Fluids 67 (2012) 149–154.[8] M. Poiana, V. Sicari, B. Mincione, Flavour Frag. J. 13 (1998) 125–130.[9] A. Nisha, K. Udaya-Sankar, G. Venkateswaran, Food Chem. 133 (2012) 220–226.
[10] L.T. Danh, N.D.A. Triet, L.T.N. Han, J. Zhao, R. Mammucari, N. Foster, J. Supercrit.Fluids 70 (2012) 27–34.
[11] N. Gelmez, N.S. Kincal, M.E. Yener, J. Supercrit. Fluids 48 (2009) 217–224.[12] C.R. Piantino, F.W.B. Aquino, L.A. Follegatti-Romero, F.A. Cabral, J. Supercrit. Fluids
47 (2008) 209–214.[13] R. Murga, M.T. Sanz, S. Beltran, J.L. Cabezas, J. Supercrit. Fluids 23 (2002) 113–121.[14] R. Murga, M.T. Sanz, S. Beltran, J.L. Cabezas, J. Supercrit. Fluids 27 (2003) 239–245.[15] E.S. Choi, M.J. Noh, K.P. Yoo, J. Chem. Eng. Data 43 (1998) 6–8.[16] V.L. Singleton, R. Orthofer, R.M. Lamuela-Raventos, Methods Enzymol. 299 (1999)
152–178.[17] C.C. Chang, M.H. Yang, H.M. Wen, J.C. Chern, J. Food Drug Anal. 10 (2002) 178–182.[18] M.S. Blois, Nature 181 (1958) 1199.[19] A. Marston, Phytochemistry 68 (2007) 2786–2798.[20] G.M. Weisz, D.R. Kammerer, R. Carle, Food Chem. 115 (2009) 758–765.[21] D.Y. Peng, D.B. Robinson, Ind. Eng. Chem. Fundam. 15 (1976) 59–64.[22] J.M. Smith, H.C. Van Ness, M.M. Abbott, Introduction to Chemical Engineering
Thermodynamics, seventh ed., McGraw Hill Higher Education, New York, 2005.[23] K.P. Johnston, S.E. Barry, N.K. Read, T.R. Holcomb, Ind. Eng. Chem. Res. 26 (1987)
2372–2377.[24] M. Hojjati, Y. Yamini, M. Khajeh, A. Vatanara, J. Supercrit. Fluids 41 (2007) 187–
194.[25] N.R. Foster, G.S. Gurdial, J.S.L. Yun, K.K. Liong, K.D. Tilly, S.S.T. Ting, H. Singh, J.H.
Lee, Ind. Eng. Chem. Res. 30 (1991) 1955–1964.[26] O.N. Ciftci, J. Calderon, F. Temelli, J. Agric. Food Chem. 60 (2012) 12482–12490.[27] A.C. Kumoro, J. Chem. Eng. Data 56 (2011) 2181–2186.[28] H. Asiabi, Y. Yamini, M. Tayyebi, M. Moradi, A. Vatanara, K. Keshmiri, J. Supercrit.
Fluids 78 (2013) 28–33.[29] J.P. Coelho, A.F. Mendonca, A.F. Palavra, R.P. Stateva, Ind. Eng. Chem. Res. 50
(2011) 4618–4624.[30] J. Chrastil, J. Phys. Chem. 86 (1982) 3016–3021.[31] J.M. Del Valle, J.M. Aguilera, Ind. Eng. Chem. Res. 27 (1988) 1551–1553.[32] Z. Solati, B.S. Baharin, H. Bagheri, J. Am. Oil Chem. Soc. 91 (2014) 295–300.[33] H. Bagheri, M.Y.B. Abdul Manap, Z. Solati, Talanta 121 (2014) 220–228.[34] N. Herzi, J. Bouajila, S. Camy, M. Romdhane, J.S. Condoret, Food Chem. 141 (2013)
3537–3545.[35] R.M.F. Vargas, M.S.T. Barroso, R.G. Neto, R. Scopel, M.A. Falcao, C.F.D. Silva, E.
Cassel, Ind. Crop. Prod. 50 (2013) 430–435.[36] J. Ivanovic, S. Dimitrijevic-Brankovic, D. Misic, M. Ristic, I. Zizovic, J. Funct. Foods 5
(2013) 416–423.
Table 2The half maximal inhibitory concentrations of various plant-derived antioxidant extracts obtained by static SC-CO2 extraction without a co-solvent.
Plants Extraction parameters IC50 (mg/mL) References
P (MPa) T (K) CO2 flow rate (g/min)
N. sativa 35 323.15 15 2590 � 10 [32]
P. nigrum 30 313.15 0.04 103.28 [33]
T. articulata 9 313.15 5 243.0 � 10 [34]
A. satureioides 12 313.15 8.33 20.40 [35]
Clove buds <10 313.15 10.33 20.64 � 0.15 [36]
Ant-nest 22.5 343.15 0.02 3620 � 120 This study
R.E. Sanjaya et al. / Journal of CO2 Utilization 6 (2014) 26–33 33


