Embed Size (px)
Citation preview
Irritable bowel syndrome : pathophysiology,symptoms and biomarkersCitation for published version (APA):
Mujagic, Z. (2015). Irritable bowel syndrome : pathophysiology, symptoms and biomarkers. UitgeverijBOXPress || Proefschriftmaken.nl. https://doi.org/10.26481/dis.20151221zm
Document status and date:Published: 01/01/2015
DOI:10.26481/dis.20151221zm
Document Version:Publisher's PDF, also known as Version of record
Please check the document version of this publication:
• A submitted manuscript is the version of the article upon submission and before peer-review. There canbe important differences between the submitted version and the official published version of record.People interested in the research are advised to contact the author for the final version of the publication,or visit the DOI to the publisher's website.• The final author version and the galley proof are versions of the publication after peer review.• The final published version features the final layout of the paper including the volume, issue and pagenumbers.Link to publication
General rightsCopyright and moral rights for the publications made accessible in the public portal are retained by the authors and/or other copyrightowners and it is a condition of accessing publications that users recognise and abide by the legal requirements associated with theserights.
• Users may download and print one copy of any publication from the public portal for the purpose of private study or research.• You may not further distribute the material or use it for any profit-making activity or commercial gain• You may freely distribute the URL identifying the publication in the public portal.
If the publication is distributed under the terms of Article 25fa of the Dutch Copyright Act, indicated by the “Taverne” license above,please follow below link for the End User Agreement:
www.umlib.nl/taverne-license
Take down policyIf you believe that this document breaches copyright please contact us at:
providing details and we will investigate your claim.
Download date: 11 May. 2022

IRRITABLE BOWEL SYNDROME
Pathophysiology, Symptoms and Biomarkers
© Copyright Zlatan Mujagić, Maastricht 2015
Layout: Tiny Wouters
Cover: Stefani Wiatowski
Printed by: Uitgeverij BOXPress || Proefschriftmaken.nl
ISBN: 978‐94‐6295‐402‐1
The studies presented in this thesis were performed within the framework of NUTRIM School of Nutrition and
Translational Research in Metabolism (Maastricht University), which participates in the Graduate School
VLAG (Food Technology, Agrobiotechnology, Nutrition and Health Sciences), accredited by the Royal
Netherlands Academy of Arts and Sciences. Furthermore, a part of the research presented in this thesis has
been funded by the Top Institute for Food and Nutrition (TIFN), Wageningen.
Printing of this thesis was financially supported by: Grünenthal GmbH, Aachen, Germany – Medische
Laboratoria Dr. Stein & Collegae, Maastricht, The Netherlands – Euro Diagnostica, Malmö, Sweden –
Nederlandse Vereniging voor Gastroenterologie (NVGE) – Maastricht University Medical Center+.
IRRITABLE BOWEL SYNDROME
Pathophysiology, Symptoms and Biomarkers
ACADEMISCH PROEFSCHRIFT
ter verkrijging van de graad van doctor aan de Universiteit Maastricht, op gezag van de Rector Magnificus, Prof. dr. L.L.G. Soete
volgens het besluit van het College van Decanen, in het openbaar te verdedigen op maandag 21 december 2015, om 12:00 uur.
door
Zlatan Mujagić
Promotor
Prof. dr. A.A.M. Masclee
Prof. dr. F.J. van Schooten
Copromotor
Dr. D.M.A.E. Jonkers
Beoordelingscommissie
Prof. dr. C.H.C. Dejong; voorzitter
Prof. dr. A.M. Schols
Prof. dr. R.C. Spiller, Queen's Medical Centre, Nottingham, UK
Prof. dr. H.W.M. Steinbusch
Dr. P.J.J. van der Veek, Medisch Centrum Haaglanden, Den Haag
Table of contents
Chapter 1 Introduction 7
Part I Pathophysiology 23
Chapter 2 Intestinal permeability in IBS 25 Chapter 3 Effects of L. plantarum on intestinal mucosa 47
Chapter 4 Effects of L. plantarum on immunity 71
Chapter 5 Markers for visceral hypersensitivity in IBS 99
Chapter 6 Biological markers for visceral hypersensitivity in IBS 115
Chapter 7 Serotonin metabolism in IBS 131
Part II Symptoms 153
Chapter 8 Systematic review: Measurement of abdominal pain in IBS 155 Chapter 9 ESM ‐ a new digital tool for symptom assessment in IBS 189
Part III Biomarkers 207
Chapter 10 A novel faecal and plasma biomarker panel for IBS 209
Chapter 11 Novel breath biomarkers for IBS; a metabolomic approach 229
Chapter 12 General discussion 247
Summary 261
Samenvatting 269
Valorisation 277
List of publications 285
Dankwoord 291
Curriculum vitae 301


7
Chapter 1
General introduction

Chapter 1
8
General introduction
9
General introduction
Functional Gastrointestinal Disorders
Functional gastrointestinal disorder (FGID) is an umbrella term for a broad spectrum of
disorders of the gastrointestinal (GI) tract, for which no clearcut organic cause can be
identified.1,2 FGIDs are among the most prevalent disorders worldwide. Since only a
minority of people who experience functional GI symptoms seek medical attention,3
the exact prevalence of FGIDs among the general population is not well established. In
a large general population based prospective cohort study in the USA, Halder et al.
found that 42% of the included subjects had one or more FGIDs, as observed over a
12 year time period.4
The first FGID to be described in 1818, was a disorder characterized by abdominal pain,
now referred to as irritable bowel syndrome (IBS).5 In the past decades, several terms
have been used for IBS, mostly based on altered motility and sensitivity of the colon as
the presumed main pathophysiological mechanism, such as spastic colon, nervous
colon or irritable colon syndrome.6 The term IBS was first introduced in 1967 by DeLor.7
In 1978, Manning and colleagues described the first criteria based on symptoms to aid
the diagnostic process for IBS (i.e. the Manning criteria).8 In 1989, the Rome Committee
published new criteria for IBS,9 which were revised several times, resulting in the
currently generally accepted ‘gold standard’ Rome III criteria. Meanwhile, discussion is
ongoing, which should lead to the development of the Rome IV criteria in the nearby
future.10
Irritable Bowel Syndrome
The diagnosis of IBS, as described by the Rome III criteria, is based on recurrent
abdominal pain or discomfort, which patients experience at least 3 days per month,
and is associated with changes in stool frequency, consistency, and/or improvement
with defecation. Furthermore, symptom onset must be at least 6 months before
making the diagnosis. Furthermore, ‘red flags’ that could indicate the presence of an
organic disorder, should be absent. Based on a meta‐analysis, a pooled estimate of 11%
has been reported for the global prevalence of IBS among the general population, with
a female predominance (1:2 ratio).11
Next to abdominal pain or discomfort, several other GI symptoms, such as bloating,
flatulence, constipation and/or diarrhoea, nausea and belching, have been associated
with IBS, but their presence and severity vary between patients. IBS can be divided into
four subtypes according to predominant bowel habits, i.e. diarrhoea (IBS‐D) and
constipation (IBS‐C) predominant and mixed (IBS‐M) subtypes, or those with
unspecified stool pattern (IBS‐U).1 Furthermore, the IBS patient population is
characterised by a large diversity in lifestyle, dietary patterns and use of medication.
Altogether, this reflects the distinct heterogeneity of the IBS patient population.
Chapter 1
10
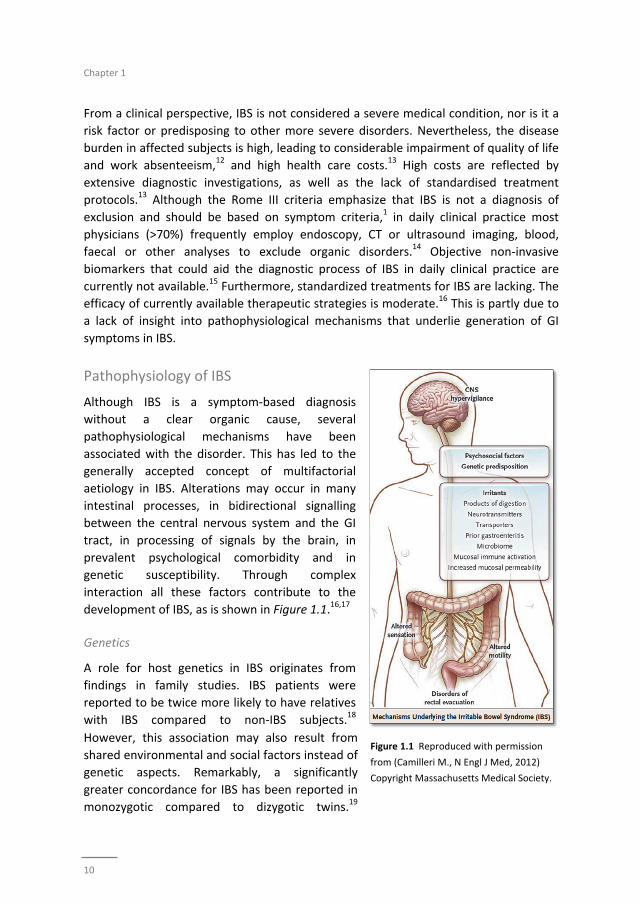
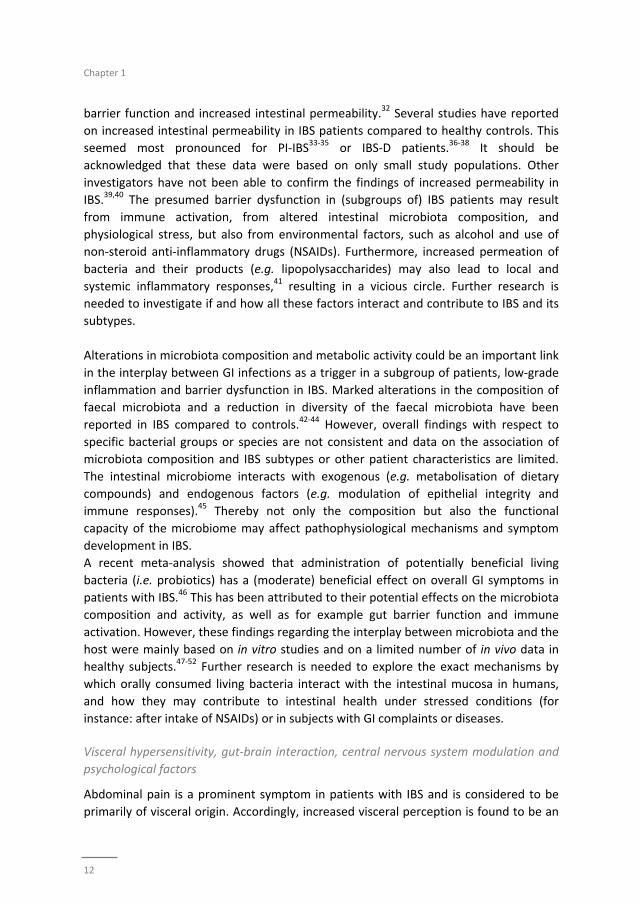
Figure 1.1 Reproduced with permission
from (Camilleri M., N Engl J Med, 2012)
Copyright Massachusetts Medical Society.
From a clinical perspective, IBS is not considered a severe medical condition, nor is it a
risk factor or predisposing to other more severe disorders. Nevertheless, the disease
burden in affected subjects is high, leading to considerable impairment of quality of life
and work absenteeism,12 and high health care costs.13 High costs are reflected by
extensive diagnostic investigations, as well as the lack of standardised treatment
protocols.13 Although the Rome III criteria emphasize that IBS is not a diagnosis of
exclusion and should be based on symptom criteria,1 in daily clinical practice most
physicians (>70%) frequently employ endoscopy, CT or ultrasound imaging, blood,
faecal or other analyses to exclude organic disorders.14 Objective non‐invasive
biomarkers that could aid the diagnostic process of IBS in daily clinical practice are
currently not available.15 Furthermore, standardized treatments for IBS are lacking. The
efficacy of currently available therapeutic strategies is moderate.16 This is partly due to
a lack of insight into pathophysiological mechanisms that underlie generation of GI
symptoms in IBS.
Pathophysiology of IBS
Although IBS is a symptom‐based diagnosis
without a clear organic cause, several
pathophysiological mechanisms have been
associated with the disorder. This has led to the
generally accepted concept of multifactorial
aetiology in IBS. Alterations may occur in many
intestinal processes, in bidirectional signalling
between the central nervous system and the GI
tract, in processing of signals by the brain, in
prevalent psychological comorbidity and in
genetic susceptibility. Through complex
interaction all these factors contribute to the
development of IBS, as is shown in Figure 1.1.16,17
Genetics
A role for host genetics in IBS originates from
findings in family studies. IBS patients were
reported to be twice more likely to have relatives
with IBS compared to non‐IBS subjects.18
However, this association may also result from
shared environmental and social factors instead of
genetic aspects. Remarkably, a significantly
greater concordance for IBS has been reported in
monozygotic compared to dizygotic twins.19
General introduction
11
Several genetic variations have been associated with the presence of IBS, such as
polymorphisms of the gene that encodes for the serotonin transporter (SERT) or for the
cytokine TNF superfamily member 15 (TNFSF15).20,21 Up to now, there is little evidence
for genetics as a major factor in the pathophysiology of IBS.22 It is more likely that
symptoms arise as a consequence of gene‐environment interactions, which indicates
that triggers during life are needed in subjects with a specific genetic background, in
order to develop IBS.
The immune system, intestinal barrier function and microbiota
An acute GI infection is a well‐known trigger for the development of IBS in a subgroup
of patients, defined as post infectious (PI) IBS. This subgroup, PI‐IBS, has been described
for the first time in the 1950s.23 In 2000 in Walkerton Ontario, a large waterborne
outbreak of bacterial dysentery (based on Escherichia coli, Campylobacter jejuni and
other pathogens) provided a unique opportunity to study the long‐term effects of acute
GI infections. In the Walkerton cohort including 2069 subjects, 36% did develop IBS,
versus 10% of controls without a previous gastroenteritis.24 These findings support
involvement of immune activation and the intestinal microbiota in the development of
IBS.
At present there is accumulating evidence for a low‐grade inflammatory state in IBS.
The differences between IBS patients and healthy subjects observed in most studies are
only subtle, e.g. with regard to increased faecal calprotectin concentrations,25 increased
mucosal infiltration of immune cells or with regard to an imbalance in plasma cytokine
profiles in IBS patients.26‐29 Other studies have focused more on the relation between
mucosal mast cell counts, their secretory activity (such as tryptase) and IBS symptoms.
For example, Barbara et al. found an increased area of colon mucosal biopsies to be
occupied by mast cells in 77% of the IBS patients compared with only 9% of controls.
Furthermore, mucosal histamine and tryptase levels were significantly increased, and
mast cells were more often located in close proximity to nerve endings in IBS patients
compared to healthy subjects. The latter finding correlated significantly with the
severity of abdominal pain/discomfort.30 More recently, Vanuytstel et al. demonstrated
that acute psychological stress increased small intestinal permeability in healthy
subjects. Administration of corticotropin‐releasing hormone (CRH) was found to induce
similar effects that could be inhibited by the mast cell stabiliser disodium cromoglycate
(DSCG).31 These findings provide exciting new insights into interactions between brain,
mast cell activity and intestinal barrier function.
A single epithelial layer of the intestinal mucosa facilitates permeation and transport of
nutrients and other substances through selective transcellular and paracellular routes
and forms an important part of the intestinal barrier. The paracellular passage is
regulated by complexes of tight junctions, adherens junctions, gap junctions and
desmosomes. Dysfunction of these complexes leads to impairment of the intestinal
Chapter 1
12
barrier function and increased intestinal permeability.32 Several studies have reported
on increased intestinal permeability in IBS patients compared to healthy controls. This
seemed most pronounced for PI‐IBS33‐35 or IBS‐D patients.36‐38 It should be
acknowledged that these data were based on only small study populations. Other
investigators have not been able to confirm the findings of increased permeability in
IBS.39,40 The presumed barrier dysfunction in (subgroups of) IBS patients may result
from immune activation, from altered intestinal microbiota composition, and
physiological stress, but also from environmental factors, such as alcohol and use of
non‐steroid anti‐inflammatory drugs (NSAIDs). Furthermore, increased permeation of
bacteria and their products (e.g. lipopolysaccharides) may also lead to local and
systemic inflammatory responses,41 resulting in a vicious circle. Further research is
needed to investigate if and how all these factors interact and contribute to IBS and its
subtypes.
Alterations in microbiota composition and metabolic activity could be an important link
in the interplay between GI infections as a trigger in a subgroup of patients, low‐grade
inflammation and barrier dysfunction in IBS. Marked alterations in the composition of
faecal microbiota and a reduction in diversity of the faecal microbiota have been
reported in IBS compared to controls.42‐44 However, overall findings with respect to
specific bacterial groups or species are not consistent and data on the association of
microbiota composition and IBS subtypes or other patient characteristics are limited.
The intestinal microbiome interacts with exogenous (e.g. metabolisation of dietary
compounds) and endogenous factors (e.g. modulation of epithelial integrity and
immune responses).45 Thereby not only the composition but also the functional
capacity of the microbiome may affect pathophysiological mechanisms and symptom
development in IBS.
A recent meta‐analysis showed that administration of potentially beneficial living
bacteria (i.e. probiotics) has a (moderate) beneficial effect on overall GI symptoms in
patients with IBS.46 This has been attributed to their potential effects on the microbiota
composition and activity, as well as for example gut barrier function and immune
activation. However, these findings regarding the interplay between microbiota and the
host were mainly based on in vitro studies and on a limited number of in vivo data in
healthy subjects.47‐52 Further research is needed to explore the exact mechanisms by
which orally consumed living bacteria interact with the intestinal mucosa in humans,
and how they may contribute to intestinal health under stressed conditions (for
instance: after intake of NSAIDs) or in subjects with GI complaints or diseases.
Visceral hypersensitivity, gut‐brain interaction, central nervous system modulation and
psychological factors
Abdominal pain is a prominent symptom in patients with IBS and is considered to be
primarily of visceral origin. Accordingly, increased visceral perception is found to be an
General introduction
13
important hallmark of IBS.53 In 1973, Ritchie was the first to report that 55% of IBS
patients versus 6% of healthy subjects experienced abdominal pain during inflation of a
balloon introduced in the rectosigmoid.54 The electronic rectal barostat with a balloon
of non‐compliant material has become a widely accepted method to assess visceral
hypersensitivity, but is also used to test the efficacy of therapeutic interventions.55,56
Later studies have confirmed Ritchie’s original observation, demonstrating that around
50% of the IBS population can be classified with visceral hypersensitivity.53,57
Several studies investigated underlying mechanisms of altered visceral perception, but
the exact pathophysiology is not yet clear. In 2009, Zhou et al. found an association
between increased intestinal permeability and visceral hypersensitivity in IBS‐D
patients,37 but this observation has not been replicated by others. The transient
receptor potential vanilloid type‐1 (TRPV1) has been shown to play a role in
inflammatory hyperalgesia.58 It is expressed by sensory neurons and activated by
capsaicin, heat, acid and inflammatory mediators.58,59 Akbar et al. demonstrated a
threefold increase in the number of TRPV1 sensory nerve fibres in colonic biopsies of
IBS patients compared to healthy controls; while no significant differences were seen
between IBS‐subtypes. Furthermore, CD3 immune cell and mast cell counts were higher
in IBS patients compared to controls, and both the numbers of TRPV1 fibres and mast
cells were found to be predictors of abdominal pain.60 Although, associations between
indicators of intestinal barrier dysfunction, low‐grade inflammation and altered visceral
perception in IBS patients have been reported, the exact role of these biological
processes in the aetiology of IBS, the development of visceral hypersensitivity and the
mode of interaction is still not clear or understood.61
In addition to intestinal factors, mechanisms in central pain processing may contribute
to abdominal pain in IBS patients. Central stimuli such as stress, affective co‐morbidity,
distraction or relaxation, and expectations have been found to alter visceral
perception.62‐64 Functional magnetic resonance imaging (fMRI) studies have
documented changes in the thalamus, prefrontal cortex, and the ventro‐lateral and
posterior parietal cortex in IBS patients, pointing to alterations in brain circuits involved
in attention, emotion and pain modulation.64,65 Psychiatric co‐morbidity is found to be
highly prevalent in IBS patients. Several studies have demonstrated that up to 50% of
IBS patients have a co‐morbid anxiety disorder or depression.66‐68 Hyper‐reactivity to
psychological stress is assumed to play an important role in symptom generation of IBS.
The behavioural, neuroendocrine and autonomic responses to stress are co‐regulated
by the hypothalamic‐pituitary‐adrenal (HPA) axis and the sympathetic nervous system.
Alterations in activity of brain and gut response to CRH, adrenocorticotropin hormone
(ACTH), cortisol, and catecholamines have been reported in IBS patients.29,31,69,70
Furthermore, altered serotonin metabolism is associated with IBS as well as with
psychiatric disorders such as anxiety or depression. Serotonin is a neurotransmitter,
with important functions in the central nervous system, such as regulation of mood,
sleep and satiety. It is derived from tryptophan, and is primarily produced by
Chapter 1
14
enterochromaffin cells within the GI tract, where serotonin affects motoric, secretory
and sensory functions of the intestines.71 Furthermore, CRH and serotonin have also
been reported to affect gut barrier function.
In these studies, mechanisms associated with increased visceral perception have been
explored, but since many pathophysiological mechanisms are associated with IBS in
general, it remains unclear why some IBS patients can be classified as viscerally
normosensitive, comparable to healthy subjects, while other IBS patients have
increased pain perception.
Although, multiple pathophysiological mechanisms have been associated with the
presence of IBS, the complex interplay between these processes and their association
with symptom generation and subtypes of IBS is still poorly understood. Referring to
the heterogeneity and the unclear aetiology of symptoms in IBS patients, William
Cumming stated in 1849 that “The bowels are at one time constipated, another lax, in
the same person. How the disease has two such different symptoms I do not profess to
explain.”72 Today, more than one and a half century later, further studies are still
needed to elucidate this intriguing phenomenon.
Symptom assessment in IBS
IBS is based on a diagnosis related to presence of specific symptoms. Reduction of
symptom severity is an important therapeutic goal in IBS patients. Therefore, symptom
scores are often used as primary outcome of IBS intervention trials. However,
investigating potential beneficial effects of various therapeutic strategies is challenging
due to the subjective nature of symptom scoring and high placebo effect in IBS
patients.73 Due to a wide variety of methods that are employed for symptom
assessment, the results of various studies are difficult to compare. To tackle this
problem, in 2012, the US Food and Drugs Administrating (FDA) published guidelines for
intervention trials in IBS, recommending a 7‐day mean of an ‘end‐of‐day 11‐point
numeric rating scale (NRS)’ as a primary endpoint for clinical trials.74 Although several
scales for the assessment of abdominal pain and other GI symptoms have been tested
psychometrically in patients with IBS,75‐77 validation studies on the 11‐point NRS
recommended by the FDA are not available.
In general, assessment of symptoms poses several hurdles. The experience of GI
symptoms, in particular pain, can be altered by factors such as anxiety, depression,
negative cognitions and positive or negative expectations.62‐64 Taking into account the
high prevalence of psychiatric co‐morbidity in IBS, the presence of psychological factors
is likely to affect symptom reporting in a heterogeneous group of subjects, as is the
case in IBS. Not only perception of symptoms, but also memory can be affected by
several psychological and circumstantial factors and may induce recall bias in methods
that employ retrospective symptom assessment. Finally, it has been demonstrated that
there is a high rate of fake compliance when filling in end‐of‐day diaries. Stone et al.
General introduction
15
found that only 10% of paper end‐of‐day diaries was completed during the indicated
time frame in a population of subjects suffering from different forms of pain.78
Therefore, taking into account the cardinal importance of symptom assessment in IBS
patients, new and more reliable symptom assessment methods need to be developed
and validated for use in the target population.
Biomarkers in IBS
Although IBS is a functional GI disorder, accumulating evidence exists for subtle organic
changes in a range of biological processes, possibly involved in the aetiology of IBS.
There is ongoing interest in developing biomarkers based on these potential
pathophysiological mechanisms. Such markers could aid the diagnostic process and
may be used for the assessment of treatment efficacy and disease follow‐up in IBS.15 As
functional GI symptoms are very prevalent in the general population, an IBS biomarker
may also be useful for the implementation in studies focusing on gut health in the
general population.
An ideal biomarker should be able to discriminate between health and disease, and
between the disease and other pathological conditions, should be sensitive for change
in (patho)physiological state of the target population, and furthermore, should be
reliable.79 Multiple markers have been investigated as potential biomarker for IBS.
These include intestinal permeability, visceral hypersensitivity, assessment of gut
motility and transit time, genetic markers, faecal bile acids, and markers of
inflammation or intestinal neuroendocrine activity in mucosal, faecal or blood
samples.15 Most studies investigated single biomarkers, while two recent studies have
tested a combination (panel) of 10 and 34 serum and genetic markers.80,81 However, up
to now the use of biomarkers in IBS has led to only moderate results and none of the
tested biomarkers or panels of markers have been accepted for the use in scientific
trials or daily clinical practice. Taking into account that IBS is based on a multifactorial
pathophysiology, a potential biomarker for IBS should be able to measure changes in
several processes involved. Therefore, new approaches in the search for biomarkers for
IBS should focus on marker panels; i.e. by combining ‘known’ biomarkers representing
separate pathophysiological processes associated with IBS or by applying a new holistic
‘‐omics’ approach. For the latter, a wide range of compounds (such as proteins or
volatile organic metabolites) can be measured in biomaterials and used to identify a
profile of compounds with the best positive prediction for IBS.
Chapter 1
16
Outline and aims
IBS is a common functional GI disorder with major impact on quality of life and health
care costs. Further characterisation of the patients and insight in underlying
pathophysiological mechanisms, paying attention to the heterogeneity of IBS with
regard to predominant symptoms and patient characteristics, may aid to elucidate the
aetiology of IBS and to provide leads for new therapeutic options. Furthermore,
accurate diagnosis and symptom assessment in IBS will facilitate future research and
patient care in daily clinical practice. Therefore, in the current thesis, the
pathophysiology, symptom assessment and biomarkers of IBS were addressed.
In Chapter 2 we focus on potential changes in intestinal permeability in IBS. There was
need for a large scale study, investigating the association between altered intestinal
permeability as an indicator of intestinal barrier dysfunction, with specific attention for
(i) IBS‐subtype differences, (ii) the GI site of potential altered permeability and (iii) the
effects of potential confounding factors, such as the use of specific medication.
In Chapter 3 we investigate whether intestinal barrier (dys)function can be modulated
by probiotic bacteria. Therefore, on separate occasions, the effect of three orally
administrated Lactobacillus plantarum strains on small intestinal barrier function was
investigated in healthy subjects after intake of the NSAID indomethacin, a drug known
to induce intestinal barrier dysfunction. In addition to measurement of intestinal
permeability, we collect duodenal biopsies for analysis of tight junction associated
proteins and genome wide transcription analysis. In Chapter 4 the same study
population was used to assess if and how these living bacteria affect the human
intestinal and systemic immune system.
In Chapter 5 we focus on another pathophysiological process and hallmark of IBS, i.e.
altered visceral perception. Most studies assessing this phenomenon report that about
50% of IBS patients can be classified as visceral hypersensitive. It is not clear to what
extent hypersensitive and normosensitive IBS patients differ in clinical presentation,
symptoms and demographics. Therefore, we assessed visceral perception in a large
group of well‐characterized IBS patients using a standardized rectal barostat procedure.
Normo‐ and hypersensitive IBS patients were then compared with regard to
demographic characteristics, lifestyle factors, psychological symptom scores and use of
medication. In Chapter 6 we use the same approach to assess whether differences exist
in biomarker data between hypersensitive and normosensitive IBS patients. The
markers that have been selected relate to several pathophysiological mechanisms of
IBS that may play a role in the development of visceral hypersensitivity, such as
intestinal immune activation, altered activity of the neuroendocrine system and
serotonin metabolism, and intraluminal metabolic processing by measuring various
short chain fatty acids as products of saccharolytic fermentation by the intestinal
microbiota.
General introduction
17
Finally, in Chapter 7 we focus further on the serotonin metabolism in IBS patients.
Previous studies have reported altered plasma serotonin levels in IBS patients
compared to healthy subjects. However, these findings were based on small study
populations or only specific IBS subtypes. We assessed plasma concentrations of
serotonin and its main metabolite 5‐hydroxyindoleacetic acid (5‐HIAA) in a large group
of IBS patients and healthy controls, with specific attention for possible differences
between IBS subtypes and increased scores of anxiety and depression.
As chronic abdominal pain is a prominent symptom in IBS patients and is often used as
primary outcome in intervention trials, we focus on methods for symptom assessment,
in particular abdominal pain, in the second part of this thesis. First, we systematically
review the literature on currently available instruments to measure chronic abdominal
pain in patients with IBS (Chapter 8). In psychological and behavioural research
momentary symptom assessment by an electronic device is used to overcome
limitations of retrospective symptom assessment using paper questionnaires or diaries,
such as recall bias or low compliance rates. In Chapter 9 we explore possible
advantages of Experience Sampling Method (ESM) over prevalently used retrospective
paper symptom scores in a small group of IBS patients.
Reliable biomarkers that can be used next to symptom scores to aid the diagnosis and
follow‐up of IBS are currently not available. The third part of this thesis deals with the
search for (sets of) biomarkers in IBS. We applied two different approaches using a
study population of two large cohorts, namely a clinical IBS cohort with healthy controls
without GI complaints, and a general population cohort. In Chapter 10 we test a set of
15 faecal and plasma markers, which were selected based on literature search as
indicators of several domains of gut health, in both cohorts. The aim is to identify and
validate a panel of markers which best discriminates IBS patients from healthy controls.
Furthermore, we test the correlation between the biomarker panel and GI symptoms in
IBS patients and subjects of the general population. Finally, we use the same cohorts to
measure all detectable volatile organic compounds (VOCs) in exhaled breath, in search
for a novel biomarker panel for IBS based on exhaled air (Chapter 11). Also in this case,
the relation of the VOC biomarkers and GI symptoms in both cohorts has been
investigated.
Finally, in Chapter 12 we summarize the main findings of the studies included in this
thesis, and provide an integrated review of new insights obtained by these studies.
Chapter 1
18
References
1. Drossman DA, Corazziari E, Delvaux M, Spiller RC, Talley NJ, Thompson WG, Whitehead WE. Rome III: The Functional Gastrointestinal Disorders, Third Edition: McLean, VA: Degnon Associates, Inc.; 2006.
2. Longstreth GF, Thompson WG, Chey WD, Houghton LA, Mearin F, Spiller RC. Functional bowel
disorders. Gastroenterology. 2006;130:1480‐91. 3. Jones R, Lydeard S. Irritable bowel syndrome in the general population. BMJ. 1992;304:87‐90.
4. Halder SL, Locke GR, 3rd, Schleck CD, Zinsmeister AR, Melton LJ, 3rd, Talley NJ. Natural history of
functional gastrointestinal disorders: a 12‐year longitudinal population‐based study. Gastroenterology. 2007;133:799‐807.
5. Powell R. On certain painful afflictions of the intestinal canal. Med Trans Royal Coll Phys. 1818;6:
106‐17. 6. Chaudhary NA, Truelove SC. The irritable colon syndrome. A study of the clinical features, predisposing
causes, and prognosis in 130 cases. Q J Med. 1962;31:307‐22.
7. DeLor CJ. The irritable bowel syndrome. Am J Gastroenterol. 1967;47:427‐34. 8. Manning AP, Thompson WG, Heaton KW, Morris AF. Towards positive diagnosis of the irritable bowel.
BMJ. 1978;2:653‐4.
9. Thompson WG, Dotevall, G., Drossman, D.A., Heaton, K.W., Kruis, W. Irritable bowel syndrome: guidelines for the diagnosis. Gastroenterol Int. 1989;2 92–5.
10. Drossman DA. Updates for Rome IV. Rome Foundation Newsletter. 2013;6(2‐3).
11. Lovell RM, Ford AC. Global prevalence of and risk factors for irritable bowel syndrome: a meta‐analysis. Clin Gastroenterol Hepatol 2012;10:712‐21 e4.
12. Spiegel BM. The burden of IBS: looking at metrics. Curr Gastroenterol Rep. 2009;11:265‐9.
13. Canavan C, West J, Card T. Review article: the economic impact of the irritable bowel syndrome. Aliment Pharmacol Ther. 2014;40:1023‐34.
14. Spiegel BM, Farid M, Esrailian E, Talley J, Chang L. Is irritable bowel syndrome a diagnosis of exclusion?:
a survey of primary care providers, gastroenterologists, and IBS experts. Am J Gastroenterol. 2010;105:848‐58.
15. Corsetti M, Van Oudenhove L, Tack J. The quest for biomarkers in IBS‐where should it lead us?
Neurogastroenterol Motil. 2014;26:1669‐76. 16. El‐Salhy M, Hatlebakk JG, Gilja OH, Hausken T. Irritable bowel syndrome: recent developments in
diagnosis, pathophysiology, and treatment. Expert Rev Gastroenterol Hepatol. 2014;8:435‐43.
17. Camilleri M. Peripheral mechanisms in irritable bowel syndrome. N Engl J Med. 2012;367:1626‐35. 18. Saito YA, Petersen GM, Larson JJ, Atkinson EJ, Fridley BL, de Andrade M, Locke GR 3rd, Zimmerman JM,
Almazar‐Elder AE, Talley NJ. Familial aggregation of irritable bowel syndrome: a family case‐control
study. Am J Gastroenterol. 2010;105:833‐41. 19. Bengtson MB, Ronning T, Vatn MH, Harris JR. Irritable bowel syndrome in twins: genes and
environment. Gut. 2006;55:1754‐9.
20. van der Veek PP, van den Berg M, de Kroon YE, Verspaget HW, Masclee AA. Role of tumor necrosis factor‐alpha and interleukin‐10 gene polymorphisms in irritable bowel syndrome. Am J Gastroenterol.
2005;100:2510‐6.
21. Van Kerkhoven LA, Laheij RJ, Jansen JB. Meta‐analysis: a functional polymorphism in the gene encoding for activity of the serotonin transporter protein is not associated with the irritable bowel syndrome.
Aliment Pharmacol Ther. 2007;26:979‐86.
22. Camilleri M, Katzka DA. Irritable bowel syndrome: methods, mechanisms, and pathophysiology. Genetic epidemiology and pharmacogenetics in irritable bowel syndrome. Am J Physiol Gastrointest Liver
Physiol. 2012;302:G1075‐84.
23. Stewart GT. Post‐dysenteric colitis. BMJ. 1950;1:405‐9. 24. Marshall JK, Thabane M, Garg AX, Clark WF, Salvadori M, Collins SM; Walkerton Health Study
Investigators. Incidence and epidemiology of irritable bowel syndrome after a large waterborne
outbreak of bacterial dysentery. Gastroenterology. 2006;131:445‐50. 25. Dolwani S, Metzner M, Wassell JJ, Yong A, Hawthorne AB. Diagnostic accuracy of faecal calprotectin
estimation in prediction of abnormal small bowel radiology. Aliment Pharmacol Ther. 2004;20:615‐21.
General introduction
19
26. Ohman L, Stridsberg M, Isaksson S, Jerlstad P, Simren M. Altered levels of fecal chromogranins and
secretogranins in IBS: relevance for pathophysiology and symptoms? Am J Gastroenterol. 2012;107:440‐7.
27. Bashashati M, Rezaei N, Shafieyoun A, McKernan DP, Chang L, Öhman L, Quigley EM, Schmulson M,
Sharkey KA, Simrén M. Cytokine imbalance in irritable bowel syndrome: a systematic review and meta‐analysis. Neurogastroenterol Motil. 2014;26:1036‐48.
28. Dinan TG, Clarke G, Quigley EM, Scott LV, Shanahan F, Cryan J, Cooney J, Keeling PW. Enhanced
cholinergic‐mediated increase in the pro‐inflammatory cytokine IL‐6 in irritable bowel syndrome: role of muscarinic receptors. Am J Gastroenterol. 2008;103:2570‐6.
29. Dinan TG, Quigley EM, Ahmed SM, Scully P, O'Brien S, O'Mahony L, O'Mahony S, Shanahan F, Keeling
PW. Hypothalamic‐pituitary‐gut axis dysregulation in irritable bowel syndrome: plasma cytokines as a potential biomarker? Gastroenterology. 2006;130:304‐11.
30. Barbara G, Stanghellini V, De Giorgio R, Cremon C, Cottrell GS, Santini D, Pasquinelli G, Morselli‐Labate
AM, Grady EF, Bunnett NW, Collins SM, Corinaldesi R. Activated mast cells in proximity to colonic nerves correlate with abdominal pain in irritable bowel syndrome. Gastroenterology. 2004;126:693‐
702.
31. Vanuytsel T, van Wanrooy S, Vanheel H, Vanormelingen C, Verschueren S, Houben E, Salim Rasoel S, Tόth J, Holvoet L, Farré R, Van Oudenhove L, Boeckxstaens G, Verbeke K, Tack J. Psychological stress
and corticotropin‐releasing hormone increase intestinal permeability in humans by a mast cell‐
dependent mechanism. Gut. 2014;63:1293‐9. 32. Turner JR. Intestinal mucosal barrier function in health and disease. Nat Rev Immunol. 2009;9:799‐809.
33. Marshall JK, Thabane M, Garg AX, Clark W, Meddings J, Collins SM; WEL Investigators. Intestinal
permeability in patients with irritable bowel syndrome after a waterborne outbreak of acute gastroenteritis in Walkerton, Ontario. Aliment Pharmacol Ther. 2004;20:1317‐22.
34. Spiller RC, Jenkins D, Thornley JP, Hebden JM, Wright T, Skinner M, Neal KR. Increased rectal mucosal
enteroendocrine cells, T lymphocytes, and increased gut permeability following acute Campylobacter enteritis and in post‐dysenteric irritable bowel syndrome. Gut. 2000;47:804‐11.
35. Dunlop SP, Hebden J, Campbell E, Naesdal J, Olbe L, Perkins AC, Spiller RC. Abnormal intestinal
permeability in subgroups of diarrhea‐predominant irritable bowel syndromes. Am J Gastroenterol. 2006;101:1288‐94.
36. Rao AS, Camilleri M, Eckert DJ, Busciglio I, Burton DD, Ryks M, Wong BS, Lamsam J, Singh R, Zinsmeister
AR. Urine sugars for in vivo gut permeability: validation and comparisons in irritable bowel syndrome‐diarrhea and controls. Am J Physiol Gastrointest Liver Physiol. 2011;301:G919‐28.
37. Zhou Q, Zhang B, Verne GN. Intestinal membrane permeability and hypersensitivity in the irritable
bowel syndrome. Pain. 2009;146:41‐6. 38. Zhou Q, Souba WW, Croce CM, Verne GN. MicroRNA‐29a regulates intestinal membrane permeability
in patients with irritable bowel syndrome. Gut. 2010;59:775‐84.
39. Kerckhoffs AP, Akkermans LM, de Smet MB, Besselink MG, Hietbrink F, Bartelink IH, Busschers WB, Samsom M, Renooij W. Intestinal permeability in irritable bowel syndrome patients: effects of NSAIDs.
Dig Dis Sci. 2010;55:716‐23.
40. Del Valle‐Pinero AY, Van Deventer HE, Fourie NH, Martino AC, Patel NS, Remaley AT, Henderson WA. Gastrointestinal permeability in patients with irritable bowel syndrome assessed using a four probe
permeability solution. Clin Chim Acta. 2013;418:97‐101.
41. Sanchez de Medina F, Romero‐Calvo I, Mascaraque C, Martinez‐Augustin O. Intestinal inflammation and mucosal barrier function. Inflamm Bowel Dis. 2014;20:2394‐404.
42. Rajilić‐Stojanović M, Biagi E, Heilig HG, Kajander K, Kekkonen RA, Tims S, de Vos WM. Global and deep
molecular analysis of microbiota signatures in fecal samples from patients with irritable bowel syndrome. Gastroenterology. 2011;141:1792‐801.
43. Jalanka‐Tuovinen J, Salojärvi J, Salonen A, Immonen O, Garsed K, Kelly FM, Zaitoun A, Palva A, Spiller
RC, de Vos WM. Faecal microbiota composition and host‐microbe cross‐talk following gastroenteritis and in postinfectious irritable bowel syndrome. Gut. 2014;63:1737‐45.
44. Jeffery IB, O'Toole PW, Öhman L, Claesson MJ, Deane J, Quigley EM, Simrén M. An irritable bowel
syndrome subtype defined by species‐specific alterations in faecal microbiota. Gut. 2012;61:997‐1006.
Chapter 1
20
45. Rajilić‐Stojanović M, Jonkers DM, Salonen A, Hanevik K, Raes J, Jalanka J, de Vos WM, Manichanh C,
Golic N, Enck P, Philippou E, Iraqi FA, Clarke G, Spiller RC, Penders J. Intestinal Microbiota And Diet in IBS: Causes, Consequences, or Epiphenomena? Am J Gastroenterol. 2015;110:278‐87.
46. Ford AC, Quigley EM, Lacy BE, Lembo AJ, Saito YA, Schiller LR, Soffer EE, Spiegel BM, Moayyedi P.
Efficacy of prebiotics, probiotics, and synbiotics in irritable bowel syndrome and chronic idiopathic constipation: systematic review and meta‐analysis. Am J Gastroenterol. 2014;109:1547‐61.
47. Karczewski J, Troost FJ, Konings I, Dekker J, Kleerebezem M, Brummer RJ, Wells JM. Regulation of
human epithelial tight junction proteins by Lactobacillus plantarum in vivo and protective effects on the epithelial barrier. Am J Physiol Gastrointest Liver Physiol. 2010;298:G851‐9.
48. Mao Y, Nobaek S, Kasravi B, Adawi D, Stenram U, Molin G, Jeppsson B. The effects of Lactobacillus
strains and oat fiber on methotrexate‐induced enterocolitis in rats. Gastroenterology. 1996;111:334‐44. 49. White JS, Hoper M, Parks RW, Clements WD, Diamond T, Bengmark S. The probiotic bacterium
Lactobacillus plantarum species 299 reduces intestinal permeability in experimental biliary obstruction.
Lett Appl Microbiol. 2006;42:19‐23. 50. Mennigen R, Nolte K, Rijcken E, Utech M, Loeffler B, Senninger N, Bruewer M. Probiotic mixture VSL#3
protects the epithelial barrier by maintaining tight junction protein expression and preventing
apoptosis in a murine model of colitis. Am J Physiol Gastrointest Liver Physiol. 2009;296:G1140‐9. 51. Mangell P, Nejdfors P, Wang M, Ahrné S, Weström B, Thorlacius H, Jeppsson B. Lactobacillus plantarum
299v inhibits Escherichia coli‐induced intestinal permeability. Dig Dis Sci. 2002;47:511‐6.
52. Zeng J, Li YQ, Zuo XL, Zhen YB, Yang J, Liu CH. Clinical trial: effect of active lactic acid bacteria on mucosal barrier function in patients with diarrhoea‐predominant irritable bowel syndrome. Alimentary
pharmacology & therapeutics. 2008 Oct 15;28(8):994‐1002.
53. Ludidi S, Conchillo JM, Keszthelyi D, Van Avesaat M, Kruimel JW, Jonkers DM, Masclee AA. Rectal hypersensitivity as hallmark for irritable bowel syndrome: defining the optimal cutoff.
Neurogastroenterol Motil. 2012;24:729‐33, e345‐6.
54. Ritchie J. Pain from distension of the pelvic colon by inflating a balloon in the irritable colon syndrome. Gut. 1973;14:125‐32.
55. Keszthelyi D, Troost FJ, Masclee AA. Irritable bowel syndrome: methods, mechanisms, and
pathophysiology. Methods to assess visceral hypersensitivity in irritable bowel syndrome. Am J Physiol Gastrointest Liver Physiol. 2012;303:G141‐54.
56. Ludidi S, Jonkers DM, Koning CJ, Kruimel JW, Mulder L, van der Vaart IB, Conchillo JM, Masclee AA.
Randomized clinical trial on the effect of a multispecies probiotic on visceroperception in hypersensitive IBS patients. Neurogastroenterol Motil. 2014;26:705‐14.
57. Mertz H, Naliboff B, Munakata J, Niazi N, Mayer EA. Altered rectal perception is a biological marker of
patients with irritable bowel syndrome. Gastroenterology. 1995;109:40‐52. 58. Walker KM, Urban L, Medhurst SJ, Patel S, Panesar M, Fox AJ, McIntyre P. The VR1 antagonist
capsazepine reverses mechanical hyperalgesia in models of inflammatory and neuropathic pain. J
Pharmacol Exp Ther. 2003;304:56‐62. 59. Caterina MJ, Schumacher MA, Tominaga M, Rosen TA, Levine JD, Julius D. The capsaicin receptor: a
heat‐activated ion channel in the pain pathway. Nature. 1997;389:816‐24.
60. Akbar A, Yiangou Y, Facer P, Walters JR, Anand P, Ghosh S. Increased capsaicin receptor TRPV1‐expressing sensory fibres in irritable bowel syndrome and their correlation with abdominal pain. Gut.
2008;57:923‐9.
61. Camilleri M, Lasch K, Zhou W. Irritable bowel syndrome: methods, mechanisms, and pathophysiology. The confluence of increased permeability, inflammation, and pain in irritable bowel syndrome. Am J
Physiol Gastrointest Liver Physiol. 2012;303:G775‐85.
62. Dickhaus B, Mayer EA, Firooz N, Stains J, Conde F, Olivas TI, Fass R, Chang L, Mayer M, Naliboff BD. Irritable bowel syndrome patients show enhanced modulation of visceral perception by auditory stress.
Am J Gastroenterol. 2003;98:135‐43.
63. Accarino AM, Azpiroz F, Malagelada JR. Attention and distraction: effects on gut perception. Gastroenterology. 1997;113:415‐22.
64. Schmid J, Langhorst J, Gaß F, Theysohn N, Benson S, Engler H, Gizewski ER, Forsting M, Elsenbruch S.
Placebo analgesia in patients with functional and organic abdominal pain: a fMRI study in IBS, UC and healthy volunteers. Gut. 2015;64:418‐27.
General introduction
21
65. Wilder‐Smith CH, Schindler D, Lovblad K, Redmond SM, Nirkko A. Brain functional magnetic resonance
imaging of rectal pain and activation of endogenous inhibitory mechanisms in irritable bowel syndrome patient subgroups and healthy controls. Gut. 2004;53:1595‐601.
66. Fadgyas‐Stanculete M, Buga AM, Popa‐Wagner A, Dumitrascu DL. The relationship between irritable
bowel syndrome and psychiatric disorders: from molecular changes to clinical manifestations. J Mol Psychiatry. 2014;2:4.
67. Mayer EA, Craske M, Naliboff BD. Depression, anxiety, and the gastrointestinal system. J Clin Psychiatry.
2001;62 Suppl 8:28‐36; discussion 7. 68. Kaplan DS, Masand PS, Gupta S. The relationship of irritable bowel syndrome (IBS) and panic disorder.
Ann Clin Psychiatry. 1996;8:81‐8.
69. Fukudo S, Nomura T, Hongo M. Impact of corticotropin‐releasing hormone on gastrointestinal motility and adrenocorticotropic hormone in normal controls and patients with irritable bowel syndrome. Gut.
1998;42:845‐9.
70. Heitkemper M, Burr RL, Jarrett M, Hertig V, Lustyk MK, Bond EF. Evidence for autonomic nervous system imbalance in women with irritable bowel syndrome. Dig Dis Sci. 1998;43:2093‐8.
71. Keszthelyi D, Troost FJ, Masclee AA. Understanding the role of tryptophan and serotonin metabolism in
gastrointestinal function. Neurogastroenterol Motil. 2009;21:1239‐49. 72. Cumming W. Electro‐galvanism in a peculiar affliction of the mucous membrane of the bowels. London
Med Gazette. 1849;NS9:969‐73.
73. Ford AC, Moayyedi P. Meta‐analysis: factors affecting placebo response rate in the irritable bowel syndrome. Aliment Pharmacol Ther. 2010;32:144‐58.
74. U.S. Department of Health and Human Services FaDA, Center for Drug Evaluation and Research (CDER).
Guidance for Industry Irritable Bowel Syndrome ‐ Clinical Evaluation of Drugs for Treatment, 2012. http://wwwfdagov/downloads/Drugs/Guidances/UCM205269pdf.
75. Spiegel B, Bolus R, Harris LA, Lucak S, Naliboff B, Esrailian E, Chey WD, Lembo A, Karsan H, Tillisch K,
Talley J, Mayer E, Chang L. Measuring irritable bowel syndrome patient‐reported outcomes with an abdominal pain numeric rating scale. Aliment Pharmacol Ther. 2009;30:1159‐70.
76. Svedlund J, Sjodin I, Dotevall G. GSRS‐‐a clinical rating scale for gastrointestinal symptoms in patients
with irritable bowel syndrome and peptic ulcer disease. Dig Dis Sci. 1988;33:129‐34. 77. Francis CY, Morris J, Whorwell PJ. The irritable bowel severity scoring system: a simple method of
monitoring irritable bowel syndrome and its progress. Aliment Pharmacol Ther. 1997;11:395‐402.
78. Stone AA, Shiffman S, Schwartz JE, Broderick JE, Hufford MR. Patient compliance with paper and electronic diaries. Control Clin Trials. 2003;24:182‐99.
79. Biomarkers Definitions Working G. Biomarkers and surrogate endpoints: preferred definitions and
conceptual framework. Clin Pharmacol Ther. 2001;69:89‐95. 80. Lembo AJ, Neri B, Tolley J, Barken D, Carroll S, Pan H. Use of serum biomarkers in a diagnostic test for
irritable bowel syndrome. Aliment Pharmacol Ther. 2009;29:834‐42.
81. Jones MP, Chey WD, Singh S, Gong H, Shringarpure R, Hoe N, Chuang E, Talley NJ. A biomarker panel and psychological morbidity differentiates the irritable bowel syndrome from health and provides novel
pathophysiological leads. Aliment Pharmacol Ther. 2014;39:426‐37.

Chapter 1
22

23
PART I
Pathophysiology

Chapter 1
24
25
Chapter 2
Intestinal permeability in IBS
Small intestinal permeability is increased in diarrhoea predominant IBS, while
alterations in gastroduodenal permeability in all IBS subtypes are largely attributable to
confounders
Zlatan Mujagic*, Samefko Ludidi*, Daniel Keszthelyi, Martine AM Hesselink,
Joanna W Kruimel, Kaatje Lenaerts, Nordin MJ Hanssen, José M Conchillo,
Daisy MAE Jonkers, Ad AM Masclee * Both authors contributed equally to the manuscript
Alimentary Pharmacology & Therapeutics 2014;40:288‐97
Chapter 2
26
Abstract
Background
Intestinal permeability has been studied in small groups of IBS patients with contrasting
findings.
Aim
The aims of the present study were to assess intestinal permeability at different sites of
the GI tract in different subtypes of well‐characterised IBS patients and healthy controls
(HC) and to assess potential confounding factors.
Methods
IBS patients and HC underwent a multi‐sugar test to assess site‐specific intestinal
permeability. Sucrose excretion and lactulose/rhamnose ratio in 0‐5h urine indicated
gastroduodenal and small intestinal permeability, respectively. Sucralose/erythritol
ratio in 0‐24h and 5‐24h urine indicated whole gut and colonic permeability,
respectively. Linear regression analysis was used to assess the association between IBS
groups and intestinal permeability and to adjust for age, sex, BMI, anxiety or
depression, smoking, alcohol intake, and use of medication.
Results
91 IBS patients, i.e. 37% IBS‐D, 23% IBS‐C, 33% IBS‐M and 7% IBS‐U, and 94 HC were
enrolled. Urinary sucrose excretion was significantly increased in the total IBS group
(µmol, median [Q1;Q3]: 5.26 [1.82;11.03] vs. 2.44 [0.91;5.85], p<0.05), as well as in IBS‐
C and IBS‐D versus HC. However, differences attenuated when adjusting for
confounders. The lactulose/rhamnose ratio was increased in IBS‐D versus HC (0.023
[0.013;0.038] vs. 0.014 [0.008;0.025], p<0.05), which remained significant after
adjustment for confounders. No difference was found in 0‐24 and 5‐24 hour
sucralose/erythritol ratio between groups.
Conclusion
Small intestinal permeability is increased in patients with IBS‐D compared to HC,
irrespective of confounding factors. Adjustment for confounders is necessary when
studying intestinal permeability, especially in a heterogeneous disorder such as IBS.
IBS and intestinal permeability
27
Introduction
Irritable bowel syndrome (IBS) is a frequently occurring functional disorder of the
gastrointestinal (GI) tract, characterised by abdominal pain and alterations in bowel
habits. It is associated with impaired quality of life, increased use of health care services
and high health care costs.1,2 The IBS patient population is phenotypically very
heterogeneous, with a diversity of predominant symptoms and clinical characteristics,3
reflecting the multitude of underlying pathophysiological mechanisms.4
Changes in gut epithelial barrier function have been observed in IBS and have been
postulated to play a role in the pathogenesis of the disorder. Several studies have
pointed to an increased intestinal permeability in IBS patients when compared to
healthy controls. However, these findings were based on data obtained in small study
populations,5‐7 or only in specific IBS subpopulations, such as post‐infectious IBS
cohorts7‐9 or diarrhoea predominant IBS (IBS‐D).5,10,11 Alterations in intestinal
permeability appear to be subtype‐related and site‐specific, as several studies found an
increased small intestinal permeability in patients with IBS‐D.5,7,10,11 Data on colonic and
whole gut permeability are inconsistent5‐7,12,13 and only a limited number of studies
investigated a non‐selected heterogeneous IBS population6,12,14 or focussed also on
patients with constipation predominant IBS (IBS‐C).7,13 Comparison of data from
published studies is further hampered by differences in methodology of permeability
tests. Furthermore, factors such as demographical characteristics, medication and
lifestyle are known to influence intestinal permeability, but currently available
information on possible confounding effects by these factors on intestinal permeability
in IBS patients is very limited.8,12
Therefore, data are needed from larger well‐characterised IBS cohorts using validated
site‐specific intestinal permeability measurements for the different anatomical GI
locations, comparing different subtypes and taking possible confounders into account.
We hypothesized that 1) IBS patients have increased intestinal permeability compared
to healthy controls (HC), which is site‐specific and subtype‐dependent and 2) intestinal
permeability in IBS patients is affected by factors such as demographical or lifestyle
characteristics, psychological symptoms and use of medication.
Aims of the present study were 1) to assess intestinal permeability of different sites of
the GI tract, in a large group of well‐characterised IBS patients and healthy controls and
to investigate whether differences exist between IBS subtypes and 2) to assess
potential confounding effects of demographical characteristics, psychological and
lifestyle factors and use of medication on intestinal permeability.
Chapter 2
28
Materials and methods
Study participants
The present study is part of a larger cohort study on the phenotypical and genotypical
characterisation of patients with IBS, with age and gender matched healthy controls,
wherein multiple parameters were assessed according to standardised procedures. The
subgroup of patients and controls that underwent an intestinal permeability test was
included in the current study.
Between September 2009 and June 2013, subjects between 18 and 75 years of age,
with IBS diagnosed by the Rome III criteria were recruited via the outpatient
department of the division Gastroenterology‐Hepatology of the Maastricht University
Medical Center+, a secondary and tertiary referral centre. Medical history was taken by
a gastroenterologist. GI endoscopy with biopsies, abdominal imaging by
ultrasonography or CT scan and/or blood, breath and faecal analysis were performed to
exclude organic disease, if indicated. Patients with a history of abdominal surgery,
except appendectomy, laparoscopic cholecystectomy and hysterectomy, and patients
who were not able to abide the instructions for the permeability test were excluded.
IBS patients were assigned to subtypes, i.e. diarrhoea (IBS‐D), constipation (IBS‐C),
mixed stool pattern (IBS‐M) and unspecified stool pattern (IBS‐U), based on
predominant bowel habits according to the ROME III criteria and daily Bristol Stool
Chart in a 14‐day symptom dairy.15
Healthy subjects in the same age category were included, as controls (HC). They were
enrolled via public advertising on websites and in local newspapers. Before
participation, a brief medical history was taken to exclude the presence of GI disorders
and current or previous GI complaints. All measurements performed in IBS patients
were also carried out in HC.
All subjects have given written informed consent prior to their inclusion. The study
protocol has been approved by the Maastricht University Medical Center+ Committee
of Ethics and was executed according to the revised Declaration of Helsinki (59th
general assembly of the WMA, Seoul, South Korea, Oct. 2008). The study has been
registered in the US National Library of Medicine (http://www.clinicaltrials.gov,
NCT00775060).
Permeability measurement
Intestinal permeability was assessed on four sites of the GI tract. Sucrose excretion and
the lactulose and rhamnose (L/R) ratio in 0‐5 hour urine were used as indicators of
gastroduodenal and small intestinal permeability, respectively. Whole‐gut permeability
was indicated by the sucralose and erythritol (S/E) ratio in 0‐24 hour urine, whereas the
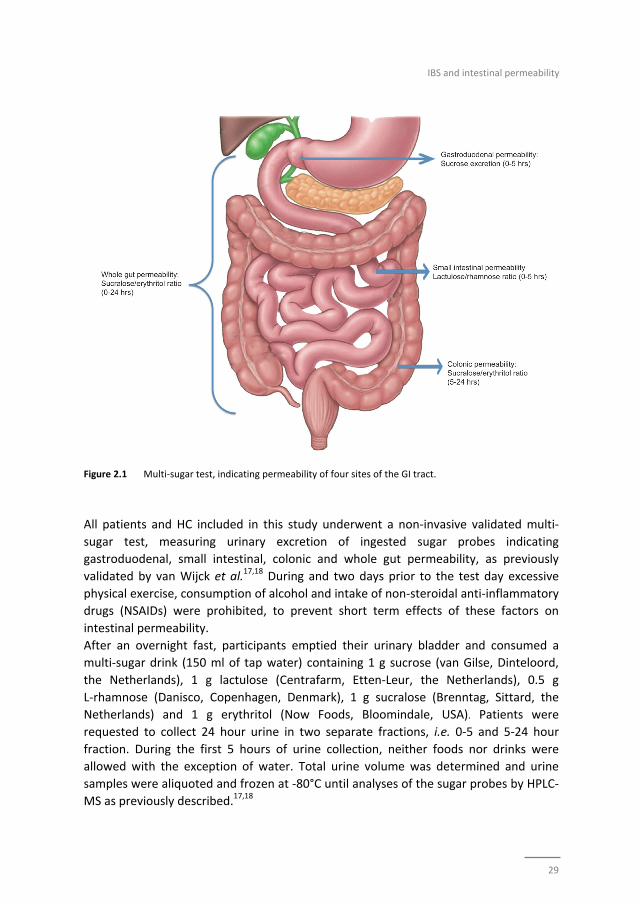
5‐24 hour S/E ratio was used as indicator for colonic permeability (Figure 2.1).16‐18
IBS and intestinal permeability
29
Figure 2.1 Multi‐sugar test, indicating permeability of four sites of the GI tract.
All patients and HC included in this study underwent a non‐invasive validated multi‐
sugar test, measuring urinary excretion of ingested sugar probes indicating
gastroduodenal, small intestinal, colonic and whole gut permeability, as previously
validated by van Wijck et al.17,18 During and two days prior to the test day excessive
physical exercise, consumption of alcohol and intake of non‐steroidal anti‐inflammatory
drugs (NSAIDs) were prohibited, to prevent short term effects of these factors on
intestinal permeability.
After an overnight fast, participants emptied their urinary bladder and consumed a
multi‐sugar drink (150 ml of tap water) containing 1 g sucrose (van Gilse, Dinteloord,
the Netherlands), 1 g lactulose (Centrafarm, Etten‐Leur, the Netherlands), 0.5 g
L‐rhamnose (Danisco, Copenhagen, Denmark), 1 g sucralose (Brenntag, Sittard, the
Netherlands) and 1 g erythritol (Now Foods, Bloomindale, USA). Patients were
requested to collect 24 hour urine in two separate fractions, i.e. 0‐5 and 5‐24 hour
fraction. During the first 5 hours of urine collection, neither foods nor drinks were
allowed with the exception of water. Total urine volume was determined and urine
samples were aliquoted and frozen at ‐80°C until analyses of the sugar probes by HPLC‐
MS as previously described.17,18
Chapter 2
30
Questionnaires
Within a period of two weeks prior to the permeability measurement, questionnaires
on demographical characteristics, lifestyle factors and the use of medication were
completed by the participants. The presence of GI symptoms was assessed using the
validated gastrointestinal symptom rating scale (GSRS), consisting of 16 items clustered
into five major GI syndromes: abdominal pain, reflux, diarrhea, indigestion and
constipation syndrome.19 Moreover, symptoms of discomfort, abdominal pain,
bloating, flatulence, nausea and intensity of total complaints were scored daily during
14 days, on a 5‐point Likert‐scale, in a symptom diary. Subsequently, the mean
symptom composite score (MSS) was calculated, based on sum of individual symptoms
per day.20
Symptoms of anxiety and depression were assessed using the hospital anxiety and
depression scale (HADS). This questionnaire consists of two 7‐item scales, that is one
for anxiety and one for depression, each with a Likert scoring range between 0–3. A
higher score indicates a higher degree of distress and a total score >8 on either the
anxiety or depression scale is indicative for the presence of anxiety or depression
symptoms, respectively.21,22
Data and statistical analysis
Statistical analysis was performed using IBM SPSS Statistics version 21.0 (IBM Statistics
for Macintosh, Chicago IL).
The total IBS group is referred to as IBSTOTAL. Data of IBSTOTAL and IBS subtypes versus HC
were compared using linear regression analysis. Due to skewed distribution, urinary
sugar excretions and ratios were natural logarithmic (LN) transformed. Linear
regression analysis was performed to assess the association between presence of IBS
and intestinal permeability (Model 1). Furthermore, we investigated possible
confounding effects of disease‐related factors on intestinal permeability. Therefore, we
first adjusted the crude analysis for demographical characteristics (age, sex, BMI),
(Model 2). Next, we additionally adjusted for psychological (anxiety or depressive)
symptoms, (Model 3). We then additionally adjusted for lifestyle factors (smoking
history, defined as current or previous smoker, and high use of alcohol, defined as more
than 15 units per week), (Model 4), and thereafter additionally for use of medication in
the two weeks prior to inclusion (NSAID, proton pump inhibitors (PPI), selective
serotonin reuptake inhibitors (SSRI) and medication that affects motility, i.e. laxatives,
prokinetics, opioids, spasmolytics and anti‐diarrhoeal drugs), (Model 5). All analyses
were performed for IBSTOTAL as well as for the subtypes in a separate analysis as dummy
variables. To investigate which covariate had the strongest confounding effect on the
association between presence of IBS and sugar excretion or ratios, we additionally
adjusted the crude analysis (Model 1) for all factors separately. The factors with the
strongest significant effects where thereafter omitted separately from the fully
IBS and intestinal permeability
31
adjusted model (Model 1‐5) to determine if the factors are indeed confounders and
affect the association between IBS and sugar excretion or ratios or if the factors are
independently of the presence of IBS associated with sugar excretion or ratios.
Missing values were excluded listwise. A two‐sided p‐value of 0.05 was considered
statistically significant. The ß of the linear regression analyses signifies one LN change in
sugar excretion and ratios versus HC.
Finally, Spearman's rank was used to assess correlation between urinary sugar
excretions or ratios and GI symptoms.
Results
Demographical characteristics
Intestinal permeability data were available from 91 IBS patients and 94 HC.
Predominant bowel habits for diarrhoea (IBS‐D), constipation (IBS‐C), mixed stool
pattern (IBS‐M) and unspecified stool pattern (IBS‐U) were seen in 37% (n=34), 23%
(n=21), 33% (n=30) and 7% (n=6) of the patients, respectively. Due to the small number
of patients with IBS‐U, this group has not been analysed as a separate subtype. All
patients were included in the analysis of the group IBSTOTAL.
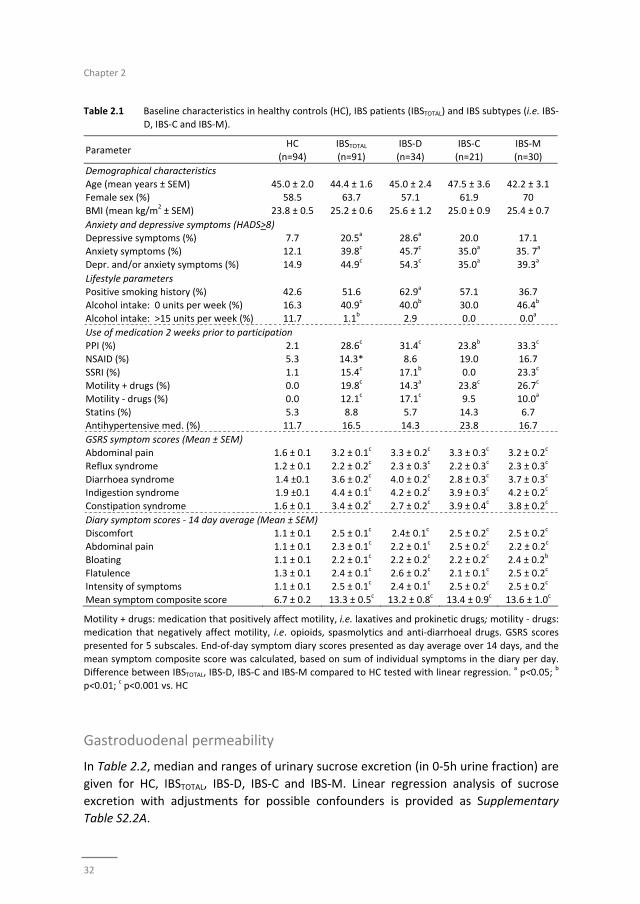
Demographical characteristics, GI and psychological symptoms, lifestyle parameters
and use of medication in HC, IBSTOTAL and IBS subtypes are presented in Table 2.1. No
statistically significant differences were observed for age, sex and BMI between groups.
Symptoms of anxiety and depression, as well as use medication were significantly
higher in IBSTOTAL versus HC. Overall alcohol consumption was significantly lower in
IBSTOTAL when compared to HC, and this was also true for high alcohol intake, i.e. above
15 units per week. As to be expected, severity of all GI symptoms was significantly
higher in IBS patients versus HC and bowel habits were altered according to IBS
subtype.
Urinary sugar excretion
Data of absolute recovery of urinary excreted sugars per urine fraction is provided in
Supplementary Table S2.1.
Chapter 2
32
Table 2.1 Baseline characteristics in healthy controls (HC), IBS patients (IBSTOTAL) and IBS subtypes (i.e. IBS‐
D, IBS‐C and IBS‐M).
Parameter HC
(n=94)
IBSTOTAL
(n=91)
IBS‐D
(n=34)
IBS‐C
(n=21)
IBS‐M
(n=30)
Demographical characteristics
Age (mean years ± SEM) 45.0 ± 2.0 44.4 ± 1.6 45.0 ± 2.4 47.5 ± 3.6 42.2 ± 3.1 Female sex (%) 58.5 63.7 57.1 61.9 70
BMI (mean kg/m2 ± SEM) 23.8 ± 0.5 25.2 ± 0.6 25.6 ± 1.2 25.0 ± 0.9 25.4 ± 0.7
Anxiety and depressive symptoms (HADS>8)
Depressive symptoms (%) 7.7 20.5a 28.6
a 20.0 17.1
Anxiety symptoms (%) 12.1 39.8c 45.7
c 35.0
a 35. 7
a
Depr. and/or anxiety symptoms (%) 14.9 44.9c 54.3
c 35.0
a 39.3
a
Lifestyle parameters
Positive smoking history (%) 42.6 51.6 62.9a 57.1 36.7
Alcohol intake: 0 units per week (%) 16.3 40.9c 40.0
b 30.0 46.4
b
Alcohol intake: >15 units per week (%) 11.7 1.1b 2.9 0.0 0.0
a
Use of medication 2 weeks prior to participation
PPI (%) 2.1 28.6c 31.4
c 23.8
b 33.3
c
NSAID (%) 5.3 14.3* 8.6 19.0 16.7
SSRI (%) 1.1 15.4c 17.1
b 0.0 23.3
c
Motility + drugs (%) 0.0 19.8c 14.3
a 23.8
c 26.7
c
Motility ‐ drugs (%) 0.0 12.1c 17.1
c 9.5 10.0
a
Statins (%) 5.3 8.8 5.7 14.3 6.7
Antihypertensive med. (%) 11.7 16.5 14.3 23.8 16.7
GSRS symptom scores (Mean ± SEM)
Abdominal pain 1.6 ± 0.1 3.2 ± 0.1c 3.3 ± 0.2
c 3.3 ± 0.3
c 3.2 ± 0.2
c
Reflux syndrome 1.2 ± 0.1 2.2 ± 0.2c 2.3 ± 0.3
c 2.2 ± 0.3
c 2.3 ± 0.3
c
Diarrhoea syndrome 1.4 ±0.1 3.6 ± 0.2c 4.0 ± 0.2
c 2.8 ± 0.3
c 3.7 ± 0.3
c
Indigestion syndrome 1.9 ±0.1 4.4 ± 0.1c 4.2 ± 0.2
c 3.9 ± 0.3
c 4.2 ± 0.2
c
Constipation syndrome 1.6 ± 0.1 3.4 ± 0.2c 2.7 ± 0.2
c 3.9 ± 0.4
c 3.8 ± 0.2
c
Diary symptom scores ‐ 14 day average (Mean ± SEM)
Discomfort 1.1 ± 0.1 2.5 ± 0.1c 2.4± 0.1
c 2.5 ± 0.2
c 2.5 ± 0.2
c
Abdominal pain 1.1 ± 0.1 2.3 ± 0.1c 2.2 ± 0.1
c 2.5 ± 0.2
c 2.2 ± 0.2
c
Bloating 1.1 ± 0.1 2.2 ± 0.1c 2.2 ± 0.2
c 2.2 ± 0.2
c 2.4 ± 0.2
b
Flatulence 1.3 ± 0.1 2.4 ± 0.1c 2.6 ± 0.2
c 2.1 ± 0.1
c 2.5 ± 0.2
c
Intensity of symptoms 1.1 ± 0.1 2.5 ± 0.1c 2.4 ± 0.1
c 2.5 ± 0.2
c 2.5 ± 0.2
c
Mean symptom composite score 6.7 ± 0.2 13.3 ± 0.5c 13.2 ± 0.8
c 13.4 ± 0.9
c 13.6 ± 1.0
c
Motility + drugs: medication that positively affect motility, i.e. laxatives and prokinetic drugs; motility ‐ drugs: medication that negatively affect motility, i.e. opioids, spasmolytics and anti‐diarrhoeal drugs. GSRS scores
presented for 5 subscales. End‐of‐day symptom diary scores presented as day average over 14 days, and the
mean symptom composite score was calculated, based on sum of individual symptoms in the diary per day. Difference between IBSTOTAL, IBS‐D, IBS‐C and IBS‐M compared to HC tested with linear regression.
a p<0.05;
b
p<0.01; c p<0.001 vs. HC
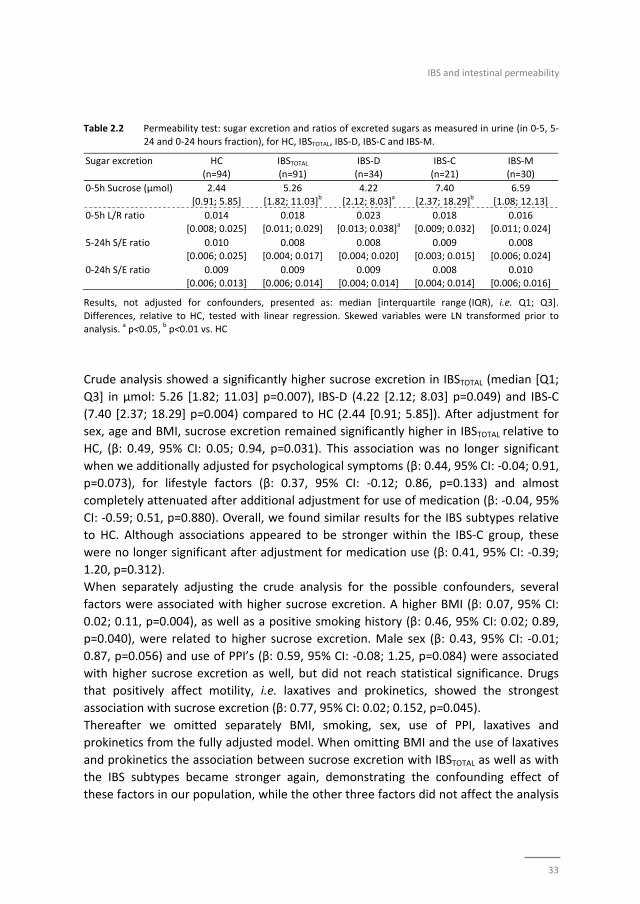
Gastroduodenal permeability
In Table 2.2, median and ranges of urinary sucrose excretion (in 0‐5h urine fraction) are
given for HC, IBSTOTAL, IBS‐D, IBS‐C and IBS‐M. Linear regression analysis of sucrose
excretion with adjustments for possible confounders is provided as Supplementary
Table S2.2A.
IBS and intestinal permeability
33
Table 2.2 Permeability test: sugar excretion and ratios of excreted sugars as measured in urine (in 0‐5, 5‐
24 and 0‐24 hours fraction), for HC, IBSTOTAL, IBS‐D, IBS‐C and IBS‐M.
Sugar excretion HC (n=94)
IBSTOTAL (n=91)
IBS‐D (n=34)
IBS‐C (n=21)
IBS‐M (n=30)
0‐5h Sucrose (μmol) 2.44
[0.91; 5.85]
5.26
[1.82; 11.03]b
4.22
[2.12; 8.03]a
7.40
[2.37; 18.29]b
6.59
[1.08; 12.13]
0‐5h L/R ratio 0.014
[0.008; 0.025]
0.018
[0.011; 0.029]
0.023
[0.013; 0.038]a
0.018
[0.009; 0.032]
0.016
[0.011; 0.024]
5‐24h S/E ratio 0.010 [0.006; 0.025]
0.008 [0.004; 0.017]
0.008 [0.004; 0.020]
0.009 [0.003; 0.015]
0.008 [0.006; 0.024]
0‐24h S/E ratio 0.009
[0.006; 0.013]
0.009
[0.006; 0.014]
0.009
[0.004; 0.014]
0.008
[0.004; 0.014]
0.010
[0.006; 0.016]
Results, not adjusted for confounders, presented as: median [interquartile range (IQR), i.e. Q1; Q3].
Differences, relative to HC, tested with linear regression. Skewed variables were LN transformed prior to analysis.
a p<0.05,
b p<0.01 vs. HC
Crude analysis showed a significantly higher sucrose excretion in IBSTOTAL (median [Q1;
Q3] in µmol: 5.26 [1.82; 11.03] p=0.007), IBS‐D (4.22 [2.12; 8.03] p=0.049) and IBS‐C
(7.40 [2.37; 18.29] p=0.004) compared to HC (2.44 [0.91; 5.85]). After adjustment for
sex, age and BMI, sucrose excretion remained significantly higher in IBSTOTAL relative to
HC, (β: 0.49, 95% CI: 0.05; 0.94, p=0.031). This association was no longer significant
when we additionally adjusted for psychological symptoms (β: 0.44, 95% CI: ‐0.04; 0.91,
p=0.073), for lifestyle factors (β: 0.37, 95% CI: ‐0.12; 0.86, p=0.133) and almost
completely attenuated after additional adjustment for use of medication (β: ‐0.04, 95%
CI: ‐0.59; 0.51, p=0.880). Overall, we found similar results for the IBS subtypes relative
to HC. Although associations appeared to be stronger within the IBS‐C group, these
were no longer significant after adjustment for medication use (β: 0.41, 95% CI: ‐0.39;
1.20, p=0.312).
When separately adjusting the crude analysis for the possible confounders, several
factors were associated with higher sucrose excretion. A higher BMI (β: 0.07, 95% CI:
0.02; 0.11, p=0.004), as well as a positive smoking history (β: 0.46, 95% CI: 0.02; 0.89,
p=0.040), were related to higher sucrose excretion. Male sex (β: 0.43, 95% CI: ‐0.01;
0.87, p=0.056) and use of PPI’s (β: 0.59, 95% CI: ‐0.08; 1.25, p=0.084) were associated
with higher sucrose excretion as well, but did not reach statistical significance. Drugs
that positively affect motility, i.e. laxatives and prokinetics, showed the strongest
association with sucrose excretion (β: 0.77, 95% CI: 0.02; 0.152, p=0.045).
Thereafter we omitted separately BMI, smoking, sex, use of PPI, laxatives and
prokinetics from the fully adjusted model. When omitting BMI and the use of laxatives
and prokinetics the association between sucrose excretion with IBSTOTAL as well as with
the IBS subtypes became stronger again, demonstrating the confounding effect of
these factors in our population, while the other three factors did not affect the analysis
Chapter 2
34
(data not shown) and are therefore not confounders in this analysis but are
independently associated with increased sucrose excretion.
Small intestinal permeability
Median and ranges of L/R ratio (in 0‐5h urine fraction) are given for HC, IBSTOTAL, IBS‐D,
IBS‐C and IBS‐M in Table 2.2. Linear regression analysis of L/R ratio with adjustments
for possible confounders is provided as Supplementary Table S2.2B.
Crude analysis showed a significantly higher L/R ratio in IBS‐D (median [Q1; Q3]: 0.023
[0.013; 0.038], p=0.029) compared to HC (0.014 [0.008; 0.025]), but no significant
differences were observed for other subtypes or IBSTOTAL. After adjustment for
demographical factors, psychological symptoms and lifestyle, the L/R ratio remained
significantly higher for IBS‐D relative to HC (β: 0.53, 95% CI: 0.03; 1.03, p=0.037). This
association was even slightly stronger when we additionally adjusted for use of
medication (β: 0.63, 95% CI: 0.09; 1.16, p=0.022).
Separately adjusting the crude analysis for each factor revealed that only male sex was
associated with increased L/R ratio (β: 0.31, 95% CI: ‐0.01; 0.63, p=0.054), although not
reaching statistical significance. When thereafter adjusting the crude analysis for all
factors combined and excluding sex, the associations between IBS groups and L/R ratio
was not affected (data not shown), demonstrating that the effect of the investigated
confounders on the association between IBS and L/R ratio is small.
Colon and whole gut permeability
Linear regression analysis of S/E‐ratio in the 5‐24h of urine fraction, indicating colonic
permeability, and in 0‐24h urine, indicating whole‐gut permeability, without (see also
Table 2.2) or with adjustments for possible confounding factors (data not shown), did
not show significant differences between IBSTOTAL or IBS subtypes compared to HC.
Correlation between intestinal permeability and symptoms
Symptoms of abdominal pain, diarrhea and indigestion syndrome as measured by the
GSRS, showed a statistically significant but weak positive correlation with sucrose
excretion (all Spearman’s rho<0.27; p=0.001). Diarrhea and indigestion syndrome also
showed a significant but weak positive correlation with L/R ratio (all Spearman’s
rho<0.17; p<0.05). No significant correlation was found for other symptoms, nor
between GI symptoms and colonic or whole gut permeability. Correlations between
symptoms measured by the 14‐days symptom diary and intestinal permeability were
comparable (data not shown).
IBS and intestinal permeability
35
Discussion
In this paper, we report on gut permeability testing, employing a validated multi‐sugar
test that simultaneously measures permeability at various sites in the GI tract, in a large
and well‐characterized IBS population and a healthy control group. In addition, we
evaluated the effect of possible confounding factors. Sucrose excretion was significantly
higher in IBSTOTAL, IBS‐D and IBS‐C when compared to controls and the L/R ratio was
significantly higher in IBS‐D patients. However, after adjustment for possible
confounders, only the L/R ratio, indicating small intestinal permeability, in IBS‐D
remained significantly increased when compared to controls.
We have used a validated multi‐sugar test to analyse site‐specific permeability of the
intestine. The advantage of this test is that low dosages of 5 different sugars were given
and analysed in two urine fractions, i.e. 0‐5h and 5‐24h, as indicators for
gastroduodenal, small intestinal, colonic and whole gut permeability (see also Figure
2.1). The site‐specificity of the different sugars and ratios used is tested previously in
animal and human studies.16‐18,23‐25 Sucrose (a disaccharide) is hydrolysed by the
enzyme sucrase in the duodenum,23 and has been demonstrated to indicate
gastroduodenal permeability when measured in 0‐5h urine. Lactulose (a disaccharide,
not broken down by human enzymes) can permeate by the paracellar route and
rhamnose (a mono‐saccharide) by the transcellular route. As both are degraded by
bacteria that are most abundant in the colon,16 they are typically used as markers for
small intestinal permeability.16‐18,24,26,27 With respect to urine sampling after sugar
intake, it is not yet clear whether 0‐1h, 0‐2h or 0‐5h urine fractions best reflect small
intestinal permeability. Data from van Wijck et al. indicate however, that 0‐5h fractions
in the applied multi‐sugar test, do reflect small intestinal permeability.17,18 Sucralose (a
disaccharide) and erythritol (a sugar alcohol) are both not broken down by human
enzymes nor by human colonic bacteria.28,29 Therefore ratios of these sugars in 5‐24h
and 0‐24h urine are used as indicators for colonic and whole gut permeability,
respectively.16‐18,24 Permeability testing by sugar probes could possibly be affected by
differences in gastric emptying and intestinal transit time, which were not assessed in
our study. However, by using a total ingested sugar amount of only 4.5g and the ratios
of transcellularly and paracellularly absorbed sugar probes, these effects were
minimized.
We found a significant difference in sucrose excretion, pointing to increased
gastroduodenal permeability in IBSTOTAL as well as in IBS‐C and IBS‐D patients compared
to HC. However, after adjusting for patient characteristics and psychological symptoms,
this difference did not remain significant for IBSTOTAL and IBS‐D. When further adjusting
for lifestyle factors and use of medication the difference did not remain significant for
Chapter 2
36
IBS‐C either, indicating that the observed difference was mainly based on confounding
factors in our population.
Although IBS is a heterogeneous disease associated with a wide variety of patient
characteristics and environmental factors (e.g. sex differences, psychosocial events,
medication), most studies assessing intestinal permeability in IBS patients have not
taken into account the possible confounding effects of these factors. Therefore it is not
known whether their observations on permeability were associated with the disease
per se or with the presence of possible confounders. Only two studies reported on a
limited number of possible confounders. In the Walkerton cohort of post infectious IBS
patients, male sex was found to be associated with increased lactulose‐mannitol ratio
in overnight urine fractions,8 which was previously demonstrated in healthy controls,30
pointing to a physiological sex difference. Furthermore NSAIDs were shown to
compromise whole gut permeability in both IBS patients and healthy controls.12
We have analysed a large number of potential confounding factors. A higher BMI was
shown to have an important confounding effect on the association between IBS and
sucrose excretion in our study, which is in line with previously reported increased
intestinal permeability in obese healthy subjects compared to lean.31 The most
pronounced effect on sucrose excretion was found when we separately adjusted for
the use of drugs that positively affect motility, i.e. prokinetics and laxatives. A possible
mechanism by which prokinetics increase intestinal permeability could be the
dopaminergic receptor stimulation by these drugs which in animal models was found to
be associated with intestinal barrier alterations.32 One study postulated that laxatives
increase intestinal permeability by direct effects on tight junction proteins.33
Male sex, smoking and use of PPI’s were associated with higher sucrose excretion in our
study, but did not have a confounding effect in our study population. In previous
studies an increased sucrose excretion was found in patients with gastro‐oesophageal
reflux disease as well as in healthy controls that use PPI’s. It was hypothesized that this
may be caused by PPI‐related effects on the intracellular potassium and calcium
homeostasis, which could affect the cytoskeleton and thereby tight junctions between
epithelial cells.34 We cannot fully rule out that PPIs or other medications did not have
any causal effect on permeability, but rather that the underlying condition for which
they were used were the cause of the observed association. However, we did not see
differences in permeability on all GI sites between patients with and without
reflux/dyspepsia symptoms, being conditions clearly associated with PPI use. With
respect to smoking, previous reports showed no difference in intestinal permeability
between smoking and non‐smoking patients with inflammatory bowel disease and
healthy subjects.35,36 With respect to use of NSAIDs, it has been observed that these
drugs can increase intestinal permeability in IBS patients and healthy subjects shortly
after intake, i.e. acute effects.12,27 We instructed study subjects to refrain from use of
NSAIDs or alcohol in the two days prior and during the permeability test, in order to
eliminate acute effect of these substances on intestinal permeability. Therefore, our
IBS and intestinal permeability
37
data reflect chronic rather than acute effects and these factors did not reveal to be
confounders in our population. In a post‐hoc analysis we also tested the effect of
alcohol intake versus no alcohol intake in general for our population, and no effect of
alcohol intake on intestinal permeability was observed in this case as well (data not
shown).
The urinary L/R ratio was affected and points to an increased small intestinal
permeability in patients with IBS‐D compared to HC, but not in other IBS‐subtypes. Our
finding is in line with previous observations in small sized studies (12 to 19 IBS‐D
patients).5,7,11 The significant difference in L/R ratio between IBS‐D and HC that we
observed persisted after adjustment for confounders.
The increased permeability, reflecting intestinal barrier dysfunction of the small bowel,
may represent an important pathophysiological mechanism in IBS‐D. This finding is
supported by recent mechanistic studies revealing not only an increased number and
activation of mast cells in jejunal biopsies of IBS‐D patients compared to HC, but also
significant differences in global gene expression, particularly in tight‐junction signaling
pathways,37 and structural alterations of the apical junction complex correlating
positively with mast cell activation as well as with clinical symptoms.38 These data
support the concept of IBS‐D as a functional gut disorder or entity having specific
organic substrates and underlying pathophysiological mechanisms.
Whether increased intestinal permeability is an early event or consequence of IBS
remains to be determined. Previous findings indicate that barrier dysfunction may
contribute to symptom generation in IBS10,38,39 and point to the direction of barrier
dysfunction as an early event, facilitating permeation of e.g. bacteria and their products
(i.e. lipopolysaccharides), resulting in immune activation40,41 which may further increase
paracellular epithelial permeability and subsequent low‐grade mucosal
inflammation.42‐44 Increased intestinal permeability has also been associated with
visceral hypersensitivity in IBS patients.10 However, it has to be noted that increased
intestinal permeability may be a consequence, rather than a causative factor of IBS.
Recent studies have shown that acute stress and factors along the gut brain axis, e.g.
serotonin45 and corticotropin‐releasing factor (CRF),46 modulate intestinal permeability
by mast cell‐dependent mechanisms in murine models as well as in healthy human
subjects, postulating that the enteric and central nervous system may have a regulatory
effect on the intestinal barrier function.46‐49 Since this evidence exists for an association
between acute stress and increased intestinal permeability in healthy individuals, we
have analysed the influence of chronic symptoms of anxiety and depression on
intestinal permeability (Model 2) in IBS patients. Symptoms of anxiety and depression
appear to account for part of the increased sucrose excretion and L/R ratio in IBS
patients; however, in the additional analysis of the separate co‐factors the effect of
psychological symptoms on intestinal permeability was only weak and not statistically
significant.
Chapter 2
38
The identification of increased small intestinal permeability in patients with IBS‐D may
become relevant from a therapeutic perspective. However, first more mechanistic
research is needed to provide a definition of a clinically relevant difference in intestinal
permeability, e.g. associated to increased bacterial translocation or endotoxin levels
and subsequent mucosal inflammation contributing to symptom generation in the
target population.
Previous data on in vivo colonic permeability in IBS or IBS‐D are contrasting, i.e. lower,6
higher5,11,13 or unaltered colonic permeability7 when compared to HC. There are
however some indications of impaired barrier function in studies focussing on tight
junctions in colonic biopsies from IBS patients, with reduced expression of zonula
occludens‐1 and occludin proteins.50 Previous reports on whole gut permeability do
point to the direction of increased permeability in post‐infectious IBS and IBS‐D,8,10
while no differences were found for IBS patients in general when compared to HC.6,12
However, all studies used different methods to assess the colonic and whole gut
permeability and included relatively small numbers of subjects or assessed permeability
only in post‐infectious IBS patients. Our aim was to clarify this point by assessing
colonic as well as whole gut permeability in a large group of IBS patients, using the
validated multi‐sugar test. Our results however, do not show statistically significant
differences in S/E ratio in 5‐24h and 0‐24h urine fraction, indicating no alternations in
colonic or whole gut permeability, respectively, in IBSTOTAL or IBS subtypes when
compared to HC.
IBS is a very heterogeneous disorder that is associated with a multitude of patient
characteristics and chronic or intermittent use of medication. Based on literature data,
we anticipated that some of these factors would affect intestinal permeability. Our
results demonstrate that especially sucrose excretion was affected by confounders,
thereby altering the conclusion with respect to gastroduodenal permeability in IBS
patients. Based on the present findings, especially BMI, smoking history, medication
and sex should be taken into account as possible confounders in future permeability
studies. Moreover, after adjustment of our analysis for possible confounding factors
only small intestinal permeability (L/R ratio) in IBS‐D patients remained significantly
increased compared to HC.
Our findings clearly show the relevance of adjustment for possible confounding factors,
as well as site‐specific permeability assessment and IBS subtype differentiation in
future studies analysing intestinal permeability in IBS patients.
Although we assessed intestinal permeability in a large heterogeneous IBS population,
and the range of our confidence intervals of our fully adjusted models were similar to
the crude model, and while analyses in our IBS subpopulations were largely consistent
with our IBSTOTAL analyses, a study including a larger number of patients in separate IBS
IBS and intestinal permeability
39
subtype groups would be warranted to confirm our findings in the subgroup analyses.
Furthermore, it has to be noted that our results are based on cross‐sectional and
observational data and that causality was not studied.
Conclusion
By assessing intestinal permeability in a large group of IBS patients and healthy
controls, we have demonstrated that L/R ratio, representing small intestinal
permeability is increased, irrespective of possible confounding factors, in patients with
diarrhea predominant IBS when compared to healthy controls. This finding point to a
different pathophysiological mechanism in this IBS subtype. Furthermore, we have
shown that adjustment for possible confounders is essential when studying intestinal
permeability, especially in a heterogeneous disorder as IBS.
Chapter 2
40
References
1. Simrén M, Brazier J, Coremans G, Dapoigny M, Müller‐Lissner SA, Pace F, Smout AJ, Stockbrügger RW, Vatn MH, Whorwell PJ. Quality of life and illness costs in irritable bowel syndrome. Digestion.
2004;69:254‐61.
2. Spiegel BM. The burden of IBS: looking at metrics. Current gastroenterology reports. 2009;11:265‐9. 3. Longstreth GF, Thompson WG, Chey WD, Houghton LA, Mearin F, Spiller RC. Functional bowel
disorders. Gastroenterology. 2006;130:1480‐91.
4. Camilleri M. Peripheral mechanisms in irritable bowel syndrome. N Engl J Med. 2012;367:1626‐35. 5. Rao AS, Camilleri M, Eckert DJ, Busciglio I, Burton DD, Ryks M, Wong BS, Lamsam J, Singh R, Zinsmeister
AR. Urine sugars for in vivo gut permeability: validation and comparisons in irritable bowel syndrome‐
diarrhea and controls. Am J Physiol Gastrointest Liver Physiol. 2011;301:G919‐28. 6. Del Valle‐Pinero AY, Van Deventer HE, Fourie NH, Martino AC, Patel NS, Remaley AT, Henderson WA.
Gastrointestinal permeability in patients with irritable bowel syndrome assessed using a four probe
permeability solution. Clin Chim Acta. 2013;418:97‐101. 7. Dunlop SP, Hebden J, Campbell E, Naesdal J, Olbe L, Perkins AC, Spiller RC. Abnormal intestinal
permeability in subgroups of diarrhea‐predominant irritable bowel syndromes. Am J Gastroenterol.
2006;101:1288‐94. 8. Marshall JK, Thabane M, Garg AX, Clark W, Meddings J, Collins SM; WEL Investigators. Intestinal
permeability in patients with irritable bowel syndrome after a waterborne outbreak of acute
gastroenteritis in Walkerton, Ontario. Aliment Pharmacol Ther. 2004;20:1317‐22. 9. Spiller RC, Jenkins D, Thornley JP, Hebden JM, Wright T, Skinner M, Neal KR. Increased rectal mucosal
enteroendocrine cells, T lymphocytes, and increased gut permeability following acute Campylobacter
enteritis and in post‐dysenteric irritable bowel syndrome. Gut. 2000;47:804‐11. 10. Zhou Q, Zhang B, Verne GN. Intestinal membrane permeability and hypersensitivity in the irritable
bowel syndrome. Pain. 2009;146:41‐6.
11. Zhou Q, Souba WW, Croce CM, Verne GN. MicroRNA‐29a regulates intestinal membrane permeability in patients with irritable bowel syndrome. Gut. 2010;59:775‐84.
12. Kerckhoffs AP, Akkermans LM, de Smet MB, Besselink MG, Hietbrink F, Bartelink IH, Busschers WB,
Samsom M, Renooij W. Intestinal permeability in irritable bowel syndrome patients: effects of NSAIDs. Dig Dis Sci. 2010;55:716‐23.
13. Gecse K1, Róka R, Séra T, Rosztóczy A, Annaházi A, Izbéki F, Nagy F, Molnár T, Szepes Z, Pávics L, Bueno
L, Wittmann T. Leaky gut in patients with diarrhea‐predominant irritable bowel syndrome and inactive ulcerative colitis. Digestion. 2012;85:40‐6.
14. Park JH, Park DI, Kim HJ, Cho YK, Sohn CI, Jeon WK, Kim BI, Won KH, Park SM. The Relationship between
Small‐Intestinal Bacterial Overgrowth and Intestinal Permeability in Patients with Irritable Bowel Syndrome. Gut Liver. 2009;3:174‐9.
15. Ersryd A, Posserud I, Abrahamsson H, Simren M. Subtyping the irritable bowel syndrome by
predominant bowel habit: Rome II versus Rome III. Aliment Pharmacol Ther. 2007;26:953‐61. 16. Meddings JB, Gibbons I. Discrimination of site‐specific alterations in gastrointestinal permeability in the
rat. Gastroenterology. 1998;114:83‐92.
17. van Wijck K, van Eijk HM, Buurman WA, Dejong CH, Lenaerts K. Novel analytical approach to a multi‐sugar whole gut permeability assay. Journal of chromatography B, Analytical technologies in the
biomedical and life sciences. 2011;879:2794‐801.
18. van Wijck K, Verlinden TJ, van Eijk HM, Dekker J, Buurman WA, Dejong CH, Lenaerts K. Novel multi‐sugar assay for site‐specific gastrointestinal permeability analysis: a randomized controlled crossover
trial. Clin Nutr. 2013;32:245‐51.
19. Svedlund J, Sjodin I, Dotevall G. GSRS‐‐a clinical rating scale for gastrointestinal symptoms in patients with irritable bowel syndrome and peptic ulcer disease. Dig Dis Sci. 1988;33:129‐34.
20. Thijssen AY, Jonkers DM, Leue C, van der Veek PP, Vidakovic‐Vukic M, van Rood YR, Clemens CH,
Masclee AA. Dysfunctional cognitions, anxiety and depression in irritable bowel syndrome. J Clin Gastroenterol. 2010;44:e236‐41.
IBS and intestinal permeability
41
21. Zigmond AS, Snaith RP. The hospital anxiety and depression scale. Acta Psychiatr Scand. 1983;67:
361‐70. 22. Bjelland I, Dahl AA, Haug TT, Neckelmann D. The validity of the Hospital Anxiety and Depression Scale.
An updated literature review. J Psychosom Res. 2002;52:69‐77.
23. Sutherland LR, Verhoef M, Wallace JL, Van Rosendaal G, Crutcher R, Meddings JB. A simple, non‐invasive marker of gastric damage: sucrose permeability. Lancet. 1994;343:998‐1000.
24. Pijls KE, Koek GH, Elamin EE, de Vries H, Masclee AA, Jonkers DM. Large intestine permeability is
increased in patients with compensated liver cirrhosis. Am J Physiol Gastrointest Liver Physiol. 2014;306:G147‐53.
25. Rutten EP, Lenaerts K, Buurman WA, Wouters EF. Disturbed intestinal integrity in patients with COPD;
effects of activities of daily living. Chest. 2013 Aug 8. 26. Lambert GP, Schmidt A, Schwarzkopf K, Lanspa S. Effect of aspirin dose on gastrointestinal
permeability. Int J Sports Med. 2012;33:421‐5.
27. Troost FJ, Saris WH, Brummer RJ. Recombinant human lactoferrin ingestion attenuates indomethacin‐induced enteropathy in vivo in healthy volunteers. Eur J Clin Nutr. 2003;57:1579‐85.
28. Roberts A, Renwick AG, Sims J, Snodin DJ. Sucralose metabolism and pharmacokinetics in man. Food
Chem Toxicol. 2000;38 Suppl 2:S31‐41. 29. Arrigoni E, Brouns F, Amado R. Human gut microbiota does not ferment erythritol. Br J Nutr.
2005;94:643‐6.
30. Suenaert P, Bulteel V, Den Hond E, Hiele M, Peeters M, Monsuur F, Ghoos Y, Rutgeerts P. The effects of smoking and indomethacin on small intestinal permeability. Aliment Pharmacol Ther. 2000;14:819‐22.
31. Teixeira TF, Souza NC, Chiarello PG, Franceschini SC, Bressan J, Ferreira CL, Peluzio Mdo C. Intestinal
permeability parameters in obese patients are correlated with metabolic syndrome risk factors. Clin Nutr. 2012;31:735‐40.
32. Zhang X, Jiang X. Effects of enteral nutrition on the barrier function of the intestinal mucosa and
dopamine receptor expression in rats with traumatic brain injury. JPEN J Parenter Enteral Nutr. 2015;39:114‐23.
33. Rummel W. Biologic membrane functions in health and disease. Effects of bile acids and laxatives on
the mucosal transfer. Bull Schweiz Akad Med Wiss. 1976;32:233‐50. 34. Mullin JM, Valenzano MC, Whitby M, Lurie D, Schmidt JD, Jain V, et al. Esomeprazole induces upper
gastrointestinal tract transmucosal permeability increase. Aliment Pharmacol Ther. 2008;28:1317‐25.
35. Gotteland M, Cruchet S, Frau V, Wegner ME, Lopez R, Herrera T, Sanchez A, Urrutia C, Brunser O. Effect of acute cigarette smoking, alone or with alcohol, on gastric barrier function in healthy volunteers. Dig
Liver Dis. 2002;34:702‐6.
36. Benoni C, Prytz H. Effects of smoking on the urine excretion of oral 51Cr EDTA in ulcerative colitis. Gut. 1998;42:656‐8.
37. Martinez C, Gonzalez‐Castro A, Vicario M, Santos J. Cellular and molecular basis of intestinal barrier
dysfunction in the irritable bowel syndrome. Gut Liver. 2012;6:305‐15. 38. Martínez C, Lobo B, Pigrau M, Ramos L, González‐Castro AM, Alonso C, Guilarte M, Guilá M, de Torres I,
Azpiroz F, Santos J, Vicario M. Diarrhoea‐predominant irritable bowel syndrome: an organic disorder
with structural abnormalities in the jejunal epithelial barrier. Gut. 2013;62:1160‐8. 39. Barbara G, Stanghellini V, De Giorgio R, Cremon C, Cottrell GS, Santini D, Pasquinelli G, Morselli‐Labate
AM, Grady EF, Bunnett NW, Collins SM, Corinaldesi R. Activated mast cells in proximity to colonic
nerves correlate with abdominal pain in irritable bowel syndrome. Gastroenterology. 2004;126: 693‐702.
40. Turner JR. Intestinal mucosal barrier function in health and disease. Nat Rev Immunol. 2009;9:799‐809.
41. Belmonte L, Beutheu Youmba S, Bertiaux‐Vandaële N, Antonietti M, Lecleire S, Zalar A, Gourcerol G, Leroi AM, Déchelotte P, Coëffier M, Ducrotté P. Role of toll like receptors in irritable bowel syndrome:
differential mucosal immune activation according to the disease subtype. PloS One. 2012;7:e42777.
42. Camilleri M, Madsen K, Spiller R, Greenwood‐Van Meerveld B, Verne GN. Intestinal barrier function in health and gastrointestinal disease. Neurogastroenterol Motil. 2012;24:503‐12.
43. Gwee KA, Collins SM, Read NW, Rajnakova A, Deng Y, Graham JC, McKendrick MW, Moochhala SM.
Increased rectal mucosal expression of interleukin 1beta in recently acquired post‐infectious irritable bowel syndrome. Gut. 2003;52:523‐6.
Chapter 2
42
44. Chadwick VS, Chen W, Shu D, Paulus B, Bethwaite P, Tie A, Wilson I. Activation of the mucosal immune
system in irritable bowel syndrome. Gastroenterology. 2002;122:1778‐83. 45. Keszthelyi D. The serotonin precursor 5‐hydroxytryptophan reinforces intestinal barrier function
[abstract]. . Gastroenterology. 2011 2011;140:S370.
46. Vanuytsel T, van Wanrooy S, Vanheel H, Vanormelingen C, Verschueren S, Houben E, Salim Rasoel S, Tόth J, Holvoet L, Farré R, Van Oudenhove L, Boeckxstaens G, Verbeke K, Tack J. Psychological stress
and corticotropin‐releasing hormone increase intestinal permeability in humans by a mast cell‐
dependent mechanism. Gut. 2014;63:1293‐9 47. Barreau F, Cartier C, Leveque M, Ferrier L, Moriez R, Laroute V, Rosztoczy A, Fioramonti J, Bueno L.
Pathways involved in gut mucosal barrier dysfunction induced in adult rats by maternal deprivation:
corticotrophin‐releasing factor and nerve growth factor interplay. J Physiol. 2007;580:347‐56. 48. Demaude J, Salvador‐Cartier C, Fioramonti J, Ferrier L, Bueno L. Phenotypic changes in colonocytes
following acute stress or activation of mast cells in mice: implications for delayed epithelial barrier
dysfunction. Gut. 2006;55:655‐61. 49. Snoek SA, Verstege MI, Boeckxstaens GE, van den Wijngaard RM, de Jonge WJ. The enteric nervous
system as a regulator of intestinal epithelial barrier function in health and disease. Exp Rev
Gastroenterol Hepatol. 2010;4:637‐51. 50. Bertiaux‐Vandaële N, Youmba SB, Belmonte L, Lecleire S, Antonietti M, Gourcerol G, Leroi AM,
Déchelotte P, Ménard JF, Ducrotté P, Coëffier M. The expression and the cellular distribution of the
tight junction proteins are altered in irritable bowel syndrome patients with differences according to the disease subtype. Am J Gastroenterol. 2011;106:2165‐73.
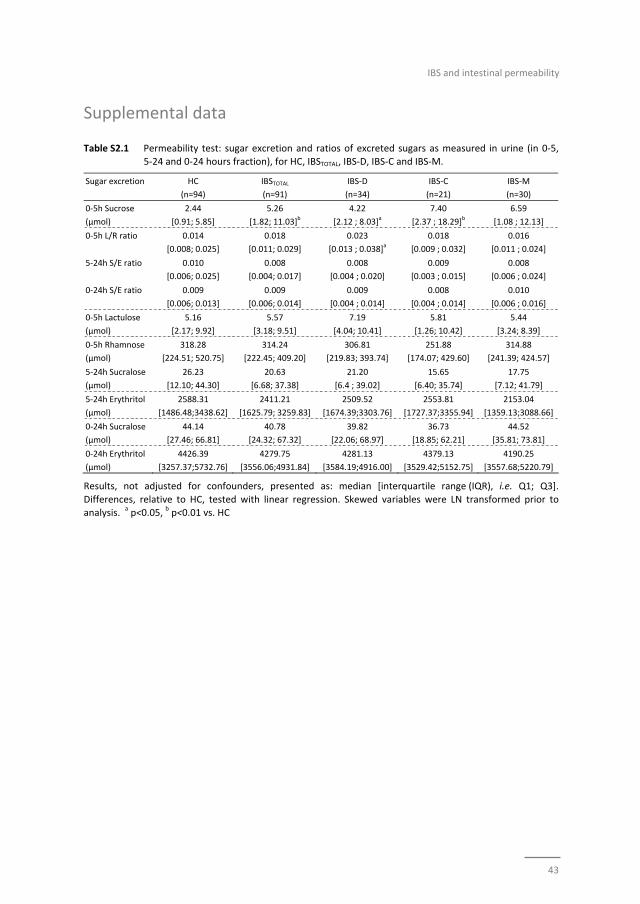
IBS and intestinal permeability
43
Supplemental data
Table S2.1 Permeability test: sugar excretion and ratios of excreted sugars as measured in urine (in 0‐5, 5‐24 and 0‐24 hours fraction), for HC, IBSTOTAL, IBS‐D, IBS‐C and IBS‐M.
Sugar excretion HC
(n=94)
IBSTOTAL
(n=91)
IBS‐D
(n=34)
IBS‐C
(n=21)
IBS‐M
(n=30)
0‐5h Sucrose
(μmol)
2.44
[0.91; 5.85]
5.26
[1.82; 11.03]b
4.22
[2.12 ; 8.03]a
7.40
[2.37 ; 18.29]b
6.59
[1.08 ; 12.13]
0‐5h L/R ratio 0.014
[0.008; 0.025]
0.018
[0.011; 0.029]
0.023
[0.013 ; 0.038]a
0.018
[0.009 ; 0.032]
0.016
[0.011 ; 0.024]
5‐24h S/E ratio 0.010
[0.006; 0.025]
0.008
[0.004; 0.017]
0.008
[0.004 ; 0.020]
0.009
[0.003 ; 0.015]
0.008
[0.006 ; 0.024]
0‐24h S/E ratio 0.009
[0.006; 0.013]
0.009
[0.006; 0.014]
0.009
[0.004 ; 0.014]
0.008
[0.004 ; 0.014]
0.010
[0.006 ; 0.016]
0‐5h Lactulose
(μmol)
5.16
[2.17; 9.92]
5.57
[3.18; 9.51]
7.19
[4.04; 10.41]
5.81
[1.26; 10.42]
5.44
[3.24; 8.39]
0‐5h Rhamnose
(μmol)
318.28
[224.51; 520.75]
314.24
[222.45; 409.20]
306.81
[219.83; 393.74]
251.88
[174.07; 429.60]
314.88
[241.39; 424.57]
5‐24h Sucralose
(μmol)
26.23
[12.10; 44.30]
20.63
[6.68; 37.38]
21.20
[6.4 ; 39.02]
15.65
[6.40; 35.74]
17.75
[7.12; 41.79]
5‐24h Erythritol
(μmol)
2588.31
[1486.48;3438.62]
2411.21
[1625.79; 3259.83]
2509.52
[1674.39;3303.76]
2553.81
[1727.37;3355.94]
2153.04
[1359.13;3088.66]
0‐24h Sucralose
(μmol)
44.14
[27.46; 66.81]
40.78
[24.32; 67.32]
39.82
[22.06; 68.97]
36.73
[18.85; 62.21]
44.52
[35.81; 73.81]
0‐24h Erythritol
(μmol)
4426.39
[3257.37;5732.76]
4279.75
[3556.06;4931.84]
4281.13
[3584.19;4916.00]
4379.13
[3529.42;5152.75]
4190.25
[3557.68;5220.79]
Results, not adjusted for confounders, presented as: median [interquartile range (IQR), i.e. Q1; Q3].
Differences, relative to HC, tested with linear regression. Skewed variables were LN transformed prior to analysis.
a p<0.05,
b p<0.01 vs. HC
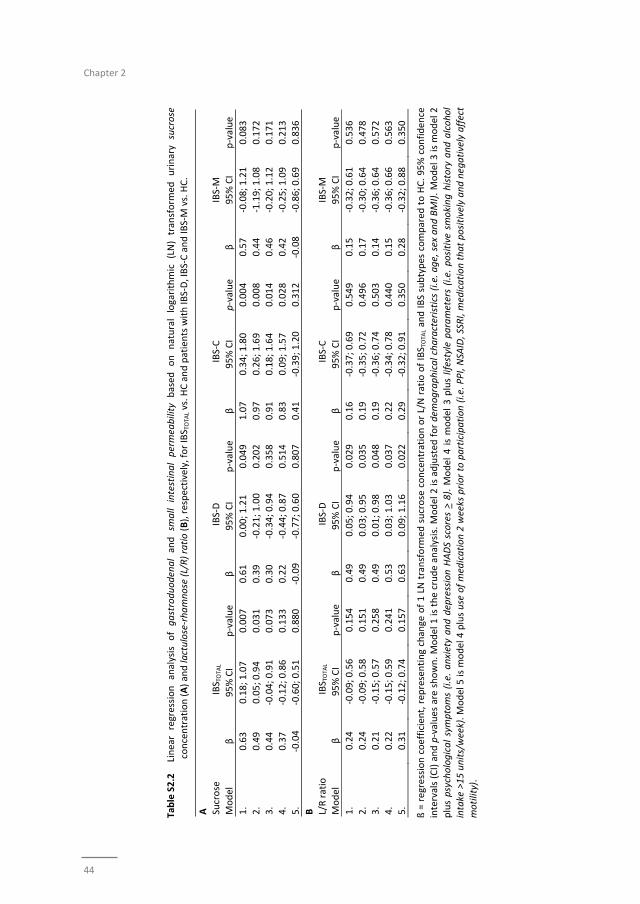
Chapter 2
44
Table S2.2
Linear regression analysis of gastroduodenal and sm
all
intestinal permeability based
on natural logarithmic (LN) transform
ed urinary sucrose
concentration (A) and lactulose‐rhamnose (L/R) ratio (B), respectively, for IBS T
OTA
L vs. HC and patients with IB
S‐D, IBS‐C and IB
S‐M vs. HC.
A
Sucrose
IBS T
OTA
L
IBS‐D
IBS‐C
IBS‐M
Model
β
95% CI
p‐value
β
95% CI
p‐value
β
95% CI
p‐value
β
95% CI
p‐value
1.
0.63
0.18; 1.07
0.007
0.61
0.00; 1.21
0.049
1.07
0.34; 1.80
0.004
0.57
‐0.08; 1.21
0.083
2.
0.49
0.05; 0.94
0.031
0.39
‐0.21; 1.00
0.202
0.97
0.26; 1.69
0.008
0.44
‐1.19; 1.08
0.172
3.
0.44
‐0.04; 0.91
0.073
0.30
‐0.34; 0.94
0.358
0.91
0.18; 1.64
0.014
0.46
‐0.20; 1.12
0.171
4.
0.37
‐0.12; 0.86
0.133
0.22
‐0.44; 0.87
0.514
0.83
0.09; 1.57
0.028
0.42
‐0.25; 1.09
0.213
5.
‐0.04
‐0.60; 0.51
0.880
‐0.09
‐0.77; 0.60
0.807
0.41
‐0.39; 1.20
0.312
‐0.08
‐0.86; 0.69
0.836
B
L/R ratio
IBS T
OTA
L
IBS‐D
IBS‐C
IBS‐M
Model
β
95% CI
p‐value
β
95% CI
p‐value
β
95% CI
p‐value
β
95% CI
p‐value
1.
0.24
‐0.09; 0.56
0.154
0.49
0.05; 0.94
0.029
0.16
‐0.37; 0.69
0.549
0.15
‐0.32; 0.61
0.536
2.
0.24
‐0.09; 0.58
0.151
0.49
0.03; 0.95
0.035
0.19
‐0.35; 0.72
0.496
0.17
‐0.30; 0.64
0.478
3.
0.21
‐0.15; 0.57
0.258
0.49
0.01; 0.98
0.048
0.19
‐0.36; 0.74
0.503
0.14
‐0.36; 0.64
0.572
4.
0.22
‐0.15; 0.59
0.241
0.53
0.03; 1.03
0.037
0.22
‐0.34; 0.78
0.440
0.15
‐0.36; 0.66
0.563
5.
0.31
‐0.12; 0.74
0.157
0.63
0.09; 1.16
0.022
0.29
‐0.32; 0.91
0.350
0.28
‐0.32; 0.88
0.350
ß = regression coefficient, rep
resenting change of 1 LN transform
ed sucrose concentration or L/N ratio of IBS T
OTA
L and IBS subtypes compared
to HC. 95% confiden
ce
intervals (CI) and p‐values are shown. Model 1
is the crude analysis. Model 2 is adjusted
for dem
ographical characteristics (i.e. age, sex and BMI). Model 3 is m
odel 2
plus psychological symptoms (i.e. anxiety and depression HADS scores > 8). M
odel 4 is model 3 plus lifestyle parameters (i.e. positive smoking history and alcohol
intake >15 units/week). Model 5 is m
odel 4 plus use of medication 2 weeks prior to participation (i.e. PPI, NSA
ID, SSRI, m
edication that positively and negatively affect
motility).

IBS and intestinal permeability
45

Chapter 2
46
47
Chapter 3
Effect of L. plantarum strains on intestinal mucosa
The effects of oral administration of three Lactobacillus plantarum strains on
intestinal barrier function and gene transcription in human small intestinal mucosa;
a randomized double‐blind placebo controlled trial
Zlatan Mujagic, Paul de Vos, Mark V Boekschoten, Coen Govers, Harm‐Jan HM Pieters,
Nicole JW de Wit, Peter A Bron, Ad AM Masclee, Freddy J Troost
Submitted
Chapter 3
48
Abstract
Background and aims
The aim of this study was to investigate the effects of three Lactobacillus plantarum
strains on in vivo small intestinal barrier function and gene transcription in healthy
subjects. The strains were selected for their differential effects on TLR signalling and
the organization of the epithelial tight junctions, which may lead to beneficial effects in
a stressed gut mucosa.
Methods
Ten healthy volunteers participated in four different intervention periods: 7‐day oral
intake of either L. plantarum WCFS1, CIP104448, TIFN101 or placebo, proceeded by a 4
weeks wash‐out period. Indomethacin, a NSIAD, was used to stress small intestinal
barrier function. The ratio in 5‐hr urinary recovery of orally ingested lactulose and
rhamnose indicated small intestinal permeability. Duodenal mucosal biopsies were
obtained by gastroduodenoscopy for tight‐junction, and host genome‐wide microarray
(Affymetrix Human Gene 1.1ST) analyses.
Results
Lactulose‐rhamnose ratio increased after intake of indomethacin (mean ratio 0.06±0.04
to 0.10±0.06, p=0.001), but was not significantly affected by the interventions.
However, gene transcription pathway analysis demonstrated that particularly
L. plantarum TIFN101 modulated cell‐cell adhesion with high turnover of genes
involved in tight‐ and adhesion junction protein synthesis and degradation (e.g. actinin
alpha‐4, metalloproteinase‐2). These effects were less pronounced for L. plantarum
WCFS1 and CIP104448.
Conclusion
Indomethacin induced an increase in small intestinal permeability, not affected by any
of the bacterial strain interventions. However, intake of the bacterial strains did induce
strain specific effects on gene transcription in mucosal cells. L. plantarum TIFN101
induced the most pronounced probiotic properties with specific effects on repair
processes in the compromised intestine of healthy subjects.
Effect of L. plantarum strains on intestinal mucosa
49
Introduction
Impairment of intestinal barrier function has been implicated as an early event in the
pathogenesis of various intestinal and systemic disorders. It may lead to increased
permeation of substances present in the gut lumen, such as bacteria and their products
(e.g., lipopolysaccharides), into the mucosal layer and may result in local and systemic
inflammatory responses.1‐3 This process is assumed to play a role in the
pathophysiology of organic gastro‐intestinal (GI) disorders such as inflammatory bowel
diseases,4,5 and celiac disease,6 but also with functional GI disorders, such as irritable
bowel syndrome.7,8 Furthermore, it has been associated with systemic disorders, such
as diabetes mellitus,9 atopic eczema,10 liver disease,11 as well as the use of medication,
such as non‐steroidal anti‐inflammatory drugs (NSAIDs).12,13 NSAIDs are frequently
consumed worldwide but have also been used in research as a model to stress the
intestinal mucosal layer and barrier function in healthy subjects.14 Up to now, no
therapeutic agents have been developed that are able to successfully restore the
intestinal mucosal barrier and thereby influence disease outcome.15 Positive effects on
intestinal barrier function have been attributed to probiotic bacteria.16‐21 However,
further research is needed to prove these beneficial effects in humans and to gain
further insight into the mechanisms through which live bacterial organisms improve the
human gut barrier function.22
In a healthy intestinal homeostasis commensal non‐pathogenic bacteria interact with
host mucosa and thereby presumably co‐regulate mucosal barrier function.
Lactobacillus plantarum, a commensal bacterium present in humans, has been
reported to reinforce the intestinal barrier and to reduce intestinal permeability in
animal studies.17‐19 In a previous study by our consortium, the administration of L.
plantarum WCFS1 directly into the duodenum of healthy human subjects beneficially
contributed to the organization of the epithelial tight junctions.16 Next to L. plantarum
WCFS1, we have selected two more L. plantarum strains, i.e. CIP104448 (CIP48), and
TIFN101 (in previous studies referred to as CIP104450), to be tested in the current
study. They were selected based on research wherein these bacterial strains were
shown to have differential effects in toll‐like receptor (TLR) signalling in vitro and to
affect both the innate and specific immune system both in vitro and in vivo.23‐25
Although it has recently been demonstrated in an in vitro model that TLR signalling is
involved in regulation of the intestinal barrier function,26 it is unknown whether these
three L. plantarum strains have positive effects on intestinal mucosal barrier in human
subjects after ingestion, or through which mechanisms these live bacterial organisms
may improve the human gut barrier function.
We hypothesized that daily oral administration of L. plantarum WCFS1, CIP48, and
TIFN101 over a 7‐day period (i) will have positive effects on compromised (due to
Chapter 3
50
intake of NSAIDs) intestinal barrier function in healthy human subjects, with regard to
intestinal permeability, tight junction protein‐ and gene expression, and furthermore
(ii) will induce alterations in the transcription of pathways involved in mucosal structure
and cell function, as measured in duodenal biopsy material.
Aim of the present randomized, double‐blind, placebo‐controlled trial was to assess the
effects of oral intake of the three L. plantarum strains over a 7‐day period on small
intestinal permeability, duodenal epithelial tight junction protein expression and
mucosal gene transcription, in healthy human subjects.
Materials and methods
The study protocol has been approved by the Maastricht University Medical Center+
Committee of Ethics, was in compliance with the Declaration of Helsinki (64th WMA
General Assembly, Fortaleza, Brazil, 2013), and has been registered in the US National
Library of Medicine (http://www.clinicaltrials.gov, NCT01456767).
Study participants
Healthy subjects were enrolled via public advertising, and were screened, involving a
standardized general physical examination. All study participants gave written informed
consent prior to inclusion. Exclusion criteria were current GI symptoms, a history of
severe disease or major abdominal surgery, use of any medication within 14 days or
investigational drugs within 180 days prior to inclusion, blood donation within 3 months
before the study period, pregnancy, lactation, obesity, smoking, use of drugs or
excessive alcohol consumption, and known allergy/hypersensitivity towards intake of
NSAIDs, sweeteners or pre‐ or probiotic supplements of any kind.
Bacterial growth conditions and definition of placebo
The bacterial strains L. plantarum WCFS1,27,28 CIP48, and TIFN10123, 24 were cultured
overnight at 37°C in Man, Rogosa and Sharpe (MRS) medium (Merck, New Jersey, USA),
to obtain stationary‐phase cultures. Maltodextrin and glucose were added to a final
concentration of 20% and 2% (wt/vol), respectively, to obtain bacterial preparations.
Detailed protocols for culturing, harvesting, freeze‐drying, storing, and viable count
determining of Lactobacillus species have been published previously.29 Placebo controls
only contained maltodextrin and glucose at similar final concentrations as bacterial
supplements, ensuring a similar appearance and taste. Encoded and non‐transparent
vials containing the supplements were provided by NIZO Food Research (Ede, NL) to
ensure the double‐blind design.
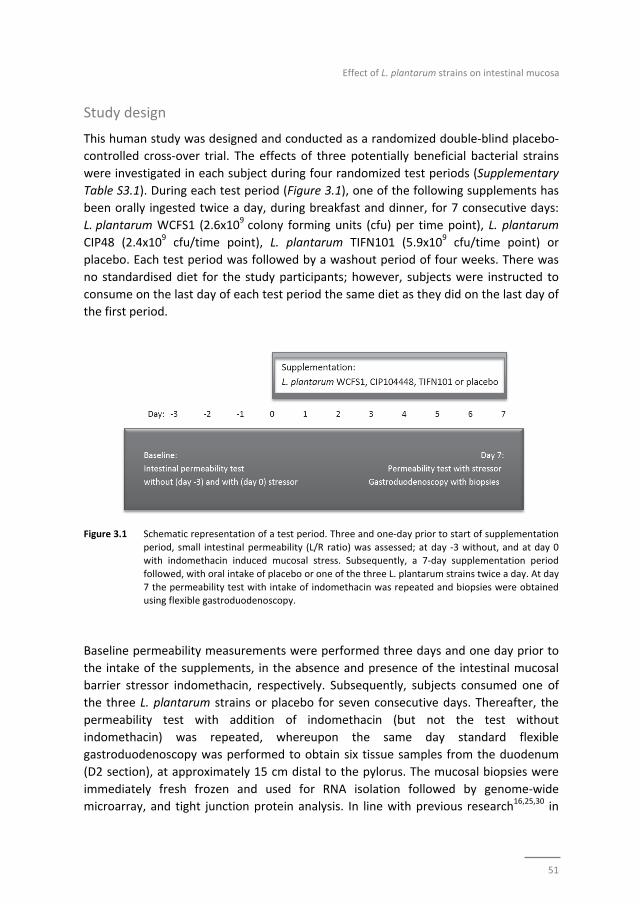
Effect of L. plantarum strains on intestinal mucosa
51
Study design
This human study was designed and conducted as a randomized double‐blind placebo‐
controlled cross‐over trial. The effects of three potentially beneficial bacterial strains
were investigated in each subject during four randomized test periods (Supplementary
Table S3.1). During each test period (Figure 3.1), one of the following supplements has
been orally ingested twice a day, during breakfast and dinner, for 7 consecutive days:
L. plantarum WCFS1 (2.6x10⁹ colony forming units (cfu) per time point), L. plantarum
CIP48 (2.4x10⁹ cfu/time point), L. plantarum TIFN101 (5.9x10⁹ cfu/time point) or
placebo. Each test period was followed by a washout period of four weeks. There was
no standardised diet for the study participants; however, subjects were instructed to
consume on the last day of each test period the same diet as they did on the last day of
the first period.
Figure 3.1 Schematic representation of a test period. Three and one‐day prior to start of supplementation
period, small intestinal permeability (L/R ratio) was assessed; at day ‐3 without, and at day 0 with indomethacin induced mucosal stress. Subsequently, a 7‐day supplementation period
followed, with oral intake of placebo or one of the three L. plantarum strains twice a day. At day
7 the permeability test with intake of indomethacin was repeated and biopsies were obtained using flexible gastroduodenoscopy.
Baseline permeability measurements were performed three days and one day prior to
the intake of the supplements, in the absence and presence of the intestinal mucosal
barrier stressor indomethacin, respectively. Subsequently, subjects consumed one of
the three L. plantarum strains or placebo for seven consecutive days. Thereafter, the
permeability test with addition of indomethacin (but not the test without
indomethacin) was repeated, whereupon the same day standard flexible
gastroduodenoscopy was performed to obtain six tissue samples from the duodenum
(D2 section), at approximately 15 cm distal to the pylorus. The mucosal biopsies were
immediately fresh frozen and used for RNA isolation followed by genome‐wide
microarray, and tight junction protein analysis. In line with previous research16,25,30 in
Chapter 3
52
which the effects of L. plantarum strains on intestinal mucosa were investigated, we
focussed on the proximal small bowel, with minimal interference of other microbial
interaction. This region of the small intestine is relatively accessible by means of
endoscopy.
Possible side effects of the ingestion of the bacterial strains, adverse reactions to intake
of indomethacin, and overall feelings of well‐being were assessed using the validated
gastrointestinal symptom rating scale (GRSR)31 pre and post test period and during the
intervention by a daily symptom diary.8
In vivo small intestinal permeability test
After an overnight fast, participants emptied their urinary bladder and consumed a
drink (150 ml of tap water) containing 1 g lactulose (Centrafarm, Etten‐Leur, the
Netherlands) and 0.5 g L‐rhamnose (Danisco, Copenhagen, Denmark). Participants were
requested to remain fasted, with the exception of water intake, and to collect urine for
5 hours. Lactulose (disaccharide) can permeate the intestinal epithelial layer through
the paracellular route and rhamnose (mono‐saccharide) through the transcellular
route. The ratio in 0‐5h urine (L/R ratio) represents small intestinal permeability, and is
used to minimize the effect of differences in gut motility and kidney function on the
results.32 During and two days prior to the test period, excessive physical exercise and
consumption of alcohol were prohibited for the study participants. Three days after this
baseline permeability test and after the 7‐day intervention period (Figure 3.1), the test
was repeated with ingestion of indomethacin, a NSAID, administered in two different
dosages; i.e. 75 mg exactly 9 hours prior and 50 mg 1 hour prior to the intake of the
sugars.13 Levels of the urinary excreted sugar probes were measured under blinded
conditions by isocratic ion‐exchange high‐pressure liquid chromatography with mass
spectrometry (HPLC‐MS) as described previously.32
RNA isolation, microarray processing and pathway analysis
Total RNA was isolated from snap frozen (in liquid nitrogen) duodenal biopsies, using
1 ml Trizol reagent (Invitrogen, Breda, NL). Subsequently it was purified using Qiagen
RNeasy Micro kit (Qiagen, Venlo, NL). NanoDrop ND‐1000 spectrophotometer (Isogen
Life Science, De Meer, NL) was used for RNA quantification, and quality was checked by
the Agilent 2100 bioanalyzer (Agilent Technologies, Amsterdam, NL). Samples were
used for further analyses in case of intact bands corresponding to 18S and 28S
ribosomal subunits and in the absence of chromosomal peaks or RNA degradation
products. Whole transcript cDNA synthesis of total RNA (100 ng) material was
conducted using Ambion WT expression kit (Life Technologies, Bleiswijk, NL), and was
labeled using the Affymetrix GeneChip WT Terminal Labelling Kit (Affymetrix, Santa
Clara, CA). Next, samples were hybridized to human whole genome Affymetrix
GeneChip Human Gene 1.1 ST arrays, washed, stained, and scanned on an Affymetrix
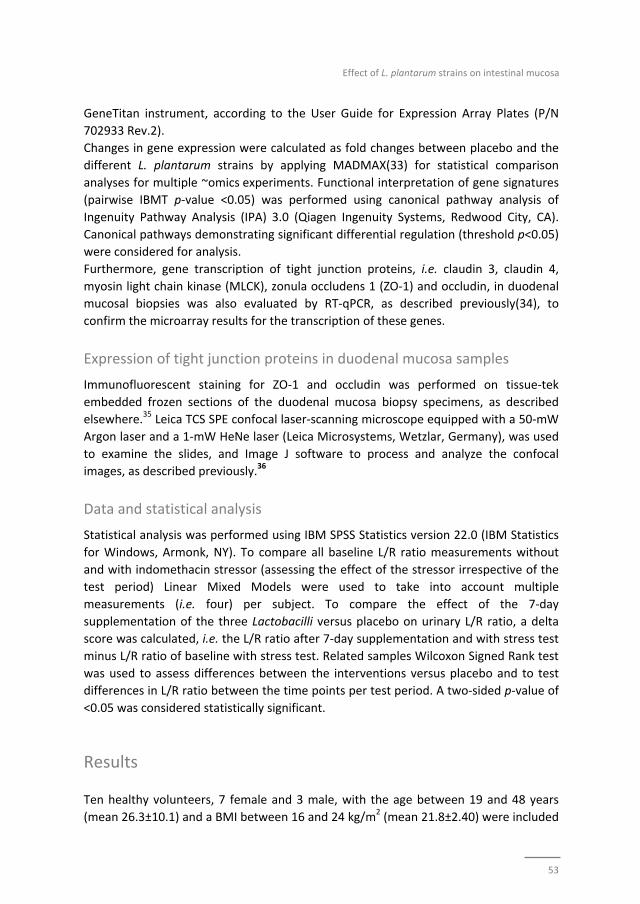
Effect of L. plantarum strains on intestinal mucosa
53
GeneTitan instrument, according to the User Guide for Expression Array Plates (P/N
702933 Rev.2).
Changes in gene expression were calculated as fold changes between placebo and the
different L. plantarum strains by applying MADMAX(33) for statistical comparison
analyses for multiple ~omics experiments. Functional interpretation of gene signatures
(pairwise IBMT p‐value <0.05) was performed using canonical pathway analysis of
Ingenuity Pathway Analysis (IPA) 3.0 (Qiagen Ingenuity Systems, Redwood City, CA).
Canonical pathways demonstrating significant differential regulation (threshold p<0.05)
were considered for analysis.
Furthermore, gene transcription of tight junction proteins, i.e. claudin 3, claudin 4,
myosin light chain kinase (MLCK), zonula occludens 1 (ZO‐1) and occludin, in duodenal
mucosal biopsies was also evaluated by RT‐qPCR, as described previously(34), to
confirm the microarray results for the transcription of these genes.
Expression of tight junction proteins in duodenal mucosa samples
Immunofluorescent staining for ZO‐1 and occludin was performed on tissue‐tek
embedded frozen sections of the duodenal mucosa biopsy specimens, as described
elsewhere.35 Leica TCS SPE confocal laser‐scanning microscope equipped with a 50‐mW
Argon laser and a 1‐mW HeNe laser (Leica Microsystems, Wetzlar, Germany), was used
to examine the slides, and Image J software to process and analyze the confocal
images, as described previously.36
Data and statistical analysis
Statistical analysis was performed using IBM SPSS Statistics version 22.0 (IBM Statistics
for Windows, Armonk, NY). To compare all baseline L/R ratio measurements without
and with indomethacin stressor (assessing the effect of the stressor irrespective of the
test period) Linear Mixed Models were used to take into account multiple
measurements (i.e. four) per subject. To compare the effect of the 7‐day
supplementation of the three Lactobacilli versus placebo on urinary L/R ratio, a delta
score was calculated, i.e. the L/R ratio after 7‐day supplementation and with stress test
minus L/R ratio of baseline with stress test. Related samples Wilcoxon Signed Rank test
was used to assess differences between the interventions versus placebo and to test
differences in L/R ratio between the time points per test period. A two‐sided p‐value of
<0.05 was considered statistically significant.
Results
Ten healthy volunteers, 7 female and 3 male, with the age between 19 and 48 years
(mean 26.3±10.1) and a BMI between 16 and 24 kg/m2 (mean 21.8±2.40) were included
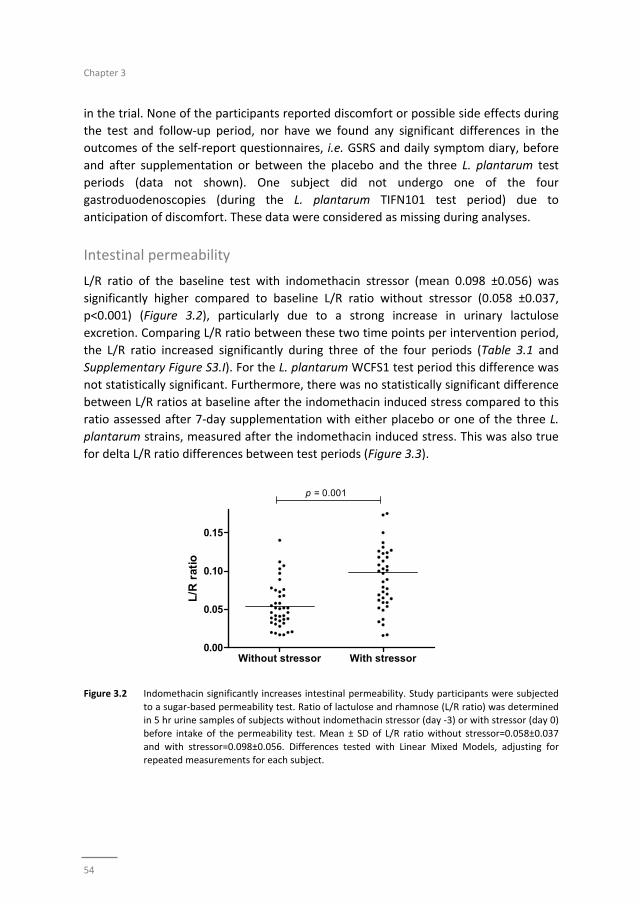
Chapter 3
54
in the trial. None of the participants reported discomfort or possible side effects during
the test and follow‐up period, nor have we found any significant differences in the
outcomes of the self‐report questionnaires, i.e. GSRS and daily symptom diary, before
and after supplementation or between the placebo and the three L. plantarum test
periods (data not shown). One subject did not undergo one of the four
gastroduodenoscopies (during the L. plantarum TIFN101 test period) due to
anticipation of discomfort. These data were considered as missing during analyses.
Intestinal permeability
L/R ratio of the baseline test with indomethacin stressor (mean 0.098 ±0.056) was
significantly higher compared to baseline L/R ratio without stressor (0.058 ±0.037,
p<0.001) (Figure 3.2), particularly due to a strong increase in urinary lactulose
excretion. Comparing L/R ratio between these two time points per intervention period,
the L/R ratio increased significantly during three of the four periods (Table 3.1 and
Supplementary Figure S3.I). For the L. plantarum WCFS1 test period this difference was
not statistically significant. Furthermore, there was no statistically significant difference
between L/R ratios at baseline after the indomethacin induced stress compared to this
ratio assessed after 7‐day supplementation with either placebo or one of the three L.
plantarum strains, measured after the indomethacin induced stress. This was also true
for delta L/R ratio differences between test periods (Figure 3.3).
Figure 3.2 Indomethacin significantly increases intestinal permeability. Study participants were subjected
to a sugar‐based permeability test. Ratio of lactulose and rhamnose (L/R ratio) was determined in 5 hr urine samples of subjects without indomethacin stressor (day ‐3) or with stressor (day 0)
before intake of the permeability test. Mean ± SD of L/R ratio without stressor=0.058±0.037
and with stressor=0.098±0.056. Differences tested with Linear Mixed Models, adjusting for repeated measurements for each subject.
Without stressor With stressor0.00
0.05
0.10
0.15
p = 0.001
L/R
rat
io
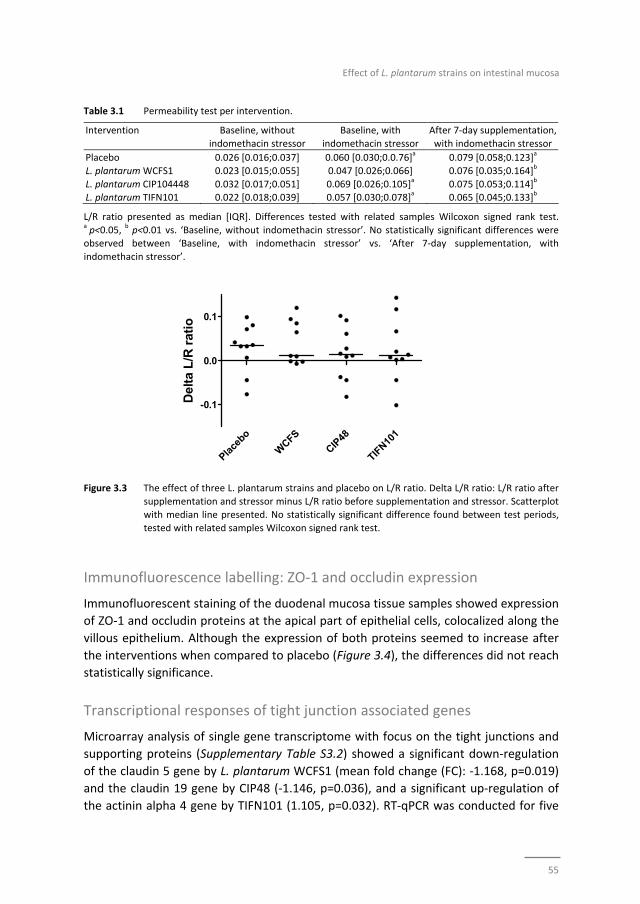
Effect of L. plantarum strains on intestinal mucosa
55
Table 3.1 Permeability test per intervention.
Intervention Baseline, without
indomethacin stressor
Baseline, with
indomethacin stressor
After 7‐day supplementation,
with indomethacin stressor
Placebo 0.026 [0.016;0.037] 0.060 [0.030;0.0.76]a 0.079 [0.058;0.123]
a
L. plantarum WCFS1 0.023 [0.015;0.055] 0.047 [0.026;0.066] 0.076 [0.035;0.164]b
L. plantarum CIP104448 0.032 [0.017;0.051] 0.069 [0.026;0.105]a 0.075 [0.053;0.114]
b
L. plantarum TIFN101 0.022 [0.018;0.039] 0.057 [0.030;0.078]a 0.065 [0.045;0.133]
b
L/R ratio presented as median [IQR]. Differences tested with related samples Wilcoxon signed rank test. a p<0.05,
b p<0.01 vs. ‘Baseline, without indomethacin stressor’. No statistically significant differences were
observed between ‘Baseline, with indomethacin stressor’ vs. ‘After 7‐day supplementation, with
indomethacin stressor’.
Figure 3.3 The effect of three L. plantarum strains and placebo on L/R ratio. Delta L/R ratio: L/R ratio after
supplementation and stressor minus L/R ratio before supplementation and stressor. Scatterplot with median line presented. No statistically significant difference found between test periods,
tested with related samples Wilcoxon signed rank test.
Immunofluorescence labelling: ZO‐1 and occludin expression
Immunofluorescent staining of the duodenal mucosa tissue samples showed expression
of ZO‐1 and occludin proteins at the apical part of epithelial cells, colocalized along the
villous epithelium. Although the expression of both proteins seemed to increase after
the interventions when compared to placebo (Figure 3.4), the differences did not reach
statistically significance.
Transcriptional responses of tight junction associated genes
Microarray analysis of single gene transcriptome with focus on the tight junctions and
supporting proteins (Supplementary Table S3.2) showed a significant down‐regulation
of the claudin 5 gene by L. plantarum WCFS1 (mean fold change (FC): ‐1.168, p=0.019)
and the claudin 19 gene by CIP48 (‐1.146, p=0.036), and a significant up‐regulation of
the actinin alpha 4 gene by TIFN101 (1.105, p=0.032). RT‐qPCR was conducted for five
Place
bo
WCFS
CIP48
TIFN10
1
-0.1
0.0
0.1
Del
ta L
/R r
atio
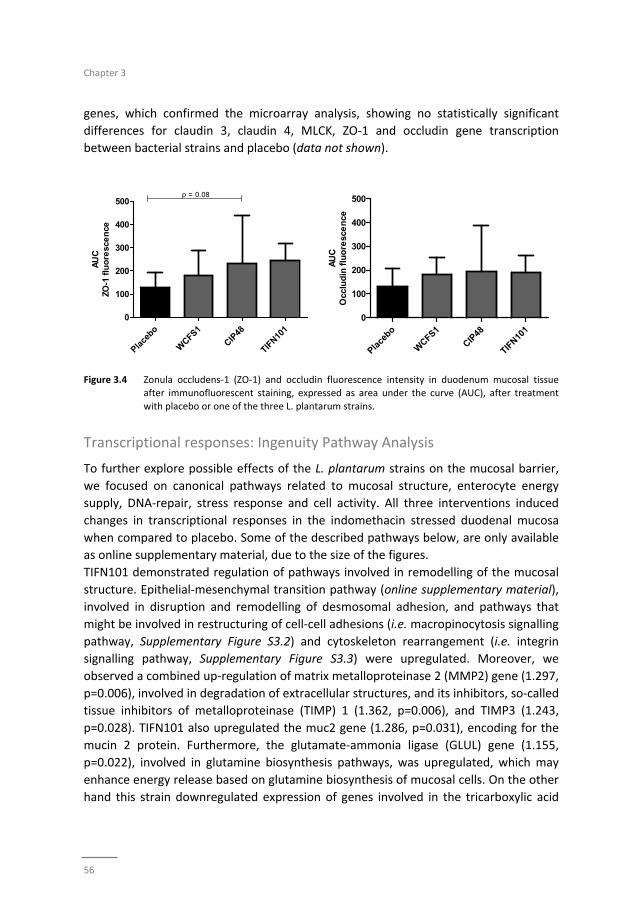
Chapter 3
56
genes, which confirmed the microarray analysis, showing no statistically significant
differences for claudin 3, claudin 4, MLCK, ZO‐1 and occludin gene transcription
between bacterial strains and placebo (data not shown).
Figure 3.4 Zonula occludens‐1 (ZO‐1) and occludin fluorescence intensity in duodenum mucosal tissue after immunofluorescent staining, expressed as area under the curve (AUC), after treatment
with placebo or one of the three L. plantarum strains.
Transcriptional responses: Ingenuity Pathway Analysis
To further explore possible effects of the L. plantarum strains on the mucosal barrier,
we focused on canonical pathways related to mucosal structure, enterocyte energy
supply, DNA‐repair, stress response and cell activity. All three interventions induced
changes in transcriptional responses in the indomethacin stressed duodenal mucosa
when compared to placebo. Some of the described pathways below, are only available
as online supplementary material, due to the size of the figures.
TIFN101 demonstrated regulation of pathways involved in remodelling of the mucosal
structure. Epithelial‐mesenchymal transition pathway (online supplementary material),
involved in disruption and remodelling of desmosomal adhesion, and pathways that
might be involved in restructuring of cell‐cell adhesions (i.e. macropinocytosis signalling
pathway, Supplementary Figure S3.2) and cytoskeleton rearrangement (i.e. integrin
signalling pathway, Supplementary Figure S3.3) were upregulated. Moreover, we
observed a combined up‐regulation of matrix metalloproteinase 2 (MMP2) gene (1.297,
p=0.006), involved in degradation of extracellular structures, and its inhibitors, so‐called
tissue inhibitors of metalloproteinase (TIMP) 1 (1.362, p=0.006), and TIMP3 (1.243,
p=0.028). TIFN101 also upregulated the muc2 gene (1.286, p=0.031), encoding for the
mucin 2 protein. Furthermore, the glutamate‐ammonia ligase (GLUL) gene (1.155,
p=0.022), involved in glutamine biosynthesis pathways, was upregulated, which may
enhance energy release based on glutamine biosynthesis of mucosal cells. On the other
hand this strain downregulated expression of genes involved in the tricarboxylic acid
Place
bo
WCFS1
CIP48
TIFN10
1
0
100
200
300
400
500p = 0.08
AU
CZO
-1 f
luo
resc
en
ce
Place
bo
WCFS1
CIP48
TIFN10
1
0
100
200
300
400
500
AU
CO
cclu
din
flu
ore
sce
nce
Effect of L. plantarum strains on intestinal mucosa
57
(TCA) cycle II pathway (Supplementary Figure S3.4), which may lead to reduced
adenosine triphosphate (ATP) production.
WCFS1 and CIP48 downregulated nitric oxide synthase 3 gene (NOS3) (‐1.113, p=0.039
and ‐1.162, p=0.018, respectively), involved in cell‐cell adhesion, and MMP9 (‐1.178,
p=0.045 and ‐1.218, p=0.025, respectively), involved in breakdown of the extracellular
matrix. CIP48 upregulated genes related to inositol phosphates biosynthesis,
components of the cytosolic side of the cell membrane, such as myotubularin related
protein 9 (MTMR9) (1.132, p=0.014), MTMR8 (1.182, p=0.043), MTMR2 (1.131,
p=0.006), phospholipase‐C β4 (PLCB4) (1.131, p=0.014), and protein tyrosine
phosphatase, non‐receptor type 2 (PTPN2) (1.187, p=0.018).
WCFS1 demonstrated regulation of genes and pathways related to cell division
processes and DNA repair (online supplementary material), with involvement of BRCA1
(1.225, p=0.022) and BRCA2 genes (1.199, p=0.018), and upregulation of protection of
telomere1 (POT1) gene (1.161, p=0.004). CIP48 showed similar effects, with
upregulation of BRCA1 (1.182, p=0.043) and 2 (1.199, p=0.018) genes and a pathway
involved in cell division and DNA‐repair (Supp. Figure S3.3‐e). Finally, CIP48 also
inhibited expression of the GADD45B gene (‐1.223, p=0.034) in the glutathione‐
mediated detoxification pathway, involved in cell stress response, and the
neuropeptide Y (NPY) gene (‐1.159, p=0.022), a protein that influences the fat
metabolism.
Discussion
In the current study we investigated the effects of oral intake of three L. plantarum
strains over a 7‐day period on small intestinal barrier function under a stressed
condition, induced by intake of NSAIDs, in healthy volunteers. Small intestinal
permeability was increased after intake of indomethacin, but was not significantly
affected by any of the treatments. However, gene transcription pathway analysis
clearly demonstrated that the different interventions modulated mucosal structure,
enterocyte energy supply, DNA‐repair, stress response and cell activity pathways, when
compared to placebo, revealing new insights into the mechanisms by which live
potentially probiotic organisms may modulate human small intestinal mucosa.
Intake of indomethacin at baseline and after the intervention period resulted in a
significant increase in small intestinal permeability, as reflected by the increased
urinary excretion of lactulose versus rhamnose. This confirmed that the NSAID is a
potent stressor of small intestinal barrier function, and that this model is well suited to
investigate potential beneficial effects of bioactive substances in healthy individuals.
The 7‐day supplementation period of the different bacterial strains did not significantly
affect small intestinal permeability. Previously, Karczewski et al. demonstrated that a
Chapter 3
58
continuous intraduodenal administration of L. plantarum WCFS1 over a 6‐hr period in
healthy subjects (without intake of NSAIDs) increased tight junction‐linked localisation
of occludin and ZO‐1 proteins.16 Our results do not confirm these findings, but our
design is different because we used indomethacin as stressor. The influence of
indomethacin on epithelial barrier may have been too pronounced to detect smaller
potentially beneficial effects induced by the bacterial interventions. However, also
differences in route of administration (i.e. oral versus intraduodenal) and exposure time
(i.e. 7 days versus 6 hours) may account for the observed difference between these
studies.
Although the interventions did not affect indomethacin induced changes in small
intestinal permeability, the three tested L. plantarum strains may influenced intrinsic
repair processes of the small intestinal mucosa. Differential effects on genes and
pathways involved in mucosal structure maintenance have been observed. The
strongest modulatory effects in this respect were demonstrated by L. plantarum
TIFN101 when compared to placebo. Intake of this bacterial strain influenced the
transcriptional response related to the turnover of adhesion molecules and
homeostasis of the mucus layer. This is exemplified by alterations of pathways involved
in cytoskeleton rearrangement, and upregulation of genes such as actinin alpha 4,
several MMP genes but also their inhibitors (TIMP genes). Moreover, the up‐regulation
of the macropinocytosis signalling pathway, which is one of the mechanisms involved in
disruption of intercellular contacts of adherens and tight junctions,37,38 may lead to
increased recycling of adhesive molecules. Finally, the mucin 2 gene is upregulated by
TIFN101. Mucin 2 is produced by the goblet cells and together with related mucin
proteins is polymerized into insoluble mucus, which is an important part of the
intestinal barrier. As the number of goblet cells, and thereby mucin production, is
increasing along the proximal to distal axis of the intestine, the effect of TIFN101 on
intestinal barrier might also be stronger when it reaches more distal parts of the
intestine.
L. plantarum WCFS1 showed some negative effects on the transcription of genes and
pathways involved in mucosal barrier homeostasis, by downregulation of genes such as
claudin 539 and NOS3. The latter gene is linked to maintenance of cytoskeletal proteins,
e.g. α‐tubulin, actinin and vimentin, and tight junction integral membrane proteins, e.g.
occludin.40 Contradictory, L. plantarum WCFS1 downregulated MMP9 gene, which leads
to inhibitory effects on breakdown of extracellular matrix,41 suggesting beneficial
effects of L. plantarum WCFS1 supplementation on mucosal integrity. L. plantarum
CIP48 demonstrated similar modest effects on gene transcription. NOS3, MMP9, and
claudin 19 genes were downregulated after the intervention. Furthermore, genes
involved in inositol phosphates biosynthesis, important for cell membrane structure
and membrane potential,42 was upregulated by L. plantarum CIP48. Thereby, both
strains, L. plantarum WCFS1 and CIP48, seem to be involved in maintaining a balance
Effect of L. plantarum strains on intestinal mucosa
59
between enhancement and disruption of cell‐cell adhesion and mucosal structure, with
no direct functional consequences for intestinal permeability and tight junction protein
expression.
We identified more mechanisms by which the three tested L. plantarum strains affect
the human host on transcriptome level. L. plantarum WCFS1 increased the
transcription of genes such as BRCA1 and 2 and POT1, which are involved in cell division
processes, DNA repair and telomere length regulation, suggesting that this bacterial
strain may be involved in the enhancement of epithelial healing after indomethacin
induced mucosal stress. L. plantarum TIFN101 modulated genes that may be involved in
inducing a shift of energy supply of the mucosal cells from oxidative phosphorylation
(by TCA II pathway downregulation) towards glutamine production (by increased
transcription of glutamine biosynthesis pathways). Glutamine is an important energy
source for intestinal epithelial cells and it promotes cell differentiation and
proliferation.43 Moreover, glutamine supplementation has been reported to reinforce
the intestinal epithelial mucosal barrier.44 Finally, the transcription of the NPY gene,
which encodes for a neuro‐hormone in the leptin signaling pathway was inhibited by L.
plantarum CIP48. Antagonising NPY‐ergic activity has been reported to reduce food
intake.45 However, no other effects on satiety related mechanisms were observed in
the transcriptome analysis, and therefore the effects on satiety are probably minimal.
In summary, L. plantarum TIFN101 demonstrated strong regulation of genes and
pathways involved in cell‐cell adhesion and turnover of adhesion molecules.
Furthermore, this strain seems to be able to induce alterations in energy supply of the
mucosal cells by affecting both oxidative phosphorylation‐ and glutamine production
pathways. L. plantarum WCFS1 modulated the transcription of genes related to DNA
repair, possibly based on mucosal tissue healing upon NSAID induced stress, and
showed minor negative effects on gene transcription related to mucosal structure. L.
plantarum CIP48 demonstrated similar effects with respect to DNA repair mechanisms
and minor positive effects on mucosal structure.
Overall our study demonstrates that the effect of bacterial supplementation on gene
transcription is highly strain dependent and differs considerably within the same
species. In the current study the transcriptome analysis was performed on duodenal
biopsies. The effects might even be more pronounced or at least different in more
distal parts of the intestine, as the mucosal function along the longitudinal axis of the
intestine does vary. Further research is needed to investigate this hypothesis.
In previous studies from our consortium L. plantarum WCFS1 was found to modulate
multiple pathways in duodenal mucosa, related to lipid biosynthesis, cellular
proliferation, cell‐death and immune responses.25,30 In the present study, we were able
to confirm that L. plantarum WCFS1 does affect some similar pathways related to cell
Chapter 3
60
function; however, most transcriptional responses were dissimilar. The main difference
between the current and previous research was the intake of indomethacin in the
present study. While in previous research the effects of L. plantarum WCFS1 on healthy
intestinal function were investigated, we assessed effect of the three bacterial strains
on small intestinal mucosa under a stressed condition. Furthermore, Troost et al.
administrated a load of L. plantarum WCFS1 using oro‐ and nasogastric catheters during
1 and 6 hours,30 and Van Baarlen et al. administered supplements of the same
bacterium by oral intake, and assessed effects after 6 hours.25 Therefore, besides the
difference in administration route (compared to Troost et al.),30 we measured long
term effects (i.e. after a 7‐day administration period) of the bacterial strains intake,
compared to the short term effects (i.e. after 1 and 6 hours) assessed in the previous
studies. Troost et al. demonstrated that different supplementation periods lead to
different transcriptional responses even between one and six hour administration of
the bacteria.30 The current data, in combination with previous findings, demonstrate
that not only the selection of the bacterial species or even strains, but also the
presence or absence of intestinal mucosal distress of the consumer, as well as route
and time period of administration of viable microbes may induce different effects on
human health. The current study contributes to further understanding of complex host‐
microbe interactions and human intestinal homeostasis, providing leads for future
research in this field.
Conclusion
Application of the NSAID indomethacin induced a profound increase in small intestinal
permeability, which was not significantly affected by the intake of the three L.
plantarum strains. However, the tested bacterial strains did modulate intrinsic repair
processes on mucosal gene transcription level. L. plantarum TIFN101 demonstrated the
most pronounced beneficial effects, by among others modulation of gene‐
transcriptions that are related to mucosal structure. L. plantarum WCFS1 and CIP48
induced more moderate transcriptional effects with respect to mucosal integrity. This
illustrates the strain dependency with respect to inducing specific effects on gene
transcription in human intestinal mucosa.
Effect of L. plantarum strains on intestinal mucosa
61
References
1. Turner JR. Intestinal mucosal barrier function in health and disease. Nat Rev Immunol. 2009;9:799‐809 2. Ahrne S, Hagslatt ML. Effect of lactobacilli on paracellular permeability in the gut. Nutrients.
2011;3:104‐17.
3. Camilleri M, Madsen K, Spiller R, Greenwood‐Van Meerveld B, Verne GN. Intestinal barrier function in health and gastrointestinal disease. Neurogastroenterol Motil. 2012;24:503‐12.
4. Salim SY, Soderholm JD. Importance of disrupted intestinal barrier in inflammatory bowel diseases.
Inflamm Bowel Dis. 2011;17:362‐81. 5. Vivinus‐Nébot M, Frin‐Mathy G, Bzioueche H, Dainese R, Bernard G, Anty R, Filippi J, Saint‐Paul MC,
Tulic MK, Verhasselt V, Hébuterne X, Piche T. Functional bowel symptoms in quiescent inflammatory
bowel diseases: role of epithelial barrier disruption and low‐grade inflammation. Gut. 2014;63:744‐52. 6. Heyman M, Abed J, Lebreton C, Cerf‐Bensussan N. Intestinal permeability in coeliac disease: insight into
mechanisms and relevance to pathogenesis. Gut. 2012;61:1355‐64.
7. Martínez C, Lobo B, Pigrau M, Ramos L, González‐Castro AM, Alonso C, Guilarte M, Guilá M, de Torres I, Azpiroz F, Santos J, Vicario M. Diarrhoea‐predominant irritable bowel syndrome: an organic disorder
with structural abnormalities in the jejunal epithelial barrier. Gut. 2013;62:1160‐8.
8. Mujagic Z, Ludidi S, Keszthelyi D, Hesselink MA, Kruimel JW, Lenaerts K, et al. Small intestinal permeability is increased in diarrhoea predominant IBS, while alterations in gastroduodenal
permeability in all IBS subtypes are largely attributable to confounders. Aliment Pharmacol Ther. 2014;
40:288‐97. 9. Bosi E, Molteni L, Radaelli MG, Folini L, Fermo I, Bazzigaluppi E, Piemonti L, Pastore MR, Paroni R.
Increased intestinal permeability precedes clinical onset of type 1 diabetes. Diabetologia.
2006;49:2824‐7. 10. Barba A, Schena D, Andreaus MC, Faccini G, Pasini F, Brocco G, Cavallini G, Scuro LA, Chieregato GC.
Intestinal permeability in patients with atopic eczema. Br J Dermatol. 1989;120:71‐5.
11. Cariello R, Federico A, Sapone A, Tuccillo C, Scialdone VR, Tiso A, Miranda A, Portincasa P, Carbonara V, Palasciano G, Martorelli L, Esposito P, Cartenì M, Del Vecchio Blanco C, Loguercio C. Intestinal
permeability in patients with chronic liver diseases: Its relationship with the aetiology and the entity of
liver damage. Dig Liver Dis. 2010;42:200‐4. 12. Kerckhoffs AP, Akkermans LM, de Smet MB, Besselink MG, Hietbrink F, Bartelink IH, Busschers WB,
Samsom M, Renooij W. Intestinal permeability in irritable bowel syndrome patients: effects of NSAIDs.
Dig Dis Sci. 2010;55:716‐23. 13. Troost FJ, Saris WH, Brummer RJ. Recombinant human lactoferrin ingestion attenuates indomethacin‐
induced enteropathy in vivo in healthy volunteers. Eur J Clin Nutr. 2003;57:1579‐85.
14. Bjarnason I, Williams P, Smethurst P, Peters TJ, Levi AJ. Effect of non‐steroidal anti‐inflammatory drugs and prostaglandins on the permeability of the human small intestine. Gut. 1986;27:1292‐7.
15. Odenwald MA, Turner JR. Intestinal permeability defects: is it time to treat? Clin Gastroenterol Hepatol.
2013;11:1075‐83. 16. Karczewski J, Troost FJ, Konings I, Dekker J, Kleerebezem M, Brummer RJ, Wells JM. Regulation of
human epithelial tight junction proteins by Lactobacillus plantarum in vivo and protective effects on the
epithelial barrier. Am J Physiol Gastrointest Liver Physiol. 2010;298:G851‐9. 17. Mao Y, Nobaek S, Kasravi B, Adawi D, Stenram U, Molin G, Jeppsson B. The effects of Lactobacillus
strains and oat fiber on methotrexate‐induced enterocolitis in rats. Gastroenterology. 1996;111:334‐44.
18. White JS, Hoper M, Parks RW, Clements WD, Diamond T, Bengmark S. The probiotic bacterium Lactobacillus plantarum species 299 reduces intestinal permeability in experimental biliary obstruction.
Lett Appl Microbiol. 2006;42:19‐23.
19. Mennigen R, Nolte K, Rijcken E, Utech M, Loeffler B, Senninger N, et al. Probiotic mixture VSL#3 protects the epithelial barrier by maintaining tight junction protein expression and preventing
apoptosis in a murine model of colitis. Am J Physiol Gastrointest Liver Physiol. 2009;296:G1140‐9.
20. Mangell P, Nejdfors P, Wang M, Ahrne S, Westrom B, Thorlacius H, et al. Lactobacillus plantarum 299v inhibits Escherichia coli‐induced intestinal permeability. Dig Dis Sci. 2002;47:511‐6.
Chapter 3
62
21. Zeng J, Li YQ, Zuo XL, Zhen YB, Yang J, Liu CH. Clinical trial: effect of active lactic acid bacteria on
mucosal barrier function in patients with diarrhoea‐predominant irritable bowel syndrome. Aliment Pharmacol Ther. 2008;28:994‐1002.
22. Shanahan F, Quigley EM. Manipulation of the microbiota for treatment of IBS and IBD‐challenges and
controversies. Gastroenterology. 2014;146:1554‐63. 23. Meijerink M, van Hemert S, Taverne N, Wels M, de Vos P, Bron PA, Savelkoul HF, van Bilsen J,
Kleerebezem M, Wells JM. Identification of genetic loci in Lactobacillus plantarum that modulate the
immune response of dendritic cells using comparative genome hybridization. PloS One. 2010;5:e10632. 24. van Hemert S, Meijerink M, Molenaar D, Bron PA, de Vos P, Kleerebezem M, Wells JM, Marco ML.
Identification of Lactobacillus plantarum genes modulating the cytokine response of human peripheral
blood mononuclear cells. BMC Microbiol. 2010;10:293. 25. van Baarlen P, Troost FJ, van Hemert S, van der Meer C, de Vos WM, de Groot PJ, Hooiveld GJ,
Brummer RJ, Kleerebezem M. Differential NF‐kappaB pathways induction by Lactobacillus plantarum in
the duodenum of healthy humans correlating with immune tolerance. Proc Natl Acad Sci U S A. 2009;106:2371‐6.
26. Vogt LM, Meyer D, Pullens G, Faas MM, Venema K, Ramasamy U, et al. Toll‐like receptor 2 activation by
beta2‐‐>1‐fructans protects barrier function of T84 human intestinal epithelial cells in a chain length‐dependent manner. J Nutr. 2014;144:1002‐8.
27. Kleerebezem M, Boekhorst J, van Kranenburg R, Molenaar D, Kuipers OP, Leer R, Tarchini R, Peters SA,
Sandbrink HM, Fiers MW, Stiekema W, Lankhorst RM, Bron PA, Hoffer SM, Groot MN, Kerkhoven R, de Vries M, Ursing B, de Vos WM, Siezen RJ. Complete genome sequence of Lactobacillus plantarum
WCFS1. Proc Natl Acad Sci U S A. 2003 Feb 18;100:1990‐5.
28. Vesa T, Pochart P, Marteau P. Pharmacokinetics of Lactobacillus plantarum NCIMB 8826, Lactobacillus fermentum KLD, and Lactococcus lactis MG 1363 in the human gastrointestinal tract. Aliment
Pharmacol Ther. 2000 Jun;14(6):823‐8.
29. Smelt MJ, de Haan BJ, Bron PA, van Swam I, Meijerink M, Wells JM, Faas MM, de Vos P. L. plantarum, L. salivarius, and L. lactis attenuate Th2 responses and increase Treg frequencies in healthy mice in a
strain dependent manner. PLoS One. 2012;7:e47244.
30. Troost FJ, van Baarlen P, Lindsey P, Kodde A, de Vos WM, Kleerebezem M, Brummer RJ. Identification of the transcriptional response of human intestinal mucosa to Lactobacillus plantarum WCFS1 in vivo.
BMC Genomics. 2008;9:374.
31. Svedlund J, Sjodin I, Dotevall G. GSRS‐‐a clinical rating scale for gastrointestinal symptoms in patients with irritable bowel syndrome and peptic ulcer disease. Dig Dis Sci. 1988;33:129‐34.
32. van Wijck K, van Eijk HM, Buurman WA, Dejong CH, Lenaerts K. Novel analytical approach to a multi‐
sugar whole gut permeability assay. J Chromatogr B Analyt Technol Biomed Life Sci. 2011;879: 2794‐801.
33. Lin K, Kools H, de Groot PJ, Gavai AK, Basnet RK, Cheng F, Wu J, Wang X, Lommen A, Hooiveld GJ,
Bonnema G, Visser RG, Muller MR, Leunissen JA. MADMAX ‐ Management and analysis database for multiple ~omics experiments. J Integr Bioinform. 2011;8:160.
34. Keszthelyi D, Troost FJ, Jonkers DM, van Eijk HM, Lindsey PJ, Dekker J, et al. Serotonergic reinforcement
of intestinal barrier function is impaired in irritable bowel syndrome. Aliment Pharmacol Ther. 2014;40:392‐402.
35. Elamin E, Masclee A, Dekker J, Jonkers D. Ethanol disrupts intestinal epithelial tight junction integrity
through intracellular calcium‐mediated Rho/ROCK activation. Am J Physiol Gastrointest Liver Physiol. 2014;306:G677‐85.
36. Abramoff MD. Image processing with ImageJ. Biophotonics Int. 2004;11:36‐42.
37. Ivanov AI, Nusrat A, Parkos CA. Endocytosis of epithelial apical junctional proteins by a clathrin‐mediated pathway into a unique storage compartment. Mol Biol Cell. 2004;15:176‐88.
38. Feick P, Haas SR, Singer MV, Bocker U. Low‐dose exposure of intestinal epithelial cells to formaldehyde
results in MAP kinase activation and molecular alteration of the focal adhesion protein paxillin. Toxicology. 2006;219:60‐72.
39. Kim CY, Kim KH. Curcumin prevents leptin‐induced tight junction dysfunction in intestinal Caco‐2 BBe
cells. J Nutr Biochem. 2014;25:26‐35.
Effect of L. plantarum strains on intestinal mucosa
63
40. Lee NP, Cheng CY. Regulation of Sertoli cell tight junction dynamics in the rat testis via the nitric oxide
synthase/soluble guanylate cyclase/3',5'‐cyclic guanosine monophosphate/protein kinase G signaling pathway: an in vitro study. Endocrinology. 2003;144:3114‐29.
41. Bhattacharyya S, Tobacman JK. Arylsulfatase B regulates colonic epithelial cell migration by effects on
MMP9 expression and RhoA activation. Clin Exp Metastasis. 2009;26:535‐45. 42. Dakin K, Li WH. Cell membrane permeable esters of D‐myo‐inositol 1,4,5‐trisphosphate. Cell Calcium.
2007;42:291‐301.
43. Rhoads M. Glutamine signaling in intestinal cells. JPEN J Parenter Enteral Nutr. 1999;23(5 Suppl): S38‐40.
44. Vermeulen MA, de Jong J, Vaessen MJ, van Leeuwen PA, Houdijk AP. Glutamate reduces experimental
intestinal hyperpermeability and facilitates glutamine support of gut integrity. World J Gastroenterol. 2011;17:1569‐73.
45. Hanson ES, Dallman MF. Neuropeptide Y (NPY) may integrate responses of hypothalamic feeding
systems and the hypothalamo‐pituitary‐adrenal axis. J Neuroendocrinol. 1995;7:273‐9.
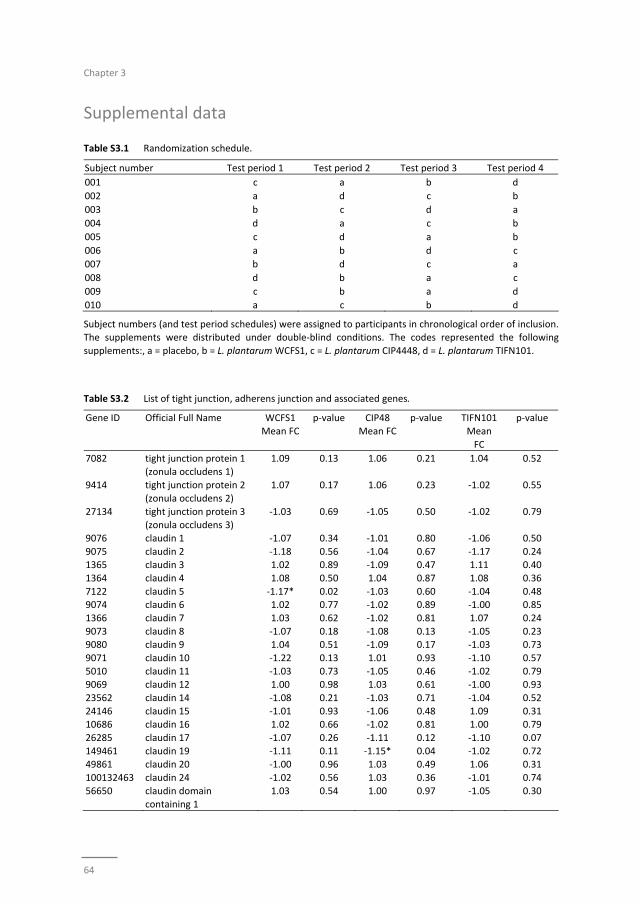
Chapter 3
64
Supplemental data
Table S3.1 Randomization schedule.
Subject number Test period 1 Test period 2 Test period 3 Test period 4
001 c a b d
002 a d c b
003 b c d a
004 d a c b
005 c d a b
006 a b d c
007 b d c a
008 d b a c
009 c b a d
010 a c b d
Subject numbers (and test period schedules) were assigned to participants in chronological order of inclusion. The supplements were distributed under double‐blind conditions. The codes represented the following
supplements:, a = placebo, b = L. plantarum WCFS1, c = L. plantarum CIP4448, d = L. plantarum TIFN101.
Table S3.2 List of tight junction, adherens junction and associated genes.
Gene ID Official Full Name WCFS1
Mean FC
p‐value CIP48
Mean FC
p‐value TIFN101
Mean
FC
p‐value
7082 tight junction protein 1 (zonula occludens 1)
1.09 0.13 1.06 0.21 1.04 0.52
9414 tight junction protein 2
(zonula occludens 2)
1.07 0.17 1.06 0.23 ‐1.02 0.55
27134 tight junction protein 3 (zonula occludens 3)
‐1.03 0.69 ‐1.05 0.50 ‐1.02 0.79
9076 claudin 1 ‐1.07 0.34 ‐1.01 0.80 ‐1.06 0.50
9075 claudin 2 ‐1.18 0.56 ‐1.04 0.67 ‐1.17 0.24 1365 claudin 3 1.02 0.89 ‐1.09 0.47 1.11 0.40
1364 claudin 4 1.08 0.50 1.04 0.87 1.08 0.36
7122 claudin 5 ‐1.17* 0.02 ‐1.03 0.60 ‐1.04 0.48 9074 claudin 6 1.02 0.77 ‐1.02 0.89 ‐1.00 0.85
1366 claudin 7 1.03 0.62 ‐1.02 0.81 1.07 0.24
9073 claudin 8 ‐1.07 0.18 ‐1.08 0.13 ‐1.05 0.23 9080 claudin 9 1.04 0.51 ‐1.09 0.17 ‐1.03 0.73
9071 claudin 10 ‐1.22 0.13 1.01 0.93 ‐1.10 0.57
5010 claudin 11 ‐1.03 0.73 ‐1.05 0.46 ‐1.02 0.79 9069 claudin 12 1.00 0.98 1.03 0.61 ‐1.00 0.93
23562 claudin 14 ‐1.08 0.21 ‐1.03 0.71 ‐1.04 0.52
24146 claudin 15 ‐1.01 0.93 ‐1.06 0.48 1.09 0.31 10686 claudin 16 1.02 0.66 ‐1.02 0.81 1.00 0.79
26285 claudin 17 ‐1.07 0.26 ‐1.11 0.12 ‐1.10 0.07
149461 claudin 19 ‐1.11 0.11 ‐1.15* 0.04 ‐1.02 0.72 49861 claudin 20 ‐1.00 0.96 1.03 0.49 1.06 0.31
100132463 claudin 24 ‐1.02 0.56 1.03 0.36 ‐1.01 0.74
56650 claudin domain containing 1
1.03 0.54 1.00 0.97 ‐1.05 0.30
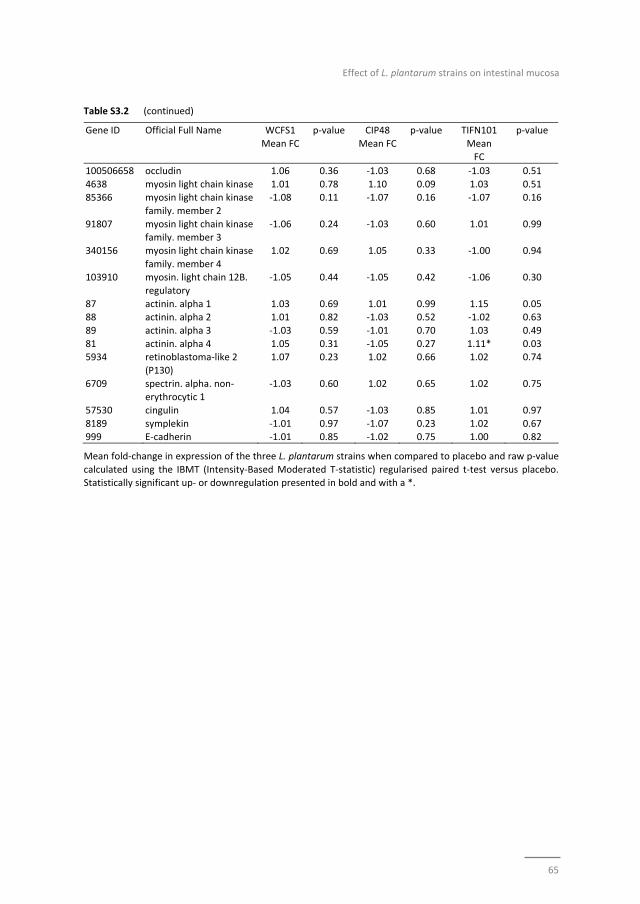
Effect of L. plantarum strains on intestinal mucosa
65
Table S3.2 (continued)
Gene ID Official Full Name WCFS1
Mean FC
p‐value CIP48
Mean FC
p‐value TIFN101
Mean
FC
p‐value
100506658 occludin 1.06 0.36 ‐1.03 0.68 ‐1.03 0.51
4638 myosin light chain kinase 1.01 0.78 1.10 0.09 1.03 0.51 85366 myosin light chain kinase
family. member 2
‐1.08 0.11 ‐1.07 0.16 ‐1.07 0.16
91807 myosin light chain kinase family. member 3
‐1.06 0.24 ‐1.03 0.60 1.01 0.99
340156 myosin light chain kinase
family. member 4
1.02 0.69 1.05 0.33 ‐1.00 0.94
103910 myosin. light chain 12B.
regulatory
‐1.05 0.44 ‐1.05 0.42 ‐1.06 0.30
87 actinin. alpha 1 1.03 0.69 1.01 0.99 1.15 0.05 88 actinin. alpha 2 1.01 0.82 ‐1.03 0.52 ‐1.02 0.63
89 actinin. alpha 3 ‐1.03 0.59 ‐1.01 0.70 1.03 0.49
81 actinin. alpha 4 1.05 0.31 ‐1.05 0.27 1.11* 0.03 5934 retinoblastoma‐like 2
(P130)
1.07 0.23 1.02 0.66 1.02 0.74
6709 spectrin. alpha. non‐erythrocytic 1
‐1.03 0.60 1.02 0.65 1.02 0.75
57530 cingulin 1.04 0.57 ‐1.03 0.85 1.01 0.97
8189 symplekin ‐1.01 0.97 ‐1.07 0.23 1.02 0.67 999 E‐cadherin ‐1.01 0.85 ‐1.02 0.75 1.00 0.82
Mean fold‐change in expression of the three L. plantarum strains when compared to placebo and raw p‐value
calculated using the IBMT (Intensity‐Based Moderated T‐statistic) regularised paired t‐test versus placebo. Statistically significant up‐ or downregulation presented in bold and with a *.
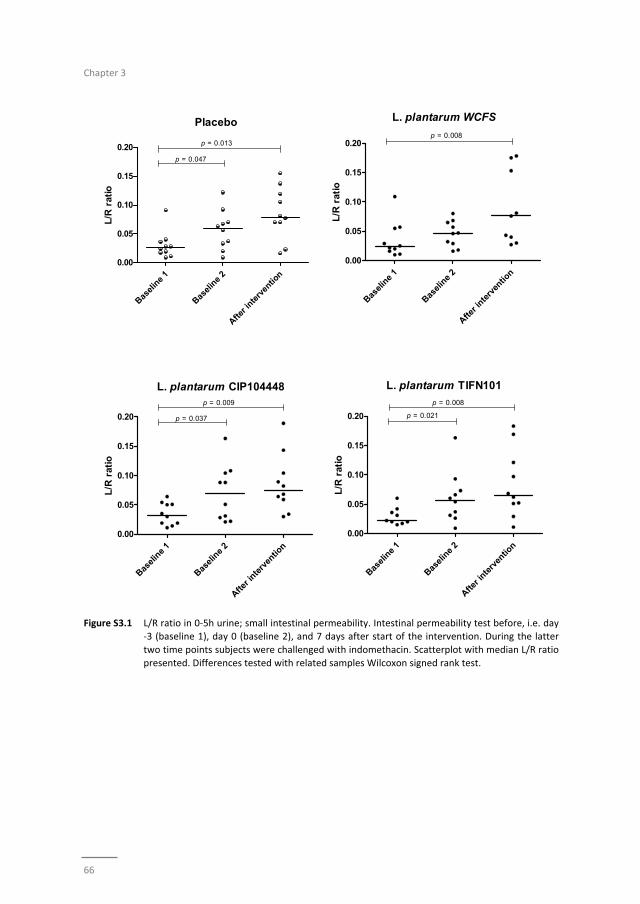
Chapter 3
66
Figure S3.1 L/R ratio in 0‐5h urine; small intestinal permeability. Intestinal permeability test before, i.e. day ‐3 (baseline 1), day 0 (baseline 2), and 7 days after start of the intervention. During the latter
two time points subjects were challenged with indomethacin. Scatterplot with median L/R ratio
presented. Differences tested with related samples Wilcoxon signed rank test.
Basel
ine
1
Basel
ine
2
After i
nterv
entio
n
0.00
0.05
0.10
0.15
0.20
Placebo
p = 0.047
p = 0.013
L/R
rat
io
Basel
ine
1
Basel
ine
2
After i
nterv
entio
n
0.00
0.05
0.10
0.15
0.20
L. plantarum WCFS
p = 0.008
L/R
rat
io
Basel
ine
1
Basel
ine
2
After i
nterv
entio
n
0.00
0.05
0.10
0.15
0.20
L. plantarum CIP104448
p = 0.037
p = 0.009
L/R
rat
io
Basel
ine
1
Basel
ine
2
After i
nterv
entio
n
0.00
0.05
0.10
0.15
0.20
L. plantarum TIFN101
p = 0.021
p = 0.008
L/R
rat
io
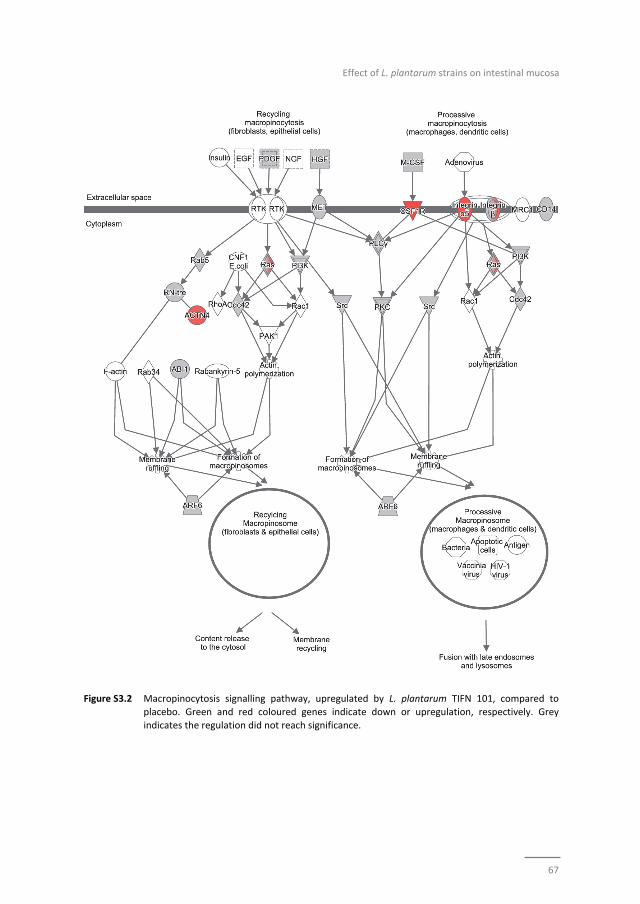
Effect of L. plantarum strains on intestinal mucosa
67
Figure S3.2 Macropinocytosis signalling pathway, upregulated by L. plantarum TIFN 101, compared to
placebo. Green and red coloured genes indicate down or upregulation, respectively. Grey
indicates the regulation did not reach significance.
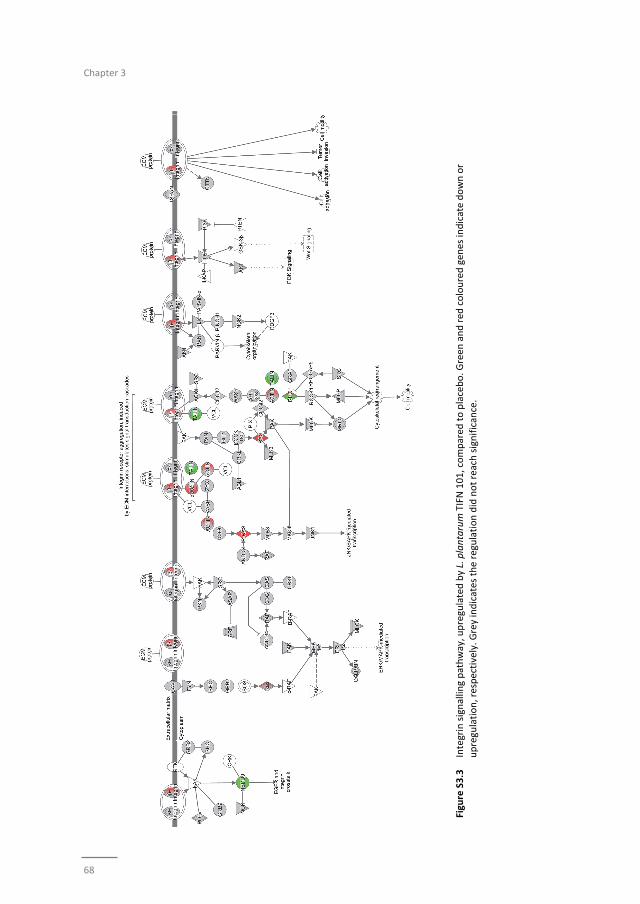
Chapter 3
68
Figure S3.3 Integrin signalling pathway, upregulated by L. plantarum TIFN 101, compared
to placebo. G
reen
and red
coloured gen
es indicate down or
upregulation, respectively. G
rey indicates the regulation did not reach significance.
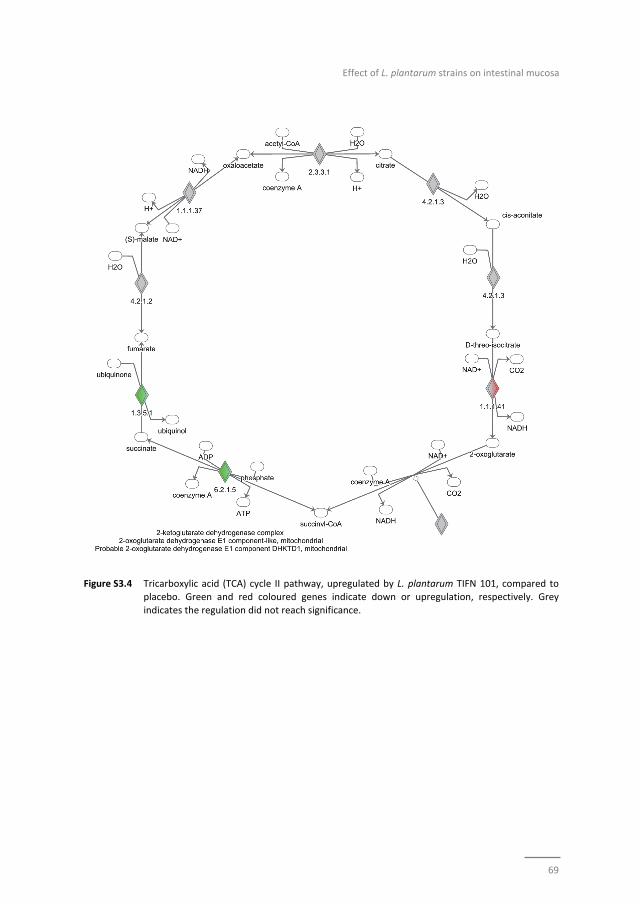
Effect of L. plantarum strains on intestinal mucosa
69
Figure S3.4 Tricarboxylic acid (TCA) cycle II pathway, upregulated by L. plantarum TIFN 101, compared to placebo. Green and red coloured genes indicate down or upregulation, respectively. Grey
indicates the regulation did not reach significance.

Chapter 3
70
71
Chapter 4
Effects of L. plantarum on immunity
Differential human mucosal transcriptomic and peripheral immune responses
induced by three Lactobacillus plantarum strains; insight into how bacteria contribute
to immunity in healthy individuals consuming the NSAID indomethacin
Paul de Vos, Zlatan Mujagic, Bart J de Haan, Roland J Siezen, Peter A Bron,
Marjolein Meijerink, Jerry M Wells, Ad AM Masclee, Mark Boekschoten,
Marijke M Faas, Freddy J Troost
Submitted
Chapter 4
72
Abstract
Objective
Probiotic consumption is known to impact host immunity, however, the mechanisms
involved and how bacteria are perceived in healthy adults under commonly
encountered mucosal enteropathies, such as consumption of NSAID‐painkillers, remain
unclear.
Methods
Adults consuming indomethacin (a NSAID) received three different strains of
Lactobacillus plantarum bacteria (TIFN101, CIP48, or WCFS1) or placebo. To gain insight
into mechanisms, CD45RO+ memory cells were challenged with either superantigen
(total responsiveness), tetanus‐toxoid (specific pathogen responses), or bacterial cell
wall components (responses against the bacterium).
Results
The NSAID induced a reduction in serum CD4+/Foxp3 regulatory cells, which was
prevented by TIFN101. Cell wall components provoked a response after WCFS1 and
TIFN101 consumption. In addition TIFN101 also enhanced specific responses against
tetanus toxoid‐antigen. In the mucosa of the human proximal small intestine, TIFN101
upregulated expression ofgenes associated with maintenance of T and B‐cell function
and antigen‐presentation. CIP48 and WCFS1 downregulated immunological pathways
involved in antigen‐presentation and shared downregulation of snoRNAs suggesting
cellular destabilization. Full sequencing of the strains revealed that TIFN101 lacks the
genes requiredfor plantaricin biosynthesis as well as for exopolysaccharide
biosynthesis, many sugar utilization cassettes, and two large LPXTG‐anchored mucus‐
binding proteins.
Conclusion
The impact of L. plantarum intake on immunity is strain dependent and involves
responses against cell wall components as well as induction of specific responses
against pathogens by enhancing antigen presentation and leucocyte maintenance in
the mucosa. Effects of L. plantarum intake in healthy humans consuming NSAIDs were
positive for TIFN101 consumption; while evidence was found that CIP48 and WCFS1
destabilized intestinal repair.
Effects of L. plantarum on immunity
73
Introduction
Commensal Lactobacilli species may play an active role in the maintenance of
homeostasis of intestinal immune responses by affecting the populations and
distribution of immune cells.1‐5 Lactobacilli likely regulate immune cells via the
interaction of bacterial cell‐wall components or secreted bacterial products with
immune or epithelial cells in the human mucosa.4,6,7 These interactions, however, seem
to contribute to more than just tolerance to the beneficial microbes. Lactobacilli have
been shown to have a positive impact on immune responses, as demonstrated in
several vaccination studies.8‐14 Also, Lactobacilli have been shown to activate more
tolerogenic cellular pathways in human intestinal mucosal cells.15,16
Lactobacillus plantarum is a well‐characterized member of the dietary group of lactic
acid bacteria, having a “generally recognized as safe” (GRAS) status.17 In a previous
study, we showed that L. plantarum strains had different effects on human dendritic
cells and human peripheral blood mononuclear cells.6,7 Using comparative genomic
hybridization, we identified a number of bacteriocins and cell‐wall components
involved in the glycosylation of cell wall teichoic acids associated with these differential
effects.4,6 We assumed that the differential expression of L. plantarum genes
contributes to the observed differences in activation of Toll‐like receptor (TLR) 2–4 and
CD14 antigens in the host.[6] As a consequence of differences in TLR‐binding, upon
incubation with dendritic cells L. plantarum‐strains induce alterations in production of
the pro‐inflammatory cytokine IL‐12 and the regulatory cytokine IL‐10.6 On the basis of
these findings three strains, L. plantarum WCFS1 (WCFS), L. plantarum CIP104448
(CIP48), and L. plantarum TIFN101 (TIFN101) were selected, which induced IL‐10/IL‐12
ratios in vitro classified as proinflammatory, neutral, or anti‐inflammatory, respectively.
In this study, we investigate human in vivo immune responses after consumption of the
three L. plantarum‐strains. Healthy volunteers received the non‐steroidal anti‐
inflammatory drug (NSAID) indomethacin, which induces mild and reversible damage to
the gastrointestinal lining.18‐21 In western societies millions of individuals take NSAIDs
for the treatment of among others musculoskeletal pain. The unwanted mucosal
effects of indomethacin are thought to be caused by inhibition of cyclooxygenase 1
(COX‐1) resulting in decreased production of prostaglandin (PG) E2 and temporary
disruption of epithelial integrity.21‐25 Polarized T‐cell responses in the peripheral
circulation, as well as the responses after re‐stimulation with cell wall extract of L.
plantarum‐strains, superantigen, or tetanus were also studied to determine whether
the L. plantarum strains could enhance immunity against one of these stimuli. Mucosal
transcriptional responses were studied in vivo in the duodenum after seven days of
daily consumption of one of the three L. plantarum strains using a randomized double‐
blind placebo‐controlled cross‐over design. Furthermore, the probiotic strains were
sequenced and annotated to identify putative gene clusters associated with the
differential responses induced by the probiotics.
Chapter 4
74
Materials and methods
Bacterial strains and growth conditions
L. plantarum WCFS1,26 L. plantarum CIP104448, and L. plantarum TIFN101 (NIZO strain‐
collection) were cultured at 37°C in Man, Rogosa, and Sharpe (MRS) medium (Merck).
Detailed protocols for culturing, harvesting, freeze drying, storing, and viability
determination of Lactobacillus species has been published.2 Maltodextrin and glucose
were added to a final concentration of 20% and 2% (wt/vol), respectively, to obtain
bacterial preparations (WCFS, 2.6 x 10⁹ CFU; CIP48, 2.4 x 10⁹ CFU; and TIFN101 , 5.6 x
109 CFU); placebo controls contained the two sugars.
Volunteers and interventions
This study was approved by the University Hospital Maastricht Ethical Committee and
has been registered in the US National Library of Medicine
(http://www.clinicaltrials.gov, NCT01456767). All subjects gave their written informed
consent. Ten healthy volunteers, 7 female and 3 male (26.3±10.1 years, BMI of
21.8±2.40 kg/m2), without a history of gastrointestinal symptoms and free of
medication, were tested on four separate occasions (September 2013 till March 2014)
in a randomized placebo‐controlled cross‐over study. The volunteers consumed their
habitual diet and kept a gastrointestinal symptoms diary. Three days before the
intervention, a blood sample was taken to obtain baseline values. The night before the
starting day the volunteers ingested 75 mg of indomethacin. On the start day the
volunteers ingested another dosage of 50 mg indomethacin to conform to a previously
established protocol to establish mild gastrointestinal stress.27,28 Subsequently, the
volunteers consumed the bacterium or placebo supplements for a period of seven days
during lunch and during dinner. The vials containing bacteria or placebo were non‐
transparent. On the seventh day, tissue samples were obtained from the horizontal
part of the duodenum by standard flexible gastroduodenoscopy at approximately
15 cm distal to the pylorus. The duodenal mucosa was chosen as the duodenum is
readily accessible for sampling. The interventions were performed with an interval of
four weeks to allow a wash‐out period and also healing of the biopsy‐sampling region.
Cell staining
Blood was collected in EDTA‐containing tubes and processed for FACS analysis
(Table 4.1). Isotype controls were used at the same dilution as the antibody.
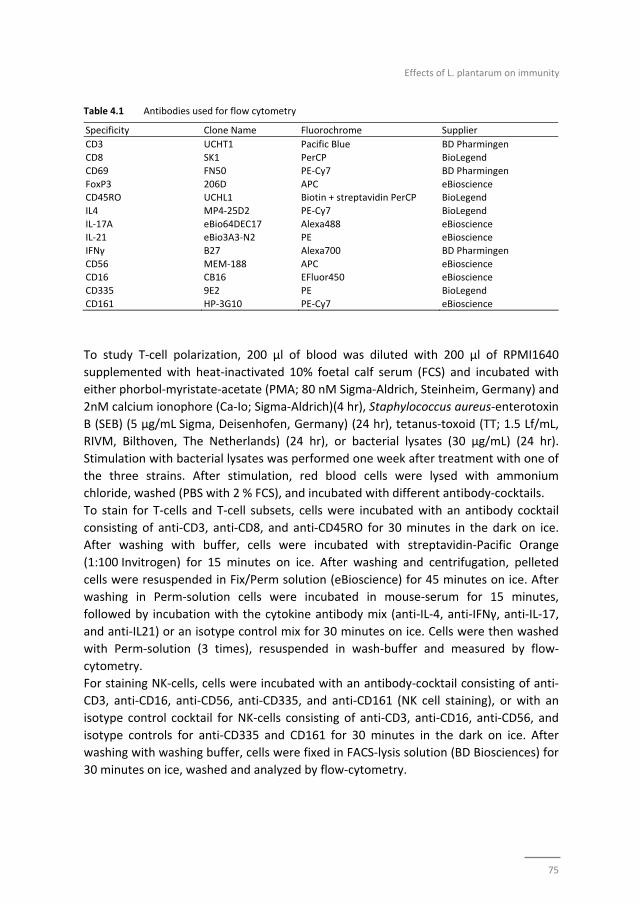
Effects of L. plantarum on immunity
75
Table 4.1 Antibodies used for flow cytometry
Specificity Clone Name Fluorochrome Supplier
CD3 UCHT1 Pacific Blue BD Pharmingen
CD8 SK1 PerCP BioLegend
CD69 FN50 PE‐Cy7 BD Pharmingen
FoxP3 206D APC eBioscience CD45RO UCHL1 Biotin + streptavidin PerCP BioLegend
IL4 MP4‐25D2 PE‐Cy7 BioLegend
IL‐17A eBio64DEC17 Alexa488 eBioscience IL‐21 eBio3A3‐N2 PE eBioscience
IFNγ B27 Alexa700 BD Pharmingen
CD56 MEM‐188 APC eBioscience CD16 CB16 EFluor450 eBioscience
CD335 9E2 PE BioLegend
CD161 HP‐3G10 PE‐Cy7 eBioscience
To study T‐cell polarization, 200 µl of blood was diluted with 200 µl of RPMI1640
supplemented with heat‐inactivated 10% foetal calf serum (FCS) and incubated with
either phorbol‐myristate‐acetate (PMA; 80 nM Sigma‐Aldrich, Steinheim, Germany) and
2nM calcium ionophore (Ca‐Io; Sigma‐Aldrich)(4 hr), Staphylococcus aureus‐enterotoxin
B (SEB) (5 µg/mL Sigma, Deisenhofen, Germany) (24 hr), tetanus‐toxoid (TT; 1.5 Lf/mL,
RIVM, Bilthoven, The Netherlands) (24 hr), or bacterial lysates (30 µg/mL) (24 hr).
Stimulation with bacterial lysates was performed one week after treatment with one of
the three strains. After stimulation, red blood cells were lysed with ammonium
chloride, washed (PBS with 2 % FCS), and incubated with different antibody‐cocktails.
To stain for T‐cells and T‐cell subsets, cells were incubated with an antibody cocktail
consisting of anti‐CD3, anti‐CD8, and anti‐CD45RO for 30 minutes in the dark on ice.
After washing with buffer, cells were incubated with streptavidin‐Pacific Orange
(1:100 Invitrogen) for 15 minutes on ice. After washing and centrifugation, pelleted
cells were resuspended in Fix/Perm solution (eBioscience) for 45 minutes on ice. After
washing in Perm‐solution cells were incubated in mouse‐serum for 15 minutes,
followed by incubation with the cytokine antibody mix (anti‐IL‐4, anti‐IFNγ, anti‐IL‐17,
and anti‐IL21) or an isotype control mix for 30 minutes on ice. Cells were then washed
with Perm‐solution (3 times), resuspended in wash‐buffer and measured by flow‐
cytometry.
For staining NK‐cells, cells were incubated with an antibody‐cocktail consisting of anti‐
CD3, anti‐CD16, anti‐CD56, anti‐CD335, and anti‐CD161 (NK cell staining), or with an
isotype control cocktail for NK‐cells consisting of anti‐CD3, anti‐CD16, anti‐CD56, and
isotype controls for anti‐CD335 and CD161 for 30 minutes in the dark on ice. After
washing with washing buffer, cells were fixed in FACS‐lysis solution (BD Biosciences) for
30 minutes on ice, washed and analyzed by flow‐cytometry.
Chapter 4
76
RNA isolation and microarray
Total RNA was isolated from duodenal biopsy samples using Trizol reagent (1 ml)
(Invitrogen, Breda, NL). RNA was purified using the Qiagen RNeasy Micro kit (Qiagen,
NL) and quantified using a NanoDrop ND‐1000 spectrophotometer (Isogen Life Science,
NL). RNA quality was confirmed using an Agilent 2100 bioanalyzer (Agilent
Technologies, NL). RNA was judged suitable for array‐hybridization only if samples
exhibited intact bands corresponding to 18S and 28S ribosomal subunits and displayed
no chromosomal peaks or RNA‐degradation products.
Total RNA (100 ng) was used for whole transcript cDNA synthesis using the Ambion WT
expression kit (Life Technologies, NL) and was subsequently labelled using the
Affymetrix GeneChip WT Terminal Labeling Kit (Affymetrix, Santa Clara, CA). Samples
were hybridized to human whole genome Affymetrix GeneChip Human Gene 1.1 ST
arrays, washed, stained, and scanned on an Affymetrix GeneTitan instrument. Details
on array handling can be found in the Affymetrix GeneTitan Instrument User Guide for
Expression Array Plates (P/N 702933 Rev.2).
Microarray data analysis
Microarray analysis was performed utilizing MADMAX for statistical analysis.29 All arrays
met the quality criteria. The probes on the Human Gene 1.1 ST‐arrays were redefined
according to Dai et al.30 based on the NCBI Entrez database (CDF version 15.1). In this
way the Human Gene 1.1 ST array targets 19,682 unique genes. Normalized expression
values were obtained from the raw intensity values by using the robust multi‐array
analysis preprocessing algorithm available in the AffyPLM library using default
settings.31 Microarray‐data were filtered and probe sets with at least five probes and
expression values higher than 20 on at least five arrays with an interquartile range >0.2
(log2 scale) across all samples were selected for further statistical analysis. In addition,
an InterQuartile Range (IQR) cut‐off of 0.2 was used to filter out genes that showed no
variation between the conditions. Differentially expressed genes were identified using
linear models, applying moderated t‐statistics that implemented empirical Bayes
regularization of standard errors in the library limma.32 The moderated t‐statistic was
extended by a Bayesian hierarchical model to define an intensity‐based moderated
t‐statistic to adjust for independence of variances relative to the degree of identity and
relation between variance and signal intensity.33 Genes were defined as significantly
changed when the p‐value was <0.05 for pairwise comparisons.
Pathway analysis
Gene set enrichment analysis (GSEA; broad.mit.edu/gsea/) was performed using
MADMAX and gene sets with a false discovery rate (FDR) <0.2 were considered
significantly enriched. GSEA takes into account the broader context in which gene
products function, namely in physically interacting networks such as biochemical,
Effects of L. plantarum on immunity
77
metabolic, or signal transduction routes, and has the advantage that it is unbiased
because no gene selection step is used. Possible transcription factors were identified
using Upstream Regulator Analysis in Ingenuity Pathway Analysis (IPA; Ingenuity
Systems, Redwood City, CA).
Genome sequencing and annotation
For DNA preparation, bacteria were pelleted, washed, and resuspended in TES buffer
(N‐[tris(hydroxymethyl)methyl]‐2‐aminoet hanesulfonic acid). Cells were lysed with
lysozyme (360 mg/ml) and mutanolysin (140 U /ml) by incubation for 2 h at 37°C.
Subsequently 300 µl water and 80 µl of a 20% SDS solution were added. The DNA
extraction was done using phenol/chloroform (3×). DNA was precipitated with
isopropanol and washed with 70% ethanol. Samples were treated with 100 µg/ml
RNAse (Sigma) for one hour at 37°C. DNA paired‐end libraries with barcoding were
made and sequenced using Illumina technology (Baseclear Leiden). The genome
sequences of L. plantarum strains CIP104448 and TIFN 101 have been deposited in
NCBI/GenBank under accession numbers JSUW00000000 and JSUX00000000,
respectively. The contig sequences were submitted to the RAST automatic annotation
server (http://rast.nmpdr.org/), which provided ORF calling and automatic annotation.
The annotated contigs of CIP48 and TIFN101 were ordered by comparing them to the
circular template genome of L. plantarum WCFS1,34 and comparing them to each other.
Contigs/genes which did not match to the WCFS1 genome were annotated in more
detail using BLASTP (http://blast.ncbi.nlm.nih.gov/) and InterProscan
(http://www.ebi.ac.uk/interpro/). Ortholog groups (OGs) in the three genomes were
determined using OrthoMCL (www.orthomcl.org/).
Statistics
Flow‐cytometry results are expressed as the mean ± standard error of the mean (SEM).
Normal distribution was confirmed by the Kolmogorov‐Smirnov test. The two‐sided
students t‐test was used for changes in immune‐cell populations after L. plantarum
treatment. Gene expression data are depicted as the median (range). The two‐sided
Mann Whitney U‐test was used to determine changes in expression‐profiles after
L. plantarum treatment in vivo. P‐values <0.05 were considered statistically significant.
Results
Human trial
None of the volunteers experienced any discomfort during or after the seven day
consumption period. Before the start of the trial (day 0) and again at day 7, blood
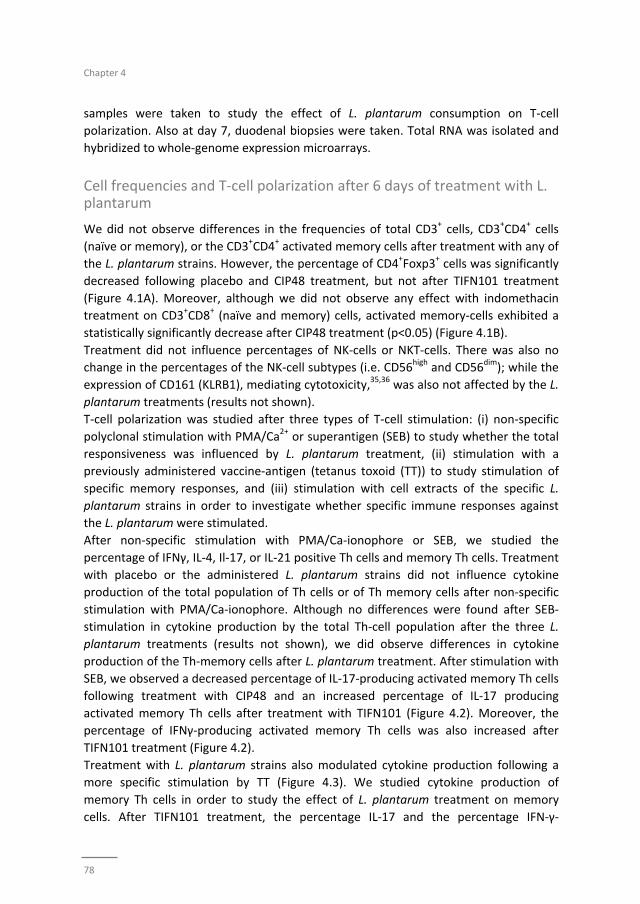
Chapter 4
78
samples were taken to study the effect of L. plantarum consumption on T‐cell
polarization. Also at day 7, duodenal biopsies were taken. Total RNA was isolated and
hybridized to whole‐genome expression microarrays.
Cell frequencies and T‐cell polarization after 6 days of treatment with L. plantarum
We did not observe differences in the frequencies of total CD3+ cells, CD3+CD4+ cells
(naïve or memory), or the CD3+CD4+ activated memory cells after treatment with any of
the L. plantarum strains. However, the percentage of CD4+Foxp3+ cells was significantly
decreased following placebo and CIP48 treatment, but not after TIFN101 treatment
(Figure 4.1A). Moreover, although we did not observe any effect with indomethacin
treatment on CD3+CD8+ (naïve and memory) cells, activated memory‐cells exhibited a
statistically significantly decrease after CIP48 treatment (p<0.05) (Figure 4.1B).
Treatment did not influence percentages of NK‐cells or NKT‐cells. There was also no
change in the percentages of the NK‐cell subtypes (i.e. CD56high and CD56dim); while the
expression of CD161 (KLRB1), mediating cytotoxicity,35,36 was also not affected by the L.
plantarum treatments (results not shown).
T‐cell polarization was studied after three types of T‐cell stimulation: (i) non‐specific
polyclonal stimulation with PMA/Ca2+ or superantigen (SEB) to study whether the total
responsiveness was influenced by L. plantarum treatment, (ii) stimulation with a
previously administered vaccine‐antigen (tetanus toxoid (TT)) to study stimulation of
specific memory responses, and (iii) stimulation with cell extracts of the specific L.
plantarum strains in order to investigate whether specific immune responses against
the L. plantarum were stimulated.
After non‐specific stimulation with PMA/Ca‐ionophore or SEB, we studied the
percentage of IFNγ, IL‐4, Il‐17, or IL‐21 positive Th cells and memory Th cells. Treatment
with placebo or the administered L. plantarum strains did not influence cytokine
production of the total population of Th cells or of Th memory cells after non‐specific
stimulation with PMA/Ca‐ionophore. Although no differences were found after SEB‐
stimulation in cytokine production by the total Th‐cell population after the three L.
plantarum treatments (results not shown), we did observe differences in cytokine
production of the Th‐memory cells after L. plantarum treatment. After stimulation with
SEB, we observed a decreased percentage of IL‐17‐producing activated memory Th cells
following treatment with CIP48 and an increased percentage of IL‐17 producing
activated memory Th cells after treatment with TIFN101 (Figure 4.2). Moreover, the
percentage of IFNγ‐producing activated memory Th cells was also increased after
TIFN101 treatment (Figure 4.2).
Treatment with L. plantarum strains also modulated cytokine production following a
more specific stimulation by TT (Figure 4.3). We studied cytokine production of
memory Th cells in order to study the effect of L. plantarum treatment on memory
cells. After TIFN101 treatment, the percentage IL‐17 and the percentage IFN‐γ‐
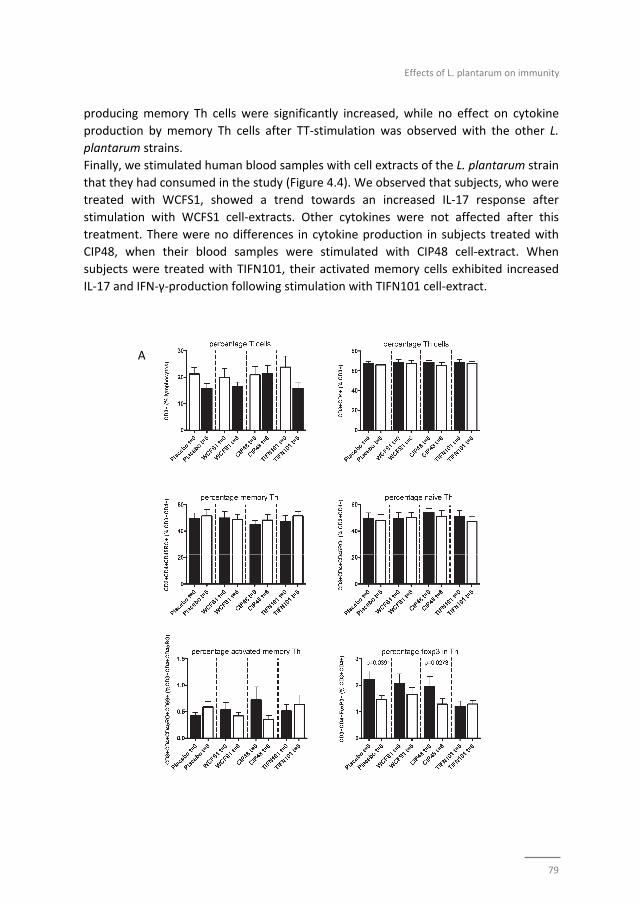
Effects of L. plantarum on immunity
79
producing memory Th cells were significantly increased, while no effect on cytokine
production by memory Th cells after TT‐stimulation was observed with the other L.
plantarum strains.
Finally, we stimulated human blood samples with cell extracts of the L. plantarum strain
that they had consumed in the study (Figure 4.4). We observed that subjects, who were
treated with WCFS1, showed a trend towards an increased IL‐17 response after
stimulation with WCFS1 cell‐extracts. Other cytokines were not affected after this
treatment. There were no differences in cytokine production in subjects treated with
CIP48, when their blood samples were stimulated with CIP48 cell‐extract. When
subjects were treated with TIFN101, their activated memory cells exhibited increased
IL‐17 and IFN‐γ‐production following stimulation with TIFN101 cell‐extract.
A
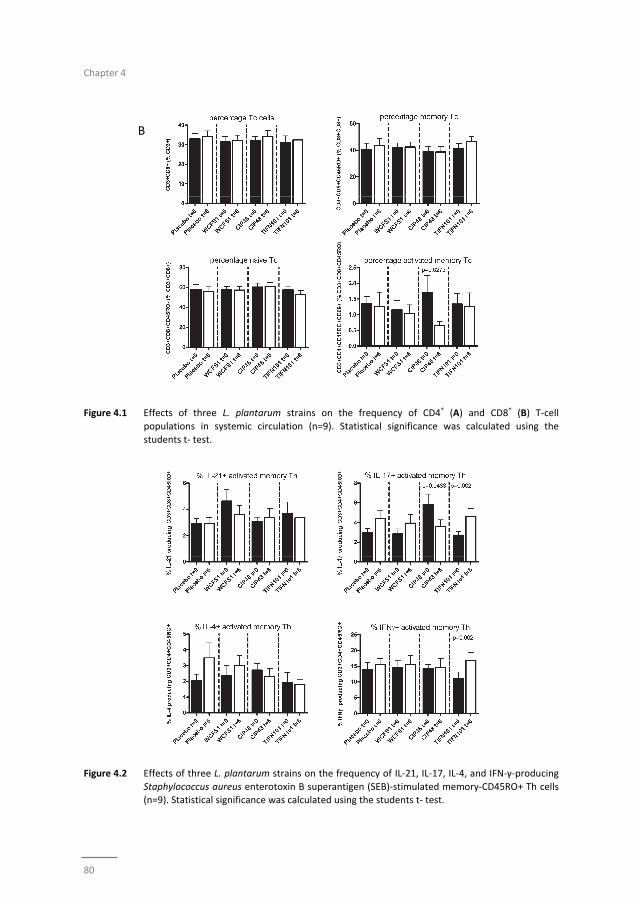
Chapter 4
80
B
Figure 4.1 Effects of three L. plantarum strains on the frequency of CD4+ (A) and CD8
+ (B) T‐cell
populations in systemic circulation (n=9). Statistical significance was calculated using the
students t‐ test.
Figure 4.2 Effects of three L. plantarum strains on the frequency of IL‐21, IL‐17, IL‐4, and IFN‐γ‐producing
Staphylococcus aureus enterotoxin B superantigen (SEB)‐stimulated memory‐CD45RO+ Th cells (n=9). Statistical significance was calculated using the students t‐ test.
Effects of L. plantarum on immunity
81
Figure 4.3 Effects of three L. plantarum strains on the frequency of IL‐21, IL‐17, IL‐4, and IFN‐γ‐producing tetanus‐toxoid (TT)‐stimulated memory‐CD45RO+ Th cells (n=9). Statistical significance was
calculated using the students t‐ test.
Figure 4.4 Effects of three L. plantarum strains on the frequency of IL‐21, IL‐17, IL‐4, and IFN‐γ‐producing
memory CD45RO+ Th cells stimulated with bacterial cell wall extracts, matched to the strain
consumed (n=9). Statistical significance was calculated using the students t‐ test.
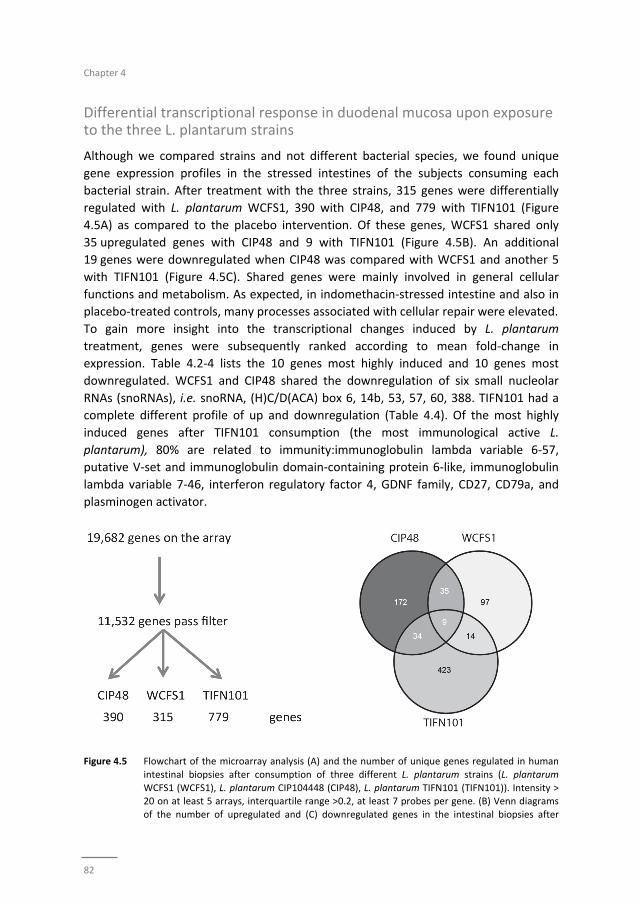
Chapter 4
82
Differential transcriptional response in duodenal mucosa upon exposure to the three L. plantarum strains
Although we compared strains and not different bacterial species, we found unique
gene expression profiles in the stressed intestines of the subjects consuming each
bacterial strain. After treatment with the three strains, 315 genes were differentially
regulated with L. plantarum WCFS1, 390 with CIP48, and 779 with TIFN101 (Figure
4.5A) as compared to the placebo intervention. Of these genes, WCFS1 shared only
35 upregulated genes with CIP48 and 9 with TIFN101 (Figure 4.5B). An additional
19 genes were downregulated when CIP48 was compared with WCFS1 and another 5
with TIFN101 (Figure 4.5C). Shared genes were mainly involved in general cellular
functions and metabolism. As expected, in indomethacin‐stressed intestine and also in
placebo‐treated controls, many processes associated with cellular repair were elevated.
To gain more insight into the transcriptional changes induced by L. plantarum
treatment, genes were subsequently ranked according to mean fold‐change in
expression. Table 4.2‐4 lists the 10 genes most highly induced and 10 genes most
downregulated. WCFS1 and CIP48 shared the downregulation of six small nucleolar
RNAs (snoRNAs), i.e. snoRNA, (H)C/D(ACA) box 6, 14b, 53, 57, 60, 388. TIFN101 had a
complete different profile of up and downregulation (Table 4.4). Of the most highly
induced genes after TIFN101 consumption (the most immunological active L.
plantarum), 80% are related to immunity:immunoglobulin lambda variable 6‐57,
putative V‐set and immunoglobulin domain‐containing protein 6‐like, immunoglobulin
lambda variable 7‐46, interferon regulatory factor 4, GDNF family, CD27, CD79a, and
plasminogen activator.
Figure 4.5 Flowchart of the microarray analysis (A) and the number of unique genes regulated in human
intestinal biopsies after consumption of three different L. plantarum strains (L. plantarum
WCFS1 (WCFS1), L. plantarum CIP104448 (CIP48), L. plantarum TIFN101 (TIFN101)). Intensity > 20 on at least 5 arrays, interquartile range >0.2, at least 7 probes per gene. (B) Venn diagrams
of the number of upregulated and (C) downregulated genes in the intestinal biopsies after
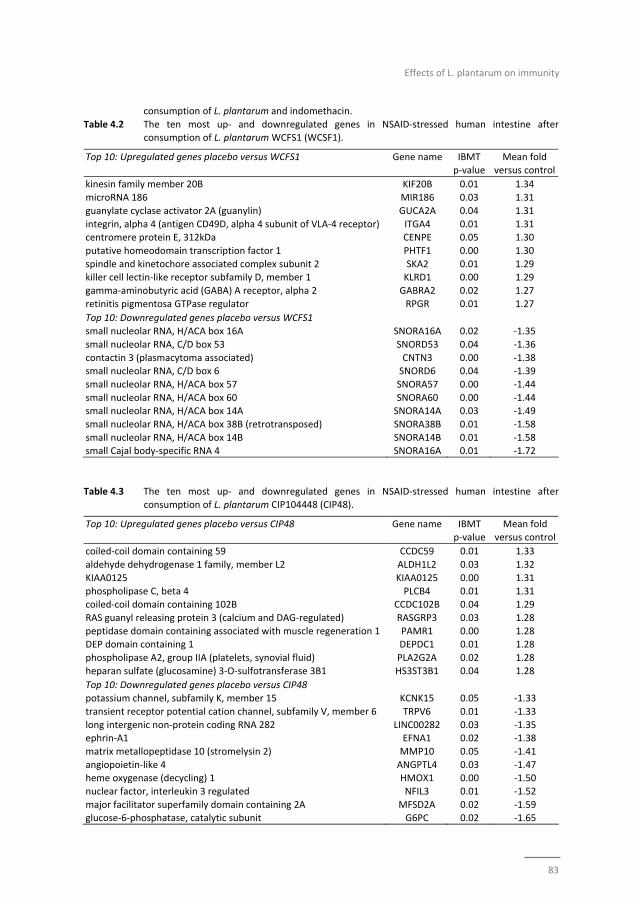
Effects of L. plantarum on immunity
83
consumption of L. plantarum and indomethacin.
Table 4.2 The ten most up‐ and downregulated genes in NSAID‐stressed human intestine after consumption of L. plantarum WCFS1 (WCSF1).
Top 10: Upregulated genes placebo versus WCFS1 Gene name IBMT p‐value
Mean fold versus control
kinesin family member 20B KIF20B 0.01 1.34
microRNA 186 MIR186 0.03 1.31
guanylate cyclase activator 2A (guanylin) GUCA2A 0.04 1.31
integrin, alpha 4 (antigen CD49D, alpha 4 subunit of VLA‐4 receptor) ITGA4 0.01 1.31 centromere protein E, 312kDa CENPE 0.05 1.30
putative homeodomain transcription factor 1 PHTF1 0.00 1.30
spindle and kinetochore associated complex subunit 2 SKA2 0.01 1.29 killer cell lectin‐like receptor subfamily D, member 1 KLRD1 0.00 1.29
gamma‐aminobutyric acid (GABA) A receptor, alpha 2 GABRA2 0.02 1.27
retinitis pigmentosa GTPase regulator RPGR 0.01 1.27
Top 10: Downregulated genes placebo versus WCFS1
small nucleolar RNA, H/ACA box 16A SNORA16A 0.02 ‐1.35
small nucleolar RNA, C/D box 53 SNORD53 0.04 ‐1.36
contactin 3 (plasmacytoma associated) CNTN3 0.00 ‐1.38 small nucleolar RNA, C/D box 6 SNORD6 0.04 ‐1.39
small nucleolar RNA, H/ACA box 57 SNORA57 0.00 ‐1.44
small nucleolar RNA, H/ACA box 60 SNORA60 0.00 ‐1.44 small nucleolar RNA, H/ACA box 14A SNORA14A 0.03 ‐1.49
small nucleolar RNA, H/ACA box 38B (retrotransposed) SNORA38B 0.01 ‐1.58
small nucleolar RNA, H/ACA box 14B SNORA14B 0.01 ‐1.58 small Cajal body‐specific RNA 4 SNORA16A 0.01 ‐1.72
Table 4.3 The ten most up‐ and downregulated genes in NSAID‐stressed human intestine after
consumption of L. plantarum CIP104448 (CIP48).
Top 10: Upregulated genes placebo versus CIP48 Gene name IBMT p‐value
Mean fold versus control
coiled‐coil domain containing 59 CCDC59 0.01 1.33
aldehyde dehydrogenase 1 family, member L2 ALDH1L2 0.03 1.32
KIAA0125 KIAA0125 0.00 1.31
phospholipase C, beta 4 PLCB4 0.01 1.31 coiled‐coil domain containing 102B CCDC102B 0.04 1.29
RAS guanyl releasing protein 3 (calcium and DAG‐regulated) RASGRP3 0.03 1.28
peptidase domain containing associated with muscle regeneration 1 PAMR1 0.00 1.28 DEP domain containing 1 DEPDC1 0.01 1.28
phospholipase A2, group IIA (platelets, synovial fluid) PLA2G2A 0.02 1.28
heparan sulfate (glucosamine) 3‐O‐sulfotransferase 3B1 HS3ST3B1 0.04 1.28
Top 10: Downregulated genes placebo versus CIP48
potassium channel, subfamily K, member 15 KCNK15 0.05 ‐1.33
transient receptor potential cation channel, subfamily V, member 6 TRPV6 0.01 ‐1.33
long intergenic non‐protein coding RNA 282 LINC00282 0.03 ‐1.35 ephrin‐A1 EFNA1 0.02 ‐1.38
matrix metallopeptidase 10 (stromelysin 2) MMP10 0.05 ‐1.41
angiopoietin‐like 4 ANGPTL4 0.03 ‐1.47 heme oxygenase (decycling) 1 HMOX1 0.00 ‐1.50
nuclear factor, interleukin 3 regulated NFIL3 0.01 ‐1.52
major facilitator superfamily domain containing 2A MFSD2A 0.02 ‐1.59 glucose‐6‐phosphatase, catalytic subunit G6PC 0.02 ‐1.65
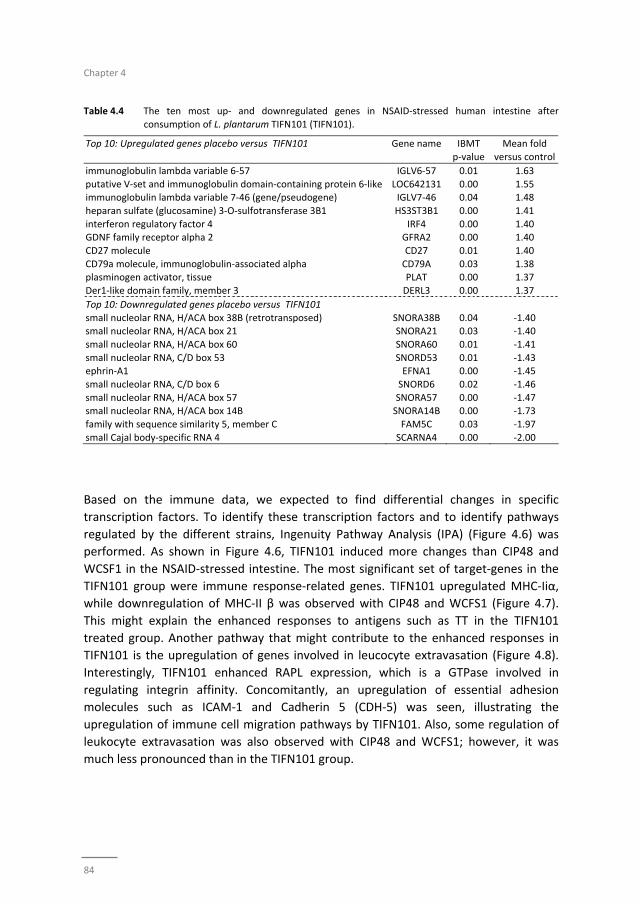
Chapter 4
84
Table 4.4 The ten most up‐ and downregulated genes in NSAID‐stressed human intestine after
consumption of L. plantarum TIFN101 (TIFN101).
Top 10: Upregulated genes placebo versus TIFN101 Gene name IBMT
p‐value
Mean fold
versus control
immunoglobulin lambda variable 6‐57 IGLV6‐57 0.01 1.63
putative V‐set and immunoglobulin domain‐containing protein 6‐like LOC642131 0.00 1.55 immunoglobulin lambda variable 7‐46 (gene/pseudogene) IGLV7‐46 0.04 1.48
heparan sulfate (glucosamine) 3‐O‐sulfotransferase 3B1 HS3ST3B1 0.00 1.41
interferon regulatory factor 4 IRF4 0.00 1.40 GDNF family receptor alpha 2 GFRA2 0.00 1.40
CD27 molecule CD27 0.01 1.40
CD79a molecule, immunoglobulin‐associated alpha CD79A 0.03 1.38 plasminogen activator, tissue PLAT 0.00 1.37
Der1‐like domain family, member 3 DERL3 0.00 1.37
Top 10: Downregulated genes placebo versus TIFN101
small nucleolar RNA, H/ACA box 38B (retrotransposed) SNORA38B 0.04 ‐1.40 small nucleolar RNA, H/ACA box 21 SNORA21 0.03 ‐1.40
small nucleolar RNA, H/ACA box 60 SNORA60 0.01 ‐1.41
small nucleolar RNA, C/D box 53 SNORD53 0.01 ‐1.43 ephrin‐A1 EFNA1 0.00 ‐1.45
small nucleolar RNA, C/D box 6 SNORD6 0.02 ‐1.46
small nucleolar RNA, H/ACA box 57 SNORA57 0.00 ‐1.47 small nucleolar RNA, H/ACA box 14B SNORA14B 0.00 ‐1.73
family with sequence similarity 5, member C FAM5C 0.03 ‐1.97
small Cajal body‐specific RNA 4 SCARNA4 0.00 ‐2.00
Based on the immune data, we expected to find differential changes in specific
transcription factors. To identify these transcription factors and to identify pathways
regulated by the different strains, Ingenuity Pathway Analysis (IPA) (Figure 4.6) was
performed. As shown in Figure 4.6, TIFN101 induced more changes than CIP48 and
WCSF1 in the NSAID‐stressed intestine. The most significant set of target‐genes in the
TIFN101 group were immune response‐related genes. TIFN101 upregulated MHC‐Iiα,
while downregulation of MHC‐II β was observed with CIP48 and WCFS1 (Figure 4.7).
This might explain the enhanced responses to antigens such as TT in the TIFN101
treated group. Another pathway that might contribute to the enhanced responses in
TIFN101 is the upregulation of genes involved in leucocyte extravasation (Figure 4.8).
Interestingly, TIFN101 enhanced RAPL expression, which is a GTPase involved in
regulating integrin affinity. Concomitantly, an upregulation of essential adhesion
molecules such as ICAM‐1 and Cadherin 5 (CDH‐5) was seen, illustrating the
upregulation of immune cell migration pathways by TIFN101. Also, some regulation of
leukocyte extravasation was also observed with CIP48 and WCFS1; however, it was
much less pronounced than in the TIFN101 group.
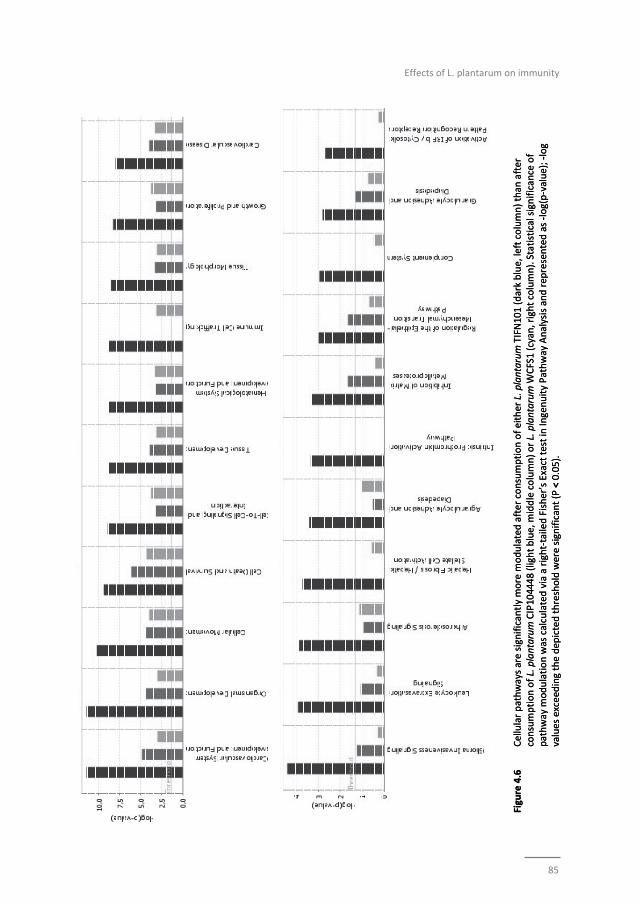
Effects of L. plantarum on immunity
85
Figure 4.6
Cellular pathways are significantly more m
odulated after consumption of either L. plantarum
TIFN
101 (dark blue, left column) than
after
consumption of L. plantarum
CIP104448 (light blue, m
iddle column) or L. plantarumWCFS1 (cyan, right column). Statistical significance of
pathway m
odulation was calculated via a right‐tailed Fisher’s Exact test in Ingenuity Pathway Analysis and represented as ‐log(p‐value); ‐log
values exceed
ing the dep
icted threshold were significant (P < 0.05).
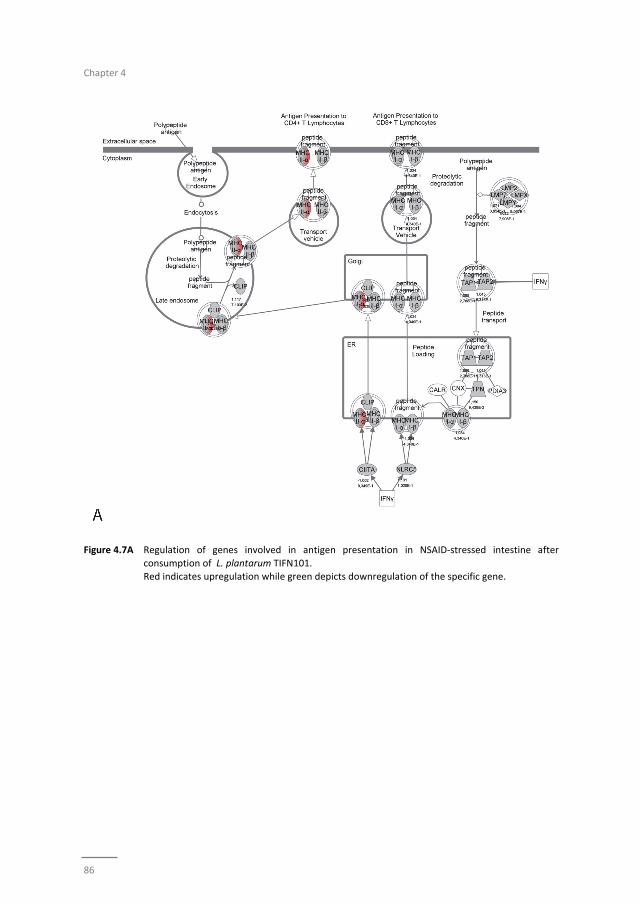
Chapter 4
86
Figure 4.7A Regulation of genes involved in antigen presentation in NSAID‐stressed intestine after
consumption of L. plantarum TIFN101. Red indicates upregulation while green depicts downregulation of the specific gene.
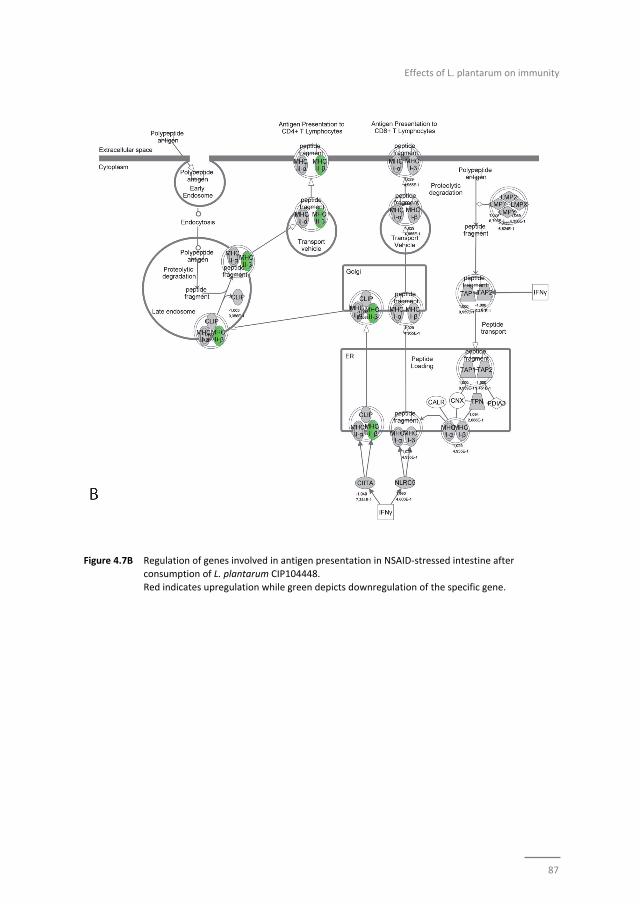
Effects of L. plantarum on immunity
87
Figure 4.7B Regulation of genes involved in antigen presentation in NSAID‐stressed intestine after
consumption of L. plantarum CIP104448.
Red indicates upregulation while green depicts downregulation of the specific gene.
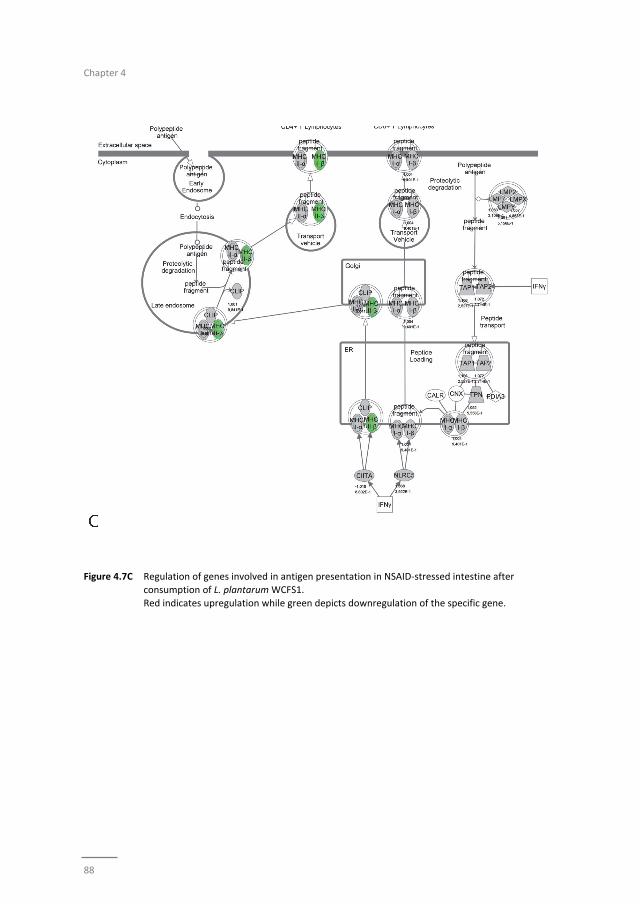
Chapter 4
88
Figure 4.7C Regulation of genes involved in antigen presentation in NSAID‐stressed intestine after
consumption of L. plantarum WCFS1.
Red indicates upregulation while green depicts downregulation of the specific gene.
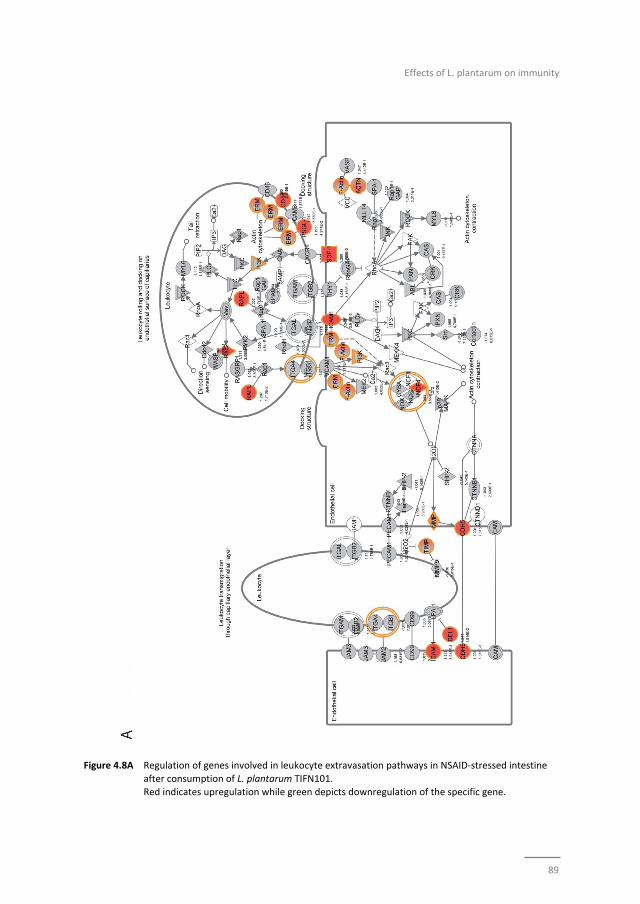
Effects of L. plantarum on immunity
89
Figure 4.8A Regulation of genes involved in leukocyte extravasation pathways in NSAID‐stressed intestine
after consumption of L. plantarum TIFN101. Red indicates upregulation while green depicts downregulation of the specific gene.
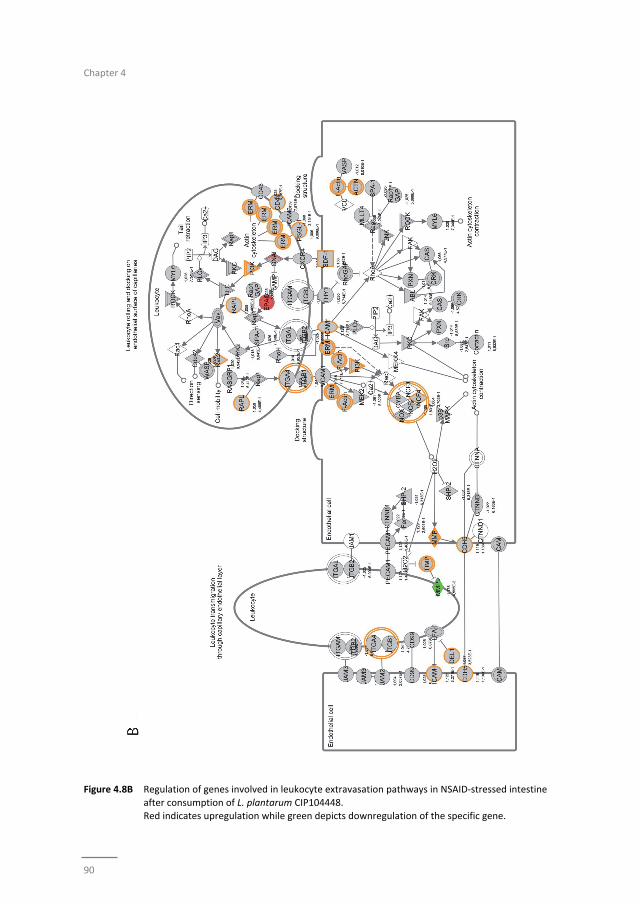
Chapter 4
90
Figure 4.8B Regulation of genes involved in leukocyte extravasation pathways in NSAID‐stressed intestine
after consumption of L. plantarum CIP104448. Red indicates upregulation while green depicts downregulation of the specific gene.
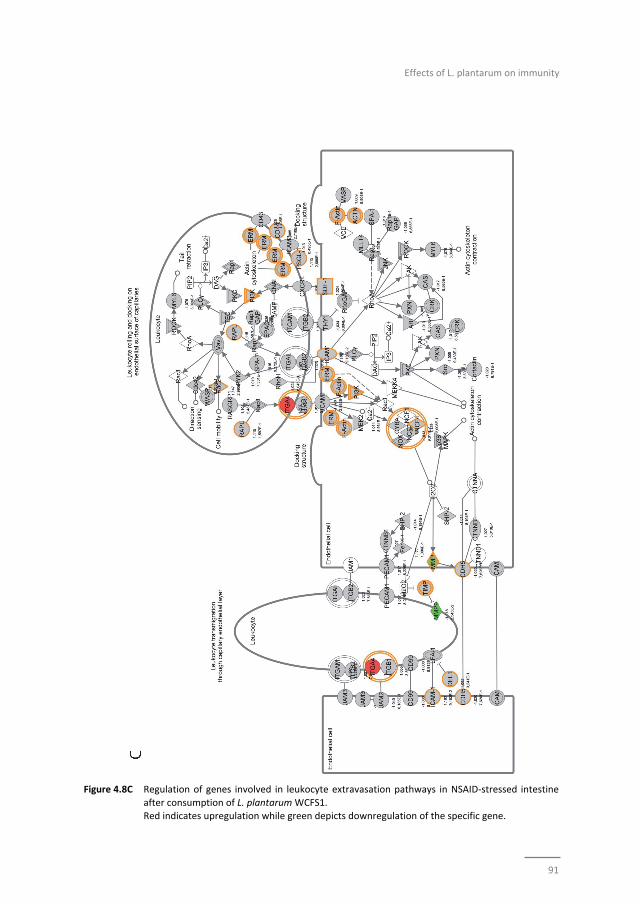
Effects of L. plantarum on immunity
91
Figure 4.8C Regulation of genes involved in leukocyte extravasation pathways in NSAID‐stressed intestine
after consumption of L. plantarum WCFS1. Red indicates upregulation while green depicts downregulation of the specific gene.
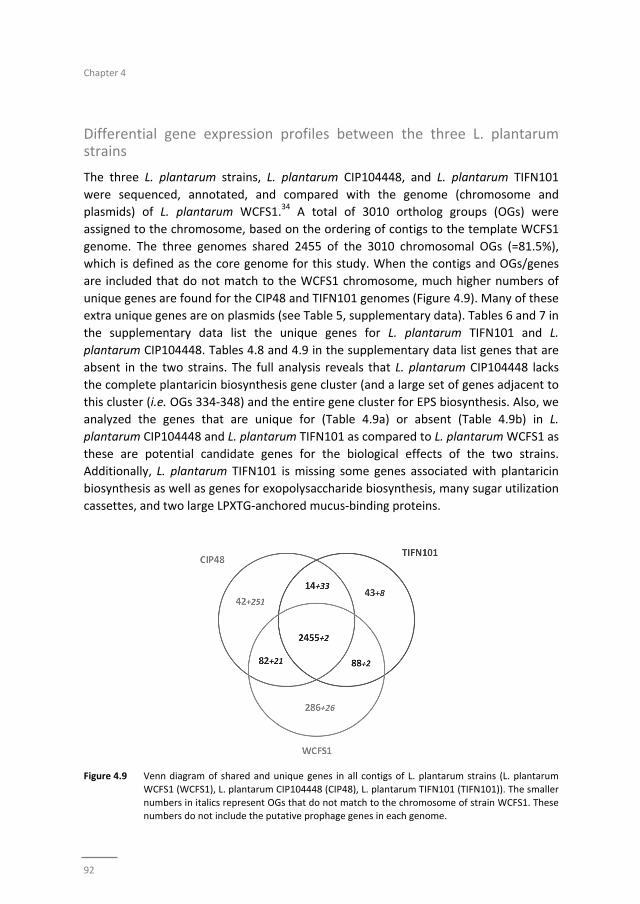
Chapter 4
92
Differential gene expression profiles between the three L. plantarum strains
The three L. plantarum strains, L. plantarum CIP104448, and L. plantarum TIFN101
were sequenced, annotated, and compared with the genome (chromosome and
plasmids) of L. plantarum WCFS1.34 A total of 3010 ortholog groups (OGs) were
assigned to the chromosome, based on the ordering of contigs to the template WCFS1
genome. The three genomes shared 2455 of the 3010 chromosomal OGs (=81.5%),
which is defined as the core genome for this study. When the contigs and OGs/genes
are included that do not match to the WCFS1 chromosome, much higher numbers of
unique genes are found for the CIP48 and TIFN101 genomes (Figure 4.9). Many of these
extra unique genes are on plasmids (see Table 5, supplementary data). Tables 6 and 7 in
the supplementary data list the unique genes for L. plantarum TIFN101 and L.
plantarum CIP104448. Tables 4.8 and 4.9 in the supplementary data list genes that are
absent in the two strains. The full analysis reveals that L. plantarum CIP104448 lacks
the complete plantaricin biosynthesis gene cluster (and a large set of genes adjacent to
this cluster (i.e. OGs 334‐348) and the entire gene cluster for EPS biosynthesis. Also, we
analyzed the genes that are unique for (Table 4.9a) or absent (Table 4.9b) in L.
plantarum CIP104448 and L. plantarum TIFN101 as compared to L. plantarum WCFS1 as
these are potential candidate genes for the biological effects of the two strains.
Additionally, L. plantarum TIFN101 is missing some genes associated with plantaricin
biosynthesis as well as genes for exopolysaccharide biosynthesis, many sugar utilization
cassettes, and two large LPXTG‐anchored mucus‐binding proteins.
Figure 4.9 Venn diagram of shared and unique genes in all contigs of L. plantarum strains (L. plantarum
WCFS1 (WCFS1), L. plantarum CIP104448 (CIP48), L. plantarum TIFN101 (TIFN101)). The smaller
numbers in italics represent OGs that do not match to the chromosome of strain WCFS1. These numbers do not include the putative prophage genes in each genome.
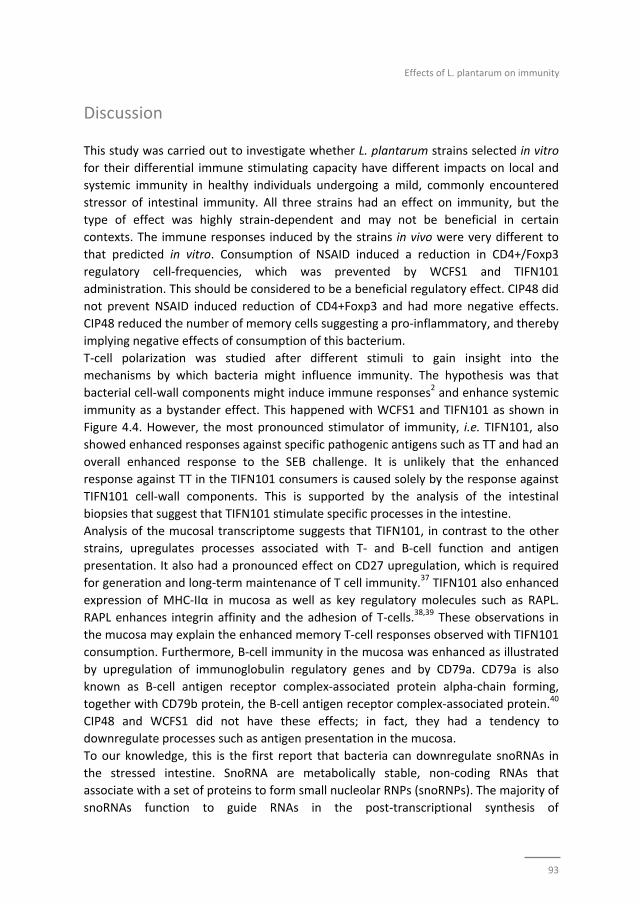
Effects of L. plantarum on immunity
93
Discussion
This study was carried out to investigate whether L. plantarum strains selected in vitro
for their differential immune stimulating capacity have different impacts on local and
systemic immunity in healthy individuals undergoing a mild, commonly encountered
stressor of intestinal immunity. All three strains had an effect on immunity, but the
type of effect was highly strain‐dependent and may not be beneficial in certain
contexts. The immune responses induced by the strains in vivo were very different to
that predicted in vitro. Consumption of NSAID induced a reduction in CD4+/Foxp3
regulatory cell‐frequencies, which was prevented by WCFS1 and TIFN101
administration. This should be considered to be a beneficial regulatory effect. CIP48 did
not prevent NSAID induced reduction of CD4+Foxp3 and had more negative effects.
CIP48 reduced the number of memory cells suggesting a pro‐inflammatory, and thereby
implying negative effects of consumption of this bacterium.
T‐cell polarization was studied after different stimuli to gain insight into the
mechanisms by which bacteria might influence immunity. The hypothesis was that
bacterial cell‐wall components might induce immune responses2 and enhance systemic
immunity as a bystander effect. This happened with WCFS1 and TIFN101 as shown in
Figure 4.4. However, the most pronounced stimulator of immunity, i.e. TIFN101, also
showed enhanced responses against specific pathogenic antigens such as TT and had an
overall enhanced response to the SEB challenge. It is unlikely that the enhanced
response against TT in the TIFN101 consumers is caused solely by the response against
TIFN101 cell‐wall components. This is supported by the analysis of the intestinal
biopsies that suggest that TIFN101 stimulate specific processes in the intestine.
Analysis of the mucosal transcriptome suggests that TIFN101, in contrast to the other
strains, upregulates processes associated with T‐ and B‐cell function and antigen
presentation. It also had a pronounced effect on CD27 upregulation, which is required
for generation and long‐term maintenance of T cell immunity.37 TIFN101 also enhanced
expression of MHC‐IIα in mucosa as well as key regulatory molecules such as RAPL.
RAPL enhances integrin affinity and the adhesion of T‐cells.38,39 These observations in
the mucosa may explain the enhanced memory T‐cell responses observed with TIFN101
consumption. Furthermore, B‐cell immunity in the mucosa was enhanced as illustrated
by upregulation of immunoglobulin regulatory genes and by CD79a. CD79a is also
known as B‐cell antigen receptor complex‐associated protein alpha‐chain forming,
together with CD79b protein, the B‐cell antigen receptor complex‐associated protein.40
CIP48 and WCFS1 did not have these effects; in fact, they had a tendency to
downregulate processes such as antigen presentation in the mucosa.
To our knowledge, this is the first report that bacteria can downregulate snoRNAs in
the stressed intestine. SnoRNA are metabolically stable, non‐coding RNAs that
associate with a set of proteins to form small nucleolar RNPs (snoRNPs). The majority of
snoRNAs function to guide RNAs in the post‐transcriptional synthesis of
Chapter 4
94
2′‐O‐methylated nucleotides and pseudo‐uridines in rRNAs, small nuclear RNAs
(snRNAs), and other cellular RNAs including mRNAs.41‐43 The relative reduction in
snoRNAs 53, 57, 60 by CIP48 and WCFS1 suggest a downregulation of methylation of
ribosomal RNA44 and downregulation of 14b diminished pseudo‐uridinilation of RNA.45
Usually this is indicative of a destabilization of cellular processes,46 suggesting that
CIP48 and WCFS1 consumption is not beneficial for a mildly stressed intestinal
environment.
Full genome sequencing of L. plantarum CIP104448 and L. plantarum TIFN101 was
applied to identify possible gene clusters that might be responsible for the differential
biological effects of the three L. plantarum strains. Several hundred novel L. plantarum
genes were found in strain CIP48 (340 new OGs) and TIFN101 (177 OGs) as compared
to strain WCFS1. Only a small number of these (47 OGs) are shared by both CIP48 and
TIFN101. The majority of these novel genes appear to be located on plasmids. CIP48
appears to have several plasmids that are not present in TIFN101 or WCFS1 (see Table
4.5, supplementary data). Strain CIP48 has specific genes, such as for lantibiotic
biosynthesis and several cell‐surface proteins, that might explain its differential effect.
Notably, however, there are also numerous genes/gene clusters in L. plantarum
CIP104448 and L. plantarum TIFN101 that are not present in the WCFS1 genome.
Strikingly, L. plantarum CIP104448 completely and L. plantarum TIFN101 partially lack
the plantaricin biosynthesis clusters. These genes have, in previous studies, been linked
to strain differences in cytokine production6,47 but were shown here not to be
associated with immune effects in vivo. Also, L. plantarum CIP104448 and L. plantarum
TIFN101 lack very large regions important for sugar metabolism. These differences have
been attributed to adaptations to environmental factors which, in our opinion, are
interesting targets genes and possibly associated with probiotic effects.48 Not only the
presence but also the absence of genes may enhance immune effects of bacteria.4
This comparative genomics study, in which effects of L. plantarum supplementation on
the mucosal transcriptome were combined with systemic immune activation
parameters, provides many leads for follow‐up experimental work to identify genes
that are responsible for or involved in the observed differences in immune effects in
humans.
Effects of L. plantarum on immunity
95
References
1 Kim HJ, Kim YJ, Lee SH, Yu J, Jeong SK, Hong SJ. Effects of Lactobacillus rhamnosus on allergic march model by suppressing Th2, Th17, and TSLP responses via CD4(+)CD25(+)Foxp3(+) Tregs. Clin Immunol
2014;153:178‐86.
2 Smelt MJ, de Haan BJ, Bron PA, van Swam I, Meijerink M, Wells JM, et al. L. plantarum, L. salivarius, and L. lactis attenuate Th2 responses and increase Treg frequencies in healthy mice in a strain dependent
manner. PLoS One 2012;7:e47244.
3 Smelt MJ, de Haan BJ, Bron PA, van Swam I, Meijerink M, Wells JM, et al. Probiotics can generate FoxP3 T‐cell responses in the small intestine and simultaneously inducing CD4 and CD8 T cell activation in the
large intestine. PLoS One 2013;8:e68952.
4 Smelt MJ, de Haan BJ, Bron PA, van Swam I, Meijerink M, Wells JM, et al. The impact of Lactobacillus plantarum WCFS1 teichoic acid D‐alanylation on the generation of effector and regulatory T‐cells in
healthy mice. PLoS One 2013;8:e63099.
5 Steinberg RS, Lima M, Gomes de Oliveira NL, Miyoshi A, Nicoli JR, Neumann E, et al. Effect of intestinal colonisation by two Lactobacillus strains on the immune response of gnotobiotic mice. Beneficial
microbes 2014:1‐11.
6 Meijerink M, van HS, Taverne N, Wels M, de VP, Bron PA, et al. Identification of genetic loci in Lactobacillus plantarum that modulate the immune response of dendritic cells using comparative
genome hybridization. PLoSOne 2010;5:e10632.
7 van Hemert S, Meijerink M, Molenaar D, Bron PA, de Vos P, Kleerebezem M, et al. Identification of Lactobacillus plantarum genes modulating the cytokine response of human peripheral blood
mononuclear cells. BMCMicrobiol 2010;10:293.
8 Akatsu H, Arakawa K, Yamamoto T, Kanematsu T, Matsukawa N, Ohara H, et al. Lactobacillus in jelly enhances the effect of influenza vaccination in elderly individuals. Journal of the American Geriatrics
Society 2013;61:1828‐30.
9 Bosch M, Mendez M, Perez M, Farran A, Fuentes MC, Cune J. Lactobacillus plantarum CECT7315 and CECT7316 stimulate immunoglobulin production after influenza vaccination in elderly. Nutricion
hospitalaria 2012;27:504‐9.
10 de Azevedo MS, Innocentin S, Dorella FA, Rocha CS, Mariat D, Pontes DS, et al. Immunotherapy of allergic diseases using probiotics or recombinant probiotics. Journal of applied microbiology
2013;115:319‐33.
11 Licciardi PV, Tang ML. Vaccine adjuvant properties of probiotic bacteria. Discovery medicine 2011;12:525‐33.
12 Van Puyenbroeck K, Hens N, Coenen S, Michiels B, Beunckens C, Molenberghs G, et al. Efficacy of daily
intake of Lactobacillus casei Shirota on respiratory symptoms and influenza vaccination immune response: a randomized, double‐blind, placebo‐controlled trial in healthy elderly nursing home
residents. The American journal of clinical nutrition 2012;95:1165‐71.
13 West NP, Cripps AW. Are vaccination models suitable to determine whether probiotics have beneficial health effects in the general population? Human vaccines & immunotherapeutics 2013;9:621‐4.
14 Yaqoob P. Ageing, immunity and influenza: a role for probiotics? The Proceedings of the Nutrition
Society 2014;73:309‐17. 15 van Baarlen P, Troost F, van der Meer C, Hooiveld G, Boekschoten M, Brummer RJ, et al. Human
mucosal in vivo transcriptome responses to three lactobacilli indicate how probiotics may modulate
human cellular pathways. Proc Natl Acad Sci U S A 2011;108:4562‐9. doi: 10.1073/pnas.1000079107. Epub 2010 Sep 7.
16 van Baarlen P, Troost FJ, van Hemert S, van der Meer C, de Vos WM, de Groot PJ, et al. Differential NF‐
kappaB pathways induction by Lactobacillus plantarum in the duodenum of healthy humans correlating with immune tolerance. Proc Natl Acad Sci U S A 2009;106:2371‐6. doi: 10.1073/pnas.0809919106.
Epub 2009 Feb 3.
17 van Baarlen P, Troost FJ, van Hemert S, van der Meer C, de Vos WM, de Groot PJ, et al. Differential NF‐kappaB pathways induction by Lactobacillus plantarum in the duodenum of healthy humans correlating
with immune tolerance. Proc Natl Acad Sci U S A 2009;106:2371‐6.
Chapter 4
96
18 Lee OY, Kang DH, Lee DH, Chung IK, Jang JY, Kim JI, et al. A comparative study of DA‐9601 and
misoprostol for prevention of NSAID‐associated gastroduodenal injury in patients undergoing chronic NSAID treatment. Archives of pharmacal research 2014.
19 Mokhtare M, Valizadeh SM, Emadian O. Lower Gastrointestinal Bleeding due to Non‐Steroid Anti‐
Inflammatory Drug‐Induced Colopathy Case Report and Literature Review. Middle East journal of digestive diseases 2013;5:107‐11.
20 Tomita T, Sadakata H, Tamura M, Matsui H. Indomethacin‐induced generation of reactive oxygen
species leads to epithelial cell injury before the formation of intestinal lesions in mice. Journal of physiology and pharmacology : an official journal of the Polish Physiological Society 2014;65:435‐40.
21 Fornai M, Antonioli L, Colucci R, Pellegrini C, Giustarini G, Testai L, et al. NSAID‐induced enteropathy:
are the currently available selective COX‐2 inhibitors all the same? The Journal of pharmacology and experimental therapeutics 2014;348:86‐95.
22 Tanaka A, Hase S, Miyazawa T, Ohno R, Takeuchi K. Role of cyclooxygenase (COX)‐1 and COX‐2
inhibition in nonsteroidal anti‐inflammatory drug‐induced intestinal damage in rats: relation to various pathogenic events. The Journal of pharmacology and experimental therapeutics 2002;303:1248‐54.
23 Higuchi K, Umegaki E, Watanabe T, Yoda Y, Morita E, Murano M, et al. Present status and strategy of
NSAIDs‐induced small bowel injury. Journal of gastroenterology 2009;44:879‐88. 24 Kawada M, Arihiro A, Mizoguchi E. Insights from advances in research of chemically induced
experimental models of human inflammatory bowel disease. World J Gastroenterol 2007;13:5581‐93.
25 Smalley WE, Ray WA, Daugherty JR, Griffin MR. Nonsteroidal anti‐inflammatory drugs and the incidence of hospitalizations for peptic ulcer disease in elderly persons. American journal of epidemiology
1995;141:539‐45.
26 Kleerebezem M, Boekhorst J, van Kranenburg R, Molenaar D, Kuipers OP, Leer R, et al. Complete genome sequence of Lactobacillus plantarum WCFS1. Proc Natl Acad Sci U S A 2003;100:1990‐5.
27 Bjarnason I, Hayllar J, MacPherson AJ, Russell AS. Side effects of nonsteroidal anti‐inflammatory drugs
on the small and large intestine in humans. Gastroenterology 1993;104:1832‐47. 28 Troost FJ, Saris WH, Brummer RJ. Recombinant human lactoferrin ingestion attenuates indomethacin‐
induced enteropathy in vivo in healthy volunteers. Eur J Clin Nutr 2003;57:1579‐85.
29 Lin K, Kools H, de Groot PJ, Gavai AK, Basnet RK, Cheng F, et al. MADMAX ‐ Management and analysis database for multiple ~omics experiments. Journal of integrative bioinformatics 2011;8:160.
30 Dai M, Wang P, Boyd AD, Kostov G, Athey B, Jones EG, et al. Evolving gene/transcript definitions
significantly alter the interpretation of GeneChip data. Nucleic acids research 2005;33:e175. 31 Irizarry RA, Hobbs B, Collin F, Beazer‐Barclay YD, Antonellis KJ, Scherf U, et al. Exploration,
normalization, and summaries of high density oligonucleotide array probe level data. Biostatistics
(Oxford, England) 2003;4:249‐64. 32 Smyth GK. Linear models and empirical bayes methods for assessing differential expression in
microarray experiments. Statistical applications in genetics and molecular biology 2004;3:Article3.
33 Sartor MA, Tomlinson CR, Wesselkamper SC, Sivaganesan S, Leikauf GD, Medvedovic M. Intensity‐based hierarchical Bayes method improves testing for differentially expressed genes in microarray
experiments. BMC bioinformatics 2006;7:538.
34 Siezen RJ, Francke C, Renckens B, Boekhorst J, Wels M, Kleerebezem M, et al. Complete resequencing and reannotation of the Lactobacillus plantarum WCFS1 genome. J Bacteriol 2012;194:195‐6.
35 Jacobs R, Hintzen G, Kemper A, Beul K, Kempf S, Behrens G, et al. CD56bright cells differ in their KIR
repertoire and cytotoxic features from CD56dim NK cells. Eur J Immunol 2001;31:3121‐7. 36 Tarazona R, Casado JG, Delarosa O, Torre‐Cisneros J, Villanueva JL, Sanchez B, et al. Selective depletion
of CD56(dim) NK cell subsets and maintenance of CD56(bright) NK cells in treatment‐naive HIV‐1‐
seropositive individuals. J Clin Immunol 2002;22:176‐83. 37 Huang J, Jochems C, Anderson AM, Talaie T, Jales A, Madan RA, et al. Soluble CD27‐pool in humans may
contribute to T cell activation and tumor immunity. J Immunol 2013;190:6250‐8.
38 Raab M, Wang H, Lu Y, Smith X, Wu Z, Strebhardt K, et al. T cell receptor "inside‐out" pathway via signaling module SKAP1‐RapL regulates T cell motility and interactions in lymph nodes. Immunity
2010;32:541‐56.
39 Zhang Y, Wang H. Integrin signalling and function in immune cells. Immunology 2012;135:268‐75.
Effects of L. plantarum on immunity
97
40 Herren B, Burrows PD. B cell‐restricted human mb‐1 gene: expression, function, and lineage infidelity.
Immunologic research 2002;26:35‐43. 41 Bratkovic T, Rogelj B. Biology and applications of small nucleolar RNAs. Cellular and molecular life
sciences : CMLS 2011;68:3843‐51.
42 Esteller M. Non‐coding RNAs in human disease. Nature reviews Genetics 2011;12:861‐74. 43 Williams GT, Farzaneh F. Are snoRNAs and snoRNA host genes new players in cancer? Nature reviews
Cancer 2012;12:84‐8.
44 Kiss‐Laszlo Z, Henry Y, Bachellerie JP, Caizergues‐Ferrer M, Kiss T. Site‐specific ribose methylation of preribosomal RNA: a novel function for small nucleolar RNAs. Cell 1996;85:1077‐88.
45 Kiss AM, Jady BE, Bertrand E, Kiss T. Human box H/ACA pseudouridylation guide RNA machinery.
Molecular and cellular biology 2004;24:5797‐807. 46 Su H, Xu T, Ganapathy S, Shadfan M, Long M, Huang TH, et al. Elevated snoRNA biogenesis is essential
in breast cancer. Oncogene 2014;33:1348‐58.
47 Wells JM, Rossi O, Meijerink M, van BP. Epithelial crosstalk at the microbiota‐mucosal interface. ProcNatlAcadSciUSA 2011;108 Suppl 1:4607‐14.
48 Molenaar D, Bringel F, Schuren FH, de Vos WM, Siezen RJ, Kleerebezem M. Exploring Lactobacillus
plantarum genome diversity by using microarrays. J Bacteriol 2005;187:6119‐27.

Chapter 4
98
99
Chapter 5
Markers for visceral hypersensitivity in IBS
Markers for visceral hypersensitivity in patients with irritable bowel syndrome
Samefko Ludidi*, Zlatan Mujagic*, Daisy MAE Jonkers, Daniel Keszthelyi, Martine AM
Hesselink, Joanna W Kruimel, Jose M Conchillo, Ad AM Masclee
* Both authors contributed equally to the manuscript
Neurogastroenterology and Motility 2014;26:1104‐11
Chapter 5
100
Abstract
Background
Irritable bowel syndrome (IBS) is a heterogeneous disorder with visceral
hypersensitivity as important hallmark. It is not known whether IBS patients with
visceral hypersensitivity have different epidemiological and clinical characteristics
compared to IBS patients without visceral hypersensitivity. Aim of our study was to
compare in detail a large group of hyper‐ versus normosensitive IBS patients with
respect to epidemiological and clinical characteristics.
Methods
IBS patients (Rome III criteria) have been recruited for a large‐scale cohort study. All
patients form this cohort that underwent a rectal barostat procedure were included
and allocated based on those with and without visceral hypersensitivity. Patient
demographics, and symptoms were collected using questionnaires (GSRS, HADS, SF‐36)
and a 14‐day symptom diary for IBS‐related symptoms. A multivariate logistic
regression model was used to identify risk markers for having visceral hypersensitivity.
Key results
Ninety‐five normosensitive and 93 hypersensitive IBS patients participated in this study.
Hypersensitive patients had significantly higher scores for GSRS abdominal pain
(p<0.05), indigestion, reflux and constipation syndrome (all p<0.01) and IBS‐symptom
intensity, discomfort, (both p<0.05) and mean symptom composite score (p<0.01). Age,
female sex and the use of SSRI medication were significantly different between the
normo‐ and the hypersensitive IBS patients. However, after adjustment for other risk
markers, only increasing age was found to be significantly associated with lower odds
for having hypersensitivity (OR 0.97 (95% CI: 0.94; 0.99)).
Conclusion
Apart from more severe symptomatology, hypersensitive IBS patients are characterized
by significantly younger age compared to normosensitve IBS patients.
Markers for visceral hypersensitivity in IBS
101
Introduction
Irritable bowel syndrome (IBS) is a functional disorder of the gastrointestinal (GI) tract
and is characterized by altered bowel habits, associated with abdominal pain. The
diagnosis is based on Rome III criteria, and includes four predominant subtypes i.e. IBS
with diarrhoea (IBS‐D), constipation (IBS‐C), mixed (IBS‐M) and the unspecified subtype
(IBS‐U).
Patients with IBS have a heterogeneous phenotypical appearance. A multifactorial
pathophysiology is assumed to be key in this diversity. It has been hypothesized that
increased visceral perception or visceral hypersensitivity is a major pathophysiological
characteristic involved in the aetiology of IBS patients. A substantial subset of up to
60% of patients with IBS is characterized by visceral hypersensitivity, which is therefore
considered an important hallmark of IBS.1,2
Using the rectal barostat, mechanical balloon distensions are applied to the rectum,
allowing to discriminate between patients with and without visceral hypersensitivity1.
Visceral hypersensitivity comprises both hyperalgesia (increased responses to painful
stimuli) and allodynia (painful responses to non‐noxious stimuli). In addition, it has
been suggested that IBS patients with visceral hypersensitivity also exhibit increased
responses to somatic stimuli, pointing to a more generalized (somatic and visceral)
hypersensitivity in these patients.3,4 These findings however, have not been confirmed
by others.5 Since visceral hypersensitivity is frequent in IBS and increased
visceroperception in IBS patients is associated with higher severity of self‐reported
symptoms,6,7 patients with visceral hypersensitivity may represent a separate entity
within the IBS population, not only from a pathophysiological but also from a clinical
perspective. However, a more detailed characterization of potential differences in
clinical features between patients with and without visceral hypersensitivity is currently
lacking.3,8
The aim of the present study was therefore to compare demographical, psychological,
lifestyle, as well as medication‐related risk markers for having visceral hypersensitivity
in patients with IBS. We hypothesize that the female sex and severity of psychological
and gastro‐intestinal symptoms are significantly associated with having visceral
hypersensitivity.
Chapter 5
102
Materials and methods
The present study is part of a large prospective cohort study on the phenotypical and
genotypical characterization of patients with IBS, of which 126 patients had
participated in a previous study by our group2.
Subjects with IBS included in this study were seen at our outpatient department from
the Maastricht University Medical Center+ between September 2009 and June 2013. All
secondary and tertiary referral IBS patients were also seen at the motility research unit
at the Maastricht University Medical Center+.
Prior to participation, subjects had signed an informed consent and the study protocol
had been approved by the Maastricht University Medical Centre+ Committee of Ethics
and was executed according to the Declaration of Helsinki (59th general assembly of the
WMA, Seoul, South Korea, Oct. 2008). The study has been registered in the US National
Library of Medicine (http://www.clinicaltrials.gov, NCT00775060).
Patients
Between September 2009 and June 2013, IBS patients visiting the gastroenterology
outpatient clinic of Maastricht University Medical Centre, were asked to participate.
Patients with an organic disease cause were excluded. All subjects that were included
complied with Rome III criteria for IBS. The present study only included patients from
our IBS cohort who were willing to undergo a rectal barostat procedure for the
assessment of visceral perception. Patients could not participate if they were unable to
stop medication that can influence gastrointestinal motility or perception for at least
3 days prior to the test.
Furthermore, all patients that participated in the IBS cohort had filled out
questionnaires on demographics, symptoms, medical and lifestyle factors. In addition,
they kept a symptom diary for 14 days.
Rectal barostat
Participants arrived in the hospital after an overnight fast. Rectal perception was
measured using an electronic barostat (Distender II; G&J Electronics, Toronto, ON,
Canada, part: C7‐CB‐R) and a balloon of non‐compliant material (Mui Scientific,
Missisauga, ON, Canada, part: C7‐2CB‐R) was lubricated with KY‐gel (Johnsson &
Joshnsson, Longhorne, PA, USA). The procedure was executed according to our
standard protocol as previously described9. Accordingly, pain was scored, using a visual
analogue scale (VAS) ranging between 0‐100 mm. For subjects that did not complete
the full protocol, VAS‐scores for the remaining pressure steps were replenished, using
the highest VAS‐score achieved over the protocol thus far. Cut‐off for visceral
hypersensitivity was defined a VAS score of ≥20 mm at pressure step 26 mmHg.
Markers for visceral hypersensitivity in IBS
103
Furthermore, the percentage of subjects with allodynia, i.e. early pain perception in
response to non‐noxious stimuli, was calculated based on VAS >10 mm prior to the
pressure step indicative for visceral hypersensitivity (i.e. 26 mmHg) as previously
described by our group.2
Questionnaires
Within a period of 2 weeks prior to the rectal barostat, questionnaires on e.g.
demographics, lifestyle factors (smoking and drinking behaviour), stress events in
relation to the presence of symptoms, symptom onset and the use of medication were
completed. Furthermore, the presence of GI symptoms was assessed using the
validated gastrointestinal symptom rating scale (GSRS), consisting of 16 items clustered
into 5 major GI syndromes: abdominal pain (AP), reflux syndrome (RS) diarrhoea
syndrome (DS), indigestion syndrome (IS), constipation syndrome (CS).10 Anxiety and
depression were assessed using the hospital anxiety and depression scale (HADS). A
score ≥8 on either the anxiety or depression scale were indicative for the presence of
anxiety or depressive symptoms, respectively.11,12 The RAND‐36 questionnaire, which is
the validated Dutch version of the Medical Outcomes Study 36‐item Short Form Health
Survey (SF‐36),13 was used to assess generic health‐related quality of life (QoL). The SF‐
36 consists of 8 domains, all ranging between 0‐100, of which a mental (QoL‐MCS) and
physical (QoL‐PCS) composite score can be derived.14,15 Finally, IBS‐related symptoms of
discomfort, abdominal pain, bloating, flatulence, nausea as well as perceived intensity
of symptoms were scored on a 5‐point Likert‐scale between 1‐5 for 14 consecutive days
prior to the rectal barostat procedure. Subsequently, the mean, i.e. per day, symptom
composite score (MSS) was calculated (range: 1‐5), based on sum of individual
symptoms.
Data and statistical analysis
Based on barostat data, patients were defined as normosensitive (IBSNORM) or
hypersensitive (IBSHYP) to rectal distension. Data were analysed for normality using a
normal probability plot. Subsequently, descriptives are presented as mean or
percentages as appropriate, for the whole group of IBS patients (IBSTOTAL) as well as for
the two IBS subgroups. Dichotomous data were analysed using a Chi‐square test,
continuous and ordinal data were analysed using an independent t‐test.
Next, a multivariate logistic regression model was used to identify risk markers for
having visceral hypersensitivity. The following variables were included in the model: I.
demographical characteristics (i.e. age, sex, BMI, IBS‐subtype and symptom duration) II.
psychological symptoms (i.e. anxiety and depressive symptoms) III. lifestyle factors (i.e.
smoking history and use of alcohol) and IV. the use of medication (i.e. NSAID and SSRI).
Adjusted data were shown as odds ratios (OR) and 95% confidence intervals (CI).
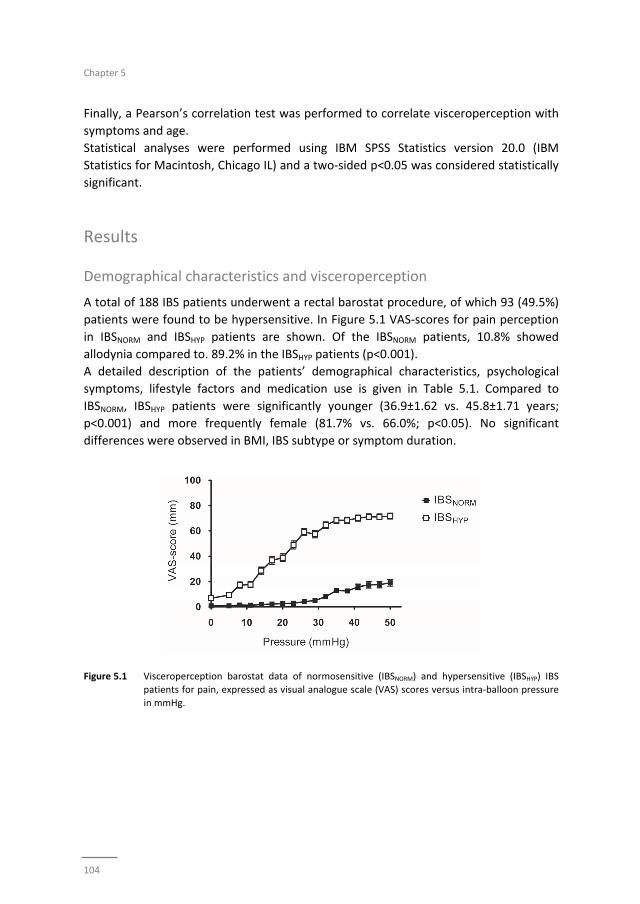
Chapter 5
104
Finally, a Pearson’s correlation test was performed to correlate visceroperception with
symptoms and age.
Statistical analyses were performed using IBM SPSS Statistics version 20.0 (IBM
Statistics for Macintosh, Chicago IL) and a two‐sided p<0.05 was considered statistically
significant.
Results
Demographical characteristics and visceroperception
A total of 188 IBS patients underwent a rectal barostat procedure, of which 93 (49.5%)
patients were found to be hypersensitive. In Figure 5.1 VAS‐scores for pain perception
in IBSNORM and IBSHYP patients are shown. Of the IBSNORM patients, 10.8% showed
allodynia compared to. 89.2% in the IBSHYP patients (p<0.001).
A detailed description of the patients’ demographical characteristics, psychological
symptoms, lifestyle factors and medication use is given in Table 5.1. Compared to
IBSNORM, IBSHYP patients were significantly younger (36.9±1.62 vs. 45.8±1.71 years;
p<0.001) and more frequently female (81.7% vs. 66.0%; p<0.05). No significant
differences were observed in BMI, IBS subtype or symptom duration.
Figure 5.1 Visceroperception barostat data of normosensitive (IBSNORM) and hypersensitive (IBSHYP) IBS
patients for pain, expressed as visual analogue scale (VAS) scores versus intra‐balloon pressure
in mmHg.
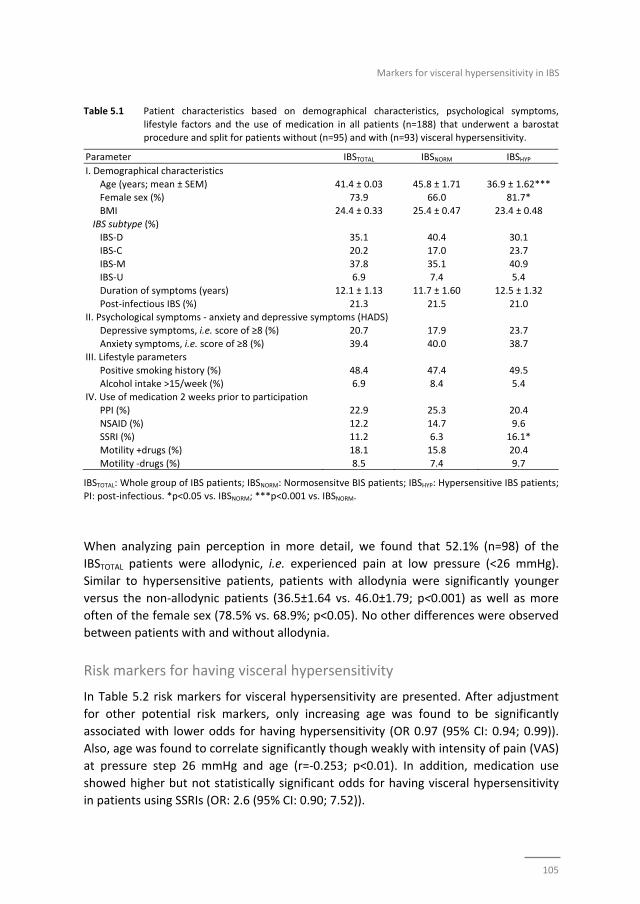
Markers for visceral hypersensitivity in IBS
105
Table 5.1 Patient characteristics based on demographical characteristics, psychological symptoms,
lifestyle factors and the use of medication in all patients (n=188) that underwent a barostat procedure and split for patients without (n=95) and with (n=93) visceral hypersensitivity.
Parameter IBSTOTAL IBSNORM IBSHYP
I. Demographical characteristics
Age (years; mean ± SEM) 41.4 ± 0.03 45.8 ± 1.71 36.9 ± 1.62*** Female sex (%) 73.9 66.0 81.7*
BMI 24.4 ± 0.33 25.4 ± 0.47 23.4 ± 0.48
IBS subtype (%) IBS‐D 35.1 40.4 30.1
IBS‐C 20.2 17.0 23.7
IBS‐M 37.8 35.1 40.9 IBS‐U 6.9 7.4 5.4
Duration of symptoms (years) 12.1 ± 1.13 11.7 ± 1.60 12.5 ± 1.32
Post‐infectious IBS (%) 21.3 21.5 21.0 II. Psychological symptoms ‐ anxiety and depressive symptoms (HADS)
Depressive symptoms, i.e. score of ≥8 (%) 20.7 17.9 23.7
Anxiety symptoms, i.e. score of ≥8 (%) 39.4 40.0 38.7 III. Lifestyle parameters
Positive smoking history (%) 48.4 47.4 49.5
Alcohol intake >15/week (%) 6.9 8.4 5.4 IV. Use of medication 2 weeks prior to participation
PPI (%) 22.9 25.3 20.4
NSAID (%) 12.2 14.7 9.6 SSRI (%) 11.2 6.3 16.1*
Motility +drugs (%) 18.1 15.8 20.4
Motility ‐drugs (%) 8.5 7.4 9.7
IBSTOTAL: Whole group of IBS patients; IBSNORM: Normosensitve BIS patients; IBSHYP: Hypersensitive IBS patients; PI: post‐infectious. *p<0.05 vs. IBSNORM; ***p<0.001 vs. IBSNORM.
When analyzing pain perception in more detail, we found that 52.1% (n=98) of the
IBSTOTAL patients were allodynic, i.e. experienced pain at low pressure (<26 mmHg).
Similar to hypersensitive patients, patients with allodynia were significantly younger
versus the non‐allodynic patients (36.5±1.64 vs. 46.0±1.79; p<0.001) as well as more
often of the female sex (78.5% vs. 68.9%; p<0.05). No other differences were observed
between patients with and without allodynia.
Risk markers for having visceral hypersensitivity
In Table 5.2 risk markers for visceral hypersensitivity are presented. After adjustment
for other potential risk markers, only increasing age was found to be significantly
associated with lower odds for having hypersensitivity (OR 0.97 (95% CI: 0.94; 0.99)).
Also, age was found to correlate significantly though weakly with intensity of pain (VAS)
at pressure step 26 mmHg and age (r=‐0.253; p<0.01). In addition, medication use
showed higher but not statistically significant odds for having visceral hypersensitivity
in patients using SSRIs (OR: 2.6 (95% CI: 0.90; 7.52)).
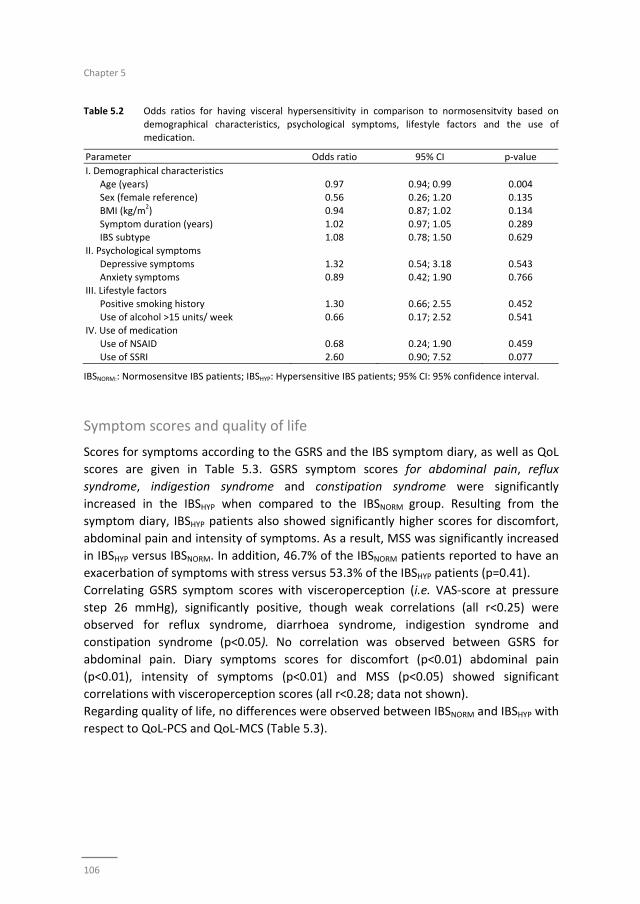
Chapter 5
106
Table 5.2 Odds ratios for having visceral hypersensitivity in comparison to normosensitvity based on
demographical characteristics, psychological symptoms, lifestyle factors and the use of medication.
Parameter Odds ratio 95% CI p‐value
I. Demographical characteristics
Age (years) 0.97 0.94; 0.99 0.004 Sex (female reference) 0.56 0.26; 1.20 0.135
BMI (kg/m2) 0.94 0.87; 1.02 0.134
Symptom duration (years) 1.02 0.97; 1.05 0.289 IBS subtype 1.08 0.78; 1.50 0.629
II. Psychological symptoms
Depressive symptoms 1.32 0.54; 3.18 0.543 Anxiety symptoms 0.89 0.42; 1.90 0.766
III. Lifestyle factors
Positive smoking history 1.30 0.66; 2.55 0.452 Use of alcohol >15 units/ week 0.66 0.17; 2.52 0.541
IV. Use of medication
Use of NSAID 0.68 0.24; 1.90 0.459 Use of SSRI 2.60 0.90; 7.52 0.077
IBSNORM:: Normosensitve IBS patients; IBSHYP: Hypersensitive IBS patients; 95% CI: 95% confidence interval.
Symptom scores and quality of life
Scores for symptoms according to the GSRS and the IBS symptom diary, as well as QoL
scores are given in Table 5.3. GSRS symptom scores for abdominal pain, reflux
syndrome, indigestion syndrome and constipation syndrome were significantly
increased in the IBSHYP when compared to the IBSNORM group. Resulting from the
symptom diary, IBSHYP patients also showed significantly higher scores for discomfort,
abdominal pain and intensity of symptoms. As a result, MSS was significantly increased
in IBSHYP versus IBSNORM. In addition, 46.7% of the IBSNORM patients reported to have an
exacerbation of symptoms with stress versus 53.3% of the IBSHYP patients (p=0.41).
Correlating GSRS symptom scores with visceroperception (i.e. VAS‐score at pressure
step 26 mmHg), significantly positive, though weak correlations (all r<0.25) were
observed for reflux syndrome, diarrhoea syndrome, indigestion syndrome and
constipation syndrome (p<0.05). No correlation was observed between GSRS for
abdominal pain. Diary symptoms scores for discomfort (p<0.01) abdominal pain
(p<0.01), intensity of symptoms (p<0.01) and MSS (p<0.05) showed significant
correlations with visceroperception scores (all r<0.28; data not shown).
Regarding quality of life, no differences were observed between IBSNORM and IBSHYP with
respect to QoL‐PCS and QoL‐MCS (Table 5.3).
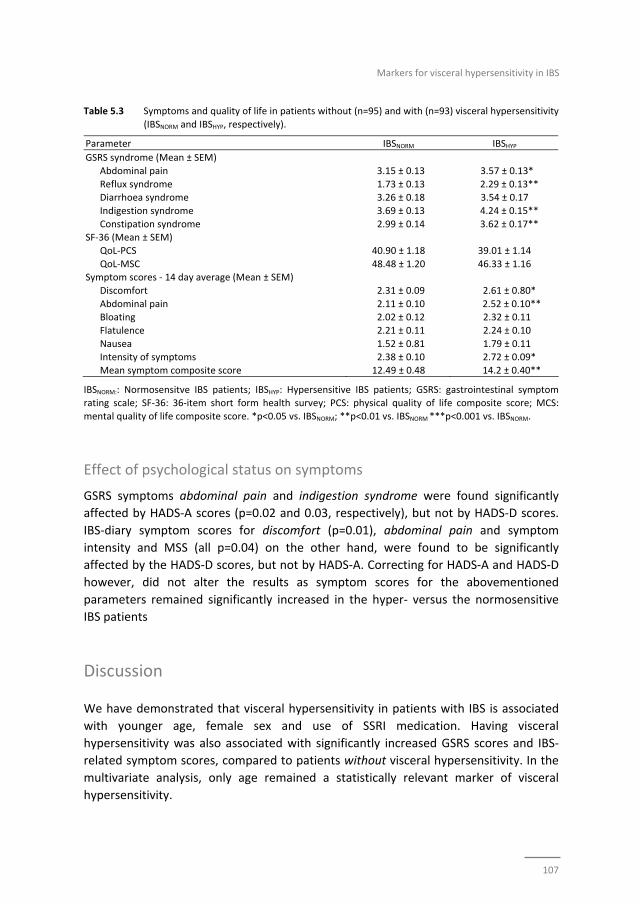
Markers for visceral hypersensitivity in IBS
107
Table 5.3 Symptoms and quality of life in patients without (n=95) and with (n=93) visceral hypersensitivity
(IBSNORM and IBSHYP, respectively).
Parameter IBSNORM IBSHYP
GSRS syndrome (Mean ± SEM)
Abdominal pain 3.15 ± 0.13 3.57 ± 0.13*
Reflux syndrome 1.73 ± 0.13 2.29 ± 0.13** Diarrhoea syndrome 3.26 ± 0.18 3.54 ± 0.17
Indigestion syndrome 3.69 ± 0.13 4.24 ± 0.15**
Constipation syndrome 2.99 ± 0.14 3.62 ± 0.17** SF‐36 (Mean ± SEM)
QoL‐PCS 40.90 ± 1.18 39.01 ± 1.14
QoL‐MSC 48.48 ± 1.20 46.33 ± 1.16 Symptom scores ‐ 14 day average (Mean ± SEM)
Discomfort 2.31 ± 0.09 2.61 ± 0.80*
Abdominal pain 2.11 ± 0.10 2.52 ± 0.10** Bloating 2.02 ± 0.12 2.32 ± 0.11
Flatulence 2.21 ± 0.11 2.24 ± 0.10
Nausea 1.52 ± 0.81 1.79 ± 0.11 Intensity of symptoms 2.38 ± 0.10 2.72 ± 0.09*
Mean symptom composite score 12.49 ± 0.48 14.2 ± 0.40**
IBSNORM:: Normosensitve IBS patients; IBSHYP: Hypersensitive IBS patients; GSRS: gastrointestinal symptom rating scale; SF‐36: 36‐item short form health survey; PCS: physical quality of life composite score; MCS:
mental quality of life composite score. *p<0.05 vs. IBSNORM; **p<0.01 vs. IBSNORM ***p<0.001 vs. IBSNORM.
Effect of psychological status on symptoms
GSRS symptoms abdominal pain and indigestion syndrome were found significantly
affected by HADS‐A scores (p=0.02 and 0.03, respectively), but not by HADS‐D scores.
IBS‐diary symptom scores for discomfort (p=0.01), abdominal pain and symptom
intensity and MSS (all p=0.04) on the other hand, were found to be significantly
affected by the HADS‐D scores, but not by HADS‐A. Correcting for HADS‐A and HADS‐D
however, did not alter the results as symptom scores for the abovementioned
parameters remained significantly increased in the hyper‐ versus the normosensitive
IBS patients
Discussion
We have demonstrated that visceral hypersensitivity in patients with IBS is associated
with younger age, female sex and use of SSRI medication. Having visceral
hypersensitivity was also associated with significantly increased GSRS scores and IBS‐
related symptom scores, compared to patients without visceral hypersensitivity. In the
multivariate analysis, only age remained a statistically relevant marker of visceral
hypersensitivity.
Chapter 5
108
Hypersensitive patients were more frequently younger of age when compared to
normosensitive IBS patients. Given the fact that symptom duration was not significantly
different among hyper‐ and normosensitive patients, the patients with visceral
hypersensitivity have presented at a younger age. Previous data point to a decline in
visceral pain perception with aging, showing higher pain thresholds to rectal distension
in older (i.e. 86±4 years) compared to younger (i.e. 26±1 years) healthy subjects.16 Pain
perception to lower range pressure distensions points to an allodynic type response.
Most patient in the hypersensitive group also had allodynia. It has been observed that
ageing results in a decrease in the number of sensory neurons in the intestine.17,18 This
may account, at least in part, for the difference in age between the hyper‐ and
normosensitive group. Anticipatory responses on the other hand, may also contribute.
Pain sensitivity in general, but also visceral hypersensitivity has been associated with an
increased tendency to report symptoms,19 pointing to involvement of central
mechanisms, e.g. altered coping and potential and psychological factors such as anxiety
in symptom presentation in IBS.20,21 In line with these observations, we recently
demonstrated that dysfunctional cognitions, which are related to coping,
independently affect IBS symptomatology.22 Accordingly, a decreased perceptual
response to stimuli may occur over time. As previously described this is most likely due
to adapting coping strategies and habituation.20,23 Although desensitization over time
could also have accounted for the significant age discrepancy in our study population
(i.e. normo‐ versus hypersensitives), symptom duration was not different between the
two groups. Therefore, we assume that hypersensitive patients have a different
underlying pathophysiology, not necessarily only pain‐associated anticipation as
proposed by Dorn et al. with altered coping mechanisms over time19.
The hypersensitive IBS patients were not only significantly younger but also more
frequently female. Concerning gender differences, some groups have observed higher
responses to painful stimuli (i.e. lower threshold or tolerance) in women compared to
men,24 which may account for the female predominance in the hypersensitive group.
The influence of sex hormones may give rise to such differences between women and
men. Accounting for menstrual cycle when analysing visceral sensitivity could have
given better insight in the potential association between sex hormones and visceral
sensitivity. Unfortunately, these data were not available in our population from daily
clinical practice. After correction for potentially confounding factors in the multivariate
model female sex was no longer found to be a risk marker for visceral hypersensitivity
in our IBS population.
Alcohol intake and smoking are well‐known lifestyle risk factors associated with several
gastrointestinal and liver diseases and carcinogenesis. With regard to IBS, several
studies have reported that lifestyle factors are associated with severity of
symptoms.25‐28
Markers for visceral hypersensitivity in IBS
109
Previously, we have observed that after acute alcohol intake intestinal permeability in
healthy subjects increases.29 Increased intestinal permeability has been related to
symptom severity and may contribute to visceral hypersensitivity.30 We evaluated
whether alcohol and smoking behaviour were associated with visceral perception, but
could not find significant associations between these risk markers and visceral pain
perception.
A subset of IBS patients develops symptoms following acute gastroenteritis.31 This
specific form of IBS is referred to as post‐infectious (PI) IBS. PI‐IBS is typically
characterized by low‐grade inflammation,32 which may contribute to the development
of pain symptoms.33 In the present study, we used a questionnaire as a screening tool
for IBS including questions related to PI‐IBS. No differences were observed in PI‐IBS
prevalence between hyper and normosensitive patients (20 vs. 21%, respectively).
Percentages we found are within the range of those observed in other studies and
cover the range in which patients report IBS symptom onset, following acute
gastroenteritis.32,34
Anxiety and depression are more prevalent among IBS patients compared to control
subjects. Several studies have shown that 20‐30% of IBS patients have depressive
symptoms and 15‐45% anxiety symptoms.22,35 Associations have been found between
anxiety and depression and the severity of reported symptoms in IBS.36‐38 Previously,
Dorn et al. found that IBS patients with higher scores on psychometric scales for anxiety
and depression have an increased tendency to report symptoms during the barostat
procedure.19 Although we compared a substantial number of IBS patients, psychological
distress as measured with the HADS was equally distributed among patients with and
without visceral hypersensitivity. Neither did absolute scores for HADS‐A and HADS‐D
differ between the normosensitive versus the hypersensitive patients nor did intensity
of pain correlate with HADS score (data not shown). Based on our data we assume that
anxiety and depression are likely to be associated with having IBS per se, but not with
having visceral hypersensitivity.
Concerning medication, use of SSRI was more frequent among the hypersensitive
compared to the normosensitive patients. This was statistically significant in the
univariate analysis (16.1% vs. 6.3%, respectively; p<0.05) but not in the multivariate
analysis (p=0.077). SSRI medication is more frequently prescribed among the IBS
population compared to the general population due to an increased prevalence of
anxiety and depression in IBS.22,35 On the other hand, SSRI’s are also prescribed for
control of abdominal symptoms, especially pain.39 As symptoms are more pronounced
in hypersensitive patients, as shown by GSRS and symptom diary scores, this may
account for higher percentage of SSRI users in the hypersensitive group.
Chapter 5
110
Hypersensitive IBS patients represent a patient group with more pronounced
symptoms during provocation (mechanical distension) with up to 90% also with early
onset of pain, referred to as allodynia. Previous studies indicate that pain perception
during provocation not necessarily correlates with symptom scores in daily life and
Posserud et al. previously demonstrated that GSRS scores only moderately correlated
with pain thresholds assessed by the rectal barostat7. Sabate et al. found no correlation
between pain thresholds after rectal distensions and IBS symptom severity.40 In a
previous study by our group, we demonstrated that IBS symptoms were increased in
patients with visceral hypersensitivity but not in those without hypersensitivity.6 In the
present study also symptoms according to the GSRS (i.e. abdominal pain, constipation
syndrome, reflux syndrome and indigestion syndrome) were significantly increased in
the hypersensitive IBS patients. Of these symptoms, constipation, reflux and indigestion
syndrome weakly correlated with visceral sensitivity thresholds. Also with regards to
the IBS symptom diary scores, we only found weak correlations (i.e. for discomfort,
abdominal pain, intensity of symptoms and mean symptom score). In this regard we
should realize that the barostat is a symptom provocation test that measures threshold
and intensity of pain in response to stimulation. With scores as GSRS and with diaries,
reporting pain retrospectively (e.g. at the end of the day when using a diary) may give
rise to recall bias. Although abdominal pain and indigestion syndrome (derived from the
GSRS) were significantly affected by the presence of anxiety symptoms (HADS) and
discomfort, abdominal pain, intensity of symptoms and MSS, were significantly affected
by the presence of depressive symptoms, Correction for psychological comorbidity
(HADS‐A and HADS‐D) did not alter the symptom scores in hypersensitive IBS patients,
nor the difference between hyper‐ and normosensitive patients. This observation
supports the concept that not only visceroperception but also altered psychological
status affects symptom generation in IBS, supporting a role of the brain‐gut axis in
these patients.
In conclusion, we have compared a substantial group of IBS patients, with and without
visceral hypersensitivity in search of patient characteristics and markers for visceral
hypersensitivity. Our data show that IBS patients with visceral hypersensitivity are
significantly younger and report significantly increased intensity of gastrointestinal
symptoms, but no other characteristics or markers could be discerned.
Markers for visceral hypersensitivity in IBS
111
References
1. Mertz H, Naliboff B, Munakata J, Niazi N, Mayer EA. Altered rectal perception is a biological marker of patients with irritable bowel syndrome. Gastroenterology. 1995;109: 40‐52.
2. Ludidi S, Conchillo JM, Keszthelyi D, Van Avesaat M, Kruimel JW, Jonkers DM, Masclee AA. Rectal
hypersensitivity as hallmark for irritable bowel syndrome: defining the optimal cutoff. Neurogastroenterol Motil. 2012;24:729‐33.
3. Piche M, Arsenault M, Poitras P, Rainville P, Bouin M. Widespread hypersensitivity is related to altered
pain inhibition processes in irritable bowel syndrome. Pain. 2010;148:49‐58. 4. Zhou Q, Fillingim RB, Riley JL, 3rd, Malarkey WB, Verne GN. Central and peripheral hypersensitivity in
the irritable bowel syndrome. Pain. 2010;148:454‐61.
5. Whitehead WE, Holtkotter B, Enck P, Hoelzl R, Holmes KD, Anthony J, Shabsin HS, Schuster MM. Tolerance for rectosigmoid distention in irritable bowel syndrome. Gastroenterology. 1990;98:1187‐92.
6. van der Veek PP, Van Rood YR, Masclee AA. Symptom severity but not psychopathology predicts
visceral hypersensitivity in irritable bowel syndrome. Clin Gastroenterol Hepatol. 2008;6:321‐8. 7. Posserud I, Syrous A, Lindstrom L, Tack J, Abrahamsson H, Simren M. Altered rectal perception in
irritable bowel syndrome is associated with symptom severity. Gastroenterology. 2007;133:1113‐23.
8. Zhou Q, Verne GN. New insights into visceral hypersensitivity‐‐clinical implications in IBS. Nat Rev Gastroenterol Hepatol. 2011;8:349‐55.
9. Ludidi S, Conchillo JM, Keszthelyi D, Koning CJ, Vanhoutvin SA, Lindsey PJ, Leufkens AM, Kruimel JW,
Jonkers DM, Masclee AA. Does meal ingestion enhance sensitivity of visceroperception assessment in irritable bowel syndrome? Neurogastroenterol Motil. 2012;24:47‐53, e3.
10. Svedlund J, Sjodin I, Dotevall G. GSRS‐‐a clinical rating scale for gastrointestinal symptoms in patients
with irritable bowel syndrome and peptic ulcer disease. Dig Dis Sci 1988;33:129‐34. 11. Zigmond AS, Snaith RP. The hospital anxiety and depression scale. Acta Psychiatr Scand. 1983;67:
361‐70.
12. Bjelland I, Dahl AA, Haug TT, Neckelmann D. The validity of the Hospital Anxiety and Depression Scale. An updated literature review. J Psychosom Res. 2002;52:69‐77.
13. Zee vd. Het meten van de algemene gezondheidstoestand met de RAND‐36, een handleiding
[Assessment of general health status with the RAND‐36; guidebook]. 1993. 14. Creed F, Ratcliffe J, Fernandez L, Tomenson B, Palmer S, Rigby C, Guthrie E, Read N, Thompson D.
Health‐related quality of life and health care costs in severe, refractory irritable bowel syndrome. Ann
Intern Med. 2001;134:860‐8. 15. Farivar SS, Cunningham WE, Hays RD. Correlated physical and mental health summary scores for the
SF‐36 and SF‐12 Health Survey, V.I. Health Qual Life Outcomes 2007;5:54.
16. Lagier E, Delvaux M, Vellas B, Fioramonti J, Bueno L, Albarede JL, Frexinos J. Influence of age on rectal tone and sensitivity to distension in healthy subjects. Neurogastroenterol Motil. 1999;11:101‐7.
17. Gabella G. Fall in the number of myenteric neurons in aging guinea pigs. Gastroenterology. 1989;96:
1487‐93. 18. Meciano Filho J, Carvalho VC, de Souza RR. Nerve cell loss in the myenteric plexus of the human
esophagus in relation to age: a preliminary investigation. Gerontology. 1995;41:18‐21.
19. Dorn SD, Palsson OS, Thiwan SI, Kanazawa M, Clark WC, van Tilburg MA, Drossman DA, Scarlett Y, Levy RL, Ringel Y, Crowell MD, Olden KW, Whitehead WE. Increased colonic pain sensitivity in irritable bowel
syndrome is the result of an increased tendency to report pain rather than increased neurosensory
sensitivity. Gut. 2007;56:1202‐9. 20. Aziz Q. Visceral hypersensitivity: fact or fiction. Gastroenterology. 2006;131:661‐4.
21. Fichna J, Storr MA. Brain‐Gut Interactions in IBS. Front Pharmacol. 2012;3:127.
22. Thijssen AY, Jonkers DM, Leue C, van der Veek PP, Vidakovic‐Vukic M, van Rood YR, Clemens CH, Masclee AA. Dysfunctional cognitions, anxiety and depression in irritable bowel syndrome. J Clin
Gastroenterol. 2010;44:e236‐41.
23. Naliboff BD, Berman S, Suyenobu B, Labus JS, Chang L, Stains J, Mandelkern MA, Mayer EA. Longitudinal change in perceptual and brain activation response to visceral stimuli in irritable bowel syndrome
patients. Gastroenterology 2006; 131:352‐365.
Chapter 5
112
24. Unruh AM. Gender variations in clinical pain experience. Pain. 1996;65:123‐67.
25. Dong L, Dingguo L, Xiaoxing X, Hanming L. An epidemiologic study of irritable bowel syndrome in adolescents and children in China: a school‐based study. Pediatrics. 2005;116:e393‐6.
26. Reding KW CK, Jarrett ME, Eugenio MD, Heitkemper MM. Relationship between patterns of alcohol
consumption and gastrointestinal symptoms among patients with irritable bowel syndrome. Am J Gastroenterol. 2013;108:270‐6.
27. Mearin F, Badía X, Balboa A, Baró E, Caldwell E, Cucala M, Díaz‐Rubio M, Fueyo A, Ponce J, Roset M,
Talley NJ. Irritable bowel syndrome prevalence varies enormously depending on the employed diagnostic criteria: comparison of Rome II versus previous criteria in a general population. Scand J
Gastroenterol 2001;36:1155‐61.
28. Li FX, Patten SB, Hilsden RJ, Sutherland LR. Irritable bowel syndrome and health‐related quality of life: a population‐based study in Calgary, Alberta. Can J Gastroenterol. 2003; 17: 259‐263.
29. Elhaseen Elamin DJ, Freddy Troost, Jan Dekker, Ad Masclee. Tu1352 Moderate Dosage of Ethanol
Increases Small and Large Intestinal Permeability in Healthy Volunteers. Gastroenterology. 2012; 142. 30. Zhou Q, Zhang B, Verne GN. Intestinal membrane permeability and hypersensitivity in the irritable
bowel syndrome. Pain. 2009;146:41‐6.
31. Ghoshal UC, Ranjan P. Post‐infectious irritable bowel syndrome: the past, the present and the future. J Gastroenterol Hepatol. 2011;26 Suppl 3:94‐101.
32. Spiller R, Lam C. An Update on Post‐infectious Irritable Bowel Syndrome: Role of Genetics, Immune
Activation, Serotonin and Altered Microbiome. J Neurogastroenterol Motil 2012;18:258‐68. 33. Gecse K, Róka R, Ferrier L, Leveque M, Eutamene H, Cartier C, Ait‐Belgnaoui A, Rosztóczy A, Izbéki F,
Fioramonti J, Wittmann T, Bueno L. Increased faecal serine protease activity in diarrhoeic IBS patients: a
colonic lumenal factor impairing colonic permeability and sensitivity. Gut. 2008;57:591‐9. 34. Longstreth GF, Hawkey CJ, Mayer EA, Jones RH, Naesdal J, Wilson IK, Peacock RA, Wiklund IK.
Characteristics of patients with irritable bowel syndrome recruited from three sources: implications for
clinical trials. Aliment Pharmacol Ther 2001;15:959‐64. 35. Lee S WJ, Ma YL, Tsang A, Guo WJ, Sung J. Irritable bowel syndrome is strongly associated with
generalized anxiety disorder: a community study. Aliment Pharmacol Ther 2009;30:643‐51.
36. Surdea‐Blaga T, Baban A, Dumitrascu DL. Psychosocial determinants of irritable bowel syndrome. World journal of gastroenterology : WJG. 2012;18:616‐26.
37. Labus JS, Bolus R, Chang L, Wiklund I, Naesdal J, Mayer EA, Naliboff BD. The Visceral Sensitivity Index:
development and validation of a gastrointestinal symptom‐specific anxiety scale. Aliment Pharmacol Ther. 2004;20:89‐97.
38. Jerndal P, Ringström G, Agerforz P, Karpefors M, Akkermans LM, Bayati A, Simrén M. Gastrointestinal‐
specific anxiety: an important factor for severity of GI symptoms and quality of life in IBS. Neurogastroenterol Motil. 2010;22:646‐e179.
39. Ruepert L, Quartero AO, de Wit NJ, van der Heijden GJ, Rubin G, Muris JW. Bulking agents,
antispasmodics and antidepressants for the treatment of irritable bowel syndrome. The Cochrane database of systematic reviews 2011: CD003460.
40. Sabate JM VM, Mion F, Siproudhis L, Ducrotte P, Zerbib F, Grimaud JC, Dapoigny M, Dyard F, Coffin B.
Relationship between rectal sensitivity, symptoms intensity and quality of life in patients with irritable bowel syndrome. Aliment Pharmacol Ther. 2008;28:484‐90.

Markers for visceral hypersensitivity in IBS
113

Chapter 5
114
115
Chapter 6
Biological markers for visceral hypersensitivity in IBS
Biomarkers for visceral hypersensitivity in patients with irritable bowel syndrome
Zlatan Mujagic, Daisy MAE Jonkers, Samefko Ludidi, Daniel Keszthelyi,
Martine A Hesselink, Ruud N Kievit, Jessica F Althof, Zsa Zsa Weerts,
Joanna W Kruimel, Frederik‐Jan van Schooten, Ad AM Masclee
Submitted
Chapter 6
116
Abstract
Background
Up to 60% of patients with Irritable Bowel Syndrome (IBS) have increased visceral
perception. Intestinal inflammation, neuroendocrine activity and intraluminal
metabolic processes may contribute to the development of visceral hypersensitivity.
Previously, we found that markers that are indicative for these biological processes are
altered in IBS patients compared to healthy controls. We hypothesize that normo‐ and
hypersensitive IBS patients significantly differ in biomarker levels.
Aim
To get more insight in biological processes associated with altered visceroperception,
several faecal and plasma markers were measured in normosensitive (IBSNORM) and
hypersensitive IBS patients (IBSHYP).
Methods
IBS patients underwent a rectal barostat to assess visceral perception to pain and based
on the outcome were classified as IBSNORM or IBSHYP. Calprotectin, human β‐defensin 2 (HBD2), chromogranin A (CgA), and short chain fatty acids (SCFAs) were measured in
faeces, citrulline in plasma and serotonin and its principal metabolite
5‐hydroxyindoleacetic acid (5‐HIAA) in platelet poor plasma (PPP).
Key Results
Faecal markers and plasma citrulline were measured in 83 IBSHYP and 84 IBSNORM
patients, while PPP for the assessment of serotonin and 5‐HIAA was available (for a
subgroup, i.e.) 53 IBSHYP and 42 IBSNORM. None of the tested markers showed significant
differences between IBSHYP and IBSNORM patients. Results were not affected by
confounders, such as patient characteristics or medication use.
Conclusions
Biomarkers relating to several pathophysiological mechanism did not differ between
hypersensitive and normosensitive IBS patients. Our findings do not support a role for
the relating biological processes in hypersensitive IBS patients based on these
biomarkers.
Biomarkers for visceral hypersensitivity in IBS
117
Introduction
Visceral hypersensitivity, measured by rectal balloon distention procedures, is an
important hallmark of irritable bowel syndrome (IBS). The prevalence of visceral
hypersensitivity among IBS patients ranges between 30% and 60%.1‐5 In a previous
study we found that hypersensitive IBS patients compared to normosensitive patients
were younger, more often female, more often used selective serotonin reuptake
inhibitors (SSRI’s) and reported higher gastrointestinal (GI) symptom scores.4 The latter
implies a role of visceral hypersensitivity in symptom generation in this subgroup of
patients. However, these findings did not elucidate why some IBS patients are
hypersensitive to artificially induced intestinal stimuli, while other IBS patients are not.
Several pathophysiological factors associated with IBS, may affect nociception and
thereby contribute to visceral hypersensitivity. Increased intestinal pain perception may
result from mucosal inflammation,6‐9 alterations in intestinal neuroendocrine
activity,10,11 or from intraluminal factors such as intestinal bacteria, their metabolic
products or dietary compounds.12‐14 The link between these intestinal biological
processes and the development of visceral hypersensitivity has been investigated using
animal models.13‐15 However, data that focus on difference between patients with
versus without visceral hypersensitivity are limited.
Previously, we found that faecal calprotectin, a marker of intestinal inflammation,16,17
and faecal chromogranin A (CgA), a neuroendocrine secretory protein of the
enterochromaffin cells,18,19 were increased in IBS patients compared to healthy
controls. In addition, faecal short chain fatty acids (SCFAs) and faecal human β‐defensin
2 (HBD2), as indicators of microbial activity and host‐microbiome interaction,20‐26 were
decreased in IBS compared to healthy subjects.27 Furthermore, a decrease was found in
IBS patients versus healthy subjects for plasma 5‐hydroxyindoleacetic acid (5‐HIAA), the
principal metabolite of serotonin (5‐hydroxitryptamine, 5‐HT),11,28,29 and the ratio of 5‐
HIAA and 5‐HT.29 Yet, concentrations of 5‐HT were not altered in IBS versus controls.29
Neither were differences observed between these groups in concentrations of plasma
citrulline, which is a marker of small intestinal effective enterocyte mass30,31 and may
be seen as a surrogate marker of small bowel barrier function.32,33 Taken together,
these findings point to alterations in biological processes, such as intestinal immune
activation and neuroendocrine and microbial activity in IBS patients versus healthy
controls. However, it is not known whether these markers also differ between IBS
subgroups of normo‐ and hypersensitive subjects.
Aim of the present study was to provide more insight in biological processes associated
with the presence of visceral hypersensitivity in IBS by comparing concentrations of
individual biomarkers between IBS patients with and without visceral hypersensitivity.
Chapter 6
118
We hypothesize that concentrations of the measured biomarkers differ between
visceral normo‐ and hypersensitive IBS patients and that these alterations may provide
leads to mechanisms involved in hypersensitivity in IBS patients.
Materials and methods
The present study is part of a larger cohort study on the phenotypic and genotypic
characterization of patients with IBS (Maastricht IBS cohort). The study protocol has
been approved by the Maastricht University Medical Centre+ (MUMC+) Ethics
Committee, was executed in compliance with the revised Declaration of Helsinki (59th
general assembly of the WMA, Seoul, South Korea, Oct. 2008), and was registered in
the US National Library of Medicine (http://www.clinicaltrials.gov, NCT00775060).
Study participants
All study participants gave written informed consent prior to participation. Adult
subjects, aged 18‐75 years, diagnosed with IBS by a gastroenterologist based on the
Rome III criteria,34 were recruited via the Gastroenterology‐Hepatology outpatient
department of the MUMC+, a secondary and tertiary referral centre. When considered
indicated by the physician, GI endoscopy with biopsies, abdominal imaging by
ultrasonography or CT scan, and/or blood, breath and faecal analyses were performed
to exclude organic disease. History of abdominal surgery was considered an exclusion
criterion, with the exception of appendectomy, laparoscopic cholecystectomy or
hysterectomy. Rectal sensitivity was assessed in all IBS patients using an electronic
rectal barostat (Distender II; G&J Electronics, Toronto, ON, Canada, part: C7‐CB‐R) and a
balloon of non‐compliant material (Mui Scientific, Missisauga, ON, Canada, part: C7‐
2CB‐R). The procedure was executed according to a standardized protocol, and a VAS‐
score of ≥20 mm at pressure step 26 mmHg was used as cut‐off to define IBS patients
being viscerally normo‐ (IBSNORM) or hypersensitive to pain (IBSHYP), as described
previously.4,5 All subjects completed several questionnaires as described in detail
previously4: i.e. GI symptoms were assessed by the Gastrointestinal Symptom Rating
Scale (GSRS)35,36 and a 14‐day GI symptom diary,4,37 scores of anxiety and depression
were assessed by the Hospital Anxiety and Depression Scale (HADS)38 and the State and
Trait Anxiety Inventory (STAI),39 quality of life scores by the 36‐item Short Form Health
Survey (SF‐36),40 and the use of medication by a general questionaire.4
Analysis of biosamples
Faecal samples were collected of all subjects, aliquoted and stored at ‐80°C within
24 hours after defecation, until further analysis. Of all participants, fasting blood
samples were collected from the antecubital vein using two precooled K2EDTA tubes.
Biomarkers for visceral hypersensitivity in IBS
119
To avoid oxidative breakdown of platelets, 0,1 ml 1.4% ascorbic acid (Sigma Aldrich, St.
Louis, MO) was added to one of the tubes, to obtain platelet poor plasma (PPP)
samples after a centrifuge step. PPP samples were available for only a subgroup of
study participants. K2EDTA tubes were centrifuged at 2300g at 4°C for 10 minutes.
Supernatants (i.e. plasma and/or PPP) were aliquoted and frozen at ‐80°C until further
analysis.
Faecal and plasma markers were selected based on literature to be measured as
indicators of pathophysiological mechanisms in IBS. The markers were measured
simultaneously and in blinded conditions by a commercial partner (Medische
Laboratoria Dr. Stein & Collegues, The Netherlands), to avoid additional thawing cycles.
Calprotectin and human β‐defensin 2 (HBD2) concentrations were determined using
commercial enzyme‐linked immunosorbent assay (ELISA, Bülmann, Switserland,19 and
Immunodiagnostik AG, Germany,22 respectively), and chromogranin A using commercial
radioimmunoassay (RIA, Euro Diagnostica, Sweden).19 All test kits were used according
to manufacturers’ instructions and the procedures were described in detail
previously.19,22 Short chain fatty acids (SCFAs), i.e. acetate, propionate, butyrate,
valerate and caproate, were determined by gas chromatography‐mass spectrometry
(GCMS) according to the method described by Garciá‐Villalba et al.41 Citrulline was
measured in plasma samples by high pressure liquid chromatography (HPLC)
fluorescence detection.31 Concentration of 5‐HT and 5‐HIAA were measured in PPP
samples by a high‐performance liquid chromatography (HPLC), as described
previously.42
Data and statistical analysis
Statistical analyses were performed using IBM SPSS Statistics version 22.0 (IBM
Statistics for Windows, Armonk, New York). Data were checked for normality using a
normal probability plot. Baseline characteristics are presented as mean (±SD) or
percentages when appropriate, for both IBS groups (i.e. IBSNORM and IBSHYP).
Dichotomous data were analysed using the Chi2 test and continuous (parametric) data
using the independent t‐test. In addition, the Spearman’s rho was calculated to test the
correlation between both the scores for abdominal pain as assessed by the end‐of‐day
GI symptom diary (mean of 14‐days) and the GSRS to VAS scores at the cut‐off value of
26 mmHg intra‐balloon pressure of the rectal barostat.
To investigate differences in biomarker levels between the IBSNORM and IBSHYP groups,
the Mann Whitney U test was used (due to a left skewed distribution of the biomarker
data). A post‐hoc analysis was conducted (linear regression analysis with natural log
transformed biomarker data), to adjust the results for possible confounding effects of
age, gender, IBS subtypes, symptoms of anxiety and depression, and medication use.
Drugs that were included in the analysis were proton pump inhibitors (PPI), SSRIs,
spasmolytics, prokinetics, anti‐diarrheal drugs, laxatives, and non‐steroid anti‐
inflammatory drugs (NSAIDs).
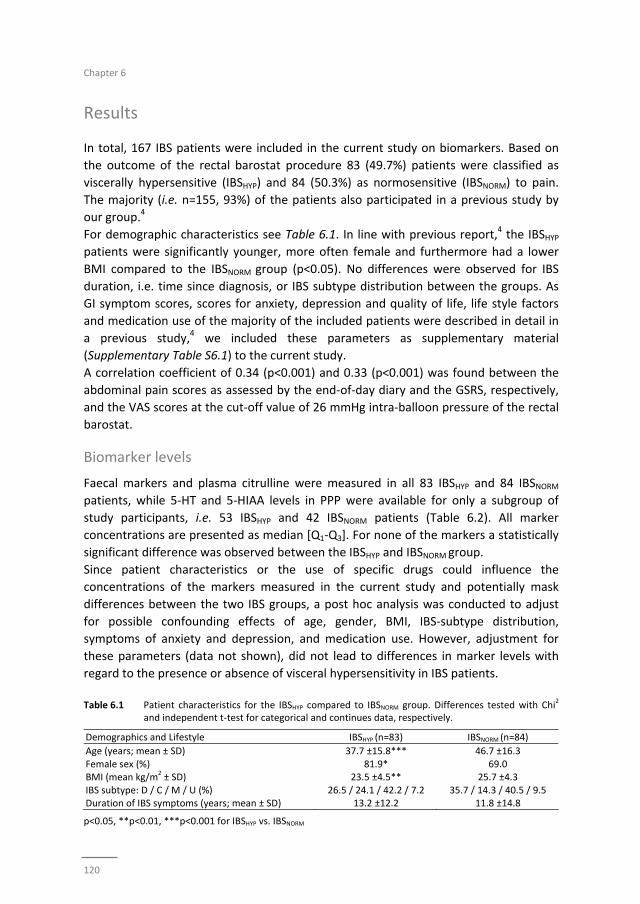
Chapter 6
120
Results
In total, 167 IBS patients were included in the current study on biomarkers. Based on
the outcome of the rectal barostat procedure 83 (49.7%) patients were classified as
viscerally hypersensitive (IBSHYP) and 84 (50.3%) as normosensitive (IBSNORM) to pain.
The majority (i.e. n=155, 93%) of the patients also participated in a previous study by
our group.4
For demographic characteristics see Table 6.1. In line with previous report,4 the IBSHYP patients were significantly younger, more often female and furthermore had a lower
BMI compared to the IBSNORM group (p<0.05). No differences were observed for IBS
duration, i.e. time since diagnosis, or IBS subtype distribution between the groups. As
GI symptom scores, scores for anxiety, depression and quality of life, life style factors
and medication use of the majority of the included patients were described in detail in
a previous study,4 we included these parameters as supplementary material
(Supplementary Table S6.1) to the current study.
A correlation coefficient of 0.34 (p<0.001) and 0.33 (p<0.001) was found between the
abdominal pain scores as assessed by the end‐of‐day diary and the GSRS, respectively,
and the VAS scores at the cut‐off value of 26 mmHg intra‐balloon pressure of the rectal
barostat.
Biomarker levels
Faecal markers and plasma citrulline were measured in all 83 IBSHYP and 84 IBSNORM
patients, while 5‐HT and 5‐HIAA levels in PPP were available for only a subgroup of
study participants, i.e. 53 IBSHYP and 42 IBSNORM patients (Table 6.2). All marker
concentrations are presented as median [Q1‐Q3]. For none of the markers a statistically
significant difference was observed between the IBSHYP and IBSNORM group.
Since patient characteristics or the use of specific drugs could influence the
concentrations of the markers measured in the current study and potentially mask
differences between the two IBS groups, a post hoc analysis was conducted to adjust
for possible confounding effects of age, gender, BMI, IBS‐subtype distribution,
symptoms of anxiety and depression, and medication use. However, adjustment for
these parameters (data not shown), did not lead to differences in marker levels with
regard to the presence or absence of visceral hypersensitivity in IBS patients.
Table 6.1 Patient characteristics for the IBSHYP compared to IBSNORM group. Differences tested with Chi
2
and independent t‐test for categorical and continues data, respectively.
p<0.05, **p<0.01, ***p<0.001 for IBSHYP vs. IBSNORM
Demographics and Lifestyle IBSHYP (n=83) IBSNORM (n=84)
Age (years; mean ± SD) 37.7 ±15.8*** 46.7 ±16.3
Female sex (%) 81.9* 69.0 BMI (mean kg/m
2 ± SD) 23.5 ±4.5** 25.7 ±4.3
IBS subtype: D / C / M / U (%) 26.5 / 24.1 / 42.2 / 7.2 35.7 / 14.3 / 40.5 / 9.5 Duration of IBS symptoms (years; mean ± SD) 13.2 ±12.2 11.8 ±14.8
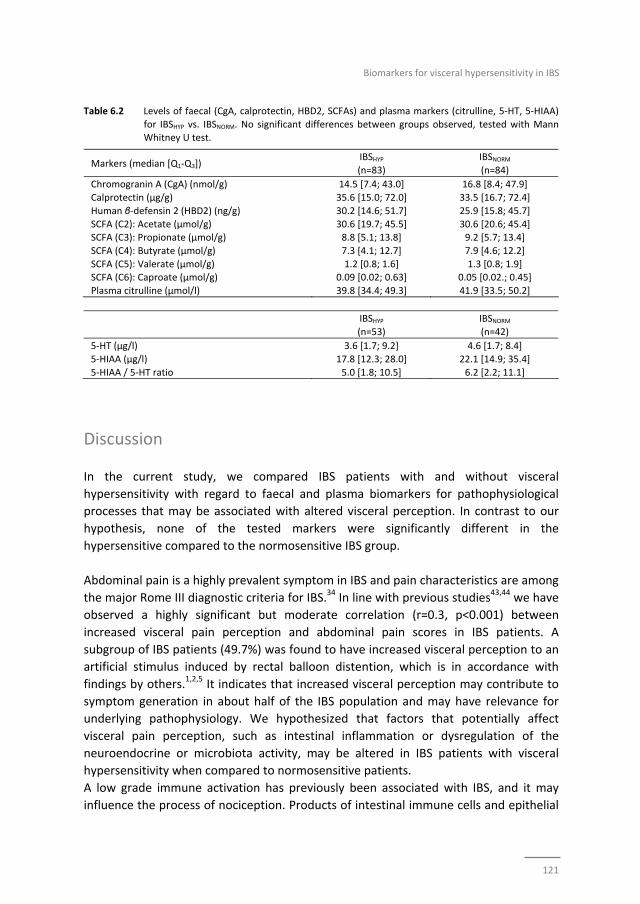
Biomarkers for visceral hypersensitivity in IBS
121
Table 6.2 Levels of faecal (CgA, calprotectin, HBD2, SCFAs) and plasma markers (citrulline, 5‐HT, 5‐HIAA)
for IBSHYP vs. IBSNORM. No significant differences between groups observed, tested with Mann Whitney U test.
IBSHYP (n=53)
IBSNORM
(n=42)
5‐HT (µg/l) 3.6 [1.7; 9.2] 4.6 [1.7; 8.4]
5‐HIAA (µg/l) 17.8 [12.3; 28.0] 22.1 [14.9; 35.4]
5‐HIAA / 5‐HT ratio 5.0 [1.8; 10.5] 6.2 [2.2; 11.1]
Discussion
In the current study, we compared IBS patients with and without visceral
hypersensitivity with regard to faecal and plasma biomarkers for pathophysiological
processes that may be associated with altered visceral perception. In contrast to our
hypothesis, none of the tested markers were significantly different in the
hypersensitive compared to the normosensitive IBS group.
Abdominal pain is a highly prevalent symptom in IBS and pain characteristics are among
the major Rome III diagnostic criteria for IBS.34 In line with previous studies43,44 we have
observed a highly significant but moderate correlation (r=0.3, p<0.001) between
increased visceral pain perception and abdominal pain scores in IBS patients. A
subgroup of IBS patients (49.7%) was found to have increased visceral perception to an
artificial stimulus induced by rectal balloon distention, which is in accordance with
findings by others.1,2,5 It indicates that increased visceral perception may contribute to
symptom generation in about half of the IBS population and may have relevance for
underlying pathophysiology. We hypothesized that factors that potentially affect
visceral pain perception, such as intestinal inflammation or dysregulation of the
neuroendocrine or microbiota activity, may be altered in IBS patients with visceral
hypersensitivity when compared to normosensitive patients.
A low grade immune activation has previously been associated with IBS, and it may
influence the process of nociception. Products of intestinal immune cells and epithelial
Markers (median [Q1‐Q3]) IBSHYP (n=83)
IBSNORM
(n=84)
Chromogranin A (CgA) (nmol/g) 14.5 [7.4; 43.0] 16.8 [8.4; 47.9]
Calprotectin (μg/g) 35.6 [15.0; 72.0] 33.5 [16.7; 72.4]
Human β‐defensin 2 (HBD2) (ng/g) 30.2 [14.6; 51.7] 25.9 [15.8; 45.7]
SCFA (C2): Acetate (μmol/g) 30.6 [19.7; 45.5] 30.6 [20.6; 45.4] SCFA (C3): Propionate (μmol/g) 8.8 [5.1; 13.8] 9.2 [5.7; 13.4]
SCFA (C4): Butyrate (μmol/g) 7.3 [4.1; 12.7] 7.9 [4.6; 12.2]
SCFA (C5): Valerate (μmol/g) 1.2 [0.8; 1.6] 1.3 [0.8; 1.9] SCFA (C6): Caproate (μmol/g) 0.09 [0.02; 0.63] 0.05 [0.02.; 0.45]
Plasma citrulline (μmol/l) 39.8 [34.4; 49.3] 41.9 [33.5; 50.2]
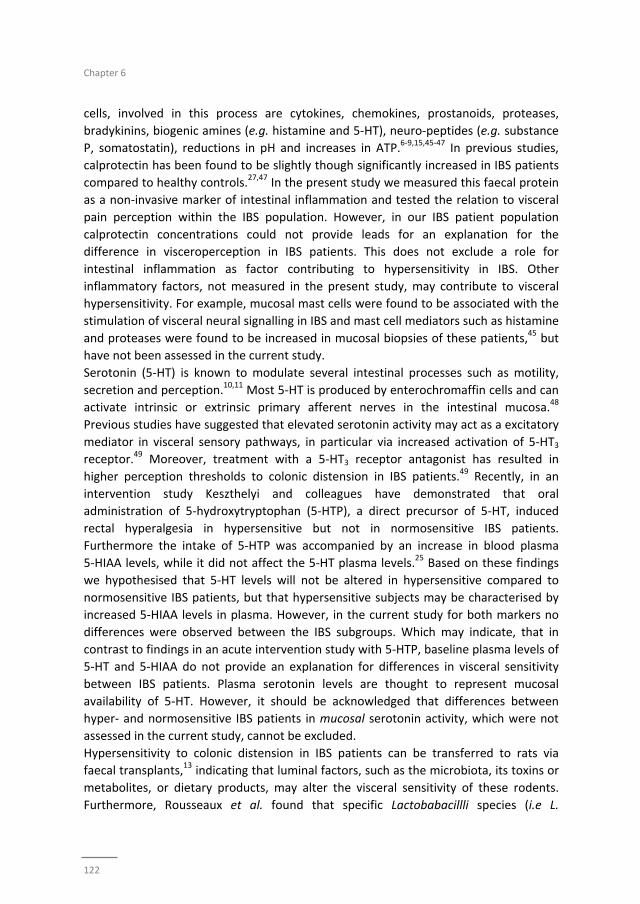
Chapter 6
122
cells, involved in this process are cytokines, chemokines, prostanoids, proteases,
bradykinins, biogenic amines (e.g. histamine and 5‐HT), neuro‐peptides (e.g. substance
P, somatostatin), reductions in pH and increases in ATP.6‐9,15,45‐47 In previous studies,
calprotectin has been found to be slightly though significantly increased in IBS patients
compared to healthy controls.27,47 In the present study we measured this faecal protein
as a non‐invasive marker of intestinal inflammation and tested the relation to visceral
pain perception within the IBS population. However, in our IBS patient population
calprotectin concentrations could not provide leads for an explanation for the
difference in visceroperception in IBS patients. This does not exclude a role for
intestinal inflammation as factor contributing to hypersensitivity in IBS. Other
inflammatory factors, not measured in the present study, may contribute to visceral
hypersensitivity. For example, mucosal mast cells were found to be associated with the
stimulation of visceral neural signalling in IBS and mast cell mediators such as histamine
and proteases were found to be increased in mucosal biopsies of these patients,45 but
have not been assessed in the current study.
Serotonin (5‐HT) is known to modulate several intestinal processes such as motility,
secretion and perception.10,11 Most 5‐HT is produced by enterochromaffin cells and can
activate intrinsic or extrinsic primary afferent nerves in the intestinal mucosa.48
Previous studies have suggested that elevated serotonin activity may act as a excitatory
mediator in visceral sensory pathways, in particular via increased activation of 5‐HT3
receptor.49 Moreover, treatment with a 5‐HT3 receptor antagonist has resulted in
higher perception thresholds to colonic distension in IBS patients.49 Recently, in an
intervention study Keszthelyi and colleagues have demonstrated that oral
administration of 5‐hydroxytryptophan (5‐HTP), a direct precursor of 5‐HT, induced
rectal hyperalgesia in hypersensitive but not in normosensitive IBS patients.
Furthermore the intake of 5‐HTP was accompanied by an increase in blood plasma
5‐HIAA levels, while it did not affect the 5‐HT plasma levels.25 Based on these findings
we hypothesised that 5‐HT levels will not be altered in hypersensitive compared to
normosensitive IBS patients, but that hypersensitive subjects may be characterised by
increased 5‐HIAA levels in plasma. However, in the current study for both markers no
differences were observed between the IBS subgroups. Which may indicate, that in
contrast to findings in an acute intervention study with 5‐HTP, baseline plasma levels of
5‐HT and 5‐HIAA do not provide an explanation for differences in visceral sensitivity
between IBS patients. Plasma serotonin levels are thought to represent mucosal
availability of 5‐HT. However, it should be acknowledged that differences between
hyper‐ and normosensitive IBS patients in mucosal serotonin activity, which were not
assessed in the current study, cannot be excluded.
Hypersensitivity to colonic distension in IBS patients can be transferred to rats via
faecal transplants,13 indicating that luminal factors, such as the microbiota, its toxins or
metabolites, or dietary products, may alter the visceral sensitivity of these rodents.
Furthermore, Rousseaux et al. found that specific Lactobabacillli species (i.e L.
Biomarkers for visceral hypersensitivity in IBS
123
acidophilus NCFM) were able to affect µ‐opiod and cannabinoid receptors in intestinal epithelial cells of rats, suggesting that the intestinal microbiota may influence visceral
perception.50 We measured faecal concentrations of HBD2, a human antimicrobial
peptide produced by intestinal epithelial cells in response to bacteria.23 Alterations in
microbiota composition may result in changes in the intestinal mucosa response
towards bacteria, possibly via HBD2. In previous studies both increased and decreased
faecal HBD2 has been observed in IBS patients compared to healthy controls.22,27
However, we did not observe any differences in HBD2 faecal concentrations between
the hyper‐ and normosensitive IBS group. We also measured several SCFAs in faecal
samples. These SCFAs are products of microbial fermentation of non‐digested
oligosaccharides in the colon and are generally regarded as beneficial for gut health.20,21
SCFAs are presumed to be a major player in maintenance of gut and immune
homeostasis.24 Furthermore, Vanhautvin et al. demonstrated that colonic
administration of butyrate, at physiologically relevant concentrations, dose‐
dependently decreases visceral sensitivity in healthy volunteers.26 The intraluminal
SCFA concentration is affected by microbiota composition as well as dietary substrates.
Our study demonstrates no significant differences in faecal SCFA concentrations
between the IBS groups, which indicates that alterations in faecal SCFA levels are not
associated with the presence of hypersensitivity in IBS patients. The intestinal
microbiota composition itself and the dietary pattern of the study subjects were not
investigated in the current study.
We previously reported that several markers (i.e. calprotectin, CgA, HBD2, the SCFAs
valerate and caproate, 5‐HIAA and the 5‐HIAA/5‐HT ratio) were significantly altered in
IBS patients compared to healthy subjects.27,29 However, in the current study no
differences were observed between the hyper‐ and normosensitive IBS patients with
regard to these markers. Thereby, intestinal biological processes, related to the tested
markers, are associated with the presence of IBS, but are not likely to play a prominent
role in the development or maintenance of visceral hypersensitivity in these patients. It
should be taken into account that the panel of tested markers is indicative for only
some of the key biological processes, which does not exclude that other factors
contribute to the presence of visceral hypersensitivity in IBS. These factors include for
example mucosal mast cell activation or mucosal cytokine release,15,45,51 alterations in
trans‐nociceptive transducer molecules (e.g. transient receptor potential (TRP) and
acid‐sensing ion channels (ASIC)),6,52 dysfunctional intestinal barrier function,53,54
and/or alterations in microbial composition,12,14 and mucosal serotonin metabolism.55
In line with the general hypothesis that the interaction between the brain and gut is
involved in the development of visceral hypersensitivity in IBS, future studies should
focus on dysregulation of mechanisms on intestinal level in combination with altered
central pain modulation and/or with psychological factors, such as stress, anxiety,
Chapter 6
124
depression or somatization.56‐58 Further research is needed to elucidate this complex
interplay between intestinal and central factors in the target population.
Conclusion
In the current study, no significant differences were found between hypersensitive and
normosensitive IBS patients with regard to the tested biomarkers: i.e. faecal
calprotectin, chromogranin A, human β‐defensin 2, and short chain fatty acids, and plasma levels of 5‐HT, 5‐HIAA, and citrulline. The set of markers we explored represents
specific pathophysiological mechanisms in IBS, such as immune activation,
neuroendocrine and microbial activity. Although further research is needed including
central and peripheral neural factors, our findings indicate that these
pathophysiological mechanisms do not play a major role in the presence of visceral
hypersensitivity in IBS patients.
Biomarkers for visceral hypersensitivity in IBS
125
References
1. Ritchie J. Pain from distension of the pelvic colon by inflating a balloon in the irritable colon syndrome. Gut. 1973;14:125‐32.
2. Mertz H, Naliboff B, Munakata J, Niazi N, Mayer EA. Altered rectal perception is a biological marker of
patients with irritable bowel syndrome. Gastroenterology. 1995;109:40‐52. 3. Piche M, Arsenault M, Poitras P, Rainville P, Bouin M. Widespread hypersensitivity is related to altered
pain inhibition processes in irritable bowel syndrome. Pain. 2010;148:49‐58.
4. Ludidi S, Mujagic Z, Jonkers D, Keszthelyi D, Hesselink M, Kruimel J, et al. Markers for visceral hypersensitivity in patients with irritable bowel syndrome. Neurogastroenterol Motil. 2014;26:1104‐11.
5. Ludidi S, Conchillo JM, Keszthelyi D, Van Avesaat M, Kruimel JW, Jonkers DM, et al. Rectal
hypersensitivity as hallmark for irritable bowel syndrome: defining the optimal cutoff. Neurogastroenterol Motil. 2012;24:729‐33, e345‐6.
6. Knowles CH, Aziz Q. Basic and clinical aspects of gastrointestinal pain. Pain. 2009;141:191‐209.
7. Basbaum AI, Bautista DM, Scherrer G, Julius D. Cellular and molecular mechanisms of pain. Cell. 2009;139:267‐84.
8. Keszthelyi D, Troost FJ, Simren M, Ludidi S, Kruimel JW, Conchillo JM, et al. Revisiting concepts of
visceral nociception in irritable bowel syndrome. Eur J Pain. 2012;16):1444‐54. 9. Keszthelyi D, Troost FJ, Jonkers DM, Helyes Z, Hamer HM, Ludidi S, et al. Alterations in mucosal
neuropeptides in patients with irritable bowel syndrome and ulcerative colitis in remission: a role in
pain symptom generation? Eur J Pain. 2013;17:1299‐306. 10. Gilet M, Eutamene H, Han H, Kim HW, Bueno L. Influence of a new 5‐HT4 receptor partial agonist,
YKP10811, on visceral hypersensitivity in rats triggered by stress and inflammation. Neurogastroenterol
Motil. 2014;26:1761‐70. 11. Keszthelyi D, Troost FJ, Masclee AA. Understanding the role of tryptophan and serotonin metabolism in
gastrointestinal function. Neurogastroenterol Motil. 2009;21:1239‐49.
12. Rajilic‐Stojanovic M, Jonkers DM, Salonen A, Hanevik K, Raes J, Jalanka J, et al. Intestinal Microbiota And Diet in IBS: Causes, Consequences, or Epiphenomena? Am J Gastroenterol. 2015;110:278‐87.
13. Crouzet L, Gaultier E, Del'Homme C, Cartier C, Delmas E, Dapoigny M, et al. The hypersensitivity to
colonic distension of IBS patients can be transferred to rats through their fecal microbiota. Neurogastroenterol Motil. 2013;25:e272‐82.
14. Kannampalli P, Pochiraju S, Chichlowski M, Berg BM, Rudolph C, Bruckert M, et al. Probiotic
Lactobacillus rhamnosus GG (LGG) and prebiotic prevent neonatal inflammation‐induced visceral hypersensitivity in adult rats. Neurogastroenterol Motil. 2014;26:1694‐704.
15. Stanisor OI, van Diest SA, Yu Z, Welting O, Bekkali N, Shi J, et al. Stress‐induced visceral hypersensitivity
in maternally separated rats can be reversed by peripherally restricted histamine‐1‐receptor antagonists. PloS One. 2013;8:e66884.
16. Lundberg JO, Hellstrom PM, Fagerhol MK, Weitzberg E, Roseth AG. Technology insight: calprotectin,
lactoferrin and nitric oxide as novel markers of inflammatory bowel disease. Nat Clin Pract Gastroenterol Hepatol. 2005;2:96‐102.
17. Wassell J, Dolwani S, Metzner M, Losty H, Hawthorne A. Faecal calprotectin: a new marker for Crohn's
disease? Ann Clin Biochem. 2004;41:230‐2. 18. Usellini L, Finzi G, Riva C, Capella C, Mochizuki T, Yanaihara C, et al. Ultrastructural identification of
human secretin cells by the immunogold technique. Their costorage of chromogranin A and serotonin.
Histochemistry. 1990;94:113‐20. 19. Ohman L, Stridsberg M, Isaksson S, Jerlstad P, Simren M. Altered levels of fecal chromogranins and
secretogranins in IBS: relevance for pathophysiology and symptoms? Am J Gastroenterol. 2012;107:
440‐7. 20. Hamer HM, Jonkers D, Venema K, Vanhoutvin S, Troost FJ, Brummer RJ. Review article: the role of
butyrate on colonic function. Aliment Pharmacol Ther. 2008;27:104‐19.
21. Tana C, Umesaki Y, Imaoka A, Handa T, Kanazawa M, Fukudo S. Altered profiles of intestinal microbiota and organic acids may be the origin of symptoms in irritable bowel syndrome. Neurogastroenterol
Motil. 2010;22:512‐9, e114‐5.
Chapter 6
126
22. Langhorst J, Junge A, Rueffer A, Wehkamp J, Foell D, Michalsen A, et al. Elevated human beta‐defensin‐2
levels indicate an activation of the innate immune system in patients with irritable bowel syndrome. Am J Gastroenterol. 2009;104:404‐10.
23. Vora P, Youdim A, Thomas LS, Fukata M, Tesfay SY, Lukasek K, et al. Beta‐defensin‐2 expression is
regulated by TLR signaling in intestinal epithelial cells. J Immunol. 2004;173:5398‐405. 24. Tan J, McKenzie C, Potamitis M, Thorburn AN, Mackay CR, Macia L. The role of short‐chain fatty acids in
health and disease. Adv Immunol. 2014;121:91‐119.
25. Keszthelyi D, Troost FJ, Jonkers DM, van Eijk HM, Dekker J, Buurman WA, et al. Visceral hypersensitivity in irritable bowel syndrome: evidence for involvement of serotonin metabolism ‐ a preliminary study.
Neurogastroenterol Motil. 2015.
26. Vanhoutvin SA, Troost FJ, Kilkens TO, Lindsey PJ, Hamer HM, Jonkers DM, et al. The effects of butyrate enemas on visceral perception in healthy volunteers. Neurogastroenterol Motil. 2009;21:952‐e76.
27. Mujagic Z, Tigchelaar F, Zhernakova A, Ludwig T, Ramiro‐Garcia J, Baranska A, et al. A novel gut health
biomarker panel for irritable bowel syndrome and the application in the general population. 2015. 28. Atkinson W, Lockhart S, Whorwell PJ, Keevil B, Houghton LA. Altered 5‐hydroxytryptamine signaling in
patients with constipation‐ and diarrhea‐predominant irritable bowel syndrome. Gastroenterology.
2006;130:34‐43. 29. Thijssen AY, Mujagic Z, Jonkers D, Ludidi S, Keszthelyi D, Hesselink M, et al. Plasma 5‐hydroxytryptamine
and 5‐hydroxyindole acetic acid levels: indicators for altered serotonin metabolism in IBS? 2015.
30. Windmueller HG, Spaeth AE. Source and fate of circulating citrulline. Am J Physiol. 1981;241:E473‐80. 31. Crenn P, Messing B, Cynober L. Citrulline as a biomarker of intestinal failure due to enterocyte mass
reduction. Clin Nutr. 2008;27:328‐39.
32. Lutgens LC, Blijlevens NM, Deutz NE, Donnelly JP, Lambin P, de Pauw BE. Monitoring myeloablative therapy‐induced small bowel toxicity by serum citrulline concentration: a comparison with sugar
permeability tests. Cancer. 2005;103:191‐9.
33. van Vliet MJ, Tissing WJ, Rings EH, Koetse HA, Stellaard F, Kamps WA, et al. Citrulline as a marker for chemotherapy induced mucosal barrier injury in pediatric patients. Pediatr Blood Cancer. 2009;53:
1188‐94.
34. Longstreth GF, Thompson WG, Chey WD, Houghton LA, Mearin F, Spiller RC. Functional bowel disorders. Gastroenterology. 2006;130:1480‐91.
35. Svedlund J, Sjodin I, Dotevall G. GSRS‐‐a clinical rating scale for gastrointestinal symptoms in patients
with irritable bowel syndrome and peptic ulcer disease. Dig Dis Sci. 1988;33:129‐34. 36. Revicki DA, Wood M, Wiklund I, Crawley J. Reliability and validity of the Gastrointestinal Symptom
Rating Scale in patients with gastroesophageal reflux disease. Qual Life Res. 1998;7:75‐83.
37. Thijssen AY, Jonkers DM, Leue C, van der Veek PP, Vidakovic‐Vukic M, van Rood YR, et al. Dysfunctional cognitions, anxiety and depression in irritable bowel syndrome. J Clin Gastroenterol. 2010;44:e236‐41.
38. Zigmond AS, Snaith RP. The hospital anxiety and depression scale. Acta Psychiatr Scand. 1983;67:
361‐70. 39. Spielberger SC. State‐trait Anxiety Inventory. Consulting Psychologists Press. 1970.
40. Creed F, Ratcliffe J, Fernandez L, Tomenson B, Palmer S, Rigby C, et al. Health‐related quality of life and
health care costs in severe, refractory irritable bowel syndrome. Ann Intern Med. 2001;134:860‐8. 41. Garcia‐Villalba R, Gimenez‐Bastida JA, Garcia‐Conesa MT, Tomas‐Barberan FA, Carlos Espin J, Larrosa M.
Alternative method for gas chromatography‐mass spectrometry analysis of short‐chain fatty acids in
faecal samples. J Sep Scie. 2012;35:1906‐13. 42. Hirowatari Y, Hara K, Kamihata H, Iwasaka T, Takahashi H. High‐performance liquid chromatographic
method with column‐switching and post‐column reaction for determination of serotonin levels in
platelet‐poor plasma. Clin Biochem. 2004;37:191‐7. 43. Kanazawa M, Palsson OS, Thiwan SI, Turner MJ, van Tilburg MA, Gangarosa LM, et al. Contributions of
pain sensitivity and colonic motility to IBS symptom severity and predominant bowel habits. Am J
Gastroenterol. 2008;103:2550‐61. 44. Posserud I, Syrous A, Lindstrom L, Tack J, Abrahamsson H, Simren M. Altered rectal perception in
irritable bowel syndrome is associated with symptom severity. Gastroenterology. 2007;133:1113‐23.
Biomarkers for visceral hypersensitivity in IBS
127
45. Barbara G, Stanghellini V, De Giorgio R, Cremon C, Cottrell GS, Santini D, et al. Activated mast cells in
proximity to colonic nerves correlate with abdominal pain in irritable bowel syndrome. Gastroenterology. 2004;126:693‐702.
46. Di Nardo G, Barbara G, Cucchiara S, Cremon C, Shulman RJ, Isoldi S, et al. Neuroimmune interactions at
different intestinal sites are related to abdominal pain symptoms in children with IBS. Neurogastroenterol Motil. 2014;26:196‐204.
47. Dolwani S, Metzner M, Wassell JJ, Yong A, Hawthorne AB. Diagnostic accuracy of faecal calprotectin
estimation in prediction of abnormal small bowel radiology. Aliment Pharmacol Ther. 2004;20:615‐21. 48. Gershon MD. Nerves, reflexes, and the enteric nervous system: pathogenesis of the irritable bowel
syndrome. J Clin Gastroenterol. 2005;39(5 Suppl 3):S184‐93.
49. Delvaux M, Louvel D, Mamet JP, Campos‐Oriola R, Frexinos J. Effect of alosetron on responses to colonic distension in patients with irritable bowel syndrome. Aliment Pharmacol Ther. 1998;12:849‐55.
50. Rousseaux C, Thuru X, Gelot A, Barnich N, Neut C, Dubuquoy L, et al. Lactobacillus acidophilus
modulates intestinal pain and induces opioid and cannabinoid receptors. Nat Med. 2007;13:35‐7. 51. Buckley MM, O'Halloran KD, Rae MG, Dinan TG, O'Malley D. Modulation of enteric neurons by
interleukin‐6 and corticotropin‐releasing factor contributes to visceral hypersensitivity and altered
colonic motility in a rat model of irritable bowel syndrome. J Physiol. 2014;592:5235‐50. 52. Holzer P. Acid sensing by visceral afferent neurones. Acta Physiol. 2011;201:63‐75.
53. Mujagic Z, Ludidi S, Keszthelyi D, Hesselink MA, Kruimel JW, Lenaerts K, et al. Small intestinal
permeability is increased in diarrhoea predominant IBS, while alterations in gastroduodenal permeability in all IBS subtypes are largely attributable to confounders. Aliment Pharmacol Ther.
2014;40:288‐97.
54. Zhou Q, Zhang B, Verne GN. Intestinal membrane permeability and hypersensitivity in the irritable bowel syndrome. Pain. 2009;146:41‐6.
55. Keszthelyi D, Troost FJ, Jonkers DM, Kruimel JW, Leue C, Masclee AA. Decreased levels of kynurenic acid
in the intestinal mucosa of IBS patients: relation to serotonin and psychological state. J Psychosom Res. 2013;74:501‐4.
56. Elsenbruch S. Abdominal pain in Irritable Bowel Syndrome: a review of putative psychological, neural
and neuro‐immune mechanisms. Brain Behav Immun. 2011;25:386‐94. 57. Schmid J, Langhorst J, Gass F, Theysohn N, Benson S, Engler H, et al. Placebo analgesia in patients with
functional and organic abdominal pain: a fMRI study in IBS, UC and healthy volunteers. Gut.
2015;64:418‐27. 58. Arsie E, Coletta M, Cesana BM, Basilisco G. Symptom‐association probability between meal ingestion
and abdominal pain in patients with irritable bowel syndrome. Does somatization play a role?
Neurogastroenterol Motil. 2015;27:416‐22.
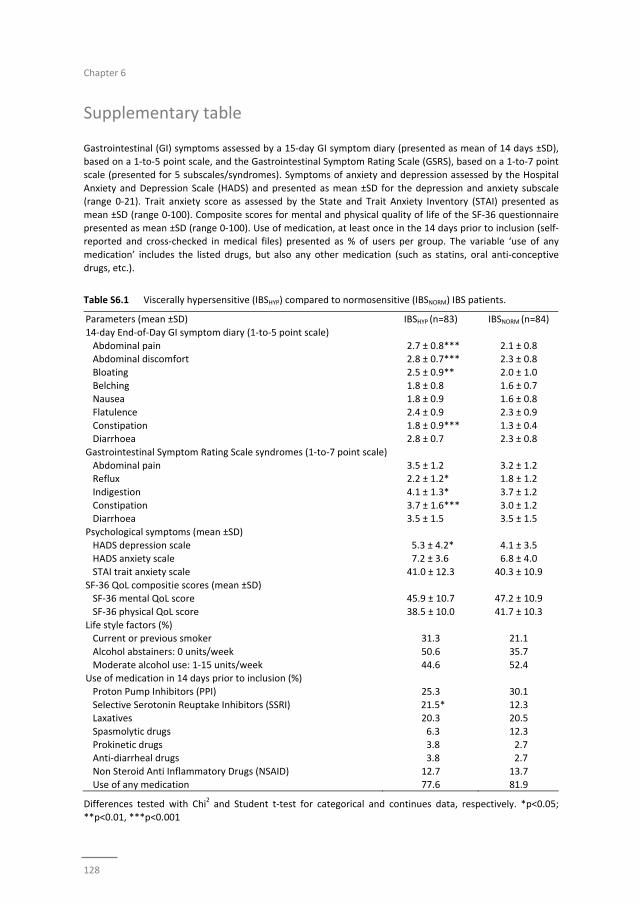
Chapter 6
128
Supplementary table
Gastrointestinal (GI) symptoms assessed by a 15‐day GI symptom diary (presented as mean of 14 days ±SD), based on a 1‐to‐5 point scale, and the Gastrointestinal Symptom Rating Scale (GSRS), based on a 1‐to‐7 point
scale (presented for 5 subscales/syndromes). Symptoms of anxiety and depression assessed by the Hospital
Anxiety and Depression Scale (HADS) and presented as mean ±SD for the depression and anxiety subscale (range 0‐21). Trait anxiety score as assessed by the State and Trait Anxiety Inventory (STAI) presented as
mean ±SD (range 0‐100). Composite scores for mental and physical quality of life of the SF‐36 questionnaire
presented as mean ±SD (range 0‐100). Use of medication, at least once in the 14 days prior to inclusion (self‐reported and cross‐checked in medical files) presented as % of users per group. The variable ‘use of any
medication’ includes the listed drugs, but also any other medication (such as statins, oral anti‐conceptive
drugs, etc.).
Table S6.1 Viscerally hypersensitive (IBSHYP) compared to normosensitive (IBSNORM) IBS patients.
Parameters (mean ±SD) IBSHYP (n=83) IBSNORM (n=84)
14‐day End‐of‐Day GI symptom diary (1‐to‐5 point scale)
Abdominal pain 2.7 ± 0.8*** 2.1 ± 0.8 Abdominal discomfort 2.8 ± 0.7*** 2.3 ± 0.8
Bloating 2.5 ± 0.9** 2.0 ± 1.0
Belching 1.8 ± 0.8 1.6 ± 0.7 Nausea 1.8 ± 0.9 1.6 ± 0.8
Flatulence 2.4 ± 0.9 2.3 ± 0.9
Constipation 1.8 ± 0.9*** 1.3 ± 0.4 Diarrhoea 2.8 ± 0.7 2.3 ± 0.8
Gastrointestinal Symptom Rating Scale syndromes (1‐to‐7 point scale)
Abdominal pain 3.5 ± 1.2 3.2 ± 1.2 Reflux 2.2 ± 1.2* 1.8 ± 1.2
Indigestion 4.1 ± 1.3* 3.7 ± 1.2
Constipation 3.7 ± 1.6*** 3.0 ± 1.2 Diarrhoea 3.5 ± 1.5 3.5 ± 1.5
Psychological symptoms (mean ±SD)
HADS depression scale 5.3 ± 4.2* 4.1 ± 3.5 HADS anxiety scale 7.2 ± 3.6 6.8 ± 4.0
STAI trait anxiety scale 41.0 ± 12.3 40.3 ± 10.9
SF‐36 QoL compositie scores (mean ±SD) SF‐36 mental QoL score 45.9 ± 10.7 47.2 ± 10.9
SF‐36 physical QoL score 38.5 ± 10.0 41.7 ± 10.3
Life style factors (%) Current or previous smoker 31.3 21.1
Alcohol abstainers: 0 units/week 50.6 35.7
Moderate alcohol use: 1‐15 units/week 44.6 52.4 Use of medication in 14 days prior to inclusion (%)
Proton Pump Inhibitors (PPI) 25.3 30.1
Selective Serotonin Reuptake Inhibitors (SSRI) 21.5* 12.3 Laxatives 20.3 20.5
Spasmolytic drugs 6.3 12.3
Prokinetic drugs 3.8 2.7 Anti‐diarrheal drugs 3.8 2.7
Non Steroid Anti Inflammatory Drugs (NSAID) 12.7 13.7
Use of any medication 77.6 81.9
Differences tested with Chi2 and Student t‐test for categorical and continues data, respectively. *p<0.05;
**p<0.01, ***p<0.001

Biomarkers for visceral hypersensitivity in IBS
129

Chapter 6
130
131
Chapter 7
Serotonin metabolism in IBS
Alterations in serotonin metabolism in Irritable Bowel Syndrome
Annemieke Y Thijssen*, Zlatan Mujagic*, Daisy MAE Jonkers, Samefko Ludidi,
Daniel Keszthelyi, Martine AM Hesselink, Cees M Clemens, José M Conchillo,
Joanna W Kruimel, Ad AM Masclee
* Both authors contributed equally to this manuscript
Alimentary Pharmacology & Therapeutics, 2015 Nov 5. [Epub ahead of print]
Chapter 7
132
Abstract
Background and aims
Alterations in serotonin (5‐HT) metabolism have been postulated to play a role in the
pathogenesis of Irritable Bowel Syndrome (IBS). However, previous reports regarding
5‐HT metabolism in IBS are contradicting. The aim of this study was to compare platelet
poor plasma (PPP) 5‐HT and 5‐hydroxyindole acetic acid (5‐HIAA) levels and their ratio
in a large cohort of IBS patients and healthy controls (HC), including IBS‐ subgroup
analysis.
Methods
IBS patients and HCs were evaluated for fasting PPP 5‐HT and 5‐HIAA levels.
Furthermore, GI‐symptom diary, GSRS, quality of life, anxiety and depression scores
were assessed in the two weeks before blood sampling.
Results
154 IBS patients and 137 HC were included. No differences were detected in plasma
5‐HT between groups. The 5‐HIAA concentrations and 5‐HIAA/5‐HT ratio were
significantly lower in IBS compared to HC: 24.6±21.9 vs. 39.0±29.5 ug/l (p<0.001) and
8.4±12.2 vs. 13.5±16.6 (p<0.01), respectively. Subtype analysis for 5‐HIAA showed all
subtypes to be significantly different from HC. The 5‐HIAA/5‐HT ratio was significantly
lower in the IBS‐M subtype versus HC. Linear regression analysis points to an influence
of gender but not of GI‐symptoms, psychological scores or medication use.
Conclusion
We demonstrated that fasting 5‐HT plasma levels are not significantly different in IBS
patients compared to controls. However, decreased 5‐HIAA levels and 5‐HIAA/5‐HT
ratio in IBS patients may reflect altered serotonin metabolism in IBS. Gender affects 5‐
HIAA levels in IBS patients, but no effects of drugs, such as SSRIs, or higher GI‐symptom
or psychological scores were found.
Serotonin metabolism in IBS
133
Introduction
Irritable Bowel Syndrome (IBS) is a highly prevalent disorder with up to 15% of the
Western population affected and a female predominance.1, 2 The Rome III criteria offer
support in diagnosing IBS3,4 with further subtyping based on predominant bowel
habits.5 The pathophysiology of IBS is still incompletely understood.6 An important role
has been claimed for dysregulations along the gut‐brain axis.7 Serotonin
(5‐hydroxytryptamine, 5‐HT) as neurotransmitter7‐9 not only modulates physiological
and behavioral processes in the brain10 but is also a key factor in the enteric nervous
system.11 Moreover, 5‐HT is an important paracrine signaling molecule in the mucosal
sensory transduction in the gut.11 Although the physiological role of 5‐HT in the
gastrointestinal (GI) tract is complex and is not completely elucidated, serotonin has
been shown to be involved in the regulation of secretion, motility and perception in the
gut.11,12
The enterochromaffin (EC) cells in the intestinal epithelium produce 90‐95% of total
5‐HT in the human body.11‐13 5‐HT is synthesized from tryptophan by tryptophan
hydroxylase and aromatic amino acid decarboxylase. Upon release, 5‐HT is inactivated
via uptake by the serotonin reuptake transporter (SERT) located among others in the
epithelial cells lining the gut lumen7,12,14 and broken down by among others the
intracellular molecule monoamine oxidase (MAO) into 5‐hydroxy indoleacetic acid
(5‐HIAA), which is excreted in urine.11,15,16 Decreased SERT activity results in decreased
5‐HT uptake and therefore decreased 5‐HIAA production.17 Systemic 5‐HT is believed to
be primarily derived from the EC cells16 and is rapidly taken up by platelets, which
consequently contain the majority of serotonin in peripheral blood.10,18 Platelet poor
plasma (PPP) levels of 5‐HT and 5‐HIAA are considered to be surrogate markers of
intestinal 5‐HT metabolism.8,11,18
Previous studies have explored serotonin metabolism in IBS, but results are difficult to
interpret and contradicting. Increased plasma 5‐HT levels have been found in IBS,8,19‐21
both in fasting and postprandial conditions, while others did not find a difference in
fasting 5‐HT levels compared to controls or levels were below detection threshold.20,22
With respect to plasma 5‐HIAA, the principal metabolite of 5‐HT, Atkinson et al. noted
that 5‐HIAA levels were slightly decreased in IBS‐C.8 The 5‐HIAA/5‐HT ratio,
representing turnover of serotonin, was found to be decreased in diarrhea
predominant IBS patients.19,20 It should be acknowledged that data on 5‐HT release and
activity is influenced by a number of variables: e.g. fasting or (meal) stimulated
condition, expression and activity of SERT, reuptake of serotonin within the gut and
transport of serotonin in liver, lungs and platelets11 and presence of concurrent
psychopathology in IBS patients23‐25 such as anxiety and depression.18,26,27
Interpretation of published data on human serotonin metabolism in IBS is further
hampered by factors such as sample processing, the analytical technique used, small
Chapter 7
134
sample size studies, the heterogeneous nature of IBS, imbalance in distribution among
IBS subtypes, sampling in fasting versus postprandial state, presence of psycho‐
pathology and use of drugs prescribed for IBS that modify gastrointestinal function or
the 5‐HT system.28 Large studies are needed, preferably from well characterized IBS
patient groups that assess parameters of 5‐HT metabolism taking into account IBS
subtypes and potential confounding factors.
We hypothesized that (i) plasma 5‐HT levels and 5‐HIAA concentrations are altered in
IBS patients compared to healthy controls, and that this (ii) depends on the IBS subtype
and (iii) is related to more severe abdominal symptoms and to altered anxiety and
depression scores. The primary aim of this study was therefore to compare platelet
poor plasma 5‐HT and 5‐HIAA levels and their ratio in a large cohort of well‐
characterized IBS patients and healthy controls. The secondary aim was to compare
differences in these parameters between subgroups of IBS patients based on IBS
subtypes and severity of abdominal and psychological symptoms.
Materials and methods
The present study is part of a larger cohort study on the phenotypical and genotypical
characterization of patients with IBS and healthy controls, the Maastricht IBS cohort,
wherein multiple parameters were assessed according to standardized procedures.
Patients and controls that handed in a blood sample for assessment of serotonin and 5‐
HIAA were included in the current study. All subjects have given written informed
consent prior to their inclusion. The study was approved by the Medical Ethics
Committee of the Maastricht University Medical Centre+ (MUMC+) and executed
according to the revised Declaration of Helsinki (59th general assembly of the WMA,
Seoul, South Korea, Oct. 2008). The study has been registered at the US National
Library of Medicine (http://www.clinicaltrials.gov NCT00775060).
Study participants
From February 2009 until present time, patients with IBS between 18‐75 years of age,
fulfilling Rome III criteria, are recruited via the outpatient clinic of the department of
Gastroenterology‐Hepatology of MUMC+ and via general practitioner (GP) offices in
Maastricht and the surrounding area. IBS patients were subtyped based on
predominant bowel habits according to the Rome III criteria. IBS diagnosis was
confirmed by a gastroenterologist or GP and when indicated endoscopy with biopsies,
abdominal imaging by ultrasonography or CT scan, and/or blood, breath and faecal
analysis were performed to exclude organic disease. Patients with a history of
abdominal surgery, apart from appendectomy, laparoscopic cholecystectomy and
hysterectomy were excluded.
Serotonin metabolism in IBS
135
Healthy controls (HC) between 18‐75 years of age were recruited by advertisements in
newspapers, on bulletin boards at Maastricht University and on a website for subject
recruitment. A brief medical history was taken to rule out history of gastrointestinal
disorders or presence of gastrointestinal complaints.
Use of medication was recorder for all subjects.
Assessment of plasma 5‐HT and 5‐HIAA
Participants arrived at the MUMC+ after an overnight fast. Blood samples were drawn
from the antecubital vein using precooled K2EDTA tubes. To avoid oxidative breakdown
of platelets, 0,1 ml 1.4% ascorbic acid (Sigma Aldrich, St. Louis, MO) was added to the
tubes. PPP samples were obtained by centrifuging tubes at 2300g at 4°C for 10 minutes.
Supernatants were aliquoted and frozen immediately at ‐80°C until further analysis.
Concentration of 5‐HT and 5‐HIAA were determined blind (i.e. on coded samples) using
high‐performance liquid chromatography (HPLC) as described previously by Hirowatari
Y. et al..29 The lower detection limit of 5‐HT and 5‐HIAA was 3.3 µg/l and 0.4 µg/l,
respectively. Data for subjects below the detection limit were based on the average
number between 0 and the detection limit for further analyses. For 5‐HT and 5‐HIAA
the intra‐assay coefficient of variability (CV) was <5% for both parameters, the inter‐
assay CV was 5% and 7%, respectively.
Questionnaires
Within a period of 2 weeks prior to collection of blood samples, questionnaires on
demographical characteristics, lifestyle factors and the use of medication were
completed by all subjects. Symptoms of abdominal discomfort, abdominal pain,
bloating, flatulence, nausea and overall GI symptom burden were scored daily using a
14 day symptom diary.30
The validated Dutch version (RAND‐36) of the Medical Outcomes Study (MOS) 36‐item
Short Form Health Survey (SF‐36) (New England Medical Centre Hospitals, 1991), was
used to measure generic health‐related QoL.31 The SF‐36 consists of eight domains with
an outcome between 0 and 100, with questions on functional health, well‐being and
physical and mental health. High scores indicate a high quality of life. From the
8 domains, a physical (PCS) and mental (MCS) composite score can be derived (and
used as a general indicator for QoL).32,33
Depressive and anxiety symptoms were assessed using the validated Hospital Anxiety
and Depression Scale (HADS) and the State‐Trait Anxiety Inventory (STAI) version DY.
The HADS questionnaire consists of two 7‐item scales, for anxiety and for depression,
each with a score ranging from 0‐21. A mean score ≥8 on the anxiety or depression sub‐
scale shows the presence of anxiety or depressive symptoms with the most optimal
balance between sensitivity and specificity,34 thereby indicating presence of a possible
mood disturbance.35 The STAI contains 40 questions on a 4‐point scale (1‐4), clustered
Chapter 7
136
into two subscales: i.e. State‐anxiety, assessing momentary anxiety symptoms, and
Trait‐anxiety, measuring how anxious participants ‘generally’ feel. The questionnaires
were completed at home and therefore the State‐score was not used in the current
analysis, as it represents momentary anxiety which did not match with the time of
blood sampling. A score of 20‐39 indicates low, 40‐59 moderate and 60‐80 high anxiety
in general.36
Statistical analysis
Statistical analysis was performed using IBM SPSS Statistics version 21.0 (IBM Statistics
for Windows, Chicago, IL, USA).
Differences in baseline characteristics between IBS patients and HC were tested with
the Chi‐square test (categorical data), and the independent‐samples t‐test (for
parametric continuous data). Differences between subtypes of IBS and HC were tested
using one‐way‐analysis of variance (ANOVA). To correct for multiple comparisons, the
Bonferroni correction was applied.
Linear regression analysis was used to assess the association between the presence of
IBS or IBS subtypes and the plasma parameters of serotonin, 5‐HIAA and the ratio and
to adjust for possible confounding factors. Therefore, we first conducted a crude
analysis. Secondly, the statistically significant results were adjusted for possible
confounding factors using the backward elimination methods. The following
parameters were included in the analyses: age, sex, BMI, psychological (anxiety or
depressive) symptoms, current smoking and use of selective serotonin reuptake
inhibitors (SSRI), proton pump inhibitors (PPI), and medication that affects motility (i.e.
laxatives, prokinetics, opioids, spasmolytics and anti‐diarrhoeal drugs). All analyses
were performed for IBS patients as a whole group as well as for the subtypes in
separate analyses as dummy variables. Missing values were excluded listwise. Data are
expressed as mean ± SD. A two‐sided p‐value < 0.05 was considered to be statistically
significant.
Results
Baseline characteristics
From the Maastricht‐IBS cohort, we included of subgroup of 154 IBS patients (IBS‐Total)
and 137 healthy controls (HC) with PPP samples available. With respect to predominant
bowel habits, 52 (34%) were classified as IBS‐D, 33 (22%) as IBS‐C, 60 (38%) as IBS‐M
and 9 (6%) patients as IBS‐U.
Patient characteristics, current medication use, scores for quality of life and anxiety and
depression are shown in Table 7.1. No significant differences in age, gender, BMI or
alcohol use were observed between IBS and HC. A significant higher percentage of IBS
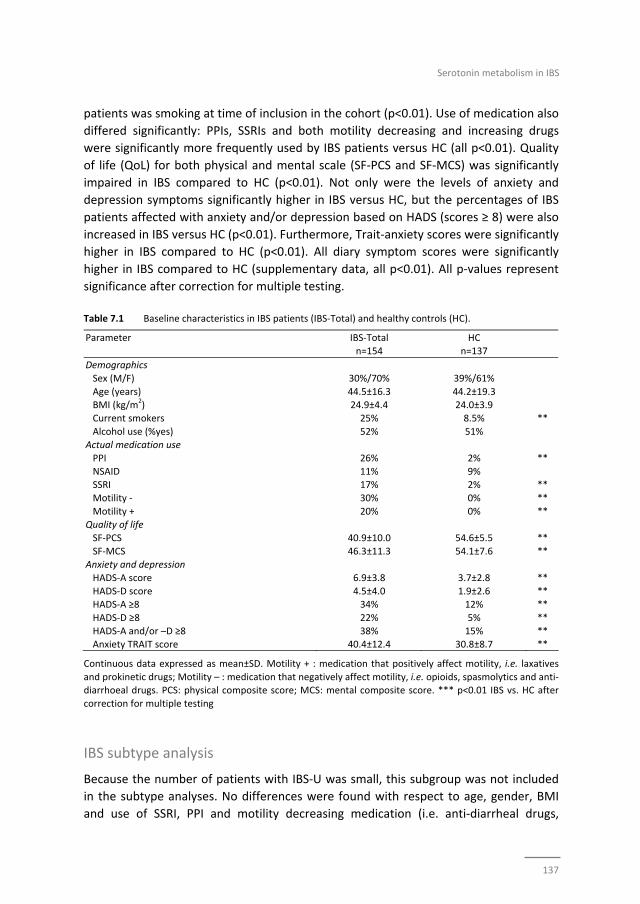
Serotonin metabolism in IBS
137
patients was smoking at time of inclusion in the cohort (p<0.01). Use of medication also
differed significantly: PPIs, SSRIs and both motility decreasing and increasing drugs
were significantly more frequently used by IBS patients versus HC (all p<0.01). Quality
of life (QoL) for both physical and mental scale (SF‐PCS and SF‐MCS) was significantly
impaired in IBS compared to HC (p<0.01). Not only were the levels of anxiety and
depression symptoms significantly higher in IBS versus HC, but the percentages of IBS
patients affected with anxiety and/or depression based on HADS (scores ≥ 8) were also
increased in IBS versus HC (p<0.01). Furthermore, Trait‐anxiety scores were significantly
higher in IBS compared to HC (p<0.01). All diary symptom scores were significantly
higher in IBS compared to HC (supplementary data, all p<0.01). All p‐values represent
significance after correction for multiple testing.
Table 7.1 Baseline characteristics in IBS patients (IBS‐Total) and healthy controls (HC).
Parameter IBS‐Total
n=154
HC
n=137
Demographics
Sex (M/F) 30%/70% 39%/61%
Age (years) 44.5±16.3 44.2±19.3 BMI (kg/m
2) 24.9±4.4 24.0±3.9
Current smokers 25% 8.5%
**
Alcohol use (%yes)
52% 51% Actual medication use
PPI 26% 2% **
NSAID 11% 9% SSRI 17% 2% **
Motility ‐ 30% 0% **
Motility + 20% 0% ** Quality of life
SF‐PCS 40.9±10.0 54.6±5.5 **
SF‐MCS 46.3±11.3 54.1±7.6 ** Anxiety and depression
HADS‐A score 6.9±3.8 3.7±2.8 **
HADS‐D score 4.5±4.0 1.9±2.6 ** HADS‐A ≥8 34% 12% **
HADS‐D ≥8 22% 5% **
HADS‐A and/or –D ≥8 38% 15% ** Anxiety TRAIT score 40.4±12.4 30.8±8.7 **
Continuous data expressed as mean±SD. Motility + : medication that positively affect motility, i.e. laxatives
and prokinetic drugs; Motility – : medication that negatively affect motility, i.e. opioids, spasmolytics and anti‐diarrhoeal drugs. PCS: physical composite score; MCS: mental composite score. *** p<0.01 IBS vs. HC after
correction for multiple testing
IBS subtype analysis
Because the number of patients with IBS‐U was small, this subgroup was not included
in the subtype analyses. No differences were found with respect to age, gender, BMI
and use of SSRI, PPI and motility decreasing medication (i.e. anti‐diarrheal drugs,
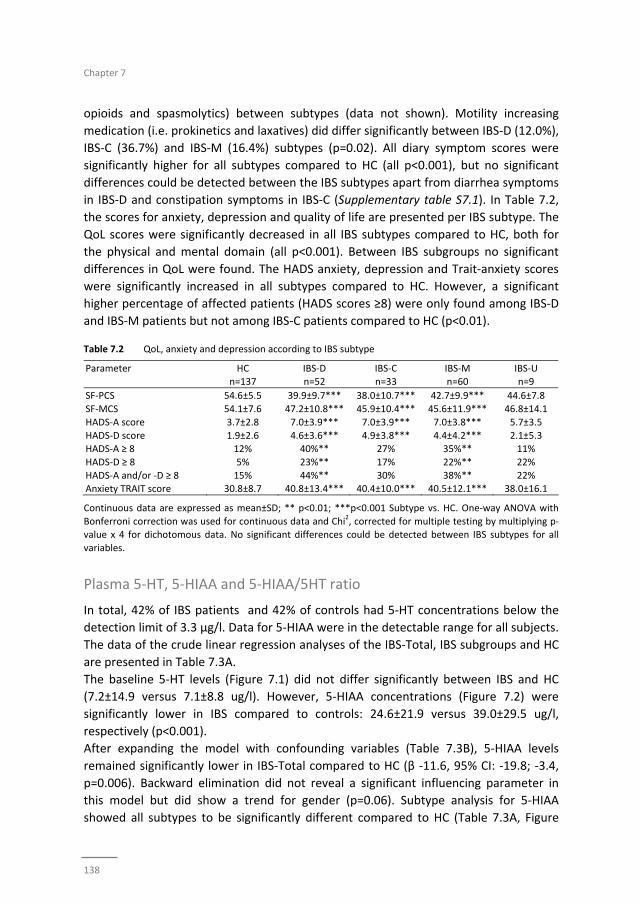
Chapter 7
138
opioids and spasmolytics) between subtypes (data not shown). Motility increasing
medication (i.e. prokinetics and laxatives) did differ significantly between IBS‐D (12.0%),
IBS‐C (36.7%) and IBS‐M (16.4%) subtypes (p=0.02). All diary symptom scores were
significantly higher for all subtypes compared to HC (all p<0.001), but no significant
differences could be detected between the IBS subtypes apart from diarrhea symptoms
in IBS‐D and constipation symptoms in IBS‐C (Supplementary table S7.1). In Table 7.2,
the scores for anxiety, depression and quality of life are presented per IBS subtype. The
QoL scores were significantly decreased in all IBS subtypes compared to HC, both for
the physical and mental domain (all p<0.001). Between IBS subgroups no significant
differences in QoL were found. The HADS anxiety, depression and Trait‐anxiety scores
were significantly increased in all subtypes compared to HC. However, a significant
higher percentage of affected patients (HADS scores ≥8) were only found among IBS‐D
and IBS‐M patients but not among IBS‐C patients compared to HC (p<0.01). Table 7.2 QoL, anxiety and depression according to IBS subtype
Parameter HC n=137
IBS‐D n=52
IBS‐C n=33
IBS‐M n=60
IBS‐U n=9
SF‐PCS 54.6±5.5 39.9±9.7*** 38.0±10.7*** 42.7±9.9*** 44.6±7.8
SF‐MCS 54.1±7.6 47.2±10.8*** 45.9±10.4*** 45.6±11.9*** 46.8±14.1
HADS‐A score 3.7±2.8 7.0±3.9*** 7.0±3.9*** 7.0±3.8*** 5.7±3.5
HADS‐D score 1.9±2.6 4.6±3.6*** 4.9±3.8*** 4.4±4.2*** 2.1±5.3 HADS‐A ≥ 8 12% 40%** 27% 35%** 11%
HADS‐D ≥ 8 5% 23%** 17% 22%** 22%
HADS‐A and/or ‐D ≥ 8 15% 44%** 30% 38%** 22% Anxiety TRAIT score 30.8±8.7 40.8±13.4*** 40.4±10.0*** 40.5±12.1*** 38.0±16.1
Continuous data are expressed as mean±SD; ** p<0.01; ***p<0.001 Subtype vs. HC. One‐way ANOVA with
Bonferroni correction was used for continuous data and Chi2, corrected for multiple testing by multiplying p‐
value x 4 for dichotomous data. No significant differences could be detected between IBS subtypes for all
variables.
Plasma 5‐HT, 5‐HIAA and 5‐HIAA/5HT ratio
In total, 42% of IBS patients and 42% of controls had 5‐HT concentrations below the
detection limit of 3.3 µg/l. Data for 5‐HIAA were in the detectable range for all subjects.
The data of the crude linear regression analyses of the IBS‐Total, IBS subgroups and HC
are presented in Table 7.3A.
The baseline 5‐HT levels (Figure 7.1) did not differ significantly between IBS and HC
(7.2±14.9 versus 7.1±8.8 ug/l). However, 5‐HIAA concentrations (Figure 7.2) were
significantly lower in IBS compared to controls: 24.6±21.9 versus 39.0±29.5 ug/l,
respectively (p<0.001).
After expanding the model with confounding variables (Table 7.3B), 5‐HIAA levels
remained significantly lower in IBS‐Total compared to HC (β ‐11.6, 95% CI: ‐19.8; ‐3.4,
p=0.006). Backward elimination did not reveal a significant influencing parameter in
this model but did show a trend for gender (p=0.06). Subtype analysis for 5‐HIAA
showed all subtypes to be significantly different compared to HC (Table 7.3A, Figure
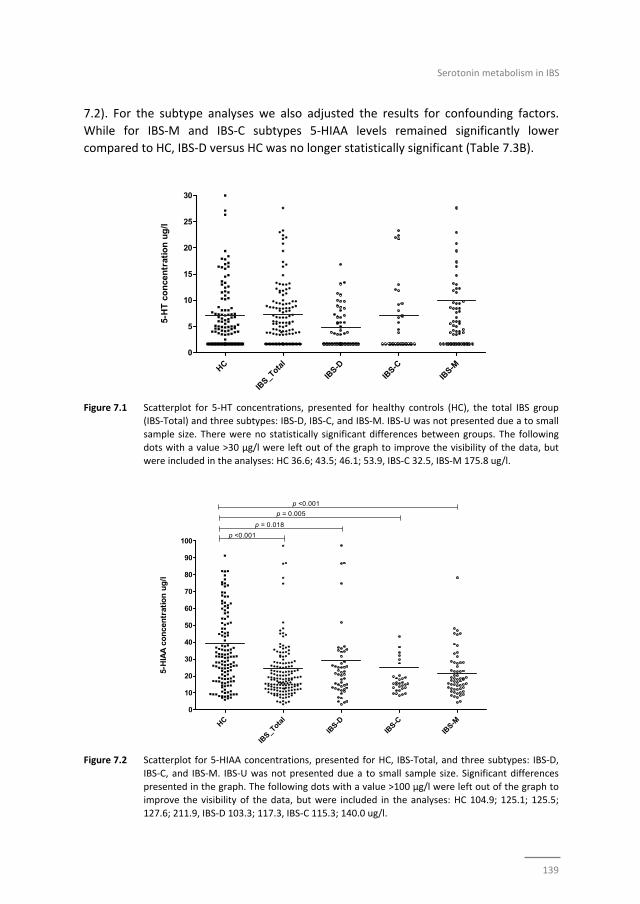
Serotonin metabolism in IBS
139
7.2). For the subtype analyses we also adjusted the results for confounding factors.
While for IBS‐M and IBS‐C subtypes 5‐HIAA levels remained significantly lower
compared to HC, IBS‐D versus HC was no longer statistically significant (Table 7.3B).
Figure 7.1 Scatterplot for 5‐HT concentrations, presented for healthy controls (HC), the total IBS group
(IBS‐Total) and three subtypes: IBS‐D, IBS‐C, and IBS‐M. IBS‐U was not presented due a to small
sample size. There were no statistically significant differences between groups. The following
dots with a value >30 µg/l were left out of the graph to improve the visibility of the data, but were included in the analyses: HC 36.6; 43.5; 46.1; 53.9, IBS‐C 32.5, IBS‐M 175.8 ug/l.
Figure 7.2 Scatterplot for 5‐HIAA concentrations, presented for HC, IBS‐Total, and three subtypes: IBS‐D,
IBS‐C, and IBS‐M. IBS‐U was not presented due a to small sample size. Significant differences
presented in the graph. The following dots with a value >100 µg/l were left out of the graph to improve the visibility of the data, but were included in the analyses: HC 104.9; 125.1; 125.5;
127.6; 211.9, IBS‐D 103.3; 117.3, IBS‐C 115.3; 140.0 ug/l.
HC
IBS_T
otal
IBS-D
IBS-C
IBS-M
0
5
10
15
20
25
30
5-H
T c
on
cen
trat
ion
ug
/l
HC
IBS_T
otal
IBS-D
IBS-C
IBS-M
0
10
20
30
40
50
60
70
80
90
100p <0.001
p = 0.018
p = 0.005
p <0.001
5-H
IAA
co
nce
ntr
atio
n u
g/l
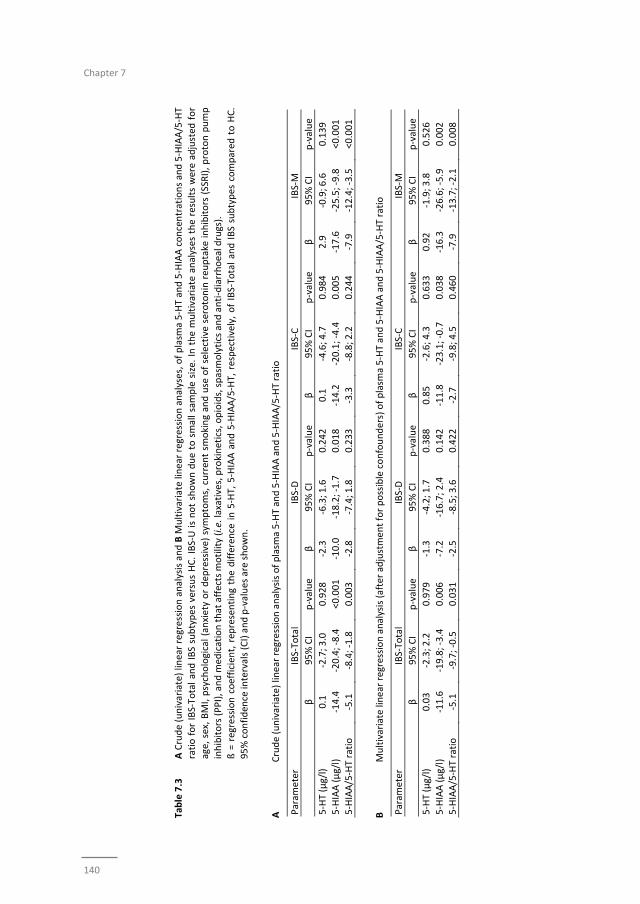
Chapter 7
140
Table 7.3
A Crude (univariate) linear regression analysis and B M
ultivariate linear regression analyses, of plasm
a 5‐HT and 5‐HIAA concentrations and 5‐HIAA/5‐HT
ratio for IBS‐Total and IBS subtypes versus HC. IBS‐U is not shown due to small sample size. In the multivariate analyses the results were adjusted
for
age, sex, BMI, psychological (anxiety or dep
ressive) symptoms, curren
t sm
oking and use of selective serotonin reu
ptake inhibitors (SSRI), proton pump
inhibitors (PPI), and m
edication that affects m
otility (i.e. laxatives, prokinetics, opioids, spasmolytics and anti‐diarrhoeal drugs).
ß = regression coefficient, rep
resenting the difference in 5‐HT, 5‐HIAA and 5‐HIAA/5‐HT, respectively, of IBS‐Total and IBS subtypes compared
to HC.
95% confiden
ce intervals (CI) and p‐values are shown.
A
Crude (univariate) linear regression analysis of plasm
a 5‐HT and 5‐HIAA and 5‐HIAA/5‐HT ratio
Param
eter
IBS‐Total
IBS‐D
IBS‐C
IBS‐M
β
95% CI
p‐value
β
95% CI
p‐value
β
95% CI
p‐value
β
95% CI
p‐value
5‐HT (µg/l)
0.1
‐2.7; 3.0
0.928
‐2.3
‐6.3; 1.6
0.242
0.1
‐4.6; 4.7
0.984
2.9
‐0.9; 6.6
0.139
5‐HIAA (µg/l)
‐14.4
‐20.4; ‐8.4
<0.001
‐10.0
‐18.2; ‐1.7
0.018
‐14.2
‐20.1; ‐4.4
0.005
‐17.6
‐25.5; ‐9.8
<0.001
5‐HIAA/5‐HT ratio
‐5.1
‐8.4; ‐1.8
0.003
‐2.8
‐7.4; 1.8
0.233
‐3.3
‐8.8; 2.2
0.244
‐7.9
‐12.4; ‐3.5
<0.001
B
Multivariate linear regression analysis (after adjustmen
t for possible confounders) of plasm
a 5‐HT and 5‐HIAA and 5‐HIAA/5‐HT ratio
Param
eter
IBS‐Total
IBS‐D
IBS‐C
IBS‐M
β
95% CI
p‐value
β
95% CI
p‐value
β
95% CI
p‐value
β
95% CI
p‐value
5‐HT (µg/l)
0.03
‐2.3; 2.2
0.979
‐1.3
‐4.2; 1.7
0.388
0.85
‐2.6; 4.3
0.633
0.92
‐1.9; 3.8
0.526
5‐HIAA (µg/l)
‐11.6
‐19.8; ‐3.4
0.006
‐7.2
‐16.7; 2.4
0.142
‐11.8
‐23.1; ‐0.7
0.038
‐16.3
‐26.6; ‐5.9
0.002
5‐HIAA/5‐HT ratio
‐5.1
‐9.7; ‐0.5
0.031
‐2.5
‐8.5; 3.6
0.422
‐2.7
‐9.8; 4.5
0.460
‐7.9
‐13.7; ‐2.1
0.008
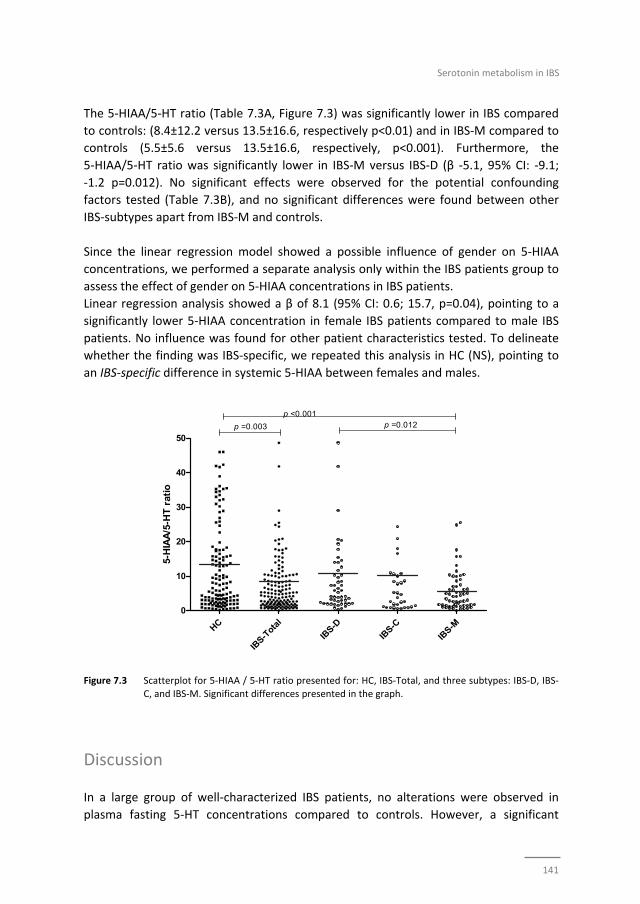
Serotonin metabolism in IBS
141
The 5‐HIAA/5‐HT ratio (Table 7.3A, Figure 7.3) was significantly lower in IBS compared
to controls: (8.4±12.2 versus 13.5±16.6, respectively p<0.01) and in IBS‐M compared to
controls (5.5±5.6 versus 13.5±16.6, respectively, p<0.001). Furthermore, the
5‐HIAA/5‐HT ratio was significantly lower in IBS‐M versus IBS‐D (β ‐5.1, 95% CI: ‐9.1;
‐1.2 p=0.012). No significant effects were observed for the potential confounding
factors tested (Table 7.3B), and no significant differences were found between other
IBS‐subtypes apart from IBS‐M and controls.
Since the linear regression model showed a possible influence of gender on 5‐HIAA
concentrations, we performed a separate analysis only within the IBS patients group to
assess the effect of gender on 5‐HIAA concentrations in IBS patients.
Linear regression analysis showed a β of 8.1 (95% CI: 0.6; 15.7, p=0.04), pointing to a
significantly lower 5‐HIAA concentration in female IBS patients compared to male IBS
patients. No influence was found for other patient characteristics tested. To delineate
whether the finding was IBS‐specific, we repeated this analysis in HC (NS), pointing to
an IBS‐specific difference in systemic 5‐HIAA between females and males.
Figure 7.3 Scatterplot for 5‐HIAA / 5‐HT ratio presented for: HC, IBS‐Total, and three subtypes: IBS‐D, IBS‐
C, and IBS‐M. Significant differences presented in the graph.
Discussion
In a large group of well‐characterized IBS patients, no alterations were observed in
plasma fasting 5‐HT concentrations compared to controls. However, a significant
HC
IBS-T
otal
IBS-D
IBS-C
IBS-M
0
10
20
30
40
50p =0.003
p <0.001p =0.012
5-H
IAA
/5-H
T r
atio
Chapter 7
142
decrease in 5‐HIAA concentrations and in the 5‐HIAA/5‐HT ratio was found in patients
with IBS. All IBS subtypes showed lower 5‐HIAA levels compared to controls, but the
difference was most pronounced in the IBS‐M group. The 5‐HIAA/5‐HT ratio also was
significantly lower in the total IBS group and IBS‐M compared to controls. Apart from a
possible gender effect on 5‐HIAA levels, no influence was found for abdominal
symptoms, anxiety and/or depression nor for medication use on plasma 5‐HT, 5‐HIAA
or their ratio in IBS patients or subgroups.
The fasting 5‐HT levels did not significantly differ between IBS or subgroups and HC.
Our data confirm previous studies by among others Kilkens et al.22 and Houghton et
al.,19 showing that fasting platelet‐poor‐plasma 5‐HT levels in IBS were not different
from controls.20 In contrast, higher fasting 5‐HT levels have been observed by others in
IBS‐D patients,8,37 but also in IBS irrespective of subtype.18 Numerous stimuli lead to 5‐
HT release; i.e. ingestion of food, vagal or sympathetic adrenergic stimulation, lowering
of luminal pH, mucosal distortion and obstruction of gut motility.38 Several trials that
assessed 5‐HT levels after meal stimulation found an increase in 5‐HT levels in IBS
compared to controls.18‐20,37 Unfortunately, most of these studies did not take into
account existing differences in baseline values.18‐20 Hougthon et al did correct for
baseline levels, after which differences in postprandial 5‐HT levels were no longer
significant.37 Atkinson et al.8 have shown an increase in 5‐HT after meal stimulation in
controls and IBS‐D but not in IBS‐C. In our study, 42% of the fasting samples had 5‐HT
concentrations below the detection limit. These data indicate that measurement of
systemic 5‐HT levels has little relevance for discrimination of IBS from controls and in
the future attention should focus (more) on mucosal levels of 5‐HT and its metabolites.
We also assessed 5‐HIAA, the principal metabolite of 5‐HT in the human body, and our
data point to a pronounced decrease in 5‐HIAA concentrations in IBS patients and in
the IBS‐D, IBS‐C and IBS‐M subtypes compared to controls. Previously, a decrease in 5‐
HIAA has been observed in IBS‐C patients8 but most studies focused on 5‐HT and/or
ratio data.19‐21 The lower 5‐HIAA concentrations found in our IBS patients may result
from a decrease in serotonergic metabolism by a reduced MAO activity (intestinal or
extra‐intestinal) or decreased uptake of 5‐HT by SERT. MAO activity in the brain as well
as in peripheral organs has been reported to be reduced in smokers compared to non‐
smokers.39,40 In our study population, significantly more IBS patients use tobacco
compared to the healthy controls. This may partially explain the differences in plasma
5‐HIAA concentrations between groups. However, after adjusting the analyses for
smoking in a multivariate linear regression model, and also after exclusion of all
smokers in a post hoc analyses, the difference between IBS patients and HC with regard
to 5‐HIAA concentration remained significant. This indicates that the imbalance in
number of smokers between groups does not significantly affect the outcomes with
regard to 5‐HIAA in our study.
Serotonin metabolism in IBS
143
Previously, mucosal SERT expression was found to be decreased in IBS‐C and IBS‐D
patients, but studies did not report on IBS‐M subtype.41‐43 Decreased mucosal SERT
activity in IBS may result in an increase in mucosal availability of 5‐HT leading to luminal
hypersensitivity, hypermotility and diarrhea. It has been speculated that continuous
exposure of the mucosa to 5‐HT may eventually result in the desensitization of 5‐HT
receptors with decreased reflex activity and give rise to luminal hyposecretion and
constipation.44,45 The role of SERT polymorphisms in enteric serotonergic signaling in
humans remains unclear.46 Variations in SERT activity and/or expression might lead to
changes in enteric serotonergic signaling and hence promote alterations of bowel
sensory, secretory and motor functions that could account for abdominal symptoms in
IBS.46 A potential role of SERT activity can be substantiated by evaluating the influence
of SSRI use on 5‐HT or 5‐HIAA levels.11 The effects of selective serotonin reuptake
inhibitors (SSRIs) are almost entirely due to SERT inhibition,11 resulting in increased
serotonergic activity. Previous studies exploring the influence of SSRI use on 5‐HT
metabolism have resulted in contradicting results with respect to 5‐HT cerebrospinal
fluid concentrations before and after acute SSRI administration.47,48 Acute
administration of citalopram in IBS patients resulted in increased PPP 5‐HT levels in
combination with enhanced memory performance, leading to the assumption that SSRI
administration increases 5‐HT at synapses, but it is still uncertain how this may affect
5‐HT activity at CNS or intestinal level.22 We anticipated to find differences in 5‐HT
metabolism markers with regard to SSRI use, but our data did not reveal any influence.
Until now, little is known about the chronic use of SSRIs on 5‐HT synthesis.49 Our data
do not provide evidence for an influence of chronic SSRI use on systemic 5‐HT and
5‐HIAA concentrations. Possibly, the effect of SSRIs on plasma levels of 5‐HT and 5‐HIAA
are concealed by transporters which function as ‘back up’ for uptake of serotonin into
the cells, i,e. organic cation and dopamine transporters, when SERT is inhibited. We
have not assessed SERT activity, which is a limitation of the present study. However,
future focus should be directed more towards local, i.e. intestinal, instead of systemic
level serotonin metabolism.
Anxiety and depression are more prevalent among IBS patients compared to the
general population.30,50 In our own tertiary center for referral of patients with complex
functional gastrointestinal disorders (FGIDs), in as much as 50% of the patients an
anxiety disorder is diagnosed and in 20% a mood disorder.51 A high prevalence of
anxiety and depression was confirmed in our IBS cohort, including patients from GPs,
secondary and tertiary referral. Changes in serotonin metabolism have been reported
to be more pronounced in patients with psychiatric co‐morbidity.10,25 We did not
observe a significant influence of anxiety and/or depression symptoms on plasma
markers of 5‐HT metabolism. A few other studies have assessed the correlation
between plasma 5‐HT metabolism and anxiety/depression symptoms in IBS patients
Chapter 7
144
but results were not in line with each other and do not point to a specific direction of
influence by anxiety or depression disorders on 5‐HT metabolism.18,26
With regard to the relation between the use of PPIs and serotonin metabolism, limited
data are available. PPI use is reported to be associated with higher levels of
chromogranin A, which is produced by enterochromaffin cells, alike most of the
serotonin that is present in GI tract and blood plasma. However, whether PPI use leads
to altered 5‐HT or 5‐HIAA plasma levels is unknown. Our analyses did not demonstrate
a significant association between these markers and the use of PPIs, also after exclusion
of all PPI users in a post hoc analyses, the difference between IBS patients and HC with
regard to 5‐HIAA concentration remained significant.
Furthermore, drugs with enterokinetic activities may also affect and even target
serotonin metabolism. Certain prokinetics target the 5‐HT4 receptor, e.g.
prucalopride52 to accelerate gastrointestinal and colonic transit. On the other hand
5‐HT3 receptor antagonists, such as ondansetron53 and alosetron54 have antiemetic
properties and slow down the movement of chyme through the GI tract. Both, the
5‐HT4 receptor agonists and 5‐HT3 receptor antagonists, have been demonstrated to
reduce symptom burden in subgroups of IBS patients,55 which further substantiates the
role of serotonin in GI physiology and possibly also IBS pathophysiology. However, in
our study population none of the subjects used 5‐HT4 receptor agonists or 5‐HT3
receptor antagonists. Furthermore, our data do not show any significant confounding
effects of any drugs that affect motility with regard to 5‐HT and 5‐HIAA plasma levels in
IBS patients and HC.
Our study is the first to observe distinctly different results for IBS‐M patients with
respect to serotonin metabolism with a decreased 5‐HIAA/5‐HT ratio. The differences in
the IBS‐M group are not explained by symptom scores, psychological comorbidity,
gender or use of medication. In previous studies on serotonin metabolism, this
subgroup of IBS patients has not been analyzed separately.8,18‐20 This is remarkable
since the IBS‐M subtype is the most common IBS subtype.56‐58 With regard to 5‐HT
metabolism in our study, IBS‐M seemed not simply a mix of IBS‐D and IBS‐C data. IBS‐M
patients had the lowest 5‐HIAA levels and 5‐HIAA/5‐HT ratio compared to all the other
subtypes. A recently published large scale study showed significantly higher scores for
IBS‐M patients regarding somatization and somatic symptom scores compared to either
IBS‐C or IBS‐D.59 However, in another study no significant differences between IBS‐D,
IBS‐C and IBS‐M with respect to IBS severity, abdominal pain, level of somatization, QoL
and anxiety or depression scores were found.60 We postulate, based on the differences
in particularly 5‐HIAA/5‐HT ratio, that IBS‐M may be a truly separate entity in IBS,
possibly with a different pathophysiological background in comparison to IBS‐D and
IBS‐C.
Serotonin metabolism in IBS
145
Linear regression analysis revealed an influence of gender on 5‐HIAA concentrations in
IBS but not in controls. Female IBS patients had significantly lower 5‐HIAA
concentrations compared to IBS males. Previously, female patients were found to have
lower SERT expression, which could explain lower 5‐HIAA concentrations.61 Differences
in systemic 5‐HT between males and females have also been observed previously in
one study, in which fasting PPP 5‐HT levels were significantly higher compared to HC,
which was explained after stratifying the groups by IBS‐D men only. A relation with
menstrual cycle could not be proven in that study. No gender differences were found in
5‐HIAA concentrations.37 The lower 5‐HIAA levels we observed in IBS females cannot be
explained by differences in subtype distribution, psychological comorbidity or use of
medication. Menstrual cycle phase was not taken into account in our study, neither
were stress factors, which have been shown to be potential confounders.13,26
Although we assessed 5‐HT and 5‐HIAA plasma levels in a relatively large
heterogeneous IBS population with sufficient numbers of subtype populations, a study
including a larger number of patients in separate IBS subtype groups would be
warranted to confirm our findings in the subgroup analyses. Furthermore, it has to be
noted that our results are based on cross‐sectional and observational data and that
causality was not studied.
The method we employed for assessment of 5‐HT and 5‐HIAA in PPP has previously
been described by Hirowatari et al.,29 and is considered to be a reliable method with
adequate specificity, sensitivity and reproducibility. It should be acknowledged that in
our study 42% of IBS patients and comparable numbers of controls had 5‐HT
concentrations below the detection limit, a finding in line with data by Bearcroft et
al..20 Brand et al systematically reviewed 101 trials that have measured 5‐HT in PPP and
found that methods to measure 5‐HT vary widely.62 The concentration of 5‐HT in
platelets may exceed free plasma concentration, leaving the possibility open that what
is measured in PPP reflects leakage of 5‐HT from platelets during preparation instead of
the actual concentration in plasma.11 Therefore, the assessment of 5‐HIAA levels seems
more useful for the assessment of systemic serotonin metabolism than the
quantification of 5‐HT itself. However, due to the wide distribution of 5‐HIAA levels in
both IBS patients and HC and the indication that the systemic measurements not fully
represents or reflects intestinal metabolism, both 5‐HT and 5‐HIAA plasma levels do not
seem to be very useful as a potential biomarker in IBS patients. Furthermore, this is a
rather crude way to evaluate the pleiotropic effects and complex metabolism of 5‐HT in
the gut physiology. Assessment of serotonin metabolism at intestinal level, combined
with systemic measurements, of 5‐HT and 5‐HIAA may help to provide a better insight
into the serotonin metabolismin IBS,8,27 however, a wide spread in mucosal assessment
of 5‐HT has also been seen in previously performed studies.63
Chapter 7
146
Conclusion
Fasting plasma 5‐HT levels were not significantly different between IBS patients and
healthy controls. However, our data showed a significant decrease in fasting 5‐HIAA
concentrations and 5‐HIAA/5‐HT ratio in IBS, in which all IBS subtypes separately have
lower 5‐HIAA levels compared to controls and the 5‐HIAA/5‐HT ratio was significantly
lower in IBS‐M versus controls. Linear regression analysis points to an influence of
gender but not of symptoms, anxiety and/or depression or medication use.
Our study demonstrated that although fasting 5‐HT plasma levels are not changed in
IBS compared to controls, the differences in 5‐HIAA levels may reflect altered serotonin
metabolism in IBS patients.
Serotonin metabolism in IBS
147
References
1 Longstreth GF, Thompson WG, Chey WD, Houghton LA, Mearin F, Spiller RC. Functional bowel disorders. Gastroenterology 2006;130:1480‐91.
2 Hungin AP, Whorwell PJ, Tack J, Mearin F. The prevalence, patterns and impact of irritable bowel
syndrome: an international survey of 40,000 subjects. Aliment Pharmacol Ther 2003; 17:643‐50. 3 Olden KW. Diagnosis of irritable bowel syndrome. Gastroenterology 2002;122:1701‐14.
4 Camilleri M, Heading RC, Thompson WG. Clinical perspectives, mechanisms, diagnosis and
management of irritable bowel syndrome. Aliment Pharmacol Ther 2002;16:1407‐30. 5 El‐Salhy M. Irritable bowel syndrome: diagnosis and pathogenesis. World J Gastroenterol 2012;18:
5151‐63.
6 Drossman DA, Camilleri M, Mayer EA, Whitehead WE. AGA technical review on irritable bowel syndrome. Gastroenterology 2002;123:2108‐31.
7 Kim DY, Camilleri M. Serotonin: a mediator of the brain‐gut connection. Am J Gastroenterol 2000;95:
2698‐709. 8 Atkinson W, Lockhart S, Whorwell PJ, Keevil B, Houghton LA. Altered 5‐hydroxytryptamine signaling in
patients with constipation‐ and diarrhea‐predominant irritable bowel syndrome. Gastroenterology
2006;130:34‐43. 9 Berger M, Gray JA, Roth BL. The expanded biology of serotonin. Ann Rev Med 2009;60:355‐66.
10 Cremon C, Carini G, Wang B, Vasina V, Cogliandro RF, De Giorgio R, Stanghellini V, Grundy D, Tonini M,
De Ponti F, Corinaldesi R, Barbara G. Intestinal serotonin release, sensory neuron activation, and abdominal pain in irritable bowel syndrome. Am J Gastroenterol 2011;106:1290‐8.
11 Gershon MD, Tack J. The serotonin signaling system: from basic understanding to drug development for
functional GI disorders. Gastroenterology 2007;132:397‐414. 12 Gershon MD. Review article: serotonin receptors and transporters ‐‐ roles in normal and abnormal
gastrointestinal motility. Aliment Pharmacol Ther 2004;20 Suppl 7:3‐14.
13 Matricon J, Meleine M, Gelot A, Piche T, Dapoigny M, Muller E, Ardid D. Review article: Associations between immune activation, intestinal permeability and the irritable bowel syndrome. Aliment
Pharmacol Ther 2012;36:1009‐31.
14 Mawe GM, Coates MD, Moses PL. Review article: intestinal serotonin signalling in irritable bowel syndrome. Aliment Pharmacol Ther 2006;23:1067‐76.
15 Tack J, Janssen P, Wouters M, Boeckxstaens G. Targeting serotonin synthesis to treat irritable bowel
syndrome. Gastroenterology 2011;141:420‐2. 16 Erspamer V, Testini A. Observations on the release and turnover rate of 5‐hydroxytryptamine in the
gastrointestinal tract. J Pharm Pharmacol 1959;11:618‐23.
17 Nikisch G, Mathe AA, Czernik A, Eap CB, Jimenez‐Vasquez P, Brawand‐Amey M, Baumann P. Stereoselective metabolism of citalopram in plasma and cerebrospinal fluid of depressive patients:
relationship with 5‐HIAA in CSF and clinical response. J Clin Psychopharmacol 2004;24:283‐90.
18 Park SY, Park MH, Yoon KW, Cho SB, Lee WS, Park CH, Kim HS, Choi SK, Rew JS. Plasma 5‐hydroxytryptamine concentration and its correlation with psychopathology in patients with irritable
bowel syndrome. Gut Liver 2009;3:26‐30.
19 Houghton LA, Atkinson W, Whitaker RP, Whorwell PJ, Rimmer MJ. Increased platelet depleted plasma 5‐hydroxytryptamine concentration following meal ingestion in symptomatic female subjects with
diarrhoea predominant irritable bowel syndrome. Gut 2003;52:663‐70.
20 Bearcroft CP, Perrett D, Farthing MJ. Postprandial plasma 5‐hydroxytryptamine in diarrhoea predominant irritable bowel syndrome: a pilot study. Gut 1998;42:42‐6.
21 Dunlop SP, Coleman NS, Blackshaw E, Perkins AC, Singh G, Marsden CA, Spiller RC. Abnormalities of 5‐
hydroxytryptamine metabolism in irritable bowel syndrome. Clin Gastroenterol Hepatol 2005;3:349‐57. 22 Kilkens TO, Honig A, Fekkes D, Brummer RJ. The effects of an acute serotonergic challenge on brain‐gut
responses in irritable bowel syndrome patients and controls. Aliment Pharmacol Ther 2005;22:865‐74.
23 Bradford K, Shih W, Videlock EJ, Presson AP, Naliboff BD, Mayer EA, Chang L. Association between early adverse life events and irritable bowel syndrome. Clin Gastroenterol Hepatol 2012;10:385‐90 e381‐3.
Chapter 7
148
24 Sykes MA, Blanchard EB, Lackner J, Keefer L, Krasner S. Psychopathology in irritable bowel syndrome:
support for a psychophysiological model. J Behav Med 2003;26:361‐72. 25 Kim JJ. Serotonin, stress, and conditioning. Biol Psychiatry 2008;63:819‐20.
26 Stasi C, Bellini M, Costa F, Mumolo MG, Ricchiuti A, Grosso M, Duranti E, Metelli MR, Gambaccini D,
Bianchi L, Di Tanna GL, Laffi G, Taddei S, Marchi S. Neuroendocrine markers and psychological features in patients with irritable bowel syndrome. Int J Colorectal Dis 2013;28:1203‐8.
27 Keszthelyi D, Troost FJ, Jonkers DM, Kruimel JW, Leue C, Masclee AA. Decreased levels of kynurenic acid
in the intestinal mucosa of IBS patients: relation to serotonin and psychological state. J Psychosom Res 2013;74:501‐4.
28 Faresjo A, Grodzinsky E, Johansson S, Wallander MA, Faresjo T, Timpka T. Self‐reported use of
pharmaceuticals among patients with irritable bowel syndrome in primary care. J Manag Care Pharm 2008;14:870‐7.
29 Hirowatari Y, Hara K, Kamihata H, Iwasaka T, Takahashi H. High‐performance liquid chromatographic
method with column‐switching and post‐column reaction for determination of serotonin levels in platelet‐poor plasma. Clin Biochem 2004;37:191‐7.
30 Thijssen AY, Jonkers DM, Leue C, van der Veek PP, Vidakovic‐Vukic M, van Rood YR, Clemens CH,
Masclee AA. Dysfunctional cognitions, anxiety and depression in irritable bowel syndrome. J Clin Gastroenterol 2010;44:e236‐41.
31 van der Zee KI SR. Het meten van de algemene gezonsheidstoestand met de RAND‐36, een handleiding.
[Assessment of general health status with the RAND‐36; guidebook]. Noordelijk Centrum voor Gezondheidsvraagstukken Rijksuniversiteit Groningen: Groningen, 1993
32 Creed F, Ratcliffe J, Fernandez L, Tomenson B, Palmer S, Rigby C, Guthrie E, Read N, Thompson D.
Health‐related quality of life and health care costs in severe, refractory irritable bowel syndrome. Ann Int Med 2001;134:860‐8.
33 Farivar SS, Cunningham WE, Hays RD. Correlated physical and mental health summary scores for the
SF‐36 and SF‐12 Health Survey, V.I. Health Qual Life Outcomes 2007;5:54. 34 Bjelland I, Dahl AA, Haug TT, Neckelmann D. The validity of the Hospital Anxiety and Depression Scale.
An updated literature review. J Psychosom Res 2002;52:69‐77.
35 Zigmond AS, Snaith RP. The hospital anxiety and depression scale. Acta Psychiatr Scand 1983;67: 361‐70.
36 Spielberger GaL. State‐trait Anxiety Inventory. Consulting Psychologists Press 1970
37 Houghton LA, Brown H, Atkinson W, Morris J, Fell C, Whorwell PJ, Lockhart S, Keevil B. 5‐hydroxytryptamine signalling in irritable bowel syndrome with diarrhoea: effects of gender and
menstrual status. Aliment Pharmacol Ther 2009;30:919‐29.
38 McLean PG, Borman RA, Lee K. 5‐HT in the enteric nervous system: gut function and neuropharmacology. Trends Neurosci 2007;30:9‐13.
39 Fowler JS, Logan J, Wang GJ, Volkow ND, Telang F, Zhu W, Franceschi D, Pappas N, Ferrieri R, Shea C,
Garza V, Xu Y, Schlyer D, Gatley SJ, Ding YS, Alexoff D, Warner D, Netusil N, Carter P, Jayne M, King P, Vaska P. Low monoamine oxidase B in peripheral organs in smokers. Proc Natl Acad Sci U S A 2003;100:
11600‐5.
40 Fowler JS, Volkow ND, Wang GJ, Pappas N, Logan J, Shea C, Alexoff D, MacGregor RR, Schlyer DJ, Zezulkova I, Wolf AP. Brain monoamine oxidase A inhibition in cigarette smokers. Proc Natl Acad Sci U S
A 1996;93:14065‐9.
41 Foley S, Garsed K, Singh G, Duroudier NP, Swan C, Hall IP, Zaitoun A, Bennett A, Marsden C, Holmes G, Walls A, Spiller RC. Impaired uptake of serotonin by platelets from patients with irritable bowel
syndrome correlates with duodenal immune activation. Gastroenterology 2011;140:1434‐43 e1431.
42 Kerckhoffs AP, ter Linde JJ, Akkermans LM, Samsom M. SERT and TPH‐1 mRNA expression are reduced in irritable bowel syndrome patients regardless of visceral sensitivity state in large intestine. Am J
Physiol Gastrointest Liver Physiol 2012;302:G1053‐60.
43 El‐Salhy M, Wendelbo I, Gundersen D. Serotonin and serotonin transporter in the rectum of patients with irritable bowel disease. Mol Med Rep 2013;8:451‐5.
Serotonin metabolism in IBS
149
44 Coates MD, Mahoney CR, Linden DR, Sampson JE, Chen J, Blaszyk H, Crowell MD, Sharkey KA, Gershon
MD, Mawe GM, Moses PL. Molecular defects in mucosal serotonin content and decreased serotonin reuptake transporter in ulcerative colitis and irritable bowel syndrome. Gastroenterology 2004;126:
1657‐64.
45 Shekhar C, Monaghan PJ, Morris J, Issa B, Whorwell PJ, Keevil B, Houghton LA. Rome III functional constipation and irritable bowel syndrome with constipation are similar disorders within a spectrum of
sensitization, regulated by serotonin. Gastroenterology 2013;145:749‐57; quiz e713‐44.
46 Colucci R, Blandizzi C, Bellini M, Ghisu N, Tonini M, Del Tacca M. The genetics of the serotonin transporter and irritable bowel syndrome. Trends Mol Med 2008;14:295‐304.
47 Carpenter LL, Anderson GM, Siniscalchi JM, Chappell PB, Price LH. Acute changes in cerebrospinal fluid
5‐HIAA following oral paroxetine challenge in healthy humans. Neuropsychopharmacology 2003;28: 339‐47.
48 Barton DA, Esler MD, Dawood T, Lambert EA, Haikerwal D, Brenchley C, Socratous F, Hastings J, Guo L,
Wiesner G, Kaye DM, Bayles R, Schlaich MP, Lambert GW. Elevated brain serotonin turnover in patients with depression: effect of genotype and therapy. Arch Gen Psychiatry 2008;65:38‐46.
49 Honig G, Jongsma ME, van der Hart MC, Tecott LH. Chronic citalopram administration causes a
sustained suppression of serotonin synthesis in the mouse forebrain. PloS One 2009;4:e6797. 50 Levy RL, Olden KW, Naliboff BD, Bradley LA, Francisconi C, Drossman DA, Creed F. Psychosocial aspects
of the functional gastrointestinal disorders. Gastroenterology 2006;130 1447‐58.
51 Kruimel J, Leue C, Winkens B, Marcus D, Schoon S, Dellink R, van Os J, Masclee A. Integrated medical‐psychiatric outpatient care in functional gastrointestinal disorders improves outcome: a pilot study. Eur
J Gastroenterol Hepatol 2015;27:721‐7.
52 Bouras EP, Camilleri M, Burton DD, Thomforde G, McKinzie S, Zinsmeister AR. Prucalopride accelerates gastrointestinal and colonic transit in patients with constipation without a rectal evacuation disorder.
Gastroenterology 2001;120:354‐60.
53 Cooke CE, Mehra IV. Oral ondansetron for preventing nausea and vomiting. Am J Hosp Pharm 1994;51: 762‐71.
54 Gunput MD. Review article: clinical pharmacology of alosetron. Aliment Pharmacol Ther 1999;13 Suppl
2:70‐6. 55 Tack J, Fried M, Houghton LA, Spicak J, Fisher G. Systematic review: the efficacy of treatments for
irritable bowel syndrome‐‐a European perspective. Aliment Pharmacol Ther 2006;24:183‐205.
56 Wilson S, Roberts L, Roalfe A, Bridge P, Singh S. Prevalence of irritable bowel syndrome: a community survey. Br J Gen Pract 2004;54:495‐502.
57 Lin S, Mooney PD, Kurien M, Aziz I, Leeds JS, Sanders DS. Prevalence, investigational pathways and
diagnostic outcomes in differing irritable bowel syndrome subtypes. Eur J Gastroenterol Hepatol 2014; 26:1176‐80.
58 Ford AC, Bercik P, Morgan DG, Bolino C, Pintos‐Sanchez MI, Moayyedi P. Characteristics of functional
bowel disorder patients: a cross‐sectional survey using the Rome III criteria. Aliment Pharmacol Ther 2014;39:312‐21.
59 Patel P, Bercik P, Morgan DG, Bolino C, Pintos‐Sanchez MI, Moayyedi P, Ford AC. Irritable bowel
syndrome is significantly associated with somatisation in 840 patients, which may drive bloating. Aliment Pharmacol Ther 2015;41:449‐58.
60 Rey de Castro NG, Miller V, Carruthers HR, Whorwell PJ. Irritable bowel syndrome: a comparison of
subtypes. J Gastroenterol Hepatol 2015;30:279‐85. 61 Franke L, Schmidtmann M, Riedl A, van der Voort I, Uebelhack R, Monnikes H. Serotonin transporter
activity and serotonin concentration in platelets of patients with irritable bowel syndrome: effect of
gender. J Gastroenterol 2010;45:389‐98. 62 Brand T, Anderson GM. The measurement of platelet‐poor plasma serotonin: a systematic review of
prior reports and recommendations for improved analysis. Clin Chem 2011;57:1376‐86.
63 Keszthelyi D, Troost FJ, Jonkers DM, van Donkelaar EL, Dekker J, Buurman WA, Masclee AA. Does acute tryptophan depletion affect peripheral serotonin metabolism in the intestine? Am J Clin Nutr 2012;95:
603‐8.
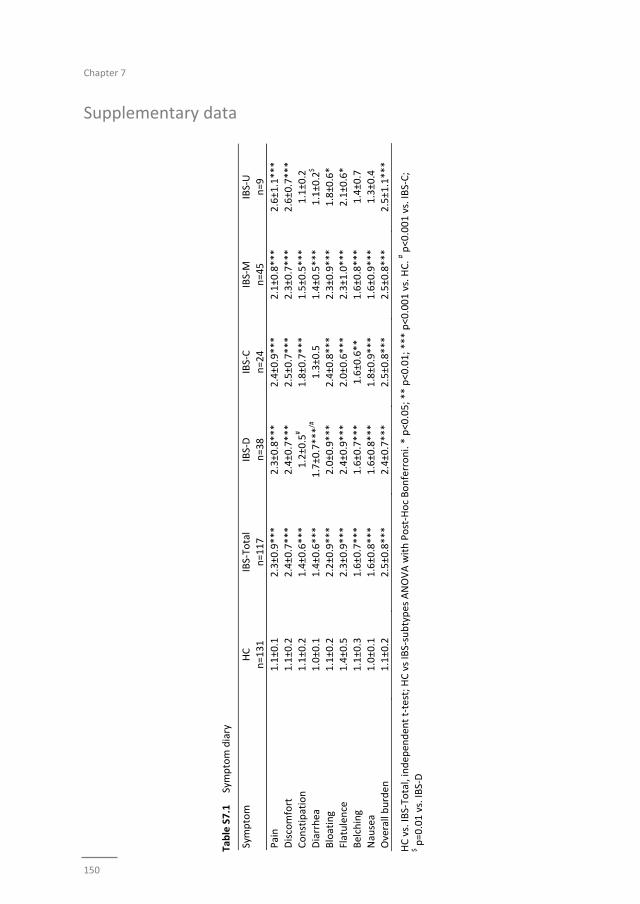
Chapter 7
150
Supplementary data
Table S7.1
Symptom diary
Symptom
HC
n=131
IBS‐To
tal
n=117
IBS‐D
n=38
IBS‐C
n=24
IBS‐M
n=45
IBS‐U
n=9
Pain
1.1±0.1
2.3±0.9***
2.3±0.8***
2.4±0.9***
2.1±0.8***
2.6±1.1***
Discomfort
1.1±0.2
2.4±0.7***
2.4±0.7***
2.5±0.7***
2.3±0.7***
2.6±0.7***
Constipation
1.1±0.2
1.4±0.6***
1.2±0.5
# 1.8±0.7***
1.5±0.5***
1.1±0.2
Diarrhea
1.0±0.1
1.4±0.6***
1.7±0.7***/#
1.3±0.5
1.4±0.5***
1.1±0.2
$
Bloating
1.1±0.2
2.2±0.9***
2.0±0.9***
2.4±0.8***
2.3±0.9***
1.8±0.6*
Flatulence
1.4±0.5
2.3±0.9***
2.4±0.9***
2.0±0.6***
2.3±1.0***
2.1±0.6*
Belching
1.1±0.3
1.6±0.7***
1.6±0.7***
1.6±0.6**
1.6±0.8***
1.4±0.7
Nausea
1.0±0.1
1.6±0.8***
1.6±0.8***
1.8±0.9***
1.6±0.9***
1.3±0.4
Overall burden
1.1±0.2
2.5±0.8***
2.4±0.7***
2.5±0.8***
2.5±0.8***
2.5±1.1***
HC vs. IB
S‐To
tal, independen
t t‐test; H
C vs IBS‐subtypes ANOVA with Post‐Hoc Bonferroni. * p<0.05; ** p<0.01; *** p<0.001 vs. HC. # p<0.001 vs. IB
S‐C;
$ p=0.01 vs. IB
S‐D

Serotonin metabolism in IBS
151

Chapter 7
152

153
PART II
Symptoms

Chapter 1
154
155
Chapter 8
Systematic review:
Measurement of abdominal pain in IBS
Systematic review: instruments to assess abdominal pain in irritable bowel syndrome
Zlatan Mujagic, Daniel Keszthelyi, Qasim Aziz, Walter Reinisch, Emilio G Quetglas,
Francesco De Leonardis, Märta Segerdahl, Ad AM Masclee
Alimentary Pharmacology & Therapeutics 2015;42:1064‐1081
Chapter 8
156
Abstract
Background
Consensus on standard methods to assess chronic abdominal pain in patients with
irritable bowel syndrome (IBS) is currently lacking.
Aim
To systematically review the literature with respect to instruments of measurement of
chronic abdominal pain in IBS patients.
Methods
Systematic literature search was performed in PubMed / Medline databases for studies
using pain measurement instruments in patients with IBS.
Results
110 publications were reviewed. A multitude of different instruments is currently used
to assess chronic abdominal pain in IBS patients. The single item methods, e.g. the
validated 10‐point numeric rating scale (NRS), and questionnaires assessing
gastrointestinal symptoms severity, focus on the assessment of only the intensity of
abdominal pain. Of these questionnaires the validated IBS‐Symptom Severity Scale
includes the broadest measurement of pain related aspects. General pain
questionnaires and electronic momentary symptom assessment tools have been used
to study abdominal pain in IBS patients as well, but have not yet been validated for this
purpose. The evidence for the use of provocation tests, e.g. the rectal barostat with
balloon distention, for measurement of abdominal pain in IBS is weak, due to the poor
correlation between visceral pain thresholds assessed by provocation tests and
abdominal pain as assessed by questionnaires.
Conclusions
The multitude of different instruments to measure chronic abdominal pain in IBS leads
to difficult to compare endpoints of published studies. There is need for a validated
instrument to assess chronic abdominal pain in IBS patients that overcome the
limitations of the currently available methods.
Measurement of abdominal pain in IBS
157
Introduction
Abdominal pain occurs frequently as a disabling symptom that is experienced by
patients in daily clinical care practice (e.g. gastroenterology, gynaecology, surgery,
urology). Chronic recurrent abdominal pain is a typical and prominent characteristic of
irritable bowel syndrome (IBS). In patients who are affected, this symptom results in a
severe burden and impairment of quality of life.1 Currently available treatments aimed
to relieve abdominal pain, including non‐steroidal anti‐inflammatory drugs, opioids,
tricyclic antidepressants and selective serotonin/noradrenalin reuptake inhibitors, are
frequently used but generally not attractive therapeutic entities in IBS, due to target‐
related side effects. Thus, efficacious therapeutic pain strategies are lacking.
Development of novel therapies is hindered by an incomplete understanding of
mechanisms involved in the pathogenesis of abdominal pain. In addition, a drawback in
the development and application of analgesics for treatment of visceral pain in patients
with IBS may, in part, be the current lack of reliable instruments to measure and
quantify chronic abdominal pain.
The International Association for the Study of Pain (IASP) defines chronic pain as
‘persistent pain, which can be either continuous or recurrent, of sufficient duration and
intensity to adversely affect a patient’s wellbeing, level of function and quality of life.’2
The duration of chronic pain, both of somatic and visceral origin, is arbitrarily set at
three months or longer.3 For IBS patients, The Rome III criteria define chronic recurrent
abdominal pain, as present at least 3 days a month in the last three months, with the
unset at least before 6 months.4 In contrast, acute pain is an instant reaction to noxious
or potentially noxious stimuli, declines within the time interval necessary for healing
and serves an useful temporary physiological purpose, motivating the body to protect
the organ while it heals.5 Up until fifteen years ago, most information on underlying
basic mechanisms of pain had been derived from experimental studies of somatic
nociception, the neural processing of noxious stimuli on e.g. skin, muscles or joints.
Chronic pain models were generally based on these studies, assuming that the same
neurological mechanisms are responsible for all forms of pain. In the past fifteen years
it became evident that both mechanisms and presentation of visceral and somatic pain
differ at various levels. Visceral sensations may even differ between organs.6,7 Chronic
abdominal pain is neurobiologically considered to be visceral pain, i.e. pain arising from
internal organs. It is manifested in an acute, recurrent or chronic form and is vague,
diffuse and poorly defined by patients. The intensity of the visceral pain is poorly
related to the magnitude of the internal injury and is often accompanied by attenuated
motor reflexes and signs of autonomic dysfunction such as nausea, sweating and pallor.
Visceral pain may be associated with secondary pain referred to the body surface with
or without cutaneous or muscular hypo‐ or hyperalgesia. Acute visceral pain may result
from various etiological factors including inflammation, infection, mechanical wall
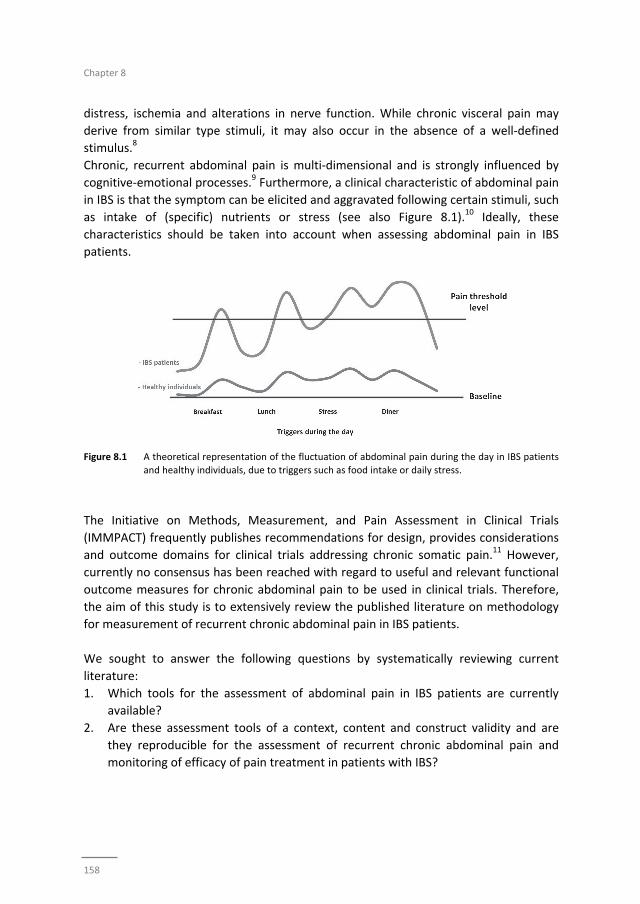
Chapter 8
158
distress, ischemia and alterations in nerve function. While chronic visceral pain may
derive from similar type stimuli, it may also occur in the absence of a well‐defined
stimulus.8
Chronic, recurrent abdominal pain is multi‐dimensional and is strongly influenced by
cognitive‐emotional processes.9 Furthermore, a clinical characteristic of abdominal pain
in IBS is that the symptom can be elicited and aggravated following certain stimuli, such
as intake of (specific) nutrients or stress (see also Figure 8.1).10 Ideally, these
characteristics should be taken into account when assessing abdominal pain in IBS
patients.
Figure 8.1 A theoretical representation of the fluctuation of abdominal pain during the day in IBS patients
and healthy individuals, due to triggers such as food intake or daily stress.
The Initiative on Methods, Measurement, and Pain Assessment in Clinical Trials
(IMMPACT) frequently publishes recommendations for design, provides considerations
and outcome domains for clinical trials addressing chronic somatic pain.11 However,
currently no consensus has been reached with regard to useful and relevant functional
outcome measures for chronic abdominal pain to be used in clinical trials. Therefore,
the aim of this study is to extensively review the published literature on methodology
for measurement of recurrent chronic abdominal pain in IBS patients.
We sought to answer the following questions by systematically reviewing current
literature:
1. Which tools for the assessment of abdominal pain in IBS patients are currently
available?
2. Are these assessment tools of a context, content and construct validity and are
they reproducible for the assessment of recurrent chronic abdominal pain and
monitoring of efficacy of pain treatment in patients with IBS?
Measurement of abdominal pain in IBS
159
Methods
Search strategy
A structured search in the PubMed / Medline databases was performed, using the
following MeSH terms: (pain measurement OR pain assessment) AND (irritable bowel
syndrome OR abdominal pain OR visceral pain). The following filters were used:
Humans; English; Adult: 19+ years. Additional search terms, i.e. pain questionnaires,
pain scales, pain trigger, pain aggravator, functional bowel disease, have been used as
verification of the search results. Studies assessing non‐GI related pain and pain caused
by malignancy or inflammatory disease, were excluded, due to neurobiological
differences in pain processing and clinical presentation.
Article selection
Evaluation of articles and quality assessment was performed by two independent
researchers (Z.M. and D.K.). All articles were screened based on title and abstract.
Articles meeting the inclusion criteria were selected for full‐text review. References of
selected articles were scanned and if suitable included. All methods used to measure
abdominal pain in patients with IBS were listed and if available, evidence of validity and
reliability evaluated. Both reviewers agreed on inclusion of the specific articles. In case
of disagreement a third reviewer (A.M.) decided regarding the inclusion.
The outcomes of interest with regard to this review were the following parameters: the
method of pain measurement in IBS patients, the content and construct validity,
internal consistency, test‐retest reliability and responsiveness of quantification of
chronic abdominal pain and monitoring of efficacy of abdominal pain treatment in IBS
patients.
Content validity refers to the extent to which the instrument measures the symptoms
that are indicative to its objective.12 Construct validity indicates to the degree of
correlation between related instruments measuring the same symptoms (e.g.
abdominal pain), expressed by the Pearson product‐moment correlation coefficient and
referred to as Pearson’s r.13,14 Internal consistency, expressed by Cronbach α
coefficient, indicates the correlation between different items of the same instrument,
which are expected to measure a similar or the same general construct.15
Responsiveness is the ability to detect meaningful change in symptoms over time, while
the test‐retest reliability, also referred to as repeatability or retest reliability, often
expressed by the intraclass correlation coefficient (ICC) or by the Cronbach α, indicates
the correlation between the same test items, scored under the same conditions, but at
different time points.16
Chapter 8
160
Results
An extensive search was performed to review the available literature on methods to
measure recurrent chronic abdominal pain with focus on IBS. The number of hits was
533 (January 1987 – June 2015). After abstract and full text review 110 articles were
included.
The reports included in this review can roughly be divided in four different categories of
instruments to assess abdominal pain: (i) single‐item (unidimensional) measures, (ii)
multi‐item measures, which can be uni‐ or multidimensional; i.e. general pain
inventories, specific pain‐dimension inventories, and general GI‐symptom severity
questionnaires, (iii) ‘real time’ or ‘momentary’ assessment symptoms, and (iv)
provocation tests. Several studies have combined more than one instrument.
Single item measure of pain intensity (Table 8.1)
Unidimensional, single‐item measures of abdominal pain intensity are widely used and
are considered accepted methods to measure acute pain in general.17 The list of the
included manuscripts, using three different single‐item instruments for the assessment
of abdominal pain is shown in Table 8.1. All three methods have been used for the
assessment of one dimension of pain in IBS patients, i.e. the intensity.
‐ Visual Analogue Scale (VAS)18‐32 is a simple, fast and easy‐to‐use method to measure
pain. A 100 mm horizontal line is anchored by two (verbal) descriptions: 0 mm
indicating ‘no pain’ and 100 mm indicating ‘worst pain bearable’. Three studies used
a VAS with six severity descriptors under the VAS‐line. The recall period varies across
studies included in this review. The VAS is frequently used in studies to assess
abdominal pain in IBS patients, but it is not psychometrically tested in the target
population.
‐ Numeric Rating Scale (NRS)1,21,33‐46 is a segmented numeric scale, using whole
numbers as possible options, with various iterations, with the lowest value of 0 or 1
as ‘no pain’ to the maximum number as ‘worst pain bearable’. The included studies in
this review used a 5‐point, 9‐point, 10‐point, 11‐point and 21‐point NRS for the
assessment of abdominal pain. The NRS were used for repeated daily pain
assessment (diaries) with a recall period of one day, or for a single pain assessment
with longer recall periods. In particular the 10‐point NRS has been well
psychometrically tested in IBS patients, showed appropriate change in response to
treatment and correlated well to the overall GI symptom severity. The construct and
discriminant validity, as well as the clinical responsiveness of the abdominal pain NRS
was reported as ‘excellent’.35
‐ Verbal rating Scale (VRS)47 is a verbal variant of the NRS or uses verbal ordinal
descriptions of pain. It is favoured in situations when patients are not able to fill in a
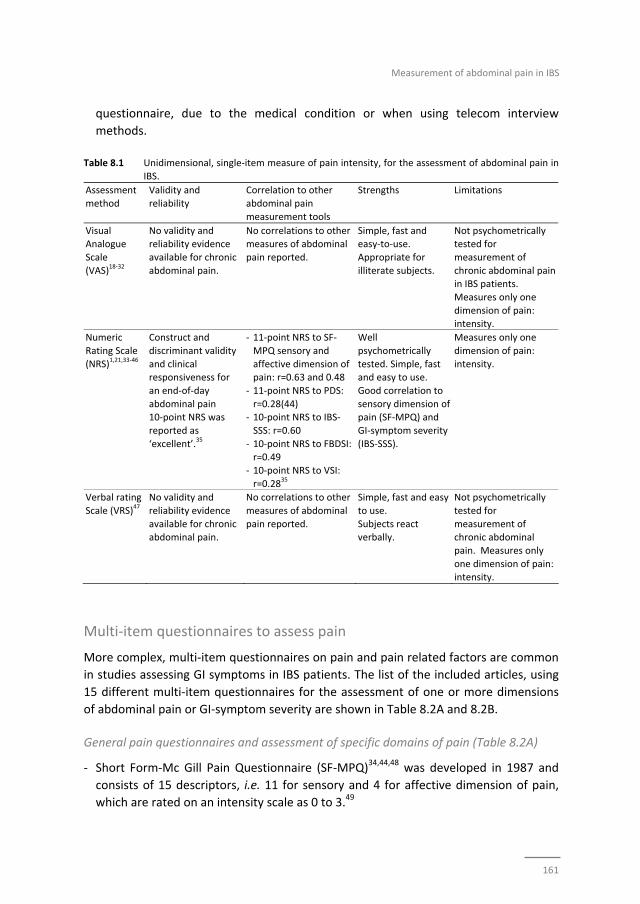
Measurement of abdominal pain in IBS
161
questionnaire, due to the medical condition or when using telecom interview
methods.
Table 8.1 Unidimensional, single‐item measure of pain intensity, for the assessment of abdominal pain in
IBS.
Assessment
method
Validity and
reliability
Correlation to other
abdominal pain
measurement tools
Strengths Limitations
Visual Analogue
Scale
(VAS)18‐32
No validity and reliability evidence
available for chronic
abdominal pain.
No correlations to other measures of abdominal
pain reported.
Simple, fast and easy‐to‐use.
Appropriate for
illiterate subjects.
Not psychometrically tested for
measurement of
chronic abdominal pain in IBS patients.
Measures only one
dimension of pain: intensity.
Numeric
Rating Scale
(NRS)1,21,33‐46
Construct and
discriminant validity
and clinical responsiveness for
an end‐of‐day
abdominal pain 10‐point NRS was
reported as
‘excellent’.35
‐ 11‐point NRS to SF‐
MPQ sensory and
affective dimension of pain: r=0.63 and 0.48
‐ 11‐point NRS to PDS:
r=0.28(44) ‐ 10‐point NRS to IBS‐
SSS: r=0.60
‐ 10‐point NRS to FBDSI: r=0.49
‐ 10‐point NRS to VSI:
r=0.2835
Well
psychometrically
tested. Simple, fast and easy to use.
Good correlation to
sensory dimension of pain (SF‐MPQ) and
GI‐symptom severity
(IBS‐SSS).
Measures only one
dimension of pain:
intensity.
Verbal rating
Scale (VRS)47
No validity and
reliability evidence
available for chronic abdominal pain.
No correlations to other
measures of abdominal
pain reported.
Simple, fast and easy
to use.
Subjects react verbally.
Not psychometrically
tested for
measurement of chronic abdominal
pain. Measures only
one dimension of pain: intensity.
Multi‐item questionnaires to assess pain
More complex, multi‐item questionnaires on pain and pain related factors are common
in studies assessing GI symptoms in IBS patients. The list of the included articles, using
15 different multi‐item questionnaires for the assessment of one or more dimensions
of abdominal pain or GI‐symptom severity are shown in Table 8.2A and 8.2B.
General pain questionnaires and assessment of specific domains of pain (Table 8.2A)
‐ Short Form‐Mc Gill Pain Questionnaire (SF‐MPQ)34,44,48 was developed in 1987 and
consists of 15 descriptors, i.e. 11 for sensory and 4 for affective dimension of pain,
which are rated on an intensity scale as 0 to 3.49
Chapter 8
162
‐ Brief Pain Inventory (BPI)50 is developed in 1994 to measure cancer pain. Using a
10‐point NRS the BPI assesses pain intensity at the time of responding and during the
last week as well as the effect of pain on daily function of the subjects.51
‐ Pain Severity Scale of the West Haven Yale Multidimensional Pain Inventory
(WHYMPI)(52) is developed in 1985 and consists of 52‐items, using a 7‐point NRS
response scale. The recall period varies per question. Most items are based on a
recall period of one week. The questionnaire is divided into 3 parts focussing on pain
experience, including pain severity, the perceived response of others to patient’s pain
and the effect of pain on daily life.53
‐ Pain Discomfort Scale (PDS)34,44 is a 10‐item instrument with a 5‐point response scale.
It has been developed in 1991 to briefly measure the chronic pain affect, i.e. pain‐
related suffering. The questions are not based on a specific recall period.54 The scale
has not been tested psychometrically in IBS patients.
‐ Pain Vigilance and Awareness Questionnaire (PVAQ)38 is a 16‐item measure assessing
pain awareness on a 6‐point scale, developed in 1997, focusing on awareness,
vigilance, preoccupation and observation of pain in general, which may influence
perceived pain severity and other pain responses.55 The scale is not psychometrically
tested in IBS patients.
‐ Visceral Sensitivity Index (VSI)33,35,36,38,56 is a 15‐item questionnaire scored on a 6‐
point Likert scale, developed and validated in an IBS population to assess GI‐
symptom specific anxiety and hypervigilance that may accompany misappraisals of
GI‐specific sensation and discomfort.33,56
Evidence for the use of the listed multi‐item questionnaires for the assessment of pain
(Table 8.2A):
Several general pain questionnaires assessing multiple dimensions of somatic chronic
pain have been developed over the years. Some of these instruments have been used
to assess abdominal pain in IBS patients (i.e. SF‐MPQ, BPI, Pain Severity Scale of
WHYMPI). However these questioners lack validation for this indication.
Chronic pain consists of a multitude of dimensions. A model of pain was described by
Melzack et al. in 1968, stating that psychological properties of pain could be divided in
sensory‐discriminative, motivational‐affective and cognitive‐evaluative dimensions.9
Questionnaires focusing on the latter two dimensions of pain have been used in studies
included in this review. Measuring a related construct, the PDS correlated significantly
to sensory pain (r=0.28) and affective pain measurement by the SF‐MPQ (r=0.42), as
well as to measurement of pain intensity by an 11‐point NRS (r=0.28) in IBS
patients.34,44 This is also true for the VSI, which has been tested in IBS patient groups.
The scale significantly correlated to abdominal pain intensity (r=0.35) as assessed by a
10‐point NRS in IBS patients.35 The concurrent, divergent and discriminant validity of
the VSI was reported as ‘good’.33,56
The PVAQ has not been psychometrically tested in an IBS patient population.
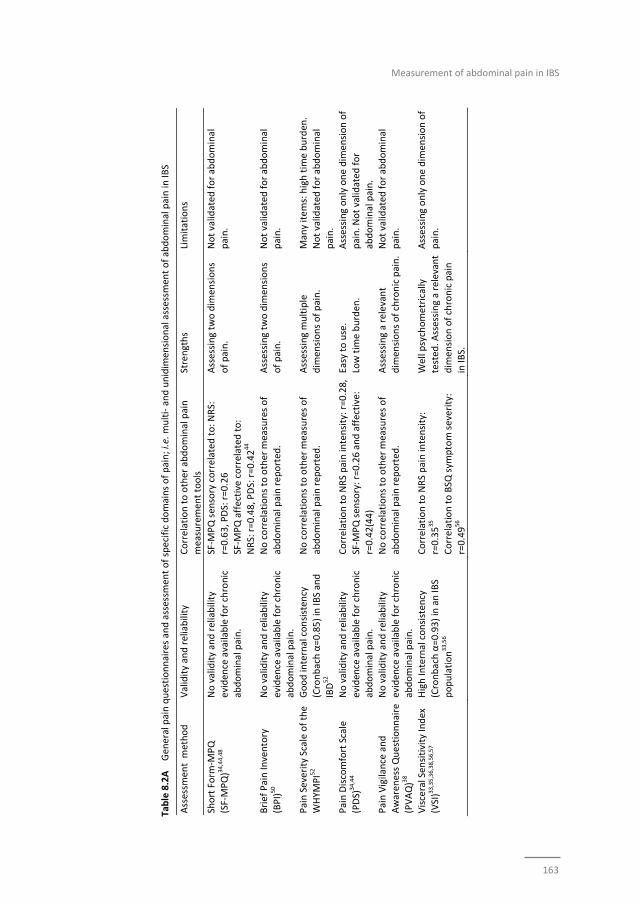
Measurement of abdominal pain in IBS
163
Table 8.2A Gen
eral pain questionnaires and assessm
ent of specific domains of pain; i.e. m
ulti‐ and unidim
ensional assessm
ent of abdominal pain in
IBS
Assessm
ent m
ethod
Validity and reliability
Correlation to other abdominal pain
measuremen
t tools
Strengths
Limitations
Short Form
‐MPQ
(SF‐MPQ)34,44,48
No validity and reliability
eviden
ce available for chronic
abdominal pain.
SF‐M
PQ sen
sory correlated
to: N
RS:
r=0.63, PDS: r=0.26
SF‐M
PQ affective correlated
to:
NRS: r=0.48, PDS: r=0.4244
Assessing tw
o dim
ensions
of pain.
Not validated
for abdominal
pain.
Brief Pain Inventory
(BPI)50
No validity and reliability
eviden
ce available for chronic
abdominal pain.
No correlations to other m
easures of
abdominal pain rep
orted
.
Assessing tw
o dim
ensions
of pain.
Not validated
for abdominal
pain.
Pain Severity Scale of the
WHYM
PI52
Good internal consisten
cy
(Cronbach α=0.85) in IB
S and
IBD52
No correlations to other m
easures of
abdominal pain rep
orted
.
Assessing multiple
dim
ensions of pain.
Many items: high tim
e burden
.
Not validated
for abdominal
pain.
Pain Discomfort Scale
(PDS)
34,44
No validity and reliability
eviden
ce available for chronic
abdominal pain.
Correlation to NRS pain intensity: r=0.28,
SF‐M
PQ sen
sory: r=0.26 and affective:
r=0.42(44)
Easy to use.
Low tim
e burden
.
Assessing only one dim
ension of
pain. N
ot validated for
abdominal pain.
Pain Vigilance and
Awaren
ess Questionnaire
(PVAQ)38
No validity and reliability
eviden
ce available for chronic
abdominal pain.
No correlations to other m
easures of
abdominal pain rep
orted
.
Assessing a relevant
dim
ensions of chronic pain.
Not validated
for abdominal
pain.
Visceral Sen
sitivity Index
(VSI)33,35,36,38,56,57
High Internal consisten
cy
(Cronbach α=0.93) in an IB
S
population33,56
Correlation to NRS pain intensity:
r=0.3535
Correlation to BSQ
sym
ptom severity:
r=0.4956
Well psychometrically
tested
. Assessing a relevant
dim
ension of chronic pain
in IB
S.
Assessing only one dim
ension of
pain.
Chapter 8
164
GI‐symptom severity questionnaires (Table 8.2B):
‐ Visual Analogue Scales for IBS (VAS‐IBS)58,59 has been developed and psychometrically
tested in 2007 as a short, patient reported questionnaire to be used in clinical
practice to assess the status over time for patients with established IBS. It consists of
9 VAS scales, assessing bowel habits, bloating and flatulence, vomiting and nausea,
psychological well‐being, the influence on quality of life (QoL) and one VAS scale
assessing the intensity of abdominal pain, with a one‐week recall period. The VAS‐IBS
can be considered a questionnaire scoring general IBS symptoms, with a single
question focusing on abdominal pain.
‐ Gastrointestinal Symptom Rating Scale (GSRS),25,58,60‐66 the original version, is a
15‐item rating scale with 4 possible answers per question with a recall period of one
week. It has been developed in 1988 as an interview‐based rating scale for the
assessment of GI symptoms in patients with IBS and patients with peptic ulcer
disease.60 It was later modified to become a self‐administered questionnaire, with a
7‐point scale used to assess GI symptoms.67 Only the first question focuses on
abdominal pain, the other 14 items assess other GI symptoms.
‐ Gastrointestinal Symptom Rating Scale – IBS (GSRS‐IBS),68,69 developed in 2003, is an
IBS specific GSRS consisting of 13 items with a 7‐point response scale. It assesses IBS‐
related symptoms of which the first two questions focus on abdominal pain in the
past week.68
‐ IBS‐Symptom Severity Scale (IBS‐SSS),35,36,41,70‐75 has been developed in 1997 and is a
frequently used symptom assessment method in IBS trials and cohorts. It consists of
VAS scales, open and binary questions and a figure of the abdomen. There are
9 items with several sub‐items, of which 4 are related to abdominal pain, including
intensity, frequency and location of pain, but also the relation of pain to stool
pattern.70
‐ Functional Bowel Disorder Severity Index (FBDSI)35,36,76 was developed in 1995 to be
used for the selection of patients for research protocols (mild, moderate, severe FBD)
but also for follow up to quantify clinical outcome over time. The score consists of
three easy to obtain variables: current pain by VAS, diagnosis of chronic functional
abdominal pain and the number of physician visits over the previous months.76
‐ Bowel Disease Questionnaire (BDQ)77‐80 was developed in 1989 to differentiate
between non‐ulcer dyspepsia, IBS and organic GI disease. It consists of 46 GI‐
symptom related items, with only 2 questions assessing the severity and frequency of
abdominal pain in the previous two weeks, scored on a 4‐point scale.77
‐ Bowel Symptom Questionnaire (BSQ)56,81‐83 was developed in 1995. It is an extensive
questionnaire of 95 items, with a broad focus, evaluating demographic
characteristics, musculoskeletal symptoms, sleep pattern, appetite, sexual function
and general GI symptoms, including abdominal pain. The items are rated on a
20‐point ordinal scale.81
Measurement of abdominal pain in IBS
165
‐ Symptom severity measures for IBS with constipation (IBS‐C SSM)75 has been
developed in 2014 for specific use in trials targeting IBS‐C patients. It consists of five
daily measures, i.e. abdominal pain, abdominal discomfort, bloating, abdominal
fullness and abdominal cramping. The items are scored on an 11‐point NRS.75
‐ Birmingham IBS symptom scale84,85 has been developed in 2008 as a GI‐symptom
severity measure for IBS and was based on the on the Rome II criteria. It consists of
11 items, which are scored on a 6‐point Likert scale, with a 4‐week recall period. One
of the 14 items measures the frequency of abdominal pain, while the other 13 assess
the stool pattern and its relation to abdominal pain.
Evidence for the use of the GI‐symptom severity questionnaires (Table 8.2B):
A multitude of instruments are currently used in studies that include IBS patients to
assess GI‐symptom severity. It has to be noted that most GI‐specific questionnaires are
psychometrically tested in the target populations as measures of overall GI‐symptom
severity, and not as measures of abdominal pain. Most GI‐symptom severity
questionnaires contain only one or two items on abdominal pain, assessing intensity or
frequency of pain, and may therefore be less suitable for studies focussing on
abdominal pain as primary outcome measure. However, the IBS‐SSS, a frequently used
questionnaire, includes several items related to abdominal pain, i.e. intensity,
frequency per 10 days, location and relation to stool pattern, and has been well
psychometrically tested in IBS patients.70 The full list of GI‐symptom severity
questionnaires and available data on validity, reliability and responsiveness for the
assessment of abdominal pain is presented in Table 8.2B.
“Real time” assessment of symptoms, including pain
Ecological Momentary Assessment (EMA), also referred to as Experience Sampling
Method (ESM), assesses symptoms via a digital device (comparable to a mobile phone),
carried by the participants for several days during the time they are awake. The device
emits an auditory signal randomly and repeatedly and participants are expected to fill
in questions on the device at that particular moment. The questions, that need to be
scored on a Likert scale, always relate to current symptoms (i.e. real time or
momentary symptom assessment), thereby eliminating recall bias.
Evidence for the use of ‘real time’ assessment of pain
EMA / ESM was used only in two studies assessing overall GI symptoms in IBS patients.
Apart from the EMA / ESM the subjects filled in a retrospective daily symptom diary.
The ratings of abdominal pain in this diary overestimated levels reported by EMA.66,88
The EMA or ESM as a method as well as the selected questions to be used still have to
be validated for the assessment of abdominal pain and other GI symptoms in IBS
patients.
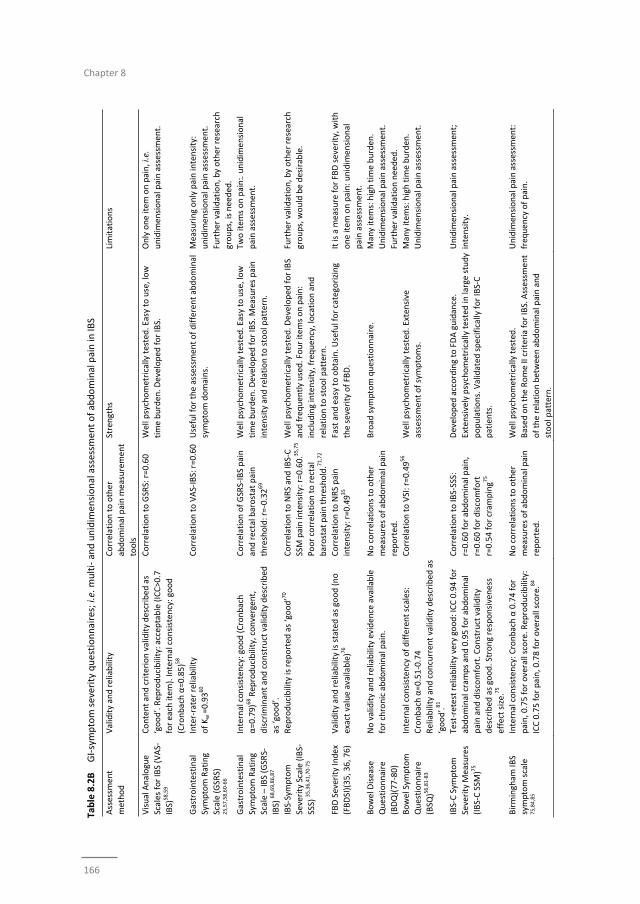
Chapter 8
166
Table 8.2B GI‐symptom severity questionnaires; i.e. m
ulti‐ and unidim
ensional assessm
ent of abdominal pain in
IBS
Assessm
ent
method
Validity and reliability
Correlation to other
abdominal pain measurement
tools
Strengths
Limitations
Visual Analogue
Scales for IBS (VAS‐
IBS)
58,59
Content and criterion validity described as
‘good’. Rep
roducibility: accep
table (ICC>0.7
for each item
). Internal consisten
cy: good
(Cronbach α=0.85)58
Correlation to GSRS: r=0.60
Well psychometrically tested. Easy to use, low
time burden. D
eveloped
for IBS.
Only one item
on pain, i.e.
unidim
ensional pain assessment.
Gastrointestinal
Symptom Rating
Scale (GSRS)
25,57,58,60‐66
Inter‐rater reliability
of Kw =0.9360
Correlation to VAS‐IBS: r=0.60
Useful for the assessmen
t of different abdominal
symptom domains.
Measuring only pain intensity:
unidim
ensional pain assessment.
Further validation, by other research
groups, is needed.
Gastrointestinal
Symptom Rating
Scale – IBS (GSRS‐
IBS) 68,69,86,87
Internal consisten
cy: good (Cronbach
α=0.79)68 Reproducibility, convergent,
discrim
inant and construct validity described
as ‘good’.
Correlation of GSRS‐IBS pain
and rectal barostat pain
threshold: r=‐0.3269
Well psychometrically tested. Easy to use, low
time burden. D
eveloped
for IBS. M
easures pain
intensity and relation to stool pattern.
Two item
s on pain:. unidim
ensional
pain assessm
ent.
IBS‐Symptom
Severity Scale (IBS‐
SSS) 35,36,41,70‐75
Reproducibility is rep
orted
as ‘good’70
Correlation to NRS and IBS‐C
SSM pain intensity: r=0.60.35,75
Poor correlation to rectal
barostat pain threshold.71,72
Well psychometrically tested. D
eveloped
for IBS
and frequen
tly used. Four item
s on pain:
including intensity, frequen
cy, location and
relation to stool pattern.
Further validation, by other research
groups, would be desirable.
FBD Severity Index
(FBDSI)(35, 36, 76)
Validity and reliability is stated as good (no
exact value available)76
Correlation to NRS pain
intensity: r=0.4935
Fast and easy to obtain. U
seful for categorizing
the severity of FBD.
It is a m
easure for FBD severity, w
ith
one item
on pain: unidim
ensional
pain assessm
ent.
Bowel Disease
Questionnaire
(BDQ)(77‐80)
No validity and reliability evidence available
for chronic abdominal pain.
No correlations to other
measures of abdominal pain
reported.
Broad
sym
ptom questionnaire.
Many item
s: high tim
e burden
.
Unidim
ensional pain assessm
ent.
Further validation needed.
Bowel Sym
ptom
Questionnaire
(BSQ
)56,81‐83
Internal consisten
cy of different scales:
Cronbach α=0.51‐0.74
Reliability and concurren
t validity described
as
‘good’.81
Correlation to VSI: r=0.4956
Well psychometrically tested. Exten
sive
assessment of symptoms.
Many item
s: high tim
e burden
.
Unidim
ensional pain assessm
ent.
IBS‐C Sym
ptom
Severity M
easures
(IBS‐C SSM
)75
Test‐retest reliability very good: ICC 0.94 for
abdominal cramps and 0.95 for abdominal
pain and discomfort. Construct validity
described
as good. Strong responsiveness
effect size.
75
Correlation to IBS‐SSS:
r=0.60 for abdominal pain,
r=0.60 for discomfort
r=0.54 for cram
ping7
5
Developed
according to FDA guidance.
Extensively psychometrically tested in
large study
populations. Validated
specifically for IBS‐C
patients.
Unidim
ensional pain assessm
ent;
intensity.
Birmingham
IBS
symptom scale
75,84,85
Internal consisten
cy: Cronbach α 0.74 for
pain, 0.75 for overall score. R
eproducibility:
ICC 0.75 for pain, 0.78 for overall score.84
No correlations to other
measures of abdominal pain
reported.
Well psychometrically tested.
Based on the Rome II criteria for IBS. Assessment
of the relation between abdominal pain and
stool pattern.
Unidim
ensional pain assessm
ent:
frequency of pain.
Measurement of abdominal pain in IBS
167
Assessment of abdominal symptoms by provocation tests (Table 8.3):
Provocation tests for the evaluation of visceral sensitivity in patient groups and healthy
controls have become an accepted and frequently used method to discriminate
hypersensitive from normosensitive individuals. It is important to note however, that
given the acute nature of the intervention, these tests are generally not applicable for
evaluation of chronic pain symptoms, but are rather indicative of alterations of
perceptive responses to certain stimuli. Different methods have been developed and
tested, i.e. mechanical intestinal stimulus (balloon distension, most frequently the
rectum, using electronic barostat), nutrient or chemical provocation test (using a meal,
acid or capsaicin), thermal or electric intestinal stimuli and thermal or electric stimuli on
the skin combined with visceral stimuli. The intensity of provoked symptoms (pain,
discomfort or urge) is assessed using a VAS or VRS.
The list of the different provocation tests, is shown in Table 8.3 and Supplementary
information. Several studies have used more than one provocation test and have
combined these with psychometric response scales.
Evidence for the use of provocation tests for the assessment of abdominal pain
(Table 8.3)
It is under debate whether methods employing a provocation or trigger should be used
to quantify chronic abdominal pain. Although several studies observed associations
between increased symptom severity and the presence of visceral hypersensitivity in
IBS patients,62,63,89 pain thresholds measured by rectal barostat only weakly correlate
with spontaneous abdominal pain assessed by the GSRS69 or IBS‐SSS.71,72 While changes
in rectal perception post‐ versus pre‐treatment have been observed in some
studies,90,91 others have not been able to observe any changes in rectal perception,61,65
questioning the role of provocation tests to assess abdominal pain and in particular
response to treatment.
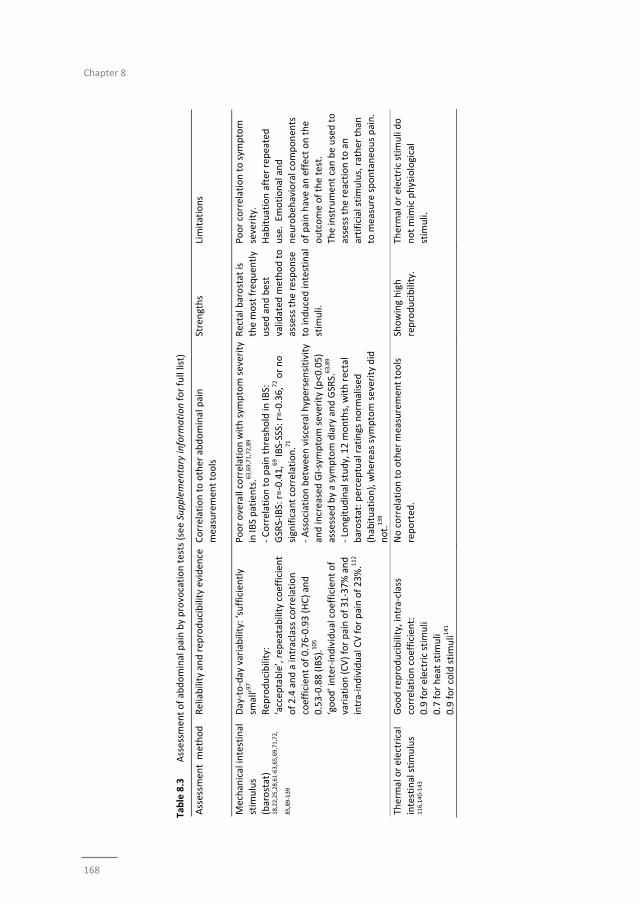
Chapter 8
168
Table 8.3
Assessmen
t of abdominal pain by provocation tests (see Supplementary inform
ation for full list)
Assessm
ent m
ethod
Reliability and rep
roducibility eviden
ce Correlation to other abdominal pain
measuremen
t tools
Strengths
Limitations
Mechan
ical intestinal
stim
ulus
(barostat)
18,22,25,28,61‐63,65,69,71,72,
85,89
‐139
Day‐to‐day variability: ‘sufficiently
small’9
7
Rep
roducibility:
‘accep
table’, repeatability coefficien
t
of 2.4 and a intraclass correlation
coefficient of 0.76‐0.93 (HC) and
0.53‐0.88 (IBS).105
‘good’ inter‐individual coefficient of
variation (CV) for pain of 31‐37% and
intra‐individual CV for pain of 23%.112
Poor overall correlation with sym
ptom severity
in IB
S patients.63,69,71,72,89
‐ Correlation to pain threshold in
IBS:
GSRS‐IBS: r=‐0.41,69 IB
S‐SSS: r=‐0.36,72 or no
significant correlation.71
‐ Association between visceral hypersensitivity
and increased GI‐symptom severity (p<0.05)
assessed
by a symptom diary and GSRS.
63,89
‐ Longitudinal study, 12 m
onths, with rectal
barostat: p
erceptual ratings norm
alised
(habituation), whereas symptom severity did
not.139
Rectal barostat is
the most frequen
tly
used and best
validated
method to
assess the response
to induced intestinal
stim
uli.
Poor correlation to sym
ptom
severity.
Habituation after rep
eated
use. Em
otional and
neu
robeh
avioral componen
ts
of pain have an
effect on the
outcome of the test.
The instrument can be used to
assess the reaction to an
artificial stimulus, rather than
to m
easure spontaneo
us pain.
Thermal or electrical
intestinal stimulus
116,140
‐143
Good rep
roducibility, intra‐class
correlation coefficien
t:
0.9 for electric stim
uli
0.7 for heat stim
uli
0.9 for cold stimuli1
41
No correlation to other m
easurement tools
reported
.
Showing high
reproducibility.
Thermal or electric stim
uli do
not mim
ic physiological
stim
uli.
Measurement of abdominal pain in IBS
169
Discussion
In this review, the currently available instruments for assessment of chronic abdominal
pain in IBS patients have been evaluated. A multitude of instruments is used in
literature to assess chronic abdominal pain in this target population. This may in part be
explained by the lack of generally accepted methods to assess chronic abdominal pain
in IBS patientS. The large variety of assessment tools used in the reviewed studies is a
limitation; the data from the different studies are difficult to compare and therefore
cannot be pooled in a meta‐analysis. Provocation tests, such as the rectal barostat, are
often applied in studies that include IBS patients, and are useful tools to assess an acute
response to artificial intestinal stimuli. However, the outcomes do not correlate well to
chronic abdominal pain severity as assessed by retrospective questionnaires.
Retrospective symptom assessment by paper questionnaires or diaries, has certain
limitations, and in particular carries the risk of recall bias. Nevertheless, at this moment
retrospective GI‐symptom severity scales are frequently used, are easy to apply, and
are the best validated methods for symptom assessment in IBS patients. However,
these questionnaires in general include only the assessment of abdominal pain
intensity. Momentary symptom assessment, may be an alternative that can eliminate
recall bias when measuring abdominal pain, but it is a relatively new method in IBS
studies, and validation of the construct of the questions used for momentary
assessment is needed.
Large variety of available questionnaires
While unidimensional single‐item measures, such as the VAS, NRS or VRS, are accepted
methods to measure acute pain, to date, the evidence for their relevance in chronic
abdominal pain assessment is only weak. However, the implementation of these
methods, in particular the NRS, in a repeated measures approach (diaries) has proven
to be useful. Therefore, the Food and Drugs Administration (FDA) has recommended
the use of a 7‐day mean of an end‐of‐day 11‐point NRS as a primary endpoint for
studies assessing abdominal pain in IBS patients.144 This method has been
demonstrated to have the ability to identify responders to therapy in a number of large
trials using linaclotide.40,46 However, post‐hoc analysis of trial data have also shown that
FDA Responder endpoints represent a rigorous and stringent standard, which is able to
distinguish an efficacious therapeutic agent from a placebo ‐ which is critically
important in a field where the placebo‐response rate has traditionally been quite high,
but fails to provide adequate measures of overall drug efficacy. While responder
endpoints may be useful for assessing if a treatment warrants FDA marketing approval,
they provide limited information for the clinician to make treatment decisions specific
to the individual patient’s symptoms and may underestimate clinical response.145
Furthermore, there is no study published or available that has presented data on
validity and reliability of the end‐of‐day 11‐point NRS in IBS patients. However, an end‐
Chapter 8
170
of‐day 10‐point NRS for abdominal pain has been psychometrically tested in a large IBS
population with good results.35 Furthermore, using an end‐of‐day 11‐point NRS,
Lackner et al. have shown that questionnaires that take into account a longer recall
period (i.e. a week) are more prone to recall bias compared to the end‐of‐day
approach.45 This indicates that repeated measures over a certain period of time may
provide a more representative impression of IBS symptom course, when compared to
the end‐of‐week questionnaires. It needs to be acknowledged that measuring only one
dimension of pain, i.e. intensity, as the VAS, VRS and NRS scales do, may be sufficient
in specific medical conditions, such as acute cholecystitis. Chronic abdominal pain,
however, is complex and includes more dimensions than only the intensity of pain.
Therefore these instruments seem less useful for the measurement of chronic
abdominal pain as they might not capture the complexity of pain perception IBS
patients.
The multi‐item questionnaires used in the reviewed articles focus on multiple pain
dimensions (SF‐MPQ, BDI, WHYMPI), on specific pain‐related aspects (PDS, VSI, PVAQ),
or on GI symptoms in general, including pain (VAS‐IBS, GSRS, GSRS‐IBS, IBS‐SSS, FDBSI,
BDQ, BSQ, IBS‐C SSM, Birmingham IBS symptom scale). The general pain questionnaires
have all been developed and psychometrically tested in patients with chronic somatic
and/or neuropathic pain49,51,53,146,147 and have been implemented in studies assessing
chronic abdominal pain in IBS without proper validation in this specific area. This also
accounts for the questionnaires assessing pain discomfort (PDS)54 and pain vigilance
and awareness (PVAQ).55 The VSI has been developed and validated for use in patients
with GI disorders, and showed to be a valuable tool to measure anxiety related to GI
symptoms, such as abdominal pain, in IBS patients.33,56 Endogenous stressors, such as
GI‐symptom related anxiety, are part of the motivational‐affective dimension of pain
and play an important role in chronic abdominal pain.148
The GI‐symptom severity questionnaires have been developed for the assessment of GI
symptoms in general and are psychometrically tested in IBS patients for this purpose.
These questionnaires focus on a variety of symptoms, such as bowel habits, bloating,
flatulence, vomiting, nausea, which are very relevant when monitoring effects of
therapies in IBS patients. However, most GI‐specific questionnaires do not focus
enough on abdominal pain (i.e. measure only pain intensity) to be used as the only
measurement in trials reporting pain as a primary or secondary outcome. Of these
questionnaires (presented in Table 8.2B), the IBS‐SSS includes the largest number of
questions related to abdominal pain, i.e. intensity, frequency, location and relation to
stool pattern. This questionnaire has been well psychometrically tested and is
frequently used in IBS studies. Based on the current literature it appears to be the best
retrospective instrument that can be used for the assessment of broader GI symptom
severity in IBS patients, including abdominal pain.
Measurement of abdominal pain in IBS
171
None of the available questionnaires include the assessment of possible triggers of
abdominal pain when measuring symptoms. As therapies may focus on the abatement
of a trigger, thereby preventing the occurrence of a pain episode instead of treating it,
this may be a relevant topic in IBS trials. The difficulty however is that patients do not
always consciously relate specific factors, such as diet or stress, to their symptoms, and
thus cannot report this in a retrospective questionnaire.
Limitations of retrospective questionnaires
A major limitation of retrospective questionnaires, which are based on
autobiographical memory, is recall bias, leading to abatement of accuracy of reports.
Therefore, retrospective data, regardless of their content validity, may not be a reliable
reflection of symptoms over a set period, but rather a reconstruction of a few specific
moments.149 Studies have dealt with this issue by using end‐of‐day diaries or assessing
shorter recall periods in questionnaires.35,45,64,89,150 Although the effect of recall bias can
be decreased by these methods,45 the assessments are still based on the retrospective
principle; asking responders to recall symptoms. In addition, assessment of chronic
symptoms such as pain by retrospective questionnaires poses a second problem
concerning ecological validity of the data. Symptoms and experiences may be affected
and influenced by the circumstances in which they occur. Questionnaires are
completed at a research facility or at home and these situations usually differ from
moments when symptoms are at worst or from situations in which symptoms are
triggered, therefore possible leading to bias by differences in environment.151
Furthermore, lack of patient compliance is an important disturbing factor in paper
questionnaires. Studies that employed paper diaries in a population of patients with
chronic somatic pain to measure symptoms have resulted in low compliance rates: 11%
actual compliance and up to 80% fake compliance, presumably resulting from filling in
diaries not during the indicated time window but afterwards.152 This limitation of fake
compliance can be eliminated by the use of electronic patient reported outcomes
instead of paper versions or by calling call into an interactive voice response system.145
‘Real time’ assessment of pain; a better alternative?
EMA or ESM, based on digital momentary or real life assessment of symptoms, is a
relatively new method in this research field.66,88 The method may help to overcome the
above described limitations of retrospective questionnaires related to recall bias. It has
been validated and is frequently used in psychiatric and psychological studies.153
Variability of symptoms during the day (see Figure 8.1) can be assessed, since repeated
measures are used. We have recently demonstrated that IBS patients report higher
scores for abdominal pain in retrospective questionnaires compared to ESM, with a
tendency to report peak rather than average pain scores, while this was not found for
other GI‐symptoms such as bloating, flatulence or belching.66 Furthermore, EMA / ESM
Chapter 8
172
may allow triggers of pain to be examined in more detail, by taking into account
situations or symptoms, scored at the previous assessment moment, that have
occurred prior to a pain episode. Furthermore, ecological bias may be reduced by
adding questions that relate to the daily life situations or conditions at moments of
increased symptom severity. However, a relevant limitation of this method is the higher
patient burden, since subjects are expected to respond at multiple random moments
during daily life.154 Therefore the number of questions should be restricted.
Although it is a promising tool, more research is needed to validate this method in the
target population. A crucial step in development of this tool is the selection and
validation of questions that are programmed into the EMA / ESM, since content,
construct and criterion validity are dependent of the selected questions.
Provocation tests; useful for the assessment of chronic abdominal pain?
Provocation tests have been used to evaluate efficacy of therapies and for mechanistic
studies, focussing on the pathophysiology of visceral pain and for the interaction with
somatic pain in IBS patients. Provocation tests are currently the best available option to
measure the response to visceral stimuli in human subjects and are therefore
important for mechanistic research of visceral sensitivity. Rectal barostat using balloon
distention is the most frequently used and best validated method in this field. It may be
used in combination with methods to assess peripheral and central nervous system
signal processing, e.g. fMRI, or in combination with somatic pain stimuli (e.g. on the
skin), to improve our understanding of visceral pain processing. Based on these studies,
visceral hypersensitivity is considered by many as a biological marker or a ‘hallmark’ for
IBS.131
However, the exact role and value of provocation tests in the quantification of visceral
pain intensity is not clear. These methods do not assess spontaneous pain, neither do
they correlate well to symptom severity or to ‘normal evoked pain’ in the every‐day life
of IBS patients.69,89
In summary, the current level of evidence for the use of provocation tests in the
assessment and follow‐up of chronic abdominal pain in IBS patients is rather low. More
insight into the pathophysiology of visceral sensations and development of a visceral
pain model is required in order to be able to develop more adequate tools for objective
assessment of chronic abdominal pain.
Future steps
An uniformly accepted model, combining and explaining the different dimensions of
chronic abdominal pain in IBS is currently not available. For reasons of tool
development for measuring responses to drug therapies and in order to be able to
measure the full spectrum of this symptom in IBS patients (see also Table 8.4), a
validated combination of instruments is needed that takes into account not only pain
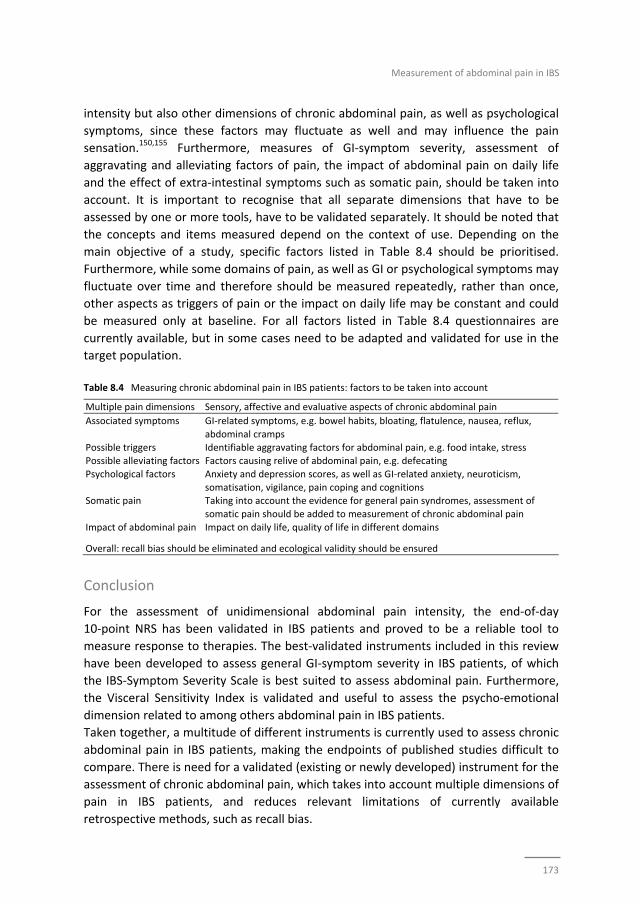
Measurement of abdominal pain in IBS
173
intensity but also other dimensions of chronic abdominal pain, as well as psychological
symptoms, since these factors may fluctuate as well and may influence the pain
sensation.150,155 Furthermore, measures of GI‐symptom severity, assessment of
aggravating and alleviating factors of pain, the impact of abdominal pain on daily life
and the effect of extra‐intestinal symptoms such as somatic pain, should be taken into
account. It is important to recognise that all separate dimensions that have to be
assessed by one or more tools, have to be validated separately. It should be noted that
the concepts and items measured depend on the context of use. Depending on the
main objective of a study, specific factors listed in Table 8.4 should be prioritised.
Furthermore, while some domains of pain, as well as GI or psychological symptoms may
fluctuate over time and therefore should be measured repeatedly, rather than once,
other aspects as triggers of pain or the impact on daily life may be constant and could
be measured only at baseline. For all factors listed in Table 8.4 questionnaires are
currently available, but in some cases need to be adapted and validated for use in the
target population.
Table 8.4 Measuring chronic abdominal pain in IBS patients: factors to be taken into account
Multiple pain dimensions Sensory, affective and evaluative aspects of chronic abdominal pain
Associated symptoms GI‐related symptoms, e.g. bowel habits, bloating, flatulence, nausea, reflux,
abdominal cramps
Possible triggers Identifiable aggravating factors for abdominal pain, e.g. food intake, stress Possible alleviating factors Factors causing relive of abdominal pain, e.g. defecating
Psychological factors Anxiety and depression scores, as well as GI‐related anxiety, neuroticism,
somatisation, vigilance, pain coping and cognitions Somatic pain Taking into account the evidence for general pain syndromes, assessment of
somatic pain should be added to measurement of chronic abdominal pain
Impact of abdominal pain Impact on daily life, quality of life in different domains
Overall: recall bias should be eliminated and ecological validity should be ensured
Conclusion
For the assessment of unidimensional abdominal pain intensity, the end‐of‐day
10‐point NRS has been validated in IBS patients and proved to be a reliable tool to
measure response to therapies. The best‐validated instruments included in this review
have been developed to assess general GI‐symptom severity in IBS patients, of which
the IBS‐Symptom Severity Scale is best suited to assess abdominal pain. Furthermore,
the Visceral Sensitivity Index is validated and useful to assess the psycho‐emotional
dimension related to among others abdominal pain in IBS patients.
Taken together, a multitude of different instruments is currently used to assess chronic
abdominal pain in IBS patients, making the endpoints of published studies difficult to
compare. There is need for a validated (existing or newly developed) instrument for the
assessment of chronic abdominal pain, which takes into account multiple dimensions of
pain in IBS patients, and reduces relevant limitations of currently available
retrospective methods, such as recall bias.
Chapter 8
174
References
1. Spiegel B, Strickland A, Naliboff BD, Mayer EA, Chang L. Predictors of patient‐assessed illness severity in irritable bowel syndrome. Am J Gastroenterol. 2008;103:2536‐43.
2. IASP. International Association for the Study of Pain: Pain Terminology 2011. http://www.iasp‐
pain.org/AM/Template.cfm?Section=Pain_Defi...isplay.cfm&ContentID=1728. 3. Treede RD, Rief W, Barke A, Aziz Q, Bennett MI, Benoliel R, et al. A classification of chronic pain for ICD‐
11. Pain. 2015;156:1003‐7.
4. Longstreth GF, Thompson WG, Chey WD, Houghton LA, Mearin F, Spiller RC. Functional bowel disorders. Gastroenterology. 2006;130:1480‐91.
5. Fornasari D. Pain mechanisms in patients with chronic pain. Clin Drug Investig. 2012;32 Suppl 1:45‐52.
6. Cervero F. Visceral versus somatic pain: similarities and differences. Dig Dis. 2009;27 Suppl 1:3‐10. 7. Loeser JD, Treede RD. The Kyoto protocol of IASP Basic Pain Terminology. Pain. 2008;137:473‐7.
8. Keszthelyi D, Troost FJ, Simren M, Ludidi S, Kruimel JW, Conchillo JM, et al. Revisiting concepts of
visceral nociception in irritable bowel syndrome. Eur J Pain. 2012;16:1444‐54. 9. Melzack R. Sensory, motivational and central control determinants of pain: A new conceptual model.
The Skin Senses Springfield, IL, Charles C Thomas1968. p. 423‐43.
10. Simren M, Mansson A, Langkilde AM, Svedlund J, Abrahamsson H, Bengtsson U, et al. Food‐related gastrointestinal symptoms in the irritable bowel syndrome. Digestion. 2001;63:108‐15.
11. Dworkin RH, Turk DC, Peirce‐Sandner S, Burke LB, Farrar JT, Gilron I, et al. Considerations for improving
assay sensitivity in chronic pain clinical trials: IMMPACT recommendations. Pain. 2012;153:1148‐58. 12. Lawshe CH. A quantitative approach to content validity. Personnel Psychology. 1975;28:563–75.
13. Campell DTaF, D. W. Convergent and discriminant validation by the multitrait‐multimethod matrix.
Psychological Bulletin. 1959;56:81‐105. 14. Pearson K. On further methods of determining correlation. London: Dulau and Co Cambridge: Draper’s
Company Research Memoirs (Biometric Series IV). 1907;39.
15. Cronbach LJ, Warrington WG. Time‐limit tests: estimating their reliability and degree of speeding. Psychometrika. 1951;16:167‐88.
16. Atkinson G, Nevill AM. Statistical methods for assessing measurement error (reliability) in variables
relevant to sports medicine. Sports Med. 1998;26:217‐38. 17. Hjermstad MJ, Fayers PM, Haugen DF, Caraceni A, Hanks GW, Loge JH, et al. Studies comparing
Numerical Rating Scales, Verbal Rating Scales, and Visual Analogue Scales for assessment of pain
intensity in adults: a systematic literature review. J Pain Symptom Manage. 2011;41:1073‐93. 18. Guthrie E, Barlow J, Fernandes L, Ratcliffe J, Read N, Thompson DG, et al. Changes in tolerance to rectal
distension correlate with changes in psychological state in patients with severe irritable bowel
syndrome. Psychosom Med. 2004;66:578‐82. 19. Tanum L, Malt UF. Personality and physical symptoms in nonpsychiatric patients with functional
gastrointestinal disorder. J Psychosom Res. 2001;50:139‐46.
20. Saggioro A. Probiotics in the treatment of irritable bowel syndrome. J Clin Gastroenterol.2004;38(6 Suppl):S104‐6.
21. Chassany O, Bonaz B, Bruley DESVS, Bueno L, Cargill G, Coffin B, et al. Acute exacerbation of pain in
irritable bowel syndrome: efficacy of phloroglucinol/trimethylphloroglucinol. A randomized, double‐blind, placebo‐controlled study. Aliment Pharmacol Ther. 2007;25:1115‐23.
22. Simren M, Agerforz P, Bjornsson ES, Abrahamsson H. Nutrient‐dependent enhancement of rectal
sensitivity in irritable bowel syndrome (IBS). Neurogastroenterol Motil.2007;19:20‐9. 23. Muller‐Lissner SA, Fumagalli I, Bardhan KD, Pace F, Pecher E, Nault B, et al. Tegaserod, a 5‐HT(4)
receptor partial agonist, relieves symptoms in irritable bowel syndrome patients with abdominal pain,
bloating and constipation. Aliment Pharmacol Ther. 2001;15:1655‐66. 24. Muller‐Lissner S, Koch G, Talley NJ, Drossman D, Rueegg P, Dunger‐Baldauf C, et al. Subject's Global
Assessment of Relief: an appropriate method to assess the impact of treatment on irritable bowel
syndrome‐related symptoms in clinical trials. J Clin Epidemiol. 2003;56:310‐6.
Measurement of abdominal pain in IBS
175
25. Klooker TK, Kuiken SD, Lei A, Boeckxstaens GE. Effect of long‐term treatment with octreotide on rectal
sensitivity in patients with non‐constipated irritable bowel syndrome. Aliment Pharmacol Ther. 2007;26:605‐15.
26. Hellstrom PM, Hein J, Bytzer P, Bjornsson E, Kristensen J, Schambye H. Clinical trial: the glucagon‐like
peptide‐1 analogue ROSE‐010 for management of acute pain in patients with irritable bowel syndrome: a randomized, placebo‐controlled, double‐blind study. Aliment Pharmacol Ther. 2009;29:198‐206.
27. Gonlachanvit S, Mahayosnond A, Kullavanijaya P. Effects of chili on postprandial gastrointestinal
symptoms in diarrhoea predominant irritable bowel syndrome: evidence for capsaicin‐sensitive visceral nociception hypersensitivity. Neurogastroenterol Motil.2009;21:23‐32.
28. Khalif IL, Guigley EMM, Makarchuk PA, Golovenko OV, Podmarenkova LF, Dzhanayev YA. Interactions
between Symptoms and Motor and Visceral Sensory Responses of Irritable Bowel Syndrome Patients to Spasmolytics (Antispasmodics). J Gastrointestin Liver Dis. 2009;18:17‐22.
29. Kim ES, Cheon JH, Park JJ, Moon CM, Hong SP, Kim TI, et al. Colonoscopy as an adjunctive method for
the diagnosis of irritable bowel syndrome: focus on pain perception. J Gastroenterol Hepatol. 2010;25:1232‐8.
30. Imai A, Kato M, Ono S, Shimizu Y, Takeda H, Asaka M. Efficacy of carbon dioxide‐insufflating
colonoscopy in patients with irritable bowel syndrome: A randomized double‐blind study. J Gastroenterol Hepatol. 2012;27:1623‐8.
31. Farnam A, Somi MH, Farhang S, Mahdavi N, Ali Besharat M. The therapeutic effect of adding emotional
awareness training to standard medical treatment for irritable bowel syndrome: a randomized clinical trial. J Psychiatr Pract. 2014;20:3‐11.
32. Halmos EP, Power VA, Shepherd SJ, Gibson PR, Muir JG. A diet low in FODMAPs reduces symptoms of
irritable bowel syndrome. Gastroenterology. 2014;146:67‐75 e5. 33. Labus JS, Mayer EA, Chang L, Bolus R, Naliboff BD. The central role of gastrointestinal‐specific anxiety in
irritable bowel syndrome: further validation of the visceral sensitivity index. Psychosom Med.
2007;69:89‐98. 34. Lackner JM, Jaccard J, Blanchard EB. Testing the sequential model of pain processing in irritable bowel
syndrome: a structural equation modeling analysis. Eur J Pain. 2005;9:207‐18.
35. Spiegel B, Bolus R, Harris LA, Lucak S, Naliboff B, Esrailian E, et al. Measuring irritable bowel syndrome patient‐reported outcomes with an abdominal pain numeric rating scale. Aliment Pharmacol Ther.
2009;30:1159‐70.
36. Spiegel BMR, Bolus R, Harris LA, Lucak S, Chey WD, Sayuk G, et al. Characterizing abdominal pain in IBS: guidance for study inclusion criteria, outcome measurement and clinical practice. Aliment Pharmacol
Ther. 2010;32:1192‐202.
37. Masand PS, Pae CU, Krulewicz S, Peindl K, Mannelli P, Varia IM, et al. A double‐blind, randomized, placebo‐controlled trial of paroxetine controlled‐release in irritable bowel syndrome. Psychosomatics.
2009;50:78‐86.
38. Craske MG, Wolitzky‐Taylor KB, Labus J, Wu S, Frese M, Mayer EA, et al. A cognitive‐behavioral treatment for irritable bowel syndrome using interoceptive exposure to visceral sensations. Behav Res
Ther. 2011;49:413‐21.
39. Hellstrom PM, Saito YA, Bytzer P, Tack J, Mueller‐Lissner S, Chang L. Characteristics of acute pain attacks in patients with irritable bowel syndrome meeting Rome III criteria. Am J Gastroenterol.
2011;106:1299‐307.
40. Rao S, Lembo AJ, Shiff SJ, Lavins BJ, Currie MG, Jia XD, et al. A 12‐week, randomized, controlled trial with a 4‐week randomized withdrawal period to evaluate the efficacy and safety of linaclotide in
irritable bowel syndrome with constipation. Am J Gastroenterol. 2012;107:1714‐24; quiz p 25.
41. Tuteja AK, Fang JC, Al‐Suqi M, Stoddard GJ, Hale DC. Double‐blind placebo‐controlled study of mesalamine in post‐infective irritable bowel syndrome ‐ a pilot study. Scand J Gastroenterol.
2012;47:1159‐64.
42. Bouchoucha M, Fysekidis M, Devroede G, Raynaud JJ, Bejou B, Benamouzig R. Abdominal pain localization is associated with non‐diarrheic Rome III functional gastrointestinal disorders.
Neurogastroenterol Motil. 2013;25:686‐93.
43. Lacy BE, Wang F, Bhowal S, Schaefer E, study g. On‐demand hyoscine butylbromide for the treatment of self‐reported functional cramping abdominal pain. Scand J Gastroenterol. 2013;48:926‐35.
Chapter 8
176
44. Lackner JM, Quigley BM. Pain catastrophizing mediates the relationship between worry and pain
suffering in patients with irritable bowel syndrome. Behaviour research and therapy. 2005;43:943‐57. 45. Lackner JM, Jaccard J, Keefer L, Firth R, Carosella AM, Sitrin M, et al. The accuracy of patient‐reported
measures for GI symptoms: a comparison of real time and retrospective reports. Neurogastroenterol
Motil.2014;26:1802‐11. 46. Chey WD, Lembo AJ, Lavins BJ, Shiff SJ, Kurtz CB, Currie MG, et al. Linaclotide for irritable bowel
syndrome with constipation: a 26‐week, randomized, double‐blind, placebo‐controlled trial to evaluate
efficacy and safety. Am J Gastroenterol. 2012;107:1702‐12. 47. Brown PM, Drossman DA, Wood AJ, Cline GA, Frazier KS, Jackson JI, et al. The tryptophan hydroxylase
inhibitor LX1031 shows clinical benefit in patients with nonconstipating irritable bowel syndrome.
Gastroenterology. 2011;141:507‐16. 48. Akbar A, Yiangou Y, Facer P, Brydon WG, Walters JR, Anand P, et al. Expression of the TRPV1 receptor
differs in quiescent inflammatory bowel disease with or without abdominal pain. Gut. 2010;59:767‐74.
49. Melzack R. The short‐form McGill Pain Questionnaire. Pain. 1987;30:191‐7. 50. Brennan BP, Fogarty KV, Roberts JL, Reynolds KA, Pope HG, Jr., Hudson JI. Duloxetine in the treatment
of irritable bowel syndrome: an open‐label pilot study. Hum Psychopharmacol. 2009;24:423‐8.
51. Cleeland CS, Ryan KM. Pain assessment: global use of the Brief Pain Inventory. Ann Acad Med Singapore. 1994;23:129‐38.
52. Seres G, Kovacs Z, Kovacs A, Kerekgyarto O, Sardi K, Demeter P, et al. Different associations of health
related quality of life with pain, psychological distress and coping strategies in patients with irritable bowel syndrome and inflammatory bowel disorder. J Clin Psychol Med Settings. 2008;15:287‐95.
53. Kerns RD, Turk DC, Rudy TE. The West Haven‐Yale Multidimensional Pain Inventory (WHYMPI). Pain.
1985;23:345‐56. 54. Jensen MP, Karoly P, Harris P. Assessing the affective component of chronic pain: development of the
Pain Discomfort Scale. J Psychosom Res. 1991;35:149‐54.
55. McCracken LM. ‘Attention’ to pain in persons with chronic pain: a behavioural approach. Behav Ther. 1997;28:271–84.
56. Labus JS, Bolus R, Chang L, Wiklund I, Naesdal J, Mayer EA, et al. The Visceral Sensitivity Index:
development and validation of a gastrointestinal symptom‐specific anxiety scale. Aliment Pharmacol Ther. 2004;20:89‐97.
57. Jerndal P, Ringstrom G, Agerforz P, Karpefors M, Akkermans LM, Bayati A, et al. Gastrointestinal‐
specific anxiety: an important factor for severity of GI symptoms and quality of life in IBS. Neurogastroenterol Motil.2010;22:646‐e179.
58. Bengtsson M, Ohlsson B, Ulander K. Development and psychometric testing of the Visual Analogue
Scale for Irritable Bowel Syndrome (VAS‐IBS). BMC gastroenterology. 2007;7:16. 59. Bengtsson M, Hammar O, Mandl T, Ohlsson B. Evaluation of gastrointestinal symptoms in different
patient groups using the visual analogue scale for irritable bowel syndrome (VAS‐IBS). BMC
Gastroenterology. 2011;11:122. 60. Svedlund J, Sjodin I, Dotevall G. GSRS‐‐a clinical rating scale for gastrointestinal symptoms in patients
with irritable bowel syndrome and peptic ulcer disease. Dig Dis Sci. 1988;33:129‐34.
61. Kuiken SD, Tytgat GN, Boeckxstaens GE. The selective serotonin reuptake inhibitor fluoxetine does not change rectal sensitivity and symptoms in patients with irritable bowel syndrome: a double blind,
randomized, placebo‐controlled study. Clin Gastroenterol Hepatol. 2003;1:219‐28.
62. Kuiken SD, Lindeboom R, Tytgat GN, Boeckxstaens GE. Relationship between symptoms and hypersensitivity to rectal distension in patients with irritable bowel syndrome. Aliment Pharmacol Ther.
2005;22:157‐64.
63. Ludidi S, Mujagic Z, Jonkers D, Keszthelyi D, Hesselink M, Kruimel J, et al. Markers for visceral hypersensitivity in patients with irritable bowel syndrome. Neurogastroenterol Motil.2014;26:1104‐11.
64. Mujagic Z, Ludidi S, Keszthelyi D, Hesselink MA, Kruimel JW, Lenaerts K, et al. Small intestinal
permeability is increased in diarrhoea predominant IBS, while alterations in gastroduodenal permeability in all IBS subtypes are largely attributable to confounders. Aliment Pharmacol Ther.
2014;40:288‐97.
Measurement of abdominal pain in IBS
177
65. Ludidi S, Jonkers DM, Koning CJ, Kruimel JW, Mulder L, van der Vaart IB, et al. Randomized clinical trial
on the effect of a multispecies probiotic on visceroperception in hypersensitive IBS patients. Neurogastroenterol Motil.2014;26:705‐14.
66. Mujagic Z, Leue C, Vork L, Lousberg R, Jonkers DM, Keszthelyi D, et al. The Experience Sampling Method
‐ a new digital tool for momentary symptom assessment in IBS: an exploratory study. Neurogastroenterol Motil.2015.
67. Revicki DA, Wood M, Wiklund I, Crawley J. Reliability and validity of the Gastrointestinal Symptom
Rating Scale in patients with gastroesophageal reflux disease. Qual Life Res. 1998;7:75‐83. 68. Wiklund IK, Fullerton S, Hawkey CJ, Jones RH, Longstreth GF, Mayer EA, et al. An irritable bowel
syndrome‐specific symptom questionnaire: development and validation. Scand J Gastroenterol.
2003;38:947‐54. 69. Posserud I, Syrous A, Lindstrom L, Tack J, Abrahamsson H, Simren M. Altered rectal perception in
irritable bowel syndrome is associated with symptom severity. Gastroenterology. 2007;133:1113‐23.
70. Francis CY, Morris J, Whorwell PJ. The irritable bowel severity scoring system: a simple method of monitoring irritable bowel syndrome and its progress. Aliment Pharmacol Ther. 1997;11:395‐402.
71. Sabate JM, Veyrac M, Mion F, Siproudhis L, Ducrotte P, Zerbib F, et al. Relationship between rectal
sensitivity, symptoms intensity and quality of life in patients with irritable bowel syndrome. Aliment Pharmacol Ther. 2008;28:484‐90.
72. Kanazawa M, Palsson OS, Thiwan SI, Turner MJ, van Tilburg MA, Gangarosa LM, et al. Contributions of
pain sensitivity and colonic motility to IBS symptom severity and predominant bowel habits. Am J Gastroenterol. 2008;103:2550‐61.
73. Sondergaard B, Olsson J, Ohlson K, Svensson U, Bytzer P, Ekesbo R. Effects of probiotic fermented milk
on symptoms and intestinal flora in patients with irritable bowel syndrome: a randomized, placebo‐controlled trial. Scand J Gastroenterol. 2011;46:663‐72.
74. Annahazi A, Ferrier L, Bezirard V, Leveque M, Eutamene H, Ait‐Belgnaoui A, et al. Luminal cysteine‐
proteases degrade colonic tight junction structure and are responsible for abdominal pain in constipation‐predominant IBS. Am J Gastroenterol. 2013;108:1322‐31.
75. Williams VS, Nelson LM, Fehnel SE, MacDougall J, Carson RT, Tourkodimitris S, et al. Psychometric
validation of symptom severity measures in irritable bowel syndrome with constipation. Aliment Pharmacol Ther. 2014;40:298‐308.
76. Drossman DA, Li ZM, Toner BB, Diamant NE, Creed FH, Thompson D, et al. Functional Bowel Disorders ‐
a Multicenter Comparison of Health‐Status and Development of Illness Severity Index. Dig Dis Sci. 1995;40:986‐95.
77. Talley NJ, Phillips SF, Melton LJ, Wiltgen C, Zinsmeister AR. A Patient Questionnaire to Identify Bowel‐
Disease. Ann Intern Med. 1989;111:671‐4. 78. Neri M, Laterza F, Howell S, Di Gioacchino M, Festi D, Ballone E, et al. Symptoms discriminate irritable
bowel syndrome from organic gastrointestinal diseases and food allergy. Eur J Gastroenterol Hepatol.
2000;12:981‐8. 79. Barbara G, Stanghellini V, De Giorgio R, Cremon C, Cottrell GS, Santini D, et al. Activated mast cells in
proximity to colonic nerves correlate with abdominal pain in irritable bowel syndrome.
Gastroenterology. 2004;126:693‐702. 80. Talley NJ, Phillips SF, Bruce B, Twomey CK, Zinsmeister AR, Melton LJ, 3rd. Relation among personality
and symptoms in nonulcer dyspepsia and the irritable bowel syndrome. Gastroenterology.
1990;99:327‐33. 81. Talley NJ, Boyce PM, Owen BK, Newman P, Paterson KJ. Initial validation of a bowel symptom
questionnaire and measurement of chronic gastrointestinal symptoms in Australians. Aus N Z J Med.
1995;25:302‐8. 82. Schmulson M, Lee OY, Chang L, Naliboff B, Mayer EA. Symptom differences in moderate to severe IBS
patients based on predominant bowel habit. Am J Gastroenterol. 1999;94:2929‐35.
83. Tan S, Tillisch K, Bolus SR, Olivas TI, Spiegel BM, Naliboff B, et al. Traditional Chinese medicine based subgrouping of irritable bowel syndrome patients. Am J Chin Med. 2005;33:365‐79.
84. Roalfe AK, Roberts LM, Wilson S. Evaluation of the Birmingham IBS symptom questionnaire. BMC
Gastroenterology. 2008;8:30.
Chapter 8
178
85. Zhu Y, Wu Z, Ma X, Liu H, Bao C, Yang L, et al. Brain regions involved in moxibustion‐induced analgesia
in irritable bowel syndrome with diarrhea: a functional magnetic resonance imaging study. BMC Complement Altern Med. 2014;14:500.
86. Ljotsson B, Hesser H, Andersson E, Lackner JM, El Alaoui S, Falk L, et al. Provoking symptoms to relieve
symptoms: a randomized controlled dismantling study of exposure therapy in irritable bowel syndrome. Behav Res Ther. 2014;55:27‐39.
87. Fassov J, Lundby L, Worsoe J, Buntzen S, Laurberg S, Krogh K. A randomised, controlled study of small
intestinal motility in patients treated with sacral nerve stimulation for irritable bowel syndrome. BMC Gastroenterology. 2014;14:111.
88. Weinland SR, Morris CB, Hu Y, Leserman J, Bangdiwala SI, Drossman DA. Characterization of episodes of
irritable bowel syndrome using ecological momentary assessment. Am J Gastroenterol. 2011;106: 1813‐20.
89. van der Veek PP, Van Rood YR, Masclee AA. Symptom severity but not psychopathology predicts
visceral hypersensitivity in irritable bowel syndrome. Clin Gastroenterol Hepatol. 2008;6:321‐8. 90. Delvaux M, Louvel D, Lagier E, Scherrer B, Abitbol JL, Frexinos J. The kappa agonist fedotozine relieves
hypersensitivity to colonic distention in patients with IBS. Gastroenterology. 1999;116:38‐45.
91. Lembo T, Naliboff BD, Matin K, Munakata J, Parker RA, Gracely RH, et al. Irritable bowel syndrome patients show altered sensitivity to exogenous opioids. Pain. 2000;87:137‐47.
92. Ritchie J. Pain from distension of the pelvic colon by inflating a balloon in the irritable colon syndrome.
Gut. 1973;14:125‐32. 93. Whitehead WE, Holtkotter B, Enck P, Hoelzl R, Holmes KD, Anthony J, et al. Tolerance for rectosigmoid
distention in irritable bowel syndrome. Gastroenterology. 1990;98:1187‐92.
94. Mertz H, Naliboff B, Munakata J, Niazi N, Mayer EA. Altered rectal perception is a biological marker of patients with irritable bowel syndrome. Gastroenterology. 1995;109:40‐52.
95. Munakata J, Naliboff B, Harraf F, Kodner A, Lembo T, Chang L, et al. Repetitive sigmoid stimulation
induces rectal hyperalgesia in patients with irritable bowel syndrome. Gastroenterology. 1997;112: 55‐63.
96. Naliboff BD, Munakata J, Fullerton S, Gracely RH, Kodner A, Harraf F, et al. Evidence for two distinct
perceptual alterations in irritable bowel syndrome. Gut. 1997;41:505‐12. 97. Hammer HF, Phillips SF, Camilleri M, Hanson RB. Rectal tone, distensibility, and perception:
reproducibility and response to different distensions. Am J Physiol. 1998;274:G584‐90.
98. Chang L, Munakata J, Mayer EA, Schmulson MJ, Johnson TD, Bernstein CN, et al. Perceptual responses in patients with inflammatory and functional bowel disease. Gut. 2000;47:497‐505.
99. Chang FY, Lu CL, Chen CY, Luo JC. Efficacy of dioctahedral smectite in treating patients of diarrhea‐
predominant irritable bowel syndrome. J Gastroenterol Hepatol. 2007;22:2266‐72. 100. Simren M, Abrahamsson H, Bjornsson ES. An exaggerated sensory component of the gastrocolonic
response in patients with irritable bowel syndrome. Gut. 2001;48:20‐7.
101. Verne GN, Robinson ME, Price DD. Hypersensitivity to visceral and cutaneous pain in the irritable bowel syndrome. Pain. 2001;93:7‐14.
102. Verne GN, Price DD, Callam CS, Zhang B, Peck J, Zhou Q. Viscerosomatic facilitation in a subset of IBS
patients, an effect mediated by N‐methyl‐D‐aspartate receptors. The journal of pain : official journal of the American Pain Society. 2012;13:901‐9.
103. Bernstein CN, Frankenstein UN, Rawsthorne P, Pitz M, Summers R, McIntyre MC. Cortical mapping of
visceral pain in patients with GI disorders using functional magnetic resonance imaging. Am J Gastroenterol. 2002;97:319‐27.
104. Bouin M, Plourde V, Boivin M, Riberdy M, Lupien F, Laganiere M, et al. Rectal distention testing in
patients with irritable bowel syndrome: sensitivity, specificity, and predictive values of pain sensory thresholds. Gastroenterology. 2002;122:1771‐7.
105. Spetalen S, Jacobsen MB, Vatn MH, Blomhoff S, Sandvik L. Visceral sensitivity in irritable bowel
syndrome and healthy volunteers: reproducibility of the rectal barostat. Dig Dis Sci. 2004;49:1259‐64. 106. Posserud I, Agerforz P, Ekman R, Bjornsson ES, Abrahamsson H, Simren M. Altered visceral perceptual
and neuroendocrine response in patients with irritable bowel syndrome during mental stress. Gut.
2004;53:1102‐8.
Measurement of abdominal pain in IBS
179
107. Delvaux M, Beck A, Jacob J, Bouzamondo H, Weber FT, Frexinos J. Effect of asimadoline, a kappa opioid
agonist, on pain induced by colonic distension in patients with irritable bowel syndrome. Aliment Pharmacol Ther. 2004;20:237‐46.
108. Coffin B, Bouhassira D, Sabate JM, Barbe L, Jian R. Alteration of the spinal modulation of nociceptive
processing in patients with irritable bowel syndrome. Gut. 2004;53:1465‐70. 109. Wilder‐Smith CH, Schindler D, Lovblad K, Redmond SM, Nirkko A. Brain functional magnetic resonance
imaging of rectal pain and activation of endogenous inhibitory mechanisms in irritable bowel syndrome
patient subgroups and healthy controls. Gut. 2004;53:1595‐601. 110. Caldarella MP, Milano A, Laterza F, Sacco F, Balatsinou C, Lapenna D, et al. Visceral sensitivity and
symptoms in patients with constipation‐ or diarrhea‐predominant irritable bowel syndrome (IBS): effect
of a low‐fat intraduodenal infusion. Am J Gastroenterol. 2005;100:383‐9. 111. Caldarella MP, Giamberardino MA, Sacco F, Affaitati G, Milano A, Lerza R, et al. Sensitivity disturbances
in patients with irritable bowel syndrome and fibromyalgia. Am J Gastroenterol. 2006;101:2782‐9.
112. Cremonini F, Houghton LA, Camilleri M, Ferber I, Fell C, Cox V, et al. Barostat testing of rectal sensation and compliance in humans: comparison of results across two centres and overall reproducibility.
Neurogastroenterol Motil.2005;17:810‐20.
113. Morgan V, Pickens D, Gautam S, Kessler R, Mertz H. Amitriptyline reduces rectal pain related activation of the anterior cingulate cortex in patients with irritable bowel syndrome. Gut. 2005;54:601‐7.
114. Lee KJ, Kim JH, Cho SW. Gabapentin reduces rectal mechanosensitivity and increases rectal compliance
in patients with diarrhoea‐predominant irritable bowel syndrome. Aliment Pharmacol Ther. 2005;22: 981‐8.
115. Vase L, Robinson ME, Verne GN, Price DD. Increased placebo analgesia over time in irritable bowel
syndrome (IBS) patients is associated with desire and expectation but not endogenous opioid mechanisms. Pain. 2005;115:338‐47.
116. Frokjaer JB, Andersen SD, Gale J, Arendt‐Nielsen L, Gregersen H, Drewes AM. An experimental study of
viscero‐visceral hyperalgesia using an ultrasound‐based multimodal sensory testing approach. Pain. 2005;119:191‐200.
117. Ng C, Malcolm A, Hansen R, Kellow JE. Distension technique influences the relationship between
colonic and rectal hypersensitivity in irritable bowel syndrome. Neurogastroenterol Motil.2006;18: 206‐10.
118. Song GH, Venkatraman V, Ho KY, Chee MW, Yeoh KG, Wilder‐Smith CH. Cortical effects of anticipation
and endogenous modulation of visceral pain assessed by functional brain MRI in irritable bowel syndrome patients and healthy controls. Pain. 2006;126:79‐90.
119. Moshiree B, Price DD, Robinson ME, Gaible R, Verne GN. Thermal and visceral hypersensitivity in
irritable bowel syndrome patients with and without fibromyalgia. Clin J Pain. 2007;23:323‐30. 120. Houghton LA, Fell C, Whorwell PJ, Jones I, Sudworth DP, Gale JD. Effect of a second‐generation
alpha2delta ligand (pregabalin) on visceral sensation in hypersensitive patients with irritable bowel
syndrome. Gut. 2007;56:1218‐25. 121. Dorn SD, Palsson OS, Thiwan SI, Kanazawa M, Clark WC, van Tilburg MA, et al. Increased colonic pain
sensitivity in irritable bowel syndrome is the result of an increased tendency to report pain rather than
increased neurosensory sensitivity. Gut. 2007;56:1202‐9. 122. van der Veek PP, Steenvoorden M, Steens J, van der Schaar PJ, Brussee J, Masclee AA. Recto‐colonic
reflex is impaired in patients with irritable bowel syndrome. Neurogastroenterol Motil.2007;19:653‐9.
123. Ringel Y, Drossman DA, Leserman JL, Suyenobu BY, Wilber K, et al. Effect of abuse history on pain reports and brain responses to aversive visceral stimulation: an FMRI study. Gastroenterology.
2008;134:396‐404.
124. Agrawal A, Houghton LA, Lea R, Morris J, Reilly B, Whorwell PJ. Bloating and distention in irritable bowel syndrome: the role of visceral sensation. Gastroenterology. 2008;134:1882‐9.
125. Piche M, Arsenault M, Poitras P, Rainville P, Bouin M. Widespread hypersensitivity is related to altered
pain inhibition processes in irritable bowel syndrome. Pain. 2010;148:49‐58. 126. Elsenbruch S, Rosenberger C, Enck P, Forsting M, Schedlowski M, Gizewski ER. Affective disturbances
modulate the neural processing of visceral pain stimuli in irritable bowel syndrome: an fMRI study. Gut.
2010;59:489‐95.
Chapter 8
180
127. Elsenbruch S, Rosenberger C, Bingel U, Forsting M, Schedlowski M, Gizewski ER. Patients with irritable
bowel syndrome have altered emotional modulation of neural responses to visceral stimuli. Gastroenterology. 2010;139:1310‐9.
128. Nozu T, Okumura T. Visceral sensation and irritable bowel syndrome; with special reference to
comparison with functional abdominal pain syndrome. J Gastroenterol Hepatol. 2011;26 Suppl 3:122‐7. 129. Vanhoutvin SA, Troost FJ, Kilkens TO, Lindsey PJ, Jonkers DM, Venema K, et al. Alternative procedure to
shorten rectal barostat procedure for the assessment of rectal compliance and visceral perception: a
feasibility study. J Gastroenterol. 2012;47:896‐903. 130. Ludidi S, Conchillo JM, Keszthelyi D, Koning CJ, Vanhoutvin SA, Lindsey PJ, et al. Does meal ingestion
enhance sensitivity of visceroperception assessment in irritable bowel syndrome? Neurogastroenterol
Motil.2012;24:47‐53, e3. 131. Ludidi S, Conchillo JM, Keszthelyi D, Van Avesaat M, Kruimel JW, Jonkers DM, et al. Rectal
hypersensitivity as hallmark for irritable bowel syndrome: defining the optimal cutoff.
Neurogastroenterol Motil.2012;24:729‐33, e345‐6. 132. Goncalves de Medeiros MT, de Oliveira RB, dos Santos AA, de Leopoldino DM, Lima MC, Nobre RA, et
al. The effects of sildenafil on rectal sensitivity and tone in patients with the irritable bowel syndrome.
Aliment Pharmacol Ther. 2012;35:577‐86. 133. Benson S, Kattoor J, Wegner A, Hammes F, Reidick D, Grigoleit JS, et al. Acute experimental
endotoxemia induces visceral hypersensitivity and altered pain evaluation in healthy humans. Pain.
2012;153:794‐9. 134. Benson S, Kotsis V, Rosenberger C, Bingel U, Forsting M, Schedlowski M, et al. Behavioural and neural
correlates of visceral pain sensitivity in healthy men and women: does sex matter? Eur J Pain.
2012;16:349‐58. 135. Letzen JE, Craggs JG, Perlstein WM, Price DD, Robinson ME. Functional connectivity of the default mode
network and its association with pain networks in irritable bowel patients assessed via lidocaine
treatment. The journal of pain : official journal of the American Pain Society. 2013;14:1077‐87. 136. Aniwan S, Gonlachanvit S. Effects of Chili Treatment on Gastrointestinal and Rectal Sensation in
Diarrhea‐predominant Irritable Bowel Syndrome: A Randomized, Double‐blinded, Crossover Study.
Journal of neurogastroenterology and motility. 2014;20:400‐6. 137. van Wanrooij SJ, Wouters MM, Van Oudenhove L, Vanbrabant W, Mondelaers S, Kollmann P, et al.
Sensitivity testing in irritable bowel syndrome with rectal capsaicin stimulations: role of TRPV1
upregulation and sensitization in visceral hypersensitivity? Am J Gastroenterol. 2014;109:99‐109. 138. Melchior C, Gourcerol G, Chastan N, Verin E, Menard JF, Ducrotte P, et al. Effect of transcranial
magnetic stimulation on rectal sensitivity in irritable bowel syndrome: a randomized, placebo‐
controlled pilot study. Colorectal Dis. 2014;16:O104‐11. 139. Naliboff BD, Berman S, Suyenobu B, Labus JS, Chang L, Stains J, et al. Longitudinal change in perceptual
and brain activation response to visceral stimuli in irritable bowel syndrome patients.
Gastroenterology. 2006;131:352‐65. 140. Rossel P, Drewes AM, Petersen P, Nielsen J, Arendt‐Nielsen L. Pain produced by electric stimulation of
the rectum in patients with irritable bowel syndrome: further evidence of visceral hyperalgesia. Scand J
Gastroenterol. 1999;34:1001‐6. 141. Brock C, Nissen TD, Gravesen FH, Frokjaer JB, Omar H, Gale J, et al. Multimodal sensory testing of the
rectum and rectosigmoid: development and reproducibility of a new method. Neurogastroenterol
Motil.2008;20:908‐18. 142. Thoua NM, Murray CD, Winchester WJ, Roy AJ, Pitcher MC, Kamm MA, et al. Amitriptyline modifies the
visceral hypersensitivity response to acute stress in the irritable bowel syndrome. Aliment Pharmacol
Ther. 2009;29:552‐60. 143. Arebi N, Bullas DC, Dukes GE, Gurmany S, Hicks KJ, Kamm MA, et al. Distinct neurophysiological profiles
in irritable bowel syndrome. Am J Physiol Gastrointest Liver Physiol.2011;300:G1086‐93.
144. U.S. Department of Health and Human Services FaDA, Center for Drug Evaluation and Research (CDER). Guidance for Industry Irritable Bowel Syndrome ‐ Clinical Evaluation of Drugs for Treatment2012.
http://wwwfdagov/downloads/Drugs/Guidances/UCM205269pdf.
Measurement of abdominal pain in IBS
181
145. Lacy BE, Lembo AJ, Macdougall JE, Shiff SJ, Kurtz CB, Currie MG, et al. Responders vs clinical response: a
critical analysis of data from linaclotide phase 3 clinical trials in IBS‐C. Neurogastroenterol Motil.2014;26:326‐33.
146. Melzack R. The McGill Pain Questionnaire: major properties and scoring methods. Pain. 1975;1:277‐99.
147. Byrne M, Troy A, Bradley LA, Marchisello PJ, Geisinger KF, Van der Heide LH, et al. Cross‐validation of the factor structure of the McGill Pain Questionnaire. Pain. 1982;13:193‐201.
148. Mayer EA. Emerging disease model for funct. gastrointestinal disorders. Am J Med. 1999;107):12S‐9S.
149. Bradburn NM, Rips LJ, Shevell SK. Answering autobiographical questions: the impact of memory and inference on surveys. Science. 1987;236:157‐61.
150. Thijssen AY, Jonkers DM, Leue C, van der Veek PP, Vidakovic‐Vukic M, van Rood YR, et al. Dysfunctional
cognitions, anxiety and depression in irritable bowel syndrome. J Clin Gastroenterol.2010;44:e236‐41. 151. Comer SD, Zacny JP, Dworkin RH, Turk DC, Bigelow GE, Foltin RW, et al. Core outcome measures for
opioid abuse liability laboratory assessment studies in humans: IMMPACT recommendations. Pain.
2012;153:2315‐24. 152. Stone AA, Shiffman S, Schwartz JE, Broderick JE, Hufford MR. Patient compliance with paper and
electronic diaries. Control Clin Trials. 2003;24:182‐99.
153. Myin‐Germeys I, Oorschot M, Collip D, Lataster J, Delespaul P, van Os J. Experience sampling research in psychopathology: opening the black box of daily life. Psychol Med. 2009;39:1533‐47.
154. Stone AA, Broderick JE, Schwartz JE, Shiffman S, Litcher‐Kelly L, Calvanese P. Intensive momentary
reporting of pain with an electronic diary: reactivity, compliance, and patient satisfaction. Pain. 2003;104:343‐51.
155. Whitehead WE, Palsson OS. Is rectal pain sensitivity a biological marker for irritable bowel syndrome:
psychological influences on pain perception. Gastroenterology. 1998;115:1263‐71.
Chapter 8
182
Supplementary information
Description of available provocation tests used to measure chronic abdominal pain
Mechanical intestinal stimulus
In the last decades, many studies have been aiming to develop an objective biomarker
for visceral pain. Different procedures using balloon distension have been designed to
apply mechanical stimuli to the intestinal lumen to provoke sensations and to measure
pain threshold of individuals. The induced sensation is reported and scored by the
subject on a VAS, NRS or VRS. In 1973, Ritchie was the first to report increased pain
sensation to distal colon balloon distension in IBS patients compared to healthy
individuals.1 In 1990, Whitehead et al. used balloon distention of the rectosigmoid
combined with a (somatic) thermal stimulus on the skin (hand immersion in cold
water), in patients with IBS compared to patients with other GI disorders and healthy
controls, and reported a significant lower tolerance for mechanical balloon distension
but not for the thermal stimulus on the hand in IBS patients. Thereby proposing the
rectal mechanical stimulus to be a possible specific biomarker for the visceral pain
threshold in IBS.2 The increased sensitivity to urge, discomfort and pain assessed by
rectal barostat balloon is referred to as visceral hypersensitivity. In case the threshold
to the mechanical stimulus is lowered, it is referred to as allodynia. Hypersensitivity and
allodynia to mechanical bowel distension have been observed in up to 60% of IBS
patients.3‐5
In the present review the included publications have assessed visceral sensation of the
rectum/colon by mechanical provocation tests in IBS patients
Reproducibility and reliability: Hammer et al. assessed reproducibility of rectal barostat
in five healthy individuals and concluded that the day‐to‐day variability was sufficiently
small to allow valid comparisons to be made.6 Spetalen et al. described an ‘acceptable
reproducibility’ of rectal barostat measurements assessed in a group 33 IBS patients
and healthy controls, reporting a repeatability coefficient of 2.4 and an interclass
correlation coefficient of 0.76‐0.93 in healthy controls and 0.53‐0.88 in IBS patients.
The pooled coefficient of variation (CV) ranged from 10‐24% and 11‐49%, respectively.7
Cremonini et al. described overall reproducibility of a rectal barostat test in 34 healthy
individuals as 'good', showing an inter‐individual CV for pain ranged between 31‐37%,
while the intra‐individual CV for pain was 23%.8 Based on these data the rectal barostat
is currently regarded as a reproducible and reliable measure for visceral sensitivity in
patients with IBS and healthy individuals.
To answer the question whether rectal sensitivity is comparable to or represents
colonic sensitivity Ng et al. correlated barostat distensions VAS scores of rectum and
descending colon in 20 IBS patients and 12 healthy controls, and observed a significant
Measurement of abdominal pain in IBS
183
correlation of r=0.60 for pain and concluded that the rectum serves as a legitimate
representative for the colon with respect to visceral hypersensitivity.9
Sensitivity and specificity: Bouin et al. reported values for sensitivity and specificity of
95.5% and 71.8% at 40 mmHg balloon pressure, respectively. The positive and negative
predictive values at the same balloon pressure were 85% and 90%, respectively.10 More
recently, Ludidi et al. calculated the optimal cut‐off value to detect visceral
hypersensitivity in IBS. The optimal cut‐off occurred at a balloon pressure of 26 mmHg
with a VAS of 20 mm resulting in 63.5% hypersensitive and 11% allodynic IBS patients.
The sensitivity, specificity and positive predictive value at this cut‐off point were 63%,
90% and 96%, respectively.3
Correlation with symptom severity: The correlation of pain threshold measured by
mechanical provocation tests and symptom severity assessed by a variety of
questionnaires was poor.
Nutrient or chemical provocation test
A frequent trigger of abdominal pain in IBS patients is food intake.11 Rectal and colonic
perception threshold in IBS patients have shown to decrease after intraduodenal
infusion of fat.12,13 Moreover liquid meals, with a more pronounced effect of fatty
compounds compared to carbohydrate, have shown to enhance visceral sensitivity in
the same population.14‐16 Therefore visceral provocation tests are mostly conducted in
a fasting condition. But, assessing postprandial visceral sensitivity in a standardized
condition could augment the understanding of visceral perception and add a further
dimension to the visceral sensitivity assessment of IBS patients.17
Several research groups have used specific chemical stimuli to study pain mechanisms.
Frokjaer et al. used an acid provocation test in combination with mechanical and
thermal stimuli to assess viscero‐visceral hyperalgesia in 12 healthy controls.18
Furthermore, capsaicin, the red pepper ingredient responsible for the heat sensation,
was used to induce abdominal pain or discomfort in healthy controls.19‐22 Data on
validity of these methods are lacking, so further research is needed.
Thermal or electric intestinal stimulus
Thermal or electrical stimuli in the intestine to provoke sensations and measure visceral
sensitivity are alternatives to the balloon distension.18,23‐26 Brock et al. combined
mechanical, thermal and electric stimuli in the rectosigmoid, tested reproducibility and
reported separate pain detection threshold intra‐class correlation coefficients (ICC) for
the different stimuli: 0.9 for repeated electrical stimuli, 0.7 for heat, 0.9 for cold and for
the mechanical stimuli (no difference between days was found), thereby showing an
high reproducibility.26 In contrast to bowel distension, thermal and electrical stimuli do
not mimic physiological condition of the intestine.
Chapter 8
184
Thermal or electric stimuli on the skin combined with visceral stimuli
The discussion is still on‐going whether IBS patients show more generalised
hypersensitivity and thereby suggesting the presence of a general pain disorders in
these patients with involvement of central hyperalgesic mechanisms, instead of
isolated visceral hypersensitivity.
Several studies combined provocation tests of the intestine in IBS patients with thermal
or electric stimuli on the skin to broadly assess sensitivity. In 1990, Whitehead et al.,
demonstrated that IBS patients had an increased response to rectal balloon distension,
but not to thermal hand skin stimuli (cold water).2 This was confirmed by Rössel et al.
using cutaneous electrical stimuli.25 Caldarella et al. used rectal distension and electric
skin stimuli to compare IBS to fibromyalgia (FM) patients, and observed increased
visceral sensitivity in IBS and increased somatic sensitivity in FM patients, indicating
that different mechanisms are involved in pain modulation in these patient groups.27
Moshiree et al. employed rectal distension and thermal skin stimuli in similar patient
groups. They point to an increased response to skin and visceral stimuli in both patient
groups. The IBS group exhibited higher pain ratings to rectal distension but lower pain
ratings to thermal skin stimuli compared to the IBS + FM group. Thus, the regions of
primary and secondary hyperalgesia depend on the origin of the primary pain
complaint.28 Verne et al. have come to opposing conclusions by demonstrating both
visceral hypersensitivity to mechanical distension in the rectum and cutaneous
allodynia/hyperalgesia to thermal stimuli in IBS patients. The cutaneous hyperalgesia
was more pronounced in the lower versus the upper extremities, suggesting a rostral‐
caudal distribution of increased pain sensitivity.29 In a recent study, the same
researchers observed that repetitive visceral distension stimuli and repetitive
cutaneous thermal stimuli enhance bidirectional mechanisms of secondary
hyperalgesia in a subgroup with visceral hypersensitivity. This enhancement was not
observed in healthy controls or normosensitive IBS patients.30 Piche et al. reported a
relationship between altered pain inhibition processes and widespread hypersensitivity
in IBS.31 Stabell et al. demonstrated lower thermal pain thresholds, for cold and heat,
on the upper extremities in a large group of subjects reporting IBS symptoms, when
compared to healthy controls.32
In conclusion, there are contradicting findings in the current literature on this topic.
However, when considering all available evidence, a subgroup of IBS patients may be
affected not only by visceral, but by a general hypersensitivity to pain.
Colonoscopy as provocation test
Kim et al. assessed colonoscopy associated pain, assuming IBS patients to experience
more pain during colonoscopy compared to other individuals. They demonstrated an
increased perception of pain during colonoscopy in IBS patients.33 This provocation
method has not been reproduced by other research groups.
Measurement of abdominal pain in IBS
185
References
1. Ritchie J. Pain from distension of the pelvic colon by inflating a balloon in the irritable colon syndrome. Gut. 1973;14:125‐32.
2. Whitehead WE, Holtkotter B, Enck P, Hoelzl R, Holmes KD, Anthony J, et al. Tolerance for rectosigmoid
distention in irritable bowel syndrome. Gastroenterology. 1990;98:1187‐92. 3. Ludidi S, Conchillo JM, Keszthelyi D, Van Avesaat M, Kruimel JW, Jonkers DM, et al. Rectal
hypersensitivity as hallmark for irritable bowel syndrome: defining the optimal cutoff.
Neurogastroenterol Motil. 2012;24:729‐33, e345‐6. 4. Kuiken SD, Lindeboom R, Tytgat GN, Boeckxstaens GE. Relationship between symptoms and
hypersensitivity to rectal distension in patients with irritable bowel syndrome. Aliment Pharmacol
Ther.2005;22:157‐64. 5. Ludidi S, Mujagic Z, Jonkers D, Keszthelyi D, Hesselink M, Kruimel J, et al. Markers for visceral
hypersensitivity in patients with irritable bowel syndrome. Neurogastroenterol Motil. 2014;26:1104‐11.
6. Hammer HF, Phillips SF, Camilleri M, Hanson RB. Rectal tone, distensibility, and perception: reproducibility and response to different distensions. Am J Physiol. 1998;274:G584‐90.
7. Spetalen S, Jacobsen MB, Vatn MH, Blomhoff S, Sandvik L. Visceral sensitivity in irritable bowel
syndrome and healthy volunteers: reproducibility of the rectal barostat. Dig Dis Sci. 2004;49:1259‐64. 8. Cremonini F, Houghton LA, Camilleri M, Ferber I, Fell C, Cox V, et al. Barostat testing of rectal sensation
and compliance in humans: comparison of results across two centres and overall reproducibility.
Neurogastroenterol Motil. 2005;17:810‐20. 9. Ng C, Malcolm A, Hansen R, Kellow JE. Distension technique influences the relationship between
colonic and rectal hypersensitivity in irritable bowel syndrome. Neurogastroenterol Motil. 2006;18:
206‐10. 10. Bouin M, Plourde V, Boivin M, Riberdy M, Lupien F, Laganiere M, et al. Rectal distention testing in
patients with irritable bowel syndrome: sensitivity, specificity, and predictive values of pain sensory
thresholds. Gastroenterology. 2002;122:1771‐7. 11. Simren M, Mansson A, Langkilde AM, Svedlund J, Abrahamsson H, Bengtsson U, et al. Food‐related
gastrointestinal symptoms in the irritable bowel syndrome. Digestion. 2001;63:108‐15.
12. Caldarella MP, Milano A, Laterza F, Sacco F, Balatsinou C, Lapenna D, et al. Visceral sensitivity and symptoms in patients with constipation‐ or diarrhea‐predominant irritable bowel syndrome (IBS): effect
of a low‐fat intraduodenal infusion. Am J Gastroenterol. 2005;100:383‐9.
13. Simren M, Abrahamsson H, Bjornsson ES. An exaggerated sensory component of the gastrocolonic response in patients with irritable bowel syndrome. Gut. 2001;48:20‐7.
14. Ludidi S, Conchillo JM, Keszthelyi D, Koning CJ, Vanhoutvin SA, Lindsey PJ, et al. Does meal ingestion
enhance sensitivity of visceroperception assessment in irritable bowel syndrome? Neurogastroenterol Motil. 2012;24:47‐53, e3.
15. Simren M, Agerforz P, Bjornsson ES, Abrahamsson H. Nutrient‐dependent enhancement of rectal
sensitivity in irritable bowel syndrome (IBS). Neurogastroenterol Motil. 2007;19:20‐9. 16. van der Veek PP, Steenvoorden M, Steens J, van der Schaar PJ, Brussee J, Masclee AA. Recto‐colonic
reflex is impaired in patients with irritable bowel syndrome. Neurogastroenterol Motil. 2007;19:653‐9.
17. Keszthelyi D, Troost FJ, Masclee AA. Irritable bowel syndrome: methods, mechanisms, and pathophysiology. Methods to assess visceral hypersensitivity in irritable bowel syndrome. Am J Physiol
Gastrointest Liver Physiol. 2012;303:G141‐54.
18. Frokjaer JB, Andersen SD, Gale J, Arendt‐Nielsen L, Gregersen H, Drewes AM. An experimental study of viscero‐visceral hyperalgesia using an ultrasound‐based multimodal sensory testing approach. Pain.
2005;119:191‐200.
19. Cao Y, Wilder‐Smith CH, Li XH, Wong RK, Hammer J, Ho KY. Characterization of a reproducible gastric pain model using oral capsaicin titration in healthy volunteers. Neurogastroenterol Motil.
2011;23:e261‐70.
20. Hammer J, Vogelsang H. Characterization of sensations induced by capsaicin in the upper gastrointestinal tract. Neurogastroenterol Motil. 2007;19:279‐87.
Chapter 8
186
21. van Wanrooij SJ, Wouters MM, Van Oudenhove L, Vanbrabant W, Mondelaers S, Kollmann P, et al.
Sensitivity testing in irritable bowel syndrome with rectal capsaicin stimulations: role of TRPV1 upregulation and sensitization in visceral hypersensitivity? Am J Gastroenterol. 2014;109:99‐109.
22. Aniwan S, Gonlachanvit S. Effects of Chili Treatment on Gastrointestinal and Rectal Sensation in
Diarrhea‐predominant Irritable Bowel Syndrome: A Randomized, Double‐blinded, Crossover Study. J Neurogastroenterol Motil.2014;20:400‐6.
23. Arebi N, Bullas DC, Dukes GE, Gurmany S, Hicks KJ, Kamm MA, et al. Distinct neurophysiological profiles
in irritable bowel syndrome. Am J Physiol Gastrointest Liver Physiol. 2011;300:G1086‐93. 24. Thoua NM, Murray CD, Winchester WJ, Roy AJ, Pitcher MC, Kamm MA, et al. Amitriptyline modifies the
visceral hypersensitivity response to acute stress in the irritable bowel syndrome. Aliment Pharmacol
Ther. 2009;29:552‐60. 25. Rossel P, Drewes AM, Petersen P, Nielsen J, Arendt‐Nielsen L. Pain produced by electric stimulation of
the rectum in patients with irritable bowel syndrome: further evidence of visceral hyperalgesia. Scan J
Gastroent. 1999;34:1001‐6. 26. Brock C, Nissen TD, Gravesen FH, Frokjaer JB, Omar H, Gale J, et al. Multimodal sensory testing of the
rectum and rectosigmoid: development and reproducibility of a new method. Neurogastroenterol
Motil. 2008;20:908‐18. 27. Stabell N, Stubhaug A, Flaegstad T, Nielsen CS. Increased pain sensitivity among adults reporting
irritable bowel syndrome symptoms in a large population‐based study. Pain. 2013;154:385‐92.
28. Caldarella MP, Giamberardino MA, Sacco F, Affaitati G, Milano A, Lerza R, et al. Sensitivity disturbances in patients with irritable bowel syndrome and fibromyalgia. Am J Gastroenterol. 2006;101:2782‐9.
29. Moshiree B, Price DD, Robinson ME, Gaible R, Verne GN. Thermal and visceral hypersensitivity in
irritable bowel syndrome patients with and without fibromyalgia. Clin J Pain. 2007;23:323‐30. 30. Verne GN, Robinson ME, Price DD. Hypersensitivity to visceral and cutaneous pain in the irritable bowel
syndrome. Pain. 2001;93:7‐14.
31. Verne GN, Price DD, Callam CS, Zhang B, Peck J, Zhou Q. Viscerosomatic facilitation in a subset of IBS patients, an effect mediated by N‐methyl‐D‐aspartate receptors. J Pain. 2012;13:901‐9.
32. Piche M, Arsenault M, Poitras P, Rainville P, Bouin M. Widespread hypersensitivity is related to altered
pain inhibition processes in irritable bowel syndrome. Pain. 2010;148:49‐58. 33. Kim ES, Cheon JH, Park JJ, Moon CM, Hong SP, Kim TI, et al. Colonoscopy as an adjunctive method for
the diagnosis of irritable bowel syndrome: focus on pain perception. J Gastroenterol
Hepatol.2010;25:1232‐8.

Measurement of abdominal pain in IBS
187

Chapter 8
188
189
Chapter 9
ESM ‐ a new digital tool for symptom assessment
in IBS
The experience sampling method ‐ a new digital tool for momentary symptom
assessment in IBS: an exploratory study
Zlatan Mujagic, Carsten Leue, Lisa Vork, Richel Lousberg, Daisy MAE Jonkers, Daniel
Keszthelyi, Martine AM Hesselink, Thirza JC van Schagen, Jim van Os, Ad AM Masclee,
Joanna W Kruimel
Neurogastroenterology and Motility 2015;27:1295‐1302
Chapter 9
190
Abstract
Background
Retrospective questionnaires are frequently used for symptom assessment in Irritable
Bowel Syndrome (IBS) patients, but are influenced by recall bias and circumstantial and
psychological factors. These limitations may be overcome by random, repeated,
momentary assessment during the day, using electronic Experience Sampling
Methodology (ESM). Therefore, we compared symptom assessment by ESM to
retrospective paper questionnaires in IBS patients.
Methods
Twenty‐six IBS patients (Rome III) were included, of which 16 were diagnosed with
panic disorder (DSM‐IV‐TR). Patients scored symptoms using end‐of‐day diaries during
14 days and the gastrointestinal symptom rating scale (GSRS) once. ESM was used on
7 consecutive days during the same time period.
Key results
End‐of‐day diary abdominal pain scores were 0.4 (SE 0.1, p<0.001) point higher (on a
1‐to‐5‐point scale) compared to corresponding ESM mean‐scores in IBS patients. The
difference was even more pronounced for upper abdominal pain scores assessed by the
GSRS (4.77±1.50) compared to ESM mean‐scores (2.44±1.30, p<0.001), both on 1‐to‐7‐
point scale. For flatulence, comparable results were found. Nausea and belching scores
showed small, but significant differences between end‐of‐day diary and ESM. All tested
symptoms were scored higher on GSRS compared to ESM mean‐scores (p<0.01).
Affective comorbidity did not influence differences in pain reporting between methods.
Conclusion
IBS patients report higher scores for abdominal pain in retrospective questionnaires
compared to ESM, with a tendency to report peak rather than average pain scores. ESM
can provide more insight in symptom course and potential triggers, and may lead to a
better understanding of IBS symptomatology.
ESM: Momentary symptom assessment in IBS
191
Introduction
A major hurdle for the development of new therapies in Irritable Bowel Syndrome (IBS)
is the current lack of reliable instruments to measure symptoms over time and quantify
therapy response. At present, retrospective self‐reported paper questionnaires based
on daily (i.e. by end‐of‐day diaries) or weekly symptom monitoring (i.e. by end‐of‐week
questionnaires) are widely used as the standard method to assess symptoms in IBS
patients.1‐4 The Food and Drugs Administration (FDA) recommends a 7‐day mean of an
‘end‐of‐day 11‐point Numeric Rating Scale’ as a primary endpoint for clinical trials
assessing abdominal pain in IBS.5 In a recently published study, Lackner et al.
demonstrated that (electronic) end‐of‐day diaries may more accurately quantify GI
symptoms in IBS patients compared to weekly symptom monitoring, in particular for
average abdominal pain over a predefined period of time.4 However, it should be taken
into account that all retrospective questionnaires (e.g. end‐of‐day or end‐of‐week
symptom assessment) are based on autobiographical memory, thereby leading to recall
bias, representing a reconstruction of specific moments, rather than a reliable
reflection of symptoms over a time period.6 Memory of pain can be influenced by
contextual, as well as by emotional and cognitive factors. This can affect perception and
interpretation of symptoms, especially pain, and may result in state‐congruent and
ecological recall bias in retrospective questionnaires.7‐9 Affective comorbidity such as
anxiety disorders, are prevalent in IBS patients and the presence of psychological
comorbidity may contribute to a distorted perception and memory of GI symptoms as
well.10,11 Furthermore, the inability to record temporal dynamics of symptoms renders
retrospective questionnaires less suitable for measurement of symptoms fluctuating
over time. Finally, it has been shown that paper diaries are subject to low compliance
rates, as low as approximately 10%, due to backfilling of questionnaires.12
The Experience Sampling Method (ESM),13 also referred to as Ecological Momentary
Assessment (EMA),14 may overcome the significant limitations of retrospective
questionnaires.15 This assessment method is characterized by the following criteria:
data are collected repeatedly and randomly during the day, for several days, using a
digital device, in the subject’s natural environment, with a focus on the subject’s in‐the‐
moment (i.e. momentary) physical and mental state and behaviour. Digital momentary
assessment reduces recall and ecological bias, may increase compliance rates and can
take into account emotional, cognitive and contextual factors impacting IBS symptom
reporting in general and abdominal pain in particular. One previous study by Weinland
and colleagues used electronic momentary assessment in a group of 58 IBS patients to
describe differences in symptom episodes between IBS subtypes. As secondary
outcome they reported that abdominal pain scores were significantly higher in the
traditional paper end‐of‐day diaries when compared to the electronic momentary
assessment.16 More research is needed to confirm their observation for abdominal
pain, but also to compare ESM to current standards (i.e. daily and weekly retrospective
Chapter 9
192
symptom reporting) with regard to other GI symptoms, as well as to investigate
possible patient characteristics, such as anxiety, that may affect pain memory and
therefore the differences between momentary and retrospective symptom assessment.
The aims of the present study were to explore possible advantages of electronic ESM
over paper retrospective questionnaires for GI symptom measurement in IBS patients,
by i) comparing abdominal pain and other GI symptom scores assessed by a paper
based end‐of‐day diary to corresponding scores assessed by ESM, by ii) comparing the
GSRS, which includes a recall period of one week, to ESM, and by iii) investigating
patient characteristics, that may affect memory of pain and may therefore contribute
to a possible difference in scores between the momentary and retrospective symptom
assessment.
We hypothesized that a) IBS patients will report higher levels of abdominal pain, and
possibly also other GI symptoms, in end‐of‐day diaries and the GSRS compared to ESM
average scores, and b) that the presence of a comorbid panic disorder, more severe
mental symptoms and negative cognitions will influence this difference in symptom
reporting between the methods.
Materials and methods
The present study is part of a larger cohort study on the phenotypical and genotypical
characterization of IBS (Maastricht IBS cohort) and of a ‘Randomized Controlled Trial of
Escitalopram versus Placebo for Patients with Irritable Bowel Syndrome and Panic
Disorder’, of which the baseline data (i.e. before start of any intervention) were used
for the present analysis. Study protocols were approved by the Maastricht University
Medical Center+ (MUMC+) Ethics Committee, were in compliance with the revised
Declaration of Helsinki (64th WMA General Assembly, Fortaleza, Brazil, 2013) and were
registered in the US National Library of Medicine (http://www.clinicaltrials.gov,
NCT00775060 and NCT01551225, respectively).
Study participants
Subjects between 18 and 75 years of age with IBS, diagnosed by a gastroenterologist
using the Rome III criteria,17 were recruited via the MUMC+ Gastroenterology‐
Hepatology outpatient clinic, which is a secondary and tertiary referral centre for
patients with functional GI disorders. For the diagnosis of IBS, GI endoscopy with
biopsies, abdominal imaging by ultrasonography or CT scan, and/or blood, breath and
faecal analysis were performed to exclude organic disease, when indicated by the
physician. Patients with a history of abdominal surgery were excluded, with the
ESM: Momentary symptom assessment in IBS
193
exception of appendectomy, laparoscopic cholecystectomy or hysterectomy. The
presence of co‐morbid panic disorder was diagnosed by an experienced psychiatrist
based on the DSM‐IV‐TR criteria, by using the Mini‐International‐Neuropsychiatric‐
Interview (M.I.N.I.).18 All subjects gave written informed consent prior to participation.
Paper questionnaires and ESM
Participants completed questionnaires on demographics, lifestyle factors and use of
medication. Furthermore, they completed scales indexing psychopathology and
negative cognitions. The Hospital Anxiety and Depression Scale (HADS), consisting of
14 items clustered into two subscales, i.e. anxiety and depression scale, with a score of
0‐21 per subscale, and a recall period of one week. Higher scores indicate higher
symptom burden.19,20 The Cognitive Scale for Functional Bowel Disorders (CS‐FBD),
consisting of 31 items, scored on a 7‐point Likert scale, and a total score of 31‐217, with
a recall period of one month, was used to assess dysfunctional cognitions related to
symptoms in FBD. A higher score indicates more dysfunctional cognitions.21
GI symptoms were assessed over 14 consecutive days using an end‐of‐day diary.
Complaints of abdominal discomfort, abdominal pain, nausea, bloating, belching,
flatulence, diarrhoea, constipation and overall symptom burden were scored on 5‐point
Likert scales.2,3,22
Electronic ESM13 was used to assess real‐time GI symptoms (e.g. abdominal pain,
heartburn, nausea, belching, bloating, flatulence) in daily life, as well as momentary
physical and mental experiences, activities and contextual aspects, during 7 consecutive
days of the same time period. ESM was started at a random day during the first week of
the 14 day end‐of‐day diary period. Subjects carried a digital device, the PsyMate
(comparable to a mobile phone).23 The device gives an auditory signal (a “beep”) at ten
random time points per day. Participants were instructed to complete 60 short
questions on the device following every signal, using a 7‐point Likert scale. The
completion of the question set took 4‐5 minutes on each occasion. The same set of
questions was repeated in the same order at every beep. As subjects are usually not
able to respond after every beep (for example because of driving a car), completion of
≥6 of the 10 beep‐questionnaires per day was considered as being compliant.24
In addition, participants were instructed to complete the Gastrointestinal Symptom
Rating Scale (GSRS), consisting of 15 items, scored on a 7‐point Likert scale, with a recall
period of one week, during the same time period.25
Individual questions of both retrospective methods were compared to individual
questions of ESM. Only GI symptoms assessed by ESM that corresponded to questions
in the end‐of‐day diary and/or GSRS were included in the current analyses. The
phrasing of the questions was similar, apart from the time frame explanation, and for
the end‐of‐day diary with regard to the used scale, i.e. a 1‐to‐5 point scale for the end‐
of‐day diary compared to a 1‐to‐7 point scale for the ESM and GSRS.
Chapter 9
194
Data and statistical analysis
4D software was used to program PsyMate devices and extract the data. Statistical
analyses were performed using IBM SPSS Statistics version 22.0 (IBM Statistics for
Windows, Armonk, New York).
In order to check if completing the ESM questionnaires at multiple time points each day
influenced the scores of the end‐of‐day diary, we compared the end‐of‐day diary scores
(i.e. 7‐day mean of each symptom) of the 7 days during which participants also carried
the PsyMate device to the 7 days during which subjects only completed the end‐of‐day
diary, using a paired sample t‐test.
ESM data are based on a multi‐level structure, including the variation between subjects
and repeated measures within subjects. Associations between GI symptom scores of
the end‐of‐day diary and corresponding ESM scores were tested, using linear mixed
models, based on a random intercept and an autoregressive (AR1) covariate structure.
Currently the end‐of‐day diary is the standard method and was therefore used as
dependent variable in the analysis. For each participant, ESM day‐mean scores of
individual symptoms were used as predictor, to test whether average symptom scores
of the day reflect the end‐of‐day‐diary scores.
Scoring scales of the end‐of‐day diaries and ESM were harmonized by rescaling the ESM
data from a 7‐point to a 5‐point scale, i.e. a score of 1 was 1, 2 or 3 was rescaled to 2, 4
to 3, 5 or 6 to 4 and 7 to 5. In order to assess whether the rescaling affected the
reliability of GI symptom related questions in ESM, a Cronbach’s α was calculated for
the original and rescaled data.
To quantify the difference of scores between the two methods, ESM data were
subtracted from corresponding end‐of‐day diary scores, resulting in a delta score,
which was statistically tested using the same multi‐level analysis, adjusting for repeated
measures. In like manner, the differences between end‐of‐day diary scores and ESM
maximum scores of the day were tested.
In order to investigate if certain patient characteristics lead to a different retrospective
perception of abdominal pain, possible predictors of a larger delta‐score (i.e. the
differences in abdominal pain reporting between ESM day‐mean scores and the end‐of‐
day diary scores) were tested: i.e. sex, age, presence of co‐morbid panic disorder,
psychological symptoms (HADS) and negative cognitions (CS‐FBD). To further test the
hypothesis that the presence of panic disorder in patients may influence GI symptom
reporting, linear mixed models were used to investigate whether there was a difference
in symptom score levels between IBS patients with and without a diagnosis of panic
disorder, within ESM or end‐of‐day diary data.
Differences between GI symptom scores assessed by the GSRS and ESM could only be
analysed on subject level, by paired sample t‐test, due to lack of intra‐subject variation
in the GSRS scores (only one measurement per subject). Subject‐means (i.e. means over
ESM: Momentary symptom assessment in IBS
195
7 days) of non‐rescaled ESM data were calculated and compared to the corresponding
GSRS scores (both ESM and GSRS use a 7‐point scale).
Results
Twenty‐six IBS patients were included in the analysis. Female gender was predominant
(69.2%), mean age was 41.8±15.5 years and mean BMI was 25.5±5.2 kg/m2. IBS
subtypes were defined based on bowel habits according to the ROME III criteria:
14 subjects were classified as diarrhoea predominant (IBS‐D), 4 as constipation
predominant (IBS‐C), 7 as mixed (IBS‐M) and 1 as undefined subtype (IBS‐U). Sixteen
patients were diagnosed with co‐morbid panic disorder. Mean scores for CS‐FBD,
measuring negative cognitions related to GI symptoms, and the HADS subscales for
depression and anxiety were 112±44, 4.2±3.7 and 7.4±4.4, respectively.
The scores of the 14 day paper end‐of‐day diary did not differ significantly between the
7 days on which also ESM was used compared to 7 days without ESM (Supplementary
Table S9.1), indicating that carrying the PsyMate device did not influence the end‐of‐
day diary scores.
All subjects reported some level of abdominal pain during the test period, and the rate
of symptomatic days, on which abdominal pain was present, i.e. end‐of‐day diary score
or at least once daily ESM score of ≥2, was 84% and 86%, respectively. The compliance
rate was 76.8% for ESM, i.e. out of the total number of days on which ESM was used by
all study participants, on 76.8% of the days at least 6 beep‐questionnaires had been
completed. Not completed beep‐questionnaires were considered as missing values in
the analyses.
To compare end‐of‐day diary to ESM scores, the scales of the two methods were
harmonized (i.e. ESM from a 7‐point to a 5‐point scale). A Cronbach’s α was calculated
for the original and rescaled ESM data; α=0.647 versus 0.648, respectively,
demonstrating that the rescaling did not influence the data strongly.
End‐of‐day diary compared to ESM scores
There was a significant association between end‐of‐day diary scores and corresponding
ESM day‐mean scores for all GI symptoms analysed (Table 9.1), demonstrating that
both methods measure the same construct, with estimates (indicating the direction and
strength of the association) ranging between 0.38 (SE 0.10) and 1.08 (SE 0.06), p<0.001.
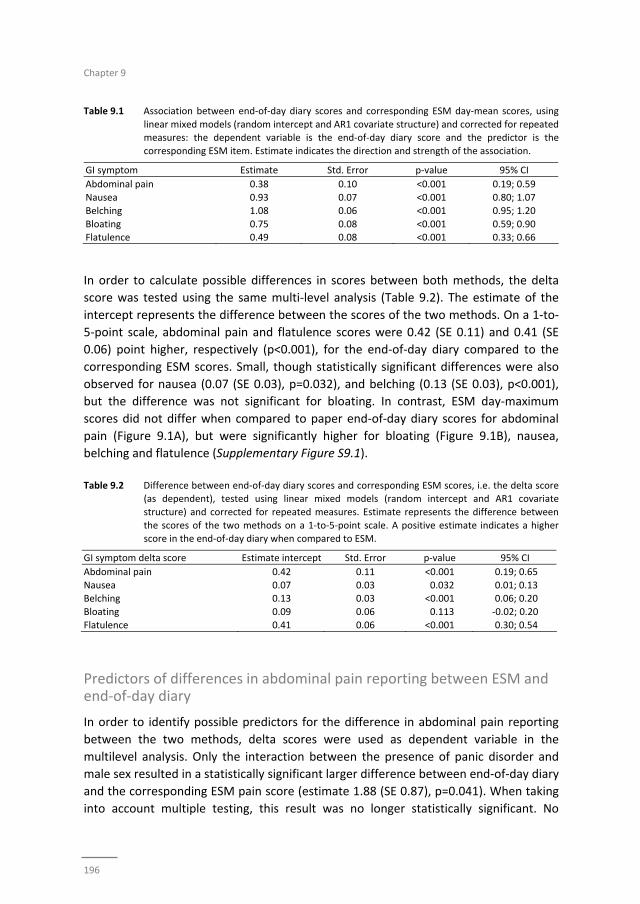
Chapter 9
196
Table 9.1 Association between end‐of‐day diary scores and corresponding ESM day‐mean scores, using
linear mixed models (random intercept and AR1 covariate structure) and corrected for repeated measures: the dependent variable is the end‐of‐day diary score and the predictor is the
corresponding ESM item. Estimate indicates the direction and strength of the association.
GI symptom Estimate Std. Error p‐value 95% CI
Abdominal pain 0.38 0.10 <0.001 0.19; 0.59
Nausea 0.93 0.07 <0.001 0.80; 1.07
Belching 1.08 0.06 <0.001 0.95; 1.20
Bloating 0.75 0.08 <0.001 0.59; 0.90 Flatulence 0.49 0.08 <0.001 0.33; 0.66
In order to calculate possible differences in scores between both methods, the delta
score was tested using the same multi‐level analysis (Table 9.2). The estimate of the
intercept represents the difference between the scores of the two methods. On a 1‐to‐
5‐point scale, abdominal pain and flatulence scores were 0.42 (SE 0.11) and 0.41 (SE
0.06) point higher, respectively (p<0.001), for the end‐of‐day diary compared to the
corresponding ESM scores. Small, though statistically significant differences were also
observed for nausea (0.07 (SE 0.03), p=0.032), and belching (0.13 (SE 0.03), p<0.001),
but the difference was not significant for bloating. In contrast, ESM day‐maximum
scores did not differ when compared to paper end‐of‐day diary scores for abdominal
pain (Figure 9.1A), but were significantly higher for bloating (Figure 9.1B), nausea,
belching and flatulence (Supplementary Figure S9.1).
Table 9.2 Difference between end‐of‐day diary scores and corresponding ESM scores, i.e. the delta score
(as dependent), tested using linear mixed models (random intercept and AR1 covariate
structure) and corrected for repeated measures. Estimate represents the difference between
the scores of the two methods on a 1‐to‐5‐point scale. A positive estimate indicates a higher score in the end‐of‐day diary when compared to ESM.
GI symptom delta score Estimate intercept Std. Error p‐value 95% CI
Abdominal pain 0.42 0.11 <0.001 0.19; 0.65
Nausea 0.07 0.03 0.032 0.01; 0.13 Belching 0.13 0.03 <0.001 0.06; 0.20
Bloating 0.09 0.06 0.113 ‐0.02; 0.20
Flatulence 0.41 0.06 <0.001 0.30; 0.54
Predictors of differences in abdominal pain reporting between ESM and end‐of‐day diary
In order to identify possible predictors for the difference in abdominal pain reporting
between the two methods, delta scores were used as dependent variable in the
multilevel analysis. Only the interaction between the presence of panic disorder and
male sex resulted in a statistically significant larger difference between end‐of‐day diary
and the corresponding ESM pain score (estimate 1.88 (SE 0.87), p=0.041). When taking
into account multiple testing, this result was no longer statistically significant. No
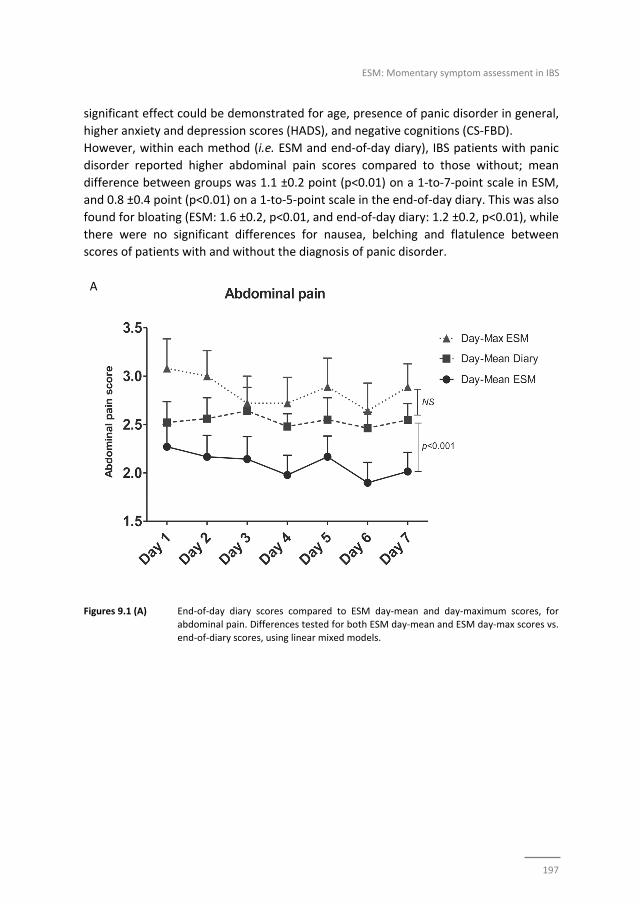
ESM: Momentary symptom assessment in IBS
197
significant effect could be demonstrated for age, presence of panic disorder in general,
higher anxiety and depression scores (HADS), and negative cognitions (CS‐FBD).
However, within each method (i.e. ESM and end‐of‐day diary), IBS patients with panic
disorder reported higher abdominal pain scores compared to those without; mean
difference between groups was 1.1 ±0.2 point (p<0.01) on a 1‐to‐7‐point scale in ESM,
and 0.8 ±0.4 point (p<0.01) on a 1‐to‐5‐point scale in the end‐of‐day diary. This was also
found for bloating (ESM: 1.6 ±0.2, p<0.01, and end‐of‐day diary: 1.2 ±0.2, p<0.01), while
there were no significant differences for nausea, belching and flatulence between
scores of patients with and without the diagnosis of panic disorder.
A
Figures 9.1 (A) End‐of‐day diary scores compared to ESM day‐mean and day‐maximum scores, for abdominal pain. Differences tested for both ESM day‐mean and ESM day‐max scores vs.
end‐of‐diary scores, using linear mixed models.
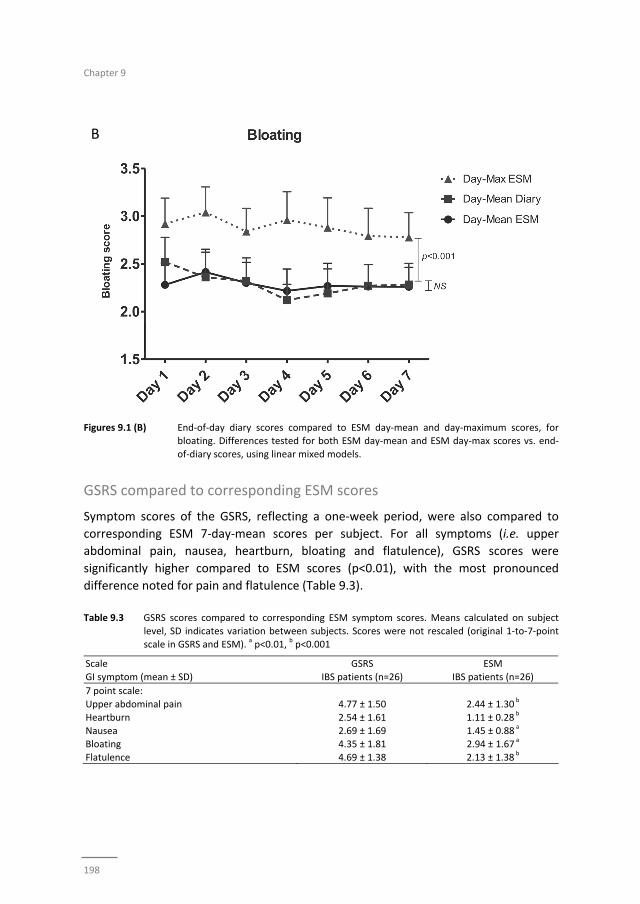
Chapter 9
198
B
Figures 9.1 (B) End‐of‐day diary scores compared to ESM day‐mean and day‐maximum scores, for bloating. Differences tested for both ESM day‐mean and ESM day‐max scores vs. end‐
of‐diary scores, using linear mixed models.
GSRS compared to corresponding ESM scores
Symptom scores of the GSRS, reflecting a one‐week period, were also compared to
corresponding ESM 7‐day‐mean scores per subject. For all symptoms (i.e. upper
abdominal pain, nausea, heartburn, bloating and flatulence), GSRS scores were
significantly higher compared to ESM scores (p<0.01), with the most pronounced
difference noted for pain and flatulence (Table 9.3).
Table 9.3 GSRS scores compared to corresponding ESM symptom scores. Means calculated on subject
level, SD indicates variation between subjects. Scores were not rescaled (original 1‐to‐7‐point scale in GSRS and ESM).
a p<0.01,
b p<0.001
Scale GSRS ESM
GI symptom (mean ± SD) IBS patients (n=26) IBS patients (n=26)
7 point scale:
Upper abdominal pain 4.77 ± 1.50 2.44 ± 1.30 b
Heartburn 2.54 ± 1.61 1.11 ± 0.28 b
Nausea 2.69 ± 1.69 1.45 ± 0.88 a
Bloating 4.35 ± 1.81 2.94 ± 1.67 a
Flatulence 4.69 ± 1.38 2.13 ± 1.38 b
ESM: Momentary symptom assessment in IBS
199
Discussion
The current study demonstrates that retrospective symptom measurement by end‐of‐
day diaries as well as an end‐of‐week questionnaire (GSRS), leads to higher scores when
compared to electronic momentary symptom assessment (i.e. by ESM), in patients with
IBS. This difference is most pronounced for abdominal pain and flatulence. Abdominal
pain scores in the end‐of‐day dairies were similar to maximum pain reporting in ESM,
indicating that subjects tend to report peak pain rather than average pain scores of the
day in an end‐of‐day diary. This was not found for the other tested GI symptoms. With
regard to GSRS versus ESM, in addition to abdominal pain and flatulence, also nausea,
heartburn and bloating scores were higher in the retrospective method compared to
momentary assessment. Furthermore, affective complaints in general did not lead to a
larger difference in abdominal pain reporting between the end‐of‐day diary and ESM.
However, within each method, IBS patients with panic disorder reported higher
abdominal pain and bloating scores compared to those without.
The reporting of peak rather than average abdominal pain has been described
previously by Weinland et al.16 for IBS patients, and by Redelmeier et al.26 studying
abdominal pain of other origin, i.e. colonoscopy and lithotripsy associated pain. The
observed patient preferences of peak pain reporting provide more understanding with
regard to pain memory and perceived relevance in IBS patients. Interestingly, peak
reporting was not found for nausea, bloating, belching and flatulence. The current
findings may imply that pain is more prone to recall bias than other GI symptoms in IBS
and may also be related to a considerable affective component in pain perception.
However, it should be noted that some symptoms, especially nausea and belching,
were less prevalent, and consequently the present study may lack power to identify
potential differences between the methods for these symptoms. Accordingly it might
be interesting to assess a symptom as nausea in a population of functional dyspepsia
patients in order to investigate whether a larger difference between ESM and end‐of‐
day diaries can be observed.
When comparing ESM scores to retrospective end‐of‐week GSRS scores, even larger
differences were found in comparison to ESM versus end‐of‐day diary scores, indicating
that questionnaires with a longer recall period are associated with higher symptom
scores in IBS patients. This is in line with previous research describing differences
between end‐of‐day and end‐of‐week symptoms assessment in IBS.4 When analysing
ESM data in more detail, GI symptoms in IBS patients were found to fluctuate
considerably during the day and during the week. The 7‐day mean of ESM data is an
average of days with higher and lower symptom burden. Subjects are prone to base
their scores on symptomatic days when filling in the GSRS, equivalent to the peak‐pain
tendency in the end‐of‐day diaries. This tendency may underlie the recall bias in
Chapter 9
200
retrospective methods. The differences between ESM and GSRS were tested
parametrically on subject‐level. However, non‐parametric testing did not lead to
different outcomes. The standard deviations of GSRS and ESM 7‐day mean scores,
indicating variation between subjects, in this analysis were broad, but differences
between methods were highly significant.
Prevalent psychological factors in IBS, in particular anxiety, have been reported to
affect pain processing, memory and interpretation.11 To investigate how anxiety may
influence the difference between the retrospective (based on memory) and momentary
assessment of abdominal pain, we included IBS patients with and without a diagnosis of
comorbid panic disorder in the current study. Although, the overall scores for
abdominal pain were higher in patients with compared to the group without panic
disorder, only the presence of panic disorder in male subjects was found to be a
significant predictor of a higher pain score difference between ESM and end‐of‐day
diary. However, this predictor was no longer significant when corrected for multiple
testing and should therefore be interpreted carefully. Furthermore, given the higher
abdominal pain scores in IBS patients with panic disorder compared to those without,
anxiety should be seen as a stable trait factor, which may less depend from
momentarily fluctuating contextual influences in IBS. It has to be acknowledged that in
the current study the IBS patients with panic disorder were overrepresented relative to
the general IBS population. Therefore our data need to be replicated by future studies
in large non‐selected IBS cohorts.
In addition to higher overall scores and peak‐symptom reporting in paper end‐of‐day
diaries, this method is also compromised by high fake compliance, as demonstrates
previously by Stone et al.12 Therefore, serious concern has risen with respect to the
validity of retrospective paper end‐of‐day diaries. Fake compliance is excluded in ESM,
since subjects can only respond within 10 minutes after the beep, and moreover, actual
compliance can be monitored. We considered a subject to be compliant on a specific
day if at least 6 out of 10 beep‐questionnaires had been completed and found a good
compliance rate for ESM, i.e. 76.8% for the total study population.
Certain limitations of the present study should be mentioned. In the current study we
have not assessed differences in reporting of consistency and frequency of defecation
between the symptom assessment methods, while disordered defecation is a key
symptom of IBS. Furthermore, the use of ESM may lead to higher patient burden
compared to end‐of‐day paper diaries. This may lead to selection bias, because patient
may decide not to participate beforehand. The number of questions asked was high
and should be reduced in future investigations. The time needed to complete a beep‐
questionnaire should be less than 2 minutes. Questions used in ESM were selected
based on available questionnaires, such as the end‐of‐day diary2,3,22 and the GSRS,25,27
ESM: Momentary symptom assessment in IBS
201
and were previously not psychometrically tested for momentary symptom assessment.
Therefore, future studies evaluating the potential of ESM for symptom assessment in
IBS should study psychometric properties, regarding validity and reliability of the
instrument, which were not subject to analysis in this preliminary study. It has to be
acknowledged that for the comparison of ESM and end‐of‐day diaries, it was necessary
to rescale the ESM data from a 7 to a 5‐point scale, which could cause a distortion of
the results. However, the Cronbach’s α for ESM GI symptom scores did not change after
rescaling, and moreover, comparable results were found by comparing ESM (non‐
rescaled data) with GSRS scores. Finally, the exploratory aim of the current study has
resulted in a small sample size. However, this has not hampered the multilevel
analyses, which are based on repeated measures.
Our results demonstrate certain advantages of ESM as a new digital symptom
assessment tool in IBS patients, regardless of the presence of psychological complaints.
Nevertheless, further research is needed to optimize the content and number of
questions for the assessment of IBS symptoms and to validate the tool as well as the
selected questions within the target population, before ESM can be implemented in
medical science and clinical practice.
Because of the repeated measures, ESM offers the advantage to study symptom
fluctuation during the day and to investigate possible triggers of pain or other
symptoms in future investigations, including for example ecological and psychosocial
factors as well as linkage to bowel habits. This insight may lead to improvement of
therapies. Previously has been found that IBS symptom episodes on average last
several hours,16 which indicates that repeated measures over the day by ESM are
suitable to capture the symptom variability in these patients. All patients in the current
study had a debriefing interview with the researcher, and acknowledged that the
number of repeated measures was sufficient to adequately measure the GI symptom
variation over the day. Furthermore, ESM could be used for more detailed evaluation of
treatment response or for intervention purposes in behavioural therapies, in the
context of personalized medicine, by giving IBS patients specific feedback with regard
to triggers of symptoms identified by ESM. This has recently been successfully applied
in a group of individuals with depression.28
Conclusion
IBS patients report higher abdominal pain and flatulence scores in end‐of‐day diaries
when compared to day‐average scores of momentary symptom assessment by ESM,
with a preference of peak‐pain reporting at the end of the day. In retrospective
symptom questionnaires that cover a one‐week period, the difference of symptom
Chapter 9
202
reporting when compared to electronic ESM is even higher for abdominal pain and the
other GI symptoms. Affective comorbidity in IBS leads to higher abdominal pain and
bloating scores compared to IBS patients without, but did not strongly influence
differences in abdominal pain reporting between tested symptom assessment
methods.
ESM: Momentary symptom assessment in IBS
203
References
1. Spiegel B, Bolus R, Harris LA, Lucak S, Naliboff B, Esrailian E, Chey WD, Lembo A, Karsan H, Tillisch K, Talley J, Mayer E, Chang L. Measuring irritable bowel syndrome patient‐reported outcomes with an
abdominal pain numeric rating scale. Aliment Pharmacol Ther. 2009;30:1159‐70.
2. Thijssen AY, Jonkers DM, Leue C, van der Veek PP, Vidakovic‐Vukic M, van Rood YR, Clemens CH, Masclee AA. Dysfunctional cognitions, anxiety and depression in irritable bowel syndrome. J Clin
Gastroenterol. 2010;44:e236‐41.
3. Ludidi S, Mujagic Z, Jonkers D, Keszthelyi D, Hesselink M, Kruimel J, Conchillo J, Masclee A. Markers for visceral hypersensitivity in patients with irritable bowel syndrome. Neurogastroenterol Motil. 2014;
26:1104‐11.
4. Lackner JM, Jaccard J, Keefer L, Firth R, Carosella AM, Sitrin M, Brenner D; Representing the IBSOS Research Group. The accuracy of patient‐reported measures for GI symptoms: a comparison of real
time and retrospective reports. Neurogastroenterol Motil. 2014;26:1802‐11.
5. U.S. Department of Health and Human Services FaDA, Center for Drug Evaluation and Research (CDER). Guidance for Industry Irritable Bowel Syndrome ‐ Clinical Evaluation of Drugs for Treatment2012.
http://wwwfdagov/downloads/Drugs/Guidances/UCM205269pdf.
6. Bradburn NM, Rips LJ, Shevell SK. Answering autobiographical questions: the impact of memory and inference on surveys. Science. 1987;236:157‐61.
7. Bower GH. Mood and memory. Am Psychol. 1981;36:129‐48.
8. Babel P, Pieniazek L, Zarotynski D. The effect of the type of pain on the accuracy of memory of pain and affect. Eur J Pain. 2015;19:358‐68.
9. Bolger N, Davis A, Rafaeli E. Diary methods: capturing life as it is lived. Annu Rev Psychol. 2003;54:
579‐616. 10. Grzesiak M, Beszłej JA, Mulak A, Szechiński M, Szewczuk‐Bogusławska M, Waszczuk E, Kantorska M,
Frydecka D. The lifetime prevalence of anxiety disorders among patients with irritable bowel syndrome.
Adv Clin Exp Med. 2014;23:987‐92. 11. Gorczyca R, Filip R, Walczak E. Psychological aspects of pain. Ann Agric Environ Med. 2013;Spec no.
1:23‐7.
12. Stone AA, Shiffman S, Schwartz JE, Broderick JE, Hufford MR. Patient compliance with paper and electronic diaries. Control Clin Trials. 2003;24:182‐99.
13. Csikszentmihalyi M, Larson R. Validity and reliability of the Experience‐Sampling Method. J Nerv Ment
Dis. 1987;175:526‐36. 14. Stone A, Shiffman S. Ecological Momentary Assessment (EMA) in behavioral medicine. Ann Behav Med.
1994;16(199‐202).
15. Myin‐Germeys I, Oorschot M, Collip D, Lataster J, Delespaul P, van Os J. Experience sampling research in psychopathology: opening the black box of daily life. Psychol Med. 2009;39:1533‐47.
16. Weinland SR, Morris CB, Hu Y, Leserman J, Bangdiwala SI, Drossman DA. Characterization of episodes of
irritable bowel syndrome using ecological momentary assessment. Am J Gastroenterol. 2011;106: 1813‐20.
17. Longstreth GF, Thompson WG, Chey WD, Houghton LA, Mearin F, Spiller RC. Functional bowel
disorders. Gastroenterology. 2006;130:1480‐91. 18. 4th. ed., text rev.; DSM‐IV‐TR; American Psychiatric Association. 2000.
19. Zigmond AS, Snaith RP. The hospital anxiety and depression scale. Acta Psychiatr Scand. 1983;67:
361‐70. 20. Bjelland I, Dahl AA, Haug TT, Neckelmann D. The validity of the Hospital Anxiety and Depression Scale.
An updated literature review. J Psychosom Res. 2002;52:69‐77.
21. Toner BB, Stuckless N, Ali A, Downie F, Emmott S, Akman D. The development of a cognitive scale for functional bowel disorders. Psychosom Med. 1998;60:492‐7.
22. Mujagic Z, Ludidi S, Keszthelyi D, Hesselink MA, Kruimel JW, Lenaerts K, Hanssen NM, Conchillo JM,
Jonkers DM, Masclee AA. Small intestinal permeability is increased in diarrhoea predominant IBS, while alterations in gastroduodenal permeability in all IBS subtypes are largely attributable to confounders.
Aliment Pharmacol Ther. 2014;40:288‐97.
Chapter 9
204
23. Myin‐Germeys I, Birchwood M, Kwapil T. From environment to therapy in psychosis: a real‐world
momentary assessment approach. Schizophr Bull. 2011;37:244‐7. 24. Courvoisier DS, Eid M, Lischetzke T. Compliance to a cell phone‐based ecological momentary
assessment study: the effect of time and personality characteristics. Psychol Assess. 2012;24:713‐20.
25. Revicki DA, Wood M, Wiklund I, Crawley J. Reliability and validity of the Gastrointestinal Symptom Rating Scale in patients with gastroesophageal reflux disease. Qual Life Res. 1998;7:75‐83.
26. Redelmeier DA, Kahneman D. Patients' memories of painful medical treatments: real‐time and
retrospective evaluations of two minimally invasive procedures. Pain. 1996;66:3‐8. 27. Svedlund J, Sjodin I, Dotevall G. GSRS‐‐a clinical rating scale for gastrointestinal symptoms in patients
with irritable bowel syndrome and peptic ulcer disease. Dig Dis Sci. 1988;33:129‐34.
28. Kramer I, Simons CJ, Hartmann JA, Menne‐Lothmann C, Viechtbauer W, Peeters F, Schruers K, van Bemmel AL, Myin‐Germeys I, Delespaul P, van Os J, Wichers M. A therapeutic application of the
experience sampling method in the treatment of depression: a randomized controlled trial. World
Psychiatry. 2014;13:68‐77.
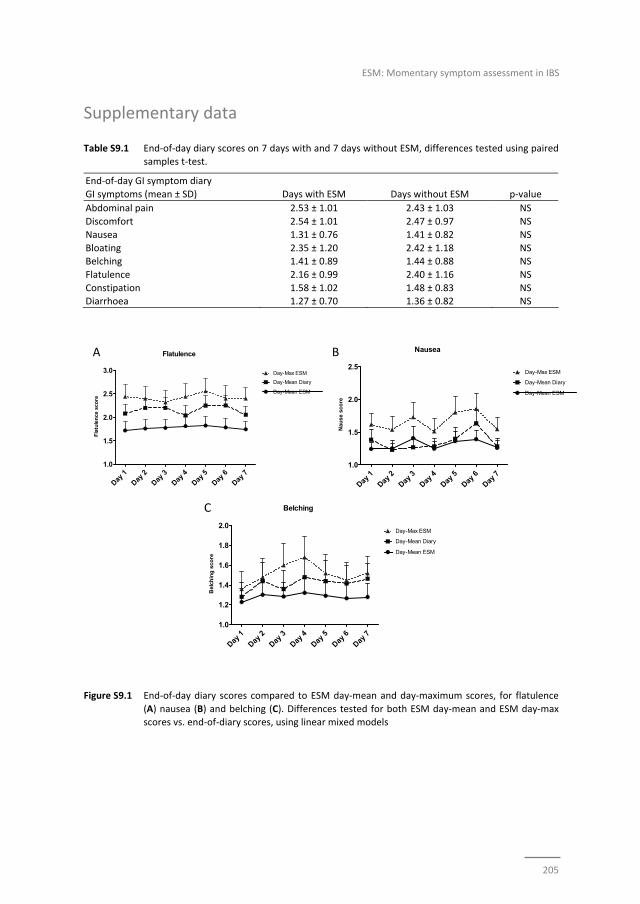
ESM: Momentary symptom assessment in IBS
205
Flatulence
Day 1
Day 2
Day 3
Day 4
Day 5
Day 6
Day 7
1.0
1.5
2.0
2.5
3.0
Day-Mean ESM
Day-Mean Diary
Day-Max ESM
Fla
tule
nce
sco
re
Nausea
Day 1
Day 2
Day 3
Day 4
Day 5
Day 6
Day 7
1.0
1.5
2.0
2.5
Day-Mean ESM
Day-Mean Diary
Day-Max ESM
Nau
se s
core
Supplementary data
Table S9.1 End‐of‐day diary scores on 7 days with and 7 days without ESM, differences tested using paired samples t‐test.
End‐of‐day GI symptom diary
GI symptoms (mean ± SD) Days with ESM Days without ESM p‐value
Abdominal pain 2.53 ± 1.01 2.43 ± 1.03 NS
Discomfort 2.54 ± 1.01 2.47 ± 0.97 NS
Nausea 1.31 ± 0.76 1.41 ± 0.82 NS
Bloating 2.35 ± 1.20 2.42 ± 1.18 NS Belching 1.41 ± 0.89 1.44 ± 0.88 NS
Flatulence 2.16 ± 0.99 2.40 ± 1.16 NS
Constipation 1.58 ± 1.02 1.48 ± 0.83 NS Diarrhoea 1.27 ± 0.70 1.36 ± 0.82 NS
A B
C
Figure S9.1 End‐of‐day diary scores compared to ESM day‐mean and day‐maximum scores, for flatulence
(A) nausea (B) and belching (C). Differences tested for both ESM day‐mean and ESM day‐max scores vs. end‐of‐diary scores, using linear mixed models
Belching
Day 1
Day 2
Day 3
Day 4
Day 5
Day 6
Day 7
1.0
1.2
1.4
1.6
1.8
2.0
Day-Mean ESM
Day-Mean Diary
Day-Max ESM
Bel
chin
g s
core

Chapter 9
206

207
PART III
Biomarkers

Chapter 1
208
209
Chapter 10
A novel faecal and plasma biomarker panel for IBS
A novel gut health biomarker panel for irritable bowel syndrome and the application
in the general population
Zlatan Mujagic*, Ettje F Tigchelaar*, Alexanda Zhernakova, Thomas Ludwig,
Javier Ramiro‐Garcia, Agnieszka Baranska, Morris A Swertz, Ad AM Masclee,
Cisca Wijmenga, Frederik J van Schooten, Agnieszka Smolinska^, Daisy MAE Jonkers^
* / ^ authors share co‐first and co‐last authorship, respectively
Submitted
Chapter 10
210
Abstract
Objective
Biological markers for the diagnosis of functional gastrointestinal (GI) disorders, such as
irritable bowel syndrome (IBS) that correlate well with GI symptom severity, are
lacking. The objective of the present study was to identify and validate a non‐invasive
biomarker panel, related to several domains of gut health associated with the
pathophysiology of IBS, that discriminates IBS patients from healthy controls (HC), and
correlates with GI symptom severity.
Methods and findings
Six plasma cytokines (IL‐1β, IL‐6, IL‐8, IL‐10, IL‐12p70, TNF‐α), plasma citrulline, and
eight faecal markers (human β‐defensin 2 (HBD2), calprotectin, chromogranin A (CgA),
short chain fatty acids: acetate, propionate, butyrate, valerate, and caproate, were
measured in a cohort of 196 clinical IBS patients and 160 HC without GI symptoms. A
combination of biomarkers, which best discriminates between IBS and HC was
identified and validated in an independent validation set and by permutation testing. A
non‐invasive 8‐item biomarker panel consisting of IL‐1β, IL‐6, IL12p70, TNF‐α, CgA,
HBD2, calprotectin and caproate, was identified to discriminate IBS form HC with high
sensitivity (88.1%) and specificity (86.5%), with an area under the ROC curve of 0.89.
The results for the IBS subtypes were comparable. Moreover, a moderate correlation
was found for biomarker panel and GI symptom scores in the IBS cohort (r=0.59,
p<0.001). Furthermore, to test a possible application of the biomarker panel, all
biomarkers were measured in a general population cohort of 958 subjects. In subjects
of this cohort with low to moderate GI symptom burden a moderate correlation
(r=0.51, p=0.003) was found between the 8‐item biomarker panel and several GI
symptom scores.
Conclusion
A novel non‐invasive multi‐domain biomarker panel, with high positive predictive value
for IBS, has been identified and validated, which correlated moderately to GI symptom
severity in IBS patients and general population subjects.
A novel biomarker panel for IBS
211
Introduction
Interest in ‘gut health’ is rapidly emerging, not only from a scientific but also from a
societal and individual perspective.1 Gastrointestinal (GI) symptoms and disorders occur
frequently in the general population and may reflect compromised gut health.2
Although gut health is difficult to define, five major domains related to a healthy GI
system have been proposed by Bischoff. These domains include effective digestion and
absorption, normal and stable microbiota, effective immune status, absence of GI
illness and status of general well‐being.1 As various underlying mechanisms may affect
these domains, it is challenging to identify and validate markers for gut health. This is
particularly relevant when healthy subjects are compared with subjects with functional
GI disorders, or when evaluating potential benefits of dietary interventions. For organic
GI diseases, diagnostic tools and markers are generally available in daily clinical
practice, such as GI endoscopy, histological examination of tissue samples or
biomarkers (e.g. anti‐transglutaminase antibodies).3,4 However, objective biological
markers that aid the diagnostic process and facilitate follow up and assessment of
treatment efficacy of functional GI disorders, such as Irritable Bowel Syndrome (IBS),
are lacking. Neither are markers available that correlate well with GI symptom
severity.5,6
The Rome III symptom criteria are the current gold standard for the diagnosis of IBS.
But, although the Rome committee emphasizes that IBS is not a diagnosis of exclusion
and should be based on symptom criteria, in daily clinical practice endoscopy, CT or
ultrasound imaging, blood, faecal or other analyses are frequently used to exclude
organic disorders.7 Therefore, there is increasing interest in reliable biomarkers that
can aid the diagnosis of IBS. A clinically and scientifically relevant biomarker for IBS
should be able to a) discriminate IBS patients from healthy subjects, b) discriminate IBS
patients from subjects with organic GI disorders, and c) correlate with severity of GI
symptoms, to be useful for monitoring of treatment efficacy. Finding objective
biomarkers that correlate with the severity of GI symptoms in IBS is also an important
step towards suitable biomarkers for functional GI complaints and gut health in the
general population.
Up to now, use of non‐invasive single biomarkers for IBS has led to only moderate
results.5,6 Therefore, recent studies focused on biomarker panels.8 To date, a specificity
and sensitivity of 88% and 50%, respectively, has been reported for a 10 item‐serum
marker panel,9 and of 64% and 81%, respectively, for a 34 item‐serum/genetic marker
panel for the discrimination of IBS patients versus healthy controls.10 Though promising,
biomarkers with higher specificity and sensitivity are needed for daily clinical practice
and scientific research. We postulated that combining markers that reflect the
multifactorial pathophysiology of IBS may lead to better results. Strong evidence exists
for a combination of rather subtle pathophysiological changes, such as low‐grade
Chapter 10
212
mucosal and systemic immune activation, intestinal barrier dysfunction, dysregulation
in neural and neuro‐hormonal signalling and altered microbiota and host‐microbe
interaction, that contribute to symptom generation in IBS.11 These mechanisms do
overlap with the domains of gut health as described by Bischoff.1
In the current study, we hypothesized that biomarkers related to several domains of
gut health and associated with the pathophysiology of IBS, can be combined and used
as a highly sensitive and specific biomarker panel to discriminate clinically diagnosed
IBS patients form healthy controls. Secondly, we hypothesized that this biomarker
panel correlates with GI symptom severity, not only in IBS patients derived from a
clinical setting with relatively high symptom burden, but also in subjects with mild to
moderate GI symptoms from the general population.
The primary objective of the present study was to assess levels of selected plasma and
faecal biomarkers, related to several domains of gut health, and to identify and validate
a non‐invasive biomarker panel, which best discriminates IBS patients from healthy
controls. The secondary objective was to correlate the biomarker panel to GI symptom
severity in clinical IBS patients as well as in a large general population cohort.
Methods
Two large Dutch cohorts were used for the current study, i.e. a clinical cohort of IBS
patients and healthy controls without GI symptoms (Maastricht IBS (MIBS) cohort),12,13
and a general population cohort (LifeLines (LL) DEEP).14 From both cohorts, subjects
were included in the analyses if faecal and plasma samples and completed GI symptom
scores were available. Identification and validation of the biomarker panel was
conducted in clinical IBS patients and healthy controls of the MIBS cohort. The
correlation of the biomarker panel to GI symptoms was evaluated in both cohorts. All
study participants gave written informed consent prior to inclusion. Study protocols
were approved by the Maastricht University Medical Center+ (MUMC+) and University
Medical Centre Groningen (UMCG) Ethics Committees, respectively, and were in
compliance with the revised Declaration of Helsinki (64th WMA General Assembly,
Fortaleza, Brazil, 2013). The MIBS cohort was registered in the US National Library of
Medicine (http://www.clinicaltrials.gov, NCT00775060).
Study participants; MIBS cohort
IBS patients, between 18 and 75 years of age, diagnosed by their treating physician and
fulfilling Rome III criteria, were recruited via the outpatient gastroenterology‐
hepatology clinic of MUMC+, a secondary and tertiary referral centre, and via general
practitioners in the area of Maastricht. Medical history was taken and GI endoscopy
A novel biomarker panel for IBS
213
with biopsies, abdominal imaging and/or blood, breath and faecal analyses were
performed to exclude organic disease, when indicated. Patients with a history of
abdominal surgery, apart from appendectomy, laparoscopic cholecystectomy and
hysterectomy, were excluded. Patients were assigned to IBS subtypes based on
predominant bowel habits according to the Rome III criteria: diarrhoea (IBS‐D),
constipation (IBS‐C), mixed stool pattern (IBS‐M) and unspecified subtype (IBS‐U). Age
and sex matched healthy controls (HC) were enrolled via public advertising. A brief
medical history was taken to exclude the presence of previous or current GI disorders
or complaints. All study participants completed questionnaires regarding demographic
characteristics and lifestyle factors. A 14‐day end‐of‐day GI symptom diary was
completed, addressing symptoms of abdominal discomfort and pain, nausea, bloating,
belching, flatulence, diarrhoea and constipation, on a 1‐to‐5 point Likert scale.13
Study participants; LL DEEP cohort
Study participants above 18 years of age and regardless of their medical background or
current complaints were enrolled from a large general population cohort in the
Netherlands, i.e. LifeLines.15 In a subgroup of the cohort, referred to as LifeLines
Detailed Extensive Examination of Participants (LL DEEP), among others subjects
collected faecal samples and completed self‐report questionnaires on demographics
and lifestyle factors, as well as a 7‐day GI symptom diary, which was identical to the
14‐day diary used in the MIBS cohort.14 Information on clinical diagnoses of IBS was not
available for this general population cohort.
Selection of biomarkers
Forty‐three potential biomarkers were selected based on extensive literature search,
using the following selection criteria: i) markers are related to one or more gut health
domains as described by Bischoff1; ii) they potentially discriminate between subjects
with healthy gut function and IBS patients; and iii) can be measured in blood or faecal
samples collected according to generally accepted and applicable procedures for bio
sample collection. Based on expert panels, focusing on relevance and feasibility of the
markers, fifteen biomarkers were selected to be measured (in both cohorts). Plasma
citrulline, a marker of functional enterocyte mass of the small bowel, was selected as
indicator of the absorptive16,17 and barrier function of the small intestine.18,19 Non‐
stimulated plasma cytokine levels, i.e. IL‐1β, IL‐6, IL‐8, IL‐10, IL‐12p70 and TNF‐α, were
selected as markers of systemic immune activation.20,21 Faecal calprotectin, a calcium
and zinc‐binding protein, was selected as an indicator of intestinal inflammation,
proportional to neutrophil migration towards the intestinal tract.22‐24 Faecal human
β‐defensin 2 (HBD2), a human antimicrobial peptide produced by among others
intestinal epithelial cells in response to (pathogenic) bacteria, was selected as an
indicator of host defence against microbes.25,26 Faecal short chain fatty acids (SCFAs),
Chapter 10
214
i.e. acetate, propionate, butyrate, valerate, and caproate, are products of microbial
fermentation of non‐digested oligosaccharides in the colon, and were selected as
indicators of gut intraluminal metabolic activity. SCFAs have been associated to
multiple pathological and physiological mechanisms in humans, e.g. modulation of
inflammation, satiety, carcinogenesis, and are an important energy source for
colonocytes.27,28 Faecal chromogranin A (CgA), was selected as an indicator of the
intestinal neuroendocrine cell activity. This peptide is produced by among others
enterochromaffin cells, and is co‐localized in storage granules with serotonin.24,29‐31
Measurement of biomarkers
Faecal and blood samples were collected using standardized collection procedures.
Venous blood was collected in K2EDTA (BD Vacutainer®) tubes and centrifuged to
obtained plasma supernatants, which were aliquoted and frozen at ‐80°C until analysis.
In the same time period, subjects collected stool samples, which were aliquoted and
stored at ‐80°C within 24 hours after defecation. All markers were measured
simultaneously to avoid additional thaw cycles, by ‘Medische Laboratoria Dr. Stein &
Colleges’, The Netherlands. Calprotectin and HBD2 were assessed using a commercial
enzyme‐linked immunosorbent assay (ELISA, by Bühlmann Laboratories, Switzerland,
and Immunodiagnostik AG, Germany, respectively),24,26 and CgA using a commercial
radioimmunoassay (RIA, Euro‐Diagnostica, Sweden),24 as described previously.24,26
Faecal SCFAs, i.e. acetate, propionate, butyrate, valerate and caproate, were measured
by gas chromatography‐mass spectrometry (GC‐MS) according to the method described
by Garciá‐Villalba et al.32 Concentrations of plasma citrulline were determined by high
pressure liquid chromatography (HPLC) fluorescence detection, as described
previously.16 Plasma cytokines, i.e. IL‐1β, IL‐6, IL‐8, IL‐10, IL‐12p70 and TNF‐α, were
measured by ProcartaPlexTM multiplex immunoassay (eBioscience, USA), as described
previously.33,34
Data and statistical analysis
Levels of individual biomarkers were compared between groups using the Mann‐
Whitney U test, due to left skewed distributions, with post‐hoc correction for multiple
testing by the Benjamini‐Hochberg step‐up procedure.35 The method of multiple
imputations was implemented as part of the statistical procedure for biomarker levels
that were below the detection limit.36 These were randomly (with uniform distribution)
replaced by levels ranging from zero till limit of detection. The assignment of values
below detection limit was repeated 2000 times. All statistical results were calculated as
average values over the 2000 iterations.
The data set of the MIBS cohort was then used for identification and validation of a
biomarker panel that best discriminates between IBS and HC, using a supervised
technique, namely Partial Least Square Discriminant Analysis (PLS‐DA).37 This strategy
A novel biomarker panel for IBS
215
for supervised data analysis via PLS‐DA involved a random division of the MIBS cohort
into a representative training set (80% of samples per group) and a validation set (20%
of samples per group), as described by Guyon.38 Within the training set we applied
double cross‐validation procedure for model optimization, the most discriminatory
biomarker selection and for development of the final PLS‐DA classification model.39,40
The latter was done in the independent validation set of the MIBS cohort (the randomly
separated 20% of samples not used in any optimization steps), by testing the
performance of selected biomarker panel to classify individuals as being an IBS patient
or HC.
Note, that commonly used cross‐validation leads to optimistic bias (i.e. too low error
estimate).41 Thus, it was not used in our analyses for evaluating the predictive power of
the PLS‐DA model.
Furthermore, linear correlations between the most discriminatory biomarker panel and
a set of GI symptoms, including all items of the GI symptom diary were tested in the
MIBS and in the general population LL‐DEEP cohort, using canonical correlation analysis
(CCA),42 which is an extension of bi‐variate correlation. CCA calculates a linear
correlation that best explains the variability both within and between the biomarker
panel and the measured GI symptoms.
Results
Identification and validation of the most discriminative biomarker panel for IBS versus HC
Baseline characteristics for 196 clinical IBS patients and 160 age and gender matched
HC without GI symptoms (MIBS cohort) are presented in Table 10.1. All GI symptom
scores were higher in IBS patients compared to HC. The scores for constipation and
diarrhoea were significantly altered, in line with the IBS subtypes (data not shown).
The biomarker data for IBS and HC subjects of the total MIBS cohort are presented in
Table 10.2. Based on univariate comparisons, non‐stimulated IL‐1β and IL‐6 were
significantly lower, while IL‐12p70 was significantly higher in plasma samples of IBS
patients relative to HC. In faecal samples, CgA and calprotectin were significantly
increased, while HBD2, and the SCFAs, valerate and caproate, were significantly
decreased in IBS patients compared to HC. These differences remained statistically
significant after correction for multiple testing.
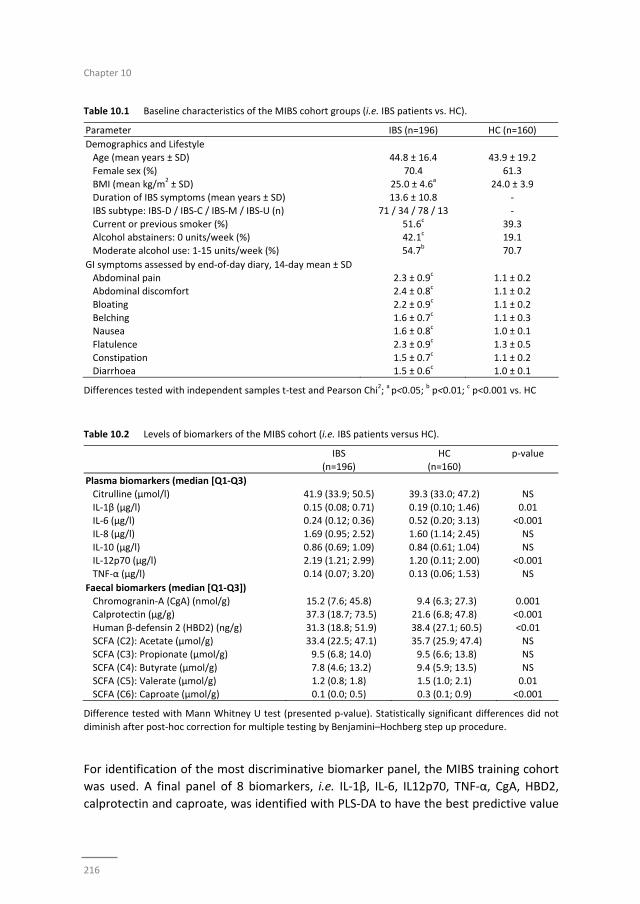
Chapter 10
216
Table 10.1 Baseline characteristics of the MIBS cohort groups (i.e. IBS patients vs. HC).
Parameter IBS (n=196) HC (n=160)
Demographics and Lifestyle
Age (mean years ± SD) 44.8 ± 16.4 43.9 ± 19.2
Female sex (%) 70.4 61.3
BMI (mean kg/m2 ± SD) 25.0 ± 4.6
a 24.0 ± 3.9
Duration of IBS symptoms (mean years ± SD) 13.6 ± 10.8 ‐
IBS subtype: IBS‐D / IBS‐C / IBS‐M / IBS‐U (n) 71 / 34 / 78 / 13 ‐
Current or previous smoker (%) 51.6c 39.3
Alcohol abstainers: 0 units/week (%) 42.1c 19.1
Moderate alcohol use: 1‐15 units/week (%) 54.7b 70.7
GI symptoms assessed by end‐of‐day diary, 14‐day mean ± SD
Abdominal pain 2.3 ± 0.9c 1.1 ± 0.2
Abdominal discomfort 2.4 ± 0.8c 1.1 ± 0.2
Bloating 2.2 ± 0.9c 1.1 ± 0.2
Belching 1.6 ± 0.7c 1.1 ± 0.3
Nausea 1.6 ± 0.8c 1.0 ± 0.1
Flatulence 2.3 ± 0.9c 1.3 ± 0.5
Constipation 1.5 ± 0.7c 1.1 ± 0.2
Diarrhoea 1.5 ± 0.6c 1.0 ± 0.1
Differences tested with independent samples t‐test and Pearson Chi2; a p<0.05;
b p<0.01;
c p<0.001 vs. HC
Table 10.2 Levels of biomarkers of the MIBS cohort (i.e. IBS patients versus HC).
IBS
(n=196)
HC
(n=160)
p‐value
Plasma biomarkers (median [Q1‐Q3)
Citrulline (μmol/l) 41.9 (33.9; 50.5) 39.3 (33.0; 47.2) NS
IL‐1β (μg/l) 0.15 (0.08; 0.71) 0.19 (0.10; 1.46) 0.01 IL‐6 (μg/l) 0.24 (0.12; 0.36) 0.52 (0.20; 3.13) <0.001
IL‐8 (μg/l) 1.69 (0.95; 2.52) 1.60 (1.14; 2.45) NS
IL‐10 (μg/l) 0.86 (0.69; 1.09) 0.84 (0.61; 1.04) NS IL‐12p70 (μg/l) 2.19 (1.21; 2.99) 1.20 (0.11; 2.00) <0.001
TNF‐α (μg/l) 0.14 (0.07; 3.20) 0.13 (0.06; 1.53) NS
Faecal biomarkers (median [Q1‐Q3])
Chromogranin‐A (CgA) (nmol/g) 15.2 (7.6; 45.8) 9.4 (6.3; 27.3) 0.001 Calprotectin (μg/g) 37.3 (18.7; 73.5) 21.6 (6.8; 47.8) <0.001
Human β‐defensin 2 (HBD2) (ng/g) 31.3 (18.8; 51.9) 38.4 (27.1; 60.5) <0.01
SCFA (C2): Acetate (μmol/g) 33.4 (22.5; 47.1) 35.7 (25.9; 47.4) NS SCFA (C3): Propionate (μmol/g) 9.5 (6.8; 14.0) 9.5 (6.6; 13.8) NS
SCFA (C4): Butyrate (μmol/g) 7.8 (4.6; 13.2) 9.4 (5.9; 13.5) NS
SCFA (C5): Valerate (μmol/g) 1.2 (0.8; 1.8) 1.5 (1.0; 2.1) 0.01 SCFA (C6): Caproate (μmol/g) 0.1 (0.0; 0.5) 0.3 (0.1; 0.9) <0.001
Difference tested with Mann Whitney U test (presented p‐value). Statistically significant differences did not
diminish after post‐hoc correction for multiple testing by Benjamini–Hochberg step up procedure.
For identification of the most discriminative biomarker panel, the MIBS training cohort
was used. A final panel of 8 biomarkers, i.e. IL‐1β, IL‐6, IL12p70, TNF‐α, CgA, HBD2,
calprotectin and caproate, was identified with PLS‐DA to have the best predictive value
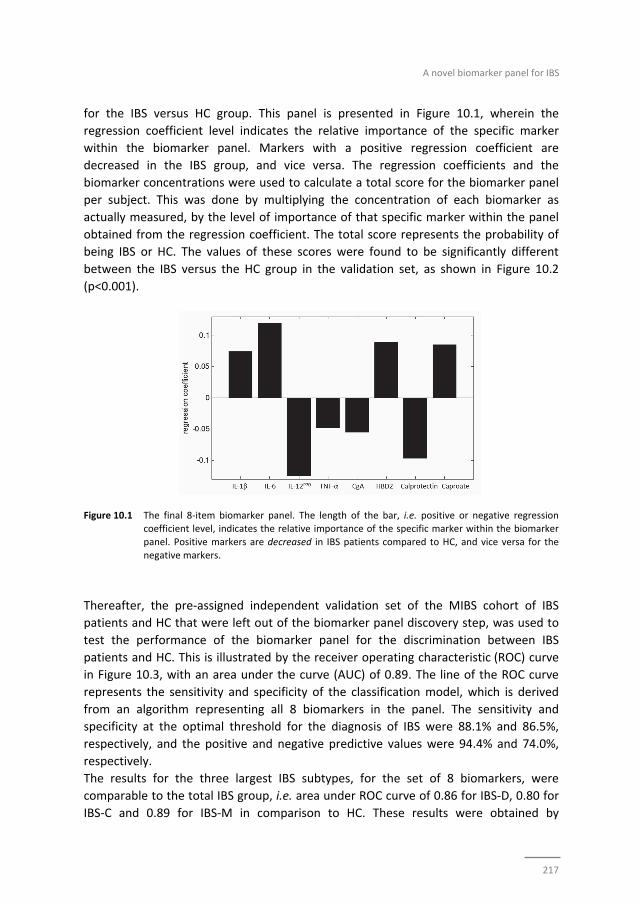
A novel biomarker panel for IBS
217
for the IBS versus HC group. This panel is presented in Figure 10.1, wherein the
regression coefficient level indicates the relative importance of the specific marker
within the biomarker panel. Markers with a positive regression coefficient are
decreased in the IBS group, and vice versa. The regression coefficients and the
biomarker concentrations were used to calculate a total score for the biomarker panel
per subject. This was done by multiplying the concentration of each biomarker as
actually measured, by the level of importance of that specific marker within the panel
obtained from the regression coefficient. The total score represents the probability of
being IBS or HC. The values of these scores were found to be significantly different
between the IBS versus the HC group in the validation set, as shown in Figure 10.2
(p<0.001).
Figure 10.1 The final 8‐item biomarker panel. The length of the bar, i.e. positive or negative regression coefficient level, indicates the relative importance of the specific marker within the biomarker
panel. Positive markers are decreased in IBS patients compared to HC, and vice versa for the
negative markers.
Thereafter, the pre‐assigned independent validation set of the MIBS cohort of IBS
patients and HC that were left out of the biomarker panel discovery step, was used to
test the performance of the biomarker panel for the discrimination between IBS
patients and HC. This is illustrated by the receiver operating characteristic (ROC) curve
in Figure 10.3, with an area under the curve (AUC) of 0.89. The line of the ROC curve
represents the sensitivity and specificity of the classification model, which is derived
from an algorithm representing all 8 biomarkers in the panel. The sensitivity and
specificity at the optimal threshold for the diagnosis of IBS were 88.1% and 86.5%,
respectively, and the positive and negative predictive values were 94.4% and 74.0%,
respectively.
The results for the three largest IBS subtypes, for the set of 8 biomarkers, were
comparable to the total IBS group, i.e. area under ROC curve of 0.86 for IBS‐D, 0.80 for
IBS‐C and 0.89 for IBS‐M in comparison to HC. These results were obtained by
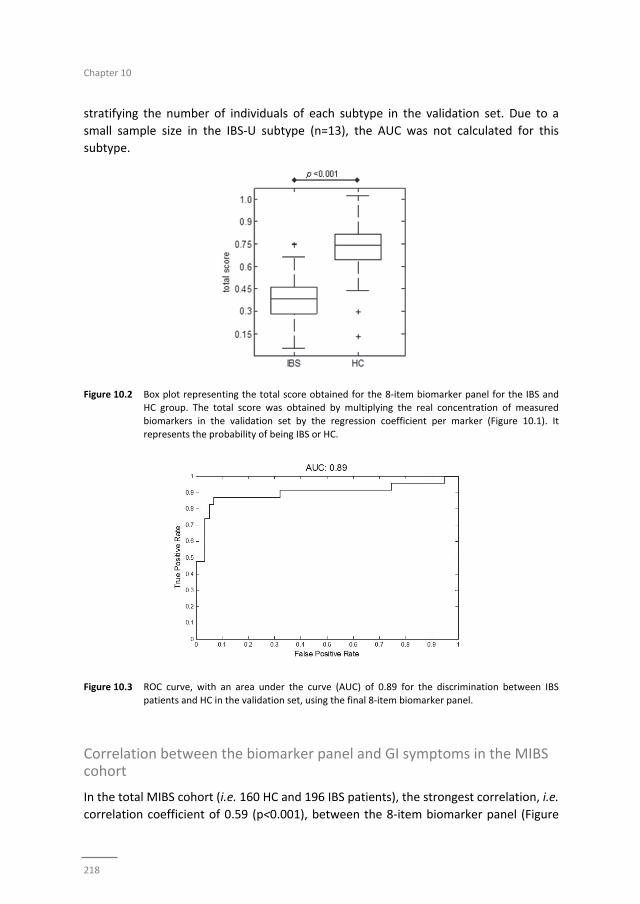
Chapter 10
218
stratifying the number of individuals of each subtype in the validation set. Due to a
small sample size in the IBS‐U subtype (n=13), the AUC was not calculated for this
subtype.
Figure 10.2 Box plot representing the total score obtained for the 8‐item biomarker panel for the IBS and HC group. The total score was obtained by multiplying the real concentration of measured
biomarkers in the validation set by the regression coefficient per marker (Figure 10.1). It
represents the probability of being IBS or HC.
Figure 10.3 ROC curve, with an area under the curve (AUC) of 0.89 for the discrimination between IBS
patients and HC in the validation set, using the final 8‐item biomarker panel.
Correlation between the biomarker panel and GI symptoms in the MIBS cohort
In the total MIBS cohort (i.e. 160 HC and 196 IBS patients), the strongest correlation, i.e.
correlation coefficient of 0.59 (p<0.001), between the 8‐item biomarker panel (Figure
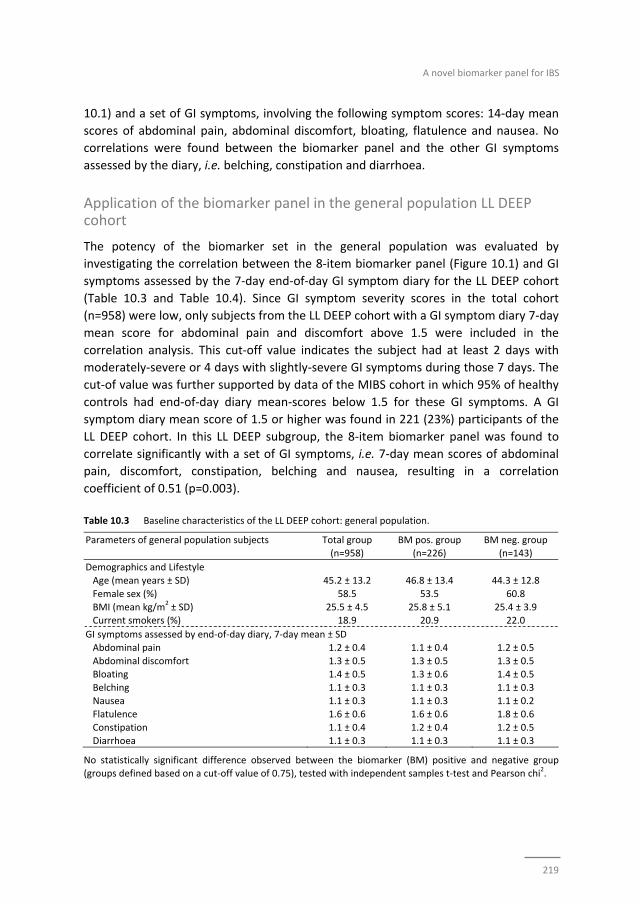
A novel biomarker panel for IBS
219
10.1) and a set of GI symptoms, involving the following symptom scores: 14‐day mean
scores of abdominal pain, abdominal discomfort, bloating, flatulence and nausea. No
correlations were found between the biomarker panel and the other GI symptoms
assessed by the diary, i.e. belching, constipation and diarrhoea.
Application of the biomarker panel in the general population LL DEEP cohort
The potency of the biomarker set in the general population was evaluated by
investigating the correlation between the 8‐item biomarker panel (Figure 10.1) and GI
symptoms assessed by the 7‐day end‐of‐day GI symptom diary for the LL DEEP cohort
(Table 10.3 and Table 10.4). Since GI symptom severity scores in the total cohort
(n=958) were low, only subjects from the LL DEEP cohort with a GI symptom diary 7‐day
mean score for abdominal pain and discomfort above 1.5 were included in the
correlation analysis. This cut‐off value indicates the subject had at least 2 days with
moderately‐severe or 4 days with slightly‐severe GI symptoms during those 7 days. The
cut‐of value was further supported by data of the MIBS cohort in which 95% of healthy
controls had end‐of‐day diary mean‐scores below 1.5 for these GI symptoms. A GI
symptom diary mean score of 1.5 or higher was found in 221 (23%) participants of the
LL DEEP cohort. In this LL DEEP subgroup, the 8‐item biomarker panel was found to
correlate significantly with a set of GI symptoms, i.e. 7‐day mean scores of abdominal
pain, discomfort, constipation, belching and nausea, resulting in a correlation
coefficient of 0.51 (p=0.003).
Table 10.3 Baseline characteristics of the LL DEEP cohort: general population.
Parameters of general population subjects Total group (n=958)
BM pos. group (n=226)
BM neg. group (n=143)
Demographics and Lifestyle
Age (mean years ± SD) 45.2 ± 13.2 46.8 ± 13.4 44.3 ± 12.8
Female sex (%) 58.5 53.5 60.8
BMI (mean kg/m2 ± SD) 25.5 ± 4.5 25.8 ± 5.1 25.4 ± 3.9
Current smokers (%) 18.9 20.9 22.0
GI symptoms assessed by end‐of‐day diary, 7‐day mean ± SD
Abdominal pain 1.2 ± 0.4 1.1 ± 0.4 1.2 ± 0.5
Abdominal discomfort 1.3 ± 0.5 1.3 ± 0.5 1.3 ± 0.5 Bloating 1.4 ± 0.5 1.3 ± 0.6 1.4 ± 0.5
Belching 1.1 ± 0.3 1.1 ± 0.3 1.1 ± 0.3
Nausea 1.1 ± 0.3 1.1 ± 0.3 1.1 ± 0.2 Flatulence 1.6 ± 0.6 1.6 ± 0.6 1.8 ± 0.6
Constipation 1.1 ± 0.4 1.2 ± 0.4 1.2 ± 0.5
Diarrhoea 1.1 ± 0.3 1.1 ± 0.3 1.1 ± 0.3
No statistically significant difference observed between the biomarker (BM) positive and negative group (groups defined based on a cut‐off value of 0.75), tested with independent samples t‐test and Pearson chi
2.
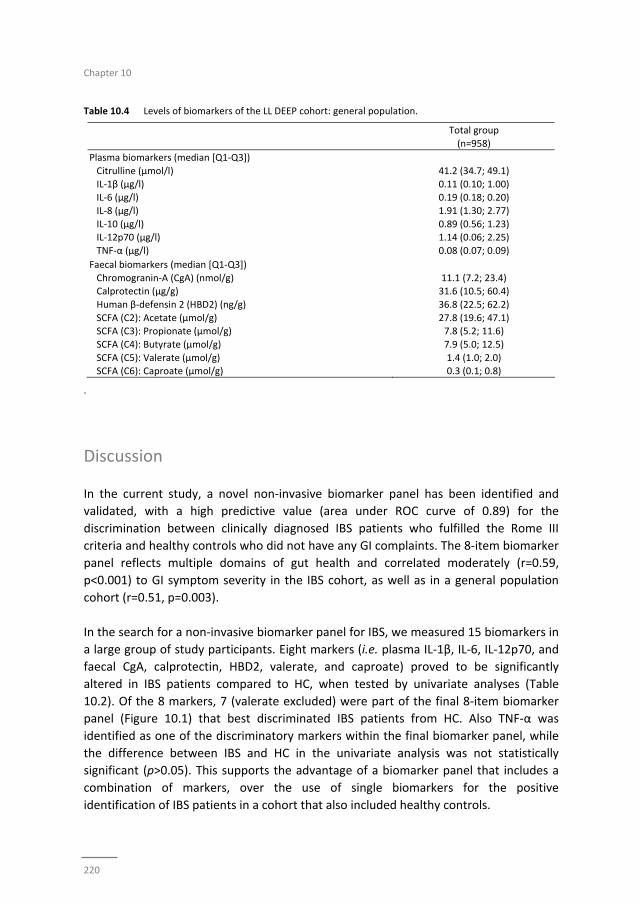
Chapter 10
220
Table 10.4 Levels of biomarkers of the LL DEEP cohort: general population.
Total group
(n=958)
Plasma biomarkers (median [Q1‐Q3])
Citrulline (μmol/l) 41.2 (34.7; 49.1)
IL‐1β (μg/l) 0.11 (0.10; 1.00) IL‐6 (μg/l) 0.19 (0.18; 0.20)
IL‐8 (μg/l) 1.91 (1.30; 2.77)
IL‐10 (μg/l) 0.89 (0.56; 1.23) IL‐12p70 (μg/l) 1.14 (0.06; 2.25)
TNF‐α (μg/l) 0.08 (0.07; 0.09)
Faecal biomarkers (median [Q1‐Q3])
Chromogranin‐A (CgA) (nmol/g) 11.1 (7.2; 23.4) Calprotectin (μg/g) 31.6 (10.5; 60.4)
Human β‐defensin 2 (HBD2) (ng/g) 36.8 (22.5; 62.2)
SCFA (C2): Acetate (μmol/g) 27.8 (19.6; 47.1) SCFA (C3): Propionate (μmol/g) 7.8 (5.2; 11.6)
SCFA (C4): Butyrate (μmol/g) 7.9 (5.0; 12.5)
SCFA (C5): Valerate (μmol/g) 1.4 (1.0; 2.0) SCFA (C6): Caproate (μmol/g) 0.3 (0.1; 0.8)
.
Discussion
In the current study, a novel non‐invasive biomarker panel has been identified and
validated, with a high predictive value (area under ROC curve of 0.89) for the
discrimination between clinically diagnosed IBS patients who fulfilled the Rome III
criteria and healthy controls who did not have any GI complaints. The 8‐item biomarker
panel reflects multiple domains of gut health and correlated moderately (r=0.59,
p<0.001) to GI symptom severity in the IBS cohort, as well as in a general population
cohort (r=0.51, p=0.003).
In the search for a non‐invasive biomarker panel for IBS, we measured 15 biomarkers in
a large group of study participants. Eight markers (i.e. plasma IL‐1β, IL‐6, IL‐12p70, and
faecal CgA, calprotectin, HBD2, valerate, and caproate) proved to be significantly
altered in IBS patients compared to HC, when tested by univariate analyses (Table
10.2). Of the 8 markers, 7 (valerate excluded) were part of the final 8‐item biomarker
panel (Figure 10.1) that best discriminated IBS patients from HC. Also TNF‐α was
identified as one of the discriminatory markers within the final biomarker panel, while
the difference between IBS and HC in the univariate analysis was not statistically
significant (p>0.05). This supports the advantage of a biomarker panel that includes a
combination of markers, over the use of single biomarkers for the positive
identification of IBS patients in a cohort that also included healthy controls.

A novel biomarker panel for IBS
221
Calprotectin and IL‐12p70 were increased in IBS patients compared to HC, pointing to a
low‐grade pro‐inflammatory state in IBS, as has been reported previously for
subgroups.20‐23 Interestingly, IL‐1β and IL‐6 were decreased in IBS patients compared to
HC. IBS is a chronic GI disorder, and in contrast to IL‐12p70, which is as pro‐
inflammatory cytokine associated with chronic inflammatory conditions,43,44 IL‐1β and
IL‐6 have both pro‐ and anti‐inflammatory properties, but are predominantly involved
in the acute‐phase immunological response.45‐47 This may imply that the acute
immunological response in IBS patients may not be affected. It should be taken into
account that we have measured baseline cytokine levels and not a stimulated cytokine
response (e.g. by LPS). Therefore, a presumed role of the measured cytokines in the IBS
pathophysiology should be interpreted with care. The level of CgA was increased in IBS
patients compared to HC, as has been observed previously,24 and may indicate an
altered intestinal neuroendocrine activity in IBS patients. Finally, the antimicrobial
peptide HBD2, as well as the SCFAs caproate and valerate, were decreased in IBS
patients compared to HC. The interpretation with regard to IBS pathophysiology is
challenging, since a decreased production as well as increased breakdown or
degradation could underlie the observed differences. Nevertheless, the observed
differences in faecal concentrations of these markers between IBS patients and HC are
indicative of altered gut microbial activity and/or host‐microbe interaction in IBS
patients.
Taken together, we have observed significant but subtle differences between IBS
patients and HC for several of the tested markers. Separately, in line with our
hypothesis, these markers lacked potential for the discrimination between groups, but
when combined had a high predictive value with a good sensitivity (88.1%) and
specificity (86.5%). The final 8‐item biomarker panel consists of markers related to
several gut‐health domains: immunology, intestinal microbiota and neuroendocrine
activity.
The current findings demonstrate that it is possible to identify the presence of a
functional gut disorder (i.e. IBS) based on a non‐invasive biomarker panel even with
only subtle changes per single maker between health and disease status. As most
clinicians (>70%) do not solely use the Rome III criteria and frequently rely on additional
(invasive) investigations to make a positive diagnosis of IBS,7 a non‐invasive biomarker
panel could aid the diagnostic process of IBS in clinical practice. The identification of the
current ‘multi‐gut health domain’ panel of faecal and plasma markers is an important
step in the development of reliable biomarkers for IBS. However, before
implementation in daily clinical practice, further research is needed, especially to assess
the value of the biomarker panel for the discrimination between IBS and organic GI
disorders, such as inflammatory bowel disease, and its potential to monitor disease
activity and symptoms over time.
Chapter 10
222
Symptom reduction is the primary goal of therapeutic interventions in IBS. Symptom
assessment, mostly by retrospective paper surveys, is challenging and is subject to
recall bias and fake compliance.48 Intervention trials in IBS patients using symptom
scores as main outcomes are hampered by a high placebo response.49 The identified
biomarker panel was found to correlate moderately though significantly (r=0.59,
p<0.001) with GI symptom severity in the IBS cohort. This indicates a possible potential
of the biomarker panel to quantify responsiveness to treatments in addition to
symptom scores, in clinical trials. However, this hypothesis needs to be tested further.
IBS is a highly prevalent disorder among the general population, but difficult to identify
in subjects not seeking medical attention. Furthermore, a large part of subjects with IBS
symptoms does not seek medical attention but try to improve their well‐being by self‐
treatment. The evaluation of potential beneficial effects of interventions such as food
products, supplementals or life style factors on GI health in the general population is
challenging, since at group level GI symptom severity is low. Alternatively, a biomarker
panel next to GI symptom questionnaires may have added value to quantify
improvements by a specific intervention in the general population. Since our biomarker
set is based on multiple gut health domains and correlated significantly with symptoms
in IBS patients, we hypothesized that it would also be applicable in the general
population. As expected, the majority of subjects form the general population reported
to have no or hardly GI symptoms, resulting in low overall mean symptom scores. As
proof of principle, subjects with a 7‐day mean score of 1.5 or higher for abdominal pain
and discomfort were selected. In this study subgroup, also a significant correlation
(r=0.51, p=0.003) between the 8‐item biomarker panel and GI symptom scores was
observed. This may indicate a potential application of the current non‐invasive 8‐item
biomarker panel in research focusing on gut health and possible interventions thereof
in the general population. As the biomarker panel reflects various domains of gut
health and distinguishes patients with a functional GI disorder from healthy subjects, it
may be a first step in the development of a biomarker (set) for healthy gut function.
The current 8‐item biomarker panel was identified in a subset of subjects of the
Maastricht IBS cohort. Although external validation in a second independent clinical IBS
cohort is needed, we validated the biomarker panel in the pre‐assigned independent
validation set of IBS patients and controls of the Maastricht IBS cohort. These subjects
were not used in the biomarker panel discovery step. The LifeLines DEEP cohort was a
large population based cohort in which biosamples and symptom scores were
collected. This cohort was not included in the current study as an external validation
cohort, but to test the potency of the biomarker panel to pick up the presence of
gastro‐intestinal symptoms in the general population.
A novel biomarker panel for IBS
223
Conclusion
A novel, non‐invasive, ‘multi‐gut health domain’ biomarker panel, with a high predictive
value for the discrimination between IBS patients and healthy controls, has been
identified and validated. Furthermore, a moderate and highly significant correlation
was observed between the biomarker panel and GI symptom severity in a clinical IBS
cohort as well as in a general population cohort. Although, further research is needed
to test the applicability of the 8‐item biomarker panel in daily clinical practice, these
findings are an important step towards biomarker based diagnosis of IBS. The
biomarker panel has potential to assess responsiveness in IBS therapy trials or of
interventions aiming to improve gut health in the general population.
Chapter 10
224
References
1. Bischoff SC. 'Gut health': a new objective in medicine? BMC Med. 2011;9:24. 2. Canavan C, West J, Card T. The epidemiology of irritable bowel syndrome. Clin Epidemiol. 2014;6:71‐80. 3. Magro F, Langner C, Driessen A, Ensari A, Geboes K, Mantzaris GJ, et al. European consensus on the
histopathology of inflammatory bowel disease. J Crohns Colitis. 2013;7:827‐51. 4. Hill P, Austin A, Forsyth J, Holmes G. British Society of Gastroenterology guidelines on the diagnosis and
management of coeliac disease. Gut. 2015;64:691‐2 5. Corsetti M, Van Oudenhove L, Tack J. The quest for biomarkers in IBS‐where should it lead us?
Neurogastroenterol Motil 2014;26:1669‐76. 6. Camilleri M. Review article: biomarkers and personalised therapy in functional lower gastrointestinal
disorders. Aliment Pharmacol Ther. 2015;42:818‐28. 7. Spiegel BM, Farid M, Esrailian E, Talley J, Chang L. Is irritable bowel syndrome a diagnosis of exclusion?:
a survey of primary care providers, gastroenterologists, and IBS experts. Am J Gastroenterol. 2010; 105:848‐58.
8. Sood R, Ford AC. Combining biomarkers in irritable bowel syndrome: A forward step towards making a positive diagnosis and directing therapy? Gastroenterology. 2015;148:1471‐3.
9. Lembo AJ, Neri B, Tolley J, Barken D, Carroll S, Pan H. Use of serum biomarkers in a diagnostic test for irritable bowel syndrome. Aliment Pharmacol Ther. 2009;29:834‐42.
10. Jones MP, Chey WD, Singh S, Gong H, Shringarpure R, Hoe N, et al. A biomarker panel and psychological morbidity differentiates the irritable bowel syndrome from health and provides novel pathophysiological leads. Aliment Pharmacol Ther. 2014;39:426‐37.
11. Camilleri M. Peripheral mechanisms in irritable bowel syndrome. N Engla J Med. 2012;367:1626‐35. 12. Mujagic Z, Ludidi S, Keszthelyi D, Hesselink MA, Kruimel JW, Lenaerts K, et al. Small intestinal
permeability is increased in diarrhoea predominant IBS, while alterations in gastroduodenal permeability in all IBS subtypes are largely attributable to confounders. Aliment Pharmacol Ther. 2014;40:288‐97.
13. Ludidi S, Mujagic Z, Jonkers D, Keszthelyi D, Hesselink M, Kruimel J, et al. Markers for visceral hypersensitivity in patients with irritable bowel syndrome. Neurogastroenterol Motil 2014;26:1104‐11.
14. Tigchelaar EF, Zhernakova A, Dekens JA, Hermes G, Baranska A, Mujagic Z, et al. Cohort profile: LifeLines DEEP, a prospective, general population cohort study in the northern Netherlands: study design and baseline characteristics. BMJ Open. 2015;5:e006772.
15. Stolk RP, Rosmalen JG, Postma DS, de Boer RA, Navis G, Slaets JP, et al. Universal risk factors for multifactorial diseases: LifeLines: a three‐generation population‐based study. Eur J Epidemiol. 2008; 23:67‐74.
16. Crenn P, Messing B, Cynober L. Citrulline as a biomarker of intestinal failure due to enterocyte mass reduction. Clin Nutr. 2008;27:328‐39.
17. Windmueller HG, Spaeth AE. Source and fate of circulating citrulline. Am J Physiol. 1981;241:E473‐80. 18. van Vliet MJ, Tissing WJ, Rings EH, Koetse HA, Stellaard F, Kamps WA, et al. Citrulline as a marker for
chemotherapy induced mucosal barrier injury in pediatric patients. Pediatr Blood Cancer. 2009;53: 1188‐94.
19. Lutgens LC, Blijlevens NM, Deutz NE, Donnelly JP, Lambin P, de Pauw BE. Monitoring myeloablative therapy‐induced small bowel toxicity by serum citrulline concentration: a comparison with sugar permeability tests. Cancer. 2005;103:191‐9.
20. Bashashati M, Rezaei N, Shafieyoun A, McKernan DP, Chang L, Ohman L, et al. Cytokine imbalance in irritable bowel syndrome: a systematic review and meta‐analysis. Neurogastroenterol Motil 2014;26:1036‐48.
21. O'Mahony L, McCarthy J, Kelly P, Hurley G, Luo F, Chen K, et al. Lactobacillus and bifidobacterium in irritable bowel syndrome: symptom responses and relationship to cytokine profiles. Gastroenterology. 2005;128:541‐51.
22. Wassell J, Dolwani S, Metzner M, Losty H, Hawthorne A. Faecal calprotectin: a new marker for Crohn's disease? Ann Clin Biochem. 2004;41:230‐2.
23. Dolwani S, Metzner M, Wassell JJ, Yong A, Hawthorne AB. Diagnostic accuracy of faecal calprotectin estimation in prediction of abnormal small bowel radiology. Aliment Pharmacol Ther. 2004;20:615‐21.
A novel biomarker panel for IBS
225
24. Ohman L, Stridsberg M, Isaksson S, Jerlstad P, Simren M. Altered levels of fecal chromogranins and secretogranins in IBS: relevance for pathophysiology and symptoms? Am J Gastroenterol. 2012;107: 440‐7.
25. Vora P, Youdim A, Thomas LS, Fukata M, Tesfay SY, Lukasek K, et al. Beta‐defensin‐2 expression is regulated by TLR signaling in intestinal epithelial cells. J Immunol. 2004;173:5398‐405.
26. Langhorst J, Junge A, Rueffer A, Wehkamp J, Foell D, Michalsen A, et al. Elevated human beta‐defensin‐2 levels indicate an activation of the innate immune system in patients with irritable bowel syndrome. Am J Gastroenterol. 2009;104:404‐10.
27. Hamer HM, Jonkers D, Venema K, Vanhoutvin S, Troost FJ, Brummer RJ. Review article: the role of butyrate on colonic function. Aliment Pharmacol Ther. 2008;27:104‐19.
28. Tana C, Umesaki Y, Imaoka A, Handa T, Kanazawa M, Fukudo S. Altered profiles of intestinal microbiota and organic acids may be the origin of symptoms in irritable bowel syndrome. Neurogastroenterol Motil 2010;22:512‐9, e114‐5.
29. Facer P, Bishop AE, Lloyd RV, Wilson BS, Hennessy RJ, Polak JM. Chromogranin: a newly recognized marker for endocrine cells of the human gastrointestinal tract. Gastroenterology. 1985;89:1366‐73.
30. Usellini L, Finzi G, Riva C, Capella C, Mochizuki T, Yanaihara C, et al. Ultrastructural identification of human secretin cells by the immunogold technique. Their costorage of chromogranin A and serotonin. Histochemistry. 1990;94:113‐20.
31. El‐Salhy M, Lomholt‐Beck B, Hausken T. Chromogranin A as a possible tool in the diagnosis of irritable bowel syndrome. Scand J Gastroenterol. 2010;45:1435‐9.
32. Garcia‐Villalba R, Gimenez‐Bastida JA, Garcia‐Conesa MT, Tomas‐Barberan FA, Carlos Espin J, Larrosa M. Alternative method for gas chromatography‐mass spectrometry analysis of short‐chain fatty acids in faecal samples. J Sep Sci. 2012;35:1906‐13.
33. Farzi A, Reichmann F, Meinitzer A, Mayerhofer R, Jain P, Hassan AM, et al. Synergistic effects of NOD1 or NOD2 and TLR4 activation on mouse sickness behavior in relation to immune and brain activity markers. Brain Behav Immun. 2015;44:106‐20.
34. Whelan RA, Rausch S, Ebner F, Gunzel D, Richter JF, Hering NA, et al. A transgenic probiotic secreting a parasite immunomodulator for site‐directed treatment of gut inflammation. Mol Ther. 2014;22: 1730‐40.
35. Benjamini Y, Hochberg Y. Controlling the False Discovery Rate ‐ a Practical and Powerful Approach to Multiple Testing. J Roy Stat Soc B Met. 1995;57:289‐300.
36. Schafer JL. Multiple imputation: a primer. Stat Methods Med Res 1999;8:3‐15. 37. Wold S, Sjostrom M, Eriksson L. PLS‐regression: a basic tool of chemometrics. Chemometr Intell Lab.
2001;58:109‐30. 38. Guyon I. A Scaling Law for the Validation‐Set Training‐Set Size Ratio. AT & T Bell Laboratories. 1997. 39. Anderssen E, Dyrstad K, Westad F, Martens H. Reducing over‐optimism in variable selection by cross‐
model validation. Chemometr Intell Lab. 2006;84:69‐74. 40. Gidskehaug L, Anderssen E, Alsberg BK. Cross model validated feature selection based on gene clusters.
Chemometr Intell Lab. 2006;84:172‐6. 41. Esbensen KH, Geladi P. Principles of Proper Validation: use and abuse of re‐sampling for validation. J
Chemometr. 2010;24:168–87. 42. Hardoon DR, Szedmak S, Shawe‐Taylor J. Canonical correlation analysis: An overview with application to
learning methods. Neural Comput. 2004;16:2639‐64. 43. Liu ZJ, Geboes K, Heremans H, Overbergh L, Mathieu C, Rutgeerts P, et al. Role of interleukin‐12 in the
induction of mucosal inflammation and abrogation of regulatory T cell function in chronic experimental colitis. Eur J Immunol. 2001;31:1550‐60.
44. Vignali DAA, Kuchroo VK. IL‐12 family cytokines: immunological playmakers. Nat Immunol. 2012;13: 722‐8.
45. Zheng H, Fletcher D, Kozak W, Jiang MH, Hofmann KJ, Conn CA, et al. Resistance to Fever Induction and Impaired Acute‐Phase Response in Interleukin‐1‐Beta‐Deficient Mice. Immunity. 1995;3:9‐19.
46. Dinarello CA. Immunological and Inflammatory Functions of the Interleukin‐1 Family. Annu Rev Immunol. 2009;27:519‐50.
47. Scheller J, Chalaris A, Schmidt‐Arras D, Rose‐John S. The pro‐ and anti‐inflammatory properties of the cytokine interleukin‐6. Biochim Biophys Acta. 2011;1813:878‐88.

Chapter 10
226
48. Mujagic Z, Keszthelyi D, Aziz Q, Reinisch W, Quetglas EG, De Leonardis F, et al. Systematic review: instruments to assess abdominal pain in irritable bowel syndrome. Aliment Pharmacol Ther. 2015; 42:1064‐81..
49. Ford AC, Moayyedi P. Meta‐analysis: factors affecting placebo response rate in the irritable bowel
syndrome. Aliment Pharmacol Ther. 2010;32:144‐58.

A novel biomarker panel for IBS
227

Chapter 10
228
229
Chapter 11
Novel breath biomarkers for IBS;
a metabolomic approach
Volatile Organic Compounds in breath as marker for Irritable Bowel Syndrome:
a metabolomic approach
Agnieszka Baranska*, Zlatan Mujagic*, Agnieszka Smolinska, Jan W Dallinga, Daisy DMA
Jonkers, Ettje F Tigchelaar, Jackie Dekens, Alexandra Zhernakova, Thomas Ludwig, Ad
AM Masclee, Cisca Wijmenga, Frederik J van Schooten
* Authors contributed equally to the manuscript
Submitted
Chapter 11
230
Abstract
Background & Aims
The diagnosis of Irritable Bowel Syndrome (IBS) is challenging because of its
heterogeneity and multifactorial pathophysiology. No reliable biomarkers have been
identified so far. We investigated a novel application of breath analysis with the goal to
distinguish IBS patients from healthy controls based on a set of volatile organic
compounds (VOCs). Additionally, the VOC‐biomarker set was correlated to self‐
reported gastrointestinal (GI) symptoms of subjects of the Maastricht IBS clinical cohort
(MIBS) and of a general population cohort, LifeLines DEEP (LL DEEP).
Methods
Breath samples were collected from 170 IBS patients and 153 healthy controls in MIBS
and from 1,307 participants in LL DEEP. Multivariate statistics were used to identify the
most discriminatory set of VOCs and to find associations between VOCs and GI
symptoms in both cohorts.
Results
A set of 16 VOCs correctly predicted 89.4% of the IBS patients and 73.3% of the healthy
controls (AUC=0.83). The VOC‐biomarker set correlated significantly with a set of GI
symptoms in the MIBS (r=0.55, p=0.0003) and LL DEEP cohorts (r=0.54, p=0.0004). A
Kruskal‐Wallis test showed no influence from possible confounding factors in
distinguishing IBS patients from healthy controls.
Conclusion
A set of breath‐based biomarkers (16 VOCs) that distinguishes IBS patients from healthy
controls was identified. The VOC‐biomarker set correlates significantly with GI
symptoms in two independent cohorts. We demonstrate the potential use of breath
analysis in the diagnosis and monitoring of IBS, and a possible application of VOC‐
analyses in a general population cohort.
Breath biomarkers for IBS
231
Introduction
Irritable Bowel Syndrome (IBS) is a functional gastrointestinal (GI) disorder
characterized by abdominal pain and altered bowel habits. IBS has a high prevalence of
up to 15% among the general population in Western countries.1 It is a heterogeneous
disorder with a multifactorial pathophysiology including alterations in intestinal
motility, visceral perception, intestinal microbiota, barrier function, low‐grade immune
activation, and psychological factors.2 Until now, the diagnosis of IBS is symptom‐based,
using the Rome III criteria,3 but objective and validated biomarkers are lacking.4 When
available, the ideal biological marker should differentiate IBS patients from healthy
individuals with occasional GI symptoms and from patients with organic GI diseases,
such as inflammatory bowel diseases (IBD). Biomarkers for IBS should not only provide
insight into the pathophysiological mechanisms that generate symptoms but also be
helpful in quantifying efficacy of therapeutic interventions in IBS.
Searches for individual biomarkers in IBS have failed so far, mainly because of the
inability to capture the complexity and heterogeneity of IBS and the variation in
symptoms. Therefore, we propose a more holistic approach. Using multiple
characteristics and factors simultaneously, we intend to cover the full heterogenic
spectrum of IBS. Analysis of exhaled breath is a promising and non‐invasive tool in
disease diagnosis and monitoring.5‐9 Hundreds of volatile organic compounds (VOCs)
are present in human exhaled breath, of which the majority is comparable between
individuals. Some compounds however, differ significantly according to metabolic
differences and may indicate certain states of health or disease. Volatiles originate from
several sources including inflamed tissue, normal and altered metabolic pathways or
from microbiota metabolism in the body. Upon formation, VOCs reach the blood‐lung
barrier through the blood stream and, due to their low solubility, are easily and rapidly
excreted via the airways. Recently we have demonstrated the value of VOCs analysis in
monitoring disease activity in Crohn’s disease.7
The aim of the present study was to use VOC analysis of exhaled breath to describe the
presence of IBS and to search for correlations between VOCs and GI symptoms in both
IBS patients and individuals from a general population cohort. More specifically, our
three research aims were:
1. To determine a specific set of VOCs that distinguishes IBS patients from control
subjects without GI complaints using the clinical Maastricht IBS cohort (MIBS)
2. To test whether our set of VOCs correlates with GI symptoms in the clinical IBS
cohort (MIBS)
3. To test a possible implication of the VOCs biomarker set in a general population
cohort, by testing whether our set of VOCs relates to more pronounced GI
symptoms reported by subjects in a general population cohort (LL DEEP cohort)
Chapter 11
232
Materials and methods
Study participants
Two cohorts were included into this study. To fulfil previously mentioned aim 1 and 2
we used Maastricht IBS (MIBS) cohort, as it represents a well‐defined group of IBS
subjects and also controls, free of GI complaints. Aim 3 was accomplished by inclusion
of a general population cohort, the LL DEEP cohort.
MIBS cohort
Breath samples were collected from 170 well‐phenotype IBS patients and from 153
healthy volunteers without GI complaints, who participated in a large clinical cohort
study (MIBS) on the phenotypic and genotypic characterization of patients with IBS.10
IBS patients, with the age ranging from 18 to 75 years, had been included in the cohort
between September 2009 and January 2014 via the Gastroenterology‐Hepatology
outpatient clinic of Maastricht University Medical Centre+ (MUMC+), a secondary and
tertiary referral centre, and via general practitioners (GPs). All patients were diagnosed
according to the ROME III criteria and were examined by a gastroenterologist or GP. GI
endoscopy, abdominal imaging and/or blood and faecal analyses were performed to
exclude organic disease when indicated. Patients with a history of abdominal surgery,
apart from appendectomy, laparoscopic cholecystectomy, or hysterectomy, were
excluded. Age and gender matched healthy controls were enrolled via public
advertisements. The controls were enrolled via public advertisements and were
subjected to a detailed medical interview to exclude the presence of GI disorders and
current or previous GI complaints or symptoms.
All participants filled in questionnaires on demographics and life style. Their GI
symptoms were assessed by an end‐of‐day GI symptom diary recorded for the period of
two weeks.10 Mean 14‐day scores per symptom were used for the analyses. Data on
medication use and medical history were self‐reported and cross‐checked with hospital
medical records.
LL DEEP cohort
Adult participants were enrolled from LifeLines, a general population cohort in the
Netherlands.11 In a subgroup of 1307 non‐selected participants (LL DEEP: LifeLines
Detailed Extensive Examination of Participants) exhaled breath samples were collected,
along with a 7‐day GI symptom diary, identical to the 2‐week GI symptom diary used in
the MIBS cohort. Information on clinical diagnoses of IBS was not available for this
general population cohort. The LL DEEP study design has been described in detail
elsewhere.12
Breath biomarkers for IBS
233
Sample collection and analysis
Each participant inflated a 3 L Tedlar Bag (SKC Ltd, Dorset, UK) with no specific
instructions on the method of exhaling. For each cohort, all samples were collected in
the same room. To avoid content alterations, the VOC contents of each bag was
captured within an hour in stainless‐steel two‐bed sorption tubes, filled with
carbograph 1TD/Carbo‐pack X (Markes International, Llantrisant, UK) and stored at
room temperature until analysis.13 Breath samples were analysed by thermal
desorption‐gas chromatography combined with time‐of‐flight mass spectrometry (TD‐
GC‐tof‐MS), as previously described.13
Sample analysis
Baseline characteristics
Raw GC‐tof‐MS data were pre‐processed to diminish the effects of noise, column
bleeding, and chromatographic drift, as described previously.14
The differences in the baseline characteristics were tested using independent samples
T‐test (continuous, normally distributed data) and Pearson Chi‐squared test
(dichotomous data).
Aim 1: Search for VOCs biomarker in MIBS
Random Forest (RF) was used to determine a set of volatile organic compounds that
best separate IBS patients from controls in the MIBS cohort.14 First, chromatograms of
IBS patients and the healthy control group were divided into a training (±80% of the
total population) and a validation set (±20% of the population) using the Duplex
algorithm.15 We included 123 subjects of each group in a training set to find
discriminatory VOCs and build a RF model. The remaining 47 IBS patients and 30
controls were used as an internal validation set to test the accuracy of the selected
VOCs. The receiver operating characteristic (ROC) curve was used to demonstrate the
performance of the RF classification model for the validation set. For each sample, RF
delivered a probability of it belonging to the IBS or control group. These probabilities
were used as a range of cut‐off values to calculate the sensitivity and specificity
presented in a ROC curve.
For visualization, we performed Principal Component Analysis (PCA) on the proximity
matrix obtained from the RF model built on the set of discriminatory VOCs.14
Influence of subjects’ characteristics and importance of individual VOCs
Potential contribution of the external factors defined by subjects’ characteristics, to the
separation seen due to the set of 16 VOCs, was checked by interpreting a PCA score
plot. To see if any of the individual VOCs from the chosen set was statistically
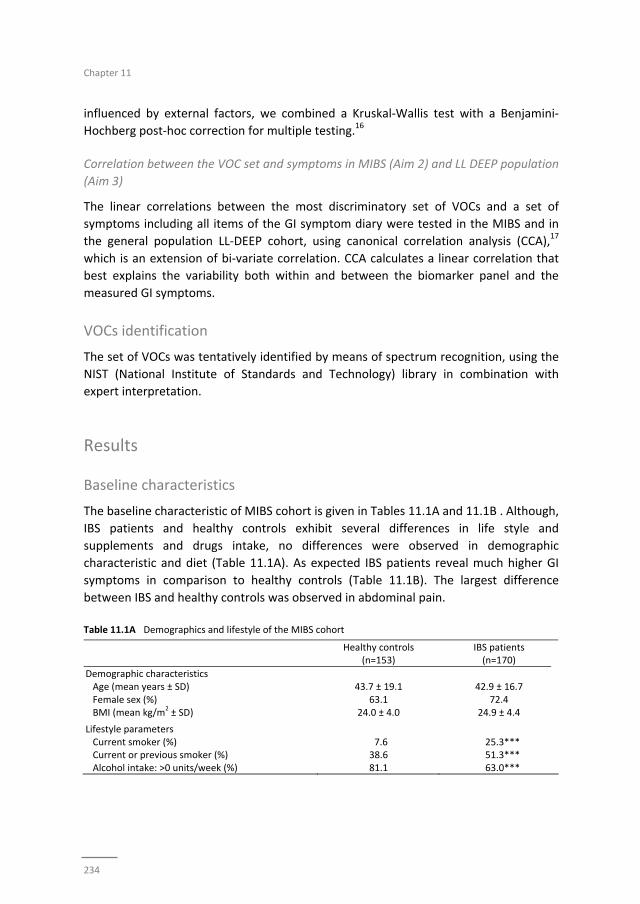
Chapter 11
234
influenced by external factors, we combined a Kruskal‐Wallis test with a Benjamini‐
Hochberg post‐hoc correction for multiple testing.16
Correlation between the VOC set and symptoms in MIBS (Aim 2) and LL DEEP population
(Aim 3)
The linear correlations between the most discriminatory set of VOCs and a set of
symptoms including all items of the GI symptom diary were tested in the MIBS and in
the general population LL‐DEEP cohort, using canonical correlation analysis (CCA),17
which is an extension of bi‐variate correlation. CCA calculates a linear correlation that
best explains the variability both within and between the biomarker panel and the
measured GI symptoms.
VOCs identification
The set of VOCs was tentatively identified by means of spectrum recognition, using the
NIST (National Institute of Standards and Technology) library in combination with
expert interpretation.
Results
Baseline characteristics
The baseline characteristic of MIBS cohort is given in Tables 11.1A and 11.1B . Although,
IBS patients and healthy controls exhibit several differences in life style and
supplements and drugs intake, no differences were observed in demographic
characteristic and diet (Table 11.1A). As expected IBS patients reveal much higher GI
symptoms in comparison to healthy controls (Table 11.1B). The largest difference
between IBS and healthy controls was observed in abdominal pain.
Table 11.1A Demographics and lifestyle of the MIBS cohort
Healthy controls (n=153)
IBS patients (n=170)
Demographic characteristics Age (mean years ± SD) 43.7 ± 19.1 42.9 ± 16.7 Female sex (%) 63.1 72.4 BMI (mean kg/m
2 ± SD) 24.0 ± 4.0 24.9 ± 4.4
Lifestyle parameters Current smoker (%) 7.6 25.3*** Current or previous smoker (%) 38.6 51.3*** Alcohol intake: >0 units/week (%) 81.1 63.0***
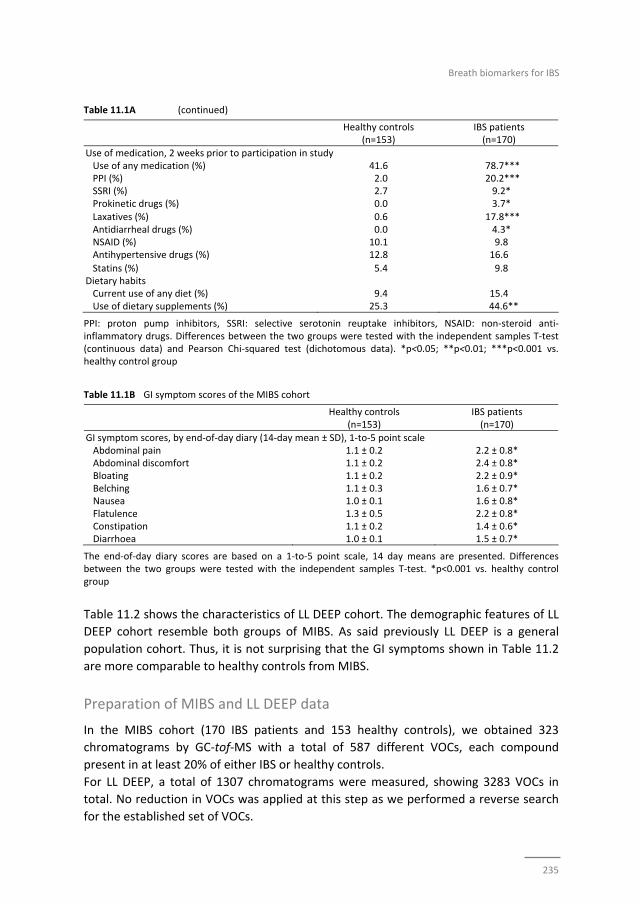
Breath biomarkers for IBS
235
Table 11.1A (continued)
Healthy controls (n=153)
IBS patients (n=170)
Use of medication, 2 weeks prior to participation in study Use of any medication (%) 41.6 78.7*** PPI (%) 2.0 20.2*** SSRI (%) 2.7 9.2* Prokinetic drugs (%) 0.0 3.7* Laxatives (%) 0.6 17.8*** Antidiarrheal drugs (%) 0.0 4.3* NSAID (%) 10.1 9.8 Antihypertensive drugs (%) 12.8 16.6
Statins (%) 5.4 9.8 Dietary habits Current use of any diet (%) 9.4 15.4 Use of dietary supplements (%) 25.3 44.6**
PPI: proton pump inhibitors, SSRI: selective serotonin reuptake inhibitors, NSAID: non‐steroid anti‐inflammatory drugs. Differences between the two groups were tested with the independent samples T‐test (continuous data) and Pearson Chi‐squared test (dichotomous data). *p<0.05; **p<0.01; ***p<0.001 vs. healthy control group Table 11.1B GI symptom scores of the MIBS cohort
Healthy controls (n=153)
IBS patients (n=170)
GI symptom scores, by end‐of‐day diary (14‐day mean ± SD), 1‐to‐5 point scale Abdominal pain 1.1 ± 0.2 2.2 ± 0.8* Abdominal discomfort 1.1 ± 0.2 2.4 ± 0.8* Bloating 1.1 ± 0.2 2.2 ± 0.9* Belching 1.1 ± 0.3 1.6 ± 0.7* Nausea 1.0 ± 0.1 1.6 ± 0.8* Flatulence 1.3 ± 0.5 2.2 ± 0.8* Constipation 1.1 ± 0.2 1.4 ± 0.6* Diarrhoea 1.0 ± 0.1 1.5 ± 0.7*
The end‐of‐day diary scores are based on a 1‐to‐5 point scale, 14 day means are presented. Differences between the two groups were tested with the independent samples T‐test. *p<0.001 vs. healthy control group
Table 11.2 shows the characteristics of LL DEEP cohort. The demographic features of LL
DEEP cohort resemble both groups of MIBS. As said previously LL DEEP is a general
population cohort. Thus, it is not surprising that the GI symptoms shown in Table 11.2
are more comparable to healthy controls from MIBS.
Preparation of MIBS and LL DEEP data
In the MIBS cohort (170 IBS patients and 153 healthy controls), we obtained 323
chromatograms by GC‐tof‐MS with a total of 587 different VOCs, each compound
present in at least 20% of either IBS or healthy controls.
For LL DEEP, a total of 1307 chromatograms were measured, showing 3283 VOCs in
total. No reduction in VOCs was applied at this step as we performed a reverse search
for the established set of VOCs.
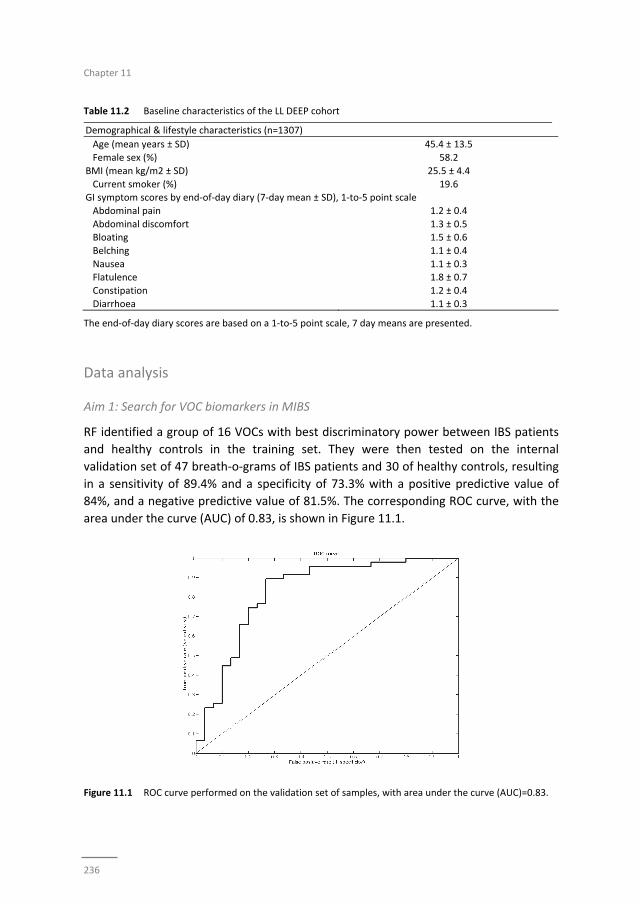
Chapter 11
236
Table 11.2 Baseline characteristics of the LL DEEP cohort
Demographical & lifestyle characteristics (n=1307)
Age (mean years ± SD) 45.4 ± 13.5
Female sex (%) 58.2
BMI (mean kg/m2 ± SD) 25.5 ± 4.4
Current smoker (%) 19.6 GI symptom scores by end‐of‐day diary (7‐day mean ± SD), 1‐to‐5 point scale
Abdominal pain 1.2 ± 0.4
Abdominal discomfort 1.3 ± 0.5 Bloating 1.5 ± 0.6
Belching 1.1 ± 0.4
Nausea 1.1 ± 0.3 Flatulence 1.8 ± 0.7
Constipation 1.2 ± 0.4
Diarrhoea 1.1 ± 0.3
The end‐of‐day diary scores are based on a 1‐to‐5 point scale, 7 day means are presented.
Data analysis
Aim 1: Search for VOC biomarkers in MIBS
RF identified a group of 16 VOCs with best discriminatory power between IBS patients
and healthy controls in the training set. They were then tested on the internal
validation set of 47 breath‐o‐grams of IBS patients and 30 of healthy controls, resulting
in a sensitivity of 89.4% and a specificity of 73.3% with a positive predictive value of
84%, and a negative predictive value of 81.5%. The corresponding ROC curve, with the
area under the curve (AUC) of 0.83, is shown in Figure 11.1.
Figure 11.1 ROC curve performed on the validation set of samples, with area under the curve (AUC)=0.83.
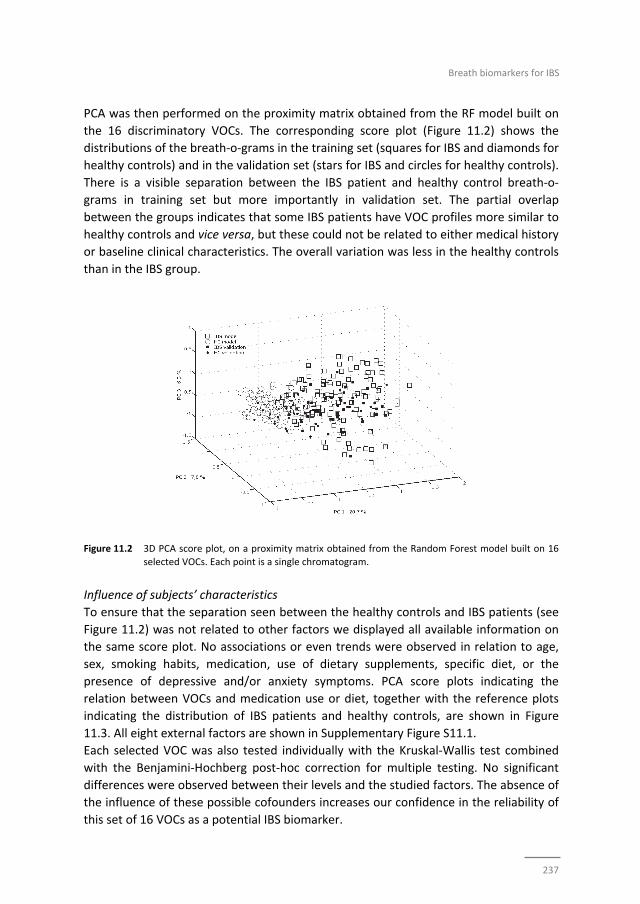
Breath biomarkers for IBS
237
PCA was then performed on the proximity matrix obtained from the RF model built on
the 16 discriminatory VOCs. The corresponding score plot (Figure 11.2) shows the
distributions of the breath‐o‐grams in the training set (squares for IBS and diamonds for
healthy controls) and in the validation set (stars for IBS and circles for healthy controls).
There is a visible separation between the IBS patient and healthy control breath‐o‐
grams in training set but more importantly in validation set. The partial overlap
between the groups indicates that some IBS patients have VOC profiles more similar to
healthy controls and vice versa, but these could not be related to either medical history
or baseline clinical characteristics. The overall variation was less in the healthy controls
than in the IBS group.
Figure 11.2 3D PCA score plot, on a proximity matrix obtained from the Random Forest model built on 16
selected VOCs. Each point is a single chromatogram.
Influence of subjects’ characteristics
To ensure that the separation seen between the healthy controls and IBS patients (see
Figure 11.2) was not related to other factors we displayed all available information on
the same score plot. No associations or even trends were observed in relation to age,
sex, smoking habits, medication, use of dietary supplements, specific diet, or the
presence of depressive and/or anxiety symptoms. PCA score plots indicating the
relation between VOCs and medication use or diet, together with the reference plots
indicating the distribution of IBS patients and healthy controls, are shown in Figure
11.3. All eight external factors are shown in Supplementary Figure S11.1.
Each selected VOC was also tested individually with the Kruskal‐Wallis test combined
with the Benjamini‐Hochberg post‐hoc correction for multiple testing. No significant
differences were observed between their levels and the studied factors. The absence of
the influence of these possible cofounders increases our confidence in the reliability of
this set of 16 VOCs as a potential IBS biomarker.
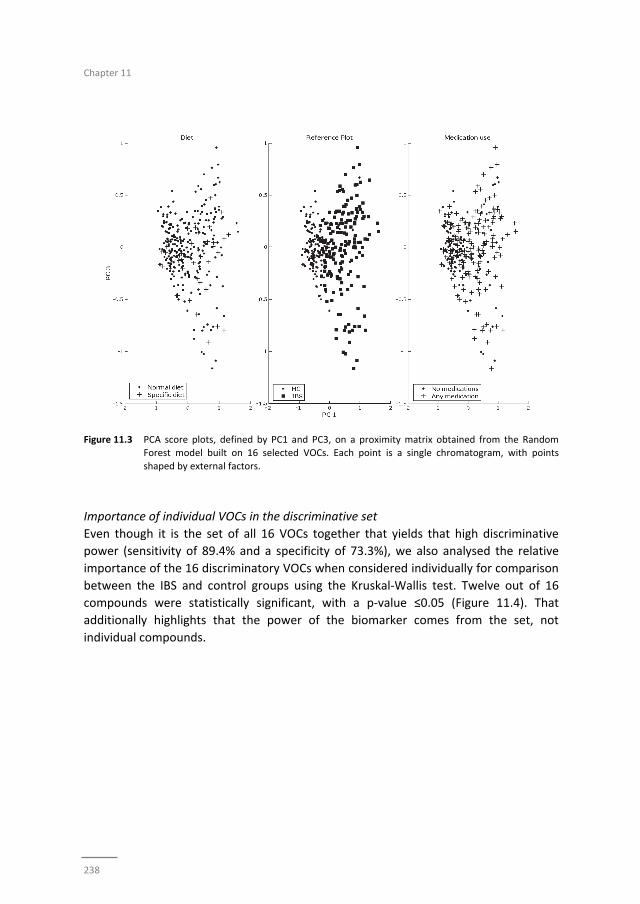
Chapter 11
238
Figure 11.3 PCA score plots, defined by PC1 and PC3, on a proximity matrix obtained from the Random
Forest model built on 16 selected VOCs. Each point is a single chromatogram, with points
shaped by external factors.
Importance of individual VOCs in the discriminative set
Even though it is the set of all 16 VOCs together that yields that high discriminative
power (sensitivity of 89.4% and a specificity of 73.3%), we also analysed the relative
importance of the 16 discriminatory VOCs when considered individually for comparison
between the IBS and control groups using the Kruskal‐Wallis test. Twelve out of 16
compounds were statistically significant, with a p‐value ≤0.05 (Figure 11.4). That
additionally highlights that the power of the biomarker comes from the set, not
individual compounds.
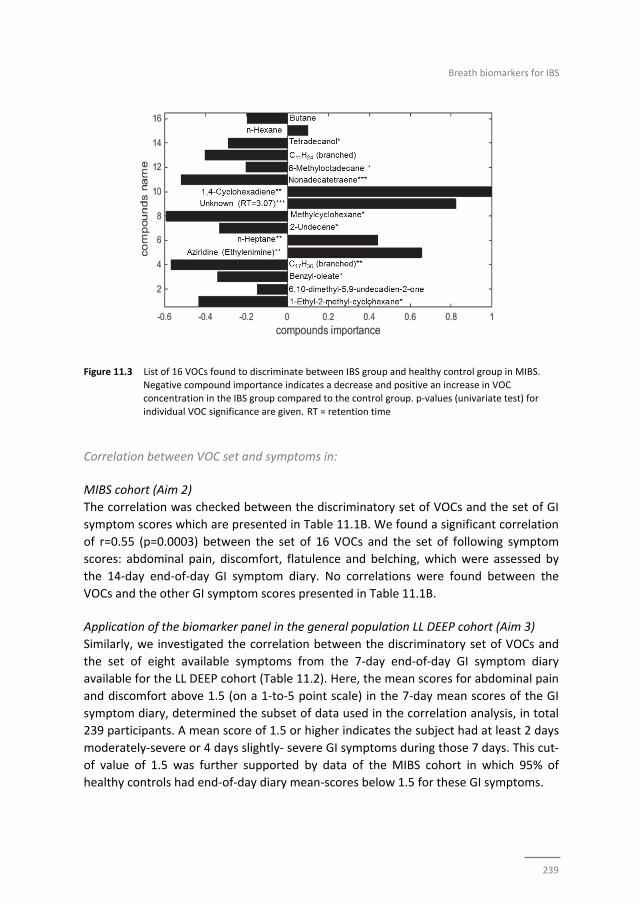
Breath biomarkers for IBS
239
Figure 11.3 List of 16 VOCs found to discriminate between IBS group and healthy control group in MIBS. Negative compound importance indicates a decrease and positive an increase in VOC
concentration in the IBS group compared to the control group. p‐values (univariate test) for
individual VOC significance are given. RT = retention time
Correlation between VOC set and symptoms in:
MIBS cohort (Aim 2)
The correlation was checked between the discriminatory set of VOCs and the set of GI
symptom scores which are presented in Table 11.1B. We found a significant correlation
of r=0.55 (p=0.0003) between the set of 16 VOCs and the set of following symptom
scores: abdominal pain, discomfort, flatulence and belching, which were assessed by
the 14‐day end‐of‐day GI symptom diary. No correlations were found between the
VOCs and the other GI symptom scores presented in Table 11.1B.
Application of the biomarker panel in the general population LL DEEP cohort (Aim 3)
Similarly, we investigated the correlation between the discriminatory set of VOCs and
the set of eight available symptoms from the 7‐day end‐of‐day GI symptom diary
available for the LL DEEP cohort (Table 11.2). Here, the mean scores for abdominal pain
and discomfort above 1.5 (on a 1‐to‐5 point scale) in the 7‐day mean scores of the GI
symptom diary, determined the subset of data used in the correlation analysis, in total
239 participants. A mean score of 1.5 or higher indicates the subject had at least 2 days
moderately‐severe or 4 days slightly‐ severe GI symptoms during those 7 days. This cut‐
of value of 1.5 was further supported by data of the MIBS cohort in which 95% of
healthy controls had end‐of‐day diary mean‐scores below 1.5 for these GI symptoms.
Chapter 11
240
In the LL DEEP cohort the 7‐day mean values for abdominal pain, flatulence, belching,
bloating, diarrhoea and nausea were found to be highly and significantly correlated
with our set of VOCs (r=0.54, p=0.0004)
Discussion
In this paper we have demonstrated a possible use of VOCs in exhaled breath analysis
for diagnosis and monitoring of IBS patients. We showed that non‐invasive breath
analysis is suitable to distinguish IBS patients from healthy controls. The first aim of our
study was to apply a holistic metabolomics approach by analysing a large number of
exhaled VOCs and searching for differences in patterns between IBS patients and
healthy controls. A pattern of 16 VOCs was identified to be most discriminative for the
presence or absence of IBS in a large group of well phenotyped IBS patients and healthy
controls (MIBS). The proposed IBS breath‐based biomarker set has a sensitivity of
89.4% and specificity of 73.3%. We have clearly shown that the selected VOCs (as a set
and separately) are related only to the presence of IBS and are not affected by any of
the possible confounders we investigated.
To our knowledge, this is the first time that a set of VOCs in exhaled air was able to
predict the presence of a common functional gastrointestinal disorder. This can be
considered an important first step forward in the design and development of reliable
non‐invasive biomarkers for IBS.
As the diagnosis of IBS is based on symptoms, our second aim was to test whether our
VOC biomarker set would also correlate with severity of GI symptoms. Four GI
symptoms showed a significant correlation (r=0.55, p=0.0003) with the set of 16 VOCs
in the clinical IBS cohort. This finding could be clinically useful, with the prospect to
improve monitoring of the IBS course in intervention studies.
Since functional GI symptoms observed in IBS patients are common in the general
population, next we tested for correlations between the set of 16 VOCs and GI
symptoms reported in a general population cohort (LL DEEP). This cohort was not
included in the current study as an external validation cohort, but to test the potency of
the biomarker panel to pick up the presence of gastro‐intestinal symptoms in the
general population. Although the overall GI symptom scores were low in the general
population, the set of 16 VOCs correlated moderately but significantly with GI
symptoms (r=0.54, p=0.0004). This finding is relevant for several reasons. First, it
enables identifying subjects with GI symptoms among the general population. Second,
it offers an opportunity to monitor effects of therapeutic interventions in relation to
underlying pathophysiological mechanisms. Since the collection of exhaled breath is
non‐invasive, easy to apply, and requires only a minimal time investment, this method
is potentially suitable for use in large cohorts and highly prevalent conditions in the
general population.
Breath biomarkers for IBS
241
Although each VOC can be interpreted and analysed separately, it is the combination of
the 16 selected VOCs that yielded the highest discriminatory power between IBS
patients and healthy controls. The biological interpretation and background of the
compounds is difficult because of the complexity of the underlying metabolic pathways.
However, even without the mechanisms being fully understood and explored, our VOC‐
biomarker set has potential value for diagnostics.
IBS is characterized by low grade chronic inflammation, which results in increased
oxidative stress leading to oxidation of larger molecules including lipids (e.g.
polyunsaturated fatty acids).18 This may give degradation products like hydrocarbons,
dienes, aldehydes, lipid peroxides and isoprostanes, which are excreted as VOCs, and
subtle changes may be detected in breath. Indeed, the majority of our selected VOCs
belong to the (saturated or unsaturated) hydrocarbon family. Some of them, like n‐
hexane, n‐heptane and 1,4‐cyclohexadiene, are increased in the IBS group, while
others, like butane and 2‐undecane, are increased in healthy controls. These
compounds were all identified earlier as potential oxidative stress markers.19‐21
Another factor known to contribute to IBS is changes in an altered gut microbial
composition.22 Products of microbial origin are found in exhaled breath, indicating that
systemic alterations of the gut flora may also be one of the factors influencing breath
composition.23,24 Interestingly, aziridine was found to be increased in breath of IBS
patients. This is a parent compound for organic substances containing the aziridine
functional group, three‐membered heterocyclic containing nitrogen. Aziridine
containing compounds were previously detected in faeces but have not been described
in exhaled breath before.25 Aziridine containing compounds are isolated from the soil
bacteria, Streptomyces caespitosus and lavendualeare, which are capable of living in
symbiosis with plants, fungi and animals.26 Since they belong to the Actinobacteria
Phyla, one of the four predominant phyla in the human body, it can be speculated that
aziridines may be produced by this or other similar types of gut bacteria.27 Antibiotic
use is more frequent among IBS patients and certain microbiota strains may overgrow
in a post‐antibiotic, replenished gut,28 leading to different metabolic breath profiles
containing for instance, aziridine. Aziridine origin is purely speculative; nevertheless it
suggests interesting connections that should be investigated further. It has to be noted
that in the IBS cohort included in the present study, the use of antibiotics in two weeks
prior to inclusion was rare, and therefore the data were not statistically corrected for
this parameter.
Some limitations of our study should be discussed. One may argue that a diagnosis of
IBS is based purely on symptoms and thus the need for biomarkers in IBS is limited.
Daily practice is quite different, revealing high health care costs for diagnostic
processing in IBS. In addition to the Rome III criteria reliable biomarkers could facilitate
the diagnostic process of IBS. We initiated a study as first step, to explore whether
based on an exhaled metabolomics profile IBS patients can be differentiated from
controls. We acknowledge that further validation is needed replicate our data and to
Chapter 11
242
test the potency of our VOCs biomarker set in a second independent cohort in
discriminating between IBS patients and subjects with comparable GI symptoms based
on organic causes, such as Inflammatory Bowel Disease or Coeliac Disease.
Furthermore, in depth research is needed to investigate the origin of the discriminatory
VOCs and their potential link to the pathophysiology of IBS.
Conclusions
A set of 16 VOCs in exhaled breath can be used to distinguish IBS patients from healthy
controls with 89.4% sensitivity and 73.3% specificity. We also demonstrated a
moderate but significant correlation between sets of GI symptoms and the VOCs‐
biomarker set for both clinical IBS patients and subjects in a general population cohort.
Our findings emphasize the relevance of this VOCs‐biomarker set for the diagnostic
process and for monitoring therapeutic interventions in IBS patients, but also its
potential to be used as a monitoring tool for gastrointestinal health in the general
public.
Breath biomarkers for IBS
243
References
1. Canavan C, West J, Card T. The epidemiology of irritable bowel syndrome. Clin Epidemiol. 2014;6:71‐80.
2. Chey WD, Kurlander J, Eswaran S. Irritable bowel syndrome: a clinical review. JAMA. 2015;313:949‐58. 3. Longstreth GF, Thompson WG, Chey WD, Houghton LA, Mearin F, Spiller RC. Functional bowel disorders.
Gastroenterology. 2006;130:1480‐91.
4. Plavsic I, Hauser G, Tkalcic M, Pletikosic S, Salkic N. Diagnosis of Irritable Bowel Syndrome: Role of Potential Biomarkers. Gastroenterol Res Pract. 2015;2015:490183.
5. de Boer NKH, de Meij TGJ, Oort FA, Ben Larbi I, Mulder CJJ, van Bodegraven AA, et al. The Scent of
Colorectal Cancer: Detection by Volatile Organic Compound Analysis. Clinical Gastroenterology and Hepatology. 2014;12:1085‐9.
6. Khalid T, Richardson P, Probert CS. The Liver Breath! Breath Volatile Organic Compounds for the
Diagnosis of Liver Disease. Clin Gastroenterol Hepatol. 2014;12:524‐6. 7. Bodelier AGL, Smolinska A, Baranska A, Dalling JW, Mujagic Z, Vanhees K, et al. Volatile organic
compounds in exhaled air as novel marker for disease activity in Crohn’s disease; a metabolomic
approach. Inflamm Bowel Dis. 2015;in press. 8. Kurada S, Alkhouri N, Fiocchi C, Dweik R, Rieder F. Review article: breath analysis in inflammatory bowel
diseases. Aliment Pharmacol Ther. 2015;41:329‐41.
9. Arasaradnam RP, Covington JA, Harmston C, Nwokolo CU. Review article: next generation diagnostic modalities in gastroenterology‐‐gas phase volatile compound biomarker detection. Aliment Pharmacol
Ther. 2014;39:780‐9.
10. Mujagic Z, Ludidi S, Keszthelyi D, Hesselink MA, Kruimel JW, Lenaerts K, et al. Small intestinal permeability is increased in diarrhoea predominant IBS, while alterations in gastroduodenal
permeability in all IBS subtypes are largely attributable to confounders. Aliment Pharmacol Ther.
2014;40:288‐97. 11. Stolk RP, Rosmalen JG, Postma DS, de Boer RA, Navis G, Slaets JP, et al. Universal risk factors for
multifactorial diseases: LifeLines: a three‐generation population‐based study. Eur J Epidemiol.
2008;23:67‐74. 12. Tigchelaar EF, Zhernakova A, Dekens JA, Hermes G, Baranska A, Mujagic Z, et al. Cohort profile: LifeLines
DEEP, a prospective, general population cohort study in the northern Netherlands: study design and
baseline characteristics. BMJ Open. 2015;5:e006772. 13. Dallinga JW, Smolinska A, van Schooten FJ. Analysis of volatile organic compounds in exhaled breath by
gas chromatography‐mass spectrometry combined with chemometric analysis. Methods Mol Biol.
2014;1198:251‐63. 14. Smolinska A, Hauschild AC, Fijten RR, Dallinga JW, Baumbach J, van Schooten FJ. Current breathomics‐‐a
review on data pre‐processing techniques and machine learning in metabolomics breath analysis. J
Breath Res. 2014;8:027105. 15. Snee RD. Validation of regression models: Methods and examples. Technometrics. 1977;19(4):415‐28.
16. Benjamini Y, Hochberg Y. Controlling the False Discovery Rate ‐ a Practical and Powerful Approach to
Multiple Testing. Journal of the Royal Statistical Society Series B‐Methodological. 1995;57:289‐300. 17. Hardoon DR, Szedmak S, Shawe‐Taylor J. Canonical correlation analysis: an overview with application to
learning methods. Neural Comput. 2004;16:2639‐64.
18. Mete R, Tulubas F, Oran M, Yilmaz A, Avci BA, Yildiz K, et al. The role of oxidants and reactive nitrogen species in irritable bowel syndrome: a potential etiological explanation. Med Sci Monit. 2013;19:762‐6.
19. Phillips M, Cataneo RN, Cummin AR, Gagliardi AJ, Gleeson K, Greenberg J, et al. Detection of lung cancer
with volatile markers in the breath. Chest. 2003;123:2115‐23. 20. Poli D, Carbognani P, Corradi M, Goldoni M, Acampa O, Balbi B, et al. Exhaled volatile organic
compounds in patients with non‐small cell lung cancer: cross sectional and nested short‐term follow‐up
study. Respir Res. 2005;6:71. 21. Chen X, Xu F, Wang Y, Pan Y, Lu D, Wang P, et al. A study of the volatile organic compounds exhaled by
lung cancer cells in vitro for breath diagnosis. Cancer. 2007;110:835‐44.
22. Rajilic‐Stojanovic M, Jonkers DM, Salonen A, Hanevik K, Raes J, Jalanka J, et al. Intestinal microbiota and diet in IBS: causes, consequences, or epiphenomena? Am J Gastroenterol. 2015;110:278‐87.
Chapter 11
244
23. Turner C, Spanel P, Smith D. A longitudinal study of ammonia, acetone and propanol in the exhaled
breath of 30 subjects using selected ion flow tube mass spectrometry, SIFT‐MS. Physiol Meas. 2006;27:321‐37.
24. Lindinger W, Taucher J, Jordan A, Hansel A, Vogel W. Endogenous production of methanol after the
consumption of fruit. Alcohol Clin Exp Res. 1997;21:939‐43. 25. de Lacy Costello B, Amann A, Al‐Kateb H, Flynn C, Filipiak W, Khalid T, et al. A review of the volatiles
from the healthy human body. J Breath Res. 2014;8:014001.
26. Seipke RF, Kaltenpoth M, Hutchings MI. Streptomyces as symbionts: an emerging and widespread theme? Fems Microbiology Reviews. 2012;36:862‐76.
27. Johnson CL, Versalovic J. The human microbiome and its potential importance to pediatrics. Pediatrics.
2012;129:950‐60. 28. Mendall MA, Kumar D. Antibiotic use, childhood affluence and irritable bowel syndrome (IBS). Eur J
Gastroenterol Hepatol. 1998;10:59‐62.
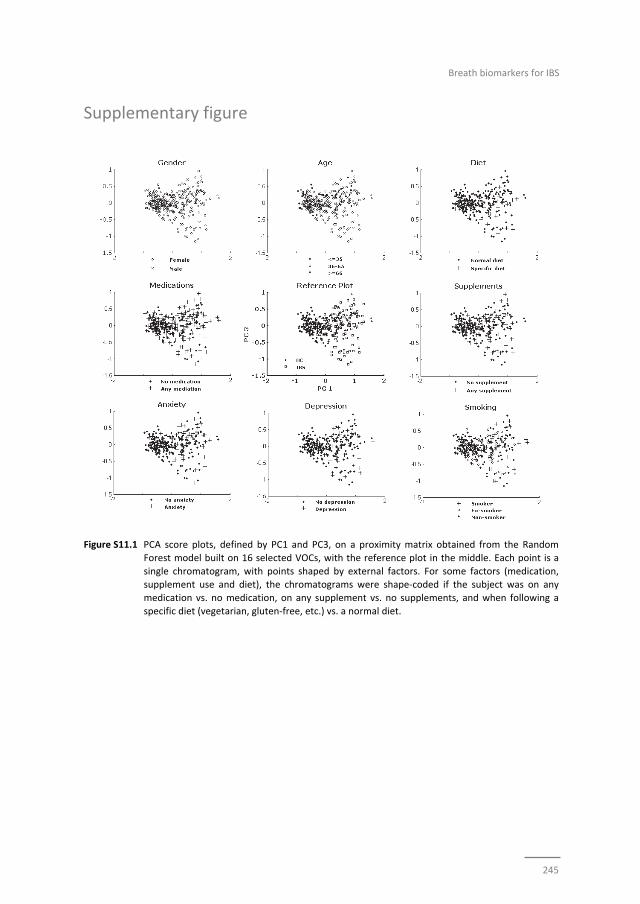
Breath biomarkers for IBS
245
Supplementary figure
Figure S11.1 PCA score plots, defined by PC1 and PC3, on a proximity matrix obtained from the Random
Forest model built on 16 selected VOCs, with the reference plot in the middle. Each point is a
single chromatogram, with points shaped by external factors. For some factors (medication, supplement use and diet), the chromatograms were shape‐coded if the subject was on any
medication vs. no medication, on any supplement vs. no supplements, and when following a
specific diet (vegetarian, gluten‐free, etc.) vs. a normal diet.

Chapter 11
246

247
Chapter 12
General discussion

Chapter 12
248
General discussion
249
General discussion
Main findings
In the thesis, we have focussed on pathophysiology, assessment of symptoms, and
biomarkers in IBS. In Chapter 2, we demonstrated that small intestinal permeability is
increased in IBS‐D patients, but not in other subtypes. Alterations observed in
gastroduodenal permeability in IBS and all subtypes were mainly contributable to
confounders. Thereafter, in a randomized double blind placebo controlled clinical trial,
we investigated potential beneficial effects of the oral administration of three
Lactobacillus plantarum strains on small intestinal barrier function in healthy subjects,
under stressed conditions (i.e. after intake of NSAIDs). Intake of L. plantarum TIFN101
resulted in most pronounced effects on gene transcription in duodenal biopsies, which
were related to mucosal repair mechanisms (Chapter 3), and to maintenance of T and
B‐cell function and antigen presentation (Chapter 4).
Thereafter, we investigated differences between viscerally hyper‐ and normosensitive
IBS patients (Chapter 5 and 6), and found that apart from age, gender, GI symptom
severity and use of SSRIs, these two groups were comparable with regard to clinical
characteristics and to a set of selected biomarkers.
Finally, the role of serotonin metabolism in IBS was investigated (Chapter 7). Both,
systemic 5‐HIAA and the 5‐HIAA/5‐HT ratio were lower in IBS patients compared to
controls. Within the IBS group, differences were observed between IBS subgroups,
being most pronounced in the IBS‐M group.
In the second part of this thesis we focussed on symptoms in IBS. At first, we
systematically reviewed the published literature and evaluated the currently available
instruments for measurement of chronic abdominal pain in patients with IBS (Chapter
8). A wide variety of methods is used in IBS research, but many are known to have
important limitations. In an exploratory study (Chapter 9), we then demonstrated that
momentary symptom assessment may reduce or even exclude limitations of the
methods that employ retrospective symptom assessment; for example, the exclusion of
recall bias.
In the final two studies (Chapter 10 and 11), we identified two biomarker panels with
high positive predictive values for IBS patients versus healthy controls, i.e. an 8‐item
biomarker panel of faecal and plasma markers and a 16‐item biomarker panel based on
the analysis of volatile organic compounds in exhaled breath. Furthermore, for both
biomarker panels a good correlation was found to GI symptom severity in an IBS and a
in a general population cohort.
Chapter 12
250
Intestinal barrier in IBS and the interplay with live bacteria
The multifactorial pathophysiology of IBS is represented by a complex interplay of a
multitude of intestinal and central processes. We have investigated several of these
processes known or presumed to be involved in the pathophysiology of IBS.
Dysregulation of complex processes of the gut barrier may lead to increased
permeation of luminal factors into the mucosa or into the systemic circulation, and to
local and systemic inflammation. The mechanism of increased permeation may either
be an early event in the pathophysiology of IBS, or an epiphenomenon of the disorder,
triggered by inflammation or dysregulation of the neuroendocrine system and brain‐gut
interaction.1‐3
Observational research is prone to confounding. Although a variety of factors, such as
sex,4 BMI,5 use of alcohol or medication,6,7 are reported to affect gut barrier function,
previous studies assessing intestinal permeability in IBS patients have not adjusted their
results for potential confounders. In a group of 91 IBS patients and 94 healthy controls
(Chapter 2), we found a significantly increased small intestinal permeability in IBS‐D
patients compared to controls. Furthermore, gastroduodenal permeability was
significantly higher in the total IBS group and the IBS‐D and IBS‐C subtypes versus
healthy subjects, but these differences were no longer significant after adjustment for
confounders (i.e. mainly sex, BMI, and the use of prokinetics and laxatives). These new
insights are relevant for the design of future studies assessing intestinal permeability in
health and disease.
A complex interplay exists between the intestinal mucosa, the immune system and
commensal bacteria. This interplay may be altered in IBS patients. Commensal
intestinal bacteria prevent colonisation of pathogens, support the digestion of
nutrients, co‐regulate epithelial functions (e.g. differentiation, mucus production and
defensin release), and affect the mucosal immune system, and tight junction protein
synthesis.8 We administered indomethacin, a NSAID, as stress‐model for the intestinal
mucosa, to healthy subjects and investigated the effects of 7‐day oral intake of three
L. plantarum strains (all three commensals of the human GI tract) on small intestinal
mucosa. In line with previous findings,9 indomethacin induced an increase in small
intestinal permeability. This was not affected by any of the three bacterial strain
interventions. However, one of the L. plantarum strains (i.e. TIFN101) induced strain
dependent effects on gene transcription in intestinal mucosal cells: on gene modulation
related to mucosal structure and on genes associated with maintenance of T and B‐cell
function and antigen presentation. Furthermore, this L. plantarum strain enhanced
memory T‐cell responses against Staphylococcus aureus enterotoxin B superantigen
and tetanus toxoid. Although we did not find a beneficial effect on intestinal
permeability, the modulation of mucosal repair mechanisms after NSAID induced
stress, and enhanced immune response against pathogens, may also contribute to
improved overall barrier function. Furthermore, our findings demonstrate that even
bacterial strains of the same species may have distinct different effects on the host,
General discussion
251
which points to careful selection of potential probiotic strains for specific target
conditions or populations. In a recent meta‐analysis, Ford et al. stated that probiotics
have therapeutic potential in IBS.10 Despite rapidly increasing knowledge it remains to
be established which individual bacterial species and strains are most beneficial for
humans and for which disorder or disease. In the past decade, remarkable progress is
made (mainly from animal and in vitro studies) with respect to understanding
mechanisms by which consumed live bacteria, but also commensal microbiota, affect
gut function.10‐12 Nevertheless, this field of research is only in its early phase of
development. Our studies have provided additional and new insights and leads for
future studies with regard to the interactions between the intestinal barrier, immune
system and bacteria present in the gut lumen.
Heterogeneity of irritable bowel syndrome
“Irritable bowel syndrome is a heterogeneous functional gastrointestinal disorder with a multifactorial aetiology that involves the interplay between both host and
environmental factors”.13 This type of statement frequently is used as introduction to a
research topic in scientific papers that deal with IBS. The heterogeneity of IBS has
puzzled researches already for over a century,14 and is considered to limit treatment
efficacy in IBS. Differences in aetiology are considered to underlie the diversity in
clinical presentation in IBS. An alternative is that therapeutic actions should focus on
more homogenous subgroups rather than on the general IBS patient population.
Acknowledging this rationale, the Rome committee divided IBS in four subtypes based
on predominant bowel habits.15 Although pathophysiological or intervention studies in
IBS frequently focus on subtypes, usually an unselected IBS population is studied with
insufficient power for separate subtype analyses. In addition, poor agreement (of 46%)
has been reported between IBS subtyping based on Rome II versus Rome III criteria,16
hindering a comparison of studies over time. Moreover, IBS symptoms and possibly also
bowel habits fluctuate over time. In a prospective study about half of IBS‐D and IBS‐C
patients were found to shift towards a different subtype, particularly to the mixed type,
over a 12‐week time period.17 Therefore, the question rises how relevant these four IBS
subtypes are for both research and clinical practice.
In Chapters 2, 5 and 7, we included sufficient numbers of IBS patients to investigate
differences between IBS‐D, IBS‐C and IBS‐M subtypes as a secondary objective.
Studying intestinal permeability and serotonin metabolism, we found significant
differences between IBS subtypes. Small intestinal permeability was increased only in
the IBS‐D group versus healthy controls (Chapter 2), while for IBS‐C and IBS‐M no
differences in GI‐permeability were observed. Furthermore, plasma 5‐HIAA levels were
decreased in all three subtypes of IBS when compared to healthy subjects. The 5‐HIAA /
5‐HT ratio was decreased in the total IBS group and in the IBS‐M subgroup (Chapter 7).
Between the IBS subgroup significant differences were observed. The ratio 5‐HIAA /
Chapter 12
252
5‐HT was significantly lower in the IBS‐M subgroup compared to the IBS‐D group. This
points to an association between altered serotonin metabolism and IBS‐M subtype,
possibly also a causative role for serotonin metabolism. The shift in predominant bowel
habit that is characteristic for IBS‐M patients is poorly understood. Up to now,
serotonin metabolism has not been studied before in this subgroup of IBS patients.
Since serotonin is known to affect gut motility and secretion,18 alterations in serotonin
metabolism may contribute to the pathophysiology and clinical spectrum of IBS‐M.
However, more research is needed to further elucidate this association. Such research
should include the investigation of changes of 5‐HIAA and 5‐HIAA / 5‐HT ratio over time
in IBS‐M patients both in plasma and mucosal samples, and the relation in time to
episodes with constipation and diarrhoea.
We did not observe significant differences between the IBS subtypes with regard to
age, gender, BMI, lifestyle factors, psychological symptom severity, and mental and
physical QoL‐scores, which is in line with previous findings.19 Furthermore, GI symptom
scores for abdominal pain or discomfort, bloating, flatulence, upper GI symptoms, as
well as overall intensity of GI complaints were comparable between the subtypes. The
use of medication was equally distributed, apart from SSRIs, laxatives and anti‐diarrheal
drugs. Finally, we found a comparable prevalence of visceral hypersensitivity in all IBS
subtypes (Chapter 5) and no major differences in the tested biomarkers panel
(Chapter 11).
Despite an extensive characterisation, we were not able to clearly define the
phenotype of three most prevalent IBS‐subtypes (D, C and M) based on a variety of
demographics, lifestyle, psychological and pathophysiological factors. These findings,
together with possible changes in symptoms and subtypes over time, suggest that IBS
patient clustering based on other factors is needed.
In this thesis, we investigated hyper‐ and normosensitive IBS patients. These groups
differed with regard to age, gender, use of SSRIs, and GI symptom scores (Chapter 5).
However, no differences were observed with regard to predominant bowel habits,
psychological factors, quality of life, use medication other than SSRIs, time since IBS
diagnosis, percentage of patients with post‐infectious type IBS, or lifestyle factors.
Furthermore, several biomarkers that represent specific pathophysiological
mechanisms of IBS, such as faecal calprotectin, chromogranin A (CgA), human
β‐defensin 2 (HBD2), short chain fatty acids (SCFAs), and plasma citrulline, 5‐HT and
5‐HIAA were not altered in the hypersensitive compared to the normosensitive IBS
group. We conclude that subtyping IBS based on visceral perception does not lead to
better sub‐classification of IBS patients.
It should be noted that the fact that biomarker levels did not differ between hyper and
normosensitive IBS patients, does not strictly exclude either low‐grade‐inflammation or
altered neuroendocrine activity or intraluminal metabolic activity to be involved in the
development of visceral hypersensitivity in IBS. Furthermore, we did not address all
biological mechanisms associated with IBS.
General discussion
253
The current knowledge of IBS pathophysiology may not be sufficient to allow clustering
of IBS patients based on differences in aetiology. The Maastricht IBS cohort formed the
basis of several chapters of the current thesis. At this moment it consists of around
500 cases and 200 healthy controls, and inclusion is ongoing. The phenotype of the
participants is well characterised, with regard to demographics, lifestyle, use of
medication, comorbidity, QoL, psychological and GI symptoms, and an extensive dietary
assessment. In subgroups of the cohort blood and faecal samples are collected. At
present, further analyses are running on microbiota composition, metabolomics in
exhaled air, host genetics and diet. These data, together with the data presented in this
thesis, will be combined in a large database and will offer the chance for
assumptionless cluster analyses, which may identify groups of patients with common
characteristics and thereby may provide leads for further studies on underlying
mechanisms contributing to symptom development and for therapeutic interventions.
Symptom assessment in IBS patients: a paradigm shift?
Chronic or recurrent abdominal pain, mostly of visceral origin, is a common symptom
that is of great clinical significance in several medical areas, in particular for IBS.20
Reduction of this symptom burden usually is the primary aim of IBS treatments.15,21
However, the variety of retrospective questionnaires and provocation tests used in
studies to measure abdominal pain in IBS (Chapter 8) makes the comparison between
studies challenging. Many of these questionnaires have not been psychometrically
tested and validated in the target population. Furthermore, these questionnaires are all
based on autobiographical memory and are therefore biased, i.e. due to recall bias, as
memory can be affected by different psychological and circumstantial factors.
Comparing an end‐of‐day diary and an end‐of‐week questionnaire to a novel electronic
momentary symptom assessment method, i.e. Experience Sampling Method (ESM),
demonstrated that IBS patients report higher pain scores in retrospective
questionnaires, compared to the average scores of momentary assessment (chapter 9).
This finding was accompanied by a tendency of peak‐pain reporting at the end of the
day, which has been observed previously.22 The peak‐reporting phenomenon was not
observed for other GI symptoms, indicating that particularly abdominal pain is prone to
recall bias. Interestingly, peak‐pain reporting was not influenced by affective
comorbidity in IBS patients. Electronic momentary symptom assessment in IBS may
overcome limitations of the currently available methods, and can provide further
insight in the fluctuation of symptom over the day. Intervention trials in patients are
time‐consuming, expensive and bare potential risks for participants. A potential
advantage of the use of repeated measures in ESM and multi‐level analytical methods
is that it may increase the statistical power to detect differences over a period of time
when compared to classical end‐of‐day diaries. This may result in smaller sample sizes
in IBS intervention trials required to reach statistical significances. In this thesis the first
step in the development and validation process of ESM for the use in IBS patients has
Chapter 12
254
been made. Further research is needed, and currently ongoing, to carefully select the
questions to be used in ESM, to psychometrically test the sets of questions and to
compare the scores to the current standardly used symptom assessment methods to
this final set of questions in ESM, in a large group of IBS patients in normal conditions
and during interventions.
From symptoms to biomarker based diagnosis in IBS
Underlying subtle and complex metabolic changes in IBS could in theory be detected by
a combination of biomarkers with sufficient power to overcome hurdles of sensitivity in
this heterogeneous patient population. Up to now, several studies have investigated
single biomarkers and two studies explored a set of serum and genetic markers for
IBS.23‐25 However, the predictive values of these markers are only low to moderate,
which may be caused by an incomplete representation of the full range of mechanisms
that are involved in the multifactorial pathophysiology of IBS.
In this thesis we focused, not only on IBS, but also on the measurement of gut health
using biomarkers in a large general population cohort. Furthermore, a cohort of clinical
IBS patients and age and gender matched healthy controls (without GI complaints)
were included. Out of fifteen plasma and faecal markers a group of eight markers, i.e.
IL‐1β, IL‐6, IL12p70, TNF‐α, CgA, HBD2, calprotectin and caproate, was identified as the
most discriminatory panel of biomarkers for the separation of IBS patients and healthy
controls (sensitivity 88%, specificity 87%). This panel of markers correlated significantly
to GI symptom scores both in the IBS cohort (r=0.6, p<0.001) and in the general
population (r=0.4, p<0.001). Furthermore, using a holistic metabolomics approach in
the same cohorts a panel of 16 volatiles correctly predicted 89% (sensitivity) of IBS
samples and 73% (specificity) of healthy controls, whit again good correlations to GI
symptoms. These findings demonstrate that faecal and plasma biomarkers, which are
indicative for different pathophysiological mechanisms of IBS, can be used as a highly
predictive marker set for IBS patients, and even correlates to GI symptoms in subjects
with more mild GI symptoms in the general population. Furthermore, our findings
acknowledge the value of measurement of VOCs in exhaled air of IBS patients and
subjects in the general population for potential use as biomarkers.
Taking into account the fact that IBS is a functional GI disorder, and that the patient
population is very heterogeneous, the sensitivity and specificity of both biomarkers
panels can be considered as high. These studies are important steps towards a
biomarker based diagnosis of IBS. However, further research is needed before the
panels can be used in daily clinical practice. In particular, the value of the biomarker
panels for the discrimination between IBS and other GI disorders, such as IBD or celiac
disease, needs to be evaluated, as well as additional validation of the markers in other,
independent, IBS cohorts.
The good correlation of the biomarker panels with GI symptoms, suggests that both
panels may be useful for the detection of changes in GI symptom severity, both in IBS
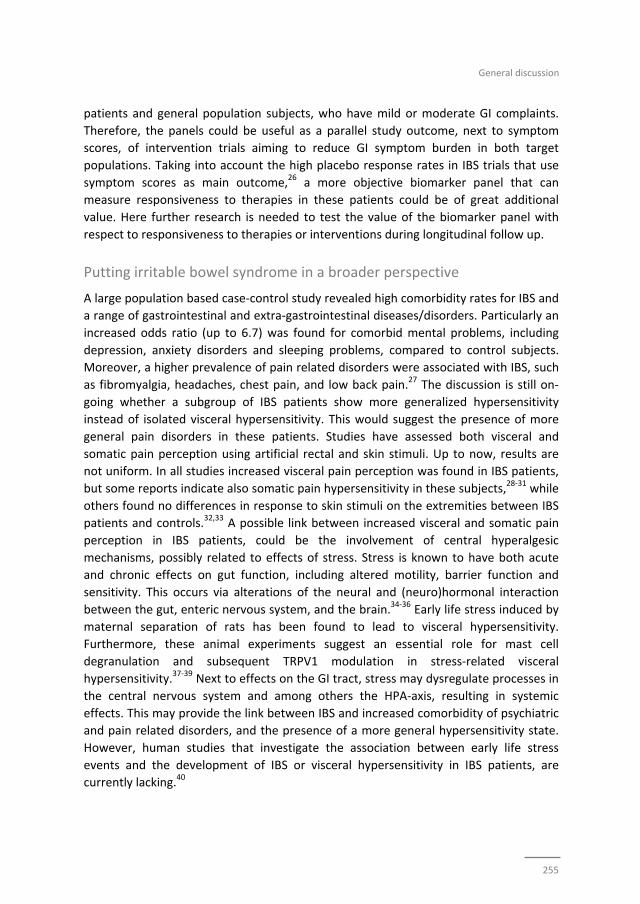
General discussion
255
patients and general population subjects, who have mild or moderate GI complaints.
Therefore, the panels could be useful as a parallel study outcome, next to symptom
scores, of intervention trials aiming to reduce GI symptom burden in both target
populations. Taking into account the high placebo response rates in IBS trials that use
symptom scores as main outcome,26 a more objective biomarker panel that can
measure responsiveness to therapies in these patients could be of great additional
value. Here further research is needed to test the value of the biomarker panel with
respect to responsiveness to therapies or interventions during longitudinal follow up.
Putting irritable bowel syndrome in a broader perspective
A large population based case‐control study revealed high comorbidity rates for IBS and
a range of gastrointestinal and extra‐gastrointestinal diseases/disorders. Particularly an
increased odds ratio (up to 6.7) was found for comorbid mental problems, including
depression, anxiety disorders and sleeping problems, compared to control subjects.
Moreover, a higher prevalence of pain related disorders were associated with IBS, such
as fibromyalgia, headaches, chest pain, and low back pain.27 The discussion is still on‐
going whether a subgroup of IBS patients show more generalized hypersensitivity
instead of isolated visceral hypersensitivity. This would suggest the presence of more
general pain disorders in these patients. Studies have assessed both visceral and
somatic pain perception using artificial rectal and skin stimuli. Up to now, results are
not uniform. In all studies increased visceral pain perception was found in IBS patients,
but some reports indicate also somatic pain hypersensitivity in these subjects,28‐31 while
others found no differences in response to skin stimuli on the extremities between IBS
patients and controls.32,33 A possible link between increased visceral and somatic pain
perception in IBS patients, could be the involvement of central hyperalgesic
mechanisms, possibly related to effects of stress. Stress is known to have both acute
and chronic effects on gut function, including altered motility, barrier function and
sensitivity. This occurs via alterations of the neural and (neuro)hormonal interaction
between the gut, enteric nervous system, and the brain.34‐36 Early life stress induced by
maternal separation of rats has been found to lead to visceral hypersensitivity.
Furthermore, these animal experiments suggest an essential role for mast cell
degranulation and subsequent TRPV1 modulation in stress‐related visceral
hypersensitivity.37‐39 Next to effects on the GI tract, stress may dysregulate processes in
the central nervous system and among others the HPA‐axis, resulting in systemic
effects. This may provide the link between IBS and increased comorbidity of psychiatric
and pain related disorders, and the presence of a more general hypersensitivity state.
However, human studies that investigate the association between early life stress
events and the development of IBS or visceral hypersensitivity in IBS patients, are
currently lacking.40
Chapter 12
256
Integration of current knowledge into the daily clinical care of IBS patients
In daily clinical practice dissatisfaction of IBS patients regarding the interaction with
their physician is not uncommon, and may negatively impact IBS disease outcome.41 It
is amongst others related to limited information and frustrations about the explanation
of IBS by the physician, in particular with regard to aetiology.42‐44 IBS patients worry
more about having a serious disease than matched controls, which may partly be
caused by a lack of understanding of their illness.27 As the effect of therapies in IBS is
low to moderate, education of patients, which should lead to a better understanding of
their symptoms and to development of adequate coping strategies is of outmost
importance. A recent review by Hungin et al. provides an integrated model of IBS for
clinicians to be used in daily clinical practice. It utilises the current knowledge regarding
IBS aetiology, including altered peripheral regulation of gut function, altered brain‐gut
interaction, and psychological distress.45 The transfer of this knowledge via a model or
scheme to IBS patients in an understandable, comprehensive way, may improve the
outcome of IBS in affected subjects.
Since IBS is a heterogeneous disorder, is associated with triggers as stress or diet, and
with frequent comorbidities (e.g. psychiatric disorders), a multidisciplinary approach
may lead to better treatment outcomes compared to the standard care provided by
GPs or gastroenterologists alone. This approach may involve disciplines such as
behavioural psychology, psychiatry, physical therapy, dietetics and in case of specific
comorbidities, disciplines as rheumatology, gynaecology, or urology. A onetime
multidisciplinary education session was tested, which involved lectures to improve
understanding of IBS and provided information about coping strategies by experts of
different field to a class of up to six IBS patient. This approach led to a significant
decrease in symptom burden in IBS patients, although placebo effect may have played
a role, as randomization and blinding was difficult to achieve.46 A multidisciplinary
approach leads to higher direct health care costs of the IBS treatment, but when
successful, may reduce the economic burden on the long term.47 However, this
approach remains to be tested and proven. Therefore, further research is needed to
prove possible benefits on disease outcomes and the economic effects.
Avicenna (Ibn‐Sīnā), the great Persian thinker and the writer of the Canon of Medicine
(1025 AD), which was used for over 600 years as the guidance for standard medical
practice in Europe and the Middle‐East, stated that in medicine the absence of
understanding does not warrant absence of existence. As described in this thesis, the
current knowledge of IBS pathophysiology is far from complete. However, in contrast to
only a few decades ago, our understanding of subtle organic changes that contribute to
the development of this functional GI disorder has considerably expanded and is rapidly
improving, which is likely to lead towards a more biomarker based diagnosis and
considerably better treatment option for IBS in the (near) future.
General discussion
257
References
1. Sanchez de Medina F, Romero‐Calvo I, Mascaraque C, Martinez‐Augustin O. Intestinal inflammation and mucosal barrier function. Inflamm Bowel Dis. 2014;20:2394‐404.
2. Keszthelyi D, Troost FJ, Jonkers DM, van Eijk HM, Lindsey PJ, Dekker J, et al. Serotonergic reinforcement
of intestinal barrier function is impaired in irritable bowel syndrome. Aliment Pharmacol Ther. 2014; 40:392‐402.
3. Vanuytsel T, van Wanrooy S, Vanheel H, Vanormelingen C, Verschueren S, Houben E, Salim Rasoel S,
Tόth J, Holvoet L, Farré R, Van Oudenhove L, Boeckxstaens G, Verbeke K, Tack J. Psychological stress and corticotropin‐releasing hormone increase intestinal permeability in humans by a mast cell‐
dependent mechanism. Gut. 2014;63:1293‐9.
4. Marshall JK, Thabane M, Garg AX, Clark W, Meddings J, Collins SM; WEL Investigators. Intestinal permeability in patients with irritable bowel syndrome after a waterborne outbreak of acute
gastroenteritis in Walkerton, Ontario. Aliment Pharmacol Ther. 2004;20:1317‐22.
5. Teixeira TF, Souza NC, Chiarello PG, Franceschini SC, Bressan J, Ferreira CL, Peluzio Mdo C. Intestinal permeability parameters in obese patients are correlated with metabolic syndrome risk factors. Clin
Nutr. 2012;31:735‐40.
6. Kerckhoffs AP, Akkermans LM, de Smet MB, Besselink MG, Hietbrink F, Bartelink IH, Busschers WB, Samsom M, Renooij W. Intestinal permeability in irritable bowel syndrome patients: effects of NSAIDs.
Dig Dis Sci. 2010;55:716‐23.
7. Elamin EE, Masclee AA, Dekker J, Jonkers DM. Ethanol metabolism and its effects on the intestinal epithelial barrier. Nutr Rev. 2013;71:483‐99.
8. Bischoff SC. 'Gut health': a new objective in medicine? BMC Med. 2011;9:24.
9. Bjarnason I, Williams P, Smethurst P, Peters TJ, Levi AJ. Effect of non‐steroidal anti‐inflammatory drugs and prostaglandins on the permeability of the human small intestine. Gut. 1986;27:1292‐7.
10. Ford AC, Quigley EM, Lacy BE, Lembo AJ, Saito YA, Schiller LR, Soffer EE, Spiegel BM, Moayyedi P.
Efficacy of prebiotics, probiotics, and synbiotics in irritable bowel syndrome and chronic idiopathic constipation: systematic review and meta‐analysis. Am J Gastroenterol. 2014;109:1547‐61.
11. Theodorou V, Ait Belgnaoui A, Agostini S, Eutamene H. Effect of commensals and probiotics on visceral
sensitivity and pain in irritable bowel syndrome. Gut Microbes. 2014;5:430‐6. 12. Gareau MG. Microbiota‐gut‐brain axis and cognitive function. Adv Exp Med Biol. 2014;817:357‐71.
13. Rajilić‐Stojanović M, Jonkers DM, Salonen A, Hanevik K, Raes J, Jalanka J, de Vos WM, Manichanh C,
Golic N, Enck P, Philippou E, Iraqi FA, Clarke G, Spiller RC, Penders J. Intestinal Microbiota And Diet in IBS: Causes, Consequences, or Epiphenomena? Am J Gastroenterol. 2015;110:278‐87.
14. Cumming W. Electro‐galvanism in a peculiar affliction of the mucous membrane of the bowels. London
Med Gazette. 1849;NS9:969‐73. 15. Drossman DA, Corazziari, E., Delvaux, M., Spiller, R.C., Talley, N.J., Thompson, W.G., Whitehead, W.E.
Rome III: The Functional Gastrointestinal Disorders, Third Edition: McLean, VA: Degnon Associates, Inc.;
2006. 16. Ersryd A, Posserud I, Abrahamsson H, Simren M. Subtyping the irritable bowel syndrome by
predominant bowel habit: Rome II versus Rome III. Aliment Pharmacol Ther. 2007;26:953‐61.
17. Mearin F, Baro E, Roset M, Badia X, Zarate N, Perez I. Clinical patterns over time in irritable bowel syndrome: symptom instability and severity variability. Am J Gastroenterol. 2004;99:113‐21.
18. Keszthelyi D, Troost FJ, Masclee AA. Understanding the role of tryptophan and serotonin metabolism in
gastrointestinal function. Neurogastroenterol Motil. 2009;21:1239‐49. 19. Tillisch K, Labus JS, Naliboff BD, Bolus R, Shetzline M, Mayer EA, Chang L. Characterization of the
alternating bowel habit subtype in patients with irritable bowel syndrome. Am J Gastroenterol.
2005;100:896‐904. 20. Elsenbruch S. Abdominal pain in Irritable Bowel Syndrome: a review of putative psychological, neural
and neuro‐immune mechanisms. Brain Behav Immun. 2011;25:386‐94.
21. U.S. Department of Health and Human Services FaDA, Center for Drug Evaluation and Research (CDER). Guidance for Industry Irritable Bowel Syndrome ‐ Clinical Evaluation of Drugs for Treatment, 2012.
http://wwwfdagov/downloads/Drugs/Guidances/UCM205269pdf.
Chapter 12
258
22. Weinland SR, Morris CB, Hu Y, Leserman J, Bangdiwala SI, Drossman DA. Characterization of episodes of
irritable bowel syndrome using ecological momentary assessment. Am J Gastroenterol. 2011;106: 1813‐20.
23. Corsetti M, Van Oudenhove L, Tack J. The quest for biomarkers in IBS‐where should it lead us?
Neurogastroenterol Motil. 2014;26:1669‐76. 24. Jones MP, Chey WD, Singh S, Gong H, Shringarpure R, Hoe N, Chuang E, Talley NJ. A biomarker panel
and psychological morbidity differentiates the irritable bowel syndrome from health and provides novel
pathophysiological leads. Aliment Pharmacol Ther. 2014;39:426‐37. 25. Lembo AJ, Neri B, Tolley J, Barken D, Carroll S, Pan H. Use of serum biomarkers in a diagnostic test for
irritable bowel syndrome. Aliment Pharmacol Ther. 2009;29:834‐42.
26. Ford AC, Moayyedi P. Meta‐analysis: factors affecting placebo response rate in the irritable bowel syndrome. Aliment Pharmacol Ther. 2010;32:144‐58..
27. Faresjo A, Grodzinsky E, Hallert C, Timpka T. Patients with irritable bowel syndrome are more burdened
by co‐morbidity and worry about serious diseases than healthy controls‐‐eight years follow‐up of IBS patients in primary care. BMC Public Health. 2013;13:832.
28. Stabell N, Stubhaug A, Flaegstad T, Nielsen CS. Increased pain sensitivity among adults reporting
irritable bowel syndrome symptoms in a large population‐based study. Pain. 2013;154:385‐92. 29. Rossel P, Drewes AM, Petersen P, Nielsen J, Arendt‐Nielsen L. Pain produced by electric stimulation of
the rectum in patients with irritable bowel syndrome: further evidence of visceral hyperalgesia. Scand J
Gastroenterol. 1999;34:1001‐6. 30. Piche M, Arsenault M, Poitras P, Rainville P, Bouin M. Widespread hypersensitivity is related to altered
pain inhibition processes in irritable bowel syndrome. Pain. 2010;148:49‐58.
31. Verne GN, Price DD, Callam CS, Zhang B, Peck J, Zhou Q. Viscerosomatic facilitation in a subset of IBS patients, an effect mediated by N‐methyl‐D‐aspartate receptors. J Pain . 2012;13:901‐9.
32. Whitehead WE, Holtkotter B, Enck P, Hoelzl R, Holmes KD, Anthony J, et al. Tolerance for rectosigmoid
distention in irritable bowel syndrome. Gastroenterology. 1990;98:1187‐92. 33. Caldarella MP, Giamberardino MA, Sacco F, Affaitati G, Milano A, Lerza R, Balatsinou C, Laterza F,
Pierdomenico SD, Cuccurullo F, Neri M. Sensitivity disturbances in patients with irritable bowel
syndrome and fibromyalgia. Am J Gastroenterol. 2006;101:2782‐9. 34. Konturek PC, Brzozowski T, Konturek SJ. Stress and the gut: pathophysiology, clinical consequences,
diagnostic approach and treatment options. J Physiol Pharmacol. 2011;62:591‐9.
35. Hyland NP, O'Mahony SM, O'Malley D, O'Mahony CM, Dinan TG, Cryan JF. Early‐life stress selectively affects gastrointestinal but not behavioral responses in a genetic model of brain‐gut axis dysfunction.
Neurogastroenterol Motil. 2015;27:105‐13.
36. Larauche M, Mulak A, Tache Y. Stress and visceral pain: from animal models to clinical therapies. Exp Neurol. 2012;233:49‐67.
37. van den Wijngaard RM, Klooker TK, Welting O, Stanisor OI, Wouters MM, van der Coelen D, Bulmer DC,
Peeters PJ, Aerssens J, de Hoogt R, Lee K, de Jonge WJ, Boeckxstaens GE. Essential role for TRPV1 in stress‐induced (mast cell‐dependent) colonic hypersensitivity in maternally separated rats.
Neurogastroenterol Motil. 2009;21:1107‐e94.
38. Stanisor OI, van Diest SA, Yu Z, Welting O, Bekkali N, Shi J, de Jonge WJ, Boeckxstaens GE, van den Wijngaard RM. Stress‐induced visceral hypersensitivity in maternally separated rats can be reversed by
peripherally restricted histamine‐1‐receptor antagonists. PloS One. 2013;8:e66884.
39. Winston J, Shenoy M, Medley D, Naniwadekar A, Pasricha PJ. The vanilloid receptor initiates and maintains colonic hypersensitivity induced by neonatal colon irritation in rats. Gastroenterology. 2007;
132:615‐27.
40. Barreau F, Ferrier L, Fioramonti J, Bueno L. New insights in the etiology and pathophysiology of irritable bowel syndrome: contribution of neonatal stress models. Pediatric Res. 2007;62:240‐5.
41. Dhaliwal SK, Hunt RH. Doctor‐patient interaction for irritable bowel syndrome in primary care: a
systematic perspective. Eur J Gastroenterol Hepatol. 2004;16:1161‐6. 42. Bijkerk CJ, de Wit NJ, Stalman WA, Knottnerus JA, Hoes AW, Muris JW. Irritable bowel syndrome in
primary care: the patients' and doctors' views on symptoms, etiology and management. Can J
Gastroenterol. 2003;17:363‐8.
General discussion
259
43. Stenner PH, Dancey CP, Watts S. The understanding of their illness amongst people with irritable bowel
syndrome: a Q methodological study. Soc Sci Med. 2000;51:439‐52. 44. Casiday RE, Hungin AP, Cornford CS, de Wit NJ, Blell MT. Patients' explanatory models for irritable
bowel syndrome: symptoms and treatment more important than explaining aetiology. Fam Pract. 2009;
26:40‐7. 45. Hungin AP, Becher A, Cayley B, Heidelbaugh JJ, Muris JW, Rubin G, Seifert B, Russell A, De Wit NJ.
Irritable bowel syndrome: an integrated explanatory model for clinical practice. Neurogastroenterol
Motil. 2015 Feb 20. 46. Saito YA, Prather CM, Van Dyke CT, Fett S, Zinsmeister AR, Locke GR, 3rd. Effects of multidisciplinary
education on outcomes in patients with irritable bowel syndrome. Clin Gastroenterol Hepatol. 2004;2:
576‐84. 47. Canavan C, West J, Card T. Review article: the economic impact of the irritable bowel syndrome.
Aliment Pharmacol Ther. 2014;40:1023‐34.

Chapter 12
260

261
Summary

262
Summary
263
Summary
Irritable Bowel Syndrome is a highly prevalent functional gastrointestinal disorder,
which often results in high symptom burden and significant impairment in quality of life
of affected subjects. The multifactorial aetiology of IBS will contribute to various
symptoms and distinct phenotypes. This thesis contained three parts, that focussed on
i) the pathophysiology of IBS, ii) symptom assessment in IBS patients and iii) the
development of new biomarker panels for IBS.
The aetiology of IBS is multifactorial, complex and incompletely understood. In part one
of this thesis, we investigated several potential pathophysiological mechanisms of IBS,
and modulation thereof.
In chapter 2, we studied alterations in intestinal permeability in IBS patients, with
particular emphasis on IBS subtypes. A validated multi‐sugar test was used to
investigate gastro‐duodenal, small intestinal, colonic and whole gut permeability in a
large group of IBS patients and age and gender matched healthy controls. All analyses
were adjusted for possible confounding effects of demographics, lifestyle factors, the
presence of psychological symptoms and the use of medication. We found that small
intestinal permeability, indicated by elevated urinary excretion of orally ingested
lactulose and rhamnose ratio, was increased in diarrhoea predominant IBS patients
when compared to healthy controls. This effect was still present after adjustment for
possible confounders. Gastro‐duodenal permeability, indicated by urinary sucrose
excretion, was increased in the total IBS group, as well as in the diarrhoea and
constipation predominant subtype. However, after adjustment for possible
confounding effects, this association was no longer significant. For colonic and whole
gut permeability, no significant differences between groups were found.
The findings presented in this study point to a different pathophysiological mechanism
in the IBS‐D subtype when compared to the other IBS subtypes, and demonstrate that
adjustment for possible confounding factors is essential when investigating intestinal
permeability, especially in a heterogeneous disorder as IBS.
Life bacteria, present in the gut as microbiota or ingested orally, interact with the host
and may affect gut and immune function of humans. It is postulated that this
interaction may be altered in IBS patients. In chapter 3 and chapter 4 of this thesis we
investigated the effects of oral administration of three different Lactobacillus
plantarum strains (all commensals of the human GI tract) on the intestinal barrier and
mucosal and systemic immune function. These studies were carried out in healthy
human subjects, after consumption of the NSAID indomethacin. NSAIDs are frequently
consumed drugs, also by patients with IBS. These drugs have immuno‐modulatory and
enteropathic effects. In our studies, NSAIDs have been used as stress‐model for the
intestinal mucosa. Indomethacin induced an increase in small intestinal permeability,
264
which was in line with previous findings, but which was not affected by any of the
bacterial interventions. However, intake of the bacterial strains did induce strain‐
dependent effects on gene transcription in intestinal mucosal cells. L. plantarum
TIFN101 showed the most pronounced modulatory properties with regard to mucosal
gene transcription, with positive effects on gene transcription of repair processes in the
compromised intestine of healthy subjects, and upregulated genes associated with
maintenance of T and B‐cell function and antigen presentation. Furthermore, it
enhanced the memory T‐cell responses against Staphylococcus aureus enterotoxin B
superantigen and tetanus toxoid. These studies provided further mechanistic insight
how three different L. plantarum strains affect the host, and demonstrated that effects
are strain specific. Furthermore, our findings provide new insights for the interactions
between intestinal barrier, immune system and bacteria present in the gut lumen. This
interplay is presumed to play an important role in the pathophysiology of IBS.
In chapter 5 and chapter 6, we focused on visceral hypersensitivity in IBS patients, with
emphasis on differences in clinical characteristics and specific biomarkers in hyper‐
versus normosensitive IBS patients. Visceral sensitivity was assessed using an electronic
barostat with rectal balloon distention. Interestingly, the hypersensitive IBS patients
were comparable to those patients classified as normosensitive with regard to
demographic and lifestyle characteristics and medication use. Only younger age, female
sex and the use of SSRI medication was significantly associated with the presence of
visceral hypersensitivity in IBS patients. However in a multivariate logistic regression
analysis only higher age was found to be significantly associated with lower odds for
having hypersensitivity. No differences were observed with regard to predominant
bowel habits, psychological factors, quality of life, medication use other than SSRIs,
time since IBS diagnosis, percentage of patients with post‐infectious type IBS, or
lifestyle factors. Furthermore, the concentrations of calprotectin, human β‐defensin 2,
chromogranin A, and short chain fatty acids (measured in faeces), and serotonin, its
principal metabolite 5‐hydroxyindoleacetic acid (5‐HIAA) and citrulline (measured in
plasma), reflecting several potential underlying mechanisms, did not differ significantly
between normosensitive and hypersensitive IBS patients.
Taken together, our data raise the question whether the assessment of visceral
sensitivity in IBS patients has relevant implications in daily clinical practice, since the
differences between hyper‐ and normosensitive IBS patients were moderate.
Nevertheless, it has to be acknowledged that the use of intestinal provocation tests in
scientific research in this target population in the past decades has provided unique
knowledge with regard to neural pain processing of intestinal stimuli and may also
provide keys to tailored therapeutic interventions.
In chapter 7 we have investigated platelet poor plasma serotonin (5‐HT) and 5‐HIAA
levels and their ratio in a large cohort of IBS patients and healthy controls, including
Summary
265
extensive IBS subgroup analyses. While no differences were detected in plasma 5‐HT
between groups, 5‐HIAA concentrations were significantly lower in IBS patients
compared to controls, which was also true for 5‐HIAA/serotonin ratio. Furthermore,
subtype analysis (after adjustment for possible confounding factors) demonstrated that
both 5‐HIAA and 5‐HIAA/serotonin ratio were significantly decreased, particularly in IBS
patients with a mixed stool pattern (i.e. IBS‐M). Furthermore, our data point to an
influence of gender on the serotonin metabolism in IBS, but not of GI symptoms,
anxiety and/or depression, lifestyle factors, or medication use.
This study demonstrated that although fasting serotonin plasma levels were not altered
in IBS patients compared to controls, the differences in 5‐HIAA levels may reflect
altered serotonin metabolism in IBS patients, in particular in the IBS‐M subtype.
Consensus on standard methods to assess chronic abdominal pain in patients with IBS
is currently lacking. In the second part of this thesis we focused on methods for GI
symptom assessment in IBS patients. First, in chapter 8 the currently available
instruments for assessing chronic abdominal pain in IBS patients have been evaluated
in a systematic review. There was large variety in assessment tools used in the included
studies, which hindered comparison between studies and pooling of data for a meta‐
analyses. Provocation tests, such as the rectal barostat, are often applied in studies that
include IBS patients, and are useful tools to assess an acute response to artificial
intestinal stimuli. However, the outcomes do not correlate well to chronic abdominal
pain severity as assessed by retrospective questionnaires. Retrospective symptom
assessment by paper questionnaires or diaries carry the risk of recall and ecological
bias. Nevertheless, at this moment retrospective GI‐symptom severity scales are
frequently used, are easy to apply, and are the best validated methods for symptom
assessment in IBS patients. However, these questionnaires in general include only the
assessment of abdominal pain intensity. There is need for validated instruments to
assess chronic abdominal pain in IBS patients that overcome the limitations of the
currently available methods. Momentary symptom assessment, may be an alternative
that can eliminate recall bias when measuring abdominal pain, but is a relatively new
method in IBS studies, and further validation is needed.
In line with the conclusion of this review, we conducted a pilot study (chapter 9) to
investigate the potential of Experience Sampling Method (ESM) for symptom
assessment in IBS patients. ESM is based on digital momentary symptom assessment,
which eliminates recall bias, reduces ecological bias and provides repeated symptom
measures during the day. We found that end‐of‐day diary abdominal pain scores were
higher compared to corresponding ESM mean‐scores in IBS patients. The difference
was even more pronounced for the end‐of‐week GSRS scores compared to ESM mean‐
scores. These findings indicate that subjects report peak pain rather than average pain
scores in retrospective questionnaires. For flatulence, comparable results were found.
Nausea and belching scores showed small, but significant differences between end‐of‐
266
day diary and ESM. All tested symptoms did score higher on GSRS compared to ESM
mean‐scores. Affective comorbidity did not influence differences in pain reporting
between methods. This study showed that ESM can provide more insight in symptom
course and potential triggers, and thereby may lead to a better understanding of IBS
symptomatology.
The diagnosis of IBS is symptom‐based and validated reliable biomarkers could aid the
diagnostic process in daily clinical practice and scientific research. In the third and final
part of this thesis, we focused on the development and validation of new biomarkers
for IBS and their potential implication in the general population. Although considered a
functional GI disorder, accumulating evidence exists for various subtle organic changes
in IBS patients compared to healthy controls. These associations offer the chance for
the development of biomarkers for IBS. The predictive values of several single markers
investigated previously are however found to be low to moderate. We hypothesized
that a combination of biomarkers that relate to several pathophysiological mechanisms
of IBS is assumed to have sufficient power to overcome hurdles of sensitivity in this
heterogeneous patient population with complex underlying aetiology and rather subtle
organic changes. The predictive values of the markers investigated previously are low
to moderate.
In chapter 10 we combined faecal and plasma biomarkers related to several domains of
gut health. All markers were measured in two large cohorts, i.e. a clinical IBS cohort
with age and gender matched healthy controls without GI symptoms, and a general
population cohort from which GI‐symptom scores were available. An 8‐item biomarker
panel consisting of IL‐1β, IL‐6, IL12p70, TNF‐α, CgA, HBD2, calprotectin and caproate,
was identified to discriminate IBS patients form healthy controls with high sensitivity of
88% and specificity of 87%. When using the same 8‐item biomarker panel to
discriminate IBS subtypes from controls, comparable results were found. Furthermore,
the biomarker panel correlated well with GI‐symptom scores in a general population
cohort.
In chapter 11, a holistic approach was used to identify new biomarkers, i.e. volatile
organic compounds in exhaled air. A set of 16 VOCs that best distinguished IBS patients
from healthy controls was identified. The VOC‐biomarker set correlated significantly
with GI symptoms in two independent cohorts. The set correctly predicted 89% of the
IBS patients and 73% of the healthy controls.
Although further research is needed to test the applicability of these biomarker panels
in daily clinical practice, these findings are important steps towards biomarkers based
diagnosis of IBS.

Summary
267
In chapter 12, we give an overview of the major findings of this thesis, tried to integrate
the different concepts that were discussed in the different chapters, and provide new
hypothesis to be investigated in future studies that focus on IBS.

268

269
Samenvatting

270
Samenvatting
271
Samenvatting
Het Prikkelbare Darm Syndroom (PDS), oftewel Irritable Bowel Syndrome (IBS) in het
Engels, is een veel voorkomende functionele maagdarmaandoening. Bij PDS‐patiënten
leiden de klachten die gerelateerd zijn aan deze aandoening tot een duidelijke
vermindering van de kwaliteit van leven. De multifactoriële etiologie van PDS levert een
verscheidenheid aan symptomen en fenotypen op.
Dit proefschrift is opgedeeld in drie onderdelen, die zich richtten op i) de
pathofysiologie van PDS, ii) het meten van symptomen bij PDS‐patiënten en iii) de
ontwikkeling en validatie van nieuwe biomarker sets voor PDS.
De etiologie van PDS is multifactorieel, complex en wordt nog steeds onvoldoende
begrepen. In deel één van dit proefschrift bestudeerden wij diverse potentiële
pathofysiologische mechanismen van PDS.
In hoofdstuk 2 richtten wij ons op de veranderingen in intestinale permeabiliteit in
PDS‐patiënten ten opzichte van gezonde controlepersonen. Daarnaast werd specifiek
aandacht besteed aan de verschillen binnen PDS‐subtypen, te weten het constipatie‐
(IBS‐C) en diarree‐predominante subtype (IBS‐D) en het subtype met een gemengd
defecatiepatroon (IBS‐M). Een gevalideerde multi‐suiker test werd gebruikt om de
gastroduodenale, dunne darm‐, colon‐ en de volledige maagdarm‐permeabiliteit te
onderzoeken in een grote groep PDS‐patiënten en in op leeftijd‐ en geslacht‐gematchte
gezonde controles. Alle analyses werden gecorrigeerd voor potentiële confounders,
zoals demografische en leefstijlfactoren, psychologische symptomen en het gebruik van
medicijnen. In deze studie vonden wij dat de dunne darmpermeabiliteit verhoogd was
in PDS‐patiënten met het diarree‐predominante subtype in vergelijking tot gezonde
controles. Dit verschil was ook aanwezig na correctie voor mogelijke confounders. De
gastro‐duodenale permeabiliteit was verhoogd in de totale PDS‐populatie en in de
diarree‐ en constipatie‐predominante subtypen. Echter, na correctie voor confounders
waren deze verschillen niet meer statistisch significant. Voor colon‐ en volledige
maagdarm‐permeabiliteit werden geen verschillen gevonden tussen de diverse
groepen.
De bevindingen, die we in deze studie gepresenteerd hebben, wijzen op een ander
pathofysiologisch mechanisme in PDS‐patiënten met het diarree‐predominante
subtype ten opzichte van de andere PDS subtypen. Tevens laat deze studie zien dat bij
het bestuderen van intestinale permeabiliteit, in het bijzonder in een heterogene
populatie als de PDS‐patiënten, het corrigeren voor mogelijke confounders van groot
belang is.
Diverse studies tonen aan dat de samenstelling van de darmflora, ofwel microbiota,
anders is bij patiënten met PDS en mogelijk een rol speelt bij het ontstaan van klachten.
De aanwezige bacteriën in de darm, maar ook oraal ingenomen bacteriën gaan
272
interacties aan met de gastheer en hebben o.a. invloed op de functie van het
maagdarmkanaal en het immuunsysteem. In hoofdstuk 3 en hoofdstuk 4 van dit
proefschrift hebben wij de effecten van drie oraal ingenomen Lactobacillus plantarum
stammen op de intestinale barrièrefunctie en het mucosale en systemische
immuunsysteem onderzocht. De drie stammen zijn van oorsprong commensale
bacteriën van het maagdarmkanaal. De twee studies werden uitgevoerd in tien
gezonde proefpersonen die gedurende testperiodes van zeven dagen elke dag één van
de drie stammen innamen. Tevens kregen zij de NSAID indometacine toegediend op
voor de testperiodes en op laatste dag van de periodes. NSAID’s, die een pijnstillende
en ontstekingsremmende werking hebben, worden frequent gebruikt, onder andere
door PDS‐patiënten. Deze middelen hebben ook een immuunmodulerend en
enteropathisch effect. In onze studies werden de NSAID’s gebruikt als een stressmodel
voor de intestinale mucosa van de gezonde proefpersonen. Zoals ook in eerdere studies
aangetoond, leidde de inname van indometacine tot een verhoogde dunne
darmpermeabiliteit. Dit effect kon niet tenietgedaan worden door de inname van de L.
plantarum stammen. Desalniettemin liet de inname van de bacteriële stammen wel een
stamafhankelijk effect zien op de gentranscriptie van de intestinale mucosale cellen: de
L. plantarum TIFN101 bacteriën hadden de meest uitgesproken modulerende
eigenschappen. De veranderingen hadden betrekking op de gentranscriptie van
reparatieprocessen in het door de NSAID’s gecompromitteerd darmweefsel en de
opregulatie van genen die geassocieerd zijn met het behoud van de T‐ en B‐celfunctie
en antigeenpresentatie. Tevens versterkten deze bacteriën de respons van T
geheugencellen tegen het Staphylococcus aureus enterotoxin B superantigeen en het
tetanus toxine.
In deze twee studies presenteerden wij nieuwe mechanistische inzichten met
betrekking tot de interactie van de oraal ingenomen L. plantarum stammen met de
mens, zoals de dambarrière en de intestinale en systemische immuunactivatie. Van
beide mechanismen wordt tevens gedacht dat deze een rol spelen in de pathofysiologie
van PDS.
In hoofdstuk 5 en hoofdstuk 6 hebben we ons gericht op viscerale hypersensitiviteit, en
met name op de verschillen tussen normo‐ en hypersensitieve PDS‐patiënten. Hierbij
hebben we zowel gekeken naar klinische kenmerken van deze groepen als verschillen in
biologische markers. Viscerale sensitiviteit werd gemeten met behulp van een
elektronische barostat, gebruik makend van een rectale opblaasbare ballon. Uit onze
studies bleek dat de hypersensitieve PDS‐patiënten op veel gebieden vergelijkbaar zijn
met de normosensitive groep. Hypersensitieve PDS‐patiënten waren wel jonger, vaker
vrouw en gebruikten vaker SSRI‐medicatie. Echter, een multivariate logistische
regressie analyse laat zien dat alleen de jongere leeftijd geassocieerd is met de viscerale
hypersensitiviteit bij PDS‐patiënten. Er werden geen verschillen met betrekking tot
maag‐darmklachten, psychologische factoren, kwaliteit van leven, het gebruik van
Samenvatting
273
medicatie behoudens SSRIs, de duur van de klachten (gemeten als tijd sinds diagnose),
en leefstijlfactoren. Daarnaast bleken ook de concentraties van verschillende markers,
die gerelateerd zijn aan mogelijke onderliggende pathofysiologische mechanismen van
PDS, niet te verschillen tussen de normo‐ en hypersensitieve PDS‐patiënten. Deze
biomarkers waren calprotectine, humaan β‐defensine 2, chromogranine A en korte
keten vetzuren gemeten in feces, en plasma citrulline, serotonine en zijn metaboliet
5‐hydroxyindoleacetic zuur (5‐HIAA).
Samenvattend kan gesteld worden dat de resultaten van deze twee studies tonen dat
de demografische en klinische verschillen net als de verschillen in de gemeten
biomarker concentraties zeer beperkt zijn tussen normo‐ en hypersensitieve patiënten.
Desalniettemin dient benadrukt te worden dat het gebruik van intestinale provocatie‐
testen in experimentele studies met deze patiëntenpopulatie in de afgelopen decennia
tot unieke kennis heeft geleid wat betreft de mechanismen hoe viscerale pijn wordt
geregistreerd en wordt ervaren.
In hoofdstuk 7 hebben we serotonine (5‐HT) en 5‐HIAA concentraties gemeten in
trombocyten‐arm plasma en de ratio van de twee markers onderzocht in PDS‐patiënten
en gezonde controles. In deze studie werd ook specifiek aandacht besteed aan de PDS‐
subtypen. Er werden geen verschillen gevonden in 5‐HT concentraties tussen de
groepen, maar 5‐HIAA‐waarden bleken significant lager te zijn in PDS‐patiënten in
vergelijking tot gezonde controles. Eenzelfde resultaat werd gevonden voor de 5‐
HIAA/5‐HT ratio. Beide bevindingen bleven statistisch significant na correctie voor
potentiele confounders. Tevens ontdekten we dat de 5‐HIAA concentratie en de 5‐
HIAA/5‐HT ratio met name verlaagd waren in PDS‐patiënten met het subtype
gekenmerkt door een gemengd defecatiepatroon (IBS‐M). Geslacht bleek als enige van
de onderzochte parameters invloed te hebben op de waarden van de geteste
serotoninemarkers in PDS‐patiënten, terwijl geen effect werd gezien van maagdarm‐
klachten, angst en depressieve symptomen, leefstijlfactoren of het gebruik van
medicatie.
In deze studie hebben wij laten zien dat weliswaar de serotoninewaarden in plasma van
PDS‐patiënten, in bloed afgenomen bij alle proefpersonen in nuchtere toestand, niet
verschillen ten opzichte van gezonde controles, maar dat er wel verschillen zijn in
5‐HIAA en 5‐HIAA/5‐HT ratio tussen PDS‐patiënten en gezonde proefpersonen en dat
dit met name kenmerkend was voor het IBS‐M subtype. Dit kan erop wijzen dat
verstoringen in het serotoninemetabolisme een pathofysiologisch rol spelen in de
betreffende patiëntenpopulatie.
PDS is een op symptomen gebaseerde diagnose en symptoomscores worden gebruikt
voor follow‐up en het kwantificeren van therapie‐effecten. Samen met een veranderd
defecatiepatroon is buikpijn een belangrijk kenmerk van PDS. Op dit moment bestaat er
geen consensus over de beste methode voor het meten van buikpijn bij PDS‐patiënten.
274
In het tweede deel van dit proefschrift richten wij ons op verschillende methodes voor
het meten van buikpijn en andere gastrointestinale symptomen. Allereerst evalueerden
en vergeleken we in hoofdstuk 8 in een systematische review, de verschillende
methodes die beschikbaar zijn voor het meten van buikpijn bij PDS‐patiënten. We
hebben geconcludeerd dat er een grote verscheidenheid aan instrumenten wordt
gebruikt en dat dit de mogelijkheid beperkt om studieresultaten met elkaar te
vergelijken in meta‐analyses. Provocatietesten, zoals de rectale barostat, worden
frequent gebruikt in studies waarin PDS‐patiënten geïncludeerd worden en zijn nuttige
instrumenten voor het kwantificeren van een acute respons op een kunstmatig
opgewekte intestinale stimulus. De uitkomst van deze methoden correleren echter
slecht met de scores van chronische buikpijn in retrospectieve vragenlijsten.
Retrospectieve symptoommeting met behulp van papier of elektronische vragenlijsten
of dagboeken dragen het risico met zich mee van zogeheten recall‐ en ecologische bias.
Desalniettemin worden de algemene PDS‐vragenlijsten, met name de papieren versies,
nog zeer frequent gebruikt in studies en zijn ze eenvoudig voor zowel de patiënten als
de onderzoekers en zijn ze de best gevalideerde methoden voor het meten van gastro‐
intestinale symptomen in deze patiëntenpopulatie. Een nadeel is dat deze vragenlijsten
zich meestal alleen richten op de intensiteit van de pijn, en geen rekening houden met
fluctuaties over de tijd of factoren die pijn beïnvloeden. Een nieuwe methode in dit
vakgebied, de ‘Experience Sampling Method’ (ESM), kan een alternatief zijn en kan de
recall‐ en ecologische bias van retrospectieve vragenlijsten reduceren. Tevens biedt het
meer statistische power om verschillen te meten door de repetitieve en momentane
symptoommeting die de kern vormt van deze meetmethode. In hoofdstuk 9 presen‐
teerden wij de resultaten van een pilotstudie waarin we een standaard papieren
symptoomdagboek (ingevuld aan het einde van iedere dag), een vragenlijst die ingevuld
werd aan het einde van een week (de GSRS) en ESM‐scores (ingevuld zes tot tien maal
per dag gedurende een week) met elkaar vergeleken hebben. We vonden dat
buikpijnscores van de dagboeken hoger waren dan de gemiddelde scores van gemeten
met ESM gedurende dezelfde periode. Deze verschillen waren nog meer uitgesproken
toen we de ESM‐scores vergeleken met de GSRS‐scores. De resultaten toonden dat
PDS‐patiënten geneigd zijn de maximale pijn van de dag of de week onthouden en deze
rapporteren in retrospectieve vragenlijsten. Voor flatulentie, misselijkheid en opboeren
werden ook hogere scores gevonden in de dagboeken in vergelijking tot ESM, maar
deze waren minder uitgesproken in vergelijking tot buikpijn. In deze studie hebben we
ook laten zien dat ESM meer inzicht geeft in het verloop van gastrointestinale klachten
over de dag bij PDS‐patiënten. Deze methode biedt ook de mogelijkheid om potentiele
uitlokkende factoren van bijvoorbeeld buikpijn te identificeren en kan hierdoor leiden
tot een beter begrip van PDS‐symptomatologie.
Daar symptoomscores door diverse (subjectieve) factoren kunnen worden beïnvloed,
zouden betrouwbare biomarkers voor PDS een belangrijke bijdrage kunnen leveren in
Samenvatting
275
zowel het diagnostisch als follow‐up proces in deze patiëntenpopulatie. In het derde en
laatste deel van dit proefschrift richtten wij ons op het identificeren en valideren van
nieuwe biomarker sets voor PDS, correlatie met symptoomscores en de mogelijke
implicatie van een dergelijke biomarker set in de algemene populatie. Ondanks het feit
dat PDS een functionele maagdarmaandoening is, bestaat er steeds meer bewijs voor
een reeks van subtiele verschillen in diverse pathofysiologische factoren tussen PDS‐
patiënten en gezonde controles. Deze associaties bieden de mogelijkheid om multi‐
domein biomarker sets te ontwikkelen die PDS‐patiënten kunnen identificeren met een
betere specificiteit en sensitiviteit dan de op dit moment bestaande solitaire
biomarkers. Onze hypothese was dan ook dat een biomarkerset alleen dan goede
diagnostische waarden zal hebben als deze de multifactoriële en complexe etiologie
van PDS representeert. In hoofdstuk 10 hebben we daarom een reeks fecale en
bloedplasma‐biomarkers gemeten die allen een relatie hebben tot een bepaald domein
van darmgezondheid geassocieerd met PDS. Hiervoor hebben we gebruik gemaakt van
twee grote cohorten, namelijk een klinische PDS‐cohort met leeftijd‐ en geslacht‐
gematchte gezonde controles zonder maagdarmklachten, alsook een algemene
populatie‐cohort (Lifelines DEEP). Dit heeft geleid tot de identificatie van een biomarker
set van 8 markers, bestaande uit IL‐1β, IL‐6, IL12p70, TNF‐α, chromogranine A, humaan
β-defensine 2, calprotectine en het korte keten vetzuur caproaat. Deze biomarker set
had een sensitiviteit van 88% en specificiteit van 87% voor de discriminatie van PDS‐
patiënten versus gezonde controles. Vergelijkbare resultaten werden gevonden voor
alle PDS‐subtypen. Daarnaast bleek de biomarker set goed te correleren met
verschillende symptoomscores in zowel het PDS‐cohort alsook het algemene populatie‐
cohort.
In hoofdstuk 11 hebben we gekozen voor een holistische benadering. We hebben alle
vluchtige organische stoffen (VOC’s) gemeten in uitademingslucht van proefpersonen
uit de bovengenoemde twee cohorten. Een set van 16 VOC’s bleek het beste
onderscheid te kunnen maken tussen PDS‐patiënten en de gezonde controles met een
specificiteit van 89% en sensitiviteit van 73%. Ook in deze studie correleerde deze
nieuwe biomarker‐set goed met de ernst van gastrointestinale symptomen binnen de
twee cohorten.
Uiteraard is verder onderzoek en validatie nodig, maar de huidige bevindingen van deze
twee studies zijn belangrijke stappen in de richting van een op biomarkers gebaseerde
diagnose en follow‐up van PDS.
Tot slot gaven wij in hoofdstuk 12 een overzicht van de belangrijkste bevindingen in dit
proefschrift, werden de verschillende concepten geïntegreerd en voortbordurend op de
resultaten in dit proefschrift, presenteerden we nieuwe hypotheses voor vervolg‐
onderzoek op het gebied van PDS.

276

277
Valorisation addendum

278
Valorisation addendum
279
Valorisation addendum
With this thesis we aim to contribute to the true goal of medical research, that is to
improve our understanding of human physiology and pathology, but also to find new
approaches to improve and optimise healthcare. This thesis focused on a highly
prevalent functional gastrointestinal (GI) disorder, i.e. Irritable Bowel Syndrome (IBS).
IBS is associated with significant impact on patients’ quality of life as well as on societal
and health care costs. The studies we presented will add to further insight in the
pathophysiology of IBS and provide tools to improve diagnosis and patient monitoring.
IBS is the most commonly diagnosed GI condition,1 characterized by abdominal pain or
discomfort and altered bowel habits. Other GI symptoms such as bloating, flatulence,
nausea and belching, are also frequently reported by patients.2 Although the
prevalence of IBS varies geographically, a worldwide estimate of the prevalence is 11%,
which is comparable to findings in the Dutch population.3 Furthermore, IBS is more
common in women than in man, with a 2:1 ratio. The exact reasons for this female
predominance are not yet clear.4
Predominant symptoms and possible triggers vary between patients. Furthermore, in
most patients, IBS is a chronic relapsing disorder in which symptoms may vary during
the day as well as over time.5 Symptom burden in IBS patients can be considerable,
contributing to significant impairment of quality of life (QoL).6 This is found not only
when compared to the general population, but also in comparison with patients with
other medical conditions, such as diabetes mellitus and even end‐stage renal disease.7
The high symptom burden and impact on QoL has a negative impact on work
productivity. Therefore IBS is not only associated with significant healthcare costs but
also with overall costs to society. The estimated annual healthcare costs per newly
diagnosed IBS patient, for example, is up to 7.500 US dollar in the USA and ranges
between 500 and 1.000 US dollar in Europe. Cost to industry in Europe through
absenteeism and presenteeism related to IBS is estimated between 500 and 1000 US
dollar per patient annually.8
Solving the riddle of IBS starts with understanding the mechanisms from which
symptoms originate. The aetiology of IBS is complex, multifactorial and incompletely
understood. Several possible aetiological factors are found to be associated with IBS,
including intestinal (e.g. impaired intestinal barrier and altered microbiota composition
and activity) and brain‐derived factors (for example anxiety and depression) as well as
the interaction between the brain and the gut.9 Despite decades of scientific research
and rapidly improving knowledge in the field of neurogastroenterology and motility,
there is still much unclear with regard to the pathophysiology, the diagnostic process,
standard therapeutics and prognosis of IBS or subgroups thereof.10 The IBS patient
population is very heterogeneous. It is a syndrome based on a cluster of symptoms and
280
generally divided in 4 subgroups based on predominant bowel habits (i.e. diarrhoea,
constipating, a mix of both, or undefined). Therefore, it can be assumed that the main
pathophysiological mechanisms may differ between IBS patients and the efficacy of
therapies that target these mechanisms may differ per patient group. It is therefore of
utmost importance to gain more insight in the underlying pathophysiological
mechanism of IBS and to cluster patients in relevant subgroups. In the current thesis we
investigated several potential pathophysiological mechanisms of IBS and focused on
differences between groups of IBS patients.
As described in this thesis, the intestinal barrier function was found to be impaired
resulting in increased intestinal permeability. However, this was influenced by a large
number of host factors, such as use of medication. After adjustment for among others
medication use the intestinal permeability was only found to be increased in the small
bowel of the diarrhoea‐predominant subtype (IBS‐D). On one hand, these findings show
that it is very important to take variations in host factors into account when performing
mechanistic studies. On the other hand, this indicates that intestinal barrier function
may contribute to symptom generation by increased permeation of toxic substances
that may affect for example neuroendocrine and immune function, in IBS‐D patients
but not in other subtypes. A variety of agents have been demonstrated to improve and
restore disturbed barrier function in experimental studies. Recently, faecal microbiota
transplantation has been shown to re‐establish mucosal barrier function in animal
models,11 pointing to a role of the intestinal microbiota in maintenance of stable barrier
function. Furthermore, previous studies showed that the administration of living
bacteria into the gut lumen of healthy subjects affected the rearrangement of tight
junction proteins.12 In line with these findings, we have demonstrated that potentially
beneficial bacteria, i.e. different L. plantarum strains, may affect gene transcription
related to intestinal barrier function as well as the mucosal and systemic immune
system in healthy subjects in whom barrier function was disturbed by intake of non‐
steroidal anti‐inflammatory drugs (NSAIDs). However, whether such interventions have
potential clinical implication for IBS patients, especially in patients with IBS‐D, still has
to be investigated.
Furthermore, in this thesis we focused on other potentially affected biological
processes in IBS patients such as the serotonin metabolism and visceral perception.
Both are potential targets in future therapeutic interventions. The serotonin
metabolism plays an important role in the physiology of the GI tract. It is involved in
among others motility, secretion and sensitivity.13 We found that fasting serotonin
levels in blood plasma of IBS patients did not differ significantly when compared to
healthy controls, but interestingly, the principle metabolite of serotonin, i.e. 5‐HIAA,
was decreased in plasma samples of IBS patients. This was particularly pronounced in
the IBS subtype characterised by a mixed stool pattern (IBS‐M). Our finding may point
to the role of altered serotonin metabolism in this pathophysiology of this IBS subtype,
but more research is needed to investigate the association. Recently it has been shown
Valorisation addendum
281
that oral administration of 5‐HTP, the precursor to serotonin, induced significant
alterations in systemic serotonin metabolites that were accompanied by increased
visceroperception of pain in hypersensitive IBS patients.14 The presence of visceral hypersensitivity is a well‐known phenomenon in IBS patients. However, in what way IBS
patients with normal visceral perception differ from those with visceral
hypersensitivity, was unknown. In this thesis we have shown that hypersensitive IBS
patients, which comprise about 50% of the total IBS population, are younger when
compared to the normosensitive patients, but that other demographic characteristic,
and also the use of medication, life style factors and the level of psychological
symptoms do not differ between these two groups. Furthermore, the groups did not
differ with respect to faecal and plasma concentrations of several biomarkers. Since the
IBS patient population is very heterogeneous, it is of utmost importance to select
clinically relevant subgroups which can be treated by targeted interventions. However,
our findings indicate that dividing IBS patients based on visceral sensitivity may be less
relevant for daily clinical practice.
The diagnosis of IBS is symptom based using the Rome III criteria, in combination with
the exclusion of other organic causes if indicated. In the second part of the thesis, we
investigated tools to aid the diagnostic process and reliable symptom assessment in
IBS. As abdominal pain is a key‐symptom of IBS we provided a systematic overview of
the currently available methods to measure abdominal pain in IBS patients, but also
performed a pilot study to investigate an electronic momentary symptom (ESM)
assessment method, which is rather novel in the field of neurogastoenterology and
motility. Repeated symptom assessment at random moments during the day using a
digital tool, was found to be feasible and to provide more accurate and detailed insight
on symptoms scores and fluctuations during the day. Thereby, this tools may aid in
identifying triggers of symptoms in individual patients, which will be of great value to
implement more personalised treatment strategies. Based on our findings, the ESM
tool is currently being optimised for application in IBS and will be validated in a large
international multicentre study.
Finally, this thesis focused on the quest for new biomarkers in IBS. In two separate
studies we developed and validated two biomarker panels whit high sensitivity and
specificity for the discrimination between IBS patients and healthy controls without GI
symptoms. Both panels, a faecal and plasma biomarker panel and a panel consisting of
volatile organic compounds in exhaled air, were based on a combination of markers
reflecting several domains of gut health associated with the multifactorial aetiology of
IBS. Both could accurately discriminate between IBS and healthy controls and
furthermore did correlate with GI symptom scores. Such biomarker panels, if our
results are replicated in future studies, could benefit the diagnostic process of IBS, but
also provide more objective measures of treatment efficacy in intervention trials.
282
In summary, the current thesis contributed to the understanding of possible
aetiological mechanisms of IBS, which may be useful for more clinically relevant
subtyping of IBS patients and may lead to new targets for interventions. Furthermore,
we have provided an overview and evaluated new methods to assess abdominal pain in
IBS patients, which may lead to more uniform (therapeutic) outcome measures in
future IBS studies. This is of utmost relevance when comparing results and data
between studies. We have provided first clues for a potent alternative method of
symptom assessment in IBS patients. The development and validation of this tool is
currently ongoing. Finally, in this thesis we identified and validated new biomarker
panels for IBS patients, which may add to diagnosis and follow‐up of IBS. These findings
contribute to our knowledge on IBS, provide new tools for evaluating effects in
therapeutic trials in IBS and help to unravel and explore potential triggers and
environmental factors contributing to symptom generation.
Although at this moment a ‘cure’ for IBS is only an utopic future perspective, our rapidly
expanding knowledge in neurogastroenterology and motility will lead to better
treatment options in the near future and thereby will reduce patient discomfort and
economic burden of IBS for society.
Valorisation addendum
283
References
1. Chey WD, Kurlander J, Eswaran S. Irritable bowel syndrome: a clinical review. JAMA. 2015;313:949‐58. 2. Longstreth GF, Thompson WG, Chey WD, Houghton LA, Mearin F, Spiller RC. Functional bowel disorders.
Gastroenterology. 2006;130:1480‐91.
3. Canavan C, West J, Card T. The epidemiology of irritable bowel syndrome. Clin Epidemiol. 2014;6:71‐80. 4. Lovell RM, Ford AC. Effect of gender on prevalence of irritable bowel syndrome in the community:
systematic review and meta‐analysis. Am J Gastroenterol. 2012;107:991‐1000.
5. El‐Serag HB, Pilgrim P, Schoenfeld P. Systemic review: Natural history of irritable bowel syndrome. Aliment Pharmacol Ther. 2004;19:861‐70.
6. Simren M, Brazier J, Coremans G, Dapoigny M, Muller‐Lissner SA, Pace F, et al. Quality of life and illness
costs in irritable bowel syndrome. Digestion. 2004;69:254‐61. 7. Gralnek IM, Hays RD, Kilbourne A, Naliboff B, Mayer EA. The impact of irritable bowel syndrome on
health‐related quality of life. Gastroenterology. 2000;119:654‐60.
8. Canavan C, West J, Card T. Review article: the economic impact of the irritable bowel syndrome. Aliment Pharmacol Ther. 2014;40:1023‐34.
9. Camilleri M. Peripheral mechanisms in irritable bowel syndrome. N Engl J Med. 2012;367:1626‐35.
10. Grundmann O, Yoon SL. Irritable bowel syndrome: epidemiology, diagnosis and treatment: an update for health‐care practitioners. J Gastroenterol Hepatol. 2010;25:691‐9.
11. Li M, Liang P, Li Z, Wang Y, Zhang G, Gao H, et al. Fecal microbiota transplantation and bacterial
consortium transplantation have comparable effects on the re‐establishment of mucosal barrier function in mice with intestinal dysbiosis. Front Microbiol. 2015;6:692.
12. Karczewski J, Troost FJ, Konings I, Dekker J, Kleerebezem M, Brummer RJ, et al. Regulation of human
epithelial tight junction proteins by Lactobacillus plantarum in vivo and protective effects on the epithelial barrier. Am J Physiol Gastrointest Liver Physiol. 2010;298:G851‐9.
13. Gershon MD, Tack J. The serotonin signaling system: from basic understanding to drug development for
functional GI disorders. Gastroenterology. 2007;132:397‐414. 14. Keszthelyi D, Troost FJ, Jonkers DM, van Eijk HM, Dekker J, Buurman WA, et al. Visceral hypersensitivity
in irritable bowel syndrome: evidence for involvement of serotonin metabolism‐‐a preliminary study.
Neurogastroenterol Motil. 2015;27:1127‐37.

284

285
List of publications

286
List of publications
287
List of publications
Mujagic Z / Tigchelaar EF, Zhernakova A, Ludwig T, Ramiro‐Garcia J, Baranska A, Swertz
MA, Masclee AAM, Wijmenga C, van Schooten FJ, Smolinska A / Jonkers DMAE. A novel
gut health biomarker panel for irritable bowel syndrome and the application in the
general population. Submitted
Baranska A / Mujagic Z, Smolinska A, Dallinga JW, Jonkers DMAE, Tigchelaar EF, Dekens
J, Zhernakova A, Ludwig T, Masclee AAM, Wijmenga C, van Schooten FJ. Volatile
Organic Compounds in breath as marker for Irritable Bowel Syndrome: a metabolomic
approach. Submitted
Mujagic Z, Jonkers DMAE, Ludidi S, Keszthelyi D, Hesselink MA, Kievit RN, Althof JF,
Weerts Z, Kruimel JW, Schooten FJ, Masclee AAM. Biomarkers for visceral
hypersensitivity in patients with irritable bowel syndrome. Submitted
Mujagic Z, de Vos P, Boekschoten MV, Govers C, Pieters HJ, de Wit NJW, Bron PA,
Masclee AAM, Troost FJ. The effects of oral administration of three Lactobacillus
plantarum strains onintestinal barrier function and gene transcription in human small
intestinal mucosa; a randomized double‐blind placebo controlled trial. Submitted
de Vos P, Mujagic Z, de Haan BJ, Siezen RJ, Bron PA, Meijerink M, Wells J, Masclee
AAM, Boekschoten MV, Faas MM, Troost FJ. Differential human mucosal transcriptomic
and peripheral immune responses induced by three Lactobacillus plantarum strains;
insight into how bacteria contribute to immunity in healthy individuals consuming the
NSAID indomethacin. Submitted
Zhernakova A, Kurilshikov A, Bonder MJ, Tigchelaar EF, Schirmer M, Vatanen T, Mujagic
Z, Vich A, Falony G, Vleira‐Silva S, Wang J, Imhann F, Brandsma E, Medema‐
Jankipersadsing S, Cenit MC, Deelen P, Weersma RK, Feskens E, Netea M, Jonkers D,
Franke L, Aulchenko Y, Huttenhouwer C, Raes J, Hofker M, Xavier RJ, Wijmenga C, Fu J.
Population‐based metagenomics analysis reveals Chromogranin A as a marker for gut
microbiome composition and diversity. Submitted
Imhann F, Bonder MJ, Vila AV, Fu J, Mujagic Z, Vork L, Tigchelaar EF, Jankipersadsing SA,
Cenit MC, Harmsen H, Dijkstra G, Franke L, Xavier RJ, Wijmenga C, Jonkers DMAE,
Weersma RK, Zhernakova A. Proton Pump Inhibitors Affect the Gut Microbiome. Gut.
Accepted; in press
288
Thijssen AY / Mujagic Z, Jonkers DMAE, Ludidi S, Keszthelyi D, Hesselink MAM, Clemens
CM, Conchillo JM, Kruimel JW, Masclee AAM. Alterations in serotonin metabolism in
Irritable Bowel Syndrome. Alimentary Pharmacology & Therapeutics, 2015 Nov 5. [Epub
ahead of print]
Quetglas EG, Mujagic Z, Wigge S, Keszthelyi D, Wachten S, Masclee AAM, Reinisch W.
Update on pathogenesis and predictors of response of therapeutic strategies used in
inflammatory bowel disease. World Journal of Gastroenterology. Accepted; in press
Tigchelaar EF, Zhernakova A, Dekens JA, Hermes G, Baranska A, Mujagic Z, Swertz MA,
Muñoz AM, Deelen P, Cénit MC, Franke L, Scholtens S, Stolk RP, Wijmenga C, Feskens
EJ. Cohort profile: LifeLines DEEP, a prospective, general population cohort study in the
northern Netherlands: study design and baseline characteristics. BMJ Open. 2015;5:
e006772.
Mujagic Z, Keszthelyi D, Aziz Q, Reinisch W, Quetglas EG, De Leonardis F, Segerdahl M,
Masclee AAM. Systematic review: instruments to assess abdominal pain in irritable
bowel syndrome. Aliment Pharmacol Ther 2015;42:1064‐81.
Bodelier AG, Smolinska A, Baranska A, Dallinga JW, Mujagic Z, Vanhees K, van den
Heuvel T, Masclee AAM, Jonkers DMAE, Pierik MJ, van Schooten FJ. Volatile Organic
Compounds in Exhaled Air as Novel Marker for Disease Activity in Crohn's Disease: A
Metabolomic Approach. Inflamm Bowel Dis 2015;21:1776‐85.
Mujagic Z, Leue C, Vork L, Lousberg R, Jonkers DMAE, Keszthelyi D, Hesselink MA, van
Schagen TJ, van Os J, Masclee AAM, Kruimel JW. The Experience Sampling Method ‐ a
new digital tool for momentary symptom assessment in IBS: an exploratory study.
Neurogastroenterol Motil 2015;27:1295‐302.
Mujagic Z / Ludidi S, Keszthelyi D, Hesselink MA, Kruimel JW, Lenaerts K, Hanssen
NM, Conchillo JM, Jonkers DMAE, Masclee AAM. Small intestinal permeability is
increased in diarrhoea predominant IBS, while alterations in gastroduodenal
permeability in all IBS subtypes are largely attributable to confounders. Aliment
Pharmacol Ther 2014;40:288‐97.
Ludidi S / Mujagic Z, Jonkers DMAE, Keszthelyi D, Hesselink M, Kruimel J, Conchillo
J, Masclee AAM. Markers for visceral hypersensitivity in patients with irritable bowel
syndrome. Neurogastroenterol Motil 2014;26:1104‐11.
List of publications
289
Straetmans J, Vent J, Lacko M, Speel EJ, Huebbers C, Semrau R, Hoebers F, Mujagic
Z, Klussmann JP, Preuss SF, Kremer B. Management of neck metastases of unknown
primary origin united in two European centers. Eur Arch Otorhinolaryngol 2015;272:
195‐205.
Patent applications
European patent application nr. 14194725: Immunoassay for peripheral memory
T Cells. European patent application nr. 14194729: Immune stimulatory probiotic.
Inventors: De Vos P, Troost FJ, Mujagic Z, Faas MM. Date of filing: 25.11.2014
Awards and grants
FNM 2014 Guangzhou, China, “Young Investigator Award” for the study: IBS and over‐
reporting of abdominal pain in retrospective questionnaires: advantages of Experience
Sampling Method as new digital tool in symptom measurement.
Pélerin symposium 2014, Maastricht, “Nomination for the Pélerin science award” for
the study: Irritable Bowel Syndrome; from symptom to biomarkers based diagnosis.
UEGW 2014 Vienna, Austria, “Travel grant for one of best submitted abstracts” for the
study: The Experience Sampling Method ‐ a new digital tool for momentary symptom
assessment in IBS.
UEGW 2014 Vienna, Austria, “Oral Free Paper Prize” for the presentation: Symptoms in
patients with functional GI disorders.
DDW 2014, Chicago, USA, “Poster of distinction” for the study: Gut permeability in IBS
is site‐specific, subtype‐dependent and affected by confounders.

290

291
Dankwoord

292

Dankwoord
293
Dankwoord
Volgens sommigen is dit het belangrijkste hoofdstuk van het proefschrift. Ik weet niet
of ik het daarmee eens ben, maar het is in ieder geval wel het meest gelezen deel van
dit boek. Daarom wil ik ook meteen van deze gelegenheid gebruik maken. Voordat jullie
het dankwoord lezen, wil ik jullie verwijzen naar hoofdstuk 1 t/m 12, alwaar jullie de
laatste wetenschappelijke inzichten kunnen vinden met betrekking tot het prikkelbare
darmsyndroom.
Na jaren werk, drie en een half jaar full time en heel veel uren naast de klinische
werkzaamheden, kan ik nu eindelijk beginnen aan dit belangrijke hoofdstuk. Er zijn veel
mensen die een bijdrage geleverd hebben aan mijn promotieonderzoek en mijn
ontwikkeling in de afgelopen jaren. Niet iedereen kan ik hier noemen, omdat de lijst te
lang zou worden, maar een aantal wil ik in dit dankwoord toch nadrukkelijk bedanken.
Allereerst, de persoon die het meeste ‘te lijden’ heeft gehad onder mijn volharding om
toch zo veel mogelijk uit mijn promotietijd te halen. En tegelijk de persoon die mij het
meeste hierin gesteund heeft.
Lieve Eveline, graag wil ik je bedanken voor het regelen van het promotiefeest en het
drukwerk. Maar ik wil je met name bedanken voor je begrip in de afgelopen jaren. Je
accepteerde mijn lange werkdagen en weekenden achter de laptop en je steunde me in
al mijn nieuwe ideeën. Op de een of andere manier zorgde je er altijd voor dat het
werkte, dat we altijd tijd vonden voor elkaar en dat ik energie had om weer een nieuwe
studie te starten. Door jou kon ik er zeker van zijn dat hoe stressvol een dag ook was ik
altijd thuis een glimlach op mijn gezicht kreeg als ik je zag. In het laatste jaar van mijn
promotietijd heb je er dan ook nog (mede) voor gezorgd dat ik thuis niet een, maar
zelfs twee prachtige dames kon verwachten na de werkdag. En ondanks dat kleine
Amila het dagelijks leven een stuk drukker maakte, heeft ze me zoveel meer
levensvreugde en geluk gebracht.
Draga majka, dragi tata, zonder jullie was dit nooit gelukt! Jullie opvoeding heeft ervoor
gezorgd dat het belang van kennis, opleiding, inzet en een positieve instelling in het
leven aan mij al vanaf de jonge jaren duidelijk was. Jullie hebben mij altijd gesteund en
jullie hebben altijd laten blijken hoe trots jullie zijn. Ik weet dat jullie heel wat in jullie
leven hebben moeten opgeven om ervoor te zorgen dat ik een opleiding aan de
universiteit kon volgen en daar blijf ik jullie altijd dankbaar voor!
Het was zwaar voor jullie om met vier kinderen, waarvan twee nog zeer jong, na jaren
van oorlog, een nieuw leven te moeten opbouwen. En dat zonder eigen bezittingen,
zonder onderdak of werk in een land met een andere cultuur en een andere taal. En
toch is het jullie, met wat hulp van goede mensen, gelukt om snel jullie draai te vinden
en een nieuw bestaan te realiseren. Jullie hebben ervoor gezorgd dat wij nooit iets te

294
kort kwamen en dat er een toekomst was waar we naar toe konden werken. Nu alle
vier de kinderen volwassen zijn, hun eigen leven leiden en hard werken aan hun
carrière, kunnen jullie van het welverdiende pensioen genieten. Alhoewel, er zijn
natuurlijk tegenwoordig wel enkele kleinkinderen waar jullie soms je handen aan vol
hebben.
Dragi Satko i Nacko, uiteraard horen jullie namen bij de belangrijkste personen die in dit
dankwoord voor moeten komen. Ik heb altijd twee grote broers gehad naar wie ik op
kon kijken. Mijn twee grote idolen die hun puberjaren zijn kwijtgeraakt door de
moeilijke jaren ’90, maar desondanks zo veel wisten te bereiken in hun leven. Jullie
hebben me laten zien dat hard werken loont. Daarnaast heb ik uiteraard jullie
‘regelmatige financiële hulpverlening’ ook zeer gewaardeerd. En daarnaast heb ik aan
jullie ook drie geweldige nichtjes, Anisa, Lejla en Mila, te danken en daarmee ook de
belangrijke titel ‘striko’.
Draga Zlata, wij zijn altijd een team geweest. Ook al denken veel mensen dat ik
voornamelijk op jou gepast heb, denk ik dat jij veel meer voor mij hebt betekend. Onze
ouders hebben ons niet voor niets een gelijkklinkende naam gegeven. Mijn kleine zusje,
die altijd voor me klaar stond, die er altijd was, en die destijds als 12‐jarige in grote
spanning mijn toelatingsbrief tot de Universiteit van Maastricht afwachtte, omdat ze
bang was dat ik eventueel ver weg zou gaan studeren. En toen, toen de brief eindelijk
kwam, en jij even alleen thuis was: de brief opende, maar niet begreep wat er in de
brief stond en of je grote broer nou in Maastricht mocht studeren of niet.
Tegenwoordig werken we zelfs samen in het azM, en geniet ik regelmatig van onze
gesprekken carpoolend naar het werk. Ik ben blij dat ik zo een lief zusje heb.
Lieve Marleen, Lou en jij hebben mede mijn leven bepaald in het afgelopen decennium.
Graag had ik ook Lou erbij gehad tijdens mijn promotie. Ik weet hoeveel plezier hij
haalde uit het feit dat Eveline, maar ook ik, het zo goed deden op de universiteit. En net
als jij, heeft hij zijn trots vaak laten blijken. We zijn gegroeid tot een hechte familie en je
steun voor Eveline en mij in de afgelopen jaren waardeer ik zeer. Je bent een lieve oma
voor Amila en je helpt ons graag. Bij dezen wil ik je dan ook ontzettend bedanken voor
alles wat je gedaan hebt.
En dan natuurlijk het MDL‐onderzoeksteam. Stuk voor stuk harde werkers, maar met
name fantastische collega’s. Als eerste begin ik met mijn paranimfen, Tim en Mark.
Tim, ik heb toch enkele jaren een kantoor met je mogen delen. En ondanks je ‘zwakke
voetbalkwaliteiten’ heb ik veel plezier gehad op UNS 40, niveau 5, ruimte 5.567. Ik
schrijf dit bewust zo specifiek op, omdat ik weet dat je zelfs na al die jaren je exacte
locatie in het universiteitsgebouw niet kan noemen. Ik heb je leren waarderen als
onderzoeker, als collega en vriend, maar ook als filosoof. Tussen de wetenschappelijke

Dankwoord
295
discussies door heb ik altijd genoten van onze gesprekken over de politiek, de
maatschappij, maar ook uiteraard sport.
Mark, we kennen elkaar al vanaf de eerste onderwijsgroep in de zomer van 2004. En
toen al konden we goed opschieten. In 2011 heb ik gesolliciteerd bij MDL in Maastricht
en kon ik er uiteraard op vertrouwen dat jij een goed woordje voor me deed, alvorens
ik bij prof. Masclee, Yolande Keulemans en later bij Freddy op sollicitatiegesprek mocht
verschijnen. We hebben tijdens onze gezamenlijke promotietijd veel leuke momenten
meegemaakt, van de clubs in Florida tot uiteraard de onvergetelijke Club Moustache‐
party’s.
Heren, ik ben blij dat jullie het paranimfschap hebben aanvaard!
Daarnaast zijn er nog een paar collega’s die ik hier uitdrukkelijk wil noemen.
Allereerst Samefko. Als IBS‐duo hebben we samen een belangrijke bijdrage geleverd
aan de opbouw van het Maastricht IBS cohort, en hebben we samen met andere
collega’s een mooie basis gelegd voor verder wetenschappelijk onderzoek in Maastricht
op dit gebied. Ik herinner me nog een van de eerste dagen op het werk, met al een berg
opdrachten en mijn minimale wetenschappelijke kennis. Je kwam op mijn kantoor en
zei: “We zijn hier een team, dus probeer vooral niet het wiel zelf uit te vinden. Je mag
me storen met vragen wanneer je maar wilt.” En je hebt je aan je woord gehouden. Van
het uitvoeren van de barostat tot de Mann‐Whitney U‐test, ik heb veel van je mogen
leren. En bovenal, ik heb met veel plezier met je samengewerkt. Bedankt!
Dan mijn twee andere roomies. Steven, ik ken je nog als coassistent in Roermond, waar
ik als zaalarts werkte op de afdeling. Jij was de gedreven student die toen al wist dat hij
MDL‐arts ging worden. Later, bij MDL in Maastricht, werden we kantoorgenoten. Met
jou en Tim op de kamer heb ik een geweldige onderzoekstijd gehad. Het was altijd
gezellig en we vonden zelfs tijd om een ‘betaald voetbalcompetitie’ op te zetten, maar
dat betekende niet dat er niet hard gewerkt werd. Hoe vaak hebben we niet samen
naar een bepaalde zin in een artikel van een van ons getuurd en deze tien keer
veranderd, totdat we het erover eens waren dat het zo goed was. Bedankt voor je
gezelligheid en je collegialiteit!
Elhaseen, de rustige man uit Soedan, die geweldige humor bleek te hebben. Met een
mix van Engels en Nederlands wist je altijd op de meest onverwachte momenten de
beste opmerkingen te maken. Graag wil ik je ook bedanken voor je hulp bij
laboratoriumwerkzaamheden. Je uitgebreide kennis op dit gebied was onmisbaar in het
eerste jaar van mijn promotie.
Dan Daniel, de andere collega met de moeilijke achternaam. Al vanaf het begin kon ik je
goedbedoelde ‘gemopper’ waarderen. Je bent collegiaal en ik heb zeer veel van je
geleerd. Je onuitputtelijke kennis over de laatste publicaties kwam meer dan eens goed
van pas. Aan verschillende artikelen in dit proefschrift heb je een belangrijke bijdrage
geleverd en ik ben je daar zeer dankbaar voor. Al jaren werk je er hard aan om
Maastricht op de neurogastro‐enterologische wereldkaart te zetten en je boekt goede

296
vooruitgang. Van onze autotour naar Nantes naar het lab van Michel Neunlist, heb ik
genoten. Helaas is er geen wetenschappelijk vervolg op gekomen, maar wie weet. Na
de promotie heb ik toch weer wat tijd te vullen.
Fedde, onze one‐and‐only mister Nicolaas, ik heb graag met je samengewerkt en het
blijft toch jammer dat je naar het noorden bent getrokken. Ik heb altijd graag met je
gediscussieerd over zaken als mastcelstabilisatoren, gevoetbald en gefeest. Met o.a.
Maarten en dr. G. – Givan hebben we een goede tijd in Orlando gehad. Een nieuwe
reünie gaat er zeker komen.
Uiteraard mag ik de feestbeesten van de MDL niet vergeten. Chanti (Chantal) en Furby
(Bouke), jullie wisten van iedere gelegenheid een goed feest te maken. Maar ook op de
werkvloer hebben jullie verhalen de werkdagen een stuk leuker gemaakt. Volgens mij
was de toevoeging van Roel, met zijn geweldige droge opmerkingen, aan jullie kantoor
ook een goede aanvulling hierop.
Dan uiteraard Freddy. Ik ben je zeker dank verschuldigd voor alle hulp en begeleiding
tijdens mijn eerste jaar als onderzoeker in Maastricht, maar ook voor de gezellige
gesprekken en de borrels en barbecues in de jaren daarna.
Martine, graag wil ik jou bedanken voor al het geduld en werk dat je steekt in de
opbouw van het MIBS cohort, je hulp met de data, maar ook voor je vaak relativerende
woorden op allerlei ‘grote’ problemen waar ik door de jaren tegenaan liep.
Helaas kan ik niet over iedereen een lang verhaal schrijven, want dan wordt het wel
een heel lang dankwoord, maar Marin, Bas, Kirsten Pijls, Kirsten van der Beek, Ellen,
Pauline, Annick, Roy, Anke, Selwyn, Dirk, Irene, Harm‐Jan, Esther, Mariëlle, Eveline,
Montserrat, Fabienne, Sander, Danyta en uiteraard het droomduo Lisa en Zsa Zsa,
graag wil ik jullie bedanken voor de samenwerking, de leuke lunchgesprekken, de
werkfeesten en jullie hulp in de afgelopen jaren. Corinne, tegenwoordig de fantastische
collega op B5, wil ik natuurlijk graag apart bedanken voor de gezelligheid tijdens mijn
onderzoekstijd. We moeten trouwens nog steeds samen het IBS‐IBD‐FFQ‐artikel
schrijven.
Tevens ben ik dank verschuldigd aan de UM onderzoeksschool NUTRIM, en met name
aan prof. Annemie Schols en Sef Janssen, voor het raamwerk waarin ik mijn
promotieonderzoek heb mogen uitvoeren.
Daarnaast wil ik ook alle clinici bedanken die hun steen bij hebben gedragen aan de
patiëntinclusies en de studie‐endoscopieën. Allereerst de MDL‐artsen, naast prof.
Masclee ook José Conchillo, Rogier De Ridder, Wim Hameeteman, Ger Koek, Silvia
Sanduleanu, Marieke Pierik, Yolande Keulemans en Joanna Kruimel, bedankt voor jullie
begeleiding en hulp. Uiteraard wil ik hier ook de arts‐assistenten (van toen) noemen:
Jeoffrey, Michel, Chantal, Frank, Jos, Paul, Bram, Reggy, Linda, Tamara, Gerben en
Maarten. Annemieke wil ik apart bedanken, mede voor de goede samenwerking op o.a.
het serotonine artikel, met uiteindelijk een mooi resultaat.

Dankwoord
297
Natuurlijk niet te vergeten, Ton Mestrom en zijn endoscopieteam, de collega’s van de
functiekamer, Pierre, Ria en Nicole, maar ook Yvan, Henny, Mia en Andrea. En uiteraard
Mietsie en Elly. Altijd een glimlach en altijd een oplossing voor al mijn kleine
problemen. Tot slot wil ik ook heel graag Tiny bedanken voor alle logistieke hulp
gedurende mijn onderzoekjaren, maar met name voor de hulp bij de lay‐out van dit
proefschrift!
Iedereen binnen de MDL‐afdeling, hartelijk bedankt voor jullie steun!
Graag wil ik ook alle collega’s van TiFN bedanken. Het is een fantastische organisatie die
bijzondere kansen biedt aan jonge onderzoekers. Ik heb via TiFN met veel interessante
mensen mogen samenwerken en sommigen wil ik hier nog nadrukkelijk noemen. Met
name wil ik het team van project GH001 bedanken: naast Daisy en Frederik‐Jan, ook
Jackie (bedankt voor je enthousiasme), Cisca (bedankt voor je leiding), Ettje en Sasha
(bedankt voor de goede samenwerking), maar ook Gerben, Edith, Hauke, Jan, Javier,
Erwin, Mark‐Jan en Morris. Agi (Agnieszka Smolinska) en Agnieszka Baranska wil ik
apart noemen. Dames, bedankt voor de goede samenwerking en collegialiteit, de
statistische lessen en de gezelligheid in de trein naar de TiFN meetings. Ondanks, maar
waarschijnlijk juist dankzij, de grote verscheidenheid in achtergronden van de leden van
het TiFN‐projectteam en daardoor vaak verschillen in opvattingen, is dit een topteam
geweest. Het project heeft wetenschappelijk reeds veel bereikt en ik denk dat menig
onderzoeker de komende jaren de vruchten kan plukken van ons werk binnen GH001.
Ik ben blij dat ik hier deel van mocht uitmaken! And of course I would like to thank the
experts. Arjen, Thomas, Gabriela, Annick, Clara, Thomas, Anja, Joseph and Kathy, thank
you for your input and support!
Tevens wil ik ook Marjolein, Jerry, Coen, Nicole, Mark, Peter en Roger bedanken voor
de hulp bij de probiotica‐studies. En uiteraard Paul, ondertussen prof. De Vos, bedankt
voor je vertrouwen in mij en voor je hulp. Ik ken niemand die sneller zijn mails
beantwoord, maar ook altijd inhoudelijk een goed antwoord heeft. Daarnaast wil ik je
ook bedanken voor de gezellige diner‐ en baravonden bij TiFN.
Joanna Kruimel en Carsten Leue wil ik graag bedanken voor de hulp bij de ESM‐studie,
maar ook met name voor alle leermomenten over de psychosomatiek, het onderwerp
dat zo belangrijk is binnen de functionele maagdarmaandoeningen. Ik vond het een
zeer prettige samenwerking. Ik vind het jammer dat ik de MPU‐trial niet heb kunnen
afronden samen met jullie, maar ik weet zeker dat de komende jaren daar nog
prachtige data uit gaan rollen. In dit kader bedank ik ook prof. Jim van Os, Richel
Lousberg, maar ook Truda Driessen voor de praktische, statistische en inhoudelijke
bijdrage en hulp bij het ESM‐project.
Ook prof. Jean Muris ben ik dank verschuldigd voor de vruchtbare samenwerking met
de huisartsen in regio Maastricht.

298
I would like to thank the ‘non‐Maastricht members of abdominal pain team’: among
others Emilio Quetglas, Francesco De Leonardis, Märta Segerdahl, prof. Qasim Aziz and
Walter Reinisch.
Bij de MDL ben ik terecht gekomen mede door het enthousiasme van de MDL‐artsen in
het Laurentius ziekenhuis te Roermond. Daarom wil ik graag Paul Bus, Eric de Goede en
Guido Houtmeyers bedanken, maar bovenal ben ik in dit kader dank verschuldigd aan
Susan Toebosch voor haar vertrouwen, steun, de vele leermomenten en de liefde voor
het vak die ze goed weet over te brengen.
Tevens wil ik ook prof. Bernd Kremer, Ernst‐Jan Speel en Jos Straetmans bedanken voor
de begeleiding tijdens mijn wetenschapsstage in 2010 en mijn eerste leermomenten
binnen de medische wetenschap.
Gedurende mijn onderzoeksjaren heb ik met veel plezier veel studenten mogen
begeleiden, die tevens een bijdrage hebben geleverd aan dit proefschrift. Caroline
Botterweck, Charlotte Bruijsten, Esther Jansen, Hanan Rachid, Jeroen van den Akker,
Jory Molema, Ruud Kiviet, Ruud Verhees, Vico Leeters, Tiny Castermans, Vicky Weel,
Reman Shaker, Thirza van Schagen, Wesam Moafa, Michaela Höhn, Zoë van Lierop,
Jessica Althof en uiteraard de tegenwoordig gewaardeerde collega’s Zsa Zsa Weerts en
Lisa Vork, allen bedankt voor jullie hulp!
In de verschillende studies in dit proefschrift heb ik data van honderden proefpersonen
verwerkt, zowel van PDS‐patiënten als mensen zonder gezondheidsklachten. Zonder de
bereidwillendheid van al deze mensen om een bijdrage te leveren aan de medische
wetenschap was ook dit proefschrift er nooit geweest. Daarom ben ik met name jullie
enorme dank verschuldigd voor jullie deelname.
De leden van de beoordelingscommissie, te weten prof. dr. Dejong (voorzitter), prof. dr.
Schols, prof. dr. Spiller, prof. dr. Steinbusch en dr. Van der Veek, wil ik graag bedanken
voor de evaluatie van dit proefschrift.
Aan het einde van dit dankwoord wil ik diegenen bedanken die het meest bijgedragen
hebben aan dit proefschrift. Ik had de eer om mijn promotieonderzoek uit te voeren
onder supervisie van mijn copromotor dr. Daisy Jonkers en mijn promotoren prof. dr.
Frederik‐Jan van Schooten en prof. dr. Ad Masclee.
Beste Daisy, ik had me geen betere copromotor kunnen voorstellen. Zonder jouw
begeleiding en input had ik dit proefschrift nooit kunnen schrijven. Je hebt een brede
kennis, je methodologisch inzicht is geweldig, maar bovenal ben je een kei in het
begeleiden van jonge onderzoekers. Je straalt vertrouwen uit, en je hebt je best gedaan
om me te helpen bij alle kleine en grote wetenschappelijke, praktische en
Dankwoord
299
privéproblemen die gedurende mijn promotietijd ontstonden. Waar ik me nog steeds
over verbaas, is je gave om kritiek als een compliment te brengen. Zelfs je ‘track
changes’ in Microsoft Word zijn blauw i.p.v. rood, zodat het aardiger overkomt. Ik ben
blij dat je mijn supervisor bent geweest! Bedankt voor alles!
Dan prof. Van Schooten, beste Frederik‐Jan, als tweede promotor bent u iets minder
nadrukkelijk betrokken geweest bij mijn alledaagse werkzaamheden. Desondanks hebt
u een belangrijke bijdrage geleverd aan dit proefschrift. Uw wetenschappelijke en
organisatorische kwaliteiten kwamen regelmatig van pas en ik heb veel van u mogen
leren. Daarnaast was u altijd een gezellige gesprekspartner, ook als het niet over de
wetenschap ging. Bedankt voor al uw hulp en de goede begeleiding!
En uiteraard als laatste in dit hoofdstuk; prof. Masclee, beste Ad, toen ik in 2011 aan
tafel in uw kantoor zat tijdens mijn sollicitatiegesprek wist ik niet dat ik het komende
decennium onder uw leiding zou gaan werken. Die dag dacht ik dat, als ik aangenomen
wordt, het wel pittige jaren zouden worden met zo een strenge baas. Dat was
tenminste de eerste indruk. Het tegendeel is waar. U bent betrokken, eerlijk en
duidelijk. U stond altijd voor me klaar als het nodig was. Het was geen uitzondering dat
ik een deadline moest halen voor een abstract of een artikel en dat ik uw commentaren
om half 8 op zondagochtend via mail binnenkreeg. Ik heb u ontzettend leren waarderen
als supervisor. Uw gedrevenheid en liefde voor het medische vak en de wetenschap is
inspirerend. Uw expertise binnen de neurogastro‐enterologie en motiliteit heeft dit
proefschrift gevormd. Graag wil ik u bij dezen dan ook bedanken voor alle hulp, de
goede begeleiding en steun in de afgelopen jaren. Ik verheug me op de klinische
werkzaamheden onder uw supervisie de komende jaren.

300

301
Curriculum vitae

302
Curriculum vitae
303
Curriculum vitae
Zlatan Mujagić was born on the 26th of June 1985 in Prijedor, Bosnia and Herzegovina.
In October 1994 he emigrated to the Netherlands, where he finished primary and
secondary school in the municipality of Stein. In 2004, he started his medical education
at Maastricht University. He has received his bachelor and master degree in 2007 and
2010, respectively. During this study period he spent one semester at the
Otorhinolaryngology clinic of the University Clinical Centre Sarajevo. He completed his
scientific internship at the department of Otorhinolaryngology at the University
hospital of Maastricht and the department of Molecular Cell Biology at the at
Maastricht University, studying the relation between the human papilloma virus and
head and neck cancer of unknown primary origin. After obtaining his medical degree,
he started working at the departments of Internal Medicine and Gastroenterology‐
Hepatology at the Laurentius hospital Roermond. One year later he started as PhD‐
fellow at the division Gastroenterology‐Hepatology, department of Internal Medicine,
Maastricht University Medical Center+ (MUMC+), under the supervision of Dr. D.
Jonkers, Prof. dr. FJ van Schooten and Prof. dr. A. Masclee. The research was performed
within NUTRIM School of Nutrition and Translational Research in Metabolism
(Maastricht University) and in part funded by the Top Institute for Food and Nutrition
(TIFN), Wageningen. At the 1st of December 2014, he started his residency
Gastroenterology‐Hepatology under supervision of Prof. dr. A. Masclee and is currently
working at the department of Internal Medicine at the MUMC+ under supervision of
Prof. dr. C. Stehouwer. Zlatan is married to Eveline and they live together with their
daughter Amila.

304


