Embed Size (px)
Citation preview
IJRET: International Journal of Research in Engineering and Technology eISSN: 2319-1163 | pISSN: 2321-7308
_______________________________________________________________________________________________ Volume: 05 Issue: 09 | Sep-2016, Available @ http://ijret.esatjournals.org 129
IRS R2-LISS IV SATELLITE IMAGE ANALYSIS FOR MAPPING LITHOLOGICAL, GEOMORPHOLOGICAL, DRAINAGE AND STRUCTURAL FEATURES ALONG THE KALWAKURTHY –
NALGONDA-HUZURNAGAR PROFILE, TELANGANA STATE, INDIA G. Udaya Laxmi1, K. Narsimha2, Linga Swamy Jogu3, Telu Raju4, G.Ramadass5
1Department of Geophysics, Osmania University, Hyderabad -500007 [email protected]
2Department of Geology, Osmania University, Hyderabad -500007 3Department of Geophysics, Osmania University, Hyderabad -500007 4Department of Geophysics, Osmania University, Hyderabad -500007 5Department of Geophysics, Osmania University, Hyderabad -500007
Abstract
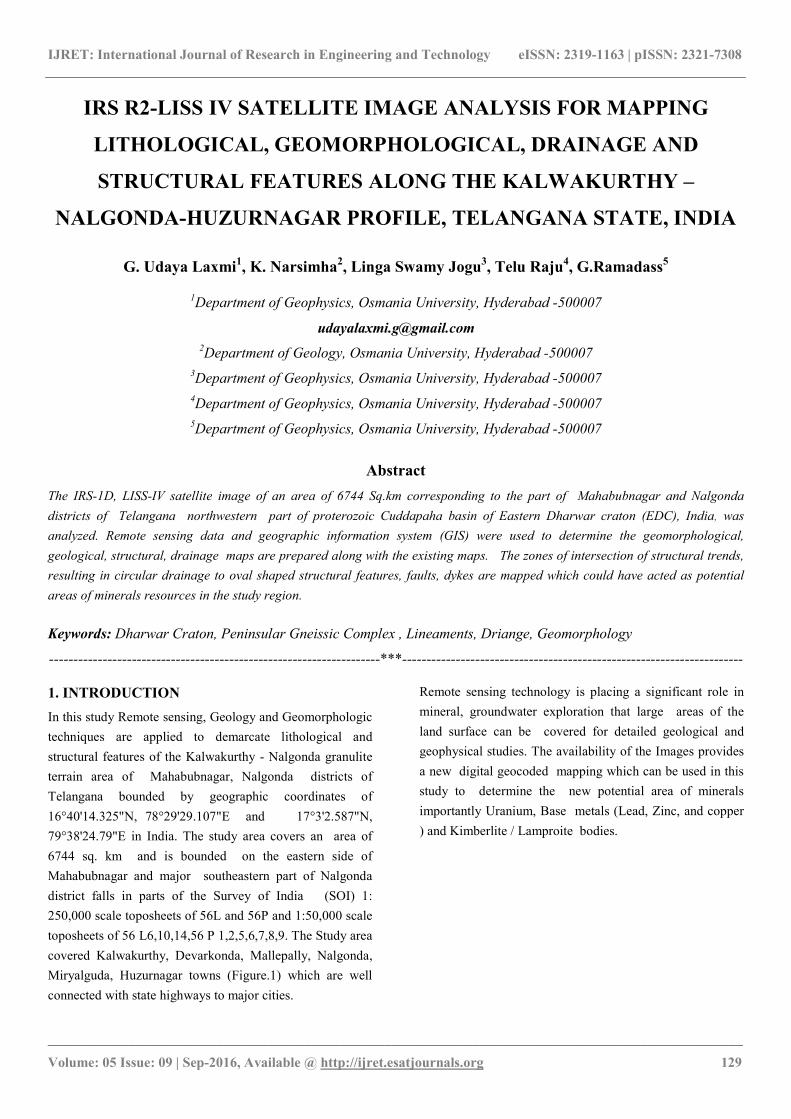
The IRS-1D, LISS-IV satellite image of an area of 6744 Sq.km corresponding to the part of Mahabubnagar and Nalgonda districts of Telangana northwestern part of proterozoic Cuddapaha basin of Eastern Dharwar craton (EDC), India, was analyzed. Remote sensing data and geographic information system (GIS) were used to determine the geomorphological, geological, structural, drainage maps are prepared along with the existing maps. The zones of intersection of structural trends, resulting in circular drainage to oval shaped structural features, faults, dykes are mapped which could have acted as potential areas of minerals resources in the study region. Keywords: Dharwar Craton, Peninsular Gneissic Complex , Lineaments, Driange, Geomorphology --------------------------------------------------------------------***---------------------------------------------------------------------- 1. INTRODUCTION In this study Remote sensing, Geology and Geomorphologic techniques are applied to demarcate lithological and structural features of the Kalwakurthy - Nalgonda granulite terrain area of Mahabubnagar, Nalgonda districts of Telangana bounded by geographic coordinates of 16°40'14.325"N, 78°29'29.107"E and 17°3'2.587"N, 79°38'24.79"E in India. The study area covers an area of 6744 sq. km and is bounded on the eastern side of Mahabubnagar and major southeastern part of Nalgonda district falls in parts of the Survey of India (SOI) 1: 250,000 scale toposheets of 56L and 56P and 1:50,000 scale toposheets of 56 L6,10,14,56 P 1,2,5,6,7,8,9. The Study area covered Kalwakurthy, Devarkonda, Mallepally, Nalgonda, Miryalguda, Huzurnagar towns (Figure.1) which are well connected with state highways to major cities.
Remote sensing technology is placing a significant role in mineral, groundwater exploration that large areas of the land surface can be covered for detailed geological and geophysical studies. The availability of the Images provides a new digital geocoded mapping which can be used in this study to determine the new potential area of minerals importantly Uranium, Base metals (Lead, Zinc, and copper ) and Kimberlite / Lamproite bodies.
IJRET: International Journal of Research in Engineering and Technology eISSN: 2319-1163 | pISSN: 2321-7308
_______________________________________________________________________________________________ Volume: 05 Issue: 09 | Sep-2016, Available @ http://ijret.esatjournals.org 130
Figure 1. Base map of the Study area Telangana State 2. AREA SELECTION In targeting a region for exploration (Helmstaedt and Gurney, 1995) for Uranium and Kimberlite deposits ,the following points are to be considered. 1. The Possibility of the area to contain minerals on the
basis of tectonic correlation. 2. The occurrence of known minerals i.e. Uranium, base
metals Kimberlites /Lamproites or related intrusive bodies in the near vicinity.
3. Known occurrence of Lamproites in the surrounding area.
4. Structural control of Lineaments As it possible for Satellite image analysis to examine the regional structural features of the study area in this paper the same was explained to understand the structural features of the region.
3. DATA BASE The data have been collected from NRSC, Hyderabad and freely available on the net source. The primary data collected by Survey of India (SI) topo sheets at the scale of 1:50,000 (topo sheet s No. 56L/6,10,14 and 56 P/1,2,5,6.7,8,9) and 1.250,000 ( topo sheets No. 56L and 56 P ) and multispectral Satellite Imagery of the IRS-R2 and LISS–IV, resolution 5.8 metres path - row:100-61b (left part); and 101-61c(right side) (merged two images), January 2013 of study region. The present work consists of an investigation of Kalwakurthy, Nalgonda, Miryalguda, Huzurnagar areas
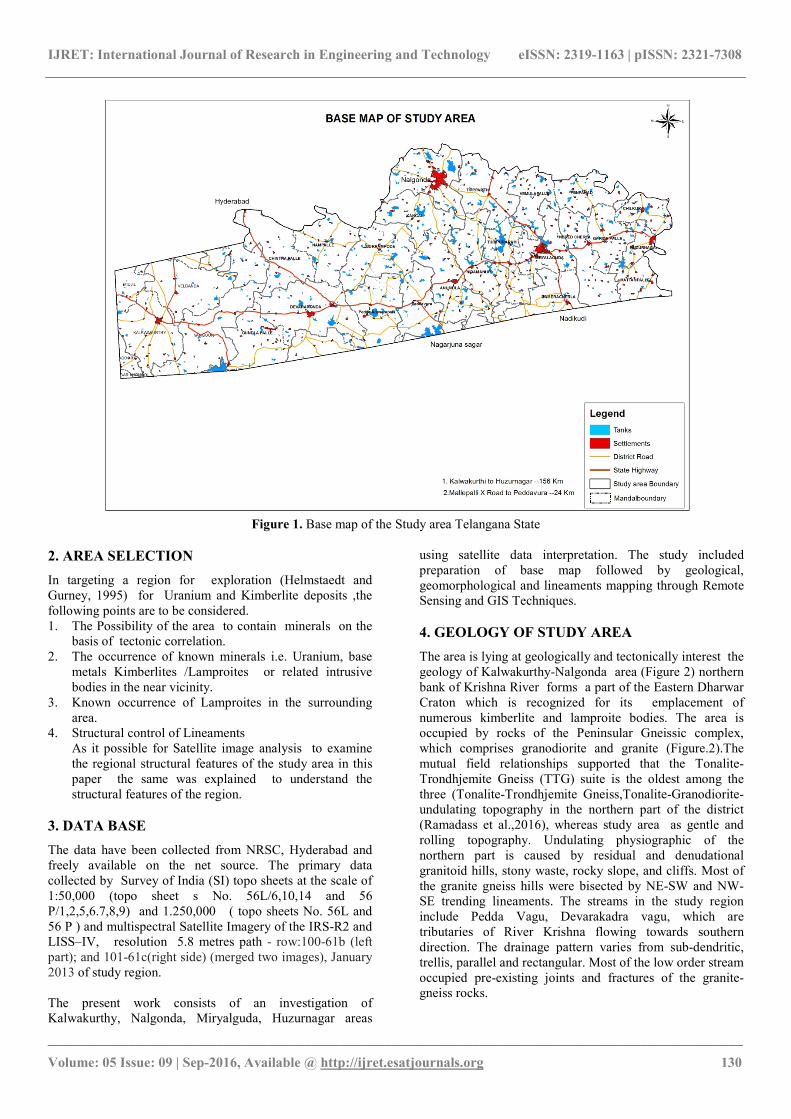
using satellite data interpretation. The study included preparation of base map followed by geological, geomorphological and lineaments mapping through Remote Sensing and GIS Techniques. 4. GEOLOGY OF STUDY AREA The area is lying at geologically and tectonically interest the geology of Kalwakurthy-Nalgonda area (Figure 2) northern bank of Krishna River forms a part of the Eastern Dharwar Craton which is recognized for its emplacement of numerous kimberlite and lamproite bodies. The area is occupied by rocks of the Peninsular Gneissic complex, which comprises granodiorite and granite (Figure.2).The mutual field relationships supported that the Tonalite-Trondhjemite Gneiss (TTG) suite is the oldest among the three (Tonalite-Trondhjemite Gneiss,Tonalite-Granodiorite- undulating topography in the northern part of the district (Ramadass et al.,2016), whereas study area as gentle and rolling topography. Undulating physiographic of the northern part is caused by residual and denudational granitoid hills, stony waste, rocky slope, and cliffs. Most of the granite gneiss hills were bisected by NE-SW and NW-SE trending lineaments. The streams in the study region include Pedda Vagu, Devarakadra vagu, which are tributaries of River Krishna flowing towards southern direction. The drainage pattern varies from sub-dendritic, trellis, parallel and rectangular. Most of the low order stream occupied pre-existing joints and fractures of the granite-gneiss rocks.
IJRET: International Journal of Research in Engineering and Technology eISSN: 2319-1163 | pISSN: 2321-7308
_______________________________________________________________________________________________ Volume: 05 Issue: 09 | Sep-2016, Available @ http://ijret.esatjournals.org 131
Figure 2. The geological map of the stud area (After GSI 2011). The Dharwar super group are exposed as linear belts near Peddavura on the Hyderabad-Nagarjuna Sagar road. In the southern part of the district along the northern bank of Krishna river, the rocks of Achaean Peninsular Gneissic complex are unconformably overlain by sedimentary rocks of 1100-600 Ma, constituting the Cuddapah super group and Kurnool group. The Cuddapah super group in the district is predominantly made up of erinaceous and argillaceous sediments respectively, represented by quartzite and shale of Cumbum formation and Srisailam quartzite. The Kurnool group of rocks comprised calcareous sediments and quartzite, limestones (Sriramulu et al,2016) are exposed at the southeast margin of the traverse. The study area is represented by magmatic gneiss and ultramafic rocks. These are followed by metabasalts. Banded iron formation is interbedded with ultramafic flows and mafic dykes intrude the volcanic sequence.
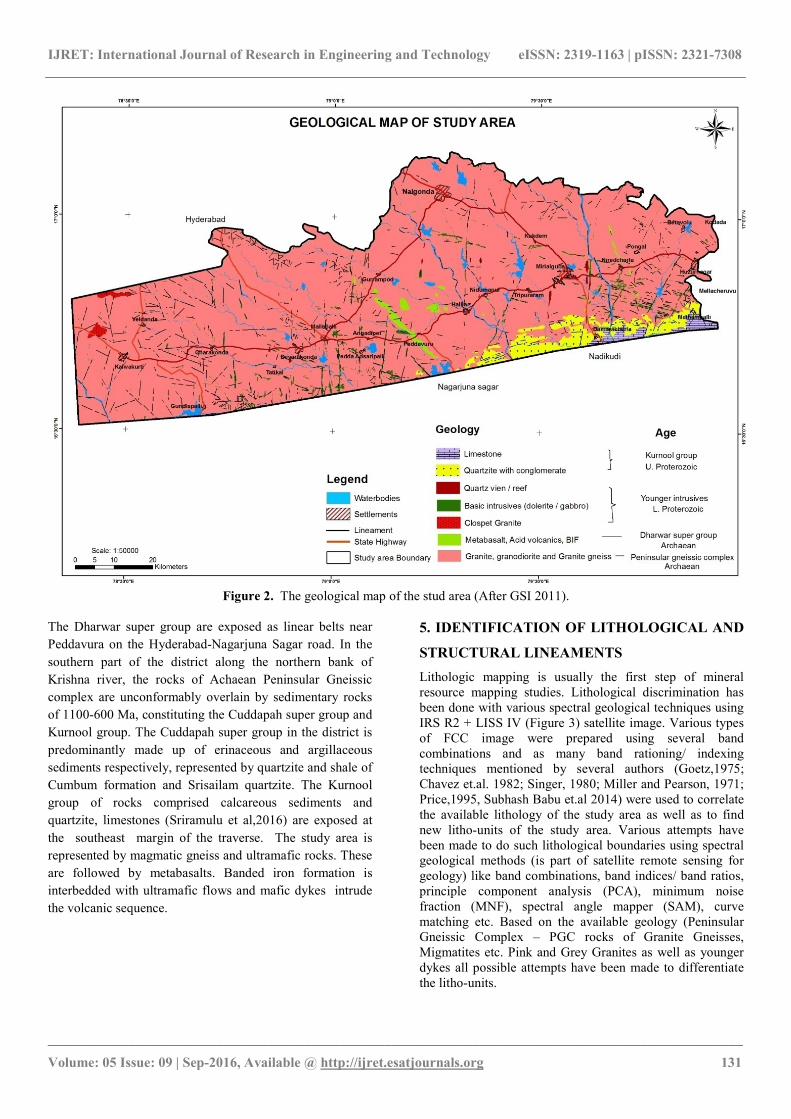
5. IDENTIFICATION OF LITHOLOGICAL AND STRUCTURAL LINEAMENTS Lithologic mapping is usually the first step of mineral resource mapping studies. Lithological discrimination has been done with various spectral geological techniques using IRS R2 + LISS IV (Figure 3) satellite image. Various types of FCC image were prepared using several band combinations and as many band rationing/ indexing techniques mentioned by several authors (Goetz,1975; Chavez et.al. 1982; Singer, 1980; Miller and Pearson, 1971; Price,1995, Subhash Babu et.al 2014) were used to correlate the available lithology of the study area as well as to find new litho-units of the study area. Various attempts have been made to do such lithological boundaries using spectral geological methods (is part of satellite remote sensing for geology) like band combinations, band indices/ band ratios, principle component analysis (PCA), minimum noise fraction (MNF), spectral angle mapper (SAM), curve matching etc. Based on the available geology (Peninsular Gneissic Complex – PGC rocks of Granite Gneisses, Migmatites etc. Pink and Grey Granites as well as younger dykes all possible attempts have been made to differentiate the litho-units.
IJRET: International Journal of Research in Engineering and Technology eISSN: 2319-1163 | pISSN: 2321-7308
_______________________________________________________________________________________________ Volume: 05 Issue: 09 | Sep-2016, Available @ http://ijret.esatjournals.org 132
Figure 3. IRS R2 – LISS IV Satellite image of study area The remote sensing technologies display surface lineaments like joints, fractures; faults etc. those are penetrated into deep-seated. also delineated using various spectral geological techniques, intersections of these are the main source of kimberlite emplacement, Many studies have emphasized the importance of lineament interpretations and digital lineament analysis in localizing the major mineral deposits and notes that there is a strong correlation between mineral deposits and lineaments (Kutina, 1969, Katz, 1982, Liu et al. 2000, Rein and Kaufmann, 2003). Geological structural map (Figure 4.) was prepared by digitizing lineaments, faults in ArcGIS software package from the geology map. Different structures that should be mapped have been represented on the map with appropriate line symbols.
In the present study, visually interpreted lineaments using satellite images reveal that these lineaments densities are very high at north and north-east of the study area. These lineaments of the highlands are mainly joints and fractures rather than faults. In buried pediments where granitic rocks with little soil cover and Pedi plains where soil cover is much high, these lineaments are not visible much through visual interpretation.
IJRET: International Journal of Research in Engineering and Technology eISSN: 2319-1163 | pISSN: 2321-7308
_______________________________________________________________________________________________ Volume: 05 Issue: 09 | Sep-2016, Available @ http://ijret.esatjournals.org 133
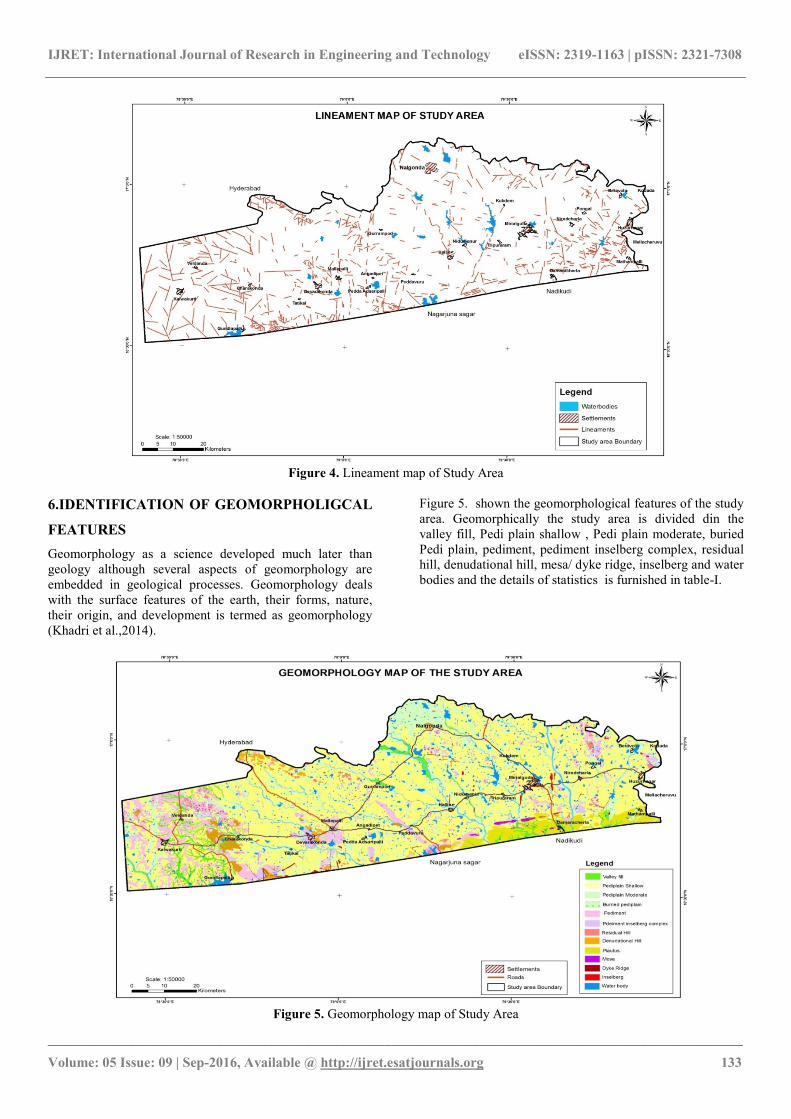
Figure 4. Lineament map of Study Area
6.IDENTIFICATION OF GEOMORPHOLIGCAL FEATURES Geomorphology as a science developed much later than geology although several aspects of geomorphology are embedded in geological processes. Geomorphology deals with the surface features of the earth, their forms, nature, their origin, and development is termed as geomorphology (Khadri et al.,2014).
Figure 5. shown the geomorphological features of the study area. Geomorphically the study area is divided din the valley fill, Pedi plain shallow , Pedi plain moderate, buried Pedi plain, pediment, pediment inselberg complex, residual hill, denudational hill, mesa/ dyke ridge, inselberg and water bodies and the details of statistics is furnished in table-I.
Figure 5. Geomorphology map of Study Area
IJRET: International Journal of Research in Engineering and Technology eISSN: 2319-1163 | pISSN: 2321-7308
_______________________________________________________________________________________________ Volume: 05 Issue: 09 | Sep-2016, Available @ http://ijret.esatjournals.org 134
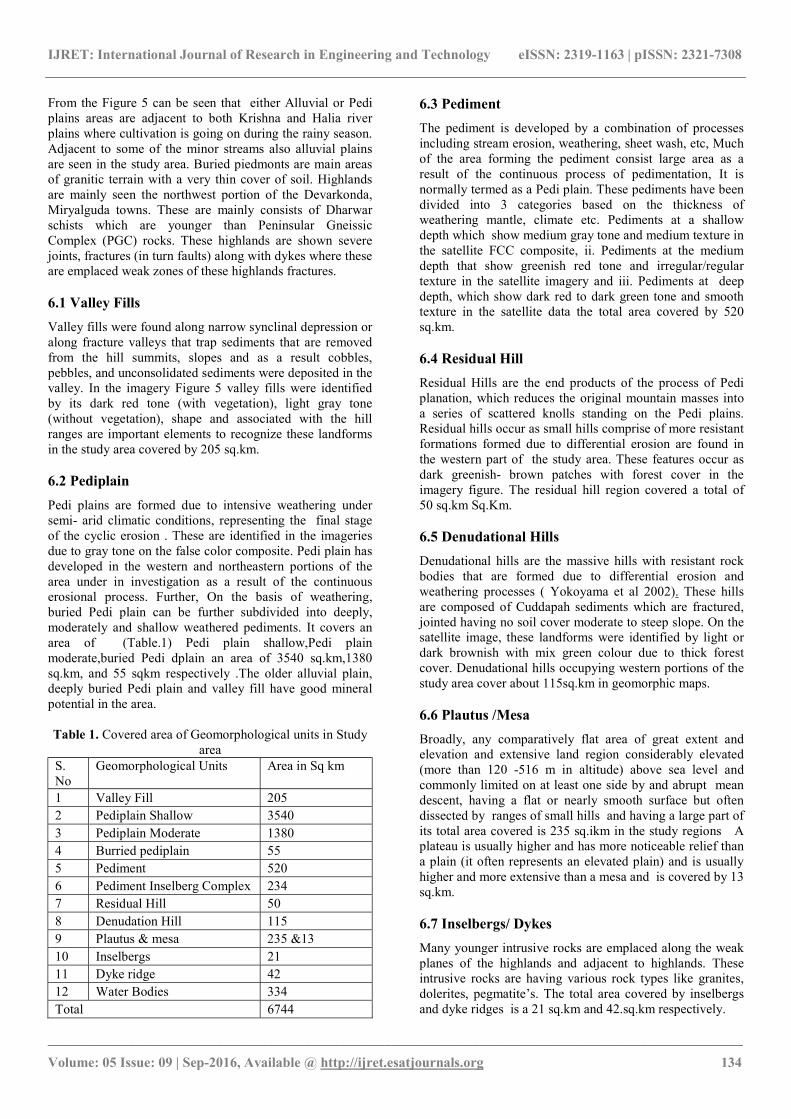
From the Figure 5 can be seen that either Alluvial or Pedi plains areas are adjacent to both Krishna and Halia river plains where cultivation is going on during the rainy season. Adjacent to some of the minor streams also alluvial plains are seen in the study area. Buried piedmonts are main areas of granitic terrain with a very thin cover of soil. Highlands are mainly seen the northwest portion of the Devarkonda, Miryalguda towns. These are mainly consists of Dharwar schists which are younger than Peninsular Gneissic Complex (PGC) rocks. These highlands are shown severe joints, fractures (in turn faults) along with dykes where these are emplaced weak zones of these highlands fractures. 6.1 Valley Fills Valley fills were found along narrow synclinal depression or along fracture valleys that trap sediments that are removed from the hill summits, slopes and as a result cobbles, pebbles, and unconsolidated sediments were deposited in the valley. In the imagery Figure 5 valley fills were identified by its dark red tone (with vegetation), light gray tone (without vegetation), shape and associated with the hill ranges are important elements to recognize these landforms in the study area covered by 205 sq.km. 6.2 Pediplain Pedi plains are formed due to intensive weathering under semi- arid climatic conditions, representing the final stage of the cyclic erosion . These are identified in the imageries due to gray tone on the false color composite. Pedi plain has developed in the western and northeastern portions of the area under in investigation as a result of the continuous erosional process. Further, On the basis of weathering, buried Pedi plain can be further subdivided into deeply, moderately and shallow weathered pediments. It covers an area of (Table.1) Pedi plain shallow,Pedi plain moderate,buried Pedi dplain an area of 3540 sq.km,1380 sq.km, and 55 sqkm respectively .The older alluvial plain, deeply buried Pedi plain and valley fill have good mineral potential in the area. Table 1. Covered area of Geomorphological units in Study
area S. No
Geomorphological Units Area in Sq km 1 Valley Fill 205 2 Pediplain Shallow 3540 3 Pediplain Moderate 1380 4 Burried pediplain 55 5 Pediment 520 6 Pediment Inselberg Complex 234 7 Residual Hill 50 8 Denudation Hill 115 9 Plautus & mesa 235 &13 10 Inselbergs 21 11 Dyke ridge 42 12 Water Bodies 334 Total 6744
6.3 Pediment The pediment is developed by a combination of processes including stream erosion, weathering, sheet wash, etc, Much of the area forming the pediment consist large area as a result of the continuous process of pedimentation, It is normally termed as a Pedi plain. These pediments have been divided into 3 categories based on the thickness of weathering mantle, climate etc. Pediments at a shallow depth which show medium gray tone and medium texture in the satellite FCC composite, ii. Pediments at the medium depth that show greenish red tone and irregular/regular texture in the satellite imagery and iii. Pediments at deep depth, which show dark red to dark green tone and smooth texture in the satellite data the total area covered by 520 sq.km. 6.4 Residual Hill Residual Hills are the end products of the process of Pedi planation, which reduces the original mountain masses into a series of scattered knolls standing on the Pedi plains. Residual hills occur as small hills comprise of more resistant formations formed due to differential erosion are found in the western part of the study area. These features occur as dark greenish- brown patches with forest cover in the imagery figure. The residual hill region covered a total of 50 sq.km Sq.Km. 6.5 Denudational Hills Denudational hills are the massive hills with resistant rock bodies that are formed due to differential erosion and weathering processes ( Yokoyama et al 2002). These hills are composed of Cuddapah sediments which are fractured, jointed having no soil cover moderate to steep slope. On the satellite image, these landforms were identified by light or dark brownish with mix green colour due to thick forest cover. Denudational hills occupying western portions of the study area cover about 115sq.km in geomorphic maps. 6.6 Plautus /Mesa Broadly, any comparatively flat area of great extent and elevation and extensive land region considerably elevated (more than 120 -516 m in altitude) above sea level and commonly limited on at least one side by and abrupt mean descent, having a flat or nearly smooth surface but often dissected by ranges of small hills and having a large part of its total area covered is 235 sq.ikm in the study regions A plateau is usually higher and has more noticeable relief than a plain (it often represents an elevated plain) and is usually higher and more extensive than a mesa and is covered by 13 sq.km. 6.7 Inselbergs/ Dykes Many younger intrusive rocks are emplaced along the weak planes of the highlands and adjacent to highlands. These intrusive rocks are having various rock types like granites, dolerites, pegmatite’s. The total area covered by inselbergs and dyke ridges is a 21 sq.km and 42.sq.km respectively.
IJRET: International Journal of Research in Engineering and Technology eISSN: 2319-1163 | pISSN: 2321-7308
_______________________________________________________________________________________________ Volume: 05 Issue: 09 | Sep-2016, Available @ http://ijret.esatjournals.org 135
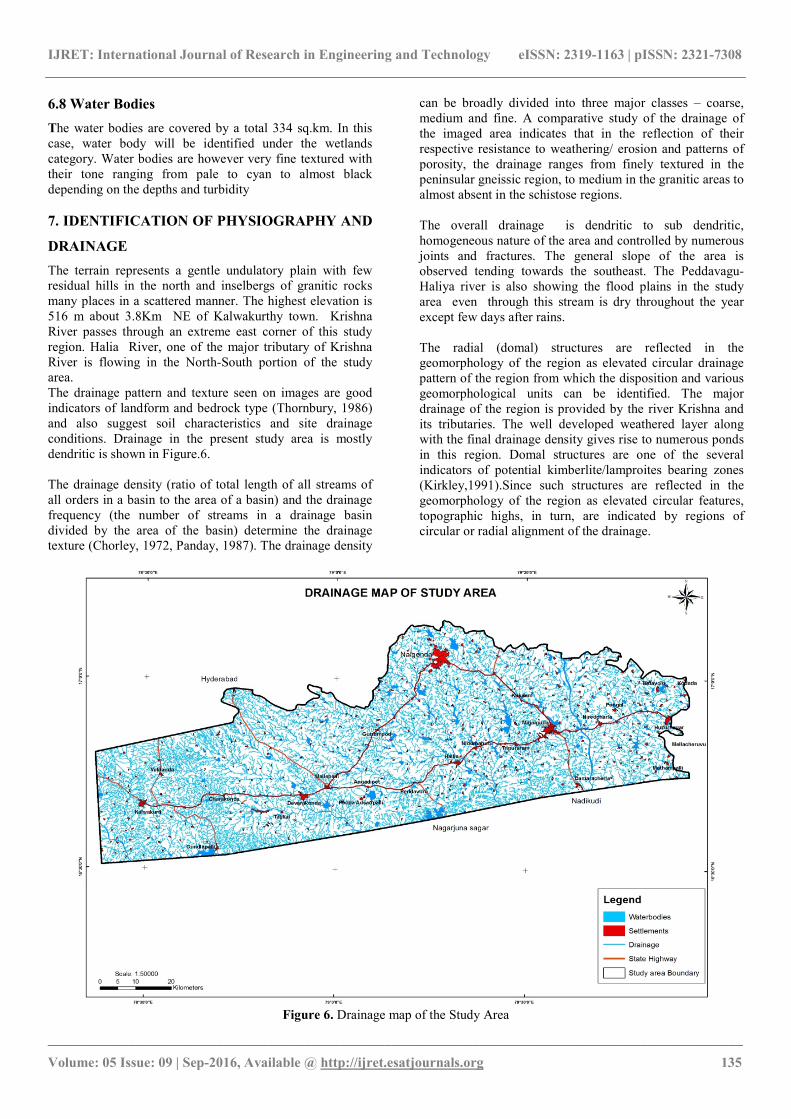
6.8 Water Bodies The water bodies are covered by a total 334 sq.km. In this case, water body will be identified under the wetlands category. Water bodies are however very fine textured with their tone ranging from pale to cyan to almost black depending on the depths and turbidity 7. IDENTIFICATION OF PHYSIOGRAPHY AND DRAINAGE The terrain represents a gentle undulatory plain with few residual hills in the north and inselbergs of granitic rocks many places in a scattered manner. The highest elevation is 516 m about 3.8Km NE of Kalwakurthy town. Krishna River passes through an extreme east corner of this study region. Halia River, one of the major tributary of Krishna River is flowing in the North-South portion of the study area. The drainage pattern and texture seen on images are good indicators of landform and bedrock type (Thornbury, 1986) and also suggest soil characteristics and site drainage conditions. Drainage in the present study area is mostly dendritic is shown in Figure.6. The drainage density (ratio of total length of all streams of all orders in a basin to the area of a basin) and the drainage frequency (the number of streams in a drainage basin divided by the area of the basin) determine the drainage texture (Chorley, 1972, Panday, 1987). The drainage density
can be broadly divided into three major classes – coarse, medium and fine. A comparative study of the drainage of the imaged area indicates that in the reflection of their respective resistance to weathering/ erosion and patterns of porosity, the drainage ranges from finely textured in the peninsular gneissic region, to medium in the granitic areas to almost absent in the schistose regions. The overall drainage is dendritic to sub dendritic, homogeneous nature of the area and controlled by numerous joints and fractures. The general slope of the area is observed tending towards the southeast. The Peddavagu-Haliya river is also showing the flood plains in the study area even through this stream is dry throughout the year except few days after rains. The radial (domal) structures are reflected in the geomorphology of the region as elevated circular drainage pattern of the region from which the disposition and various geomorphological units can be identified. The major drainage of the region is provided by the river Krishna and its tributaries. The well developed weathered layer along with the final drainage density gives rise to numerous ponds in this region. Domal structures are one of the several indicators of potential kimberlite/lamproites bearing zones (Kirkley,1991).Since such structures are reflected in the geomorphology of the region as elevated circular features, topographic highs, in turn, are indicated by regions of circular or radial alignment of the drainage.
Figure 6. Drainage map of the Study Area
IJRET: International Journal of Research in Engineering and Technology eISSN: 2319-1163 | pISSN: 2321-7308
_______________________________________________________________________________________________ Volume: 05 Issue: 09 | Sep-2016, Available @ http://ijret.esatjournals.org 136
The southern part of the district along the northern bank of Krishna river is a plateau. The mean elevation of the terrain is 150m above msl and the general slope is towards the southeast. The general drainage pattern in the gneissic country is coarse dendritic to sub-dendritic, whereas in the limestone dominant sediments, a trellis to the radial pattern is apparently seen. The major rivers include Krishna, Dindi, Peddavagu, Musi, Aler. Haliya, Kongal and Palleru which form part of the Krishna River Basin. All the streams generally flow in the south-easterly direction and join in the Krishna River. While general slope of the area is to be to the east, and drainage density is 0.8 to 1Km/km2 .The drainage pattern is apparently being controlled by structure and lithology in the study area. The lithologic variation has given a rise to different drainage patterns., based upon the occurrence of circular alignment of the drainage pattern, coinciding Ramadugu lamproite clusters. 8. CONCLUSION Multispectral Imagery of the IRS-1D and LISS–IV, high- resolution data of the Mahabubnager and Nalgonda district 4 metres was analyzed using Arc GIS and ERDAS software and prepared geological, geomorphological and structural elements/ Lineament maps and drainage maps (Figures 2,3,4,5 and 6) . Several structural features fractures and dyke NW-SE,NE-SW,N-S and E-W trends, are mapped, which are responsible for the emplacements for mineral resources in the study region. The geomorphological units such as flood plain, valley fill and deeply buried Pedi plain are prospective zones for groundwater exploration and development in the study area. Ramadugu and Ramannapet (Jaggayapet) lamproites are emplaced along NE-SW and NW-SE lineaments contact between the dyke and granite gneisses and implying the involvement of distinct deep- seated faults/fractures in controlling their emplacements. ACKNOWLEDGEMENTS We gratefully acknowledge the University Grants Commission(UGC) , India supported this work and funding from the BSR Research Start- Up Grant project. Participation in field work by Mr. K. Venu is acknowledged. We acknowledge the help given by Dr. D. Vidya sagara Chary in the preparation of figures. REFERENCES [1] A. Subhash Babu, G. Udayalaxmi and G.Ramadass.,
2014. Integration of Litho-Units derived from Satellite data. International journal of Research in Science & Technology(IJRST) Vol.1, Issue 11, December 2014, pp.26-30.
[2] Chavez, P.S, Jr., Berlin, G.L., and Sowers, L.B. Statistical Method for Selecting Landsat MSS Ratios. Journal of Applied Photographic Engineering. 1982. 8 (1) 23-30.
[3] Chorley R. J., 1972. Spatial Analysis in Geomorphology, Harper & Row Publishers, N.Y.
[4] F. A. Kruse, “Mapping Surface Mineralogy Using Imaging Spectrometrey,” Geomorphology, Vol. 137, No. 1, 2012, pp.41-56.
[5] G,Ramadass, G.UdayaLaxmi and G.Sriramulu 2016. Application of RS and GIS for Land Use/ Land Cover, Geomorphological Studies in Nalgonda District, Telangana, India. International Journal of Advanced Remote Sensing and GIS (IJARSG), Cloud Publications, Vol.5 (3), pp.1592-1604.
[6] G.Sriramulu., G.Ramadass and G.UdayaLaxmi 2016. Emplacement of Lamproites in and around Ramadugu, Nalgonda District- ground Magnetic evidence. IRA-International Journal of Applied Sciences, Vol.3, Issue 2, May 2016, pp.129-155.
[7] Geological Survey of India, 2011: District resource map of Nalgonda, Mahabubnagar districts, Andhra Pradesh,1:250,000 scale.
[8] Goetz, A.F.H, 1975: Application of ERTS Images and Image Processing to Regional Geologic
[9] Helmstaedt, H. and Gurney, J.J., 1995. Geotectonic controls of primary diamond deposits: Implications for area selectionin Journal of Geochemical Exploration 53:125-144
[10] Katz, M., 1982: Lineament Analysis of Landsat Imagery Applied to Mineral Exploration. In Mineral Exploration Techniques in Tropical Forest Areas. Edited by Laming, D.I.C. and Gibbs, A.K. Hiden Wealth. 157-166.
[11] Khadri, S. F. R. and Chaitanya B. Pande.,2014. Remote sensing and gis applications of geomorphological mapping of Mahesh river basin, Akola & Buldhana districts, Maharashtra, India using multispectral satellite data. Indian Streams Research Journal Volume 4 | Issue 5 | pp.1-7.
[12] Kirkley, M.B., Gurney, J.J., Otter, M.L., Hill, S.J., and Daniels, L.R., 1991, The application of C isotope measurements to the identifi cation of the sources of C in diamonds: A review: Applied Geochemistry, v. 6, p. 477–494, doi:10.1016/0883-2927(91)90048-T.
[13] Kutina, J.1969. Hydrothermal Ore Deposits in the Western United States: A New Concept of StructuralControl of Distribution. Science. 165; 1113-1119.
[14] Liu, C.C., Sousa, M.D.A Jr., and Gopinath, T.R.,2000. Regional Structural Analysis by Remote Sensing for Mineral Exploration, Paraiba State, Northeast Brazil. Geocarto International. 15 (1) 70-77.
[15] Miller, L.D. and Pearson, R.L. Areal Mapping Program of the IBP Grassland Biome, Remote Sensing of the Productivity of the Short Grass Prairie as Input Into Bio System Model. 7th Proceedings of the International Symposium. Remote Sensing of Environment. 1971. 1; 175-2005.
[16] Pandey S. N., 1987. Principles and application of photogeology, Wiley Eastern Limited, New Delhi.
[17] Price J. C., 1995. Examples of high resolution visible to near infrared reflectance spectra and a standardized collection for remote sensing studies: International Journal of Remote Sensing, Vol. 16, pp. 993 – 1000.
[18] Problems and Geologic Mapping in Northern Arizona. JPL Technical Report 32-1597, Jet Propulsion Laboratory, Pasadena, C.A.
[19] Rein, Bert. And Kaufmann, H. 2003. Exploration for Gold using panchromatic stereoscopic intelligence
IJRET: International Journal of Research in Engineering and Technology eISSN: 2319-1163 | pISSN: 2321-7308
_______________________________________________________________________________________________ Volume: 05 Issue: 09 | Sep-2016, Available @ http://ijret.esatjournals.org 137
satellite photographs and Landsat TM data in the Hebei area, China. International Journal of Remote Sensing. Vol. 24. No. 12, pp. 2427-2438.
[20] Singer, R.B. 1980: Near Infrared Spectral Reflectance of Mineral Mixtures, Systematic Combinationsof Pyroxenes, Olivine and Iron Oxide. PSD Publications. No.258, MIT, Cambridge, MA.
[21] Thornbury William D., 1986. Principles of Geomorphology, 2nd edition, Wiley Eastern Ltd.
[22] Yokoyama R, Shirasawa M., Pike R.J., 2002. Visualizing topography by openness: a new application of image processing to digital elevation models, Photogrammetric Engineering and Remote Sensing, 68, pp. 257-265.


