Embed Size (px)
Citation preview

8th International Conference on Islamic Economics and Finance
1
Performance of Islamic Mutual Funds in Saudi Arabia
Hesham Merdad1
M. Kabir Hassan
2
Introduction
As of April 2010, Muslims represent almost 21.01 percent of the world's population.3 Moreover, it is estimated that these Muslims have more than USD 800 billion to invest and that amount is growing at 15 percent annually, Girard & Hassan (2008). This surge in liquidity attracted many money managers and financial institutions, whether they were from the Arab or Western world, and induced them to start offering financial services that fit these Muslim religious preferences. Since then, these Islamic financial services started to gain tremendous attention and awareness and the demand on such services began to increase at a skyrocket rate. For example, the global market value for Islamic financial services, measured by Shariah compliant assets, grew from USD 150, 549 to 758 billion in 1990, 2006, and 2007, respectively.4
Since the birth of Islamic mutual funds, researches have been interested in investigating whether the risk-return profile of such funds is different from the risk-return profile of conventional funds. And whether adhering to the Shariah law would be at the cost of the funds’ performance; especially that Islamic funds suffer from smaller investment universe, limited asset selection, and restricted investment practices when compared with conventional funds.
By the end of 2008, these Islamic financial services reached USD 951 billion. This means that the market value of these Islamic financial services at the end of 2008 grew almost 25.5 percent over that in 2007 and 534 percent over that in 1990, McKenzie (2010). One of most crucial financial services that have been offered is the Islamic mutual fund.
Hence, these researches conducted empirical studies to assess the performance of Islamic funds relative to conventional funds (Abdullah, Hassan, & Mohamad (2007), Abderrezak (2008), and Merdad, Hassan, & Alhenawi (2010)) as well as relative to both Islamic and conventional indices (Elfakhani & Hassan (2005), Kräussl & Hayat (2008), and Hoepner, Rammal, & Rezec (2009)).
However, given that the literature on Islamic mutual funds is still at its infancy, results and conclusions across these studies are not drawing a clear picture about the risk-return profile of these Islamic mutual funds. In other words, some of these studies concluded that investing in Islamic mutual funds comes at no cost. These studies found no evidence that there exist any performance differences between Islamic and conventional funds as well as between Islamic funds and both Islamic and conventional indices. On the other hand, other studies found that adhering to the Shariah law negatively affects the funds’ performance because of the several restrictions that Shariah law imposes.
1 University of New Orleans, USA and KFUPM, Saudi Arabia 2 University of New Orleans. Email: [email protected]. Phone: 610-529-1247.
3 This is according to the CIA world’s fact book. This Information can be accessed at the following link: https://www.cia.gov/library/publications/the-world-factbook/geos/xx.html. 4 Shariah is an Arabic word. And Shariah law is the legislative framework that regulates all aspects of life, both private and public.

Center for Islamic Economics and Finance, Qatar Faculty of Islamic Studies, Qatar Foundation
2
Now, to critically investigate whether adhering to the Shariah law does, indeed, have any effect on the risk-return profile of mutual funds, this paper will carry out the investigation to a country that possesses the largest amount of Shariah complaint fund assets in the world. That country is Saudi Arabia.
In general, because Islamic funds suffer from smaller investment universe, limited asset selection, and restricted investment practices when compared with conventional funds, it is expected that Saudi Islamic funds will underperform or perform as good as the Saudi conventional funds. Furthermore, because Shariah law requires investors to avoid excessive risk and share instead of shift risk to other parties, it is expected that Saudi Islamic funds will be either less or as risky as Saudi conventional funds.
To our knowledge, this is the first paper that comprehensively examines the Islamic mutual fund issue in the context of Saudi Arabia. Merdad, Hassan, & Alhenawi (2010) addressed the same issue, but there paper was a case study that focused only on funds managed by HSBC Saudi Arabia Limited.
This paper contributes to the Islamic mutual funds literature in three ways. First, it uses a Saudi fund sample that is a very unique in terms of size and its fair representation to the entire Saudi mutual fund industry. In other words, out of a total of 234 mutual funds available in Saudi Arabia as of April 1, 2010, this paper uses a sample of 143 Saudi mutual funds (96 funds are Islamic and 47 funds are conventional funds) from January 2003 to January 2010 that very much represents the Saudi mutual fund population in terms of geographical focus, diversity, investment objectives, Shariah compliancy, and institutional management.
On the other hand, Saudi mutual fund samples in other studies like Abderrezak (2008), Kräussl & Hayat (2008), and Hoepner, Rammal, & Rezec (2009), were not very much representative of the Saudi mutual fund population. This is because these studies were examining Islamic mutual funds in general and not Saudi Islamic mutual funds in particular. Therefore, Saudi mutual funds were only considered a subset in their entire sample set. As a result, conclusions and assertions from these studies that pertained to Saudi Islamic mutual funds cannot be generalized on the entire Saudi mutual fund population.
Second, studies, like Ahmed (2001) and Dabbeeru (2006a, 2006b, and 2006c), were among the first to provide a primer analysis on the performance of Saudi Arabia mutual funds, but, their studies very much lacked statistical sophistication. This paper, however, overcomes this issue by employing commonly widespread methods, models, and statistical tests. Furthermore, this paper overcomes the benchmark problem that is widely spread in the mutual fund literature by benchmarking funds against their most respective and coherent market benchmarks. Furthermore, funds are not only going to be benchmarked against their respective Islamic indices, but also against their respective conventional indices as well. Finally, the effect of different investment styles on the performance of both the Islamic and conventional Saudi mutual funds will be examined by employing a four-factor model.
Third, Islamic funds do not allow investing in instruments that have adversely affected conventional funds and triggered the global financial crisis in the first place, such as toxic assets
Center for Islamic Economics and Finance, Qatar Faculty of Islamic Studies, Qatar Foundation
3
and derivatives. Therefore, it would be interesting to take a closer look at the performance of Saudi mutual funds during the recent financial crisis period and observe how such period affected these funds’ performance and riskiness.
Overall, the results indicate that there was no statistical evidence that there existed any differences in the performance of Islamic mutual funds relative to conventional mutual funds during the entire sample period (from January 2003 to January 2010). Further, a closer look at the effect of the recent financial crisis period on Saudi mutual funds, the results reveal that both funds (Islamic and conventional) were affected by the same manner.
The rest of the paper unfolds as follows. Section 2 discusses previous studies on the performance of conventional mutual funds and Islamic mutual funds. Section 3 covers the data for the empirical study. Section 4 discusses the methodology. Section 5 provides the empirical results and discussions. Section 6 is the conclusion.
Previous Literature
The previous literature discussion will be divided into two main topics:
1- Previous literature on conventional mutual funds.
2- Previous literature on Islamic mutual funds.
Previous Literature on Conventional Mutual Funds
There are tremendous studies that have been addressing the mutual funds’ performance issue, and some of these studies go back to the 1960s. For example, based on the capital asset pricing model (CAPM) developed by Sharpe (1964) and Lintner (1965), Jensen (1967) derived a risk-adjusted measure (known as “Jensen’s Alpha”) that estimates the fund manager’s ability to contribute to the fund’s return when the level of risk is controlled. He used this measure to examine the ability of 115 mutual fund managers to earn abnormal returns during the period from 1945 to 1964. Jensen documented that, on average, these funds were not able to outperform the market benchmark of the Standard and Poor Composite 500 Price Index (S&P500).
Using a sample of 123 mutual funds during the period from 1960 to 1969, McDonald (1974) also found that the majority of funds did not outperform the New York Stock Exchange (NYSE) Index.
Also Kon & Jen (1979) used a sample of 49 mutual funds from January 1960 to December 1971 to examine the non-stationarity of the market-related risk for mutual funds over time. They divided their sample into different risk regimes and then ran regular OLS regressions for each regime. They found that there were multiple levels of beta that existed for 37 funds. This indicated that many funds were engaging in market timing activities.
Kon (1983) further examined the existence of both selectivity and market timing skills in mutual funds. He found no statistical significance for market timing, but there were five out of 23 funds that had statistical significance for the selectivity ability. Consistent with Kon (1983)

Center for Islamic Economics and Finance, Qatar Faculty of Islamic Studies, Qatar Foundation
4
findings; the findings of Chen, Cheng, Rahman, & Chan (1992) indicated that there existed no market timing abilities using 93 mutual funds from January 1977 to March 1984.
Grinblantt & Titman (1992) used a sample of 279 mutual funds from December 31, 1974 to December 31, 1984 to analyze the persistence in performance in mutual funds. They found that any differences in the performance persistence between funds were due to the fund manager’s ability to earn abnormal returns.
Using the Treynor and Mazuy (1966) model; Annuar, Shamsher, & Ngu (1997) also examined the existence of both selectivity and market timing skills in 31 Malaysian unit trust funds from July 1990 to August 1995.5 Their findings showed that there was statistical evidence that these unit trust funds possessed selectivity skills, but not market timing skills.
Shamsher, Annuar, & Taufiq (2000) examined 41 actively and passively managed Malaysian funds during 1995 and 1999. They found no statistical significance in the performance of actively and passively managed funds using risk-return measures such as Sharpe ratio, Treynor ratio, and Jensen’s alpha. Further, they did not find differences in the selection ability between actively and passively managed funds. Consistent with other studies, they also found no market timing abilities for both actively and passively managed funds.
Further, they asserted that these unit trust funds did not achieve their expected level of diversification.
Finally, Dabbeeru provided a primer analysis on the performance of mutual funds in Saudi Arabia. Dabbeeru provided three series of papers to examine the issue. The first paper Dabbeeru (2006a) provided a basic guide to Saudi Arabian mutual funds during the period from January 1, 2006 to June 15, 2006. Although the study covered 182 mutual funds available in Saudi Arabia, the study only focused on the bullish period in the Saudi market and significantly lacked statistical sophistication. That is, Dabbeeru only employed the standard deviation, risk per return, and non-risk adjusted return measures to gauge the performance of Saudi mutual funds.
In his second paper Dabbeeru (2006b) examined the performance of 97 Saudi equity mutual funds during the period from February 2005 to October 2006. For this study, Dabbeeru examined the past performance of these funds where he reported the Year-to-date (YTD) returns for these funds and the locally focused market index (Tadawul) for the past 6-month, 1-year, and 3-years.6
Previous Literature on Islamic Mutual Funds
Again, no statistical tests were reported. In Dabbeeru (2006c) final paper, he examined balanced, debt, and liquid funds instead of equity funds.
Ahmed (2001) provided a primer on the performance of 13 Islamic equity funds in Saudi Arabia. These funds were managed by only two institutional managers: the National Commercial Bank (NCB) and Al-Baraka Group. However, no statistical tests were reported in his study.
Elfakhani & Hassan (2005) used a sample of 46 Islamic mutual funds from January 1, 1997 to August 31, 2002 to examine the performance of Islamic mutual funds relative to Islamic and conventional market benchmarks. They employed different risk-adjusted performance
5 In Malaysia, mutual funds are called unit trust funds. 6 Tadawul is now called Tadawul All Share Index (TASI)

Center for Islamic Economics and Finance, Qatar Faculty of Islamic Studies, Qatar Foundation
5
measures, such as Sharpe ratio, Treynor ratio, and Jensen alpha index. Moreover, they employed an ANOVA statistical test. Overall, their findings suggested that there was no statistical evidence that there existed any performance differences between these Islamic funds and the employed market benchmarks. However, their findings suggested that Islamic mutual funds do offer a good hedging opportunity against market downturns and recessions.
Abdullah, Hassan, & Mohamad (2007) used a sample 65 Malaysian unit trust funds (only 14 were Islamic) from 1992 to 2001 to compare the performance between Islamic and conventional unit trust funds in Malaysia. They employed different risk-return measures, such as the adjusted Sharpe ratio, Treynor ratio, adjusted Jensen’s alpha index, Modigliani and Modigliani (MM) measure, and the information ratio. They found that during bullish economic conditions, conventional funds performed better than Islamic funds. But during bearish economic conditions, Islamic funds performed better than conventional ones. Thus, they concluded that Islamic funds can help “hedge the downside risk in an adverse economic situation.” They also found that both conventional and Islamic funds marginally and slightly underperformed the employed market benchmark. Further, there was little evidence that both Islamic and conventional funds possessed selection and market timing skills when the Treynor & Mazuy (1966) model was used. They also found that conventional funds had diversification levels that were marginally better than Islamic funds, but both funds were unable to achieve at least 50 percent of the market diversification level.
Kräussl & Hayat (2008) used a sample of 59 Islamic equity funds (IEF) to examine the performance of these funds relative to Islamic and conventional market benchmarks during the period from 2001 and 2006. They employed a set of risk-adjusted measures, such as the Jensen’s alpha index, Sharpe ratio, Treynor ratio, Modigliani and Modigliani (MM) measure, TT measure, and the information ratio. They found that, on average, there were no significant performance differences between IEFs and the employed market benchmarks, both Islamic and conventional. However, a closer look at the bear market of 2002, they documented that IEFs did significantly outperform the Islamic and conventional market indices using conditional CAPM. Analyzing the risk-return characteristics of IEFs, they found that IEFs possessed superior systematic risk-to-return ratios. Therefore, they argued that these IEFs “seem most attractive as part of a larger fully diversified portfolio like a fund of funds.” Furthermore, consistent with previous studies, they did not find any evidence that these IEFs possessed market timing skills using the Treynor & Mazuy (1966) model.
Abderrezak (2008) examined the performance of 46 Islamic Equity Funds (IEF) relative to their conventional peer, Islamic and conventional market benchmarks, and ethical funds during the period from January 1997 to August 2002. He employed several methodologies such as the Sharpe ratio, one factor model, Fama and French 3-factor model. He found that IEFs are 40 basis points more expensive than their conventional peers. Further, he found that IEFs consistently underperformed their respective Islamic and conventional market benchmarks. Finally, he found that there was no statistical evidence that there existed any performance differences between Islamic and ethical funds.
Muhammad & Mokhtar (2008) used weekly Net Asset Values (NAVs) of only nine Islamic equity funds in Malaysia in order to examine their performance relative to the market

Center for Islamic Economics and Finance, Qatar Faculty of Islamic Studies, Qatar Foundation
6
index, Kuala Lumpur Syariah Index (KLSI), for the period from 2002 to 2006. To assess these funds’ performance, they employed the Sharpe ratio and the Treynor ratio. They found that eight of these funds underperformed the KLSI. However, they found a bag of mixed results when they employed the standard deviation, coefficient of variation, and the systematic risk (beta) to assess the riskiness of these funds.
Hoepner, Rammal, & Rezec (2009) used a unique dataset of 262 Islamic equity funds from 20 countries and four regions in order to examine the performance of these funds relative to constructed portfolios that had exposure to national, regional, and global markets. Furthermore, their paper investigated different investment styles to which these Islamic funds were exposed. They did so by employing a conditional three level Carhart model. They found that Islamic funds from eight nations (mostly from the western regions) significantly underperformed their respective equity market benchmarks, and funds from only three nations outperformed their respective market benchmarks. They also found that Islamic funds were biased towards small stocks only. Furthermore, they found that Islamic funds from the Gulf Cooperation Council (GCC) or Malaysia did not significantly underperform their respective benchmarks or were biased towards small stocks. Finally, they argued that Islamic equity funds can offer a hedging opportunity because their investment universe is limited to low debt/equity ratio stocks.
Dewi & Ferdian (2009) used 10 Indonesian and 14 Malaysian Islamic mutual funds in order to examine their performance relative to the Jakarta Islamic Index (JJI) and Malaysia Dow Jones Islamic Market Index (DJIMY) from January 1, 2006 to April 31, 2009, respectively. Furthermore, their paper did a performance comparison between Indonesian and Malaysian Islamic funds. They found that Malaysian Islamic funds outperformed the Indonesian Islamic funds.
Mansor & Bhatti (2009) analyzed the performance and growth rates of Islamic and conventional mutual funds in Malaysia. They used yearly data of Malaysian mutual funds from 1999 to March 2009 and daily return data from July 1, 2008 to May 10, 2009. To assess the performance of funds, they only used the non-risk adjusted average returns, standard deviation, and correlation analysis. No statistical tests were presented except for Jarque-Bera test for normality. They found that there was a strong correlation between Islamic and conventional mutual funds. They also found that the ratio of Islamic to conventional funds was increasing indicating the importance of Islamic funds. The Growth rates of Islamic mutual funds were higher than that of conventional funds in terms of NAVs. Finally, they asserted that Islamic funds were lesser than conventional funds in terms of size.
Merdad, Hassan, & Alhenawi (2010) used a sample of 28 Saudi mutual funds managed by HSBC in order to examine the performance of the 12 Islamic funds relative to the 16 conventional funds during the period from January 2003 to January 2010. They used several risk-adjusted performance measures such as the Sharpe ratio, Treynor ratio, Modigliani and Modigliani (MM) index, TT index, and Jensen alpha index. Furthermore, they employed the Treynor and Mazuy model to examine the Saudi funds’ selectivity and market timing abilities. They found that Islamic funds underperformed conventional funds during both full and bullish periods, but outperformed during bearish and financial crisis periods. Furthermore, they found that HSBC managers were good at showing timing and selectivity skills for Islamic funds during

Center for Islamic Economics and Finance, Qatar Faculty of Islamic Studies, Qatar Foundation
7
the bearish period, and for conventional funds during the bullish period. They also asserted that Islamic mutual funds do offer hedging opportunities for investors during economic downturns.
The Data
This section discusses the data and its sources in this empirical study. This section is divided into two subsections: A) Data on Saudi mutual funds. B) Data for the multifactor model.
A.
The data consists of monthly net asset values (NAVs) of 143 out of 234 mutual funds available in Saudi Arabia during the period from January 2003 to January 2010. Information on these funds was obtained from three main sources: 1) the official site of the Saudi Stock Exchange (Tadawul).
Mutual Fund Data
7 2) Official site of HSBC Saudi Arabia Limited.8 3) Zawya database.9
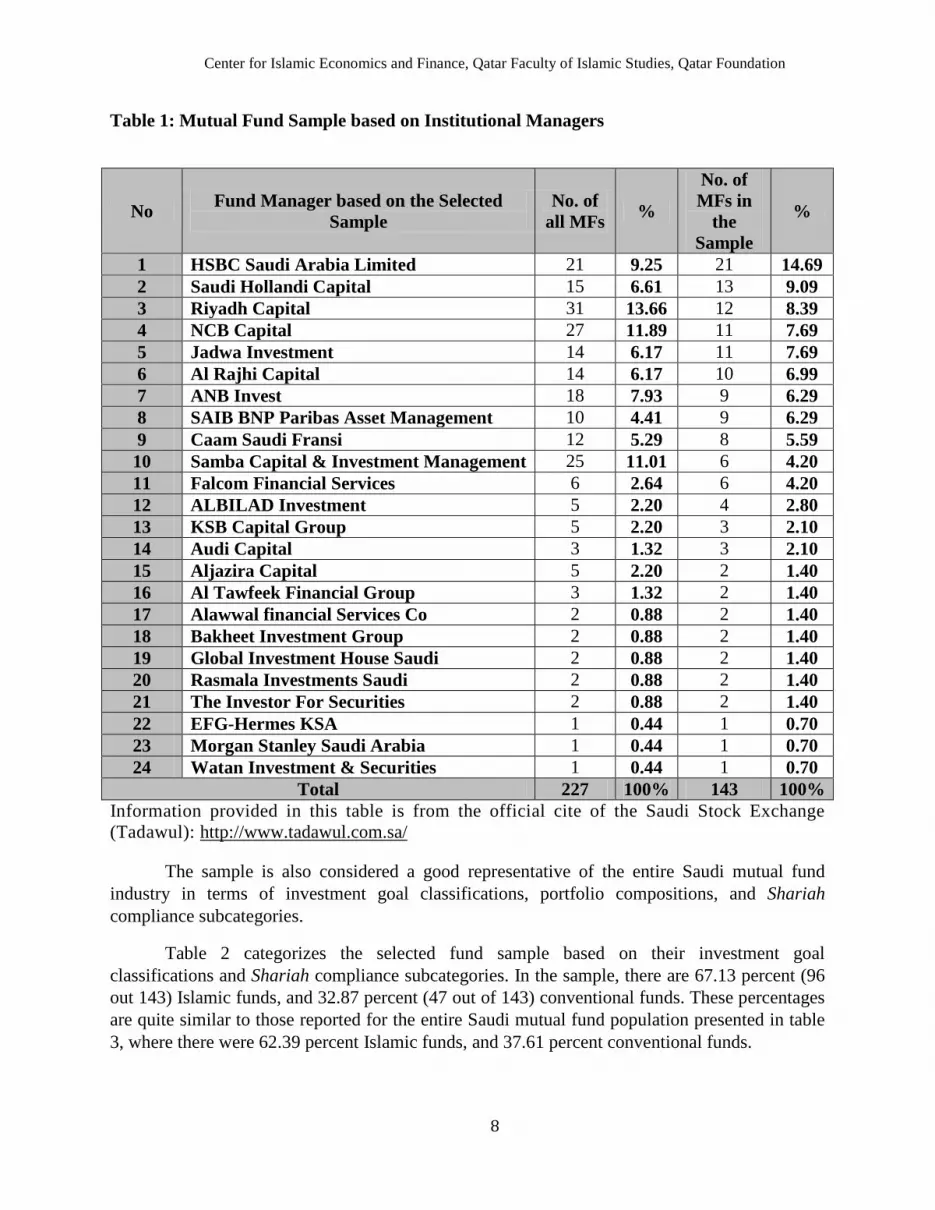
The funds in the sample are managed by 24 out of 28 Institutional managers, see table 1. HSBC Saudi Arabia Limited manages the largest number of funds (21 funds, 14.69 percent of all available funds). Coming after HSBC is the Saudi Hollandi Capital, Riyadh Capital, and then NCB Capital with 9.09, 8.39, and then 7.69 percent, respectively.
The following table presents the selected sample of 143 mutual funds in Saudi Arabia for the period from January 2003 to January 2010. Funds are categorized based on institutional managers that manage these funds. The second column shows the name of the institutional managers, the third column shows the total number of funds under their management, the fourth column shows the percentage of funds each manager manages, and the fifth column shows the number of funds each institutional manager manages in the selected sample. The last column shows the percentage of funds each manager manages in the sample (in a descending order).
7 Source is: http://www.tadawul.com.sa/ 8 Source is: http://www.hsbcsaudi.com 9 Zawya is one of leading Middle Eastern business information companies. Their main website is: http://www.zawya.com. Further, I would like to express my gratitude to Mr. James Randall, the international business manager, for providing me a trial excess to the database.
Center for Islamic Economics and Finance, Qatar Faculty of Islamic Studies, Qatar Foundation
8
Table 1: Mutual Fund Sample based on Institutional Managers
No Fund Manager based on the Selected Sample
No. of all MFs %
No. of MFs in
the Sample
%
1 HSBC Saudi Arabia Limited 21 9.25 21 14.69 2 Saudi Hollandi Capital 15 6.61 13 9.09 3 Riyadh Capital 31 13.66 12 8.39 4 NCB Capital 27 11.89 11 7.69 5 Jadwa Investment 14 6.17 11 7.69 6 Al Rajhi Capital 14 6.17 10 6.99 7 ANB Invest 18 7.93 9 6.29 8 SAIB BNP Paribas Asset Management 10 4.41 9 6.29 9 Caam Saudi Fransi 12 5.29 8 5.59 10 Samba Capital & Investment Management 25 11.01 6 4.20 11 Falcom Financial Services 6 2.64 6 4.20 12 ALBILAD Investment 5 2.20 4 2.80 13 KSB Capital Group 5 2.20 3 2.10 14 Audi Capital 3 1.32 3 2.10 15 Aljazira Capital 5 2.20 2 1.40 16 Al Tawfeek Financial Group 3 1.32 2 1.40 17 Alawwal financial Services Co 2 0.88 2 1.40 18 Bakheet Investment Group 2 0.88 2 1.40 19 Global Investment House Saudi 2 0.88 2 1.40 20 Rasmala Investments Saudi 2 0.88 2 1.40 21 The Investor For Securities 2 0.88 2 1.40 22 EFG-Hermes KSA 1 0.44 1 0.70 23 Morgan Stanley Saudi Arabia 1 0.44 1 0.70 24 Watan Investment & Securities 1 0.44 1 0.70
Total 227 100% 143 100% Information provided in this table is from the official cite of the Saudi Stock Exchange (Tadawul): http://www.tadawul.com.sa/
The sample is also considered a good representative of the entire Saudi mutual fund industry in terms of investment goal classifications, portfolio compositions, and Shariah compliance subcategories.
Table 2 categorizes the selected fund sample based on their investment goal classifications and Shariah compliance subcategories. In the sample, there are 67.13 percent (96 out 143) Islamic funds, and 32.87 percent (47 out of 143) conventional funds. These percentages are quite similar to those reported for the entire Saudi mutual fund population presented in table 3, where there were 62.39 percent Islamic funds, and 37.61 percent conventional funds.

Center for Islamic Economics and Finance, Qatar Faculty of Islamic Studies, Qatar Foundation
9
Table 2: Mutual Fund Sample based on its Shariah Compliance Subcategories and Investment Goals Classifications
The following table presents the selected sample of 143 mutual funds in Saudi Arabia for the period from January 2003 to January 2010. Funds are broken down based on their Shariah compliance subcategories (Islamic and conventional funds) and investment goal classifications (growth, income, capital preservation, and income and growth). The percentage of funds is reported for each subcategory and classification.
Subcategory/Classification
Investment Goal Classification Total
No. of
MFs
% Growth % Inco
me % Capital
Preservation
%
Income and
Growth
%
Islamic Funds 61 42.66 16 11.
19 13 9.09 6 4.2
0 96 67.13
Conventional Funds 28 19.58 8 5.5
9 6 4.20 5 3.5
0 47 32.87
Total 89 24 19 11 143 100% % 62.24 16.78 13.29 7.69 Information provided in this table is from the official cite of the Saudi Stock Exchange
(Tadawul): http://www.tadawul.com.sa/
Further, table 2 breaks down the fund sample based on the funds’ investment goal. The results show that mutual funds that have growth investment objectives dominate the funds sample with 89 out of 143 funds, 62.24 percent. This percentage is quite similar to that reported for the entire Saudi mutual fund population presented in table 3, where 66.67 percent of all funds were growth oriented. Other investment objectives such as Income, capital preservation, and income and growth make around 16.78, 13.29, and 7.69 percent of the total fund sample, respectively.
Also, the table presents the percentages of Islamic and conventional funds that are based on investment goal classifications of the selected fund sample. Islamic funds that are growth oriented dominate the sample with 61 out of 147 funds, 42.66 percent. On the other hand, conventional funds that are income and growth oriented are considered the least in the sample with only 5 out of 143 funds, 3.50 percent.
Table 3 breaks down the fund sample based on the funds’ security type (equity, bonds, money market, trade finance, and balanced), geographical focus (local, international, and Arab), investment goal (growth, income, capital preservation, and income and growth), and Shariah compliant subcategories (Islamic and conventional funds). From the table, locally focused Islamic equity funds dominate the sample with 26 out 143 funds, 18.18 percent.

Center for Islamic Economics and Finance, Qatar Faculty of Islamic Studies, Qatar Foundation
10
Table 3: Mutual Fund Sample based on Portfolio Composition, Geographical Focus, Investment Goals, and Shariah Compliance subcategories.
The following table presents the selected sample of 143 mutual funds in Saudi Arabia for the period from January 2003 to January 2010. Funds are based on their type of security (stocks, bonds, money markets, trade finance, and balanced), geographic focus (local, international, Arab), investment goal classifications (growth, income, capital preservation, and income & growth), and Shariah compliance subcategories (Islamic and conventional funds). The final column presents the percentage of funds in each security type and geographical focus category (in descending order). Also, at the end of the table, percentages of funds under each investment goal classification and Shariah compliance subcategory are reported.
Category/ Classification/ Subcategory
Investment Goal Classification
Total % Growth Income Capital
Preservation Income & Growth
Islamic
Conven.
Islamic
Conven.
Islamic
Conven.
Islamic
Conven.
Local stocks 26 19 0 1 0 0 2 3 51 35.66
Arab stock 14 5 0 0 0 0 0 0 19 13.29
Trade finance local 4 0 8 0 5 0 0 0 17 11.8
9 Balanced int. 7 2 0 1 2 1 0 1 14 9.79 Trade finance int. 2 0 7 0 2 0 0 0 11 7.69
Money market local 0 1 0 3 2 3 0 0 9 6.29
Int. stocks 5 0 0 0 0 0 2 1 8 5.59 Money market int. 0 1 0 3 1 2 0 0 7 4.9
Balanced local 3 0 0 0 0 0 2 0 5 3.5 Bond int. 0 0 1 0 1 0 0 0 2 1.4
Total 61 28 16 8 13 6 6 5
143 100%
% 42.66 19.58 11.19 5.59 9.09 4.2 4.2 3.5 Total for
Classification 89 24 19 11
% 62.24 16.78 13.29 7.69 Information provided in this table is from the official cite of the Saudi Stock Exchange (Tadawul): http://www.tadawul.com.sa/
Table 4 shows the distribution of the fund sample based on the three main geographical focuses (local, international, and Arab) and the Shariah compliance subcategories of funds (Islamic and conventional funds). The results show that there are 82 out of 143 (57.34 percent), 42 out of 143 (29.37 percent), and 19 out of 143 (13.29 percent) funds that are locally, internationally, and Arab focused, respectively. Funds that are Islamic and locally focused

Center for Islamic Economics and Finance, Qatar Faculty of Islamic Studies, Qatar Foundation
11
dominate the sample with 52 out 143 funds (36.36 percent). However, the lowest number of funds falls under the Arab focused conventional fund category (5 out 143 funds, 3.50 percent).
Table 4: Mutual Fund Sample based on its Geographical Focus Categories and Shariah Compliance Subcategories
The following table presents the selected sample of 143 mutual funds in Saudi Arabia for the period from January 2003 to January 2010. Funds are broken down based on their three main geographical focuses (local, international, and Arab) and their Shariah compliance subcategories (Islamic and conventional funds). The percentage of funds is reported for each category and subcategory.
No Category/ Subcategory
Subcategory Total No. of
MFs
% Islamic % Conventional %
1 Local 52 36.36 30 20.98 82 57.34 2 International 30 20.98 12 8.39 42 29.37 3 Arab 14 9.79 5 3.5 19 13.29
Total 96 47 143 100% % 67.13 32.87 Information provided in this table is from the official cite of the Saudi Stock Exchange (Tadawul):
Table 5 breaks down the sample based on the funds’ three geographical focuses (local, international, and Arab), investment goal classifications, and Shariah compliance subcategories. Locally focused Islamic funds that are growth orientated dominate the sample with 33 out of 143 funds (23.08 percent). However, funds that are internationally focused and at the same time are income and growth oriented are the least in the sample with only 2 out of 143 funds (1.40 percent). That is true regardless if these funds were Islamic or conventional funds.
http://www.tadawul.com.sa/

8th International Conference on Islamic Economics and Finance
12
Table 5: Mutual Fund Sample based on the Geographical Focus, Investment Goals, and Shariah Compliance Subcategories.
The following table presents the selected sample of 143 mutual funds in Saudi Arabia for the period from January 2003 to January 2010. Funds are based on their three main geographic focuses categories (local, international, Arab countries), investment goal classifications (growth, income, capital preservation, and income & growth), and Shariah compliance subcategories (Islamic and conventional funds). The final column presents the percentage of funds under each geographic focus category (in descending order). The final row presents the percentage of funds under each classification and subcategory.
Category/ Classifica
tion Subcatego
ry
Investment Goal Classification Total % Growth Income Capital Preservation Income & Growth
Islamic % Conv
en. % Islamic % Conv
en. % Islamic % Conv
en. % Islamic % Conv
en. %
Local 33 23.08 20 13.
99 8 5.59 4 2.
8 7 4.9 3 2.
1 4 2.8 3 2.
1 82 57.34
International 14 9.7
9 3 2.1 8 5.59 4 2.
8 6 4.2 3 2.
1 2 1.4 2 1.
4 42 29.37
Arab 14 9.79 5 3.5 0 0 0 0 0 0 0 0 0 0 0 0 19 13.2
9 Total 61 28 16 8 13 6 6 5
143 100%
% 42.66 19.58 11.19 5.59 9.09 4.2 4.2 3.5 Total
funds for Investment Goal
Classification
89 24 19 11
% 62.24 16.78 13.29 7.69 Information provided in this table is from the official cite of the Saudi Stock Exchange (Tadawul): http://www.tadawul.com.sa/

8th International Conference on Islamic Economics and Finance
13
Further, the proxy for the risk free rate is the monthly Saudi Interbank Offering Rate (SIBOR) with one month maturity. For this study, it would be more appropriate to use the rate of return on sukuk instead of the rate of the risk-free asset since Shariah law forbids any return that is in the context of debt. But the problem is that there is not sufficient data on sukuk rates that could be used in empirical studies that discuses Islamic finance. Thus, the most comparable risk-free rate to use for this study is the SIBOR rate.
As for the market indices used, this paper employs six different market indices. These market indices fall under two main classifications: Islamic indices and conventional indices. The Islamic indices are: 1) Global Index of the GCC Islamic Index (to mainly benchmark locally focused Islamic funds).10
The monthly historical prices of both Islamic and conventional indices from January 2003 to January 2010 were obtained from three main sources: 1) the official site of the Saudi Stock Exchange (Tadawul).
2) MSCI World Islamic Index (to mainly benchmark internationally focused Islamic funds). 3) MSCI Arab Markets Domestic Islamic Index excluding Saudi Arabia (to mainly benchmark Arabian countries focused Islamic funds). The conventional indices are: 1) Tadawul All Share Index: TASI (to mainly benchmark locally focused conventional funds). 2) MSCI World Index IMI (to mainly benchmark internationally focused conventional funds). 3) MSCI Arabian Markets Domestic Index excluding Saudi Arabia (to mainly benchmark Arabian countries focused conventional funds).
11 2) The official site of the Global Investment House.12 3) MSCI Barra.13
Finally, the sample period will be divided into four different periods depending on the economic condition and that division will hold throughout the entire study. These periods are:
1. The overall sample period: from January 2003 to January 2010, 2. The bullish period: from January 2003 to February 2006, 3. The bearish period: from March 2006 to January 2010, and 4. The recent financial crisis period: from September 2008 to January 2010.
The main purpose for this division is to: 1) capture the behavior these Saudi mutual funds during different economic conditions, 2) enhance comparability and observe any differences between Islamic and conventional funds during those different market trends.
B.
To further enhance comparability between Islamic and conventional funds in Saudi Arabia, a multifactor model, which is in the spirit of Carhart (1997) four-factor model, is considered to
Data for the Multifactor Model
10 GCC refers to the Gulf Cooperation Council. This index was used to benchmark locally focused Islamic funds instead of the Saudi Arabia Islamic index. This is because the Saudi Arabia Islamic index is considered relatively new and do not have data that goes all the way back to January 2003. 11 Source is: http://www.tadawul.com.sa/ 12 Sources is: http://www.globalinv.net 13 The MSCI data contained herein is the property of MSCI Inc. (MSCI). MSCI, its affiliates and any other party involved in, or related to, making or compiling any MSCI data; make no warranties with respect to any such data. The MSCI data contained herein is used under license and may not be further used, distributed or disseminated without the express written consent of MSCI.

Center for Islamic Economics and Finance, Qatar Faculty of Islamic Studies, Qatar Foundation
14
control for different investment styles. Such mode is constructed based on all stocks listed on the Saudi Arabia stock exchange (Tadawul).
To be included in the test, all listed firms must have available data on stock prices, book values of equity, and total shares outstanding from January 2002 to January 2010. The final sample that is used to perform the constructed four-factor model consists of 123 out 135 firms listed on the exchange from December 2003 to January 2010.
Methodology
This section discusses the methodology used in this empirical study, and it is divided into two subsections. A) Non-risk adjusted returns section. B) Regression approach section: it will discuss three models, 1) The single-factor model (CAPM) in order to estimate the Jenson’s Alpha Index as well as the systematic risk beta. 2) The Treynor and Mazuy (1966) model in order to estimate the selection and market timing abilities. 3) Multifactor model in the spirit of Carhart (1997) four-factor model in order to control for common investment styles.
A.
Conventionally, mutual fund returns are calculated as capital gains plus income (dividends). However, because obtaining data on dividends was very difficult, dividends are not accounted for in this study.
Non Risk-Adjusted Returns
𝑅𝑖,𝑡
= 𝑁𝐴𝑉𝑖,𝑡 − 𝑁𝐴𝑉𝑖,𝑡−1 + 𝐷𝑖,𝑡
𝑁𝐴𝑉𝑖,𝑡−1
...................................……………………Equation ( 1)
where:
𝑅𝑖,𝑡 ∶ Total return of an individual fund (i) at month (t). 𝑁𝐴𝑉𝑖,𝑡 ∶ Net Asset Value of fund (i) at month (t). 𝑁𝐴𝑉𝑖,𝑡−1 ∶ Net Asset Value of fund (i) at month (t-1). 𝐷𝑖,𝑡 ∶ Dividend or cash disbursement for fund (i) at month (t).
It is worthy to note that this paper does not focus on comparing the performance of individual mutual funds in Saudi Arabia. Instead, this paper focuses on comparing the performance of the entire Islamic mutual funds industry relative to the entire conventional mutual funds industry in Saudi Arabia. Thus, it would make more sense if these funds were grouped into portfolios.
As a result, 24 equally-weighted portfolios (12 Islamic portfolios and 12 conventional portfolios, see table 9) were formed based on the following characteristics.14
14 According to Hoepner, Rammal, & Rezec (2009), “It is common practice to analyze portfolios of assets with religious of ethical characteristics based on equal weighted rather than value weighted portfolios. This practice ensures a focus on the assets religious or ethical characteristics and substantially reduces the risk of bias due to idiosyncratic return characteristics of a specific asset.” Further, because of information insufficiency, it is very difficult to apply value weighted approaches. Furthermore, Due to data insufficiency, historical data on the Arab countries focused portfolios both (Islamic and conventional) start from August 2004 instead of January 2003.

Center for Islamic Economics and Finance, Qatar Faculty of Islamic Studies, Qatar Foundation
15
1. The funds’ geographical focus (local, international, and Arab). 2. The funds’ the Shariah compliancy (Islamic and conventional). 3. Different market trends (overall, bull, bear, and financial crisis periods).
The equally weighted portfolios are calculated as follows:
𝑅𝑝,𝑡
= ∑ 𝑅𝑛𝑡𝑖=1 𝑖,𝑡
𝑛𝑡
.............................................................…………………………Equation ( 2)
where:
𝑅𝑝,𝑡 ∶ Return at month (t) for the portfolio (p). 𝑅𝑖,𝑡 ∶ Total return at month (t) of an individual fund (i). 𝑛𝑡 ∶ The number of individual fund under each category at month (t).
Table 6: List of all 24 Created Portfolios
The total sample consists of 143 mutual funds (96 Islamic and 47 conventional funds) in Saudi Arabia for the period from January 2003 to January 2010. From these funds 24
equally-weighted portfolios (12 Islamic and 12 conventional) were formed based on the funds’ 1) Geographical focus (local, international, and Arab), 2) Shariah compliancy (Islamic and conventional), 3) different market trends (overall period: January 2003 to January 2010, bull period: January 2003 to February 2006, bear period: March 2006 to January 2010, and financial crisis period: September 2008 to January 2010). The studied period is from January 2003 to January 2010 for all portfolios except for portfolios that are Arab focused. Both Arab countries focused portfolios (Islamic and conventional) start from August 2004.

Center for Islamic Economics and Finance, Qatar Faculty of Islamic Studies, Qatar Foundation
16
Panel A: Over all sample (January 2003-Janurary 2010)
Panel C: The bear period (March 2006-January2010)
Local Local Islamic portfolio 1 Islamic portfolio 7
non- Islamic portfolio1 non- Islamic portfolio7 International International
Islamic portfolio 2 Islamic portfolio 8 non-Islamic portfolio 2 non-Islamic portfolio 8
Arab Arab Islamic portfolio 3 Islamic portfolio 9
non-Islamic portfolio 3 non-Islamic portfolio 9 Panel B: The bull period (January 2003-Feberuary 2006)
Panel D: The Financial Crisis period (September 2008-January2010)
Local Local Islamic portfolio 4 Islamic portfolio 10
non- Islamic portfolio4 non- Islamic portfolio10 International International
Islamic portfolio 5 Islamic portfolio 11 non-Islamic portfolio 5 non-Islamic portfolio 11
Arab Arab Islamic portfolio 6 Islamic portfolio 12
non-Islamic portfolio 6 non-Islamic portfolio 12
B. B.1.
Regression Approach
The single-factor model was used to estimate the Jensen's alpha index as well as the systematic risk (beta). The Jenson’s alpha index is a relative risk-adjusted return measure that was first introduced by
Single-Factor Model (CAPM)
Michael Jensen in the 1970s to determine the abnormal return of a portfolio over the theoretical expected return using a capital asset pricing model (CAPM). Thus, the Jenson’s alpha index is the coefficient on the constant term in the single-factor model presented in the following equation:
𝑅𝑝𝑡 − 𝑅𝑓𝑡 = 𝛼𝑝 + 𝛽𝑝 �𝑅𝑚𝑡 − 𝑅𝑓𝑡�+ 𝜀𝑝𝑡
...................……………………Equation ( 3)
where:
𝑅𝑝𝑡 ∶ Rate of return of the portfolio (p) at time (t). 𝑅𝑓𝑡 ∶ Risk free rate measured by SIBOR one month maturity at time (t). 𝛼𝑝 ∶ The intercept. In the context of this model, it is also called Jensen’s (1967)
alpha, the selectivity skill coefficient. It is estimated using OLS regression. 𝛽𝑝 ∶ Portfolio's beta or the market risk being estimated using OLS regression.

Center for Islamic Economics and Finance, Qatar Faculty of Islamic Studies, Qatar Foundation
17
𝑅𝑚𝑡 ∶ The return on the market index at time (t). 𝜀𝑝𝑡 ∶ The error term with zero mean.
Note that only positive and significant alphas indicate that the portfolio has outperformed the market index.
The systematic risk (beta) is also called the market risk and it measures the sensitivity of the portfolio’s return to the market return. Therefore, it shows the riskiness of the portfolio that cannot be removed by diversification. A positive (negative) beta indicates that the portfolio’s return is positively (negatively) correlated with the market index. However, a zero beta indicates that the portfolio’s return has no correlation with the market index. Finally, beta is estimated by a simple linear regression and it is the coefficient on the market term in equation 3.
B.2.
The Treynor & Mazuy (1966) model measures both stock selection and market timing abilities. This model extends the Jensen’s alpha model by adding a quadratic term in the model. It is calculated as follows:
Treynor & Mazuy (1966) Model
𝑅𝑝𝑡 − 𝑅𝑓𝑡 = 𝛼𝑝 + 𝛽𝑝 �𝑅𝑚𝑡 − 𝑅𝑓𝑡�+ 𝛾𝑝 �𝑅𝑚𝑡 − 𝑅𝑓𝑡�
2+ 𝜀𝑝𝑡
....….…Equation ( 4)
where:
𝑅𝑝𝑡 ∶ Rate of return of the portfolio (p) at time (t). 𝑅𝑓𝑡 ∶ Risk free rate measured by SIBOR one month maturity at time (t). 𝛼𝑝 ∶ The intercept of the model. It is estimated using OLS regression analysis and
it is the selectivity skill coefficient. 𝛽𝑝 ∶ Portfolio's beta or the market risk being estimated using OLS regression
analysis. 𝑅𝑚𝑡 ∶ The return on the market index at time (t). 𝛾𝑝 ∶ This is the market timing coefficient for portfolio (p). 𝜀𝑝𝑡 ∶ The error term with zero mean
A positive and significant alpha indicates that managers possess selectivity skills. Further, this measure could be used as robustness to the Jensen’s alpha index. However, a positive and significant gamma ( 𝛾𝑝 ) indicates that managers are consistently able to time the market. This means that managers will increase their funds’ exposure to the market when they think that the market will do well and reduce their funds’ exposure to the market when they believe that the market will plummet.
B.3.
It has been very common in the literature that the single-factor asset pricing model is insufficiently able to fully explain the cross-sectional expected stock returns. Fama & French (1992), (1993), and (1996) illustrated the CAPM insufficiency in explaining the cross-sectional
Multifactor Model
Center for Islamic Economics and Finance, Qatar Faculty of Islamic Studies, Qatar Foundation
18
stock returns and introduced a 3-factor model that includes a risk factor related to size (SMB) and a risk factor related to book-to-market ratio (HML) in addition to the market excess returns. The findings of Fama and French imply that the 3-factor model will be incrementally useful in explaining mutual fund returns if fund managers significantly engage in style investment strategies, such as investing in small vs. large cap stocks or value (high book-to-market) vs. growth (low book-to-market) stocks.
However, although there are benefits from using Fama and French 3-factor model, there is a growing literature that indicates such model is subject to further improvements. That is, the 3-factor model is insufficiently capable in explaining the Jegadeesh & Titman (1993) momentum strategy of buying the past year’s return winners and selling short past losers. Thus, Carhart (1997) suggested the addition of a risk factor related to momentum to the existing 3-factor model to capture persistence in fund performance.
The resulting four-factor model is expected to provide reliable information on the funds’ performance relative to a market benchmark because it controls for different investment styles. Furthermore, there is growing evidence that the performance of Islamic funds is indeed attributed to style tilts, which cannot be accounted for using a single factor model. For example, Hoepner, Rammal, & Rezec (2009) found that Islamic funds were biased towards small stocks. Also, Abderrezak (2008) found that Islamic equity funds (IEFs) are biased towards both small cap firms and growth stocks.
This paper will follow both Fama & French (1993) and Carhart (1997) methodologies in order to construct a four-factor model that could explain the cross-sectional stock returns using almost all firms listed on the Saudi stock exchange (Tadawul).

Center for Islamic Economics and Finance, Qatar Faculty of Islamic Studies, Qatar Foundation
19
The following equation is estimated
Four-Factor Model Construction:
𝑅𝑝𝑡 − 𝑅𝑓𝑡 = 𝛼𝑝 + 𝛽𝑝 �𝑅𝑚𝑡 − 𝑅𝑓𝑡�+ 𝑠𝑝 𝑆𝑀𝐵𝑡 + ℎ𝑝 𝐻𝑀𝐿𝑡+ 𝑚𝑝 𝑀𝑂𝑀𝑡 + 𝜀𝑝𝑡
………..…………….Equation ( 5)
where:
𝑅𝑝𝑡 ∶ Rate of return of the portfolio (p) at time (t). 𝑅𝑓𝑡 ∶ Risk free rate measured by SIBOR one month maturity at time (t). 𝛼𝑝 ∶ The intercept of the model. It is estimated using OLS regression analysis and
it is the selectivity skill coefficient. 𝛽𝑝 ∶ Portfolio's beta or the market risk being estimated using OLS regression
analysis. 𝑅𝑚𝑡 ∶ The return on the market index at time (t). 𝑠𝑝 ∶ This is the size risk factor coefficient for portfolio (p). 𝑆𝑀𝐵𝑡 ∶ (Small minus big) Is the return on the mimicking portfolio for the common
size risk factor in Saudi stock returns ℎ𝑝 ∶ This is the book-to-market risk factor coefficient for portfolio (p). 𝐻𝑀𝐿𝑡 ∶ (High minus low) Is the return on the mimicking portfolio for the common
book-to-market risk factor in Saudi stock returns 𝑚𝑝 ∶ This is the momentum risk factor coefficient for portfolio (p). 𝑀𝑂𝑀𝑡 ∶ Is the return on the mimicking portfolio for the common momentum risk
factor in Saudi stock returns 𝜀𝑝𝑡 ∶ The error term with zero mean
In constructing this four-factor model, all firms listed on the Saudi Stock Exchange (Tadawul) and had available data on stock prices, book values of equity, and total shares outstanding from January 2002 to January 2010 were considered. The final sample included 123 out of 135 listed firms from December 2003 to January 2010. The market value is calculated by multiplying the total shares outstanding by the stock price for that period. The book-to-market value is calculated by dividing the book value of equity by the market value. For the excess market returns, the six market indices in excess of the SIBOR one month maturity were used as market benchmarks.
The calculation of the SMB and HML risk factors will follow Fama & French (1993) methodology, and the calculation of the MOM risk factor will follow Carhart (1997) methodology. Basically six portfolios were created from sorts of stocks on total market value (size) and book-to-market ratios to form portfolios meant to mimic the underlying risk factors in returns that are related to size and book-to-market. And another six portfolios were created from sorts of stocks on total market value (size) and past ten-month returns (momentum) to form a portfolio meant to mimic the underlying risk factor in persistence of returns.
To further elaborate, all stocks were ranked each month based on their total market value (size). Then using the median of the market value, stocks were split into two groups: small (S)

Center for Islamic Economics and Finance, Qatar Faculty of Islamic Studies, Qatar Foundation
20
and big (B). Stocks are ranked again each month, but this time the ranking is based on the book-to-market ratios. These stocks were spited into three book-to-market groups based on the breakpoints for the bottom 30 percent (low: L), middle 40 percent (Medium: M), and top 30 percent (High: H).
Then six portfolios were constructed based on the intersection of two size and three book-to-market groups. Thus, there will be (S/L, S/M, S/H, B/L, B/M, and B/H). For example, B/H portfolio indicates that this portfolio contains only returns on stocks that are in the big and high book-to-market groups.
Similar procedure was done to construct six portfolios based on the intersection of two size and three momentum groups. That is, first stocks were ranked each month based on past ten-month returns and then grouped into three groups lowest 30 percent past ten-month returns (losers: L), middle 40 percent past ten-month returns (Mediocre: M), and highest 30 percent past ten-month returns (winners: W). The six constructed portfolios are (S/L, S/M, S/W, B/L, B/M, and B/W) where B/W portfolio contains only returns on stocks that are in the big and winner groups.
SMB (small minus big) is calculated by taking the average return on the three small portfolios minus the average return on the three big portfolios. This difference is expected to make the created portfolio mimicking the risk factor that is related to size largely free from the book-to-market influence and more focused on the difference return between small and big stocks. It is calculated as follows:
SMB= 1/3 (S/L + S/M + S/H) – 1/3 (B/L + B/M + B/H) ………………………………..........Equation ( 6)
HML (high minus low) is calculated by taking the average return on the two value portfolios minus the average return on the two growth portfolios. This difference is expected to make the created portfolio mimicking the risk factor that is related to the book-to-market largely free from the size influence and more focused on the difference return between value (high book-to-market) and growth (low book-to-market) stocks. It is calculated as follows:
HML= 1/2 (S/H + B/H) – 1/2 (S/L + B/L) ………………………………………………………..Equation ( 7)
MOM (winners minus losers) is calculated by taking the average return on the two highest 30 percent past ten-month return portfolios (winners) minus the average return on the two lowest 30 percent past ten-month return portfolios (losers). This difference is expected to make the created portfolio mimicking the risk factor related to the momentum largely free from the size influence and more focused on the difference return between momentum (buying past ten-month return winners) and contrarian (selling past short losers) stocks. It is calculated as follows:
MOM= 1/2 (S/W + B/W) – 1/2 (S/L + B/L) ………………………………………………….….Equation ( 8)
Finally, it is worthy to note that all factor portfolios are value-weighted and are rebalanced monthly. Table 7 reports the summary statistics of all factors: SMB, HML, and MOM.

Center for Islamic Economics and Finance, Qatar Faculty of Islamic Studies, Qatar Foundation
21
Table 7: Summary Statistics on the Risk Factors
This table reports the summary statistics of all calculated risk factors: SMB, HML, and MOM from the four-factor model for the period from December 2003 to January 2010. The calculation of the SMB and HML risk factors will follow Fama & French (1993) methodology, and the calculation of the MOM risk factor will follow Carhart (1997) methodology. Basically six portfolios were created from sorts of stocks on total market value (2 groups) and book-to-market ratios (3 groups) to form portfolios meant to mimic the underlying risk factors in returns that are related to size and book-to-market. And another six portfolios were created from sorts of stocks on total market value (2 groups) and past ten-month returns (3 groups) to form a portfolio meant to mimic the underlying risk factor in persistence of returns.
SMB (small minus big) is calculated by taking the average return on the three small portfolios minus the average return on the three big portfolios: SMB= 1/3 (S/L + S/M + S/H) – 1/3 (B/L + B/M + B/H). HML (high minus low) is calculated by taking the average return on the two value portfolios minus the average return on the two growth portfolios: HML= 1/2 (S/H + B/H) – 1/2 (S/L + B/L). MOM (winners minus losers) is calculated by taking the average return on the two highest 30% past ten-month return portfolios (winners) minus the average return on the two lowest 30% past ten-month return portfolios (losers): MOM= 1/2 (S/W + B/W) – 1/2 (S/L + B/L). All factor portfolios are value-weighted and are rebalanced monthly.

Center for Islamic Economics and Finance, Qatar Faculty of Islamic Studies, Qatar Foundation
22
Panel A: Over all sample (December 2003-Janurary 2010) Mean Media
n St.
Dev. Min Max
SMB -
0.2879
-0.3454 0.4697
-1.747
9
1.1874
HML -
0.5097
-0.2645 0.6895
-2.770
6
0.6314
MOM 4.1565 3.3106 2.6873 1.293
7 11.76
11 Panel B: The bull period (December 2003-Feberuary 2006)
Mean
Median
St. Dev. Min Max
SMB -
0.1527
-0.103 0.4835 -
0.9284
1.0521
HML -0.861 -0.6959 0.8411
-2.150
9
0.3394
MOM 5.5776 4.1322 3.4168 1.293
7 11.76
11 Panel C: The bear period (March 2006-January2010)
Mean
Median
St. Dev. Min Max
SMB -
0.3656
-0.3622 0.4485
-1.747
9
1.1874
HML -
0.3079
-0.2475 0.4904
-2.770
6
0.6314
MOM 3.3402 3.1989 1.7308 1.301
3 7.976
Panel D: The Financial Crisis period (September 2008-January2010)
Mean
Median
St. Dev. Min Max
SMB -
0.3924
-0.3819 0.1106
-0.735
2 -0.256
HML -
0.2541
-0.255 0.0945 -
0.4301
-0.069
7
MOM 1.75 1.8345 0.3011 1.3013
2.2929

Center for Islamic Economics and Finance, Qatar Faculty of Islamic Studies, Qatar Foundation
23
Empirical Results and Discussions
A.
Table 8 presents the descriptive statistics of the created fund portfolios. These portfolios are based on the Saudi mutual funds’ geographical focus (local, international, and Arab), Shariah compliancy (Islamic and conventional), and different market trends (overall, bull, bear, and financial crisis periods). For each portfolio the mean, median, variance, minimum, and maximum of the non risk-adjusted returns are reported.
Non-Risk Adjusted Returns Analysis
Table 8: Summary Statistics of the non-Risk Adjusted Returns
The total sample consists of 143 mutual funds (96 Islamic and 47 conventional funds) in Saudi Arabia for the period from January 2003 to January 2010. From these funds 24 equally-weighted portfolios were formed based on the funds’: 1) geographical focus (local, international, and Arab), 2) Shariah compliancy (Islamic and conventional), and 3) different market trends (overall period: Jan. 2003 to Jan. 2010, bull period: Jan. 2003 to Feb. 2006, bear period: Mar. 2006 to Jan. 2010, and financial crisis period: Sept. 2008 to Jan. 2010). The studied period is from Jan. 2003 to Jan. 2010 for all portfolios except for portfolios that are Arab focused. Both Arab countries focused portfolios (Islamic and conventional) start from Aug. 2004. In this table the summary statistics for all 24 portfolios along with all six market indices are reported.
The market benchmarks used are divided into two main groups: Islamic and conventional indices: The Islamic indices are: 1) GCC Islamic: Global Index of the GCC Islamic Index (to benchmark locally focused Islamic funds). 2) MSCI World Islamic: MSCI World Islamic Index (to benchmark internationally focused Islamic funds). 3) MSCI Arab Mrk Islamic: MSCI Arab Markets Domestic Islamic Index excluding Saudi Arabia (to benchmark Arabian countries focused Islamic funds). The conventional indices are: 1) TASI: Tadawul All Share Index (to benchmark locally focused conventional funds). 2) MSCI World Index: MSCI World Index IMI (to benchmark internationally focused conventional funds). 3) MSCI Arab Mrk Index: MSCI Arabian Markets Domestic Index excluding Saudi Arabia (to benchmark Arabian countries focused conventional funds). Further, a mean difference t-tests is performed to examine any mean difference in non-risk adjusted returns between Islamic and conventional portfolios as well as between portfolios and their respective and most coherent market indices. Similarly, a non-parametric statistical test using the Mann-Whitney test is performed to test for any statistical differences in the median between Islamic and conventional portfolios. Also an F-test for variance differences between Islamic and conventional portfolios is performed. Panel A, B, C, and D reports the results for the overall, bull, bear, and financial crisis periods, respectively.

Center for Islamic Economics and Finance, Qatar Faculty of Islamic Studies, Qatar Foundation
24
Panel A: Over all sample (January 2003-Janurary 2010) Mean Media
n Varian
ce Min Max
Local Islamic portfolio 0.27
% 0.30% 0.03% -5.37% 3.76%
non-Islamic portfolio 0.37% 0.51% 0.07% -
6.19% 5.66%
The difference -
0.11%
-0.21% -0.04%
GCC Islamic 1.13% 2.40% 0.88%
-32.25
%
15.54%
Diff b/w Islamic portfolio & GCC Islamic -
0.86%
TASI 1.02% 2.54% 0.95%
-29.78
%
17.90%
Diff b/w non- Islamic portfolio & TASI -
0.65%
International Islamic portfolio 0.27
% 0.45% 0.0079%
-3.09% 1.89%
non-Islamic portfolio 0.13% 0.17% 0.0067
% -
3.63% 1.73%
The difference 0.14% 0.28% 0.0012
%
MSCI World Islamic 0.61% 1.27% 0.19%
-18.80
% 8.15%
Diff b/w Islamic portfolio & MSCI World Islamic
-0.34%
MSCI World Index 0.50% 1.56% 0.23%
-21.67
%
10.89%
Diff b/w non- Islamic portfolio & MSCI World Index
-0.37%
Arab Islamic portfolio 0.17 0.30% 0.14% - 8.49%

Center for Islamic Economics and Finance, Qatar Faculty of Islamic Studies, Qatar Foundation
25
% 12.34%
non-Islamic portfolio 0.21% 0.51% 0.13%
-10.31
% 8.47%
The difference -
0.04%
-0.21% 0.01%
MSCI Arab Mrk Islamic 0.46% 1.01% 0.95%
-29.20
%
26.17%
Diff b/w Islamic portfolio & MSCI Arab Mrk Islamic
-0.30%
MSCI Arab Mrk Index 0.40% 0.61% 0.64%
-26.76
%
19.05%
Diff b/w non- Islamic portfolio & MSCI Arab Mrk Index
-0.19%
SIBOR 0.24
% 0.24% 0.0002% 0.03% 0.43%
*, **, *** significant at 10%, 5%, 1%, respectively.
Further, table 11 reports a mean difference t-test between Islamic and conventional portfolios. Similarly, a non-parametric statistical test using the Mann-Whitney test is also performed in order to test for any statistical differences in the non-risk adjusted median returns between Islamic and conventional portfolio. Finally, an F-test is performed in order to test for differences in the variance between Islamic and conventional portfolios. Additionally, table 11 reports a mean difference t-test between portfolios (Islamic and conventional) and their most coherent and respective market benchmarks
To illustrate, the market indices and the portfolios that these indices are suppose to benchmark are as follows: 1) Global Index of the GCC Islamic Index (to benchmark the locally focused Islamic portfolio). 2) MSCI World Islamic Index (to benchmark the internationally focused Islamic portfolio). 3) MSCI Arab Markets Domestic Islamic Index excluding Saudi Arabia (to benchmark the Arabian countries focused Islamic portfolio). 4) Tadawul All Share Index (TASI) (to benchmark the locally focused conventional portfolio). 5) MSCI World Index IMI (to benchmark the internationally focused conventional portfolio). 6) MSCI Arabian Markets Domestic Index excluding Saudi Arabia (to benchmark the Arabian countries focused conventional portfolio).
Moreover, table 11 is divided into 4 panels. Panel A covers the overall sample period (January 2003 to January 2010), panel B covers the bull period (January 2003 to February 2006),

Center for Islamic Economics and Finance, Qatar Faculty of Islamic Studies, Qatar Foundation
26
panel C covers the bear period (March 2006 to January 2010), and panel D covers the financial crisis period (September 2008 to January 2010).
In general, during the overall sample period, the mean and median of the non-risk adjusted returns show that there was no statistical evidence that there existed any differences in performance between Islamic and conventional portfolios. Similarly, using the variance as a measure of the total risk, the results indicate that there was no statistical evidence that there existed any differences in the total risk between Islamic and conventional portfolios. These results hold regardless of the portfolios’ geographical focus.
Furthermore, regardless of the portfolios’ geographical focus, the results during the overall sample period revealed that both Islamic and conventional portfolios marginally, and not significantly, underperformed their respective market indices.
Breaking the sample period into different market trends, the results during the bull period (table 11, panel B) show that there was no statistical evidence that there existed any differences in performance between Islamic and conventional portfolios that are both locally and Arab focused. Furthermore, there was no statistical evidence that there existed any differences in the total risk between these portfolios.
Panel B: The bull period (January 2003-Feberuary 2006) Mean Media
n Variance Min Max
Local Islamic portfolio 0.70% 0.57% 0.01% -
1.30% 2.87%
non-Islamic portfolio 1.15% 1.02% 0.03% -4.80%
4.61%
The difference -0.45% -0.45% -0.02% GCC Islamic 5.71% 4.76% 0.26% -
2.26% 15.54
%
Diff b/w Islamic portfolio & GCC Islamic -
5.00%***
TASI 5.40% 5.13% 0.23% -6.59%
14.34%
Diff b/w non- Islamic portfolio & TASI -
4.25%***
International Islamic portfolio 0.58% 0.59% 0.0024% -
0.42% 1.72%
non-Islamic portfolio 0.21% 0.19% 0.0005% -0.23%
0.82%
The difference 0.37%***
0.40%***
0.0019%***
MSCI World Islamic 1.37% 1.44% 0.07% - 6.64

Center for Islamic Economics and Finance, Qatar Faculty of Islamic Studies, Qatar Foundation
27
3.31% % Diff b/w Islamic portfolio & MSCI World
Islamic -0.79%*
MSCI World Index 1.54% 1.82% 0.07% -3.62%
8.15%
Diff b/w non- Islamic portfolio & MSCI World Index
-1.33%*
**
Arab Islamic portfolio 1.78% 0.73% 0.08% -
6.41% 6.72%
non-Islamic portfolio 2.36% 1.76% 0.08% -1.63%
8.47%
The difference -0.58% -1.03% 0.00%
MSCI Arab Mrk Islamic 5.70% 7.63% 1.12% -
10.56%
26.17%
Diff b/w Islamic portfolio & MSCI Arab Mrk Islamic -3.93%
MSCI Arab Mrk Index 4.25% 4.35% 0.55% -8.13%
19.05%
Diff b/w non- Islamic portfolio & MSCI Arab Mrk Index -1.89%
SIBOR 0.21% 0.17% 0.0001% 0.10% 0.43
% *, **, *** significant at 10%, 5%, 1%, respectively.
However, looking at the internationally focused portfolios (both Islamic and conventional), it seemed that the Islamic portfolio significantly performed better and was also considered more risky than the internationally focused conventional portfolio. Such results were statistically significant at 1 percent when looking at the difference in mean, median, and variance tests. The internationally Islamic portfolio earned around 0.37 percent average returns more than the internationally focused conventional portfolio.
Also, the results during the bull sample period revealed that locally and internationally focused portfolios (Islamic and conventional) significantly underperformed their respective locally and internationally market indices. However, Arab focused portfolios (Islamic and conventional) marginally, and not significantly, underperformed their respective market indices.

Center for Islamic Economics and Finance, Qatar Faculty of Islamic Studies, Qatar Foundation
28
Panel C: The bear period (March 2006-January2010) Mean Media
n Varian
ce Min Max
Local Islamic portfolio -
0.08% -
0.25% 0.04% -5.37% 3.76%
non-Islamic portfolio -0.24%
-0.55% 0.09% -6.19% 5.66%
The difference 0.16% 0.30% -0.05%
GCC Islamic -2.48%
-2.68% 1.08%
-32.25
%
14.45%
Diff b/w Islamic portfolio & GCC Islamic 2.40%
TASI -2.42%
-1.88% 1.25%
-29.78
%
17.90%
Diff b/w non- Islamic portfolio & TASI 2.18% International Islamic portfolio 0.02% 0.02% 0.011% -3.09% 1.89% non-Islamic portfolio 0.07% 0.16% 0.012% -3.63% 1.73%
The difference -0.05%
-0.14%
-0.001%
MSCI World Islamic 0.002% 1.05% 0.28%
-18.80
% 8.15%
Diff b/w Islamic portfolio & MSCI World Islamic 0.02%
MSCI World Index -0.32% 0.97% 0.35%
-21.67
%
10.89%
Diff b/w non- Islamic portfolio & MSCI World Index 0.39%
Arab
Islamic portfolio -0.48% 0.11% 0.15%
-12.34
% 8.49%
non-Islamic portfolio -0.66%
-0.50% 0.13%
-10.31
% 4.40%
The difference 0.18% 0.62% 0.02%
MSCI Arab Mrk Islamic -1.65% 0.50% 0.75%
-29.20
%
12.81%
Diff b/w Islamic portfolio & MSCI Arab Mrk Islamic 1.17%
MSCI Arab Mrk Index - - 0.60% - 11.40

Center for Islamic Economics and Finance, Qatar Faculty of Islamic Studies, Qatar Foundation
29
1.16% 0.48% 26.76%
%
Diff b/w non- Islamic portfolio & MSCI Arab Mrk Index 0.50%
SIBOR 0.27% 0.33% 0.0003% 0.03% 0.43%
*, **, *** significant at 10%, 5%, 1%, respectively.
During adverse market trends - bear (panel C) and financial crisis (panel D) periods - the mean and median of the non-risk adjusted returns show that there was no statistical evidence that there existed any differences in performance between Islamic and conventional portfolios. Similarly, the results indicate that there was no statistical evidence that there existed any differences in the total risk between Islamic and conventional portfolios. These results hold regardless of the portfolios’ geographical focus.
Furthermore, regardless of the portfolios’ geographical focus, the results during both bear (panel C) and financial crisis (panel D) periods reveal that both Islamic and conventional portfolios marginally, and not significantly, performed less badly than their respective market benchmark.
Panel D: The Financial Crisis period (September 2008-January2010) Mean Median Variance Min Max
Local Islamic portfolio -0.49% -0.39% 0.04% -5.37% 2.86% non-Islamic portfolio -0.96% -0.92% 0.07% -5.80% 3.43%
The difference 0.47% 0.53% -0.03% GCC Islamic -3.92% -3.52% 1.08% -28.41% 14.45% Diff b/w Islamic portfolio & GCC
Islamic 3.44% TASI -1.98% 0.12% 1.24% -29.78% 17.90%
Diff b/w non- Islamic portfolio & TASI 1.03% International Islamic portfolio -0.21% -0.02% 0.018% -3.09% 1.89%
non-Islamic portfolio -0.22% -0.04% 0.020% -3.63% 1.73% The difference 0.01% 0.03% -0.002% MSCI World Islamic -0.91% 2.21% 0.62% -18.80% 8.15%
Diff b/w Islamic portfolio & MSCI World Islamic 0.70%
MSCI World Index -1.03% 2.01% 0.79% -21.67% 10.89% Diff b/w non- Islamic portfolio & MSCI
World Index 0.80%
Arab Islamic portfolio -1.58% -1.62% 0.15% -12.34% 3.48% non-Islamic portfolio -1.80% -1.41% 0.19% -10.31% 3.87%
The difference 0.22% -0.21% -0.04%

Center for Islamic Economics and Finance, Qatar Faculty of Islamic Studies, Qatar Foundation
30
MSCI Arab Mrk Islamic -4.31% -3.00% 1.32% -29.20% 12.12% Diff b/w Islamic portfolio & MSCI
Arab Mrk Islamic 2.73% MSCI Arab Mrk Index -3.61% -2.89% 1.12% -26.76% 10.61%
Diff b/w non- Islamic portfolio & MSCI Arab Mrk Index 1.82%
SIBOR 0.10% 0.05% 0.0001% 0.03% 0.35% *, **, *** significant at 10%, 5%, 1%, respectively.
The non-risk-adjusted return results during the overall sample period indicate that there was no statistical evidence that there existed any performance or risk differences between Islamic and conventional portfolios, regardless of the portfolio geographical focus. Similar results were observed when looking at the adverse market trend periods (bear and financial crisis periods).
Discussion
A closer look at the bullish market trend period, the results also show that there were no differences in performance or risk between both Islamic and conventional portfolios when these portfolios are locally and Arab focused portfolios.
On the other hand, the results regarding the internationally focused portfolios show that the internationally focused Islamic portfolio performed better and was considered more risky than its peer the international focused conventional portfolio. This is very much consistent with the risk-return tradeoff theory: more risk is accompanied by more return in order to compensate for the level of risk assumed. But at the same time, these results contradict what was hypothesized regarding the expected behavior of Islamic mutual funds. That is, since the investment universe of Islamic funds is considered a subset in the investment universe of conventional funds, then it was expected that Islamic funds either perform worse or as good as conventional funds but not better. By the same token, it was expected that Islamic funds are either less or as risky as their peers conventional funds but not more risky than their peers.
As for comparing the performance of the fund portfolios relative to their respective market benchmarks, the results show that there was no evidence that there existed any performance differences between both Islamic and conventional fund portfolios and their respective market benchmarks. Such results holds during the overall, bear, and financial crisis periods.
However, when looking at the bull period, the results show that only locally and internationally focused portfolios (Islamic and conventional) significantly underperformed their respective market benchmarks. But the Arab focused portfolios (Islamic and conventional) did not show any evidence that there were performance differences between them and their respective market benchmarks.

Center for Islamic Economics and Finance, Qatar Faculty of Islamic Studies, Qatar Foundation
31
At the end, it is worthy to note that these results were before adjusting for risk. It could be the case that adjusting for risk would reveal a different story.
B.
This section will cover three common regression models: 1) A single factor model (CAPM) in order to estimate the Jenson’s Alpha index and the systematic risk (beta). 2) The Treynor and Mazuy (1966) model in order to estimate the selection and market timing abilities. 3) Multifactor model in the spirit of Carhart (1997) four-factor model in order to control for common investment styles. Furthermore, in all regression models, each Islamic and conventional portfolio is benchmarked against Islamic and then conventional indices that have the same geographical focus as the examined portfolio.
Regression Approach Analysis
It is worthy to note that since funds are assembled into portfolios, then it would be more appropriate to use the systematic risk (beta) than the total risk (the variance) to assess the riskiness of the fund portfolios. This is because funds’ specific risk will most likely be diversified away when these funds are grouped into portfolios.
Furthermore, in order to test if there is any evidence that there existed any differences in performance between Islamic and conventional portfolios, this paper reports the results and tests on the “difference portfolio.” This “difference portfolio” is constructed by subtracting the returns of the conventional portfolio from the returns of the Islamic portfolio. Similar procedure is followed to test the existence of any risk or investment style differences between Islamic and conventional portfolios.
B.1.
A single-factor model is employed to estimate the Jenson’s alpha index, which is one of the most commonly used measures for assessing the performance of mutual funds, and the systematic risk (beta). As discussed before, funds have superior performance over the employed market benchmark if and only if alpha was positive and significant.
Single-Factor Model (CAPM)
Table 9: Single-Factor Model (CAPM)
This table reports the results from the single-factor model (CAPM). The total sample consists of 143 mutual funds (96 Islamic and 47 conventional funds) in Saudi Arabia for the period from January 2003 to January 2010. From these funds 24 equally-weighted portfolios were formed based on the funds’: 1) Geographical focus (local, international, and Arab), 2) Shariah compliancy (Islamic and conventional), 3) different market trends (overall period: January 2003 to January 2010, bull period: January 2003 to February 2006, bear period: March 2006 to January 2010, and financial crisis period: September 2008 to January 2010). All Arab focused portfolios (Islamic and conventional) start from August 2004. Other than that all portfolios start from January 2003. To overcome the benchmark problem and enhance comparability, each portfolio is benchmarked against Islamic and then conventional market indices that have the same geographical focus as the examined portfolio. The locally focused indices are: the GCC Islamic (Global Index of the GCC Islamic Index) and TASI (Tadawul All Share Index). The

Center for Islamic Economics and Finance, Qatar Faculty of Islamic Studies, Qatar Foundation
32
internationally focused indices are: MSCI World Islamic (MSCI World Islamic Index) and MSCI World Index IMI. The Arab focused indices are: MSCI Arab Mrk Islamic (MSCI Arab Markets Domestic Islamic Index excluding Saudi Arabia) and MSCI Arab Mrk Index (MSCI Arabian Markets Domestic Index excluding Saudi Arabia). Also, this table reports the results of testing the difference in the Jenson’s alpha index as well as the difference in the systematic risk (beta) between Islamic and conventional portfolios. Panel A, B, C, and D reports the results on the locally focused portfolios, internationally focused portfolios, Arab focused portfolios, and the Adjusted R-squared from all regressions, respectively. Finally, all standard errors are corrected for heteroscedasticity problems using White’s (1980) correction test.
Panel A: Locally Focused Portfolios
Measure
Index
Overall sample Bull Bear Financial Crisis
Islamic Conven. Islamic Conve
n. Islamic Conven. Islamic Conve
n.
Jens
on A
lpha
Inde
x GCC
Islamic
-0.08% -0.01% 0.24% 0.25% 0.00% -0.07% 0.15% -0.16%
Diff -0.07% -0.01% 0.07% 0.31%
TASI -0.08% -0.02% -0.09% -0.29% 0.03% -0.01%
-0.21%*
*
-0.59%*
Diff -0.06% 0.20% 0.04% 0.38%
Syst
emat
ic R
isk
Bet
a GCC
Islamic
11.12%***
15.74%*** 4.56% 12.45%
*** 12.60%
*** 15.85%
*** 18.18%
*** 22.27%
***
Diff -4.62% -7.89% -3.25% -4.09% TAS
I 13.10%
*** 19.09%
*** 11.08%
*** 23.65%
*** 13.94%
*** 18.60%
*** 18.01%
*** 22.32%
*** Diff -5.99%** -12.57%** -4.67% -4.31%
*, **, *** significant at 10%, 5%, 1%, respectively.
Panel A in table 9 reports the results of the Jenson alpha index as well as the systematic risk (beta) from the single factor model for the locally focused portfolios (both Islamic and conventional). Looking at the performance of both locally focused portfolios (Islamic and conventional) relative to the locally focused market benchmarks (Islamic and conventional indices), the results indicate the following. During the overall period, neither Islamic nor conventional portfolios outperformed the market, regardless what locally focused market benchmark was used to adjust for risk. Similar results were obtained during the bull, bear, and financial crisis periods. That is, alphas were either negative or positive but insignificant.
Looking at the performance differences between Islamic and conventional portfolios, the results from the “difference portfolio” indicate that there was no statistical evidence that there existed any differences in performance between Islamic and conventional portfolios. This result

Center for Islamic Economics and Finance, Qatar Faculty of Islamic Studies, Qatar Foundation
33
holds during all studied periods, regardless what locally focused market benchmark was used to adjust for risk.
The riskiness results, measured by the systematic risk (beta), of the locally focused portfolios indicate that during all studied periods (overall, bull, bear, and financial crisis periods); all betas were positive and highly significant regardless what locally focused market benchmark was used to adjust for risk. This means that returns of both locally focused portfolios (Islamic and conventional) were positively correlated with both Islamic and conventional market returns. However, there is one exception. That is, there was no statistical evidence that there was a co-movement between the locally focused Islamic portfolio and the locally focused Islamic index (GCC Islamic Index) during the bull period.
Looking at the systematic risk differences between Islamic and conventional portfolios, the results from the “difference portfolio” indicate that the existence of any differences depends on the market benchmark used. That is, when the locally focused Islamic index (GCC Islamic Index) was used to adjust for risk, the results indicate that there existed no differences in risk between Islamic and conventional portfolios. This was true during all studied sample periods. However, when the locally focused conventional index (TASI) was used to adjust for risk, the results indicate that the Islamic portfolio was almost 6 and 12.57 percent less risky than the conventional portfolio during the overall and bull period, respectively. But there existed no statistical evidence that there were any differences in risk during adverse economic periods (bear and financial crisis periods).
Panel B: Internationally Focused Portfolios
Measure
Index
Overall sample Bull Bear Financial Crisis
Islamic Conven.
Islamic
Conven. Islamic Conven
. Islamic Conven.
Jens
on A
lpha
Inde
x
MSCI
World
Islamic
-0.03% -
0.17%***
0.28%***
-0.05%
**
-0.21%*
*
-0.15%* -0.15% -0.15%
Diff 0.14% 0.33%*** -0.06% 0.00% MSC
I Worl
d Inde
x
-0.01% -
0.15%***
0.28%***
-0.05%
**
-0.17%* -0.11% -0.14% -0.15%
Diff 0.13% 0.33%*** -0.06% 0.01%
Syst
emat
ic
Ris
k B
eta MSCI
World
Isla
14.82%***
14.92%***
7.53%**
4.35%***
15.32%***
17.02%***
15.71%***
16.76%***

Center for Islamic Economics and Finance, Qatar Faculty of Islamic Studies, Qatar Foundation
34
mic Diff -0.10% 3.18% -1.70% -1.05%
MSCI
World
Index
13.68%***
13.49%***
7.07%**
4.00%***
13.91%***
15.24%***
14.44%***
14.96%***
Diff 0.20% 3.07% -1.32% -0.52% *, **, *** significant at 10%, 5%, 1%, respectively.
Panel B in table 9 reports the results of the Jenson alpha Index as well as the systematic risk (beta) for the internationally focused portfolios (both Islamic and conventional). Looking at the performance of both internationally focused portfolios (Islamic and conventional) relative to the internationally focused market benchmarks (both Islamic and conventional), the results indicate the following. During the overall period, neither Islamic nor conventional portfolios outperformed the market index, regardless what internationally focused market benchmark was used to adjust for risk. Similar results were obtained during the bear and financial crisis periods.
However, during the bull period, there was statistical evidence that the internationally focused Islamic portfolio significantly, at 1 percent, outperformed both internationally focused market indices (Islamic and conventional). The outperformance was around 0.28 percent in both cases.
Looking at the performance differences between Islamic and conventional portfolios, the results from the “difference portfolio” indicate that there was no statistical evidence that there existed any differences in performance between Islamic and conventional portfolios. This result holds during only the overall, bear, and financial crisis periods. Further, such result holds regardless what internationally focused market benchmark was used to adjust for risk. However, during the bull period, there was statistical evidence that the internationally focused Islamic portfolio significantly, at 1 percent, outperformed its respective peer when both internationally focused market indices (Islamic and conventional) were used. The outperformance was around 0.33 percent in both cases.
The riskiness results of the internationally focused portfolios indicate that during all sample periods (overall, bull, bear, and financial crisis periods), all betas were positive and highly significant, regardless what internationally focused market benchmark was used to adjust for risk.
Looking at the systematic risk differences between Islamic and conventional portfolios, the results from the “difference portfolio” indicate that there was no statistical evidence that there existed any differences in risk between Islamic and conventional portfolios during all studied periods. This result holds regardless what internationally focused market benchmark was used to adjust for risk.

Center for Islamic Economics and Finance, Qatar Faculty of Islamic Studies, Qatar Foundation
35
Panel C in table 9 reports the results of the Jenson alpha index as well as the systematic risk (beta) for the Arab focused portfolios (both Islamic and conventional). Looking at the performance of both Arab focused portfolios (Islamic and conventional) relative to the Arab focused market benchmarks (both Islamic and conventional), the results indicate the following. During the overall period, neither Islamic nor conventional portfolios outperformed the market index, regardless what Arab focused market benchmark was used to adjust for risk. Similar results were obtained during the bear and financial crisis periods.
However, during the bull period, there was statistical evidence that the Arab focused Islamic portfolio significantly, at 10 percent, outperformed only the Arab focused Islamic index (MSCI Arab Markets Domestic Islamic Index). The outperformance was around 0.86 percent. Also, there was statistical evidence that the Arab focused conventional portfolio significantly outperformed both Arab focused market indices (Islamic and conventional). The outperformance was around 1.24 and 1.12 percent when the Arab focused conventional portfolio was benchmarked against the Arab focused Islamic index (MSCI Arab Markets Domestic Islamic Index) and the Arab focused conventional index (MSCI Arab Markets Domestic Index), respectively.
Panel C: Arab Focused Portfolios
Measure
Index
Overall sample Bull Bear Financial Crisis
Islamic Conven. Islamic Conve
n. Islamic Conven. Islamic Conve
n.
Jens
on A
lpha
Inde
x
MSCI
Arab
Mrk Islamic
-0.15% -0.12% 0.86%* 1.24%** -0.17% -0.32% -0.37% -0.36%
Diff -0.03% -0.38% 0.16% -0.02% MSCI
Arab
Mrk Inde
x
-0.14% -0.11% 0.65% 1.12%* -0.27% -0.43% -0.48% -0.52%
Diff -0.03% -0.48% 0.16% 0.05%
Syst
emat
ic R
isk
Bet
a
MSCI
Arab
Mrk Islamic
24.16%***
27.37%***
11.50%**
15.19%***
30.33%***
31.74%***
29.53%***
34.91%***
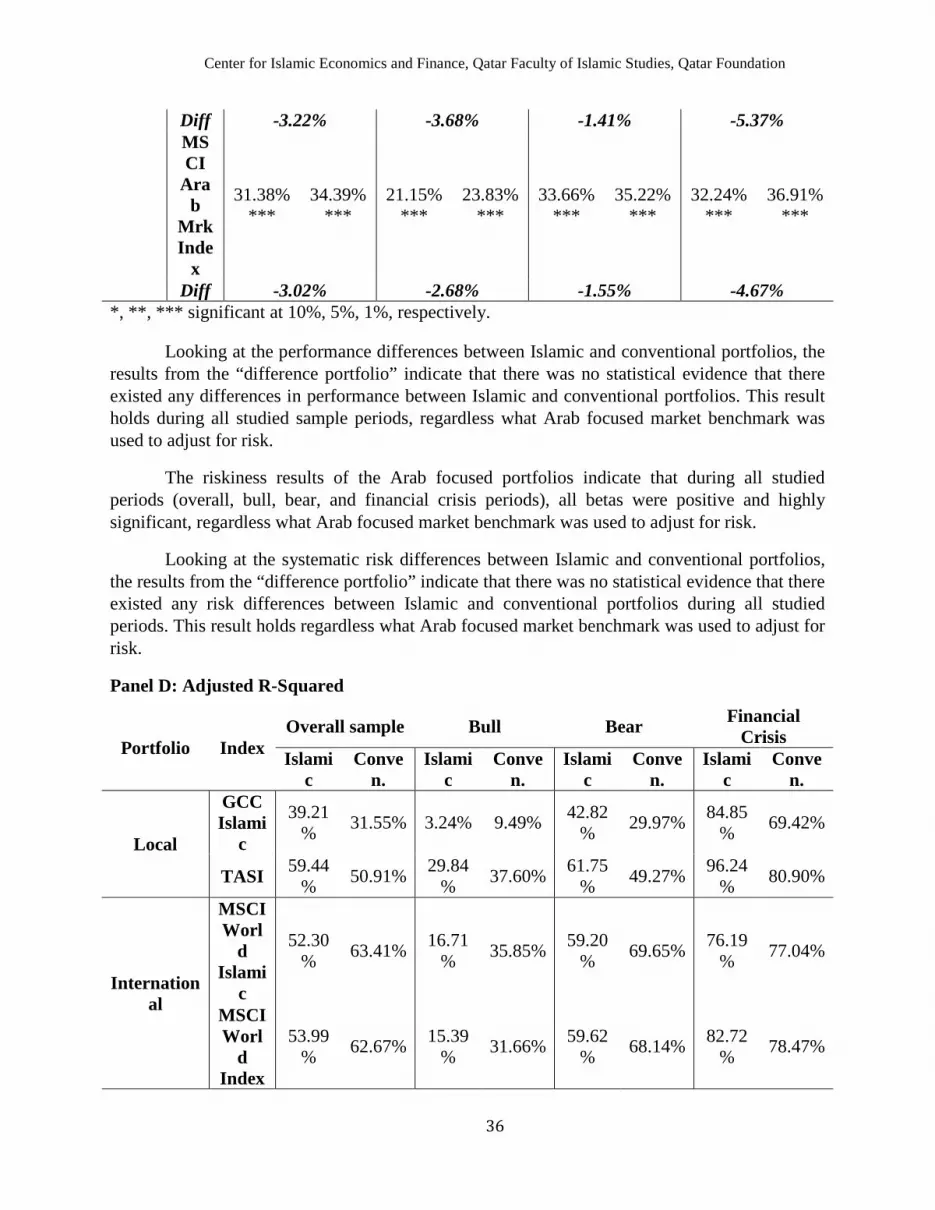
Center for Islamic Economics and Finance, Qatar Faculty of Islamic Studies, Qatar Foundation
36
Diff -3.22% -3.68% -1.41% -5.37% MSCI
Arab
Mrk Inde
x
31.38%***
34.39%***
21.15%***
23.83%***
33.66%***
35.22%***
32.24%***
36.91%***
Diff -3.02% -2.68% -1.55% -4.67% *, **, *** significant at 10%, 5%, 1%, respectively.
Looking at the performance differences between Islamic and conventional portfolios, the results from the “difference portfolio” indicate that there was no statistical evidence that there existed any differences in performance between Islamic and conventional portfolios. This result holds during all studied sample periods, regardless what Arab focused market benchmark was used to adjust for risk.
The riskiness results of the Arab focused portfolios indicate that during all studied periods (overall, bull, bear, and financial crisis periods), all betas were positive and highly significant, regardless what Arab focused market benchmark was used to adjust for risk.
Looking at the systematic risk differences between Islamic and conventional portfolios, the results from the “difference portfolio” indicate that there was no statistical evidence that there existed any risk differences between Islamic and conventional portfolios during all studied periods. This result holds regardless what Arab focused market benchmark was used to adjust for risk.
Panel D: Adjusted R-Squared
Portfolio Index Overall sample Bull Bear Financial
Crisis Islami
c Conve
n. Islami
c Conve
n. Islami
c Conve
n. Islami
c Conve
n.
Local
GCC Islami
c
39.21% 31.55% 3.24% 9.49% 42.82
% 29.97% 84.85% 69.42%
TASI 59.44% 50.91% 29.84
% 37.60% 61.75% 49.27% 96.24
% 80.90%
International
MSCI Worl
d Islami
c
52.30% 63.41% 16.71
% 35.85% 59.20% 69.65% 76.19
% 77.04%
MSCI Worl
d Index
53.99% 62.67% 15.39
% 31.66% 59.62% 68.14% 82.72
% 78.47%
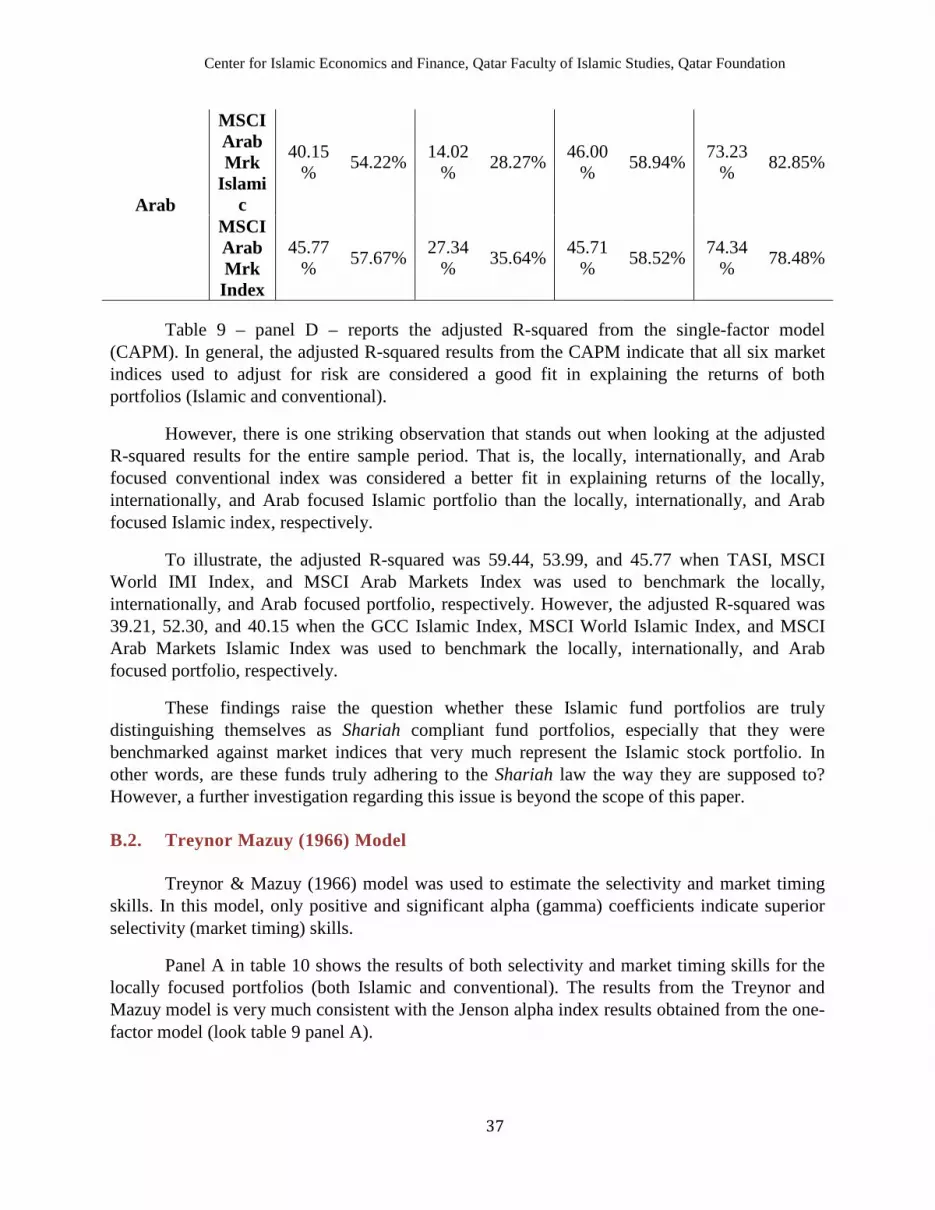
Center for Islamic Economics and Finance, Qatar Faculty of Islamic Studies, Qatar Foundation
37
Arab
MSCI Arab Mrk
Islamic
40.15% 54.22% 14.02
% 28.27% 46.00% 58.94% 73.23
% 82.85%
MSCI Arab Mrk
Index
45.77% 57.67% 27.34
% 35.64% 45.71% 58.52% 74.34
% 78.48%
Table 9 – panel D – reports the adjusted R-squared from the single-factor model (CAPM). In general, the adjusted R-squared results from the CAPM indicate that all six market indices used to adjust for risk are considered a good fit in explaining the returns of both portfolios (Islamic and conventional).
However, there is one striking observation that stands out when looking at the adjusted R-squared results for the entire sample period. That is, the locally, internationally, and Arab focused conventional index was considered a better fit in explaining returns of the locally, internationally, and Arab focused Islamic portfolio than the locally, internationally, and Arab focused Islamic index, respectively.
To illustrate, the adjusted R-squared was 59.44, 53.99, and 45.77 when TASI, MSCI World IMI Index, and MSCI Arab Markets Index was used to benchmark the locally, internationally, and Arab focused portfolio, respectively. However, the adjusted R-squared was 39.21, 52.30, and 40.15 when the GCC Islamic Index, MSCI World Islamic Index, and MSCI Arab Markets Islamic Index was used to benchmark the locally, internationally, and Arab focused portfolio, respectively.
These findings raise the question whether these Islamic fund portfolios are truly distinguishing themselves as Shariah compliant fund portfolios, especially that they were benchmarked against market indices that very much represent the Islamic stock portfolio. In other words, are these funds truly adhering to the Shariah law the way they are supposed to? However, a further investigation regarding this issue is beyond the scope of this paper.
B.2.
Treynor & Mazuy (1966) model was used to estimate the selectivity and market timing skills. In this model, only positive and significant alpha (gamma) coefficients indicate superior selectivity (market timing) skills.
Treynor Mazuy (1966) Model
Panel A in table 10 shows the results of both selectivity and market timing skills for the locally focused portfolios (both Islamic and conventional). The results from the Treynor and Mazuy model is very much consistent with the Jenson alpha index results obtained from the one-factor model (look table 9 panel A).

Center for Islamic Economics and Finance, Qatar Faculty of Islamic Studies, Qatar Foundation
38
Table 10: Treynor & Mazuy (1966) Model
This table reports the results from the Treynor and Mazuy selectivity and market timing model. The total sample consists of 143 mutual funds (96 Islamic and 47 conventional funds) in Saudi Arabia for the period from January 2003 to January 2010. From these funds 24
Panel A: Locally Focused Portfolios
equally-weighted portfolios were formed based on the funds’: 1) Geographical focus (local, international, and Arab), 2) Shariah compliancy (Islamic and conventional), 3) different market trends (overall period: January 2003 to January 2010, bull period: January 2003 to February 2006, bear period: March 2006 to January 2010, and financial crisis period: September 2008 to January 2010). All Arab focused portfolios (Islamic and conventional) start from August 2004. Other than that all portfolios start from January 2003. To overcome the benchmark problem and enhance comparability, each portfolio is benchmarked against Islamic and then conventional market indices that have the same geographical focus as the examined portfolio. The locally focused indices are: the GCC Islamic (Global Index of the GCC Islamic Index) and TASI (Tadawul All Share Index). The internationally focused indices are: MSCI World Islamic (MSCI World Islamic Index) and MSCI World Index IMI. The Arab focused indices are: MSCI Arab Mrk Islamic (MSCI Arab Markets Domestic Islamic Index excluding Saudi Arabia) and MSCI Arab Mrk Index (MSCI Arabian Markets Domestic Index excluding Saudi Arabia). Also, this table reports the results of testing the difference in the selectivity skills as well as the difference in the market timing skills between Islamic and conventional portfolios. Panel A, B, C, and D reports the results on the locally focused portfolios, internationally focused portfolios, Arab focused portfolios, and the Adjusted R-squared from all regressions, respectively. Finally, all standard errors are corrected for heteroscedasticity problems using White’s (1980) correction test.
Measure Index
Overall sample Bull Bear Financial Crisis Islami
c Conve
n. Islamic Conven. Islamic Conven. Islamic Conve
n.
Sele
ctiv
ity S
kills
GCC Islami
c
-0.16% -0.34% 0.16% 0.12% -0.23% -0.53% 0.25% -0.14%
Diff 0.18% 0.04% 0.30% 0.39%
TASI -0.08% -0.22% -0.10% -0.31% 0.03% -0.19% -0.19%
-0.74%*
* Diff 0.15% 0.21% 0.22% 0.56%*
Mar
ket T
imin
g Sk
ills
GCC Islami
c 8.82% 34.41%
* -
61.32%
-102.18
%
29.49%*
59.38%**
-14.32%
* -1.99%
Diff -25.58% 40.86% -29.89% -12.33%
TASI -0.31%
20.55%*
73.90%* 92.74% -0.19% 17.04% -1.95% 16.22%
Diff -20.85% -18.84% -17.24% -18.17% *, **, *** significant at 10%, 5%, 1%, respectively.

Center for Islamic Economics and Finance, Qatar Faculty of Islamic Studies, Qatar Foundation
39
That is, the results indicate that both locally focused Islamic and conventional portfolios did not possess any selectivity skills over the market. Furthermore, the results indicate that there were no differences in the selectivity skill between Islamic and conventional portfolios. There results hold during all studied periods, regardless what locally focused market benchmark was used to adjust for risk.
Looking at the market timing abilities of locally focused portfolios (both Islamic and conventional), the results indicate that the locally focused conventional portfolio was able to time the market during the overall sample period. Such market timing ability of 34.41 and 20.55 percent was observed when the portfolio was benchmarked against both locally focused market indices, the GCC Islamic Index and TASI, respectively.
Breaking down the sample period, the results during the bull period indicate that only the Islamic portfolio was able to time the market (73.90 percent) when only the locally focused conventional market index, TASI, was used to adjust for risk. However, during the bear period, both portfolios, Islamic and conventional, were able to time the market when only the locally focused Islamic index, GCC Islamic Index, was used to adjust for risk. The market timing abilities for the Islamic and conventional portfolio was 24.49 and 59.38 percent, respectively. The results during the financial crisis period show that both portfolios were not able to time the market, regardless what locally focused market benchmark was used to adjust for risk.
Looking at any differences in the ability to time the market between Islamic and conventional portfolios, the results from the “difference portfolio” indicate that there was no statistical evidence that there existed any differences between the two portfolios during all studied periods. This result holds regardless what locally focused market benchmark was used to adjust for risk.
Panel B in table 10 shows the results of both selectivity and market timing skills for the internationally focused portfolios (both Islamic and conventional). The results of the selectivity skills are very much consistent with the Jenson alpha index results in the one-factor model (look table 9, panel B).
Panel B: Internationally Focused Portfolios
Measure Index
Overall sample Bull Bear Financial Crisis
Islamic
Conven. Islamic Conve
n. Islami
c Conve
n. Islam
ic Conve
n.
Sele
ctiv
ity S
kills
MSCI Worl
d Islam
ic
-0.02% -0.11% 0.40%***
-0.06%
**
-0.27%
** -0.14% -
0.30% -0.13%
Diff 0.10% 0.46%*** -0.13% -0.17% MSCI Worl
d 0.02% -0.08% 0.38%***
-0.07%
** -0.18% -0.06% -
0.19% -0.02%

Center for Islamic Economics and Finance, Qatar Faculty of Islamic Studies, Qatar Foundation
40
Index Diff 0.10% 0.44%*** -0.12% -0.17%
Mar
ket T
imin
g Sk
ills
MSCI Worl
d Islam
ic
-7.37%
-24.67%
*
-228.55%*
**
10.71%
22.92% -3.97% 29.86
% -4.46%
Diff 17.30% -239.26%* 26.89% 34.32% MSCI Worl
d Index
-12.87
%
-26.34%
**
-199.45%*
**
21.90% 4.61%
-16.01
% 6.63%
-19.54
%
Diff 13.47% -221.35%*** 20.62% 26.17% *, **, *** significant at 10%, 5%, 1%, respectively.
That is, during the overall, bear, and financial crisis periods, there was no evidences that either portfolio (Islamic or conventional) outperformed the market. Furthermore, there was no statistical evidence that there existed any differences in the selectivity skill between Islamic and conventional portfolios. However, during the bull period, the results indicate that the internationally focused Islamic portfolio outperformed the market, by approximately 0.38 percent; and possessed superior selectivity skills, approximately 0.45 percent, over its respective peer the internationally focused conventional portfolio. These results hold during all studied periods and regardless what internationally focused market benchmark was used to adjust for risk.
Looking at the market timing abilities of internationally focused portfolios (both Islamic and conventional), the results indicate that there was no evidence that both portfolios were able to time the market. Furthermore, the results from the “difference portfolio” indicate that there was no statistical evidence that there existed any differences in the ability to time the market between the two portfolios. These results hold during all studied periods, regardless what internationally focused market benchmark was used to adjust for risk.
Panel C: Arab Focused Portfolios
Measure Index
Overall sample Bull Bear Financial Crisis Islami
c Conven. Islamic Conven.
Islamic
Conven. Islamic Conve
n.
Sele
ctiv
ity S
kills
MSCI Arab Mrk
Islamic
0.15% 0.19% 0.72% 1.35%*
-0.13% -0.22% -0.06% -0.24%
Diff -0.04% -0.63% 0.10% 0.17% MSCI Arab Mrk
Index
-0.05% -0.02% 0.31% 1.07%
* -
0.25% -0.43% -0.03% -0.40%

Center for Islamic Economics and Finance, Qatar Faculty of Islamic Studies, Qatar Foundation
41
Diff -0.03% -0.75% 0.18% 0.37% M
arke
t Tim
ing
Skill
s MSCI Arab Mrk
Islamic
-32.26
%
-33.18%*
** 19.81%
-15.22
%
-7.53%
-18.82
%
-42.19%
-16.18
%
Diff 0.92% 35.02% 11.29% -26.02% MSCI Arab Mrk
Index
-14.43
% -13.64% 100.07
% 16.26
% -
3.90% -0.84% -
63.05%*
-17.12
%
Diff -0.78% 83.81% -3.07% -45.93% *, **, *** significant at 10%, 5%, 1%, respectively.
Panel C in table 10 shows the results of both selectivity and market timing skills for the Arab focused portfolios (both Islamic and conventional). The results of the selectivity skills are somewhat consistent with the Jenson alpha index results in the one-factor model (look table 12, panel C).
That is, during the overall, bear, and financial crisis periods, there was no evidences that either portfolio (Islamic or conventional) outperformed the market. On the other hand, during the bull period, the results indicate that the Arab focused conventional portfolio outperformed the market when both Arab focused market indices were used. However, the results during all studied periods indicate that there was no statistical evidence that there existed any differences in the selectivity skill between Islamic and conventional portfolios. All these results hold regardless what Arab focused market benchmark was used to adjust for risk.
Looking at the market timing abilities of Arab focused portfolios (both Islamic and conventional), the results indicate that there was no evidence that both portfolios were able to time the market. Furthermore, the results from the “difference portfolio” indicate that there was no statistical evidence that there existed any differences in the ability to time the market between the two portfolios. These results hold during all studied periods, regardless what Arab focused market benchmark was used to adjust for risk.
Table 10 – panel D – reports the adjusted R-squared from the Treynor & Mazuy (1966) model. In general, the adjusted R-squared results indicate that this model is as good as the CAPM in explaining the returns of both portfolios (Islamic and conventional).
Panel D: Adjusted R-Squared
Portfolio Index Overall sample Bull Bear Financial
Crisis Islami
c Conve
n. Islami
c Conve
n. Islami
c Conve
n. Islami
c Conve
n.
Local GCC Islami
c
39.03% 34.22% 3.30% 9.02% 47.01
% 38.43% 85.06% 67.25%

Center for Islamic Economics and Finance, Qatar Faculty of Islamic Studies, Qatar Foundation
42
TASI 58.94% 51.39% 32.91
% 37.96% 60.88% 48.98% 96.01
% 80.83%
International
MSCI Worl
d Islami
c
51.82% 64.38% 31.70
% 34.19% 59.34% 68.99% 76.59
% 75.45%
MSCI Worl
d Index
53.94% 64.81% 31.80
% 31.00% 58.78% 68.25% 81.67
% 78.36%
Arab
MSCI Arab Mrk
Islamic
41.24% 55.75% 9.34% 24.19% 44.82
% 58.38% 74.15% 81.95%
MSCI Arab Mrk
Index
45.09% 57.17% 27.67
% 31.75% 44.48% 57.58% 76.72
% 77.20%
Consistent with what was previously pointed out, the adjusted R-squared results from the Treynor and Mazuy model during the entire sample period indicate that the locally, internationally, and Arab focused conventional index was considered a better fit in explaining the returns of the locally, internationally, and Arab focused Islamic portfolio than the locally, internationally, and Arab focused Islamic index, respectively. This further supports the raised concern whether Islamic fund portfolios are truly distinguishing themselves as Shariah compliant fund portfolios or not.
B.3.
There is documented evidence showing that if funds are considerably engaging in style investment strategies, such as focusing on small caps or value stocks, the returns on these funds cannot be fully explained by a single-factor model or other previously discussed risk-adjusted performance measures. In other words, the traditional performance measures discussed thus far would all provide biased performance estimates of mutual funds if these funds were involved in style investment strategies.
Four-Factor Model
Therefore, this paper overcomes this problem by employing a four-factor model that is based on all firms listed on the Saudi Stock Exchange (Tadawul) in order to control for different investment styles: small caps vs. large caps, value vs. growth stocks, and momentum vs. contrarian strategies. It is expected that such model will shed more light on the differences in performance and investment style behaviors between Islamic and conventional funds in Saudi Arabia.

Center for Islamic Economics and Finance, Qatar Faculty of Islamic Studies, Qatar Foundation
43
Table 11 compares the adjusted R-squared from the four-factor model and the single-factor model (CAPM) during the full sample period. Consistent with the pervious literature, the results indicate that the four-factor model is indeed a better fit in explaining the returns of both locally and internationally focused portfolios (Islamic and conventional) than the single-factor model. The adjusted R-squared from the four-factor model is higher than that from the CAPM. However, the four-factor model seem to be almost as fit as the single-factor model in explaining the returns of both Arab focused portfolios (Islamic and conventional).
Table 11: Adjusted R-Squared Comparison
Employed Benchmark
This table compares the adjusted R-squared from the four-factor model and the single factor model during the full sample period.
Portfolio Local International Arab
4-factor CAPM 4-
factor CAPM 4-factor CAPM
GCC Islamic Islamic 41.51% 39.21% Conventional 35.49% 31.55%
TASI Islamic 61.34% 59.44% Conventional 54.92% 50.91%
MSCI World Islamic
Islamic 56.61% 52.30% Conventional 63.73% 63.41%
MSCI World Index Islamic 57.96% 53.99% Conventional 63.69% 62.67%
MSCI Arab Mrk Islamic
Islamic 39.51% 40.15% Conventional 54.36% 54.22%
MSCI Arab Mrk Index
Islamic 44.51% 45.77% Conventional 56.93% 57.67%
Panel A in table 12 reports the results from the four-factor model for the locally focused portfolios (both Islamic and conventional). The alpha results show that there was no statistical evidence that both portfolios (Islamic and conventional) outperformed the employed market benchmark. However, there is one exception when the locally focused Islamic portfolio was benchmarked against the locally focused Islamic index: the GCC Islamic index during the financial crisis period. The Islamic portfolio significantly, at 10 percent, outperformed the GCC Islamic index by 2.20 percent. Furthermore, the results show that there was no evidence that there existed any performance differences between the Islamic and conventional portfolios. These results hold during all the studied periods, regardless what locally focused market index was used to adjust for risk.
Table 12: Four-Factor Model
This table reports the results from the four-factor model for the period from December 2003 to January 2010. The calculation of the SMB and HML risk factors will follow Fama & French (1993) methodology, and the calculation of the MOM risk factor will follow Carhart (1997) methodology. Basically six portfolios were created from sorts of stocks on total market value (2 groups) and book-to-market ratios (3 groups) to form portfolios meant to mimic the underlying

Center for Islamic Economics and Finance, Qatar Faculty of Islamic Studies, Qatar Foundation
44
risk factors in returns that are related to size and book-to-market. And another six portfolios were created from sorts of stocks on total market value (2 groups) and past ten-month returns (3 groups) to form a portfolio meant to mimic the underlying risk factor in persistence of returns.
All Arab focused portfolios (Islamic and conventional) start from August 2004. Other than that all portfolios start from December 2003. To overcome the benchmark problem and enhance comparability, each portfolio is benchmarked against Islamic and then conventional market indices that have the same geographical focus as the examined portfolio. The locally focused indices are: the GCC Islamic (Global Index of the GCC Islamic Index) and TASI (Tadawul All Share Index). The internationally focused indices are: MSCI World Islamic (MSCI World Islamic Index) and MSCI World Index IMI. The Arab focused indices are: MSCI Arab Mrk Islamic (MSCI Arab Markets Domestic Islamic Index excluding Saudi Arabia) and MSCI Arab Mrk Index (MSCI Arabian Markets Domestic Index excluding Saudi Arabia). Also, this table reports the results of testing the difference between Islamic and conventional portfolios in the alpha (selectivity skills), systematic risk (beta), SMB, HML, and MOM. Panel A, B, C, and D reports the results on the locally focused portfolios, internationally focused portfolios, Arab focused portfolios, and the Adjusted R-squared from all regressions, respectively. Finally, all standard errors are corrected for heteroscedasticity problems using White’s (1980) correction test.
SMB (small minus big) is calculated by taking the average return on the three small portfolios minus the average return on the three big portfolios: SMB= 1/3 (S/L + S/M + S/H) – 1/3 (B/L + B/M + B/H). HML (high minus low) is calculated by taking the average return on the two value portfolios minus the average return on the two growth portfolios: HML= 1/2 (S/H + B/H) – 1/2 (S/L + B/L). MOM (winners minus losers) is calculated by taking the average return on the two highest 30% past ten-month return portfolios (winners) minus the average return on the two lowest 30% past ten-month return portfolios (losers): MOM= 1/2 (S/W + B/W) – 1/2 (S/L + B/L). All factor portfolios are value-weighted and are rebalanced monthly.
Panel A: Locally Focused Portfolios
Coeff.
Index
Overall sample Bull Bear Financial Crisis
Islamic Conven.
Islamic
Conven. Islamic Conven
. Islamic Conven.
Alpha
GCC Islamic
-0.41% -0.94%* 0.43% 0.58% -0.89%* -
2.05%**
2.20%* 1.49%
Diff 0.54% -0.15% 1.16% 0.72%
TASI -0.51%* -1.09%* 0.10% -0.11%
-1.27%*
**
-2.53%*
** 0.15% -1.08%
Diff 0.57% 0.21% 1.26% 1.23%
Beta
GCC Islamic
11.68%***
16.13%*** 2.63% 7.62% 12.91%
*** 16.32%
*** 17.71%
*** 21.08%
***
Diff -4.45% -4.98% -3.41% -3.37% TAS
I 13.42%
*** 19.33%
*** 9.39%
** 22.25%
*** 14.33%
*** 19.46%
*** 17.83%
*** 22.05%
***
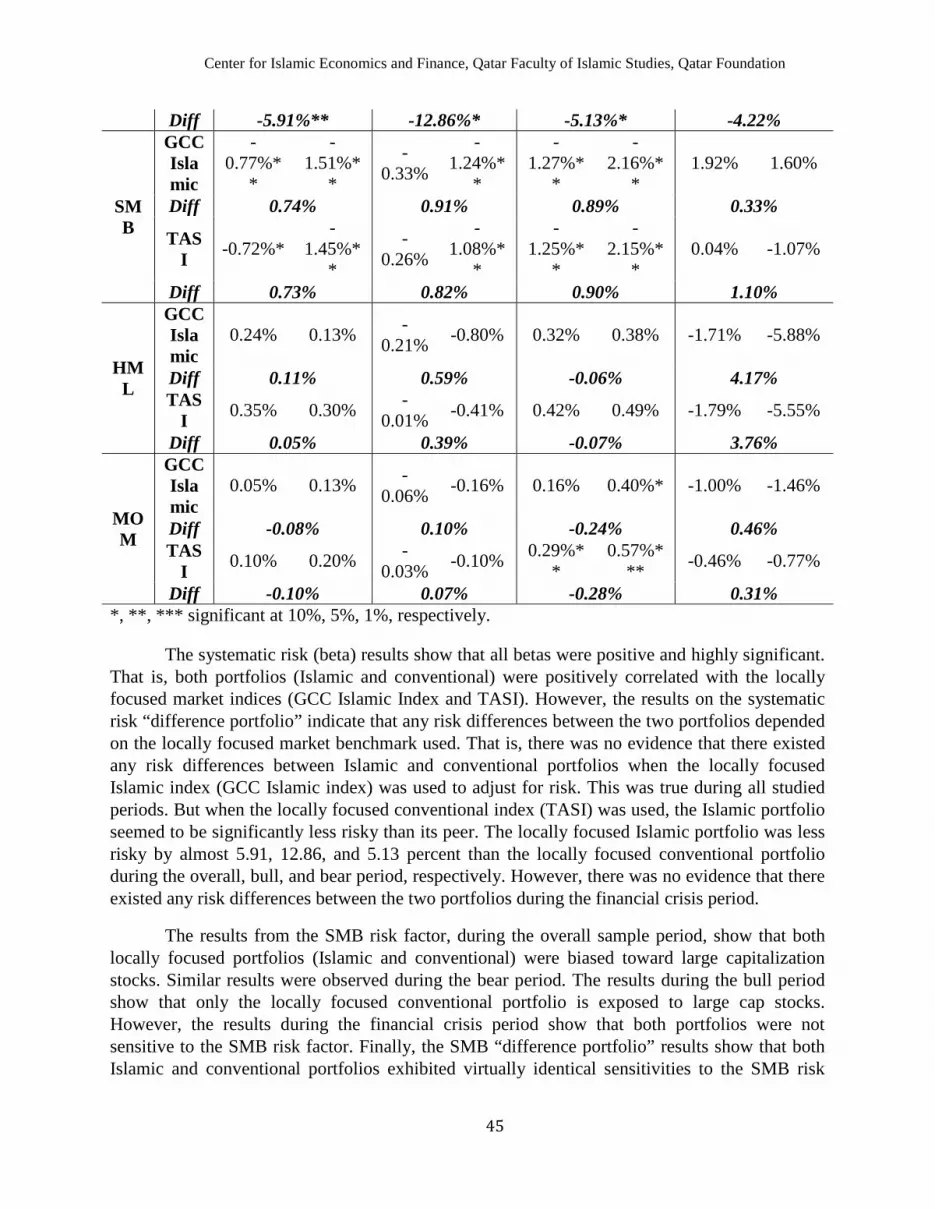
Center for Islamic Economics and Finance, Qatar Faculty of Islamic Studies, Qatar Foundation
45
Diff -5.91%** -12.86%* -5.13%* -4.22%
SMB
GCC Islamic
-0.77%*
*
-1.51%*
*
-0.33%
-1.24%*
*
-1.27%*
*
-2.16%*
* 1.92% 1.60%
Diff 0.74% 0.91% 0.89% 0.33%
TASI -0.72%*
-1.45%*
*
-0.26%
-1.08%*
*
-1.25%*
*
-2.15%*
* 0.04% -1.07%
Diff 0.73% 0.82% 0.90% 1.10%
HML
GCC Islamic
0.24% 0.13% -0.21% -0.80% 0.32% 0.38% -1.71% -5.88%
Diff 0.11% 0.59% -0.06% 4.17% TAS
I 0.35% 0.30% -0.01% -0.41% 0.42% 0.49% -1.79% -5.55%
Diff 0.05% 0.39% -0.07% 3.76%
MOM
GCC Islamic
0.05% 0.13% -0.06% -0.16% 0.16% 0.40%* -1.00% -1.46%
Diff -0.08% 0.10% -0.24% 0.46% TAS
I 0.10% 0.20% -0.03% -0.10% 0.29%*
* 0.57%*
** -0.46% -0.77%
Diff -0.10% 0.07% -0.28% 0.31% *, **, *** significant at 10%, 5%, 1%, respectively.
The systematic risk (beta) results show that all betas were positive and highly significant. That is, both portfolios (Islamic and conventional) were positively correlated with the locally focused market indices (GCC Islamic Index and TASI). However, the results on the systematic risk “difference portfolio” indicate that any risk differences between the two portfolios depended on the locally focused market benchmark used. That is, there was no evidence that there existed any risk differences between Islamic and conventional portfolios when the locally focused Islamic index (GCC Islamic index) was used to adjust for risk. This was true during all studied periods. But when the locally focused conventional index (TASI) was used, the Islamic portfolio seemed to be significantly less risky than its peer. The locally focused Islamic portfolio was less risky by almost 5.91, 12.86, and 5.13 percent than the locally focused conventional portfolio during the overall, bull, and bear period, respectively. However, there was no evidence that there existed any risk differences between the two portfolios during the financial crisis period.
The results from the SMB risk factor, during the overall sample period, show that both locally focused portfolios (Islamic and conventional) were biased toward large capitalization stocks. Similar results were observed during the bear period. The results during the bull period show that only the locally focused conventional portfolio is exposed to large cap stocks. However, the results during the financial crisis period show that both portfolios were not sensitive to the SMB risk factor. Finally, the SMB “difference portfolio” results show that both Islamic and conventional portfolios exhibited virtually identical sensitivities to the SMB risk

Center for Islamic Economics and Finance, Qatar Faculty of Islamic Studies, Qatar Foundation
46
factor. These results hold regardless what locally focused market benchmark was used to adjust for risk.
The results from the HML risk factor indicate that there was no statistical evidence that both portfolios (Islamic and conventional) were exposed to either growth (low book-to-market ratio) or value (high book-to-market ratio) stocks. Further, the results from the HML “difference portfolio” indicate that both portfolios exhibited identical sensitivities to HML risk factor. These results hold during all studied periods, regardless what locally focused market index was used to adjust for risk.
The results from the MOM risk factor indicate that there was no statistical evidence that both portfolios (Islamic and conventional) were following a momentum or a contrarian investment strategy during the overall period. Similar results were obtained when the sample period was broken down into the bull and financial crisis periods. However, the results during the bear period show that both Islamic and conventional portfolios were following a momentum strategy. That is, the Islamic portfolio was following a momentum strategy when only the locally focused conventional market index (TASI) was used to adjust for risk. But the conventional portfolio was following a momentum strategy when both locally focused market indices (Islamic and conventional) were used to adjust for risk. Finally, the results from the MOM “difference portfolio” show that both Islamic and conventional portfolios exhibited identical sensitivities to the MOM risk factor.
Panel B in table 12 reports the results from the four-factor model for the internationally focused portfolios (Islamic and conventional). The alpha results show that there was no statistical evidence that both portfolios (Islamic and conventional) outperformed the market. Furthermore, there was no evidence that there existed any performance differences between the Islamic and conventional portfolios. These results hold during all the studied periods, regardless what internationally focused market index was used to adjust for risk.
The systematic risk (beta) results show that all betas were positive and highly significant. Furthermore, the results on the systematic risk “difference portfolio” indicate that there were not any differences in risk between Islamic and conventional portfolios during the overall, bear, and financial crisis periods. However, during the bull period, the results indicate that the internationally focused Islamic portfolio was significantly, at 1 percent, considered more risky than the internationally focused conventional portfolio. That is, the Islamic portfolio was about 7.20 and 7.88 percent more risky than the conventional portfolio when the internationally focused Islamic index (MSCI World Islamic Index) and the internationally focused conventional index (MSCI World IMI Index) was used to adjust for risk, respectively.

Center for Islamic Economics and Finance, Qatar Faculty of Islamic Studies, Qatar Foundation
47
Panel B: Internationally Focused Portfolios
Coeff.
Index
Overall sample Bull Bear Financial Crisis
Islamic Conven. Islamic Conve
n. Islamic Conven. Islamic Conven
.
Alpha
MSCI
World
Islamic
-0.14% -0.13% 0.07% -0.02% 0.01% -0.03% -
2.32%**
-0.45%
Diff -0.01% 0.09% 0.04% -1.86% MSC
I Worl
d Inde
x
-0.12% -0.11% 0.06% -0.02% 0.02% -0.02% -
1.67%**
0.21%
Diff 0.00% 0.08% 0.04% -1.88%
Beta
MSCI
World
Islamic
15.29%***
15.63%***
11.53%***
4.33%***
15.78%***
17.22%***
16.71%***
17.70%***
Diff -0.34% 7.20%*** -1.45% -1.00% MSC
I Worl
d Inde
x
14.19%***
14.33%***
12.03%***
4.16%***
14.38%***
15.51%***
14.42%***
15.55%***
Diff -0.14% 7.88%*** -1.12% -1.13%
SMB
MSCI
World
Islamic
0.01% -0.02% -0.03% -0.05% -0.11% -0.06% -1.80%* -1.38%
Diff 0.03% 0.03% -0.05% -0.42% MSC
I Worl
d Inde
x
-0.03% -0.05% -0.02% -0.05% -0.17% -0.12% -0.88% -0.51%
Diff 0.02% 0.03% -0.05% -0.37%

Center for Islamic Economics and Finance, Qatar Faculty of Islamic Studies, Qatar Foundation
48
HML
MSCI
World
Islamic
-0.25%*
* 0.03% -0.11% -0.08% -0.05% 0.14% -3.08% 1.01%
Diff -0.27%* -0.03% -0.19% -4.09% MSC
I Worl
d Inde
x
-0.20%* 0.07% -0.09% -0.08% 0.02% 0.21% -1.92% 2.32%
Diff -0.27%* -0.01% -0.19% -4.25%
MOM
MSCI
World
Islamic
-0.01% 0.00% 0.03% -0.01% -0.08% -0.03% 0.39% 0.02%
Diff -0.01% 0.04% -0.05% 0.38% MSC
I Worl
d Inde
x
0.00% 0.00% 0.03% -0.01% -0.07% -0.02% 0.39% 0.02%
Diff 0.00% 0.04% -0.05% 0.37% *, **, *** significant at 10%, 5%, 1%, respectively.
The results from the SMB risk factor indicate that there was no statistical evidence that both portfolios (Islamic and conventional) were exposed to the SMB risk factor. However, there was one exception. That is, during the financial crisis period, the Islamic portfolio was significantly exposed to large cap stocks when the internationally focused Islamic index (MSCI World Islamic Index) was used to adjust for risk. However, the results on SMB “difference portfolio” show that both portfolios exhibited identical sensitivities to the SMB risk factor.
The results from the HML risk factor indicate that only the internationally focused Islamic portfolio was significantly sensitive to the HML risk factor. That is, during the overall period, the Islamic portfolio was biased towards growth stocks; regardless what internationally focused market benchmark index was used to adjust for risk. However, during the bull, bear, and financial crisis periods, there was no evidence that either portfolio (Islamic or conventional) was sensitive to the HML risk factor. The “difference portfolio” results show that the Islamic portfolio was sensitive to growth stocks more than the conventional portfolio during only the overall sample period. However, during the bull, bear, and financial crisis periods, the results
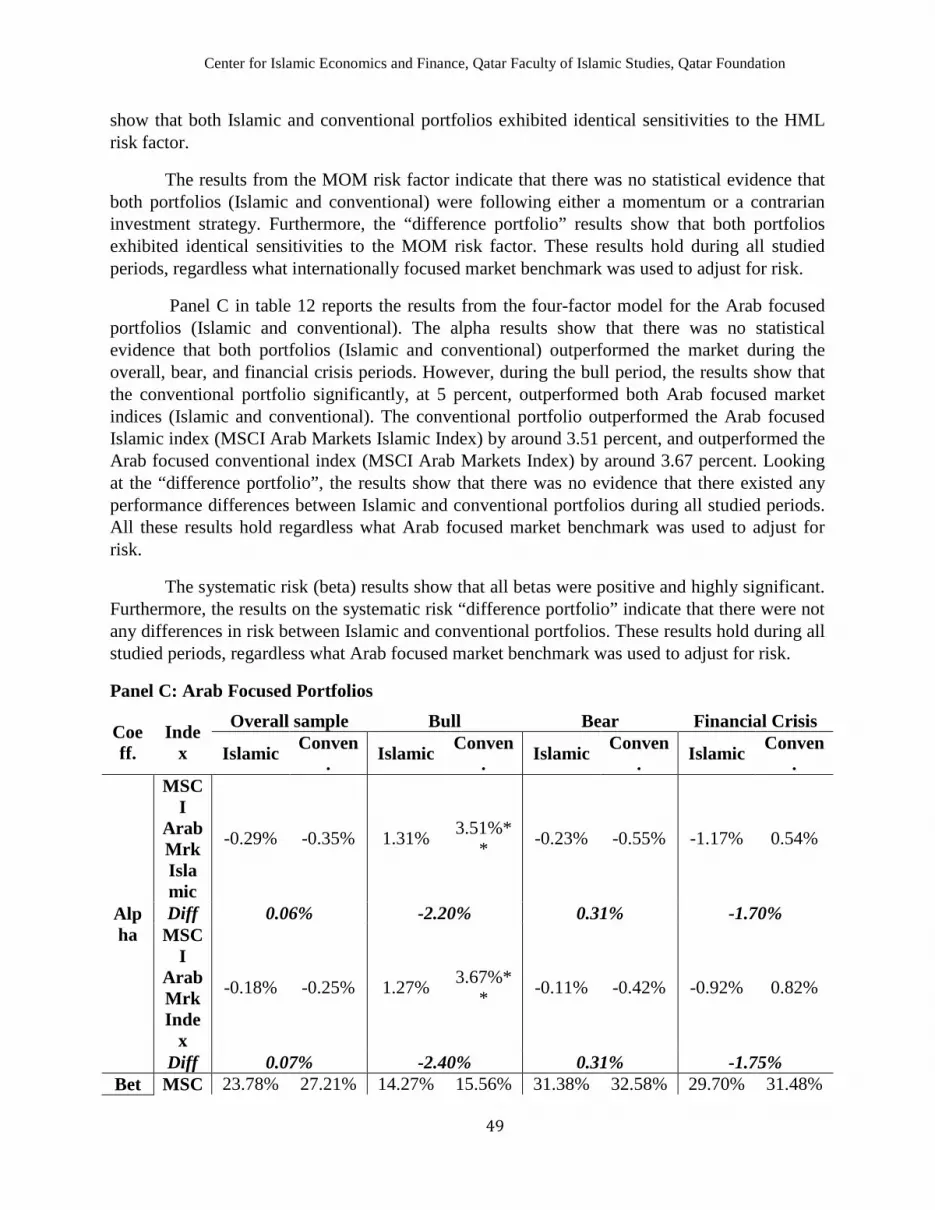
Center for Islamic Economics and Finance, Qatar Faculty of Islamic Studies, Qatar Foundation
49
show that both Islamic and conventional portfolios exhibited identical sensitivities to the HML risk factor.
The results from the MOM risk factor indicate that there was no statistical evidence that both portfolios (Islamic and conventional) were following either a momentum or a contrarian investment strategy. Furthermore, the “difference portfolio” results show that both portfolios exhibited identical sensitivities to the MOM risk factor. These results hold during all studied periods, regardless what internationally focused market benchmark was used to adjust for risk.
Panel C in table 12 reports the results from the four-factor model for the Arab focused portfolios (Islamic and conventional). The alpha results show that there was no statistical evidence that both portfolios (Islamic and conventional) outperformed the market during the overall, bear, and financial crisis periods. However, during the bull period, the results show that the conventional portfolio significantly, at 5 percent, outperformed both Arab focused market indices (Islamic and conventional). The conventional portfolio outperformed the Arab focused Islamic index (MSCI Arab Markets Islamic Index) by around 3.51 percent, and outperformed the Arab focused conventional index (MSCI Arab Markets Index) by around 3.67 percent. Looking at the “difference portfolio”, the results show that there was no evidence that there existed any performance differences between Islamic and conventional portfolios during all studied periods. All these results hold regardless what Arab focused market benchmark was used to adjust for risk.
The systematic risk (beta) results show that all betas were positive and highly significant. Furthermore, the results on the systematic risk “difference portfolio” indicate that there were not any differences in risk between Islamic and conventional portfolios. These results hold during all studied periods, regardless what Arab focused market benchmark was used to adjust for risk.
Panel C: Arab Focused Portfolios
Coeff.
Index
Overall sample Bull Bear Financial Crisis
Islamic Conven. Islamic Conven
. Islamic Conven. Islamic Conven
.
Alpha
MSCI
Arab Mrk Islamic
-0.29% -0.35% 1.31% 3.51%** -0.23% -0.55% -1.17% 0.54%
Diff 0.06% -2.20% 0.31% -1.70% MSC
I Arab Mrk Inde
x
-0.18% -0.25% 1.27% 3.67%** -0.11% -0.42% -0.92% 0.82%
Diff 0.07% -2.40% 0.31% -1.75% Bet MSC 23.78% 27.21% 14.27% 15.56% 31.38% 32.58% 29.70% 31.48%

Center for Islamic Economics and Finance, Qatar Faculty of Islamic Studies, Qatar Foundation
50
a I Arab Mrk Islamic
*** *** *** *** *** *** *** ***
Diff -3.43% -1.29% -1.20% -1.78% MSC
I Arab Mrk Inde
x
30.76%***
33.99%***
22.04%***
22.16%***
34.29%***
35.62%***
32.35%***
32.90%***
Diff -3.23% -0.12% -1.33% -0.55%
SMB
MSCI
Arab Mrk Islamic
0.47% 0.16% 1.81% 1.39% -1.23% -1.03% 0.02% 7.72%*
Diff 0.31% 0.42% -0.20% -7.70% MSC
I Arab Mrk Inde
x
0.46% 0.16% 1.67% 1.30% -0.82% -0.61% 0.46% 8.73%*
Diff 0.30% 0.37% -0.21% -8.26%
HML
MSCI
Arab Mrk Islamic
-0.79% -0.87% -
2.23%**
-2.62%*
* 0.92% 0.65% 2.62% -6.09%
Diff 0.08% 0.39% 0.27% 8.70% MSC
I Arab Mrk Inde
x
-0.61% -0.66% -
1.95%**
-2.31%*
* 0.90% 0.63% 2.57% -6.81%
Diff 0.05% 0.36% 0.27% 9.39%
MOM
MSCI
Arab Mrk Isla
-0.03% -0.04% -0.38% -
0.70%**
-0.02% 0.02% 0.84% 0.25%

Center for Islamic Economics and Finance, Qatar Faculty of Islamic Studies, Qatar Foundation
51
mic Diff 0.01% 0.32% -0.04% 0.59%
MSCI
Arab Mrk Inde
x
-0.03% -0.04% -0.35% -
0.68%**
-0.05% -0.01% 0.73% 0.11%
Diff 0.01% 0.34% -0.04% 0.62% *, **, *** significant at 10%, 5%, 1%, respectively.
The results from the SMB risk factor indicate that there was no statistical evidence that both portfolios (Islamic and conventional) were sensitive to the SMB risk factor. However, there is one exception during the financial crisis period. That is, the results show that only the Arab focused conventional portfolio was significantly, at 10 percent, exposed to small cap stocks. However, the “difference portfolio” results show that both portfolios exhibited identical sensitivities to the SMB risk factor. All these results hold regardless what Arab focused market benchmark was used to adjust for risk.
The results from the HML risk factor indicate that there was no statistical evidence that both portfolios (Islamic and conventional) were sensitive to the HML risk factor during the overall, bear, and financial crisis periods. However, during the bull period, the results show that both portfolios (Islamic and conventional) were significantly, at 5 percent, biased toward growth stocks. However, the “difference portfolio” results show that both portfolios exhibited identical sensitivities to the HML risk factor during all studied periods. All these results hold regardless what Arab focused market benchmark was used to adjust for risk.
The results from the MOM risk factor indicate that there was no statistical evidence that both portfolios (Islamic and conventional) were sensitive to the MOM risk factor during the overall, bear, and financial crisis periods. However, during the bull period, the results show that only the Arab focused conventional portfolio was significantly, at 5 percent, following a contrarian investment strategy. However, the “difference portfolio” results show that both portfolios exhibited identical sensitivities to the MOM risk factor during all studied periods. All these results hold regardless what Arab focused market benchmark was used to adjust for risk.
Panel D in table 12 reports the adjusted R-squared from the four-factor model for all Islamic and conventional portfolios (locally, internationally, and Arab focused portfolios).
Again, consistent with the adjusted R-squared results obtained from both the one-factor model (CAPM) and the Treynor and Mazuy model, the adjusted R-squared results from the four-factor model during the entire sample period indicate that the locally, internationally, and Arab focused conventional index was considered a better fit in explaining the returns of the locally, internationally, and Arab focused Islamic portfolio than the locally, internationally, and Arab focused Islamic index, respectively. Such results do not only hold during the overall sample period, but also during all other periods (bull, bear, and financial crisis periods). This further
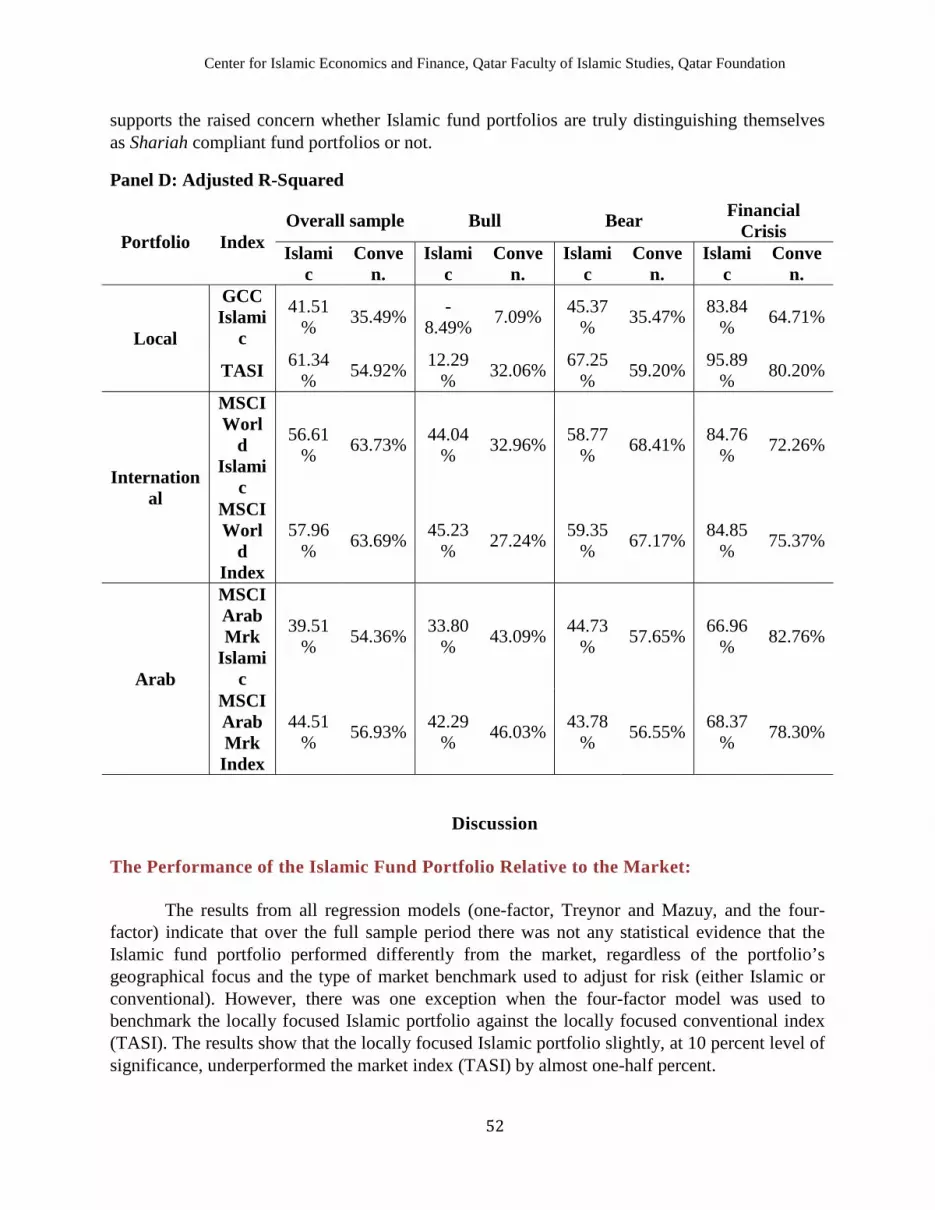
Center for Islamic Economics and Finance, Qatar Faculty of Islamic Studies, Qatar Foundation
52
supports the raised concern whether Islamic fund portfolios are truly distinguishing themselves as Shariah compliant fund portfolios or not.
Panel D: Adjusted R-Squared
Portfolio Index Overall sample Bull Bear Financial
Crisis Islami
c Conve
n. Islami
c Conve
n. Islami
c Conve
n. Islami
c Conve
n.
Local
GCC Islami
c
41.51% 35.49% -
8.49% 7.09% 45.37% 35.47% 83.84
% 64.71%
TASI 61.34% 54.92% 12.29
% 32.06% 67.25% 59.20% 95.89
% 80.20%
International
MSCI Worl
d Islami
c
56.61% 63.73% 44.04
% 32.96% 58.77% 68.41% 84.76
% 72.26%
MSCI Worl
d Index
57.96% 63.69% 45.23
% 27.24% 59.35% 67.17% 84.85
% 75.37%
Arab
MSCI Arab Mrk
Islamic
39.51% 54.36% 33.80
% 43.09% 44.73% 57.65% 66.96
% 82.76%
MSCI Arab Mrk
Index
44.51% 56.93% 42.29
% 46.03% 43.78% 56.55% 68.37
% 78.30%
Discussion
The results from all regression models (one-factor, Treynor and Mazuy, and the four-factor) indicate that over the full sample period there was not any statistical evidence that the Islamic fund portfolio performed differently from the market, regardless of the portfolio’s geographical focus and the type of market benchmark used to adjust for risk (either Islamic or conventional). However, there was one exception when the four-factor model was used to benchmark the locally focused Islamic portfolio against the locally focused conventional index (TASI). The results show that the locally focused Islamic portfolio slightly, at 10 percent level of significance, underperformed the market index (TASI) by almost one-half percent.
The Performance of the Islamic Fund Portfolio Relative to the Market:

Center for Islamic Economics and Finance, Qatar Faculty of Islamic Studies, Qatar Foundation
53
Breaking down the sample period, the results during the bull period indicate the following. The locally focused Islamic portfolio did not perform differently from the locally focused market indices (Islamic and conventional), using all three regression models. However, using only the one-factor as well as the Treynor and Mazuy models, the results show that the internationally focused Islamic portfolio significantly, at 1 percent, outperformed the internationally focused market indices (Islamic and conventional indices). But when the four-factor model, which controls different investment styles, was used; the results show that such outperformance vanished. As for the Arab focused Islamic portfolio, the results show that it did not perform differently from Arab focused indices (Islamic and conventional indices) using the Treynor and Mazuy model and the four-factor model. The results from the one-factor model show that the Arab focused Islamic portfolio outperformed the Arab focused Islamic index, but performed no differently from the Arab focused conventional index.
The results during the bear period show that when the one-factor as well as the Treynor and Mazuy models were used, the locally focused Islamic portfolio did not performed differently from the locally focused market indices (both Islamic and conventional indices). However, when the four-factor model was used, the results show that the locally focused Islamic portfolio significantly underperformed both locally focused market indices (Islamic and conventional indices). As for the internationally focused Islamic portfolio, the results show that it significantly underperformed both internationally focused market indices when the one-factor model was used and underperformed only the internationally focused Islamic index (MSCI World Islamic Index) when Treynor and Mazuy model was used. However, when the four-factor model was used, that underperformance vanished. That is, the internationally focused Islamic portfolio did not perform differently from both internationally focused market indices. As for the Arab focused Islamic portfolio, the results indicate that it did not perform differently from both Arab focused indices (Islamic and conventional indices) using all three regression models.
The results during the financial crisis period indicate that the locally focused Islamic portfolio performed differently from the market depending on what regression model was used and what market benchmarked was employed to adjust for risk. However, the results from the four-factor model indicate that the locally focused Islamic portfolio outperformed only the locally focused Islamic index (GCC Islamic index) and performed no differently from the locally focused conventional index (TASI). As for the internationally focused Islamic portfolio, the results indicate that it did not perform differently from both internationally focused indices when the one-factor as well as the Treynor and Mazuy models were used. However, when the four-factor model was used, the internationally focused Islamic portfolio significantly, at 5 percent, underperformed both internationally focused market indices. As for the Arab focused Islamic portfolio, the results show that it did not perform differently from both Arab focused market indices (Islamic and conventional indices) using all three regression models.
When the performance of the Islamic portfolio is compared to the performance of the conventional portfolio, regardless of the portfolio’s geographical focus and whether the market index is an Islamic or a conventional index; the results show that there was no statistical
Performance Comparison between Islamic and Conventional Fund Portfolios:
Center for Islamic Economics and Finance, Qatar Faculty of Islamic Studies, Qatar Foundation
54
evidence that there existed any performance differences between the two portfolios. This is true when all regression models were used during all studied periods (overall, bull, bear, and financial crisis periods).
However, there was one exception when the one-factor as well as the Treynor and Mazuy models were used during the bull period to benchmark each of the internationally focused Islamic and conventional portfolios against both internationally focused market indices (Islamic and conventional indices). In other words, the internationally focused Islamic portfolio significantly, at 1 percent, outperformed the internationally focused conventional portfolio during the bull period. Both models showed that the outperformance was less than one-half percent, regardless what internationally focused market benchmark was used to adjust for risk. However, when the four-factor model was used such outperformance vanished.
As discussed, since funds are assembled into portfolios, then using the systematic risk (beta), as a measure of the portfolio’s riskiness, is more appropriate than using the total risk (variance). The analysis of the systematic risk will be based on two models. The first model is the commonly used single-factor model (CAPM). The second model is the constructed four-factor model that controls for different investment styles. Overall, the systematic risk results from both models are very much consistent with each other.
The Riskiness of the Islamic Fund Portfolio:
The results from both regression models (the one-factor and the four-factor models) indicate that during the overall sample period all betas were positive and highly significant, regardless of the portfolio’s geographical focus and the type of market benchmark used to adjust for risk (Islamic or conventional). Similar results were obtained during the bull, bear, and financial crisis periods.
However, there was one exception during the bull period when both models were used to benchmark the locally focused Islamic portfolio against the locally focused Islamic index (GCC Islamic index). That is, the results suggest that the return of the locally focused Islamic portfolio was independent from the return of the GCC Islamic Index during the bull period.
Looking at the systematic risk difference between Islamic and conventional portfolios, the results indicate the following. Looking at the locally focused portfolios, the systematic risk results from both models indicate that the locally focused Islamic portfolio was around 6 and 13 percent less risky than the locally focused conventional portfolio when the locally focused conventional benchmark (TASI) was used to adjust for risk during the overall and bull period, respectively. In addition, when using the four-factor model, the results also show that during the bear period the locally focused Islamic portfolio was around 5 percent less risky than the locally focused conventional portfolio when TASI was used to adjust for risk. However, when the locally focused Islamic index (GCC Islamic Index) was used to adjust for risk, the results from
Risk Comparison between Islamic and Conventional Fund Portfolios:

Center for Islamic Economics and Finance, Qatar Faculty of Islamic Studies, Qatar Foundation
55
both models show that there was no statistical evidence that there existed any risk differences between the locally focused Islamic and conventional portfolios.
Looking at the internationally focused portfolios, the systematic risk results from the single-factor model indicate that during all studied sample periods (overall, bull, bear, and financial crisis periods), there was no statistical evidence that there existed any risk differences between the internationally focused Islamic portfolio and the internationally focused conventional portfolio. Similar results were obtained when using the four-factor model, except during the bull period. That is, the systematic risk results from the four-factor model during the bull period indicate that the internationally focused Islamic portfolio was around 7 to 8 percent more risky than the internationally focused conventional portfolio. This result was also consistent with the result from the non-risk-adjusted return analysis (see table 11, panel B) where it showed that the internationally focused Islamic portfolio was more risky than the internationally focused conventional portfolio, using the variance as the risk measure. These results, however, contradict what was hypothesized because it was expected that Islamic funds are either less or as risky as their peers the conventional funds.
Looking at the Arab focused portfolios, the systematic risk results from both models indicate that during all sample periods (overall, bull, bear, and financial crisis periods) there was no statistical evidence that there existed any risk differences between the Arab focused Islamic portfolio and the Arab focused conventional portfolio.
The results from the Treynor and Mazuy model indicate that regardless of the portfolio’s geographical focus and the sample period under examination, there was no statistical evidence that there existed any differences in the ability to time the market between the Islamic and conventional portfolios.
Market Timing Skills:
The results from the four-factor model indicate that both Islamic and conventional portfolios exhibited identical sensitivities to both SMB and MOM risk factors, regardless of the portfolios’ geographical focus. Moreover, only Islamic and conventional portfolios that are locally and Arab focused exhibited similar sensitivities to the HML risk factor. All these results hold regardless of the sample period under examination.
Different Investment Styles:
As for the effect of the HML risk factor on the internationally focused portfolios, the results indicate that the internationally focused Islamic portfolio was more biased toward growth stocks than its peer the internationally focused conventional portfolio. This result was only observed during the overall period. However, results from other periods (bull, bear, and financial crisis periods) show that both internationally focused Islamic and conventional portfolios exhibited identical sensitivities to the HML risk factor.

Center for Islamic Economics and Finance, Qatar Faculty of Islamic Studies, Qatar Foundation
56
The adjusted R-squared from all models show that the locally, internationally, and Arab focused conventional index was considered a better fit in explaining the returns of the locally, internationally, and Arab focused Islamic portfolio than the locally, internationally, and Arab focused Islamic index, respectively. Such results raise a concern whether Islamic fund portfolios are truly distinguishing themselves as Shariah compliant fund portfolios or not. However, a further investigation regarding this issue is beyond the scope of this paper.
Adjusted R-Squared:
The results from all employed models indicate that there was no statistical evidence that there existed any differences in performance, riskiness, market timing skills, and sensitivities to all three risk factors (SMB, HML, and MOM) between Islamic and conventional portfolios, regardless of their geographical focus.
A Closer Look at Portfolios during the Recent Financial Crisis period:
Conclusions
This paper is considered an extension to the previous literature on Islamic mutual funds. What makes this paper unique is that it is the first paper, to our knowledge, that comprehensively investigates the performance and riskiness of Islamic mutual funds relative to conventional funds and relative to several Islamic and conventional indices in the Saudi Arabia context.
The sample used for this study consists of 143 Saudi mutual funds (96 are Islamic and 47 are conventional) from January 2003 to January 2010. The sample is considered a good representative of the entire Saudi mutual fund industry in terms of investment goal classifications, portfolio compositions, and Shariah compliance subcategories.
Furthermore, since this paper does not focus on individual funds, but instead on the entire mutual fund industry in Saudi Arabia, the fund sample are grouped into portfolios based on: 1) the fund’s geographical focus (locally, internationally, and Arab focused funds). 2) the fund’s Shariah compliancy (Islamic and conventional funds). 3) different market trends (overall, bull, bear, and the recent financial crisis periods).
The results from the regression models show that over the entire sample period, there was no statistical evidence that there existed any differences in performance between Islamic and conventional fund portfolios. Furthermore, the results also show that there was no statistical evidence that there existed any differences in performance between the Islamic portfolio and the employed market benchmarks, regardless if these benchmarks were Islamic or conventional benchmarks. All these results hold regardless of the geographical focus of the Islamic portfolio.
These findings imply that Islamic funds in Saudi Arabia offer opportunities to investors that are similar to those offered by conventional funds. There is no cost from adhering to the Shariah law. Hence, Muslim investors can invest in these Saudi Islamic funds in order to benefit and prosper from developments in both capital and financial markets without the fear that their Islamic beliefs are compromised.

Center for Islamic Economics and Finance, Qatar Faculty of Islamic Studies, Qatar Foundation
57
Also these findings imply that non-Muslim investors, who view investing in Islamic funds as a form of socially responsibility investing (SRI) since Islamic funds possess an ethical nature, can safely invest in these Shariah-complaint Saudi funds without fearing that doing so will be at the expense of the fund’s performance.
The main conclusion of this paper is that both Muslim and non-Muslim investors can safely consider Islamic mutual funds in their portfolio collection. However, the burden remains on the investor to single out candidate mutual funds based on their performance regardless of whether these funds were Islamic, conventional, or ethical funds.
Finally, this paper raises an important concern regarding the stringency in applying the Shariah law on Islamic mutual funds in Saudi Arabia. However, this issue is left for future research because investigating such issue is beyond the scope of this paper.

Center for Islamic Economics and Finance, Qatar Faculty of Islamic Studies, Qatar Foundation
58
Bibliography
Abderrezak, F. (2008). The Performance of Islamic Equity Funds: A Comparison to Conventional, Islamic and Ethical Benchmarks. Retrieved April 1, 2010, from Failaka: http://www.failaka.com/downloads/AbderrezakF_Perf_IslamicEquityFunds.pdf
Abdullah, F., Hassan, T., & Mohamad, S. (2007). Investgation of performance of Malaysian Islamic unit trust funds . Managerial Finance, 33 (2) , 142-153.
Ahmed, O. B. (2001). Islamic Equity Funds: The Mode of Resource Mobilization and Placement. Islamic Research and Training Institute, Islamic Development Bank, Jeddah, Saudi Arabia .
Annuar, M., Shamsher, M., & Ngu, M. (1997). Selectivity and timing evidence from the performance of Malaysian unit trusts. Pertanika Journal of Social Science and Humanities, Vol. 5 , 45-57.
Basso, A., & Funari, S. (2003). Measuring the performance of ethical mutual funds: a DEA approach. Journal of the Operational Research Society (54) , 521-531.
Bauer, R., Derwall, J., & Otten, R. (2007). The Ethical Mutual Fund Performance Debate: New Evidence from Canada. Journal of Business Ethics (70) , 111–124.
Bauer, R., Koedijk, K., & Otten, R. (2005). International evidence on ethical mutual fund performance and investment style. Journal of Banking & Finance (29) , 1751–1767.
Bodie, Z., Kane, A., & Marcus, A. (2005). Investments, 6th edition. New York: McGraw-Hill.
Carhart, M. M. (1997). On persistance in Mutual Fund Performance. Journal of Finance, 52 (1) , 57-82.
Chen, C., Cheng, F., Rahman, S., & Chan, A. (1992). A cross sectional analysis of mutual fund's market timing and security selection skill. Journal of Business Finance and Accounting, Vol. 19 , 659-674.
Cornell, V. J. (2006). In the Shadow of Deuteronomy: approaches to interest and usury in Judaism and Christianity. In A. Thomas, Interest in Islamic Economics: Understanding riba (pp. 13-25). Abingdon, Oxon, UK; New York, USA: Routledge.
Dabbeeru, R. N. (2006b, November). A four-step model to evaluate mutual funds: A case-study for equity mutual funds in Saudi Arabia. Retrieved April 13, 2010, from Social Science Research Network (SSRN): http://ssrn.com/abstract=946937
Dabbeeru, R. N. (2006c, December 21). Analyzing Balanced, Debt and Liquid Funds: A Case-study of Mutual Funds in Saudi Arabia. Retrieved April 20, 2010, from Social Science Research Network (SSRN): http://ssrn.com/abstract=952975
Dabbeeru, R. N. (2006a, August 1). Performance Analysis of Mutual Funds in Saudi Arabia. Retrieved March 14, 2010, from Social Science Research Network (SSRN): http://ssrn.com/abstract=921523

Center for Islamic Economics and Finance, Qatar Faculty of Islamic Studies, Qatar Foundation
59
DeLorenzo, Y. T. (2006). In the Shadow of Deuteronomy: approaches to interest and usury in Judaism and Christianity. In A. Thomas, Interest in Islamic Economics: Understanding riba (pp. 1-9). Abingdon, Oxon, UK; New York, USA: Routledge.
DeLorenzo, Y. T. (2007). Shari`ah Supervision of Islamic Mutual Funds. Retrieved April 24, 2010, from Islamic Finance Affairs: http://islamicfinanceaffairs.wordpress.com/2007/10/01/shariah-supervision-of-islamic-mutual-funds-sh-yusuf-talal-delorenzo/
Dewi, M., & Ferdian, I. (2009). Evaluating Performance of Islamic Mutual Funds in Indonesia and Malaysia. Retrieved May 1, 2010, from Universitas Indonesia: http://staff.ui.ac.id/internal/060603200/publikasi/
Elfakhani, S., & Hassan, M. K. (2005). Performance of Islamic Mutual Funds. Economic Research Forum, 12th Annual Conference, (pp. 1-33). Cairo, Egypt.
Elfakhani, S., Hassan, M. K., & Sidani, Y. (2007). Islamic Mutual Funds. In M. K. edited by M. Kabir Hassan, Handbook of Islamic banking (pp. 265-273). Cheltenham, UK ; Northampton, MA, USA: Edward Elgar.
El-Gamal, M. A. (2000). A Basic Guide to Contemporary Islamic Banking and Finance. Retrieved April 08, 2010, from Unpublished paper, Rice University: http://www.lariba.com/dev/knowledge-center/islamic-banking-guide.pdf
Fama, E. F., & French, K. R. (1996). Multifactor Explanations of Asset Pricing Anomalies. The Journal of Finance , 55-84.
Fama, E., & French, K. (1993). Common risk factors in the returns on stocks and bonds. Journal of Financial Economics 33 , 3−56.
Fama, E., & French, K. (1992). The cross-section of expected stock returns. Journal of Finance 47 , 427-465.
Forte, G., & Miglietta, F. (2007). Islamic Mutual Funds as Faith-Based Funds in a Socially Responsible Context. Retrieved May 5, 2010, from Social Science Research Network (SSRN): http://ssrn.com/abstract=1012813
Girard, E., & Hassan, M. K. (2005). Faith-Based Ethical Investing: The Case of Dow Jones Islamic Indexes. FMA papers .
Girard, E., & Hassan, M. K. (2008). Is There a Cost to Faith-Based Investing: Evidence from FTSE Islamic Indices. The Journal of Investing (17) , 112-121.
Gregory, A., Matatko, J., & Luther, R. (1997). Ethical until trust financial performance: Small company effects and fund size effects . Journal of Business Finance and Accounting, 24 , 705–725.
Grinblantt, M., & Titman, S. (1992). The Persistence of Mutual Fund Performance. The Journal of Finance, Vol. 47, No. 5 , 1977-1984.

Center for Islamic Economics and Finance, Qatar Faculty of Islamic Studies, Qatar Foundation
60
Hamilton, S., Jo, H., & Statman, M. (1993). Doing Well while Doing Good? The Investment Performance of Socially Responsible Mutual Funds. Financial Analysts Journal, Vol. 49, No. 6 , 62-66 .
Hassan, M. K. (2001). Risk, Return, and Volatility of Faith-Based Investing: The case of DJIM. Paper Presented at the Fifth Harvard University Forum on Islamic Finance, October 6-7 .
Hoepner, A. G., Rammal, H. G., & Rezec, M. (2009). Islamic Mutual Funds' Financial Performance and Investment Style: Evidence from 20 Countries. Retrieved May 1, 2010, from Social Science Research Network (SSRN): http://ssrn.com/abstract=1475037
Hussein, K. A. (2005). Islamic Investment: Evidence From Dow Jones and FTSE Indices. Paper presented at the 6th International Conference on Islamic Banking and Finance, Jakarta, Indonesia, November 21-14 .
Ibrahim, M. F., Ong, S. E., & Parsa, A. (2006). Shariah Property Investment in Asia . National University of Singapore research project .
Israelsen, C. L. (2005). A Refinemen to the Sharpe Ratio and Information Ratio. Journal of Asset Management, vol.5 .
Jegadeesh, N., & Titman, S. (1993). Returns to Buying Winners and Selling Losers: Implications for Stock Market Efficiency. Journal of Finance 48(1) , 65-91.
Jensen, M. C. (1967). The Performance of Mutual Funds in the Period 1945-1964. Journal of Finance, 23 (2) , 389-416.
Jensen, M. C. (1967). The Performance of Mutual Funds in the Period 1945-1964. Journal of Finance, 23 (2) , 389-416.
Khan, M. S., & Mirakhor, A. (1987). The Framework and Practice of Islamic Banking . In M. S. Mirakhor, Theoretical Studies in Islamic Banking and Finance (pp. 1- 14). Houston, Texas, USA: The Institute for Research and Islamic Studies.
Khatkhatay, M. H., & Nisar, S. (2007). Investment in Stocks: A Critical Review of Dow Jones Shari'ah Screening Norms. Islamic Development Bank , 21.
Kon, S. (1983). The market timing performance of mutual fund managers. Journal of Business Vol. 56 , 321.347.
Kon, S., & Jen, F. (1979). The investment performance of mutual funds: an empirical investigation of timing, selectivity and market efficiency. Journal of Business, Vol. 63 , 261-278.
Kräussl, R., & Hayat, R. (2008). Risk and Return Characteristics of Islamic Equity Funds. Retrieved May 19, 2010, from Social Science Research Network (SSRN): http://ssrn.com/abstract=1320712

Center for Islamic Economics and Finance, Qatar Faculty of Islamic Studies, Qatar Foundation
61
Kreander, N., Gray, R. H., Power, D. M., & Sinclair, C. D. (2005). Evaluating the Performance of Ethical and Non-ethical Funds: A Matched Pair Analysis. Journal of Business Finance & Accounting, 32 (7) & (8) , 1465-1493.
Kreander, N., Gray, R. H., Power, D. M., & Sinclair, C. D. (2002). The financial performance of European ethical funds 1996–1998 . Journal of Accounting and Finance, 1 , 3–22.
Lintner, J. (1965). The valuation of risk assets and the selection of risky investments in stock portfolios and capital budgets. Review of Economics and Statistics 47 , 13-37.
Luther, R. G., & John Matatko, D. C. (1992). The Investment Performance of UK “Ethical” Unit Trusts. Accounting Auditing & Accountability Journal, volume 5, issue 4 , 57-70.
Luther, R., & Matatko, J. (1994). The performance of ethical unit trusts: Choosing an appropriate benchmark. British Accounting Review 26 , 77–89.
Mallin, C. A., Saadouni, B., & Briston, R. J. (1995). The financial performance of ethical investment funds. Journal of Business Finance and Accounting, 22 , 483–496.
Mansor, F., & Bhatti, M. I. (2009). The Performance of Islamic mutual funds: The Malaysian Case. Paper presented in the 14th Annual Banking and Finance Conference, Melbourne University, September 29 .
McDonald, J. (1974). Objectives and performance of mutual funds. Journal of Finance and Quantitative Analysis, Vol. 13 , 311-333.
McKenzie, D. (2010). Islamic Finance 2010. Retrieved April 22, 2010, from International Financial Services London: http://www.ifsl.org.uk/output/ReportItem.aspx?NewsID=32
Merdad, H., Hassan, M. K., & Alhenawi, Y. (2010). Islamic Versus Conventional Mutual Funds Performance in Saudi Arabia: A Case Study. Journal of King Abdulaziz University: Islamic Economics, Contents Volume 23 Number 2 , 161-198.
Modigliani, F., & Modigliani, L. (1997). Risk adjusted performance. Journal of Portfolio Management, Vol. 23 , 45-54.
Muhammad, N. M., & Mokhtar, M. (2008). Islamic Equity Mutual Fund Performance in Malaysia: Risk and Return Analysis. Paper presented in the Malaysina Finance Association (MFA): 11th International Conference at Kuching, Malaysia, 5-6 June .
M'Zali, B., & Turcotte, M. (1998). The Financial Performance of Canadian and American Environmental and Social Mutual Funds. Partnership and Leadership: Building Alliances for a Sustainable Future, 7th International Conference, November 15-18 .
Newell, G., & Acheampong, P. (2002). The Role of Property in Ethical Managed Funds. Pacific Rim Real Estate Society (PRRES), conference at Christchurch, January 21-23 .
Obaidullah, M. (2005). Islamic Financial Services. Jeddah, Saudi Arabia: Islamic Economics Research Center.

Center for Islamic Economics and Finance, Qatar Faculty of Islamic Studies, Qatar Foundation
62
Rammal, H. G. (2006). The Importance of Shari’Ah Supervision in Islamic Financial Institutions. Corporate Ownership and Control, Vol. 3, Issue 3 , 204-208.
Reyes, M. G., & Grieb, T. (1998). The external performance of socially-responsible mutual funds. American Business Review, 16 , 1–7.
Sadeghi, M. (2008). Financial Performance of Shariah-Compliant Investment: Evidence from Malaysian Stock Market. International Research Journal of Finance and Economics, Issue 20 , 15-26.
Shamsher, M., Annuar, M., & Taufiq, H. (2000). Investment in unit trusts: performance of active and passive funds . Proceedings of FEP Seminar 2000: Issues in Accounting and Finance 2, Universiti Putra Malaysia Press, Serdang , 129-141.
Sharpe, W. F. (1964). Capital Asset Prices: A Theory of Market Equilibrium under Conditions of Risk . Journal of Finance, 19 (3) , 425-442.
Sharpe, W. (1966). Mutual Fund Performance. Journal of Business 39 (1) , 119-138.
Siddiqi, M. A. (2002). Muslim investors find faith in stock markets. The Middle East Magazine, September 1 .
Siddiqi, M. N. (2004). Riba, Bank Interest and the Rational of its Prohibition. Jeddah, Saudi Arabia: Islamic Research and Training Institute, Islamic Development Bank.
Treynor, J., & Mazuy, K. (1966). Can mutual funds outguess the market? Harvard Business Review, Vol. 44 , 131-136.
Usmani, M. T. (2002). An Introduction to Islamic Finance. The Hague, The Netherlands: Kluwer Law International.
Valpey, F. (2001). Structuring Islamic Equity Funds: Shari’a Portfolio. Paper presented at the 4th Paper presented at the 4th .
Visser, H. (2009). Islamic Finance: Principles and Practice. Cheltenham, Northampton: Edward Elgar.
White, H. (1980). A Heteroscedasticity Consistent Covariance Matrix Estimator and a Direct Test of Heteroscedasticity. Econometrica, Vol. 48 , 817-838.


