Embed Size (px)
Citation preview

ISSN: 2319-5967
ISO 9001:2008 Certified International Journal of Engineering Science and Innovative Technology (IJESIT)
Volume 3, Issue 4, July 2014
792
Effect of fillers on the longevity of the plastic
infused mining wire ropes Sheila Devasahayam
1, 3 Veena Sahajwalla
1 Michael Sng
2
1. Centre for Sustainable Materials Research and Technology (SMaRT Centre)
School of Materials Science and Engineering
University of New South Wales
Sydney, NEW SOUTH WALES 2052, AUSTRALIA.
2. Moly-Cop Ropes
Mayfield New South Wales 2304
PO Box 245C, Newcastle, NEW SOUTH WALES 2300, AUSTRALIA.
3. School of Science, Information Technology and Engineering,
Federation University Australia, Mt Helen
Ballarat, VICTORIA 3350
AUSTRALIA. Abstract: Mining wire ropes (MWR) are subjected to continued bending, tensile stresses and fluctuating loads. Rope
deterioration study is crucial for safe operating environment in open cut mines, better planning in terms of rope changes,
resulting in reduced cost to production ratios. This study investigates why some MWR perform better than the others.
Scanning electron microscope and Fourier Transform Infrared spectroscopy studies revealed the presence of kaolin as
filler at the surface/interface of polymer component of better performing wire ropes and none in the ones that failed
before its expected life expectancy. It is suggested kaolin reduces the incompatibility between PP and PE blend and the
microstructure of the semi crystalline polymer matrices. Fracture toughness rendered by these fillers to the polymer
matrix enhanced the mechanical performance of these ropes, by virtue of their ability to act as crack stoppers due to their
smaller sizes.
Keywords: Mining-wire ropes, fillers, FTIR, SEM, polymer-blends, micro-structures.
I. INTRODUCTION
Mining wire ropes (MWR) experiencing continued bending and tensile stresses and fluctuating loads, recoil at
considerable speeds causing damage through impact. Understanding rope deterioration and rope changes is
crucial for safe operation in open cut mines, and to reduce cost to production ratios. In MWR applications,
polymer blend (PB)s, such as isotactic (PP), (IPP) / high density polyethylene(PE), (HDPE), IPP/ low density
PE, (LDPE), are widely used [1,2].
Though, homopolymer of PP is used for high load/modulus and harsh environmental exposure, their large
spherulite dimensions affect mechanical properties adversely. This led to commercial interest in blends based on
IPP and polyolefins which exhibiting improved mechanical properties. PBs/ co-polymers are immiscible
showing phase separation during crystallization. The morphology development, thermal properties and
crystallinity of the PBs depend on miscibility between the blending components, thermal history and cooling
rate [3]. Fillers play an important role in modifying PBs [4]. Compatibilizers such as nanofillers can tune the
immiscible PB properties.
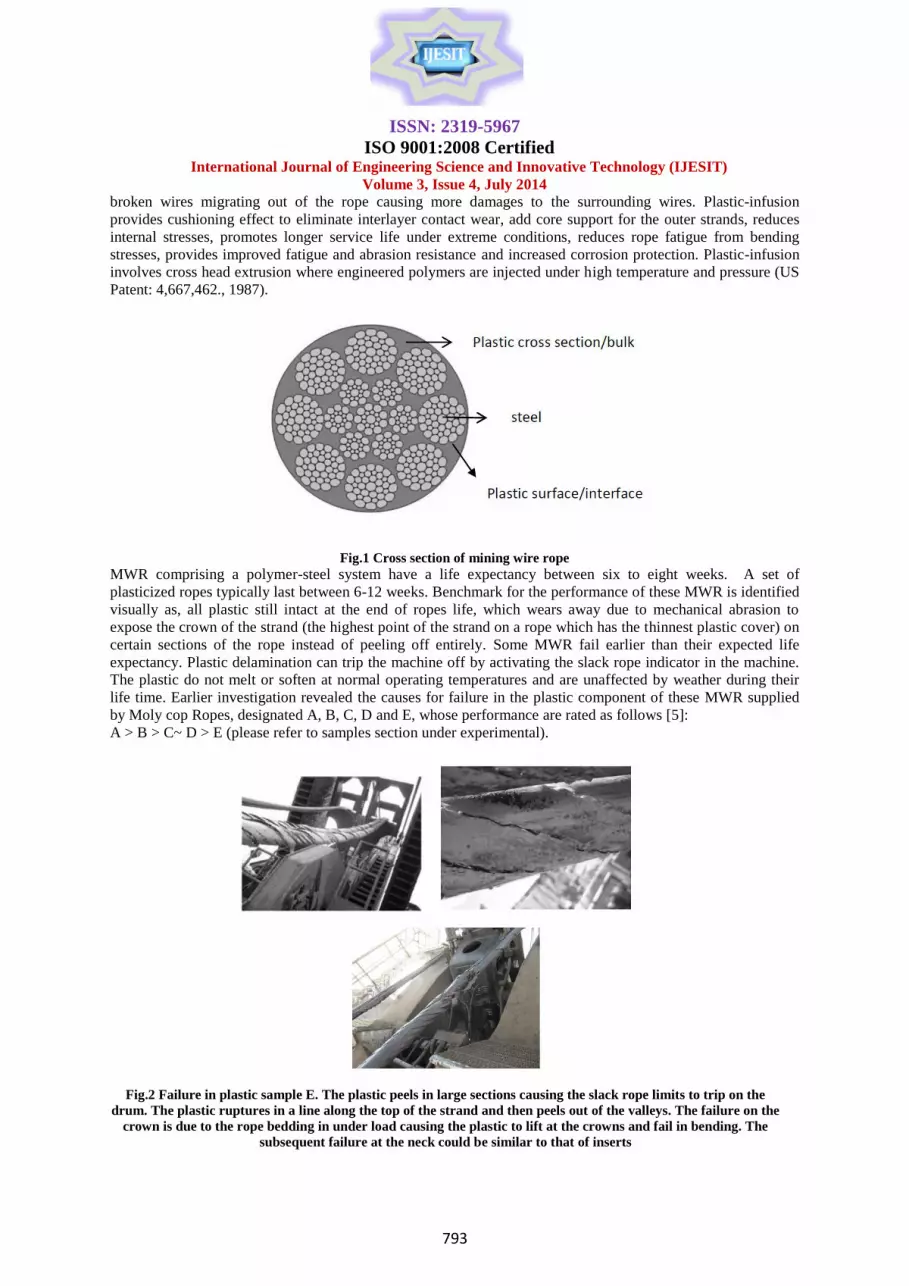
Rope construction controls tensile loading, abrasive wear, crushing, corrosion and rotation. MWR is fully
supported by steel core and plastic is extruded into the voids, consisting of several strands of steel wire laid (or
'twisted') into a helix featuring a 6 or 8 steel strand constructions (Figure 1). MWR is filled with plastic material
in the interstices between all strands and the individual wires within various strands. There is no change in steel
construction before and after the plastic-infusion.
The non-alloy carbon steel, with carbon content 0.4 - 0.95% contributes to the strength of the rope. A large
number of small sized wires and strands produce a flexible rope with good resistance to the bending fatigue.
Plastic is used to enhance the life of the MWR, protecting it from external damages and preventing the internal
grease from attracting sand and dirt which accelerates rope wear. Internally, the plastic provides extra cushion
support to reduce the pressures at contact points, reducing the fatigue wear and breaks reducing the likelihood of
ISSN: 2319-5967
ISO 9001:2008 Certified International Journal of Engineering Science and Innovative Technology (IJESIT)
Volume 3, Issue 4, July 2014
793
broken wires migrating out of the rope causing more damages to the surrounding wires. Plastic-infusion
provides cushioning effect to eliminate interlayer contact wear, add core support for the outer strands, reduces
internal stresses, promotes longer service life under extreme conditions, reduces rope fatigue from bending
stresses, provides improved fatigue and abrasion resistance and increased corrosion protection. Plastic-infusion
involves cross head extrusion where engineered polymers are injected under high temperature and pressure (US
Patent: 4,667,462., 1987).
Fig.1 Cross section of mining wire rope
MWR comprising a polymer-steel system have a life expectancy between six to eight weeks. A set of
plasticized ropes typically last between 6-12 weeks. Benchmark for the performance of these MWR is identified
visually as, all plastic still intact at the end of ropes life, which wears away due to mechanical abrasion to
expose the crown of the strand (the highest point of the strand on a rope which has the thinnest plastic cover) on
certain sections of the rope instead of peeling off entirely. Some MWR fail earlier than their expected life
expectancy. Plastic delamination can trip the machine off by activating the slack rope indicator in the machine.
The plastic do not melt or soften at normal operating temperatures and are unaffected by weather during their
life time. Earlier investigation revealed the causes for failure in the plastic component of these MWR supplied
by Moly cop Ropes, designated A, B, C, D and E, whose performance are rated as follows [5]:
A > B > C~ D > E (please refer to samples section under experimental).
Fig.2 Failure in plastic sample E. The plastic peels in large sections causing the slack rope limits to trip on the
drum. The plastic ruptures in a line along the top of the strand and then peels out of the valleys. The failure on the
crown is due to the rope bedding in under load causing the plastic to lift at the crowns and fail in bending. The
subsequent failure at the neck could be similar to that of inserts

ISSN: 2319-5967
ISO 9001:2008 Certified International Journal of Engineering Science and Innovative Technology (IJESIT)
Volume 3, Issue 4, July 2014
794
Fig. 3 A. XPS spectrum of sample A
We studied the effects of chemical composition, crystallinity, per cent PP and morphology of the polymer
matrix [5] on the performance/longevity of the MWR. We concluded that the PP content in PP-PE blends
correlated with performance of the MWR. Higher PP content, results in larger spherulite dimensions leading
to early failure in MWR. The crystallinity of PP [5], for IPP evaluated considering a crystalline peak at 841
cm−1
and a peak insensitive to phase content, at 973 cm−1
had following values: A: 0.38; B: 0.30; C:
0.37; D: 0.38 and E: 0.34. The crystallinity of PE was estimated from the ratio of 731 cm−1
to 719 cm−1
absorbances using FTIR (ASTM D5576).
A, D and C contained higher amorphous content than the crystalline phase. E and B also show higher
amorphous content than the crystalline content but only slightly higher. The proportion of PP was determined
using the relative ratio of the absorbance of two peaks in the rocking wagging region, a peak at 1168 cm−1
characteristic for methyl group wagging in PP and a peak at 720 cm−1
arising from ethylene rocking and
typical for HDPE using the ATR-FTIR technique. The PP content is estimated using the expression
A1168/(A1168 + A720) for different samples are: A: 51.11 %; B: 60.20 %; C: 34.81% ; D: 43.14%; and E:
84.83%. The objective for this research is to understand the differences between the plastics types and why
some MWR perform better than others. We also investigate factors causing early failure in MWR in addition
to higher % PP content, if and what fillers are present in the plastic component of the MWR and how they
improve the performance of PP-PE blend.
II. EXPERIMENTAL
A. Samples
The Moly-Cop Ropes supplied MWR samples and information on mechanical performance as listed below: A >
B > C~ D > E. Figure 2 shows the failure in plastic component of E. The manufacturers of MWR have not
released the chemical compositions; structures of MWRs. Samples are from different rope manufacturers with
different wire types and quality.
The surface samples are referred to as A-surface; B-surface; C-surface; D-surface and E-surface. The cross
sections of the samples are referred to as A-bulk; B-bulk; C-bulk; D-bulk and sample E- bulk. We investigated
the bulk as well as the interface /surface of all the samples.
B. X-ray photoelectron spectroscopy (XPS)
XPS reveals surface chemistry of the materials, limited to a depth of 1 to 12 nm in parts per thousand ranges.
The instrument ESCALAB250Xi, US, manufactured by Thermo Scientific, UK, with ssoftware: Advantage
had background

ISSN: 2319-5967
ISO 9001:2008 Certified International Journal of Engineering Science and Innovative Technology (IJESIT)
Volume 3, Issue 4, July 2014
795
Fig. 3 b. XPS spectrum of sample E
Vacuum > than 2 x 10⁻⁹
mbar. Source: mono-chromated Al K alpha (energy 1486.68 eV); power: 164 W
(10.8 mA and 15.2 kV); spot size: 500 m; photoelectron take off angle: 90 and the pass energy: 100 eV for
survey scans and 20 eV for surface region scans. Due to limited financial resources only two samples (A and
E) were subjected to XPS, a better and a worse performing plastic type, to draw the difference in surface
chemical composition.
C. ATR-FTIR spectroscopy
Bulk and the surface/interface of the MWR were studied using Perkin Elmer Spotlight 400 FTIR Microscope,
UK, a Fourier transform infrared (FTIR) spectrometer fitted with Harrick Grazing Angle ATR accessories. This
technique probes the surface of a sample (up to 2 m deep) with varying wavelengths of infrared energy. The
detection limit of IR is between 2 and 3 % by weight of the total sample. The technique allows transmittance or
absorbance to be measured. The spectra were accumulated for 4 scans at a resolution of 4 cm_1
over the spectral
range 600–4000 cm_1
at ambient temperature.
D. Scanning Electron Microscope (SEM) Tests
The Hitachi S-3400N SEM, from Hitachi Science Ltd. Japan, and EDS: XFlash 5010, Bruker AXS
Microanalysis GmbH Germany, fitted with secondary and backscatter electron detectors allowing topographic
and compositional (atomic number contrast) surface imaging were used to carry out imaging and X-ray
microanalysis. Carbon coating to render the samples more conductive using Emitech K575 x Evaporative
Carbon Coater, Quorum technologies.
III. RESULTS AND DISCUSSION
A. X-ray photoelectron spectroscopy (XPS)
The XPS spectra of A-surface and A-bulk and E-surface and E- bulk are shown in Figures 3a and3b. The
chemical compositions of the bulk and the surface/interface of A and E are summarised in Table 1. A-surface
and E-surface showed Zinc. E-surface showed higher amounts of silica-silicon compounds (4.95%)
compared to the A-surface (1.6%). The chemical composition of steel in E indicated less than 1% Si. Hence
it is concluded that the silicon/silica is not sourced from steel in E.
E-bulk showed silicon, part of which could have come from the colouring agent. The SEM of the colouring
agent used in E is presented in Figures 4a and 4b. A separate analysis of the colouring agent (not
incorporated in the polymer matrix) showed silica, titanium, and chlorine, though the FTIR of E-bulk
(Figures 5a and 6a) showed no evidence of titanium and chlorine. The XPS trace of E-surface showed
titanium, which could have come from the colouring agent migrating to the surface of E.

ISSN: 2319-5967
ISO 9001:2008 Certified International Journal of Engineering Science and Innovative Technology (IJESIT)
Volume 3, Issue 4, July 2014
796
Table 1. Chemical composition by XPS
Sample A- surface
Sample A-bulk
Sample E-surface
Sample E-bulk
Name Peak BE At. % Peak BE At. % Peak BE At. % Peak BE At. %
C1s A 285.01 82.84 285.01 92.27 168.95 0.2 285 94.49
C1s B 286.49 3.44 286.29 2.94 102.27 4.95 286.45 2.11
C1s C 288.67 1.56 168.95 0.2
S2p A 168.91 0.15 169.05 0.07 168.95 0.2 168.41 0.08
Si2p 102.22 1.6 102.35 0.88 102.27 4.95 102.15 0.78
P2p 133.93 0.22
Cl2p3 A 198.45 0.43
O1s A 532.11 6.54 532.18 3.37 532.19 11.24 532.19 1.66
O1s B 530.56 0.48 529.91 1.02 530.66 0.26
O1s C 533.42 0.91 533.84 0.22 533.8 0.67 533.49 0.28
N1s A 400.06 0.59 400.04 0.83 399.94 0.28
Ca2p3 A 347.63 0.47 347.53 0.3
Na1s A 1071.7 0.64 1071.7 0.21 1071.55 0.44 1071.73 0.06
Zn2p3 A 1022.27 0.1 1022.31 0.04 1022.23 0.18
Pb4f7 A 138.67 0.01 138.69 0.005
Ti2p3 458.44 0.22
a

ISSN: 2319-5967
ISO 9001:2008 Certified International Journal of Engineering Science and Innovative Technology (IJESIT)
Volume 3, Issue 4, July 2014
797
b
Fig. 4 SEM results of colouring agent used in sample E; a. SEM image of colouring agent; b. EDX of colouring
agent
The process of migration of melt additives, especially the polar groups in PBs leads to a preferential
enrichment of melt additive at the air-polymer interface [6]. There was no evidence of chlorine, though
present in the colouring agent on the E-surface, indicating that the chlorine could have volatilised during
crystallization. E-surface and A- surface showed calcium. A-surface showed lead, chlorine and phosphorous.
B. The FTIR difference spectrum
Fig 5a FTIR Spectra between 3800-3500 cm-1 of all bulk samples

ISSN: 2319-5967
ISO 9001:2008 Certified International Journal of Engineering Science and Innovative Technology (IJESIT)
Volume 3, Issue 4, July 2014
798
Fig. 5b FTIR Spectra between 3800-3500 cm-1 of all samples
FTIR-ATR spectra showed difference between the chemical composition of the bulk and surfaces (Figures
5a, 5b, 6a and 6b) for all samples except sample E. FTIR-ATR spectra of E- surface and the E-bulk were
identical. Two distinct regions of contrasts between the surface and the bulk samples are observed between
3800-3500 cm-1
and 1700-650 cm-1
for samples A, B, C and D.
A difference FTIR spectrum of B-surface and the E-surface was obtained by spectral subtraction, (Figure 7).
E- Surface exhibited a doublet at 1540 cm−1
and 1575 cm−1
, but absent in B-surface is attributed to the to the
coordination structure of carboxylate groups with calcium ions [7].
Other observed differences include, the disappearance of isotactic configuration of PP bands at 1165 cm-1
,
997 cm-1
and 977 cm-1
, for all the surface samples except E-surface (Figure 6b) . This indicates that the
isotactic configuration on the surface of the A, B, C and D are involved in some surface modification
involving fillers. The fillers affect crystallization processes and phase segregation in polymer matrix and
ultimate super molecular structure of semi crystalline polymer [8].
Since E was identified as the least performing, its performance is directly correlated to the absence of
surface modification seen in surface of A, B, C and D. Figure 6b shows new peaks, around 3500-3800 cm–1
for the A-surface, B-surface, C-surface, and D-surface, but not for E- surface. These new peaks are not seen
in any of the bulk samples (Figure 5a).
To narrow down the compound responsible for new peaks, the difference spectrum was matched with
Renishaw Minerals and Inorganic Materials Database r02 - S/N H16387and Renishaw Polymeric Materials
Database r03 - S/N H16387. The difference spectrum matched with kaolin (Al2Si2O5(OH)4) (Figure 8), a
common filler used in polyolefin products [8].
C. Peaks supporting presence of kaolin
Figure 8 shows published [9] spectrum of the kaolin modified by silane coupling agent. A typical spectrum
of kaolin shows four bands, at 3697, 3669, 3645 and 3620 cm–1
. The band observed at around 3620 cm-1
is
ascribed to the inner hydroxyls, and the bands observed at around the other three characteristic bands are
ascribed to the vibrations of the external hydroxyls. Other characteristic peaks for kaolinite [10] include
3695, 3665, 3650, 3620, 1640, 1108, 1025, 1000, 910, 782, 749, 690, 530, 460, 422, 360, 340 and 268 cm-1
.
ISSN: 2319-5967
ISO 9001:2008 Certified International Journal of Engineering Science and Innovative Technology (IJESIT)
Volume 3, Issue 4, July 2014
799
The band at 3670-56 cm-1
corresponds to Al---O-H stretching; the band at 3645 cm-1
to OH stretching,
crystalline hydroxyl [11,12 and13]; the band at 913 cm−1
to Al–OH; the bands at 1032, 1008, 469 cm−1
to Si–
O and the band at 913 cm−1
to Al–O–H. The bands at 1100 and 1200 cm−1
are assigned to the amorphous
SiO2.
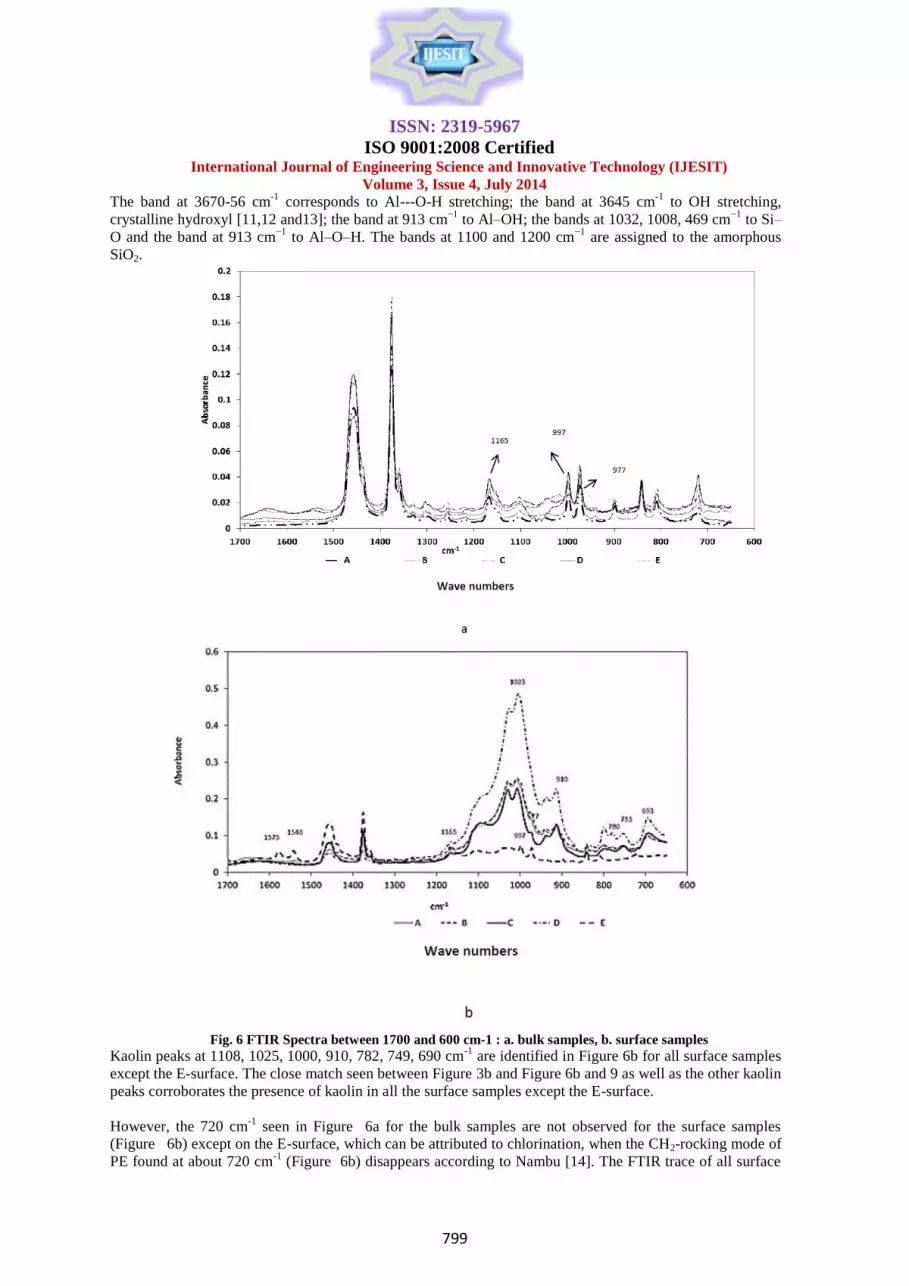
Fig. 6 FTIR Spectra between 1700 and 600 cm-1 : a. bulk samples, b. surface samples
Kaolin peaks at 1108, 1025, 1000, 910, 782, 749, 690 cm-1
are identified in Figure 6b for all surface samples
except the E-surface. The close match seen between Figure 3b and Figure 6b and 9 as well as the other kaolin
peaks corroborates the presence of kaolin in all the surface samples except the E-surface.
However, the 720 cm-1
seen in Figure 6a for the bulk samples are not observed for the surface samples
(Figure 6b) except on the E-surface, which can be attributed to chlorination, when the CH2-rocking mode of
PE found at about 720 cm-1
(Figure 6b) disappears according to Nambu [14]. The FTIR trace of all surface
ISSN: 2319-5967
ISO 9001:2008 Certified International Journal of Engineering Science and Innovative Technology (IJESIT)
Volume 3, Issue 4, July 2014
800
samples also showed the band at 920 cm-1
except for the E- surface suggesting chlorinated PEs. However,
absence of peaks at 1197cm-1
or at 1060 cm-1
, characteristic of C-C skeletal vibrations in the CHCl and
1260–1270 cm-1
characteristic CH bending vibrations for the chlorinated structures confirmed their absence.
Therefore, it was concluded that the filler responsible for the differences in the FTIR spectra of the bulk and
the surface samples, is kaolin. The FTIR spectrum of B-surface matched with kaolin and 36% chlorinated PE
is shown in Figure 9, where the best match is observed for the kaolin.
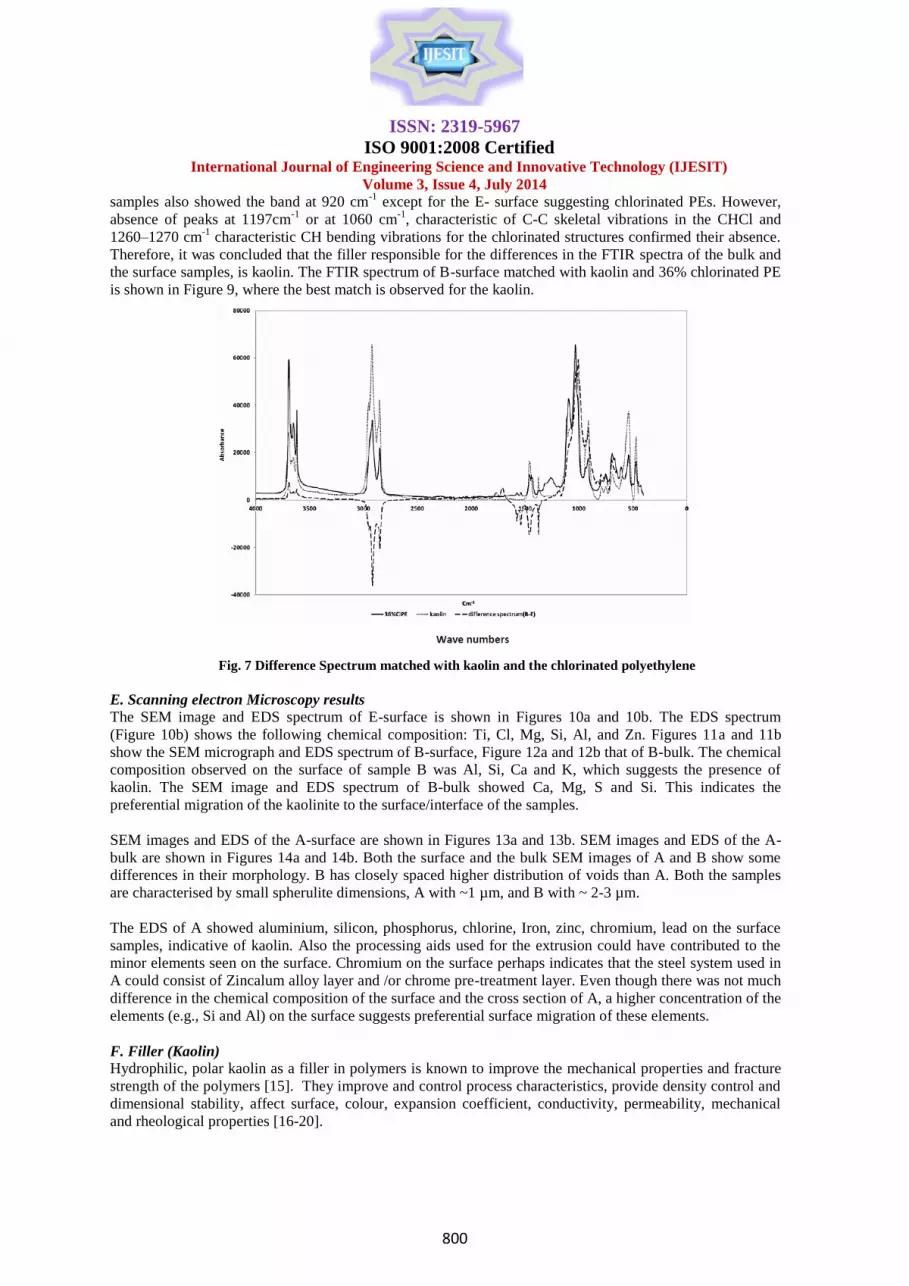
Fig. 7 Difference Spectrum matched with kaolin and the chlorinated polyethylene
E. Scanning electron Microscopy results
The SEM image and EDS spectrum of E-surface is shown in Figures 10a and 10b. The EDS spectrum
(Figure 10b) shows the following chemical composition: Ti, Cl, Mg, Si, Al, and Zn. Figures 11a and 11b
show the SEM micrograph and EDS spectrum of B-surface, Figure 12a and 12b that of B-bulk. The chemical
composition observed on the surface of sample B was Al, Si, Ca and K, which suggests the presence of
kaolin. The SEM image and EDS spectrum of B-bulk showed Ca, Mg, S and Si. This indicates the
preferential migration of the kaolinite to the surface/interface of the samples.
SEM images and EDS of the A-surface are shown in Figures 13a and 13b. SEM images and EDS of the A-
bulk are shown in Figures 14a and 14b. Both the surface and the bulk SEM images of A and B show some
differences in their morphology. B has closely spaced higher distribution of voids than A. Both the samples
are characterised by small spherulite dimensions, A with ~1 µm, and B with ~ 2-3 µm.
The EDS of A showed aluminium, silicon, phosphorus, chlorine, Iron, zinc, chromium, lead on the surface
samples, indicative of kaolin. Also the processing aids used for the extrusion could have contributed to the
minor elements seen on the surface. Chromium on the surface perhaps indicates that the steel system used in
A could consist of Zincalum alloy layer and /or chrome pre-treatment layer. Even though there was not much
difference in the chemical composition of the surface and the cross section of A, a higher concentration of the
elements (e.g., Si and Al) on the surface suggests preferential surface migration of these elements.
F. Filler (Kaolin)
Hydrophilic, polar kaolin as a filler in polymers is known to improve the mechanical properties and fracture
strength of the polymers [15]. They improve and control process characteristics, provide density control and
dimensional stability, affect surface, colour, expansion coefficient, conductivity, permeability, mechanical
and rheological properties [16-20].

ISSN: 2319-5967
ISO 9001:2008 Certified International Journal of Engineering Science and Innovative Technology (IJESIT)
Volume 3, Issue 4, July 2014
801
Kaolin-filled polymers, at higher loadings, possess the worst possible distribution, because of large filler
agglomerates, small particle size, high filler surface energy, adsorbing moisture during processing and lack
homogeneity [21]. Agglomeration is attributed to the intermolecular hydrogen bonding between the structural –
OH groups present in them.
In the present study, both PE and PP being nonpolar in nature, kaolin in the matrix is expected to possess
unintercalated or micro composite structure if the surface is not modified [20]. Figures 14a and 12a indicate a
fairly dispersed surface morphology for A-bulk and B-bulk, indicating that the kaolin is perhaps surface
modified. The A-Surface shows clusters / particles (Figure 13a) indicating migration of the particles to the
surface. Moreover, FTIR spectra of A and B show kaolin only on the surface/interfaces, not in the bulk.
Kaolin addition to immiscible polymers like PP and PE decreases the thermodynamic interaction parameter, X23
creating a diffuse interphase between the immiscible polymers. The miscibility of PBs is related to X23 [4]. It
also affects nucleation, kinetics of crystallization and the crystallinity [22].
Thus the fillers decrease the immiscibility and reduce the spherulite size of the crystalline domain of the
polymers [20, 23, 24, 25]. They control the morphology of the blends by preventing the coalescence and
reduction of X23, improving the adhesion between the two phases leading to the enhancement of mechanical
properties. With the increasing concentrations of the fillers, the crystallinity of the components of the blends
decreases.
E exhibited highest PP content and bigger spherulites. In comparison A, B showed smaller spherulite structures
and relatively homogenised morphology, suggesting added fillers which decreased their spherulite sizes, in
addition to their lower PP content compared to E. B-bulk despite its higher PP content than C-bulk and -D bulk
was identified as a better performing than C and D. B-bulk exhibited much lower crystallinity in PP than the
other samples (Figure 15).
The % PP in F igure 1 5 is estimated using the expression A1168/(A1168 + A720). 1168 cm−1
is
characteristic for methyl group wagging in PP and a peak at 720 cm−1
is characteristic for ethylene rocking and
typical for HDPE [26, 27].
The PP crystallinity, Xc, in Figure 15 was estimated quantitatively using FTIR technique [28, 29], evaluated
using the formula:
Xc
Acr = absorbancies of crystalline fraction
Aav = absorbancies of peak insensitive to phase content
aav = absorptivities of crystalline fraction
acr = absorptivities of peak insensitive to phase content.
For isotactic PP av = 973 cm-1
, cr = 841 cm-1
and a973/a841 = 0.57.
Lower crystallinity in PP in B-bulk is attributed to the higher filler content which decreases the crystallinity [5].
The nucleating effect of kaolin reduces the crystallinity in polymer matrix, spherulite size and increases nucleus
density [20, 25].
Kaolin exhibits flaky structure and high aspect ratios. Variation in aspect ratios in flaky fillers cause non
alignment resulting in uneven stress distribution reducing the transverse modulus. A high aspect ratio is
associated with large surface area, leading to better interaction between the polymer chain and the filler leading
to reduced shrinkage restricted to one direction. Thus reinforcement with kaolin flakes leads to increased tensile
and flexural strength [30, 31]. The polymer segments adjacent to the filler surface are immobilised due to the
high degree of dimensional stability of the filler particles. The micro sized fillers act as crack stoppers
increasing the fracture toughness of the polymers [32].
Polymer chains pack differently in the vicinity of a surface or interface of a filler particle, with the Interface
acting as a reflecting plane, the chain trajectory reflecting back into the polymer melt. The reflection does not
perturb projection of radius of gyration parallel to the plane, Rg, and is comparable to bulk Rg [33]. However,
it is reduced in perpendicular direction, Rg⊥, Consequently, the coil-coil interpenetration decreases

ISSN: 2319-5967
ISO 9001:2008 Certified International Journal of Engineering Science and Innovative Technology (IJESIT)
Volume 3, Issue 4, July 2014
802
resulting in a loss of entanglement at interface [34]. The reduced interpenetration of neighbouring chains in
favour of self-penetration leads to: a. weakening of the polymer network, b. decreased resistance to melt
flow, c. reduced entanglement density near the interface, leading to decreased entanglement molecular
weight, Me (Molecular weight of the polymer between cross-link points, at the interface). Larger the Me,
longer the time needed to relax any deviation from equilibrium state of entanglement strand. Failure
properties, such as toughness, depend critically upon the ratio of the Mw of the polymer to its Me.
Consequently, when the coil-coil interpenetration decreases it results in a loss of entanglement at the
substrate/melt interface. The relaxation of the repeating units of the polymer chains closest to the
nanoparticle surface are slowed by roughly 2 orders of magnitude when these repeating units and
nanoparticle have an attractive interaction. Conversely, when there is no attraction between monomers and
the nanoparticle, the relaxation of surface layer monomers is enhanced by roughly one order of magnitude
near the surface than the bulk. The concomitant energy dissipation arising from the extension and the
relaxation of the interfacial bonds contributes resistance to fracture. When the energy barriers separating the
metastable states are larger than the vibrational and thermal energies of the system, the interface does not
relax within any experimentally observable time frame. On the other hand, when the energy barriers are
comparable to thermal and vibrational energies, the contact area exhibits a time- dependent relaxation with a
concomitant dissipation of strain energy. Significant drag to crack propagation arise from rate-dependent
processes occurring right at the interface. When interfacial interaction is primarily due to dispersive forces
the relaxation time is on the order of a microsecond or less. The relaxation time of bond dissociation, for the
breaking of polymer chains is about 1013
s. When relaxation time < 1s chain pull out dominates while for
relaxation time ~ 1013
s, chain scission /bond scission dominates [32].
Fig. 8 IR spectra of associated hydroxyls for kaolin samples (a,b Uncalcined kaolin, modified; c,d calcined kaolin,
modified; e Calcined kaolin, unmodified. The absorption peaks of 3621– 3695 cm-1 are assigned to the hydroxyls
in the kaolinite structure, which disappear in the calcined samples. The peaks of 3424, 3447 and 3460 cm-1 are
assigned to the associated hydroxyls formed by coupling agent molecules in the surface of minerals. -(Reproduced
with permission with permission from Elsevier: Fig 3- Q. Liu et al. MAS NMR study of surface-modified calcined
kaolin, Applied Clay Science 19, 2001, 89–94)

ISSN: 2319-5967
ISO 9001:2008 Certified International Journal of Engineering Science and Innovative Technology (IJESIT)
Volume 3, Issue 4, July 2014
803
Fig. 9 FTIR spectrum of sample B-surface matched with kaolin and chlorinated polyethylene
Fig. 10a &10b SEM image and EDS spectrum of sample E-surface. Dimension of holes corresponding to 5-60
microns
Fig. 11a &11b. SEM image EDS Spectrum of sample B-surface

ISSN: 2319-5967
ISO 9001:2008 Certified International Journal of Engineering Science and Innovative Technology (IJESIT)
Volume 3, Issue 4, July 2014
804
Fig. 12a & 12b.SEM image and EDS Spectrum of sample B-bulk
Fig 13a &13b. SEM images EDS spectra of sample A-surface
Fig 14a & 14b. SEM images EDS spectra of sample A-bulk.

ISSN: 2319-5967
ISO 9001:2008 Certified International Journal of Engineering Science and Innovative Technology (IJESIT)
Volume 3, Issue 4, July 2014
805
Fig. 15 Crystallinity in polypropylene vs % polypropylene
When the filler exhibit comparable affinity of the filler for each blended polymer, the filler may be expected to
accumulate in the interfacial region and provide the immiscible PB with an enhanced stability. Otherwise, the
filler will preferably concentrate in the polymer phase which more strongly interacts with it. The selective
localization of the filler at the interface depends on the balance of interactions between the filler and each
constitutive polymer [35]. However, the SEM images in the present study do not reveal any such selective
localization of the fillers at the interfaces, ruling out any preferential affinity for kaolin for either PE or PP.
Early failure in sample E is attributed to higher PP content and the absence of fillers. The improved and better
performance of the A and B compared to E, is due to kaolin as filler, which reduces the X23of two immiscible
polymers, namely the PE and PP, improving their mechanical properties, reduces the crystallinity and the
spherulite size of the polymer matrix perhaps as a consequence of the reduction in entanglement length.
IV. CONCLUSION
The difference in performance of MWRs showed kaolin as a filler at the surface/interfaces of better
performing plastics as the possible cause. The fillers affect the crystallinity of the IPP and PE PB in the
MWR. They also decrease the X23, crystallinity and the spherulite size of the polymer matrix causing them to
better perform. Kaolin also improves the mechanical properties and fracture strength of the polymers. The
waning signal of isotactic configuration on the surface samples showed the evidence of fillers affecting the
phase segregation in the PBs.
REFERENCES [1] O. Olabisi, LM. Robeson, MT. Shaw: In Polymer–polymer miscibility. New York: Academic Press, 1979.
[2] LH. Sperling: In Introduction to physical polymer science. New Jersey: Wiley, 2006.
[3] JH. Chen, JC. Zhong, YH. Cai, WB. Su, YB. Yang: Morphology and thermal properties in the binary blends of poly
(propylene-co-ethylene) copolymer and isotactic polypropylene with polyethylene Polymer 2007; 48: 2946.
[4] VV. Shifrin., Y.S. Lipatov. , NY. Nesterov:. The introduction of a filler and consequent increase in the thermodynamic
compatibility of binary polyblends. Polym Sci U.S.S.R. 1985; 27: 412.
[5] S. Devasahayam., V.Sahajwalla. Michael, Sng: Investigation into failure in to MWRMWR– effect of crystallinity. Open
journal of organic polymer materials 2013; 3, 34-40.
[6] VM. Datla: Surface modification of fibres and nonwovens with melt additives. Doctoral Thesis / Dissertation. North
Carolina State University, 2008; 259.
[7] Y. Lu and J D. Miller: Carboxyl stretching vibrations of spontaneously adsorbed and lb-transferred calcium
carboxylates as determined by FTIR internal reflection spectroscopy. J Colloid Interface Sci 2002; 256: 41.
[8] SN. Mustafa: Effect of kaolin on the mechanical properties of polypropylene/ polyethylene composite Material. Diyala
Journal of Engineering Sciences 2012; 5 (02): 162.

ISSN: 2319-5967
ISO 9001:2008 Certified International Journal of Engineering Science and Innovative Technology (IJESIT)
Volume 3, Issue 4, July 2014
806
[9] Q. Liu., DA. Spears. Q. Liu: MAS NMR study of surface-modified calcined kaolin. Appl Clay Sci 2001; 19: 89.
[10] S. Mukherjee., S.K.Srivastava: Minerals transformations in north eastern region coals of India on heat treatment.
Energy Fuels 2006; 20: 1089.
[11] BR. Ilić., AA. Mitrović., LR. Miličić: Thermal treatment of kaolin clay to obtain metakaolin. Hem. ind. 2010; 64: 351.
[12] BJ. Saikia, G. Parthasarathy: Fourier transforms infrared spectroscopic characterization of kaolinite from Assam and
Meghalaya, Northeastern India. J. Mod. Phys. 2010; 1: 206.
[13] S. OLEJNIK., AM. POSNER, JP. QUIRK: The I.R. spectra of interlamellar kaolinite-amide complexes - i. the
complexes of formamide, n-methylformamide and dimethylformamide, Clays Clay Miner 1971; 19: 83.
[14] K. Nambu: Studies on chlorinated polyethylenes. I. Infrared spectra of chlorinated polyethylene’s. J. Appl. Polym. Sci.
1960; IV: 69-73.
[15] S. Roopa and Siddaramaiah: Effect of metakaolin filler on the physico-mechanical properties and chemical resistance of
chain extended polyurethane journal of reinforced plastics and composites, J Reinf Plast Compos 2007; 26: 681.
[16] S. Devasahayam: Interfacial toughness in polymer-layered laminar composites. J Polym Sci Part B: Polym Phys 2004;
42: 3822.
[17] S. Devasahayam: Towards improving wet-adhesion in a metal oxide-polymer coating system’s Appl Polym Sci 2006;
99: 3318.
[18] S.Devasahayam: Effect of moisture-ingress on adhesion energy in a metal oxide-polymer system. J. Appl. Polym. Sci.
J. Appl Polym Sci 2006; 99:2052.
[19] A. Ariffin, A. S. Mansor, S.S.Jikan and Z. A. Mohd. Ishak: Mechanical, morphological, and thermal properties of
polypropylene/kaolin composite. Part I. The effects of surface-treated kaolin and processing enhancement. J Appl
Polym Sci 2008; 108: 3901.
[20] Vikas Mittal: Polymer Nanocomposites: In synthesis, microstructure, and properties optimization of polymer
nanocomposite properties. Weinheim: WILEY-VCH Verlag GmbH & Co. KGaA, 2010.
[21] Y. W. Leong, M. B. Abu Bakar, Z. A. Mohd. Ishak, A. Ariffin, B. Pukanszky: Comparison of mechanical properties
and interfacial interaction between talc, kaolin and calcium carbonate filled polypropylene composites. J Appl Polym
Sci 2004; 91: 3315.
[22] WG. Perkins: Polymer toughness and impact resistance. Polym Eng Sci 1999; 39, 12: 2445.
[23] HW. Starkweather Jr, RE.Brooks: Effect of spherulites on the mechanical properties of nylon 66. J Appl Polym Sci
1959; 1(2): 236.
[24] MJ. Inoue: Studies on crystallization of high polymers by differential thermal analysis. Polym Sci Part a 1961; 1: 2013.
[25] Z. M. Ariffin., S. Ariff., S. Jikan: Evaluation on non-isothermal crystallization kinetics of polypropylene/kaolin
composites by employing Dobreva and Kissinger methods. Journal of Thermal Analysis and Calorimetry. J Therm
Anal Calorim 2011; 103: 171.
[26] CE.Miller: Use of Near-Infrared Spectroscopy to Determine the Composition of High-Density/Low-Density
Polyethylene Blend Films. Appl Spectrosc 1993, 47(2) 139. doi:10.1366/0003702934048370.
[27] W. Camacho, S. Karlsson: NIR, DSC, and FTIR as Quantitative Methods for Compositional Analysis of Blends of
Polymers Obtained from Recycled Mixed Plastic Waste Polym Eng Sci 2001; 41(9): 1626.
[28] S. Doroudiani, CB. Park, MT Kortschot:. Effect of the Crystallinity and Morphology on the Microcellular Foam
Structure of Semi crystalline Polymers. Polym Eng Sci, 1996; 36: 2645.
[29] YV Kissin:. Orientation of Isotactic Polypropylene in Crystalline and Amorphous Phases: IR Methods. J Polym Sci.,
Part B: Polym. Phys. 1983; 21: 2085.
[30] R. Gachte, H. Muller: In Plastic Additives Handbook: Stabilizers, processing aids, plasticizers, filler, reinforcements,
colorant for thermoplastics. Vienna: Hanser Publishers. Munich. 1987; 410.
[31] N. Allbee: In plastic compounding. New York: resin Publication Inc. 1984.
[32] Animangsu Ghatak, Katherine Vorvolakos, Hongquan She, David L. Malotky, & Manoj K. Chaudhury: Interfacial rate
processes in adhesion and friction. J. Phys. Chem. B. 2000; 104: 4018.
[33] HR. Brown, TP.Russell Entanglements at Polymer Surfaces and Interfaces. Macromolecules 1996; 29: 798.

ISSN: 2319-5967
ISO 9001:2008 Certified International Journal of Engineering Science and Innovative Technology (IJESIT)
Volume 3, Issue 4, July 2014
807
[34] O. Baumchen, R. Renate Fetzer,M. Klos, M. Lessel, L. Marquant, H. Hahl, K. Jacobs:. Cond Mat Soft. ArXiv:
1202.1002v1 5 Feb 2012; http://arxiv.org/pdf/1202.1002.pdf.
[35] F. Gubbels., S. Blather., E. Vanlathem., R. Jerome., R. Deltour, F. Brouers., and Ph. Teyssie: Design of Electrical
Composites: Determining the Role of the Morphology on the Electrical Properties of Carbon Black Filled PBs.
Macromolecules. 1995; 28(5): 1559.
AUTHOR BIOGRAPHY
Dr Sheila Devasahayam Lecturer, Metallurgy, Federation University Australia Mt. Helen, Ballarat, VIC 3350 Australia Ph + 61 (3) 53276466 Email: [email protected]
Dr Sheila Devasahayam has a strong research background in both metallurgy and polymer Science. Sheila obtained PhD in materials Science from University of Queensland and contributed to many aspects of polymer science ranging from coatings, radiation chemistry, surface modifications using plasma and nanocomposites. Sheila previously obtained PhD in chemical metallurgy from India and contributed to many aspects of mineral research including acid mine drainage, pressure leaching, thermal analysis, bacterial leaching, iron ore processing, coal dewatering and crushing studies using vertical shaft impeller and high pressure grinding rolls. The combined expertise in two diversified fields has enabled Sheila to provide solutions to industrial immediate problems, as evidenced in the current paper.
Scientia ProfessorVeena Sahajwalla
(FTSE FIEAust CPEng)
ASSOCIATE DEAN (Strategic Industry Relations) Faculty of Science
DIRECTOR, Centre for Sustainable Materials Research & Technology
Room 116, School of Materials Science & Engineering (BuildingE8)
University of New South Wales
SYDNEY
NSW 2052
AUSTRALIA
Ph: +61 (2) 9385 4426 | Fax: +61 (2) 9385 4292|
Email: [email protected]
http://www.smart.unsw.edu.au/
http://www.materials.unsw.edu.au/staff/veena-sahajwalla
Professor Veena Sahajwalla’s research interests include sustainability of materials
and processes with emphasis on environmental benefits. She is an international award
winning engineer who has widely presented on her research and experiences
throughout the world. As the Director of UNSW’s Centre for Sustainable Materials and