Embed Size (px)
Citation preview
ISSN: 2320-5407 Int. J. Adv. Res. 7(9), 828-843
828
Journal Homepage: - www.journalijar.com
Article DOI: 10.21474/IJAR01/9733
DOI URL: http://dx.doi.org/10.21474/IJAR01/9733
RESEARCH ARTICLE
A THOROUGH LITERATURE REVIEW OF CUSTOMER SATISFACTION DEFINITION, FACTORS
AFFECTING CUSTOMER SATISFACTION AND MEASURING CUSTOMER SATISFACTION.
Razafimanjary Maminiaina Aimee.
Business management, Master of management program, Parahyangan Catholic University.
……………………………………………………………………………………………………....
Manuscript Info Abstract
……………………. ……………………………………………………………… Manuscript History
Received: 12 July 2019 Final Accepted: 14 August 2019
Published: September 2019
Key words:- customer satisfaction, definition, factors,
measuring.
Customer satisfaction (CS) has attracted serious research attention in
the recent past year. Customer satisfaction is now for all companies the
primary criterion for the assessment of their relationship with the
market, a permanent object of their operating policies and an important
element for the reinforcement of company reputation, as well as a
fundamental guide to direct operational processes.
So this paper is done in order to have a deeper understanding on the
customers‘ satisfaction but especially help the students, the managers
and also all person which can use it. We will going to see some
definitions of the customer satisfaction, factors affecting customer
satisfaction, and also measuring the customer satisfaction.
Copy Right, IJAR, 2019,. All rights reserved.
……………………………………………………………………………………………………....
Introduction:- Customer satisfaction is an important aspect and becomes a key to run a successful business (Krivobokova, 2009). It
also becomes the most important focus area for worldwide companies. If customers are satisfied with the product,
they will repeat purchasing, showing loyalty, and telling good things to other people. Otherwise, they will move to
another brand or may complain and express their dislikes to the company and others. It can have long-term impact
on company‘s image (Nair, 2013).
Customers are valuable asset for the company, therefore, their opinion is crucial and should be explored persistently.
The company should focus on voice of customer to retain the customers longer. To know the customers‘ desires, the
company can build direct interaction with them. By conducting market research, company can investigate customer
satisfaction level.
Customer satisfaction is important to improve customer-focused products and services. Voice of customers can be a
valuable input for management in mapping which areas should be prioritized. There is a significant relationship
between product quality and customer satisfaction (Cruz, 2015). Seyedi et al. (2012) also stated that the product and
service quality were the important factors affecting customer satisfaction.
Moreover, the level of satisfaction depended on the extent to which the needs were met. According to Suchánek et
al. (2014), quality is defined as perceived quality of the customer, so the main factor in measuring product quality is
customer satisfaction itself. To achieve high customer satisfaction, it is important for the company to create products
that meet the requirements of its customers.
Corresponding Author:-Razafimanjary Maminiaina Aimee.
Address:-Business management, Master of management program, Parahyangan Catholic University.
ISSN: 2320-5407 Int. J. Adv. Res. 7(9), 828-843
829
Moreover, according to Alex and Thomas (2012), product quality is the degree to how well the product
specifications meet customers‘ expectations. On the other hand, Munusamy et al. (2010) mentioned that service
quality could be defined as the difference between the customer‘s expectations of the service with the perception of
the service received.
Purpose Of The Study
The main objective of this study is to review and provide the conceptual basics to understand the definition of
customer satisfaction; some factors which can affect the customer satisfaction and also the methodologies used for
measuring customer satisfaction.
Literature Review
Customer Satisfaction
Understanding Satisfaction is the level of a person's feelings after comparing the performance or perceived results
compared with expectations (Susanto, 2010). Definition Satisfaction is a value of one's feelings whether satisfying
or disappointing produced by a process comparing the presence or appearance of a product desirable to the expected
values.
Kotler and Keller (2012) said that "satisfaction is a person's feelings of pleasure or disappointment that result from
comparing a product's perceived performance (or outcome) to expectations". Whereas, customer satisfaction
according to Jahanshahi et al. (2011) is "customer satisfaction is the result of a customer's perception of the value
received in a transaction or relationship - where value equels perceived service quality relative to price and customer
acquisition costs". However, it is in contrast with the research of Tu et al. (2013) which indicated that "customer
satisfaction is viewed as influencing repurchasing intentions and behavior, which, in turn, leads to an organization's
future revenue and profits". Customer satisfaction is a customer feedback in the form of evaluation after purchasing
some goods or servicescompared with customer expectations. Customer satisfaction is measured by using the
customer expectations with the performance of the goods or services that can meet the needs and desires of the
customers. A satisfied customer means that there are similarities between the performance of the goods and services
with the hope of the customers, where it will encourage them to re-purchase the products. At the same time, a
disappointed customer would persuade the other customers to not re-purchase and as a result, they will move to
another brand competitor.
Kotler and Keller (2013) mention customer satisfaction is a person's feeling that is the result of a comparison of the
performance of a product purchased with what is expected by consumers. Customer satisfaction is defined by the
customer's response to the evaluation of perceived nonconformity between expectations and performance. Oliver
(2010) states that customer satisfaction is a post-purchase evaluation where the perception of product performance
exceeds customer expectations. Loveloock (2012) states that customer satisfaction is an emotional state, their post-
purchase reaction can be anger, dissatisfaction, irritation, excitement, and neutrality. Customer satisfaction has a
direct relationship with customer loyalty, profits and market share. Customers if they are satisfied with the value
provided by products and services, are likely to become customers for a long time.
Crosby, Evan and Cowles (19900 and Kim and Cha (2002) state that customer satisfaction is defined as an
experience based on customer evaluations or evaluations, namely reality greater than expectations, factors that
influence customer satisfaction if expectations are smaller than reality. then the customer is not satisfied, whereas if
the reality is greater than expectation then said the customer is satisfied.
Kotler and Armstrong (2012) defined that "customer satisfaction is the extent to which product's perceived
performance matches a buyer's expectations." Customer satisfaction consists of several indicators, namely loyalty,
satisfaction, repurchase interest, small desire to make a complaint, the willingness to recommend the product, and
the reputation of the company (Kotler and Keller, 2012; Nguyen and LeBlanc, 1998).
Kotler and Keller (2008) expressed satisfaction is feeling happy or disappointed someone emerged after comparing
between perception on the performance or the results of a product and hope- Hopes. Satisfaction is a function of
perception / impression of the performance and hope.
Experts have defined customer satisfaction in services as the extent to which customer‘s expectations are met
through services performance (Santouridis & Trivellas, 2010, 330-340). Satisfaction, according to Hui and Zheng
ISSN: 2320-5407 Int. J. Adv. Res. 7(9), 828-843
830
(2010, 306), is what the perceived quality results in the form of an evaluative judgment of a transaction. Sellers
directly come to know the customers‘ needs through customer satisfaction which is very significant because
business strengths and weaknesses can be evaluated through it. Moreover, it helps in improving the performance of
goods and services to both customers and employees. It not only gives knowledge on business strengths and
weaknesses but also attempts to urge competition based on those strengths and weaknesses. Likewise, it causes to
translate more vision into frustrating sources and areas where progress is needed. Finally, for informing management
of situations or issues in need of actual promotion, customer satisfaction assists in accommodating a relevant system
(ICR 2011).
Customer satisfaction, according to Deng et al (2009, 289), is very important part of the business setup because
business generates much revenue from the industry when the customer is satisfied by the services being provided.
Customer satisfaction refers to the customer buying behavior and the utility he obtained using the product. Customer
satisfaction functions in a single manner whereby a customer compares your product with those of competitors to
reach a decision. Therefore, customer‘s evaluation of products and services is what customer satisfaction defines in
that whether their services are meeting consumer needs or not. Through customer satisfaction, customer‘s
expectations are assessed in that they are being satisfied or remain unsatisfied with the quality of goods and services.
Customers, sometimes, are more satisfied in case the product performance goes beyond their expectation (Kotler
2012).
Customer satisfaction is the outcome that customers received when the service they experienced exceed their
expectation. In marketing, it is being viewed as the global evaluation of service experience over time (Lim et al.,
2006). Customer satisfaction is generally known as an outcome of service quality. Numerous studies in different
industries have proved this relationship. For instance, Rod & Ashill (2009), Szwajca (2018; 2016) and Ngo &
Pavelková (2017) in banking, Hussain et al. (2015) in airline, Srivastava & Sharma (2013) in telecommunication and
Saghier (2013) in hotel industry. Customer satisfaction portrays the quality of products or services provided to the
customer in a positive manner, whereby the level of customer satisfaction enhanced along with an increased level of
service quality (Bilan, 2013; Yeo et al., 2015). In other words, the more positive customers‘ perceived service
quality, the better their satisfaction level with the service provider is likely to be.
Customer satisfaction is important to improve customer-focused products and services. Voice of customers can be a
valuable input for management in mapping which areas should be prioritized. There is a significant relationship
between product quality and customer satisfaction (Cruz, 2015). Seyedi et al. (2012) also stated that the product and
service quality were the important factors affecting customer satisfaction. Moreover, the level of satisfaction
depended on the extent to which the needs were met. According to Suchánek et al. (2014), quality is defined as
perceived quality of the customer, so the main factor in measuring product quality is customer satisfaction itself. To
achieve high customer satisfaction, it is important for the company to create products that meet the requirements of
its customers.
Because of their impact on financial performance (Sun and Kim, 2013), customer satisfaction and loyalty are
crucially important to company management. From a cognitive psychology view, customer satisfaction arises from
consumers‘ subjective perceptions of post consumption performance against their prior expectations of performance
(Kim et al., 2015). The expectation disconfirmation paradigm (Oliver, 1981) proposes that customer satisfaction
arises in situations where expectations are met, or even exceeded (positively disconfirming/disconfirming) (Qian et
al., 2015). Because expectations differ among consumers, customer satisfaction is a highly subjective concept, and is
the result of cumulative service evaluations (Kaura et al., 2015). Following this stream of research, we define
customer satisfaction as a customer‘s overall assessment of his or her mobile service provider to date (Keiningham
et al., 2014). As a fundamental concept of marketing, customer satisfaction is widely recognized as a key intangible
asset, and one of the best indicators for future profits of a firm as it is positively associated with customer loyalty
(Kim et al., 2015; Luo et al., 2010; Ryding, 2010). Customer loyalty can be described as ―the strength of a
customer‘s dispositional attachment to a brand (or a service provider) and his/her intent to rebuy the brand (or
repatronize the service provider) consistently in the future‖ (Pan et al., 2012, p. 151). Besides driving higher
repurchase intentions, loyal customers are more likely to pay premium prices, make additional purchases, and bring
referrals through favorable word-of-mouth (Haumann et al 2014; Ryding, 2010; Qiu et al., 2015). In the context of
mobile services, empirical studies showed that customer satisfaction leads to favorable post-purchase behaviors,
such as increased customer loyalty, decreased customer complaints, and lower switching intentions (Calvo-Porral
and Lévy-Mangin, 2015; Morgeson et al., 2015).
ISSN: 2320-5407 Int. J. Adv. Res. 7(9), 828-843
831
In marketing literature, customer satisfaction has been considered as a crucial factor influencing customer loyalty
(Gerpott et al., 2001; Kumar et al., 2013; Kim et al., 2015a; Kim et al., 2016). Omachonu et al. (2008) suggest that it
is a psychological state where there is a consistency between the emerging emotion and expectation. Gerpott et al.
(2001) state that satisfied customers tend to retain their pattern of purchases. Grönholdt et al. (2000) point out that
customer loyalty is a function of customer satisfaction, and that loyal customers affect a company‘s financial
performance. Wong and Zhou (2006), Aktepe et al. (2015) and Chang, (2015) specify that satisfaction is one of the
key factors affecting customer loyalty. Analytical studies by Maxham and Netemeyer (2002) and Blodgett et al.
(1997) recognize the fact that satisfied customers publicize the firm and are more likely to remain loyal. Therefore,
it is crucial that customer satisfaction is selected as a factor determining customer loyalty in this study.
Customer Loyalty
Edvardsson et al. (2000) define customer loyalty as the desire or propensity of customers to buy on a continual basis
from the same firm. According to Caruana (2004) and Keropyan and Gil-Lafuente (2012), customer loyalty is a deep
commitment to repurchase the preferred product despite environmental volatility. Jones and Mothers Baugh (2002)
also define it as an attachment with the same organization for a long period, with the purpose of repeat purchase. For
this study, customer loyalty is defined as the reappearance of the customers with the same organization for longer
periods. As the level of competition increases, so does the need for customer loyalty, since there is a wide range of
choice, fast, creative, and innovative services (Bodet, 2008; Kim et al., 2016; Kumar et al., 2013; Karjaluoto et al.,
2012; Aktepe et al., 2015; Rasheed & Abadi, 2014; Stevens, 2000; Chang, 2015).
Customer loyalty is very important for the Company to maintain its business continuity and continuity of business
activities, loyal customers are those who are very satisfied with certain products or services, so have the enthusiasm
to introduce to anyone they know. Later in the next stage loyal customers will expand their "loyalty" to other
products made by the same manufacturer. And in the end they are consumers who are loyal to a particular
manufacturer or company forever. Kotler (2001) states that high loyalty is a customer who makes purchases with
increasing percentage in certain companies than other companies.
According to Griffin (2008) definition of customer loyalty as a manifestation of the behavior of the units of decision
making purchases continue - going against the goods / services of a company that is selected. Oliver in Vanessa
(2007) defines loyalty as a customer commitment to defend in depth to re-subscribe or repurchase of products /
services consistently elected in the future, although the influence of the situation and marketing efforts have
potential to cause behavioral changes. The characteristics of loyal customers among other things by Grifin (2008) is
refer to others, re-purchase on a regular basis, and show resistance to the pull of competitors.
According to Christina Whidya Utami (2006: 58), Consumer loyalty is the loyalty of consumers to shop at certain
locations. Loyalty does not form in a short time but through the learning process and based on the experience of the
consumers themselves from the purchase all the time. If the obtained is in accordance with expectations then the
purchase process continues to recur. It can be said that there has been a loyalty.
Customer loyalty is one of the most important customer metrics in marketing due to the profit impact of maintaining
a loyal customer base (Oliver, 2010). The literature points out that customer loyalty lead to firm profitability because
customer loyalty positively influences firm product-marketplace performance (Anderson & Mittal, 2000) and
financial performance (Gupta & Zeithaml, 2006). Brown and Chen (2001) propose three approaches used to
measure customer loyalty: 1) Behavioral measurement; 2) Attitudinal measurement; 3) Composite measurement.
Behavioral measurements consider continuous, repetitious purchase behavior as an indicator of loyalty. The
attitudinal measurements use attitudinal information to show the emotional and psychological attachment inherent in
loyalty, which include intentions for re-purchase and the spreading of positive word-of-mouth about a product or
service. Composite measurement of loyalty combines both behavioral and attitudinal dimensions (Rundle-Thiele &
Maio, 2001). It measures loyalty in terms of preferences as a result of trust in a product or service further explaining
that a customer is sincerely loyal only when brand commitment is present, which in turn is ―mediated by a high
degree of affective and cognitive brand conviction and attitude strength.‖ When a customer is said to have strong
resistance to change brands and have durable conviction over time, there is a high tendency to be committed to a
brand, resulting to measurement of loyalty.
According to Tipton, F (2000) consumer loyalty is a customer's commitment to a brand, store or supplier based on a
very positive nature in long-term purchases.
ISSN: 2320-5407 Int. J. Adv. Res. 7(9), 828-843
832
Factors affecting Customer Satisfaction
Factors such as commitment, service fairness, switching barrier, communication, conflict handling, price fairness,
and relational benefit are some of the determinants of customer satisfaction and customer loyalty. The determinants
vary depending on the scope of the particular industry. Commitment, service fairness and conflict handling, for
instance, have been largely used as determinants of customer loyalty in the financial services industry; whereas
relational benefit and switching barrier are important in the airline industry. Price fairness is a crucial determinant of
customer satisfaction and customer loyalty in service industries such as auto repairs and maintenance.
Zamazalová (Zamazalová, 2008) also mentions the key factors that affect customer satisfaction and which can be
used to measure customer satisfaction. These factors are product (in terms of its quality, availability etc.); price
(convenient payment conditions and others); services; distribution; and image of a product. Conversely, if
expectations are not met then what happens is dissatisfaction. The experience of repeated satisfaction will increase
the overall level of satisfaction and make it easier for customers to set clear expectations in the future. Broadly
speaking, customer satisfaction provides two main benefits for the Company, namely in the form of customer
loyalty and positive word get (word of mouth).
Factors affecting customer satisfaction according to Lupioyadi, (2001) include:
1. Product quality, i.e. customers will feel satisfied when their results show that the products they use quality.
2. Quality of service or service, that is customer will feel satisfied if they get good service or as expected.
3. Emotions, the customer will feel proud and gain confidence that others will be amazed by him when using
products with a particular brand that tends to have a higher level of satisfaction. Satisfaction obtained not
because of the quality of the product but social or self-esteem that makes customers feel satisfied with a
particular brand.
4. Price, i.e. products that have the same quality but set a relatively cheap price will provide a higher value to
customers.
5. Costs, i.e. customers who do not need to incur additional costs or do not need to waste time to get a product or
service tend to be satisfied with the product or service.
According Irawan (2004: 37), the factors that drive customer satisfaction are as follows:
1. Product quality, customer satisfied if after buying and using the product turns out the product quality is good.
2. Price, for sensitive customers, usually a cheap price is an important source of satisfaction because customers
will get high value for money.
3. Service Quality, satisfaction with service quality is usually difficult to imitate. Service quality is a driver that
has many dimensions, one of which is popular is SERVQUAL.
4. Emotional Factor, customers will feel satisfied (proud) because of the emotional value provided by the brand of
the product.
5. Cost and convenience, customers will be more satisfied if relatively easy, convenient and efficient in getting the
product or service.
Factors influencing customer perception and expectation according to Gaspersz (Nasution, 2005: 50) are as follows:
1. Needs and desires associated with things that customers feel when they are trying to make transactions with
producers or suppliers of products (companies). If at that time the needs and desires are large, expectations or
expectations of customers will be high, and vice versa.
2. Past experience when consuming products from companies and competitors.
3. Experience from friends, where they will tell the quality of the product to be purchased by the customer. This
clearly affects customers' perceptions especially on products that are perceived to be at high risk.
Service Quality
Service quality is regarded as a key source of competitive advantage, as it helps retain and attract customers.
According to Shin and Kim (2008), Tsoukatos and Rand (2006), Cronin and Taylor (1992) and Kim et al. (2015a)
service quality is associated with loyalty and customer satisfaction. This association has been confirmed, and
research has proven the positive role of service quality on customer satisfaction, which eventually leads to customer
loyalty (Santouridis & Trivellas, 2010; Deng et al., 2009; Turel & Serenko, 2006; Kim et al., 2004; Rashed &
Abadi, 2014). As such, service quality is included as an independent variable to customer loyalty.
ISSN: 2320-5407 Int. J. Adv. Res. 7(9), 828-843
833
Service quality within a service company is often conditioned as a comparison between the expected service and the
service received significantly. Companies that are able to provide good service to their customers or customers have
the greatest opportunity to continue to be visited by their customers (Liu and Wu 2007). Because service quality is
an important instrument that will make customers behave positively like, behavior to promote (refer to) company
products to others (Gounaris et al., 2003). Then it can be interpreted that the Service quality will have a positive
impact on customer loyalty (Lyon and Powers 2004). According to Parasuraman (1998: 77) there are 5 indicators of
service quality Tangibles, Reliability, Responsiveness, Assurance and Empathy
Perceived Value
Perceived value is the comparison that customers make between the advantages or disadvantages of one or more
service providers (Sanchezet et al., 2005). It has a marked association with customer loyalty (Park et al., 2006;
Kuoet al., 2009; Rasheed & Abadi, 2014; Chang, 2015). Sirdeshmukh et al. (2002), Yang and Peterson (2004), and
Wathneet al. (2001) also substantiate the fact with their findings. Atalik and Arslan (2009) found that perceived
value positively affected Turkish airline passengers. Similarly, in the Chinese phone industry, Lai et al. (2009)
pointed out how closely the two are related. Lin and Wang (2006), in their study of Taiwanese mobile phone
consumers, reiterated its significance. The importance of perceived value was also identified by other researchers,
such as Roiget et al. (2006), Anderson and Srinivasan (2003), Chen and Dubinsky (2003), Cronin et al. (2000),
Hellier et al. (2003), and Parasuraman and Grewal (2000). Overall, findings from research on customer loyalty in
telecommunication industries from 2001 to 2010 suggest that perceived value is one of the most common key
determinants of customer loyalty. Thus, we hypothesize that when consumers receive more value from what they
paid, they will decrease their search and will remain loyal to the firm.
Customer Value
Monroe (1990), defines that "customer value is buyers perceptions of value represent a trade-off between the quality
or benefits they perceive in the product relative to the sacrifice they perceived by paying the price", while Naumann
(1995) showed that " customer value is created when customer expectations in each of the three areas are met or
exceeded. Only when all three are in harmony will be maximized customer value ". Therefore, Ma and Ding (2010)
and Sugiarti have a different perspective concerning the customer value, Ma and Ding (2010) thought that "customer
value is Directly related to the benefit that a product or service ", whereas Sugiarti et al. (2013) concluded that
"customer value is an evaluation of the benefits of a product or service that is perceived by customers as Compared
to what the customers had dedicated to get the product or service".
Customer value is seen as a ratio of the benefits felt by the customer along with its sacrifice. The implementation of
this sacrifice is in line with the exchange process such as transaction costs and the risk of the products offered by the
company. Henceforth, there will be a disappointment when the ratio value that is perceived by the economic
sacrifices of the customers with the products offered by the company are not in accordance with the customer
expectations. Otherwise, when the ratio value is appropriate or exceeding the customer expectations, customers will
feel such satisfaction. Another idea about customer value is that it is the perception of the customer about the quality
and the benefit of toothpaste towards the sacrifice to pay the price. Customer value can be measured by functional
value, emotional value and social value (Kotler and Keller, 2012; Afiff and Astuti, 2009; and Shoki, 2012).
Kotler (2007) argues that customer value is the difference between total customer value and total customer cost.
Sugiarti T, et al (2013) found that customer value contributed to customer satisfaction in his study in South
Kalimantan against 150 Hypermarts. Wang et.al. (2004) found the role of customer value to customer satisfaction,
brand loyalty and customer behavior based on CRM performance. Kotler (2002) states that brand loyalty is one of
the brand assets, which shows the high value of a loyalty, because to build many challenges that must be faced and
takes a very long time. Woodruff RB (1997) states perceived value occurs through a customer shopping process
once repeated expenditures or expenditures.
Product and price
Customer satisfaction is determined by the quality and price of the products desired by the customer, as stated by
Bei and Chiao (2001) that "Consider product quality and price as the foundation to build up consumer satisfaction",
while Khan and Ahmed (2012) said that ―product quality is a critical determinant of consumer satisfaction ".
Moreover, Ehsani and Ehsani (2015) concluded that "price can be used as a resource to increase both profit and
customer satisfaction". In this decade, there have been a lot of studies that explain the causality between product
ISSN: 2320-5407 Int. J. Adv. Res. 7(9), 828-843
834
quality and price with customer value, between product quality and price with customer satisfaction, and between
customer values with customer satisfaction.
This is also supported by the research of Jahanshahi et al. (2011) that explained if product quality is influenced
customer satisfaction. Another research that has a similar point with this research is the research conducted by Malik
et al. (2012), he found that the price is affected customer satisfaction. Furthermore, the research of Hanzaee and
Yazd (2010) resulted that the price has an effect on customer value, and Munisih and Soliha (2015) proved that
product quality could influence customer value. Still, the results of Tu et al., (2013) research showed that customer
value is able to influence customer satisfaction. By that, a concept of structural equation model is designed in this
study to deepen the influence of product quality and price towards customer satisfaction with the mediator of
customer value.
Product
Garvin, 1987 developed a system of thinking about the quality of products by describing the basic elements of
product quality in eight dimensions. (Garvin, 1987): (Foster, 2001): pointed out that quality is multidimensional and
that each of its dimensions can be used strategically to gain competitive advantage. The following is a summary of
Garvin‘s eight dimensions of Product Quality:
1. Performance refers to a product's primary operating characteristics.
2. Features are additional characteristics that enhance the appeal of the product to the customer. These are the
secondary aspects of performance.
3. Reliability is the likelihood that a product will not fail within a specific time period when put in use.
4. Conformance is the precision with which the product or service meets the specified standards.
Durability measures the length of a product‘s operating life.
5. Serviceability is the speed, ease and costs with which the product can be put back into service when it breaks
down.
6. Aesthetics refers to how the product looks, feels, sounds etc. It is a matter of personal judgement and a
reflection of individual preference.
7. Perceived quality is the quality attributed by the customer, noting that perception is not always reality Here,
Kotler and Armstrong (2012) described that "product is anything that can be offered to a market for attention,
acquisition, use, or consumption that MIGHT satisfy a want or need ", while Aaker (1994), quoted Ehsani
(2015), said that "quality of product is the customer's perception of the overall quality or superiority of the
product or service, with respect to its intended purpose, relative to alternatives, ". Kotler and Amstrong (2012)
assumed that product quality is "Product quality is the characteristic of a product or service that bear on its
ability to satisfy stated or implied customer needs". It is important to note that the quality of the product is not
reviewed by the company standpoint, it is seen from the perspective of the customer. Associated with that, it
raised two important factors that affect the quality of the product, namely the expected product quality and the
perceived product quality. In details, if the perceived product quality is in line with the expectation, then the
customer will perceive the product quality as a good quality and also feel satisfied. Conversely, if the perceived
product quality is not as expected, then the quality of the product as the customer perceived is qualified as a bad
product quality. Thus, the qualification of both bad and good product depends on the ability of the company to
meet the customer expectations.
Kotler and Amstrong (2010) define product quality as the ability to carry out their duties which include durability,
reliability, progress, strength, ease of packaging and product repairs and other characteristics. A product is anything
that has value in the target market where its ability to provide benefits and satisfaction including objects, services,
organizations, places, people, and ideas. The way to view products like this involves a wide range of situations
including concrete and abstract services. Kotler and Keller (2013) divided the product level into five, the first core
benefit, namely the basic benefits of a product offered to consumers. The second basic product is the basic form of
the product that can be felt by the five senses. The third expected product is a series of product attributes and
conditions expected by the buyer at the time of buying the product. The fourth augmented product is one that
distinguishes between the products offered by business entities and the products offered by competitors. The fifth
product potential is all the arguments and changes that are improved, the form experienced by the product in the
future.
Price
Understanding the perception of prices according to Kotler and Keller (2013) is a process by which we choose,
ISSN: 2320-5407 Int. J. Adv. Res. 7(9), 828-843
835
organize and translate information input to create a meaningful world picture. The important thing is that perception
depends not only on physical stimulation, but also on the relation of stimuli to the surrounding plane and the
conditions in each of us, while the price is the sum of all the valuable that the customer gives toc profit from giving
a deep meaning to them. When consumers evaluate and research the price of a product is influenced by consumer
behavior.
According to Kotler and Keller (2013) there is a pricing objective covering first the orientation on profit or called
the profit maximization that every company always chooses the price that can give the most profit. Second
Orientation on volume pricing objectivity. Third orientation to the image. Company image can be formed through
pricing strategies. High prices for prestigious shows while low prices are used for trust purposes.
According to Zeithaml (1988), from the customer view, "price is what is given up or sacrificed to obtain a product or
service". Bei and Chiao (2001) indicated that "the price is defined as what is given up or sacrificed to acquire a
service or product", while Kotler and Armstrong (2012) suggested that "Price is the amount of money charged for a
product or a service; the sum of the values that customers exchange for the benefits of having or using a product or
service " How customers perceive a certain price, in which the high-low price of a product can be a significant effect
on a customer intention to purchase the product. Customer will give an attention to the price paid by other
customers, no one is happy to pay more cash compared to other customers. The fairness of the price will influence
the perception of the customers and it ultimately will influence their willingness to become a customer. For
toothpaste products, the price is the amount of money that is taken out for a toothpaste; customer value that is
exchanged to get the benefit from the ownership or use of a toothpaste. Kotler and Keller (2012) and Kusdiyah
(2012) defined price as something that can be measured which consists of several indicators, such as the affordable
price, the fair price, discounted price, competitor price, and price suitability.
Customer Delight: Customer delight is the reaction of customers when they receive a service or product that delivers value beyond their
expectations (Mascarenhas, et.al, 2004). To create delight, the company must understand customer needs, anticipate
customer needs, deliver more what customers expect, and make every moment of the aspect in this relationship fun,
or a fun experience. According to Plutchik in Kwong and Yau (2002) states that delight is a complex emotion, a
combination of "joy" and "surprise". Such customers have a high emotional attachment and positive cognition. In
contrast, outrage is a combination of "surprise" with "angry". Kwong, Yau and Oliver (2002), explains the indicators
in customer delight, namely Justice, Esteem, Security, Trust, Variety.
Methodologies for measuring Customer Satisfaction
After undertaking a literature review, the most popular methodologies in measuring CS are defined. The objective of
this section is to provide the basic conceptual ideas about the most popular methodologies.
National Customer Satisfaction Index (NCSI)
Sweden has become the first country to establish a national economic indicator reflecting customer satisfaction.
Clases Fornell (1992) in the articles ―A national Customer Satisfaction Barometer: The Swedish Experience‖
proposed a method for measuring CS in more than 30 industries and for more than 100 corporations. After the first
national customer satisfaction was developed in Sweden, a number of both national and international customer
satisfaction barometers and indices have been introduced such as the American Customer Satisfaction Index (ACSI)
(Fornell, Johnson, Anderson, Cha & Bryant, 1996), European Customer Satisfaction Index (ECSI), Norwegian
Customer Satisfaction Barometers (NCSB) (Andreassen & Lindestad, 1998), etc. The implementation of national
customer satisfaction indices seems to be suitable for a sustainable evaluation of the performance of companies in an
international context. (Grund & Bruhn, 2000).
In this methodology, Customer Satisfaction Index (CSI) represents its served market's – its customers'- overall
evaluation of total purchase and consumption experience, both actual and anticipated (Fornell, 1992; Johnson &
Fornell, 1991). Each version of NCSI can include some modifications. But all of them are based on two fundamental
properties. First, the methodology must recognize that CSI is a customer evaluation that cannot be measured
directly. Second, as an overall measure of CS, CSI must be measured in a way that not only accounts for
consumption experience, but is also forward-looking (Anderson & Fornell, 2000). Therefore, it includes not just
antecedents but also the consequences of overall CS. The antecedents of CS is based on the expectation and
disconfirmation paradigm which suggest that the dispersal between expectation of performance and perceived
ISSN: 2320-5407 Int. J. Adv. Res. 7(9), 828-843
836
performance can determine customer satisfaction (Yi, 1990). These antecedents are usually performance expectation
of a product or service, the perceived performance and perceived value. The consequences of overall customer
satisfaction are the customer behaviors such as loyalty and complaint (Fornell, 1992; Fornell, Johnson, Anderson,
Cha & Bryant, 1996; Grund & Bruhn, 2000; Johnson, Gustafsson, Andreassen, Lervik & Cha, 2001; Anderson &
Fornell, 2000). These antecedents and consequences are latent variables which can be measured through other
manifest variable which related to them. Structural Equation Modelling (SEM) is usually the technique for finding
the CS level and validating the causal relationship between CS and antecedents, consequences in this methodology.
One of the most important advantages of SEM is its capacity to study the relationships among latent constructs that
are indicated by multiple measures (Lei & Wu, 2007). In addition, SEM can provide separated estimates of relations
among latent constructs and their manifest variables (the measurement model) and of the relations among constructs
(the structural model) (Tomarke & Niels, 2005). The goal of SEM is to determine whether a hypothesized
theoretical model is consistent with the data collected to reflect this theory.
Service quality (SERVQUAL)
The SERVQUAL method was suggested to evaluate CS by Parasuraman, Zeithaml, and Berry (1988).
Consequently, there have been several follow-up articles and studies about the SERVQUAL method and its
application. Research in service quality has also been conducted within the framework of the expectation and
disconfirmation paradigm. The central idea in this model is that service quality is primarily a function of the
difference scores or gaps between expectations and perceptions (Jamali, 2007). The service quality research has
been dominated by the SERVQUAL instrument which is usually cluster in five group quality determinants:
Reliability, Responsiveness, Assurance, Empathy and Tangible (Parasuraman, Zeithaml & Berry, 1985; Ghobadian,
Speller & Jones, 1994; Curry & Herbert, 1998; Wisniewski, 2001).
However, there has been controversy in the service quality literature about the sequential order of the two
constructs: CS and service quality. While authors such as Dabholkar, Shepherd and Thorpe (2000); Cronin, Brady
and Hult (2000) regard perceived quality as an antecedent to satisfaction, other authors (e.g. Parasuraman et al.,
1988; Bitner, 1990), however, consider CS as an antecedent to service quality. The majority of recent publications
(e.g. Yavas, Benkenstein, & Stuhldreier, 2004; Carrillat, Jaramillo, & Mulki, 2007; Jamali, 2007) consider service
quality as an antecedent to CS. Thus, SERVQUAL can be used as a methodology used for measuring CS. The
objective of SERVQUAL methodology is usually to develop the best instrument for measuring CS. The best
instrument can be defined as the best service quality constructs for predicting CS for a specific firm. Structural
Modelling Equation, Factor Analysis or Multiple Regression analysis are usually used for choosing and validating
the best service quality constructs among the proposed ones.
Various scholars however pointed out that SERVQUAL is not a generic measure that could be applied to any
service and that it needs to be customized to the specific service under consideration (Carman, 1990; Babakus &
Boller, 1992). Li, Riley, Lin and Qi (2006) proposed five quality dimensions for comparing overall CS between two
largest US parcel delivery companies, the UPS and FedEx. They are availability, responsiveness, reliability,
completeness, and professionalism of service. Jamali (2007) proposed a conceptual model which included not just
basic service quality dimension but also others antecedents of CS such as: Equity, Attributions, Cost/benefit
analysis, Emotion,etc. Chadee and Mattsson (1996) investigated the best attributes influence on the overall
satisfaction of a quality dimension during tourist encounters. The quality dimensions in the article were eating out,
hotel accommodation, renting a car and going on a sightseeing tour. Andaleeb and Conway (2006) used factor
analysis and regression model to find the impact of service quality determinants on CS in the restaurant industry.
MUlticriteria Satisfaction Analysis (MUSA)
The MUSA method was first introduced by Grigoroudis and Siskos (2002). The main objectives of MUSA method
are: (1) supply the evaluation of customers‘ satisfaction level, both globally and partially for each of the
characteristics of the provided service; (2) The supply of a complete set of results that analyze in depth customers‘
preferences and expectations, and explain their satisfaction level; (3) The development of a decision tool with
emphasis on the understanding and the applicability of the provided results (Grigoroudis & Siskos, 2002). The
proposed MUSA method defines CS as the aggregation of individual judgments into a collective value function
assuming that client‘s global satisfaction depends on a set of n criteria or variables representing service
characteristic dimensions. The required data for the MUSA method is collected through a questionnaire through
which the customers are asked about their perception about the overall satisfaction ( ) and their satisfaction about
ISSN: 2320-5407 Int. J. Adv. Res. 7(9), 828-843
837
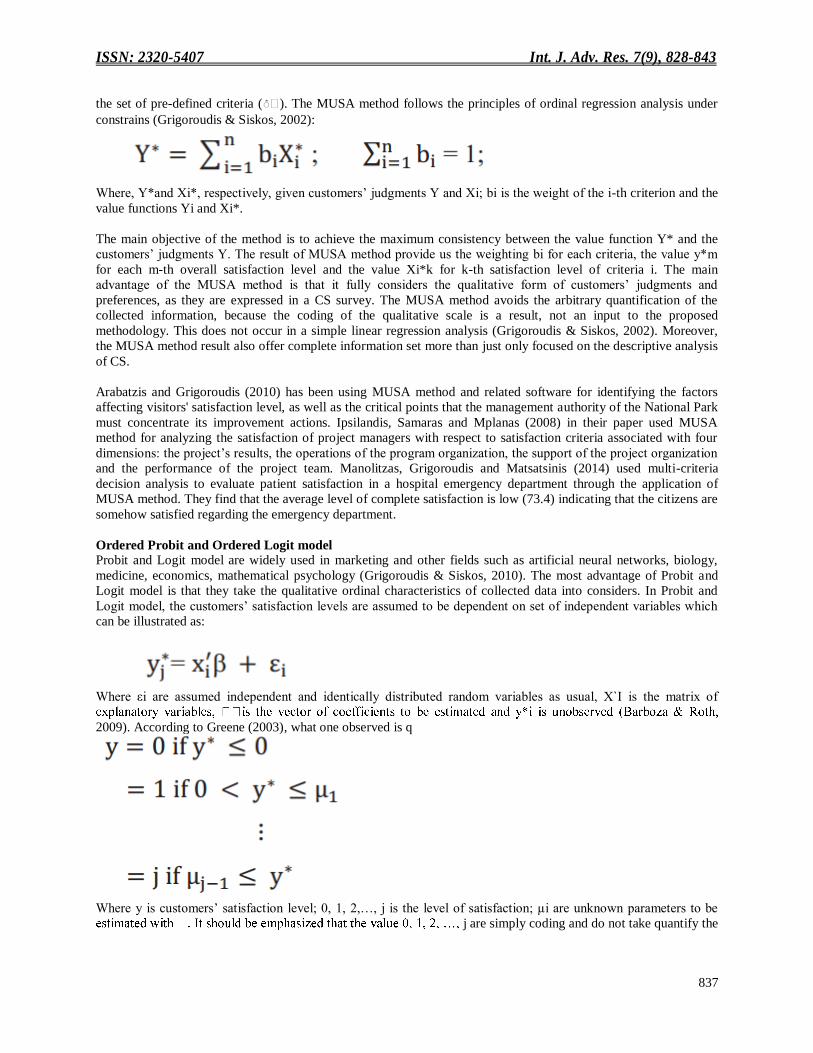
the set of pre-defined criteria ( ). The MUSA method follows the principles of ordinal regression analysis under
constrains (Grigoroudis & Siskos, 2002):
Where, Y*and Xi*, respectively, given customers‘ judgments Y and Xi; bi is the weight of the i-th criterion and the
value functions Yi and Xi*.
The main objective of the method is to achieve the maximum consistency between the value function Y* and the
customers‘ judgments Y. The result of MUSA method provide us the weighting bi for each criteria, the value y*m
for each m-th overall satisfaction level and the value Xi*k for k-th satisfaction level of criteria i. The main
advantage of the MUSA method is that it fully considers the qualitative form of customers‘ judgments and
preferences, as they are expressed in a CS survey. The MUSA method avoids the arbitrary quantification of the
collected information, because the coding of the qualitative scale is a result, not an input to the proposed
methodology. This does not occur in a simple linear regression analysis (Grigoroudis & Siskos, 2002). Moreover,
the MUSA method result also offer complete information set more than just only focused on the descriptive analysis
of CS.
Arabatzis and Grigoroudis (2010) has been using MUSA method and related software for identifying the factors
affecting visitors' satisfaction level, as well as the critical points that the management authority of the National Park
must concentrate its improvement actions. Ipsilandis, Samaras and Mplanas (2008) in their paper used MUSA
method for analyzing the satisfaction of project managers with respect to satisfaction criteria associated with four
dimensions: the project‘s results, the operations of the program organization, the support of the project organization
and the performance of the project team. Manolitzas, Grigoroudis and Matsatsinis (2014) used multi-criteria
decision analysis to evaluate patient satisfaction in a hospital emergency department through the application of
MUSA method. They find that the average level of complete satisfaction is low (73.4) indicating that the citizens are
somehow satisfied regarding the emergency department.
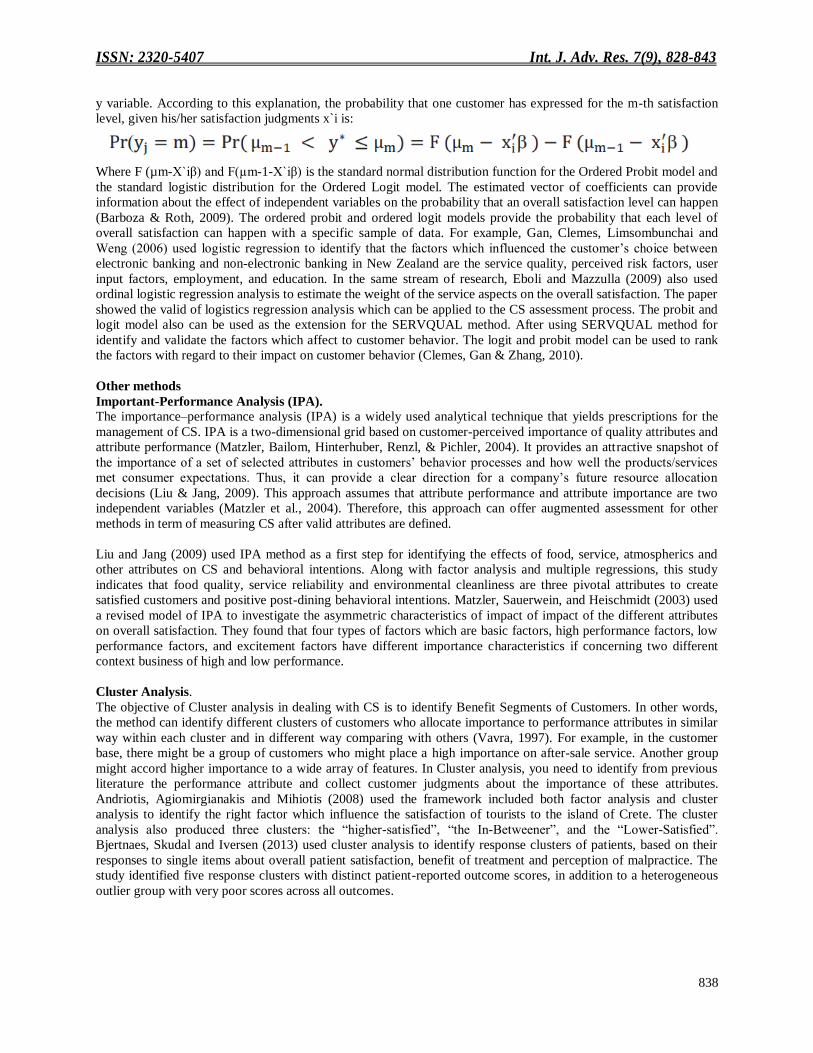
Ordered Probit and Ordered Logit model Probit and Logit model are widely used in marketing and other fields such as artificial neural networks, biology,
medicine, economics, mathematical psychology (Grigoroudis & Siskos, 2010). The most advantage of Probit and
Logit model is that they take the qualitative ordinal characteristics of collected data into considers. In Probit and
Logit model, the customers‘ satisfaction levels are assumed to be dependent on set of independent variables which
can be illustrated as:
Where εi are assumed independent and identically distributed random variables as usual, X`I is the matrix of
2009). According to Greene (2003), what one observed is q
Where y is customers‘ satisfaction level; 0, 1, 2,…, j is the level of satisfaction; µi are unknown parameters to be
j are simply coding and do not take quantify the
ISSN: 2320-5407 Int. J. Adv. Res. 7(9), 828-843
838
y variable. According to this explanation, the probability that one customer has expressed for the m-th satisfaction
level, given his/her satisfaction judgments x`i is:
Where F (µm-X`iβ) and F(µm-1-X`iβ) is the standard normal distribution function for the Ordered Probit model and
the standard logistic distribution for the Ordered Logit model. The estimated vector of coefficients can provide
information about the effect of independent variables on the probability that an overall satisfaction level can happen
(Barboza & Roth, 2009). The ordered probit and ordered logit models provide the probability that each level of
overall satisfaction can happen with a specific sample of data. For example, Gan, Clemes, Limsombunchai and
Weng (2006) used logistic regression to identify that the factors which influenced the customer‘s choice between
electronic banking and non-electronic banking in New Zealand are the service quality, perceived risk factors, user
input factors, employment, and education. In the same stream of research, Eboli and Mazzulla (2009) also used
ordinal logistic regression analysis to estimate the weight of the service aspects on the overall satisfaction. The paper
showed the valid of logistics regression analysis which can be applied to the CS assessment process. The probit and
logit model also can be used as the extension for the SERVQUAL method. After using SERVQUAL method for
identify and validate the factors which affect to customer behavior. The logit and probit model can be used to rank
the factors with regard to their impact on customer behavior (Clemes, Gan & Zhang, 2010).
Other methods
Important-Performance Analysis (IPA). The importance–performance analysis (IPA) is a widely used analytical technique that yields prescriptions for the
management of CS. IPA is a two-dimensional grid based on customer-perceived importance of quality attributes and
attribute performance (Matzler, Bailom, Hinterhuber, Renzl, & Pichler, 2004). It provides an attractive snapshot of
the importance of a set of selected attributes in customers‘ behavior processes and how well the products/services
met consumer expectations. Thus, it can provide a clear direction for a company‘s future resource allocation
decisions (Liu & Jang, 2009). This approach assumes that attribute performance and attribute importance are two
independent variables (Matzler et al., 2004). Therefore, this approach can offer augmented assessment for other
methods in term of measuring CS after valid attributes are defined.
Liu and Jang (2009) used IPA method as a first step for identifying the effects of food, service, atmospherics and
other attributes on CS and behavioral intentions. Along with factor analysis and multiple regressions, this study
indicates that food quality, service reliability and environmental cleanliness are three pivotal attributes to create
satisfied customers and positive post-dining behavioral intentions. Matzler, Sauerwein, and Heischmidt (2003) used
a revised model of IPA to investigate the asymmetric characteristics of impact of impact of the different attributes
on overall satisfaction. They found that four types of factors which are basic factors, high performance factors, low
performance factors, and excitement factors have different importance characteristics if concerning two different
context business of high and low performance.
Cluster Analysis.
The objective of Cluster analysis in dealing with CS is to identify Benefit Segments of Customers. In other words,
the method can identify different clusters of customers who allocate importance to performance attributes in similar
way within each cluster and in different way comparing with others (Vavra, 1997). For example, in the customer
base, there might be a group of customers who might place a high importance on after-sale service. Another group
might accord higher importance to a wide array of features. In Cluster analysis, you need to identify from previous
literature the performance attribute and collect customer judgments about the importance of these attributes.
Andriotis, Agiomirgianakis and Mihiotis (2008) used the framework included both factor analysis and cluster
analysis to identify the right factor which influence the satisfaction of tourists to the island of Crete. The cluster
analysis also produced three clusters: the ―higher-satisfied‖, ―the In-Betweener‖, and the ―Lower-Satisfied‖.
Bjertnaes, Skudal and Iversen (2013) used cluster analysis to identify response clusters of patients, based on their
responses to single items about overall patient satisfaction, benefit of treatment and perception of malpractice. The
study identified five response clusters with distinct patient-reported outcome scores, in addition to a heterogeneous
outlier group with very poor scores across all outcomes.
ISSN: 2320-5407 Int. J. Adv. Res. 7(9), 828-843
839
Data Envelopment Analysis (DEA).
The traditional DEA technique has long been utilized as an invaluable tool in the field of operations research and
management science to solve problems in wide range of industries as well as in not-for profit (Bayraktar, Tatoglu,
Turkyilmaz, Delen & Zaim, 2012). The DEA model measures the efficiency of any Decision Making Unit (DMU)
which is obtained as the maximum of a ratio of weighted outputs to weighted inputs subject to the condition that the
similar ratios for every DMU be less than or equal to unity (Charnes, Cooper, & Rhodes, 1978). In DEA model for
CS, a DMU is a customer which expresses judgments. The inputs are usually the attributes of overall CS which are
pre-defined from the literature. The outputs are usually customer behaviors such as: overall CS, customer loyalty,
customer re-purchase intention, etc. DEA method respects and takes into account the cause-effect relationship
between inputs and outputs makes it suitable for measuring the result of the company‘s efforts to satisfy customers.
DEA model provides the efficiency score which express how efficient the attributes from products/services make the
customer satisfy comparing with other products or services. DEA can be used most effectively for benchmarking to
compare the satisfaction level between a groups of companies. Löthgren and Tambour (1999) used DEA network
model to obtain measures of efficiency and productivity that account for CS of Swedish pharmacies. Estimation
results from the network model and a direct productivity model (without CS) are compared and indicate that the
technical efficiency is lower under the network model. Bayraktar et al. (2012) used DEA for analyzing and
comparing CS and loyalty efficiency for mobile phone brands in an emerging telecommunication market, Turkey.
Drawing on the perceptual responses of 251 mobile phone users, the DEA models reveal that from the top six
mobile phone brands in Turkey, Nokia features as the most efficient brand followed by LG and Sonny Ericsson in
terms of CS and loyalty.
There are still a lot of methods and models which can be useful for measuring CS. They are not mentioned in detail
in this study concerning the less popular of these methods for both academic research and practical application in
term of measuring CS. These methods can be named such as: Descriptive Statistics, Discriminant analysis, Kano
model, multiple regressions, conjoint analysis, etc.
Conclusion:-
From those literature review this journal is showing us that there is so many definition of the customer satisfaction
that is applicable for business such as ―Acording to Kotler and Armstrong (1999) stated that customer satisfaction is
a level where the estimation of product / service performance in accordance with buyer expectations. Furthermore,
according to Gerson (2001) states that customer satisfaction is the feelings owned by the customer if the needs are
real or only the assumption is met or exceed expectations. "Customer satisfaction is when a product or service meets
or exceeds consumer expectations, usually customers feel satisfied".
In order to be able to understand more about the customer satisfaction, it is important to know the factor that can
influence this satisfaction so that this journal has shown us those factors such as commitment, service fairness and
conflict handling, price fairness. Those factors are a crucial determinant of customer satisfaction and customer
loyalty in service.
According to Zamazalová (Zamazalová, 2008) also mentions the key factors that affect customer satisfaction and
which can be used to measure customer satisfaction. These factors are product (in terms of its quality, availability
etc.); price (convenient payment conditions and others); services; distribution; and image of a product.
And especially, in order to be able to know if the customer satisfaction is high or low, it is necessary to know how to
measure it. So that in this journal, it is also showed some way to measure the customer satisfaction such as national
Customer Satisfaction Index (NCSI), service quality (SERVQUAL), MUlticriteria Satisfaction Analysis (MUSA),
Ordered Probit and Ordered Logit model, Important-Performance Analysis (IPA), Cluster Analysis, Data
Envelopment Analysis (DEA).
So the main purpose of this journal is to show a deeper understanding of the customer satisfaction including its
definition, factors, and tools for measuring it.
References:-
ISSN: 2320-5407 Int. J. Adv. Res. 7(9), 828-843
840
1. Aina Nindiani1; Mohammad Hamsal2; Humiras Hardi Purba3, Product and Service Quality Analysis: An
Empirical Study of Customer Satisfaction in a Bakery, Binus Business Review, 9(2), July 2018, 95-103 DOI:
10.21512/bbr.v9i2.4257, P-ISSN: 2087-1228 E-ISSN: 2476-9053
2. Andaleeb, S., & Conway, C. (2006). Customer Satisfaction In The Restaurant Industry: An Examination of the
Transaction-specific Model. Journal of Services Marketing, 20(1), 3-11.
3. Anderson, E., & Fornell, C. (2000). Foundations of The American Customer Satisfaction Index. Total Quality
Management, 11(7), 869-882. http://dx.doi.org/10.1080/09544120050135425
4. Andriotis, K., Agiomirgianakis, G., & Mihiotis, A. (2008). Measuring tourist satisfaction: A factor-cluster
segmentation approach. Journal of Vacation Marketing, 14(3), 221-235.
http://dx.doi.org/10.1177/1356766708090584
5. Arbore, A. and Busacca, B. (2009), ―Customer satisfaction and dissatisfaction in retail banking: exploring the
asymmetric impact of attribute performances‖, Journal of Retailing and Consumer Services, Vol. 16
6. Azizi, M., Dehghan, S., Ziaie, M., & Mohebi, N. (2017). Identifying the customer satisfaction factors in
furniture market. Economics, Management and Sustainability, 2(1), 6-18. https://doi.org/10.14254/jems.2017.2-
1.1
7. Barboza, G., & Roth, K. (2009). Understanding customers' revealed satisfaction preferences: An order probit
model for credit unions. Journal of Financial Services Marketing, 13(4), 330-344.
http://dx.doi.org/10.1057/fsm.2008.27
8. Bayraktar, E., Tatoglu, E., Turkyilmaz, A., Delen, D., & Zaim, S. (2012). Measuring the efficiency of customer
satisfaction and loyalty for mobile phone brands with DEA. Expert Systems with Applications, 39(1), 99-106.
http://dx.doi.org/10.1016/j.eswa.2011.06.041
9. Carrillat, F., Jaramillo, F., & Mulki, J. (2007). The validity of the SERVQUAL and SERVPERF scales: A meta-
analytic view of 17 years of research across five continents. International Journal of Service Industry
Management, 18(5), 472-490
10. Chen, N., Huang, S., Shu, S., & Wang, T. (2013).Market segmentation, service quality, and overall satisfaction:
self-organizing map and structural equation modeling methods. Quality & Quantity, 47 (2), 969–987.
11. Chuah, S., & Chuah, S. (2017).Why do satisfied customers defect? A closer look at the simultaneous effects of
switching barriers and inducements on customer loyalty. Journal of Service, 27 (3), 1–49.
12. Chen, R., Hsiao, J., & Hwang, H. (2012). Measuring customer satisfaction of Internet banking in Taiwan: Scale
development and validation. Total Quality Management & Business Excellence, 23(8), 749-767.
http://dx.doi.org/10.1080/14783363.2012.704284
13. Chen, Z., Ling, K.C., Ying, G.X. and Meng, T.C. (2012), ―Antecedents of online customer satisfaction in
China‖, International Business Management, Vol. 6 No. 2, pp. 168-175
14. COOIL ET AL. (2007) A Longitudinal Analysis of Customer Satisfaction and Share of Wallet: Investigating
the Moderating Effect of Customer Characteristics. Journal of Marketing 71, (1): 67-83.
15. David J. Burns, Lewis Neisner, (2006) "Customer satisfaction in a retail setting: The contribution of emotion",
International Journal of Retail & Distribution Management, Vol. 34 Issue: 1, pp.49-66, https://
doi.org/10.1108/09590550610642819 Permanent link to this document:
https://doi.org/10.1108/09590550610642819
16. Dawi, N. M., Jusoh, A., Streimikis, J., & Mardani, A. (2018). The influence of service quality on customer
satisfaction and customer behavioral intentions by moderating role of switching barriers in satellite pay TV
market. Economics and Sociology, 11(4), 198-218. doi:10.14254/2071-789X.2018/11-4/13. THE influence of
service quality on customer satisfaction and customer behavioral intentions by moderating role of switching
barriers in satellite pay TV market.
17. Dholakia, R.R. and Zhao, M. (2010), ―Effects of online store attributes on customer satisfaction and repurchase
intentions‖, International Journal of Retail and Distribution Management, Vol. 38 No. 7, pp. 482-496.
18. Dimitriades, S.Z. (2006). ‗Customer satisfaction, loyalty and commitment in service organizations: Some
evidence from Greece‘. Management Research News, vol. 29, no. 12, pp. 782-800.
19. Djumarno,,Santrianimatina Anjani, , Said Djamaluddin, Lecturer, MercuBuana University, Jakarta, Indonesia,
Alumni, MercuBuana University, Jakarta, Indonesia, Lecturer, MercuBuana University, Jakarta, Indonesia,
Corresponding Author: Said Djamaluddin. Effect of Product Quality and Price on Customer Loyalty through
Customer Satisfaction, International Journal of Business and Management Invention (IJBMI) ISSN (Online):
2319 – 8028, ISSN (Print): 2319 – 801X www.ijbmi.org || Volume 7 Issue 8 Ver. I || August. 2018 || PP—13-
20.
20. Dr. Niken Sulistyowati, SE, Ak, MM, Senior Lecturer in Magister Management Program, Mercubuana
University, Jakarta, Indonesia, ANALYSIS OF THE INFLUENCE OF BRAND IMAGE AND CUSTOMER
ISSN: 2320-5407 Int. J. Adv. Res. 7(9), 828-843
841
VALUE ON CUSTOMER SATISFACTION AND Its impact on customer loyalty. International Journal of
Economics, Business and Management Research Vol. 2, No. 04; 2018 ISSN: 2456-7760
21. Dutka, A. (1994), AMA Handbook of Customer Satisfaction: A Complete Guide to Research Planning and
Implementation, NTC Business Books, Lincolnwood, IL
22. Fornell, C., Mithas, S., Morgeson, F., & Krishnan, M. (2006). Customer Satisfaction And Stock Prices: High
Returns, Low Risk. Journal of Marketing, 70(1), 3-14. http://dx.doi.org/10.1509/jmkg.2006.70.1.3
23. Hélia Gonçalves Pereira, Maria de Fátima Salgueiro, Paulo Rita. 2017. Online determinants of e-customer
satisfaction: application to website purchases in tourism. Service Business 11:2, 375-403. [Crossref]
24. Hermawan Francisca*, Wijayanti Sri Hapsari, Indonesian customer satisfaction in online shopping trading,
Faculty of Economy and Business, Atma Jaya Catholic University, Indonesia, *E-mail:
[email protected], 3(75), March 2018 73DOI https://doi.org/10.18551/rjoas.2018-03.08
Hussain, R., Al Nasser, A., & Hussain, Y.K. (2015).Service quality and customer satisfaction of a UAE-based
airline: An empirical investigation. Journal of Air Transport Management, 42, 167–175
25. Ismail, I., Haron, H., Ibrahim, D. N., & Isa, S. M. (2006). Service quality, client satisfaction and loyalty towards
audit firms: Perceptions of Malaysian public listed companies. Managerial Auditing Journal, 21(7), 738-756.
http://dx.doi.org/10.1108/02686900610680521
26. Ismail Razak1 1 Student of Doctoral Program in Economics, University of Merdeka, Malang, Indonesia, The
Impact of Product Quality and Price on Customer Satisfaction with the Mediator of Customer Value, journal of
marketing and consumer research, ISSN 2422-8451, Email: [email protected]
27. Jamal, A. and Naser, K. (2003), ―Factors influencing customer satisfaction in the retail banking sector in
Pakistan‖, International Journal of Commerce and Management, Vol. 13 No. 2
28. Jamali, D. (2007). A study of customer satisfaction in the context of a public private partnership. International
Journal of Quality & Reliability Management, 24(4), 370- 385. http://dx.doi.org/10.1108/02656710710740545
29. Jones, M. A., Mothersbaugh, D. L., & Beatty, S. E. (2002). Why customers stay: Measuring the underlying
dimensions of services switching costs and managing their differential strategic outcomes. Journal of Business
Research, 55(6), 441-450. http://dx.doi.org/10.1016/S0148-2963(00)00168-5
30. G. Ronald Gilbert, Cleopatra Veloutsou, (2006) "A cross‐industry comparison of customer satisfaction", Journal
of Services Marketing, Vol. 20 Issue: 5, pp.298-308, https://doi.org/10.1108/08876040610679918 Permanent
link to this document: https://doi.org/10.1108/08876040610679918
31. Grigoroudis, E., & Siskos, Y. (2010). Customer satisfaction evaluation methods for measuring and
implementing service quality. New York: Springer.
32. Gómez, M., Mclaughlin, E., & Wittink, D. (2004). Customer satisfaction and retail sales performance: An
empirical investigation. Journal of Retailing, 80(4), 265-278. http://dx.doi.org/10.1016/j.jretai.2004.10.003
33. Guo, X., Ling, K.C. and Liu, M. (2012), ―Evaluating factors influencing customer satisfaction towards online
shopping in China‖, Asian Social Science, Vol. 8 No. 13, pp. 40-50.
34. Kim, M. K., Park, M. C., & Jeong, D. H. (2004). The effects of customer satisfaction and switching barrier on
customer loyalty in Korean mobile telecommunication services. Telecommunication Policy, 28(1/2), 145-159.
http://dx.doi.org/10.1016/j.telpol.2003.12.003
35. Kim, M., Chang, Y., Park, M. C., & Lee, J. (2015). The effect of quality on the satisfaction and the loyalty of
Smartphone users. Telematics and Informatics, 32(4), 949-960. http://dx.doi.org/10.1016/j.tele.2015.05.003.
36. Kum Fai Yuen, Vinh Van Thai, (2015) "Service quality and customer satisfaction in liner shipping",
International Journal of Quality and Service Sciences, Vol. 7 Issue: 2/3, pp.170-183,
https://doi.org/10.1108/IJQSS-02-2015-0024 Permanent link to this document: https://doi.org/10.1108/IJQSS-
02-2015-0024
37. Kuo, Y., Wu, C., & Deng, W. (2009). The relationships among service quality, perceived value, customer
satisfaction and post-purchase intention in mobile value-added services. Computers in Human Behaviour, 25,
887-896. http://dx.doi.org/10.1016/j.chb.2009.03.003
38. Lam SY, SHANKAR V, Erramilli MK, Murthy B (2004), customer value satisfaction, loyalty, and switching
costs: an illusion form business-to business service context. Journal of the academy of marketing science
32:293-311.
39. Li, B., Riley, M., Lin, B., & Qi, E. (2006). A comparison study of customer satisfaction between the UPS and
FedEx. Industrial Management & Data Systems, 106(2), 182-199.
http://dx.doi.org/10.1108/02635570610649844
40. Liu, X., He, M., Gao, F. and Xie, P. (2008), ―An empirical study of online shopping customer satisfaction in
China: a holistic perspective‖, International Journal of Retail and Distribution Management, Vol. 36 No. 11, pp.
919-940
ISSN: 2320-5407 Int. J. Adv. Res. 7(9), 828-843
842
41. Ling Chen Hoe, DBA Senior GM (Meiden Malaysia Sdn Bhd) Senior Lecturer, Sunway College, KL, Malaysia,
The Effects of Product Quality on Customer Satisfaction and Loyalty: Evidence from Malaysian Engineering
Industry. International Journal of Industrial Marketing ISSN 2162-3066 2018, Vol. 3, No. 1
42. Luciano Munari, Federica Ielasi, Luisa Bajetta, (2013) "Customer satisfaction management in Italian banks",
Qualitative Research in Financial Markets, Vol. 5 Issue: 2, pp.139-160, https://doi.org/10.1108/ QRFM-11-
2011-0028 Permanent link to this document: https://doi.org/10.1108/QRFM-11-2011-0028
43. Mathetha Mokonyama, Christoffel Venter. 2013. Incorporation of customer satisfaction in public transport
contracts – A preliminary analysis. Research in Transportation Economics 39:1, 58-66. [Crossref]
44. MoehammadUnggul Januarko1, BugiSatrio Adiwibowo2, Medina Diyah Kusumawati3 Corresponding
Author:MoehammadUnggul Januarko.Effect Product Quality, Price Perception, Customer Satisfaction Batik
Betawi Loyalty in Jakarta, IOSR Journal of Business and Management (IOSR-JBM) e-ISSN: 2278-487X, p-
ISSN: 2319-7668. Volume 20, Issue 8. Ver. II (August. 2018), PP 01-07 www.iosrjournals.org
45. Muhamad Saufiyudin Omar, Hashim Fadzil Ariffin, Rozila Ahmad. 2016. Service Quality, Customers‘
Satisfaction and the Moderating Effects of Gender: A Study of Arabic Restaurants. Procedia - Social and
Behavioral Sciences 224, 384-392. [Crossref]
46. Muhammad Irfan1, Mohammad Farid Shamsudin1 & Noor Ul Hadi1 1 Universiti Kuala Lumpur Business
School (UNIKL BIS), Bangunan Yayasan Selangor, Malaysia, How Important Is Customer Satisfaction?
Quantitative Evidence from Mobile Telecommunication Market, International Journal of Business and
Management; Vol. 11, No. 6; 2016 ISSN 1833-3850 E-ISSN 1833-8119 Published by Canadian Center of
Science and Education
47. Ni Putu Wiwik Juliantari1*, I Nengah Suardhika2, IGN Eka Teja Kusuma2 The Determinant of Customer
Satisfaction that Gives the Effect of Word of Mouth in PT. BPR Krisna Yuna Dana,Gianyar Bali International
Journal of Contemporary Research and Review, ISSN 0976 – 4852, February, 2018|Volume 09|Issue Vol. 9,
Issue. 02, Page no: ME 20519-20532, https://doi.org/10.15520/ijcrr/2018/9/02/437
48. Peter Palm. 2016. Measuring customer satisfaction: a study of the Swedish real estate industry. Property
Management 34:4, 316-331. [Abstract] [Full Text] [PDF]
49. Petr Suchánek, Jiří Richter, Maria Králová2, Customer Satisfaction, Product Quality and Performance of
Companies1, REVIEW OF ECONOMIC PERSPECTIVES – NÁRODOHOSPODÁŘSKÝ OBZOR, VOL. 14,
ISSUE 4, 2014, pp. 329–344, DOI: 10.1515/revecp-2015-0003
50. Picon, A., Castro, I., & Roldan, J. L. (2014). The Relationship between satisfaction and Loyalty: A mediator
analysis. Journal of Business Research, 67(5), 746-751. http://dx.doi.org/10.1016/j.jbusres.2013.11.038
51. Rahim A. Ganiyu, Customer satisfaction and loyalty: a study of interrelationships and effects in nigerian
domestic airline industry Department of Business Administration, University of Lagos, Lagos, Nigeria
[email protected], Oradea Journal of Business and Economics, Volume II Issue 1 Published on
March 2017
52. Rahim A. Ganiyu. 2016a. Perceptions of Service Quality: An Empirical Assessment of Modified SERVQUAL
Model among Domestic Airline Carriers in Nigeria. Acta Universitatis Sapientiae, Economics and Business 4:1.
. [Crossref]
53. Rahim Hussain, (2016) "The mediating role of customer satisfaction: evidence from the airline industry", Asia
Pacific Journal of Marketing and Logistics, Vol. 28 Issue: 2, pp.234-255, https://doi.org/10.1108/APJML-01-
2015-0001 Permanent link to this document: https://doi.org/10.1108/APJML-01-2015-0001
54. Sayani H (2015) Customer satisfaction and loyalty in the United Arab Emirates banking industry. International
Journal of Bank Marketing 33: 351-375.
55. Seiders K, Voss GB, Grewal D, Godfrey AL (2005) Do satisfied customers buy more? Examining moderating
influences in a retailing context. Journal of marketing 69: 26-43
56. Shamsundin, M. F. (2010). Determinants of Customer Loyalty. PhD. thesis, submitted to Othman Yeop
Abdullah Graduate School of Business, Utara Malaysia.
57. Somjit Barat, John E. Spillan. 2012. An Exploratory Study of Customer Satisfaction in a Community Bank.
International Journal of Customer Relationship Marketing and Management 3:3, 15-32. [Crossref]
58. Türkyilmaz, A., & Özkan, C. (2007). Development of A Customer Satisfaction Index Model: An Application
To The Turkish Mobile Phone Sector. Industrial Management & Data Systems, 107(5), 672-687.
http://dx.doi.org/10.1108/02635570710750426
59. Petr Suchánek & Maria Králová, Customer satisfaction and different evaluation of it by companies, ISSN:
1331-677X (Print) 1848-9664 (Online) Journal homepage: http://www.tandfonline.com/loi/rero20
ISSN: 2320-5407 Int. J. Adv. Res. 7(9), 828-843
843
60. Urvashi Tandon, Ravi Kiran, Ash Sah, (2017) "Analyzing customer satisfaction: users perspective towards
online shopping", Nankai Business Review International, Vol. 8 Issue: 3, pp.266-288, https://
doi.org/10.1108/NBRI-04-2016-0012 Permanent link to this document: https://doi.org/10.1108/NBRI-04-2016-
0012
61. Quang Nguyen, Tahir M. Nisar, Dan Knox, Guru Prakash Prabhakar, (2018) "Understanding customer
satisfaction in the UK quick service restaurant industry: The influence of the tangible attributes of perceived
service quality", British Food Journal, Vol. 120 Issue: 6, pp.1207-1222, https://doi.org/10.1108/BFJ-08-2017-
0449 Permanent link to this document:https://doi.org/10.1108/BFJ-08-2017-0449
62. Wisniewski, M. (2001). Using SERVQUAL to assess customer satisfaction with public sector services.
Managing Service Quality, 11(6), 380-388. http://dx.doi.org/10.1108/EUM0000000006279
63. Yi, Y. (1990). A Critical Review of Consumer Satisfaction. Review of Marketing, 4, 68-123.

![Lippman, Scahill, and Schultz ("Knights 843-59, the Nike Temple Bastion, and Cleon's Shields from Pylos." AJA 110.4 [2006] 551-563)](https://img.pdfslide.net/doc/110x75/631755562b00f6ff4406855a/lippman-scahill-and-schultz-knights-843-59-the-nike-temple-bastion-and-cleons.jpg)


