Embed Size (px)
Citation preview

Japan’s Retail Revolution Michael Smitka
Washington & Lee University October 2012

Priors
� What should Japanese retail look like? � 1960: Early postwar � 1985: Buildup to bubble � 2010: Today
� What would affect structure of retail? � Factors � How change over time?

Analytics
� Analytic factors � Three laws of retailing ◦ Location ◦ location and ◦ location
� Mobility � Income � Legal or other institutional constraints � Technology ◦ Organizational forms ◦ Logistics, IT, other enablers
� Other?

And why matter?
� How would it affect U utility of consumers? ◦ Intangible “rhythm of life”?
� How would it affect employment etc? � Other criteria? � My claim: A retail revolution ◦ that reflects / enables a lifestyle revolution

The early 20th century legacy
� A row of old-style stores (selling to tourists outside the Kenroku-en park in Kanazawa) and an open-air farmers market (in Wajima on the Noto penisula).


商店街 Shotengai “shopping street”
Scenes from a shopping street in Sumida-ku in Tokyo.


Mom & Pop Establishments
� Small “izakaya” – restaurants for fish and sake, located around train stations (the bottom two) or markets (the top one, serving breakfast at 7 am following the fish auctions in Numazu)


Small wholesale markets
� The next two photos are the fish market in Numazu in Shizuoka Pref. In 2005 it was an open-air market from which you could see Mt. Fuji


Japan’s retail looks familiar
� Ex ante structure of: ◦ Large center city departments stores � And specialized retailers ◦ Neighborhood mom & pop shopping areas
� In context of ◦ Dense residential areas ◦ Small house sizes, initially no refrigerators ◦ Housewives do shopping: low female LFLow incomes & mobility ◦ “Blue law” regulations and entry barriers to support the status quo

Sources of change: Demand Side
� Suburbanization � Higher incomes ◦ Larger houses, refrigerators ◦ Higher opportunity cost of shoppers time ◦ Especially as more women entered the LF
� Changing mobility � Higher incomes ◦ Changing tastes � More variety, different goods � More ability to shop for prices

Sources of change: Supply Side
� New formats ◦ Discount “supermarkets” (cf. K-Mart) ◦ Large floorspace ◦ At-risk inventory
◦ Convenience stores ◦ Longer hours ◦ Take over liquor licenses ◦ Innovations in IT
� Inventory control � Management assistance � Supply chain management
◦ Franchising ◦ McDonald’s, KFC
◦ Roadside stores ◦ Denny’s

Limits to change: Regulatory Restrictions
� Department Store Law 1926 ◦ Large store law, revised multiple times (esp 1973) ◦ Prevented entry above a certain floor size
◦ Except as approved by local government � Operating hours ◦ De facto local cartels
◦ Set common day off for shopping streets ◦ Informal closing hours for same ◦ Formal restrictions on large stores
� But much milder than in Germany! � Miscellaneous
� Liquor sales needed a license � Rice had to be through official store � Pharmacies restricted in what they could sell ◦ Cosmetics initially restricted, too

Limits to change: Economic Considerations
� Real estate prices � Hard to afford good sites � Tenancy and other laws made combining land hard
� Urban structure � Roads not designed for cars as transportation ◦ No parking ◦ Narrow roads / congestion
� Limited mobility ◦ Local shotengai 商店街 or take train to department store

Regulatory change
� Despite limitations ◦ Gradual new entry ◦ Suburbs with no stores and rural areas could approve
new entrants ◦ But large firms that already had stores loved the
restrictions!! ◦ Over time large chains gained lobbying clout ◦ New parties in urban areas? è less clout for small
stores? ◦ Also US lobbying for change: trade disputes
� Partial liberalization in 1991 ◦ Abolished 1998 � And now strengthened a bit in 2007

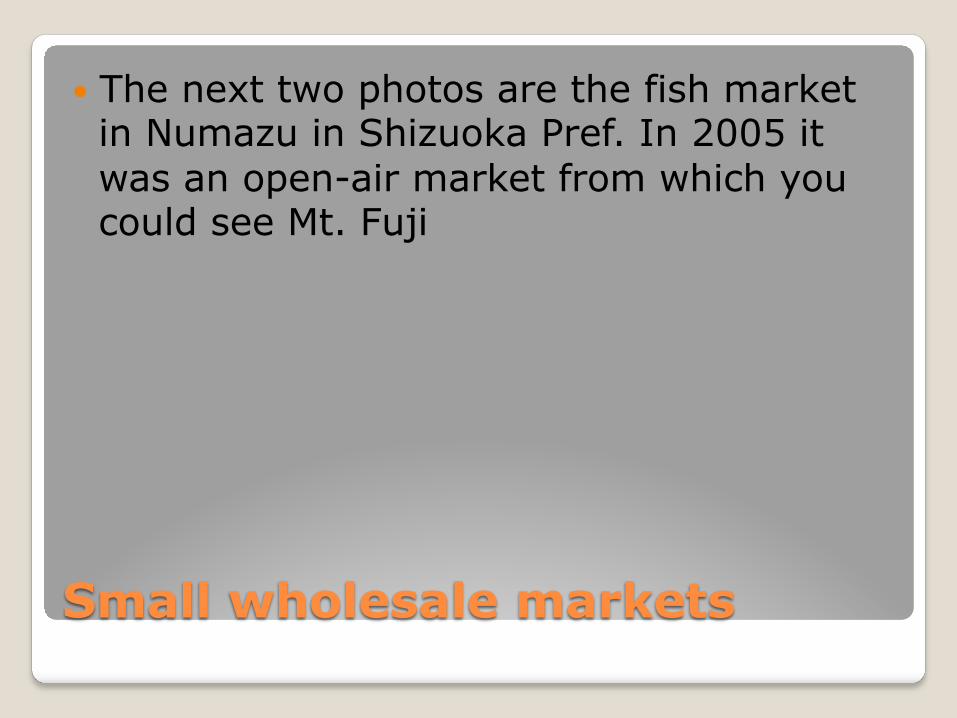
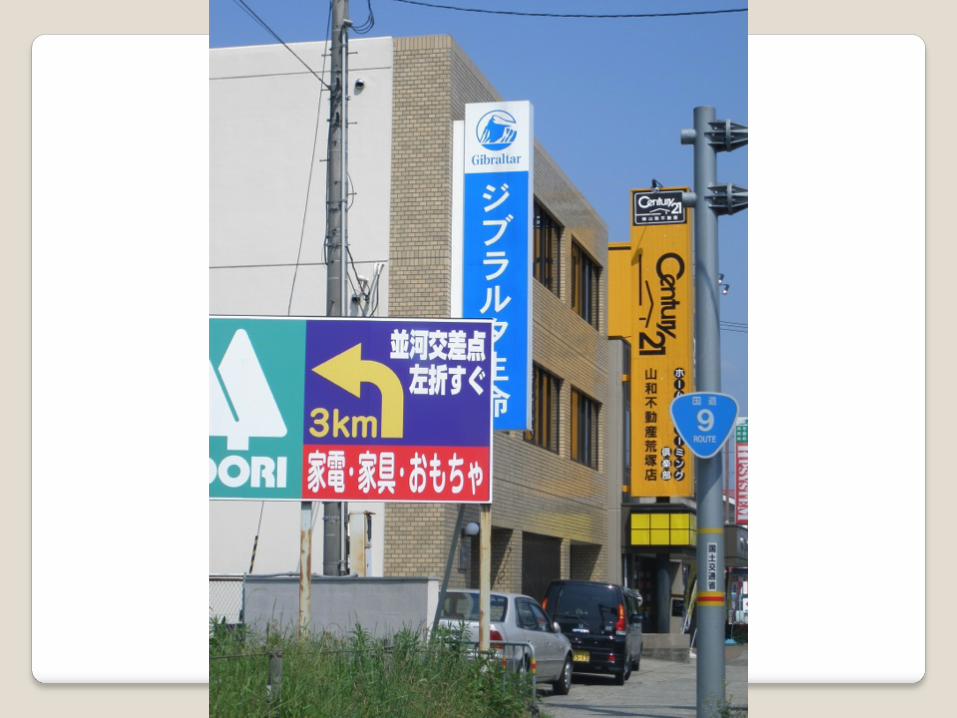
� New types of stores ◦ most of the photos are self-explanatory
◦ the aerial photos are of a portion of a former JFE steel mill being turned into a mall, the first shows the construction phase (ca. 2004), the second the mall itself replete with parking for 5,800 cars


Changes also familiar
� Rises in income, mobility � Suburbanization ◦ Larger houses, refrigeration, etc
� Regulatory change ◦ Entry regulation process liberalized � Floor space restrictions removed � Hours restrictions removed
� And post-bubble real estate cheap

Other points
� Innovators in “everyday low price” format ◦ But first mover (Daiei) bankrupt � cf. Sears and K-Mart in the US
� Hypermarkets ◦ Jusco, Yokado
� Growing number of big-box and deep discounters
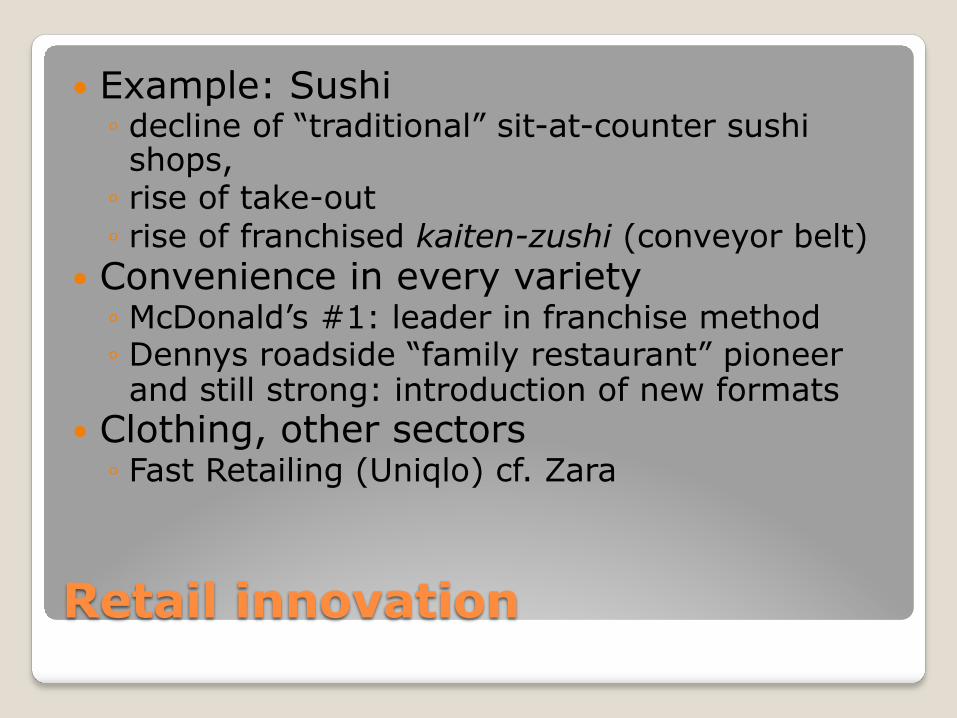
Retail innovation
� Example: Sushi ◦ decline of “traditional” sit-at-counter sushi shops, ◦ rise of take-out ◦ rise of franchised kaiten-zushi (conveyor belt)
� Convenience in every variety ◦ McDonald’s #1: leader in franchise method ◦ Dennys roadside “family restaurant” pioneer and still strong: introduction of new formats
� Clothing, other sectors ◦ Fast Retailing (Uniqlo) cf. Zara

Additional examples
� Convenience stores ◦ 7-11 stores are a Japanese company � But due to a failed leveraged buyout
� ¥100 stores: Daiso � ¥99 stores (now Lawson) 24-hour small-
portion small-format food stores � Many others

Sum
� Similar macro patterns � Examples of conscious borrowing � Examples of de novo innovation � And now internationalization � And exit by Carrefour, Tesco, Metro ◦ And to date $6 bil losses by Walmart’s Seiyu

0.0
20.0
40.0
60.0
80.0
100.0
120.0
140.0
160.0
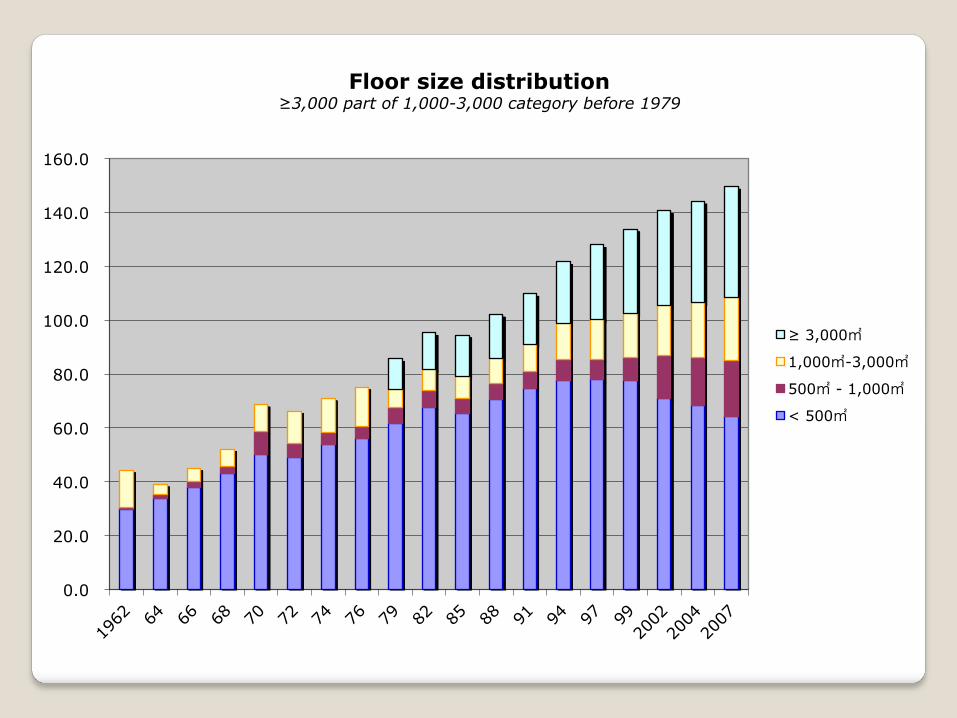
Floor size distribution ≥3,000 part of 1,000-3,000 category before 1979
≥ 3,000㎡
1,000㎡-3,000㎡
500㎡ - 1,000㎡
< 500㎡


Department Stores and Supermarkets Continue to Lose Share
Note a “supermarket” is comparable to a Walmart (US) or Carrefour or Metro (EU). Originally chains such as Daiei, Jusco and Ito Yokado did not carry food items (as was true of Walmart) but now most provide one-stop shopping.
0
1,000,000
2,000,000
3,000,000
4,000,000
5,000,000
6,000,000
7,000,000
8,000,000
9,000,000
0
200,000
400,000
600,000
800,000
1,000,000
1,200,000
1,400,000
1,600,000
1,800,000 19
56
1958
1960
1962
1964
1966
1968
1970
1972
1974
1976
1979
1982
1985
1988
1991
1994
1997
1999
2002
2004
2007
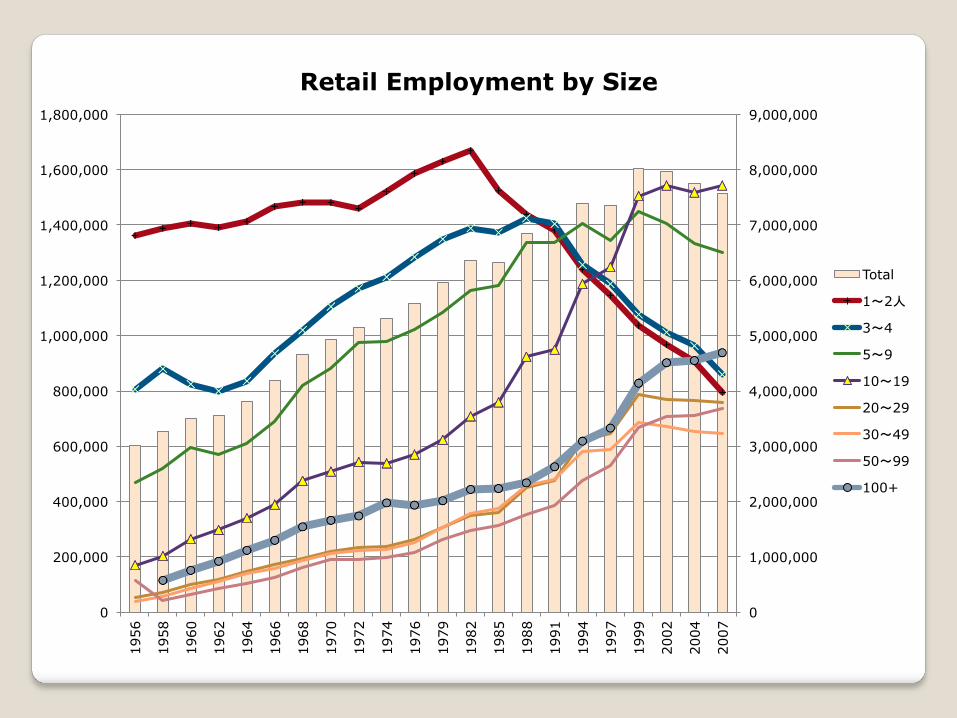
Retail Employment by Size
Total
1~2人
3~4
5~9
10~19
20~29
30~49
50~99
100+

0
500,000
1,000,000
1,500,000
2,000,000
2,500,000
3,000,000
3,500,000
4,000,000
4,500,000
5,000,000
5,500,000
6,000,000
6,500,000
7,000,000
7,500,000
8,000,000 19
56
1958
1960
1962
1964
1966
1968
1970
1972
1974
1976
1979
1982
1985
1988
1991
1994
1997
1999
2002
2004
2007
Retail Employment by Size
100+
50~99
30~49
20~29
10~19
5~9
3~4
1~2人

0.0
20.0
40.0
60.0
80.0
100.0
120.0
140.0
160.0
Floor size distribution ≥3,000 part of 1,000-3,000 category before 1979
≥ 3,000㎡
1,000㎡-3,000㎡
500㎡ - 1,000㎡
< 500㎡

34.0%
35.0%
36.0%
37.0%
38.0%
39.0%
40.0%
41.0%
42.0%
43.0%
44.0%
0.0%
5.0%
10.0%
15.0%
20.0%
25.0%
Market Shares of Food Service Industry (left scale except for restaurants)
Institutional
Beverages & Snacks
Entertainment & drink
Take out
Hotels
Restaurants

1921 1925 1929 1933 1937 1941 1945 1949 1953 1957 1961 1965 1969 1973 1977 1981 1985 1989 1993 1997 2001 2005 0%
1%
2%
3%
4%
5%
6%
7%
8%
9%
10%
11%
12%
Chiba City Population Growth Five-Year Moving Average

“Shata-gai”
� Rows of shuttered stores ◦ Chiba City (top) ◦ Narita City, Chiba Pref (bottom two)

Shuttered storefronts


商店街なのに誰もいなくて婆ちゃんに寂しい将来...