Embed Size (px)
Citation preview
Production and marketing of Bajra in Jaipur District of Rajasthan
jktLFkku ds t;iqj ftys esas cktjs dk mRiknu vkSj foi.ku
Thesis
Submitted to the
Sri Karan Narendra Agriculture
University, Jobner
in partial fulfillment of the requirements
for the degree of
Master of Science
in the
Faculty of Agriculture
(Agricultural Economics)
By
Sumita Jakhar
2015
Sri Karan Narendra Agriculture University, Jobner
S.K.N. College of Agriculture, Jobner
CERTIFICATE- I
Dated :------
.2015
This is to certify that Miss. Sumitra Jakhar has
successfully completed the comprehensive examination held on
………………. as required under the regulation for Master’s
degree.
(R.C. SHARMA)
HEAD
Department of Agricultural Economics
S.K.N. College of Agriculture,
Sri Karan Narendra Agriculture University, Jobner S.K.N. College of Agriculture, Jobner
CERTIFICATE- II
Dated :------------2015
This is to certify that the thesis entitled “Production and
Marketing of Bajra in Jaipur District of Rajasthan” submitted
for the degree of Master of Science in the subject of
Agricultural Economics embodies bonafide research work
carried out by Miss. Sumitra Jakhar under my guidance and
supervision and that no part of this thesis has been submitted for
any other degree. The assistance and help received during the
course of investigation have been fully acknowledged. The draft
of the thesis was also approved by the advisory committee on
...........2014.
(R.C. SHARMA)
HEAD (Pradeep
Kumar)
Department of Agricultural Economics Major
Advisor
S.K.N. College of Agriculture,
Jobner
(G.L. KESHWA)
Dean
S.K.N. College of Agriculture,
Jobner
Sri Karan Narendra Agriculture University, Jobner S.K.N. College of Agriculture, Jobner
CERTIFICATE- III
Dated :-----------
2015
This is to certify that the thesis entitled “Production and
Marketing of Bajra in Jaipur District of Rajasthan” submitted
by Miss. Sumitra Jakhar to the Sri Karan Narendra Agriculture
University, Jobner in partial fulfillment of the requirements for the
degree of Master of Science in the subject of Agricultural
Economics after recommendation by the external examiner, was
defended by the candidate before the following members of the
advisory committee. The performance of the candidate in the oral
examination on his thesis has been found satisfactory; we
therefore, recommend that the thesis be approved.
(Pradeep Kumar) (R.C.KUMAWAT)
Major Advisor Advisor
(K.N. GUPTA)
(K.Ramkrishna)
Advisor Dean, PGS,
Nominee
(R.C. SHARMA)
HEAD (G.L.
KESHWA)
Department of Agricultural Economics Dean
S.K.N. College of Agriculture, S.K.N. College of Agriculture,
Jobner Jobner
Approved
DIRECTOR EDUCATION
Sri Karan Narendra Agriculture University, Jobner
Sri Karan Narendra Agriculture University, Jobner S.K.N. College of Agriculture, Jobner
CERTIFICATE- IV
Dated :-----------
2014
This is to certify that Miss. Sumitra Jakhar of the
Department of Agricultural Economics, S.K.N. College of
Agriculture, Jobner has made all corrections/modifications in the
thesis entitled “Production and Marketing of Bajra in Jaipur
District of Rajasthan” which were suggested by the external
examiner and the advisory committee in the oral examination held
on --------------2014. The final copies of the thesis duly bound and
corrected were submitted on --------------2014 and forwarded
herewith for approval.
(Pradeep Kumar)
Major Advisor
(R.C. SHARMA)
HEAD
Department of Agricultural
Economics
S.K.N. College of Agriculture,
Jobner
(G.L. KESHWA)
DEAN
S.K.N. College of Agriculture, Jobner
Approved
DIRECTOR EDUCATION
Sri Karan Narendra Agriculture University, Jobner
List of contents
Chapter
No.
Title Page
No.
CERTIFICATE-I …….
CERTIFICATE-II …….
CERTIFICATE-III …….
CERTIFICATE-IV …….
ACKNOWLEDGEMENTS …….
LIST OF CONTENTS …….
LIST OF TABLES …….
LIST OF FIGURES …….
LIST OF APPENICES …….
Chapters-1 Introduction
1.1 Objectives …….
1.2 Plan of thesis …….
Chapter-2 Review of Literature .........
2.1 Cost of cultivation and returns …….
2.2 Marketing margins, costs and price spread
2.3 Relationship between arrivals and prices …….
2.4 Constraints …….
Chapter-3 Research Methodology
3.1 Sampling framework …….
3.1.1 Selection of Crop …….
3.1.2 Selection of the study area: …….
3.1.3 Selection of Tehsils: …….
3.1.4 Selection of Villages: …….
3.1.5 Selection of the farmers …….
3.1.6 Selection of market …….
3.2 Collection of data …….
3.3 Analysis of data: …….
3.3.1. To study the cost of cultivation of bajra …….
3.3.2 Interest on Working Capital …….
3.3.3 Rental Value of Owned Land …….
3.3.4 Depreciation - …….
3.3.5 Interest on Fixed Capital- …….
3.3.6 Operational Cost (O.C.)- …….
3.3.7 Cost of Production (per quintal)- …….
3.3.8 Farm Business Measures- …….
3.3.9 Studying of Marketing costs, Margins and Price
Spread
…….
3.3.10 Relationship between arrivals and prices of
bajra
…….
3.3.11 Problems faced by the bajra farmers …….
3.4 Limitations of the study …….
Section 4 A RESULTS AND DISCUSSION …….
4A Cost structure …….
4A.1 Cost Group …….
4A. 2 Components of Operational Cost …….
4A.2 Component of Overhead Costs …….
4A.3 Returns from cultivation of bajra crop …….
Section-B Marketing of bajra …….
4B.1 Marketing channels …….
4B.1.1 Village sale (Producer-Village trader-Wholesaler-
Retailer-Consumer).
…….
4B.1.2 Mandi sale (Producer-Wholesaler- Retailer-
Consumer)
…….
4B.1.3 Producer- consumer …….
4B.2 Marketing costs …….
(i) Transportation charges …….
(ii) Loading and unloading charges: …….
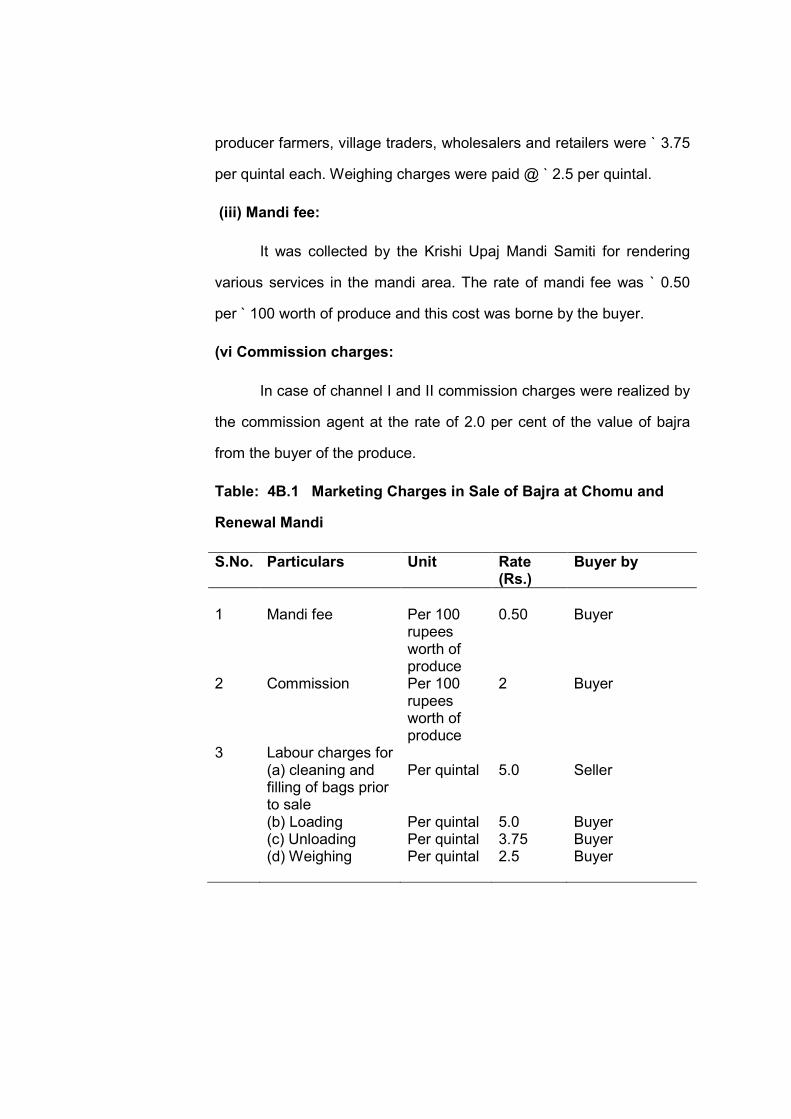
(iii) Mandi fee: …….
(iv) Commission charges: …….
4B.2 Marketing Costs Incurred In Chomu
Market By Different Agencies Are
Discussed As Under:
…….
4B.2.1 Costs of bajra marketing incurred in
channel-I (village sale) (Producer
Village trader Wholesaler Retailer)
…….
4B.2.2 Costs of bajra marketing incurred in
channel-II (Mandi sale) (Producer
Wholesaler- Retailer)
…….
4B.2.3 Costs of bajra marketing incurred in
channel-III (Producer Consumer)
…….
4B.3 Marketing costs, margins and price
spread
…….
4B.3.1 Price spread in marketing of bajra in
channel-I (Producer Village Trader
Wholesaler Retailer)
…….
4B.3.2 Price spread in marketing of bajra in …….
channel-II (Producer Wholesaler
Retailer)
4B.3.3 Price spread in marketing of bajra in
channel-III (Producer Consumer)
…….
4B.4 Marketing Costs Incurred in Renwal
market by different Agencies are
discussed as under:
…….
4B.4.1 Costs of bajra marketing incurred in
channel-I (village sale)(Producer
Village trader Wholesaler Retailer)
…….
4B.4.2 Costs of bajra marketing incurred in
channel-II (Mandi sale) (Producer
Wholesaler- Retailer)
…….
4B.4.3 Costs of bajra marketing incurred in
channel-III (Producer Consumer)
…….
4B.5 Marketing costs, margins and price
spread
…….
4B.5.1 Price spread in marketing of bajra in
channel-I (Producer Village Trader
Wholesaler Retailer)
…….
4B.5.2 Price spread in marketing of bajra in
channel-II (Producer Wholesaler
Retailer)
…….
4B.5.3 Price spread in marketing of bajra in …….
channel-III (Producer Consumer)
Section-C
Relationship between market arrivals and
prices of Bajra in Chomu and Renwal markets
…….
4C.1 Seasonal Pattern of Market Arrivals and Prices
of Bajra Crop in Chomu and Renwal Markets
…….
4C.1.a Seasonal pattern of arrivals in Chomu market …….
4C.1.b Seasonal pattern of arrivals in Renwal market …….
4C.1.c Seasonal pattern in prices of bajra in Chomu
market
…….
4C.1.d Seasonal pattern in prices of bajra in Renwal
market
…….
4C.2 Relationship between Monthly Arrivals and
Wholesale Prices of Bajra
…….
4C.3 Relationship between Yearly Arrivals and
Wholesale Prices of Bajra
…….
Section-D Problems Faced by the Bajra Producers
1 Technical problems …….
2 Infrastructural problems …….
3 Economical problems …….
4 Social problems …….
Chapter-5 Summary, Conclusions and Suggestions
5.1 Introduction …….
5.2 Methodology: …….
5.3 Results …….
5.3.1 Costs of and returns from cultivation of bajra
crop:
…….
5.3.2 Costs and margins in marketing of bajra …….
5.3.3 Market arrivals and prices of bajra …….
5.3.4 Problems faced by the bajra producers …….
5.4 Conclusions …….
5.5 Policy implication …….
BIBLIOGRAPHY …….
ABSTRACT (ENGLISH) …….
ABSTRACT (HINDI) …….
APPENDICES …….
LIST OF TABLES
Table No.
Particulars Page No.
3.1 Details of sample selection ………
4A.1 Cost of cultivation of bajra crop on sample farms
during -2012-13 ………
4A.2 Operational and overhead costs and their
components in cost of cultivation of Bajra crop on
sample farms during 2012-13
………
4A.3 Returns from cultivation of Bajra crop on sample
farms during 2012-13 ………
4B.1 Distribution of producer farmers adopting different
marketing channels ………
4B.2 Marketing charges in sale of bajra at chomu and
renwal Mandi ………
4B.2.1 Marketing cost of bajra incurred in channel-I in
Chomu teshil of Rajasthan: 2012-13 ………
4B.2.2 Marketing cost of bajra incurred in channel-II in
Chomu teshil of Rajasthan 2012-13
………
4B.3.1 Price spread in marketing of bajra in channel-I in
chomu teshil of Rajasthan 2012-13 ………
4B.3.2 Price spread in marketing of bajra in channel-II in
Chomu teshil of Rajasthan: 2012-13 ………
4B.3.3 Price spread in marketing of bajra in channel-III ………
(Producer Consumer)
4B.4.1 Marketing cost of bajra incurred in channel-I in
Renwal teshil of Rajasthan: 2012-13 ………
4B.4.2 Marketing cost of bajra incurred in channel-II in
Renwal teshil of Rajasthan: 2012-13 ………
4B.5.1 Price spread in marketing of bajra in channel-I in
Renwal teshil of Rajasthan 2012-13
………
4B.5.2 Price spread in marketing of bajra in channel-II in
Renwal teshil of Rajasthan: 2012-13 ………
4B.5.3 Price spread in marketing of bajra in channel-III
(Producer Consumer) ………
4C.1.a Pattern of market arrival of bajra in different
quarters of the year during 2005-06 to 2012-13 ………
4C.1.b Pattern of market arrival of bajra in different
quarters of the year during 2005-06 to 2012-13 ………
4C.1.c Price of bajra in different quarter of the year in
Chomu market 2005-06 to 2012-13 ………
4C. 1.d Price of bajra in different quarter of the year in
renwal market during 2005-06 to 2012-13 ………
4C.2.1 Monthly market arrivals and monthly wholesale
prices of bajra in Chomu and Renwal market
during 2005-06 to 2012-13
………
4C.2.2 Correlation Co-efficient Between Monthly Arrivals
and Wholesale Prices of Bajra during the Period
2005-06 to 2012-13
………
4C.3 Correlation co-efficient between yearly wholesale
prices and arrivals of bajra in Chomu and Renwal
market: during 2005-06 to 2009-10
………
4D.1 Technical problems in production and marketing of
bajra faced by the sample farmers
………
4D.2 Infrastructural problems in production and
marketing of Bajra faced by the sample farmers ………
4D.3 Economic problems in production and marketing of
bajra faced by the sample farmers ………
4D.4 Social problems in production and marketing of
bajra faced by the sample farmers ………
LIST OF FIGURES
Figure
No.
Particulars Page
No.
4.1 Correlation coefficient between montly arrivals and
wholesale prices of Bajra during the period 2005-
06 to 2012-13
……
4.2 Correlation coefficient between montly arrivals and
wholesale prices of Bajra during the period 2005-06 to
2012-13
……
LIST OF APPENDICES
Appendix Particulars Page
No.
I Schedule for farmer
……
II Schedule for village trader …….
III Schedule for wholesaler …….
IV Schedule for retailer …….
Chapter-1
INTRODUCTION
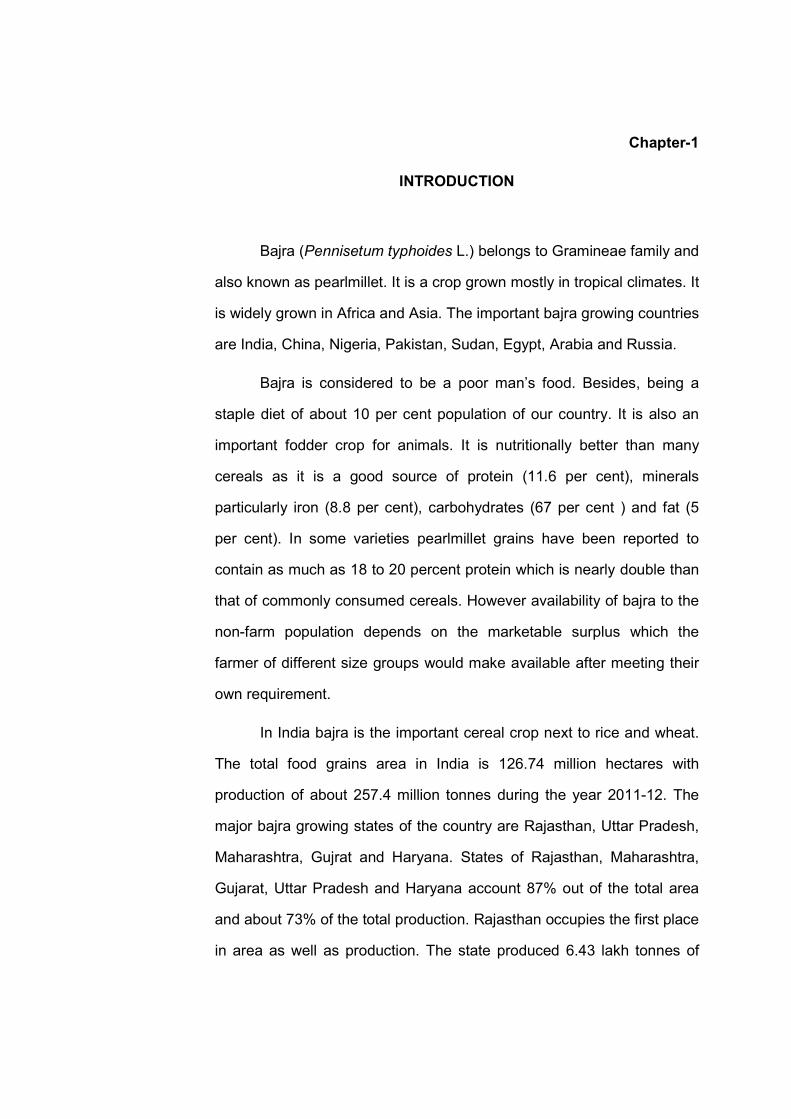
Bajra (Pennisetum typhoides L.) belongs to Gramineae family and
also known as pearlmillet. It is a crop grown mostly in tropical climates. It
is widely grown in Africa and Asia. The important bajra growing countries
are India, China, Nigeria, Pakistan, Sudan, Egypt, Arabia and Russia.
Bajra is considered to be a poor man’s food. Besides, being a
staple diet of about 10 per cent population of our country. It is also an
important fodder crop for animals. It is nutritionally better than many
cereals as it is a good source of protein (11.6 per cent), minerals
particularly iron (8.8 per cent), carbohydrates (67 per cent ) and fat (5
per cent). In some varieties pearlmillet grains have been reported to
contain as much as 18 to 20 percent protein which is nearly double than
that of commonly consumed cereals. However availability of bajra to the
non-farm population depends on the marketable surplus which the
farmer of different size groups would make available after meeting their
own requirement.
In India bajra is the important cereal crop next to rice and wheat.
The total food grains area in India is 126.74 million hectares with
production of about 257.4 million tonnes during the year 2011-12. The
major bajra growing states of the country are Rajasthan, Uttar Pradesh,
Maharashtra, Gujrat and Haryana. States of Rajasthan, Maharashtra,
Gujarat, Uttar Pradesh and Haryana account 87% out of the total area
and about 73% of the total production. Rajasthan occupies the first place
in area as well as production. The state produced 6.43 lakh tonnes of
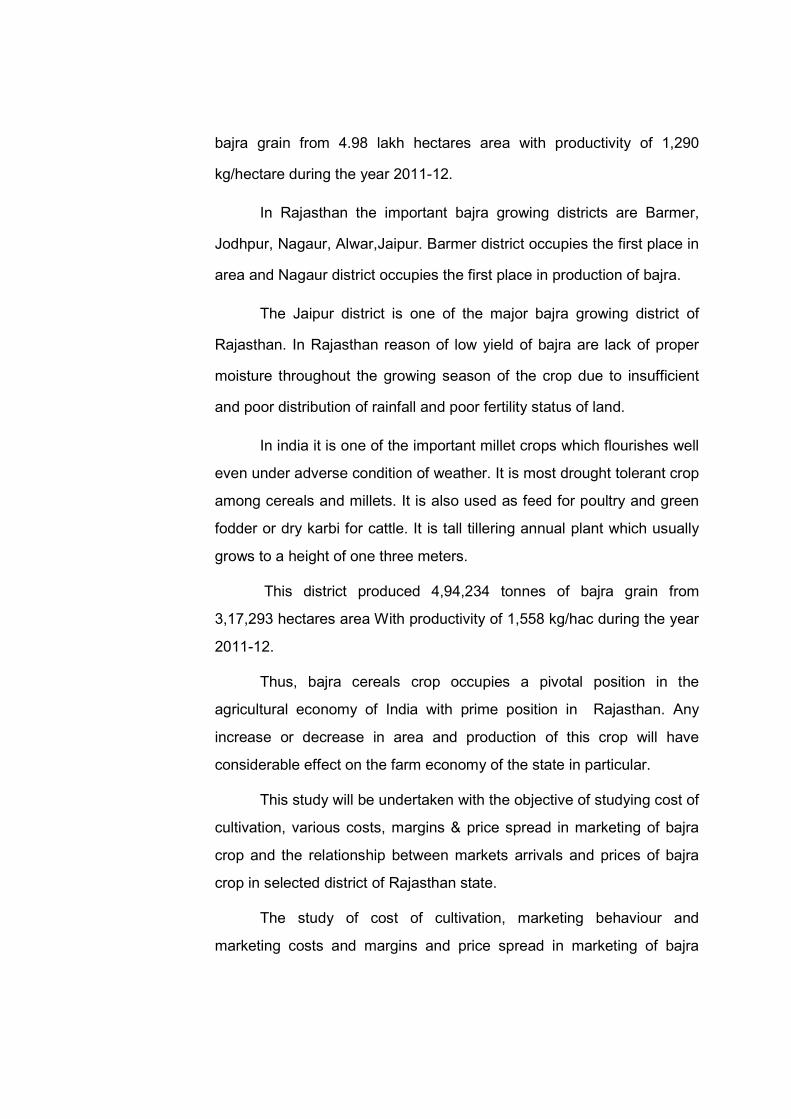
bajra grain from 4.98 lakh hectares area with productivity of 1,290
kg/hectare during the year 2011-12.
In Rajasthan the important bajra growing districts are Barmer,
Jodhpur, Nagaur, Alwar,Jaipur. Barmer district occupies the first place in
area and Nagaur district occupies the first place in production of bajra.
The Jaipur district is one of the major bajra growing district of
Rajasthan. In Rajasthan reason of low yield of bajra are lack of proper
moisture throughout the growing season of the crop due to insufficient
and poor distribution of rainfall and poor fertility status of land.
In india it is one of the important millet crops which flourishes well
even under adverse condition of weather. It is most drought tolerant crop
among cereals and millets. It is also used as feed for poultry and green
fodder or dry karbi for cattle. It is tall tillering annual plant which usually
grows to a height of one three meters.
This district produced 4,94,234 tonnes of bajra grain from
3,17,293 hectares area With productivity of 1,558 kg/hac during the year
2011-12.
Thus, bajra cereals crop occupies a pivotal position in the
agricultural economy of India with prime position in Rajasthan. Any
increase or decrease in area and production of this crop will have
considerable effect on the farm economy of the state in particular.
This study will be undertaken with the objective of studying cost of
cultivation, various costs, margins & price spread in marketing of bajra
crop and the relationship between markets arrivals and prices of bajra
crop in selected district of Rajasthan state.
The study of cost of cultivation, marketing behaviour and
marketing costs and margins and price spread in marketing of bajra
gives an idea of the producer’s-share in the prices paid by the
consumers on different sized farms. The relationship between market
arrivals and prices helps to know the effect of increase in prices on their
arrivals trend.
OBJECTIVES
The following are the specific objectives of the study :
(i) To study the cost of cultivation of bajra in Jaipur district of
Rajasthan.
(ii) To study the marketing costs, margins and price spread of
bajra in Jaipur district of Rajasthan.
(iii) To study the relationship between arrivals and prices of bajra
in the selected regulated market.
(iv) To find out the constraints faced by the farmers in the
cultivation and marketing of bajra.
1.2 Plan of thesis
The text of this study runs through five chapters. The present
chapter deals with the introduction and objectives as well as plan of the
thesis. The review of literature is presented in chapter two. The third
chapter deals with the methodology adopted in the selection of area and
crop, collection of data and analysis thereof. Chapter four deals with the
results and discussion and is consisted of four sections namely; section
A, B, C, and D. Summary, conclusions and recommendations of the
study are presented in chapter five followed by bibliography, abstracts
and appendices.
Chapter- 2
REVIEW OF LITERATURE
In this chapter, an attempt has been made to review some of
the important studies related to the present investigation. The chapter
has been divided into four sections for presenting the available studies
in a scientific manner.
2.1 Cost of cultivation and returns
2.2 Marketing margins, costs and price spread
2.3 Relationship between arrivals and prices
2.4 Constraints
2.1 Cost of cultivation and returns
Mishra (1998) conducted research entitled “Economic Analysis of
Production and Marketing of Green pea in Jaipur District (Rajasthan).” It
was observed from the study that the average cost of cultivation of
Green pea was Rs. 40652.28 per hectare. This was higher than the
competing crops, grown by the farmers in the study area. Among the
competing crops, cost of cultivation ranged from Rs. 7189.40 per
hectare in taramira to Rs. 21555.24 per hectare in wheat. The cost of
production per quintal of green pea was Rs. 404.18. It ranged from Rs.
323.52 for barley to Rs. 806.63 for taramira (competing crops). The cost
of production was higher in case of gram, mustard and taramira and
lower in wheat and barley as compared to green pea.
Shah and Zala (2006) studied on “Cost-benefit analysis of Ginger
cultivation in middle Gujarat” concluded that Ginger was a highly capital
intensive crops and the average cost of cultivation estimated Rs
2,02,260 per hectare, The average cost founded as Rs 1,57,368. Seed
cost founded highest (64129 per hectare) the net profit per hectare over
cost C2 for founded as Rs 1, 80,338 and input-output ratio as 1:1.97 on
the basis of cost C2 for all the farms. The overall cost of production has
been founded as Rs 1,566 per quintal which was much lower than the
market price, 2,000-5,000 per quintal, during the study period, which
indicated that the Ginger cultivation was quite remunerative in the area
even at lowest price.
Rajur et al. (2008)” Economics of chilli production in Karnataka”
Chilli was one of the most important commercial crops of India. Studied
on the title the result showed that cost A2 accounted for 30.70 per cent in
Gulbarga, 28.81 percent in Raichur and 32.30percent in Bijapur district.
Cost B2 accounted for 47.09 percent,44.54 and 50.25 in respectived
districts In cost C3 use of family labour was more in case of Bijapur
district than Gulbarga and Raichur districts due to non-availability of
hired labour during peak period cost of cultivation per hectare was
highest in Raichur district (Rs.34955.50) followed by Gulbarga
(Rs.33870.40) and (Rs.28836.26) in Bijapur districts. Which was due to
lower cost of chilli production in Raichur district as compared to Bijapur
and Gulbarga districts?
Kanaujia et al. (2009) analysed the productivity and profitability of
agri-horti system in sub-tropical region at Khadakhar village of district
Hamirpur, Utter Pradesh in four years old aonla (Emblica Officinalis G.)
orchard. The study revealed that under agri-horti system, the highest net
return (Rs. 52,540 per hectare) with high benefit/cost ratio was found in
aonla+chickpea, followed by aonla+wheat (Rs. 43,440 per hectare) and
the lowest under aonla+mustard (Rs. 41,444 per hectare) cropping
system in third fruiting year. During first and second fruiting year, the
profitability from aonla and associated crops was lesser than sole crops
due to poor yield of aonla but during third year, economics of agri- horti
system was rapidly improved due to very high yield of aonla.
Singh and Toppo (2010) in their study “Economics of production
and marketing of tomato in kanke block of Ranchi district” found that the
average cost of cultivation per hectare of Kharif and Rabi tomato was
estimated as Rs. 26011 and Rs. 23523, respectively. The average
productivity per hectare was quintals and 96 quintals in these seasons
the cost return ratio was 1:1.65 and 1:1.86 for tomato in the two
seasons. It was further observed that in the marketing of tomato, there
were three main channels prevailing among selected farmers. The
marginal farmers prefer to sell their produce all through channel l, while
small farmers sold their produce through all of the channels However,
forty percent of them sold their produce through channels lll, thirty five
percent through channel l and twenty percent through channel ll.
Dwivedi et al. (2010) conducted a study entitled “An analytical
economics of saffron cultivation in Jammu and Kashmir”. Indian saffron
is cultivated on a large scale in Jammu and Kashmir Valley where the
cool dry climate and rich soil with excellent drainage and organic content
makes the area ideal for this spice India exported 5.5 mt of saffron, the
worlds costliest spices and the Jammu and Kashmir state enjoys a
virtual monopoly in the cultivation of saffron and contributes almost 99
per cent of the national production of saffron. Keeping this in view, an
attempt was made to analyse the cost and return structure of saffron
crop in Kashmir Valley. The overall cost of cultivation was estimated as
Rs. 263138.32 per hectare and net return was Rs 412709.83 per
hectare. Per hectare overall farm business income was estimated as Rs.
628397.81 from this crop, while family labour income was calculated as
Rs. 423836.47. The overall benefit cost ratio was 1:2.57 on sample
farms under the study.
Gate et al. (2010) in their study “Cost of cultivation of groundnut a
research study” conducted in palampur and Dessa talukas of
Banaskantha district of Gujarat state for estimating the cost of groundnut
production , using 90 farmers obtained through multistage stratified
random sampling technique. The requisite data was collected through
personal interviews with the farmers with the help of pre-tested
comprehensive schedules related to kharif groundnut crop for the year
2005-06. In the study it was found that the average cost of cultivation
and net income per hectare of groundnut crop was Rs. 22526 /- and Rs.
3581/- , respectively for the year 2005-06 . The total and gross return
over cost A, cost B, cost C and cost2 of small farmers was highest and
decreased with increase in the size of holding.
2.2 Marketing margins, costs and price spread
Mishra (1998) from his study entitled “Economics Analysis of
Production and marketing of Green pea in Jaipur District (Rajasthan).”
Concluded that the total marketing cost in sale of green gram at village
was Rs. 142.85 per quintal. The cost of marketing in Mandi sale in
different channels viz.first, second and third was Rs. 80.05, Rs.117.94
and Rs.146.19, respectively. The marketing cost has been higher in
channel-lll because of the involvement of more number of middlemen
and more loss of quantity of pea in the process of sale. Producer’s share
in the consumer’s rupee was 60.83 per cent in village sale and 69.88 to
71.78 percent in mandi sale. In mandi sale, the producer’s share was
higher in channel-l (71.78 percent) as compared to channel-ll (71.08 per
cent) and channel-lll(69.88 per cent). Producer- farmers got higher share
(9-11 per cent) in mandi sale compared to village sale.
Choudhary (2000) conducted a study entitled “Marketing of
Fennel in Tonk district of Rajasthan”. It was observed that total cost in
sale of fennel seed has been Rs 209.60 per quintal at village and Rs
207.55 per quintal at mandi. Marketing costs were higher (Rs. 2.05 per
quintal) in sale of fennel seed at village level compared to sale at mandi.
Transportation cost and cost of gunny bags were the major cost items
borne by producer-farmers in the sale of fennel seed both at village and
mandi. Among the middlemen, wholesalers accounted for a very high
share in total marketing costs of fennel seed. Marketing margins
accounted for 46.69 per cent of the consumer’s price in sale of fennel
seed through channel-I (producer farmers- village trader- wholesaler-
retailer – consumer) and 33.33 per cent of the consumer’s price in sale
through channel-II (producer farmer- wholesaler- retailer- consumer).
Retailers got higher margin in sale of fennel seed in both the channels
compared to the wholesalers. Producer’s share in consumer’s rupee
was 48.65 per cent in sale of fennel seed at village level and 62.05 per
cent at regulated market. Farmers selling their fennel seed in the
regulated market got 13.40 per cent higher share compared to village
sale.
Killedar et al. (2002) conducted study on the topic “Economics of
Production and Marketing of Ginger in Satara District of Western
Maharashtra” concluded that per quintal cost of marketing of Ginger was
estimated as Rs 402.62. While observing the item wise marketing total
charges are 402.62Rs per quintal, out of this Packing charges Rs 24.55
(6.1per cent), Octori Rs 2.00(0.5 per cent), Labour charges Rs 4.05
(1.00 per cent),Weighing charges Rs 5.88 (1.46 per cent), Market Fees
Rs 0.80 (0.20 per cent),Transportation charges Rs 49.98(12.41 per
cent), Commission charges Rs 304.64 (75.67 per cent) and others are
Rs1.0.72 (2.66 per cent) respectively , it is noticed that the highest share
(75.67 per cent)in total marketing cost was of commission charges,
followed by transport (12.41 per cent) and packaging charges (6.10 per
cent). Above eighty percent of Ginger growers sent their produce to
Mumbai and Pune markets for marketing of Ginger.
Tripathi et al. (2006) their study on marketing of ginger in Ri-
Biho district of Meghalaya observed that during the year 2003-04 the
marketable surplus was higher than marketed surplus in all production
ranged, showing that farmers sold the produce at higher prices without
keeping portion of production for seed. Marketing cost while ranged for
Rs. 357 to Rs. 519 per quintal noted to be higher in channel II.
Producer’s share in consumer’s rupees was 38.64 per cent to 60.59
per cent. The analysis revealed that the producer’s share in
consumer’s rupees was low due to exorbitant margin taken by the
village traders / commission agents.
Kaur and Singh (2010) concluded that the per quintal total
marketing cost of kinnow was estimated to be the highest when the
produce was sold through commission agent to wholesaler in the
wholesale market as compared to produce sold through other
marketing channels. As for producer’s share in consumer rupee, the
average category of kinnow orchardists had an overall average of
61.71 per cent share in the consumer’s rupee in the domestic
marketing. Channel III (producer-retailer–consumer) was the best
channel for local marketing, whereas channel I (producer- pre harvest
contractor –wholesaler –retailer – consumer) was found to be the best
channel from consumer’s point of view.
Shelke et al. (2009) studied the price spread of Groundnut in
Maharashtra state. The result revealed that producer share in
consumer‘s rupee was only 49.99 percent. The roasted incurred the
cost of Rs.240.81 per quintal of Groundnut pods. The retailers meet the
expenses of Rs. 18 per quintal of roasted Groundnut. The margin of
the roaster is Rs.105.65 per quintal where as the margin of retailers
was Rs 278.76 per quintal constituting 21.43 percent of the consumers
purchase price. The share of producer is quite low.
Changule et al.(2013) studied the marketed surplus and price
spread off maize in Aurangabad district of Maharashtra during 2010-
11. The result revealed that price paid by consumer was Rs 1010,
Rs1035 and Rs 1155 per quintal in channel I, II, III respectively in
which Producer’s share in consumer’s rupee was 94.20 percent 87.69
percent and 76.02 percent respectively. Producer ‘s share in
consumer’s rupee was highest in channel I than that of channel II, III,
net price received by producer was highest in channel III which was
Rs. 269.29 followed by 127.42 in channel II and Rs. 58.58 in channel I.
It was found that the channel I was benefited to producers.
Shah, et.al. (2010) examined the marketing margin in citrus
business in Haripur district of N.W.F.P, Pakistan during. The persent
study was conducted during the citrus production season of year 2008.
The results revealed that growers received only 35.7 percent of final
year, while rest of the 64.0 percent prices was accumulated in to the
profit basket of market functionaries. The share of various
intermediaries was, contractors got 21.3 percent, 9.8 percent of the
profit margin was taken away by the commission agents and 14.9
percent by the wholesalers, while remaining 18.4 percent profit margin
went to the retailers and other functionaries. It concluded that
producer’s share in consumer’s rupee was relatively very low except in
care of that channel where produce was sold directly by the producer
to consumer price spread analysis revealed that , various market
intermediaries were the highest beneficiaries in the marketing
channels.
Deshmukh et al. (2010) studied the marketable surplus and
price spread of Pearlmillet in Beed district ,Maharashtra during the
2008-09. The study revealed that the price paid by the consumer was
highest Rs. 920 per quintal in channel III, in which producer ‘s share in
consumer ‘s rupee was 66.21 percent . In the case of channel II the
price paid by the consumer was Rs. 775 pre quintals, in which the
producer’s share in the consumer’s rupee was 77.80 percent. In
channel I compared to that in channels II and III but the producer’s
share in the consumer’s rupee was highest, i.e. 97.66 percent as
compared to that in other channels. The net price received by the
producer Rs.610 was highest in channel III as compared to Rs. 603 per
quintal in channel II and Rs.585 per quintal in channel I. The price
spread was highest in channel III Rs.311.28 followed by Rs. 172 in
channel II and Rs.14 in channel I. It was found that channel III was
beneficial to both producer as well as intermediaries.
Sharma et al. (2013) conducted a study on Economics of
Tomato cultivation in Jaipur district of Rajasthan during 2008. The
study was on the basis of highest area and production. The result
revealed that the marketing cost in different marketing channels borne
by farmers were Rs.55.35 in channel l, Rs.53.57 in channel ll and Rs.
40 in channel lll. The shares of producer in consumer rupee were
hightest of channel ll 56.79 percent and lowest in case of channel l
52.50 percent. The price spread in different marketing channels was
47.50 percent channel l, 43.21 percent in channel ll and 43.65 percent
in channel lll.
2.3 Relationship between market arrivals and prices
Lal (1994) conducted a study on Production and Marketing of
Bajra in Jaipur district of Rajasthan. He studied the relationship between
market arrivals and wholesale prices of Bajra in Jaipur and Renwal
market of Rajasthan during 1993-94 by working out the correlation
coefficient. The correlation coefficient between wholesale prices and
arrivals of Bajra crop in corresponding months were -0.4880 and -0.3926
and between wholesale prices and arrivals of Renwal months were -
0.1655 and -0.5540 in Jaipur and Renwal markets respectively. The
negative sign indicate that the arrivals and prices were inversely related
in both the market. Further the seasonal indices of Bajra arrivals were
maximum during the period of Oct.-Dec. while the prices indices during
this period were lowest in both the markets. On other hand, the arrivals
indices were lower in lean season months of May - Aug. as against this
the prices indices in these months were higher.
Mishra (1998) from his study entitled “Economic Analysis of
Production and Marketing of Green pea in Jaipur District (Rajasthan)”,
observed that the arrivals of green pea in the mandi started from second
week of November up to the end of March. There has been continues
increase in market arrivals of green pea from November to February and
decreased there after till the end of the crop season. Arrivals of green
pea were low in the starting month of the season i.e. November (5.21per
cent). It picked up and increased thereafter. The arrivals were the
highest in February (31 per cent). The market arrivals were low in March
(17 per cent) i.e.in the last month of the marketing season. Prices has
shown continuously decreasing trend from first arrivals months
(November) to the last arrival month (March) of the marketing season.
The comparison of arrivals and prices reveals that these moved in
opposite direction i.e. prices were higher in low arrivals months and
lower in brisk arrival months of the produce. The study further revealed
that the correlation coefficient between market arrivals and prices was
negative showing there by an inverse relationship (except in February).
However the coefficients were significant only in three months
(November, December and March) out of 5 months of the marketing
season. In remaining two months, the coefficient was non- significant.
Thus, it was inferred that prices were influenced by the arrivals in three
months of the production season. The correlation coefficient based on
lagged values of arrivals were also negative during the study period
(except in February)as has been observed in the concurrent period
analysis.
Nahatkar et al. (1999) studied the market arrivals and prices of
Wheat in Sehore regulated market of Madhya Pardesh during the period
1984-85 to1994-95. He observed that market arrivals of Wheat in
Sehore market increased over time and Wheat prices in general had
shown an increasing trend. Variation in annual prices was less than the
variation in arrivals. Annual rainfall and prices of Wheat significantly
affected arrivals of Wheat. There was negative relationship between
annual arrivals and Wheat in market during most of the years. There
were positive and highly significant relationships between prices and
arrivals of Wheat during the months of December, March-August.
Hamendra et al. (2012) studied carried out to assess the trend in
market arrivals and prices of Rapeseed- Mustard in Bharatpur district of
Rajasthan. The result was found that the higher indices for arrivals were
recorded during the mount hog March to May (April) and lower from
June to February. The price index was the lowest in May and highest in
February in Bharatpur market. There was positive relationship between
farm size, total stock and previous stock.
Kasar et al. (1996) in their study entitled “Behaviour of Prices and
Arrivals of Red Chilies: A Case Study from Maharashtra” Estimated the
coefficient of correlation between arrivals and prices of red chillies in
Dohdaicha market to be 0.683 which was significant at 5 per cent level
of probability. The proportion of arrivals of red (dry) chillies was meager.
By and large, there existed a significant negative correlation between
arrivals and prices of red chillies.
Bhole (2004) studied the problems in marketing of oranges in
vidharbha. He indicated main problems such as delayed payment,
breaking contract as oranges prices slash, cut in payment of farmers in
the event of loss of fruits due to dropping, high commission changes,
high transportation, loading and unloading charges and delayed
payment of commission agents.
Kumar et al. (2006) examined the variability pattern of market
arrivals and prices of potato in four metropolitan markets. Relationship
between market arrivals and prices in those Delhi, Mumbai, Kolkata,
Babgalore & examined markets during 1999-2001 periods. The results
revealed that as regards the market arrivals in Bangalore market the
variability was higher than that in Delhi and Mumbai markets the price
variability was maximum during August-September in Delhi and
Bangalore markets, During July-October in Mumbai market and during
May-July in Kalkata market.
Thombre et al. (2013) studied the market arrivals and prices of
Pigeonpea in Marathwada region during the year 1980-81 to 2005-06.
The month wise market arrivals and prices data of Pigeonpea from
respective markets were used for analysis (1980-81 to 2005-06). The
seasonal variation in arrivals and prices was calculated by using ratio to
moving average method. The relationship between market arrivals and
prices of pigeon pea was tested with the help of simple linear regression
equation and double log modal. The results revealed that, arrivals and
prices of pieonpea had strong season effect. The results confirmed the
negative relationship between arrivals and prices in both the markets
under the study.
Vekariya et.al. (2006) studied the relationship between market
arrivals and prices of major vegetable in Ahmadabad and Mahuva
market of Gujarat during the period. the arrivals and prices of potato
increased by 5.11 and 6.34 per cent anmum, respectively in Ahmadabad
market & mahuva market , arrivals and prices of onion increased by 7.05
and 13.14 per cent respectively, the growth of market arrivals were very
high and prices were declined 4.29 per cent due to maximum arrivals in
Junagarh markets. The arrivals of Brinjal were low in Ahmadabad
market.
Singh et al. (2010) in their study “A study on behaivour of arrivals
and prices of green chillies in Punjab” the present study was conducted
in Amritsar and Patiala. Amritsar and Patiala markets were selected
purposively which have recorded highest market arrivals during last
three years it has been noticed that area under chilli crop has declined,
whereas the area under vegetable crop has increased in Punjab. The
time series analysis shows that arrivals of chilli increased over period of
time in the sample markets similarly the prices of chilli registered
increase over a period of time in Amritsar market whereas in Patiala
market it shows the declining trend. It has been found that the seasonal
nature of chilli crop creates glut in the market during the post
2.4 Constraints
Chahal et al. (2010) conducted a study on the constraints in
marketing of Maize faced by farmer, major constraints reported by
farmers were non- availability of credit, poor marketing facilities, lack of
storage facilities, non-availability of seed suitable to the local needs, late
sowing of crop etc.
Ghafoor et.al.(2010) studied the marketing problems faced by
kinnow growers of tehsil Toba Tek Singh (Pakistan). The study revealed
that lack of storage facilities and non availability of cartons appeared to
be the major problems faced by kinnow growers, late payments by the
dealers, less price of kinnow in markets monopoly of middleman,
packing and loading, high carriage and other handing charges, also
perceived to be very important factors contributing toward marketing
problems of kinnow. From the above, we can conclude that major
production and marketing constraints associated with the fruits were
high cost of inputs, lack of skilled labour, lack of storage facilities,
unavailability of quality seedlings, large numbers of middlemen,
unregulated markets, high commission charges, high cost of
transportation and lack of market information.
Guledgudda et al. (2002) conducted a study on banana cultivation
in Haveri district of Karnataka state and identified the problems faced
during production were lack of technical know-how, lack of adequate
credit facility, scarcity of water etc. The farmers in the study area also
expressed marketing problems like involvement of intermediaries, lack of
storage facilities and inadequate transportation.
Singh and Sharma (2011) conducted a study in problems and
prospects in production and marketing of mint oil in Moradabad district of
Uttar Pradesh. The results of analysis revealed that about 95 per cent of
the farmers in the study area were not getting required technical
guidance from the agencies involved in this trade. Almost all the large
farmers felt this problem very intensively. Thus, problem of inadequate
distillation infrastructure was expressed by 88 per cent of mentha
growers in the study area, as distillation of oil is an important part.
Improper storage arrangements as impediment in cultivation and
marketing of mint oil were expressed by about 82 per cent of farmers in
the study area, corrupt practices of trading was expressed by 81 per
cent of respondents in study area. High price volatility and lack of
minimum support price were the problems expressed by about 65 per
cent of the farmers.
Nazeer Ahmed et al. (2012) reported that farmers are facing lot of
problems in cultivation of aromatic plants specially their scientific
cultivation and agronomy and marketing of produce. There is lack of
standard package of practices for aromatic plants and moreover farmers
are not aware to available technologies. Aromatic crop cultivation is a
new area for the farmers and the workers and labourers are not aware
about the aromatic plants, cultivation, processing and post harvest
practices. The non-availability of the skilled labour and high-tech
cultivation harvesting and processing is the limitation.
Ram Suresh et al. (2012) conducted a study on the constraints in
production of these aromatic crops, faced by 85 per cent growers, were
lack of improved production techniques, non-availability of quality
planting material, absence of input subsidies and poor access to credit.
About 45 per cent growers reported shortage of labour during harvesting
season.
Shashikant et al. (2013) conducted a study on the constraints in
production & marketing of red gram faced by farmers was conducted in
2008-09 in Gulbarga district of Karnataka. Major constraints reported by
the farmers were inadequate availability of labour, high cost of pesticide,
inadequate availability of fertilizers and quality seeds, low output price
during post harvest period, damage due to natural calamities,
inadequate transportations facility, high market fees and charges, high
transportation cost, lack of storage facilities.
Subhash et al.(2006) conducted a study on the constraints in
pearl millet it was found that the constraints such as high price of
herbicides, fungicides and other pesticides and lack of irrigation facilities,
failures of crop due to unfavorable weather conditions and use of
untreated seeds were also very serious , and lack of knowledge
regarding the application date and dosage of fertilizers were major
constraints in marketing of produce, while unavailability of warehouses ,
distress sale due to immediate need for money, low support price of
produce, lack of cooperative organization for marketing of produce, lack
of guidance and knowledge.
Chapter-3
RESEARCH METHODOLOGY
Scientific study of any problem requires a systematic investigation
using appropriate methods and procedures in order to arrive at reliable
and practical conclusions. This chapter deals with the methods used in
present investigation as discussed below under the following sub-heads:
3.1 Sampling framework
3.2 Collection of data
3.3 Analysis of data, and
3.4 Limitations of the study
3.1.1 Selection of Crop:
Bajra crop was selected for the detailed study because this crop
has a good place among the cereal crops in Rajasthan.
3.1.2 Selection of the study area:
Jaipur district of the state of Rajasthan was selected purposively
for the study. This district is one of the major bajra growing districts of
Rajasthan.
3.1.3 Selection of Tehsils:
Jaipur district comprises fourteen tehsils, Out of which two tehsils,
namely Chomu and Renwal were selected randomly.
3.4 Selection of Villages:
A list of villages was obtained from the secretary, Krishi Upaj
Mandi Samiti, Renwal and Chomu from was which maximum farmers
have sold their produce in the market. Out of tthis, six villages namely
Rampura, Malikpura, Luniyawas, Alisar, Biharipura, Jaisinghpura were
selected randomly.
3.5 Selection of the farmers
The list of the bajra growing farmers in these six villages was
selected along with their size of operational holding were prepared with
the help of patwaries of the concerned villages. Next a combined list of
all the bajra growers was made in an ascending order of size of their
respective operational land holding. These bajra growers were
categorized into following four size groups.
(i) Small Less than 2 ha
(ii) Semi- medium 2-4 ha
(iii) Medium 4-10 ha
(iv) Large 10 ha and above
Finally, sixty Bajra growers were randomly selected in proportion to their
total number in each size of group for detailed investigation.
3.6 Selection of market
Two markets i.e. Chomu Krishi Upaj Mandi Samiti and Renwal
Krishi Upaj Mandi Samiti were selected for detail study.
3.7 Collection of data
Both primary and secondary Data were utilized in the study. The
primary data in respect of area under bajra crop and production of bajra,
sale pattern, costs incurred by the selected farmers in the sale of bajra
and sale price of the produce obtained by the farmers, costs incurred by
the wholesalers and retailers in purchase and sell of bajra, were
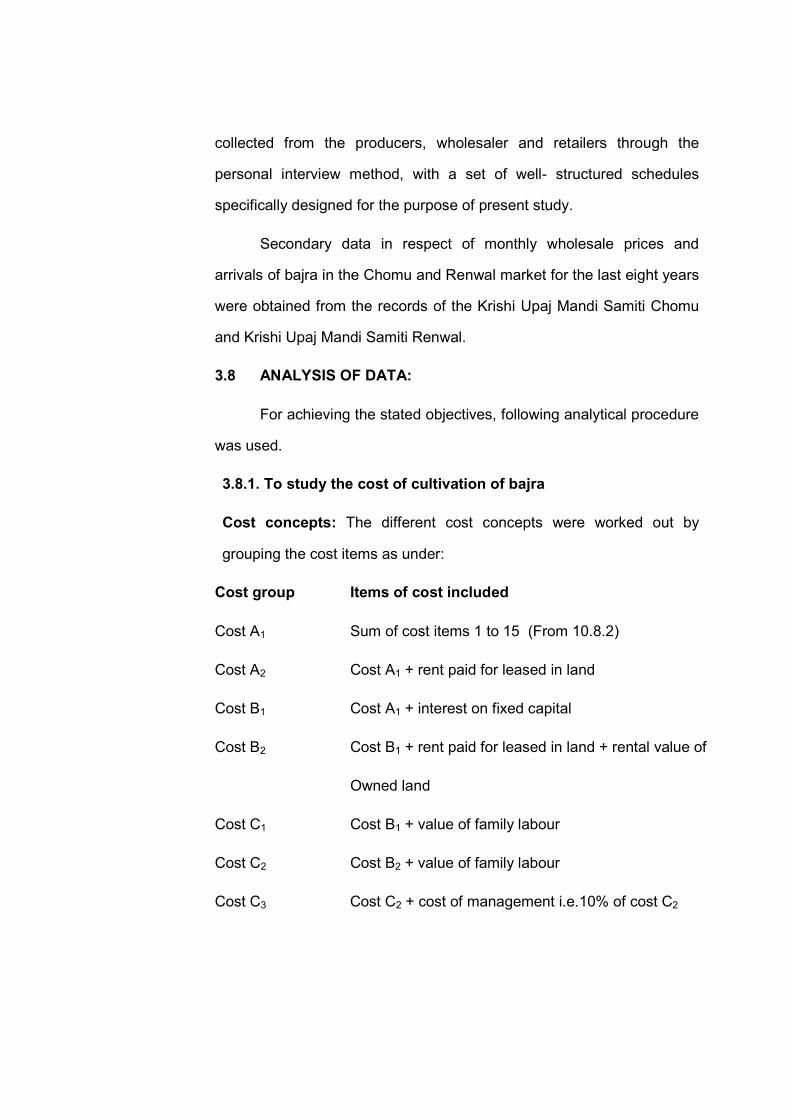
collected from the producers, wholesaler and retailers through the
personal interview method, with a set of well- structured schedules
specifically designed for the purpose of present study.
Secondary data in respect of monthly wholesale prices and
arrivals of bajra in the Chomu and Renwal market for the last eight years
were obtained from the records of the Krishi Upaj Mandi Samiti Chomu
and Krishi Upaj Mandi Samiti Renwal.
3.8 ANALYSIS OF DATA:
For achieving the stated objectives, following analytical procedure
was used.
3.8.1. To study the cost of cultivation of bajra
Cost concepts: The different cost concepts were worked out by
grouping the cost items as under:
Cost group Items of cost included
Cost A1 Sum of cost items 1 to 15 (From 10.8.2)
Cost A2 Cost A1 + rent paid for leased in land
Cost B1 Cost A1 + interest on fixed capital
Cost B2 Cost B1 + rent paid for leased in land + rental value of
Owned land
Cost C1 Cost B1 + value of family labour
Cost C2 Cost B2 + value of family labour
Cost C3 Cost C2 + cost of management i.e.10% of cost C2
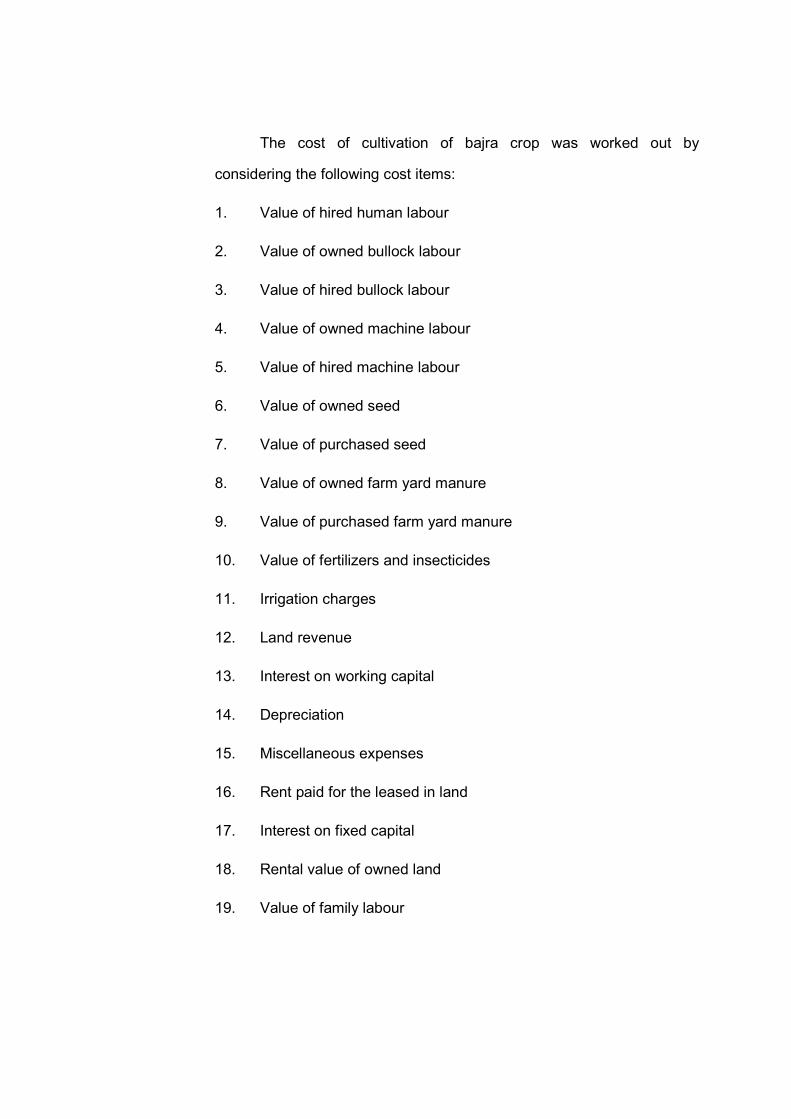
The cost of cultivation of bajra crop was worked out by
considering the following cost items:
1. Value of hired human labour
2. Value of owned bullock labour
3. Value of hired bullock labour
4. Value of owned machine labour
5. Value of hired machine labour
6. Value of owned seed
7. Value of purchased seed
8. Value of owned farm yard manure
9. Value of purchased farm yard manure
10. Value of fertilizers and insecticides
11. Irrigation charges
12. Land revenue
13. Interest on working capital
14. Depreciation
15. Miscellaneous expenses
16. Rent paid for the leased in land
17. Interest on fixed capital
18. Rental value of owned land
19. Value of family labour
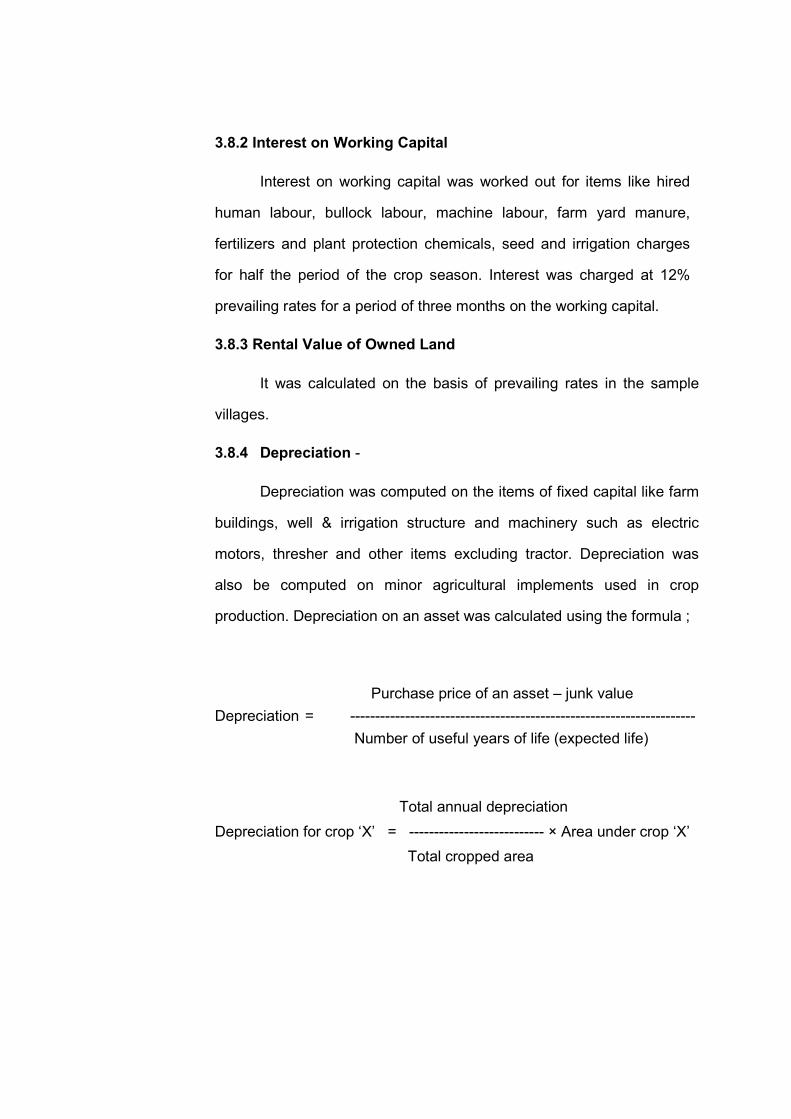
3.8.2 Interest on Working Capital
Interest on working capital was worked out for items like hired
human labour, bullock labour, machine labour, farm yard manure,
fertilizers and plant protection chemicals, seed and irrigation charges
for half the period of the crop season. Interest was charged at 12%
prevailing rates for a period of three months on the working capital.
3.8.3 Rental Value of Owned Land
It was calculated on the basis of prevailing rates in the sample
villages.
3.8.4 Depreciation -
Depreciation was computed on the items of fixed capital like farm
buildings, well & irrigation structure and machinery such as electric
motors, thresher and other items excluding tractor. Depreciation was
also be computed on minor agricultural implements used in crop
production. Depreciation on an asset was calculated using the formula ;
Purchase price of an asset – junk value
Depreciation = ---------------------------------------------------------------------
Number of useful years of life (expected life)
Total annual depreciation
Depreciation for crop ‘X’ = --------------------------- × Area under crop ‘X’
Total cropped area
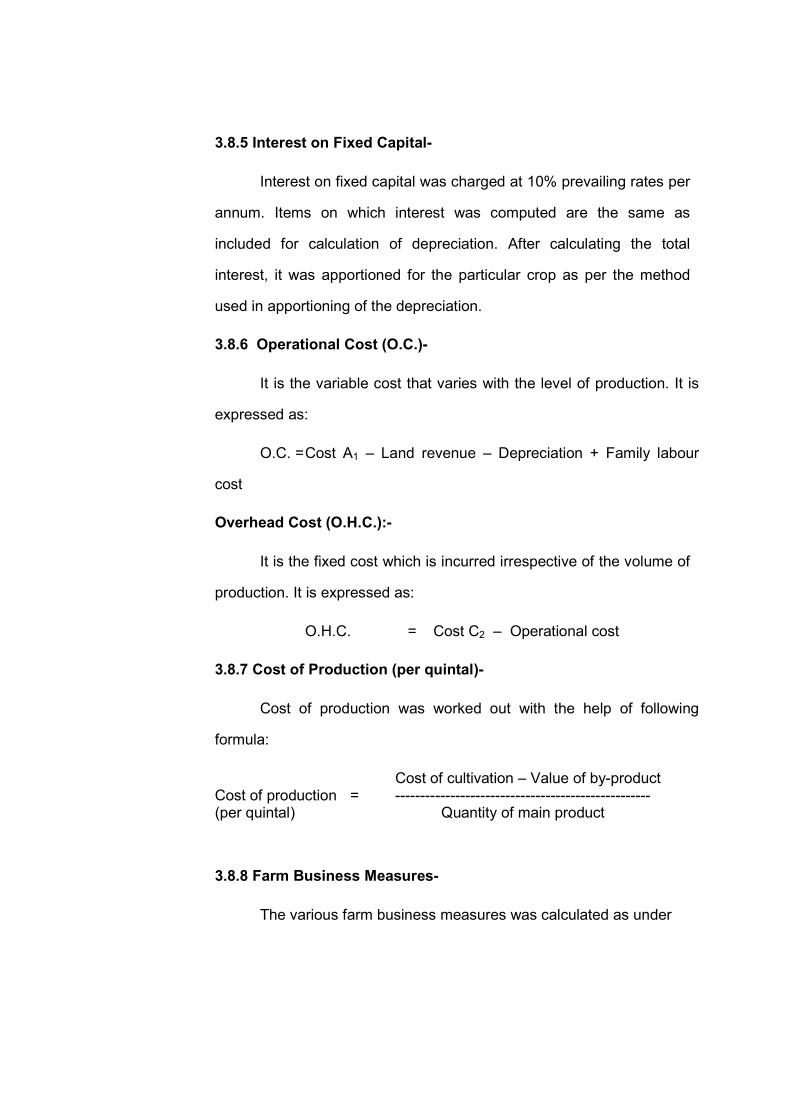
3.8.5 Interest on Fixed Capital-
Interest on fixed capital was charged at 10% prevailing rates per
annum. Items on which interest was computed are the same as
included for calculation of depreciation. After calculating the total
interest, it was apportioned for the particular crop as per the method
used in apportioning of the depreciation.
3.8.6 Operational Cost (O.C.)-
It is the variable cost that varies with the level of production. It is
expressed as:
O.C. = Cost A1 – Land revenue – Depreciation + Family labour
cost
Overhead Cost (O.H.C.):-
It is the fixed cost which is incurred irrespective of the volume of
production. It is expressed as:
O.H.C. = Cost C2 – Operational cost
3.8.7 Cost of Production (per quintal)-
Cost of production was worked out with the help of following
formula:
Cost of cultivation – Value of by-product Cost of production = --------------------------------------------------- (per quintal) Quantity of main product
3.8.8 Farm Business Measures-
The various farm business measures was calculated as under
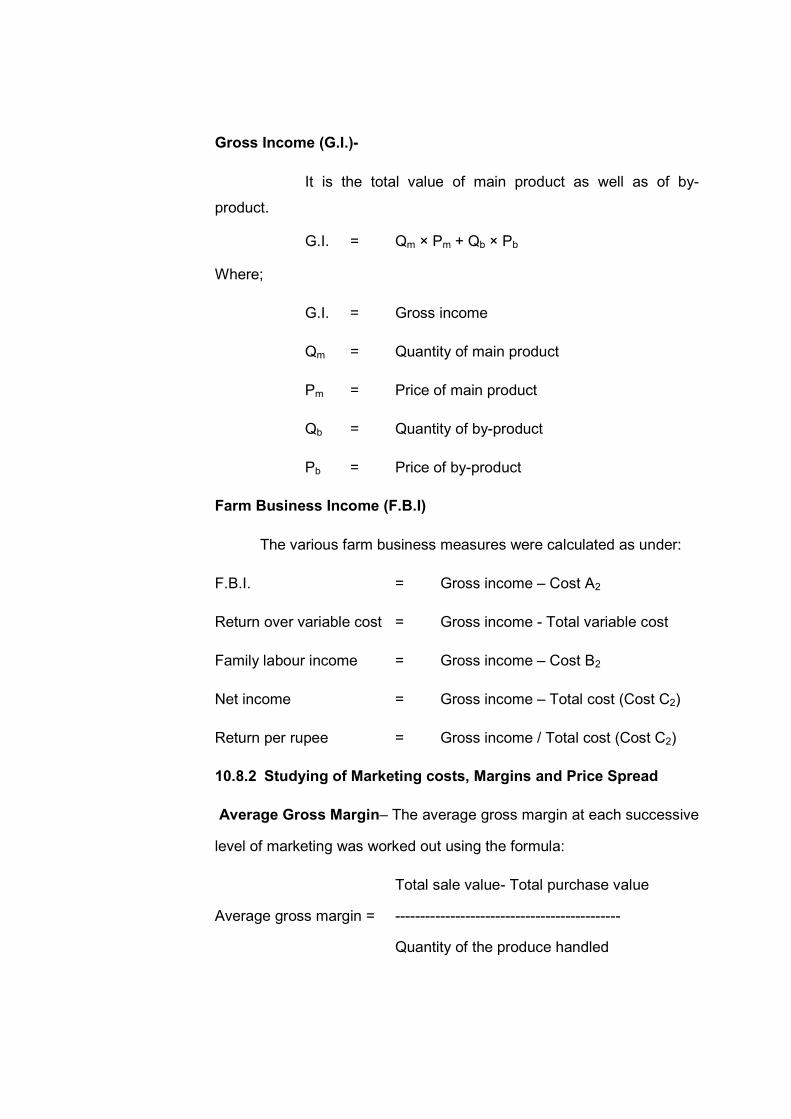
Gross Income (G.I.)-
It is the total value of main product as well as of by-
product.
G.I. = Qm × Pm + Qb × Pb
Where;
G.I. = Gross income
Qm = Quantity of main product
Pm = Price of main product
Qb = Quantity of by-product
Pb = Price of by-product
Farm Business Income (F.B.I)
The various farm business measures were calculated as under:
F.B.I. = Gross income – Cost A2
Return over variable cost = Gross income - Total variable cost
Family labour income = Gross income – Cost B2
Net income = Gross income – Total cost (Cost C2)
Return per rupee = Gross income / Total cost (Cost C2)
10.8.2 Studying of Marketing costs, Margins and Price Spread
Average Gross Margin– The average gross margin at each successive
level of marketing was worked out using the formula:
Total sale value- Total purchase value
Average gross margin = ---------------------------------------------
Quantity of the produce handled
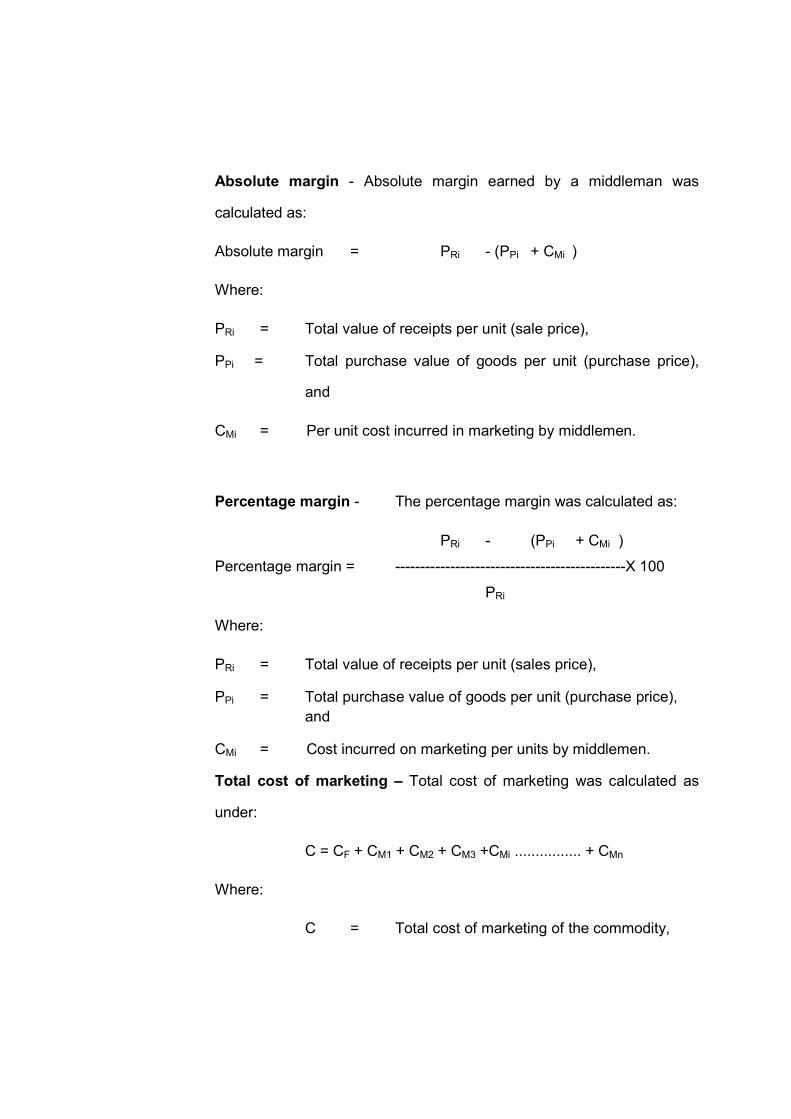
Absolute margin - Absolute margin earned by a middleman was
calculated as:
Absolute margin = PRi - (PPi + CMi )
Where:
PRi = Total value of receipts per unit (sale price),
PPi = Total purchase value of goods per unit (purchase price),
and
CMi = Per unit cost incurred in marketing by middlemen.
Percentage margin - The percentage margin was calculated as:
PRi - (PPi + CMi )
Percentage margin = ----------------------------------------------X 100
PRi
Where:
PRi = Total value of receipts per unit (sales price),
PPi = Total purchase value of goods per unit (purchase price),
and
CMi = Cost incurred on marketing per units by middlemen.
Total cost of marketing – Total cost of marketing was calculated as
under:
C = CF + CM1 + CM2 + CM3 +CMi ................ + CMn
Where:
C = Total cost of marketing of the commodity,
CF = Cost borne by the producer-farmer from the
time at which the produce leaves the farm till
the sale of the produce,
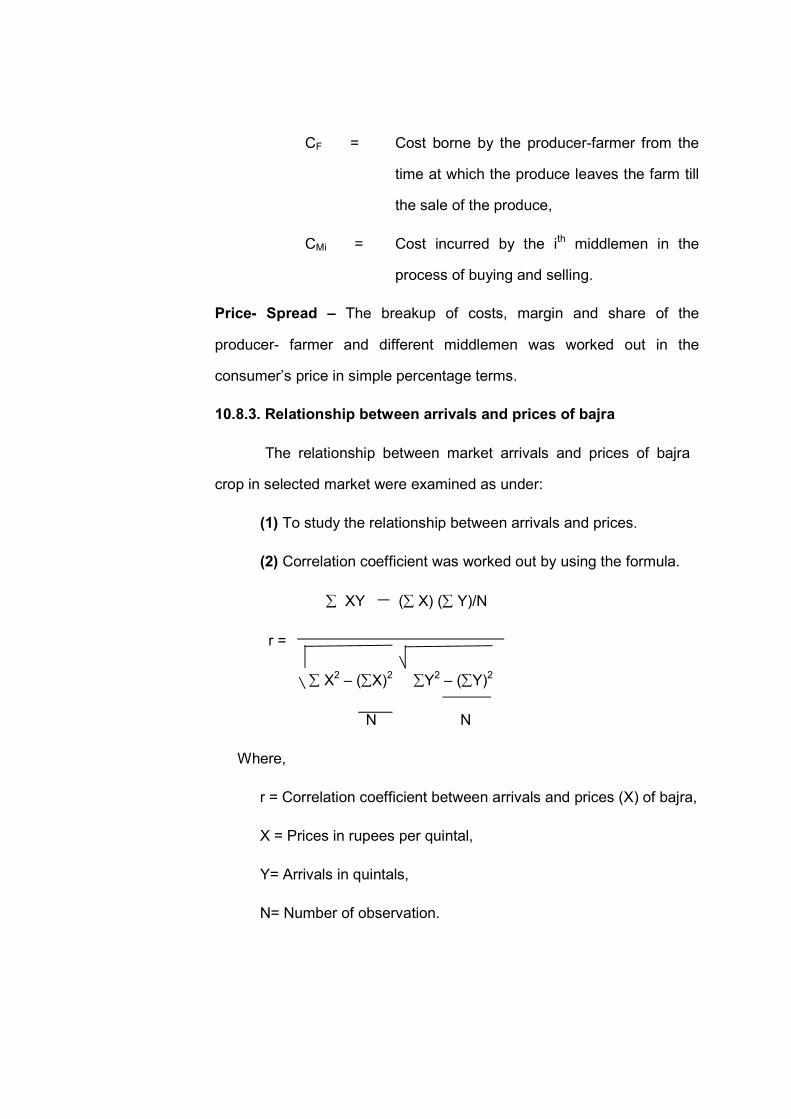
CMi = Cost incurred by the ith middlemen in the
process of buying and selling.
Price- Spread – The breakup of costs, margin and share of the
producer- farmer and different middlemen was worked out in the
consumer’s price in simple percentage terms.
10.8.3. Relationship between arrivals and prices of bajra
The relationship between market arrivals and prices of bajra
crop in selected market were examined as under:
(1) To study the relationship between arrivals and prices.
(2) Correlation coefficient was worked out by using the formula.
XY ( X) ( Y)/N
r =
X2 – (X)2 Y2 – (Y)2
N N
Where,
r = Correlation coefficient between arrivals and prices (X) of bajra,
X = Prices in rupees per quintal,
Y= Arrivals in quintals,
N= Number of observation.
3.8.4 Problems faced by the bajra farmers
Technical, infra-structural, economics and social constraints were
studied in the study area.
(1) Technical constraints- Technical constraints means
impediments or restraints pertaining to know- how or skill in the
way of adoption of particular recommended production
technology.
(2) Infra- structural constraints- It has been defined those
impediments or restraints pertaining to organization in the way
of adopting of particular recommended production technology
and marketing operations.
(3) Economic constraints- It means the restraints pertaining to
finance, profitable operation, in the way of adopting of particular
recommended production technology and marketing operation.
(4) Social constraints- Social constraints mean the impediments
or restraints pertaining to society, habit and mental acceptance
in the way of adopting of particular recommended production
and marketing practices.
The interview schedule was specially prepared to find out the
constraints. The constraints expressed by the respondents were
categorized as technical, infra-structural, economic, social constraints on
basis of number of respondents facing particular constraints.
3.9 Limitations of the study
Though all possible efforts were made to make the study objective
and comprehensive, certain limitations did remain. The most
prominent limitations of the study are as under:
(i) The findings of the study arrived at on the basis of a particular
agricultural year 2012-13, may not stand true for the successive
years, mainly due to changes in the prices of inputs and outputs.
Hence the findings of the study depend upon the reliability of the
assumptions hypothesized in the study.
(ii) Lack of maintenance of records relating to inputs and outputs by
the farmers was another limitation. The data were collected
through survey method. The information provided by the farmers
was based entirely on their recall memory. Though, every effort
was made to elicit correct information, however, the chances of
error might be there due to forgetfulness. Hence the results of the
study are true to the extent the data are reliable.
Chapter –4
RESULTS AND DISCUSSION
In this chapter, an attempt has been made to present the details
of costs and returns of bajra crop for the sample farmers of Jaipur
district. Production is normally considered the function of area and yield.
The decision regarding the choice of a crop enterprise to be taken on the
farm and the allocation of the area and the resources under it to a great
extent depends on the level of yield, price of output and the cost of
inputs used in the production of that enterprise. The cost of cultivation
/production and the returns to different factors of production help in
decision making about the selection of the enterprise, Therefore these
measures were also worked out for the bajra crop. The chapter has
been divided in to four sub-sections:
Section-4A Cost structure, and Returns from bajra cultivation
Section-4B Marketing costs, margin and price spread in marketing of
bajra crop.
Section-4C Relationship between market arrivals and prices of bajra in
Chomu and Renwal market
Section-4D Problems faced by the bajra producers.
Section 4 A
4A COST STRUCTURE
In the cultivation of bajra crop various cost are incurred. The
different cost groups and their components are presented below:
4A.1 Cost Group
Various types of costs incurred in the cultivation of bajra crop are
presented in Table 4A.1The overall cost of cultivation of bajra crop (cost
C3) was ` 10362.80 per hectare. The cost of cultivation of bajra was `.
10470.69, 10349.52, 10256.18 and 10184.35, in case of small, semi-
medium, medium and large size groups respectively. The operational
cost on small farms was higher due to more intensive use of human and
fertilizer, FYM as well as. Thus, the cost C3 was highest on small farms
followed by semi-medium, medium and large sized farms. It is clear from
the table that cost of cultivation of bajra decreased with the increase in
size of land holdings.
The operational cost exceed the overhead cost in all size groups
of farms, on an
average, the share of operational costs was 40.51 per cent of the total
cost (cost C3) for the sample farms. The operational cost was ` 3816.43
for the sample farms of the selected villages.
Overall, cost A1, A2, B1, B2, C1 and C2 were ` 3662.43, 3662.43,
4150.73, 8650.73, 4920.73 and 9420.73, respectively on the sample
farms. Cost A2 was equal to cost A1 on all the size groups of farms
because none of the sample farmers leased in any land for cultivation of
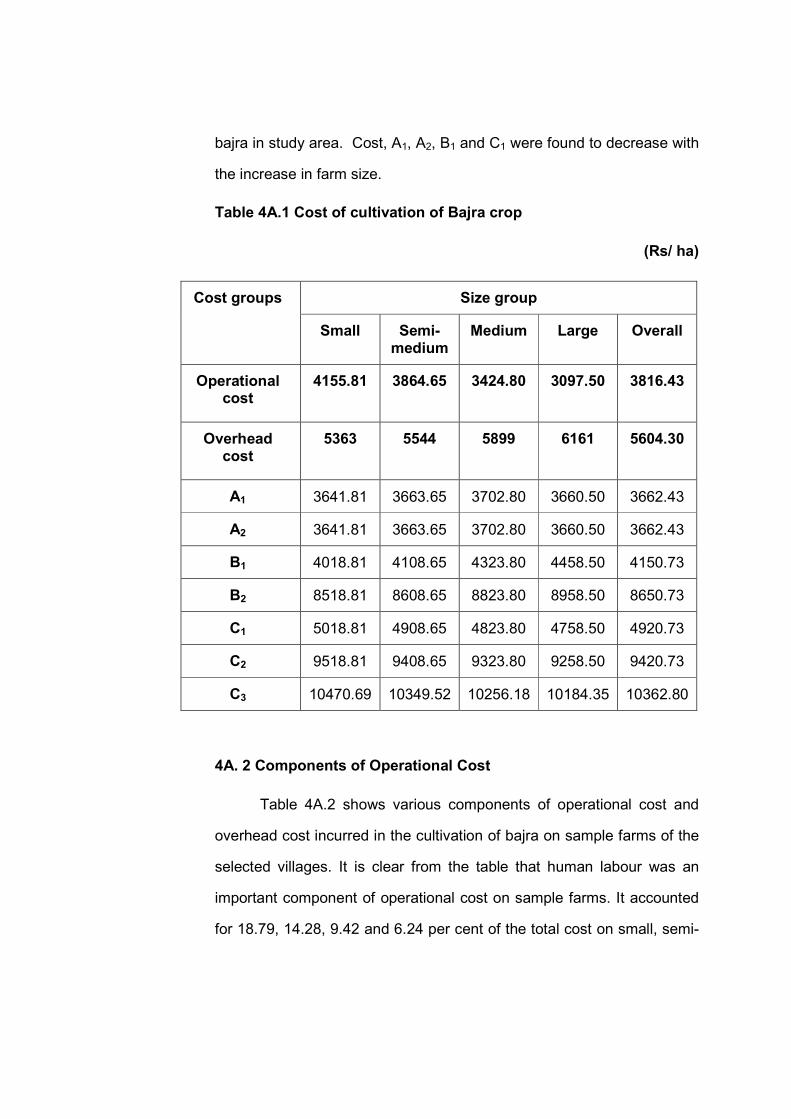
bajra in study area. Cost, A1, A2, B1 and C1 were found to decrease with
the increase in farm size.
Table 4A.1 Cost of cultivation of Bajra crop
(Rs/ ha)
Cost groups Size group
Small Semi-medium
Medium Large Overall
Operational cost
4155.81
3864.65
3424.80
3097.50
3816.43
Overhead cost
5363
5544
5899
6161
5604.30
A1 3641.81 3663.65 3702.80 3660.50 3662.43
A2 3641.81 3663.65 3702.80 3660.50 3662.43
B1 4018.81 4108.65 4323.80 4458.50 4150.73
B2 8518.81 8608.65 8823.80 8958.50 8650.73
C1 5018.81 4908.65 4823.80 4758.50 4920.73
C2 9518.81 9408.65 9323.80 9258.50 9420.73
C3 10470.69 10349.52 10256.18 10184.35 10362.80
4A. 2 Components of Operational Cost
Table 4A.2 shows various components of operational cost and
overhead cost incurred in the cultivation of bajra on sample farms of the
selected villages. It is clear from the table that human labour was an
important component of operational cost on sample farms. It accounted
for 18.79, 14.28, 9.42 and 6.24 per cent of the total cost on small, semi-
medium, medium and large farms, respectively. It was observed that the
share of human labour was maximum on small sized farms followed by
semi-medium, medium and large farms. The overall share of the human
labour was 14.35 per cent of the total cost. Its share was found to
decrease with the increase in size of land holdings.
FYM was another important component of the operational cost.
The cost of FYM was highest on small sized farms (10.27 per cent)
followed by semi-medium (8.06 per cent) followed by medium (4.99) and
large sized farms (2.70 per cent).Thus, the share of FYM was found
decrease with the increase in farm size.
Machine labour was another important component of the
operational cost. The share of machine labour in total cost ranged
between 5 to 9.85 per cent on different size group of farms. It was
observed that the share of machine labour was maximum on large farms
followed by medium farms followed by semi- medium and small farms.
The overall share of the machine labour was 6.49 per cent of the total
cost. Its share was found to increase with the increase in size of holding.
The share of fertilizer cost was 5.02 to 6.46 per cent different size
groups of farms with an average of 5.58 per cent. The fertilizer cost
showed positive relationship with the size of farms i.e. the cost of
fertilizer increase with the increase in farm size.
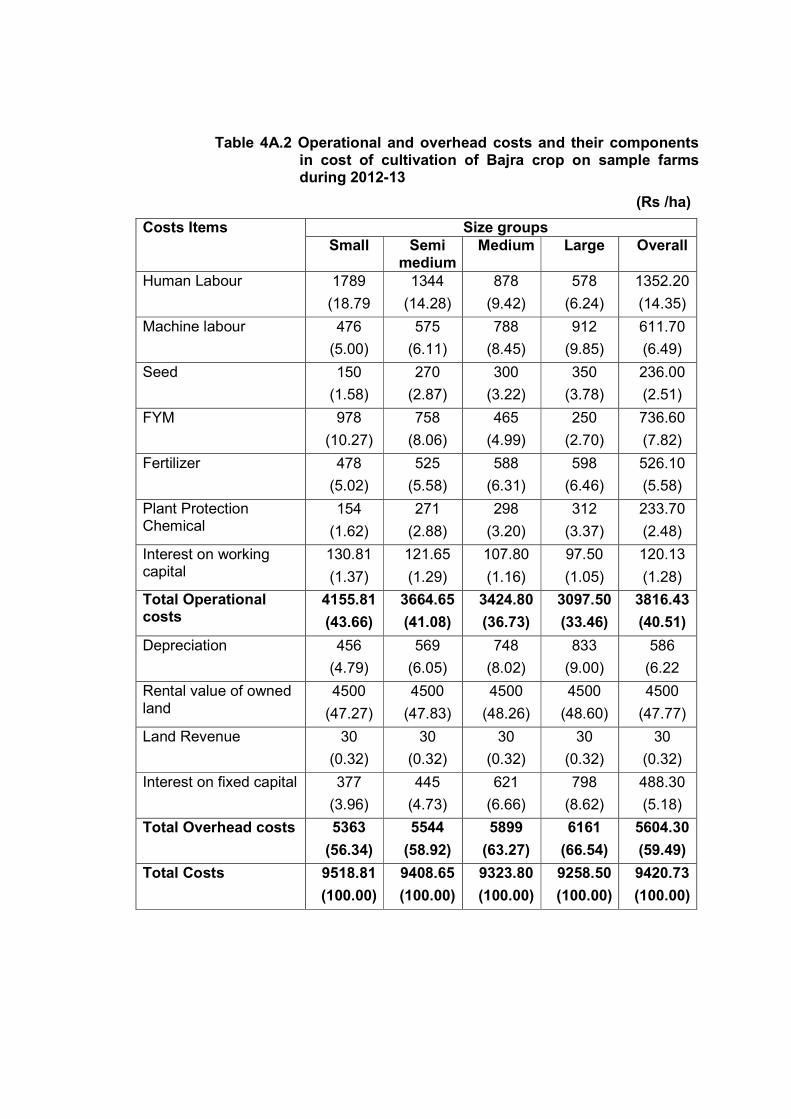
Table 4A.2 Operational and overhead costs and their components in cost of cultivation of Bajra crop on sample farms during 2012-13
(Rs /ha)
Costs Items Size groups Small Semi
medium Medium Large Overall
Human Labour 1789
(18.79
1344
(14.28)
878
(9.42)
578
(6.24)
1352.20
(14.35)
Machine labour 476
(5.00)
575
(6.11)
788
(8.45)
912
(9.85)
611.70
(6.49)
Seed 150
(1.58)
270
(2.87)
300
(3.22)
350
(3.78)
236.00
(2.51)
FYM 978
(10.27)
758
(8.06)
465
(4.99)
250
(2.70)
736.60
(7.82)
Fertilizer 478
(5.02)
525
(5.58)
588
(6.31)
598
(6.46)
526.10
(5.58)
Plant Protection Chemical
154
(1.62)
271
(2.88)
298
(3.20)
312
(3.37)
233.70
(2.48)
Interest on working capital
130.81
(1.37)
121.65
(1.29)
107.80
(1.16)
97.50
(1.05)
120.13
(1.28)
Total Operational costs
4155.81
(43.66)
3664.65
(41.08)
3424.80
(36.73)
3097.50
(33.46)
3816.43
(40.51)
Depreciation 456
(4.79)
569
(6.05)
748
(8.02)
833
(9.00)
586
(6.22
Rental value of owned land
4500
(47.27)
4500
(47.83)
4500
(48.26)
4500
(48.60)
4500
(47.77)
Land Revenue 30
(0.32)
30
(0.32)
30
(0.32)
30
(0.32)
30
(0.32)
Interest on fixed capital 377
(3.96)
445
(4.73)
621
(6.66)
798
(8.62)
488.30
(5.18)
Total Overhead costs 5363
(56.34)
5544
(58.92)
5899
(63.27)
6161
(66.54)
5604.30
(59.49)
Total Costs 9518.81
(100.00)
9408.65
(100.00)
9323.80
(100.00)
9258.50
(100.00)
9420.73
(100.00)
Seed was another important component of the operational cost
on sample farms. The share of seed cost in total cost was 1.58 to 3.78
per cent on different sized farms with an average of 2.51 per cent. The
seed cost was highest on large sized farms (3.78 per cent) and the
lowest on small sized farms (1.58 per cent) due to use of improved
variety of bajra seeds by large farmers.
Plant protection chemicals were another important component of
the operational cost. The share of plant protection chemical in total cost
ranged 1.62 to 3.37 per cent on different size group of farms with an
average of 2.48 per cent. The use of plant protection chemicals was
higher on large sized farms followed by medium farms followed by semi-
medium farms and small sized farms.
On an average interest on working capital accounted for 1.28 per
cent share, in the total cost. The share of interest on working capital
decreased with the increase in farm size.
4A.2 Component of Overhead Costs
The share of overhead cost components in total cost was 56.34 to
66.54 per cent on different size groups of farms with an average of 59.49
per cent. The share was highest on large size farms (66.54 per cent)
followed by medium (63.27 per cent) followed by semi-medium (58.92)
and small size farms (56.34 per cent). Thus, the share of overhead cost
increases with the increased in size of farm.
Rental value of owned land was the major component of the total
cost overall it shares was 47.77 per cent. Its share was 47.27, 47.82,
48.26 and 48.60 per cent, respectively on small, semi- medium, medium
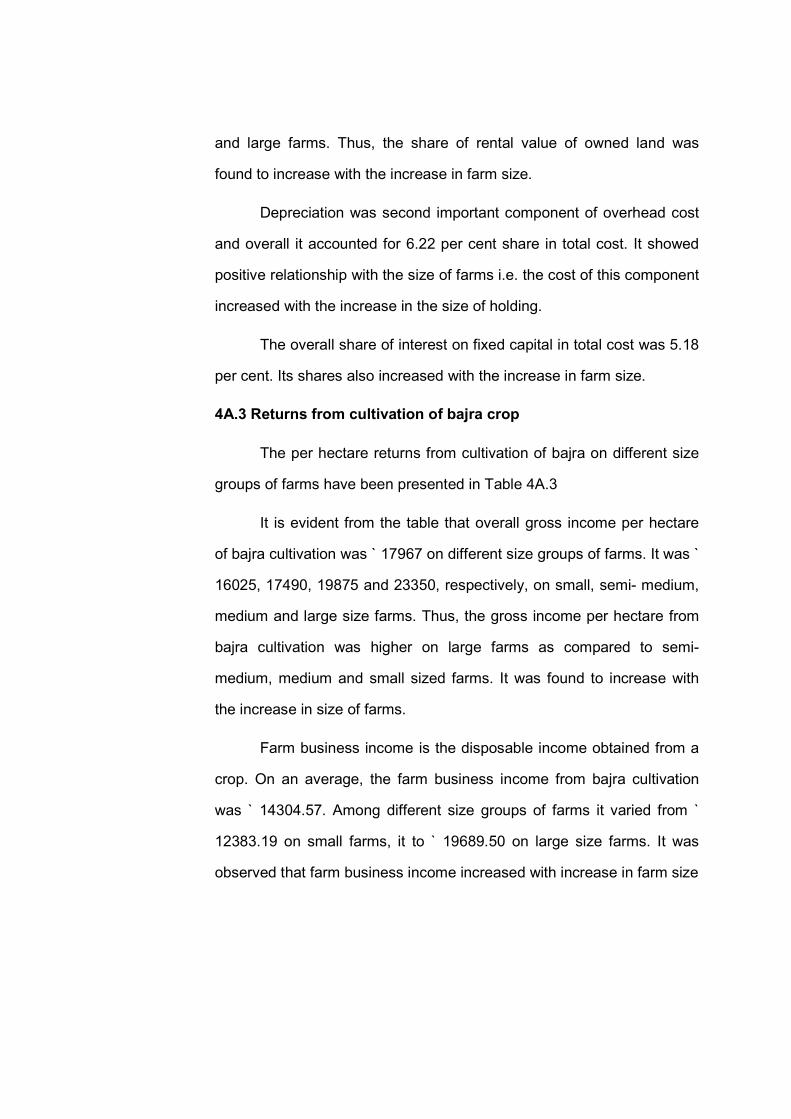
and large farms. Thus, the share of rental value of owned land was
found to increase with the increase in farm size.
Depreciation was second important component of overhead cost
and overall it accounted for 6.22 per cent share in total cost. It showed
positive relationship with the size of farms i.e. the cost of this component
increased with the increase in the size of holding.
The overall share of interest on fixed capital in total cost was 5.18
per cent. Its shares also increased with the increase in farm size.
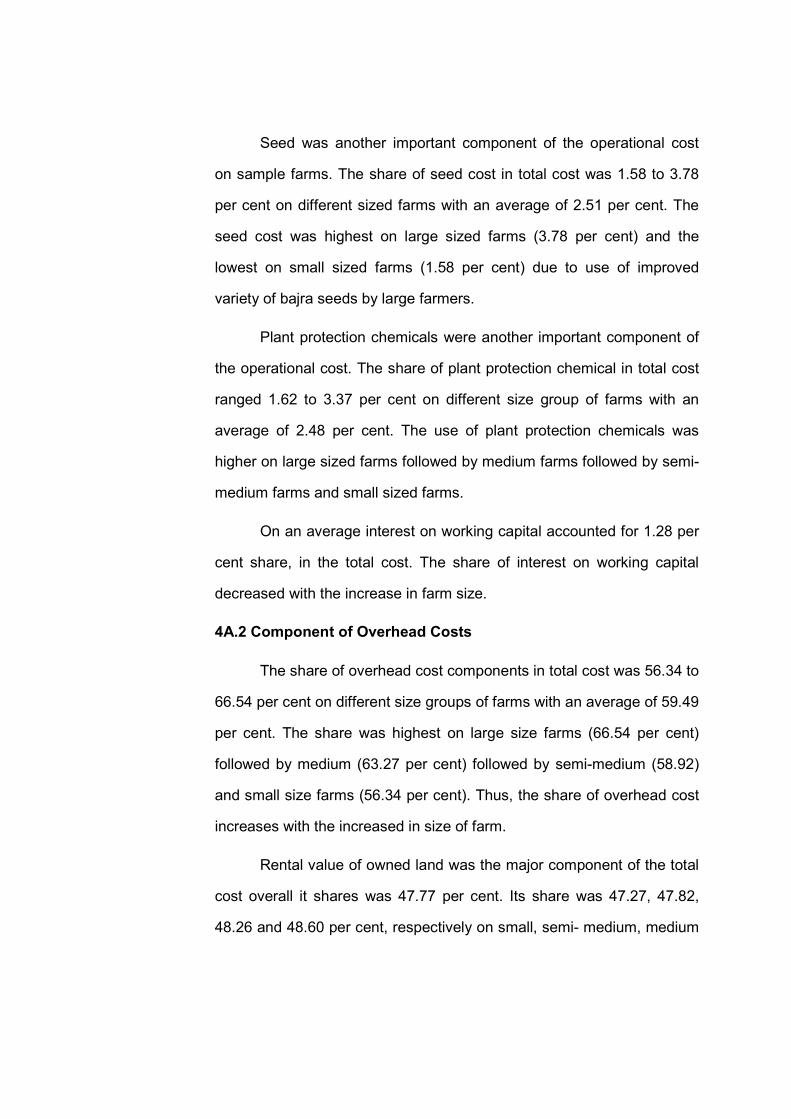
4A.3 Returns from cultivation of bajra crop
The per hectare returns from cultivation of bajra on different size
groups of farms have been presented in Table 4A.3
It is evident from the table that overall gross income per hectare
of bajra cultivation was ` 17967 on different size groups of farms. It was `
16025, 17490, 19875 and 23350, respectively, on small, semi- medium,
medium and large size farms. Thus, the gross income per hectare from
bajra cultivation was higher on large farms as compared to semi-
medium, medium and small sized farms. It was found to increase with
the increase in size of farms.
Farm business income is the disposable income obtained from a
crop. On an average, the farm business income from bajra cultivation
was ` 14304.57. Among different size groups of farms it varied from `
12383.19 on small farms, it to ` 19689.50 on large size farms. It was
observed that farm business income increased with increase in farm size
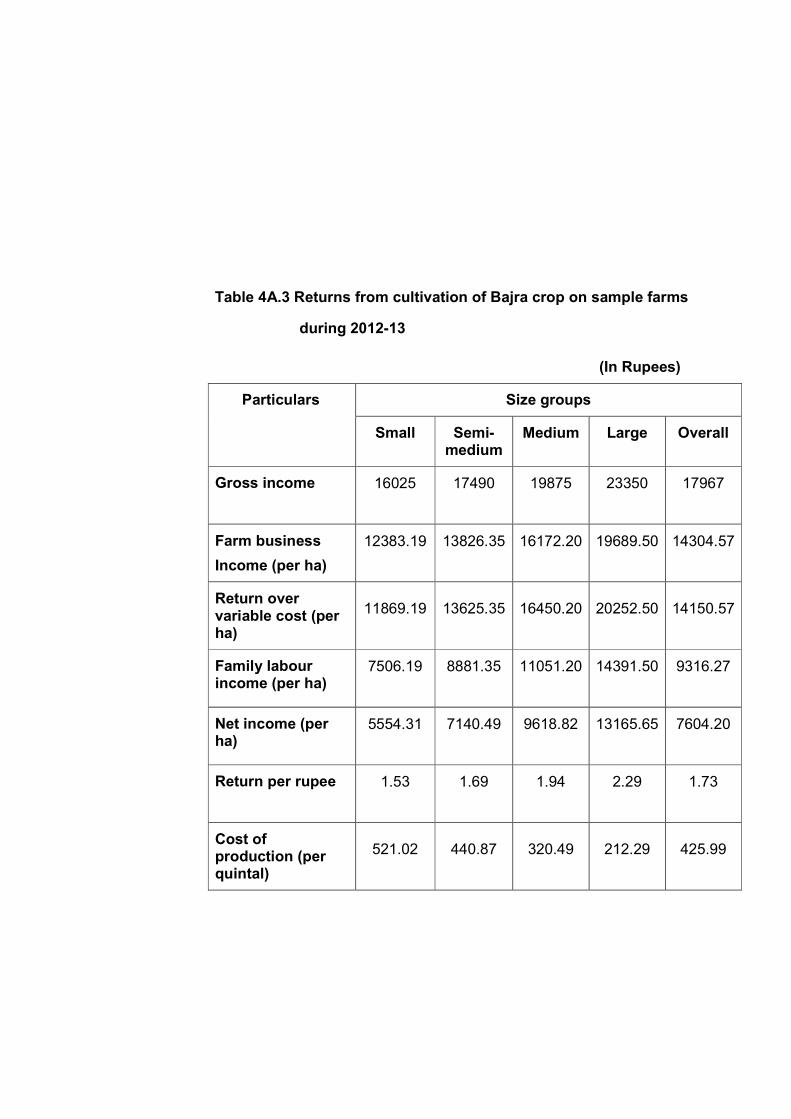
Table 4A.3 Returns from cultivation of Bajra crop on sample farms
during 2012-13
(In Rupees)
Particulars Size groups
Small Semi-medium
Medium Large Overall
Gross income 16025
17490
19875
23350
17967
Farm business
Income (per ha)
12383.19
13826.35
16172.20
19689.50
14304.57
Return over variable cost (per ha)
11869.19
13625.35
16450.20
20252.50
14150.57
Family labour income (per ha)
7506.19
8881.35
11051.20
14391.50
9316.27
Net income (per ha)
5554.31
7140.49
9618.82
13165.65
7604.20
Return per rupee 1.53
1.69
1.94
2.29
1.73
Cost of production (per quintal)
521.02
440.87
320.49
212.29
425.99
The overall return over variable cost per hectare of bajra
cultivation was ` 14150.57. Among different size groups of farms it was `
1186919, 13625.35, 16450.20 and 20252.50, respectively on small,
semi-medium, medium and large size farms.
The family labour income per hectare of bajra cultivation varied
from `7506.19 on small farms to ` 14391.50 on large sized farms .The
overall family labour income was worked out to be ` 9316.27 per
hectare. The family labour income per hectare increased with the
increase in the size of holding.
Net income is the pure profit per hectare of crop. This measure
was computed by deducting cost C3 (total cost) from the gross income.
The overall net income was ` 7604.20 per hectare. The net income was `
5554.31 per hectare on small size group and ` 13165.65 per hectare on
large size group. Thus, net income derived from the cultivation of bajra
increased with the increase in size of holdings.
The return per rupee was ` 1.53, 1.69, 1.94 and 2.29 on small,
semi-medium, medium and large sized groups of the farms, respectively.
On an average, return per rupee was ` 1.73. Thus return per rupee was
found to increase with the increase in the size of holdings. As per this
criterion, bajra cultivation on the sample farms of the study area was
found to be quite profitable crop enterprise.
It is revealed from the forgoing discussion that the per hectare
cost of production per quintal of bajra varied from ` 212.29 on large sized
farms to ` 521.02 on small sized farms with an overall average of `
425.99.
Human labour was important component of the operational cost
as it ranged from 6.24 to 18.79 per cent share in Overall total cost on
different sized farms was of 14.35 per cent and Overall cost A1, A2, B1,
B2, C1, and C2 were ` 3662.43, 3662.43, 4150.73, 8650.73, 4920.73 and
9420.73, per hectare, respectively.
All the costs except B2 were inversely related with the size of
holdings. The Overall production of bajra was ` 425.99 per quintal. It
ranged from ` 212.29 per quintal on large sized farms to ` 521.02 per
quintal on small sized farms. The cost of production per quintal was
found to decrease with the increase in size of farms.
The net income per hectare of bajra crop ranged from ` 5554.31
to ` 13165.65 on different sized farms. The highest returns were
obtained on large sized farms.
The return per rupee from bajra cultivation was highest (Rs 2.29)
on large sized farms and lowest on small sized farms (` 1.53) with an
average of ` 1.73. Thus bajra cultivation was found to be profitable crop
enterprise in the study area.
Section-B
Marketing of Bajra
Production of an agricultural commodity is complete only when it
reaches to the hands of those who need it, i.e., the consumers. All the
commodities may not be produced in all the areas, because of variation
in agro-climatic conditions. Hence, need arises due to for their
movement from producers to ultimate consumers. Here, an attempt
has been made to analyze the marketing channels and to estimate the
costs and margins and prices received by the various marketing
agencies and farmers involved in the marketing of bajra in the study
area.
4B.1 Marketing channels
A marketing channel is a route through which produce moves
from the producers to the ultimate consumers. The length of the channel
varies from commodity to commodity depending on the quantity of the
produce to be moved, the form of consumer demand and the degree of
regional specialization in the production. In the study area, farmers of
bajra were observed to adopt the only following channel in marketing of
bajra:
Channel-I Producer Village trader Wholesaler Retailer
Channel-II Producer Wholesaler- Retailer
Channel-III Producer Consumer
4B.2 Marketing costs
Following kinds of marketing costs were incurred by different
agencies including producer farmers engaged in the marketing of
barley in the study area:
(i) Transportation charges:
The cost of transportation was one of the major components of
the marketing costs. This cost varies with the distance between
producing point and selling point. In case of channel I (Table 4B.1),
they sold their produce to village traders at their shop who transported
it to the mandi for sale through the channel-I (i.e., producer village
trader wholesaler retailer). In this channel-I producer farmers and
village traders incurred on an average ` 8.56 and ` 15.23 per quintal on
transportation, respectively. In channel-II (i.e., producer wholesaler
retailer) the producer farmers incurred on an average ` 19.25 per
quintal brought the produce to the Krishi Upaj Mandi Chomu and
Renewal. Wholesalers and retailers the incurred on an average ` 13.58
and ` 8.90 per quintal as transportation charges, respectively. In
channel-III (i.e., producer consumer) the producer farmers sold their
produce to consumer at farm itself and the consumer incurred on
transportation charges on an average ` 33.63 per quintal.
(ii) Loading and unloading charges:
It is the payment made to the laboures for rendering services of
loading & unloading of produce. In case of channel I and II the average
loading charges paid by the village traders, wholesalers and retailers
were ` 5.00 per quintal. On an average unloading charges paid by
producer farmers, village traders, wholesalers and retailers were ` 3.75
per quintal each. Weighing charges were paid @ ` 2.5 per quintal.
(iii) Mandi fee:
It was collected by the Krishi Upaj Mandi Samiti for rendering
various services in the mandi area. The rate of mandi fee was ` 0.50
per ` 100 worth of produce and this cost was borne by the buyer.
(vi Commission charges:
In case of channel I and II commission charges were realized by
the commission agent at the rate of 2.0 per cent of the value of bajra
from the buyer of the produce.
Table: 4B.1 Marketing Charges in Sale of Bajra at Chomu and
Renewal Mandi
S.No. Particulars Unit Rate (Rs.)
Buyer by
1 Mandi fee Per 100
rupees worth of produce
0.50 Buyer
2 Commission Per 100 rupees worth of produce
2 Buyer
3 Labour charges for (a) cleaning and
filling of bags prior to sale
Per quintal 5.0 Seller
(b) Loading Per quintal 5.0 Buyer (c) Unloading Per quintal 3.75 Buyer (d) Weighing Per quintal 2.5 Buyer
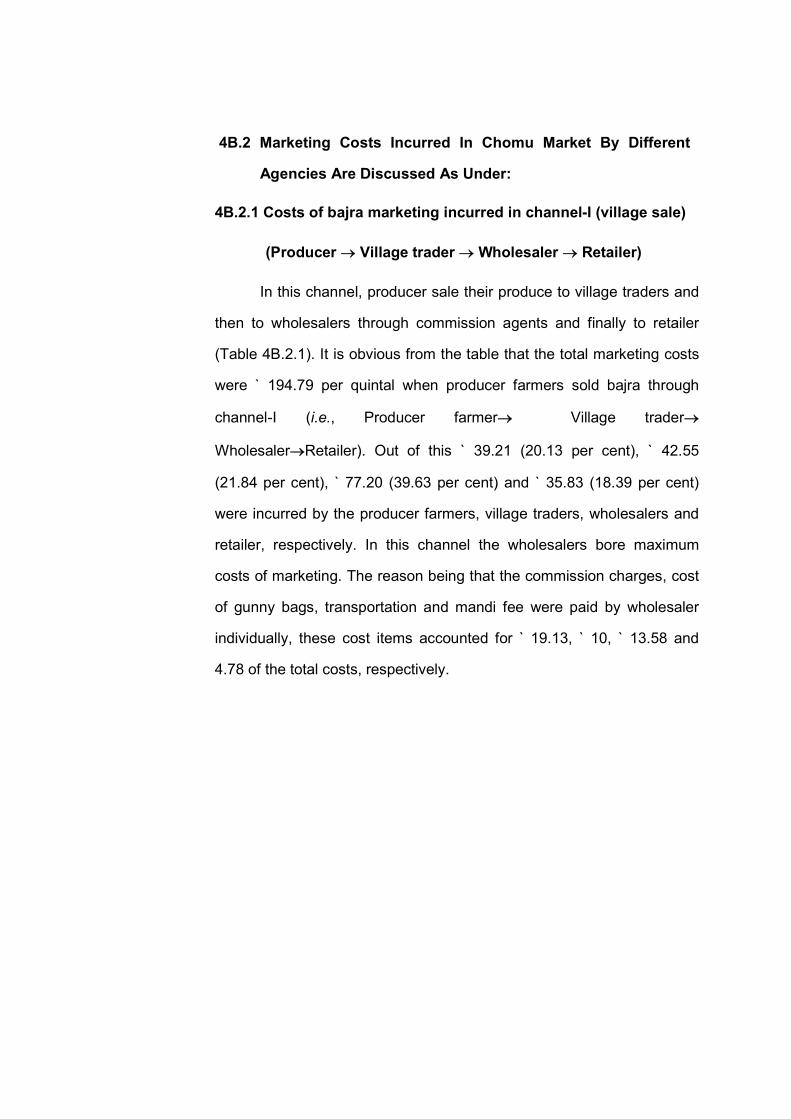
4B.2 Marketing Costs Incurred In Chomu Market By Different
Agencies Are Discussed As Under:
4B.2.1 Costs of bajra marketing incurred in channel-I (village sale)
(Producer Village trader Wholesaler Retailer)
In this channel, producer sale their produce to village traders and
then to wholesalers through commission agents and finally to retailer
(Table 4B.2.1). It is obvious from the table that the total marketing costs
were ` 194.79 per quintal when producer farmers sold bajra through
channel-I (i.e., Producer farmer Village trader
WholesalerRetailer). Out of this ` 39.21 (20.13 per cent), ` 42.55
(21.84 per cent), ` 77.20 (39.63 per cent) and ` 35.83 (18.39 per cent)
were incurred by the producer farmers, village traders, wholesalers and
retailer, respectively. In this channel the wholesalers bore maximum
costs of marketing. The reason being that the commission charges, cost
of gunny bags, transportation and mandi fee were paid by wholesaler
individually, these cost items accounted for ` 19.13, ` 10, ` 13.58 and
4.78 of the total costs, respectively.
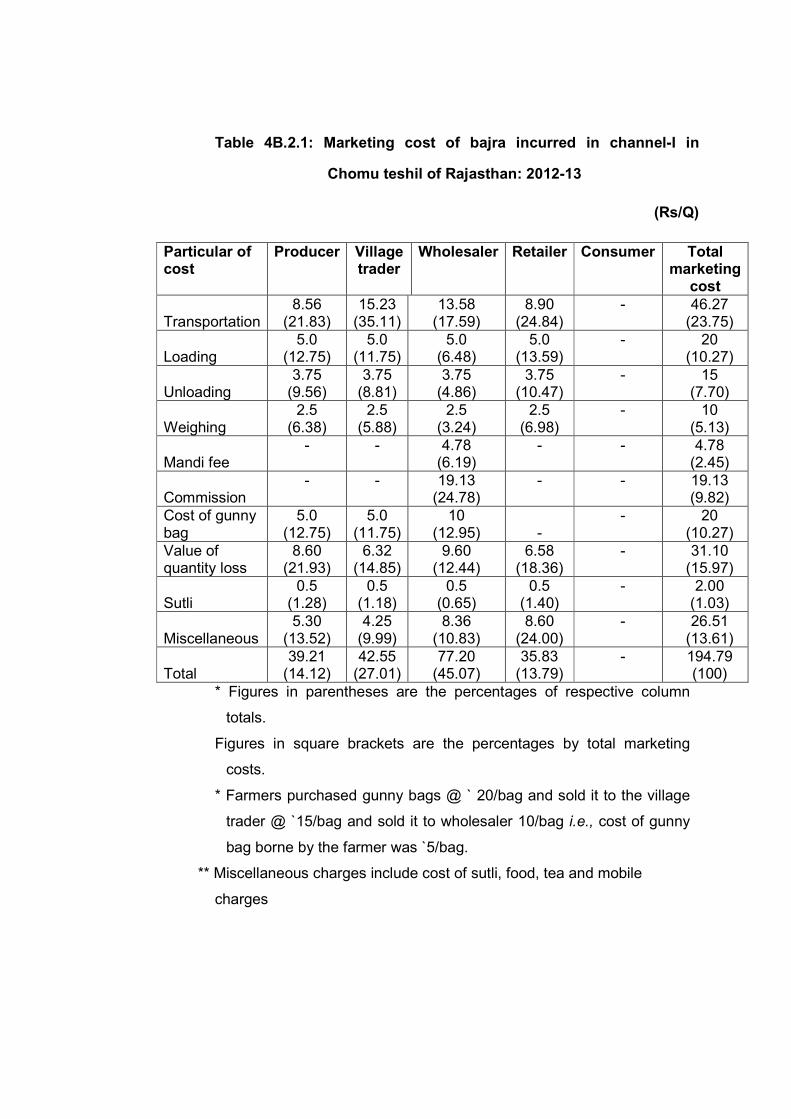
Table 4B.2.1: Marketing cost of bajra incurred in channel-I in
Chomu teshil of Rajasthan: 2012-13
(Rs/Q)
Particular of cost
Producer Village trader
Wholesaler Retailer Consumer Total marketing
cost
Transportation 8.56
(21.83) 15.23
(35.11) 13.58
(17.59) 8.90
(24.84) - 46.27
(23.75)
Loading 5.0
(12.75) 5.0
(11.75) 5.0
(6.48) 5.0
(13.59) - 20
(10.27)
Unloading 3.75
(9.56) 3.75
(8.81) 3.75
(4.86) 3.75
(10.47) - 15
(7.70)
Weighing 2.5
(6.38) 2.5
(5.88) 2.5
(3.24) 2.5
(6.98) - 10
(5.13)
Mandi fee - - 4.78
(6.19) - - 4.78
(2.45)
Commission - - 19.13
(24.78) - - 19.13
(9.82) Cost of gunny bag
5.0 (12.75)
5.0 (11.75)
10 (12.95)
-
- 20 (10.27)
Value of quantity loss
8.60 (21.93)
6.32 (14.85)
9.60 (12.44)
6.58 (18.36)
- 31.10 (15.97)
Sutli 0.5
(1.28) 0.5
(1.18) 0.5
(0.65) 0.5
(1.40) - 2.00
(1.03)
Miscellaneous 5.30
(13.52) 4.25
(9.99) 8.36
(10.83) 8.60
(24.00) - 26.51
(13.61)
Total 39.21
(14.12) 42.55
(27.01) 77.20
(45.07) 35.83
(13.79) - 194.79
(100) * Figures in parentheses are the percentages of respective column
totals.
Figures in square brackets are the percentages by total marketing
costs.
* Farmers purchased gunny bags @ ` 20/bag and sold it to the village
trader @ `15/bag and sold it to wholesaler 10/bag i.e., cost of gunny
bag borne by the farmer was `5/bag.
** Miscellaneous charges include cost of sutli, food, tea and mobile
charges
4B.2.2 Costs of bajra marketing incurred in channel-II (Mandi sale)
(Producer Wholesaler- Retailer)
This channel was the most common marketing channel adopted
by farmers in the study area. In this channel, producer farmers sold bajra
through the wholesalers of the mandi. Finally, these wholesalers stored
bajra for sale to the retailer at some later date. It was the most common
method of sale for bajra in the study area. In this channel, the producer
farmers took the produce to the Krishi Upaj Mandi Chomu and sold it to
the wholesalers through commission agents. The wholesalers sold it to
the retailer. The marketing cost incurred in movement of the produce
through this channel is presented in table 4B.2.2. Average marketing
cost was estimated at ` 164.39 per quintal when the producer farmer
sold bajra in the mandi through this channel. Out of this, ` 51.36, ` 77.20
and `35.83 were incurred by the producer farmer, wholesaler and
retailer, respectively which accounted for 31.21,46.96 and 21.80per cent
of the total costs of marketing of bajra in that order. Transportation
charges, value of quantity lost, miscellaneous charges, cost of gunny
bag and commission charges were the main items of cost for marketing
of bajra which, together accounted for 82.49 per cent of the total costs of
marketing. These cost items individually accounted for 25.38, 13.37,
13.09, 12.17 and 11.64 per cent, respectively.
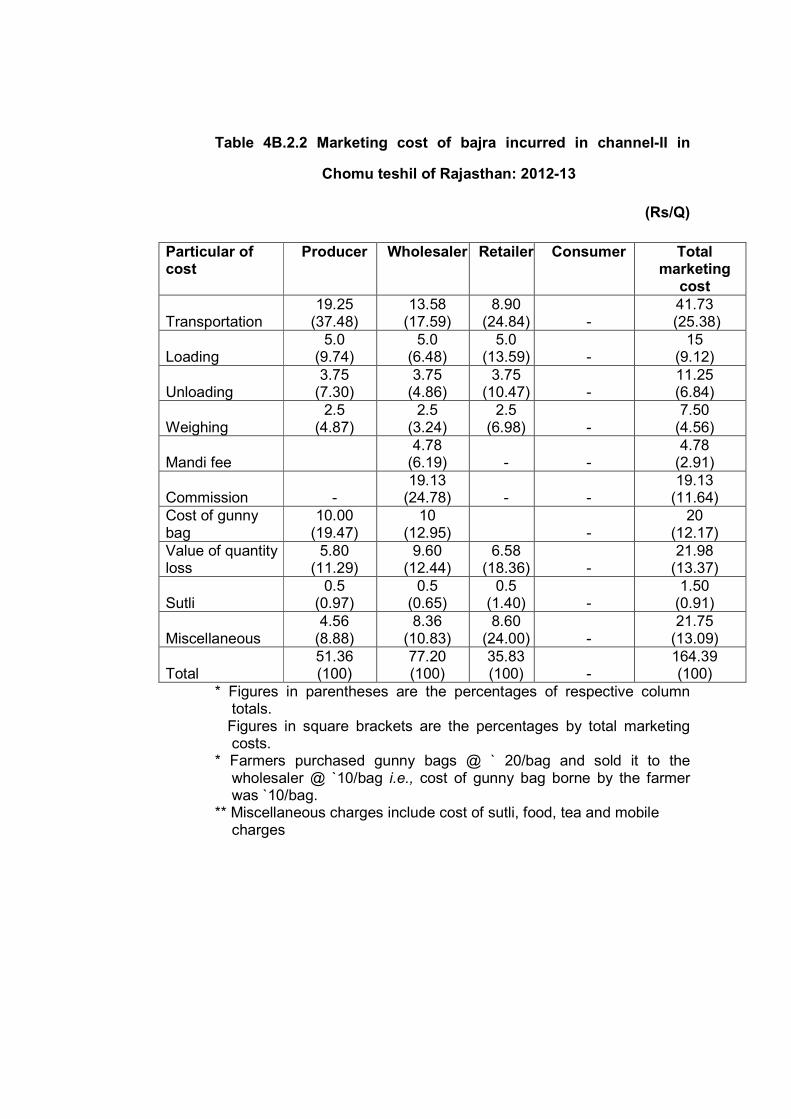
Table 4B.2.2 Marketing cost of bajra incurred in channel-II in
Chomu teshil of Rajasthan: 2012-13
(Rs/Q)
Particular of cost
Producer Wholesaler Retailer Consumer Total marketing
cost
Transportation 19.25
(37.48) 13.58
(17.59) 8.90
(24.84) - 41.73
(25.38)
Loading 5.0
(9.74) 5.0
(6.48) 5.0
(13.59) - 15
(9.12)
Unloading 3.75
(7.30) 3.75
(4.86) 3.75
(10.47) - 11.25 (6.84)
Weighing 2.5
(4.87) 2.5
(3.24) 2.5
(6.98) - 7.50
(4.56)
Mandi fee 4.78
(6.19) - - 4.78
(2.91)
Commission - 19.13
(24.78) - - 19.13
(11.64) Cost of gunny bag
10.00 (19.47)
10 (12.95)
-
20 (12.17)
Value of quantity loss
5.80 (11.29)
9.60 (12.44)
6.58 (18.36) -
21.98 (13.37)
Sutli 0.5
(0.97) 0.5
(0.65) 0.5
(1.40) - 1.50
(0.91)
Miscellaneous 4.56
(8.88) 8.36
(10.83) 8.60
(24.00) - 21.75
(13.09)
Total 51.36 (100)
77.20 (100)
35.83 (100) -
164.39 (100)
* Figures in parentheses are the percentages of respective column totals.
Figures in square brackets are the percentages by total marketing costs.
* Farmers purchased gunny bags @ ` 20/bag and sold it to the wholesaler @ `10/bag i.e., cost of gunny bag borne by the farmer was `10/bag.
** Miscellaneous charges include cost of sutli, food, tea and mobile charges
4B.2.3 Costs of bajra marketing incurred in channel-III (Producer
Consumer)
In this channel barley moved from producer farmer to consumer
directly and no marketing costs were borne by producer farmer itself.
4B.3 Marketing costs, margins and price spread
Price spread refers to the difference between the price paid by
the final consumer and the price received by the producer farmer for an
equivalent quantity of farm produce. It is often known as farm retail
spread or price spread. It includes the costs incurred in moving the
produce from the point of production to the point of consumption and
profits realized in that process by different market functionaries
involved in the marketing of the product. The overall efficiency of
marketing system is judged by the extent of price spread. Price spread
in bajra in both the marketing channels is discussed below:
4B.3.1 Price spread in marketing of bajra in channel-I (Producer
Village Trader Wholesaler Retailer)
The price spread in marketing of bajra by the producer farmer at
village level to the village trader and then to the wholesaler and retailer
are presented in Table 4B.3.1. The producer's net share in consumers
rupee in the sale of bajra through the channel-I was ` 822.00 (66.66 per
cent). In this channel the village traders purchased bajra from the
producer-farmers at their own shop on an average price of ` 861.21 per
quintal. The village traders took it to the Krishi Upaj Mandi Chomu and
sold to the wholesaler through the commission agents at on average
price of ` 956.42 per quintal. In this channel of sale the producer farmers
and the village traders incurred on an average ` 39.21and ` 42.55 per
quintal as expenses, respectively. The village traders got a net margin of
` 52.66 per quintal. This accounted for 4.27 per cent of the consumer’s
price. Wholesalers purchased bajra at an average price of ` 956.42 per
quintal and sold it to the retailer at ` 1101.88 per quintals. The margin of
wholesalers in this process was ` 68.26 per quintal of bajra. Retailer
purchased bajra at an average price of ` 1101.88 per quintal and sold it
to the consumer at ` 1233.18 per quintals. The margin of retailer in this
process was ` 95.47 per quintal. Among the three market functionaries
present in channel-I retailers got the maximum margin due to sale of
bajra at high prices to the consumers in small quantity. The total
marketing costs incurred by various intermediaries constituted 15.80 per
cent of the consumer’s price. The price spread in this channel was `
411.18. Small producer farmers preferred to sell bajra in village to the
village traders because of their poor economic condition as well as small
quantity of produce available with them.
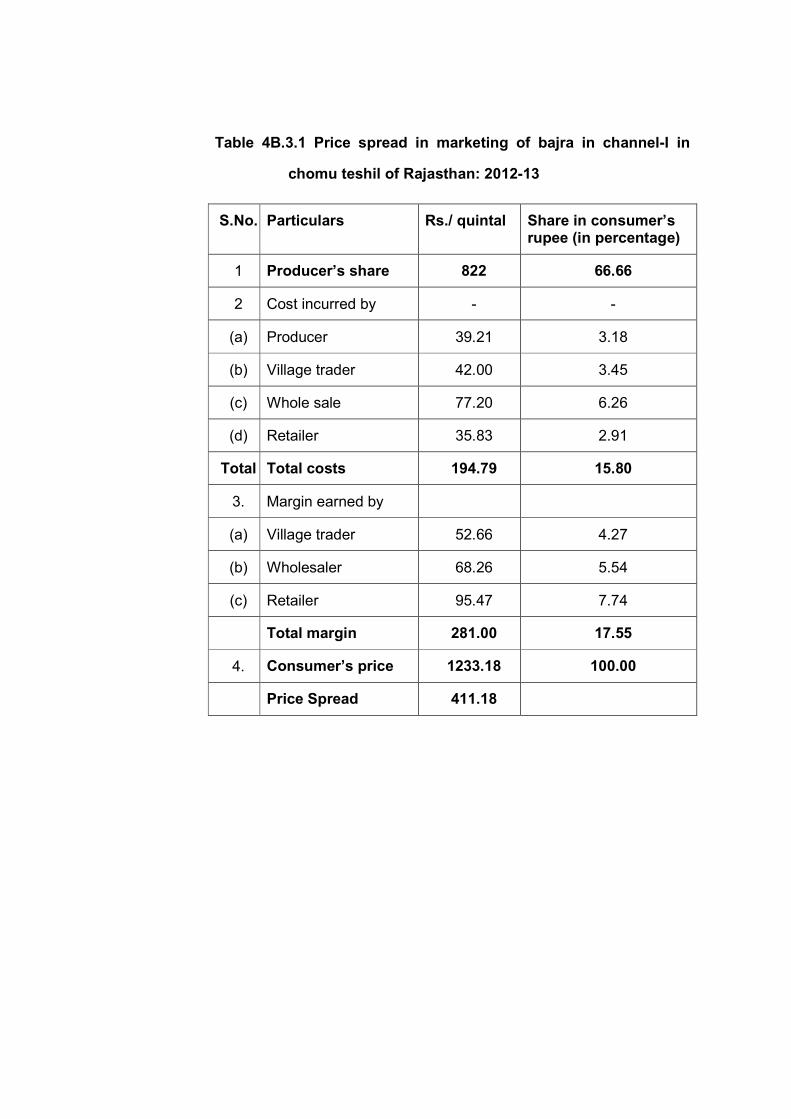
Table 4B.3.1 Price spread in marketing of bajra in channel-I in
chomu teshil of Rajasthan: 2012-13
S.No. Particulars Rs./ quintal Share in consumer’s rupee (in percentage)
1 Producer’s share 822 66.66
2 Cost incurred by - -
(a) Producer 39.21 3.18
(b) Village trader 42.00 3.45
(c) Whole sale 77.20 6.26
(d) Retailer 35.83 2.91
Total Total costs 194.79 15.80
3. Margin earned by
(a) Village trader 52.66 4.27
(b) Wholesaler 68.26 5.54
(c) Retailer 95.47 7.74
Total margin 281.00 17.55
4. Consumer’s price 1233.18 100.00
Price Spread 411.18
4B.3.2 Price spread in marketing of bajra in channel-II (Producer
Wholesaler Retailer)
The price spread in marketing of bajra in channel-II is presented
in Table 4B.3.2. In this channel; producer-farmers directly sold the
produce in the Chomu mandi to the wholesalers through commission
agents. The producer's net share in consumers rupee in the sale of
bajra through the channel-II was ` 905.06 (73.39 per cent). The
producer farmer cost incurred by the producer farmer was on an
average ` 51.36 per quintal of bajra before selling it to the wholesaler
at an average price of ` 956.42 per quintal. In this channel the
producer farmers and the wholesaler incurred on an average `51.36
and ` 77.20 per quintal as expenses, respectively. The wholesaler got
a net margin of ` 68.26 per quintal. This accounted for 5.54 per cent of
the consumer’s price. Retailer purchased bajra at an average price of `
1101.88 per quintal and sold it to the consumers at ` 1233.18 per
quintals. The margin of retailer in this process was ` 95.47 per quintal.
Among the two market functionaries present in channel-II retailers got
the maximum margin by the sale of bajra at high prices to the
consumers in small quantity. The total marketing costs incurred by
various intermediaries constituted 13.33 per cent of the consumer’s
price. The price spread in this channel was ` 328.12.
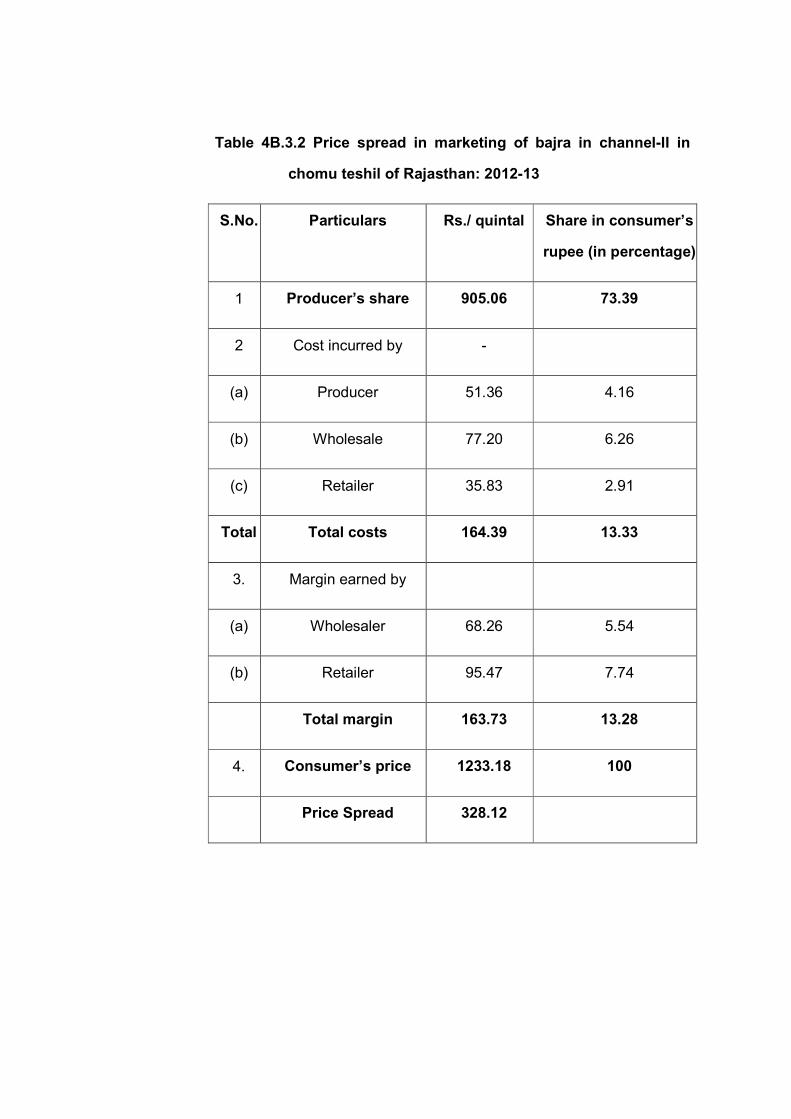
Table 4B.3.2 Price spread in marketing of bajra in channel-II in
chomu teshil of Rajasthan: 2012-13
S.No. Particulars Rs./ quintal Share in consumer’s
rupee (in percentage)
1 Producer’s share 905.06 73.39
2 Cost incurred by -
(a) Producer 51.36 4.16
(b) Wholesale 77.20 6.26
(c) Retailer 35.83 2.91
Total Total costs 164.39 13.33
3. Margin earned by
(a) Wholesaler 68.26 5.54
(b) Retailer 95.47 7.74
Total margin 163.73 13.28
4. Consumer’s price 1233.18 100
Price Spread 328.12
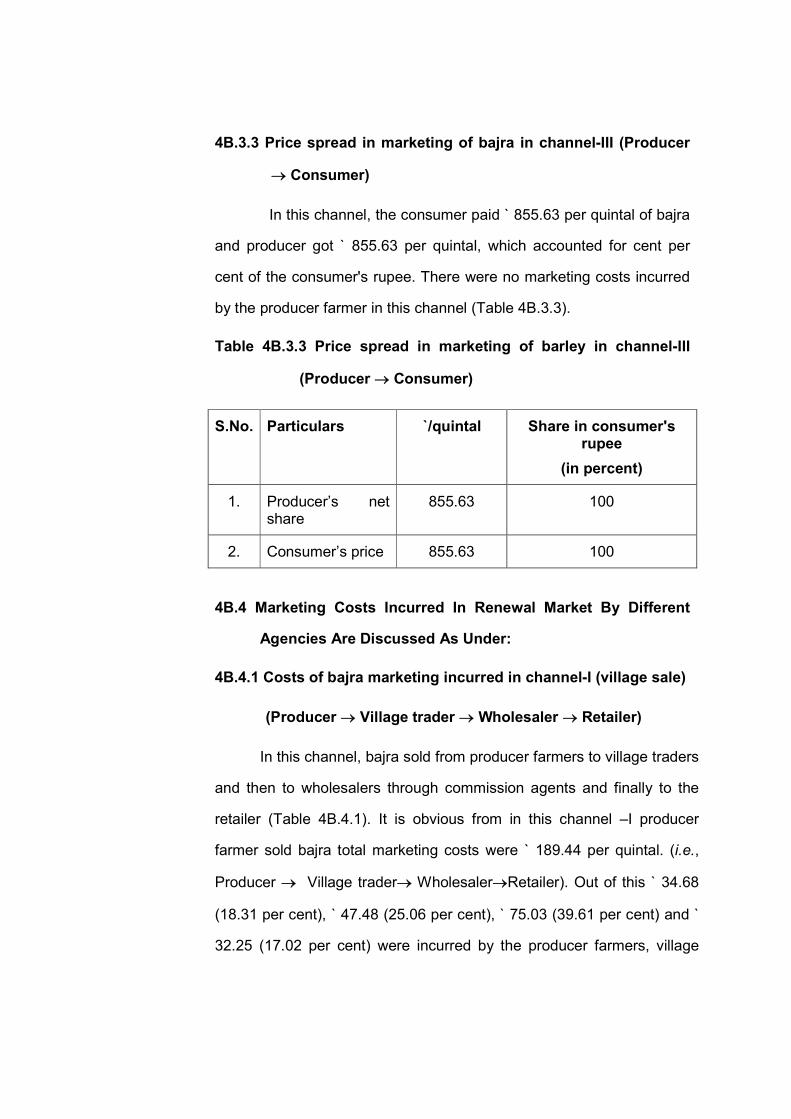
4B.3.3 Price spread in marketing of bajra in channel-III (Producer
Consumer)
In this channel, the consumer paid ` 855.63 per quintal of bajra
and producer got ` 855.63 per quintal, which accounted for cent per
cent of the consumer's rupee. There were no marketing costs incurred
by the producer farmer in this channel (Table 4B.3.3).
Table 4B.3.3 Price spread in marketing of barley in channel-III
(Producer Consumer)
S.No. Particulars `/quintal Share in consumer's rupee
(in percent)
1. Producer’s net share
855.63 100
2. Consumer’s price 855.63 100
4B.4 Marketing Costs Incurred In Renewal Market By Different
Agencies Are Discussed As Under:
4B.4.1 Costs of bajra marketing incurred in channel-I (village sale)
(Producer Village trader Wholesaler Retailer)
In this channel, bajra sold from producer farmers to village traders
and then to wholesalers through commission agents and finally to the
retailer (Table 4B.4.1). It is obvious from in this channel –I producer
farmer sold bajra total marketing costs were ` 189.44 per quintal. (i.e.,
Producer Village trader WholesalerRetailer). Out of this ` 34.68
(18.31 per cent), ` 47.48 (25.06 per cent), ` 75.03 (39.61 per cent) and `
32.25 (17.02 per cent) were incurred by the producer farmers, village
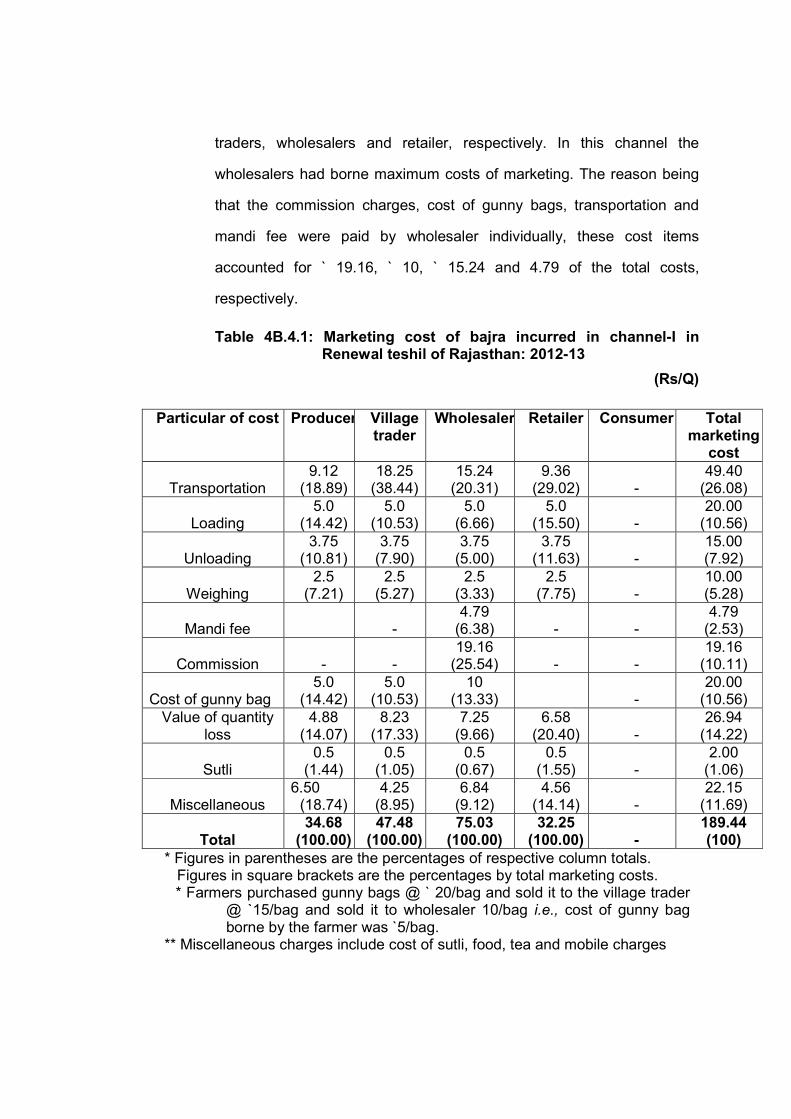
traders, wholesalers and retailer, respectively. In this channel the
wholesalers had borne maximum costs of marketing. The reason being
that the commission charges, cost of gunny bags, transportation and
mandi fee were paid by wholesaler individually, these cost items
accounted for ` 19.16, ` 10, ` 15.24 and 4.79 of the total costs,
respectively.
Table 4B.4.1: Marketing cost of bajra incurred in channel-I in Renewal teshil of Rajasthan: 2012-13
(Rs/Q)
Particular of cost Producer Village trader
Wholesaler Retailer Consumer Total marketing
cost
Transportation 9.12
(18.89) 18.25
(38.44) 15.24
(20.31) 9.36
(29.02) - 49.40
(26.08)
Loading 5.0
(14.42) 5.0
(10.53) 5.0
(6.66) 5.0
(15.50) - 20.00
(10.56)
Unloading 3.75
(10.81) 3.75
(7.90) 3.75
(5.00) 3.75
(11.63) - 15.00 (7.92)
Weighing 2.5
(7.21) 2.5
(5.27) 2.5
(3.33) 2.5
(7.75) - 10.00 (5.28)
Mandi fee - 4.79
(6.38) - - 4.79
(2.53)
Commission - - 19.16
(25.54) - - 19.16
(10.11)
Cost of gunny bag 5.0
(14.42) 5.0
(10.53) 10
(13.33) -
20.00 (10.56)
Value of quantity loss
4.88 (14.07)
8.23 (17.33)
7.25 (9.66)
6.58 (20.40) -
26.94 (14.22)
Sutli 0.5
(1.44) 0.5
(1.05) 0.5
(0.67) 0.5
(1.55) - 2.00
(1.06)
Miscellaneous 6.50
(18.74) 4.25
(8.95) 6.84
(9.12) 4.56
(14.14) - 22.15
(11.69)
Total 34.68
(100.00) 47.48
(100.00) 75.03
(100.00) 32.25
(100.00) - 189.44 (100)
* Figures in parentheses are the percentages of respective column totals. Figures in square brackets are the percentages by total marketing costs.
* Farmers purchased gunny bags @ ` 20/bag and sold it to the village trader @ `15/bag and sold it to wholesaler 10/bag i.e., cost of gunny bag borne by the farmer was `5/bag.
** Miscellaneous charges include cost of sutli, food, tea and mobile charges
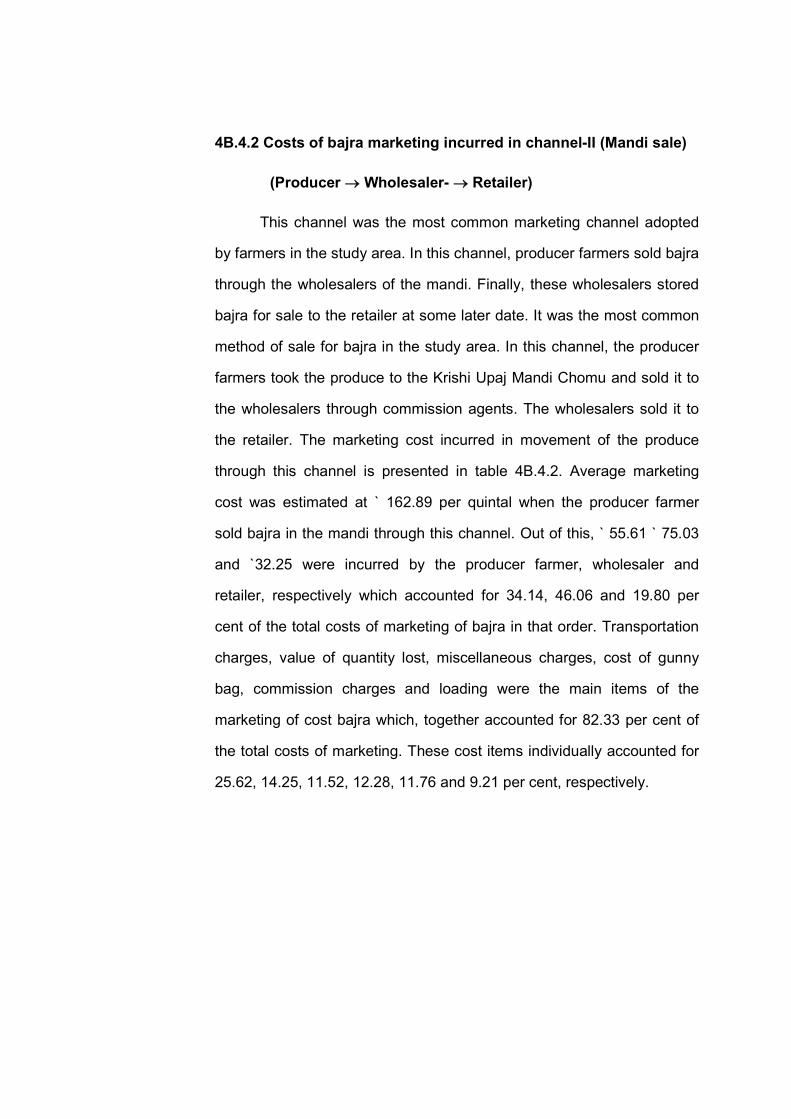
4B.4.2 Costs of bajra marketing incurred in channel-II (Mandi sale)
(Producer Wholesaler- Retailer)
This channel was the most common marketing channel adopted
by farmers in the study area. In this channel, producer farmers sold bajra
through the wholesalers of the mandi. Finally, these wholesalers stored
bajra for sale to the retailer at some later date. It was the most common
method of sale for bajra in the study area. In this channel, the producer
farmers took the produce to the Krishi Upaj Mandi Chomu and sold it to
the wholesalers through commission agents. The wholesalers sold it to
the retailer. The marketing cost incurred in movement of the produce
through this channel is presented in table 4B.4.2. Average marketing
cost was estimated at ` 162.89 per quintal when the producer farmer
sold bajra in the mandi through this channel. Out of this, ` 55.61 ` 75.03
and `32.25 were incurred by the producer farmer, wholesaler and
retailer, respectively which accounted for 34.14, 46.06 and 19.80 per
cent of the total costs of marketing of bajra in that order. Transportation
charges, value of quantity lost, miscellaneous charges, cost of gunny
bag, commission charges and loading were the main items of the
marketing of cost bajra which, together accounted for 82.33 per cent of
the total costs of marketing. These cost items individually accounted for
25.62, 14.25, 11.52, 12.28, 11.76 and 9.21 per cent, respectively.
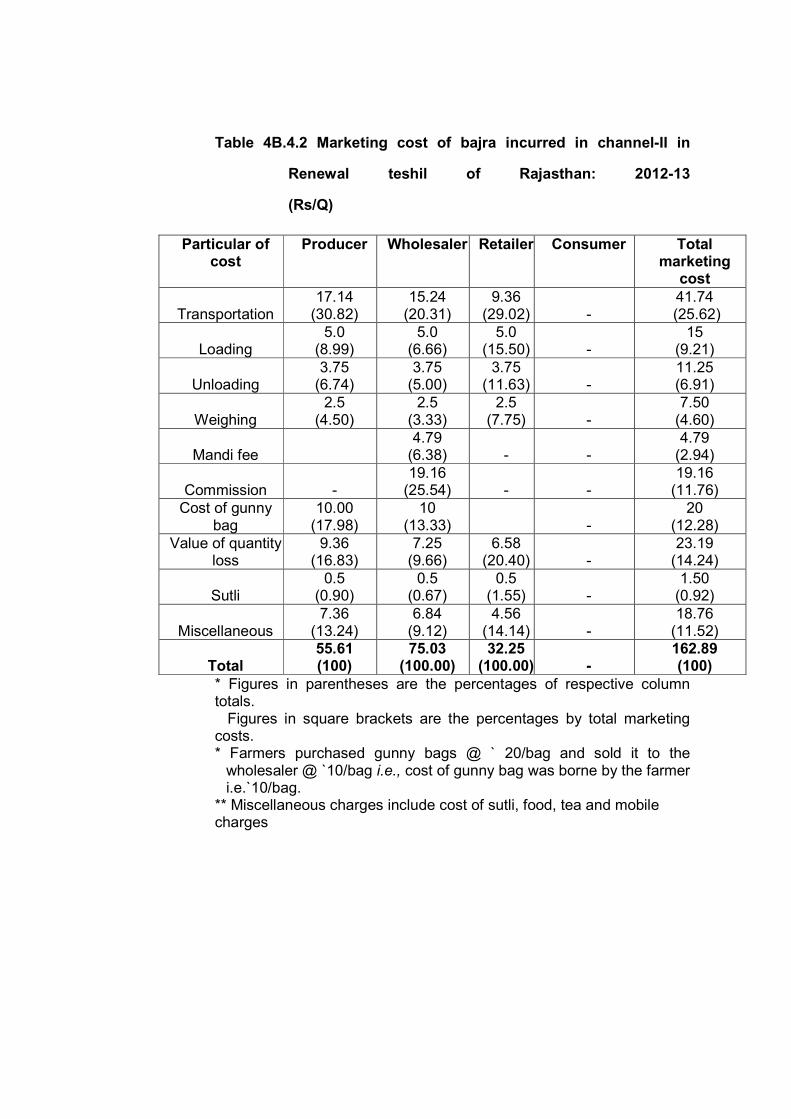
Table 4B.4.2 Marketing cost of bajra incurred in channel-II in
Renewal teshil of Rajasthan: 2012-13
(Rs/Q)
Particular of cost
Producer Wholesaler Retailer Consumer Total marketing
cost
Transportation 17.14
(30.82) 15.24
(20.31) 9.36
(29.02) - 41.74
(25.62)
Loading 5.0
(8.99) 5.0
(6.66) 5.0
(15.50) - 15
(9.21)
Unloading 3.75
(6.74) 3.75
(5.00) 3.75
(11.63) - 11.25 (6.91)
Weighing 2.5
(4.50) 2.5
(3.33) 2.5
(7.75) - 7.50
(4.60)
Mandi fee 4.79
(6.38) - - 4.79
(2.94)
Commission - 19.16
(25.54) - - 19.16
(11.76) Cost of gunny
bag 10.00
(17.98) 10
(13.33) -
20 (12.28)
Value of quantity loss
9.36 (16.83)
7.25 (9.66)
6.58 (20.40) -
23.19 (14.24)
Sutli 0.5
(0.90) 0.5
(0.67) 0.5
(1.55) - 1.50
(0.92)
Miscellaneous 7.36
(13.24) 6.84
(9.12) 4.56
(14.14) - 18.76
(11.52)
Total 55.61 (100)
75.03 (100.00)
32.25 (100.00) -
162.89 (100)
* Figures in parentheses are the percentages of respective column totals. Figures in square brackets are the percentages by total marketing costs. * Farmers purchased gunny bags @ ` 20/bag and sold it to the
wholesaler @ `10/bag i.e., cost of gunny bag was borne by the farmer i.e.`10/bag.
** Miscellaneous charges include cost of sutli, food, tea and mobile charges
4B.4.3 Costs of bajra marketing incurred in channel-III (Producer
Consumer)
In this channel barley moved from producer farmer to consumer
directly and no marketing costs were borne by producer farmer itself.
4B.5 Marketing costs, margins and price spread
Price spread refers to the difference between the price paid by
the final consumer and the price received by the producer farmer for an
equivalent quantity of farm produce. It is often known as farm retail
spread or price spread. It includes the costs incurred in moving the
produce from the point of production to the point of consumption and
profits realised in that process by different market functionaries
involved in the marketing of the product. The overall efficiency of
marketing system is judged by the extent of price spread. Price spread
in bajra in both the marketing channels is discussed below:
4B.5.1 Price spread in marketing of bajra in channel-I (Producer
Village Trader Wholesaler Retailer)
The price spread in marketing of bajra by the producer farmer at
village level to the village trader and then to the wholesaler and retailer
are presented in Table 4B.5.1. The producer's net share in consumers
rupee in the sale of bajra through the channel-I was ` 812 (64.47 per
cent). In this channel the village traders purchased bajra from the
producer-farmers at their own shop on an average price of ` 846.91 per
quintal. The village traders took it to the Krishi Upaj Mandi Renwal and
sold to the wholesaler through the commission agents at on average
price of ` 957.84 per quintal. In this channel of sale the producer farmers
and the village traders incurred on an average ` 34.68 and ` 47.48 per
quintal as expenses, respectively. The village traders got a net margin of
` 63.45 per quintal. This accounted for 5.04 per cent of the consumer’s
price. Wholesalers purchased bajra at an average price of ` 957.84 per
quintal and sold it to the retailer at ` 1122.32 per quintals. The margin of
wholesalers in this process was ` 89.45 per quintal of bajra. Retailer
purchased bajra at an average price of ` 1122.32 per quintal and sold it
to the consumer at ` 1259.82 per quintals. The margin of retailer in this
process was ` 105.25 per quintal. Among the three market functionaries
present in channel-I retailers got the maximum margin by the sale of
bajra at high prices to the consumers in small quantity. The total
marketing costs incurred by various intermediaries constituted 15.04 per
cent of the consumer’s price. The price spread in this channel was `
447.59. Small producer farmers preferred to sell bajra in village to the
village traders because of their poor economic condition as well as small
quantity of produce available with them.
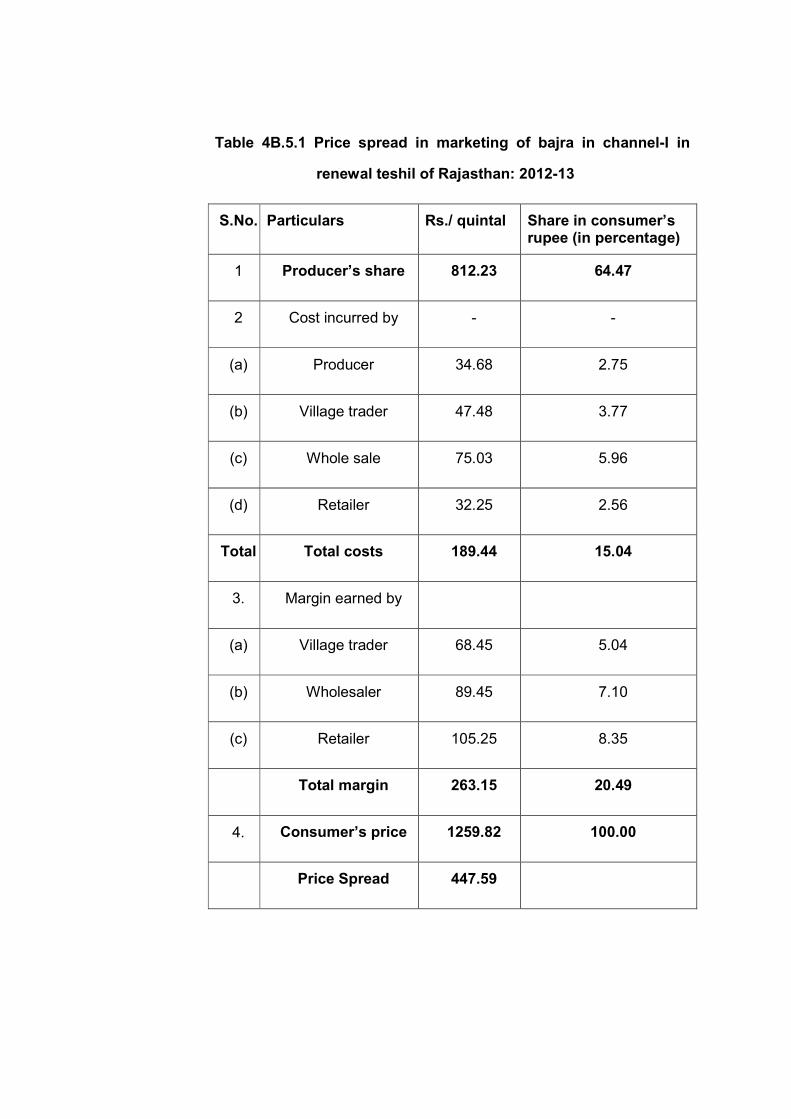
Table 4B.5.1 Price spread in marketing of bajra in channel-I in
renewal teshil of Rajasthan: 2012-13
S.No. Particulars Rs./ quintal Share in consumer’s rupee (in percentage)
1 Producer’s share 812.23 64.47
2 Cost incurred by - -
(a) Producer 34.68 2.75
(b) Village trader 47.48 3.77
(c) Whole sale 75.03 5.96
(d) Retailer 32.25 2.56
Total Total costs 189.44 15.04
3. Margin earned by
(a) Village trader 68.45 5.04
(b) Wholesaler 89.45 7.10
(c) Retailer 105.25 8.35
Total margin 263.15 20.49
4. Consumer’s price 1259.82 100.00
Price Spread 447.59
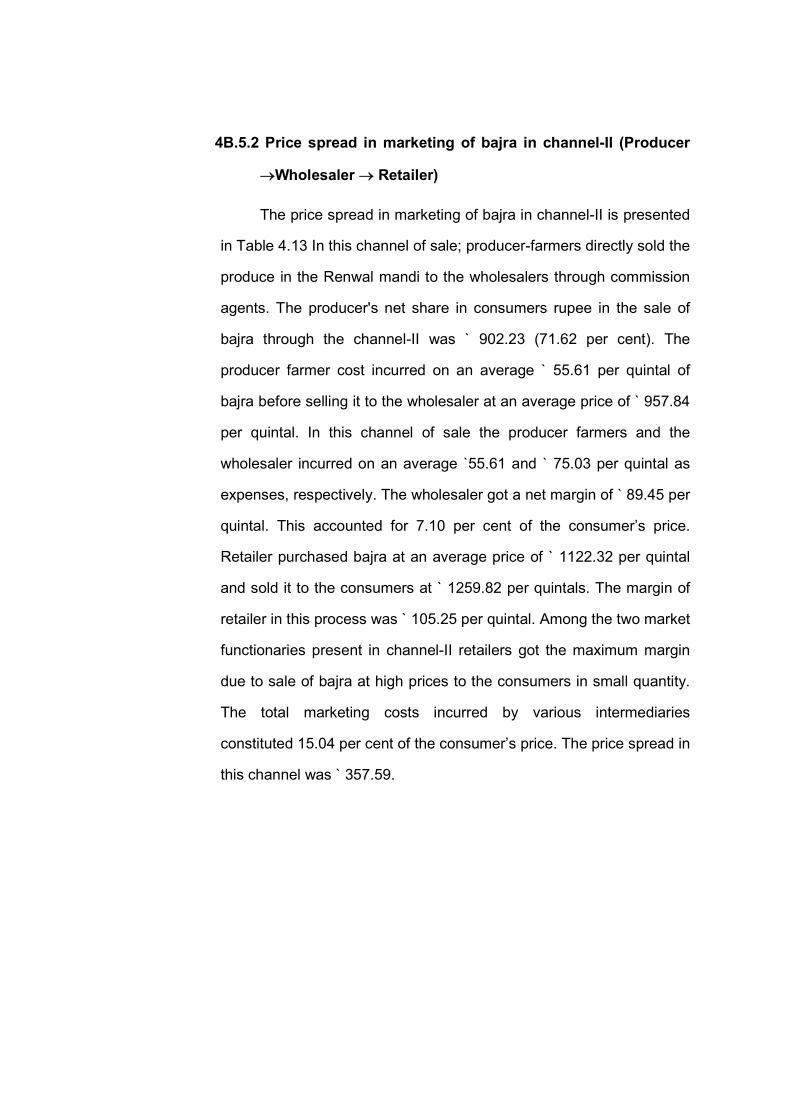
4B.5.2 Price spread in marketing of bajra in channel-II (Producer
Wholesaler Retailer)
The price spread in marketing of bajra in channel-II is presented
in Table 4.13 In this channel of sale; producer-farmers directly sold the
produce in the Renwal mandi to the wholesalers through commission
agents. The producer's net share in consumers rupee in the sale of
bajra through the channel-II was ` 902.23 (71.62 per cent). The
producer farmer cost incurred on an average ` 55.61 per quintal of
bajra before selling it to the wholesaler at an average price of ` 957.84
per quintal. In this channel of sale the producer farmers and the
wholesaler incurred on an average `55.61 and ` 75.03 per quintal as
expenses, respectively. The wholesaler got a net margin of ` 89.45 per
quintal. This accounted for 7.10 per cent of the consumer’s price.
Retailer purchased bajra at an average price of ` 1122.32 per quintal
and sold it to the consumers at ` 1259.82 per quintals. The margin of
retailer in this process was ` 105.25 per quintal. Among the two market
functionaries present in channel-II retailers got the maximum margin
due to sale of bajra at high prices to the consumers in small quantity.
The total marketing costs incurred by various intermediaries
constituted 15.04 per cent of the consumer’s price. The price spread in
this channel was ` 357.59.
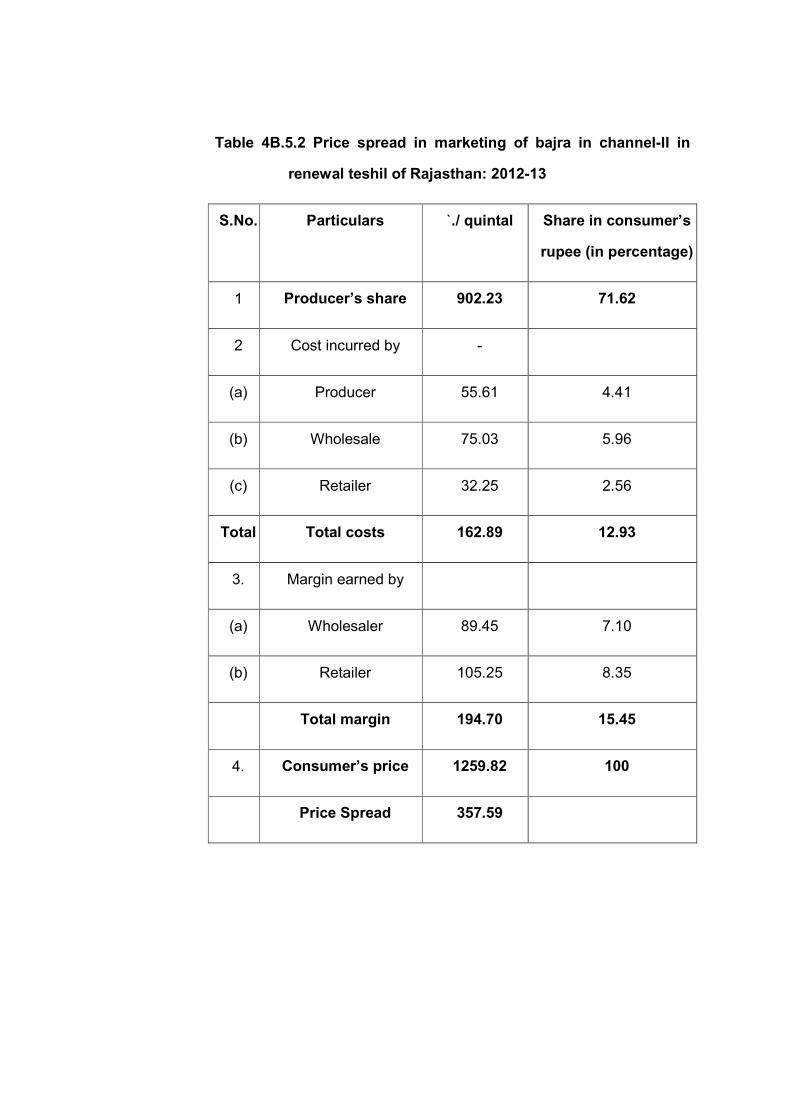
Table 4B.5.2 Price spread in marketing of bajra in channel-II in
renewal teshil of Rajasthan: 2012-13
S.No. Particulars `./ quintal Share in consumer’s
rupee (in percentage)
1 Producer’s share 902.23 71.62
2 Cost incurred by -
(a) Producer 55.61 4.41
(b) Wholesale 75.03 5.96
(c) Retailer 32.25 2.56
Total Total costs 162.89 12.93
3. Margin earned by
(a) Wholesaler 89.45 7.10
(b) Retailer 105.25 8.35
Total margin 194.70 15.45
4. Consumer’s price 1259.82 100
Price Spread 357.59
4B.5.3 Price spread in marketing of bajra in channel-III (Producer
Consumer)
In this channel, the price paied by consumer ` 843.55 per
quintal of bajra and producer got ` 843.55 per quintal, which accounted
for cent per cent of the consumer's rupee. There were no marketing
costs incurred by the producer farmer in this channel (Table 4B.5.3).
Table 4B.5.3 Price spread in marketing of barley in channel-III
(Producer Consumer)
S.No. Particulars `/quintal Share in consumer's rupee
(in percent)
1. Producer’s net share
843.55 100
2. Consumer’s price
843.55 100
From the above discussion, it could be concluded that the net
price received in the channel adopted by farmer was higher than that
realized in channel-I and channel-II and lower than channel-III.
The results presented in this sub-section are summarized as
under
1. Producer farmers adopted three channels for sale of bajra.
There was channel-I (Producer Village Trader Wholesaler
Retailer) for selling at village itself. Channel-II (Producer
Wholesaler Retialer) for selling at mandi and channel-III
(Producer Consumer) for selling the produce directly to the
consumer at farm itself.
2. The total marketing cost in selling of bajra was higher in
channel-I (` 289.14 per quintal) followed (` 264.46) in channel-II
because of involvement of intermediaries in the marketing
process. In channel-III there was no marketing cost. In case of
contract farmers it accounted to ` 89.91 per quintal.
3. Transportation charges, commission, value of quantity lost and
cost of gunny bag were the main items of costs.
4. There existed significant difference in the margins earned by
different market intermediaries. The village trader received 2.98
per cent (` 36.05 per quintal) share of the processor's rupee in
purchase of barley. The share obtained by the wholesaler was
9.86 per cent (` 118.88 per quintal). Among the functionaries,
wholesaler got the higher margin due to sale of barley at higher
prices to the processor.
5. The Produces share in the consumer’s rupee in sale of bajra at
Chomu and Renwal market has been 73.39 per cent and 71.62
per cent (Rs 905.06 per quintal and 902.23 per quintal). The
share and the net price received by the producer farmers in the
village sale is only 66.66 per cent and 64.47 per cent (Rs
822.00 per quintal and 812.23 per quintal). As such farmer got
low share in village sale process than that of Mandi sale.
Section-C
RELATIONSHIP BETWEEN MARKET ARRIVALS AND PRICES OF
BAJRA IN CHOMU AND RENEWAL MARKETS
The most important single factor responsible for wide fluctuations
in prices of agricultural commodities is the uncertainty of their supply.
The extent of variation in prices of crops brings effect on their production
and their market arrivals. In the peak season of production when arrivals
of produce in the market are high, prices generally prevail at low level.
When arrivals decreases with the advancement of the crop season,
prices of the crop ruled at high level. Both these situations affect the
farmer’s income. In the first case they get low income as major part of
the produce is disposed by the farmers in the peak production season to
meet their financial needs and also due to the poor holding capacity.
They cannot get the advantages of the second situation because the
produce available with them at this late stage is fairly in small quantity
with most of the farmers. This necessitates selecting of right time for
marketing the produce to get better prices and high income from the
crop output.
The study of behaviour of market arrivals and prices is important
to know the effect of market arrivals of the crop on prices of the crop in
different seasons of the year. Such studies are advantageous for the
producer-farmers in taking decisions regarding time of sale of their
output in the years to come. This also helps the market planners in
planning the size of the market and in creation of the necessary market
infrastructures for an efficient marketing in the area.
The relationship between market arrivals and prices of bajra in
the Chomu and Renwal market of Jaipur district has been examined
using monthly data on arrivals and prices of bajra obtained from the
records of Mandi samiti for the last 8 year i.e. 2005-06 to 2012-13.
The chapter has been divided in to three sub-selection as under:
4C.1 Pattern of market arrivals and price behaviour of bajra in Chomu
and Renwal market indifferent seasons of the year.
4C.2 Relationship between monthly arrivals and wholesale price of bajra
and
4C.3 Relationship between yearly arrivals and wholesale prices of bajra
4C.1 Seasonal Pattern of Market Arrivals and Prices of Bajra Crop
in Chomu and Renwal Markets
In this section, the intra-seasonal variations in arrivals and prices
have been examined.
4C.1.a Seasonal pattern of arrivals in Chomu market
The arrivals of bajra in different quarters of the year viz., peak,
mid, lean and off marketing seasons during the study period 2005-06
and 2012-13 in Chomu market is given in Table 4C.1.a.
About 55.88 to 74.04 per cent of total arrivals of bajra in the peak
quarter of the year during the study years. Arrivals of bajra were highest
in the peak quarter during 2009-10 (74.04 per cent) and lowest in year
2011-12 (55.88 per cent) with overall arrivals of bajra 62.72 per cent.
Arrivals ranged from 11.25 to 32.34 per cent in the second quarter (mid
season), highest arrivals were in this quarter during the year 2011-12
(32.34 per cent) and lowest arrivals in 2009-10 (11.25 per cent) with
overall arrivals of 20.47 per cent. In the lean period, arrivals ranged from
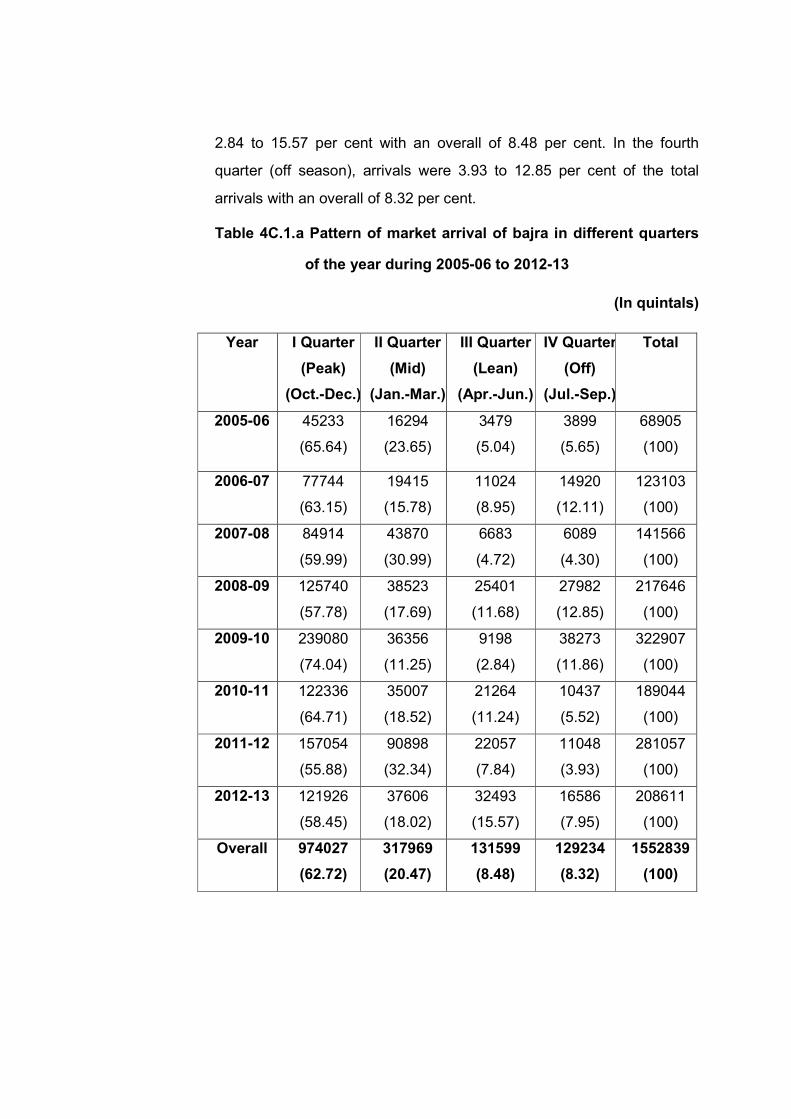
2.84 to 15.57 per cent with an overall of 8.48 per cent. In the fourth
quarter (off season), arrivals were 3.93 to 12.85 per cent of the total
arrivals with an overall of 8.32 per cent.
Table 4C.1.a Pattern of market arrival of bajra in different quarters
of the year during 2005-06 to 2012-13
(In quintals)
Year
I Quarter
(Peak)
(Oct.-Dec.)
II Quarter
(Mid)
(Jan.-Mar.)
III Quarter
(Lean)
(Apr.-Jun.)
IV Quarter
(Off)
(Jul.-Sep.)
Total
2005-06 45233
(65.64)
16294
(23.65)
3479
(5.04)
3899
(5.65)
68905
(100)
2006-07
77744
(63.15)
19415
(15.78)
11024
(8.95)
14920
(12.11)
123103
(100)
2007-08 84914
(59.99)
43870
(30.99)
6683
(4.72)
6089
(4.30)
141566
(100)
2008-09 125740
(57.78)
38523
(17.69)
25401
(11.68)
27982
(12.85)
217646
(100)
2009-10 239080
(74.04)
36356
(11.25)
9198
(2.84)
38273
(11.86)
322907
(100)
2010-11 122336
(64.71)
35007
(18.52)
21264
(11.24)
10437
(5.52)
189044
(100)
2011-12 157054
(55.88)
90898
(32.34)
22057
(7.84)
11048
(3.93)
281057
(100)
2012-13 121926
(58.45)
37606
(18.02)
32493
(15.57)
16586
(7.95)
208611
(100)
Overall 974027
(62.72)
317969
(20.47)
131599
(8.48)
129234
(8.32)
1552839
(100)
The pattern of arrivals of bajra in different quarters indicated that
about 62.72 per cent of the total arrivals were in the first quarter or peak
season i.e. immediately after the harvest of the crop within a period of 3
months. Arrivals decreased in the subsequent by season’s viz., in
second and third quarters of the year. Arrivals were less in the fourth
quarter compared to second and third quarters.
More than 83.19 per cent quantity of bajra arrived in the first two
quarters (with in six months) and only 16.81 per cent bajra arrived in the
other two quarters of the year.
4C.1.b Seasonal pattern of arrivals in Renwal market
The arrivals of bajra in different quarters of the year viz., peak,
mid, lean and off marketing seasons during the study period 2005-06
and 2012-13 in Renwal market is given in Table 4C.1.b
Arrivals of bajra were 44.86 to 70.67 per cent of total arrivals in
the peak quarters of the year during the study years. Arrivals in the peak
quarter were highest in year 2009-10 (70.67 per cent) and lowest in year
2011-12 (44.86 per cent) with overall arrivals of 52.55 per cent. Arrivals
ranged between 18.48 to 39.02 per cent in the second quarter (mid
season), highest arrivals in this quarter being in year 2010-11 (39.02 per
cent) and lowest arrivals in 2009-10 (18.48 per cent) with overall arrivals
of 27.58 per cent.
In the lean period, arrivals ranged between 2.39 to 25.13 per cent
with an overall of 13.12 per cent. In the fourth quarter (off season),
arrivals were 1.44 to 14.12 per cent of the total arrivals with an overall of
6.73 per cent.
The pattern of arrivals of bajra in different quarters indicated that
about 52.55 per cent of the total arrivals were in the first quarter or peak
season i.e. immediately after the harvest of the crop within a period of 3
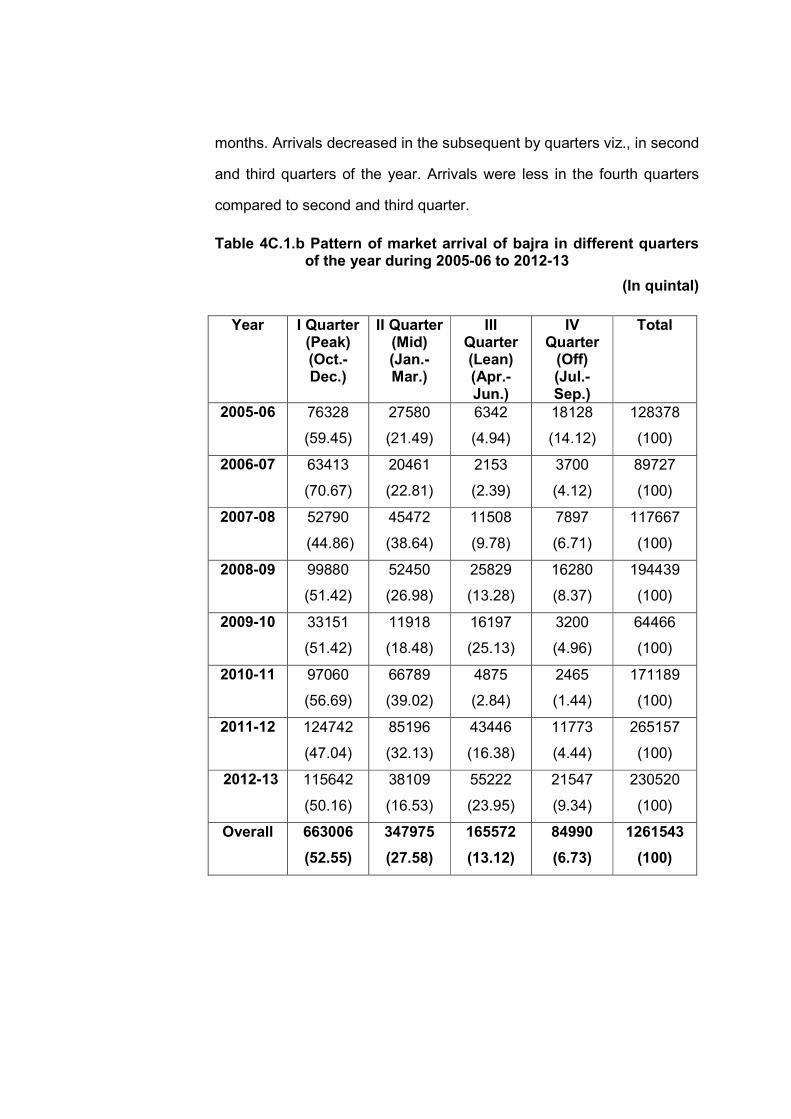
months. Arrivals decreased in the subsequent by quarters viz., in second
and third quarters of the year. Arrivals were less in the fourth quarters
compared to second and third quarter.
Table 4C.1.b Pattern of market arrival of bajra in different quarters of the year during 2005-06 to 2012-13
(In quintal)
Year I Quarter (Peak) (Oct.-Dec.)
II Quarter (Mid) (Jan.-Mar.)
III Quarter (Lean) (Apr.-Jun.)
IV Quarter
(Off) (Jul.-Sep.)
Total
2005-06 76328
(59.45)
27580
(21.49)
6342
(4.94)
18128
(14.12)
128378
(100)
2006-07 63413
(70.67)
20461
(22.81)
2153
(2.39)
3700
(4.12)
89727
(100)
2007-08 52790
(44.86)
45472
(38.64)
11508
(9.78)
7897
(6.71)
117667
(100)
2008-09 99880
(51.42)
52450
(26.98)
25829
(13.28)
16280
(8.37)
194439
(100)
2009-10 33151
(51.42)
11918
(18.48)
16197
(25.13)
3200
(4.96)
64466
(100)
2010-11 97060
(56.69)
66789
(39.02)
4875
(2.84)
2465
(1.44)
171189
(100)
2011-12 124742
(47.04)
85196
(32.13)
43446
(16.38)
11773
(4.44)
265157
(100)
2012-13 115642
(50.16)
38109
(16.53)
55222
(23.95)
21547
(9.34)
230520
(100)
Overall 663006
(52.55)
347975
(27.58)
165572
(13.12)
84990
(6.73)
1261543
(100)
More than 80.13per cent quantity of bajra arrived in the first two
quarters (within six months) and only 19.87 per cent bajra arrived in the
other two quarters of the year.
4C.1.c Seasonal pattern in prices of bajra in Chomu market
The average seasonal prices and the percentage change over the
seasons have been presented in Table 4C.1.c.
The inter-seasonal variation in prices of bajra showed that prices
decreased in the second quarter (January-March) over the first quarter
(October-December) in one year and increased in seven years out of a
total of eight years study period. The increase in prices of bajra from first
to second quarter was maximum in year 2008-09 i.e. by 16.70 per cent.
Price were lowest increase from first to second quarter in year 2006-07
i.e. 1.70 per cent on the whole, prices were higher in the second quarter
over the first season by 9.70 per cent. Price was higher in the third
quarter (April to June) over the second quarter (October to December) in
three year and low in five year. The highest increase in prices from
second to the third quarter has been there in year 2010-11 by 19.40 per
cent. In five years viz., 2005-06, 2008-09, 2009-10, 2011-12 and 2012--
13 prices were lower in the third quarter over the second quarter. On the
whole, prices were lower in the third season over the second quarters by
only 4.40 per cent. Prices have shown increase in three year and
decreases in five years in the fourth quarter over the third quarter.
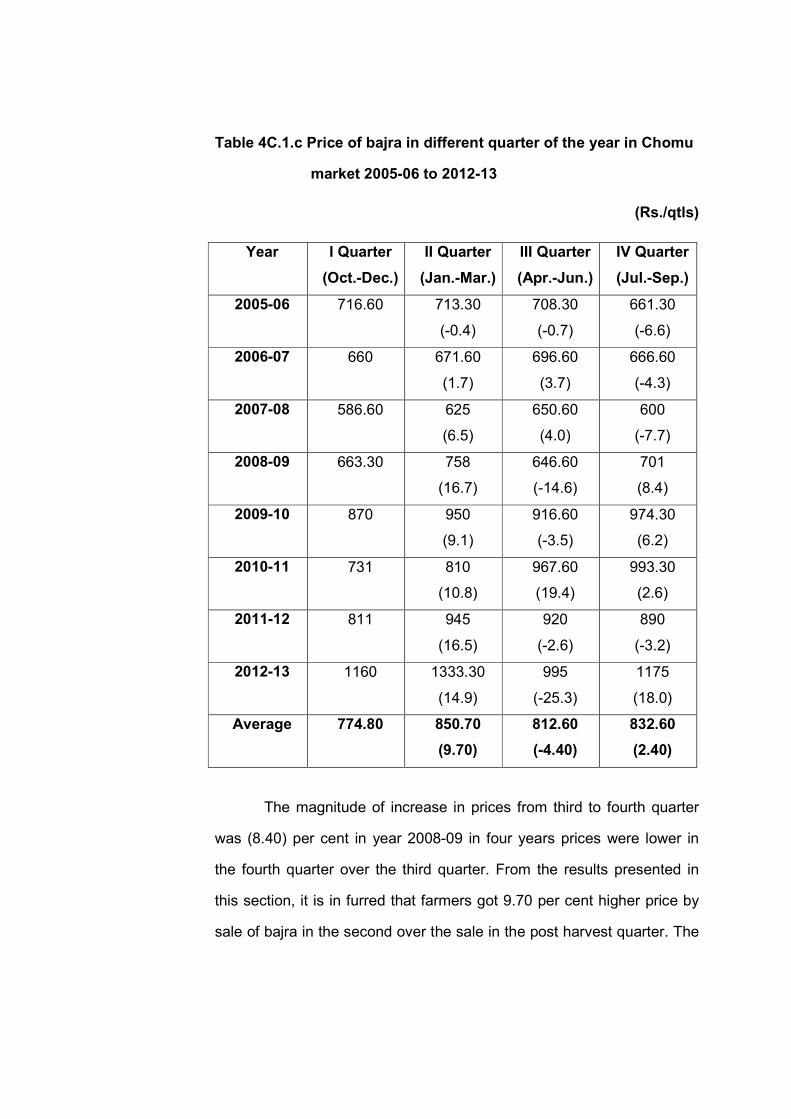
Table 4C.1.c Price of bajra in different quarter of the year in Chomu
market 2005-06 to 2012-13
(Rs./qtls)
Year I Quarter
(Oct.-Dec.)
II Quarter
(Jan.-Mar.)
III Quarter
(Apr.-Jun.)
IV Quarter
(Jul.-Sep.)
2005-06 716.60
713.30
(-0.4)
708.30
(-0.7)
661.30
(-6.6)
2006-07 660
671.60
(1.7)
696.60
(3.7)
666.60
(-4.3)
2007-08 586.60 625
(6.5)
650.60
(4.0)
600
(-7.7)
2008-09 663.30 758
(16.7)
646.60
(-14.6)
701
(8.4)
2009-10 870 950
(9.1)
916.60
(-3.5)
974.30
(6.2)
2010-11 731
810
(10.8)
967.60
(19.4)
993.30
(2.6)
2011-12 811 945
(16.5)
920
(-2.6)
890
(-3.2)
2012-13 1160
1333.30
(14.9)
995
(-25.3)
1175
(18.0)
Average 774.80 850.70
(9.70)
812.60
(-4.40)
832.60
(2.40)
The magnitude of increase in prices from third to fourth quarter
was (8.40) per cent in year 2008-09 in four years prices were lower in
the fourth quarter over the third quarter. From the results presented in
this section, it is in furred that farmers got 9.70 per cent higher price by
sale of bajra in the second over the sale in the post harvest quarter. The
carrying of bajra to the third and fourth quarter of the year is not
advantageous.
4C.1.d Seasonal pattern in prices of bajra in Renewal market
The average seasonal prices and the percentage change over the
quarters have been presented in Table 4C.1.d
The inter-seasonal variation in prices of bajra showed that prices
decreased in the second quarter (January-March) over the first quarter
(October-December) in one year and increased in seven years out of a
total of eight years study period. The increase in prices of bajra from first
to second quarter was maximum in year 2008-09 i.e. by 18 per cent. The
lowest increase in price from first to second quarter was in year 2006-07
i.e. 0.50 per cent on the whole, prices were higher in the second quarter
over the first quarter by 8.11 per cent. Price was higher in the third
quarter (April to June) over the second quarter (October to December) in
four year and low in four year. The highest increase in prices from
second to the third quarter has been there in year 2010-11 by 16.80 per
cent. In four years viz., 2005-06, 2008-09, 2009-10 and 2012-13 prices
were lower in the third quarter over the second quarter. On the whole,
prices were lower in the third quarter over the second quarter by only
4.80 per cent. Prices have shown increase in one year and decreases in
seven years in the fourth quarter over the third quarter. The magnitude
of increase in prices from third to fourth quarter was (13.90) per cent in
year 2012-13 in seven year prices were lower in the fourth quarter over
the third quarter. From the results presented in this section, it is in furred
that farmers got 8.11 per cent higher price by sale of bajra in the second
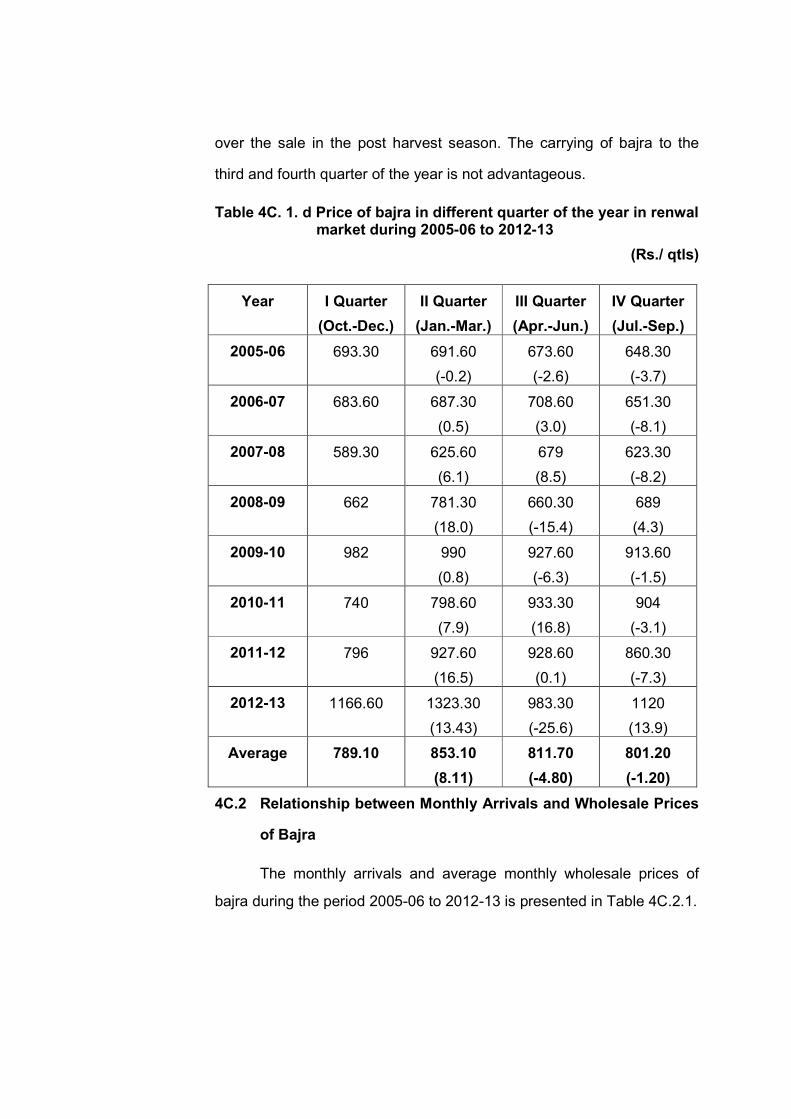
over the sale in the post harvest season. The carrying of bajra to the
third and fourth quarter of the year is not advantageous.
Table 4C. 1. d Price of bajra in different quarter of the year in renwal market during 2005-06 to 2012-13
(Rs./ qtls)
Year I Quarter
(Oct.-Dec.)
II Quarter
(Jan.-Mar.)
III Quarter
(Apr.-Jun.)
IV Quarter
(Jul.-Sep.)
2005-06 693.30
691.60
(-0.2)
673.60
(-2.6)
648.30
(-3.7)
2006-07 683.60 687.30
(0.5)
708.60
(3.0)
651.30
(-8.1)
2007-08 589.30 625.60
(6.1)
679
(8.5)
623.30
(-8.2)
2008-09 662 781.30
(18.0)
660.30
(-15.4)
689
(4.3)
2009-10 982 990
(0.8)
927.60
(-6.3)
913.60
(-1.5)
2010-11 740 798.60
(7.9)
933.30
(16.8)
904
(-3.1)
2011-12 796 927.60
(16.5)
928.60
(0.1)
860.30
(-7.3)
2012-13 1166.60
1323.30
(13.43)
983.30
(-25.6)
1120
(13.9)
Average 789.10 853.10
(8.11)
811.70
(-4.80)
801.20
(-1.20)
4C.2 Relationship between Monthly Arrivals and Wholesale Prices
of Bajra
The monthly arrivals and average monthly wholesale prices of
bajra during the period 2005-06 to 2012-13 is presented in Table 4C.2.1.
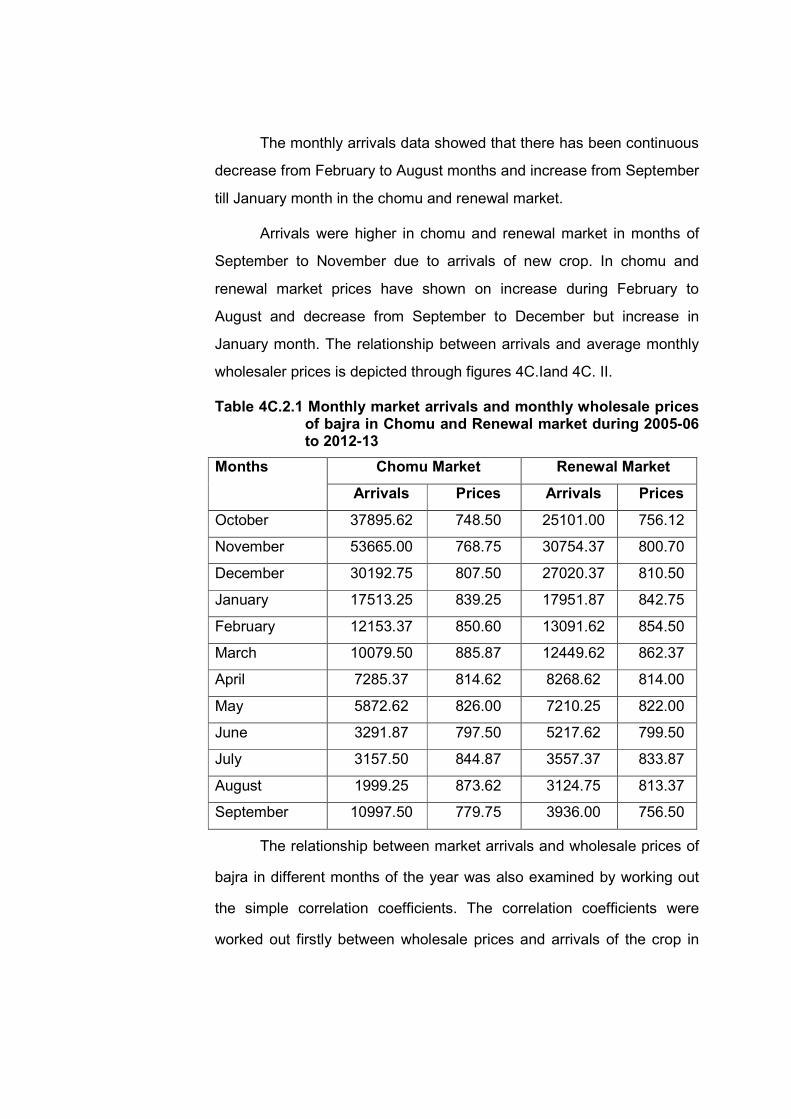
The monthly arrivals data showed that there has been continuous
decrease from February to August months and increase from September
till January month in the chomu and renewal market.
Arrivals were higher in chomu and renewal market in months of
September to November due to arrivals of new crop. In chomu and
renewal market prices have shown on increase during February to
August and decrease from September to December but increase in
January month. The relationship between arrivals and average monthly
wholesaler prices is depicted through figures 4C.Iand 4C. II.
Table 4C.2.1 Monthly market arrivals and monthly wholesale prices of bajra in Chomu and Renewal market during 2005-06 to 2012-13
Months Chomu Market Renewal Market
Arrivals Prices Arrivals Prices
October 37895.62 748.50 25101.00 756.12
November 53665.00 768.75 30754.37 800.70
December 30192.75 807.50 27020.37 810.50
January 17513.25 839.25 17951.87 842.75
February 12153.37 850.60 13091.62 854.50
March 10079.50 885.87 12449.62 862.37
April 7285.37 814.62 8268.62 814.00
May 5872.62 826.00 7210.25 822.00
June 3291.87 797.50 5217.62 799.50
July 3157.50 844.87 3557.37 833.87
August 1999.25 873.62 3124.75 813.37
September 10997.50 779.75 3936.00 756.50
The relationship between market arrivals and wholesale prices of
bajra in different months of the year was also examined by working out
the simple correlation coefficients. The correlation coefficients were
worked out firstly between wholesale prices and arrivals of the crop in
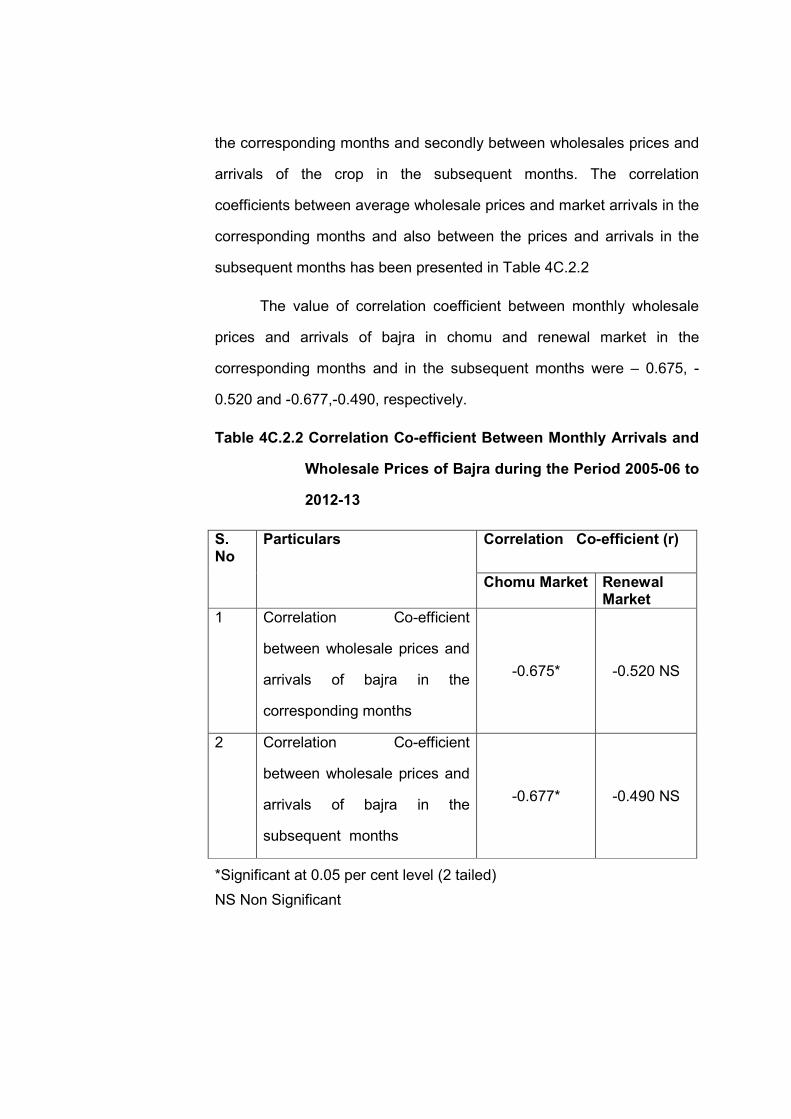
the corresponding months and secondly between wholesales prices and
arrivals of the crop in the subsequent months. The correlation
coefficients between average wholesale prices and market arrivals in the
corresponding months and also between the prices and arrivals in the
subsequent months has been presented in Table 4C.2.2
The value of correlation coefficient between monthly wholesale
prices and arrivals of bajra in chomu and renewal market in the
corresponding months and in the subsequent months were – 0.675, -
0.520 and -0.677,-0.490, respectively.
Table 4C.2.2 Correlation Co-efficient Between Monthly Arrivals and
Wholesale Prices of Bajra during the Period 2005-06 to
2012-13
S. No
Particulars Correlation Co-efficient (r)
Chomu Market Renewal Market
1 Correlation Co-efficient
between wholesale prices and
arrivals of bajra in the
corresponding months
-0.675* -0.520 NS
2 Correlation Co-efficient
between wholesale prices and
arrivals of bajra in the
subsequent months
-0.677* -0.490 NS
*Significant at 0.05 per cent level (2 tailed)
NS Non Significant
The negative sign of correlation coefficient between the arrivals
and wholesale prices indicated the existence of inverse relationship in
them. Further, the prices prevailing in a month in general luring effect on
the arrival of the output in the subsequent months rather than in the
same month and thus the second type of relationship is more important
in taking of decisions of timing of sale of bajra crop.
In decision making, the study of the relationship in prices and
arrivals of the crop in the subsequent months has been more useful to
the producer-farmers because farmer producer’s lake decision for the
sale of the crop based on today’s price in the market with the hope that
today’s price will prevail farm arrow also.
4C.3 Relationship between Yearly Arrivals and Wholesale Prices
of Bajra
The relationship in the monthly arrivals and prices is not a true
reflector of the relationship between the two because of the wide
variations in arrivals and prices from month to month due to the
exogenous factors i.e. temporary increase in demand or decrease in
supply of the output. The correlation coefficients between yearly prices
and arrivals of bajra during the period 2005-06 to 2012-13 for chomu
and renewal markets were presented Table-4C.3.
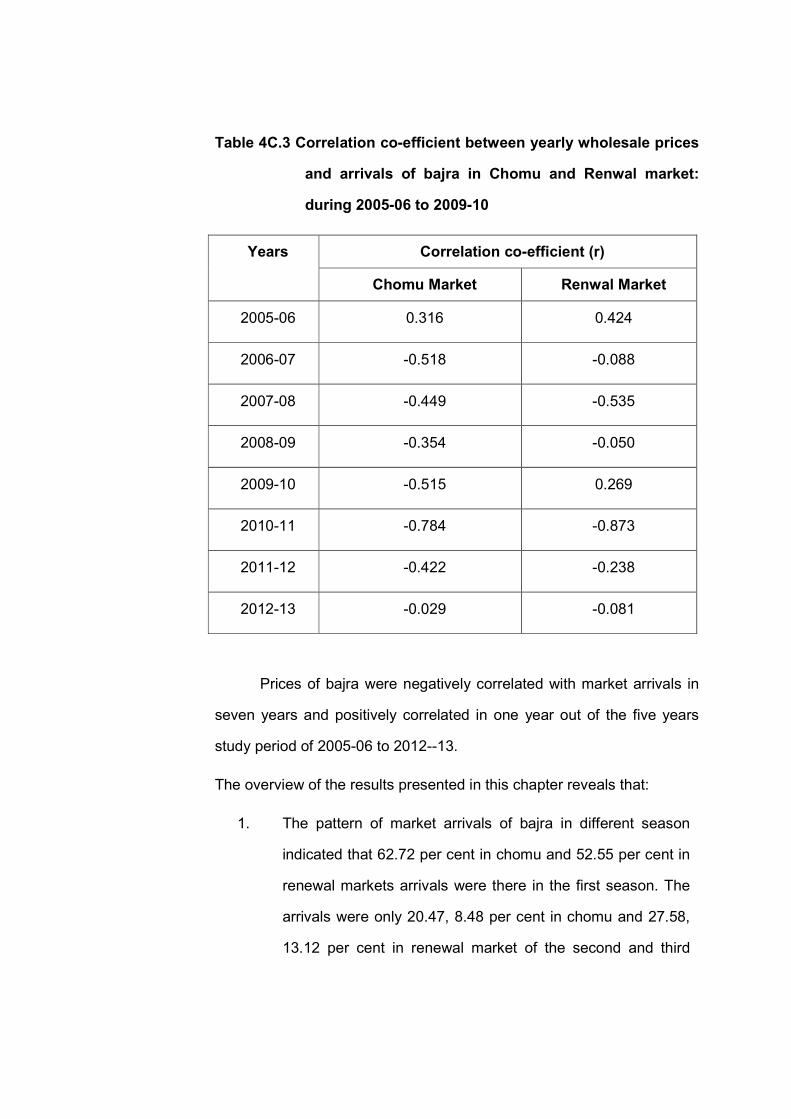
Table 4C.3 Correlation co-efficient between yearly wholesale prices
and arrivals of bajra in Chomu and Renwal market:
during 2005-06 to 2009-10
Years Correlation co-efficient (r)
Chomu Market Renwal Market
2005-06 0.316 0.424
2006-07 -0.518 -0.088
2007-08 -0.449 -0.535
2008-09 -0.354 -0.050
2009-10 -0.515 0.269
2010-11 -0.784 -0.873
2011-12 -0.422 -0.238
2012-13 -0.029 -0.081
Prices of bajra were negatively correlated with market arrivals in
seven years and positively correlated in one year out of the five years
study period of 2005-06 to 2012--13.
The overview of the results presented in this chapter reveals that:
1. The pattern of market arrivals of bajra in different season
indicated that 62.72 per cent in chomu and 52.55 per cent in
renewal markets arrivals were there in the first season. The
arrivals were only 20.47, 8.48 per cent in chomu and 27.58,
13.12 per cent in renewal market of the second and third
seasons. The arrivals of bajra have been almost 62.72 and
52.55 per cent of the total annual arrivals in the first peak
season. The arrivals were low in the second and third
seasons fourth season is also low in second and third
season.
2. Prices of bajra were higher in the second season by 9.70
and 8.11 per cent over the first season in the chomu and
renewal market. Prices were law by -4.40 percent, 2.40 in
the third and fourth season over the second season in
chomu market and -4.80 per cent,-1.20 per cent in renewal
market. Thus farmers got 9 per cent higher prices by sale of
bajra in the second season over the first season (post
harvest sale). It is not advantageous to early the bajra
produce to the third and fourth season of the year.
3. There existed inverse relationship between prices and
arrivals of bajra in the corresponding as well as in
subsequent months. The higher negative value of correlation
coefficient for subsequent months compared to the
corresponding months explains that the effect of prices
arrivals has been more pronemeed in the subsequent
months.
4. The correlation in yearly prices and arrivals of bajra were
negative in seven years and positive in one year. It reveals
that prices of bajra are not only affected by arrivals but are
also affected by other factors viz., demand, export potential
and seasonality of the crop etc.
Section-D
PROBLEMS FACED BY THE BAJRA PRODUCERS
In this section an attempt has been made to identify the problems
faced by bajra growers in the production and marketing of bajra in
chomu & renewal tehsils of Jaipur district. The problems responsible
were divided into the following four categories:-
1. Technical
2. Economic
3. Infrastructural
4. Social
1. Technical problems
Technical constraints are the lack of know-how or skill required
for adoption of particular recommended production and marketing
technology. The table 4D.1 shows 3 technical problems in production
and marketing of bajra. The problems faced by sample farmers were the
lack of technical knowledge about bajra cultivation reported by 60 per
cent from total farm groups. Out of which 62.50 per cent of small, 66.67
per cent semi-medium and 58.33 per cent of medium farmers faced this
problem. Large farmers did not face the problem related to cultivation of
bajra. Bajra crop is labour intensive and required both skilled and
unskilled labour. The study revealed that 100 per cent of the total
selected bajra growers were faced by this problem. Out of which 100,
100,100 and 100 per cent of small, semi-medium, medium and large
farmers, respectively faced this problem in the study area. About 58.34
per cent farmers reported that there was lack of recommended doses of
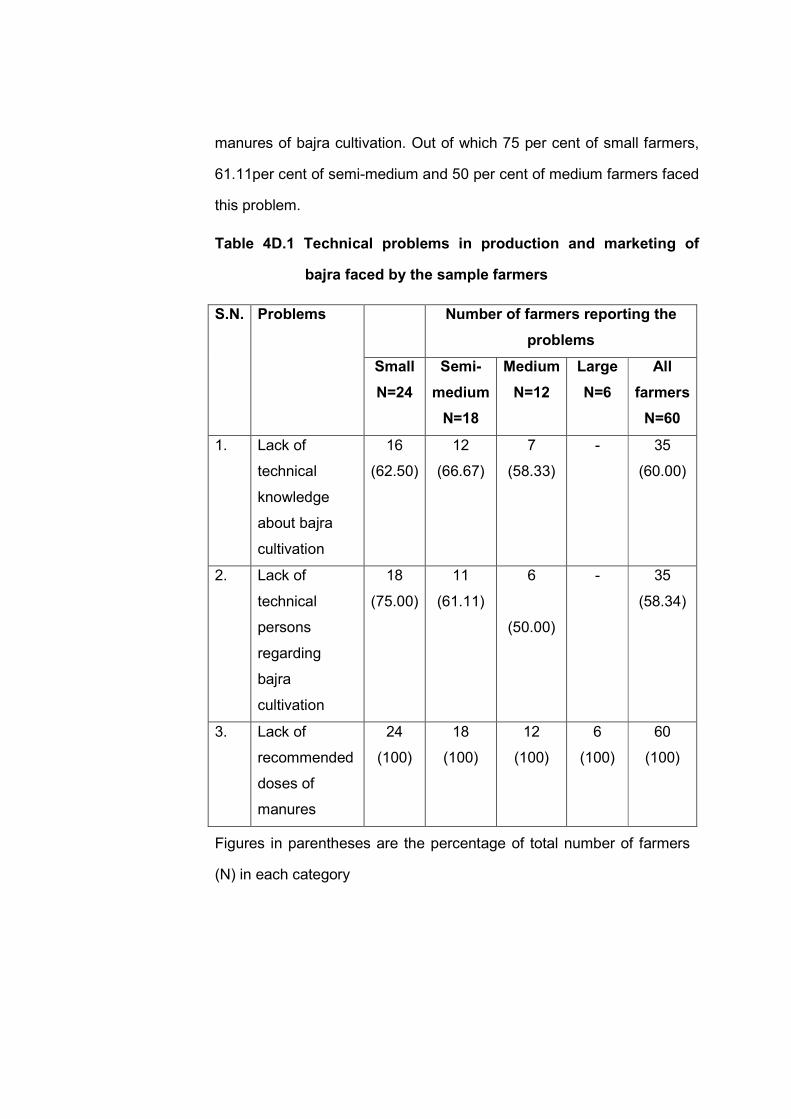
manures of bajra cultivation. Out of which 75 per cent of small farmers,
61.11per cent of semi-medium and 50 per cent of medium farmers faced
this problem.
Table 4D.1 Technical problems in production and marketing of
bajra faced by the sample farmers
S.N. Problems Number of farmers reporting the
problems
Small
N=24
Semi-
medium
N=18
Medium
N=12
Large
N=6
All
farmers
N=60
1. Lack of
technical
knowledge
about bajra
cultivation
16
(62.50)
12
(66.67)
7
(58.33)
- 35
(60.00)
2. Lack of
technical
persons
regarding
bajra
cultivation
18
(75.00)
11
(61.11)
6
(50.00)
- 35
(58.34)
3. Lack of
recommended
doses of
manures
24
(100)
18
(100)
12
(100)
6
(100)
60
(100)
Figures in parentheses are the percentage of total number of farmers
(N) in each category
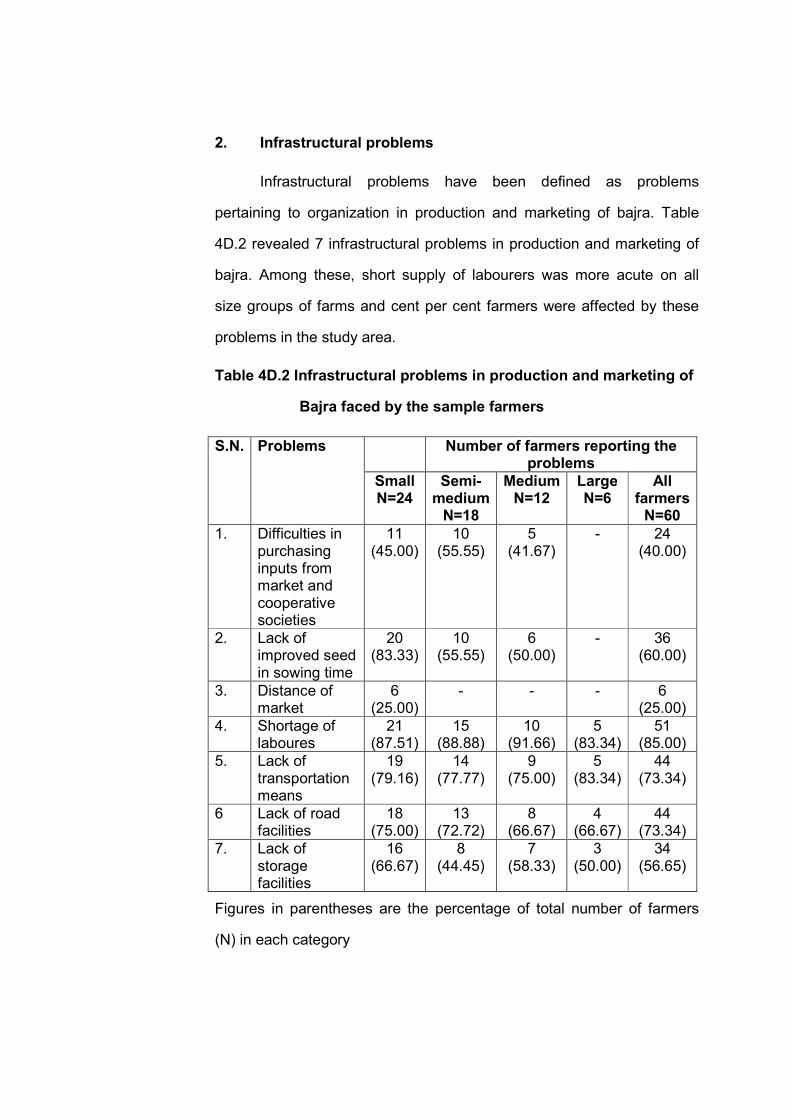
2. Infrastructural problems
Infrastructural problems have been defined as problems
pertaining to organization in production and marketing of bajra. Table
4D.2 revealed 7 infrastructural problems in production and marketing of
bajra. Among these, short supply of labourers was more acute on all
size groups of farms and cent per cent farmers were affected by these
problems in the study area.
Table 4D.2 Infrastructural problems in production and marketing of
Bajra faced by the sample farmers
S.N. Problems Number of farmers reporting the problems
Small N=24
Semi-medium
N=18
Medium N=12
Large N=6
All farmers
N=60 1. Difficulties in
purchasing inputs from market and cooperative societies
11 (45.00)
10 (55.55)
5 (41.67)
- 24 (40.00)
2. Lack of improved seed in sowing time
20 (83.33)
10 (55.55)
6 (50.00)
- 36 (60.00)
3. Distance of market
6 (25.00)
- - - 6 (25.00)
4. Shortage of laboures
21 (87.51)
15 (88.88)
10 (91.66)
5 (83.34)
51 (85.00)
5. Lack of transportation means
19 (79.16)
14 (77.77)
9 (75.00)
5 (83.34)
44 (73.34)
6 Lack of road facilities
18 (75.00)
13 (72.72)
8 (66.67)
4 (66.67)
44 (73.34)
7. Lack of storage facilities
16 (66.67)
8 (44.45)
7 (58.33)
3 (50.00)
34 (56.65)
Figures in parentheses are the percentage of total number of farmers
(N) in each category
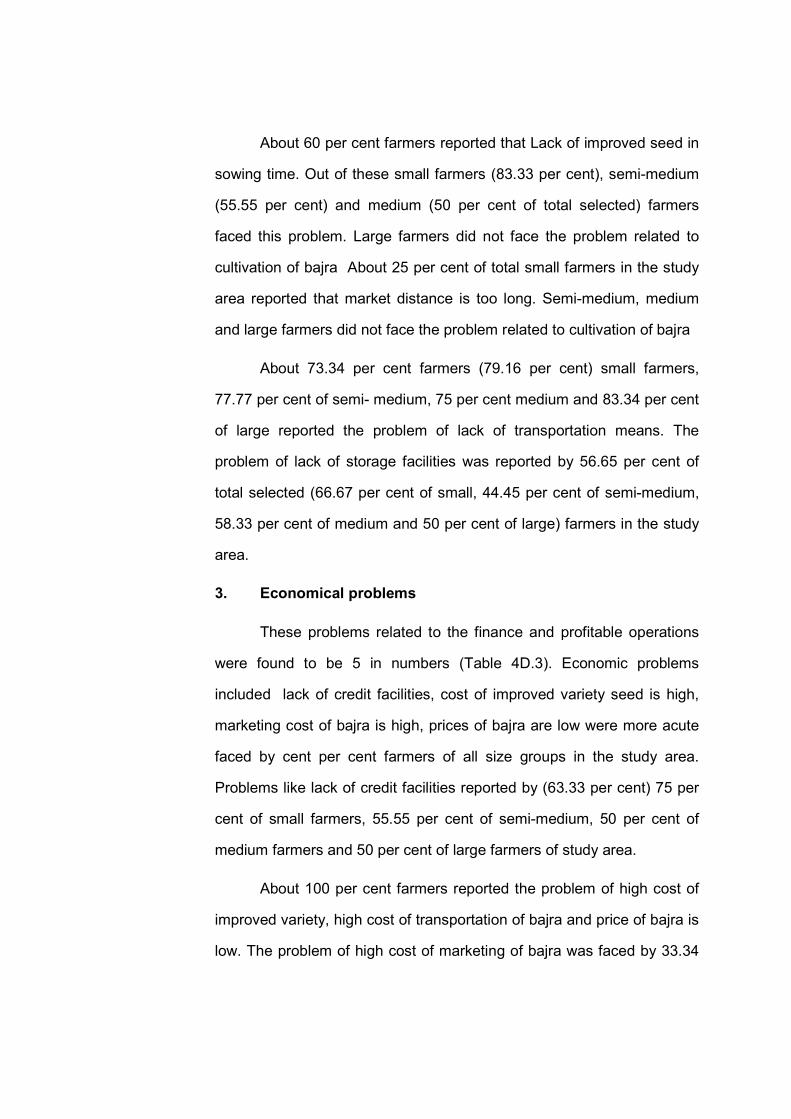
About 60 per cent farmers reported that Lack of improved seed in
sowing time. Out of these small farmers (83.33 per cent), semi-medium
(55.55 per cent) and medium (50 per cent of total selected) farmers
faced this problem. Large farmers did not face the problem related to
cultivation of bajra About 25 per cent of total small farmers in the study
area reported that market distance is too long. Semi-medium, medium
and large farmers did not face the problem related to cultivation of bajra
About 73.34 per cent farmers (79.16 per cent) small farmers,
77.77 per cent of semi- medium, 75 per cent medium and 83.34 per cent
of large reported the problem of lack of transportation means. The
problem of lack of storage facilities was reported by 56.65 per cent of
total selected (66.67 per cent of small, 44.45 per cent of semi-medium,
58.33 per cent of medium and 50 per cent of large) farmers in the study
area.
3. Economical problems
These problems related to the finance and profitable operations
were found to be 5 in numbers (Table 4D.3). Economic problems
included lack of credit facilities, cost of improved variety seed is high,
marketing cost of bajra is high, prices of bajra are low were more acute
faced by cent per cent farmers of all size groups in the study area.
Problems like lack of credit facilities reported by (63.33 per cent) 75 per
cent of small farmers, 55.55 per cent of semi-medium, 50 per cent of
medium farmers and 50 per cent of large farmers of study area.
About 100 per cent farmers reported the problem of high cost of
improved variety, high cost of transportation of bajra and price of bajra is
low. The problem of high cost of marketing of bajra was faced by 33.34
per cent farmers (out of which 33.34 per cent of small, 38.88 per cent of
semi-medium and 41.66 per cent of medium farmers).
Table 4D.3. Economic problems in production and marketing of
bajra faced by the sample farmers
S. No.
Problems Number of farmers reporting the problems
Small N=24
Semi-medium
N=18
Medium N=12
Large N=6
All farmers
N=60 1. Lack of credit
facilities
18
(75.00)
10
(55.55)
6
(50.00)
3
(50.00)
38
(63.33)
2. High cost of
improved
variety
24
(100)
18
(100.00)
12
(100.00)
6
(100.00)
60
(100.00)
3. Cost of
transportation
of bajra is
high
24
(100)
18
(100.00)
12
(100.00)
6
(100.00)
60
(100.00)
4. Marketing
cost of bajra
is high
8
(33.34)
7
(38.88)
5
(41.66)
-
20
(33.34)
5. Prices of
bajra are low
24
(100)
18
(100.00)
12
(100.00)
6
(100.00)
60
(100.00)
Figures in parentheses are the percentage of total number of farmers
(N) in each category
4. Social problems
These problems related to the social customs, habits and mental
acceptance in the production and marketing of bajra were included in
this section. Table 4D.4 revealed 2 social problems. Among these fear of
thieves and stray animals prohibits farmers to take bajra crop were more
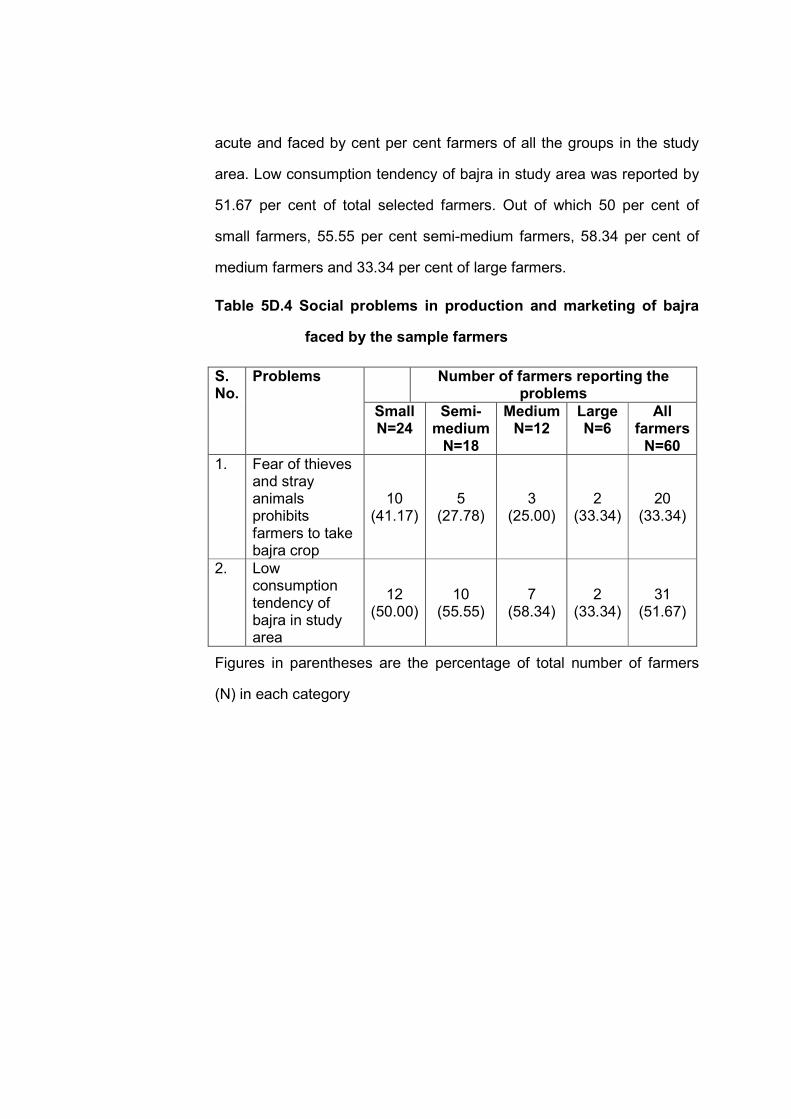
acute and faced by cent per cent farmers of all the groups in the study
area. Low consumption tendency of bajra in study area was reported by
51.67 per cent of total selected farmers. Out of which 50 per cent of
small farmers, 55.55 per cent semi-medium farmers, 58.34 per cent of
medium farmers and 33.34 per cent of large farmers.
Table 5D.4 Social problems in production and marketing of bajra
faced by the sample farmers
S. No.
Problems Number of farmers reporting the problems
Small N=24
Semi-medium
N=18
Medium N=12
Large N=6
All farmers
N=60 1. Fear of thieves
and stray animals prohibits farmers to take bajra crop
10 (41.17)
5 (27.78)
3 (25.00)
2 (33.34)
20 (33.34)
2. Low consumption tendency of bajra in study area
12 (50.00)
10 (55.55)
7 (58.34)
2 (33.34)
31 (51.67)
Figures in parentheses are the percentage of total number of farmers
(N) in each category
Chapter–5
SUMMARY, CONCLUSIONS AND SUGGESTIONS
5.1 INTRODUCTION
Bajra (Pearlmillet) belongs to family Gramineae. It is a tropical
crop. It is widely grown in Africa and Asia. The important bajra growing
countries are India, China, Nigeria, Pakistan, Sudan, Egypt, Arabia and
Russia.
In India bajra is the important cereal crop next to rice and wheat.
The total foodgrains area in india was 126.74 million hectares with
production of about 257.4 million tonnes during the year 2011-12. The
major bajra growing states of the country are Rajasthan, Uttar Pradesh,
Maharashtra, Gujrat and Haryana. There states together account for
87% of the total area and 73% of the total production. Rajasthan
occupies first place in area as well as production. The state produced
6.43 lakh tonnes of bajra grain on 4.98 lakh hectares area with
productivity of 1,290 kg/hectare during the year 2011-12.
In Rajasthan the important bajra growing districts are Barmer,
Jodhpur, Nagaur, Alwar and Jaipur. Barmer district occupies the first
place in terms of area and Nagaur district in terms of production of bajra.
Jaipur district is one of the major bajra growing districts of
Rajasthan. This district produced 4.94 lakh tonnes of bajra grain on 3.17
lakh hectares area with productivity of 1,558 kg/ha during the year 2011-
12.
5.2 METHODOLOGY:
The study was confined to Jaipur district of Rajasthan which was
selected purposively for the study. This district was one of the major
bajra growing districts of Rajasthan.
Chomu and Renwal tehsils of Jaipur district were selected
randomly for the study. A list of villages selling bajra was obtained from
the secretaries of Krishi Upaj Mandi Samiti, Renwal and Chomu who
sold their produce in there mandies. Based on the information of
maximum production and sale of bajra, six villages namely Rampura,
Malikpura, Luniyawas, Alisar, Biharipura and Jaisinghpura were selected
randomly. Lists of bajra growing farmers of these six villages along with
their size of operational holding were prepared with the help of patwaries
of the concerned villages. Then a combined list of all the bajra growers
was prepared in an ascending order of the size of their respective
operational land holdings these were then divided to in four size group
viz., small, semi- medium, medium and large. Finally, a sample of 60
bajra growing farmers was randomly selected in proportion to their total
number in each size group. Two markets, i.e.; Chomu Krishi Upaj Mandi
Samiti and Renwal Krishi Upaj Mandi Samiti were selected for studying
the relationship between arrivals and prices of bajra.
Both primary and secondary data were used in the study. The
primary data in respect of area under bajra crop and production of bajra,
sale pattern, costs incurred by the selected farmers in the sale of bajra
and sale price of the produce obtained by the farmers, costs incurred by
the wholesalers and retailers in purchase and sell of bajra , were
collected from the producers, wholesaler and retailers through personal
interview method, with a set of well- structured schedules specifically
designed for the study.
Secondary data in respect of monthly wholesale prices and
arrivals of bajra in Chomu and Renwal markets for the last six years
were obtained from the records of the Krishi Upaj Mandi Samiti, Chomu
and Krishi Upaj Mandi Samiti, Renwal.
5.3 RESULTS
The summarized results of the study are presented under the
following sub-heads:
5.3.1 Costs of and returns from cultivation of bajra crop:
The study results revealed that the per hectare cost of cultivation
of bajra varied from Rs 10470.69 to Rs 10184.35 and that of production
per quintal from ` 212.29 on large sized farms to ` 521.02 on small sized
farms with an overall average of ` 425.99 per quintal, respectively.
Human labour was important component of the operational cost
as it ranged from 6.24 per cent to 18.79 per cent share in Overall total
cost on different sized farms was of 14.35 per cent and overall cost A1,
A2, B1, B2, C1, and C2 were ` 3662.43, 3662.43, 4150.73, 8650.73,
4920.73 and 9420.73, per hectare, respectively.
All the costs except B2 were inversely related with the size of
holdings. The overall cost of production of bajra was ` 425.99 per
quintal. It ranged from ` 212.29 per quintal on large sized farms to `
521.02 per quintal on small sized farms. The cost of production per
quintal was found to decrease with the increase in size of farms.
The net income per hectare of bajra crop ranged from ` 5554.31
to ` 13165.65 on different sized farms. The highest returns were
obtained on large sized farms.
The return per rupee from bajra cultivation was highest (Rs 2.29)
on large sized farms and lowest on small sized farms (` 1.53) with an
average of ` 1.73. Thus bajra cultivation was found to be a profitable
crop enterprise in the study area.
5.3.2 Costs and margins in marketing of bajra
The total marketing cost of bajra was higher in channel-I (`
194.79 per quintal for chomu farmers and 189.44 per quintal for
renewal farmers) followed by channel-II (` 164.39 per quintal for chomu
farmers and 162.89 per quintal for renewal farmers) because of
involvement of intermediaries in the marketing process. In channel-III
there was no marketing cost.
In channel-I adopted by bajra growing farmers chomu KUMS out
of total costs, ` 39.21 (14.12 per cent), ` 42.55 (27.01 per cent). ` 77.20
(45.07) and ` 35.83 (13.79 per cent) were incurred by the producer
farmers, village traders wholesalers and retailer, respectively. In this
channel the wholesalers bore maximum costs of marketing in chomu
market. The reason being that the commission charges and mandi fee
were paid by wholesalers.
In channel-I adopted by bajra growing farmers of renewal KUMS
out of total costs, ` 34.68 (18.31 per cent), ` 47.48 (25.06 per cent). `
75.03 (39.61) and ` 32.25 (17.02 per cent) were incurred by the
producer farmers, village traders wholesalers and retailer, respectively.
In this channel the wholesalers bore maximum costs of marketing in
renewal market. The reason being that the commission charges and
mandi fee were paid by wholesalers.
In channel-II, ` 51.36, ` 77.20 and ` 35.83 were incurred by the
producer farmer, wholesaler and the retailer, respectively which
accounted for 31.24,47.01 and 21.66 per cent of the total costs of
marketing of bajra in chomu market. Transportation charges, cost of
gunny bag , value of quantity lost and cost of gunny bag were the main
items of cost for marketing of bajra in chomu market.
In channel-II, ` 55.61, ` 75.03 and ` 35.25 were incurred by the
producer farmer, wholesaler and the retailer, respectively which
accounted for 34.14,46.06 and 19.79 per cent of the total costs of
marketing of bajra in renewal market. Transportation charges, cost of
gunny bag , value of quantity lost and cost of gunny bag were the main
items of cost for marketing of bajra in renewal market.
In the channel-III bajra moved from producer farmer to
consumer directly and no marketing costs were borne by producer
farmer itself.
There existed significant difference in the margins earned by
different market intermediaries. The village trader had 4.27 per cent (`
52.66 per quintal) share in the consumers rupee in purchase of bajra in
Chomu market. The share obtained by the wholesaler was 5.54 per
cent (` 68.26 per quintal) and that of retailer was 7.74 per cent (95.47
per quintal). Among the functionaries, retailer got the higher margin
due to sale of bajra at higher prices to the consumer.
There existed significant difference in the margins earned by
different market intermediaries. The village trader had 5.04 per cent (`
68.45 per quintal) share in the consumers rupee in purchase of bajra in
Renewal market. The share obtained by the wholesaler was 7.10 per
cent (` 89.45 per quintal) and retailer was 8.35per cent (105.25 per
quintal). Among the functionaries, retailer got the higher margin due to
sale of bajra at higher prices to the consumer.
Producers got a share of 66.66 per cent in the price paid by
consumers in the sale of bajra at village and 73.39 per cent in the sale
directly in the Chomu market. Thus, the net price received by the
producer farmers is higher by 6.73 per cent in sale of bajra in the Mandi
than at village.
Producers got a share of 64.47 per cent in the price paid by
consumers in the sale of bajra at village and 71.62 per cent in the sale
directly in Renewal market. Thus, the net price received by the producer
farmers was higher by 7.15 per cent in sale of bajra in the Mandi than at
village.
5.3.3 Market arrivals and prices of bajra
The pattern of market arrivals of bajra in different quarter
indicated that 62.72 per cent of market arrivals in Chomu and 52.55 per
cent in Renewal were there in the first quarter. The arrivals in second
and third quarter were only 20.47, 8.48 per cent in chomu and 27.58,
13.12 per cent in Renewal market, respectively. The arrivals of bajra in
Chomu and renewal mandi were maximum in the first peak season. The
arrivals were low in the subsequent season. Prices of bajra were higher
in the second quarter by 9.70 and 8.11 per cent over the first quarter in
Chomu and Renewal market. Prices were law by -4.40 percent, 2.40 in
the third and fourth quarters over the second quarter in Chomu market
and by -4.80 per cent and -1.20 per cent in Renewal market. Thus
farmers got 9 per cent higher prices by sale of bajra in the second
quarter over the first quarter (post harvest sale). It is not advantageous
to early the bajra produce to the third and fourth quarter of the year.
There existed inverse relationship between prices and arrivals of bajra in
the corresponding as well as in subsequent months. The higher negative
value of correlation coefficient for subsequent months compared to the
corresponding months explains that the effect of prices on arrivals was
more propounded in the subsequent months. The correlation in yearly
prices and arrivals of bajra were negative in seven years and positive in
one year. It reveals that prices of bajra are not only affected by arrivals
but are also affected by other factors viz., demand, export potential and
seasonality of the crop etc.
5.3.4 Problems faced by the bajra producers
Results of opinion survey under taken to know the problems
faced by the farmers in production and marketing of bajra revealed that
lack of technical knowledge about bajra cultivation, lack of technical
persons regarding bajra cultivation were the technical problems faced by
majority of sample farmers, Short supply of labourers, lack of storage
facilities, lack of improved seeds in sowing time were the infrastructural
problems faced by the farmers. High cost of improved variety seeds,
higher marketing cost of bajra, low price of bajra were the major
economic problems faced by majority of sample farmers. Fear of thieves
and stray animals prohibit farmers to take bajra crop was the social
problem faced by cent per cent sample farmers.
5.4 CONCLUSIONS
The important conclusions of the study are:
1. Bajra cultivation was a profitable entity in the study area. Net
income per hectare of bajra cultivation ranged from Rs 5554.31
to Rs 13165.65 on different sized farms. Highest return was
obtained by the large sized farms. Returns per rupee from bajra
cultivation were also very high (Rs 2.29) on large sized farms.
This increased with the increase in size of farms. The average
return was estimated at Rs 1.73 per rupee investment. Per
hectare cost of cultivation (cost C3) was Rs 10184.70 on large
sized farms and highest (Rs 10470.69) on small sized farms
with an overall average of Rs 10362.80. The average A1, A2, B1,
B2, C1 and C2 were Rs 3662.43, Rs. 3662.43, Rs. 4150.73, Rs
8650.73, Rs 4920.73 and Rs 9420.73, per hectare, respectively.
The average cost of production of bajra was Rs 425.99 per
quintal it ranged from Rs 212.29 on large sized farms to Rs
521.02 on small sized farms
2. Total marketing cost was noted to be higher channel-I (Producer
Village Trader Wholesaler retailer) it was ` 194.79 per
quintal for Chomu farmers and Rs 189.44 per quintal for
Renewal farmers. In channel-II (Producer Wholesaler
retailer) the respective marketing costs were Rs 164.39 and Rs
162.89 per quintal, respectively. because of involvement of
intermediaries in the marketing process. In channel-III (Producer
Consumer) there was no marketing cost.
3. There existed significant difference in the margins earned by
different market intermediaries. The village trader had 4.27 per
cent (` 52.66 per quintal) share in the consumer’s rupee in
Chomu market. The share obtained by the wholesaler was 5.54
per cent (` 68.26 per quintal) that of and retailer was 7.74 per
cent (Rs 95.47 per quintal). Among the functionaries, retailer got
the higher margin due to sale of bajra at higher prices to the
consumer
4. There existed significant difference in the margins earned by
different market intermediaries. The village trader had 5.04 per
cent (` 68.45 per quintal) share in the consumer’s rupee in
Renewal market. The share obtained by the wholesaler was
7.10 per cent (` 89.45 per quintal) and that of retailer was 8.35
per cent (Rs 105.25 per quintal). Among the functionaries,
retailer got the higher margin due to sale of bajra at higher
prices to the consumer.
5. The pattern of market arrivals of bajra in different quarters
indicated that 62.72 per cent of market arrivals in Chomu and
52.55 per cent in Renewal were there in the first season. The
arrivals in second and third quarter were only 20.47, 8.48 per
cent in Chomu and 27.58, 13.12 per cent in Renewal market,
respectively. The arrivals of bajra in chomu and renwal mandi
were maxiumum in the first peak season. The arrivals were low
in the subsequent season.
6. Prices of bajra were higher in the second quarter by 9.70 and
8.11 per cent over the first quarter in Chomu and Renewal
market. Prices were law by -4.40 percent, 2.40 in the third and
fourth quarter over the second quarter in Chomu market and by
-4.80 per cent and -1.20 per cent in Renewal market. Thus
farmers got 9 per cent higher prices by sale of bajra in the
second quarter over the first quarter (post harvest sale). It is not
advantageous to early the bajra produce to the third and fourth
quarter of the year.
7. There existed inverse relationship between prices and arrivals of
bajra in the corresponding as well as in subsequent months. The
higher negative value of correlation coefficient for subsequent
months compared to the corresponding months explains that the
effect of prices on arrivals was more pronounced in the
subsequent months.
8. The correlation in yearly prices and arrivals of bajra were
negative in seven years and positive in one year. It reveals that
prices of bajra are not only affected by arrivals but are also
affected by other factors viz., demand, export potential and
seasonality of the crop etc.
9. The most important problems reported by the farmers were lack
of technical knowledge about bajra cultivation, short supply of
labourer, lack of storage facilities, high cost of improved variety
seeds, high marketing cost, low price bajra and fear of thieves
and stray animals to the crop.
BIBLIOGRAPHY
Ahmed, Nazeer, Kumar, R. and Sharma, O.C. (2011). “Problems and
prospects of aromatic crops of cultivation in Jammu and
Kashmir”. South Indian Horticulture, 60 : 67-74.
Chahal,S.S.,and Kataria Poonam,(2010),”Constraints in the production
and Marketing of Maize in Panjab.” Agriculture Update
;5(1/2):228-236.
Changule, R.B., and Gaikwad, G.P.,(2013), “Marketed surplus and Price
Spread in different channels of Maize marketing.” International
Journal of commerce and Business Mangement ,6(1):76-79.
Choudhary, S.N. (2000). “Marketing of Fennel in Tonk District of
Rajasthan, “Unpublished M.Sc. (Ag.) Economics. Thesis,
Rajasthan Agricultural University, Bikaner, Campus-Jobner,
pp. 125-128.
Deshmukh, Pawar,D.S., Landge .B.R., Yeware, V.V., and
P.P.(2010)”Marketed surplus and price spread in different
channels of Pearlmillet marketing.”International Journal of
Commerce and Business Mangement;3(1):41-44.
Dwivedi, Sudhaker and Singh, Tarunvir (2010). “An analytical economics
of saffron cultivation in Jammu and Kashmir”. Journal of Hill
Agriculture, vol. 1 (2):168-171.
Gate. M.R., Khodiar,M.B., Sadhu, B.R. and Shekhar Serene, (2009),
“Cost of cultivation of groundnut Banaskantha distruct of
Gujrat” International research Journal Vol-l issue ll.
Guledgudda, S.S., Vishweshwar, S. and Olekar, J.N. (2002). “Banana
cultivation in Haveri district of Karnataka state”. Indian Journal
of Agricultural Marketing. 16 (1): 51-58.
Kanaujia, V.K., Choudhary, H.P., Kumar, K. and Verma, M. (2009).
“Productivity and profitability of agri-horti system in sub-
tropical region”. Current Advances in Agricultural Science. 1
(1): 38-40.
Kasar, D.V., Pant, R.C. and Rasane, V.S. (1996). “Behavioural of prices
and arrivals of red chillies”. A case study from Maharashtra.
Indian Journal of Agricultural Marketing, 10 (3) : 78-81.
Kaur, H. and Singh, I.P. (2010). “Marketing of Kinnour is Sriganaganar
District of Rajasthan state, Indian Journal of Agricultural
Marketing, 24 (1) : pp. 141-149.
Killedar N.S., Lahor, N.S., Babar, V.S. and Ingarale, M.T. (2002).
“Economics of production and marketing of Ginger in Satara
District of Western Maharashtra” Indian Journal of Agricultural
Marketing; 16(2), pp.76-77.
Kumar Virender; Sharma, H.R. and Sharma, R.K. (2006), “Markets
Arrivals and price behaviour of potato A study of four
Metropolitan markets”. Indian Journal of Agricultural
Marketing, 20 (1) ; 78-89.
Lal, B., (1994), ”Production and marketing of Bajra in Jaipur district of
Rajasthan”. Unpublished M.Sc (Ag.). Agricultural economics
Thesis , RAU, Bikaner.
Mehta Subhash Chander, Sube Singh Hasija ,S.K., and R.C. (2006)
“Constraints in adaptation of recommended Pearlmillet
production technology in dryland farming.”Annals of Agri Bio
Research ;11(1):81-87.
Mishra, S.K.,”Economics analysis of Production and Marketing of Green
pea in Jaipur District (Rajasthan)”, Unpublished M.Sc. (Ag.)
Agricultural Economics Thesis, Rajasthan Agriculture
University, Bikaner, Campus- Jobner, 1998, pp. 108-116.
Nahatkar, S.B.,Sharma, H.O., and Chauhan, R.S.,(1999) “Analysis of
market arrivals and prices of Wheat in Sehore regulated
market of Madhya Pardesh” Agriculture marketing, 41 (4):5-8
Rajur B.C., Patel, B.L. and Basavaraj (2008). “Economics of chilli
production in Karnataka”. Karnataka Journal of Agricultural
Science, 21 (2), pp. 237-240.
Ram, S., Kumar, S., Singh, V., Ram, P., Tomar, V.K.S. and Singh, A.K.
(2012). “Economics of production to marketing of aromatic
crops in Uttar Praeesh”. Agriclrual Economics Research
Review, 25 (1) : 157-160.
Shah, S.P. and Zala, Y.C. (2006). “Cost-benefit analysis of Ginger
cultivation in middle Gujarat” Agricultural Economics Research
Review, 19 (Conf. issue) : 206.
Sharma, S.M., and Dahiya R.H. (2013), Economics of Tomato cultivation
in Jaipur District of Rajasthan . Annals of Horticulture 6(11):1-
11.
Shashikant, V.G.,Dubey,L.R. and Arpita Kotnala,(2013),”Constraints
faced by Red gram growers in Gulbarga district of Karnataka,”
Environment and Ecology,31(2):440-443.
Shelke, S.D.,Nagure,D.V.,and Patil, S.N.(2009),”Price spread and
marketing pattern of Groundnut in Maharashtra State.”
Agriculture update;4(3/4):376-378. 2 ref.
Singh and Toppo, (2010), “Economics of production and marketing of
tomato in kanke block of Ranchi District Maharashtra .” Indian
Journal of Agricultural Marketing, 24(2).
Singh, Gaganjat, S.S. Chandraj and P.Kataria , (2010),”A study on
behaivour of arrivals and prices of green chillies in Panjab”.
Indian Journal of Agricultural Marketing, 24(1).
Singh, H.,Singh, P., and Bairwa, K.C.,(2013),” To study the Trends of
Market arrivals and prices of Rapeseed- Mustard in Bharatpur
district of Rajasthan.” Annual Agriculture Research, New
Series Volume 34(3):281-285.
Singh, S.R. and Sharma, P. (2011). “Problems and prospects in
production and marketing of mint oil in Moradabad district of
Uttar Pradesh”. Indian Journal of Agricultural Marketing, 25 (1)
: 21-35.
Thombre, A.P., More, S.S.,(2013),”Market arrivals and prices of Pigeon
pea in Mahathwada region (M.S).”Agriculture
update;8(1/2):122-124. 3 ref.
Tripathi, A.K., Mandal, Subhasis, Datta, K.K. and Verma, M.R. (2006).
“A study on marketing of Ginger in Ri-Biho district of
Meghalaya” Indian Journal of Marketing, 20 (2): pp. 106-115.
Vekariya, S.B., Khant, K.A. and Gajupara, H.M. (2006). “Price behavior
of major vegetables in Gujarat State. Indian Journal of
Agicultural Marketing, 20 (1) : 28-37.

Production and Marketing of Bajra in Jaipur District of Rajasthan
Sumitra Jakhar Dr. Pradeep
Kumar
(Research Scholar) (Major Advisor)
ABSTRACT
The present investigation was carried out to study the cost
structure and returns from cultivation of bajra crop, marketing
costs, margins, price spread in marketing of bajra, relationship
between market arrivals and prices of bajra in the selected
markets and problems faced by the farmers in production and
marketing of bajra. A sample of 60 bajra cultivators was selected
for detailed study.
Post graduate student, Department of Agricultural Economics, S.K.N. College of Agriculture,
Jobner Associate Professor, Department of Agricultural Economics, S.K.N. College of Agriculture, Jobner
The state of Rajasthan occupies the eminent position in
production of bajra in the country. Bajra is grown mainly in
Barmer, Jodhpur, Nagaur, Alwar, and Jaipur districts of the state.
Primary data were collected for the agricultural year 2012-13. The
secondary data were collected from the records Krishi Upaj Mandi
Samiti Chomu and Krishi Upaj Mandi Samiti Renwal in the study
area.
In the selected farms the cost of cultivation (cost C3) per
hectare of bajra was ` 10184.35 on large sized farms and `
10470.69 on small sized farms with an overall average of `
10362.80. The various costs in cultivation viz., cost A1, A2, B1, B2,
C1 and C2 were ` 3662.43, ` 3662.43, ` 4150.73, ` 8650.73, `
4920.73 and ` 9420.73 per hectare, respectively. Human labour
cost accounted the major share (6.24 to 18.79 per cent) in total
operational costs. The other important operational cost was costs
of FYM, machine lobour, plant protection chemical, seed and
fertilizer.
The cost of production was ` 212.29 per quintal on large
sized farms ` 521.02 per quintal on small sized farms with an
overall average of ` 425.99 per quintal. Cultivation of bajra crop
has been a profitable entity in the study area. Net income in bajra
crop cultivation ranged from ` 5554.31 to ` 13165.65 per hectare
on different sized farms. Highest returns was obtained by the
large sized farms return per rupee from cultivation of bajra crop
was highest on large sized farms (`. 2.29) and lowest on small
sized farms (` 1.53) with an average of ` 1.73.
The total marketing cost of bajra was higher in channel-I (`
194.79 per quintal for Chomu farmers and 189.44 per quintal for
Renwal farmers) followed by channel-II (` 164.39 per quintal for
chomu farmers and 162.89 per quintal for Renwal farmers)
because of involvement of intermediaries in the marketing
process. In channel-III there was no marketing cost. Marketing
margins accounted to 17.55 per cent and 20.49 per cent of
consumer’s price in village sale in Chomu and Renwal farmers
and 13.28 and 15.45 per cent margins in sale of Mandi in Chomu
and Renwal farmers. Retailers got higher margins in sale of bajra
in both villages and Mandi sale compared to the wholesaler.
Producers share in consumer’s rupee was 66.66 per cent and
64.47 per cent in sale of bajra at village sale in Chomu and
Renwal farmers and 73.39 per cent and 71.62 per cent at
regulated market of Chomu and Renwal.
Sixty two percent and fifty two per cent bajra produce
arrived in the first quarter (Oct.-Dec.) of the year in Chomu and
Renwal markets. The arrivals were 20.47, 27.58, 8.48, 13.12 and
8.32, 6.73 per cent in the second, third and fourth quarters in
Chomu and Renwal markets. Farmers got 9.70 per cent and 8.11
per cent higher price by sale of bajra in the second quarter over
the post harvest quarter (Peak season) selling of bajra in the third
and fourth quarters of the year was not found advantageous.
The correlation coefficient between monthly wholesale
prices and arrivals of bajra in the corresponding months and in
the subsequent months were -0.675,-0.520 and -0.677, -0.490,
showing that there exist inverse relationship between the two and
the value of correlation coefficient has been higher for the
subsequent months than for the corresponding months. The value
of correlation coefficient between yearly arrivals and prices of
bajra were negative in six years and positive only in two years out
of the eight years study period.
Results of opinion survey showed that the major constraints were
short supply of labourers, high cost of improved variety seeds, low prices
of bajra were the most important problems faced by the farmers.
jktLFkku ds t;iqj ftys esa cktjs dk mRiknu vkSj foi.ku
lqfe=k tk[kM+ Mk¡- iznhi dqekj
¼'kks/kdÙkkZ½ ¼eq[; lykgdkj½
lkajk’k
orZeku vUos"k.k jktLFkku jkT; esa cktjsa ds ykxr lajpuk ,oa
mRiknu ls izkIr izfrQy] cktjsa dh foi.ku foi.ku esa ykxr o dher
foLrkj cktjsa dh vkod rFkk dherks ds chp lEcU/k rFkk cktjsa ds
LukrdksÙkj Nk=k] df̀"k vFkZ'kkL= foHkkx] Jh d.kZ ujsUnz df̀"k egkfo|ky;] tkscusj lgvkpk;Z] df̀"k vFkZ'kkL= foHkkx] Jh d.kZ ujsUnz df̀"k egkfo|ky;] tkscusj
mRiknu ,oa foi.ku esa d`"kdksa }kjk n`f"Vxr leL;kvksa dks Hkh tkuus gsrq
iz;Ru fd;k x;kA
foLr`r v/;;u gsrq lkB cktjk mRikndksa dk p;u fd;k x;kA
jktLFkku jkT; cktjk mRiknu dh n`f"V ls ns’k esa ,dkf/kdkj
j[krk gSA jkT; esa cktjsa dh Qly eq[;r;k ckMesj] tks/kiqj] ukxkSj]
vyoj] vkSj t;iqj ftyksa esa gksrk gSA izkFkfed }kjk d`f"k o"kZ 2012&13
ds fy, ,d= fd, x, FksA ek/;fed MsVk v/;;u ds {ks= esa fjdkMZ d`f"k
mit eaMh lfefr pkSew vkSj d`f"k mit eaMh jsuoky ls ,d= fd, x,
FksA
p;fur fdlkuksa esa cktjsa dh Qly ds d` f"kr esa dqy ykxr
¼ykxr l3½ nh/kZ tksrksa ij 10184-35 :i;s izfr gSDV;j ,oa y/kq tksrksa ij
10470-69 :i;s izfr gSDVj FkhA Qly dh vkSlr d`f"kr djus dh dqy
ykxr 10362-80 :i;s FkhA cktjs dh dqy ifjorZu ykxr v] vkyx v2]
ykxr c1] ykxr c2] ykxr l1] ,oa ykxr l2 Øe’k% 3662-43 :i;s]
3662-43 :i;s] 4150-73 :i;s 8650-73 :i;s] 4920-73 :i;s ,oa 9420-73
:i;s izfr gsDV;j ikbZ xbZA]
cktjs dh ifjorZu ykxr esa ekuo Je dh ykxr ¼6-24 ls 18-79
izfr’rk½ izeq[k FkhA ifjorZu’khy ykxr ds nqljs eq[; L=ksrksa esa xkscj dh
[kkn] ;kaf=d Je] ikS/k laj{k.k jlk;u] cht] vkSj moZjd dh ykxr gksuk
ik;k x;kA
cktjsa dh mRiknu ykxr nh?kZ tksrksa ij 212-29 :i;s izfr fDoaVy
,oa y?kq tksrsa ij 521-02 :i;s izfr fDoaVy ds e/; Fkh rFkk v/;;u {ks=
esa vkSlr ykxr 425-99 :i;s izfr fDoaVy ikbZ xbZA
v/;;u {ks= esa cktjsa mRiknu ,d ykHkizn m/ke gSA cktjsa dh
[ksrh ls fofHkUu tksr vkdkjksa ij 'kq} vk; 5554-31 :i;s ls 13165-65
:i;s izfr gSDVj ds e/; FkhA Qly ds d`f"kr djus ls vf/kdre izfrQy
nh/kZ tksrksa ij ik;k x;kA cktjk dh Qly ls izfr :i;s izfrQy
vf/kdre nh/kZ tksrksa ij ¼2-29 :i;s½ rFkk U;wure izfrQy y/kq tksrksa ij
¼1-53 :i;s½ ,oa vkSlr izfrQy 1-73 :i;s ik;k x;kA
cktjsa dk fczdh esa dqy foi.ku ykxr ¼194-79 :i;s izfr fDoaVy½
pkSew fdlkuksa ds fy, vkSj 189-44 :i;sa izfr fDoaVy jsuoky fdlkuksa ds
fy,½ esa 164-39 :i;s izfr fDoaVy pkSew fdlkuksa ds fy, vkSj 162-89 :i;s
izfr fDoaVy jsuoky fdlkuksa ds fy, f}fr; ek/;e dh Fkh tks fd izFke
ek/;e esa fcpkSfy;ksa dh Hkkxhnkjh ds dkj.k vf/kd FkhA rhljsa ek/;e esa
foi.ku ykxr ugh FkhA xzkeh.k {ks= esa foØ; djus ij ,oa e.Mh esa foØ;
djus ij e.Mh eas foØ; esa mRikndksa dks miHkksDrk dherksa esa ls izkIr
ykHkka’k Øe’k% ` 66.66, 64.47 ,oa ` 73.39, 71.62 izfr’kr pkSew ,oa
jsuoky fdlkuksa esa ik;k x;kA [kqnjk O;kikjh dks Fkksd O;kikjh dh vis{kk
xzkeh.k foØ; ,oa e.Mh foØ; djus dh nksuksa fof/k;ksa esa vf/kd foi.ku
ykHk izkIr gksrk gSA mRiknu d`"kdksa dk miHkksDrk dherksa esa va’k] xkaoksa esa
foØ; djus ij ` 17.55, 20.49 izfr’kr ,oa pkSew ,oa jsuoky+ fu;af=r e.Mh
esa foØ; djus ij ` 13.28,15.47 izfr’kr ik;k x;kA mRiknd d̀"kdksa dks
fu;af=r e.Mh esa ys tkdj vius pkoy ds mRikn dks foØ; djus ij 4-
27, 5.04 izfr’kr vf/kd ykHkka’k izkIr gksrk gSA
cktjk mRiknu dh 62 vkSj 52 izfr’kr vkod o"kZ ds igys frekgh
¼vDVqcj&* fnlEcj½ esa pkSew vkSj jsuoky cktjksa esa o`f}A nwljs] rhljs ,oa
pkSFks] frekgh esa dqy vkod dk Øe’k% 20-47] 27-58] 8-48] 13-21 rFkk
rFkk 8-32] 6-32 izfr’kr pkSew vkSj jsuoky cktjkjksa esa vkod gqbZA d`"kdksa
dks dVkbZ ds rqjUr ckn ds frekgh dh vis{kk nqljsa frekgh esa cktjsa dks
cpsus ij 9-70 ,oa 8-11 izfr’kr T;knk dher izkIr gqbZA cktjsa dh fczdh
rhljs ,oa pkSFks frekgh esa dlk ykHkizn ugh ik;k x;kA
vuq:Ik ,oa rnUrj ekg ds dherksa ,oa vkod ds ek/;e
lg&lEcU/k xq.kkad Øe’k% &0-675] &0-52 vkSj &0-677] &0-490 FkkA ;g
xq.kkad nksuksa ds e/;e +_.kkRed lEcU/k n’kkZrk gS rFkk lg&lEcU/k
xq.kkad dk eku vuq:I ekg ds ctk; rnUrj ekg esa T;knk ik;k x;kA
cktjsa dh o"kZ Hkj dh dqy vkod vkSj dherksa ds e/; lg&lEcU/k xq.kkad
vkB o"kksZ ds v/;;u dky esa ls N% o"kksZ esa xq.kkRed ,oa nks o"kksZ esa
/kukRed ik;k x;kA
losZ{k.k ds ifj.kkeksa }kjk Kkr gqvk fd Jfedksa dh iwfrZ dh deh]
xq.kkRrk fdLe ds chtksa dh mPp ykxr] cktjsa dh de dher dh vf/kd
egRoiw.kZ leL;k,a FkhA
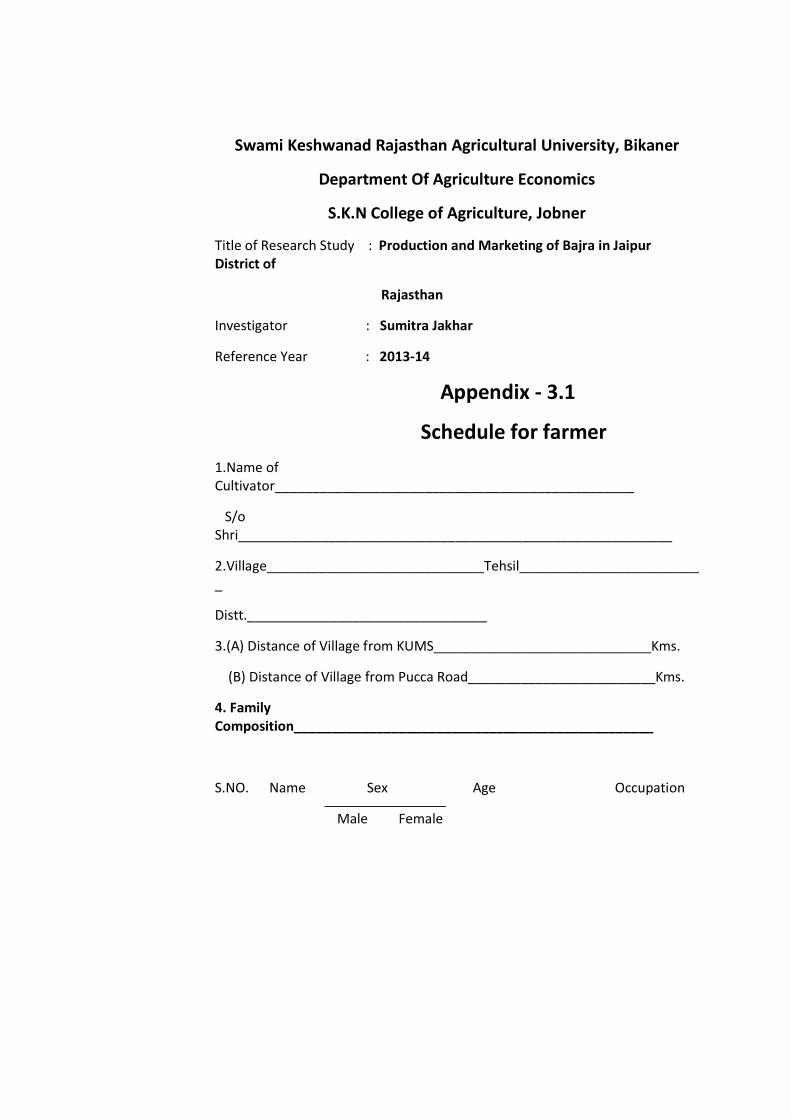
Swami Keshwanad Rajasthan Agricultural University, Bikaner
Department Of Agriculture Economics
S.K.N College of Agriculture, Jobner
Title of Research Study : Production and Marketing of Bajra in Jaipur District of
Rajasthan
Investigator : Sumitra Jakhar
Reference Year : 2013-14
Appendix - 3.1
Schedule for farmer
1.Name of Cultivator________________________________________________
S/o Shri__________________________________________________________
2.Village_____________________________Tehsil_________________________
Distt.________________________________
3.(A) Distance of Village from KUMS_____________________________Kms.
(B) Distance of Village from Pucca Road_________________________Kms.
4. Family Composition________________________________________________
S.NO. Name Sex Age Occupation
Male Female
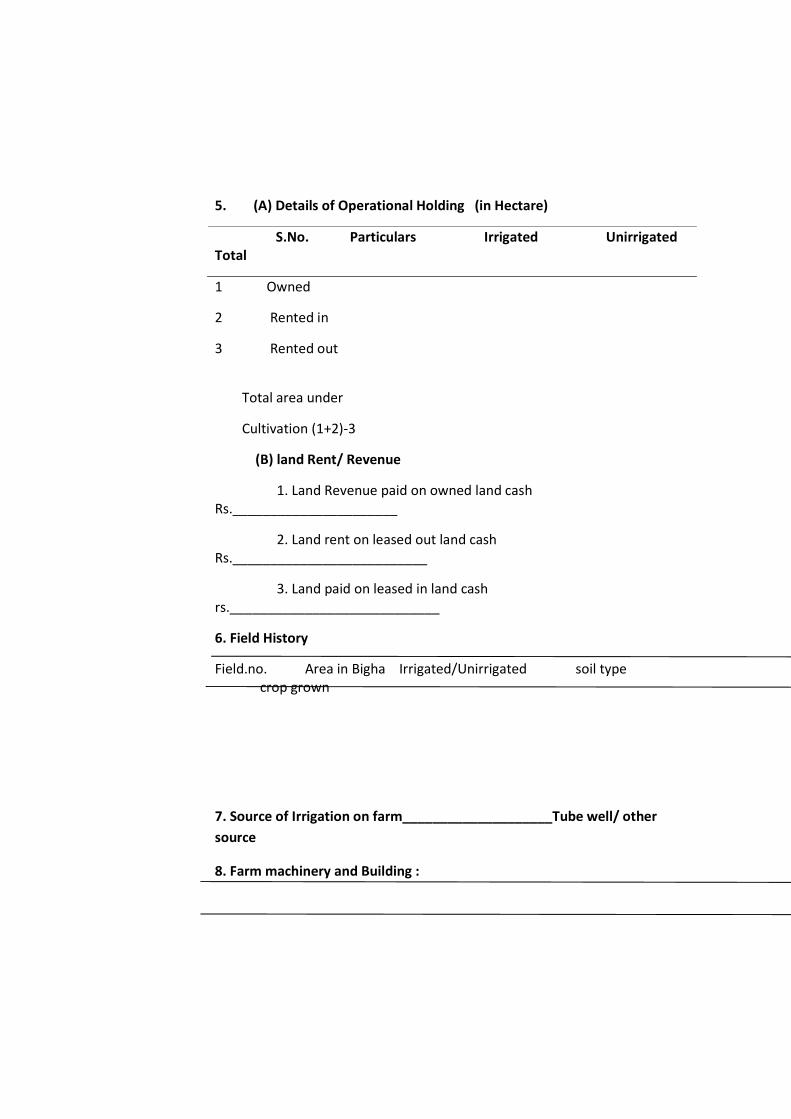
5. (A) Details of Operational Holding (in Hectare)
S.No. Particulars Irrigated Unirrigated Total
1 Owned
2 Rented in
3 Rented out
Total area under
Cultivation (1+2)-3
(B) land Rent/ Revenue
1. Land Revenue paid on owned land cash Rs.______________________
2. Land rent on leased out land cash Rs.__________________________
3. Land paid on leased in land cash rs.____________________________
6. Field History
Field.no. Area in Bigha Irrigated/Unirrigated soil type crop grown
7. Source of Irrigation on farm____________________Tube well/ other
source
8. Farm machinery and Building :
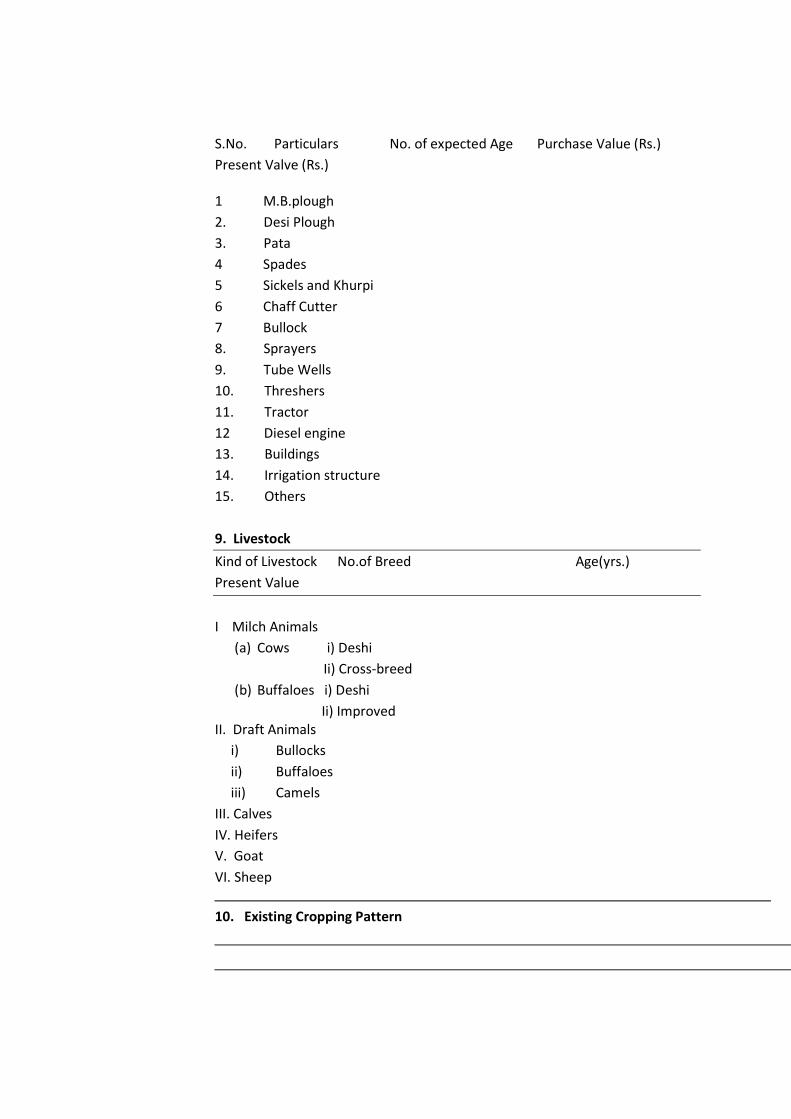
S.No. Particulars No. of expected Age Purchase Value (Rs.)
Present Valve (Rs.)
1 M.B.plough
2. Desi Plough
3. Pata
4 Spades
5 Sickels and Khurpi
6 Chaff Cutter
7 Bullock
8. Sprayers
9. Tube Wells
10. Threshers
11. Tractor
12 Diesel engine
13. Buildings
14. Irrigation structure
15. Others
9. Livestock
Kind of Livestock No.of Breed Age(yrs.)
Present Value
I Milch Animals
(a) Cows i) Deshi
Ii) Cross-breed
(b) Buffaloes i) Deshi
Ii) Improved II. Draft Animals
i) Bullocks
ii) Buffaloes
iii) Camels
III. Calves
IV. Heifers
V. Goat
VI. Sheep
10. Existing Cropping Pattern
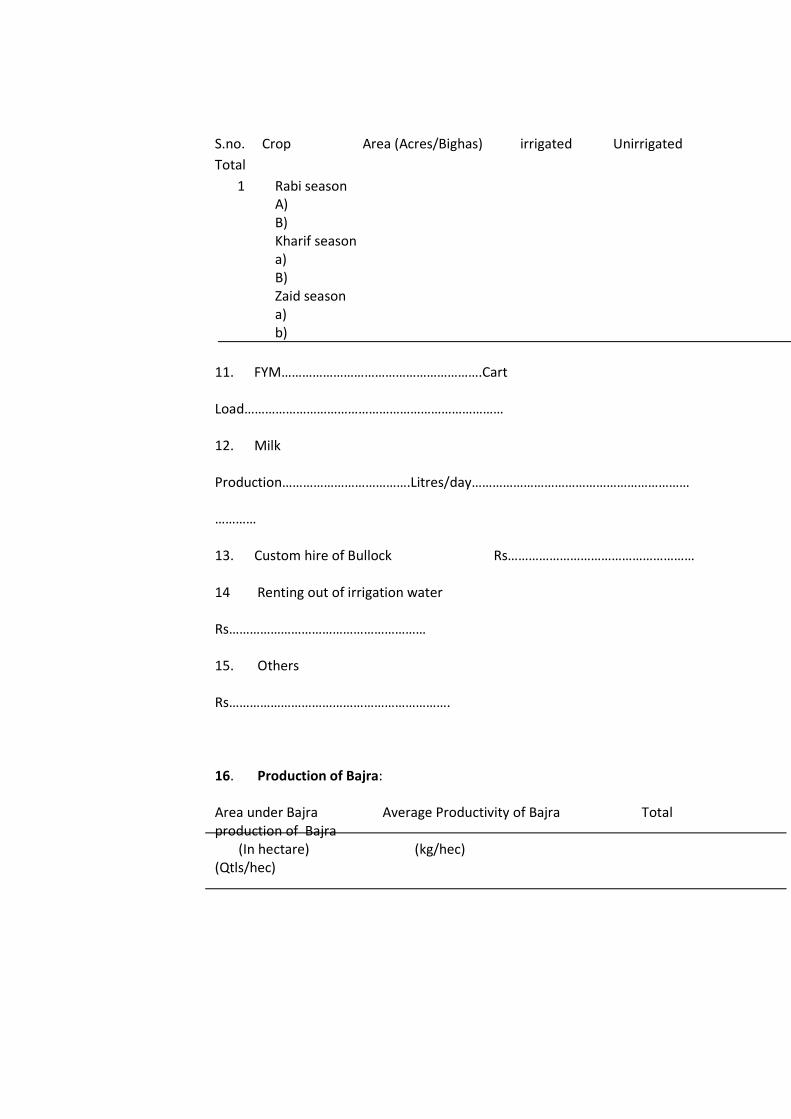
S.no. Crop Area (Acres/Bighas) irrigated Unirrigated
Total
1 Rabi season A) B) Kharif season a) B) Zaid season a) b)
11. FYM………………………………………………….Cart
Load…………………………………………………………………
12. Milk
Production……………………………….Litres/day………………………………………………………
…………
13. Custom hire of Bullock Rs………………………………………………
14 Renting out of irrigation water
Rs…………………………………………………
15. Others
Rs……………………………………………………….
16. Production of Bajra:
Area under Bajra Average Productivity of Bajra Total production of Bajra (In hectare) (kg/hec) (Qtls/hec)
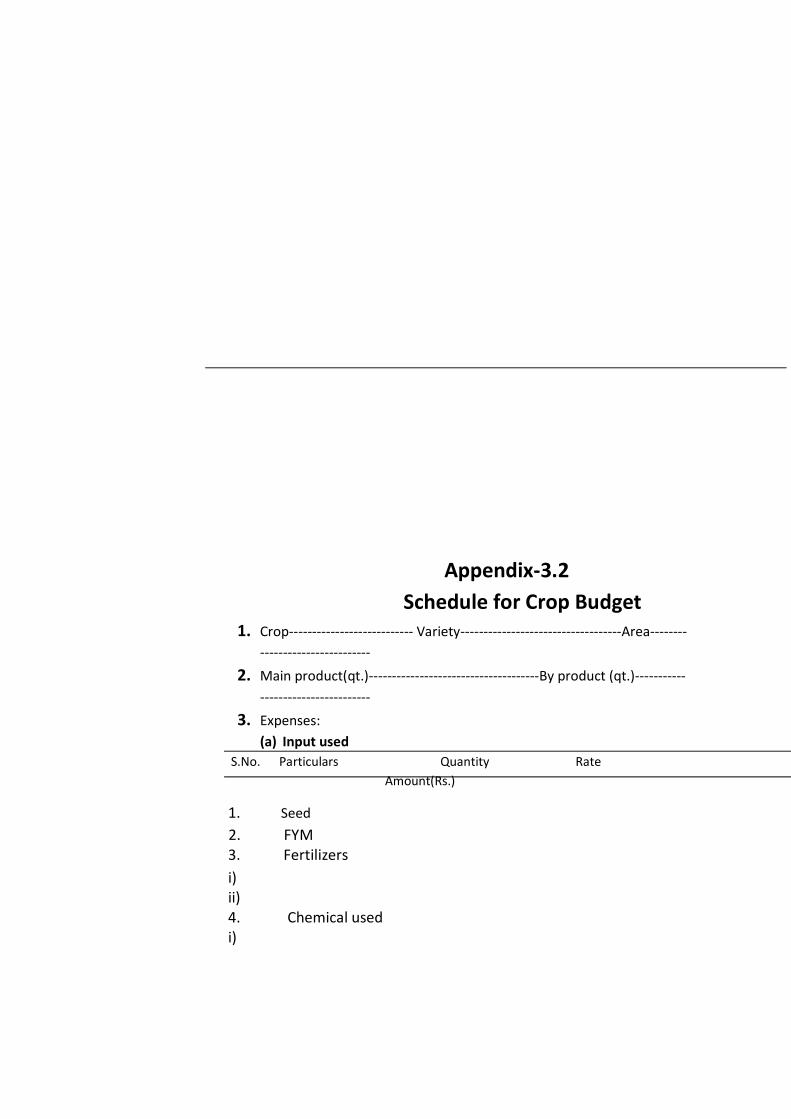
Appendix-3.2
Schedule for Crop Budget 1. Crop--------------------------- Variety-----------------------------------Area--------
------------------------
2. Main product(qt.)-------------------------------------By product (qt.)-----------
------------------------
3. Expenses:
(a) Input used
S.No. Particulars Quantity Rate
Amount(Rs.)
1. Seed
2. FYM 3. Fertilizers
i) ii) 4. Chemical used i)
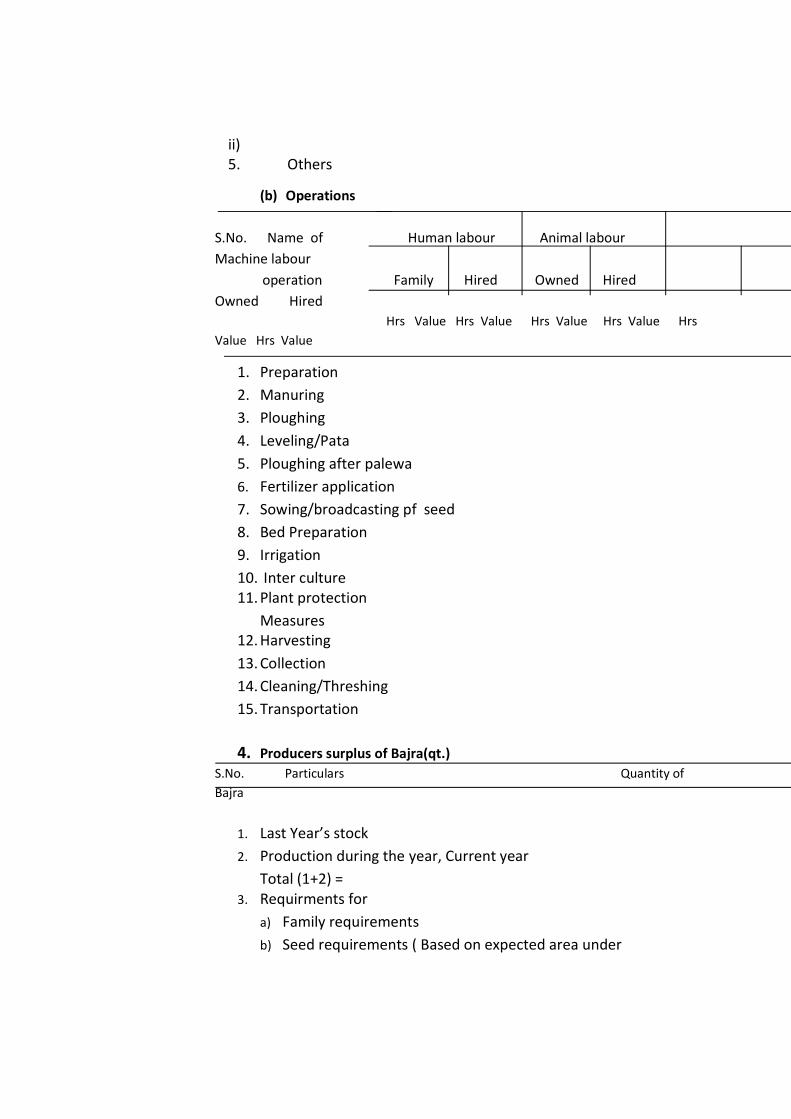
ii) 5. Others
(b) Operations
S.No. Name of Human labour Animal labour
Machine labour
operation Family Hired Owned Hired
Owned Hired
Hrs Value Hrs Value Hrs Value Hrs Value Hrs
Value Hrs Value
1. Preparation
2. Manuring
3. Ploughing
4. Leveling/Pata
5. Ploughing after palewa
6. Fertilizer application
7. Sowing/broadcasting pf seed
8. Bed Preparation
9. Irrigation
10. Inter culture 11. Plant protection
Measures 12. Harvesting
13. Collection
14. Cleaning/Threshing
15. Transportation
4. Producers surplus of Bajra(qt.)
S.No. Particulars Quantity of
Bajra
1. Last Year’s stock
2. Production during the year, Current year
Total (1+2) = 3. Requirments for
a) Family requirements
b) Seed requirements ( Based on expected area under
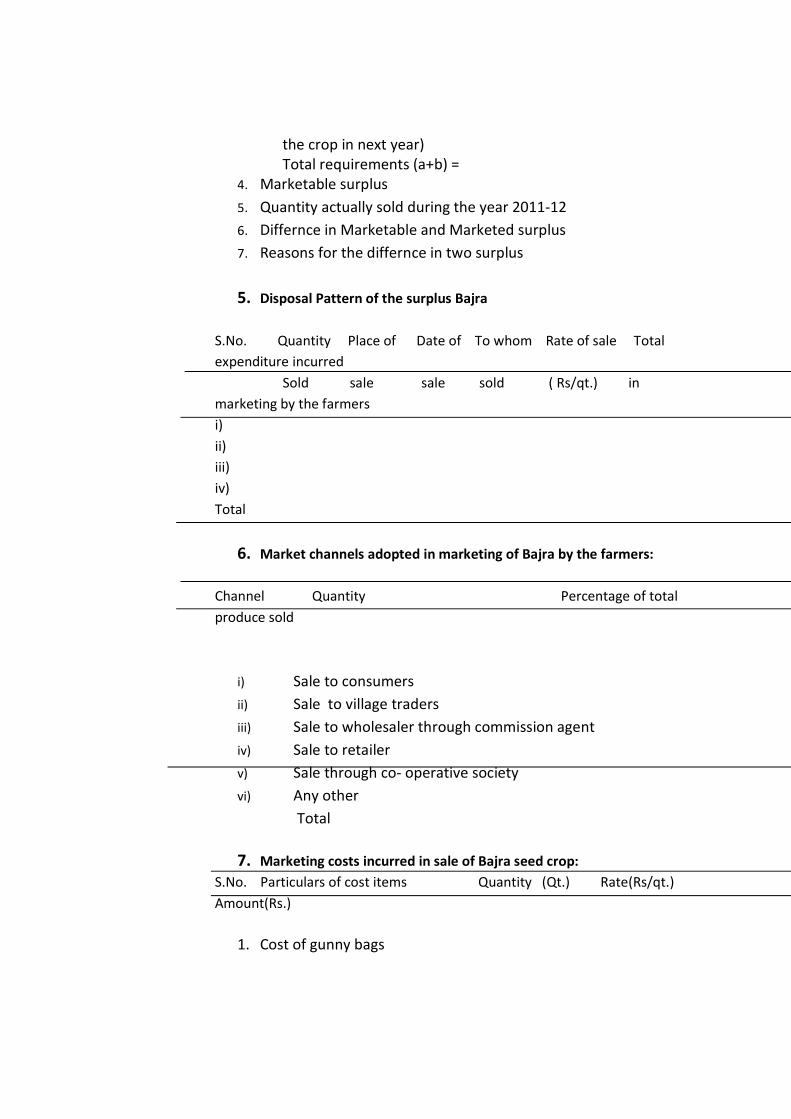
the crop in next year) Total requirements (a+b) =
4. Marketable surplus
5. Quantity actually sold during the year 2011-12
6. Differnce in Marketable and Marketed surplus
7. Reasons for the differnce in two surplus
5. Disposal Pattern of the surplus Bajra
S.No. Quantity Place of Date of To whom Rate of sale Total
expenditure incurred
Sold sale sale sold ( Rs/qt.) in
marketing by the farmers
i)
ii)
iii)
iv)
Total
6. Market channels adopted in marketing of Bajra by the farmers:
Channel Quantity Percentage of total
produce sold
i) Sale to consumers
ii) Sale to village traders
iii) Sale to wholesaler through commission agent
iv) Sale to retailer
v) Sale through co- operative society
vi) Any other
Total
7. Marketing costs incurred in sale of Bajra seed crop:
S.No. Particulars of cost items Quantity (Qt.) Rate(Rs/qt.)
Amount(Rs.)
1. Cost of gunny bags
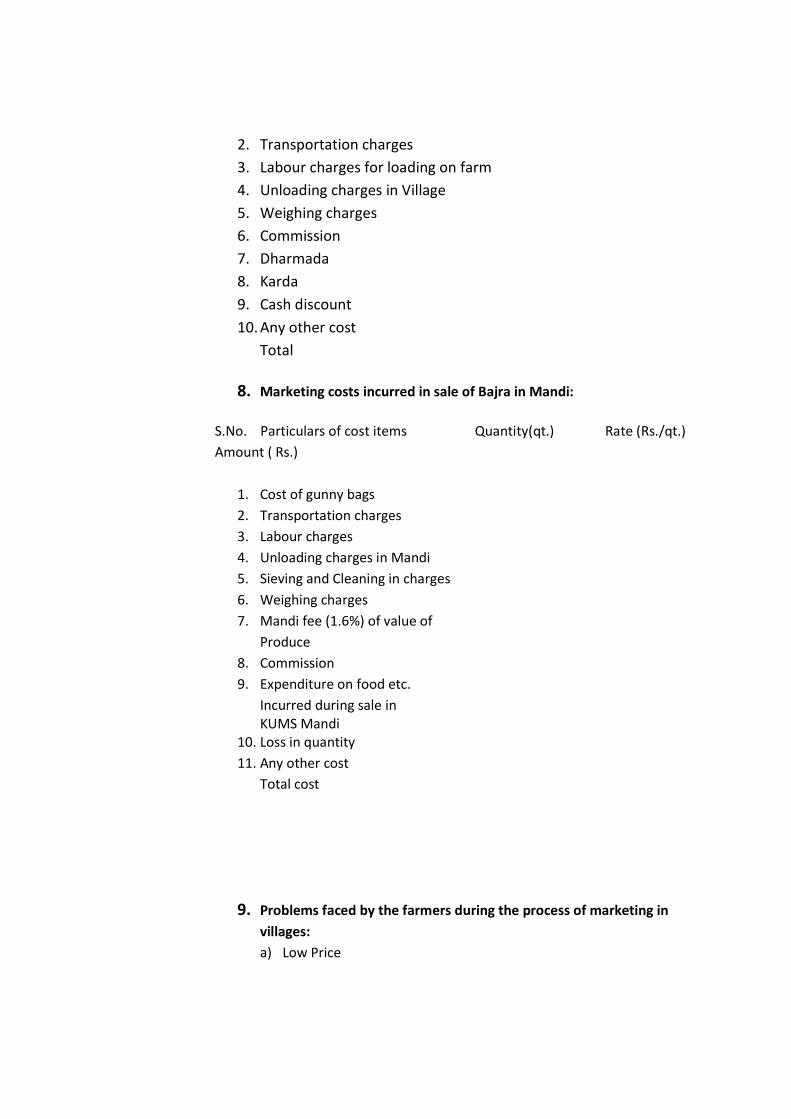
2. Transportation charges
3. Labour charges for loading on farm
4. Unloading charges in Village
5. Weighing charges
6. Commission
7. Dharmada
8. Karda
9. Cash discount
10. Any other cost
Total
8. Marketing costs incurred in sale of Bajra in Mandi:
S.No. Particulars of cost items Quantity(qt.) Rate (Rs./qt.)
Amount ( Rs.)
1. Cost of gunny bags
2. Transportation charges
3. Labour charges
4. Unloading charges in Mandi
5. Sieving and Cleaning in charges
6. Weighing charges
7. Mandi fee (1.6%) of value of
Produce
8. Commission
9. Expenditure on food etc.
Incurred during sale in KUMS Mandi
10. Loss in quantity
11. Any other cost
Total cost
9. Problems faced by the farmers during the process of marketing in
villages:
a) Low Price
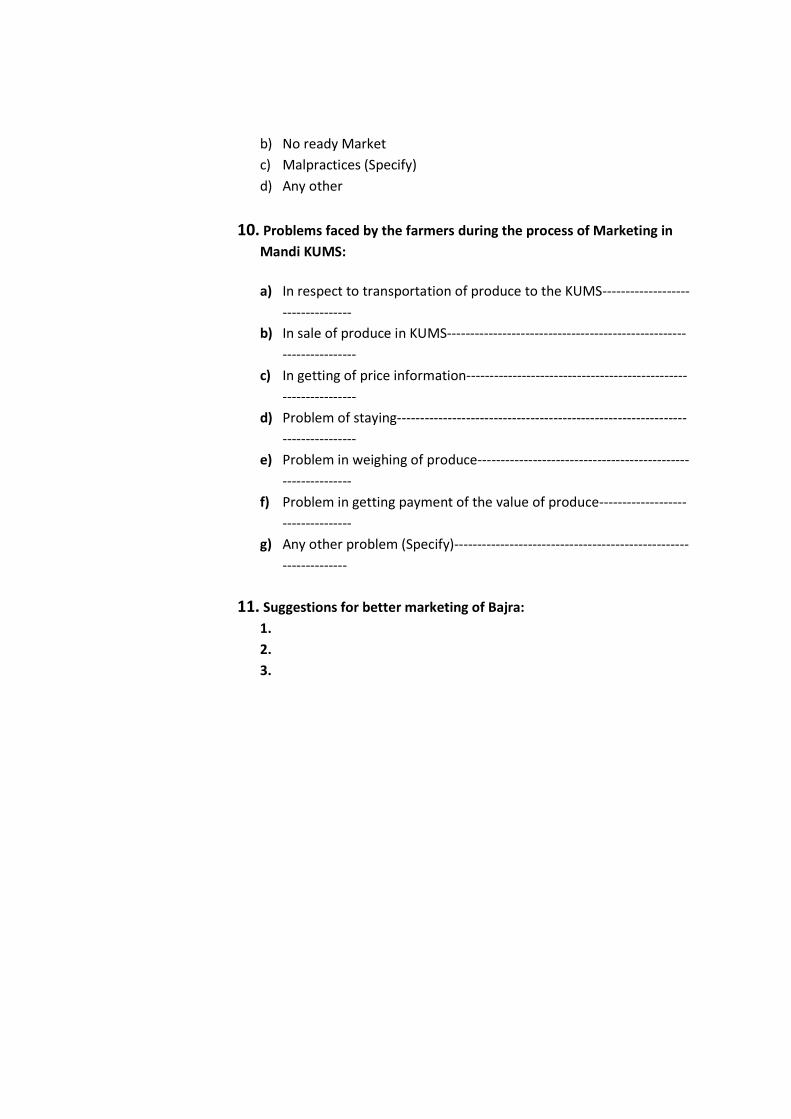
b) No ready Market
c) Malpractices (Specify)
d) Any other
10. Problems faced by the farmers during the process of Marketing in
Mandi KUMS:
a) In respect to transportation of produce to the KUMS-------------------
---------------
b) In sale of produce in KUMS----------------------------------------------------
----------------
c) In getting of price information------------------------------------------------
----------------
d) Problem of staying---------------------------------------------------------------
----------------
e) Problem in weighing of produce----------------------------------------------
---------------
f) Problem in getting payment of the value of produce-------------------
---------------
g) Any other problem (Specify)---------------------------------------------------
--------------
11. Suggestions for better marketing of Bajra:
1.
2.
3.
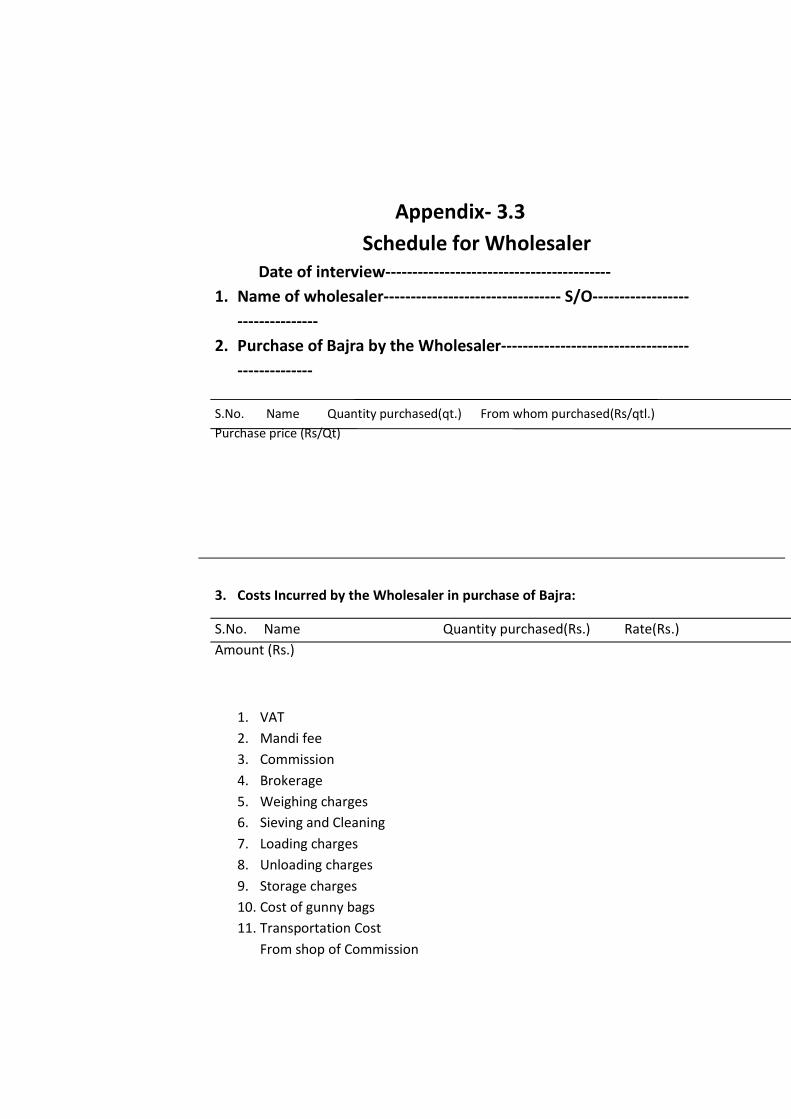
Appendix- 3.3
Schedule for Wholesaler Date of interview------------------------------------------
1. Name of wholesaler--------------------------------- S/O------------------
---------------
2. Purchase of Bajra by the Wholesaler-----------------------------------
--------------
S.No. Name Quantity purchased(qt.) From whom purchased(Rs/qtl.)
Purchase price (Rs/Qt)
3. Costs Incurred by the Wholesaler in purchase of Bajra:
S.No. Name Quantity purchased(Rs.) Rate(Rs.)
Amount (Rs.)
1. VAT
2. Mandi fee
3. Commission
4. Brokerage
5. Weighing charges
6. Sieving and Cleaning
7. Loading charges
8. Unloading charges
9. Storage charges
10. Cost of gunny bags
11. Transportation Cost
From shop of Commission
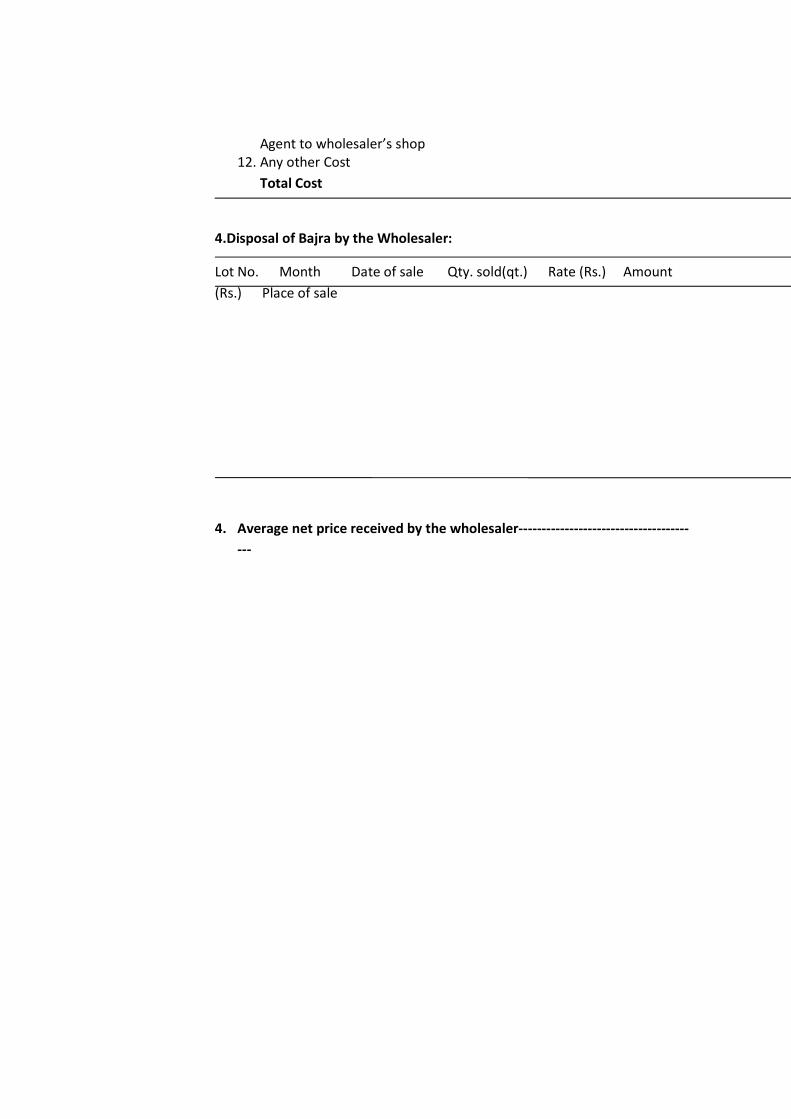
Agent to wholesaler’s shop 12. Any other Cost
Total Cost
4.Disposal of Bajra by the Wholesaler:
Lot No. Month Date of sale Qty. sold(qt.) Rate (Rs.) Amount
(Rs.) Place of sale
4. Average net price received by the wholesaler-------------------------------------
---
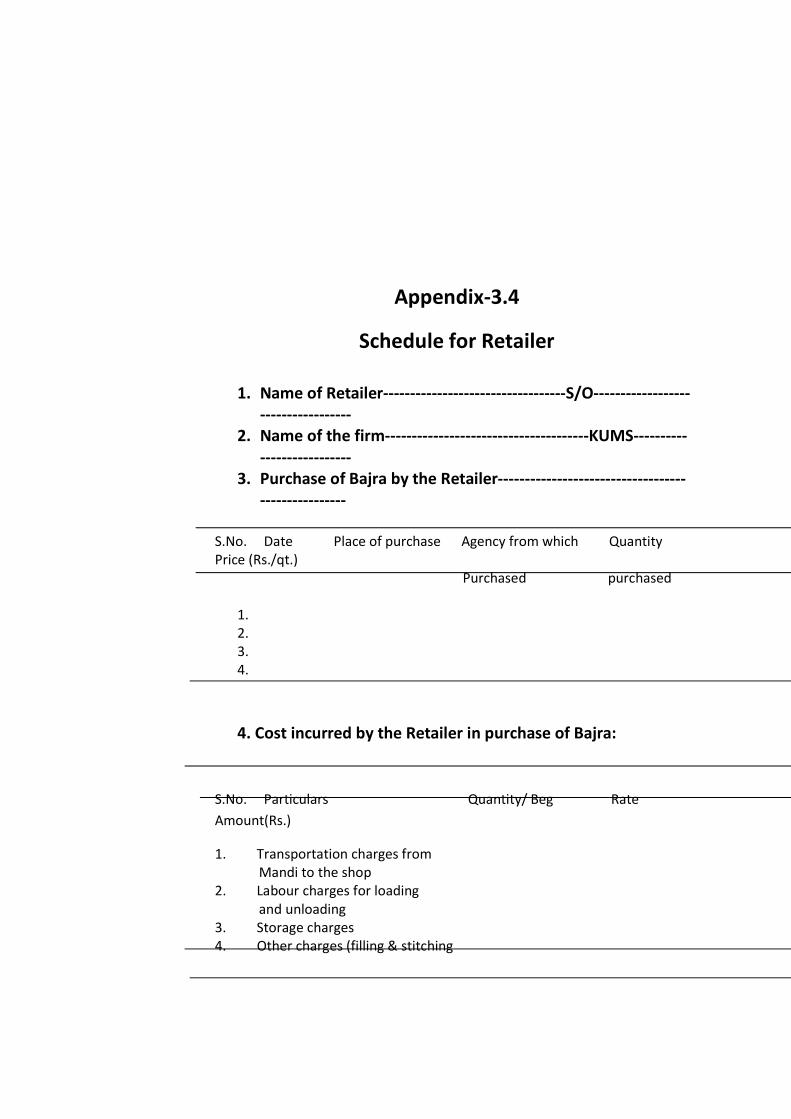
Appendix-3.4
Schedule for Retailer
1. Name of Retailer----------------------------------S/O-----------------------------------
2. Name of the firm--------------------------------------KUMS---------------------------
3. Purchase of Bajra by the Retailer---------------------------------------------------
S.No. Date Place of purchase Agency from which Quantity Price (Rs./qt.) Purchased purchased
1. 2. 3. 4.
4. Cost incurred by the Retailer in purchase of Bajra:
S.No. Particulars Quantity/ Beg Rate
Amount(Rs.)
1. Transportation charges from Mandi to the shop 2. Labour charges for loading and unloading 3. Storage charges 4. Other charges (filling & stitching
bag and sutli charges etc.)
Total Costs
5. Sale of Bajra
S.No. Date of sale To whom sold Quantity (qt.) Rate(Rs.) Amount(Rs.)
1. 2. 3. 4.
6. Net price received by the Retailer------------------------------------
--------
Appendix-3.5
Schedule for Mandi 1. Date of Establishment -----------------------------------------------
2. Area commanded-------------------------------------------------------
3. Information about different agriculture products handled
by Mandi
S.No. Particulars Quantity in different
years (qtl.)
2010-11
2011-12
1. Name of different agriculture Products handled by the Mandi (A) (B) (C) (D) (E) (F)
2. Bajra handled
4. Information about middlemen in Mandi:
S.No. Category of middlemen Number of registered Number of middlemen Middlemen in Mandi dealing in Bajra during Last 2 years
1.
2.
5. Information (General information) about Mandi particularly
to Bajra
6. Prescribed charges for sale of Bajra in the KUMS:
S.No. Charges Rate By whom
payable
1. Mandi fee 2. Loading charges 3. Unloading charges 4. Sieving and cleaning Charges 5. Commission 6. Weighing charges 7. other charges (specify)
7.Information obtained from Mandi secretary (based on his experience):
(a) Comman marketing channels in marketing of Bajra---------------------
--------------------
i) : -------------------------------------------------------------------------------------------------------
ii) : ----------------------------------------------------------------------------------------------------
(b) Area from where Bajra comes for sale in the KUMS
i) :----------------------------------------------------------------------------------------------------------
ii) :-----------------------------------------------------------------------------------------------------------
(c) Area to which Bajra is taken by the traders of the KUMS for further sale:
i) with in state
ii) outside the state
(d) Method of sale followed in sale of Bajra in the KUMS:
e) Method of weighing followed for Bajra ------------------------------------------------
f) Suggestions, if any (regarding improvement in marketing of Bajra):
1. 2. 3. 4. 5. 6.
Appendix-4
SCHEDULE FOR PROBLEMS FACED BY THE FARMERS
S.NO Particulars
Yes/ No
A. Production constraints
Lack of technical knowledge about Bajra cultivation
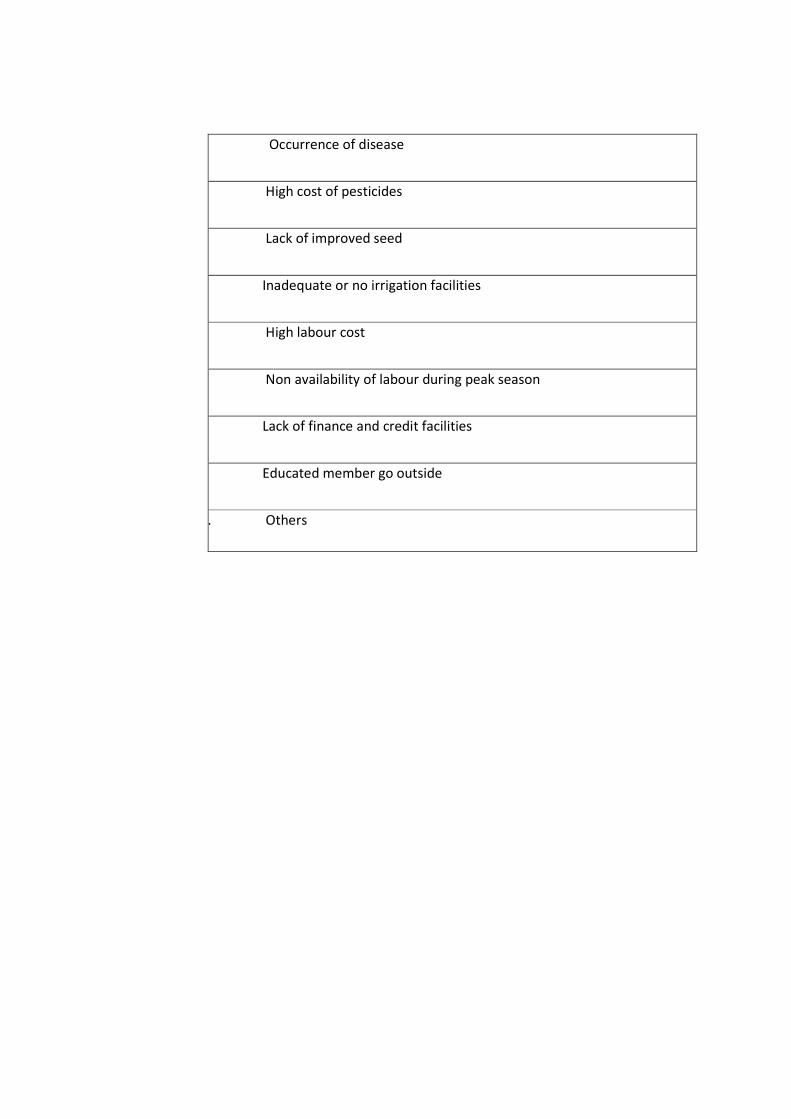
Occurrence of disease
High cost of pesticides
Lack of improved seed
Inadequate or no irrigation facilities
High labour cost
Non availability of labour during peak season
Lack of finance and credit facilities
Educated member go outside
10. Others
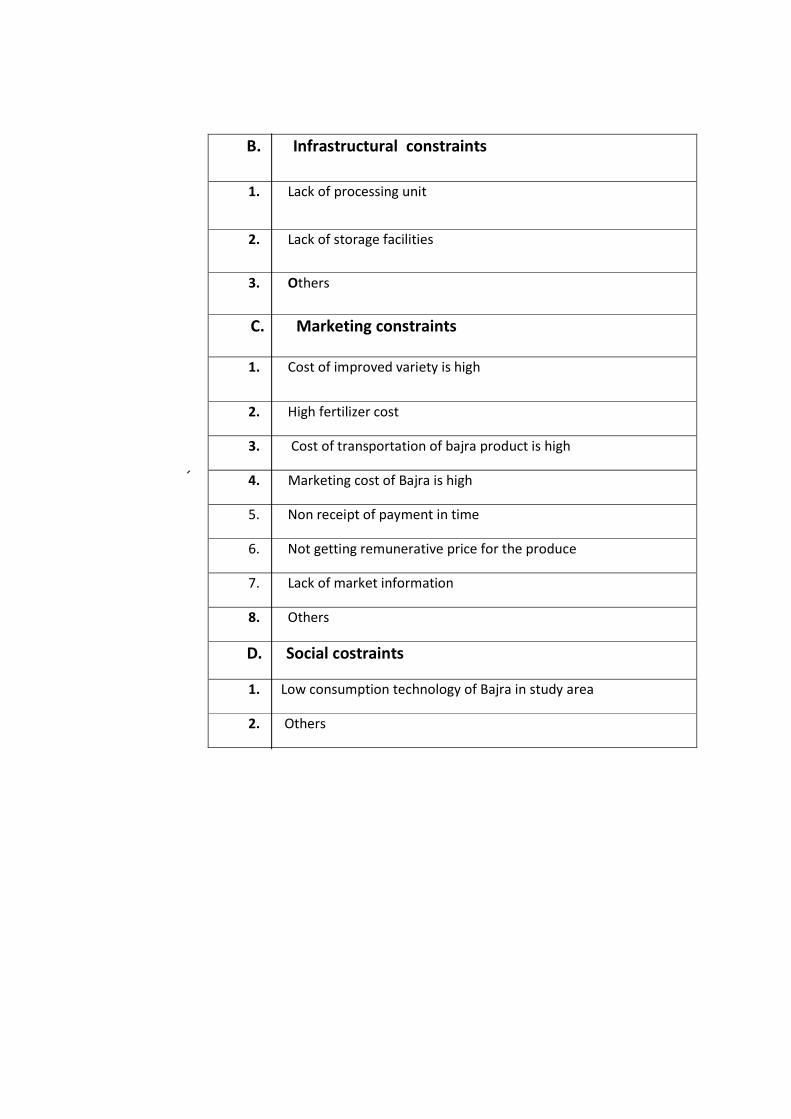
B. Infrastructural constraints
1. Lack of processing unit
2. Lack of storage facilities
3. Others
C. Marketing constraints
1. Cost of improved variety is high
2. High fertilizer cost
3. Cost of transportation of bajra product is high
4. Marketing cost of Bajra is high
5. Non receipt of payment in time
6. Not getting remunerative price for the produce
7. Lack of market information
8. Others
D. Social costraints
1. Low consumption technology of Bajra in study area
2. Others


![dk;kZy; funs'kd] ek/;fed f'k{kk jktLFkku] chdkusj](https://img.pdfslide.net/doc/110x75/631ff71494d995f22f072cc6/dkkzy-funskd-ekfed-fkkk-jktlfkku-chdkusj.jpg)
![ksfxdh fo'ofo|ky;] mn;iqj jksLVj iaftdk&lh/kh HkrhZ ds fy,s](https://img.pdfslide.net/doc/110x75/6331c56e5696ca447302e7aa/ksfxdh-foofoky-mniqj-jkslvj-iaftdklhkh-hkrhz-ds-fys.jpg)


![iqj fodkl izkf/kdj.k] t - Jaipur Development Authority](https://img.pdfslide.net/doc/110x75/6334bdf962e2e08d4902c296/iqj-fodkl-izkfkdjk-t-jaipur-development-authority.jpg)

![iqj fodkl izkf/kdj.k] t - Login - Jaipur Development Authority](https://img.pdfslide.net/doc/110x75/63385e1238eb2ce98a02c552/iqj-fodkl-izkfkdjk-t-login-jaipur-development-authority.jpg)


