Embed Size (px)
Citation preview
Journal of Technology Management & Innovation
Volume 10, Issue 3, October 2015Research Articles
Entrepreneurship and Academic Employment – More Alike than You’d Think.Anna Sinell, Marie Heidingsfelder, Martina Schraudner................................................................................... 1
Wheat Industry: Which Factors Influence Innovation?Vitor Francisco Dalla Corte, Paulo Dabdab Waquil, Kyle Stiegert.................................................................... 11
Perceptual Factors Affecting the Tendency to Collaboration in SMEs: Perceived Importance of Collaboration Modes and Partners. / Heeyong Noh, Sungjoo Lee ...................................................................... 18
Brazilian Incubators and Science Parks’ resources and R&D collaboration.Serje Schmidt, Alsones Balestrin.......................................................................................................................... 32
Sources of Innovation: The Case of Portuguese Consultancy Sector.Marisa Cesário, Silvia Fernandes, Bruno Jesus, José M. Barata.......................................................................... 44
Socio-Technological Characterization of Goat Industry at Tamarugal Province in Atacama DesertSergio Diez de Medina, Pamela Cabello, Juan Carlos Ríos, Pablo Figueroa,Ivan Balic, Damien Hardy, Viviana Vrsalovic................................................................................................................................................. 53
Gestión de una Cultura de Innovación Basada en las PersonasJaime E. Souto....................................................................................................................................................... 60
66Fuentes de Conocimiento en Empresas BiotecnológicasViridiana Núñez.................................................................................................................................................
La Imagen de un Producto Turístico Rural a través del Acceso al Contenido Generado por otros Usuarios en Internet: Diferencias por Género. Carmen Hidalgo-Alcazar, María Sicilia, Salvador Ruiz de Maya............ 75
Case Studies
Regulation and Technology Innovation: A comparison of Stated and Formal Regulatory Barriers throughout the Technology Innovation Process. Robert Engberg, Peter Altmann............................................. 85
Multidimensional Balanced Efficiency Decision ModelAntonella Petrillo, Fabio De Felice....................................................................................................................... 92
Evaluation of Technological Trends and Demands of the Manufacturing Industry to a Center of R&D&I.Leone Peter Correia da Silva Andrade, Markus Will, Luis Alberto Breda Mascarenhas,Rafaela Campos da Silva, Jefferson de Oliveira Gomes......................................................................................... 104
Application of Lean Manufacturing Tools in the Food and Beverage IndustriesRui Borges Lopes, Filipa Freitas, Inês Sousa.......................................................................................................... 120
Corporate Social Responsibility: a Case Study in Subsidiaries from Brazil and ChinaCaroline Chagas Prates, Eugenio Avila Pedrozo, Tania Nunes Silva................................................................... 131
Review
Emprendimiento en la Tercera Edad: Una Revisión de la Situación ActualFelipe Oelckers....................................................................................................................................................... 143
ISSN: 0718-2724. (http://jotmi.org)Journal of Technology Management & Innovation © Universidad Alberto Hurtado, Facultad de Economía y Negocios.
J. Technol. Manag. Innov. 2015. Volume 10, Issue 3
ISSN: 0718-2724. (http://jotmi.org)Journal of Technology Management & Innovation © Universidad Alberto Hurtado, Facultad de Economía y Negocios.
Entrepreneurship and Academic Employment – More Alike than You’d Think
Anna Sinell 1*, Marie Heidingsfelder 1, Martina Schraudner 1
Abstract: Recognising the increasing value of knowledge and technology transfer, the scientific and political communities in Germany have recently devoted much attention to academic entrepreneurship. Seeking to explore similarities and differences between academic employment and entrepreneurship, we interviewed 112 postdoctoral students from the four major German research organisations and 16 senior transfer managers whose responsibilities included spin-off facilitation.
Our findings indicate that those involved in such occupations often believe that academic employment and entrepreneurship differ substantially on many levels. Both interviewed senior managers and postdoctoral students considered engaging in commercialisation activities to be a risky and serious undertaking and a significant career change. Simultaneously, the opinions and observations of postdoctoral students helped us identify a wide range of similarities between academic employment and entrepreneurship. Our findings can help make entrepreneurship more accessible to researchers, re-define the boundaries between scientific and commercial activities, and, ultimately, foster knowledge and technology transfer.
Keywords: Academic spin-off, entrepreneurship, knowledge transfer, paradigms of (German) academia.
Schubert, Rammer, & Frietsch, 2014) and only approximately one percent of these businesses are initiated by researchers (Braun-Thürmann, Knie, & Simon, 2010, p. 9). Seeking to increase the number of such businesses and to generally reduce the existing gap between academia and business, the government and many research organisations have recently initiated a range of programs.
The impact of these programs, however, has remained low. In 2013, only 45 businesses were initiated by the employees of the four major national research organisations (Helmholtz Association, 2014; Leibniz Association, 2015; Fraunhofer-Gesellschaft, 2014; Max Planck Society, 2014). Such small proportions of academic spin-offs can be explained, for example, by potential entrepreneurs being unclear about their objectives and strategies and lacking necessary information and skills in business administration (Hemer, Schleinkofer, & Göthner, 2007; Riesenhuber, Walter, & Auer, 2006; Franklin, Wright, & Lockett, 2001; Vohora, Wright, & Lockett, 2004). Especially during the start-up stage, such lack of information and skills can lead to poor decisions (Spath, Winter, & Pape, 2010). One structural barrier, identified by Braun-Thürmann et al. (2010), is the lack of support by the employing organisation.
Many of the publications on the subject share the assumption that the gap between academic employment and entrepreneurship would be extremely difficult to bridge and that for a scientist to engage in commercialisation activities would be a non-trivial undertaking (e. g.
Submitted August 26th 2015 / Approved September 30th 2015
1. Introduction
As the lines between science, industry, and government grow increasingly blurry (Etzkowit, Webster, & Healey, 1998; Etzkowitz & Leydesdorff, 2000; Ranga & Etzkowitz, 2013), the role of knowledge and technology transfer, KTT, in the utilisation of research findings continues to increase (von Kortzfleisch, Bertram, Zerwas, & Arndt, 2015; Bozeman, Rimes, & Youtie, 2015). In view of these developments, both the scientific and political communities have begun paying greater attention to academic entrepreneurship (e. g. Shane, 2004; Wright, 2007; O’Shea, Chugh, & Allen, 2008). To this end, the European Commission initiated the European Institute of Innovation and Technology, EIT, as a part of its Horizon 2020 program (European Commission, 2014, p. 28). In Germany, the High-tech Strategy of the German federal government is intended to foster knowledge and technology transfer, to increase the national capacity for innovation, and, in particular, to increase the commercialisation activity of national research institutions (Federal Ministry of Education and Research, 2010, p. 10).
Academic entrepreneurship can help more efficiently utilise research findings, create jobs, and provide economic benefits (Dickel, 2009). Germany’s capacity for innovation is currently estimated as very high (Frietsch, Rammer, Schubert, Bührer, & Neuhäusler, 2012; Poirson 2013). Simultaneously, a relatively small number of businesses are initiated every year (Brixy, Hundt, Sternberg, & Stüber, 2009;
1 Fraunhofer Center for Responsible Research and Innovation Berlin-Germany. *Corresponding author: [email protected]
1
ISSN: 0718-2724. (http://jotmi.org)Journal of Technology Management & Innovation © Universidad Alberto Hurtado, Facultad de Economía y Negocios.
J. Technol. Manag. Innov. 2015. Volume 10, Issue 3
Braun-Thürmann et al., 2010; Jain, George, & Maltarich, 2009; van der Sijde, David, Frederik, & Redondo Carretero, 2014). In line with these findings, we have formulated the following research questions: Where do transfer managers and postdoctoral students see the differences between academic employment and entrepreneurship and how do their perceptions match the existing common perceptions about such differences? What causes these perceptual differences? Considering job profiles, required skill sets, and existing organisational practices, how different are academic employment and entrepreneurship precisely?
Our findings suggest that this “tale of two logics” (van der Sijde et al., 2014) might largely be a widely-shared and self-perpetuating illusion.
2. Theoretical background
2.1. Existing paradigms By commercialising innovations, academic spin-offs have the potential (e. g. Bollinger, Hope, & Utternack, 1983; Gottschalk, Fryges, Metzger, Heger, & Licht, 2007) to re-shape the existing technological landscape (Breznitz, O’Shea, & Allen, 2008). Scholars have explored the challenges that potential academic entrepreneurs might face (e. g. Franklin et al., 2001; Vohora et al., 2004, Hemer et al., 2007; Riesenhuber et al., 2006). While their studies vary substantially in approach and method, these scholars share the view that academic employment and entrepreneurship belong to two different worlds, which are opposite of one another in a variety of ways and each of which has clear boundaries. Crossing these boundaries would require fundamental changes in social and symbolic order (Braun-Thürmann et al., 2010). Braun-Thürmann et al. (2010) distinguish between three types of such boundaries, which define (1) research types and contexts, (2) organisations, and (3) individual identities. From individuals, crossing these boundaries would require, respectively, (1) resetting their priorities, (2) developing new professional identities outside of their current organisations, and (3) conforming their behaviour to norms that are compatible with entrepreneurship. According to Jain et al. (2009), engaging in commercialisation activities typically require individual scientists to modify their role identity, which entails norms, processes, and outputs (Jain et al., 2009, p. 924). The transition between the two worlds can be achieved gradually and will result in the scientists adopting a hybrid role identity (Jain et al., 2009) and the development of a new community with its own norms and practices (Braun-Thürmann et al., 2010, p. 24).
Merton (1959) identified the four following components of the scientific ethos: (1) universalism, implying that scientific observations should be verifiable and independent of the observer, (2) communism, implying that scientists share their work for the common good, (3) disinterestedness, implying that scientists have no emotional or financial attachments to their work, and (4) organized scepticism, implying that scientists should wait until they have gathered all the facts before they make a judgment about a particular theory. These norms are often incompatible with those of entrepreneurship (Jain et al., 2009, p. 924). A scientist’s notion of universality is in conflict with an entrepreneur’s belief in the unique selling point (Barney, 1991).
Communism is incompatible with the definition of private property, while the academic ideal of scepticism contradicts the entrepreneurial ideal of passion (Baum & Locke, 2004; Camerer & Lovallo, 1999). While delayed dissemination of findings in academia would conflict with the principles of universalism and communism (Merton, 1959), from an entrepreneurial perspective, a premature disclosure of certain findings might violate patent protection and compromise potential intellectual property (Ndonzuau, Pirnay, & Surlemont, 2002). Given these incompatibilities, reconciling both worlds poses a non-trivial challenge and requires a substantial amount of “identity work” from an individual scientist engaging in entrepreneurial activity (Jain et al., 2009, p. 924; Bird, Hayward, & Allen, 1993). Other factors that such scientists might need to consider include planning, risks, management styles, and money (Samson, 1990). As compared to entrepreneurs, scientists usually have the opportunity to make longer-term plans, face fewer risks, have the opportunity to appreciate more consensus-oriented management styles, and place a lower value on money (Samson, 1990).
Some recent studies, however, challenge this “tale of two logics” by indicating that some of these incompatibilities might be relative. Sass (2011, pp. 55-57.) demonstrates that commercialisation activities and patent applications have long become part of academic occupation (see also Lee & Rhoads, 2004). In some cases, the principles of communism are not strictly adhered to and findings are disseminated with restrictions or not at all, especially when different groups research in similar directions and are considered mutual competitors (Campbell et al. 2002; Blumenthal, Campbell, Anderson, Causino, & Louis, 1997). Some studies indicate that more scientists would potentially be interested in commercialising their findings if they had the time (Braunerhjelm, 2007). In a group studied by van Looy, Callaert, & Debackere, (2006), those who were more open to entrepreneurship usually demonstrated higher academic productivity. All these findings challenge the above-described paradigms.
2.2 Beyond the paradigmsSince the late 1930s, scholars in different research fields have explored how individuals related to their work (Ekehammer, 1974; Lewin, 1935; Murray, 1938; Pervin, 1968; Kristof-Brown, Zimmerman, & Johnson, 2005). While their studies vary in approach and method, most of them address individual values, preferences, aspirations, skills, and personality traits in relation to occupation and workplace. Drawing from their literature review, Kristof-Brown et al. (2005) have developed probably the most comprehensive model of person-environment fit. This model has four dimensions. The first dimension, Person-job, refers to individual knowledge, skills, abilities, and job responsibilities. The second dimension, Person-organisation, refers to fundamental organisational norms, values, and practices including organisational culture. The third dimension, Person-group, refers to relationships with co-workers, team composition, and work atmosphere. Finally, the fourth dimension, Person-supervisor, refers to organisational hierarchies and relationships between employees and their superiors.
2
ISSN: 0718-2724. (http://jotmi.org)Journal of Technology Management & Innovation © Universidad Alberto Hurtado, Facultad de Economía y Negocios.
J. Technol. Manag. Innov. 2015. Volume 10, Issue 3
For the purposes of our research, we have slightly adapted this model. Kristof-Brown et al. (2005) regarded supervising activities as part of group dynamics, and egalitarian work relationships and loose hierarchies are common practice in both academia and entrepreneurships. Our model therefore regards the third and fourth dimensions as one. We also expanded the second category and renamed it Person-structure to shift the focus toward more structural aspects of organisations.
Drawing from this model, we analyse the perceptions of transfer managers and postdoctoral students about differences between academic employment and entrepreneurship and analyse possible causes of these perceptions. By considering job profiles, required skill sets, and existing organisational practices, we precisely discuss the differences and similarities of academic employment and entrepreneurship.
3. Method
In order to explore similarities and differences between academic employment and entrepreneurship, we conducted a comprehensive literature review and 128 qualitative interviews. We used the review and the method of theoretical sampling (Glaser & Strauss, 2010) (1) to identify the criteria for interviewee selection, and (2) to “deductively derive” (Flick, 2007; Mayring, 2010) categories, which helped develop semi-structured questionnaires for the interviews and later helped analyse the gathered empirical data. For the interviews, we selected 112 postdoctoral students from the four major German research organisations1 and 16 senior transfer managers from scientific organisations and government agencies, including former researchers, whose responsibilities included spin-off facilitation. The managers were selected (1) because of their long-term and vast experience in KTT and academic entrepreneurship and (2) because, due to their positions, their views carried substantial weight in setting KTT agendas.
The 112 individual problem-centred interviews (Witzel, 2000) with postdoctoral students focused personal aspirations, career drivers, career development strategies, career paths both within and outside of academia, and existing practices in research organisations including shared norms, values, and basic assumptions (Schein, 1985).
The questionnaire contained both yes/no and free-response questions in order to approach the subject at hand from different angles. Each interview was recorded, and these records were transcribed and analysed. For this analysis, we utilised a range of qualitative methods from empirical social research, including that of Mayring (2010). By adhering to “the principle of openness” (Flick, 2010; Lamnek, 2010), these methods enabled us to assess individual perspectives and points of reference. With the purpose of theory building (Eisenhardt & Graebner, 2007), this analysis focused on individual perceptions of self and others and behaviours
typical within different types of KTT teams. Finally, we utilised the gathered data to “inductively restructure and expand” the above-mentioned categories (Mayring, 2010).
The following section presents our findings, including a selection of interview quotations. In accordance with the major principle of qualitative research, these quotations are intended to illustrate the findings rather than provide a representative sample (Haas & Scheibelhofer, 1998). For reasons of confidentiality, only the sexes and positions of quoted interviewees are revealed.
4. Findings
In this chapter, we show where interviewed senior transfer managers and postdoctoral students saw differences between academic employment and entrepreneurship, present the students’ perceptions about their jobs and workplaces, and describe the similarities between the two worlds that we established based on these perceptions.
4.1 Academic entrepreneurship as perceived by interviewed senior transfer managers and postdoctoral students Scientists are scientists to the core, they don’t start businesses. (Senior manager, female) Most of the aspects of academic employment and entrepreneurship addressed by interviewed senior transfer managers can be referred to person-job and person-structure fit and only few can be associated to person-group fit (Kristof-Brown et al., 2005). These managers most often spoke about the individual traits of scientists and entrepreneurs and their intrinsic motivations. This section presents the managers’ observations, and quotations supporting these observations.
Many interviewed managers explained the low number of national academic spin-offs by scientists being too averse to risk and “lacking courage,” as illustrated by the following quotation.
[It] is because too few are that open to risk and ready to do it. For a scientist to leave his or her organisation and to start a business, I think, the stretch would be too big. He or she would also need much endurance. (Senior manager, male)
Many studies indicate that business owners often exhibit high risk tolerance and more risk adverse individuals are less likely to start a business (e. g. Stewart, Watson, Carland, & Carland, 1999; Wagner, 2003; Ekelund, Johansson, Järvelin, & Lichtermann, 2005). Unlimited-term employees have been shown to be particularly unlikely to start a business (Caliendo, Fossen, & Kritikos, 2007), and women have been shown to be more risk averse than men (e. g. Wagner, 2007; Caliendo et al., 2007).
German research organisations mostly provide limited-term employment contracts, which often cover at most two years. Nonetheless, many researchers appear to regard academic employment as “the more secure option” and would rather endure its hardships than expose themselves to the risks of entrepreneurship.
(1) The interviews were part of Career and leadership – women in research organisations and technical universities, funded by BMBF, grant ID 01FP1303, and jointly conducted by Fraunhofer and RWTH Aachen in four major research organisations and five TU9 universities respectively between June 2013 and June 2015.
3
ISSN: 0718-2724. (http://jotmi.org)Journal of Technology Management & Innovation © Universidad Alberto Hurtado, Facultad de Economía y Negocios.
J. Technol. Manag. Innov. 2015. Volume 10, Issue 3
Many research organisations provide business support programs, including the training of managerial skills. Simultaneously, interviewed managers observed that potential entrepreneurs in their organisations often did not find themselves “fit for surviving in the free market” (senior manager, female) and possessing necessary business management skills and understanding of the law. These findings match those of many empirical studies (e. g. Franklin et al., 2001; Vohora et al., 2004). Within their samples, Walter, Auer, & Ritter, (2006) and Dickel (2009) discovered that those new academic entrepreneurs who put a higher value on networking and cultivating entrepreneurial spirit were usually more successful in general and with their first product in particular (Dickel, 2009). To summarise, interviewed senior transfer managers identified the following two major issues related to person-job fit: most scientists are too averse to risk and lack necessary skills.
Similarly in relation to person-structure fit, many interviewees identified significant barriers that one might face while switching from “relatively secure” academic employment to “insecure” entrepreneurship. Some even referred to the latter as “the risky area”, as illustrated by the following quotation.
To say, I am entering the risky area, where I have to face all these completely different problems and possibly, a bankruptcy, that would be a really big deal. (Senior manager, male)
In German academia, working extra hours on top of normal hours required in the office is standard practice. Simultaneously, many interviewees believed that entrepreneurship was more demanding and that it would be nearly impossible to combine entrepreneurship with family obligations and interests outside work. In view of the fact that women usually carry a larger load of family responsibilities it is perhaps not surprising that in 2009, for example, only eight and two percent of highly technological start-ups in Germany were founded by all-female and mixed-gender teams respectively (Metzger, Niefert, & Licht, 2008).
While the government and many research institutions provide different business support programs, including help with networking and the development of business plans, finance remains an issue, in particular when a potential new business requires complicated equipment. Many interviewed managers identified access to external finance to be another major challenge, as illustrated by the following quotation.
I mean, there are opportunities [to find investors]. But you have to know about them. At the beginning, you need to be very… incredibly motivated and to want, want, want to find all this information. (Senior manager, female)
Many of the managers identified certain cultural beliefs to be a substantial barrier. As compared to other nations, Germans might be more prone to the fear of failure (Singer, Ernesto Amorós, & Moska, 2014) and more willing to believe in the gap between science and business, as illustrated by the following quotation.
In Germany, there is this divide in people’s heads. We believe that good science can not possibly be driven by considerations of commerce. (Senior manager, male)
The language that interviewees used was a manifestation of this perceived divide. To engage in commercialisation activities, a scientist would have “to take the plunge,” “to jump into the deep end,” “to go down a rough road,” “to be ready to suffer,” and “to be a real bulldog”. These choices of words suggest that the managers believed that engaging in commercialisation activities would require much courage, endurance, and assertiveness. To summarise, most interviewed senior transfer managers believed that academic employment and entrepreneurship differed substantially on many levels and that engaging in commercialisation activities entailed a range of challenges, as illustrated by the following quotation.
Starting a business is just a huge life change. (Senior manager, female)
Most interviewed postdoctoral students mentioned differences between academic employment and entrepreneurship similar to those mentioned by interviewed senior transfer managers. Most spoke of the risks and downsides of academic entrepreneurship and few spoke of the upsides and opportunities that it provided. Both those who could imagine starting a business at some point and those who could not associated entrepreneurship with a range of challenges, primarily those related to financing and planning, as illustrated by the following quotation.
Well, that would be extremely risky and require a huge investment. That’s why it probably wouldn’t work. (Postdoc, male)
Simultaneously, more than one-fourth of the interviewed postdoctoral students found entrepreneurship appealing and considered it a valid career option. These students included men and women in approximately equal proportions. Among those whose organisations provided spin-off support, as compared to those whose organisations did not, a greater proportion either already had some entrepreneurial experience or intended to start a business in the immediate future, as illustrated by the following quotation.
This program [provided by the institute] is actually quite generous. [...] They funded four full-time positions for a start-up. We also have quite a mix of backgrounds in our team, in a good way, everything a company needs, right at the start and later, after it takes off. (Postdoc, male)
Many interviewed postdoctoral students found that good, marketable ideas were essential for a successful start-up. Many believed that the specifics of one’s academic field determined how much opportunity one had to develop such ideas and that applied research, as compared to basic research, provided better opportunities. Many believed, sometimes with regret, that it would be nearly impossible to commercialise most findings in certain basic research fields, as illustrated by the following quotation.
To start a business, one needs to have ideas that have that kind of potential. We often have interesting ideas here, but being outside of our
4
ISSN: 0718-2724. (http://jotmi.org)Journal of Technology Management & Innovation © Universidad Alberto Hurtado, Facultad de Economía y Negocios.
J. Technol. Manag. Innov. 2015. Volume 10, Issue 3
field… they’re just ideas. And then we say, yeah, that would be useful, it would be great to do it. But you can’t, not with this group. (Postdoc, male)
Many interviewed postdoctoral students believed that to attempt entrepreneurship, one needed to have certain personality traits such as high risk tolerance and to possess certain skills, such as business administration. Most believed that they lacked both and found that entrepreneurship would require too much time and effort, as illustrated by the following quotation.
I don’t think I’m cut out for that. There would be just too much uncertainty. (Postdoc, female)
To conclude, most interviewed postdoctoral students believed that academic entrepreneurship was an option only for those scientists who were more risk tolerant, were interested in practical application, had the necessary knowhow and skills, and were willing to invest a great deal of time and effort. Although many found entrepreneurship potentially appealing, they believed that they lacked the necessary skills, had “the wrong personality,” and were generally unfit for entrepreneurship.
When looking at possible causes for the outlined perceptual differences of academic employment and entrepreneurship two main factors can be identified: First, scientists and entrepreneurs lack the opportunity to identify themselves within the other group. It requires opportunities for reflection and change of perspective to find out about the working conditions and tasks in science and entrepreneurship respectively.
The fact, that scientists have long been employed in their field, makes entrepreneurship seem really strange and far away. So they are just not interested in it and don’t see potential overlaps. (Senior manager, female)
University-industry cooperation could be a promising way to overcome these perceptions, as pointed out by a senior KTT manager:Coorperation between research institutions and businesses are certainly a good way to simply have a change of perspective and also to see how companies work, what markets need, and what research can and cannot do. (Senior manager, male)
Secondly, academic entrepreneurship as part of KTT-activities is still a young topic and not yet well established in research institutions. The findings indicate that – apart from a small number of exceptions – entrepreneurship and academic spin-off formation is neither part of university curricula nor is it well communicated in the research institutions.
A huge barrier is that the issue of technology transfer and spin-offs is just not on the agenda of [the research organization] and the directors of the institutions. (Senior manager, male)
Additionally, there is a lack of incentives and appreciation for transfer activities and spin-off formation within research organizations as research and teaching are still perceived as being of greater value.
There are many ways to incentivize spin-off activities. An award or financial benefits could be a good idea. […] but that just does not fit to the strategy of [the research organization]. Here it’s mainly projects with industry that count. (Senior manager, male) The results are in line with the findings of Grave, Hetze, & Kanig (2014) that more than half of the scientific staff at German universities do not know that KTT-support programs exist at their research institutions and less than 25% of German universities provide incentives or reward structures to foster spin-off formation (Grave et al., 2014). In order to increase the engagement of scientists in entrepreneurship activities, supporting structures for spin-off formation must be adequately and frequently communicated (Kolb & Wagner, 2015). Universities, that provide established policies and procedures for the management of technology transfer and articulate entrepreneurship as a fundamental element of their mission, perform significantly better with regard to the number of spin-offs created (Caldera & Debande, 2010; Huyghe & Knockaert, 2015).
The above-described opinions and observations of both interviewed senior transfer managers and postdoctoral students match the widely-shared assumptions that academic employment and entrepreneurship are fundamentally different and that engaging in the latter would be an enormous career change and not worth the effort. In the following section, we explore to what degree this assumption is grounded in reality.
4.2 Similarities between academic employment and entrepreneurship The postdoctoral students were interviewed about their perceptions of German academia, its existing practices and infrastructures, their own place in it, and the specifics of their work. By analysing their responses, we concluded that academic employment and entrepreneurship share a range of similarities. Drawing from Kristof-Brown et al. (2005), we associated each similarity with one of the three dimensions described in Section 2.2 – person-job, person-structure, and person-group. The responses of interviewed postdoctoral students suggest that their decisions to work in academia were primarily determined by considerations that can be referred to person-job fit. Most interviewed postdoctoral students stated that their major drivers were their assignments, research subjects, and the opportunity to research by itself. An occupation in science helped them explore their interests and provided variety of assignments, personal autonomy, and creative freedom. Many found their work to be rich and exciting. Many were motivated by the given autonomy to determine when, where, and how they will work. Many felt that their work was meaningful and its results useful to others. The following quotation illustrates.
I was always driven by the substance, by its role. And when a project spoke to me, when I thought that it mattered, that was always a factor. That it was about some important issues, not just producing knowledge. And that it could be implemented and resolve these issues. (Postdoc, male)
Many studies indicate that the most appealing aspects of entrepreneurship are very similar. Most entrepreneurs are driven by
5
ISSN: 0718-2724. (http://jotmi.org)Journal of Technology Management & Innovation © Universidad Alberto Hurtado, Facultad de Economía y Negocios.
J. Technol. Manag. Innov. 2015. Volume 10, Issue 3
the opportunities to realise their own ideas (Hünnies-Stemann, Rulle, Seel, & Terbel, 2010), to take responsibility, and work autonomously (Shane, 2004; Kulicke & Schleinkofer, 2008; Roberts, 1989; Egeln, Gottschalk, Rammer, & Spielkamp, 2002).
When asked about their responsibilities, interviewed postdoctoral students mentioned research and project management, including team management, fundraising, and time management. Applying for grants, in particular, has long been a major part of researcher’s job, as illustrated by the following quotation.
My responsibilities include project supervision and my own research. I mentor graduate and PhD students, network with both researches and business people, and manage my own projects. So, applying for and managing money grants. (Postdoc, female)
Entrepreneurial activities are very similar to those described above – entrepreneurs raise money, supervise other people, and manage time and finances. Lack of skills necessary for performing these activities can hinder a start-up (Hünnies-Stemann et al., 2010). Some interviewed postdoctoral students commented on these similarities between entrepreneurship and a job in academia, as illustrated by the following quotation.
Because I have to find the money by myself… it’s like in business. I find the funds for everything here [at the institute]. That’s what the overhead is for, so to say, for my co-workers. And if this money stops, I’ll be unemployed. It’s not that different from entrepreneurship. (Postdoc, male)
With regard to the person-structure relationship, most postdoctoral students spoke of the shortcomings of existing practices in academia and very few spoke of their benefits. Many mentioned that the system provided limited opportunity for long-term career development planning, and wished that their organisations would more actively communicate with them about their professional prospects and potential career steps, as illustrated by the following quotation.
And then there’s career planning, which is a really big issue in academia. I would like to have more certainty with that sometime soon. Not that I necessarily need an unlimited-term contract, but it would be great if we could discuss what I can achieve here and how exactly I can achieve that. (Postdoc, male)
Simultaneously, only few postdoctoral students associated entrepreneurship with similar uncertainties and commented on these similarities between the two worlds, as illustrated by the following quotations.
Because academia doesn’t do unlimited-term contracts as much anymore, all you can be sure of is one year or two. And then there’s the 12-years regulation. I simply see no point for myself [in staying in academia], especially if I want to start a family. (Postdoc, female) In business as in academia – there’re no guaranties that a project will succeed. (Postdoc, female)
In entrepreneurship, such uncertainties are balanced by a large degree
of personal autonomy (Sass, 2011; Shane, 2004; Hünnies-Stemann et al., 2010). Similarly in academia, many organisations give their employees the autonomy to determine when, where, and how they will work. This flexibility, however, continues to erase the boundaries between professional and private, and actual workloads exceeding contractual workloads has long been standard practice throughout academia. All postdoctoral students often worked and were available to their co-workers and superiors outside of regular working hours, as illustrated by the quotation below. While the students accepted this investment of time as natural and acceptable within the research context, they considered similar demands of an entrepreneurial lifestyle overwhelming.
I read my mails. I am available on weekends for emergencies. I respond to mails after work. If you count all this, I start at 7 a.m. and finish around 10 or 11 p.m. (Postdoc, male)
The students were to a large degree driven by intrinsic motivations – they were passionate about their work, felt that it gave them the opportunity to satisfy their curiosity, and associated it with feelings of excitement, enjoyment, and freedom, as illustrated by the quotation below. Most described the given opportunity to fulfil themselves through their work as one of their major drivers. In a similar manner, actual and potential business owners are often driven by intrinsic motivations (Sass, 2011), including the opportunity to fulfil themselves (Hünnies-Stemann et al., 2010; Autio & Kauranen, 1994).
As a scientist, I feel […] free. I am more free to choose, what I want to research […]. What motivates me most, is my own curiosity… and then the discoveries, the wonders, and figuring things out. (Postdoc, female)
With regard to the person-group relationships, most postdoctoral students found the atmosphere in their workplace to be very encouraging and described it as open, friendly, cooperative, and supportive. In particular, many found discussions with their co-workers to be interesting and motivating. Some even chose to accept their current positions because of their co-workers and atmosphere in the workplace. In a similar manner, actual and potential business owners are often motivated by relationships with their employees and partners (Sass, 2011). Egalitarian relationships are characteristic of academia and its hierarchies are often loosely defined. Almost all postdoctoral students supervised projects and mentored PhD students. Simultaneously, their leadership was not institutionalised and they did not have any sanction power, which often allowed for loose interpretations of their own position in the hierarchy. Some wished for a stricter definition of hierarchies and clearer instruction from their superiors, and others did not question the existing order and appreciated the large degree of personal autonomy it provides. In this regard, some recognised the similarities between their current position and self-employment, as illustrated by the following quotation.
That you are, I’d say, your own boss. I mean, you have autonomy, you are not restricted and nobody tells you that you can’t do this or that. Working here, at this institute, is really not that different from being self-employed. (Postdoc, male)
6
ISSN: 0718-2724. (http://jotmi.org)Journal of Technology Management & Innovation © Universidad Alberto Hurtado, Facultad de Economía y Negocios.
J. Technol. Manag. Innov. 2015. Volume 10, Issue 3
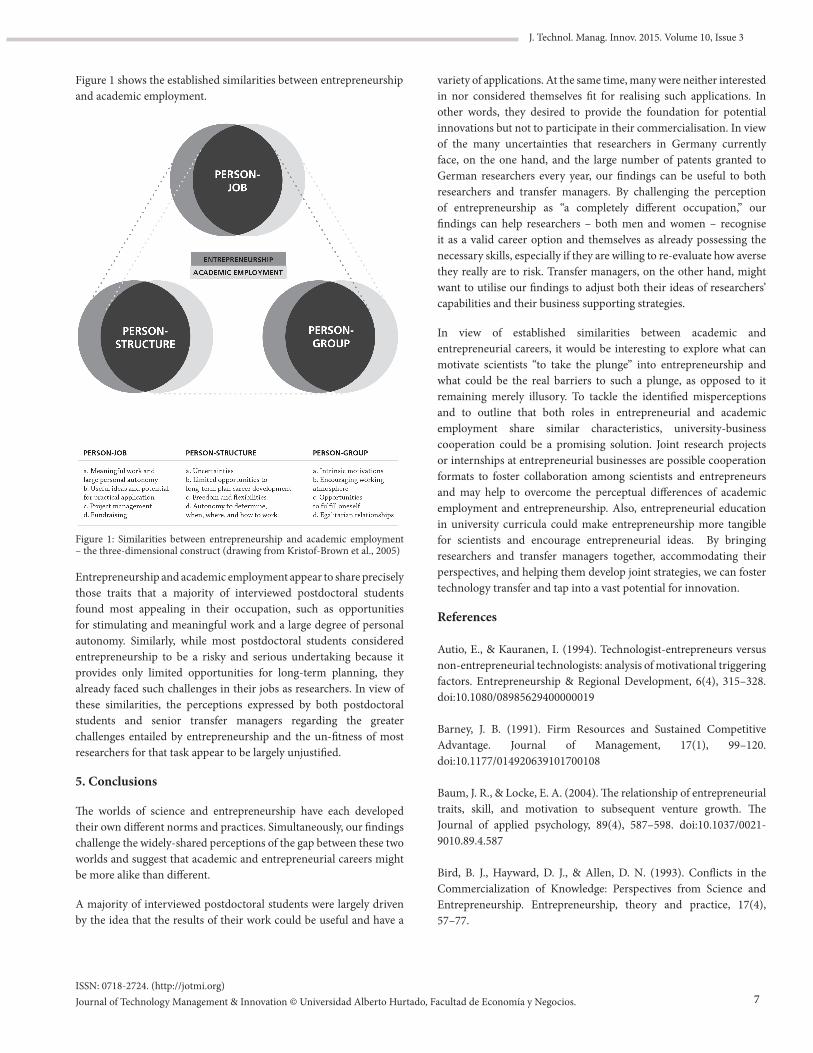
Figure 1 shows the established similarities between entrepreneurship and academic employment.
Figure 1: Similarities between entrepreneurship and academic employment – the three-dimensional construct (drawing from Kristof-Brown et al., 2005)
Entrepreneurship and academic employment appear to share precisely those traits that a majority of interviewed postdoctoral students found most appealing in their occupation, such as opportunities for stimulating and meaningful work and a large degree of personal autonomy. Similarly, while most postdoctoral students considered entrepreneurship to be a risky and serious undertaking because it provides only limited opportunities for long-term planning, they already faced such challenges in their jobs as researchers. In view of these similarities, the perceptions expressed by both postdoctoral students and senior transfer managers regarding the greater challenges entailed by entrepreneurship and the un-fitness of most researchers for that task appear to be largely unjustified.
5. Conclusions
The worlds of science and entrepreneurship have each developed their own different norms and practices. Simultaneously, our findings challenge the widely-shared perceptions of the gap between these two worlds and suggest that academic and entrepreneurial careers might be more alike than different. A majority of interviewed postdoctoral students were largely driven by the idea that the results of their work could be useful and have a
variety of applications. At the same time, many were neither interested in nor considered themselves fit for realising such applications. In other words, they desired to provide the foundation for potential innovations but not to participate in their commercialisation. In view of the many uncertainties that researchers in Germany currently face, on the one hand, and the large number of patents granted to German researchers every year, our findings can be useful to both researchers and transfer managers. By challenging the perception of entrepreneurship as “a completely different occupation,” our findings can help researchers – both men and women – recognise it as a valid career option and themselves as already possessing the necessary skills, especially if they are willing to re-evaluate how averse they really are to risk. Transfer managers, on the other hand, might want to utilise our findings to adjust both their ideas of researchers’ capabilities and their business supporting strategies.
In view of established similarities between academic and entrepreneurial careers, it would be interesting to explore what can motivate scientists “to take the plunge” into entrepreneurship and what could be the real barriers to such a plunge, as opposed to it remaining merely illusory. To tackle the identified misperceptions and to outline that both roles in entrepreneurial and academic employment share similar characteristics, university-business cooperation could be a promising solution. Joint research projects or internships at entrepreneurial businesses are possible cooperation formats to foster collaboration among scientists and entrepreneurs and may help to overcome the perceptual differences of academic employment and entrepreneurship. Also, entrepreneurial education in university curricula could make entrepreneurship more tangible for scientists and encourage entrepreneurial ideas. By bringing researchers and transfer managers together, accommodating their perspectives, and helping them develop joint strategies, we can foster technology transfer and tap into a vast potential for innovation.
References
Autio, E., & Kauranen, I. (1994). Technologist-entrepreneurs versus non-entrepreneurial technologists: analysis of motivational triggering factors. Entrepreneurship & Regional Development, 6(4), 315–328. doi:10.1080/08985629400000019
Barney, J. B. (1991). Firm Resources and Sustained Competitive Advantage. Journal of Management, 17(1), 99–120. doi:10.1177/014920639101700108
Baum, J. R., & Locke, E. A. (2004). The relationship of entrepreneurial traits, skill, and motivation to subsequent venture growth. The Journal of applied psychology, 89(4), 587–598. doi:10.1037/0021-9010.89.4.587
Bird, B. J., Hayward, D. J., & Allen, D. N. (1993). Conflicts in the Commercialization of Knowledge: Perspectives from Science and Entrepreneurship. Entrepreneurship, theory and practice, 17(4), 57–77.
7
ISSN: 0718-2724. (http://jotmi.org)Journal of Technology Management & Innovation © Universidad Alberto Hurtado, Facultad de Economía y Negocios.
J. Technol. Manag. Innov. 2015. Volume 10, Issue 3
Blumenthal, D., Campbell, E. G., Anderson, M. S., Causino, N., & Louis, K. S. (1997). Withholding research results in academic life science. Evidence from a national survey of faculty. Journal of the American Medical Association, 277(15), 1224–1228.
Bollinger, L., Hope, K., & Utterback, J. M. (1983). A review of literature and hypotheses on new technology-based firms. Research Policy, 12(1), 1–14. doi:10.1016/0048-7333(83)90023-9
Bozeman, B., Rimes, H., & Youtie, J. (2015). The evolving state-of-the-art in technology transfer research: Revisiting the contingent effectiveness model. Research Policy, 44(1), 34–49. doi:10.1016/j.respol.2014.06.008
Braunerhjelm, P. (2007). Academic entrepreneurship: social norms, university culture and policies. Science and Public Policy, 34(9), 619–631. doi:10.3152/030234207X276554
Braun-Thürmann, H., Knie, A., & Simon, D. (2010). Unternehmen Wissenschaft.: Ausgründungen als Grenzüberschreitungen akademischer Forschung. Science Studies. Bielefeld: Transcript.
Breznitz, S. M., O’Shea, R. P., & Allen, T. J. (2008). University Commercialization Strategies in the Development of Regional Bioclusters Journal of Product Innovation Management, 25(2), 129–142. doi:10.1111/j.1540-5885.2008.00290.x
Brixy, U., Hundt, C., Sternberg, R., & Stüber, H. (2009). Unternehmensgründungen im internationalen Vergleich: Deutschland - eine Gründungswüste? (IAB Kurzbericht No. 15/2009). Retrieved from Institut für Arbeitsmarkt- und Berufsforschung (IAB) website: http://doku.iab.de/kurzber/2009/kb1509.pdf
Caldera, A., & Debande, O. (2010). Performance of Spanish universities in technology transfer: An empirical analysis. Research Policy, 39(9), 1160–1173. doi:10.1016/j.respol.2010.05.016
Caliendo, M., Fossen, F., & Kritikos, A. (2009). Risk attitudes of nascent entrepreneurs–new evidence from an experimentally validated survey. Small Business Economics, 32(2), 153–167. doi:10.1007/s11187-007-9078-6
Camerer, C., & Lovallo, D. (1999). Overconfidence and Excess Entry: An Experimental Approach. American Economic Review, 89(1), 306–318. doi:10.1257/aer.89.1.306
Campbell, E. G., Clarridge, B. R., Gokhale, M., Birenbaum, L., Hilgartner, S., Holtzman, N. A., & Blumenthal, D. (2002). Data withholding in academic genetics: evidence from a national survey. Journal of the American Medical Association, 287(4), 473–480.
Dickel, P. (2009). Marktbezogenes Lernen in Akademischen Spin-offs: Gewinnung und Integration von Marktinformationen in der frühen Phase technologiebasierter Ausgründungen. Gabler Edition Wissenschaft: Vol. 62. Wiesbaden: Gabler.
Egeln, J., Gottschalk, S., Rammer, C., & Spielkamp, A. (2002). Spinoff-Gründungen aus der öffentlichen Forschung in Deutschland: Gutachten für das Bundesministerium für Bildung und Forschung (Wirtschaftsanalysen). Mannheim. Retrieved from ftp://ftp.zew.de/pub/zew-docs/docus/dokumentation0302.pdf
Eisenhardt, K. M., & Graebner, M. E. (2007). Theory Building From Cases: Opportunities And Challenges. Academy of Management Journal, 50(1), 25–32. doi:10.5465/AMJ.2007.24160888
Ekehammar, B. (1974). Interactionism in personality from a historical perspective. Psychological Bulletin, 81(12), 1026–1048. doi:10.1037/h0037457
Ekelund, J., Johansson, E., Järvelin, M.-R., & Lichtermann, D. (2005). Self-employment and risk aversion—evidence from psychological test data. Labour Economics, 12(5), 649–659. doi:10.1016/j.labeco.2004.02.009
Etzkowitz, H., & Leydesdorff, L. (2000). The dynamics of innovation: from National Systems and “Mode 2” to a Triple Helix of university–industry–government relations. Research Policy, 29(2), 109–123. doi:10.1016/S0048-7333(99)00055-4
Etzkowitz, H., Webster, A., & Healey, P. (1998). Capitalizing knowledge: New intersections of industry and academia. SUNY series, frontiers in education. Albany, NY: State University of New York Press.
European Commission. (2014). Horizon 2020 in brief: The EU framework programme for research & innovation. Luxembourg: Publications Office.
Federal Ministry of Education and Research. (2010). Ideen. Innovation. Wachstum: Hightech-Strategie 2020 für Deutschland. Bonn, Berlin. Retrieved from BMBF_Hightech Strategie.pdf
Flick, U. (2007). Qualitative Sozialforschung: Eine Einführung (6th ed.). rowohlts enzyklopädie. Hamburg: Rowohlt.
Flick, U. (2010). Design und Prozess qualitativer Forschung. In U. Flick, E. v. Kardorff, & I. Steinke (Eds.), Qualitative Forschung. Ein Handbuch (8th ed., pp. 252–264). Reinbek: Rowohlt.
Franklin, S. J., Wright, M., & Lockett, A. (2001). Academic and Surrogate Entrepreneurs in University Spin-out Companies. The Journal of Technology Transfer, 26(1-2), 127–141. doi:10.1023/A:1007896514609
Fraunhofer-Gesellschaft. (2014). Jahresbericht 2013: Leben in der digitalen Welt. München. Retrieved from http://www.fraunhofer.de/de/publikationen/fraunhofer-jahresbericht.html
Frietsch, R., Rammer, C., Schubert, T., Bührer, S., & Neuhäusler, P. (2012). Innovationsindikator 2012. Berlin, Bonn. Retrieved from http://www.telekom-stiftung.de/dts-cms/sites/default/files//dts-library/materialien/pdf/innovationsindikator_2012.pdf
8
ISSN: 0718-2724. (http://jotmi.org)Journal of Technology Management & Innovation © Universidad Alberto Hurtado, Facultad de Economía y Negocios.
J. Technol. Manag. Innov. 2015. Volume 10, Issue 3
Glaser, B. G., & Strauss, A. L. (2010). Grounded Theory: Strategien qualitativer Forschung (3rd ed.). Bern: Huber.
Gottschalk, S., Fryges, H., Metzger, G., Heger, D., & Licht, G. (2007). Start-ups zwischen Forschung und Finanzierung: Hightech-Gründungen in Deutschland: Gutachten. Mannheim. Retrieved from Zentrum für Europäische Wirtschaftsforschung (ZEW) website: http://www.zew.de/de/publikationen/3390
Grave, B., Hetze, P., & Kanig, A. (2014). Gründungsradar 2013: Wie Hochschulen Unternehmensgründungen fördern. Analysen. Essen: Stifterverband für die deutsche Wissenschaft.
Haas, B., & Scheibelhofer, E. (1998). Typenbildung in der qualitativen Sozialforschung:: Eine methodologische Analyse anhand ausgewählter Beispiele. Reihe Soziologie: Vol. 34. Wien: Institut für Höhere Studien.
Helmholtz Association. (2014). Geschäftsbericht 2014: Der Helmholtz-Gemeinschaft Deutscher Forschungszentren. Retrieved from http://www.helmholtz.de/fileadmin/user_upload/04_ mediathek/Geschaeftsbericht_2014/epaper-Geschaeftsbericht_2014/epaper/ausgabe.pdf?rnd=545897a33d830
Hemer, J., Schleinkofer, M., & Göthner, M. (2007). Akademische Spin-offs: Erfolgsbedingungen für Ausgründungen aus Forschungseinrichtungen. Studien des Büros für Technikfolgen-Abschätzung beim Deutschen Bundestag: Vol. 2. Berlin: Edition sigma.
Hünnies-Stemann, J., Rulle, E., Seel, B., & Terberl, S. (2010). Frauen gründen in Nano: Gründerinnenpotenzialstudie im Rahmen des BMBF-Projektes „Power für Gründerinnen“ Nano4women & Entrepreneurship. Retrieved from Bundesministerium für Bildung und Forschung (BMBF) website: http://www. n a n o - 4 - w o m e n . d e / f i l e a d m i n / n a n o - 4 - w o m e n / d at e i e n /gruenderinnenpotenzialstudie_2010.pdf
Huyghe, A., & Knockaert, M. (2015). The influence of organizational culture and climate on entrepreneurial intentions among research scientists. The Journal of T echnology T ransfer, 40(1), 138–160. doi:10.1007/s10961-014-9333-3
Jain, S., George, G., & Maltarich, M. (2009). Academics or entrepreneurs? Investigating role identity modification of university scientists involved in commercialization activity. Research Policy, 38(6), 922–935. doi:10.1016/j.respol.2009.02.007
Kolb, C., & Wagner, M. (2015). Crowding in or crowding out: The link between academic entrepreneurship and entrepreneurial traits. The Journal of Technology Transfer, 40(3), 387–408.
Kristof-Brown, A. L., Zimmermann, R. D., & Johnson, E. C. (2005). Consequences of individuals’ fit at work. A meta analysis of person-job, person-organization, person-group, and person-supervisor fit. Personnel Psychology, 58(2), 281–342. doi:10.1111/j.1744-6570.2005.00672.x
Kulicke, M., & Schleinkofer, M. (2008). Wirkungen von EXIST-SEED aus Sicht von Geförderten: Ergebnisse einer Befragung im Rahmen der wissenschaftlichen Begleitung von EXIST - Existenzgründungen aus der Wissenschaft im Auftrag des Bundesministeriums für Wirtschaft und Technologie (BMWi). ISI-Schriftenreihe Innovationspotenziale. Stuttgart: Fraunhofer IRB.
Lamnek, S. (2010). Qualitative Sozialforschung: Lehrbuch (5th ed.). Weinheim, Basel: Beltz.
Lee, J. J., & Rhoads, R. A. (2004). Faculty Entrepreneurialism and the Challenge to Undergraduate Education at Research Universities. Research in Higher Education, 45(7), 739–760. doi:10.1023/B:RIHE.0000044229.70457.ca
Leibniz Association. (2015). Leibniz Gemeinschaft: Transfer / Gründungen. Retrieved from http://www.leibniz-gemeinschaft.de/transfer/gruendungen/
Lewin, K. (1935). A dynamic theory of personality: Selected papers. New York, NY: McGraw-Hill.
Max Planck Society. (2014). Jahresbericht 2013. München. Retrieved from http://www.mpg.de/8236616/Jahresbericht_2013.pdf
Mayring, P. (2010). Qualitative Inhaltsanalyse: Grundlagen und Techniken. Beltz Pädagogik. Weinheim: Beltz.
Merton, R. K. (1959). Social theory and social structure. Glencoe: Free Press.
Metzger, G., Niefert, M., & Licht, G. (2008). High-Tech-Gründungen in Deutschland.: Trends, Strukturen, Potenziale. Mannheim.
Murray, H. A. (1938). Explorations in personality. Oxford: Oxford University Press.
Ndonzuau, F. N., Pirnay, F., & Surlemont, B. (2002). A stage model of academic spin-off creation. TECHNOVATION, 22(5), 281–289. doi:10.1016/S0166-4972(01)00019-0
O’Shea, R. P., Chugh, H., & Allen, T. J. (2008). Determinants and consequences of university spinoff activity: a conceptual framework. The Journal of Technology Transfer, 33(6), 653–666. doi:10.1007/s10961-007-9060-0
Pervin, L. A. (1968). Performance and satisfaction as a function of individual-environment fit. Psychological Bulletin, 69(1), 56–68. doi:10.1037/h0025271
9
ISSN: 0718-2724. (http://jotmi.org)Journal of Technology Management & Innovation © Universidad Alberto Hurtado, Facultad de Economía y Negocios.
J. Technol. Manag. Innov. 2015. Volume 10, Issue 3
Poirson, H. (2013). German Productivity Growth: An Industry Perspective. In A. Mody (Ed.), Germany in an Interconnected World Economy (pp. 55–77). Washington, DC: International Monetary Fund.
Ranga, M., & Etzkowitz, H. (2013). Triple Helix Systems: An Analytical Framework for Innovation Policy and Practice in the Knowledge Society. Industry and Higher Education, 27(4), 237–262.
Riesenhuber, F., Walter, A., & Auer, M. E. (2006). Akademische Spin-offs: eine empirische Untersuchung zum Umgang mit technischer Unsicherheit und der Steigerung des Wachstums. Zeitschrift für Betriebswirtschaftslehre, (Special Issue), 117–139.
Roberts, E. B. (1989). The personality and motivations of technological entrepreneurs. Journal of engineering and Technology Management, 6(1), 5–23. doi:10.1016/0923-4748(89)90012-X
Samsom, K. J. (1990). Scientists as Entrepreneurs: Organizational Performance in Scientist-Started New Ventures. Dordrecht: Springer Netherlands.
Sass, E. (2011). Der Naturwissenschaftler als Unternehmer: Gründertypen und deren Motivation im universitären Umfeld. Gabler Research. Unternehmerisches Personalmanagement. Wiesbaden: Gabler.
Schein, E. H. (1985). Organizational culture and leadership: A dynamic view. San Francisco, CA: Jossey-Bass.
Schubert, T., Rammer, C., & Frietsch, R. (2014). Innovationsindikator 2014. Retrieved from http://www.innovationsindikator.de/fileadmin/user_upload/Dokumente/Innovationsindikator_2014.pdf
Shane, S. (2004). Academic entrepreneurship: University spinoffs and wealth creation. New horizons in entrepreneurship. Cheltenham, UK, Northampton, MA: Edward Elgar.
Singer, S., Ernesto Amorós, J., & Moska, D. (2015). GEM 2014 Global Report. Retrieved from http://www.gemconsortium.org/docs/download/3616
Spath, D., Winter, J., & Pape, J. (2010). Wirtschaftliche E ntwicklung von Ausgründungen aus ausseruniversitären Forschungseinrichtungen. acatech: Nr. 4. Berlin, New York, NY: Springer.
Stewart, W. H., Jr., Watson, W. E., Carland, J. C., & Carland, J. W. (1999). A proclivity for entrepreneurship: A comparison of entrepreneurs, small business owners, and corporate managers. Journal of Business Venturing, 14(2), 189–214.
van der Sijde, P., David, F., Frederik, H., & Redondo Carretero, M. (2014). University-Business Cooperation: A Tale of Two Logics. In T. Kliewe & T. Kesting (Eds.), Moderne Konzepte des organisationalen Marketing (pp. 145–160). Springer Fachmedien Wiesbaden. Retrieved from http://dx.doi.org/10.1007/978-3-658-04680-4_9
van Looy, B., Callaert, J., & Debackere, K. (2006). Publication and patent behavior of academic researchers: Conflicting, reinforcing or merely co-existing? Research Policy, 35(4), 596–608. doi:10.1016/j. respol.2006.02.003
Vohora, A., Wright, M., & Lockett, A. (2004). Critical junctures in the development of university high-tech spinout companies. Research Policy, 33(1), 147–175. doi:10.1016/S0048-7333(03)00107-0
von Kortzfleisch, H. F. O., Bertram, M., Zerwas, D., & Arndt, M. (2015). Consideration of Knowledge and Technology Transfer Characteristics for Research Evaluation. In I. M. Welpe, J. Wollersheim, S. Ringelhan, & M. Osterloh (Eds.), Incentives and Performance (pp. 449–463). Springer International Publishing. Retrieved from http://dx.doi. org/10.1007/978-3-319-09785-5_27
Wagner, J. (2003). The Impact of Personal Characteristics and the Regional Milieu on the Transition from Unemployment to Self-employment: Empirical Evidence for Germany. Journal of Economics and Statistics (Jahrbuecher fuer Nationaloekonomie und Statistik), 223(2), 204–222. Retrieved from http://ideas.repec.org/a/jns/jbstat/v223y2003i2p204-222.html
Wagner, J. (2007). What a Difference a Y makes-Female and Male Nascent Entrepreneurs in Germany. Small Business Economics, 28(1), 1–21. doi:10.1007/s11187-005-0259-x
Walter, A., Auer, M., & Ritter, T. (2006). The impact of network capabilities and entrepreneurial orientation on university spin-off performance. Entrepreneurship and Strategic Alliances, 21(4), 541–567. doi:10.1016/j.jbusvent.2005.02.005
Witzel, A. (2000). The Problem-centered Interview. Forum Qualitative Sozialforschung / Forum: Qualitative Social Research, 1(1).
Wright, M. (2007). Academic entrepreneurship in Europe. Cheltenham, UK, Northampton, MA: Edward Elgar.
10
J. Technol. Manag. Innov. 2015. Volume 10, Issue 3
ISSN: 0718-2724. (http://jotmi.org)Journal of Technology Management & Innovation © Universidad Alberto Hurtado, Facultad de Economía y Negocios.
Wheat Industry: Which Factors Influence Innovation?
Vitor Francisco Dalla Corte 1*, Paulo Dabdab Waquil 2, Kyle Stiegert 3
Abstract: A change in the profile of food consumption is occurring because of the new context of demographic growth, the increase of income in developing economies, and urbanization. In Brazil, consumption patterns have trended from fresh to processed food and internal and external growth in demand has led to opportunities that require new and higher levels of technological innovation and associated managerial skill. The aim of this study was to evaluate the role of innovation on a key Brazilian food industry: wheat product markets. Results showed that while most firms did not innovate in the past year, new investments in R&D were important for innovation to occur compared to other factors such as the size of the company, the integration in supply chain, and the age of the company. These results demonstrate that innovation is not a random or unpredictable process, but a complex and diverse process that may be specific to each industry.
Keywords: innovation; food industry; wheat products.
Introduction
The profile of food consumption in many countries, both with respect to quantity and quality, is changing rapidly in response to changes in population growth, the increase in income in developing countries, and urbanization. In Brazil in particular, consumption shifted from fresh to processed food in recent decades. Currently, 85% of food is processed, a significant increase from earlier periods: 70% in 1990 and 56% in 1980 (ABIA, 2013). This increase corresponds with a dra-matic increase (195%) in the revenues in the food industry, which were R$ 104.4 billion in 2002 and rose to R$ 353.9 billion in 2012. While most of this growth has been driven by domestic sales, increas-ing external sales also provide opportunities for growth.
The food sector has traditionally been viewed as a mature low-tech-nology industry with slow rates of innovation. However, increases in the growth of internal and external demand in processed food has stimulated new investments in developing new technologies and improved management to maintain competitiveness. In this context, Brazilian food sector innovation has become one of the main driving forces in economic development and business competitiveness. The biotechnology revolution along with competitive pressures associated with lower import protection has incentive the food sector to improve control processes, capture economies of scale, improve food safety measures and nutritional quality, and to develop a new generation of foods to supply consumers that demand greater convenience, variety and quality (Traill and Meulenberg, 2002).
The food processing industry in Brazil has been the main techno-logical innovator in the agrifood chain. Therefore, it is important to systematically evaluate the innovation process in the industry, since it consists of a significant share of the agribusiness sector and the entire economy. In the wheat industry in particular, proper innovation can provide firms with a major competitive advantage. Many studies have been conducted with the aim of identifying the factors that influence or determine the level of innovation in the wheat industry and/or food companies (Traill and Grunert, 1997; Roeder et al., 2000; Dob-son et al., 2001; Avermaete et al., 2004; Cabral, 2007; Brewin et al., 2009; Capitanio et al., 2010; Triguero et al., 2013). However, the re-sults of these studies are often contradictory. The research in this pa-per indicates that while innovation is a complex and diverse process, the process is not random and unpredictable. Furthermore, there may be observable trends that are specific to a particular company or industry. Therefore, given the importance of innovation for both economic growth and business competitiveness, understanding the factors that influence or determine innovation within firms and the industry is of great importance. This understanding can help firms increase their own efficiency and allow the government to implement the appropriate policies for technological innovation.
Innovation and its Determinants
The modern food chain has become increasingly complex, which leads to new and unique challenges for researchers. In the early 20th century, agricultural markets were comprised of a limited variety of
Submitted August 26th 2015 / Approved September 30th 2015
1 Business Graduate Program, Faculdade Meridional (IMED), Passo Fundo, RS, Brazil.2 Center of Studies and Researches in Agribusiness (CEPAN), Federal University of Rio Grande do Sul (UFRGS), Brazil. 3 Department of Agricultural & Applied Economics (AAE), University of Wisconsin (UW), Madison, WI, USA. *Corresponding author: [email protected]
11
ISSN: 0718-2724. (http://jotmi.org)Journal of Technology Management & Innovation © Universidad Alberto Hurtado, Facultad de Economía y Negocios.
J. Technol. Manag. Innov. 2015. Volume 10, Issue 3
products for basic consumption, homogeneous technologies for pro-duction and processing, and consistent information for all consumers. Additionally, large agribusiness firms enjoyed high levels of market power leading to large profits. In recent decades, rapidly developing product differentiation, new production methods, and growing urban markets has led to a diversified farming and agribusiness industries with widely diversified economic outcomes.
The proposal of Schumpeter (1939) was to relate the essence of eco-nomic development to innovation. Therefore, innovation would be the heart of the economic system, serving as the main engine of capi-talist development and a source of profit. The innovative businessman would be the main drivers of technological development and, conse-quently, they would capture extraordinary profits (Zawislak, 2004).
Firms formalized innovation internally through research and devel-opment (R&D) departments, which institutionalized the firm’s growth in process and technical efficiency (Penrose, 1959). Coase (1937), ar-gued that a series of transactions could be arranged outside the mar-ket and regulated by the firm. This innovation would serve to lower transaction costs. His point was that the management of resource al-location would be dependent on intangible entrepreneur-coordinator assets, responsible for finding superior organizational formats that reduce transaction costs. In the context of Sumpeter and Coase, the firm is ultimately responsible for managing both tangible (technolo-gies) and intangible (knowledge) assets by utilizing information with-in an institutional environment for decision making. The firm can develop new technologies or search for alternatives to their hierarchy in order to remain competitive. These technologies can lower costs of production, streamline processes, improve quality, or expand what the firm does. In an increasingly competitive, intense, and dynamic environment, the need for up to date information becomes essential for the firm. Therefore, the firm seeks knowledge about consumers and competitors. Firms gradually pass from the condition of a single period profits maximizer to problem solvers (innovative) to obtain and maintain a long-run stream of profits.
Building on the view of firms as problem solvers, the “evolutionary theory” developed by Nelson and Winter (1982) arises. The starting point of this theory is that the firm becomes the locus of technological accumulation, including not only new technologies, but also knowl-edge and learning. As firms innovate, their technological knowledge and managerial skill would not be easily copied because other firms cannot observe the underlying details of private changes and they could not easily access new technologies. The transfer of such knowl-edge would be costly and would necessarily require learning. Some technologies cannot be imitated at all. In these cases, new technolo-gies originate from the initiative and effort of their own firms as they adapt to their particular assets and institutional environment. There-fore, the creation of a new technology requires skills, effort and in-vestment of each firm. Dosi and Orsenigo (1988) affirms that the evo-lutionary theory can explain the permanent existence of asymmetries between firms, in terms of the technologies utilized and the quality of production. There are different degrees of technology accumulation
and different efficiencies in technological and innovative research process. Technological change is understood as a continuing process of either the adoption of existing technologies or the creation of new technical knowledge, which is determined by the external inputs and the previous accumulation of capabilities and knowledge of the firm.
There is an ongoing debate about the nature of the innovation process. Innovation is recognized as a driving force for the economic develop-ment and competitiveness of the firm and, as a result, this increases our interest in understanding the factors that determine this process. The research presented in this paper is constructed on the internal development of new technologies and new strategies that alter the ex-istence, functioning, behavior, and the role played by markets. Our work is consistent with studies by Cesaratto and Mangano (1993), Christensen (1996), and Cabral (2007) which define innovation as being either new to the world, country or company, thus utilizing a wider approach to measuring innovation.
Note that the Schumpeterian view of innovation would be predom-inantly associated with radical innovation. He does not consider cascading technical improvements of new products or processes as innovation. For Schumpeter (1934), large companies would innovate more than small firms. The study of Scherer (1992) confirms this hy-pothesis, demonstrating that 90% of R&D performed in the U.S. is conducted by four major corporations. However, studies have recent-ly found evidence that small and medium food companies invest heav-ily in innovation (Traill and Grunert, 1997; Avermaete, et. al., 2004).
The size of the company could potentially be related to its market power upstream or downstream, and this would influence the innova-tion process. Several research studies evaluate innovation in the food industry and its relation to the upstream and downstream sectors. In a study of the European retail sector, Dobson et al. (2001) show that increasing the market power of retailers can lower prices, but also re-duce product variety and innovation efforts of the agri-food business-es. Studying the effect of market structure on innovation of agri-food products in the U.S., Roeder et al. (2000) state that there is a strong negative correlation between market concentration and innovation. Another study conducted by the Federal Trade Commission (FTC, 2003) also suggests a strong negative correlation between market con-centration and innovation. The authors suggest that higher market dominance by a few companies lowers the propensity for innovation.
In a survey in the German food industry, Weiss and Wittkopp (2005) find that an increase in market power in the retail sector decreases innovation by manufacturers. The market power of retailers has neg-ative effects on innovation in food manufacturing, which is measured by the number of new products introduced in the market.
Another study analyzes how downstream firms with market power force suppliers into exclusive agreements and, thus, reduce incentives to innovate (Inderst and Wey, 2006). In summary, the market power of downstream firms may reduce incentives for innovation by food manufacturers. Similar effects can be expected if there is market concentration of upstream suppliers.
12
ISSN: 0718-2724. (http://jotmi.org)Journal of Technology Management & Innovation © Universidad Alberto Hurtado, Facultad de Economía y Negocios.
J. Technol. Manag. Innov. 2015. Volume 10, Issue 3
On the other hand, the research conducted by Triguero et al. (2013) find that certain factors, such as positive evolution of the market share of firms, are not strongly related to innovation in the Spanish food in-dustry. Following the same reasoning, Bhattacharya and Bloch (2004) argue that a high market concentration can provide an opportuni-ty for small businesses to capture a share of market power through innovation, and the intensity of R&D would not have a positive or significant relation to innovation.
The number and size of firms (market concentration), the degree of product differentiation, and market size may all affect the number of innovations in a nonlinear manner (Roder, et. al., 2000). Therefore, it is important to include specific characteristics of each sector when analyzing the relationship between firm size and innovation.
Existing differences in the intensity and source of technological inno-vation and individual factors, such as firm size, may not be sufficient to predict and explain innovative activity. A linear model of innova-tion, characterized by a unidirectional relationship to company size, as proposed by Schumpeter (1934), may be inadequate for explaining the complex process of technological innovation.
Directly related to the Schumpeterian view of technical progress, Nelson and Winter (1982) describe the Evolutionary Theory of Eco-nomic Change, in which change is understood as technological devel-opment. The generation and application of new technologies begins with the initiative and effort of the firms. This process is described as an adaptation of the specific assets in an institutional environment. Developing specific expertise (routines or genes) and perception (based on the ability and limited rationality of their managers), firms have the technological competence to ensure their survival in com-petitive situations, which can be adverse.
The competence of a company is based on their internal ability to change the combination of factors (a mutation) in a specific way to seek gains in the market. Thus, the competition among different technologies (generated by different firms) in the market results in a natural selection. The very essence of technological and economic development rises from the gene-mutation-selection process (Nelson and Winter, 1982).
Dosi (1982) describes a complex structure of relations between the economic environment and the direction of technological change. A theory of technical change would define, as generally as possible, the nature of these interactive mechanisms, which can act as either a source of homogeneity or heterogeneity among industries or com-panies.
Although under the same technological regiments, the firms may dif-fer in many other relevant aspects. Considering its interaction with the economic environment, firms can present business strategies (in-cluding, for example, R&D and prices) and organizational structure (such as having different levels of vertical integration and horizontal diversification) (Dosi and Orsenigo, 1988). Consequently, innovation
in the wheat industry can be related to greater vertical integration in the production chain.
In addition, innovations can be developed or generated either inter-nally or externally to the company and can result from R&D, learn-ing from patent acquisitions, improved know-how or new equipment and machinery. However, there is an expectation that consolidated companies (longevity in market) are more prone to innovate. These companies have greater experience that facilitates cumulative learn-ing and, consequently, can improve the innovative performance.
Materials and Methods
To obtain the necessary information for this study, an online ques-tionnaire was developed and sent by email to the directors or product development sectors at 179 companies. Before sending the link, re-spondents were contacted by telephone to explain the research objec-tives and to describe the questionnaire.
The sample was composed by the companies registered in class as-sociations, which are responsible for process more than 80% of na-tional production volume of wheat products. The questionnaire was sent to 40 companies registered in ABITRIGO (Brazilian Association of Wheat Industry), 30 from ABIMA (Brazilian Association of Pasta Industry), 61 from ANIB (Brazilian Association of Biscuits) and over 48 companies registered in ABIA (Brazilian Association of Food In-dustry). Data was collected from October to December 2013. From 179 companies invited to participate on the study, 51 questionnaires were returned with valid responses, representing a response rate of approximately 28%.
In this paper, a logistic regression is used to analyze the determinants of innovation. For this logistic regression, information on whether or not innovation occurred is needed to determine a dichotomous value (1 if there is innovation or 0 if there is not) as the dependent variable. From this binary outcome, the logistic regression estimates the prob-ability that an event occurs (Gujarati, 2006).
The likelihood that firms innovate is estimated from the identifica-tion of independent variables that are hypothesized to impact the de-pendent variable. The logistic regression assumes a relation between the dependent and independent variables that resembles an S-shaped curve, in which at very low levels of the independent variable, the probability tends to zero, but as the independent variable increases, the probability initially increases rapidly. Then, the slope begins to decrease, so that at any level of the independent variable, the proba-bility will tend to one, but will not exceed this value (Gujarati, 2006). Logistic regression does not require normality of the error term. This method resembles, in many respects, the multiple linear regression, however the logistic regression provides a direct prediction of the probability of an event occurring (Hair, et. al., 2008).
Estimative of logistic coefficients (β0, β1, … , βn) are used to explain the changes in probability and are expressed in logarithms, needing to
13
ISSN: 0718-2724. (http://jotmi.org)Journal of Technology Management & Innovation © Universidad Alberto Hurtado, Facultad de Economía y Negocios.
J. Technol. Manag. Innov. 2015. Volume 10, Issue 3
be transformed back (antilogarithm) for analysis. For example, if β1 is positive, the transformed antilog is greater than 1, and the inequality ratio increases, thus increasing the predicted probability of occur-rence (yes) and decreasing the likelihood of the event to not occur (no). Another difference compared to the multiple regression analysis is the method of estimating the coefficients. Instead of minimizing the squared deviations (least squares method), a logistic regression maximizes the likelihood (best estimate) of an event occurring due to non-linearity of the logistic transformation (Hair et al., 2008). To evaluate the explanatory power of the model, I calculate the Nagelk-erke R2 , with values from 0 to 1 (where values closer to 1 indicate higher explanatory power). To determine which independent vari-ables are significant determinants of innovation, the Wald statistic is calculated. The hypothesis that at least one of the coefficients in the ratio of inequality influences and modifies the probability of an event occurring or not was tested (Gujarati, 2006).
A model of estimation is utilized to identify variables with explan-atory power for the propensity of a firm to innovate or not, according to Equation 1:
Y = β0 + β1 X1 + β2 X2 + β3 X3 + β4 X4 + β5 X5 + β6 X6
Y = Innovation (1 = innovate, 0 otherwise) Β0 = Constant; β1 = coefficient for the number of employees - FUNC4; β2 = coefficient for the gross sales - FATB9; β3 = coefficient for the investment in R&D - INVPED11; β4 = coefficient for the R&D department - SNPED6; β5 = coefficient for the longevity in market - ANO1; β6 = coefficient for the integration in the production chain - NPROD2; X1 = number of employees - FUNC4 X2 = gross sales - FATB9; X3 = investment in R&D - INVPED11; X4 = R&D department - SNPED6; X5 = longevity in market - ANO1; X6 = integration in the production chain - NPROD2
As discussed above, the size of the company can be one of the fac-tors that increases the propensity of the firm to innovate, therefore the variables of the number of employees (FUNC4) and gross sales (FATB9) are considered. Another factor potentially related to the
propensity to innovate is research and development. It is assumed that firms with higher investments in R&D (INVPED11) and hav-ing a formalized department of R&D (SNPED6) are more likely to innovate. We also considered the age of the company (ANO1), expecting that cumulative learning increases the propensity to in-novate. Finally, the production chain (NPROD2) is also included, with the assumption that a higher level of integration increases the propensity to innovate.
In addition, to estimate the probability of an event to occur, a logit transformation is needed according to
Equation 2 (Gujarati, 2006):
Pi = exponential of event occurring;e = exponential of the negative logistic equation.
The logit function also allows simulations of how the probability of innovating changes in a company, changing the independent vari-ables, which will be presented in the following results.
Results and Discussion
As described in materials and methods section, 51 valid responses were received. 28 firms did not innovate (55% of the 51 responses) and 23 (45%) of the responses indicated an innovation occurred in the recent period (last five years). These findings suggest that most companies producing wheat products innovated more rapidly com-pared to the innovation in the Brazilian food industry in general but lower than in other regions. Rates of Brazilian food industry inno-vation reported in Innovation research - PINTEC (2000; 2003; 2005; 2008) suggest an increasing trend: 1998-2000: 29%; 2001-2003: 34%; 2003-2005: 32%; 2006-2008: 38%. In the European Union this per-centage is above 55%, according to data from the Community Inno-vation Survey (CIS, 2013).
Based on these results, and in the context of an increasingly compet-itive environment and complex consumer profiles, there is a growing opportunity for more companies to innovate. As described above, a logistic model is utilized to identify variables that influence the pro-pensity of firms to innovate. The variables are mainly related to firm size, research and development, the age of the company, and integra-tion in the supply chain. The results are shown in Table 1.
(2)
- (β0+β1X1+...+βnXn)
(1)
14
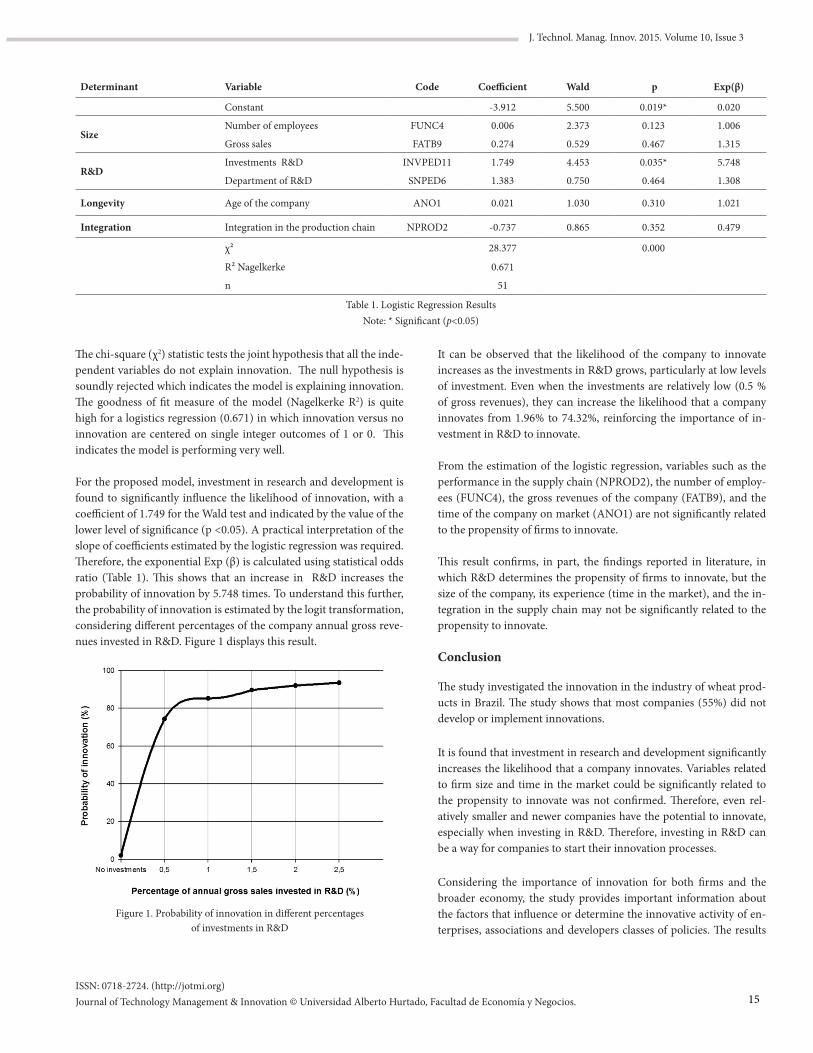
ISSN: 0718-2724. (http://jotmi.org)Journal of Technology Management & Innovation © Universidad Alberto Hurtado, Facultad de Economía y Negocios.
J. Technol. Manag. Innov. 2015. Volume 10, Issue 3
The chi-square (χ2) statistic tests the joint hypothesis that all the inde-pendent variables do not explain innovation. The null hypothesis is soundly rejected which indicates the model is explaining innovation. The goodness of fit measure of the model (Nagelkerke R2) is quite high for a logistics regression (0.671) in which innovation versus no innovation are centered on single integer outcomes of 1 or 0. This indicates the model is performing very well.
For the proposed model, investment in research and development is found to significantly influence the likelihood of innovation, with a coefficient of 1.749 for the Wald test and indicated by the value of the lower level of significance (p <0.05). A practical interpretation of the slope of coefficients estimated by the logistic regression was required. Therefore, the exponential Exp (β) is calculated using statistical odds ratio (Table 1). This shows that an increase in R&D increases the probability of innovation by 5.748 times. To understand this further, the probability of innovation is estimated by the logit transformation, considering different percentages of the company annual gross reve-nues invested in R&D. Figure 1 displays this result.
Determinant Variable Code Coefficient Wald p Exp(β)
Constant -3.912 5.500 0.019* 0.020
SizeNumber of employees FUNC4 0.006 2.373 0.123 1.006
Gross sales FATB9 0.274 0.529 0.467 1.315
R&DInvestments R&D INVPED11 1.749 4.453 0.035* 5.748
Department of R&D SNPED6 1.383 0.750 0.464 1.308
Longevity Age of the company ANO1 0.021 1.030 0.310 1.021
Integration Integration in the production chain NPROD2 -0.737 0.865 0.352 0.479
χ² 28.377 0.000
R² Nagelkerke 0.671
n 51
Table 1. Logistic Regression Results Note: * Significant (p<0.05)
Figure 1. Probability of innovation in different percentages of investments in R&D
It can be observed that the likelihood of the company to innovate increases as the investments in R&D grows, particularly at low levels of investment. Even when the investments are relatively low (0.5 % of gross revenues), they can increase the likelihood that a company innovates from 1.96% to 74.32%, reinforcing the importance of in-vestment in R&D to innovate.
From the estimation of the logistic regression, variables such as the performance in the supply chain (NPROD2), the number of employ-ees (FUNC4), the gross revenues of the company (FATB9), and the time of the company on market (ANO1) are not significantly related to the propensity of firms to innovate.
This result confirms, in part, the findings reported in literature, in which R&D determines the propensity of firms to innovate, but the size of the company, its experience (time in the market), and the in-tegration in the supply chain may not be significantly related to the propensity to innovate.
Conclusion
The study investigated the innovation in the industry of wheat prod-ucts in Brazil. The study shows that most companies (55%) did not develop or implement innovations.
It is found that investment in research and development significantly increases the likelihood that a company innovates. Variables related to firm size and time in the market could be significantly related to the propensity to innovate was not confirmed. Therefore, even rel-atively smaller and newer companies have the potential to innovate, especially when investing in R&D. Therefore, investing in R&D can be a way for companies to start their innovation processes.
Considering the importance of innovation for both firms and the broader economy, the study provides important information about the factors that influence or determine the innovative activity of en-terprises, associations and developers classes of policies. The results
15
ISSN: 0718-2724. (http://jotmi.org)Journal of Technology Management & Innovation © Universidad Alberto Hurtado, Facultad de Economía y Negocios.
J. Technol. Manag. Innov. 2015. Volume 10, Issue 3
show that this is not a random or unpredictable process, but some-thing complex and diverse that can be specific to each industry.
There are a number of opportunities for the processing industry to be more innovative, which can benefit all segments of the production chain, from the production of wheat processing industry to, there-fore, benefit consumers and conquer new markets. Although all lim-itations for smaller companies to innovate, innovative behavior will be required to ensure competitiveness in the new competitive envi-ronment with new consumption patterns. Investments in R&D may still be a great advantage for innovation.
Acknowledgements
Conselho Nacional de Desenvolvimento Científico e Tecnológico– CNPq, Coordenação de Aperfeiçoamento de Pessoal de Nível Superior – Capes.
References
ABIA. Associação Brasileira das Indústrias de Alimentação (2013). Re-trieved from http://abia.org.br/vst/o_setor_em_numeros.html
ABIMA. Associação Brasileira das Indústrias de Massas (2013). Re-trieved from http://www.abima.com.br/.est_mmundial.html
ABITRIGO. Associação Brasileira da Indústria de Trigo (2013). Retrieved from http://www.abitrigo.com.br/index.php?mpg=09.00.00
ANIB. Associação Brasileira da Indústria de Biscoitos (2013). Retrieved from http://www.anib.com.br/dados_estatisticos
Avermaete, T., Viane, J., Morgan, E., Pitts, E., Crawford, N., & Ma-hon, D. (2004). Determinants of product and process innovation in small food manufacturing firms. Trends in Food Science & Technolo-gy, 15(10), 474–483.
Bhattacharya, M., & Bloch, H. (2004). Determinants of innovation. Small Business Economics, 22(2), 155-162.
Brewin, D., Monchuk, D., & Partridge, M. (2009). Examining the adoption of product and process innovations in the canadian food processing industry. Canadian Journal of Agricultural Economics, 57(1), 75-97.
Cabral, J. (2007). Determinantes da propensão para inovar e da in-tensidade inovativa em empresas da indústria de alimentos do Brasil. Revista de Administração Contemporânea, 11(4), 87-108.
Capitanio, F., Coppola, A., & Pascucci, S. (2010). Product and process innovation in the italian food industry. Agribusiness, 26(4), 503-518.
Cesaratto, S., & Mangano, S. (1993). Technological profiles and eco-nomic performance in the Italian manufacturing sector. Economics of Innovation and New Technology, 2(3), 237-256.
Christensen, J. (1996). Innovative assets and inter-asset linkages: a resource-based approach to innovation. Economics of Innovation and New Technology, 4(3), 193-209.
CIS. Community Innovation Survey (2013). Retrieved from http://epp.eurostat.ec.europa.eu/portal/page/portal/microdata/cis
Coase, R. (1937). The Nature of the Firm. Economica, 4(16), 386-405.
Dobson, P., Clarke, R., Davies, S., & Waterson, M. (2001). Buyer power and its impact on competition in the food retail distribution sector of the Eu-ropean Union. Journal of Industry, Competition and Trade, 1(3), 274–281.
Dosi, G. (1982). Technological trajectories and technological para-digms. Research Policy, 11(3), 147-162.
Dosi, G., & Orsenigo, L. (1988). Industrial Structure and Techni-cal Change in Innovation, Technology and Finance. Oxford: Basil Blackwell.
Federal Trade Commission. (2003). To Promote Innovation: the Prop-er Balance of Competition and Patent Law and Policy. FTC: Federal Trade Commission, USA.
Gujarati, D. (2006). Econometria básica. Rio de Janeiro: Elsiever.
Hair, J., Anderson, R., Tatham, R., & Black, W. (2008). Análise multi-variada de dados. São Paulo: Bookman.
Inderst, R., & Wey, C. (2006). Buyer power and supplier incentives. European Economic Review, 51(3), 647–667.
Nelson, R., & Winter, S. (1982). An Evolutionary Theory of Economic Change. Cambridge: The Belknap Press of Harvard University Press.
Penrose, E. (1959). The Theory of the Growth of the Firm. New York: Oxford University Press.
PINTEC. Pesquisa de Inovação (2000). Retrieved from http://www.pintec.ibge.gov.br/downloads/PUBLICACAO/Publicacao%20PIN-TEC%202000.pdf
PINTEC. Pesquisa de Inovação (2003). Retrieved from http://www.pintec.ibge.gov.br/downloads/PUBLICACAO/Publicacao%20PIN-TEC%202003.pdf
PINTEC. Pesquisa de Inovação (2005). Retrieved from http://www.pintec.ibge.gov.br/downloads/PUBLICACAO/Publicacao%20PIN-TEC%202005.pdf
PINTEC. Pesquisa de Inovação (2008). Retrieved from http://www.pintec.ibge.gov.br/downloads/PUBLICACAO/Publicacao%20PIN-TEC%202008.pdf
16
ISSN: 0718-2724. (http://jotmi.org)Journal of Technology Management & Innovation © Universidad Alberto Hurtado, Facultad de Economía y Negocios.
J. Technol. Manag. Innov. 2015. Volume 10, Issue 3
Roeder, C., Herrman, R., & Connor, J. (2000). Determinants of new product introductions in the US food industry: a panel-model ap-proach. Applied Economics Letters, 7(11), 743–748.
Scherer, F.M. (1992). Schumpeter and plausible capitalism. Journal of Economic Literature, 30(3), 1416–1433.
Schumpeter, J.A. (1934). The Theory of Economic Development. Cam-bridge: Harvard University Press.
Schumpeter, J. A. (1939). Business Cycles: A Theoretical, Historical, and Statistical Analysis of the Capitalist Process. Philadelphia: Porcu-pine Press.
Traill, B., & Grunert, K. (1997). Product and Process Innovation in the Food Industry. Suffolk: Chapman & Hall.
Traill, B., & Meulenberg, M. (2002). Innovation in the Food Industry. Agribusiness, 18(1), 1–21.
Triguero, A., Córcoles, D., & Cuerva, M. C. (2013). Differences in in-novation between food and manufacturing firms: An analysis of per-sistence. Agribusiness, 29(3), 273-292.
Weiss, H.R., & Wittkopp, A. (2005). Retailer concentration and prod-uct innovation in food manufacturing. European Review of Agricultu-ral Economics, 32(2), 219–244.
Zawislak, P. A. (2004). Economia das Organizações e a Base para o Pensamento Estratégico. In: S. Clegg; C. Hardy; W. Nord; M. Cal-das; R. Fachin & T. Fischer. (Eds.), Handbook de Estudos Organiza-cionais: Ação e Análise Organizacionais (pp. 180-185). São Paulo: Atlas.
17
ISSN: 0718-2724. (http://jotmi.org)Journal of Technology Management & Innovation © Universidad Alberto Hurtado, Facultad de Economía y Negocios.
J. Technol. Manag. Innov. 2015. Volume 10, Issue 3
1909Perceptual Factors Affecting the Tendency to Collaboration in SMEs:
Perceived Importance of Collaboration Modes and Partners
Heeyong Noh 1, Sungjoo Lee 1*
Abstract: This research aims to explore key factors of SMEs’ external collaboration and to identify the factors that are perceived to affect their propensity for collaboration. In particular, we focus on two factors—internal strategic activities geared toward open innovation and external collaboration partners, both of which are essential to establishing an external collaboration. We conducted a survey of Korean SMEs regarding their collaboration project experiences, and we used logistic regression analysis to analyze the survey data. The research findings are expected to aid understanding of SMEs’ complex open innovation mechanism and to have meaningful implications for the development of their collaboration models.
Keywords: SMEs, Collaboration models, Korea, Innovation
Introduction
Pavitt (1983) showed that more than half of the innovations since 1955 have come from large enterprises (LEs) with more than ten thousand employees. However, Rothwell (1984) argued that simply counting innovations does not explain the relative innovative efficien-cy of small and medium enterprises (SMEs) and LEs, and proposed using innovations per unit of employment or innovations per unit of output. Wyatt’s (1982) analysis supports the argument that small firms’ share of innovations is considerably greater than their share of R&D expenditures relative to LEs. It is now clear that SMEs have a strong impact on national economic growth because of their poten-tial for innovation (Harrison and Hart, 1987; Levy and Powell, 1988). Thus, improving their competitiveness is critical to driving and developing the economy.
Among the ways to support innovation in SMEs and further enhance their competitiveness, the use of aggressive external collaboration is especially important in the context of open innovation (OI) (Lee et al., 2010; Lee et al., 2012; Westhead and Storey, 1995). Since the con-cept of OI was introduced, there has been extensive literature pub-lished on external collaboration (Chen et al., 2011; Enkel et al., 2009; Chiaroni, et al, 2011). For SMEs, external collaboration may be nec-essary in order to survive in a turbulent market environment (Lee et al., 2012). External collaboration offers a way for SMEs to extend and complement their internal resources (Lee et al., 2010) and to make up for a lack of knowledge, qualified human resources, and facilities as well as their limited market information and access (Hamdani and Wirawan, 2012; Lu and Beamish, 2001). Clearly, moving toward an external collaboration can be a logical means for SMEs to establish innovation; however, risks and costs for this movement may exist.
Submitted August 8th 2015 / Approved October 12th 2015
1 Department of Industrial Engineering, Ajou University, South Korea*Corresponding author: [email protected]
Various OI studies of SMEs have been conducted recently (Van de Vrande et al., 2009), and they have shown that network ties and rela-tionships such as information sharing and resource pooling can offer technological opportunities to improve SMEs’ performance (Ches-brough, 2003; Lee et al., 2010; Lipparini and Sobrero, 1994). Focus-ing on those advantages of external collaboration, some research has shown that both inbound and outbound strategies have positively affected SMEs’ innovative performances (Bianchi et al., 2010; Pari-da et al., 2012). In contrast, other studies focused on the disadvan-tages of external collaboration, such as having to reveal proprietary information, potentially losing competitive advantage, increasing the complexity of innovation, and facing the challenges of applying the concept of OI (West and Gallagher, 2006). This double-edged sword has caused confusion regarding SMEs’ use of external collaboration. Besides, SMEs’ previous experiences with collaboration, which are of great importance when assessing the effectiveness of OI strategies, differ greatly. Accordingly, SMEs are likely to have different percep-tions about OI. As Buytendijk (1922) said, “perception is always re-lated to specific actions or, more precisely, perception always includes the impetus to actions” (p.24). Investigating perceptions about SMEs’ external collaboration strategies will help explain their strategic be-haviors toward OI. SMEs’ perceptions are particularly interesting to examine, as management decisions are made mainly on the basis of insights from top managers. In spite of their significance, however, little effort has been made to deal with the issues associated with these perceptions.
To fill the research gap, therefore, this study aims to understand the determinants of collaboration tendency, focusing on two perceptual factors—the perceived importance of collaboration modes and the external collaboration partners. The former describes why and how
18
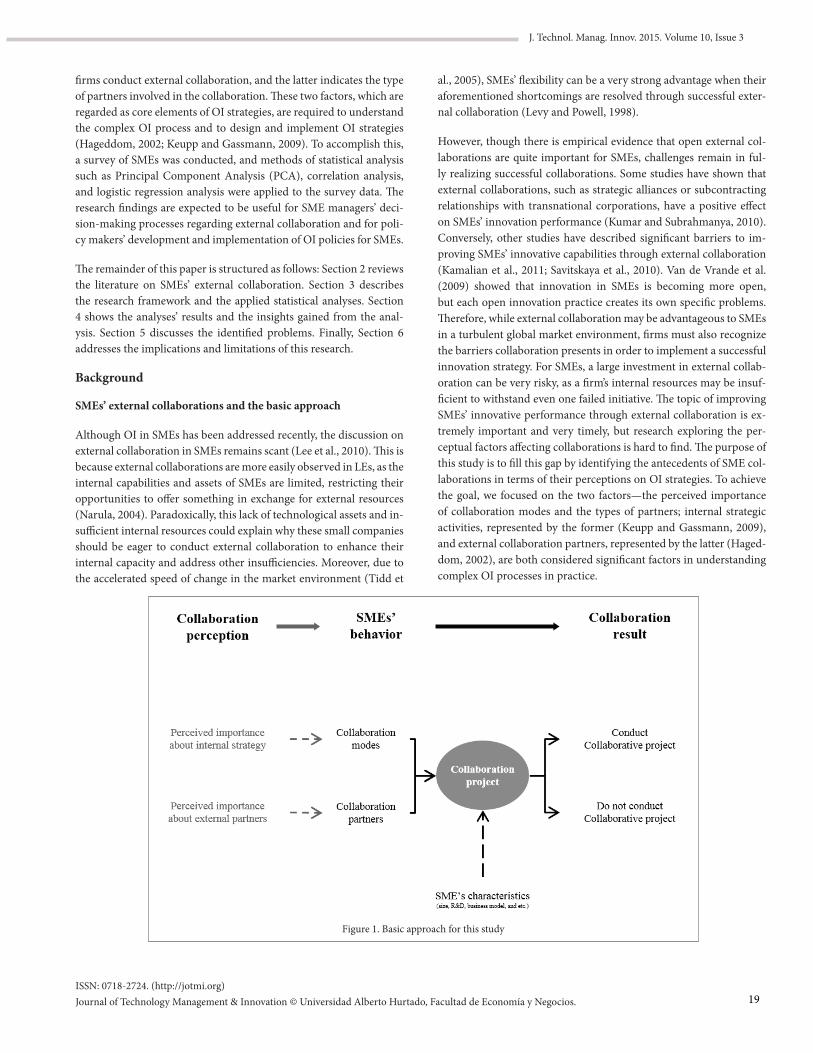
ISSN: 0718-2724. (http://jotmi.org)Journal of Technology Management & Innovation © Universidad Alberto Hurtado, Facultad de Economía y Negocios.
J. Technol. Manag. Innov. 2015. Volume 10, Issue 3
firms conduct external collaboration, and the latter indicates the type of partners involved in the collaboration. These two factors, which are regarded as core elements of OI strategies, are required to understand the complex OI process and to design and implement OI strategies (Hageddom, 2002; Keupp and Gassmann, 2009). To accomplish this, a survey of SMEs was conducted, and methods of statistical analysis such as Principal Component Analysis (PCA), correlation analysis, and logistic regression analysis were applied to the survey data. The research findings are expected to be useful for SME managers’ deci-sion-making processes regarding external collaboration and for poli-cy makers’ development and implementation of OI policies for SMEs.
The remainder of this paper is structured as follows: Section 2 reviews the literature on SMEs’ external collaboration. Section 3 describes the research framework and the applied statistical analyses. Section 4 shows the analyses’ results and the insights gained from the anal-ysis. Section 5 discusses the identified problems. Finally, Section 6 addresses the implications and limitations of this research.
Background
SMEs’ external collaborations and the basic approach
Although OI in SMEs has been addressed recently, the discussion on external collaboration in SMEs remains scant (Lee et al., 2010). This is because external collaborations are more easily observed in LEs, as the internal capabilities and assets of SMEs are limited, restricting their opportunities to offer something in exchange for external resources (Narula, 2004). Paradoxically, this lack of technological assets and in-sufficient internal resources could explain why these small companies should be eager to conduct external collaboration to enhance their internal capacity and address other insufficiencies. Moreover, due to the accelerated speed of change in the market environment (Tidd et
al., 2005), SMEs’ flexibility can be a very strong advantage when their aforementioned shortcomings are resolved through successful exter-nal collaboration (Levy and Powell, 1998).
However, though there is empirical evidence that open external col-laborations are quite important for SMEs, challenges remain in ful-ly realizing successful collaborations. Some studies have shown that external collaborations, such as strategic alliances or subcontracting relationships with transnational corporations, have a positive effect on SMEs’ innovation performance (Kumar and Subrahmanya, 2010). Conversely, other studies have described significant barriers to im-proving SMEs’ innovative capabilities through external collaboration (Kamalian et al., 2011; Savitskaya et al., 2010). Van de Vrande et al. (2009) showed that innovation in SMEs is becoming more open, but each open innovation practice creates its own specific problems. Therefore, while external collaboration may be advantageous to SMEs in a turbulent global market environment, firms must also recognize the barriers collaboration presents in order to implement a successful innovation strategy. For SMEs, a large investment in external collab-oration can be very risky, as a firm’s internal resources may be insuf-ficient to withstand even one failed initiative. The topic of improving SMEs’ innovative performance through external collaboration is ex-tremely important and very timely, but research exploring the per-ceptual factors affecting collaborations is hard to find. The purpose of this study is to fill this gap by identifying the antecedents of SME col-laborations in terms of their perceptions on OI strategies. To achieve the goal, we focused on the two factors—the perceived importance of collaboration modes and the types of partners; internal strategic activities, represented by the former (Keupp and Gassmann, 2009), and external collaboration partners, represented by the latter (Haged-dom, 2002), are both considered significant factors in understanding complex OI processes in practice.
Figure 1. Basic approach for this study
19
ISSN: 0718-2724. (http://jotmi.org)Journal of Technology Management & Innovation © Universidad Alberto Hurtado, Facultad de Economía y Negocios.
J. Technol. Manag. Innov. 2015. Volume 10, Issue 3
Thus, the basic approach to investigate the two antecedents of exter-nal collaboration is shown in Fig. 1. First of all, we assume that SMEs’ perceptions about external collaboration affect their behaviors and that those behaviors influence the collaboration results. Furthermore, the perceptions about the best modes of collaboration and partner types will affect SMEs’ collaborative behaviors (e.g., their efforts to form a collaboration network or their commitment to collaboration). These behaviors are expected to have a significant impact on SMEs’ propensity for collaboration and on the success of their collabora-tions; these collaboration results will also be affected by firm-specific characteristics. Based on this approach, we firstly categorize the col-laboration modes and partner types according to their perceptions of SMEs, and we then examine how these perceptions affect SMEs’ tendencies for collaboration.
Firms may employ different types of collaborations to enhance per-formance, including interfirm collaborations such as joint ventures, research and development (R&D) collaborations, co-productions, university-industry collaborations, and customer-industry collabo-rations. It is apparent that these strategic collaborations provide an opportunity for technological innovation and commercial benefit through resource pooling, technology complementing, etc. (Ches-brough, 2003; Chesbrough et al., 2006, Fitjar and Rodriguez-Pose, 2013; Kang and Park, 2012; Parmentier and Mangematin, 2014). From this perspective, Laursen and Salter (2006) showed that a firm that is too internally focused may miss profitable opportunities because it lacks resources that can only be obtained outside the firm. Likewise, a number of researchers have focused on the relationship between collaboration and its outcomes. The relationship between technology exploration—an inbound collaboration also known as the external technology acquisition (ETA) process—and innovative performance has been widely studied (Kurokawa, 1997; Sisodiya et al., 2013), and Procter & Gamble’s case is one of the most well-known examples in the field of business management (Chesbrough et al., 2006). Research has also been conducted on the benefits of technology exploitation, a form of outbound collaboration also known as the external technolo-gy exploitation (ETE) process (Arora and Fosfuri, 2003; Athreye and Cantwell, 2007; Mendi, 2007).
However, is it possible to say that every type of external collabora-tion boosts the technological or financial performance of a firm in the same way? Some researchers have warned that building external collaborations without careful consideration of the risks may not in-crease a firm’s internal capabilities and may even negatively impact its performance (Fey and Birkinshaw, 2005; Kafouros and Forsans, 2011). For firms undertaking inbound collaboration, factors such as their absorption capacity, “Not invented here” (NIH) syndrome, and asymmetric information about the technology market can be barriers to achieving innovative performance or enhancing the firm’s internal capabilities (Kani and Motohashi, 2012; Savitskaya et al., 2010; West and Gallagher, 2006). Similarly, concerns such as rent dissipation, “Not sold here” (NSH) syndrome, the complexity of intellectual prop-erty rights (IPR), and fear of disclosing proprietary information can make a firm hesitant about engaging in outbound collaboration (Kani and Motohashi, 2012; Savitskaya et al., 2010; West and Gallagher,
2006). Interestingly, these factors are greatly associated with percep-tions about external collaboration; thus, considering such perceptual factors is necessary to identify why some SMEs seek to conduct exter-nal collaboration while others do not.
Collaboration strategies and questions for exploration research
In the previous section, the basic approach of this study was de-scribed, including two significant factors: collaboration modes and collaborative partners. As each factor has varied types and different characteristics, we should figure out how the factors are explained in the existing studies. To achieve this, effectiveness and efficiency are useful concepts for understanding why and how firms conduct exter-nal collaboration; effectiveness is often said to mean “doing the right thing” to contrast with efficiency, or “doing things right.” Based on the concepts of effectiveness and efficiency, we can raise a set of questions regarding whether perceptual factors affect SMEs’ tendency to col-laborate. Three kinds of questions are considered here: 1) perception context, 2) collaboration modes, and 3) collaboration partners.
First, as the aforementioned basic approach of this study assumes that SMEs’ perceptions about external collaboration affect their behaviors and that these behaviors influence collaboration results, there should be significant causal relationships between SMEs’ perceptions regard-ing the importance of external collaboration and their actual pro-pensity to conduct external collaboration when the basic approach is properly constructed.
Q1. Does the perceived importance of external collaboration have a significant impact on SMEs’ propensity for conducting external collaboration?
Secondly, collaboration modes are important in describing col-laboration strategies. SMEs can have many motives for conducting collaborations with other organizations. In many cases, a firm may want to seek the opportunity to resolve its managerial problems or to otherwise benefit from collaborations. In this context, Cho et al. (2015) showed that there are two major drivers of SMEs’ technolo-gy opportunity discovery: 1) opportunity discovery from the market and 2) opportunity creation by technology. According to the concept of effectiveness, these market and technology opportunities would have different levels of effectiveness for SMEs. However, opportunity discovery from the market might be more effective than opportunity creation by technology. This is both because SMEs typically lack the resources (Hamdani and Wirawan, 2012; Lu and Beamish, 2001) to develop technology that can create a new opportunity and because opportunity discovery from market can be less risky than developing a new technology with R&D investment.
Q2a. For SMEs’ collaboration propensity, does the perceived importance of discovering opportunity from the market have a stronger impact than the perceived importance of creating opportunity through technology?
Hollanders and Celikel-Esser (2007) found that innovation efficiency is improved when more innovation outputs are generated with the same amount of innovation inputs or when fewer innovation inputs
20
ISSN: 0718-2724. (http://jotmi.org)Journal of Technology Management & Innovation © Universidad Alberto Hurtado, Facultad de Economía y Negocios.
J. Technol. Manag. Innov. 2015. Volume 10, Issue 3
are needed for the same amount of innovation outputs. In the collabo-ration context, a firm might choose an inflow strategy or an outflow strategy based on which offers a more efficient method of collabo-ration. For example, a pharmaceutical SME might want to exploit a new technology that it developed. Anand and Khanna (2000) showed that there is a relatively high licensing propensity to earn extra rent in the pharmaceutical industry, compared with other industries. On the other hand, some micro-organizations and start-ups may want to focus on user-involved collaboration. Living Labs is one of the most popular user-involved external collaborations for SMEs that typically have problems acquiring venture capital to ensure reliable market evaluation (Eriksson et al., 2005; Wadhwa, 2012). In other cases, an alliance of SMEs may be formed to coproduce a product because the cost of acquiring manufacturing facilities would be too high for a single SME to manage alone. In summary, firms’ internal strategic activities represent their needs and desires, and significant relationships between strategies and outcomes exist (Mosakowski, 1993). Although internal strategic activities vary according to the spe-cific desires or demands of each firm, inbound strategies for external collaboration are much more common than outbound activities. Out-bound activities present a higher level of managerial challenge due to the imperfect and asymmetric information structure of the technology market (Kani and Motohashi, 2012) and to the lack of systematic internal processes to facilitate outward exploitation. SMEs also tend to struggle with external collaboration by acquiring valuable resources from external environments rather than by utilizing an outbound strategy (Parida et al., 2012). Similarly, the perceived importance of an inflow strategy might be a more significant factor than the per-ceived importance of an outflow strategy in explaining whether SMEs conduct collaboration.
Q2b. Does the perceived importance of inflow strategy have a stronger impact than the perceived importance of outflow strategy in explaining SMEs’ collaboration propensity?
Thirdly, collaboration partnership is another important factor when SMEs are conducting external collaboration. SMEs’ relationships with stakeholders can be valuable resources in the context of OI. Re-searchers have identified several technical partners that can be used to examine the relationships between collaborative partners and in-novation (Bougrain and Haudeville, 2002; Lee et al., 2010). Further-more, most innovative companies have strong cooperative ties with external stakeholders, and their important partners are primarily val-ue-chain stakeholders, such as clients, customers, and suppliers (Do-loreux and Mattson, 2008). Tomlinson and Fai (2013) also showed that the supply chain positively affects a firm’s innovation. Thus, col-laboration partners are selected based on which collaboration oppor-tunity is employed and how it is employed. Collaboration modes are described by the concepts of effectiveness and efficiency, which de-note collaboration opportunities and collaboration application meth-ods, respectively, in this study. Therefore, collaboration partners can be grouped in accordance with collaboration modes. There are two major drivers of SMEs’ technology opportunity discoveries (Cho et al., 2015). R&D-related organizations and public institutions might
be proper collaboration partners when SMEs choose the opportunity creation by technology strategy. On the other hand, market-related stakeholders can be useful collaboration partners for the discover-ing opportunity from market strategy. In addition, Husted and Allen (2007) showed that there are two types of market-related activities to achieve corporate social strategy: value chain activities and non-val-ue chain activities. Although value chain activities have long been a source of focus, non-value chain related activities have only been con-sidered critical in recent strategic management approaches. In other words, market opportunity partners should be grouped into value chain stakeholders who are directly related to the market competition and non-value chain stakeholders who are indirectly related to the market competition. In question 2a, we supposed that opportunity discovering from the market would be more effective than opportu-nity creation by technology. Likewise, market stakeholders may be more effective than R&D stakeholders at explaining SMEs’ propensity for collaboration.
Q3a. Does the perceived importance of market stakeholders have a stronger impact than the perceived importance of R&D stakeholders on SMEs’ collaboration propensity?
Under the context of efficiency, an external organization can help an SME to improve the efficiency of its resource acquisition or resource allocation capabilities. Robson and Bennett (2000) noted that exter-nal business advice has a positive effect on SMEs’ performance. In particular, private sector sources such as lawyers, suppliers, custom-ers, and friends or relatives dominated the main positive relationships in business advice and SME performance. Wren and Storey (2002) also demonstrated that the use of outside consultants can overcome SMEs’ substantial market failure. Therefore, SMEs’ business and sup-port services might work positively to conduct external collaboration.
Q3b. Does the perceived importance of business services, such as ac-counts, legal support, and consultants have a significant impact on de-scribing SMEs’ propensity for collaboration?
Research framework
Research process
This study aims to explore the practical antecedents of SMEs’ suc-cessful collaborations by looking at the perceived importance of col-laboration modes and partners from the SMEs’ perspectives. Fig. 2 shows the research process. A survey was carried out to investigate the current state of SMEs’ OI activities. In the survey, questions about broad types of collaboration modes and partners were asked in or-der to derive the practical determinants of SMEs’ external collabora-tions. In the second stage of the process, Varimax-rotated PCA was conducted to typify patterns of collaboration modes and partners. Following that, correlation analysis was used to develop models of external collaboration. Finally, in the third stage, the perceptual fac-tors affecting the tendency toward collaboration were explored using logistic regression analysis.
21
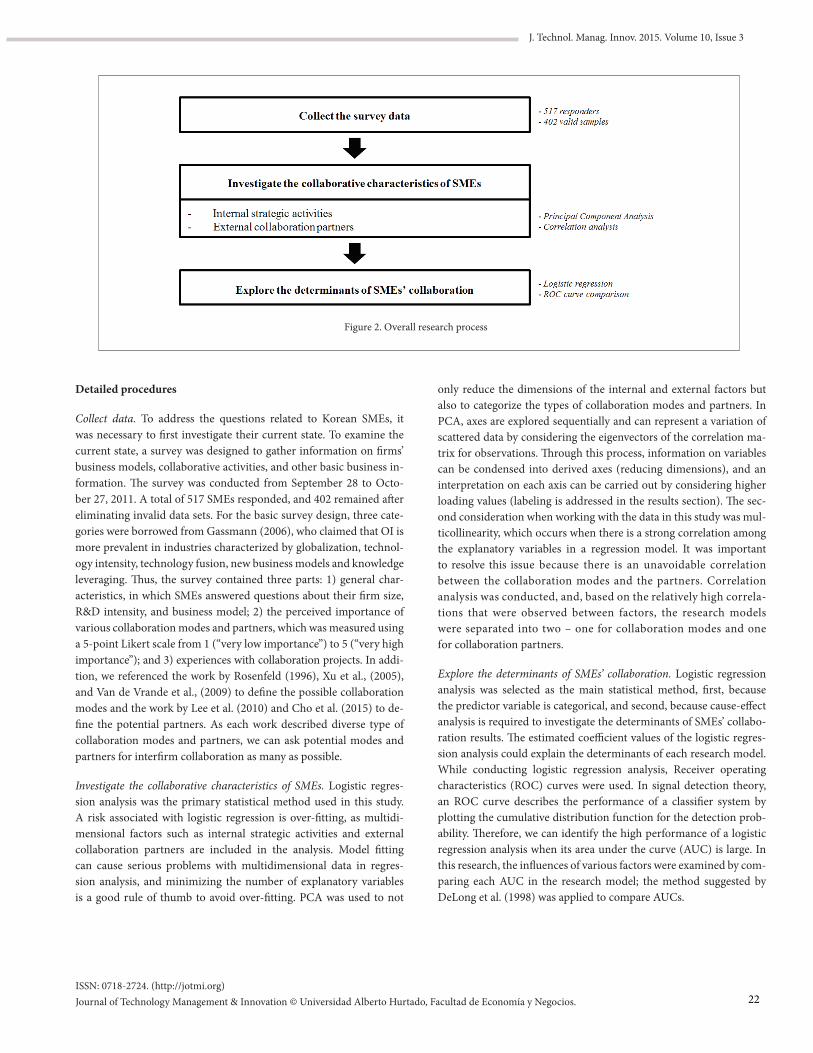
ISSN: 0718-2724. (http://jotmi.org)Journal of Technology Management & Innovation © Universidad Alberto Hurtado, Facultad de Economía y Negocios.
J. Technol. Manag. Innov. 2015. Volume 10, Issue 3
Detailed procedures
Collect data. To address the questions related to Korean SMEs, it was necessary to first investigate their current state. To examine the current state, a survey was designed to gather information on firms’ business models, collaborative activities, and other basic business in-formation. The survey was conducted from September 28 to Octo-ber 27, 2011. A total of 517 SMEs responded, and 402 remained after eliminating invalid data sets. For the basic survey design, three cate-gories were borrowed from Gassmann (2006), who claimed that OI is more prevalent in industries characterized by globalization, technol-ogy intensity, technology fusion, new business models and knowledge leveraging. Thus, the survey contained three parts: 1) general char-acteristics, in which SMEs answered questions about their firm size, R&D intensity, and business model; 2) the perceived importance of various collaboration modes and partners, which was measured using a 5-point Likert scale from 1 (“very low importance”) to 5 (“very high importance”); and 3) experiences with collaboration projects. In addi-tion, we referenced the work by Rosenfeld (1996), Xu et al., (2005), and Van de Vrande et al., (2009) to define the possible collaboration modes and the work by Lee et al. (2010) and Cho et al. (2015) to de-fine the potential partners. As each work described diverse type of collaboration modes and partners, we can ask potential modes and partners for interfirm collaboration as many as possible.
Investigate the collaborative characteristics of SMEs. Logistic regres-sion analysis was the primary statistical method used in this study. A risk associated with logistic regression is over-fitting, as multidi-mensional factors such as internal strategic activities and external collaboration partners are included in the analysis. Model fitting can cause serious problems with multidimensional data in regres-sion analysis, and minimizing the number of explanatory variables is a good rule of thumb to avoid over-fitting. PCA was used to not
Figure 2. Overall research process
only reduce the dimensions of the internal and external factors but also to categorize the types of collaboration modes and partners. In PCA, axes are explored sequentially and can represent a variation of scattered data by considering the eigenvectors of the correlation ma-trix for observations. Through this process, information on variables can be condensed into derived axes (reducing dimensions), and an interpretation on each axis can be carried out by considering higher loading values (labeling is addressed in the results section). The sec-ond consideration when working with the data in this study was mul-ticollinearity, which occurs when there is a strong correlation among the explanatory variables in a regression model. It was important to resolve this issue because there is an unavoidable correlation between the collaboration modes and the partners. Correlation analysis was conducted, and, based on the relatively high correla-tions that were observed between factors, the research models were separated into two – one for collaboration modes and one for collaboration partners.
Explore the determinants of SMEs’ collaboration. Logistic regression analysis was selected as the main statistical method, first, because the predictor variable is categorical, and second, because cause-effect analysis is required to investigate the determinants of SMEs’ collabo-ration results. The estimated coefficient values of the logistic regres-sion analysis could explain the determinants of each research model. While conducting logistic regression analysis, Receiver operating characteristics (ROC) curves were used. In signal detection theory, an ROC curve describes the performance of a classifier system by plotting the cumulative distribution function for the detection prob-ability. Therefore, we can identify the high performance of a logistic regression analysis when its area under the curve (AUC) is large. In this research, the influences of various factors were examined by com-paring each AUC in the research model; the method suggested by DeLong et al. (1998) was applied to compare AUCs.
22
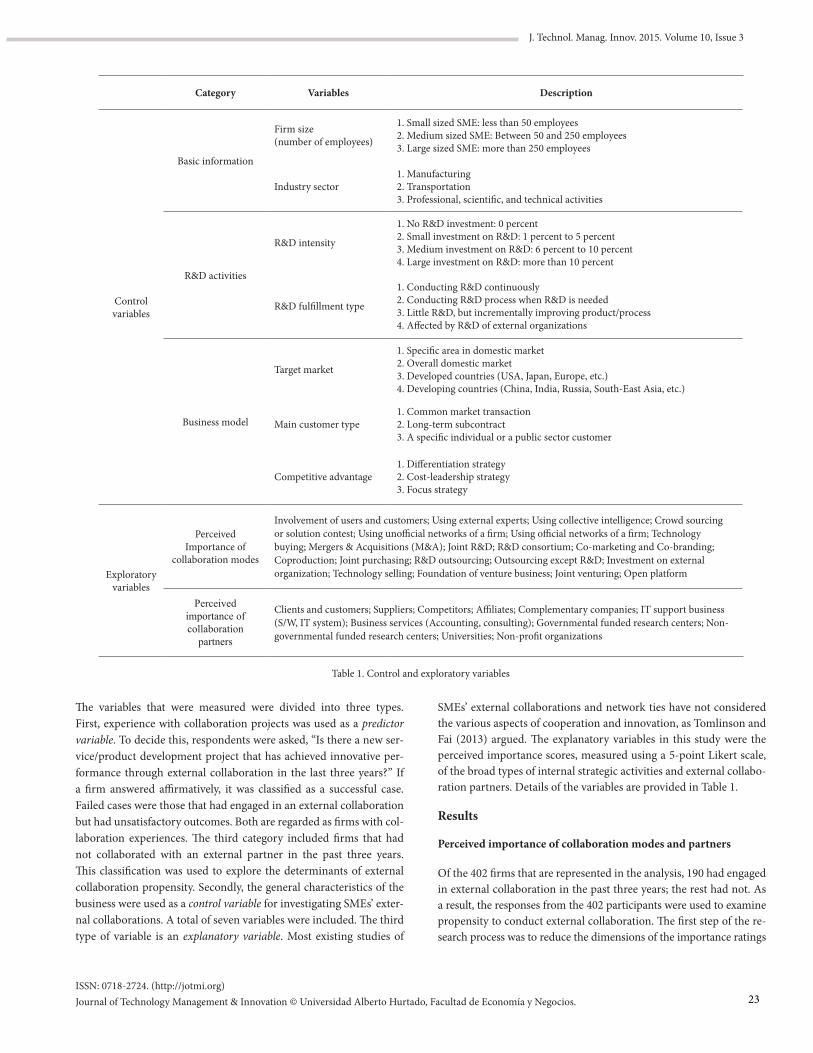
ISSN: 0718-2724. (http://jotmi.org)Journal of Technology Management & Innovation © Universidad Alberto Hurtado, Facultad de Economía y Negocios.
J. Technol. Manag. Innov. 2015. Volume 10, Issue 3
Category Variables Description
Control variables
Basic information
Firm size (number of employees)
1. Small sized SME: less than 50 employees2. Medium sized SME: Between 50 and 250 employees3. Large sized SME: more than 250 employees
Industry sector1. Manufacturing2. Transportation3. Professional, scientific, and technical activities
R&D activities
R&D intensity
1. No R&D investment: 0 percent2. Small investment on R&D: 1 percent to 5 percent3. Medium investment on R&D: 6 percent to 10 percent4. Large investment on R&D: more than 10 percent
R&D fulfillment type
1. Conducting R&D continuously2. Conducting R&D process when R&D is needed3. Little R&D, but incrementally improving product/process4. Affected by R&D of external organizations
Business model
Target market
1. Specific area in domestic market2. Overall domestic market3. Developed countries (USA, Japan, Europe, etc.)4. Developing countries (China, India, Russia, South-East Asia, etc.)
Main customer type1. Common market transaction2. Long-term subcontract3. A specific individual or a public sector customer
Competitive advantage1. Differentiation strategy2. Cost-leadership strategy3. Focus strategy
Exploratory variables
Perceived Importance of
collaboration modes
Involvement of users and customers; Using external experts; Using collective intelligence; Crowd sourcing or solution contest; Using unofficial networks of a firm; Using official networks of a firm; Technology buying; Mergers & Acquisitions (M&A); Joint R&D; R&D consortium; Co-marketing and Co-branding; Coproduction; Joint purchasing; R&D outsourcing; Outsourcing except R&D; Investment on external organization; Technology selling; Foundation of venture business; Joint venturing; Open platform
Perceived importance of collaboration
partners
Clients and customers; Suppliers; Competitors; Affiliates; Complementary companies; IT support business (S/W, IT system); Business services (Accounting, consulting); Governmental funded research centers; Non-governmental funded research centers; Universities; Non-profit organizations
Table 1. Control and exploratory variables
The variables that were measured were divided into three types. First, experience with collaboration projects was used as a predictor variable. To decide this, respondents were asked, “Is there a new ser-vice/product development project that has achieved innovative per-formance through external collaboration in the last three years?” If a firm answered affirmatively, it was classified as a successful case. Failed cases were those that had engaged in an external collaboration but had unsatisfactory outcomes. Both are regarded as firms with col-laboration experiences. The third category included firms that had not collaborated with an external partner in the past three years. This classification was used to explore the determinants of external collaboration propensity. Secondly, the general characteristics of the business were used as a control variable for investigating SMEs’ exter-nal collaborations. A total of seven variables were included. The third type of variable is an explanatory variable. Most existing studies of
SMEs’ external collaborations and network ties have not considered the various aspects of cooperation and innovation, as Tomlinson and Fai (2013) argued. The explanatory variables in this study were the perceived importance scores, measured using a 5-point Likert scale, of the broad types of internal strategic activities and external collabo-ration partners. Details of the variables are provided in Table 1.
Results
Perceived importance of collaboration modes and partners
Of the 402 firms that are represented in the analysis, 190 had engaged in external collaboration in the past three years; the rest had not. As a result, the responses from the 402 participants were used to examine propensity to conduct external collaboration. The first step of the re-search process was to reduce the dimensions of the importance ratings
23
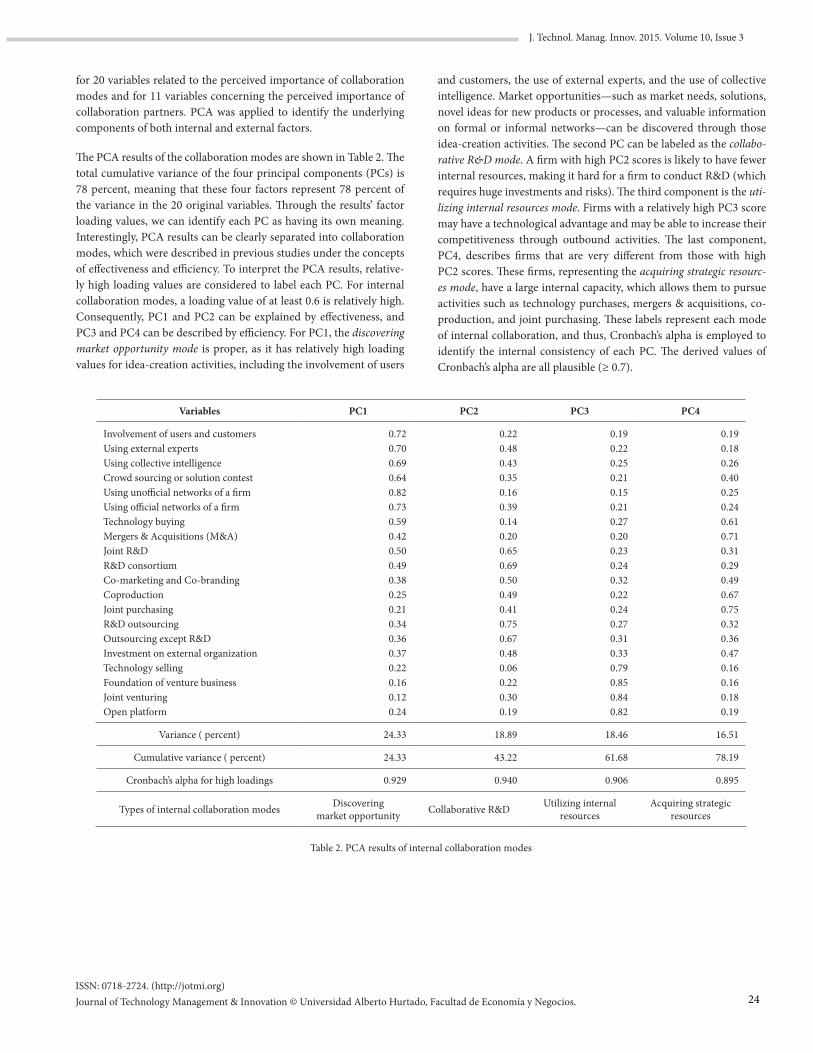
ISSN: 0718-2724. (http://jotmi.org)Journal of Technology Management & Innovation © Universidad Alberto Hurtado, Facultad de Economía y Negocios.
J. Technol. Manag. Innov. 2015. Volume 10, Issue 3
for 20 variables related to the perceived importance of collaboration modes and for 11 variables concerning the perceived importance of collaboration partners. PCA was applied to identify the underlying components of both internal and external factors.
The PCA results of the collaboration modes are shown in Table 2. The total cumulative variance of the four principal components (PCs) is 78 percent, meaning that these four factors represent 78 percent of the variance in the 20 original variables. Through the results’ factor loading values, we can identify each PC as having its own meaning. Interestingly, PCA results can be clearly separated into collaboration modes, which were described in previous studies under the concepts of effectiveness and efficiency. To interpret the PCA results, relative-ly high loading values are considered to label each PC. For internal collaboration modes, a loading value of at least 0.6 is relatively high. Consequently, PC1 and PC2 can be explained by effectiveness, and PC3 and PC4 can be described by efficiency. For PC1, the discovering market opportunity mode is proper, as it has relatively high loading values for idea-creation activities, including the involvement of users
and customers, the use of external experts, and the use of collective intelligence. Market opportunities—such as market needs, solutions, novel ideas for new products or processes, and valuable information on formal or informal networks—can be discovered through those idea-creation activities. The second PC can be labeled as the collabo-rative R&D mode. A firm with high PC2 scores is likely to have fewer internal resources, making it hard for a firm to conduct R&D (which requires huge investments and risks). The third component is the uti-lizing internal resources mode. Firms with a relatively high PC3 score may have a technological advantage and may be able to increase their competitiveness through outbound activities. The last component, PC4, describes firms that are very different from those with high PC2 scores. These firms, representing the acquiring strategic resourc-es mode, have a large internal capacity, which allows them to pursue activities such as technology purchases, mergers & acquisitions, co-production, and joint purchasing. These labels represent each mode of internal collaboration, and thus, Cronbach’s alpha is employed to identify the internal consistency of each PC. The derived values of Cronbach’s alpha are all plausible (≥ 0.7).
Variables PC1 PC2 PC3 PC4
Involvement of users and customersUsing external expertsUsing collective intelligenceCrowd sourcing or solution contestUsing unofficial networks of a firmUsing official networks of a firmTechnology buyingMergers & Acquisitions (M&A)Joint R&DR&D consortiumCo-marketing and Co-brandingCoproductionJoint purchasingR&D outsourcingOutsourcing except R&DInvestment on external organizationTechnology sellingFoundation of venture businessJoint venturingOpen platform
0.720.700.690.640.820.730.590.420.500.490.380.250.210.340.360.370.220.160.120.24
0.220.480.430.350.160.390.140.200.650.690.500.490.410.750.670.480.060.220.300.19
0.190.220.250.210.150.210.270.200.230.240.320.220.240.270.310.330.790.850.840.82
0.190.180.260.400.250.240.610.710.310.290.490.670.750.320.360.470.160.160.180.19
Variance ( percent) 24.33 18.89 18.46 16.51
Cumulative variance ( percent) 24.33 43.22 61.68 78.19
Cronbach’s alpha for high loadings 0.929 0.940 0.906 0.895
Types of internal collaboration modes Discoveringmarket opportunity Collaborative R&D Utilizing internal
resourcesAcquiring strategic
resources
Table 2. PCA results of internal collaboration modes
24
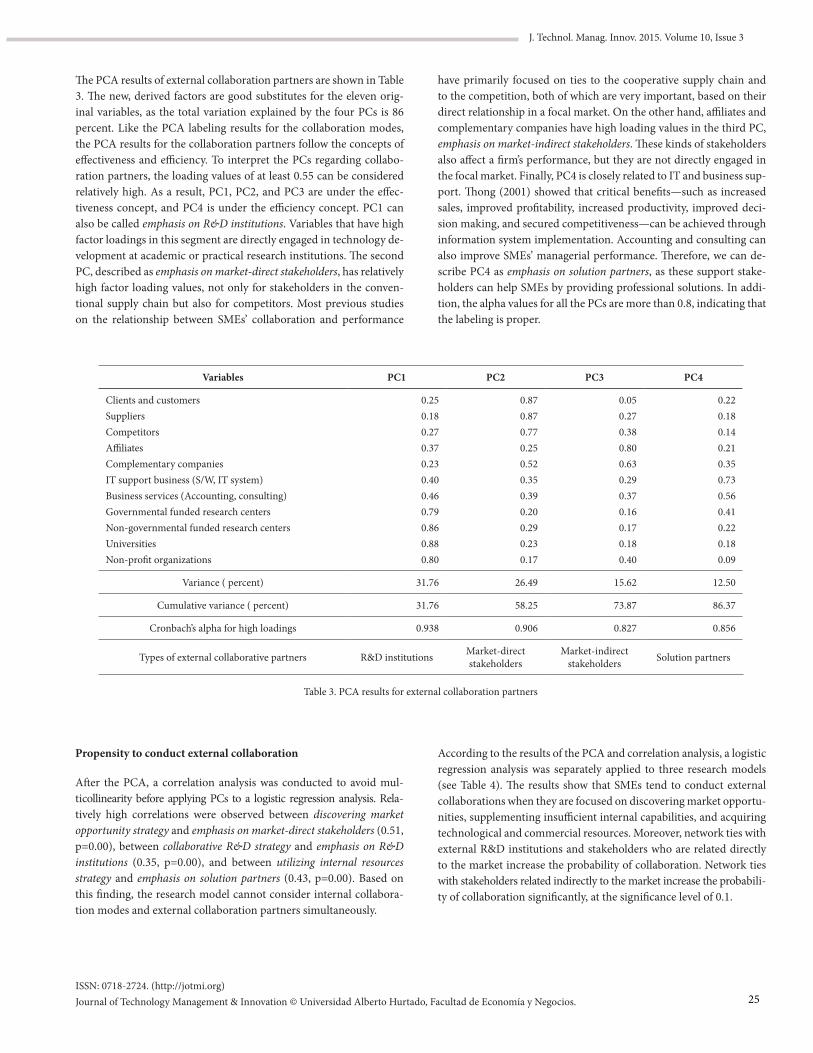
ISSN: 0718-2724. (http://jotmi.org)Journal of Technology Management & Innovation © Universidad Alberto Hurtado, Facultad de Economía y Negocios.
J. Technol. Manag. Innov. 2015. Volume 10, Issue 3
The PCA results of external collaboration partners are shown in Table 3. The new, derived factors are good substitutes for the eleven orig-inal variables, as the total variation explained by the four PCs is 86 percent. Like the PCA labeling results for the collaboration modes, the PCA results for the collaboration partners follow the concepts of effectiveness and efficiency. To interpret the PCs regarding collabo-ration partners, the loading values of at least 0.55 can be considered relatively high. As a result, PC1, PC2, and PC3 are under the effec-tiveness concept, and PC4 is under the efficiency concept. PC1 can also be called emphasis on R&D institutions. Variables that have high factor loadings in this segment are directly engaged in technology de-velopment at academic or practical research institutions. The second PC, described as emphasis on market-direct stakeholders, has relatively high factor loading values, not only for stakeholders in the conven-tional supply chain but also for competitors. Most previous studies on the relationship between SMEs’ collaboration and performance
have primarily focused on ties to the cooperative supply chain and to the competition, both of which are very important, based on their direct relationship in a focal market. On the other hand, affiliates and complementary companies have high loading values in the third PC, emphasis on market-indirect stakeholders. These kinds of stakeholders also affect a firm’s performance, but they are not directly engaged in the focal market. Finally, PC4 is closely related to IT and business sup-port. Thong (2001) showed that critical benefits—such as increased sales, improved profitability, increased productivity, improved deci-sion making, and secured competitiveness—can be achieved through information system implementation. Accounting and consulting can also improve SMEs’ managerial performance. Therefore, we can de-scribe PC4 as emphasis on solution partners, as these support stake-holders can help SMEs by providing professional solutions. In addi-tion, the alpha values for all the PCs are more than 0.8, indicating that the labeling is proper.
Variables PC1 PC2 PC3 PC4
Clients and customersSuppliersCompetitorsAffiliatesComplementary companiesIT support business (S/W, IT system)Business services (Accounting, consulting)Governmental funded research centersNon-governmental funded research centersUniversitiesNon-profit organizations
0.250.180.270.370.230.400.460.790.860.880.80
0.870.870.770.250.520.350.390.200.290.230.17
0.050.270.380.800.630.290.370.160.170.180.40
0.220.180.140.210.350.730.560.410.220.180.09
Variance ( percent) 31.76 26.49 15.62 12.50
Cumulative variance ( percent) 31.76 58.25 73.87 86.37
Cronbach’s alpha for high loadings 0.938 0.906 0.827 0.856
Types of external collaborative partners R&D institutions Market-direct stakeholders
Market-indirect stakeholders Solution partners
Table 3. PCA results for external collaboration partners
Propensity to conduct external collaboration
After the PCA, a correlation analysis was conducted to avoid mul-ticollinearity before applying PCs to a logistic regression analysis. Rela-tively high correlations were observed between discovering market opportunity strategy and emphasis on market-direct stakeholders (0.51, p=0.00), between collaborative R&D strategy and emphasis on R&D institutions (0.35, p=0.00), and between utilizing internal resources strategy and emphasis on solution partners (0.43, p=0.00). Based on this finding, the research model cannot consider internal collabora-tion modes and external collaboration partners simultaneously.
According to the results of the PCA and correlation analysis, a logistic regression analysis was separately applied to three research models (see Table 4). The results show that SMEs tend to conduct external collaborations when they are focused on discovering market opportu-nities, supplementing insufficient internal capabilities, and acquiring technological and commercial resources. Moreover, network ties with external R&D institutions and stakeholders who are related directly to the market increase the probability of collaboration. Network ties with stakeholders related indirectly to the market increase the probabili-ty of collaboration significantly, at the significance level of 0.1.
25
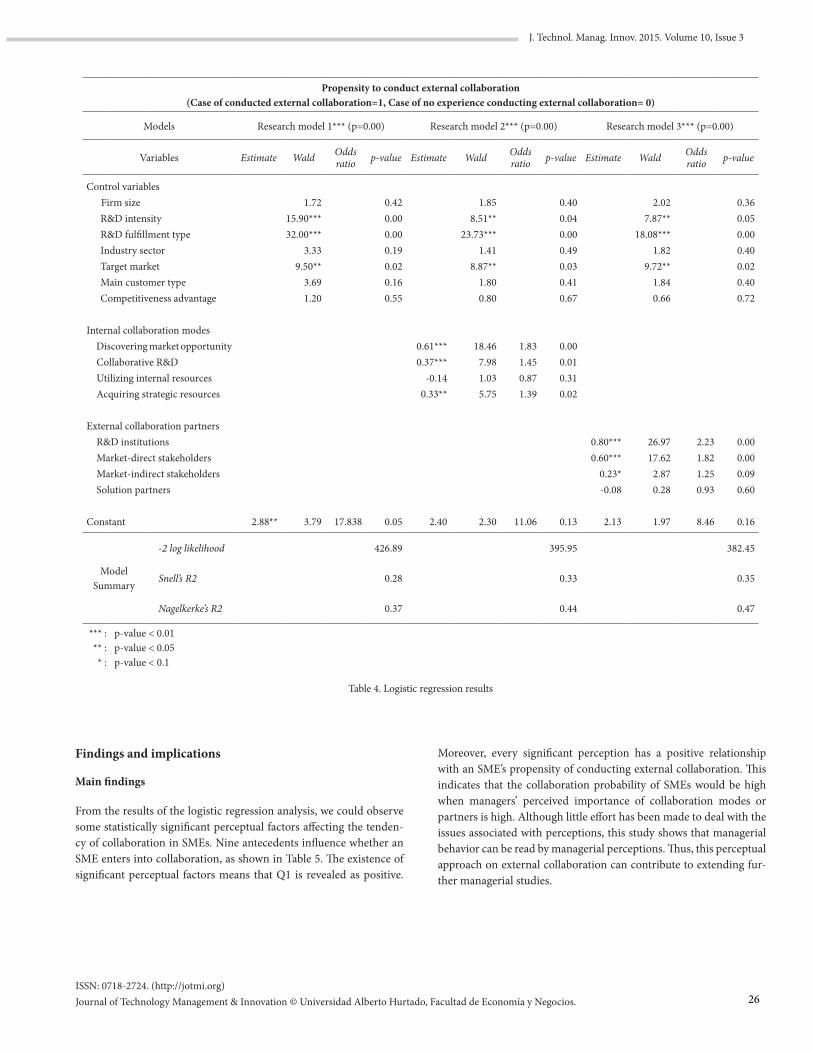
ISSN: 0718-2724. (http://jotmi.org)Journal of Technology Management & Innovation © Universidad Alberto Hurtado, Facultad de Economía y Negocios.
J. Technol. Manag. Innov. 2015. Volume 10, Issue 3
Propensity to conduct external collaboration (Case of conducted external collaboration=1, Case of no experience conducting external collaboration= 0)
Models Research model 1*** (p=0.00) Research model 2*** (p=0.00) Research model 3*** (p=0.00)
Variables Estimate Wald Odds ratio p-value Estimate Wald Odds
ratio p-value Estimate Wald Odds ratio p-value
Control variables Firm size
R&D intensityR&D fulfillment typeIndustry sectorTarget marketMain customer typeCompetitiveness advantage
Internal collaboration modesDiscovering market opportunityCollaborative R&DUtilizing internal resourcesAcquiring strategic resources
External collaboration partnersR&D institutionsMarket-direct stakeholdersMarket-indirect stakeholdersSolution partners
Constant 2.88**
1.7215.90***32.00***
3.339.50**
3.691.20
3.79 17.838
0.420.000.000.190.020.160.55
0.05
0.61***0.37***
-0.140.33**
2.40
1.858.51**
23.73***1.41
8.87**1.800.80
18.467.981.035.75
2.30
1.831.450.871.39
11.06
0.400.040.000.490.030.410.67
0.000.010.310.02
0.13
0.80***0.60***
0.23*-0.08
2.13
2.027.87**
18.08***1.82
9.72**1.840.66
26.9717.62
2.870.28
1.97
2.231.821.250.93
8.46
0.360.050.000.400.020.400.72
0.000.000.090.60
0.16
ModelSummary
-2 log likelihood 426.89 395.95 382.45
Snell’s R2 0.28 0.33 0.35
Nagelkerke’s R2 0.37 0.44 0.47
*** :** :* :
p-value < 0.01p-value < 0.05p-value < 0.1
Table 4. Logistic regression results
Findings and implications
Main findings
From the results of the logistic regression analysis, we could observe some statistically significant perceptual factors affecting the tenden-cy of collaboration in SMEs. Nine antecedents influence whether an SME enters into collaboration, as shown in Table 5. The existence of significant perceptual factors means that Q1 is revealed as positive.
Moreover, every significant perception has a positive relationship with an SME’s propensity of conducting external collaboration. This indicates that the collaboration probability of SMEs would be high when managers’ perceived importance of collaboration modes or partners is high. Although little effort has been made to deal with the issues associated with perceptions, this study shows that managerial behavior can be read by managerial perceptions. Thus, this perceptual approach on external collaboration can contribute to extending fur-ther managerial studies.
26
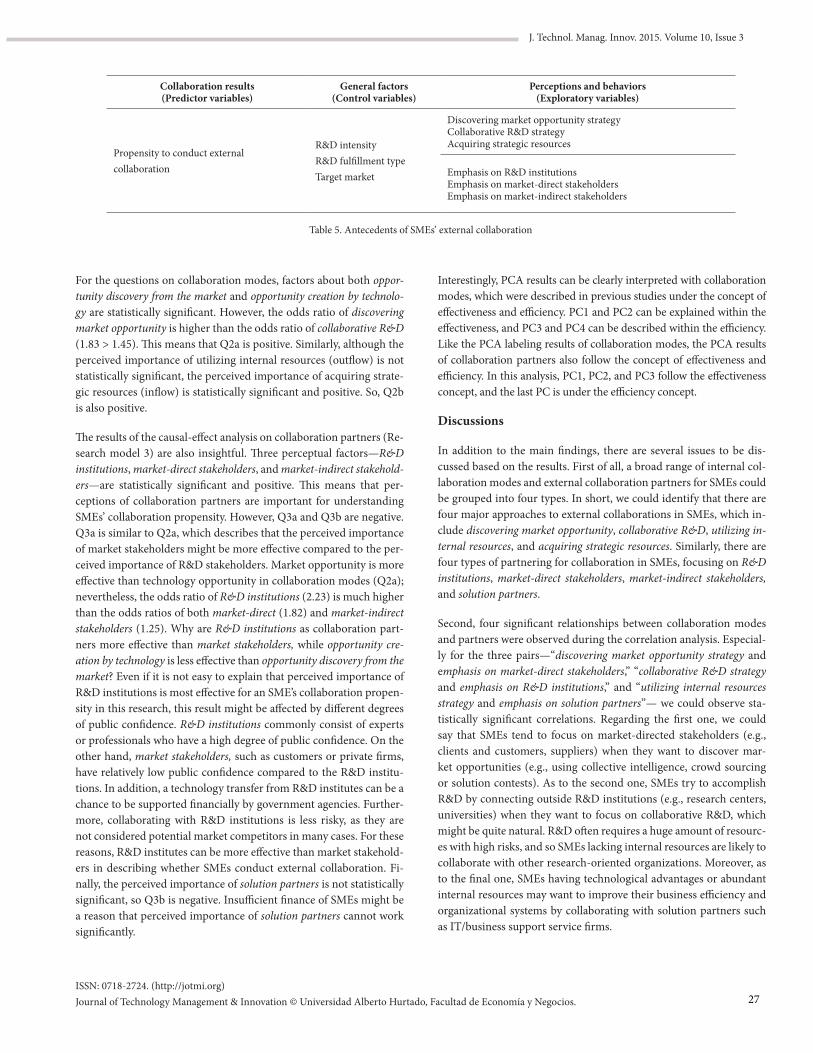
ISSN: 0718-2724. (http://jotmi.org)Journal of Technology Management & Innovation © Universidad Alberto Hurtado, Facultad de Economía y Negocios.
J. Technol. Manag. Innov. 2015. Volume 10, Issue 3
For the questions on collaboration modes, factors about both oppor-tunity discovery from the market and opportunity creation by technolo-gy are statistically significant. However, the odds ratio of discovering market opportunity is higher than the odds ratio of collaborative R&D (1.83 > 1.45). This means that Q2a is positive. Similarly, although the perceived importance of utilizing internal resources (outflow) is not statistically significant, the perceived importance of acquiring strate-gic resources (inflow) is statistically significant and positive. So, Q2b is also positive.
The results of the causal-effect analysis on collaboration partners (Re-search model 3) are also insightful. Three perceptual factors—R&D institutions, market-direct stakeholders, and market-indirect stakehold-ers—are statistically significant and positive. This means that per-ceptions of collaboration partners are important for understanding SMEs’ collaboration propensity. However, Q3a and Q3b are negative. Q3a is similar to Q2a, which describes that the perceived importance of market stakeholders might be more effective compared to the per-ceived importance of R&D stakeholders. Market opportunity is more effective than technology opportunity in collaboration modes (Q2a); nevertheless, the odds ratio of R&D institutions (2.23) is much higher than the odds ratios of both market-direct (1.82) and market-indirect stakeholders (1.25). Why are R&D institutions as collaboration part-ners more effective than market stakeholders, while opportunity cre-ation by technology is less effective than opportunity discovery from the market? Even if it is not easy to explain that perceived importance of R&D institutions is most effective for an SME’s collaboration propen-sity in this research, this result might be affected by different degrees of public confidence. R&D institutions commonly consist of experts or professionals who have a high degree of public confidence. On the other hand, market stakeholders, such as customers or private firms, have relatively low public confidence compared to the R&D institu-tions. In addition, a technology transfer from R&D institutes can be a chance to be supported financially by government agencies. Further-more, collaborating with R&D institutions is less risky, as they are not considered potential market competitors in many cases. For these reasons, R&D institutes can be more effective than market stakehold-ers in describing whether SMEs conduct external collaboration. Fi-nally, the perceived importance of solution partners is not statistically significant, so Q3b is negative. Insufficient finance of SMEs might be a reason that perceived importance of solution partners cannot work significantly.
Interestingly, PCA results can be clearly interpreted with collaboration modes, which were described in previous studies under the concept of effectiveness and efficiency. PC1 and PC2 can be explained within the effectiveness, and PC3 and PC4 can be described within the efficiency. Like the PCA labeling results of collaboration modes, the PCA results of collaboration partners also follow the concept of effectiveness and efficiency. In this analysis, PC1, PC2, and PC3 follow the effectiveness concept, and the last PC is under the efficiency concept.
Discussions
In addition to the main findings, there are several issues to be dis-cussed based on the results. First of all, a broad range of internal col-laboration modes and external collaboration partners for SMEs could be grouped into four types. In short, we could identify that there are four major approaches to external collaborations in SMEs, which in-clude discovering market opportunity, collaborative R&D, utilizing in-ternal resources, and acquiring strategic resources. Similarly, there are four types of partnering for collaboration in SMEs, focusing on R&D institutions, market-direct stakeholders, market-indirect stakeholders, and solution partners.
Second, four significant relationships between collaboration modes and partners were observed during the correlation analysis. Especial-ly for the three pairs—“discovering market opportunity strategy and emphasis on market-direct stakeholders,” “collaborative R&D strategy and emphasis on R&D institutions,” and “utilizing internal resources strategy and emphasis on solution partners”— we could observe sta-tistically significant correlations. Regarding the first one, we could say that SMEs tend to focus on market-directed stakeholders (e.g., clients and customers, suppliers) when they want to discover mar-ket opportunities (e.g., using collective intelligence, crowd sourcing or solution contests). As to the second one, SMEs try to accomplish R&D by connecting outside R&D institutions (e.g., research centers, universities) when they want to focus on collaborative R&D, which might be quite natural. R&D often requires a huge amount of resourc-es with high risks, and so SMEs lacking internal resources are likely to collaborate with other research-oriented organizations. Moreover, as to the final one, SMEs having technological advantages or abundant internal resources may want to improve their business efficiency and organizational systems by collaborating with solution partners such as IT/business support service firms.
Collaboration results(Predictor variables)
General factors(Control variables)
Perceptions and behaviors(Exploratory variables)
Propensity to conduct external collaboration
R&D intensityR&D fulfillment typeTarget market
Discovering market opportunity strategyCollaborative R&D strategyAcquiring strategic resources
Emphasis on R&D institutionsEmphasis on market-direct stakeholdersEmphasis on market-indirect stakeholders
Table 5. Antecedents of SMEs’ external collaboration
27
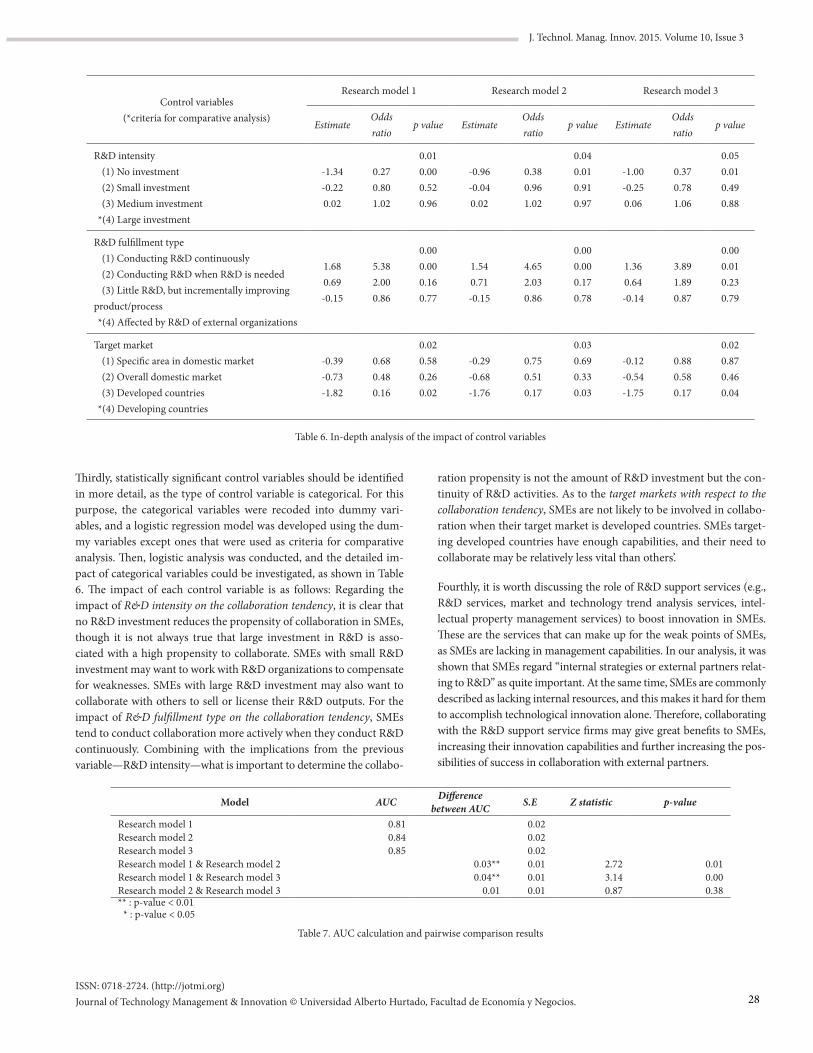
ISSN: 0718-2724. (http://jotmi.org)Journal of Technology Management & Innovation © Universidad Alberto Hurtado, Facultad de Economía y Negocios.
J. Technol. Manag. Innov. 2015. Volume 10, Issue 3
Thirdly, statistically significant control variables should be identified in more detail, as the type of control variable is categorical. For this purpose, the categorical variables were recoded into dummy vari-ables, and a logistic regression model was developed using the dum-my variables except ones that were used as criteria for comparative analysis. Then, logistic analysis was conducted, and the detailed im-pact of categorical variables could be investigated, as shown in Table 6. The impact of each control variable is as follows: Regarding the impact of R&D intensity on the collaboration tendency, it is clear that no R&D investment reduces the propensity of collaboration in SMEs, though it is not always true that large investment in R&D is asso-ciated with a high propensity to collaborate. SMEs with small R&D investment may want to work with R&D organizations to compensate for weaknesses. SMEs with large R&D investment may also want to collaborate with others to sell or license their R&D outputs. For the impact of R&D fulfillment type on the collaboration tendency, SMEs tend to conduct collaboration more actively when they conduct R&D continuously. Combining with the implications from the previous variable—R&D intensity—what is important to determine the collabo-
Control variables(*criteria for comparative analysis)
Research model 1 Research model 2 Research model 3
EstimateOdds ratio
p value EstimateOdds ratio
p value EstimateOdds ratio
p value
R&D intensity(1) No investment(2) Small investment (3) Medium investment
*(4) Large investment
-1.34-0.220.02
0.270.801.02
0.010.000.520.96
-0.96-0.040.02
0.380.961.02
0.040.010.910.97
-1.00-0.250.06
0.370.781.06
0.050.010.490.88
R&D fulfillment type(1) Conducting R&D continuously(2) Conducting R&D when R&D is needed(3) Little R&D, but incrementally improving
product/process*(4) Affected by R&D of external organizations
1.680.69-0.15
5.382.000.86
0.000.000.160.77
1.540.71-0.15
4.652.030.86
0.000.000.170.78
1.360.64-0.14
3.891.890.87
0.000.010.230.79
Target market(1) Specific area in domestic market(2) Overall domestic market(3) Developed countries
*(4) Developing countries
-0.39-0.73-1.82
0.680.480.16
0.020.580.260.02
-0.29-0.68-1.76
0.750.510.17
0.030.690.330.03
-0.12-0.54-1.75
0.880.580.17
0.020.870.460.04
Table 6. In-depth analysis of the impact of control variables
ration propensity is not the amount of R&D investment but the con-tinuity of R&D activities. As to the target markets with respect to the collaboration tendency, SMEs are not likely to be involved in collabo-ration when their target market is developed countries. SMEs target-ing developed countries have enough capabilities, and their need to collaborate may be relatively less vital than others’.
Fourthly, it is worth discussing the role of R&D support services (e.g., R&D services, market and technology trend analysis services, intel-lectual property management services) to boost innovation in SMEs. These are the services that can make up for the weak points of SMEs, as SMEs are lacking in management capabilities. In our analysis, it was shown that SMEs regard “internal strategies or external partners relat-ing to R&D” as quite important. At the same time, SMEs are commonly described as lacking internal resources, and this makes it hard for them to accomplish technological innovation alone. Therefore, collaborating with the R&D support service firms may give great benefits to SMEs, increasing their innovation capabilities and further increasing the pos-sibilities of success in collaboration with external partners.
Model AUC Difference between AUC S.E Z statistic p-value
Research model 1Research model 2Research model 3Research model 1 & Research model 2Research model 1 & Research model 3Research model 2 & Research model 3
0.810.840.85
0.03**0.04**
0.01
0.020.020.020.010.010.01
2.723.140.87
0.010.000.38
** : p-value < 0.01* : p-value < 0.05
Table 7. AUC calculation and pairwise comparison results
28
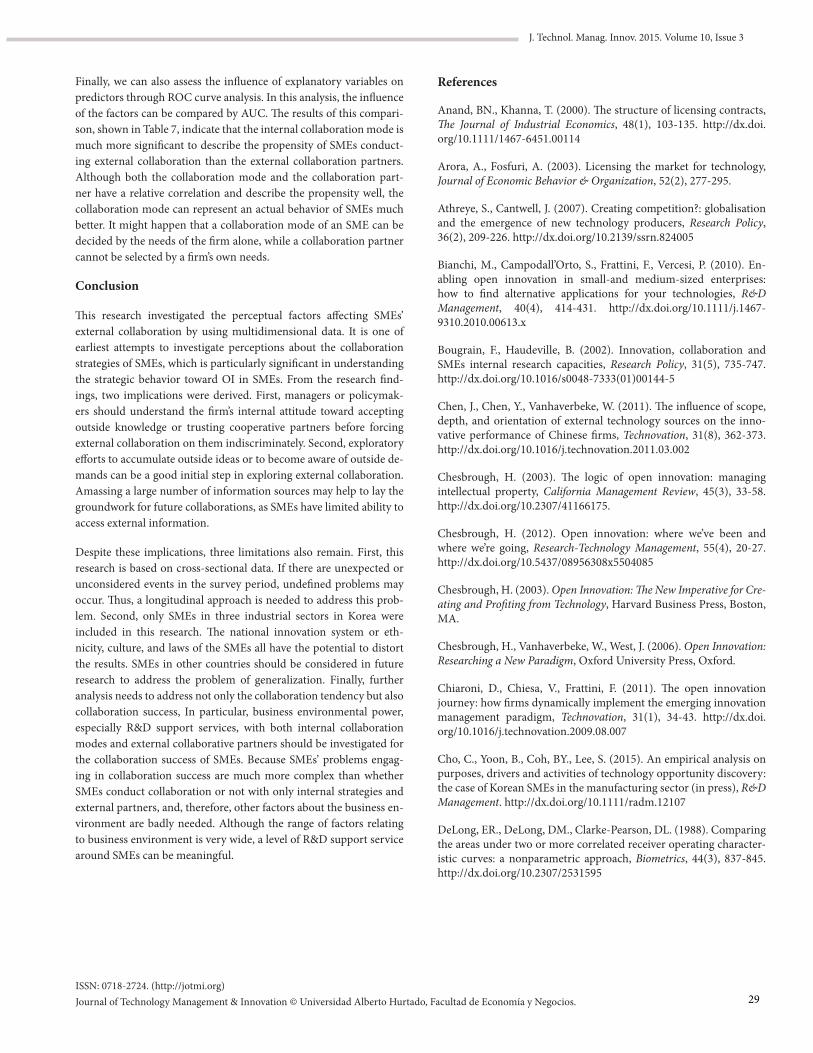
ISSN: 0718-2724. (http://jotmi.org)Journal of Technology Management & Innovation © Universidad Alberto Hurtado, Facultad de Economía y Negocios.
J. Technol. Manag. Innov. 2015. Volume 10, Issue 3
Finally, we can also assess the influence of explanatory variables on predictors through ROC curve analysis. In this analysis, the influence of the factors can be compared by AUC. The results of this compari-son, shown in Table 7, indicate that the internal collaboration mode is much more significant to describe the propensity of SMEs conduct-ing external collaboration than the external collaboration partners. Although both the collaboration mode and the collaboration part-ner have a relative correlation and describe the propensity well, the collaboration mode can represent an actual behavior of SMEs much better. It might happen that a collaboration mode of an SME can be decided by the needs of the firm alone, while a collaboration partner cannot be selected by a firm’s own needs.
Conclusion
This research investigated the perceptual factors affecting SMEs’ external collaboration by using multidimensional data. It is one of earliest attempts to investigate perceptions about the collaboration strategies of SMEs, which is particularly significant in understanding the strategic behavior toward OI in SMEs. From the research find-ings, two implications were derived. First, managers or policymak-ers should understand the firm’s internal attitude toward accepting outside knowledge or trusting cooperative partners before forcing external collaboration on them indiscriminately. Second, exploratory efforts to accumulate outside ideas or to become aware of outside de-mands can be a good initial step in exploring external collaboration. Amassing a large number of information sources may help to lay the groundwork for future collaborations, as SMEs have limited ability to access external information.
Despite these implications, three limitations also remain. First, this research is based on cross-sectional data. If there are unexpected or unconsidered events in the survey period, undefined problems may occur. Thus, a longitudinal approach is needed to address this prob-lem. Second, only SMEs in three industrial sectors in Korea were included in this research. The national innovation system or eth-nicity, culture, and laws of the SMEs all have the potential to distort the results. SMEs in other countries should be considered in future research to address the problem of generalization. Finally, further analysis needs to address not only the collaboration tendency but also collaboration success, In particular, business environmental power, especially R&D support services, with both internal collaboration modes and external collaborative partners should be investigated for the collaboration success of SMEs. Because SMEs’ problems engag-ing in collaboration success are much more complex than whether SMEs conduct collaboration or not with only internal strategies and external partners, and, therefore, other factors about the business en-vironment are badly needed. Although the range of factors relating to business environment is very wide, a level of R&D support service around SMEs can be meaningful.
References
Anand, BN., Khanna, T. (2000). The structure of licensing contracts, The Journal of Industrial Economics, 48(1), 103-135. http://dx.doi.org/10.1111/1467-6451.00114
Arora, A., Fosfuri, A. (2003). Licensing the market for technology, Journal of Economic Behavior & Organization, 52(2), 277-295.
Athreye, S., Cantwell, J. (2007). Creating competition?: globalisation and the emergence of new technology producers, Research Policy, 36(2), 209-226. http://dx.doi.org/10.2139/ssrn.824005
Bianchi, M., Campodall’Orto, S., Frattini, F., Vercesi, P. (2010). En-abling open innovation in small‐and medium‐sized enterprises: how to find alternative applications for your technologies, R&D Management, 40(4), 414-431. http://dx.doi.org/10.1111/j.1467-9310.2010.00613.x
Bougrain, F., Haudeville, B. (2002). Innovation, collaboration and SMEs internal research capacities, Research Policy, 31(5), 735-747. http://dx.doi.org/10.1016/s0048-7333(01)00144-5
Chen, J., Chen, Y., Vanhaverbeke, W. (2011). The influence of scope, depth, and orientation of external technology sources on the inno-vative performance of Chinese firms, Technovation, 31(8), 362-373. http://dx.doi.org/10.1016/j.technovation.2011.03.002
Chesbrough, H. (2003). The logic of open innovation: managing intellectual property, California Management Review, 45(3), 33-58. http://dx.doi.org/10.2307/41166175.
Chesbrough, H. (2012). Open innovation: where we’ve been and where we’re going, Research-Technology Management, 55(4), 20-27. http://dx.doi.org/10.5437/08956308x5504085
Chesbrough, H. (2003). Open Innovation: The New Imperative for Cre-ating and Profiting from Technology, Harvard Business Press, Boston, MA.
Chesbrough, H., Vanhaverbeke, W., West, J. (2006). Open Innovation: Researching a New Paradigm, Oxford University Press, Oxford.
Chiaroni, D., Chiesa, V., Frattini, F. (2011). The open innovation journey: how firms dynamically implement the emerging innovation management paradigm, Technovation, 31(1), 34-43. http://dx.doi.org/10.1016/j.technovation.2009.08.007
Cho, C., Yoon, B., Coh, BY., Lee, S. (2015). An empirical analysis on purposes, drivers and activities of technology opportunity discovery: the case of Korean SMEs in the manufacturing sector (in press), R&D Management. http://dx.doi.org/10.1111/radm.12107
DeLong, ER., DeLong, DM., Clarke-Pearson, DL. (1988). Comparing the areas under two or more correlated receiver operating character-istic curves: a nonparametric approach, Biometrics, 44(3), 837-845. http://dx.doi.org/10.2307/2531595
29
ISSN: 0718-2724. (http://jotmi.org)Journal of Technology Management & Innovation © Universidad Alberto Hurtado, Facultad de Economía y Negocios.
J. Technol. Manag. Innov. 2015. Volume 10, Issue 3
Doloreux, D., Mattson, H. (2008). To what extent do sectors “So-cialize” innovation differently? mapping cooperative linkages in knowledge-intensive industries in the Ottawa region, In-dustry and Innovation, 15(4), 351-370. http://dx.doi.org/10.1080/13662710802239463
Enkel, E., Gassmann, O., Chesbrough, H. (2009). Open R&D and open innovation: exploring the phenomenon, R&D Management, 39(4), 311-316. http://dx.doi.org/10.1111/j.1467-9310.2009.00570.x
Eriksson, M., Niitamo, VP., Kulkki, S. (2005). State-of-the-art in uti-lizing Living Labs approach to user-centric ICT innovation-a Euro-pean approach, Lulea: Center for Distance-spanning Technology. Lulea University of Technology Sweden: Lulea
Fey, CF., Birkinshaw, J. (2005). External sources of knowledge, gover-nance mode, and R&D performance, Journal of Management, 31(4), 597-621. http://dx.doi.org/10.1177/0149206304272346
Fitjar, RD., Rodríguez-Pose, A. (2013). Firm collaboration and modes of innovation in Norway, Research Policy, 42(1), 128-138. http://dx.doi.org/10.1016/j.respol.2012.05.009
Gassmann, O. (2006). Opening up the innovation process: to-wards an agenda. R&D Management, 36(3), 223-228. http://dx.doi.org/10.1111/j.1467-9310.2006.00437.x
Hageddom, J. (2002). Inter-firm R&D partnerships: an overview of major trends and patterns since 1960, Research Policy, 31(4), 477-492. http://dx.doi.org/10.1016/s0048-7333(01)00120-2
Hamdani, J., Wirawan, C. (2012). Open innovation implementation to sustain Indonesian SMEs, Procedia Economics and Finance, 4, 223-233. http://dx.doi.org/10.1016/s2212-5671(12)00337-1
Harrison, RT., Hart, M. (1987). Innovation and market development: the experience of small firms in a peripheral economy, Omega, 15(6), 445-454. http://dx.doi.org/10.1016/0305-0483(87)90002-8
Hollanders, H., Esser, FC. (2007). Measuring innovation efficiency, INNO-Metrics Thematic Paper.
Hung, KP., Chou, C. (2013). The impact of open innovation on firm performance: the moderating effects of internal R&D and environ-mental turbulence, Technovation, 33(10), 368-380. http://dx.doi.org/10.1016/j.technovation.2013.06.006
Husted, BW., Allen, DB. (2007). Corporate social strategy in multina-tional enterprises: Antecedents and value creation, Journal of Business Ethics, 74(4), 345-361. http://dx.doi.org/10.1007/s10551-007-9511-4
Kafouros, MI., Forsans, N. (2012). The role of open innovation in emerging economies: do companies profit from the scientific knowl-edge of others?, Journal of World Business, 47(3), 362-370. http://dx.doi.org/10.1016/j.jwb.2011.05.004
Kamalian, A., Rashki, M., Arbabi, ML. (2011). Barriers to Innovation among Iranian SMEs, Asian Journal of Business Management, 3(2), 79-90.
Kang, KN., Park, H. (2012). Influence of government R&D support and inter-firm collaborations on innovation in Korean biotechnology SMEs, Technovation, 32(1), 68-78. http://dx.doi.org/10.1016/j.tech-novation.2011.08.004
Kani, M., Motohashi, K. (2012) Understanding the technology mar-ket for patents: new insights from a licensing survey of Japanese firms, R esearch P olicy, 21(1), 226-235. http://dx.doi.org/10.1016/j. respol.2011.08.002
Keupp, MM., Gassmann, O. (2009). Determinants and archetype users of open innovation, R&D Management, 39(4), 331-341. http://dx.doi.org/10.1111/j.1467-9310.2009.00563.x
Kurokawa, S. (1997). Make-or-buy decisions in R&D: small tech-nology based firms in the United States and Japan, I EEE Transac-tions on Engineering Management, 44(2), 124-134. http://dx.doi. org/10.1109/17.584921
Laursen, K., Salter, A. (2006). Open for innovation: the role of open-ness in explaining innovation performance among UK manufactur-ing firms, S trategic Management Journal, 2 7(2), 1 31-150. h ttp://dx. doi.org/10.1002/smj.507
Lee, S., Park, G., Yoon, B., Park, J. (2010). Open innovation in SMEs—an intermediated network model, Research Policy, 39(2), 290-300. http://dx.doi.org/10.1016/j.respol.2009.12.009
Lee, Y., Shin, J., Park, Y. (2012). The changing pattern of SME’s inno-vativeness through business model globalization, Technological Fore-casting and Social Change, 79(5), 832-842. http://dx.doi.org/10.1016/j. techfore.2011.10.008
Levy, M., Powell, P. (1998). SME flexibility and the role of information systems, Small Business Economics, 11(2), 183-196.
Lipparini, A., Sobrero, M. (1994). The glue and the pieces: entre-preneurship and innovation in small-firm n etworks, J ournal o f Business Venturing, 9(2), 125-140. http://dx.doi.org/10.1016/0883-9026(94)90005-1
Lu, JW., Beamish, PW. (2001). The internationalization and perfor-mance of SMEs, Strategic Management Journal, 22, 565-586. http://dx.doi.org/10.1002/smj.184.abs
Mendi, P. (2007). Trade in disembodied technology and total factor productivity in OECD countries, Research Policy, 36(2), 209-226. http://dx.doi.org/10.1016/j.respol.2006.09.028
Mortara, L., Minshall, T. (2011). How do large multinational com-panies implement open innovation?, Technovation, 31(10), 586-597. http://dx.doi.org/10.1016/j.technovation.2011.05.002
30
ISSN: 0718-2724. (http://jotmi.org)Journal of Technology Management & Innovation © Universidad Alberto Hurtado, Facultad de Economía y Negocios.
J. Technol. Manag. Innov. 2015. Volume 10, Issue 3
Mosakowski, E. (1993). A resource-based perspective on the dynamic strategy-performance relationship: an empirical examination of the focus and differentiation strategies in, Journal of Management, 19(4), 819-839. http://dx.doi.org/10.1016/0149-2063(93)90029-m
Narula, R. (2004). R&D collaboration by SMEs: new opportunities and limitations in the face of globalization, Technovation, 24(2), 153-161. http://dx.doi.org/10.1016/s0166-4972(02)00045-7OECD. (2011). 2010 OECD Annual Report, OECD.
Parida, V., Westerberg, M., Frishammar, J. (2012). Inbound open innovation activities in high‐tech SMEs: the impact on innovation performance, Journal of Small Business Management, 50(2), 283-309. http://dx.doi.org/10.1111/j.1540-627x.2012.00354.x
Parmentier, G., Mangematin, V. (2014). Orchestrating innovation with user communities in the creative industries, Technological Fore-casting and Social Change, 83, 40-53. http://dx.doi.org/10.1016/j.tech-fore.2013.03.007
Pavitt, K. (1983). Characteristics of innovative activities in British industry, Omega, 11(2), 113-130. http://dx.doi.org/10.1016/0305-0483(83)90001-4
Roathwell, R. (1984). The role of small firms in the emergence of new technologies, Omega, 12(1), 19-29. http://dx.doi.org/10.1016/0305-0483(84)90007-0
Robson, PJ., Bennett, RJ. (2000). SME growth: the relationship with business advice and external collaboration, Small Business Economics, 15(3), 193-208.
Rosenfeld, S. A. (1996). Does cooperation enhance competitiveness? Assessing the impacts of inter-firm collaboration. Research policy, 25(2), 247-263. http://dx.doi.org/10.1016/0048-7333(95)00835-7
Savitskaya, I., Salmi, P., Torkkeli, M. (2010). Barriers to open inno-vation: case China, Journal of Technology Management & Innovation, 5(4), 10-21. http://dx.doi.org/10.4067/s0718-27242010000400002
Sisodiya, SR., Johnson, JL., Grêgoire, Y. (2013). Inbound open in-novation for enhanced performance: enablers and opportunities, Industrial Marketing Management, 42(6), 836-849. http://dx.doi.org/10.1016/j.indmarman.2013.02.018
Statistics Korea. (2013). SME Export Status Index.
Sudhir kumar, R., Bala Subrahmanya., MH. (2010). Influence of sub-contracting on innovation and economic performance of SMEs in Indian automobile industry, Technovation, 30(11), 558-569. http://dx.doi.org/10.1016/j.technovation.2010.06.005
Thong, JY. (2001). Resource constraints and information systems im-plementation in Singaporean small businesses, Omega, 29(2), 143-156. http://dx.doi.org/10.1016/s0305-0483(00)00035-9
Tidd, J., Bessant, J., Pavitt, K. (2005). Managing Innovation: Integrat-ing Technology, Market and Organizational Change 3rd edition, John Wiley & Sons, Chichester.
Tomlinson, PR., Fai, FM. (2013). The nature of SME co-operation and innovation: a multi-scalar and multi-dimensional analysis, In-ternational Journal of Production Economics, 141(1), 316-326. http://dx.doi.org/10.1016/j.ijpe.2012.08.012
Van de Vrande, V., De Jong, JP., Vanhaverbeke, W., De Rochemont., M. (2009). Open innovation in SMEs: trends, motives and management challenges, Technovation, 29(6), 423-437. http://dx.doi.org/10.1016/j.technovation.2008.10.001
Wadhwa, RS. (2012). Flexibility in manufacturing automation: a living lab case study of Norwegian metalcasting SMEs, Journal of Manufacturing Systems, 31(4), 444-454. http://dx.doi.org/10.1016/j.jmsy.2012.07.008
West, J., Gallagher., S. (2006). Challenges of open innovation: the par-adox of firm investment in open‐source software, R&D Management, 36(3), 319-331. http://dx.doi.org/10.1111/j.1467-9310.2006.00436.x
Westhead, P., Storey, DJ. (1995). Links between higher education in-stitutions and high technology firms, Omega, 23(4), 345-360. http://dx.doi.org/10.1016/0305-0483(95)00021-f
Wren, C., Storey, DJ. (2002). Evaluating the effect of soft business sup-port upon small firm performance, Oxford Economic Papers, 54(2), 334-365. http://dx.doi.org/10.1093/oep/54.2.334
Wyatt, S. (1982). The Role of Small Firms in Innovative Activity: Some New Evidence, Mimeo, SPRU, Sussex.
Xu, T., Bower, D. A., & Smith, N. J. (2005). Types of collaboration between foreign contractors and their Chinese partners. Interna-tional Journal of Project Management, 23(1), 45-53. http://dx.doi.org/10.1016/j.ijproman.2004.05.012
31
J. Technol. Manag. Innov. 2015. Volume 10, Issue 3
ISSN: 0718-2724. (http://jotmi.org)Journal of Technology Management & Innovation © Universidad Alberto Hurtado, Facultad de Economía y Negocios.
Brazilian Incubators and Science Parks’ Resources and R&D Collaboration
Serje Schmidt 1*, Alsones Balestrin 2
Abstract: One initiative largely stimulated through public policy to strengthen firms’ innovation capacity is the creation and consolidation of Incu-bators and Science & Technology Parks (ISTPs). These habitats aim to foster innovation through, among other methods, the promotion of resource complementarity and action interdependence. Empirical studies, however, have not been conclusive about this. This article analyse the relations between resources provided by ISTPs and the elements of collaborative R&D. We conducted a survey with Brazilian ISTPs and analysed the results using a quantitative multilevel approach. Our study suggests that these innovative environments do affect collaborative R&D, but not by through the services and infrastructure they provide. We indicate possible alternatives to support future studies that analyse ISTPs in emerging countries.
Keywords: innovation; cooperation; innovation environments; tenant firms.
Submitted March 6th 2015 / Approved April 5th 2015.
1 Research & Post-Graduation Dept., Feevale University, Brazil2 Research & Post-Graduation Unit, UNISINOS University, Brazil.*Corresponding author: [email protected]
Introduction
Incubators and science & technology parks (ISTPs) are important institutional mechanisms that stimulate regional development, since they seek to sustain innovation ecosystems. These innovation environ-ments mostly host small and medium-sized firms, which individually face many difficulties with keeping up-to-date and with developing and bringing innovations to market. In such cases, collaboration is a fundamental strategy for developing new products and services, char-acterizing the network as the locus of innovation (Nooteboom, 2008). Therefore, in order to promote innovation and regional development, ISTPs should direct their efforts not only to strengthen individual firms, but also to develop the networks to which these firms belong. The incubators in Chile, for example, emphasize the network when developing their tenants (Chandra & Medrano Silva, 2012).
Although there has been a growth in interest in collaboration and innovation in these milieus among government, academics and prac-titioners, the results of research remain ambiguous. Some studies indicate that ISTPs strengthen inter-organizational relations (Chan et al., 2010; Phillimore, 1999; Tan, 2006; Vedovello, 1997) and inno-vation (Lindelöf & Löfsten, 2003; Tan, 2006). In Brazil, for instance, Lahorgue (2004) and Etzkowitz et al. (2005) indicated that incuba-tors have been producing encouraging results in terms of generating employment and income for the population. Other studies, however, have not found empirical evidence that these environments positively influence inter-organizational relations (Bakouros et al., 2002; Kihl-gren, 2003; Lindelöf & Löfsten, 2003; Malairaja & Zawdie, 2008; Ra-dosevic & Myrzakhmet, 2009; Vedovello, 1997) or innovation (Chan et al., 2010; Massey et al., 1992; Radosevic & Myrzakhmet, 2009; Wes-thead, 1997). Also, the adoption of models for these innovation envi-ronments is both criticized (Castells & Hall, 1994) and considered a practicable possibility (Etzkowitz & Leydesdorff, 2000).
With the exception of a small number of studies, the majority of quantitative analyses have compared firms inside these environ-ments against firms from outside, assuming homogeneity of ser-vices and infrastructure and relatively context-independent sample characteristics. Qualitative studies, on the other hand, provide weak generalizability that is necessary for a comprehensive theoretical support. In addition, many studies focus on technologically devel-oped countries, subjected to different institutional factors from de-veloping countries.
Given the importance of ISTP development and the opportunities for contribution identified in the literature, our research objective is to investigate how do ISTP’s environments affect R&D collaboration between their tenants. We conducted a multilevel analysis among Brazilian ISTPs, a developing country that has partially adopted ISTP conceptions and management models from other nations. Adopting two levels of analysis, we use a quantitative approach to observe three different types of relationships. Our intention is to contribute to the increasing understanding of the complex phenomenon of R&D col-laboration within ISTPs by providing a basis for the conceptualiza-tion of its elements and antecedents. We expect that the results of this study can help policymakers and ISTP managers to understand the role of these habitats as active facilitators of innovation, thereby bringing complementary elements to their strategy formulation.
The present work is organized as follows: in the next section, we ex-plain the design and research method. The, each of the constructs are detailed. We discuss ISTP resources, collaborative R&D and the ele-ments that comprise it. In the following section, we describe the data collection process. The results are presented next and are followed by a discussion of the implications of this study for theory and practice. Our concluding remarks are presented in the final section, also de-scribing this study’s limitations.
32
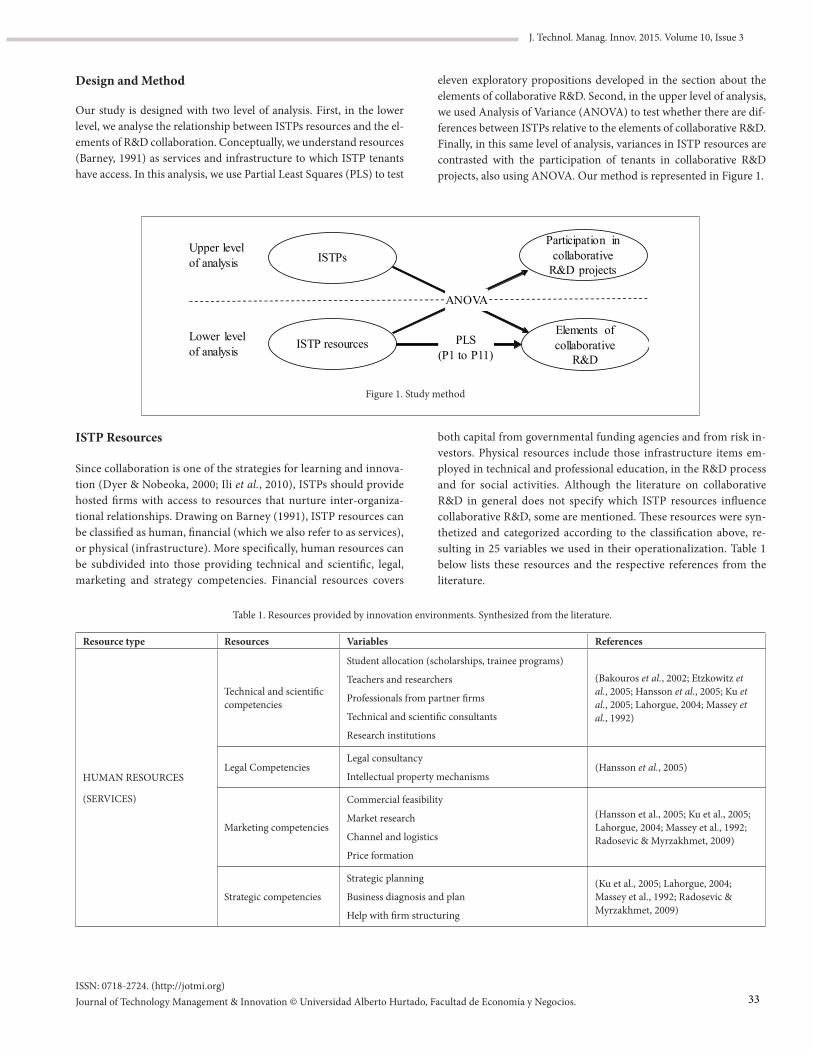
J. Technol. Manag. Innov. 2015. Volume 10, Issue 3
ISSN: 0718-2724. (http://jotmi.org)Journal of Technology Management & Innovation © Universidad Alberto Hurtado, Facultad de Economía y Negocios.
Design and Method
Our study is designed with two level of analysis. First, in the lower level, we analyse the relationship between ISTPs resources and the el-ements of R&D collaboration. Conceptually, we understand resources (Barney, 1991) as services and infrastructure to which ISTP tenants have access. In this analysis, we use Partial Least Squares (PLS) to test
ISTP Resources
Since collaboration is one of the strategies for learning and innova-tion (Dyer & Nobeoka, 2000; Ili et al., 2010), ISTPs should provide hosted firms with access to resources that nurture inter-organiza-tional relationships. Drawing on Barney (1991), ISTP resources can be classified as human, financial (which we also refer to as services), or physical (infrastructure). More specifically, human resources can be subdivided into those providing technical and scientific, legal, marketing and strategy competencies. Financial resources covers
ISTPsParticipation in
collaborative R&D projects
ISTP resourcesElements of collaborative
R&D
ANOVA
PLS(P1 to P11)
Upper level of analysis
Lower level of analysis
Figure 1. Study method
Resource type Resources Variables References
HUMAN RESOURCES
(SERVICES)
Technical and scientific competencies
Student allocation (scholarships, trainee programs)
Teachers and researchers
Professionals from partner firms
Technical and scientific consultants
Research institutions
(Bakouros et al., 2002; Etzkowitz et al., 2005; Hansson et al., 2005; Ku et al., 2005; Lahorgue, 2004; Massey et al., 1992)
Legal CompetenciesLegal consultancy
Intellectual property mechanisms(Hansson et al., 2005)
Marketing competencies
Commercial feasibility
Market research
Channel and logistics
Price formation
(Hansson et al., 2005; Ku et al., 2005; Lahorgue, 2004; Massey et al., 1992; Radosevic & Myrzakhmet, 2009)
Strategic competencies
Strategic planning
Business diagnosis and plan
Help with firm structuring
(Ku et al., 2005; Lahorgue, 2004; Massey et al., 1992; Radosevic & Myrzakhmet, 2009)
Table 1. Resources provided by innovation environments. Synthesized from the literature.
eleven exploratory propositions developed in the section about the elements of collaborative R&D. Second, in the upper level of analysis, we used Analysis of Variance (ANOVA) to test whether there are dif-ferences between ISTPs relative to the elements of collaborative R&D. Finally, in this same level of analysis, variances in ISTP resources are contrasted with the participation of tenants in collaborative R&D projects, also using ANOVA. Our method is represented in Figure 1.
both capital from governmental funding agencies and from risk in-vestors. Physical resources include those infrastructure items em-ployed in technical and professional education, in the R&D process and for social activities. Although the literature on collaborative R&D in general does not specify which ISTP resources influence collaborative R&D, some are mentioned. These resources were syn-thetized and categorized according to the classification above, re-sulting in 25 variables we used in their operationalization. Table 1 below lists these resources and the respective references from the literature.
33
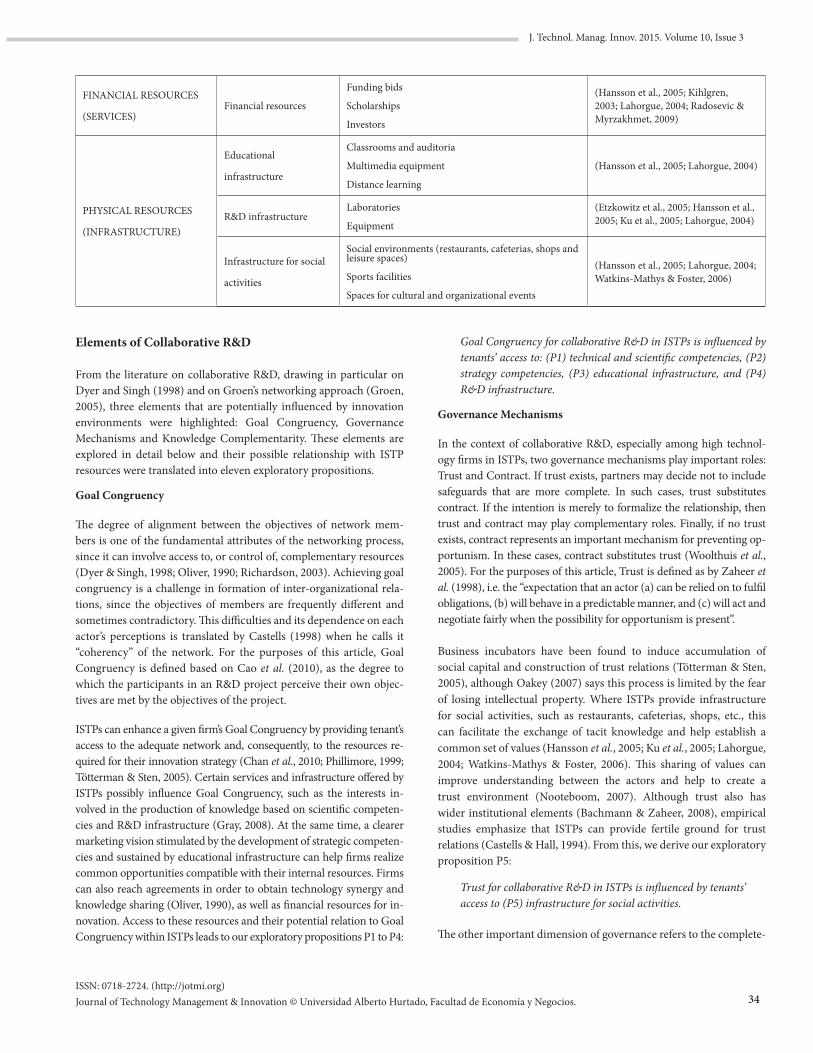
J. Technol. Manag. Innov. 2015. Volume 10, Issue 3
ISSN: 0718-2724. (http://jotmi.org)Journal of Technology Management & Innovation © Universidad Alberto Hurtado, Facultad de Economía y Negocios.
FINANCIAL RESOURCES
(SERVICES)Financial resources
Funding bids
Scholarships
Investors
(Hansson et al., 2005; Kihlgren, 2003; Lahorgue, 2004; Radosevic & Myrzakhmet, 2009)
PHYSICAL RESOURCES
(INFRASTRUCTURE)
Educational
infrastructure
Classrooms and auditoria
Multimedia equipment
Distance learning
(Hansson et al., 2005; Lahorgue, 2004)
R&D infrastructureLaboratories
Equipment
(Etzkowitz et al., 2005; Hansson et al., 2005; Ku et al., 2005; Lahorgue, 2004)
Infrastructure for social
activities
Social environments (restaurants, cafeterias, shops and leisure spaces)
Sports facilities
Spaces for cultural and organizational events
(Hansson et al., 2005; Lahorgue, 2004; Watkins-Mathys & Foster, 2006)
Elements of Collaborative R&D
From the literature on collaborative R&D, drawing in particular on Dyer and Singh (1998) and on Groen’s networking approach (Groen, 2005), three elements that are potentially influenced by innovation environments were highlighted: Goal Congruency, Governance Mechanisms and Knowledge Complementarity. These elements are explored in detail below and their possible relationship with ISTP resources were translated into eleven exploratory propositions.
Goal Congruency
The degree of alignment between the objectives of network mem-bers is one of the fundamental attributes of the networking process, since it can involve access to, or control of, complementary resources (Dyer & Singh, 1998; Oliver, 1990; Richardson, 2003). Achieving goal congruency is a challenge in formation of inter-organizational rela-tions, since the objectives of members are frequently different and sometimes contradictory. This difficulties and its dependence on each actor’s perceptions is translated by Castells (1998) when he calls it “coherency” of the network. For the purposes of this article, Goal Congruency is defined based on Cao et al. (2010), as the degree to which the participants in an R&D project perceive their own objec-tives are met by the objectives of the project.
ISTPs can enhance a given firm’s Goal Congruency by providing tenant’s access to the adequate network and, consequently, to the resources re-quired for their innovation strategy (Chan et al., 2010; Phillimore, 1999; Tötterman & Sten, 2005). Certain services and infrastructure offered by ISTPs possibly influence Goal Congruency, such as the interests in-volved in the production of knowledge based on scientific competen-cies and R&D infrastructure (Gray, 2008). At the same time, a clearer marketing vision stimulated by the development of strategic competen-cies and sustained by educational infrastructure can help firms realize common opportunities compatible with their internal resources. Firms can also reach agreements in order to obtain technology synergy and knowledge sharing (Oliver, 1990), as well as financial resources for in-novation. Access to these resources and their potential relation to Goal Congruency within ISTPs leads to our exploratory propositions P1 to P4:
Goal Congruency for collaborative R&D in ISTPs is influenced by tenants’ access to: (P1) technical and scientific competencies, (P2) strategy competencies, (P3) educational infrastructure, and (P4) R&D infrastructure.
Governance Mechanisms
In the context of collaborative R&D, especially among high technol-ogy firms in ISTPs, two governance mechanisms play important roles: Trust and Contract. If trust exists, partners may decide not to include safeguards that are more complete. In such cases, trust substitutes contract. If the intention is merely to formalize the relationship, then trust and contract may play complementary roles. Finally, if no trust exists, contract represents an important mechanism for preventing op-portunism. In these cases, contract substitutes trust (Woolthuis et al., 2005). For the purposes of this article, Trust is defined as by Zaheer et al. (1998), i.e. the “expectation that an actor (a) can be relied on to fulfil obligations, (b) will behave in a predictable manner, and (c) will act and negotiate fairly when the possibility for opportunism is present”.
Business incubators have been found to induce accumulation of social capital and construction of trust relations (Tötterman & Sten, 2005), although Oakey (2007) says this process is limited by the fear of losing intellectual property. Where ISTPs provide infrastructure for social activities, such as restaurants, cafeterias, shops, etc., this can facilitate the exchange of tacit knowledge and help establish a common set of values (Hansson et al., 2005; Ku et al., 2005; Lahorgue, 2004; Watkins-Mathys & Foster, 2006). This sharing of values can improve understanding between the actors and help to create a trust environment (Nooteboom, 2007). Although trust also has wider institutional elements (Bachmann & Zaheer, 2008), empirical studies emphasize that ISTPs can provide fertile ground for trust relations (Castells & Hall, 1994). From this, we derive our exploratory proposition P5:
Trust for collaborative R&D in ISTPs is influenced by tenants’access to (P5) infrastructure for social activities.
The other important dimension of governance refers to the complete-
34
J. Technol. Manag. Innov. 2015. Volume 10, Issue 3
ISSN: 0718-2724. (http://jotmi.org)Journal of Technology Management & Innovation © Universidad Alberto Hurtado, Facultad de Economía y Negocios.
ness of contractual safeguards. In ISTPs, contractual safeguards may be more or less detailed, depending on the understanding of the con-tract’s role from the actors involved (Woolthuis et al., 2005). Consid-ering ISTPs can provide access to intellectual property and general legal competencies, as well as to financial resources provided by the state, it is reasonable to propose that these resources will be associated with more complete contractual safeguards. This leads to our explor-atory propositions P6 and P7:
Contractual completeness for collaborative R&D in ISTPs is influenced by tenants’ access to (P6) legal competencies and (P7) financial resources.
Knowledge Complementarity
Network formation allows easier access to complementary resources for innovation (Dyer & Singh, 1998). In the case of collaborative R&D, complementary resources are primarily scientific, technical and commercial knowledge that complement the resources owned by a firm, enabling it to fulfil its innovation objectives (Dyer & Nobeoka, 2000; Ili et al., 2010; Richardson, 2003). The definition of knowledge complementarity adopted for the purposes of this article is based on Cao et al. (2010) and Nonaka (1994) and is stated as “the exchange of tacit knowledge that fulfils or completes the performance of each partner in a collaborative R&D project by the sharing of experiences”.
Results indicating that knowledge complementarity is positively influenced by incubators have been reported (Tötterman & Sten, 2005). In the case of science parks, however, the results are ambigu-ous. While some studies suggest a positive influence on knowledge complementarity (Phillimore, 1999; Tan, 2006; Watkins-Mathys & Foster, 2006), others have identified neutral or even negative influ-ences (Bakouros et al., 2002; Chan et al., 2010; Malairaja & Zawdie, 2008; Westhead, 1997).
Some resources may encourage knowledge complementarity and synergy between ISTP firms, such as R&D laboratories(Löfsten & Lindelöf, 2005; Vedovello, 1997) and equipment (Kihlgren, 2003; Malairaja & Zawdie, 2008; Watkins-Mathys & Foster, 2006). ISTPs can enable access to resources that tenants do not possess, which may be the case of specific technical, scientific and marketing competen-cies. The origin of these competencies could be suppliers, custom-ers, universities or research institutions; thereby connecting internal firms into a diversified network of relationships. Infrastructure for education can serve as means to become acquainted with the compe-tencies of other tenants, leading to knowledge complementarity. On this basis, exploratory propositions P8 to P11 can be stated as follows:
Knowledge complementarity for collaborative R&D in ISTPs is influenced by tenants’ access to: (P8) technical and scientific competencies, (P9) marketing competencies, (P10) educational infrastructure, and (P11) R&D infrastructure.
In the next section, we explore the method used to achieve our study objectives.
Data Collection
As an emerging country, Brazil is struggling to promote innovation and entrepreneurship. It has 384 incubators that have graduated 2,509 firms. These firms employ 29,205 persons and receive around US$ 1.8 billion in revenues (ANPROTEC, 2012). Data collection was conducted from April to May 2013. A list of 290 ISTPs was extract-ed from the website of the Brazilian IASP1 subsidiary, ANPROTEC2. Each ISTP was telephoned, given an explanation of the research ob-jectives and then requested to supply a list of their tenants, resulting in a list of 1,004 tenants. We called the person responsible for R&D at each tenant (defined as our respondent), and invited him to partic-ipate in our study. A list of 437 e-mail addresses was obtained. Data collection was conducted using SurveyMonkey1 and respondents were informed that if they took part and completed the questionnaire they would be entered into a raffle to win a tablet, as an incentive to participate. After three reminders sent to non-respondents, 265 questionnaires had been answered. A non-significant number of cas-es with incomplete data was identified (Kline, 1998) and the mean for the variable in question was used as a substitute in such cases. Outliers were also non-significant, since only one variable from one questionnaire was identified as such.
The scale for independent variables, i.e., the services and infra-structure provided by ISTPs, was designed to measure respondents’ opinions on the contribution that ISTPs made to their access to the resources listed in Table 1. The response scale ranged from zero, meaning the ISTP did not contribute to accessing the resource, to three, meaning it contributed greatly. Dependent variables were mea-sured by adapting scales already available in the literature and that offered adequate validity and reliability. The scale for Goal Congru-ency was based on Cao et al. (2010); for Trust, on Zaheer et al. (1998); for Contract, on a formative construct from Woolthuis et al. (2005); and the measurement for Knowledge Complementarity was based on Wittmann et al. (2009) and Deitz et al. (2010). Precautions were taken to control common method biases (Podsakoff et al., 2003), such as separating independent and dependent variables using different sec-tion of the online form and different scales, ensuring respondent ano-nymity and careful consideration of item wording constructions. A pre-test was also conducted with four respondents in firms located in ISTPs, which helped to improve ordering and wording of items.
Results
Sample Characteristics
The typical firm in our sample is small (83.4% with less than 10 employees), recently established (80.6% less than 5 years) and does business in the high technology market (72.9% in information technology, communications, biotechnology, etc.) Most firms are located within incubators (71.8%) while some of them are situated in science parks (19.6%). Other firms (8.6%) have either recently left their incubators or are hosted in mixed environments (science park and incubator). Most respondents have worked for their
(1) www.surveymonkey.com
35
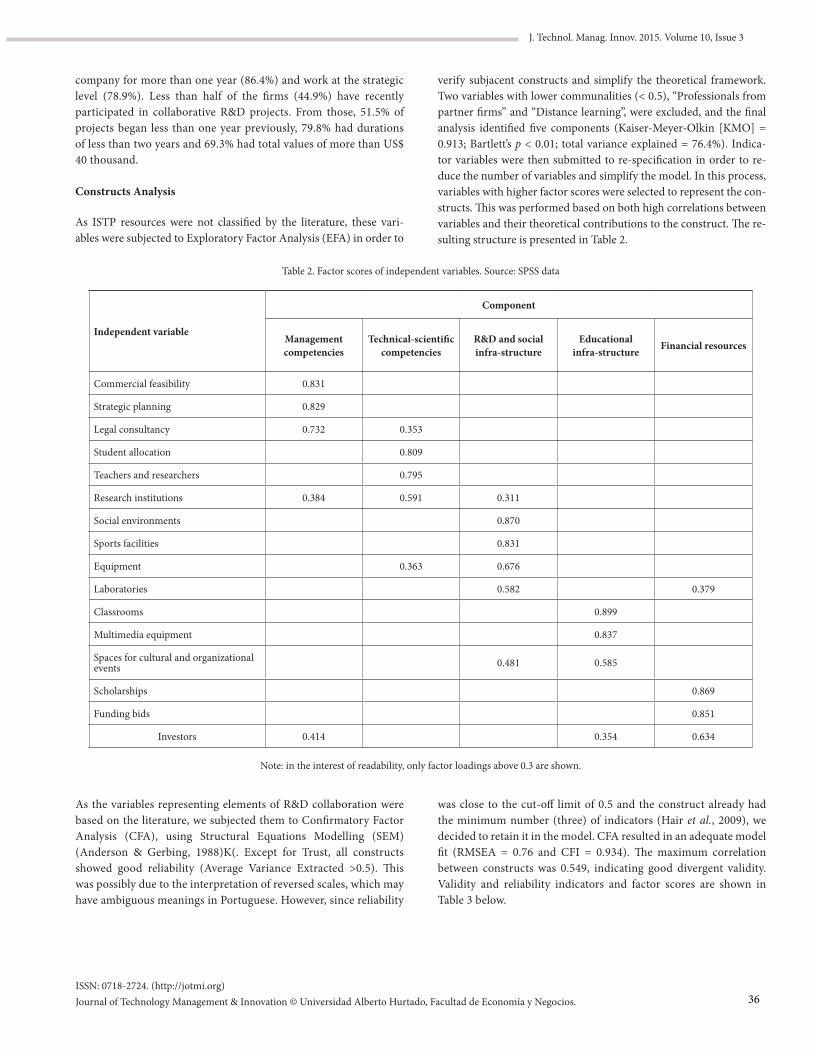
J. Technol. Manag. Innov. 2015. Volume 10, Issue 3
ISSN: 0718-2724. (http://jotmi.org)Journal of Technology Management & Innovation © Universidad Alberto Hurtado, Facultad de Economía y Negocios.
company for more than one year (86.4%) and work at the strategic level (78.9%). Less than half of the firms (44.9%) have recently participated in collaborative R&D projects. From those, 51.5% of projects began less than one year previously, 79.8% had durations of less than two years and 69.3% had total values of more than US$ 40 thousand.
Constructs Analysis
As ISTP resources were not classified by the literature, these vari-ables were subjected to Exploratory Factor Analysis (EFA) in order to
verify subjacent constructs and simplify the theoretical framework. Two variables with lower communalities (< 0.5), “Professionals from partner firms” and “Distance learning”, were excluded, and the final analysis identified five components (Kaiser-Meyer-Olkin [KMO] = 0.913; Bartlett’s p < 0.01; total variance explained = 76.4%). Indica-tor variables were then submitted to re-specification in order to re-duce the number of variables and simplify the model. In this process, variables with higher factor scores were selected to represent the con-structs. This was performed based on both high correlations between variables and their theoretical contributions to the construct. The re-sulting structure is presented in Table 2.
Table 2. Factor scores of independent variables. Source: SPSS data
Independent variable
Component
Management competencies
Technical-scientific competencies
R&D and social infra-structure
Educational infra-structure Financial resources
Commercial feasibility 0.831
Strategic planning 0.829
Legal consultancy 0.732 0.353
Student allocation 0.809
Teachers and researchers 0.795
Research institutions 0.384 0.591 0.311
Social environments 0.870
Sports facilities 0.831
Equipment 0.363 0.676
Laboratories 0.582 0.379
Classrooms 0.899
Multimedia equipment 0.837
Spaces for cultural and organizational events 0.481 0.585
Scholarships 0.869
Funding bids 0.851
Investors 0.414 0.354 0.634
Note: in the interest of readability, only factor loadings above 0.3 are shown.
As the variables representing elements of R&D collaboration were based on the literature, we subjected them to Confirmatory Factor Analysis (CFA), using Structural Equations Modelling (SEM) (Anderson & Gerbing, 1988)K(. Except for Trust, all constructs showed good reliability (Average Variance Extracted >0.5). This was possibly due to the interpretation of reversed scales, which may have ambiguous meanings in Portuguese. However, since reliability
was close to the cut-off limit of 0.5 and the construct already had the minimum number (three) of indicators (Hair et al., 2009), we decided to retain it in the model. CFA resulted in an adequate model fit (RMSEA = 0.76 and CFI = 0.934). The maximum correlation between constructs was 0.549, indicating good divergent validity. Validity and reliability indicators and factor scores are shown in Table 3 below.
36
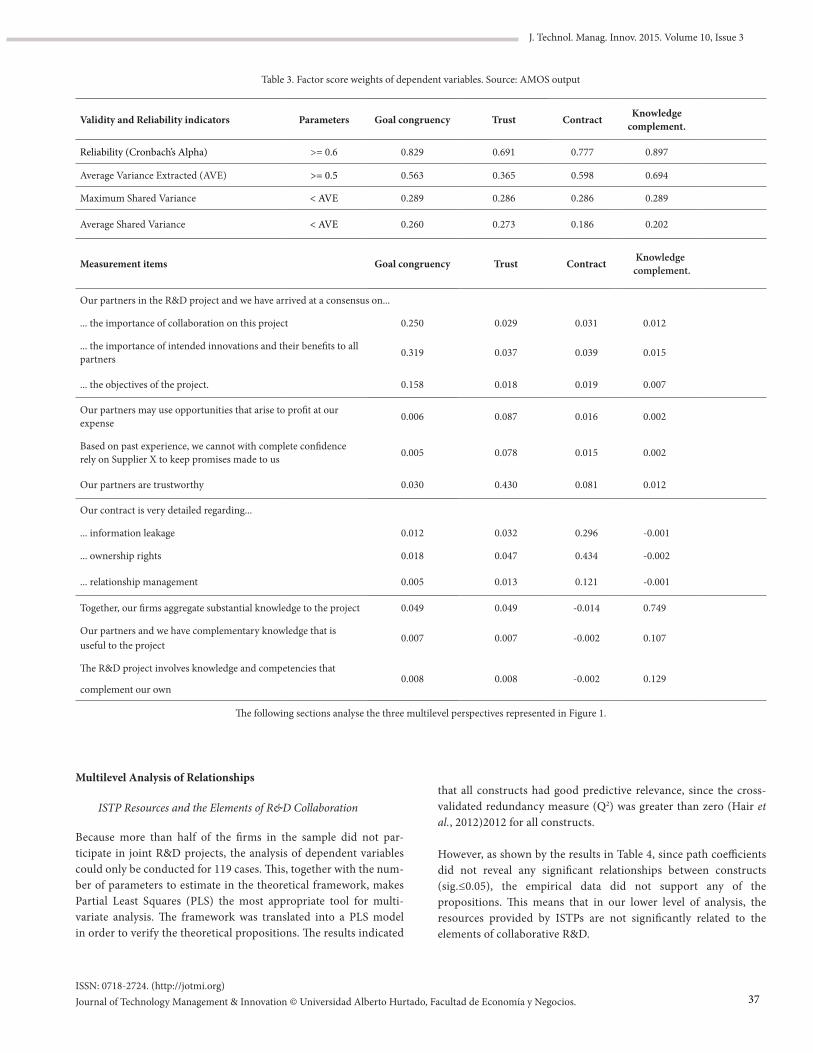
J. Technol. Manag. Innov. 2015. Volume 10, Issue 3
ISSN: 0718-2724. (http://jotmi.org)Journal of Technology Management & Innovation © Universidad Alberto Hurtado, Facultad de Economía y Negocios.
Table 3. Factor score weights of dependent variables. Source: AMOS output
Validity and Reliability indicators Parameters Goal congruency Trust Contract Knowledge complement.
Reliability (Cronbach’s Alpha) >= 0.6 0.829 0.691 0.777 0.897
Average Variance Extracted (AVE) >= 0.5 0.563 0.365 0.598 0.694
Maximum Shared Variance < AVE 0.289 0.286 0.286 0.289
Average Shared Variance < AVE 0.260 0.273 0.186 0.202
Measurement items Goal congruency Trust Contract Knowledge complement.
Our partners in the R&D project and we have arrived at a consensus on...
... the importance of collaboration on this project 0.250 0.029 0.031 0.012
... the importance of intended innovations and their benefits to all partners 0.319 0.037 0.039 0.015
... the objectives of the project. 0.158 0.018 0.019 0.007
Our partners may use opportunities that arise to profit at our expense 0.006 0.087 0.016 0.002
Based on past experience, we cannot with complete confidence rely on Supplier X to keep promises made to us 0.005 0.078 0.015 0.002
Our partners are trustworthy 0.030 0.430 0.081 0.012
Our contract is very detailed regarding...
... information leakage 0.012 0.032 0.296 -0.001
... ownership rights 0.018 0.047 0.434 -0.002
... relationship management 0.005 0.013 0.121 -0.001
Together, our firms aggregate substantial knowledge to the project 0.049 0.049 -0.014 0.749
Our partners and we have complementary knowledge that is useful to the project
0.007 0.007 -0.002 0.107
The R&D project involves knowledge and competencies that
complement our own0.008 0.008 -0.002 0.129
The following sections analyse the three multilevel perspectives represented in Figure 1.
Multilevel Analysis of Relationships
ISTP Resources and the Elements of R&D Collaboration
Because more than half of the firms in the sample did not par-ticipate in joint R&D projects, the analysis of dependent variables could only be conducted for 119 cases. This, together with the num-ber of parameters to estimate in the theoretical framework, makes Partial Least Squares (PLS) the most appropriate tool for multi-variate analysis. The framework was translated into a PLS model in order to verify the theoretical propositions. The results indicated
that all constructs had good predictive relevance, since the cross-validated redundancy measure (Q2) was greater than zero (Hair et al., 2012)2012 for all constructs.
However, as shown by the results in Table 4, since path coefficients did not reveal any significant relationships between constructs (sig.≤0.05), the empirical data did not support any of the propositions. This means that in our lower level of analysis, the resources provided by ISTPs are not significantly related to the elements of collaborative R&D.
37
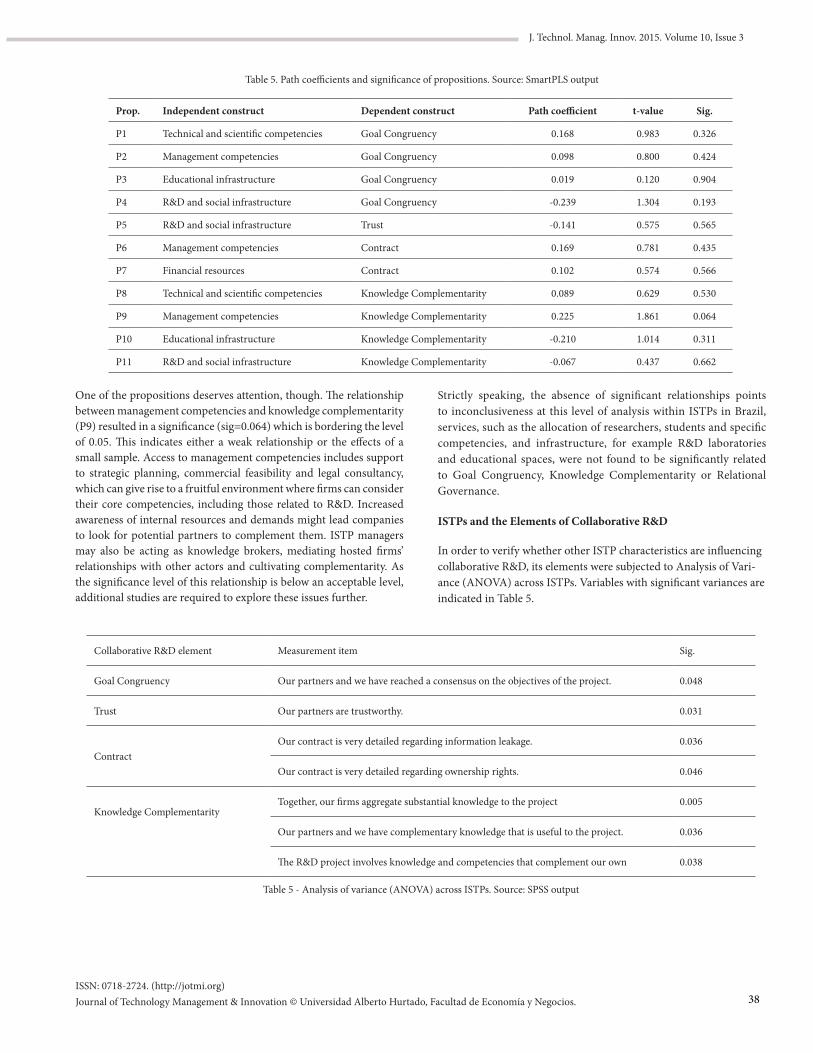
J. Technol. Manag. Innov. 2015. Volume 10, Issue 3
ISSN: 0718-2724. (http://jotmi.org)Journal of Technology Management & Innovation © Universidad Alberto Hurtado, Facultad de Economía y Negocios.
Table 5. Path coefficients and significance of propositions. Source: SmartPLS output
Prop. Independent construct Dependent construct Path coefficient t-value Sig.
P1 Technical and scientific competencies Goal Congruency 0.168 0.983 0.326
P2 Management competencies Goal Congruency 0.098 0.800 0.424
P3 Educational infrastructure Goal Congruency 0.019 0.120 0.904
P4 R&D and social infrastructure Goal Congruency -0.239 1.304 0.193
P5 R&D and social infrastructure Trust -0.141 0.575 0.565
P6 Management competencies Contract 0.169 0.781 0.435
P7 Financial resources Contract 0.102 0.574 0.566
P8 Technical and scientific competencies Knowledge Complementarity 0.089 0.629 0.530
P9 Management competencies Knowledge Complementarity 0.225 1.861 0.064
P10 Educational infrastructure Knowledge Complementarity -0.210 1.014 0.311
P11 R&D and social infrastructure Knowledge Complementarity -0.067 0.437 0.662
Strictly speaking, the absence of significant relationships points to inconclusiveness at this level of analysis within ISTPs in Brazil, services, such as the allocation of researchers, students and specific competencies, and infrastructure, for example R&D laboratories and educational spaces, were not found to be significantly related to Goal Congruency, Knowledge Complementarity or Relational Governance.
ISTPs and the Elements of Collaborative R&D
In order to verify whether other ISTP characteristics are influencing collaborative R&D, its elements were subjected to Analysis of Vari-ance (ANOVA) across ISTPs. Variables with significant variances are indicated in Table 5.
One of the propositions deserves attention, though. The relationship between management competencies and knowledge complementarity (P9) resulted in a significance (sig=0.064) which is bordering the level of 0.05. This indicates either a weak relationship or the effects of a small sample. Access to management competencies includes support to strategic planning, commercial feasibility and legal consultancy, which can give rise to a fruitful environment where firms can consider their core competencies, including those related to R&D. Increased awareness of internal resources and demands might lead companies to look for potential partners to complement them. ISTP managers may also be acting as knowledge brokers, mediating hosted firms’ relationships with other actors and cultivating complementarity. As the significance level of this relationship is below an acceptable level, additional studies are required to explore these issues further.
Collaborative R&D element Measurement item Sig.
Goal Congruency Our partners and we have reached a consensus on the objectives of the project. 0.048
Trust Our partners are trustworthy. 0.031
ContractOur contract is very detailed regarding information leakage. 0.036
Our contract is very detailed regarding ownership rights. 0.046
Knowledge ComplementarityTogether, our firms aggregate substantial knowledge to the project 0.005
Our partners and we have complementary knowledge that is useful to the project. 0.036
The R&D project involves knowledge and competencies that complement our own 0.038
Table 5 - Analysis of variance (ANOVA) across ISTPs. Source: SPSS output
38
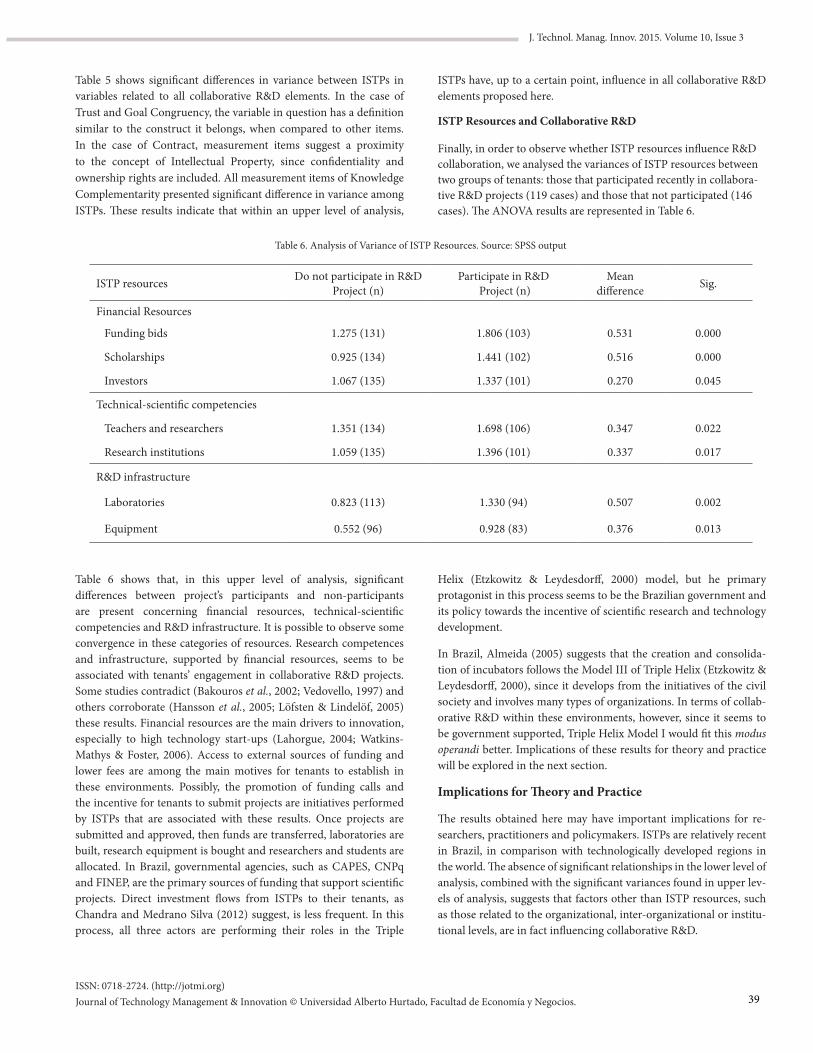
J. Technol. Manag. Innov. 2015. Volume 10, Issue 3
ISSN: 0718-2724. (http://jotmi.org)Journal of Technology Management & Innovation © Universidad Alberto Hurtado, Facultad de Economía y Negocios.
Table 5 shows significant differences in variance between ISTPs in variables related to all collaborative R&D elements. In the case of Trust and Goal Congruency, the variable in question has a definition similar to the construct it belongs, when compared to other items. In the case of Contract, measurement items suggest a proximity to the concept of Intellectual Property, since confidentiality and ownership rights are included. All measurement items of Knowledge Complementarity presented significant difference in variance among ISTPs. These results indicate that within an upper level of analysis,
ISTPs have, up to a certain point, influence in all collaborative R&D elements proposed here.
ISTP Resources and Collaborative R&D
Finally, in order to observe whether ISTP resources influence R&D collaboration, we analysed the variances of ISTP resources between two groups of tenants: those that participated recently in collabora-tive R&D projects (119 cases) and those that not participated (146 cases). The ANOVA results are represented in Table 6.
Table 6. Analysis of Variance of ISTP Resources. Source: SPSS output
ISTP resources Do not participate in R&D Project (n)
Participate in R&D Project (n)
Mean difference Sig.
Financial Resources
Funding bids 1.275 (131) 1.806 (103) 0.531 0.000
Scholarships 0.925 (134) 1.441 (102) 0.516 0.000
Investors 1.067 (135) 1.337 (101) 0.270 0.045
Technical-scientific competencies
Teachers and researchers 1.351 (134) 1.698 (106) 0.347 0.022
Research institutions 1.059 (135) 1.396 (101) 0.337 0.017
R&D infrastructure
Laboratories 0.823 (113) 1.330 (94) 0.507 0.002
Equipment 0.552 (96) 0.928 (83) 0.376 0.013
Table 6 shows that, in this upper level of analysis, significant differences between project’s participants and non-participants are present concerning financial resources, technical-scientific competencies and R&D infrastructure. It is possible to observe some convergence in these categories of resources. Research competences and infrastructure, supported by financial resources, seems to be associated with tenants’ engagement in collaborative R&D projects. Some studies contradict (Bakouros et al., 2002; Vedovello, 1997) and others corroborate (Hansson et al., 2005; Löfsten & Lindelöf, 2005) these results. Financial resources are the main drivers to innovation, especially to high technology start-ups (Lahorgue, 2004; Watkins-Mathys & Foster, 2006). Access to external sources of funding and lower fees are among the main motives for tenants to establish in these environments. Possibly, the promotion of funding calls and the incentive for tenants to submit projects are initiatives performed by ISTPs that are associated with these results. Once projects are submitted and approved, then funds are transferred, laboratories are built, research equipment is bought and researchers and students are allocated. In Brazil, governmental agencies, such as CAPES, CNPq and FINEP, are the primary sources of funding that support scientific projects. Direct investment flows from ISTPs to their tenants, as Chandra and Medrano Silva (2012) suggest, is less frequent. In this process, all three actors are performing their roles in the Triple
Helix (Etzkowitz & Leydesdorff, 2000) model, but he primary protagonist in this process seems to be the Brazilian government and its policy towards the incentive of scientific research and technology development.
In Brazil, Almeida (2005) suggests that the creation and consolida-tion of incubators follows the Model III of Triple Helix (Etzkowitz & Leydesdorff, 2000), since it develops from the initiatives of the civil society and involves many types of organizations. In terms of collab-orative R&D within these environments, however, since it seems to be government supported, Triple Helix Model I would fit this modus operandi better. Implications of these results for theory and practice will be explored in the next section.
Implications for Theory and Practice
The results obtained here may have important implications for re-searchers, practitioners and policymakers. ISTPs are relatively recent in Brazil, in comparison with technologically developed regions in the world. The absence of significant relationships in the lower level of analysis, combined with the significant variances found in upper lev-els of analysis, suggests that factors other than ISTP resources, such as those related to the organizational, inter-organizational or institu-tional levels, are in fact influencing collaborative R&D.
39
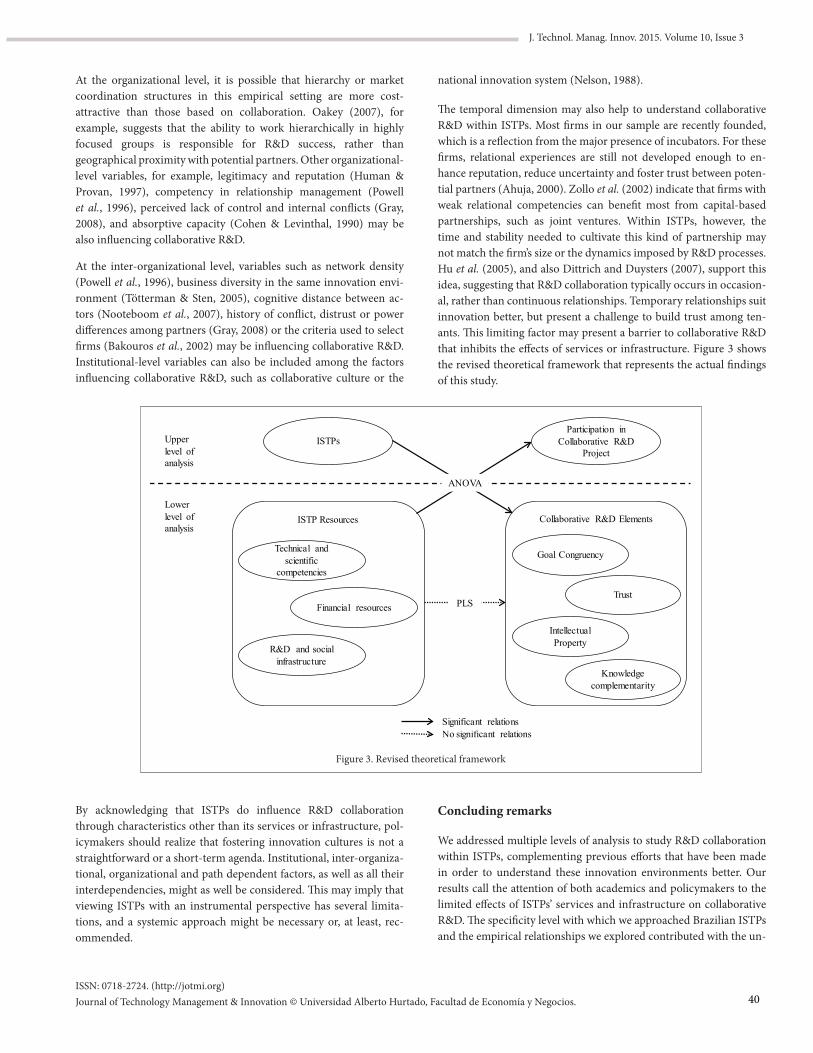
J. Technol. Manag. Innov. 2015. Volume 10, Issue 3
ISSN: 0718-2724. (http://jotmi.org)Journal of Technology Management & Innovation © Universidad Alberto Hurtado, Facultad de Economía y Negocios.
At the organizational level, it is possible that hierarchy or market coordination structures in this empirical setting are more cost-attractive than those based on collaboration. Oakey (2007), for example, suggests that the ability to work hierarchically in highly focused groups is responsible for R&D success, rather than geographical proximity with potential partners. Other organizational-level variables, for example, legitimacy and reputation (Human & Provan, 1997), competency in relationship management (Powell et al., 1996), perceived lack of control and internal conflicts (Gray, 2008), and absorptive capacity (Cohen & Levinthal, 1990) may be also influencing collaborative R&D.
At the inter-organizational level, variables such as network density (Powell et al., 1996), business diversity in the same innovation envi-ronment (Tötterman & Sten, 2005), cognitive distance between ac-tors (Nooteboom et al., 2007), history of conflict, distrust or power differences among partners (Gray, 2008) or the criteria used to select firms (Bakouros et al., 2002) may be influencing collaborative R&D. Institutional-level variables can also be included among the factors influencing collaborative R&D, such as collaborative culture or the
national innovation system (Nelson, 1988).
The temporal dimension may also help to understand collaborative R&D within ISTPs. Most firms in our sample are recently founded, which is a reflection from the major presence of incubators. For these firms, relational experiences are still not developed enough to en-hance reputation, reduce uncertainty and foster trust between poten-tial partners (Ahuja, 2000). Zollo et al. (2002) indicate that firms with weak relational competencies can benefit most from capital-based partnerships, such as joint ventures. Within ISTPs, however, the time and stability needed to cultivate this kind of partnership may not match the firm’s size or the dynamics imposed by R&D processes. Hu et al. (2005), and also Dittrich and Duysters (2007), support this idea, suggesting that R&D collaboration typically occurs in occasion-al, rather than continuous relationships. Temporary relationships suit innovation better, but present a challenge to build trust among ten-ants. This limiting factor may present a barrier to collaborative R&D that inhibits the effects of services or infrastructure. Figure 3 shows the revised theoretical framework that represents the actual findings of this study.
By acknowledging that ISTPs do influence R&D collaboration through characteristics other than its services or infrastructure, pol-icymakers should realize that fostering innovation cultures is not a straightforward or a short-term agenda. Institutional, inter-organiza-tional, organizational and path dependent factors, as well as all their interdependencies, might as well be considered. This may imply that viewing ISTPs with an instrumental perspective has several limita-tions, and a systemic approach might be necessary or, at least, rec-ommended.
ISTP Resources
ISTPs
Collaborative R&D Elements
Goal Congruency
Knowledge complementarity
Trust
Intellectual Property
Technical and scientific
competencies
Financial resources
R&D and social infrastructure
Participation in Collaborative R&D
ProjectUpper level of analysis
Lower level of analysis
ANOVA
PLS
No significant relationsSignificant relations
Figure 3. Revised theoretical framework
Concluding remarks
We addressed multiple levels of analysis to study R&D collaboration within ISTPs, complementing previous efforts that have been made in order to understand these innovation environments better. Our results call the attention of both academics and policymakers to the limited effects of ISTPs’ services and infrastructure on collaborative R&D. The specificity level with which we approached Brazilian ISTPs and the empirical relationships we explored contributed with the un-
40
J. Technol. Manag. Innov. 2015. Volume 10, Issue 3
ISSN: 0718-2724. (http://jotmi.org)Journal of Technology Management & Innovation © Universidad Alberto Hurtado, Facultad de Economía y Negocios.
derstanding of these environments and its role as promoters of ten-ants’ collaboration, innovation and regional development. Our con-tribution indicates that ISTPs in Brazil influence collaborative R&D through elements other than its services or infrastructure.
Some research limitations and potential biases of the present study may also be considered. The sample used here is not representative of the population of Brazilian ISTP tenants, and caution is advisable while generalizing the results. Greater samples could also allow the testing of propositions with more robust multivariate statistical tech-niques, such as Structural Equations Modelling (SEM), and provide different significance levels. In addition, causality relations among constructs may not be implied, since the conditions for such testing were not met.
We understand that the phenomena of R&D collaboration within incubators and science parks transcends the relationships observed here, endorse previous studies and calls for further academic atten-tion. Approaching this empirical environment is not an easy task. On one hand, idiosyncrasies of the context within which ISTPs are formed and developed and, on the other hand, the complexities in-herent to collaborative R&D projects, may prevent identification of generalizable propositions. Considering the issues discussed here, future efforts to comprehend this phenomenon could be directed at exploring different levels of analysis. Theoretically, the exogenous variables discussed above, and epistemologically, complex systems theory, may offer some light.
References
Ahuja, G. (2000). The duality of collaboration: inducements and opportunities in the formation of interfirm linkages. Strategic Management Journal, 21(3), 317-343. doi: 10.1002/(SICI)1097-0266(200003)21:3<317::AID-SMJ90>3.0.CO;2-B
Almeida, M. (2005). The evolution of the incubator movement in Brazil. International Journal of Technology and Globalisation, 1(2), 258-277. doi: doi:10.1504/IJTG.2005.007054
Anderson, J. C., & Gerbing, D. W. (1988). Structural equation mo-deling in practice: A review and recommended two-step appro-ach. Psychological Bulletin, 103(3), 411-423. doi: 10.1037/0033-2909.103.3.411
ANPROTEC. (2012). Estudo, Análise e Proposições sobre as Incuba-doras de Empresas no Brasil – relatório técnico.
Bachmann, R., & Zaheer, A. (2008). In M. Cropper, M. Ebers, C. Hux-man & P. S. Ring (Eds.), The Oxford Handbook of Inter-Organizational Relations. New York: Oxford Press.
Bakouros, Y. L., Mardas, D. C., & Varsakelis, N. C. (2002). Science park, a high tech fantasy?: an analysis of the science parks of Greece. Technovation, 22(2), 123-128. doi: http://dx.doi.org/10.1016/S0166-4972(00)00087-0
Barney, J. (1991). Firm Resources and Sustained Competi-tive Advantage. Journal of Management, 17(1), 99-120. doi: 10.1177/014920639101700108
Cao, M., Vonderembse, M. A., Zhang, Q., & Ragu-Nathan, T. S. (2010). Supply chain collaboration: conceptualisation and instrument development. International Journal of Production Research, 48(22), 6613-6635. doi: 10.1080/00207540903349039
Castells, M. (1998). La era de la información: economía, sociedad y cultura (1a Ed. ed.). Madrid: Alianza.
Castells, M., & Hall, P. (1994). Technopoles of the World. London & New York: Routledge.
Cohen, W. M., & Levinthal, D. A. (1990). Absorptive Capacity: A New Perspective on Learning and Innovation. Administrative Science Quarterly, 35(1), 128-152.
Chan, K.-Y. A., Oerlemans, L. A. G., & Pretorius, M. W. (2010). Kno-wledge exchange behaviours of science park firms: the innovation hub case. Technology Analysis & Strategic Management, 22(2), 207-228. doi: 10.1080/09537320903498546
Chandra, A., & Medrano Silva, M. A. (2012). Business Incubation in Chile: Development, Financing and Financial Services. Journal of Te-chnology Management and Innovation, 7(2), 13. doi: 10.4067/s0718-27242012000200001
Deitz, G. D., Tokman, M., Richey, R. G., & Morgan, R. M. (2010). Joint venture stability and cooperation: Direct, indirect and contin-gent effects of resource complementarity and trust. Industrial Marke-ting Management, 39(5), 862-873. doi: http://dx.doi.org/10.1016/j.indmarman.2010.01.003
Dittrich, K., & Duysters, G. (2007). Networking as a Means to Stra-tegy Change: The Case of Open Innovation in Mobile Telephony. Journal of Product Innovation Management, 24(6), 510-521. doi: 10.1111/j.1540-5885.2007.00268.x
Dyer, J. H., & Nobeoka, K. (2000). Creating and managing a high-performance knowledge-sharing network: the Toyota case. Strate-gic Management Journal, 21(3), 345-367. doi: 10.1002/(SICI)1097--0266(200003)21:3<345::AID-SMJ96>3.0.CO;2-N
Dyer, J. H., & Singh, H. (1998). The Relational View: Cooperative Strategy and Sources of Interorganizational Competitive Advanta-ge. Academy of Management Review, 23(4), 660-679. doi: 10.5465/amr.1998.1255632
Etzkowitz, H., de Mello, J. M. C., & Almeida, M. (2005). Towar-ds “meta-innovation” in Brazil: The evolution of the incubator and the emergence of a triple helix. Research Policy, 34(4), 411-424. doi: http://dx.doi.org/10.1016/j.respol.2005.01.011
41
J. Technol. Manag. Innov. 2015. Volume 10, Issue 3
ISSN: 0718-2724. (http://jotmi.org)Journal of Technology Management & Innovation © Universidad Alberto Hurtado, Facultad de Economía y Negocios.
Etzkowitz, H., & Leydesdorff, L. (2000). The dynamics of innovation: from National Systems and “Mode 2” to a Triple Helix of university–industry–government relations. Research Policy, 29(2), 109-123. doi: http://dx.doi.org/10.1016/S0048-7333(99)00055-4
Gray, B. (2008). Intervening to Improve Inter-Organizational Part-nerships. In M. Cropper, M. Ebers, C. Huxman & P. S. Ring (Eds.), The Oxford Handbook of Inter-Organizational Relations. New York: Oxford Press.
Groen, A. J. (2005). Knowledge intensive entrepreneurship in ne-tworks: Towards a Multi-Level/Multi Dimensional Approach. Journal of Enterprising Culture, 13(01), 69-88. doi: doi:10.1142/S0218495805000069
Hair, J., Black, W. C., Babin, B. J., & Anderson, R. E. (2009). Multiva-riate Data Analysis (7th Ed ed.): Prentice Hall.
Hair, J., Sarstedt, M., Ringle, C., & Mena, J. (2012). An assessment of the use of partial least squares structural equation modeling in ma-rketing research. Journal of the Academy of Marketing Science, 40(3), 414-433. doi: 10.1007/s11747-011-0261-6
Hansson, F., Husted, K., & Vestergaard, J. (2005). Second generation science parks: from structural holes jockeys to social capital catalysts of the knowledge society. Technovation, 25(9), 1039-1049. doi: http://dx.doi.org/10.1016/j.technovation.2004.03.003
Hu, T.-S., Lin, C.-Y., & Chang, S.-L. (2005). Technology-based regio-nal development strategies and the emergence of technological com-munities: a case study of HSIP, Taiwan. Technovation, 25(4), 367-380. doi: http://dx.doi.org/10.1016/j.technovation.2003.09.002
Human, S. E., & Provan, K. G. (1997). An Emergent Theory of Struc-ture and Outcomes in Small-Firm Strategic Manufacturing Networks. Academy of Management Journal, 40(2), 368-403. doi: 10.2307/256887
Ili, S., Albers, A., & Miller, S. (2010). Open innovation in the automo-tive industry. R&D Management, 40(3), 246-255. doi: 10.1111/j.1467--9310.2010.00595.x
Kihlgren, A. (2003). Promotion of innovation activity in Russia throu-gh the creation of science parks: the case of St. Petersburg (1992–1998). Technovation, 23(1), 65-76. doi: http://dx.doi.org/10.1016/S0166-4972(01)00077-3
Kline, R. B. (1998). Principles and Practice of Structural Equation Mo-deling. New York: Guilford Press.
Ku, Y. L., Liau, S.-J., & Hsing, W.-C. (2005). The high-tech milieu and innovation-oriented development. Technovation, 25(2), 145-153. doi: http://dx.doi.org/10.1016/S0166-4972(03)00074-9
Lahorgue, M. A. (2004). Pólos, Parques e Incubadora. Brasilia: Anpro-tec/Sebrae.
Lindelöf, P., & Löfsten, H. (2003). Science Park Location and New Technology-Based Firms in Sweden – Implications for Strategy and Performance. Small Business Economics, 20(3), 245-258. doi: 10.1023/A:1022861823493
Löfsten, H., & Lindelöf, P. (2005). R&D networks and product innovation patterns—academic and non-academic new technology -based firms on Science Parks. Technovation, 25(9), 1025-1037. doi:http://dx.doi.org/10.1016/j.technovation.2004.02.007
Malairaja, C., & Zawdie, G. (2008). Science parks and university–in-dustry collaboration in Malaysia. Technology Analysis & Strategic Ma-nagement, 20(6), 727-739. doi: 10.1080/09537320802426432
Massey, D., Quintas, P., & Wield, D. (1992). High Tech Fantasies: Science Parks in Society, Science and Space. London: Routledge.
Nelson, R. R. (1988). Preface to Part V: National systems of innova-tion. In G. Dosi, R. Freeman, R. Nelson & L. Soete (Eds.), Technical Change and Economic Theory. London: Pinter Pub Ltd.
Nonaka, I. (1994). A Dynamic Theory of Organizational Know-ledge Creation. Organization Science, 5(1), 14-37. doi: doi:10.1287/orsc.5.1.14
Nooteboom, B. (2007). Social capital, institutions and trust. Review of So-cial Economy, 65(1), 29-53. doi: 10.1080/00346760601132154
Nooteboom, B. (2008). Learning and Innovation in Inter-organizatio-nal Relationships. In M. Cropper, M. Ebers, C. Huxman & P. S. Ring (Eds.), The Oxford Handbook of Inter-Organizational Relations. New York: Oxford Press.
Nooteboom, B., Van Haverbeke, W., Duysters, G., Gilsing, V., & van den Oord, A. (2007). Optimal cognitive distance and absorp-tive capacity. Research Policy, 36(7), 1016-1034. doi: http://dx.doi. org/10.1016/j.respol.2007.04.003
Oakey, R. (2007). Clustering and the R&D management of high-tech-nology small firms: in theory and practice. R&D Management, 37(3), 237-248. doi: 10.1111/j.1467-9310.2007.00472.x
Oliver, C. (1990). Determinants of Interorganizational Relationships: Integration and Future Directions. Academy of Management Review, 15(2), 241-265. doi: 10.5465/amr.1990.4308156
Phillimore, J. (1999). Beyond the linear view of innovation in science park evaluation An analysis of Western Australian Technology Park. Technovation, 19(11), 673-680. doi: http://dx.doi.org/10.1016/S0166-4972(99)00062-0
Podsakoff, P. M., MacKenzie, S. B., Lee, J.-Y., & Podsakoff, N. P. (2003). Common method biases in behavioral research: A critical re-view of the literature and recommended remedies. Journal of Applied Psychology, 88(5), 879-903. doi: 10.1037/0021-9010.88.5.879
42
J. Technol. Manag. Innov. 2015. Volume 10, Issue 3
ISSN: 0718-2724. (http://jotmi.org)Journal of Technology Management & Innovation © Universidad Alberto Hurtado, Facultad de Economía y Negocios.
Powell, W. W., Koput, K. W., & Smith-Doerr, L. (1996). Interorganizatio-nal Collaboration and the Locus of Innovation: Networks of Learning in Biotechnology. Administrative Science Quarterly, 41(1), 116-145.
Radosevic, S., & Myrzakhmet, M. (2009). Between vision and reality: Promoting innovation through technoparks in an emerging economy. Technovation, 29(10), 645-656. doi: http://dx.doi.org/10.1016/j.tech-novation.2009.04.001
Richardson, G. B. (2003). The Organization of Industry Re-visited. Pa-per presented at the DRUID Summer Conference, Copenhagen.
Tan, J. (2006). Growth of industry clusters and innovation: Les-sons from Beijing Zhongguancun Science Park. Journal of Business Venturing, 21(6), 827-850. doi: http://dx.doi.org/10.1016/j.jbus-vent.2005.06.006
Tötterman, H., & Sten, J. (2005). Start-ups: Business Incubation and Social Capital. International Small Business Journal, 23(5), 487-511. doi: 10.1177/0266242605055909
Vedovello, C. (1997). Science parks and university-industry interac-tion: Geographical proximity between the agents as a driving force. Technovation, 17(9), 491-531. doi: http://dx.doi.org/10.1016/S0166-4972(97)00027-8
Watkins-Mathys, L., & Foster, M. J. (2006). Entrepreneurship: the missing ingredient in China’s STIPs? Entrepreneurship & Regional Development, 18(3), 249-274. doi: 10.1080/08985620600593161
Westhead, P. (1997). R&D ‘inputs’ and ‘outputs’ of technology-based firms located on and off Science Parks. R&D Management, 27(1), 45-62. doi: 10.1111/1467-9310.00041
Wittmann, C. M., Hunt, S. D., & Arnett, D. B. (2009). Explaining alliance success: Competences, resources, relational factors, and re-source-advantage theory. Industrial Marketing Management, 38(7), 743-756. doi: http://dx.doi.org/10.1016/j.indmarman.2008.02.007
Woolthuis, R. K., Hillebrand, B., & Nooteboom, B. (2005). Trust, Contract and Relationship Development. Organization Studies, 26(6), 813-840. doi: 10.1177/0170840605054594
Zaheer, A., McEvily, B., & Perrone, V. (1998). Does Trust Matter? Ex-ploring the Effects of Interorganizational and Interpersonal Trust on Performance. Organization Science, 9(2), 141-159. doi:10.1287/orsc.9.2.141
Zollo, M., Reuer, J. J., & Singh, H. (2002). Interorganizational Rou-tines and Performance in Strategic Alliances. Organization Science, 13(6), 701-713. doi:10.1287/orsc.13.6.701.503
(Endnotes)i International Association of Science Parks and Areas of Innovation (www.iasp.ws). ii Associação Nacional de Entidades Promotoras de Empreendimentos Inovadores (www.anprotec.org.br).
43
ISSN: 0718-2724. (http://jotmi.org)Journal of Technology Management & Innovation © Universidad Alberto Hurtado, Facultad de Economía y Negocios.
J. Technol. Manag. Innov. 2015. Volume 10, Issue 3
Sources of Innovation: The Case of Portuguese Consultancy Sector
Marisa Cesário 1, Silvia Fernandes 1*, Bruno Jesus 1, José Monteiro Barata 2
Abstract: This study addresses the effects of external environments on types of innovation introduced by Portuguese consultancy firms (PCs) in computer, technical, and management areas. It distinguishes the most determinant factors for innovation regarding product, process, organization, and marketing. The assessment framework followed three steps: 1) evaluation of propensity to use external sources of information and cooperation with agents, 2) identification of factors used most often during innovation, and 3) derivation of profiles of firms under study. The method gener-ated tree-based classification models that segmented the sample into innovative and non-innovative firms, and distinct profiles that emphasized specificities concerning use of external sources and agents for innovation.
Keywords: innovation; information sources; cooperation; consultancy; CHAID technique; profiles.
Submitted August 10th 2015 / Approved October 7th 2015
Introduction
In modern dynamic economies consultancy enterprises have achieved strong innovative influence (Kieser, 2002). They increasingly ac-knowledge that change is not only important, but also compulsory since they constantly face fast-changing markets. As knowledge-in-tensive firms (Armbrüster, 2006; Empson, 2001; Morris, 2001) they provide a stream of innovations to several agents who need expert knowledge to face business challenges (McKenna, 2006). Portuguese consultancies (PCs) consist of multinationals (with large national/international customers) and small or medium-sized firms whose cli-ents are national. Products from this industry are diverse and possess properties of intangible knowledge (Oliveira & Barata, 2006). Strong interactions between providers and consumers arise, where each transaction is tailored to customers’ needs. Thus PCs can help firms identify innovation initiatives (Back, et. al., 2014), turning these com-panies an interesting ecosystem to study innovation processes. Most studies about innovation in Portugal have focused more on prod-uct and process innovations than service innovations (Costa, et. al., 2014). Our work contributes to fill a gap in the literature as we include organizational and marketing types, which are more effective ways of innovating business models and services (Amshoff, et. al., 2015). The purpose of this study is to address the effect of external environments on PCs innovation, analyzing which information sources or cooper-ation agents most stimulate it. The analysis is divided into four types – product, process, organization, and marketing innovation – making this study distinct from studies that use broad conceptualizations ofinnovation.
PCs innovation ecosystem
A framework for appraising PCs innovation is needed due to the diversity of concepts consultants create. They create demand for their services by introducing new management tools and practices (Huczynski, 1993; Sturdy, 1997), which include customer service excellence, service portfolios, techniques of quality management, balanced scorecard, among others. As soon as an innovation becomes standardized, consultants seek new approaches or solutions to in-troduce it to the market (Abrahamson, 1996; Benders & Veen, 2001; Suddaby & Greenwood, 2001). Due to fast changing technologies and business environments, it is more difficult for enterprises to maintain competitive advantages through in-house R&D alone. Recent work suggests addressing these issues to inform stakeholders about drivers, emergent trends and scenarios (Gallouj, et. al., 2015). A relevant fore-sight is to assess external sources and agents of innovation, their va-riety and effectiveness (Chang, et. al., 2012). PCs must complement internal resources with those from outside, interacting with a broad range of actors (Lundvall 2010; Laursen & Salter 2006; Chesbrough, et. al., 2006). Consultancies can launch a so diverse range of innova-tions (Benders & Veen, 2001; Kieser, 1997; Suddaby & Greenwood, 2001), that this work distinguishes product, process, organizational and marketing types. This classification can address important issues regarding innovation ecosystems, analyzing the influence of different information sources and cooperation initiatives regarding innovation.
This study aims to explore whether PCs complement R&D1 with ex-ternal knowledge. Other studies examine this topic (Cornish, 1997;
1 Faculty of Economics, University of Algarve, Campus de Gambelas, Faro, Portugal. 2 Lisbon School of Economics and Management (ISEG), University of Lisbon, Portugal*Corresponding author: [email protected]
(1) In consultancy, R&D relates to development, integration, outsourcing, following trends (technological, technical, and scientific) to develop or adapt products/services.
44
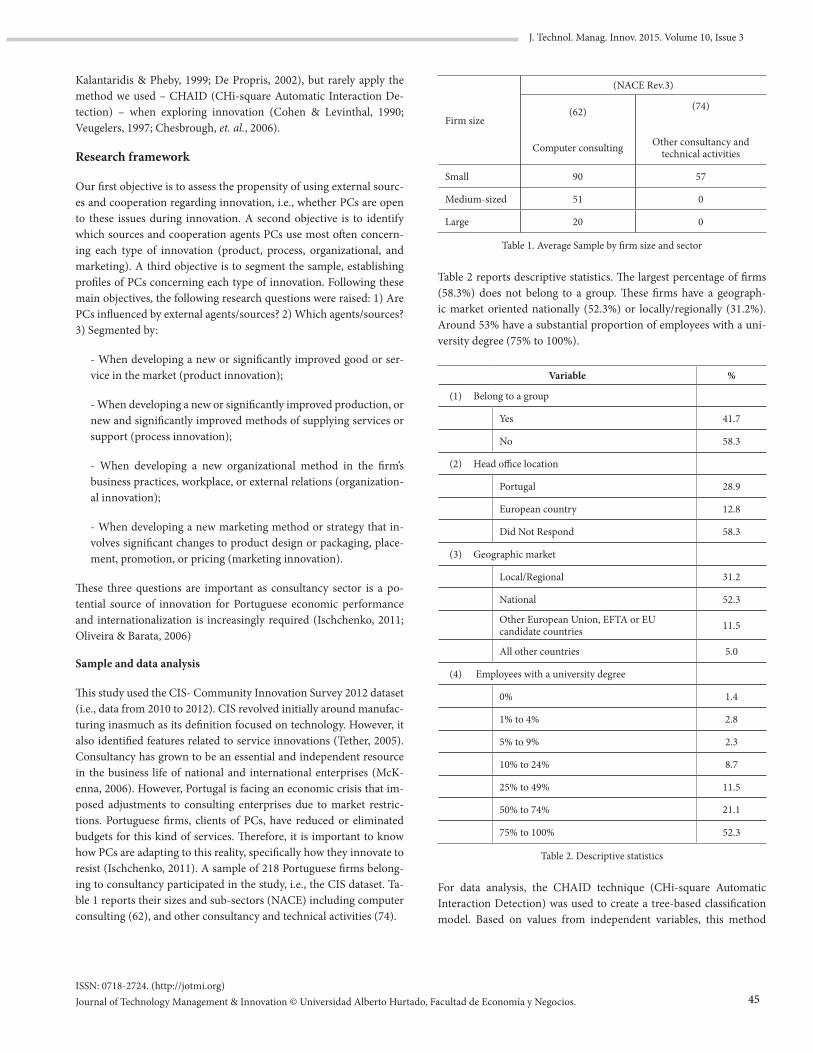
ISSN: 0718-2724. (http://jotmi.org)Journal of Technology Management & Innovation © Universidad Alberto Hurtado, Facultad de Economía y Negocios.
J. Technol. Manag. Innov. 2015. Volume 10, Issue 3
Kalantaridis & Pheby, 1999; De Propris, 2002), but rarely apply the method we used – CHAID (CHi-square Automatic Interaction De-tection) – when exploring innovation (Cohen & Levinthal, 1990; Veugelers, 1997; Chesbrough, et. al., 2006).
Research framework
Our first objective is to assess the propensity of using external sourc-es and cooperation regarding innovation, i.e., whether PCs are open to these issues during innovation. A second objective is to identify which sources and cooperation agents PCs use most often concern-ing each type of innovation (product, process, organizational, and marketing). A third objective is to segment the sample, establishing profiles of PCs concerning each type of innovation. Following these main objectives, the following research questions were raised: 1) Are PCs influenced by external agents/sources? 2) Which agents/sources? 3) Segmented by:
- When developing a new or significantly improved good or ser-vice in the market (product innovation);
- When developing a new or significantly improved production, or new and significantly improved methods of supplying services or support (process innovation);
- When developing a new organizational method in the firm’s business practices, workplace, or external relations (organization-al innovation);
- When developing a new marketing method or strategy that in-volves significant changes to product design or packaging, place-ment, promotion, or pricing (marketing innovation).
These three questions are important as consultancy sector is a po-tential source of innovation for Portuguese economic performance and internationalization is increasingly required (Ischchenko, 2011; Oliveira & Barata, 2006)
Sample and data analysis
This study used the CIS- Community Innovation Survey 2012 dataset (i.e., data from 2010 to 2012). CIS revolved initially around manufac-turing inasmuch as its definition focused on technology. However, it also identified features related to service innovations (Tether, 2005). Consultancy has grown to be an essential and independent resource in the business life of national and international enterprises (McK-enna, 2006). However, Portugal is facing an economic crisis that im-posed adjustments to consulting enterprises due to market restric-tions. Portuguese firms, clients of PCs, have reduced or eliminated budgets for this kind of services. Therefore, it is important to know how PCs are adapting to this reality, specifically how they innovate to resist (Ischchenko, 2011). A sample of 218 Portuguese firms belong-ing to consultancy participated in the study, i.e., the CIS dataset. Ta-ble 1 reports their sizes and sub-sectors (NACE) including computer consulting (62), and other consultancy and technical activities (74).
Firm size
(NACE Rev.3)
(62)
Computer consulting
(74)
Other consultancy and technical activities
Small 90 57
Medium-sized 51 0
Large 20 0
Table 1. Average Sample by firm size and sector
Table 2 reports descriptive statistics. The largest percentage of firms (58.3%) does not belong to a group. These firms have a geograph-ic market oriented nationally (52.3%) or locally/regionally (31.2%). Around 53% have a substantial proportion of employees with a uni-versity degree (75% to 100%).
Variable %
(1) Belong to a group
Yes 41.7
No 58.3
(2) Head office location
Portugal 28.9
European country 12.8
Did Not Respond 58.3
(3) Geographic market
Local/Regional 31.2
National 52.3
Other European Union, EFTA or EU candidate countries 11.5
All other countries 5.0
(4) Employees with a university degree
0% 1.4
1% to 4% 2.8
5% to 9% 2.3
10% to 24% 8.7
25% to 49% 11.5
50% to 74% 21.1
75% to 100% 52.3
Table 2. Descriptive statistics
For data analysis, the CHAID technique (CHi-square Automatic Interaction Detection) was used to create a tree-based classification model. Based on values from independent variables, this method
45
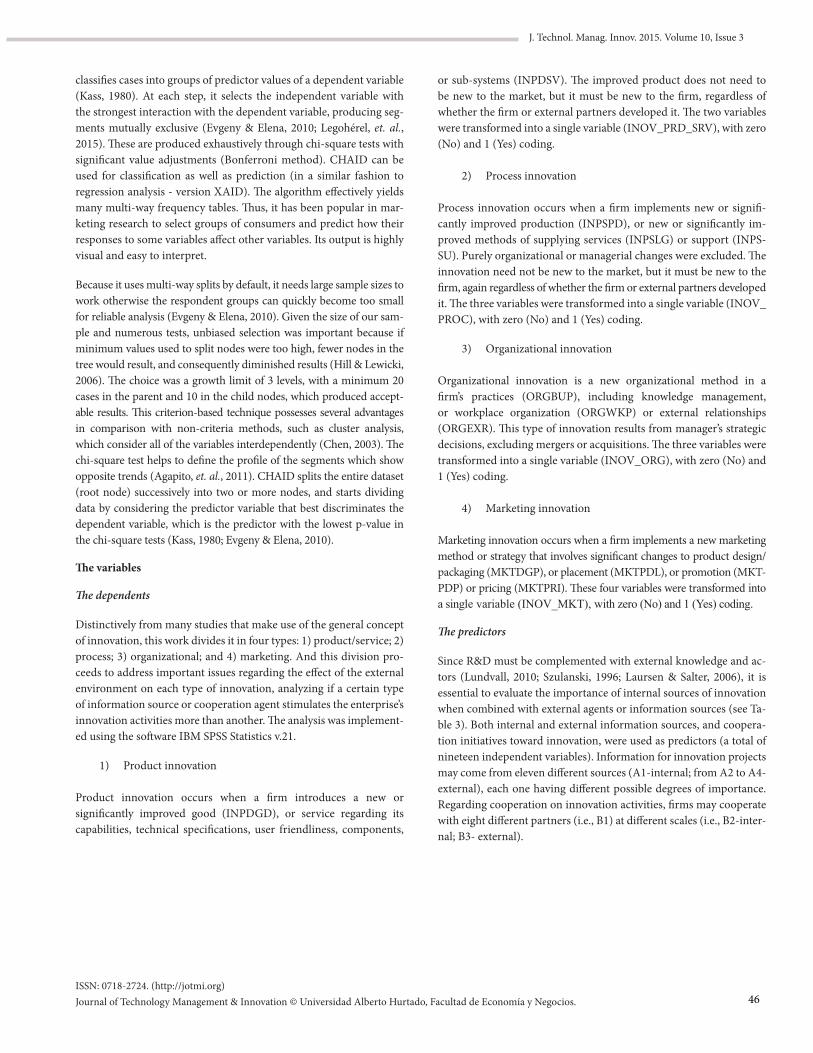
ISSN: 0718-2724. (http://jotmi.org)Journal of Technology Management & Innovation © Universidad Alberto Hurtado, Facultad de Economía y Negocios.
J. Technol. Manag. Innov. 2015. Volume 10, Issue 3
or sub-systems (INPDSV). The improved product does not need to be new to the market, but it must be new to the firm, regardless of whether the firm or external partners developed it. The two variables were transformed into a single variable (INOV_PRD_SRV), with zero (No) and 1 (Yes) coding.
2) Process innovation
Process innovation occurs when a firm implements new or signifi-cantly improved production (INPSPD), or new or significantly im-proved methods of supplying services (INPSLG) or support (INPS-SU). Purely organizational or managerial changes were excluded. The innovation need not be new to the market, but it must be new to the firm, again regardless of whether the firm or external partners developed it. The three variables were transformed into a single variable (INOV_PROC), with zero (No) and 1 (Yes) coding.
3) Organizational innovation
Organizational innovation is a new organizational method in a firm’s practices (ORGBUP), including knowledge management, or workplace organization (ORGWKP) or external relationships (ORGEXR). This type of innovation results from manager’s strategic decisions, excluding mergers or acquisitions. The three variables were transformed into a single variable (INOV_ORG), with zero (No) and 1 (Yes) coding.
4) Marketing innovation
Marketing innovation occurs when a firm implements a new marketing method or strategy that involves significant changes to product design/packaging (MKTDGP), or placement (MKTPDL), or promotion (MKT-PDP) or pricing (MKTPRI). These four variables were transformed into a single variable (INOV_MKT), with zero (No) and 1 (Yes) coding.
The predictors
Since R&D must be complemented with external knowledge and ac-tors (Lundvall, 2010; Szulanski, 1996; Laursen & Salter, 2006), it is essential to evaluate the importance of internal sources of innovation when combined with external agents or information sources (see Ta-ble 3). Both internal and external information sources, and coopera-tion initiatives toward innovation, were used as predictors (a total of nineteen independent variables). Information for innovation projects may come from eleven different sources (A1-internal; from A2 to A4- external), each one having different possible degrees of importance. Regarding cooperation on innovation activities, firms may cooperate with eight different partners (i.e., B1) at different scales (i.e., B2-inter-nal; B3- external).
classifies cases into groups of predictor values of a dependent variable (Kass, 1980). At each step, it selects the independent variable with the strongest interaction with the dependent variable, producing seg-ments mutually exclusive (Evgeny & Elena, 2010; Legohérel, et. al., 2015). These are produced exhaustively through chi-square tests with significant value adjustments (Bonferroni method). CHAID can be used for classification as well as prediction (in a similar fashion to regression analysis - version XAID). The algorithm effectively yields many multi-way frequency tables. Thus, it has been popular in mar-keting research to select groups of consumers and predict how their responses to some variables affect other variables. Its output is highly visual and easy to interpret.
Because it uses multi-way splits by default, it needs large sample sizes to work otherwise the respondent groups can quickly become too small for reliable analysis (Evgeny & Elena, 2010). Given the size of our sam-ple and numerous tests, unbiased selection was important because if minimum values used to split nodes were too high, fewer nodes in the tree would result, and consequently diminished results (Hill & Lewicki, 2006). The choice was a growth limit of 3 levels, with a minimum 20 cases in the parent and 10 in the child nodes, which produced accept-able results. This criterion-based technique possesses several advantages in comparison with non-criteria methods, such as cluster analysis, which consider all of the variables interdependently (Chen, 2003). The chi-square test helps to define the profile of the segments which show opposite trends (Agapito, et. al., 2011). CHAID splits the entire dataset (root node) successively into two or more nodes, and starts dividing data by considering the predictor variable that best discriminates the dependent variable, which is the predictor with the lowest p-value in the chi-square tests (Kass, 1980; Evgeny & Elena, 2010).
The variables
The dependents
Distinctively from many studies that make use of the general concept of innovation, this work divides it in four types: 1) product/service; 2) process; 3) organizational; and 4) marketing. And this division pro-ceeds to address important issues regarding the effect of the external environment on each type of innovation, analyzing if a certain type of information source or cooperation agent stimulates the enterprise’s innovation activities more than another. The analysis was implement-ed using the software IBM SPSS Statistics v.21.
1) Product innovation
Product innovation occurs when a firm introduces a new or significantly improved good (INPDGD), or service regarding its capabilities, technical specifications, user friendliness, components,
46
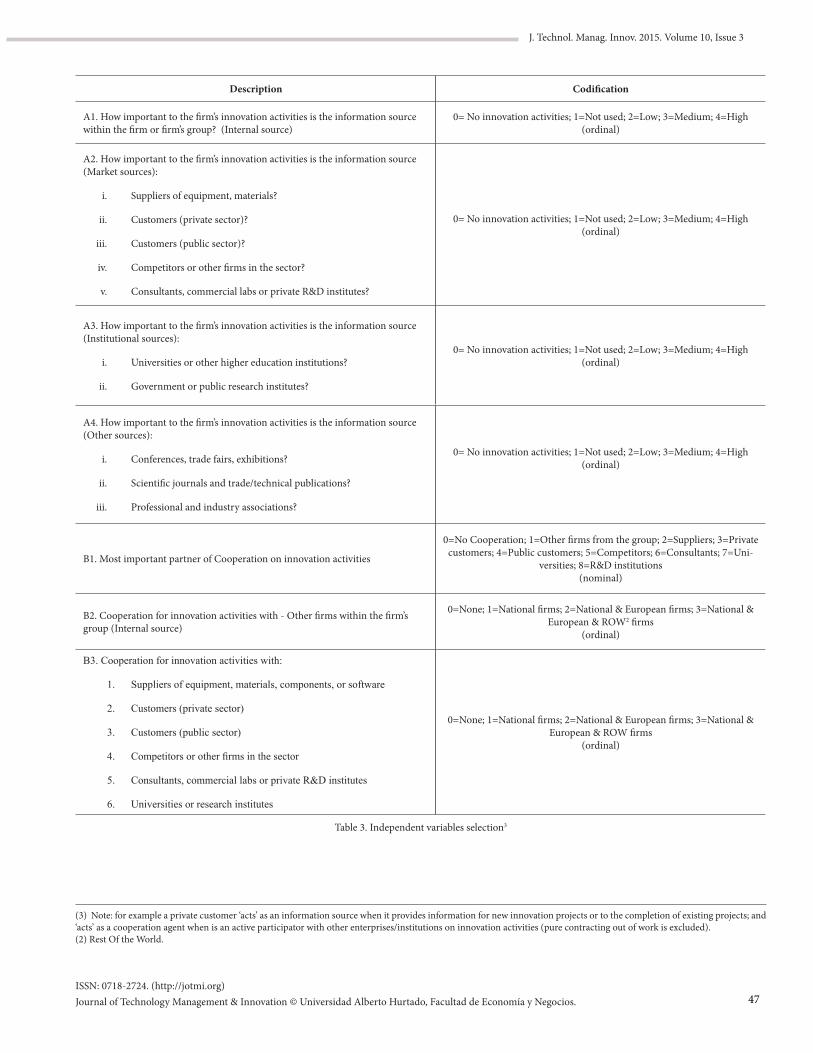
ISSN: 0718-2724. (http://jotmi.org)Journal of Technology Management & Innovation © Universidad Alberto Hurtado, Facultad de Economía y Negocios.
J. Technol. Manag. Innov. 2015. Volume 10, Issue 3
Description Codification
A1. How important to the firm’s innovation activities is the information source within the firm or firm’s group? (Internal source)
0= No innovation activities; 1=Not used; 2=Low; 3=Medium; 4=High(ordinal)
A2. How important to the firm’s innovation activities is the information source (Market sources):
i. Suppliers of equipment, materials?
ii. Customers (private sector)?
iii. Customers (public sector)?
iv. Competitors or other firms in the sector?
v. Consultants, commercial labs or private R&D institutes?
0= No innovation activities; 1=Not used; 2=Low; 3=Medium; 4=High(ordinal)
A3. How important to the firm’s innovation activities is the information source (Institutional sources):
i. Universities or other higher education institutions?
ii. Government or public research institutes?
0= No innovation activities; 1=Not used; 2=Low; 3=Medium; 4=High(ordinal)
A4. How important to the firm’s innovation activities is the information source (Other sources):
i. Conferences, trade fairs, exhibitions?
ii. Scientific journals and trade/technical publications?
iii. Professional and industry associations?
0= No innovation activities; 1=Not used; 2=Low; 3=Medium; 4=High(ordinal)
B1. Most important partner of Cooperation on innovation activities
0=No Cooperation; 1=Other firms from the group; 2=Suppliers; 3=Private customers; 4=Public customers; 5=Competitors; 6=Consultants; 7=Uni-
versities; 8=R&D institutions(nominal)
B2. Cooperation for innovation activities with - Other firms within the firm’s group (Internal source)
0=None; 1=National firms; 2=National & European firms; 3=National & European & ROW2 firms
(ordinal)
B3. Cooperation for innovation activities with:
1. Suppliers of equipment, materials, components, or software
2. Customers (private sector)
3. Customers (public sector)
4. Competitors or other firms in the sector
5. Consultants, commercial labs or private R&D institutes
6. Universities or research institutes
0=None; 1=National firms; 2=National & European firms; 3=National & European & ROW firms
(ordinal)
Table 3. Independent variables selection3
(3) Note: for example a private customer ‘acts’ as an information source when it provides information for new innovation projects or to the completion of existing projects; and ‘acts’ as a cooperation agent when is an active participator with other enterprises/institutions on innovation activities (pure contracting out of work is excluded).(2) Rest Of the World.
47
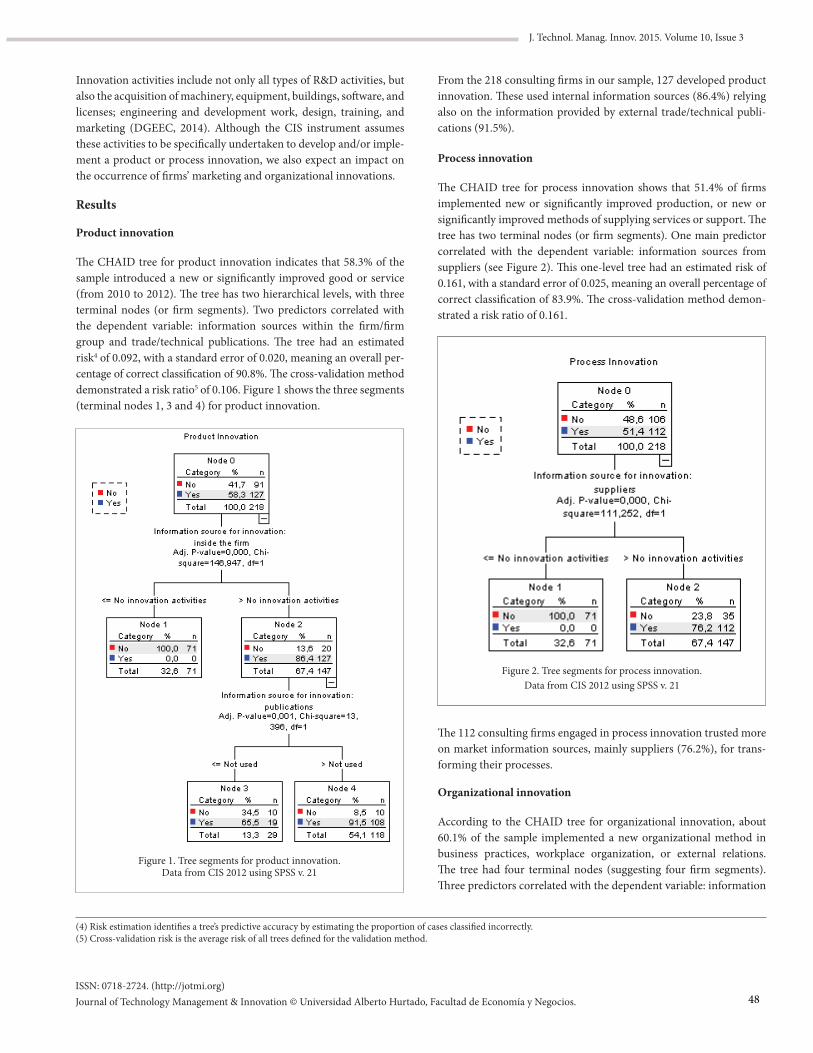
ISSN: 0718-2724. (http://jotmi.org)Journal of Technology Management & Innovation © Universidad Alberto Hurtado, Facultad de Economía y Negocios.
J. Technol. Manag. Innov. 2015. Volume 10, Issue 3
Innovation activities include not only all types of R&D activities, but also the acquisition of machinery, equipment, buildings, software, and licenses; engineering and development work, design, training, and marketing (DGEEC, 2014). Although the CIS instrument assumes these activities to be specifically undertaken to develop and/or imple-ment a product or process innovation, we also expect an impact on the occurrence of firms’ marketing and organizational innovations.
Results
Product innovation
The CHAID tree for product innovation indicates that 58.3% of the sample introduced a new or significantly improved good or service (from 2010 to 2012). The tree has two hierarchical levels, with three terminal nodes (or firm segments). Two predictors correlated with the dependent variable: information sources within the firm/firm group and trade/technical publications. The tree had an estimated risk4 of 0.092, with a standard error of 0.020, meaning an overall per-centage of correct classification of 90.8%. The cross-validation method demonstrated a risk ratio5 of 0.106. Figure 1 shows the three segments (terminal nodes 1, 3 and 4) for product innovation.
(4) Risk estimation identifies a tree’s predictive accuracy by estimating the proportion of cases classified incorrectly.(5) Cross-validation risk is the average risk of all trees defined for the validation method.
From the 218 consulting firms in our sample, 127 developed product innovation. These used internal information sources (86.4%) relying also on the information provided by external trade/technical publi-cations (91.5%).
Process innovation
The CHAID tree for process innovation shows that 51.4% of firms implemented new or significantly improved production, or new or significantly improved methods of supplying services or support. The tree has two terminal nodes (or firm segments). One main predictor correlated with the dependent variable: information sources from suppliers (see Figure 2). This one-level tree had an estimated risk of 0.161, with a standard error of 0.025, meaning an overall percentage of correct classification of 83.9%. The cross-validation method demon-strated a risk ratio of 0.161.
Figure 2. Tree segments for process innovation. Data from CIS 2012 using SPSS v. 21
The 112 consulting firms engaged in process innovation trusted more on market information sources, mainly suppliers (76.2%), for trans-forming their processes.
Organizational innovation
According to the CHAID tree for organizational innovation, about 60.1% of the sample implemented a new organizational method in business practices, workplace organization, or external relations. The tree had four terminal nodes (suggesting four firm segments). Three predictors correlated with the dependent variable: information
Figure 1. Tree segments for product innovation. Data from CIS 2012 using SPSS v. 21
48
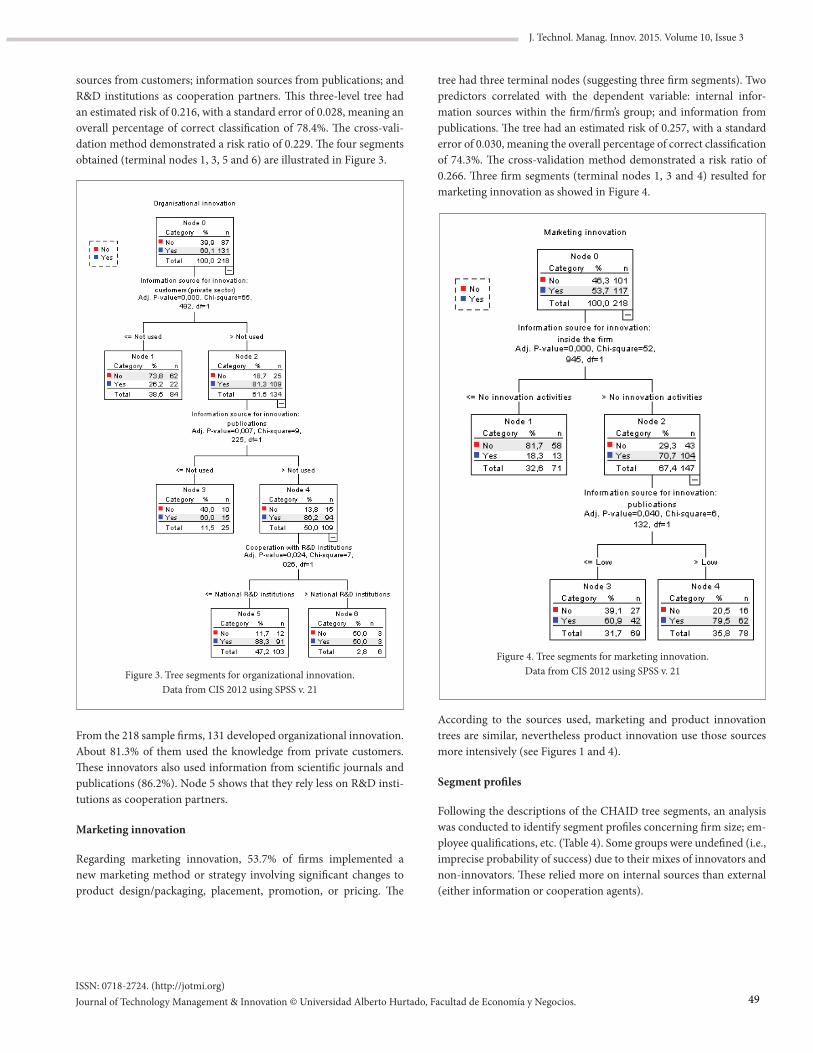
ISSN: 0718-2724. (http://jotmi.org)Journal of Technology Management & Innovation © Universidad Alberto Hurtado, Facultad de Economía y Negocios.
J. Technol. Manag. Innov. 2015. Volume 10, Issue 3
sources from customers; information sources from publications; and R&D institutions as cooperation partners. This three-level tree had an estimated risk of 0.216, with a standard error of 0.028, meaning an overall percentage of correct classification of 78.4%. The cross-vali-dation method demonstrated a risk ratio of 0.229. The four segments obtained (terminal nodes 1, 3, 5 and 6) are illustrated in Figure 3.
Figure 3. Tree segments for organizational innovation. Data from CIS 2012 using SPSS v. 21
From the 218 sample firms, 131 developed organizational innovation. About 81.3% of them used the knowledge from private customers. These innovators also used information from scientific journals and publications (86.2%). Node 5 shows that they rely less on R&D insti-tutions as cooperation partners.
Marketing innovation
Regarding marketing innovation, 53.7% of firms implemented a new marketing method or strategy involving significant changes to product design/packaging, placement, promotion, or pricing. The
tree had three terminal nodes (suggesting three firm segments). Two predictors correlated with the dependent variable: internal infor-mation sources within the firm/firm’s group; and information from publications. The tree had an estimated risk of 0.257, with a standard error of 0.030, meaning the overall percentage of correct classification of 74.3%. The cross-validation method demonstrated a risk ratio of 0.266. Three firm segments (terminal nodes 1, 3 and 4) resulted for marketing innovation as showed in Figure 4.
According to the sources used, marketing and product innovation trees are similar, nevertheless product innovation use those sources more intensively (see Figures 1 and 4).
Segment profiles
Following the descriptions of the CHAID tree segments, an analysis was conducted to identify segment profiles concerning firm size; em-ployee qualifications, etc. (Table 4). Some groups were undefined (i.e., imprecise probability of success) due to their mixes of innovators and non-innovators. These relied more on internal sources than external (either information or cooperation agents).
Figure 4. Tree segments for marketing innovation. Data from CIS 2012 using SPSS v. 21
49
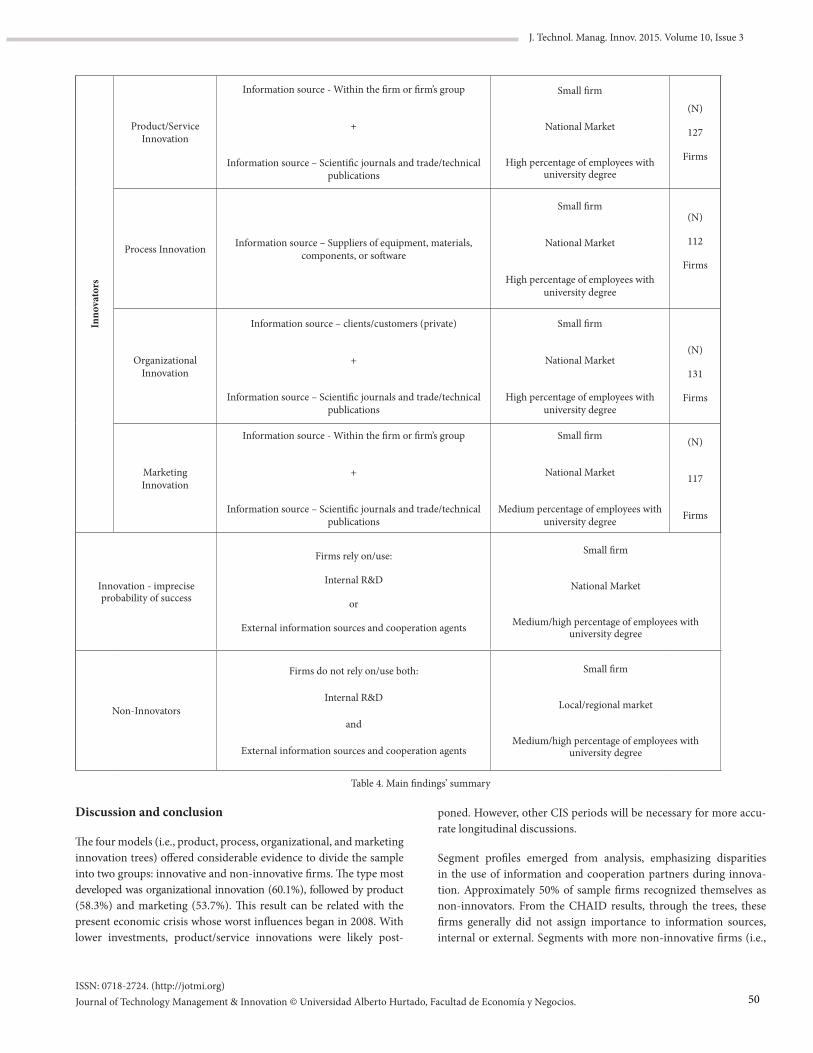
ISSN: 0718-2724. (http://jotmi.org)Journal of Technology Management & Innovation © Universidad Alberto Hurtado, Facultad de Economía y Negocios.
J. Technol. Manag. Innov. 2015. Volume 10, Issue 3
Inno
vato
rs
Product/Service Innovation
Information source - Within the firm or firm’s group
+
Information source – Scientific journals and trade/technical publications
Small firm
National Market
High percentage of employees with university degree
(N)
127
Firms
Process Innovation Information source – Suppliers of equipment, materials, components, or software
Small firm
National Market
High percentage of employees with university degree
(N)
112
Firms
Organizational Innovation
Information source – clients/customers (private)
+
Information source – Scientific journals and trade/technical publications
Small firm
National Market
High percentage of employees with university degree
(N)
131
Firms
Marketing Innovation
Information source - Within the firm or firm’s group
+
Information source – Scientific journals and trade/technical publications
Small firm
National Market
Medium percentage of employees with university degree
(N)
117
Firms
Innovation - imprecise probability of success
Firms rely on/use:
Internal R&D
or
External information sources and cooperation agents
Small firm
National Market
Medium/high percentage of employees with university degree
Non-Innovators
Firms do not rely on/use both:
Internal R&D
and
External information sources and cooperation agents
Small firm
Local/regional market
Medium/high percentage of employees with university degree
Table 4. Main findings’ summary
Discussion and conclusion
The four models (i.e., product, process, organizational, and marketing innovation trees) offered considerable evidence to divide the sample into two groups: innovative and non-innovative firms. The type most developed was organizational innovation (60.1%), followed by product (58.3%) and marketing (53.7%). This result can be related with the present economic crisis whose worst influences began in 2008. With lower investments, product/service innovations were likely post-
poned. However, other CIS periods will be necessary for more accu-rate longitudinal discussions.
Segment profiles emerged from analysis, emphasizing disparities in the use of information and cooperation partners during innova-tion. Approximately 50% of sample firms recognized themselves as non-innovators. From the CHAID results, through the trees, these firms generally did not assign importance to information sources, internal or external. Segments with more non-innovative firms (i.e.,
50
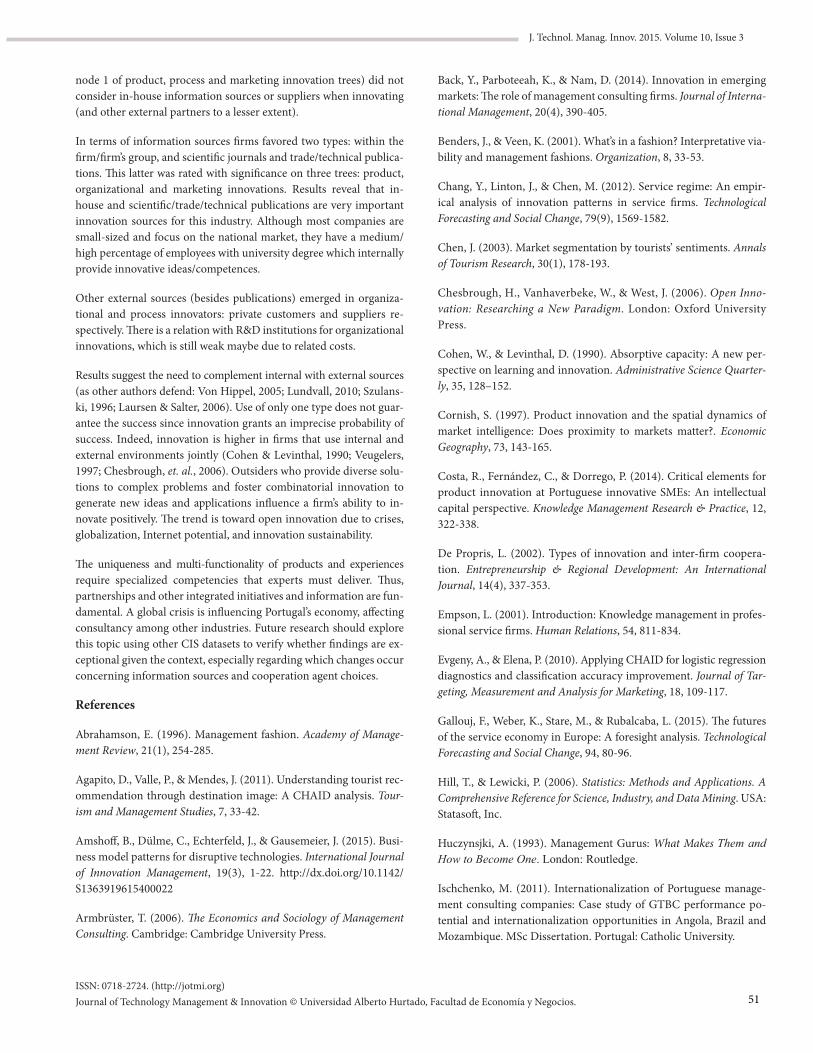
ISSN: 0718-2724. (http://jotmi.org)Journal of Technology Management & Innovation © Universidad Alberto Hurtado, Facultad de Economía y Negocios.
J. Technol. Manag. Innov. 2015. Volume 10, Issue 3
node 1 of product, process and marketing innovation trees) did not consider in-house information sources or suppliers when innovating (and other external partners to a lesser extent).
In terms of information sources firms favored two types: within the firm/firm’s group, and scientific journals and trade/technical publica-tions. This latter was rated with significance on three trees: product, organizational and marketing innovations. Results reveal that in-house and scientific/trade/technical publications are very important innovation sources for this industry. Although most companies are small-sized and focus on the national market, they have a medium/high percentage of employees with university degree which internally provide innovative ideas/competences.
Other external sources (besides publications) emerged in organiza-tional and process innovators: private customers and suppliers re-spectively. There is a relation with R&D institutions for organizational innovations, which is still weak maybe due to related costs.
Results suggest the need to complement internal with external sources (as other authors defend: Von Hippel, 2005; Lundvall, 2010; Szulans-ki, 1996; Laursen & Salter, 2006). Use of only one type does not guar-antee the success since innovation grants an imprecise probability of success. Indeed, innovation is higher in firms that use internal and external environments jointly (Cohen & Levinthal, 1990; Veugelers, 1997; Chesbrough, et. al., 2006). Outsiders who provide diverse solu-tions to complex problems and foster combinatorial innovation to generate new ideas and applications influence a firm’s ability to in-novate positively. The trend is toward open innovation due to crises, globalization, Internet potential, and innovation sustainability.
The uniqueness and multi-functionality of products and experiences require specialized competencies that experts must deliver. Thus, partnerships and other integrated initiatives and information are fun-damental. A global crisis is influencing Portugal’s economy, affecting consultancy among other industries. Future research should explore this topic using other CIS datasets to verify whether findings are ex-ceptional given the context, especially regarding which changes occur concerning information sources and cooperation agent choices.
References
Abrahamson, E. (1996). Management fashion. Academy of Manage-ment Review, 21(1), 254-285.
Agapito, D., Valle, P., & Mendes, J. (2011). Understanding tourist rec-ommendation through destination image: A CHAID analysis. Tour-ism and Management Studies, 7, 33-42.
Amshoff, B., Dülme, C., Echterfeld, J., & Gausemeier, J. (2015). Busi-ness model patterns for disruptive technologies. International Journal of Innovation Management, 19(3), 1-22. http://dx.doi.org/10.1142/S1363919615400022
Armbrüster, T. (2006). The Economics and Sociology of Management Consulting. Cambridge: Cambridge University Press.
Back, Y., Parboteeah, K., & Nam, D. (2014). Innovation in emerging markets: The role of management consulting firms. Journal of Interna-tional Management, 20(4), 390-405.
Benders, J., & Veen, K. (2001). What’s in a fashion? Interpretative via-bility and management fashions. Organization, 8, 33-53.
Chang, Y., Linton, J., & Chen, M. (2012). Service regime: An empir-ical analysis of innovation patterns in service firms. Technological Forecasting and Social Change, 79(9), 1569-1582.
Chen, J. (2003). Market segmentation by tourists’ sentiments. Annals of Tourism Research, 30(1), 178-193.
Chesbrough, H., Vanhaverbeke, W., & West, J. (2006). Open Inno-vation: Researching a New Paradigm. London: Oxford University Press.
Cohen, W., & Levinthal, D. (1990). Absorptive capacity: A new per-spective on learning and innovation. Administrative Science Quarter-ly, 35, 128–152.
Cornish, S. (1997). Product innovation and the spatial dynamics of market intelligence: Does proximity to markets matter?. Economic Geography, 73, 143-165.
Costa, R., Fernández, C., & Dorrego, P. (2014). Critical elements for product innovation at Portuguese innovative SMEs: An intellectual capital perspective. Knowledge Management Research & Practice, 12, 322-338.
De Propris, L. (2002). Types of innovation and inter-firm coopera-tion. Entrepreneurship & Regional Development: An International Journal, 14(4), 337-353.
Empson, L. (2001). Introduction: Knowledge management in profes-sional service firms. Human Relations, 54, 811-834.
Evgeny, A., & Elena, P. (2010). Applying CHAID for logistic regression diagnostics and classification accuracy improvement. Journal of Tar-geting, Measurement and Analysis for Marketing, 18, 109-117.
Gallouj, F., Weber, K., Stare, M., & Rubalcaba, L. (2015). The futures of the service economy in Europe: A foresight analysis. Technological Forecasting and Social Change, 94, 80-96.
Hill, T., & Lewicki, P. (2006). Statistics: Methods and Applications. A Comprehensive Reference for Science, Industry, and Data Mining. USA: Statasoft, Inc.
Huczynsjki, A. (1993). Management Gurus: What Makes Them and How to Become One. London: Routledge.
Ischchenko, M. (2011). Internationalization of Portuguese manage-ment consulting companies: Case study of GTBC performance po-tential and internationalization opportunities in Angola, Brazil and Mozambique. MSc Dissertation. Portugal: Catholic University.
51
ISSN: 0718-2724. (http://jotmi.org)Journal of Technology Management & Innovation © Universidad Alberto Hurtado, Facultad de Economía y Negocios.
J. Technol. Manag. Innov. 2015. Volume 10, Issue 3
Kalantaridis, C., & Pheby, J. (1999). Processes of innovation among manufacturing SMEs: The experience of Bedfordshire. Entrepreneur-ship & Regional Development, 11, 57-78.
Kass, G. (1980). An exploratory technique for investigating large quantities of categorical data. Applied Statistics, 29, 119-127.
Kieser, A. (2002). Managers as marionettes? Using fashion theories to explain the success of consultancies. In M. Kipping & L. Engwall (Eds.), Management Consulting: Emergence and Dynamics of a Knowl-edge Industry (pp. 167-183). London: Oxford University Press.
Kieser, A. (1997). Rhetoric and myth in management fashion. Orga-nization, 4, 49-74.
Laursen, K., & Salter, A. (2006). Open for innovation: The role of openness in explaining innovation performance among UK manu-facturing firms. Strategic Management Journal, 27(2), 131-150.
Legohérel, P., Hsu, C., & Daucé, B. (2015). Variety-seeking: Using the CHAID segmentation approach in analyzing the international travel-er market. Tourism Management, 46, 359-366.
Lundvall, B.A. (2010). National Systems of Innovation: Towards a The-ory of Innovation and Interactive Learning. London: Anthem Press.
Mckenna, C. (2006). The World’s Newest Profession: Management Consulting in the Twentieth Century. Cambridge: Cambridge Univer-sity Press.
Morris, T. (2001). Asserting property rights: Knowledge codification in the professional service firm. Human Relations, 54, 819-838.
Oliveira, M., & Barata, J.M. (2006). Inovação e conhecimento nos serviços: O caso do sector de auditoria e consultoria financeira. XVI Jornadas Luso-Espanholas de Gestão Científica, Évora, Portugal.
Sturdy, A. (1997). The consultancy process: An insecure business?. Journal of Management Studies, 34(3), 389-413.
Suddaby, R., & Greenwood, R. (2001). Colonising knowledge: Com-modification as a dynamic of jurisdictional expansion in professional service firms. Human Relations, 54(7), 933-953.
Szulanski, G. (1996). Exploiting internal stickiness: Impediments to the transfer of the best practice. Strategic Management Journal, 17, 27-43.
Tether, B.S. (2005). Do services innovate (differently)? Insights from the European Innobarometer Survey. Industry and Innovation, 12(2), 153-184.
Veugelers, R. (1997). Internal R&D expenditures and external tech-nology sourcing. Research Policy, 26(3), 303-315.
Von Hippel, E. (2005). Democratizing Innovation. Cambridge: Ed. MIT Press.
52
J. Technol. Manag. Innov. 2015. Volume 10, Issue 3
ISSN: 0718-2724. (http://jotmi.org)Journal of Technology Management & Innovation © Universidad Alberto Hurtado, Facultad de Economía y Negocios.
Socio-Technological Characterization of Goat Industry at Tamarugal Province in Atacama Desert
Sergio Diez-de-Medina R. 1, 2*, Pamela Cabello 1, 2, Juan Carlos Ríos 1, 2, Pablo Figueroa1 , Iván Balic 1, Damien Hardy 3 and Viviana Vrsalovic 1
Abstract: The following article displays a study carried over the goat producers in the northern Tamarugal province in Chile, including the analysis of a survey that characterizes the technical capability of the industry mainly constituted by altiplanean natives communities, exposing the needs that the innovation system requires to be improved in order to boost the generation of added value products useful for project sustainability of these communities. As well, sensitization of the main social breakthroughs is made in order to develop an effective technology transfer to the communities to accomplish this aimed sustainability, through innovative use of the resources.
Keywords: Goat; sustainability; Tamarugal; innovation; Chile; Atacama
Introduction
With a territorial extension of 39,350 Km2 located within Atacama Desert, the province of Tamarugal in Chile base its economy mostly in the ore extraction of minerals such as copper and lithium, indus-try which yields the most important income in the country. Never-theless and facing a sustainable strategy to the local economy, the local government through the innovation fund for competitiveness (FIC) has allowed to Universidad de Los Lagos project the Center for Animal Reproduction (CRAULA) in order to give technical and administrative assistance to the producers of this region. The goat producers of this region belongs mostly to autochthonous Aymará ethnicity and face extreme conditions to breed the livestock, which include the scarcity of precipitations and vegetation. Despite this the Criolla mixed race with marked influence of Saanen and Anglo Nu-bian have shown a good adaptation to the handicaps exposed by the desert, showing yields between 32-78 Kg in females and 50-90 Kg in males (Figueroa et al., 2013). The milk production measured is 78, 6 Kg manually extracted in adult females, letting the animals to be free-ly fed and rationalizing the water for them in the farms, which comes principally from natural wells. The difficulties that the weather add to the production are summed to the geographical isolation that the north of Chile have from centers with economic relevance (1800 Km away from the capital Santiago), and the lack of established slaugh-terhouses which is consider a relevant improvement to do in terms of public policies. Due to these handicaps the producers mainly focus the commercialization of their livestock during 2 main festivities in July and December when the floating population of the region grows, and mobile slaughterhouses are established, trading the meat in form of jerky. Milk production is limited by the conditions and is princi-pally used to produce hand-made cheeses in very small quantities.
Submitted August 26th 2015 / Approved September 30th 2015
1 Universidad de Los Lagos, New business projects unit, Santiago de Chile.2 Universidad de los Lagos, Center for Animal Reproduction (CRAULA). Iquique, Chile.3 Institut de l’élevage, Paris, France. *Corresponding author: [email protected]
Facing these challenges is how CRAULA aims to improve the produc-tion and potentiate the local industry, allowing accessibility to prom-ising markets and performing technology transfer from the university to the local producers (Figueroa et al., 2013). In one hand the cen-ter is installing a laboratory for the diagnosis and assisted breeding including in-vitro fertilization techniques performed by specialized veterinarians and scientists to improve traits such as milk and meat yield (Dubeuf & Boyazoglu, 2009; Oman et al., 1999). On the other side the assistance in commercial issues is performed by a group of consultants from the university who have as goals to assess the needs of the producers to construct a proper strategy to reach markets that can yield more benefits to them, taking in account opportunities for project a multiple product development from the biomass generated each season (Cannarella & Piccioni, 2011).
The first two years of the interaction between the University and the local producers allowed identifying the producer´s needs, including the urgent animal health assistance and the willing of the local pro-ducers to conform commercial community collaboration in order to explode the availability of the renewable source and project the use of resources that are apparently almost completely lost.
The opportunities In long term relies in the recognition of the best individuals adapted to the desert conditions that can be used for the improvement of different races aiming to increase the yield of meat and milk. In middle term the capacitation of local producers and in-habitants of the region for potentiate the treatment and generation of goat derived products including goat cheese, cured leather and wool for shoes, clothes and handcraft, allowing the impulse of a multiple product development (Drejer & Gudmundsson, 2002). In short term, the direct improvement of the sanitary conditions and the catalysis
53
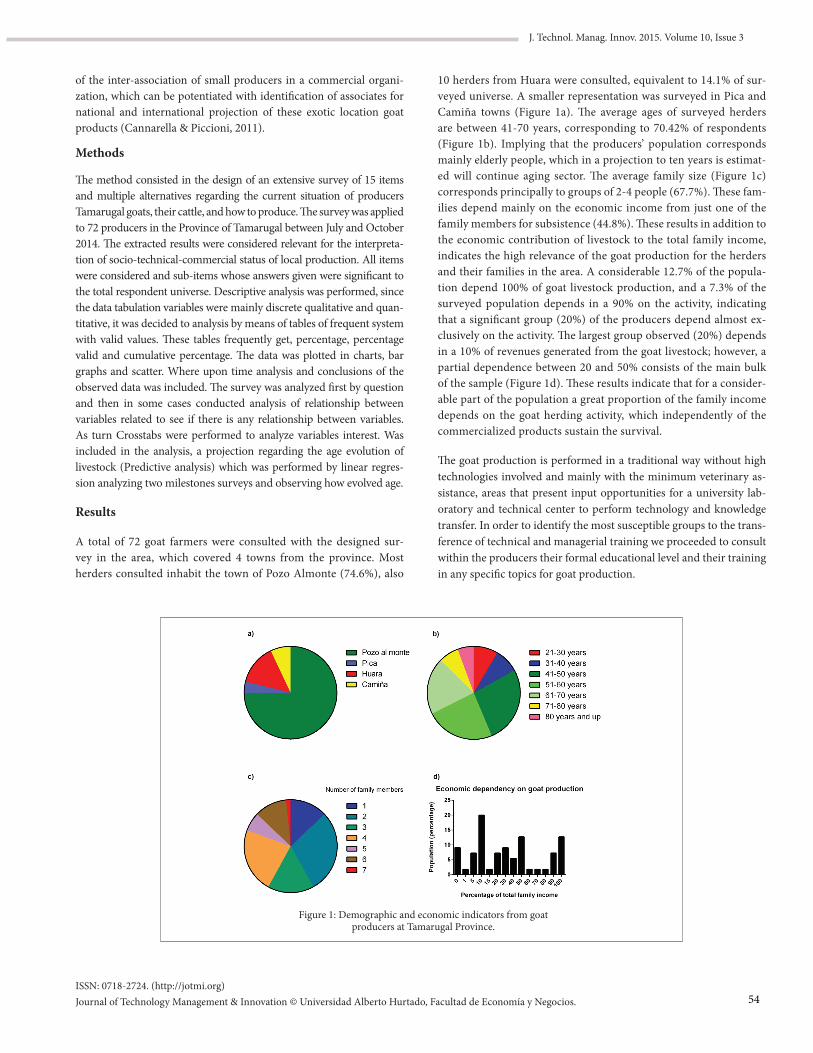
ISSN: 0718-2724. (http://jotmi.org)Journal of Technology Management & Innovation © Universidad Alberto Hurtado, Facultad de Economía y Negocios.
J. Technol. Manag. Innov. 2015. Volume 10, Issue 3
of the inter-association of small producers in a commercial organi-zation, which can be potentiated with identification of associates for national and international projection of these exotic location goat products (Cannarella & Piccioni, 2011).
Methods
The method consisted in the design of an extensive survey of 15 items and multiple alternatives regarding the current situation of producers Tamarugal goats, their cattle, and how to produce. The survey was applied to 72 producers in the Province of Tamarugal between July and October 2014. The extracted results were considered relevant for the interpreta-tion of socio-technical-commercial status of local production. All items were considered and sub-items whose answers given were significant to the total respondent universe. Descriptive analysis was performed, since the data tabulation variables were mainly discrete qualitative and quan-titative, it was decided to analysis by means of tables of frequent system with valid values. These tables frequently get, percentage, percentage valid and cumulative percentage. The data was plotted in charts, bar graphs and scatter. Where upon time analysis and conclusions of the observed data was included. The survey was analyzed first by question and then in some cases conducted analysis of relationship between variables related to see if there is any relationship between variables. As turn Crosstabs were performed to analyze variables interest. Was included in the analysis, a projection regarding the age evolution of livestock (Predictive analysis) which was performed by linear regres-sion analyzing two milestones surveys and observing how evolved age.
Results
A total of 72 goat farmers were consulted with the designed sur-vey in the area, which covered 4 towns from the province. Most herders consulted inhabit the town of Pozo Almonte (74.6%), also
10 herders from Huara were consulted, equivalent to 14.1% of sur-veyed universe. A smaller representation was surveyed in Pica and Camiña towns (Figure 1a). The average ages of surveyed herders are between 41-70 years, corresponding to 70.42% of respondents (Figure 1b). Implying that the producers’ population corresponds mainly elderly people, which in a projection to ten years is estimat-ed will continue aging sector. The average family size (Figure 1c) corresponds principally to groups of 2-4 people (67.7%). These fam-ilies depend mainly on the economic income from just one of the family members for subsistence (44.8%). These results in addition to the economic contribution of livestock to the total family income, indicates the high relevance of the goat production for the herders and their families in the area. A considerable 12.7% of the popula-tion depend 100% of goat livestock production, and a 7.3% of the surveyed population depends in a 90% on the activity, indicating that a significant group (20%) of the producers depend almost ex-clusively on the activity. The largest group observed (20%) depends in a 10% of revenues generated from the goat livestock; however, a partial dependence between 20 and 50% consists of the main bulk of the sample (Figure 1d). These results indicate that for a consider-able part of the population a great proportion of the family income depends on the goat herding activity, which independently of the commercialized products sustain the survival.
The goat production is performed in a traditional way without high technologies involved and mainly with the minimum veterinary as-sistance, areas that present input opportunities for a university lab-oratory and technical center to perform technology and knowledge transfer. In order to identify the most susceptible groups to the trans-ference of technical and managerial training we proceeded to consult within the producers their formal educational level and their training in any specific topics for goat production.
Figure 1: Demographic and economic indicators from goat producers at Tamarugal Province.
54
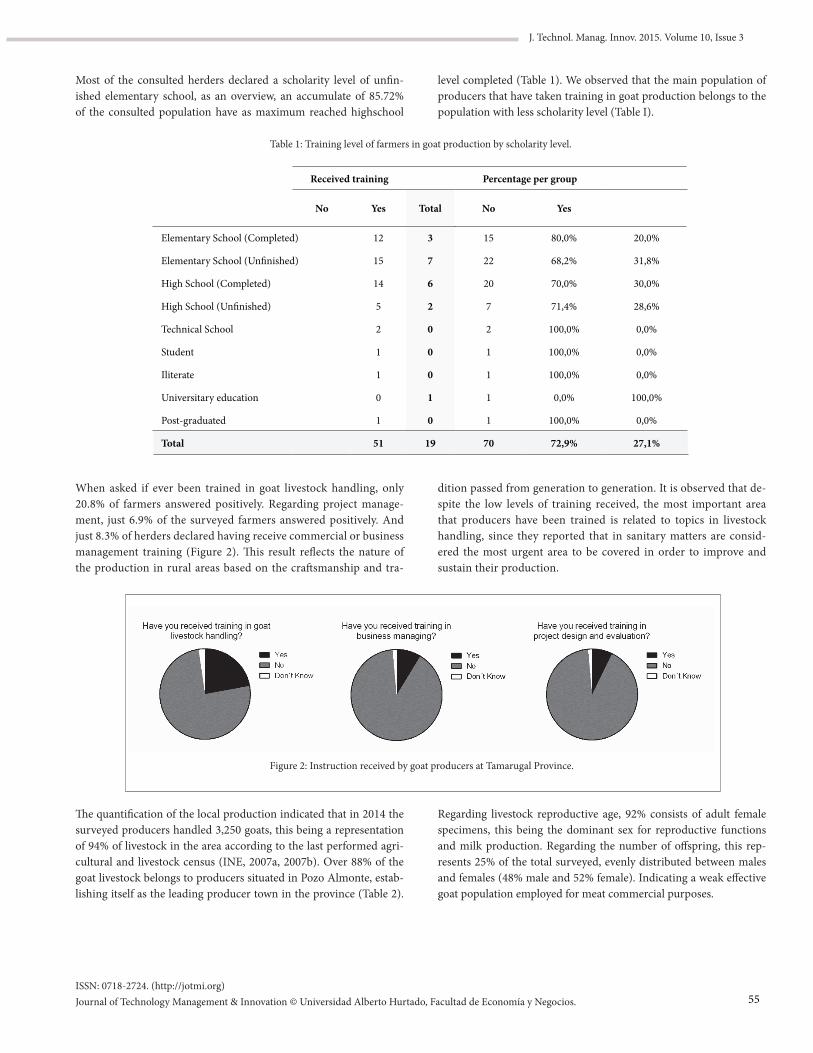
ISSN: 0718-2724. (http://jotmi.org)Journal of Technology Management & Innovation © Universidad Alberto Hurtado, Facultad de Economía y Negocios.
J. Technol. Manag. Innov. 2015. Volume 10, Issue 3
When asked if ever been trained in goat livestock handling, only 20.8% of farmers answered positively. Regarding project manage-ment, just 6.9% of the surveyed farmers answered positively. And just 8.3% of herders declared having receive commercial or business management training (Figure 2). This result reflects the nature of the production in rural areas based on the craftsmanship and tra-
Most of the consulted herders declared a scholarity level of unfin-ished elementary school, as an overview, an accumulate of 85.72% of the consulted population have as maximum reached highschool
level completed (Table 1). We observed that the main population of producers that have taken training in goat production belongs to the population with less scholarity level (Table I).
Table 1: Training level of farmers in goat production by scholarity level.
Received training Percentage per group
No Yes Total No Yes
Elementary School (Completed) 12 3 15 80,0% 20,0%
Elementary School (Unfinished) 15 7 22 68,2% 31,8%
High School (Completed) 14 6 20 70,0% 30,0%
High School (Unfinished) 5 2 7 71,4% 28,6%
Technical School 2 0 2 100,0% 0,0%
Student 1 0 1 100,0% 0,0%
Iliterate 1 0 1 100,0% 0,0%
Universitary education 0 1 1 0,0% 100,0%
Post-graduated 1 0 1 100,0% 0,0%
Total 51 19 70 72,9% 27,1%
dition passed from generation to generation. It is observed that de-spite the low levels of training received, the most important area that producers have been trained is related to topics in livestock handling, since they reported that in sanitary matters are consid-ered the most urgent area to be covered in order to improve and sustain their production.
Figure 2: Instruction received by goat producers at Tamarugal Province.
The quantification of the local production indicated that in 2014 the surveyed producers handled 3,250 goats, this being a representation of 94% of livestock in the area according to the last performed agri-cultural and livestock census (INE, 2007a, 2007b). Over 88% of the goat livestock belongs to producers situated in Pozo Almonte, estab-lishing itself as the leading producer town in the province (Table 2).
Regarding livestock reproductive age, 92% consists of adult female specimens, this being the dominant sex for reproductive functions and milk production. Regarding the number of offspring, this rep-resents 25% of the total surveyed, evenly distributed between males and females (48% male and 52% female). Indicating a weak effective goat population employed for meat commercial purposes.
55
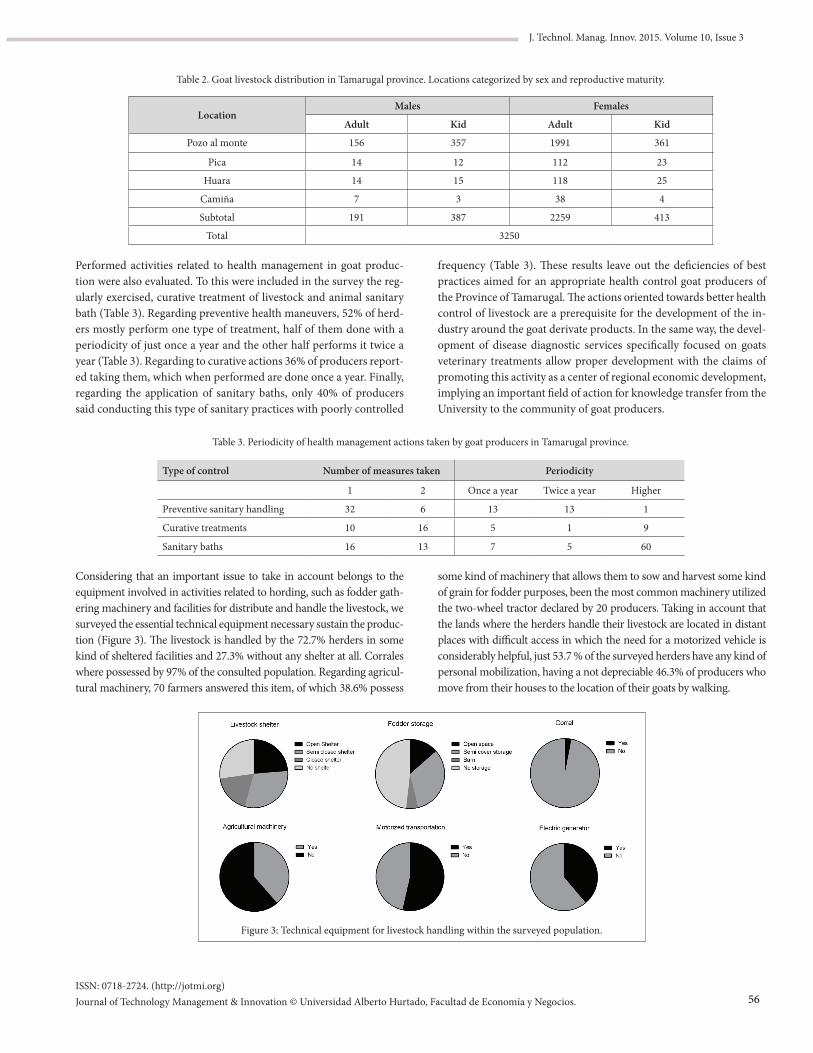
ISSN: 0718-2724. (http://jotmi.org)Journal of Technology Management & Innovation © Universidad Alberto Hurtado, Facultad de Economía y Negocios.
J. Technol. Manag. Innov. 2015. Volume 10, Issue 3
Table 2. Goat livestock distribution in Tamarugal province. Locations categorized by sex and reproductive maturity.
LocationMales Females
Adult Kid Adult Kid
Pozo al monte 156 357 1991 361
Pica 14 12 112 23
Huara 14 15 118 25
Camiña 7 3 38 4
Subtotal 191 387 2259 413
Total 3250
Figure 3: Technical equipment for livestock handling within the surveyed population.
Performed activities related to health management in goat produc-tion were also evaluated. To this were included in the survey the reg-ularly exercised, curative treatment of livestock and animal sanitary bath (Table 3). Regarding preventive health maneuvers, 52% of herd-ers mostly perform one type of treatment, half of them done with a periodicity of just once a year and the other half performs it twice a year (Table 3). Regarding to curative actions 36% of producers report-ed taking them, which when performed are done once a year. Finally, regarding the application of sanitary baths, only 40% of producers said conducting this type of sanitary practices with poorly controlled
frequency (Table 3). These results leave out the deficiencies of best practices aimed for an appropriate health control goat producers of the Province of Tamarugal. The actions oriented towards better health control of livestock are a prerequisite for the development of the in-dustry around the goat derivate products. In the same way, the devel-opment of disease diagnostic services specifically focused on goats veterinary treatments allow proper development with the claims of promoting this activity as a center of regional economic development, implying an important field of action for knowledge transfer from the University to the community of goat producers.
Table 3. Periodicity of health management actions taken by goat producers in Tamarugal province.
Type of control Number of measures taken Periodicity
1 2 Once a year Twice a year Higher
Preventive sanitary handling 32 6 13 13 1
Curative treatments 10 16 5 1 9
Sanitary baths 16 13 7 5 60
Considering that an important issue to take in account belongs to the equipment involved in activities related to hording, such as fodder gath-ering machinery and facilities for distribute and handle the livestock, we surveyed the essential technical equipment necessary sustain the produc-tion (Figure 3). The livestock is handled by the 72.7% herders in some kind of sheltered facilities and 27.3% without any shelter at all. Corrales where possessed by 97% of the consulted population. Regarding agricul-tural machinery, 70 farmers answered this item, of which 38.6% possess
some kind of machinery that allows them to sow and harvest some kind of grain for fodder purposes, been the most common machinery utilized the two-wheel tractor declared by 20 producers. Taking in account that the lands where the herders handle their livestock are located in distant places with difficult access in which the need for a motorized vehicle is considerably helpful, just 53.7 % of the surveyed herders have any kind of personal mobilization, having a not depreciable 46.3% of producers who move from their houses to the location of their goats by walking.
56
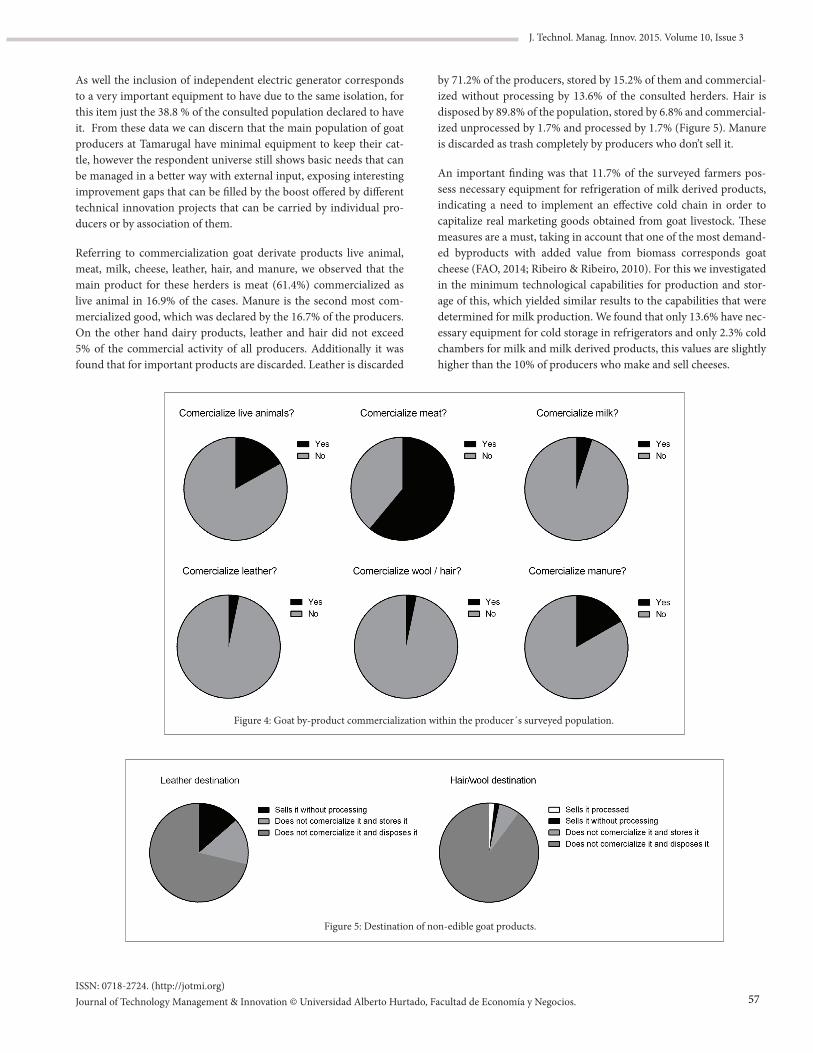
ISSN: 0718-2724. (http://jotmi.org)Journal of Technology Management & Innovation © Universidad Alberto Hurtado, Facultad de Economía y Negocios.
J. Technol. Manag. Innov. 2015. Volume 10, Issue 3
As well the inclusion of independent electric generator corresponds to a very important equipment to have due to the same isolation, for this item just the 38.8 % of the consulted population declared to have it. From these data we can discern that the main population of goat producers at Tamarugal have minimal equipment to keep their cat-tle, however the respondent universe still shows basic needs that can be managed in a better way with external input, exposing interesting improvement gaps that can be filled by the boost offered by different technical innovation projects that can be carried by individual pro-ducers or by association of them.
Referring to commercialization goat derivate products live animal, meat, milk, cheese, leather, hair, and manure, we observed that the main product for these herders is meat (61.4%) commercialized as live animal in 16.9% of the cases. Manure is the second most com-mercialized good, which was declared by the 16.7% of the producers. On the other hand dairy products, leather and hair did not exceed 5% of the commercial activity of all producers. Additionally it was found that for important products are discarded. Leather is discarded
by 71.2% of the producers, stored by 15.2% of them and commercial-ized without processing by 13.6% of the consulted herders. Hair is disposed by 89.8% of the population, stored by 6.8% and commercial-ized unprocessed by 1.7% and processed by 1.7% (Figure 5). Manure is discarded as trash completely by producers who don’t sell it.
An important finding was that 11.7% of the surveyed farmers pos-sess necessary equipment for refrigeration of milk derived products, indicating a need to implement an effective cold chain in order to capitalize real marketing goods obtained from goat livestock. These measures are a must, taking in account that one of the most demand-ed byproducts with added value from biomass corresponds goat cheese (FAO, 2014; Ribeiro & Ribeiro, 2010). For this we investigated in the minimum technological capabilities for production and stor-age of this, which yielded similar results to the capabilities that were determined for milk production. We found that only 13.6% have nec-essary equipment for cold storage in refrigerators and only 2.3% cold chambers for milk and milk derived products, this values are slightly higher than the 10% of producers who make and sell cheeses.
Figure 4: Goat by-product commercialization within the producer´s surveyed population.
Figure 5: Destination of non-edible goat products.
57
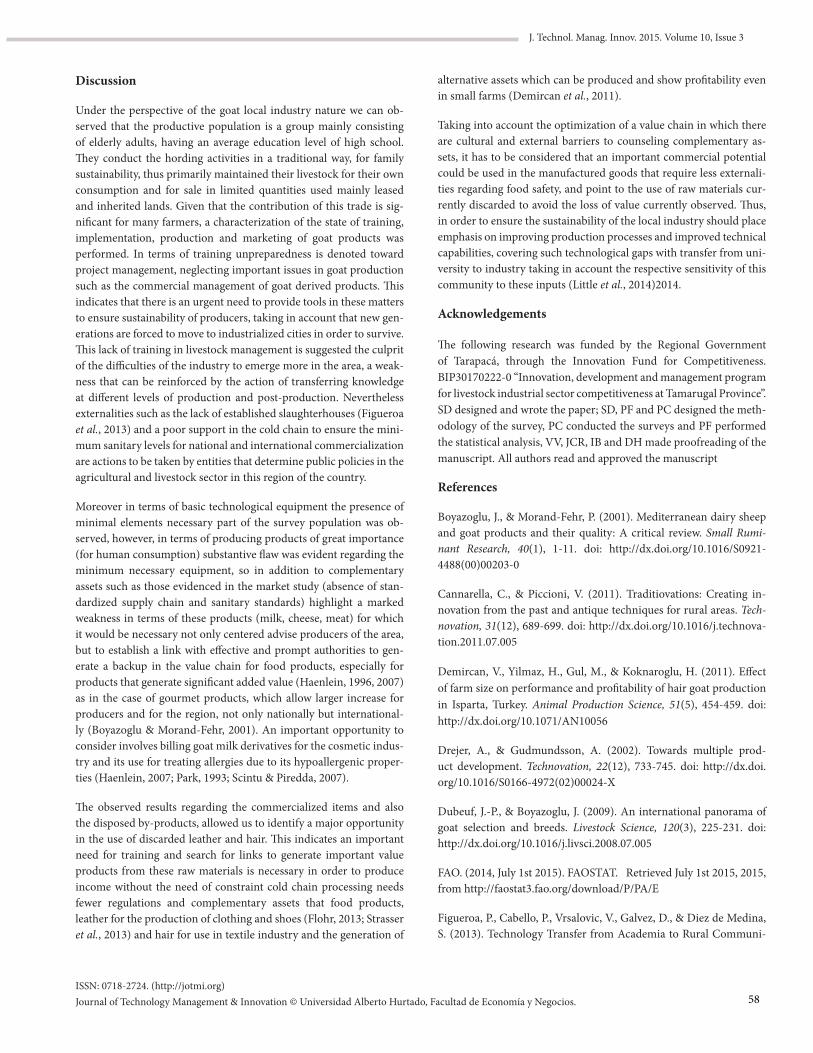
ISSN: 0718-2724. (http://jotmi.org)Journal of Technology Management & Innovation © Universidad Alberto Hurtado, Facultad de Economía y Negocios.
J. Technol. Manag. Innov. 2015. Volume 10, Issue 3
Discussion
Under the perspective of the goat local industry nature we can ob-served that the productive population is a group mainly consisting of elderly adults, having an average education level of high school. They conduct the hording activities in a traditional way, for family sustainability, thus primarily maintained their livestock for their own consumption and for sale in limited quantities used mainly leased and inherited lands. Given that the contribution of this trade is sig-nificant for many farmers, a characterization of the state of training, implementation, production and marketing of goat products was performed. In terms of training unpreparedness is denoted toward project management, neglecting important issues in goat production such as the commercial management of goat derived products. This indicates that there is an urgent need to provide tools in these matters to ensure sustainability of producers, taking in account that new gen-erations are forced to move to industrialized cities in order to survive. This lack of training in livestock management is suggested the culprit of the difficulties of the industry to emerge more in the area, a weak-ness that can be reinforced by the action of transferring knowledge at different levels of production and post-production. Nevertheless externalities such as the lack of established slaughterhouses (Figueroa et al., 2013) and a poor support in the cold chain to ensure the mini-mum sanitary levels for national and international commercialization are actions to be taken by entities that determine public policies in the agricultural and livestock sector in this region of the country.
Moreover in terms of basic technological equipment the presence of minimal elements necessary part of the survey population was ob-served, however, in terms of producing products of great importance (for human consumption) substantive flaw was evident regarding the minimum necessary equipment, so in addition to complementary assets such as those evidenced in the market study (absence of stan-dardized supply chain and sanitary standards) highlight a marked weakness in terms of these products (milk, cheese, meat) for which it would be necessary not only centered advise producers of the area, but to establish a link with effective and prompt authorities to gen-erate a backup in the value chain for food products, especially for products that generate significant added value (Haenlein, 1996, 2007) as in the case of gourmet products, which allow larger increase for producers and for the region, not only nationally but international-ly (Boyazoglu & Morand-Fehr, 2001). An important opportunity to consider involves billing goat milk derivatives for the cosmetic indus-try and its use for treating allergies due to its hypoallergenic proper-ties (Haenlein, 2007; Park, 1993; Scintu & Piredda, 2007).
The observed results regarding the commercialized items and also the disposed by-products, allowed us to identify a major opportunity in the use of discarded leather and hair. This indicates an important need for training and search for links to generate important value products from these raw materials is necessary in order to produce income without the need of constraint cold chain processing needs fewer regulations and complementary assets that food products, leather for the production of clothing and shoes (Flohr, 2013; Strasser et al., 2013) and hair for use in textile industry and the generation of
alternative assets which can be produced and show profitability even in small farms (Demircan et al., 2011).
Taking into account the optimization of a value chain in which there are cultural and external barriers to counseling complementary as-sets, it has to be considered that an important commercial potential could be used in the manufactured goods that require less externali-ties regarding food safety, and point to the use of raw materials cur-rently discarded to avoid the loss of value currently observed. Thus, in order to ensure the sustainability of the local industry should place emphasis on improving production processes and improved technical capabilities, covering such technological gaps with transfer from uni-versity to industry taking in account the respective sensitivity of this community to these inputs (Little et al., 2014)2014.
Acknowledgements
The following research was funded by the Regional Government of Tarapacá, through the Innovation Fund for Competitiveness. BIP30170222-0 “Innovation, development and management program for livestock industrial sector competitiveness at Tamarugal Province”. SD designed and wrote the paper; SD, PF and PC designed the meth-odology of the survey, PC conducted the surveys and PF performed the statistical analysis, VV, JCR, IB and DH made proofreading of the manuscript. All authors read and approved the manuscript
References
Boyazoglu, J., & Morand-Fehr, P. (2001). Mediterranean dairy sheep and goat products and their quality: A critical review. Small Rumi-nant Research, 40(1), 1-11. doi: http://dx.doi.org/10.1016/S0921-4488(00)00203-0
Cannarella, C., & Piccioni, V. (2011). Traditiovations: Creating in-novation from the past and antique techniques for rural areas. Tech-novation, 31(12), 689-699. doi: http://dx.doi.org/10.1016/j.technova-tion.2011.07.005
Demircan, V., Yilmaz, H., Gul, M., & Koknaroglu, H. (2011). Effect of farm size on performance and profitability of hair goat production in Isparta, Turkey. Animal Production Science, 51(5), 454-459. doi: http://dx.doi.org/10.1071/AN10056
Drejer, A., & Gudmundsson, A. (2002). Towards multiple prod-uct development. Technovation, 22(12), 733-745. doi: http://dx.doi.org/10.1016/S0166-4972(02)00024-X
Dubeuf, J.-P., & Boyazoglu, J. (2009). An international panorama of goat selection and breeds. Livestock Science, 120(3), 225-231. doi: http://dx.doi.org/10.1016/j.livsci.2008.07.005
FAO. (2014, July 1st 2015). FAOSTAT. Retrieved July 1st 2015, 2015, from http://faostat3.fao.org/download/P/PA/E
Figueroa, P., Cabello, P., Vrsalovic, V., Galvez, D., & Diez de Medina, S. (2013). Technology Transfer from Academia to Rural Communi-
58
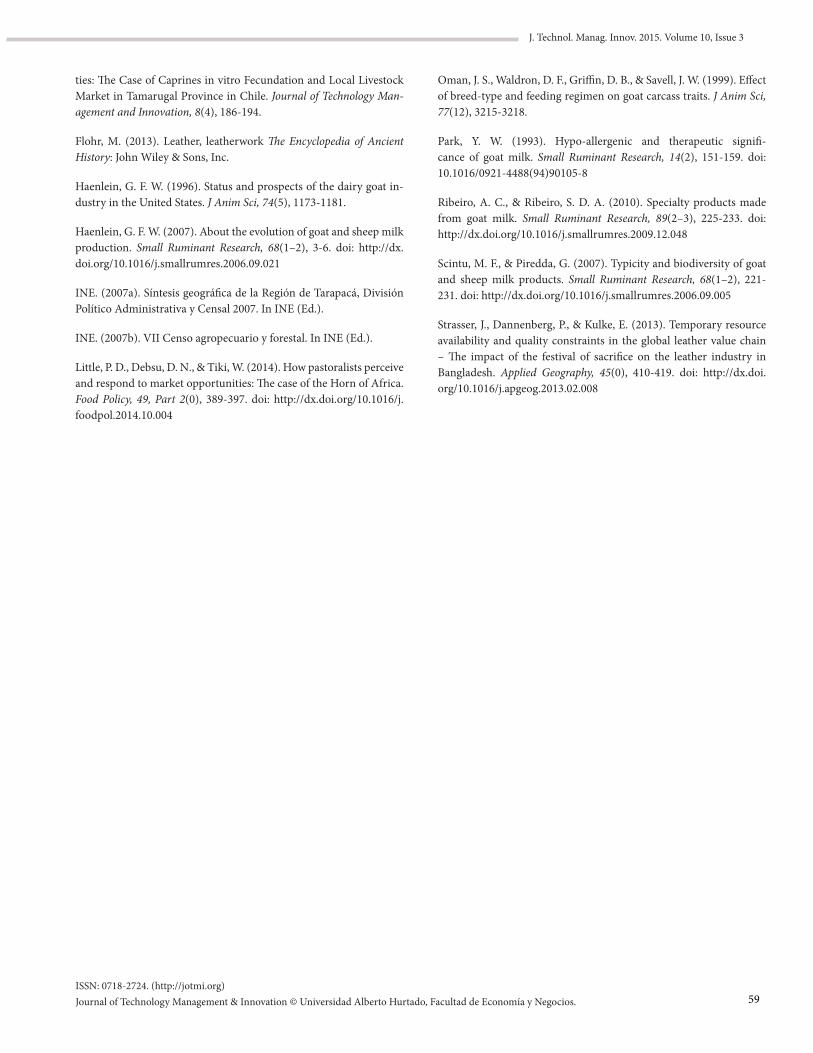
ISSN: 0718-2724. (http://jotmi.org)Journal of Technology Management & Innovation © Universidad Alberto Hurtado, Facultad de Economía y Negocios.
J. Technol. Manag. Innov. 2015. Volume 10, Issue 3
ties: The Case of Caprines in vitro Fecundation and Local Livestock Market in Tamarugal Province in Chile. Journal of Technology Man-agement and Innovation, 8(4), 186-194.
Flohr, M. (2013). Leather, leatherwork The Encyclopedia of Ancient History: John Wiley & Sons, Inc.
Haenlein, G. F. W. (1996). Status and prospects of the dairy goat in-dustry in the United States. J Anim Sci, 74(5), 1173-1181.
Haenlein, G. F. W. (2007). About the evolution of goat and sheep milk production. Small Ruminant Research, 68(1–2), 3-6. doi: http://dx.doi.org/10.1016/j.smallrumres.2006.09.021
INE. (2007a). Síntesis geográfica de la Región de Tarapacá, División Político Administrativa y Censal 2007. In INE (Ed.).
INE. (2007b). VII Censo agropecuario y forestal. In INE (Ed.).
Little, P. D., Debsu, D. N., & Tiki, W. (2014). How pastoralists perceive and respond to market opportunities: The case of the Horn of Africa. Food Policy, 49, Part 2(0), 389-397. doi: http://dx.doi.org/10.1016/j.foodpol.2014.10.004
Oman, J. S., Waldron, D. F., Griffin, D. B., & Savell, J. W. (1999). Effect of breed-type and feeding regimen on goat carcass traits. J Anim Sci, 77(12), 3215-3218.
Park, Y. W. (1993). Hypo-allergenic and therapeutic signifi-cance of goat milk. Small Ruminant Research, 14(2), 151-159. doi: 10.1016/0921-4488(94)90105-8
Ribeiro, A. C., & Ribeiro, S. D. A. (2010). Specialty products made from goat milk. Small Ruminant Research, 89(2–3), 225-233. doi: http://dx.doi.org/10.1016/j.smallrumres.2009.12.048
Scintu, M. F., & Piredda, G. (2007). Typicity and biodiversity of goat and sheep milk products. Small Ruminant Research, 68(1–2), 221-231. doi: http://dx.doi.org/10.1016/j.smallrumres.2006.09.005
Strasser, J., Dannenberg, P., & Kulke, E. (2013). Temporary resource availability and quality constraints in the global leather value chain – The impact of the festival of sacrifice on the leather industry inBangladesh. Applied Geography, 45(0), 410-419. doi: http://dx.doi.org/10.1016/j.apgeog.2013.02.008
59
J. Technol. Manag. Innov. 2015. Volume 10, Issue 3
ISSN: 0718-2724. (http://jotmi.org)Journal of Technology Management & Innovation © Universidad Alberto Hurtado, Facultad de Economía y Negocios.
Gestión de una Cultura de Innovación Basada en las Personas
Jaime E. Souto 1*
Resumen: La cultura de innovación tiene un papel central en la capacidad de innovación de las organizaciones. Así como un destacable efecto sobre la competitividad. Ante su relevancia es indispensable determinar una serie de herramientas para adaptarla a las necesidades e idiosincrasia de cada empresa a lo largo de diferentes periodos de tiempo. En este trabajo se aborda la gestión de la cultura de innovación desde la dirección del personal y de los equipos de trabajo, fruto de reconocer el papel central de las personas en la cultura y la innovación. Inevitablemente, las personas deben ser el punto central en cualquier cultura corporativa, especialmente en su enfoque hacia la innovación. De hecho, una instrumentación efectiva en la creación y mantenimiento de un lugar de encuentro y expresión de las personas es un requerimiento ineludible.
Palabras clave: cultura de innovación; dirección del personal; trabajo en equipo; innovación.
Abstract: The innovation culture has a central role in the innovation capabilities of organizations, as well as a remarkable effect on competitive-ness. Given its relevance, it is essential establishing a set of tools to suit the needs and idiosyncrasies of each company over different periods of time. In this paper, the management of innovation culture is approached from the direction of staff and work teams, as result of recognizing the central role of people in culture and innovation. Inevitably, people should be the central point in any corporate culture, especially in its approach toward innovation. In fact, an effective implementation in creating and maintaining a meeting point and expression of people is an indispensable requirement.
Keywords: innovation culture; staff management; teamwork; innovation.
Introducción
Actualmente, la innovación es fundamental para la competitividad y supervivencia de las empresas. Las empresas innovadoras sobrevivirán y prosperarán en detrimento de las demás (Schumpeter, 1934 y 1942).
Sin embargo, tanto la gestión de la innovación como la tarea de agrupar los esfuerzos de los miembros de la organización hacia ese fin no es sencillo. Las principales razones son debidas a su complejidad, riesgo e incertidumbre.
La cultura desempeña una labor trascendental en el proceso de innovación de las organizaciones, con un importante efecto sobre sus resultados (Feldman, 1988; Kiurunen, 2009; Lin, 2009; Martins y Terblanche, 2003; McLaughlin et al., 2008; Morcillo, 1997; Morcillo et al., 2007; Lee et al., 2008; Villena-Manzanares y Souto-Pérez, 2015).
La cultura corporativa tiene una gran influencia sobre la competitividad. Las organizaciones atesoran ventajas competitivas sostenibles resultado o consecuencia de su cultura corporativa. Mintzberg et al. (1998) destacan el papel de la cultura corporativa sobre la competitividad de las empresas y el mantenimiento de sus
Submitted June 5th 2015 / Approved October 7th 2015
1 Universidad Autónoma de Madrid. Departamento de Dirección de Empresas. *Email: [email protected].
ventajas competitivas, al reconocerla como un recurso original, imposible de imitar y no sustitutivo. Cada entidad tiene una cultura única y, por tanto, una cultura de innovación diferente a la de las demás, con sus propias características y niveles de adaptabilidad, flexibilidad y convivencia con la incertidumbre y ambigüedad.
En torno a las personas como el determinante de la cultura de innovación en las organizaciones, este trabajo plantea y desarrolla dos pilares fundamentales de su creación y gestión.
Desde una perspectiva centrada en los miembros de la organización y en el imprescindible papel de las personas en la innovación y creatividad, sus esfuerzos y compromiso con la innovación son
cruciales en la construcción de organizaciones capaces de conseguir que la innovación y la creatividad fluyan de forma natural. Las condiciones necesarias para posibilitar un entorno propicio para la innovación y la creatividad en las organizaciones requiere del entendimiento de las organizaciones como lugares de encuentro y colaboración entre personas, favorables para aunar esfuerzos e intercambiar experiencias. Es imposible plantear los dos pilares comentados, sin plasmar al mismo tiempo en ellos las bases necesarias para favorecer el encuentro y colaboración entre las personas.
60
J. Technol. Manag. Innov. 2015. Volume 10, Issue 3
ISSN: 0718-2724. (http://jotmi.org)Journal of Technology Management & Innovation © Universidad Alberto Hurtado, Facultad de Economía y Negocios.
Proposición de un Modelo de Gestión de la Cultura de In-novación
La cultura es un conjunto de asunciones básicas compartidas entre las personas, capaces de determinar sus comportamientos y relaciones (Schein, 1992). Schein (1992) estudia la cultura como una consecuencia del aprendizaje de un grupo, al solucionar los problemas externos de adaptación y los internos de integración. En la cultura de innovación esas soluciones son fruto del descubrimiento y la creatividad, resultado de enfrentarse al riesgo e incertidumbre de romper con lo establecido y cotidiano. Bajo esa perspectiva el elemento central de la cultura de innovación son las personas y su trabajo en grupo, constantemente orientado hacia la consecución de innovaciones.
Por tanto, es posible identificar dos aspectos básicos en la gestión de una cultura de innovación: la dirección de las personas y el trabajo en equipo.
Dirección del Personal
Las empresas no innovan por accidente, sino gracias a una adecuada orientación de todos sus empleados hacia ese fin. Además, ante la creciente importancia de los intangibles en la mejora de la situación competitiva de las organizaciones, en las personas yace el éxito de muchas compañías, especialmente, al ser depositarias de muchos conocimientos fruto de sus experiencias y vivencias. Así, la dirección del personal tiene una relevancia critica en el desarrollo de una cultura de innovación, al permitir la dirección, motivación y recompensa de su gente en la consecución de innovaciones.
El clima de creatividad y comportamiento innovador deseado de los empleados es factible con una adecuada implementación de los sistemas de dirección del personal. Los sistemas de dirección del personal incluyen: selección y reclutamiento, formación, recompensa (Kono, 1990) y valoración y gestión del desempeño.
Sistema de Selección y Reclutamiento
Tan importante como reclutar a las personas con las habilidades, conocimientos y experiencia necesarias para el puesto a desempeñar, es la capacitación de esos individuos para innovar. Pues la innovación es una actividad que involucra a toda la organización, cada trabajador debe aportar su grano de arena.
La identificación, selección y reclutamiento de los individuos apropiados, junto con una amplia variedad de habilidades profesionales y áreas de conocimiento, son el caldo de cultivo de la innovación.Pero los nuevos miembros de la organización no sólo se deben seleccionar y reclutar por su perfil individual, sino también por su aportación a la diversidad de la entidad, al permitir la entrada de nuevos conocimientos que se puedan combinar con los existentes, en otras palabras, nuevos empleados realmente capaces de trabajar con los actuales y de aportar nuevas perspectivas. Así, un nuevo individuo no sólo debe ser valorado por sus habilidades y cualificaciones para su puesto, sino también por su aportación a toda la compañía y a los grupos de trabajo en donde se integrará.
Además, los rasgos de personalidad del individuo y como encajan con sus compañeros son una variable a tener mucho más que presente, de gran relevancia, al incluir cuestiones tan importantes para la cultura de innovación como la tolerancia al riesgo, independencia y creatividad.
Con todos esos aspectos es posible seleccionar y reclutar el tipo adecuado de empleado, posibilitando el trabajo en equipo y la creación de equipos equilibrados en la mezcla de habilidades. Incluso posibilita el realineamiento de un equipo creativo, al introducir nuevos miembros (Bilton, 2007). Para crear y mantener una cultura innovadora, es necesario reclutar el tipo correcto de empleado (Kirkbride, 1987), sin ese elemento básico es imposible dar forma a una cultura innovadora. A menudo, el fracaso de una compañía o un proyecto se puede explicar por reclutar a la clase equivocada de empleados (Martin, 1984).
Pero el primer paso antes de seleccionar y reclutar nuevos trabajadores es una buena determinación de las necesidades de personal para innovar, tanto de su cantidad como de sus características en términos de habilidades, conocimientos, experiencia y área de conocimiento.
Formación
El desempeño de un trabajador no depende únicamente de reclutar a la persona más apropiada para un puesto, ni tampoco de una adecuada gestión de sus habilidades y destrezas, también es imprescindible dotarlos de nuevas habilidades y conocimientos, posibilitando el crecimiento personal del individuo hacia lo que quiere ser y hacer, reduciendo el desfase entre lo que puede y sabe hacer y lo que quiere poder y saber hacer.
Esa es la función de la formación, mejorando los conocimientos y destrezas de los trabajadores, tanto al mantenerlos actualizados como al incrementarlos. Así, es posible aumentos considerables en el desempeño de un puesto de trabajo, posibilitando la innovación.
Pero la principal contribución de la formación a la cultura de innovación no se restringe a dotar de los conocimientos necesarios para innovar, hay otro punto critico para la cultura de innovación, consistente en contar con personas de mente abierta, capaces de ver más allá de lo evidente. Muchas innovaciones son fruto de conocimientos ya existentes que son combinados o empleados de forma original. Aunque ninguna persona es innovadora si no cuenta con las habilidades y conocimientos necesarios para serlo, por supuesto, tras su capacitación, es imprescindible la motivación hacia este comportamiento. Por tanto, ambas se complementan y son imprescindibles para la innovación y el establecimiento de una cultura de innovación.
Pero tan importante como formar es hacerlo adecuadamente, es decir, en temas pertinentes. Los nuevos conocimientos y habilidades deben ser relevantes para las tareas y funciones desarrolladas en el puesto actual o en otros futuros. Además, esta segunda posibilidad abre la puerta al incremento de la flexibilidad de asignación de los empleados, algo no sólo de gran valor para la adaptación de la
61
J. Technol. Manag. Innov. 2015. Volume 10, Issue 3
ISSN: 0718-2724. (http://jotmi.org)Journal of Technology Management & Innovation © Universidad Alberto Hurtado, Facultad de Economía y Negocios.
compañía a los cambios en el entorno, sino también al intercambio de conocimientos en la entidad, especialmente los tácitos, difícilmente replicables.
Contar con empleados polivalentes, capaces de desempeñar otras funciones y tareas, es un aspecto elemental que posibilita la reestructuración de la empresa y su adaptación a los cambios. En un entorno económico con una considerable aceleración de la aparición de cambios como el actual, la capacidad de adaptación es una variable critica para la competitividad.
Además, la formación del personal es uno de los factores involucrados en la creación de una cultura innovadora (Attwood, 1990).
Sistema de Valoración y Gestión del Desempeño
El cometido de este sistema no se restringe a la evaluación del trabajo de los empleados y su aportación a la consecución de innovaciones, también incluye la gestión de sus aptitudes y actitudes. Este planteamiento enfatiza la importancia de la gestión de las competencias atesoradas por las personas.
Las personas son factores clave para el éxito y la consecución de los objetivos de las organizaciones, al brindar sus conocimientos y habilidades. Ninguna entidad debe desaprovechar el talento de sus empleados, ni dejar de explotar sus conocimientos y habilidades.
Tanto las actitudes como las aptitudes de las personas que conforman una organización tienen un gran valor. La actitud de cada individuo está determinada por lo que quiere ser y hacer, de forma colectiva, su agregación e interacción son críticas para la configuración de una cultura de innovación, al marcar las voluntades y motivación del grupo. Por su parte, la aptitud de cada individuo marca que puede y sabe hacer fruto de sus conocimientos tácitos y explícitos que afloran en forma de habilidades y destrezas.
Tanto las aptitudes como las actitudes conforman roles de comportamiento e interacción entre los individuos, así, son la piedra angular de la cultura de innovación. Además, es indudable la riqueza cultural fruto de aunar actitudes y aptitudes, no todos pensamos ni vemos el mundo igual, tampoco tenemos los mismos conocimientos y habilidades. Sin duda, una de las claves del éxito y aparición de muchas innovaciones ha sido la combinación de diferentes perspectivas y puntos de vista sobre el entorno de actividad y el propio negocio, como por ejemplo sobre el entendimiento de un negocio o una actividad.
Por tanto, la diversidad en una compañía no es fruto de juntar cosas diferentes por azar o bajo su aparición por casualidad, sino de aunar e integrar laboriosamente cosas diferentes, siempre bajo una constante gestión de todas las competencias de los miembros de la organización.
Aunque las actitudes son menos evidentes y difíciles de identificar, su valor en la creación de una cultura de innovación fuerte y efectiva son evidentes. Un comportamiento y orientación hacia la innovación sólo es posible con una alineación de las voluntades y motivación de los
individuos hacia esta actividad. En concreto, es crucial la motivación para enfrentarse a los diferentes problemas del proceso de innovación, como son el riesgo y la incertidumbre.
Sistema de Recompensa
Por su impacto sobre el comportamiento de los individuos y grupos, es de gran utilidad en la gestión de una cultura de innovación, tanto en las fases de creación y consolidación como en la de manten-imiento. La principal razón del impacto de este sistema se debe a la tendencia hacia la desaparición de los comportamientos no recom-pensados o castigados (Van de Ven et al., 1989).
Para convertir este sistema en una valiosa herramienta en la gestión de una cultura de innovación, la consecución de innovaciones y comportamientos encaminados hacia ese fin deben ser recompensados. Así, tanto las actividades innovadoras como la demostración de compromiso con los valores concordantes con la cultura de innovación serán recompensados (Milton et al., 1992).
Además, las recompensas han de compensar los riesgos asumidos por los innovadores. Si no fuera así, el nivel de riesgo asumido por estos individuos seria bajo, provocando un nivel bajo de innovación (Amabile, 1988). Por tanto, el sistema de recompensas no castigará los fallos inevitables y parte del proceso de aprendizaje, aunque impliquen un coste en dinero y tiempo para la organización. Penalizar los errores cometidos desemboca en la eliminación de la iniciativa (Coyne, 1990).
Las recompensas se pueden clasificar principalmente en los siguientes tres tipos: financieras, promoción y reconocimiento.
Las financieras consisten en cuantías económicas. Aunque son poderosas motivadoras, no siempre son las más efectivas, especialmente, cuando el nivel retributivo actual cubre sobradamente cualquier necesidad económica.
La promoción en un ascenso del trabajador. Sin embargo, no puede ser entregada a todo el mundo, ni de forma igualitaria, sólo debe ser utilizada excepcionalmente.
El reconocimiento del esfuerzo innovador es una de las recompensas más significativas, por su importante contribución a la gestión y fomento de una cultura innovadora. El reconocimiento profesional y trabajar en áreas con grandes desafíos puede ser un potente motivador (Lank, 1997). El reconocimiento tiene algunas ventajas con respecto a otras recompensas, se puede dar en términos generales y más frecuentemente.
Una adecuada combinación de estos tres tipos de recompensas posibilita la motivación de los trabajadores. Aunque es muy importante enfocarlo tanto a nivel individual como grupal, para estimular los mejores resultados de cada persona, como por ejemplo la colaboración e integración dentro de los grupos de trabajo en que este ubicado.
Una incorrecta implantación del sistema de recompensas puede tener un efecto contrario al deseado. Un reconocimiento desigual
62
J. Technol. Manag. Innov. 2015. Volume 10, Issue 3
ISSN: 0718-2724. (http://jotmi.org)Journal of Technology Management & Innovation © Universidad Alberto Hurtado, Facultad de Economía y Negocios.
o inadecuado puede ser contraproducente en el fomento de la innovación (Rydz, 1986).
Sistema de Plan de Carrera
Este sistema está muy relacionado con el de formación, al aunar las ambiciones profesionales de los individuos con las metas de la organización, proporcionando la educación y formación necesaria para permitir el progreso de la carrera profesional dentro de la organización.
La aportación a la cultura de innovación consiste en posibilitar el desarrollo profesional a partir del desempeño innovador de los individuos, nuevamente vuelve a estar relacionado con otro sistema, el de valoración del desempeño.
Pero no sólo se relaciona con unos cuantos de los restantes sistemas de dirección del personal, también enfatiza la relevancia de integrar de forma coherente toda la dirección del personal, pues los diferentes sistemas no funcionaran de forma aislada de los demás. La dirección del personal orientada hacia la cultura de innovación es como una mesa con cuatro patas, si cualquiera de las patas es más larga o corta a las demás, la mesa se tambalea y resulta inservible, si una es más débil a las demás, la carga soportada por todas terminará por los suelos.
Por tanto, los cuatro sistemas constitutivos de la dirección del personal deben estar equilibrados y coordinados, sino lo conseguido por uno será perdido por otro.
Gestión del Trabajo en Equipo
El trabajo en equipo ha tomado gran relevancia en las compañías, por su papel en la consecución de innovaciones, al facilitar o posibilitar la creación, transferencia, asimilación y combinación de conocimiento, tanto explícitos como tácitos.
En el seno de los grupos son generados recursos culturales, capaces de apuntalar las ventajas competitivas de la empresa (Wernerfelt, 1989).
No es suficiente con hacer trabajar juntas a las personas, tienen que cooperar e interactuar en un ambiente abierto y participativo. Un equipo únicamente puede tener éxito si sus miembros aúnan esfuerzos, conocimientos y habilidades hacia los objetivos comunes. Sin duda, el primer paso es alinear los objetivos de todos los miembros del equipo, a través de la selección de aptitudes y actitudes afines y complementarias es posible. Aunque las diversas desviaciones que se irán produciendo a lo largo del tiempo se deberán corregir, bien con la modificación de los miembros del equipo, dando entrada a nuevos individuos o recolocando a otros, o bien con la realineación de los objetivos de algunos miembros o la modificación de los objetivos de todo el grupo.
La dirección dirige las relaciones dentro de los grupos innovadores, re-ensamblando a sus miembros dentro de nuevas configuraciones que posibiliten el proceso de innovación. Cada miembro de un grupo juega un papel peculiar en el mismo, tanto en su adecuación a la
labor realizada como su aportación a la orientación de ese equipo de trabajo, determinando su composición y relaciones su propensión hacia el impulso de la innovación en la conquista de las metas de la organización.
Además, de la mezcla de especializaciones y áreas resulta la fertilización cruzada de ideas, una característica fundamental de las organizaciones innovadoras (Gerstenfeld, 1970; Kanter, 1988). Esa interdisciplinariedad es posible gracias al trabajo en equipo de personas procedentes de diversas disciplinas, incentivadas para colaborar.
Una cultura de innovación fuerte requiere de procesos de innovación estructurados en torno a los grupos basados en la interdisciplinariedad. Sólo así, será posible la consecución de innovaciones generadas a partir de conocimientos procedentes de diferentes disciplinas, posibilitando la puesta en común y combinación de los mismos, así como, futuros desarrollos de los mismos.
En la actualidad la innovación es una tarea de todos los miembros de la organización, ya no puede estar únicamente encerrada en un departamento, zona, área funcional o unidad de negocio de una empresa. La cooperación inter-funcional es la más fructífera para la innovación (Nonaka y Takeuchi, 1995). En definitiva, todos deben ser participes, todos deben aportar su grano de arena para lograr innovaciones.
Este aspecto de agrupar a todas las personas hacia la obtención de innovaciones es el mantra de la cultura de innovación. Todos deben hacer su aportación y poner sus conocimientos y habilidades al servicio de conseguir innovaciones. En el contexto actual, ante un creciente y muy relevante efecto de la innovación sobre la competitividad de las empresas, innovar es una prioridad si la compañía quiere tener éxito y sobrevivir. Las empresas no innovadoras languidecerán y finalmente desaparecerán (Schumpeter, 1934).
Conclusiones
La cultura de una corporación depende de aspectos sociológicos e ideológicos, así como de los medios disponibles. La primera hace referencia a la comunicación entre individuos. La segunda a las creencias, rituales, prácticas y mitos. Por último, los medios están relacionados con los procesos, técnicas y herramientas disponibles, determinados por el avance científico y tecnológico.
El modelo planteado posibilita la gestión de la cultura de innovación a través de los aspectos sociológicos e ideológicos de la cultura corporativa. Así, de forma acompasada los pilares expuestos actúan sobre:
(1) Las relaciones y comunicación entre las personas.
(2) Las creencias, rituales y prácticas admitidas por el colectivo de la compañía.
Una organización proclive hacia la innovación, capaz de generar nuevos descubrimientos y comercializarlos con éxito, no surge por
63
J. Technol. Manag. Innov. 2015. Volume 10, Issue 3
ISSN: 0718-2724. (http://jotmi.org)Journal of Technology Management & Innovation © Universidad Alberto Hurtado, Facultad de Economía y Negocios.
casualidad, es fruto del tesón de sus miembros, quiénes han de ser orientados convenientemente con respecto a la situación actual. De esa forma, es posible mantener un espíritu innovador en situaciones complicadas para la empresa, aprovechando las oportunidades existentes y haciendo frente a las amenazas reales.
No obstante, en algunas compañías van más allá, fundamentando su gran éxito en convertir amenazas de su entorno en oportunidades. Algo impensable para muchas entidades, pero viable al gestionar convenientemente la cultura de innovación desde los pilares detallados.
La dirección del personal y el trabajo en equipo permiten la gestión de una cultura de innovación, e incluso, su creación, a través de las personas que se ven involucradas, pero su gestión y dirección por sí sola, sin tener en cuenta a las personas, no permite crear y mantener la cultura deseada. Por tanto, estas herramientas no son elementos constitutivos de una cultura de innovación, sólo los aspectos sociológicos, ideológicos y los medios disponibles por el colectivo de la entidad lo son. Sin embargo, sí actúan sobre esos aspectos, constituyendo una vía para dar lugar a comportamientos basados en asunciones básicas proclives hacia la innovación.
El valor de cualquier herramienta de gestión de una cultura de innovación debe medirse por su efecto sobre el comportamiento de las personas. La propuesta presentada, trabaja sobre los individuos y grupos, con el objetivo de suscitar pautas de conducta propensas a la innovación.
Las herramientas de dirección del personal son elementales en la creación de empresas más competitivas, al ser el pilar básico en la creación y mantenimiento de una cultura de innovación. Pero también permite mejorar la flexibilidad de toda la compañía.
Una de las principales barreras a la innovación y al establecimiento de una cultura de innovación es la inercia y la resistencia al cambio. Para conseguir que los empleados asuman la innovación y el cambio como algo natural, es esencial hacerlos participes, aquí la formación y gestión por competencias toman un papel crucial.
Una cultura de innovación no se crea a partir de unidades separadas para explotar el presente y desarrollar el futuro, tal como predica la innovación ambidiestra, ambas deben ir de la mano y es imprescindible su colaboración para evitar errores y fracasos innecesarios. Pero la eliminación de la resistencia al cambio no es posible sin hacer participes del nuevo proyecto a los miembros de los actuales, especialmente, si ese nuevo proyecto del cual están desvinculados y no pueden aportar nada termina por sustituir a los vigentes.
Los cambios reconocidos como oportunidades por la dirección de una compañía deben serlo también para el resto de personas de la compañía. Una oportunidad para la empresa se convierte en una amenaza para sus empleados si se ven relegados y desplazados, algo evitable si se utilizan adecuadamente los sistemas de dirección
del personal. Una adecuada gestión de las competencias de las personas y su formación serán vitales para recolocar a los empleados afectados por el nuevo proyecto, pero sobre todo, para aprovechar sus conocimientos y habilidades en la buena consecución y éxito de ese proyecto, obteniendo el mejor resultado posible.
Sin embargo, esto no implica que la existencia de unidades separadas no sea útil, pero su uso debería limitarse al desarrollo de diferentes caminos dependientes –algo olvidado en la actual literatura. Aunque siempre aprovechando sinergias entre ambas unidades, en buena parte posibles, si la compañía dispone de personas polivalentes y con capacidad de aprender.
Sin duda la gestión de la cultura de innovación hace hincapié en la importancia de las personas proclives al aprendizaje, con capacidades para aprender constantemente y posibilitar el surgimiento de nuevos conocimientos o la combinación de los existentes en nuevas direcciones.
Enfocándose sobre el factor humano es posible crear una espiral virtuosa en la mejora del desempeño de la organización, llegando incluso, a poder crear una verdadera organización capaz de aprender. Una organización de esas características, tiene a las personas presentes en todo lo que hace, pues ellas son el corazón del aprendizaje de la organización. La cultura de innovación es el elemento central en la creación de una organización capaz de aprender, en donde las personas son lo más apreciado. La cultura de innovación incluye a la “cultura de aprendizaje”, orientándola tenazmente hacia la obtención de innovaciones dentro de la dirección de progreso seleccionada por la entidad.
Pero la innovación no es una actividad individual, requiere del trabajo en equipo. Sólo aglutinando los esfuerzos de toda la compañía se puede tener éxito en esa actividad.
La gestión del trabajo en equipo es el factor clave para conseguir un lugar de encuentro entre las personas. Una forma de hacer trabajar juntos a los individuos hacia un fin colectivo, mientras comparten y ponen en común sus conocimientos, posibilitando su aplicación, generación y diseminación por toda la empresa.
Por tanto, la gestión de una cultura de innovación a lo largo del tiempo implica fundamentalmente una adecuada dirección del personal y del trabajo en equipo. Aunque ambos pilares deben enfocarse siempre hacia la creación de un lugar de encuentro y expresión de las personas, para posibilitar la generación e impulso de ideas y cambios encaminados a la mejora de la eficiencia y eficacia.
Referencias
Amabile, T.M. (1988). A model of creativity and innovation in organizations. Research in Organizational Behavior, 10, 123-167.
Attwood, T. (1990). Corporate culture: For and against you. Management Accounting, 68(1), 26-29.
64
J. Technol. Manag. Innov. 2015. Volume 10, Issue 3
ISSN: 0718-2724. (http://jotmi.org)Journal of Technology Management & Innovation © Universidad Alberto Hurtado, Facultad de Economía y Negocios.
Bilton, C. (2007). Management and creativity. Oxford, UK: Blackwell Publishing.
Coyne, W. (1990). Innovation as a competitive advantage. Hospitals, 64(10), 88-88.
Feldman, S.P. (1988). How organizational culture can affect innovation. Organizational Dynamics, 17(1), 57-68. http://dx.doi.org/10.1016/0090-2616(88)90030-7
Gerstenfeld, A. (1970). Effective management of research & development. Massachusetts: Addison-Wesley.
Kanter, R.M. (1988). When a thousand flowers bloom: Structural, collective, and social conditions for innovation in organizations. En B.M. Staw y L.L. Cummings (Eds.), Research in organizational behavior (pp. 169-211). Greenwich, CT: JAI Press.
Kirkbride, P.S. (1987). Personnel management and organisational culture: A case of deviant innovation?. Personnel Review, 16(1), 3-9. http://dx.doi.org/10.1108/eb055552
Kiurunen, A.M. (2009). Culture effect on innovation level in European countries. International Journal of Business Innovation and Research, 3(3), 311-324. http://dx.doi.org/10.1504/ijbir.2009.024182
Kono, T. (1990). Corporate culture and long-range planning. Long Range Planning, 23(4), 9-19. http://dx.doi.org/10.1016/0024-6301(90)90148-w
Lank, E. (1997). Leveraging invisible assets: The human factor. Long Range Planning, 30(3), 406-412. http://dx.doi.org/10.1016/s0024-6301(97)90258-2
Lee, C.K., Tan, B., y Chiu, J.Z. (2008). The impact of organisational culture and learning on innovation performance. International Journal of Innovation and Learning, 5(4), 413-428. http://dx.doi.org/10.1504/ijil.2008.017561
Lin, L.H. (2009). Effects of national culture on process management and technological innovation. Total Quality Management & Business Excellence, 20(12), 1287-1301. http://dx.doi.org/10.1080/14783360903250621
Martin, M.J.C. (1984). Managing technological innovation and entrepreneurship. Reston, VA: Reston Publishing Company.
Martins, E.C., y Terblanche, F. (2003). Building organisational culture that stimulates creativity and innovation. European Journal of Innovation Management, 6(1), 64-74. http://dx.doi.org/10.1108/14601060310456337
Mclaughlin, P., Bessant, J., y Smart, P. (2008). Developing an organisation culture to facilitate radical innovation. International Journal of Technology Management, 44(3-4), 298-323. http://dx.doi.org/10.1504/ijtm.2008.021041
Milton, D., Verran, J., Murdaugh, C., y Gerber R. (1992). Differentiated group professional practice in nursing: A demonstration model. The Nursing Clinics of North America, 27(1), 23-30.
Mintzberg, H., Ahlstrand, B., y Lampel, J. (1998). Strategy Safari. New York: Free Press.
Morcillo, P. (1997). Dirección estratégica de la tecnología e innovación. Madrid: Civitas.
Morcillo, P., Rodriguez, J. M., y Rubio, L. (2007). Corporate culture and innovation: In search of the perfect relationship. International Journal of Innovation and Learning, 4(6), 547-570. http://dx.doi.org/10.1504/ijil.2007.013448
Nonaka, I., y Takeuchi, H. (1995). The knowledge-creating company: How Japanese companies create the dynamics of innovation. New York: Oxford University Press.
Rydz, J.S. (1986). Managing innovation. Massachusetts: Ballinger Publishing.
Schein, E.H. (1992). Organizational culture and leadership. San Francisco: Jossey-Bass.
Schumpeter, J. (1934). Theory of economic development: An inquiry into profit, capital, credit interest, and business cycle. Cambridge: Harvard University Press.
Schumpeter, J. (1942). Capitalism, socialism and democracy. London: Unwin University Books.
Van de Ven, A.H., Angle, H.L., y Poole, M. S. (1989). Research on the management of innovation. New York: Harper & Row, Ballinger Division.
Villena-Manzanares, F., y Souto-Pérez, J.E. (2015). The impact of strategic intangible on the export performance of the manufacturing SMEs. Intangible Capital, 11(1), 13-40. http://dx.doi.org/10.3926/ic.567
Wernerfelt, B. (1989). From critical resource to corporate strategy. Journal of General Management, 14(3), 4-12.
65
J. Technol. Manag. Innov. 2015. Volume 10, Issue 3
ISSN: 0718-2724. (http://jotmi.org)Journal of Technology Management & Innovation © Universidad Alberto Hurtado, Facultad de Economía y Negocios.
Fuentes de Conocimiento en Empresas Biotecnológicas
Viridiana Núñez López*
Resumen: Los resultados empíricos respecto a cómo las empresas obtienen el conocimiento externo, sobre todo en sectores intensivos en cono-cimiento, no han sido concluyentes. Mientras que la mayoría de los estudios previos considera para el análisis un mecanismo de acceso al cono-cimiento, el presente estudio considera tres mecanismos: relaciones formales e informales y movilidad laboral. El estudio es cualitativo, explor-atorio, e intenta identificar cuáles son las fuentes de conocimiento externo de las empresas biotecnológicas localizadas en la región occidente de México. Los resultados muestran que más de la mitad de los vínculos para obtener el conocimiento se establecen a nivel regional, predominando las relaciones formales. Sin embargo, los resultados sugieren que es el conocimiento adquirido a nivel internacional el que confiere a la empresa una competitividad de clase mundial.
Palabras clave: conocimiento externo; aprendizaje; empresa biotecnológica; país emergente.
Abstract: Empirical results regarding how the firms obtain external knowledge, mainly firms belonging to intensive-knowledge sectors, have been inconclusive. While the majority of early studies considered only one mechanism of knowledge access, in the current study three mechanisms are considered: formal and informal relationships, and laboral mobility. This study is qualitative, exploratory and attempts to identify external knowledge sources in the biotechnology firms located in the occidental region of Mexico. The results show that more than half of the links for getting the knowledge are at the regional level. However, the results suggest that the knowledge acquired at the international level confers on a world-class competitiveness to the firm.
Keywords: External knowledge; learning; biotechnology firm; emerging economy.
Submitted August 26th 2015 / Approved September 30th 2015
Introducción
A diferencia de otros sectores, la industria biotecnológica es relativamente reciente (Powell, Koput, y Smith, 1996). Por ejemplo, la industria química posee una larga historia de investigación científica básica1, asimismo el conocimiento teórico ya ha sido codificado (en revistas científicas, libros de texto), es decir, es un campo maduro. La búsqueda y selección de procesos alternativos se realiza a partir de una serie de principios, leyes y modelos ya dados, que describen las relaciones entre variables2. El sector biotecnológico se encuentra en una etapa muy diferente. La primera empresa fue fundada en la década de los 70. La investigación básica sobre ingeniería de procesos biotecnológicos a gran escala ha sido poca, por lo que las variables críticas pueden ser desconocidas, haciendo difícil predecir cómo los procesos que han sido probados en el laboratorio se comportarán en la fábrica (Pisano, 1994).
Inmersa en la economía del conocimiento, la biotecnología es intensiva en conocimiento (Decarolis y Deeds, 1999; Moen, 2001;
*Departamento de Ciencias Sociales y Jurídicas, Universidad de Guadalajara, Jalisco, México, E-mail: [email protected]
(1) La industria química remonta sus orígenes al siglo XVIII. La producción de fármacos, utilizando síntesis química, ha tenido lugar desde finales del siglo XIX (Pisano, 1994).(2) Como presión, volumen y temperatura.
Powell et al., 1996; Prevezer, 1997; Salavisa, Sousa y Fontes, 2012) complejo y en expansión (Powell, 1998; Rank, Rank y Wald, 2006). La empresa precisa del conocimiento externo que se genera en universidades, instituciones e incluso otras empresas (Audretsch y Feldman, 2003; Decarolis y Deeds, 1999; Khoury y Pleggenkuhle, 2011; Powell et al., 1996).
La combinación de conocimiento permite llevar a cabo: i) Innovación radical (Doloreux, 2002; Grandstrand, 1998; Salavisa et al., 2012; Song, Almeida y Wu, 2003), siendo esta habilidad la que puede determinar la sobrevivencia (Owen-Smith y Powell, 2004) o competitividad (Smith, 2000) de la empresa. ii) Innovación incremental, la cual se refleja en la mejora de productos y procesos. iii) Realización de procesos (Decarolis y Deeds, 1999; Moen, 2001; Prevezer, 1997; Salavisa et al., 2012). Además, el conocimiento conduce al aprendizaje. La conexión entre ambas variables radica en que el aprendizaje conlleva cambios en la base de conocimiento (Chaminade y Edquist, 2005; Doloreux, 2002; Smith, 2000). La importancia del aprendizaje radica en que es la fuente de las habilidades y capacidades que posee la empresa (Pisano, 1994).
66
ISSN: 0718-2724. (http://jotmi.org)Journal of Technology Management & Innovation © Universidad Alberto Hurtado, Facultad de Economía y Negocios.
J. Technol. Manag. Innov. 2015. Volume 10, Issue 3
Los mecanismos para acceder al conocimiento externo están basados en la interacción social (Doloreux y Parto, 2005; Larsson et al., 1998), ejemplos de ellos son: la relación formal e informal, la movilidad laboral. No obstante, los resultados no han sido concluyentes respecto a la manera en que la empresa obtiene el conocimiento externo. La literatura empírica se ha enfocado al estudio de un mecanismo de acceso a conocimiento externo3 a la vez, por lo que se pierde de vista el entorno bajo el que se están dando estos resultados;. Segundo, es frecuente realizar investigaciones con datos secundarios, con sus consecuentes limitaciones4. Tercero, los estudios se han enfocado a países desarrollados.
El presente estudio intenta identificar cuáles son los mecanismos de conocimiento externo que utiliza la empresa como parte de su proceso de aprendizaje. Para ello considera tres mecanismos, utiliza datos primarios y se aplicó a empresas biotecnológicas del occidente de México. Los resultados muestran que el principal mecanismo de acceso a conocimiento externo es la relación formal a nivel regional. Sin embargo, los lazos (o vínculos) para acceder al conocimiento no están construidos del todo, sino que se van formando a medida que surgen las necesidades de conocimiento, pero también los obstáculos.
El presente artículo está organizado de la siguiente manera: la segunda sección expone el marco analítico en que se basa el estudio. La tercera sección describe la estrategia metodológica aplicada en la investigación así como los datos utilizados. La cuarta sección presenta los resultados obtenidos. La última sección está dedicada a la discusión.
Marco analítico
Algunos tipos de interacción social abordados en la literatura son: alianzas (Carayannopoulos y Auster, 2010; Haeussler, Patzelt y Zahra, 2012; Khoury y Pleggenkuhle, 2011; Larsson et al., 1998); redes (Breschi y Catalini, 2010; Fabrizio, 2009; Porter et al., 1996; Salavisa et al., 2012); colaboraciones (Powell et al., 1996). En otras palabras, la interacción social puede darse a través de relaciones formales o informales, siendo esta clasificación la que considera la presente investigación.
Definimos relación formal como un “acuerdo formal/codificado entre los actores, generalmente involucra un sistema de autoridad, distribución de competencias, derechos y deberes y un dispositivo de resolución de conflictos” (Salavisa et al., 2012, p. 388); colaboración informal como aquella “asociada con lazos personales que son directamente movilizados o actúan como mediadores en el acceso a los recursos” (Salavisa et al., 2012, p. 388). Al entablarse una relación formal o informal se crea un lazo (o vínculo) entre los participantes.
Empíricamente la movilidad laboral se ha tratado desde diferentes perspectivas. En este trabajo consideramos que la empresa a la que se mueve el empleado se ve beneficiada por la derrama de conocimiento, siendo la movilidad una manera de tener acceso al conocimiento externo. Definimos movilidad como el movimiento de trabajadores de una empresa a otra (Maliranta, Mohnen y Rouvinen, 2009), siempre y cuando el movimiento sea entre empresas biotecnológicas. Sin embargo, no en todas las aglomeraciones de empresas existe movilidad en una escala significativa. Por ejemplo, Lawton-Smith y Waters (2005) encuentran que la movilidad en Cambridge y Oxford, regiones que concentran industria de alta tecnología en Inglaterra, la movilidad no es mayor comparada con el resto del país.
En la presente investigación consideramos dos tipos de conocimiento: i) Conocimiento científico biotecnológico, denominado en este trabajo por simplicidad “conocimiento biotecnológico”. ii) Conocimiento científico diferente al biotecnológico, es todo aquel conocimiento científico que no es biotecnológico pero que es útil a la empresa porque es complementario del área empresarial, denominado en este trabajo “conocimiento complementario”.
El conocimiento es difícil de medir o evaluar (Audretsch y Feldman, 2003; Granstrand, 1998). Por ello, conocer el conjunto de lazos (que se establecen a partir de las relaciones formales e informales) para acceder a conocimiento externo es útil porque da cuenta de un flujo de conocimiento (Breschi y Catalini, 2010) el cual forma parte del proceso de aprendizaje5 de la empresa; además permitirá el diseño de instrumentos de política para apoyarlos (Balzat y Hanusch, 2004; Chaminade y Edquist, 2005; Doloreux, 2002; Edgington, 2008; Smith, 2000).
El presente estudio se inserta en este cuerpo de literatura. Intenta identificar las fuentes de conocimiento, esto es, el conjunto de lazos, formales e informales, de las empresas biotecnológicas de la región occidente de México en su búsqueda deliberada de conocimiento externo. Asimismo el estudio se ocupa de otro mecanismo de acceso a conocimiento, la movilidad laboral.
Metodología
De acuerdo con la OCDE (2009)6 en México existen varias zonas biotecnológicas (ver figura 1), una de ellas se ubica en la región occidente, que es en la que se centra la presente investigación.
De acuerdo a nuestra revisión, no encontramos una fuente que concentrara los datos sobre las empresas biotecnológicas localizadas en la región occidente, en parte, porque las empresas suelen agruparse por el giro industrial, y no por la técnica de producción que utilizan.
(3) Una excepción es el estudio de Tzabbar, Aharonson y Amburgey (2013) que consideran al mismo tiempo las colaboraciones formales y la movilidad. (4) Por ejemplo, hay estudios que utilizan datos de patentes para definir que hubo flujo de conocimiento. Sin embargo, no todas las relaciones derivan en patentes porque no todas las invenciones son patentables o se patentan (Griliches, 1990), aunque sí haya una transmisión de conocimiento.(5) Dado que el conocimiento conlleva cambios en la base de conocimiento de la empresa (Chaminade y Edquist, 2005; Doloreux, 2002; Smith, 2000) es inevitable hablar de aprendizaje, sobre todo cuando la empresa está haciendo esfuerzos deliberados por allegarse de conocimiento externo.(6) El estudio de la OCDE identifica las regiones biotecnológicas en el mundo considerando tres niveles dados por el número de patentes en biotecnología. En México identi-fica varias regiones biotecnológicas, situadas todas, en la escala más baja (de 1 a 100 patentes).
67
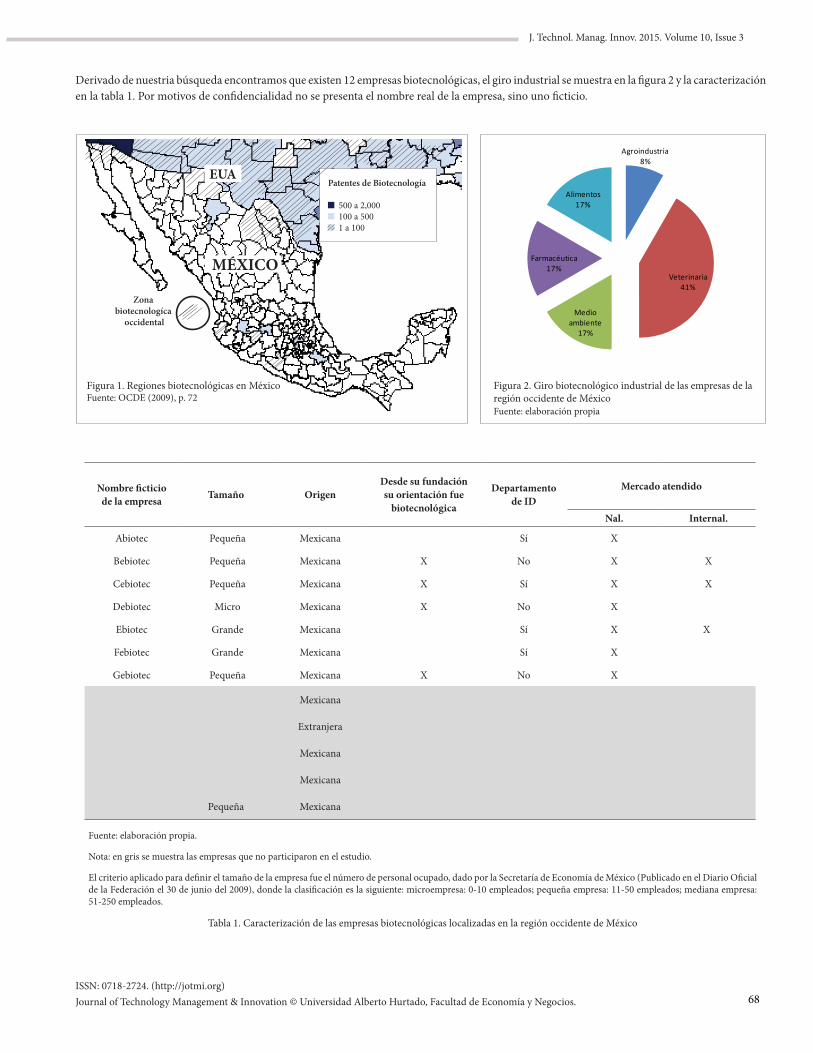
ISSN: 0718-2724. (http://jotmi.org)Journal of Technology Management & Innovation © Universidad Alberto Hurtado, Facultad de Economía y Negocios.
J. Technol. Manag. Innov. 2015. Volume 10, Issue 3
Derivado de nuestria búsqueda encontramos que existen 12 empresas biotecnológicas, el giro industrial se muestra en la figura 2 y la caracterización en la tabla 1. Por motivos de confidencialidad no se presenta el nombre real de la empresa, sino uno ficticio.
Agroindustria8%
Veterinaria41%
Medio ambiente
17%
Farmacéutica 17%
Alimentos 17%
Patentes de Biotecnología
500 a 2,000 100 a 500 1 a 100
Zona biotecnologíca
occidental
EUA
MÉXICO
Figura 1. Regiones biotecnológicas en MéxicoFuente: OCDE (2009), p. 72
Figura 2. Giro biotecnológico industrial de las empresas de la región occidente de MéxicoFuente: elaboración propia
Nombre ficticio de la empresa Tamaño Origen
Desde su fundación su orientación fue
biotecnológica
Departamento de ID
Mercado atendido
Nal. Internal.
Abiotec Pequeña Mexicana Sí X
Bebiotec Pequeña Mexicana X No X X
Cebiotec Pequeña Mexicana X Sí X X
Debiotec Micro Mexicana X No X
Ebiotec Grande Mexicana Sí X X
Febiotec Grande Mexicana Sí X
Gebiotec Pequeña Mexicana X No X
Mexicana
Extranjera
Mexicana
Mexicana
Pequeña Mexicana
Fuente: elaboración propia.
Nota: en gris se muestra las empresas que no participaron en el estudio.
El criterio aplicado para definir el tamaño de la empresa fue el número de personal ocupado, dado por la Secretaría de Economía de México (Publicado en el Diario Oficial de la Federación el 30 de junio del 2009), donde la clasificación es la siguiente: microempresa: 0-10 empleados; pequeña empresa: 11-50 empleados; mediana empresa: 51-250 empleados.
Tabla 1. Caracterización de las empresas biotecnológicas localizadas en la región occidente de México
68
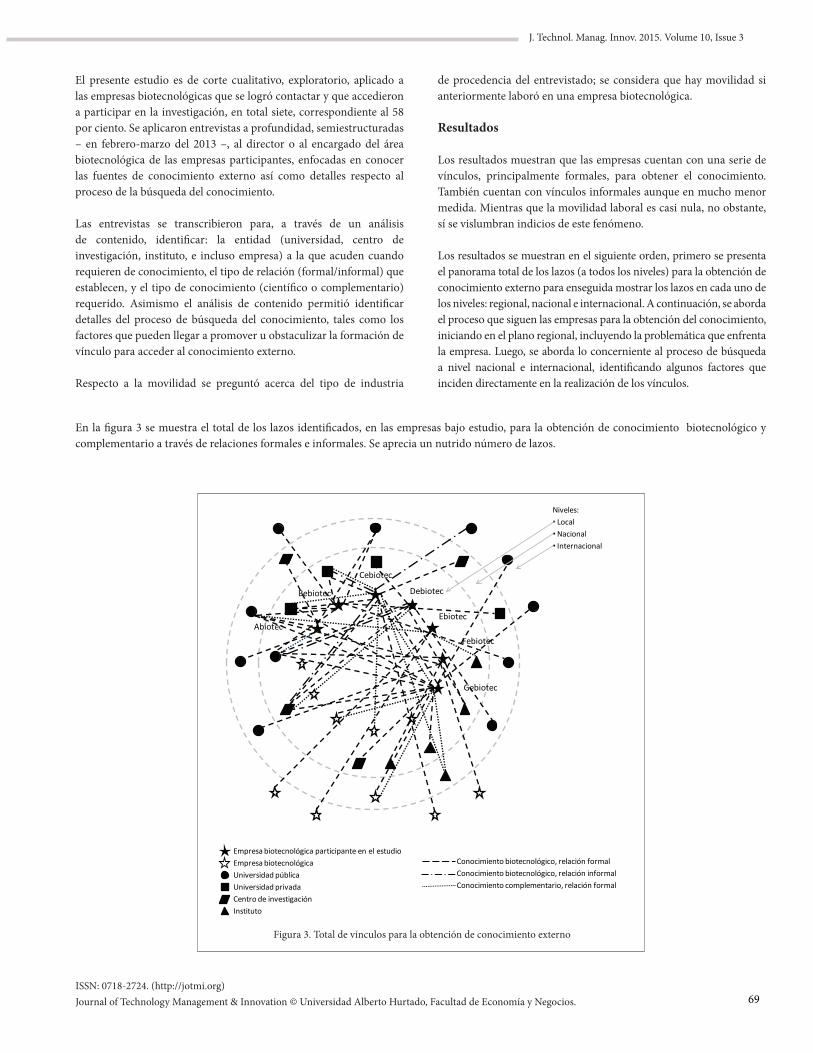
ISSN: 0718-2724. (http://jotmi.org)Journal of Technology Management & Innovation © Universidad Alberto Hurtado, Facultad de Economía y Negocios.
J. Technol. Manag. Innov. 2015. Volume 10, Issue 3
El presente estudio es de corte cualitativo, exploratorio, aplicado a las empresas biotecnológicas que se logró contactar y que accedieron a participar en la investigación, en total siete, correspondiente al 58 por ciento. Se aplicaron entrevistas a profundidad, semiestructuradas – en febrero-marzo del 2013 –, al director o al encargado del áreabiotecnológica de las empresas participantes, enfocadas en conocerlas fuentes de conocimiento externo así como detalles respecto alproceso de la búsqueda del conocimiento.
Las entrevistas se transcribieron para, a través de un análisis de contenido, identificar: la entidad (universidad, centro de investigación, instituto, e incluso empresa) a la que acuden cuando requieren de conocimiento, el tipo de relación (formal/informal) que establecen, y el tipo de conocimiento (científico o complementario) requerido. Asimismo el análisis de contenido permitió identificar detalles del proceso de búsqueda del conocimiento, tales como los factores que pueden llegar a promover u obstaculizar la formación de vínculo para acceder al conocimiento externo.
Respecto a la movilidad se preguntó acerca del tipo de industria
de procedencia del entrevistado; se considera que hay movilidad si anteriormente laboró en una empresa biotecnológica.
Resultados
Los resultados muestran que las empresas cuentan con una serie de vínculos, principalmente formales, para obtener el conocimiento. También cuentan con vínculos informales aunque en mucho menor medida. Mientras que la movilidad laboral es casi nula, no obstante, sí se vislumbran indicios de este fenómeno.
Los resultados se muestran en el siguiente orden, primero se presenta el panorama total de los lazos (a todos los niveles) para la obtención de conocimiento externo para enseguida mostrar los lazos en cada uno de los niveles: regional, nacional e internacional. A continuación, se aborda el proceso que siguen las empresas para la obtención del conocimiento, iniciando en el plano regional, incluyendo la problemática que enfrenta la empresa. Luego, se aborda lo concerniente al proceso de búsqueda a nivel nacional e internacional, identificando algunos factores que inciden directamente en la realización de los vínculos.
En la figura 3 se muestra el total de los lazos identificados, en las empresas bajo estudio, para la obtención de conocimiento biotecnológico y complementario a través de relaciones formales e informales. Se aprecia un nutrido número de lazos.
Conocimiento biotecnológico, relación formalConocimiento biotecnológico, relación informalConocimiento complementario, relación formal
Empresa biotecnológica participante en el estudioEmpresa biotecnológicaUniversidad públicaUniversidad privadaCentro de investigaciónInstituto
Niveles:• Local•Nacional• Internacional
Debiotec
Cebiotec
Bebiotec
AbiotecFebiotec
Ebiotec
Gebiotec
Figura 3. Total de vínculos para la obtención de conocimiento externo
69
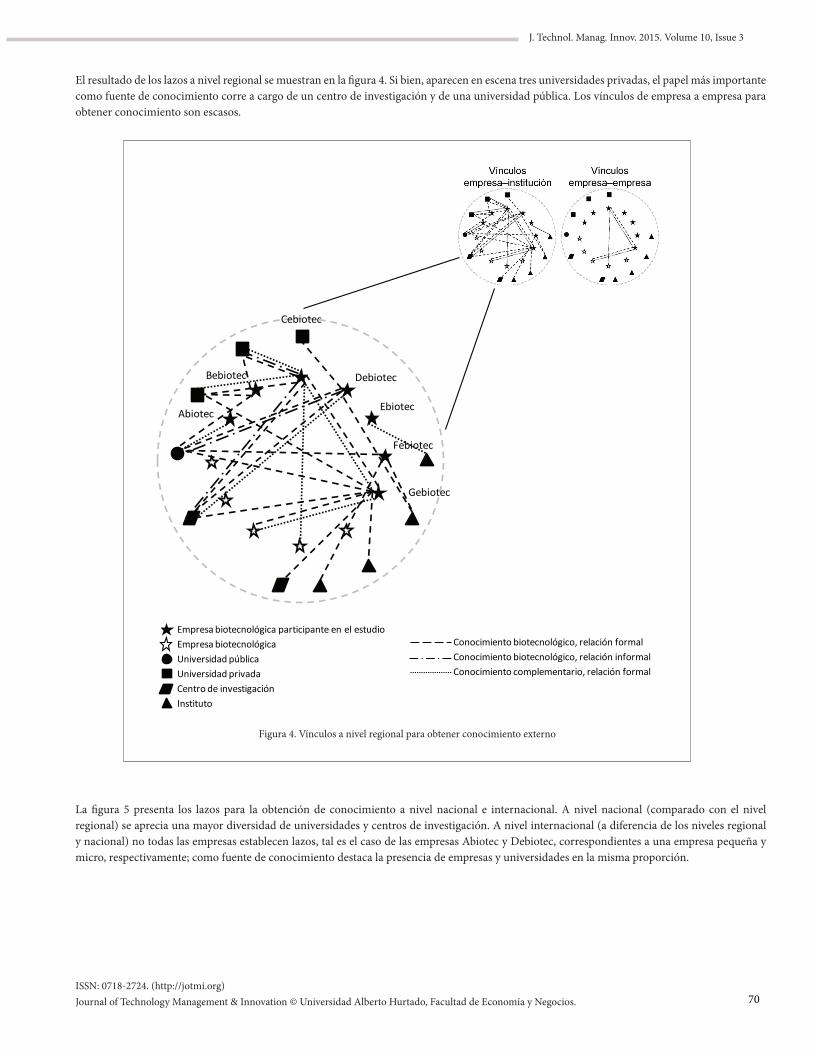
ISSN: 0718-2724. (http://jotmi.org)Journal of Technology Management & Innovation © Universidad Alberto Hurtado, Facultad de Economía y Negocios.
J. Technol. Manag. Innov. 2015. Volume 10, Issue 3
El resultado de los lazos a nivel regional se muestran en la figura 4. Si bien, aparecen en escena tres universidades privadas, el papel más importante como fuente de conocimiento corre a cargo de un centro de investigación y de una universidad pública. Los vínculos de empresa a empresa para obtener conocimiento son escasos.
Debiotec
Cebiotec
Bebiotec
Abiotec
Febiotec
Ebiotec
Gebiotec
Conocimiento biotecnológico, relación formalConocimiento biotecnológico, relación informalConocimiento complementario, relación formal
Empresa biotecnológica participante en el estudioEmpresa biotecnológicaUniversidad públicaUniversidad privadaCentro de investigaciónInstituto
Figura 4. Vínculos a nivel regional para obtener conocimiento externo
La figura 5 presenta los lazos para la obtención de conocimiento a nivel nacional e internacional. A nivel nacional (comparado con el nivel regional) se aprecia una mayor diversidad de universidades y centros de investigación. A nivel internacional (a diferencia de los niveles regional y nacional) no todas las empresas establecen lazos, tal es el caso de las empresas Abiotec y Debiotec, correspondientes a una empresa pequeña y micro, respectivamente; como fuente de conocimiento destaca la presencia de empresas y universidades en la misma proporción.
70
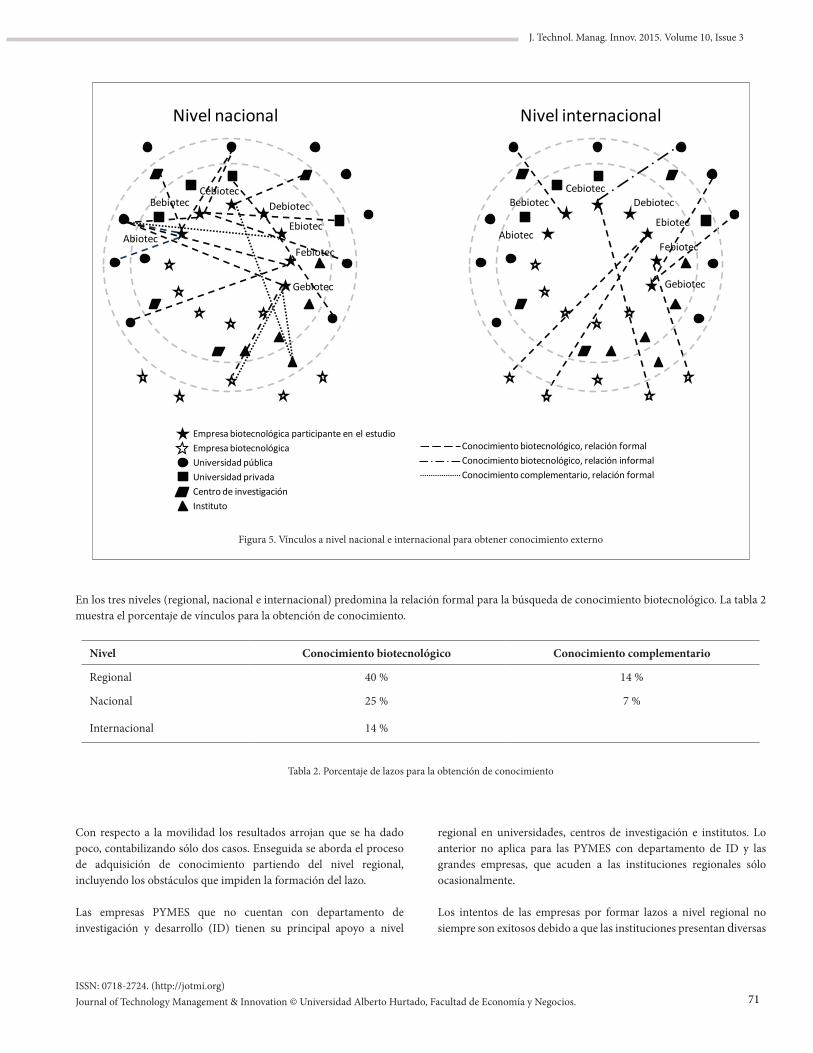
ISSN: 0718-2724. (http://jotmi.org)Journal of Technology Management & Innovation © Universidad Alberto Hurtado, Facultad de Economía y Negocios.
J. Technol. Manag. Innov. 2015. Volume 10, Issue 3
Conocimiento biotecnológico, relación formalConocimiento biotecnológico, relación informalConocimiento complementario, relación formal
Empresa biotecnológica participante en el estudioEmpresa biotecnológicaUniversidad públicaUniversidad privadaCentro de investigaciónInstituto
Nivel nacional
DebiotecCebiotec
Bebiotec
AbiotecFebiotec
Ebiotec
Gebiotec
Nivel internacional
DebiotecCebiotec
Bebiotec
AbiotecFebiotec
Ebiotec
Gebiotec
Figura 5. Vínculos a nivel nacional e internacional para obtener conocimiento externo
En los tres niveles (regional, nacional e internacional) predomina la relación formal para la búsqueda de conocimiento biotecnológico. La tabla 2 muestra el porcentaje de vínculos para la obtención de conocimiento.
Nivel Conocimiento biotecnológico Conocimiento complementario
Regional 40 % 14 %
Nacional 25 % 7 %
Internacional 14 %
Tabla 2. Porcentaje de lazos para la obtención de conocimiento
Con respecto a la movilidad los resultados arrojan que se ha dado poco, contabilizando sólo dos casos. Enseguida se aborda el proceso de adquisición de conocimiento partiendo del nivel regional, incluyendo los obstáculos que impiden la formación del lazo.
Las empresas PYMES que no cuentan con departamento de investigación y desarrollo (ID) tienen su principal apoyo a nivel
regional en universidades, centros de investigación e institutos. Lo anterior no aplica para las PYMES con departamento de ID y las grandes empresas, que acuden a las instituciones regionales sólo ocasionalmente.
Los intentos de las empresas por formar lazos a nivel regional no siempre son exitosos debido a que las instituciones presentan diversas
71
ISSN: 0718-2724. (http://jotmi.org)Journal of Technology Management & Innovation © Universidad Alberto Hurtado, Facultad de Economía y Negocios.
J. Technol. Manag. Innov. 2015. Volume 10, Issue 3
deficiencias, deliberados o no, que dificultan o impiden su formación, como: 1) Niveles por debajo de sus requerimientos. Por ejemplo, algunas empresas consideran que las universidades no tienen un perfil enfocado a la industria o no están certificadas para ofrecer servicios de tercerías7. 2) Burocracia, que impide los acuerdos contractuales. Para algunos empresarios esta burocracia fomenta la colaboración informal porque “hacer un convenio es casi imposible”. 3) Las propias instituciones evitan vincularse con PyMES. Por ejemplo, en el caso de tener una patente la ceden a una empresa grande.
En cuanto a la vinculación entre empresas sí existe aunque es escasa (ver figura 4). La tendencia es a no vincularse, incluso algunas empresas no tienen contemplada esta opción. Otra causa manifiesta es el hermetismo que prevalece al ser empresas competidoras.
Así como hay obstáculos para la formación de vínculos a nivel regional también hay factores que incentivan la formación de los lazos a nivel nacional e internacional. En esta investigación identificamos dos factores: el mercado y la proactividad.
Dado que el mercado es muy reñido, no sólo porque la empresa atiende el mercado internacional sino por la competencia a la que se enfrenta a nivel nacional, las empresas se dan a la tarea de ofrecer productos competitivos. Para ello, al no encontrar el conocimiento necesario dentro del país, las empresas buscan el conocimiento o conocimiento incorporado en una tecnología en el extranjero. Así, han establecido vínculos en Estados Unidos, Canadá, América del sur, Europa. El segundo factor, la personalidad proactiva8 del empresario, se manifiesta en la iniciativa de forjar lazos más densos a nivel nacional e internacional.
La mayoría de las empresas tiene una deficiencia de conocimiento complementario. Esto se debe a que las empresas surgieron de emprendedores con una formación educativa técnica, de la que precisamente partieron para fundar la empresa. Los empresarios manifestaron tener deficiencias en rubros como: mercado, protección de la propiedad industrial, administración, cuestiones fiscales.
Discusión
El presente estudio intentó identificar cuáles son los mecanismos de conocimiento externo que utilizan las empresas biotecnológicas de la región occidente de México. Se encontró que el mecanismo más utilizado es la relación formal para la búsqueda de conocimiento científico biotecnológico.
(7) Se denomina tercería cuando se acude a un tercero por: 1) cuestión normativa, por ejemplo, la realización de estudios preclínicos; 2) realización de pruebas especiales. En el primer caso se acude a una instancia certificada. En el segundo caso a una empresa o institución que cuente con los medios y recursos para llevar a cabo la prueba en cuestión.
(8) La personalidad proactiva para Bateman y Crant es aquella que está relativamente libre de fuerzas situacionales, mientras que los individuos que no tienen esta características son relativamente pasivos, es decir, reaccionan, se adaptan y terminan moldeados por el entorno. La gente proactiva explora en busca de oportunidades, muestra iniciativa, se pone en acción, y persevera hasta que logra el cambio deseado; la personalidad opuesta, no identifica y muchos menos aprovecha las oportunidades para cambiar las cosas, tiene poca iniciativa y espera a que otros hagan los cambios, pasivamente se adaptan y perpetúan el estado de su entorno (1993). Para Crant la proactividad es “tomar la iniciativa para mejorar las circunstancias actuales o crear unas nuevas; esto implica desafiar el status quo y no adaptarse pasivamente a las condiciones actuales” (2000, p. 436).
Respecto a la movilidad los resultados arrojaron que es escasa, entre los motivos están los siguientes: i) hay empresas familiares o constituida por varios socios los cuales tienen incentivos para permanecer en la firma, no para moverse a otra empresa; ii) la industria está compuesta por menos de 15 empresas biotecnológicas de diversos giros, por tanto, la oferta para moverse a una empresa similar es reducida; iii) se observa una marcada tendencia a permanecer en una empresa con intención de tener estabilidad laboral, dadas las pocas oportunidades que presenta la región.
Los procesos que siguen las empresas para la obtención del conocimiento externo distan de ser homogéneos. Aun cuando las empresas están bajo el mismo entorno y región, sus procesos pueden verse afectados por factores tales como: i) los recursos, por ejemplo, si tienen o no departamento de ID; ii) la personalidad proactiva del emprendedor, que lo lleve a explorar más allá del entorno regional, es decir, a nivel nacional o incluso internacional; iii) un mercado muy competido, debido a que se comparte el mercado con empresas connacionales y trasnacionales en territorio nacional, o porque se atiende el mercado internacional.
El análisis muestra que las empresas exploran o buscan por varias vías hasta encontrar el conocimiento que requieren, esto es, las redes para acceder al conocimiento no están construidas del todo, sino que se van formando a medida que surgen las necesidades de conocimiento, pero también los obstáculos (por ejemplo, la burocracia o el bajo nivel científico de las universidades).
La iniciativa de establecer vínculos más densos, y a nivel internacional, está relacionada no sólo con el crecimiento de la empresa sino también con su participación en el mercado internacional. Lo que sugiere que el conocimiento adquirido a nivel internacional confiere a la empresa una competitividad de clase mundial.
Con lo anterior, se espera haber atendiendo la sugerencia de autores como Breschi y Catalini de realizar “estudios cualitativos enfocados a capturar las sutilezas involucradas en las interacciones” (2010, p. 25), en este caso, el acceso a conocimiento.
Los resultados reportados tienen algunas implicaciones de política pública. Primero, al ser las universidades y centros de investigación públicos fuente de conocimiento deben ser menos burocráticos, de manera que incentiven el acercamiento de las empresas; este punto es crucial toda vez que los resultados muestran que el lazo predominante es de tipo formal. Segundo, las universidades y
72
ISSN: 0718-2724. (http://jotmi.org)Journal of Technology Management & Innovation © Universidad Alberto Hurtado, Facultad de Economía y Negocios.
J. Technol. Manag. Innov. 2015. Volume 10, Issue 3
centros de investigación públicos deben elevar su nivel a fin de poder atender las demandas de las empresas de conocimiento científico biotecnológico, sin olvidar los requerimientos de conocimiento complementario, como: manufactura, mercado, administrativo, propios de cualquier empresa. Por último, y no menos importante, es necesario fomentar a través de instituciones públicas la vinculación con entidades relevantes en el plano internacional por ser ahí donde se genera el conocimiento.
El estudio tiene varias limitaciones. Primero, muestra los resultados específicos de una región de un país en desarrollo por lo que los resultados no se prestan a hacer generalizaciones. Sin embargo, sí permite un acercamiento a la comprensión de la manera en que las empresas obtienen el conocimiento externo, los factores que pueden obstaculizarlo y aquellos que le dan impulso. Segundo, la reducida población de empresas de biotecnología de la región bajo estudio no permite todavía el surgimiento de algunos fénomenos propios de aglomeraciones más nutridas, tal es el caso de la movilidad. Tercero, las entrevistas estuvieron limitadas a la apertura del entrevistado ya que el empresario de la región bajo estudio suele ser muy reservado.
Referencias
Audretsch, D. y Feldman, M. (2003). Small-Firm Strategic Research Partnerships: The Case of Biotechnology. Technology Analysis and Strategic Management, 15(2), 273-288.
Balzat, M. y Hanusch, H. (2004). Recent Trends in the Research in National Innovation Systems. Journal of Evolutionary Economics, 14, 197-210.
Bateman, T. S. y Crant, J. M. (1993). The Proactive Component of Organizational Behavior: A Measure and Correlates. Journal of Organizational Behavior, 14(2), 103-118.
Breschi, S. y Catalini, C. (2010). Tracing the Links between Science and Technology: An Exploratory Analysis of Scientists’ and Inventors’ Networks. Research Policy, 39(1), 14-26.
Carayannopoulos, S. y Auster, E. R. (2010). External Knowledge Sourcing in Biotechnology through Acquisition versus Alliance: A KBV Approach. Research Policy, 39(2), 254-267.
Chaminade, C. y Edquist, C. (2005). From Theory to Practice: The Use of Systems of Innovation Approach in Innovation Policy. Centre for Innovation, Research and Competence in the Learning Economy, Lund University. Manuscrito en preparación.
Crant, J. M. (2000). Proactive Behavior in Organizations. Journal of Management, 26(3), 435-462.
Decarolis, D. M. y Deeds, D. L. (1999). The Impact of Stocks and Flows of Organizational Knowledge on Firm Performance: An Empirical Investigation of the Biotechnology Industry. Strategic Management Journal, 20(10), 953-968.
Doloreux, D. (2002). What we should know about Regional Systems of Innovation. Technology in Society, 24(3), 243-263.
Doloreux, D. y Parto, S. (2005). Regional Innovation Systems: Current Discourse and Unresolved Issues. Technology in Society, 27(2), 133-153.
Edgington, D. W. (2008). The Japanese Innovation System: University–Industry Linkages, Small Firms and Regional Technology Clusters. Prometheus, 26(1), 1-19.
Fabrizio, K. R. (2009). Absorptive Capacity and the Search for Innovation. Research Policy, 38(2), 255-267.
Granstrand, O. (1998). Towards a Theory of the Technology-Based Firm. Research Policy, 27(5), 465-489.
Griliches, Z. (1990). Patent Statistics as Economic Indicators: A Survey. Journal of Economic Literature, 28(4), 1661-1707.
Haeussler, C., Patzelt, H. y Zahra, S. A. (2012). Strategic Alliances and Product Development in High Technology New Firms: The Moderating Effect of Technological Capabilities. Journal of Business Venturing, 27(2), 217-233.
Khoury, T. A. y Pleggenkuhle, E. G. (2011). Shared Inventions and the Evolution of Capabilities: Examining the Biotechnology Industry. Research Policy, 40(7), 943-956.
Larsson, R., Bengtsson, L., Henriksson, K. y Sparks, J. (1998). The Interorganizational Learning Dilemma: Collective Knowledge Development in Strategic Alliances. Organization Science, 9(3), 285-305.
Lawton-Smith, H. y Waters, R. (2005). Employment Mobility in High-Technology Agglomerations: The Cases of Oxfordshire and Cambridgeshire. Area, 37(2), 189-198.
Maliranta, M., Mohnen, P. y Rouvinen, P. (2009). Is Inter-firm Labor Mobility a Channel of Knowledge Spillovers? Evidence from a Linked Employer-Employee Panel. Industrial and Corporate Change, 18(6), 1161-1191.
Moen, J. (2001). Is mobility of Technical Personnel a Source of R&D Spillovers? Department of Economics Discussion Paper 05/01, Norwegian School of Economics and Business Administration.
OCDE (2009). Biotechnology Statistics 2009. OCDE, París.
Owen-Smith, J. y Powell, W. W. (2004). The Effects of Spillovers in the Boston Biotechnology Community. Organization Science, 15(1), 5-21.
Pisano, G. P. (1994). Knowledge, Integration, and the Locus of Learning: An Empirical Analysis of Process Development. Strategic Management Journal, 15, 85-100.
73
ISSN: 0718-2724. (http://jotmi.org)Journal of Technology Management & Innovation © Universidad Alberto Hurtado, Facultad de Economía y Negocios.
J. Technol. Manag. Innov. 2015. Volume 10, Issue 3
Porter, J., Oliver, A., Zucker, L. y Brewer, M. (1996). Social Networks, Learning, and Flexibility: Sourcing Scientific Knowledge in New Biotechnology Firms. Organization Science, 7(4), 428-443.
Powell, W. W. (1998). Learning from Collaboration: Knowledge and Networks in the Biotechnology and Pharmaceutical Industries. California Management Review, 40(3), 228-240.
Powell, W. W., Koput, K. W. y Smith, L. (1996). Interorganizational Collaboration and the Locus of Innovation: Networks of Learning in Biotechnology. Administrative Science Quarterly, 41(1), 116-145.
Prevezer, M. (1997). The Dynamics of Industrial Clustering in Biotechnology. Small Business Economics, 9(3), 255-271.
Rank, C., Rank, O. y Wald, A. (2006). Integrated Versus Core-Periphery Structures in Regional Biotechnolgy Networks. European Management Journal, 24(1), 73-85.
Salavisa, I., Sousa, C. y Fontes M. (2012). Topologies of Innovation Networks in Knowledge-intensive Sectors: Sectoral Differences in the Access to Knowledge and Complementary Assets through Formal and Informal Ties. Technovation, 32(6), 380-399.
Smith, K. (2000). Innovation as a Systemic Phenomenon: Rethinking the Role of Policy. Enterprise and Innovation Management Studies, 1(1), 73-102.
Song, J., Almeida, P. y Wu, G. (2003). When is Mobility more likely to Facilitate Interfirm Knowledge Transfer? Management Science, 49(4), 351-365.
Tzabbar, D., Aharonson, B. S. y Amburgey, T. L. (2013). When does Tapping External Sources of Knowledge Result in Knowledge Integration? Research Policy, 42(2), 481-494.
74
J. Technol. Manag. Innov. 2015. Volume 10, Issue 3
ISSN: 0718-2724. (http://jotmi.org)Journal of Technology Management & Innovation © Universidad Alberto Hurtado, Facultad de Economía y Negocios.
La Imagen de un Producto Turístico Rural a través del Acceso al Contenido Generado por otros Usuarios en Internet: Diferencias por Género
Carmen Hidalgo-Alcázar1* María Sicilia2, Salvador Ruiz De Maya3
Resumen: Los contenidos generados por los usuarios sobre un producto turístico en Internet son utilizados de forma recurrente por otros turistas como una importante fuente de información. Sin embargo, se desconoce la influencia que tienen estos contenidos en la formación de la imagen de un producto turístico, así como si existen o no diferencias de género en cuanto a la percepción de esa imagen. En la investigación actual, se ha utilizado como producto turístico un alojamiento rural y como estímulo la propia web del alojamiento. Los resultados de este estudio demuestran que los contenidos generados por otros usuarios en la web afectan a la imagen percibida del producto turístico. También se observa que las mujeres generan una imagen afectiva y cognitiva más favorable sobre el producto turístico que los hombres. La novedad de esta investigación reside en aportar conocimiento nuevo sobre la relación del contenido generado por otros usuarios y las dimensiones de la imagen de un producto turístico, en un entorno poco estudiado como el turismo rural.
Palabras clave: Internet, Imagen, Contenidos Generados por otros Usuarios, Producto Turístico, Turismo Rural, Género.
Abstract: The image of a rural tourism product through user-generated content on the Internet: gender differences: Tourists usually consult user-generated content on the Internet to plan a trip. However, its influence on image formation of a tourism product is not yet fully understood. The effect of user-generated content on tourism product image could vary depending on the gender of the consumer. In the present study, a rural ac-commodation has been selected as tourism product and its website as stimulus to be analyzed. Our results show how user-generated content affects the image of a tourism product. Results also confirm that this effect is more favorable for women than for men. The originality of this research is to provide new knowledge about the relationship of user-generated content and the image of a tourism product in an environment that has not been studied yet, that is, rural tourism.
Keywords: Internet, Image, User-Generated Content, Tourism Product, Rural Tourism, Gender.
Introducción
Internet en los últimos años se ha convertido en el canal principal para la búsqueda y propagación de información (Cox et al., 2009; Wirtz et al., 2010). El sector turístico ha sido uno de los primeros sectores en adaptar las tecnologías de la información (TIC) a sus procesos (Reinders y Baker, 1997). Por ello, Internet se ha vuelto una fuente de información fundamental para los viajeros (Pan et al., 2007; Law et al., 2010), a la vez que una herramienta de comunicación en constante crecimiento, hasta el punto de convertirse en una plata-forma fundamental para la proyección de la imagen turística de los destinos (Schmallegger y Carson, 2008; Jeong et al., 2012).
Los desarrollos recientes en Internet se han producido tanto por la generación de contenidos por parte de los usuarios, como por las apli-caciones individuo a individuo (en inglés, peer-to-peer). De hecho, se puede hablar de una explosión de este tipo de contenido generado por los usuarios y de materiales auto-producidos en Internet (Ander-
Submitted July 2th 2015 / Approved October 7th 2015
1 Universidad Católica del Norte, Escuela de Ciencias Empresariales, Coquimbo, Chile.2,3 Universidad de Murcia, Departamento de Comercialización e Investigación de Mercados, Facultad de Economía y Empresa, Murcia, España.*Autor de correspondencia: [email protected]
son, 2007). El contenido generado por el usuario durante o después del viaje se convierte en una fuente importante de información, ya que permite saber cómo han percibido los turistas el lugar visitado y cómo han vivido su experiencia.
La importancia de Internet en el proceso de formación de la imagen ha sido ampliamente reconocida por académicos y profesionales. Es-tudios anteriores han demostrado que influye tanto en la dimensión cognitiva como en la afectiva de la imagen, aunque la mayor parte de la investigación se ha centrado en el componente cognitivo (Ech-tner y Ritchie, 1991; Walmsley y Young, 1998; Chen y Uysal, 2002). En el sector turístico se detecta una especial necesidad de investi-gación debido a los importantes cambios ocurridos en los últimos años (Mingetti y Buhalis, 2010, Standing et al., 2014). A este sesgo en la in-vestigación, se suma el hecho de que el desarrollo de Internet ha generado la creación de diferentes plataformas online, tales como webs, blogs y foros de discusión que pueden tener efectos diferenciales en la ima-gen percibida por los turistas (Jani y Hwang, 2011).
75
ISSN: 0718-2724. (http://jotmi.org)Journal of Technology Management & Innovation © Universidad Alberto Hurtado, Facultad de Economía y Negocios.
J. Technol. Manag. Innov. 2015. Volume 10, Issue 3
Algunos modelos de toma de elección de un destino turístico (por ejemplo, Woodside y Lysonski, 1989; Um y Crompton, 1990; Stabler, 1995) muestran que las características personales de los individuos, como el género, edad, ocupación y educación, pueden influir en las percepciones de los lugares. La diferencia de género se ha estudiado en gran detalle más que otros atributos personales (Wilborn et al., 2007), debido a su fuerte capacidad para interpretar los comporta-mientos de consumo de los individuos. Así, el género se utiliza con frecuencia como base para la segmentación de una proporción sig-nificativa de productos y servicios (Putrevu, 2001). El hecho de que hombres y mujeres son diferentes es reconocido en la mayoría de las sociedades. Además, se ha discutido ampliamente el hecho de que las TIC son generadoras de nuevas formas de desigualdad entre mujeres y hombres, reflejadas en las diferencias en oportunidades de acceso y en el uso diferencial de estas tecnologías, específicamente en el uso diferencial de Internet (Hargittai y Shafer, 2006; Sánchez, 2010). Pero una pregunta a la que se enfrentan los investigadores sobre hábitos y conductas del consumidor, es si las diferencias de género pueden traducirse en consistentes patrones diferenciales en procesamiento de información y juicios de opinión (Kim et al., 2007). A la hora de comprar un producto turístico o planificar un viaje el individuo se enfrenta a varias fuentes de información, y como ya comentamos an-teriormente, Internet es la fuente más utilizada por los turistas. Es por ello, que se hace necesaria una investigación más profunda en cuanto a si existen diferencias de género frente a la actitud de determinada información online sobre un producto turístico, así como su posibles implicaciones.
De esta manera, esta investigación pretende explicar cómo influye el contenido generado por otros usuarios en la imagen percibida de un producto turístico. Los objetivos específicos a investigar son los siguientes: (1) conocer la relevancia de los comentarios generados por otros usuarios cuando navega por una web de un producto turísti-co determinado, (2) conocer el impacto del acceso a los comentarios en las dimensiones afectiva y cognitiva de la imagen percibida de un producto turístico, y (3) analizar si hombres y mujeres se enfrentan del mismo modo al contenido generado por otros usuarios y si gen-eran percepciones similares o diferentes en cuanto a la imagen. Los objetivos se enmarcan en el contexto de un mercado muy similar al de América Latina debido a sus comparables características cultura-les, sociales y económicas: España (Andonova et al., 2013; Polo et al., 2015). Para alcanzar estos objetivos, llevamos a cabo una revisión de la literatura, un estudio empírico y el correspondiente análisis de los resultados. Al final del trabajo, se presentan las implicaciones del estudio realizado, así como las limitaciones y futuras líneas de inves-tigación que se derivan del mismo.
La imagen de un producto turístico en el contexto del turismo rural
La imagen turística puede definirse como “la expresión de todo cono-cimiento objetivo, impresiones, prejuicios, imaginaciones y pensam-ientos emotivos que un individuo o grupo puede tener de un produc-to turístico en particular” (Bandyopahyay y Morais, 2005, p.1009). En el contexto turístico, la imagen representa lo que los turistas piensan,
sienten y asocian en relación a un determinado producto turístico. Es decir, lo que los turistas perciben e interiorizan. El estudio de la ima-gen turística ha recibido gran atención en la literatura científica sobre turismo, no sólo por los investigadores académicos sino también por los gestores y responsables de los propios productos turísticos (Balo-glu y Brinberg, 1997; Gallarza, Gil y Calderón, 2002; Battino, 2013).
Este trabajo se realiza en consonancia con los investigadores que abo-gan por la inclusión de la dimensión afectiva de la imagen en los es-tudios de turismo (Baloglu y McCleary, 1999a; Royo y Serarols, 2005; Martín y Bosque, 2008; Marinao, Chasco y Torres, 2012). Por lo tanto, la aproximación que utilizamos al concepto imagen de un producto turístico se basa en dos dimensiones, que diferencia las evaluaciones cognitivas de las afectivas en la imagen percibida por el turista (Balo-glu y McCleary, 1999a; Pike y Ryan, 2004). El componente cognitivo de la imagen lo constituyen las creencias, los conocimientos y las eval-uaciones del turista sobre los atributos del producto turístico, mien-tras que el componente afectivo está relacionado con las motivaciones y los deseos del individuo en la decisión, así como los sentimientos o respuestas emocionales que los individuos manifiestan hacia pro-ducto turístico (Gartner, 1993; Pike y Ryan, 2004).
El turismo rural se está expandiendo con fuerza en todo el mundo, debido a los múltiples beneficios que este tipo de turismo ofrece a las comunidades locales (Esteban et al., 2010; Herrero y San Martin, 2012). En los países europeos hay una mayor tradición de turismo rural, especialmente en España, donde se ha utilizado para incentivar el turismo de interior frente al tradicional de sol y playa. Sin embargo, en Latinoamérica, el turismo rural es aún incipiente, encontrándose muchos de sus productos en etapa de desarrollo. No obstante, como señala Barrera (2006), todos los países del continente americano cuentan con establecimientos turísticos en las zonas rurales, regis-trándose un notorio crecimiento de la actividad a la vez que un ma-yor interés por promover entre los residentes del espacio rural. Países como Argentina, Chile y México están realizando grandes esfuerzos por fomentar este tipo de turismo.
El sector del turismo rural es uno de los más activos en Internet. Las empresas españolas del sector ya consideran a Internet como el prin-cipal canal de comercialización, por lo que la gran mayoría cuenta con acceso a Internet (Informe ePyme 2013). La mayoría de los es-tablecimientos de turismo rural españoles ya cuentan con su propio sitio web. Los emprendimientos dedicados al turismo rural en Lati-noamérica están empezado a incorporar también las TIC (Cataldi et al., 2012). La mayoría de los establecimientos de turismo rural es-pañoles ya cuentan con su propio sitio web. El uso de Internet como herramienta de difusión y comercialización de la oferta de turismo rural está permitiendo incrementar el mercado potencial. Se está ge-nerando un gran impacto entre los turistas extranjeros, que cada vez aprecian más las bondades de este tipo de turismo.
El sitio web del establecimiento ha sido, hasta el momento, una herra-mienta imprescindible para crear una imagen del negocio y difundirla a los potenciales clientes (Informe ePyme 2013; Bombelli et. al, 2013). En una industria intensiva en información como lo es la del turismo,
76
ISSN: 0718-2724. (http://jotmi.org)Journal of Technology Management & Innovation © Universidad Alberto Hurtado, Facultad de Economía y Negocios.
J. Technol. Manag. Innov. 2015. Volume 10, Issue 3
los sitios webs constituyen un elemento de suma importancia para las empresas del sector, ya que mejoran su competitividad, permitiendo estar presentes en los procesos de toma de decisiones de los turistas potenciales (Marzo-Navarro et al., 2010). Según el estudio de Radiografía del Viajero Rural, 2013, Internet es el principal medio a través del cual 8 de cada 10 viajeros rurales (83,79%) buscan alojamiento cuando organi-zan su viaje de turismo rural. Las opiniones y el contenido generado por otros usuarios también son interesantes para el turismo rural, pudiendo llegar a ser el complemento ideal al “boca a boca”, que tradicionalmente ha supuesto uno de los principales factores que han influido en la elec-ción del alojamiento rural (González y García, 2010).
Las opiniones de otros usuarios en Internet y su impacto en el sector del turismo rural
La opinión de otros consumidores puede resultar influyente en las percepciones y en la toma de decisiones de los consumidores poten-ciales en todos los ámbitos, pero en el sector turístico es especial-mente relevante debido a que los servicios turísticos no se pueden probar con anterioridad (Buhalis, 2003; Senecal y Nantal, 2004) y las decisiones de compra se perciben de riesgo elevado (Lewis y Cham-bers, 2000). Así pues, las opiniones y experiencias de otras personas son una fuente de información muy valorada por los turistas poten-ciales, ya que reducen su sensación de riesgo y desconocimiento de los productos y servicios turísticos (Huertas, 2008). Según el estudio Radiografía del Viajero Rural 2013, el porcentaje de viajeros que han elegido condicionados por las opiniones de otros viajeros publicadas en Internet asciende al 37,29 %.
Las experiencias de otros turistas influyen en gran medida en los procesos de decisión turísticos. Las vivencias positivas de otros usu-arios y su comunicación pública, así como la forma de mostrar dichas experiencias, con comentarios emocionantes y fotografías, pueden motivar y convencer mucho más que información más objetiva o un folleto turístico. Los usuarios compran más una experiencia que un producto turístico, y las experiencias de otros usuarios pueden ayudar a planificar e imaginar las propias experiencias turísticas (Henning-Thurau et al., 2004; Senecal y Nantal, 2004).
Varios estudios realizados en el ámbito turístico corroboran la im-portancia del carácter experiencial de esta compra y la influencia de otras personas en la decisión. Saranow (2004) demostró el éxito de los blogs de viajes en la influencia de las decisiones de los turistas potenciales, basado en la importancia de los millones de comentarios generados por los consumidores que han estado en algún destino. En un análisis más detallado, Pan et al. (2007) analizaron las opiniones de los visitantes para comprender mejor la experiencia vivida en los destinos y demostraron que el análisis de estas opiniones puede ser una forma útil de detectar las debilidades y fortalezas del de un des-tino turístico. Por su parte, Lin y Huang (2006) demostraron como los relatos personales de las visitas de los turistas podían promover la imagen turística de los destinos. Mientras que otros autores se han adentrado en diferentes aspectos de la imagen turística de los destinos analizando los contenidos generados por los usuarios en los blogs de viaje (Wenger, 2008; Bosangit y Mena, 2009).
Sin embargo, en este tipo de investigaciones aún no se ha tratado la relación que puede haber entre el contenido generado por otros usu-arios dentro de la web oficial de un producto turístico y la imagen percibida del mismo. Si bien se ha abordado el impacto de los foros de viajes sobre la imagen del destino se ha olvidado la posibilidad de generar contenidos en la plataforma más básica en este medio y la que más se está utilizando en la actualidad, la web del propio produc-to turístico. Como la web de un producto turístico es normalmente uno de los primeros sitios en los que el viajero busca información (Toprural, 2013), resulta útil analizar en qué medida afecta el con-tenido generado por otros usuarios en esa plataforma a la imagen del producto turístico.
Diferencias de género en el procesamiento de la información
Está generalmente aceptado que los hombres tienden a ser los prime-ros en usar las nuevas tecnologías y en obtener ventajas significativas de ello, tanto en el hogar como en el trabajo. Sin embargo, sigue sien-do necesarios nuevos estudios sobre la relación entre el género y las nuevas tecnologías para entender mejor las diferencias entre hombres y mujeres (Gargallo-Castel et al., 2010).
La literatura ha registrado diversas implicaciones de género que carac-terizan la sociedad de la información. Algunos estudios han logrado identificar las diferencias de género desde el proceso mismo del auto reconocimiento frente a las tecnologías, en cuanto a habilidades y con-fianza, hasta la eficacia en el uso de las mismas (Shashaani, 1997; Ken-nedy, Wellman y Klement, 2003). Los hombres y las mujeres parecen dar diferente importancia a los atributos más destacados (Holbrook, 1986; Fischer y Arnold, 1994) y a las fuentes de información más ha-bituales (Meyers-Levy, 1988) al evaluar un producto o un servicio. Al-gunas de las diferencias de género puestas de manifiesto en la literatura son, sin duda, debidas a las diferencias en el interés y el conocimiento hacia determinadas categorías de producto entre el hombre y la mu-jer. Sin embargo, la investigación sobre el género sugiere que varias de las diferencias no pueden explicarse en términos de interés o de cono-cimiento y que es mejor explicarlas en términos de diferencias en el procesamiento de la información entre hombres y mujeres (Meyers Levy y Maheswaran, 1991; Meyers-Levy y Sternthal, 1991).
En el contexto tecnológico actual, es importante reconocer las dife-rencias de género en materia de procesamiento de la información (Putrevu, 2001). La evaluación de las fuentes de información difiere entre hombres y mujeres (Meyers-Levy, 1988). Las mujeres son más exhaustivas a la hora de decodificar mensajes no-verbales (Hall, 1984; Everhart et al., 2001), y se muestran más afectadas por los estímulos visuales (Dittmar et al., 2004). Además, tienen mo-tivaciones más intrínsecas, emocionales y románticas (Holbrook, 1986; Dittmar et al., 2004). Por su parte, los hombres suelen ser más analíticos y, por tanto, más objetivos que las mujeres, que son más subjetivas e intuitivas (Kim et al., 2007). Los hombres no se involucran en las historias, mientras que las mujeres participan de cada historia y la analizan teniendo en cuenta su experiencia personal. Desde el punto de vista de la información, los hombres parecen reaccionar más positivamente a reclamos objetivos y las
77
ISSN: 0718-2724. (http://jotmi.org)Journal of Technology Management & Innovation © Universidad Alberto Hurtado, Facultad de Economía y Negocios.
J. Technol. Manag. Innov. 2015. Volume 10, Issue 3
mujeres lo hacen más hacia mensajes subjetivos y orientados a la imagen. Asimismo, mientras que los hombres ven como una di-versión el navegar por Internet, las mujeres lo perciben en mayor medida como una herramienta de comunicación interpersonal (Jackson et al., 2001; Colley et al., 2008).
Las diferencias de género también son visibles en la utilización de la tecnología social a través de Internet (Figueroa et al., 2010). Los datos de participación de las mujeres en este tipo de herramientas revelan que participan menos que los hombres en la creación de blogs y que los temas tratados por ellas son diferentes (McLean, 2009). Por otro lado, según los datos del perfil del viajero rural en España, se observa que las mujeres opinan más en las redes, 7 de cada 10 mujeres opinan sobre sus experiencias en Internet, mientras que solo tres de cada diez hombres lo hacen (Toprural 2013). Además, las mujeres son más ac-tivas en Facebook y en Twitter. Dadas estas diferencias, es necesario plantearse qué ocurre a la hora de enfrentarse al contenido generado por otros usuarios en la web de un producto turístico, si responden de manera similar a esta fuente de información. Para dar respuesta a esta pregunta planteamos el siguiente estudio empírico.
Metodología
Diseño y procedimiento
El estímulo utilizado para el presente estudio fue un sitio web real so-bre un alojamiento rural como servicio turístico. La selección de este servicio de turismo fue motivada por varias razones. En la actualidad, en España el porcentaje de viajeros que han optado por la elección de un alojamiento rural condicionados por los comentarios en Internet de otros usuarios supera el 37% (Toprural, 2013). Además, el turismo rural es uno de los más activos en Internet, ya que 8 de cada 10 via-jeros rurales (83,79%) al organizar su viaje, buscan el alojamiento a través de este medio.
En relación a la muestra utilizada en el estudio, Mowen y Brown (1980) propusieron que los estudiantes son una muestra homogénea y por lo tanto son adecuados para las investigaciones. Además, debido a su homogeneidad en comparación con una muestra escogida de la población general, se consideran una muestra adecuada para probar las predicciones teóricas acerca de las relaciones entre variables (Calder et al., 1981), cosa que está en línea con el propósito de este estudio. Además, las muestras de los estudiantes se han utilizado con frecuencia en estudios de marketing (Keh y Pang, 2010; Samuelsen y Olsen, 2012; Troye y Supphellen, 2012) y los estudios de turismo (Kaplan et al, 2010; Lee y Gretzel, 2012; Yang et al., 2012). Por otra parte, los viajeros jóvenes rurales viajan en su mayoría con los amigos,
ya que suele ser un destino barato y donde pueden compartir gastos entre ellos (Toprural 2013). Por lo tanto, un alojamiento rural es un producto turístico accesible para los jóvenes españoles.
Los estudiantes universitarios españoles fueron reclutados a través de anuncios en los que se pedía colaboración a cambio de un pequeño obsequio. El procedimiento consistió en visitar la web de un producto turístico rural durante unos minutos (de 5 a 10 minutos). Las instruc-ciones para la visita fueron: “Imagina que estás buscando información para pasar un fin de semana con tus amigos en una casa rural y entras en el siguiente sitio web para informarte sobre este producto turístico. Visita la web durante unos minutos y a continuación te haremos unas preguntas sobre la misma”. Tras la exposición a la web, los individuos respondieron al cuestionario que incluía las variables del estudio. Entre otras cuestiones, se les preguntó a los participantes si habían accedido o no a leer el contenido generado por otros usuarios que se incluía en la web.
Validación del instrumento
Para la medición de las variables recurrimos a escalas previamente utilizadas en la literatura. Las dos dimensiones de la imagen se mi-dieron con escalas de tipo diferencial semántico de 1 a 10 puntos. La imagen afectiva utiliza cuatro adjetivos bipolares adaptados de Russell (1980) y usados posteriormente por otros investigadores en el ámbito del turismo (Baloglu y Brinberg, 1997; Walmsley y Young, 1998; Baloglu y McCleary, 1999a, 1999b; Baloglu y Mangaloglu, 2001). Las evaluaciones afectivas se corresponden con los sentimien-tos del individuo hacia el producto turístico: estresante/relajante, aburrido/divertido, deprimente/excitante y desagradable/agradable. Las evaluaciones cognitivas hacen referencia a las creencias y cono-cimientos que tienen los individuos sobre el objeto, es decir, evalu-aciones de los atributos del producto turístico: aislado/de fácil acceso, frío/amigable, sucio/limpio, tranquilo/ruidoso, inseguro/seguro. Esta medida de la imagen cognitiva se ha adaptado del estudio de Ong y Horbunluekit (1997). Al final del cuestionario los individuos propor-cionaron información demográfica.
Descripción de la muestra
La muestra consistió en estudiantes universitarios españoles may-ores de 18 años que no tenían conocimiento previo sobre el pro-ducto turístico utilizado en el estudio, es decir, no habían visitado el alojamiento rural con anterioridad y no pertenecían al área geográ-fica donde se encontraba el mismo. Se recogieron 194 cuestionarios válidos. La edad promedio de la muestra fue de 22 años (entre 18 y 28) y el 53,1% de los participantes fueron mujeres (Tabla 1).
78
ISSN: 0718-2724. (http://jotmi.org)Journal of Technology Management & Innovation © Universidad Alberto Hurtado, Facultad de Economía y Negocios.
J. Technol. Manag. Innov. 2015. Volume 10, Issue 3
En relación a la exposición al contenido generado por otros usuarios, como podemos observar en el Tabla 1, el 57,7% de la muestra accedió a leer los comentarios generados por otros usuarios cuando visitó el sitio web. Es decir, más de la mitad de la muestra tiene en cuenta esta fuente de información a la hora de informarse sobre este producto turístico.
dependiente la variable género (hombre o mujer). Los resultados (Tabla 2) muestran que existen diferencias significativas entre hom-bres y mujeres respecto a la imagen cognitiva percibida. Las mujeres perciben tanto una imagen afectiva como una imagen cognitiva más favorable sobre ese producto turístico que los hombres.
Variables Frecuencia Porcentaje
GÉNERO
Mujer 103 53,1 Hombre 91 46,9EDAD 18-21 107 55,2 22-28 87 44,8
ACCESO AL CONTENIDO GENERADO POR OTROS USUARIOS
Si 112 57,7 No 82 42,3TOTAL 194 100
Tabla 1. Características de la muestra
Resultados
Para analizar las diferencias entre la imagen percibida por hom-bres y mujeres, se realizaron análisis de la varianza con las variables imagen afectiva e imagen cognitiva como dependientes y como in-
VariableDependiente Género Media Desviación
Típica F Sig.
Imagen afectivaHombre 7,730 1,086
6,105 0,014Mujer 8,109 1,044
Imagen cognitivaHombre 7,703 1,110
6,741 0,010Mujer 8,093 0,981
Tabla 2. Resultados del análisis de la varianza. Género e imagen
El impacto del contenido generado por otros usuarios sobre las dos dimensiones de la imagen percibida por el turista potencial se anal-izó a través de un análisis de la varianza, considerando como variable independiente el acceso (si o no) del entrevistado al contenido gener-ado por otros usuarios. Los resultados (Tabla 3) muestran que existen diferencias en la imagen cognitiva entre los individuos que leen los comentarios y los que no. Los primeros tienen una imagen cognitiva
más favorable que los segundos. Sin embargo, no existen diferencias significativas respecto a la imagen afectiva percibida. Estos resultados confirman la importancia que tiene el contenido generado por otros usuarios en la formación de la imagen del producto turístico por parte del turista. En concreto, las opiniones de otros viajeros determinan la concepción e ideas que el receptor se hace del producto turístico, es decir, la dimensión cognitiva de la imagen.
VariableDependiente
Acceso al contenido generado por otros usuarios Media Desviación
Típica F Sig.
Imagen afectivaSí 7,948 1,199
0,065 0,799No 7,908 0,894
Imagen cognitivaSí 8,111 1,032
5,667 0,019No 7,743 1,102
Tabla 3. Resultados del análisis de la varianza. Contenido generado por otros usuarios
79
ISSN: 0718-2724. (http://jotmi.org)Journal of Technology Management & Innovation © Universidad Alberto Hurtado, Facultad de Economía y Negocios.
J. Technol. Manag. Innov. 2015. Volume 10, Issue 3
Conclusiones e implicaciones
El avance tecnológico y la creciente competencia internacional, afec-tan por tanto a la manera en que los destinos turísticos son imagina-dos, percibidos y consumidos. El turismo se refiere a menudo como una experiencia hedónica de consumo (Vogt y Fesenmaier, 1998). Con productos experienciales como los viajes y el turismo, la expe-riencia de consumo es un fin en sí mismo y la planificación de un viaje es un proceso social agradable e interactivo, donde la fantasía y las emociones también juegan un papel importante y los individuos están involucrados en una continua búsqueda de información (De-crop y Snelders 2004). Al pasar por este proceso y con la recopilación de toda esta información, el individuo crea una “imagen” o “represen-tación mental” (Alhemoud y Armstrong 1996; Tapachai y Waryszak, 2000) de lo que la experiencia de viaje podría ser en un futuro. Con la difusión de Internet, las interacciones entre los consumidores se han convertido en algo común, que ha llevado a algunos investigadores de turismo a señalar que el boca a boca online juega un papel importan-te en la adquisición y la retención de los consumidores en la era del comercio electrónico (Litvin et al., 2008; Vermeulen y Seegers, 2009; Ye et al., 2011).
Los comunicadores, encargados de marketing y los gestores de los destinos turísticos deben incorporar este recurso de comunicación interactiva a sus sitios web, ya que más de la mitad de la muestra que visitó la web accedió a leer los contenidos generados por otros usua-rios a la hora de informarse sobre este producto turístico. Este resul-tado tiene importantes implicaciones sobre el sector de turismo rural. Con esta opción habilitada los visitantes anteriores y los potencia-les podrán intercambiar opiniones y experiencias sobre los destinos y otros productos turísticos. Hasta ahora, los agentes de viajes eran prácticamente los únicos que aconsejaban la compra de determina-dos productos turísticos. En la actualidad, con la información y com-pra de estos productos a través de Internet, se presta más atención a la opinión de otros usuarios para suplir los consejos de los agentes y ayudar a la creación de imagen y decisiones de compra de los servi-cios turísticos.
Dada la importancia de las diferencias de género en la toma de de-cisiones de los consumidores (Wilborn et al., 2007), el género puede ser una variable fundamental a tener en cuenta a la hora de anali-zar las actitudes hacia la publicidad y acciones de marketing. En el caso del turismo, una actividad económica especialmente sensible a Internet, debido a su intangibilidad y globalidad, el género tiene un impacto importante. La revisión de la bibliografía pone de manifiesto que entre hombres y mujeres hay diferencias que también se eviden-cian entre los turistas (Figueroa et al., 2010). Con el presente estudio demostramos que hombres y mujeres se comportan de manera dife-rente ante la exposición al contenido generado por otros viajeros. Así, nuestros resultados revelan que son las mujeres las que más acceden a los contenidos generados por otros usuarios cuando visitan la web de un producto turístico. Esto puede ser debido a que son ellas las que más se involucran en las historias y las analizan teniendo en cuenta su experiencia personal, a la vez que son más subjetivas e intuitivas (Kim et al., 2007).
En cuanto a la percepción de la imagen por género, nuestros resul-tados también muestran diferencias tanto en la dimensión afectiva como en la dimensión cognitiva de la imagen, siendo las mujeres las que generan una imagen afectiva y cognitiva más favorable sobre el producto turístico en relación a los hombres. Las mujeres procesan más la información y de una manera más elaborada (Putrevu, 2001) y, además, al acceder en mayor medida que los hombres al contenido generado por otros usuarios, disponen de más información y, por tanto, se forman una imagen más favorable del producto turístico.
Los resultados de este estudio extienden los de trabajos previos en el contexto online, al demostrar que el contenido generado por otros usuarios afecta a la imagen de un producto turístico. En concreto, con nuestro estudio hemos observado que los individuos que han leído los contenidos generados por otros viajeros muestran una imagen cognitiva más favorable que los que no han leído dichos contenidos, mientras que la imagen afectiva obtiene una valoración muy simi-lar en ambos grupos. Esto se puede deber a que la imagen cognitiva es más manipulable que la afectiva a través de la búsqueda de infor-mación (Holbrook, 1978; Woodside y Lysonski, 1989; Um y Cromp-ton, 1990; Baloglu y McCleary, 1999), lo que está en la línea de los resultados encontrados. En consecuencia, la web de un producto turístico como plataforma debe ser considerada cuando se trata de mejorar la imagen del mismo. Es decir, el contenido generado por otros usuarios y proyectado a través de la web debe ser considerado como una oportunidad para crear y promover una imagen positiva del producto turístico.
En el ámbito de la promoción de un producto turístico, los conteni-dos generados por otros usuarios tienen un enorme valor añadido aún muy inexplorado para el desarrollo de la imagen favorable. Estas plataformas y aplicaciones pertenecen a la llamada Web 2.0, en clara expansión y generalización, por lo que hay que seguir indagando en sus efectos sobre la imagen cognitiva y afectiva del producto turístico. Por el momento, los resultados obtenidos en esta investigación pue-den ayudar a las administraciones públicas y gestores de marketing turístico a entender mejor el proceso de formación de la imagen a través de los sitios web de productos turísticos.
La principal limitación de este trabajo está relacionada con que el estudio se ha aplicado a una única web de turismo rural. Estudio debería replicarse con otros productos turísticos con el fin de poder generalizar los resultados. Asimismo, otras investigaciones deben lle-varse a cabo para averiguar qué resultados se producen en otras plata-formas diferentes al sitio web oficial del producto turístico. Por ejem-plo, portales tipo www.booking.com, www.triapvisor.es o incluso las redes sociales, también pueden contribuir a la creación de la imagen de un producto turístico rural y por ello podrían ser abordadas en futuras investigaciones.
Otra línea de investigación debe considerar el número y el tipo de comentarios (positivos o negativos) efectuados por otros turistas. En nuestro estudio los comentarios que había de otros usuarios eran to-dos positivos. Sin embargo, en la realidad, los consumidores buscan leer comentarios positivos y negativos simultáneamente. En general,
80
ISSN: 0718-2724. (http://jotmi.org)Journal of Technology Management & Innovation © Universidad Alberto Hurtado, Facultad de Economía y Negocios.
J. Technol. Manag. Innov. 2015. Volume 10, Issue 3
el número de comentarios positivos ocupa una mayor parte del total de las investigaciones (Resnick y Zeckhauser, 2002; Mulpuru, 2007). Aunque el número de comentarios positivos sea mayor, las críticas negativas son muy influyentes para los usuarios (Chevalier y Mayzlin, 2006; Pavlou y Dimoka, 2006). Así, los estudios sobre comentarios mixtos (una combinación de comentarios positivos y negativos) pu-ede ser otra área de investigación futura en la literatura de la imagen.
Acerca de los autores:
Carmen Hidalgo-Alcázar es doctora en Ciencias Empresariales por la Universidad de Murcia, España. Actualmente es profesora asistente en la Universidad Católica del Norte, Coquimbo (Chile). Sus intereses en cuanto a investigación están centrados en el marketing turístico y en las nuevas tecnologías aplicadas a la comunicación y al turismo. Imparte docencia en marketing, administración, comportamiento organizacional y metodología de la investigación. Ha publicado ar-tículos en revistas como Tourism&Management Studies y Journal of Urban Regeneration & Renewal.
María Sicilia es doctora por la Universidad de Murcia y profesora titular en el departamento de Comercialización e Investigación de Mercados de la Universidad de Murcia. Actualmente imparte do-cencia en publicidad, comunicación comercial e investigación de mercados. Realiza investigaciones en publicidad y comportamiento del consumidor. Ha publicado artículos en revistas como Journal of Business Research, Journal of Advertising, Journal of Interactive Mar-keting, Electronic Commerce Research and Applications y European Journal of Marketing.
Salvador Ruiz de Maya es doctor en Ciencias Económicas y Empre-sariales y Catedrático del Departamento de Comercialización e In-vestigación de Mercados de la Universidad de Murcia. Su actividad investigadora se centra principalmente en el área de marketing y el comportamiento del consumidor. Co-autor/editor de 12 libros, la mayoría relacionados con el comportamiento del consumidor, y de varios capítulos para 14 libros, sus trabajos de investigación se han publicado en revistas como Journal of Service Research, Ecological Economics, Marketing Letters, Journal of Business Ethics, Journal of Business Research, Journal of Advertising, Journal of Interactive Mar-keting, Electronic Commerce Research and Applications, Corporate Social Responsibility and Environmental Management y European Journal of Marketing.
Referencias
Alhemoud, A.M., & Armstrong, E.G. (1996). Image of Tourism At-tractions in Kuwait. Journal of Travel Research, 34(4), 76-80. DOI: 10.1177/004728759603400413
Anderson, P. (2007). What is Web 2.0? Ideas, technologies and implica-tions for education. Bristol, UK: JISC, 2007.
Andonova, V., Stoyanova, A., Valencia, C., & Juliao-Rossi, J. (2013). What can Latin-American entrepreneurs learn from Catalan ga-
zelles?. Academia Revista Latinoamericana de Administracion, 26(2), 290-317. http://dx.doi.org/10.1108/ARLA-06-2013-0069
Baloglu, S., & Brinberg, D. (1997). Affective images of tourism desti-nation. Journal of Travel Research, 35(4), 11-15.
Baloglu, S., & Mangaloglu, M. (2001). Tourism destinations images of Turkey, Egypt, Greece, and Italy as perceived by US-based tour opera-tors and travel agents. Tourism Management, 22(1), 1–9.
Baloglu, S., & Mccleary, K. (1999a). A Model of Destination Image Formation. Annals of Tourism Research, 26 (4), 868-897. http://dx.doi.org/10.1016/s0160-7383(99)00030-4
Baloglu, S., & Mccleary, K. (1999b). U.S. International Pleasure Trav-elers’ Image of Four Mediterranean Destinations: A Comparison of Visitors and Non-Visitors. Journal of Travel Research, 38(2), 144-152. http://dx.doi.org/10.1177/004728759903800207
Bandyopadhyay, R., & Morais, D. (2005). Representative Dissonance. India’s Self and Western Image. Annals of Tourism Research, 32(4), 1006–1021. doi:10.1016/j.annals.2005.02.002
Barrera, E. (2006). Turismo rural, un agronegocio para el desarrollo de territorios rurales. En: Vieites, C. Agronegocios alternativos. En-foque, importancia y bases para la generación de actividades agropec-uarias no tradicionales. Editorial Hemisferio Sur, Buenos Aires, Ar-gentina pp. 464.
Battino, S. (2013). La imagen que perciben los turistas que visitan Cerdeña. Primeras consideraciones extraídas de una investigación realizada mediante cuestionarios. Cuadernos de Turismo, 32, 37-64.
Bombelli, E., Fernandez, S., Di Pierro, V., Britos, M.B., Bertoncello, R., & Cataldi, Z. (2013). Emprendimientos de turismo rural basados en TIC como recursos tecnológicos de competitividad .42 JAIIO, Jor-nadas Argentinas de Informática.
Bosangit, C., & Mena, M. (2009). Meanings, Motivations and Be-havior of Filipino-American First-time Visitors of the Philippines: A Content Analysis of Travel Blogs. Paper presented at the International Conference on Tourist Experiences: Meanings, Motivations and Be-havior, Preston, April 1 to 4.
Buhalis, D. (2003). eTourism: Information Technology for Strategic Tourism Management. Prentice Hall.
Buhalis, D., & Law, R. (2008). Progress in information technology and tourism management: 20 years on and 10 years after the Internet-The state of eTourism research. Tourism Management, 29(4), 609-623. doi:10.1016/j.tourman.2008.01.005
Calder, B.J., Phillips, L.W., & Tybout, A.M. (1981). Designing research for application. Journal of Consumer Research, 8(2), 197-207. http://dx.doi.org/10.1086/208856
81
ISSN: 0718-2724. (http://jotmi.org)Journal of Technology Management & Innovation © Universidad Alberto Hurtado, Facultad de Economía y Negocios.
J. Technol. Manag. Innov. 2015. Volume 10, Issue 3
Cataldi, Z., Bombelli, E. C., Fernandez, S., Di Pierro, V., Barberis, J. G., & Bertoncello, R. (2012). TIC y turismo rural. In XIV Workshop de Investigadores en Ciencias de la Computación. Argentina.
Chen, J., & Uysal, M. (2002). Market positioning analysis: A hybrid approach. Annals of Tourism Research, 29(4), 987-1003. doi:10.1016/S0160-7383(02)00003-8
Chevalier, J.A., & Mayzlin, D. (2006). The effect of word of mouth on sales: Online book reviews. Journal of Marketing Research, 43(3), 345-354. http://dx.doi.org/10.1509/jmkr.43.3.345
Colley, A., & Maltby, J. (2008). Impact of the Internet in our lives: Male and female personal perspectives. Computers in Human Behavior, 24(5), 2005-2013. doi:10.1016/j.chb.2007.09.002
Cox, C., Burgess, S., Sellitto, C., & Buultjens, J. (2009). The role of user-generated content in tourists’ travel planning behaviour. Jour-nal of Hospitality Marketing & Management, 18(8), 743-764. http://dx.doi.org/10.1080/19368620903235753
Crompton, J. (1979). An Assessment of the Image of Mexico as a Va-cation Destination and the Influence of Geographical Location upon That Image. Journal of Travel Research, 17(4), 18-23.
Decrop, A., & Snelders, D. (2004). Planning the Summer Vacation: An Adaptable Process. Annals of Tourism Research, 31(4), 1008-1030. doi:10.1016/j.annals.2004.03.004
Dichter, E. (1985). What is an image?. Journal of Consumer Research, 13, 455-472.
Dittmar, H., Long, K., & Meek, R. (2004). Buying on the Internet: Gender Differences in On-line and Conventional Buying Motiva-tions. Sex Roles, 50(5/6), 423-444.
Echtner, C.M., & Ritchie, J.R.B. (1991). The Meaning and Measure-ment of Destination Image. The Journal of Tourism Studies, 2(2), 2-12.Esteban, A., Mondéjar, J.A., Mondéjar, J., & Meseguer, M.L. (2010). La gestión del turismo en los programas de innovación rural de Castilla-La Mancha. Cuadernos de Gestión, 10, nº especial, 111-124.
Everhart, D.E., Shucard, J.L., Quatrin, T., & Shucard, D.W. (2001). Sex-related Differences in Event-related Potentials, Face Recognition, and Facial Affect Processing in Prepubertal Children. Neuropsychol-ogy, 15(3), 329-341.
Figueroa D.C., Segovia P.M., & Talón B.P. (2010). La perspectiva de género y el uso de Internet en la comercialización turística. VIII Con-greso “Turismo y Tecnologías de la Información y las Comunicaciones” Turitec 2010.
Fischer, E., & Arnold, S.J. (1994). Sex, Gender Identity, Gender Role Attitudes, and Consumer Behavior. Psychology & Marketing, 11(2), 163- 182. http://dx.doi.org/10.1002/mar.4220110206
Gallarza, M.G., Gil, I., & Calderón, H. (2002). Destination Image: To-wards a Conceptual Framework. Annals of Tourism Research, 29(1), 56-78. doi:10.1016/S0160-7383(01)00031-7
Gargallo-Castel, A., Esteban-Salvador, L., & Pérez-Sanz, J. (2010). Impact of gender in adopting and using ICTs in Spain. Journal of technology management & innovation, 5(3), 120-128. http://dx.doi.org/10.4067/S0718-27242010000300009
Gartner, W.C. (1993). Image Formation Process. Journal of Travel and Tourism Marketing, 2(2/3), 191-215.
González S.R., & García M.F (2008). Los blogs y los portales de ser-vicios, las nuevas herramientas de comunicación en el turismo rural. VII Congreso “Turismo y Tecnologías de la Información y las Comu-nicaciones” Turitec 2008.
Hall, J.A. (1984). Nonverbal Sex Differences: Communication Accuracy and Expressive Style. Baltimore: Johns Hopkins University Press.
Hargittai, E., & Shafer, S. (2006). Differences in actual and perceived online skills: the role of gender. Social Science Quarterly, 87(2), 432-448.
Henning-Thurau, T., Gwinner, K., Walsh, G., & Gremler, D. (2004). Electronic word-of-mouth via consumer-opinion platforms. Journal of Interactive Marketing, 18(1), 38-52. doi:10.1002/dir.10073
Herrero, Á., & San Martín, H. (2012). Developing and testing a global model to explain the adoption of websites by users in rural tourism accommodations. International Journal of Hospitality Management, 31(4), 1178-1186. doi:10.1016/j.ijhm.2012.02.005
Holbrook, M. (1978). Beyond Attitude Structure: Toward the Information-al Determinants of Attitude. Journal of Marketing Research, 15, 545-556.
Holbrook, M. (1986). Aims, Concepts, and Methods for the Repre-sentation of Individual Differences in Esthetics Responses to Design Features. Journal of Consumer Research, 13, 337-347.
Huertas R.A. (2008). Aplicación de la Web 2.0 a los destinos turísti-cos. Implantación y diferencias. VII Congreso Turismo y Tecnologías de la Información y las Comunicaciones Turitec 2008.
Informe ePyme (2013). Análisis sectorial de implantación de las TIC en la Pyme española. Fundetec.
Jackson, L.A., Ervin, K.S., Gardner, P.D., & Schmitt, N. (2001). Gen-der and the Internet: Women communicating and men searching. Sex Roles, 44, 363–379
Jani, D., & Hwang, Y. (2011). User-generated Destination Image through Weblogs: A Comparison of Pre- and Post-visit Images. Asia Pacific Journal of Tourism Research, 16(3), 339-356. http://dx.doi.org/10.1080/10941665.2011.572670
82
ISSN: 0718-2724. (http://jotmi.org)Journal of Technology Management & Innovation © Universidad Alberto Hurtado, Facultad de Economía y Negocios.
J. Technol. Manag. Innov. 2015. Volume 10, Issue 3
Jeong, C., Holland, S., Jun, S.H., & Gibson, H. (2012). Enhancing destination image through travel website information. International journal of tourism research, 14(1), 16-27.
Kaplan, M.D., Yurt, O., Guneri, B., & Kurtulus, K. (2010). Brand-ing places: applying brand personality concept to cities. Euro-pean Journal of Marketing, 44(9/10), 1286-1304. http://dx.doi.org/10.1108/03090561011062844
Keh, H.T., & Pang, J. (2010). Customer reactions to service separa-tion. Journal of Marketing, 74(2), 55-70. http://dx.doi.org/10.1509/jmkg.74.2.55
Kim, D., Lehto, X., & Morrison, A. (2007). Gender differences in online travel information search: Implications for marketing Com-munications on the Internet. Tourism Management, 28(2), 423-433. doi:10.1016/j.tourman.2006.04.001
Law, R., Qi, S., & Buhalis, D. (2010). Progress in tourism manage-ment: A review of website evaluation in tourism research. Tourism Management, 31(3), 297–313. doi:10.1016/j.tourman.2009.11.007
Lawson, F, & Band-Bovy, M. (1977). Tourism and recreational devel-opment. London: Architectural Press.
Lee, W., & Gretzel, U. (2012). Designing persuasive destination web-sites: A mental imagery processing perspective. Tourism manage-ment, 33(5), 1270-1280. doi:10.1016/j.tourman.2011.10.012
Lewis, R.C., & Chambers, R.E. (2000). Marketing leadership in hospi-tality, foundations and practices (3ed). New York: Wiley.
Lin, Y., & Huang, J. (2006). Internet blogs as a tourism marketing me-dium: A case study. Journal of Business Research, 59(10), 1201-1205.
Litvin, S.W., Goldsmith, R. E., Pan, B. (2008). Electronic word-of-mouth in hospitality and tourism management. Tourism Manage-ment, 29(3), 458–468. doi:10.1016/j.tourman.2007.05.011
Marinao, E., Chasco, C., & Torres, E. (2012). Trust in tourist destina-tions. The role of local inhabitants and institutions. Academia Revista Latinoamericana de Administración, 51, 27-47.
Marzo-Navarro, M., Pedraja-Iglesias, M., & Vinzó, L. (2010). Ori-entación hacia el Desarrollo del Turismo del Vino de las Webs de las Bodegas de La Rioja y Aragón (España). Journal of Technology Management & Innovation, 5(2), 113-132. http://dx.doi.org/10.4067/S0718-27242010000200011
Mazanec, J.A. (1994). Consumer Behaviour in Tourism, en Witt, S. y Moutinho, L. [ed.]: Tourism Marketing and Management Handbook, pp. 63-68. Hempel Hempstead: Prentice-Hall.
Mclean, J. (2009). State of the blogosphere. Technorati Report.Meyers-Levy, J. (1988). Influence of Sex Roles on Judgment. Journal of Consumer Research, 14, 522-530.
Meyers-Levy, J., & Maheswaran, D. (1991). Exploring Differences in Males’ and Females’ Processing Strategy. Journal of Consumer Re-search, 18, 63-70.
Meyers-Levy, J., & Sternthal, B. (1991). Gender Differences in the Use of Message Cues and Judgments. Journal of Marketing Research. 28, 84- 96.
Minguetti, V., & Buhalis, D. (2010). Digital divide in tourism. Journal of Travel Research, 49(3), 267-281.
Mowen, J.C., &Brown, S.W. (1981). On explaining and predicting the effectiveness of celebrity endorsers. Advances In Consumer Research, 8(1), 437-441.
Mulpuru, S. (2007). Which Personalization Tools Work For eCom-merce—And Why. Forrester Research.
Ong, B.S., & Horbunluekit, S. (1997). The Impact of a Thai Cultural Show on Thailand’s Destination Image. American Business Review, 15(2), 97-103.
Pan, B., Maclaurin, T., & Crotts, J. (2007). Travel blogs and the impli-cations for destination marketing. Journal of Travel Research, 46(1), 35-45.
Pavlou, P.A., & Dimoka, A. (2006). The nature and role of feedback text comments in online marketplaces: Implications for trust build-ing, price premiums, and seller differentiation. Information Systems Research, 17(4), 392-414.
Pike, S., & Ryan, C. (2004). Destination positioning analysis through a comparison of cognitive, affective and cognitive perceptions. Journal of Travel Research, 42(4), 333–342. DOI: 10.1177/0047287504263029
Polo Peña, A.I., Frías Jamilena, D.M., & Castañeda García, J.A. (2015). Market orientation and business results among small‐scale service firms. Academia Revista Latinoamericana de Administración, 28(1), 135-166. http://dx.doi.org/10.1108/ARLA-04-2013-0005
Putrevu, S. (2001). Exploring the Origins and Information Processing Differences Between Men and Women. Academy of Marketing Science Review, 10(1), 1-14.
Reinders, J., & Baker, M. (1997). The future for direct retailing of travel and tourism products: the influence of information technology (pp. 119-128). Springer Vienna.
Resnick, P., & Zeckhauser, R. (2002). Trust among strangers in Inter-net transactions: Empirical analysis of eBay’s reputation system. The Economics of the Internet and E-commerce, 11(2), 23-25.
Royo Vela, M., & Seraols, CH. (2005). El turismo rural-cultural: un modelo de gestión del marketing turístico a nivel local, basado en la medida de la imagen del turismo. Cuadernos de turismo, 16, 197-220. Samuelsen, B.M., & Olsen, L.E. (2012). The attitudinal response to
83
ISSN: 0718-2724. (http://jotmi.org)Journal of Technology Management & Innovation © Universidad Alberto Hurtado, Facultad de Economía y Negocios.
J. Technol. Manag. Innov. 2015. Volume 10, Issue 3
alternative brand growth strategies. European Journal of Marketing, 46(1/2), 177-191. http://dx.doi.org/10.1108/03090561211189293
San Martín, H., & Del Bosque, I.A.R. (2008). Exploring the Cogni-tive–Affective Nature of Destination Image and the Role of Psycho-logical Factors in Its Formation. Tourism Management, 29(2), 263-277. doi:10.1016/j.tourman.2007.03.012
Sánchez, M.G. (2010). Implicaciones de Género en la Sociedad de la Información: Un Análisis desde los Determinantes de Uso de Internet en Chile y México. Journal of Technology Management & Innovation, 5(1), 108-126. http://dx.doi.org/10.4067/S0718-27242010000100009 Saranow, J. (2004). Getting Travel Advice From a Stranger. The Wall Street Journal, 28.
Schmallegger, D., & Carson, D. (2008). Blogs in tourism: Changing approaches to information exchange. Journal of Vacation Marketing, 14(2), 99-110. http://dx.doi.org/10.1177/13567667070875
Senecal, S., & Nantal, A. (2004). The influence of online product rec-ommendations on consumers’ online choices . Journal of Retailing, 80(2), 159-169. doi:10.1016/j.jretai.2004.04.001
Stabler, M.J. (1995). The image of destination regions: Theoretical and empirical aspects. In B. Goodall, & G. Ashworth (Eds.), Marketing in tourism Industry: The Promotion of destination regions (pp. 133–159). London.
Standing, C., Tang-Taye, J.P., & Boyer, M. (2014). The Impact of the Internet in Travel and Tourism: A Research Review 2001–2010. Journal of Travel & Tourism Marketing, 31(1), 82-113. DOI: 10.1080/10548408.2014.861724
Tapachai, N., & Waryszak, R. (2000). An Examination of the Role of Beneficial Image in Tourist Destination Selection. Journal of Travel Research, 39(1), 37-44. DOI: 10.1177/004728750003900105
Toprural (2013). Radiografía del Viajero Rural, 2013. Retrieved from http://www.toprural.com/radiografia-del-viajero-rural_l.html
Troye, S.V., & Supphellen, M. (2012). Consumer Participation in Co-production: “I Made It Myself ” Effects on Consumers’ Sensory Per-ceptions and Evaluations of Outcome and Input Product. Journal of marketing, 76(2), 33-46. http://dx.doi.org/10.1509/jm.10.0205
Um, S., & Crompton, J.L. (1990). Attitude Determinants in Tour-ism Destination Choice. Annals of Tourism Research, 17(3), 432-48. doi:10.1016/0160-7383(90)90008-F
Vermeulen, I.E., & Seegers, D. (2009). Tried and tested: The impact of online hotel reviews on consumer consideration. Tourism Manage-ment, 30(1), 123–127. doi:10.1016/j.tourman.2008.04.008
Vogt, C.A., & Fesenmaier, D.R. (1998). Expanding the Functional Tourism Information Search Model: Incorporating Aesthetic, He-donic, Innovation, and Sign Dimensions. Annals of Tourism Research, 25(3), 551-578. doi:10.1016/S0160-7383(98)00010-3
Walmsley, D., & Young, M. (1998). Evaluative images and tourism: The use of personal constructs to describe the structure of destina-tion Images. Journal of Travel Research, 36(3), 65–69. http://dx.doi.org/10.1177/004728759803600307
Wegner, A. (2008). Analysis of travel bloggers’ characteristics and their communication about Austria as a tourism destination. Journal of Vacation Marketing, 14 (2), 169-176.
Wilborn, L.R., Brymer, R.A., & Schmidgall, R. (2007). Ethic decisions and gender differences of European hospitality students. Tourism and Hospitality Research, 7(3-4), 230-241.
Wirtz, B.W., Schilke, O., & Ullrich, S. (2010). Strategic development of business models: Implications of the Web 2.0 for creating value on the Internet. Long Range Planning, 42(2/3), 272–290.
Woodside, A., & Lysonski, S. (1989). A General Model of Traveler Destination Choice. Journal of Travel Research, 27(4), 8-14.
Yang, J., Ryan, C., & Zhang, L. (2012). The use of questionnaires in Chinese tourism research. Annals of Tourism Research, 39(3), 1690-1693. doi:10.1016/j.annals.2012.02.002
Ye, Q., Law, R., Gu, B., & Chen, W. (2011). The influence of user-gen-erated content on traveler behavior: An empirical investigation on the effects of e-word-of-mouth to hotel online bookings. Computers in Human Behavior, 27(2), 634–639. doi:10.1016/j.chb.2010.04.014
84
ISSN: 0718-2724. (http://jotmi.org)Journal of Technology Management & Innovation © Universidad Alberto Hurtado, Facultad de Economía y Negocios.
J. Technol. Manag. Innov. 2015. Volume 10, Issue 3
Regulation and Technology Innovation: A Comparison of Stated and Formal Regulatory Barriers throughout the Technology Innovation Process
Robert Engberg 1 Peter Altmann 2*
Abstract: Regulation is often mentioned as a barrier to technology innovation in various industries. Delayed market entry, stifled creativity, added activities and resource requirements are some frequently mentioned barriers. The study presented here explored various claims of regulation acting as a barrier to technology innovation. The findings suggest that formal statutory requirements only partly explain why regulation is perceived as a technology innovation barrier. Findings further indicate several discrepancies between stated and formal regulatory barriers and suggest that the majority of the stated barriers emerge within the organization during operationalization and the technology innovation process.
Keywords: regulation; barrier; technology innovation management; R&D management; new product development process; NPD
Introduction
Many firms conduct their technology innovation activities in a reg-ulatory environment affected by various rules and directives main-tained and upheld by an authority. The impact of these regulations on a firm’s technology innovation activities can be both positive as well as negative depending on various industry and firm characteristics (Dodgson, Gann, & Salter, 2008), as well as technological characteris-tics (Ashford & Heaton, 1983).
Although clear that regulation can negatively impact technology in-novation in a wide range of industries (Rothwell, 1980; Ashford & Heaton, 1983), the reason why it does so is less clear. Findings suggest that the negative impact on technology innovation is most noticeable in industries with standards for minimum quality, safety, and efficacy (Maxwell, 1998; Hall & Bagchi-Sen, 2002), especially when regula-tion is too rigidly imposed or administratively complicated (Pearce & Turner, 1984), or when it limits and encumbers technology related activities and outcomes (Garud & Rappa, 1994).
However, findings showing that regulation stifles technology innova-tion often relies on perceptual measures (e.g. Hauptman & Roberts, 1987). Little concrete evidence exists in support of the widespread perception within certain industries that regulation negatively im-pacts technology innovation (Ashford & Heaton, 1983). Further-more, a closer examination of the perceptual measures reveal that statements of regulation as a barrier to technology innovation tends to diminish over time within individual firms (Hauptman & Roberts, 1987). Increasingly, investigations have suggested that regulation in itself does not stifle technology innovation, but rather attempts of its operationalization (Ashford & Heaton, 1983; Georg, Røpke, & Jør-gensen, 1992; Hadjimanolis, 2003; Herzlinger, 2006).
Submitted June 22th 2015 / Approved October 7th 2015
1 Department of Innovation Management, School of Business, Engineering and Science, Halmstad University, Halmstad, Sweden 2 Department of Technology Management and Economics, Chalmers University of Technology, Gothenburg, Sweden. *Corresponding author: [email protected]
To this background, the study presented in this paper investigates how well stated regulatory barriers coincide with formal regulatory requirements during the technology development process. Of prin-cipal interest is to increase our understanding of underlying causes regarding possible discrepancies. Relying on an insider-outsider re-search approach (see Louis & Bartunek, 1992) we conducted an in-depth case study at a large multinational medical device company. Our case is suitable for four reasons. First, the medical device indus-try is characteristic of an industry where regulation is often reported as a key barrier to technology innovation (Eisenberg, 2007; Kaplan et al., 2004). Second, the case is situated in a low-velocity industry environment thus mitigating the risk of regulatory barriers stemming from outdated regulations. Third, the case company was recently sub-jected to regulatory inspection and risked restrictions on key mar-kets. Finally, one of the authors has worked with technology innova-tion within the case company since 2006.
Method
Our investigation is based on desk research, interviews, and an in-depth case study. One author (hereafter called the insider) has nine years of experience in various roles related to technology development and quality management at the case company, a multinational with USD 3.2 billion in turnover and nearly 16,000 employees in 2015 (upon re-quest, all information pertaining to the company is made anonymous).
The insider’s vocational experiences include but are not limited to: the development of a new quality system, participation in several technol-ogy innovation projects, as well as involvement in several regulatory audits conducted at the case company. This ensured contextual knowl-edge related to the handling, understanding, and operationalization of regulatory frameworks deemed necessary for the aim of this study.
85
ISSN: 0718-2724. (http://jotmi.org)Journal of Technology Management & Innovation © Universidad Alberto Hurtado, Facultad de Economía y Negocios.
J. Technol. Manag. Innov. 2015. Volume 10, Issue 3
This research study was conducted in three stages. During the first, the insider and outsider met to discuss the ongoing regulatory inspec-tions. The insider argued that whilst regulation is perceived as a barri-er to technology innovation within the case company, the actual cause was unclear. To address this gap, the insider set out to conduct desk research centered on regulation as a barrier to technology innovation. The desk research included both academic articles on technology in-novation in regulatory environments as well as the regulatory frame-work in question, i.e. the U.S. Food and Drug Administration (FDA). Insights from literature formed the basis for further investigations by providing a framework over various reasons that regulation inhibits technology innovation. Various operational limitations and resource demands are examples of these ‘inhibitors’.
The second stage involved interviews. We selected the following representatives from functional areas associated with technology in-novation and regulation: 1) R&D manager, 2) technical manager, 3) site manager, 4) regulatory and quality assurance manager, 5) proj-ect manager, 6) three new product development (NPD) engineers, 7) and a former FDA inspector. These interviews were transcribed and analyzed to identify statements related to regulation inhibiting tech-nology innovation. Statements were initially identified in terms of impacting the outcome or the process of technology innovation, and then grouped into categories that we coded based on the statements. For example, a statement regarding submittal time would be coded under ‘time to market’. Statements could include examples of impact and individual opinions and beliefs about their own work and the work of others. The aim was not to collect evidence for the inhibitors found during the previous desk research stage, but to collect data on the various ways individuals reported regulation as a barrier.
Finally, we compared and contrasted the findings from the two previ-ous stages by sorting the ways regulation reportedly inhibited tech-nical innovation, i.e. stated barriers, as well as assess the degree of concrete mention in regulatory text, i.e. regulatory requirements. We relied on the stage gate model of technology innovation to guide us in this effort to compare stated and concrete examples of formal regula-tory requirements.
Regulation and the technology innovation process
According to the 2003 PDMA study, firms increasingly rely on for-mal product development processes (Barczak, Griffin, & Kahn, 2009). One commonly used method is to treat technology development as occurring in several stages. The exact nature of what these stages looks like is industry and firm specific, but generally they include: discovery, scoping, build business case, development, testing and val-idation, followed by launch and post-launch review (Cooper, 2008; Cooper, Edgett, & Kleinschmidt, 2002).
In industries where regulation has a high impact on technology devel-opment, e.g. the clean technology industry (Pearce & Turner, 1984),
the chemical industry (Ashford & Heaton, 1983), and the medical de-vices industry (Eisenberg, 2007; Kaplan et al., 2004), these stages and gates consider regulation to a higher degree (for an example see Pi-etzsch, Shluzas, Paté-Cornell, Yock, & Linehan, 2009). For industries sharing a focus on minimum quality standards, safety and efficacy, the regulatory barriers are quite similar. Minimum quality standards are enforced through quality management systems and/or directly on products, and necessitate steps for how to establish evidence of safety, efficacy and quality controls during the product lifecycle.
Regulation can thus directly limit technology innovation outcomes as well as the processes involved in providing evidence of safety and ef-ficacy claims. These processes are often both costly and time consum-ing and increase risks associated with technology innovation (Kaplan et al., 2004). Similarly, regulatory compliance often requires manu-facturers and developers to ensure that the manufacturing outputs in question, as well as associated activities, are compliant with statutes. Furthermore, given the vast amount of manufacturing outputs cov-ered by regulatory frameworks, manufacturers often have problems navigating the regulatory text. Also, the applicability of a statute nor-mally varies throughout the technology innovation process. In order to facilitate further reading, we now present the case-specific context of medical devices development.
Medical devices that are marketed in the U.S. are regulated by the FDA. In the case of the FDA, quality standards, safety, and efficacy are ensured through four main statutes: 1) Premarket Notification, other-wise known as the 510(k), 2) Premarket Approval (PMA), 3) Investi-gational Device Exemption (IDE), and 4) Quality System Regulation (QSR). The 510(k) and the PMA achieve their purpose of ensuring product safety and efficacy by requiring medical device manufactur-ers to demonstrate that a new device is substantially equivalent to an already approved device, or by using for instance clinical studies to demonstrate that the new device is safe and effective for intended use. Finally, the QSR dictates requirements on the quality management system (QMS) that requires various organizational activities, such as documentation, as well as by provides specifications for technology innovation activities and outcomes. The relevance of a certain statute depends on two things: 1) the risk classification of the medical device (ranging from 1-4 on major markets) where larger numbers signify greater risk, and correspondingly more rigorous regulatory require-ments, and 2) the stage of the medical device development process.
To this background, we will adopt the adaptation of Pietzsch et al. (2009) of the stage-gate process consisting of five major stages: I) ini-tiation, opportunity, and risk analysis, II) formulation, concept, and feasibility, III) design and development, and verification and valida-tion, IV) final validation and launch preparation, and V) launch and post-launch assessment. Given that Stage III contains regulatory sub-mission, we omit the last two stages given that the majority of tech-nology development takes place in the first three. In the next section, we present our case findings.
86
ISSN: 0718-2724. (http://jotmi.org)Journal of Technology Management & Innovation © Universidad Alberto Hurtado, Facultad de Economía y Negocios.
J. Technol. Manag. Innov. 2015. Volume 10, Issue 3
Case findings
Below we account for our case findings by describing each of the three stages in terms of their formal regulatory requirements as well as the stated barriers.
Stage I and regulatory requirements
Stage I involves activities focused on user need identification and idea screening activities such as intellectual property (IP) reviews, prelim-inary market analysis, and estimations of clinical impact. To ensure efficacy, needs need to be verified. Such a verification process may involve talking to physicians, patients and technology users, as well as direct observation in clinical settings. Stage I also involves a review of existing solutions as well as continued activities aimed at market assessment. Finally, Stage I contains initial assessments of technol-ogy risks as well as potential regulatory paths. Formally, he FDA does not impact any of the activities in Stage I, but later regulatory steps depend on applicants being able to show documentation of need veri-fication and risk assessment (see Stage II).
Stage I and stated barriers
Stage I mostly lacks formal regulatory requirements. However, a qual-ity and regulatory assurance manager told us that “people complain about for instance design control limiting their work during phases when it does not even apply”. Similarly, a former FDA inspector told us that “much of the impact is due to work being done that the FDA does not specifically require”. One example of such unnecessary work is found during the early product concept development. NPD engi-neers were complaining that “the design control limits early creativ-ity” in terms of product design. Formally, design control starts with Stage II.
The only formal requirement impacting Stage I is associated with documentation of need verification and risk assessment. The FDA does not specify steps for conducting such a need verification and risk assessment. Instead, companies rely on tools such as quality function deployment to map customer expectations and needs into processes and parameters that will fulfill them, and basic failure effect mode analysis to assess the risk of product concepts.
Finally, firms normally consider the radicalness of the proposed tech-nology and the preferred market entry model during Stage I. Depend-ing on a company’s R&D strategy and product portfolio, developers focus on certain risk classes when developing medical devices. Such a focus was mentioned by the R&D manager to be “a barrier to more radical innovation”. But the statutes do not limit a company’s develop-ment efforts per se, but rather detail what the regulatory process looks like leading to approval. The choice of preferred class is determined by various functional strategies.
Stage II and regulatory requirements
Stage II includes development activities that start once the develop-ment project is approved. The main focus is on concept formulation and feasibility assessment. These activities are the first to be subject to regulation in the form of design controls and are formally regu-lated by 21 CFR 820.30. One specific requirement is the creation and maintenance of a design history file (DHF) indicating that the device is developed in accordance to a previously approved design plan. One important step is to document user inputs that impact design choices. Common sources for such input are existing product complaints or meetings with potential end users such as doctors, technicians and nurses. Furthermore, user input can also include information related to the intended use, testing requirements, biocompatibility require-ments, and requirements related to the physical aspects of the final device. The purpose is to verify user needs as inputs to the design process and to ensure that these are secured by design choices.
As with most technology development, medical devices development is marked by iterations and frequent changes. Computational models (such as finite element analysis), although not formally required, are often used in this development stage to ensure that verified needs are met and that risks are controlled. Formally, the FDA requires that the DHF is maintained to ensure that such changes do not compromise the ability to satisfy an identified need, or affect the risk of the product. In addition, the FDA requires continuous design reviews throughout the design process. Finally, the FDA requires a risk analysis where risks are identified and mitigated to the level that corresponds or im-proves upon existing products used for the same purpose.
In sum, Stage II marks the beginning of formal requirements. Al-though requirements, such as risk analysis, are not specified in terms of process steps, there exist industry standards for how such a risk analysis should be conducted (e.g. ISO 14971). Several tools, such as Failure Mode Effect Analysis (FMEA) and Fault Tree Analysis (FTA), are commonly adopted to conduct and manage risk analysis during Stage II.
Stage II and stated barriers
Our findings suggest that this stage is perceived to be quite problematic. Issues related to encumbering activities, bothersome quality systems, and limitations to product designs were examples mentioned. We will now elaborate on each.
As for encumbering activities, NPD engineers reported that the doc-umentation associated with Stage II is cumbersome and ties up im-portant resources from other value-adding tasks. One NPD engineer reported that “the documentation has been drafted from scratch three times” when referring to documentation during early design related
87
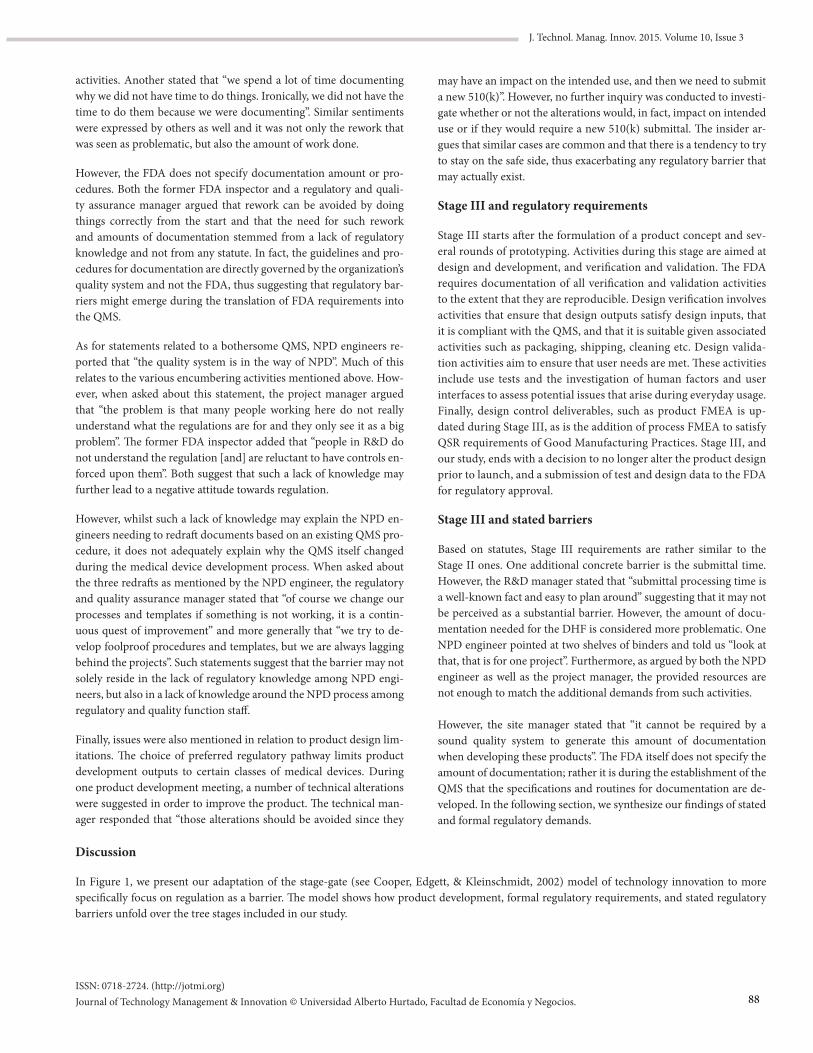
ISSN: 0718-2724. (http://jotmi.org)Journal of Technology Management & Innovation © Universidad Alberto Hurtado, Facultad de Economía y Negocios.
J. Technol. Manag. Innov. 2015. Volume 10, Issue 3
activities. Another stated that “we spend a lot of time documenting why we did not have time to do things. Ironically, we did not have the time to do them because we were documenting”. Similar sentiments were expressed by others as well and it was not only the rework that was seen as problematic, but also the amount of work done.
However, the FDA does not specify documentation amount or pro-cedures. Both the former FDA inspector and a regulatory and quali-ty assurance manager argued that rework can be avoided by doing things correctly from the start and that the need for such rework and amounts of documentation stemmed from a lack of regulatory knowledge and not from any statute. In fact, the guidelines and pro-cedures for documentation are directly governed by the organization’s quality system and not the FDA, thus suggesting that regulatory bar-riers might emerge during the translation of FDA requirements into the QMS.
As for statements related to a bothersome QMS, NPD engineers re-ported that “the quality system is in the way of NPD”. Much of this relates to the various encumbering activities mentioned above. How-ever, when asked about this statement, the project manager argued that “the problem is that many people working here do not really understand what the regulations are for and they only see it as a big problem”. The former FDA inspector added that “people in R&D do not understand the regulation [and] are reluctant to have controls en-forced upon them”. Both suggest that such a lack of knowledge may further lead to a negative attitude towards regulation.
However, whilst such a lack of knowledge may explain the NPD en-gineers needing to redraft documents based on an existing QMS pro-cedure, it does not adequately explain why the QMS itself changed during the medical device development process. When asked about the three redrafts as mentioned by the NPD engineer, the regulatory and quality assurance manager stated that “of course we change our processes and templates if something is not working, it is a contin-uous quest of improvement” and more generally that “we try to de-velop foolproof procedures and templates, but we are always lagging behind the projects”. Such statements suggest that the barrier may not solely reside in the lack of regulatory knowledge among NPD engi-neers, but also in a lack of knowledge around the NPD process among regulatory and quality function staff.
Finally, issues were also mentioned in relation to product design lim-itations. The choice of preferred regulatory pathway limits product development outputs to certain classes of medical devices. During one product development meeting, a number of technical alterations were suggested in order to improve the product. The technical man-ager responded that “those alterations should be avoided since they
may have an impact on the intended use, and then we need to submit a new 510(k)”. However, no further inquiry was conducted to investi-gate whether or not the alterations would, in fact, impact on intended use or if they would require a new 510(k) submittal. The insider ar-gues that similar cases are common and that there is a tendency to try to stay on the safe side, thus exacerbating any regulatory barrier that may actually exist.
Stage III and regulatory requirements
Stage III starts after the formulation of a product concept and sev-eral rounds of prototyping. Activities during this stage are aimed at design and development, and verification and validation. The FDA requires documentation of all verification and validation activities to the extent that they are reproducible. Design verification involves activities that ensure that design outputs satisfy design inputs, that it is compliant with the QMS, and that it is suitable given associated activities such as packaging, shipping, cleaning etc. Design valida-tion activities aim to ensure that user needs are met. These activities include use tests and the investigation of human factors and user interfaces to assess potential issues that arise during everyday usage. Finally, design control deliverables, such as product FMEA is up-dated during Stage III, as is the addition of process FMEA to satisfy QSR requirements of Good Manufacturing Practices. Stage III, and our study, ends with a decision to no longer alter the product design prior to launch, and a submission of test and design data to the FDA for regulatory approval.
Stage III and stated barriers
Based on statutes, Stage III requirements are rather similar to the Stage II ones. One additional concrete barrier is the submittal time. However, the R&D manager stated that “submittal processing time is a well-known fact and easy to plan around” suggesting that it may not be perceived as a substantial barrier. However, the amount of docu-mentation needed for the DHF is considered more problematic. One NPD engineer pointed at two shelves of binders and told us “look at that, that is for one project”. Furthermore, as argued by both the NPD engineer as well as the project manager, the provided resources are not enough to match the additional demands from such activities.
However, the site manager stated that “it cannot be required by a sound quality system to generate this amount of documentation when developing these products”. The FDA itself does not specify the amount of documentation; rather it is during the establishment of the QMS that the specifications and routines for documentation are de-veloped. In the following section, we synthesize our findings of stated and formal regulatory demands.
Discussion
In Figure 1, we present our adaptation of the stage-gate (see Cooper, Edgett, & Kleinschmidt, 2002) model of technology innovation to more specifically focus on regulation as a barrier. The model shows how product development, formal regulatory requirements, and stated regulatory barriers unfold over the tree stages included in our study.
88
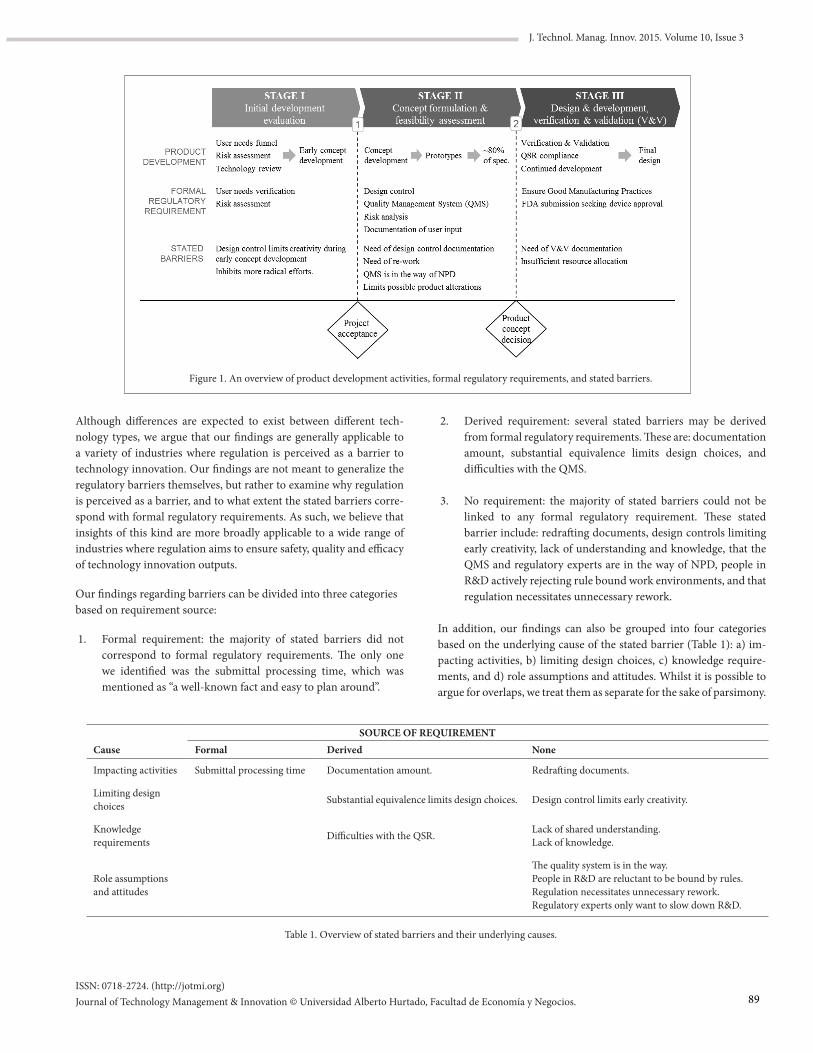
ISSN: 0718-2724. (http://jotmi.org)Journal of Technology Management & Innovation © Universidad Alberto Hurtado, Facultad de Economía y Negocios.
J. Technol. Manag. Innov. 2015. Volume 10, Issue 3
Although differences are expected to exist between different tech-nology types, we argue that our findings are generally applicable to a variety of industries where regulation is perceived as a barrier to technology innovation. Our findings are not meant to generalize the regulatory barriers themselves, but rather to examine why regulation is perceived as a barrier, and to what extent the stated barriers corre-spond with formal regulatory requirements. As such, we believe that insights of this kind are more broadly applicable to a wide range of industries where regulation aims to ensure safety, quality and efficacy of technology innovation outputs.
Our findings regarding barriers can be divided into three categories based on requirement source:
1. Formal requirement: the majority of stated barriers did not correspond to formal regulatory requirements. The only one we identified was the submittal processing time, which was mentioned as “a well-known fact and easy to plan around”.
Figure 1. An overview of product development activities, formal regulatory requirements, and stated barriers.
2. Derived requirement: several stated barriers may be derived from formal regulatory requirements. These are: documentation amount, substantial equivalence limits design choices, and difficulties with the QMS.
3. No requirement: the majority of stated barriers could not be linked to any formal regulatory requirement. These stated barrier include: redrafting documents, design controls limiting early creativity, lack of understanding and knowledge, that the QMS and regulatory experts are in the way of NPD, people in R&D actively rejecting rule bound work environments, and that regulation necessitates unnecessary rework.
In addition, our findings can also be grouped into four categories based on the underlying cause of the stated barrier (Table 1): a) im-pacting activities, b) limiting design choices, c) knowledge require-ments, and d) role assumptions and attitudes. Whilst it is possible to argue for overlaps, we treat them as separate for the sake of parsimony.
SOURCE OF REQUIREMENTCause Formal Derived None
Impacting activities Submittal processing time Documentation amount. Redrafting documents.
Limiting design choices Substantial equivalence limits design choices. Design control limits early creativity.
Knowledge requirements Difficulties with the QSR. Lack of shared understanding.
Lack of knowledge.
Role assumptions and attitudes
The quality system is in the way.People in R&D are reluctant to be bound by rules.Regulation necessitates unnecessary rework.Regulatory experts only want to slow down R&D.
Table 1. Overview of stated barriers and their underlying causes.
89
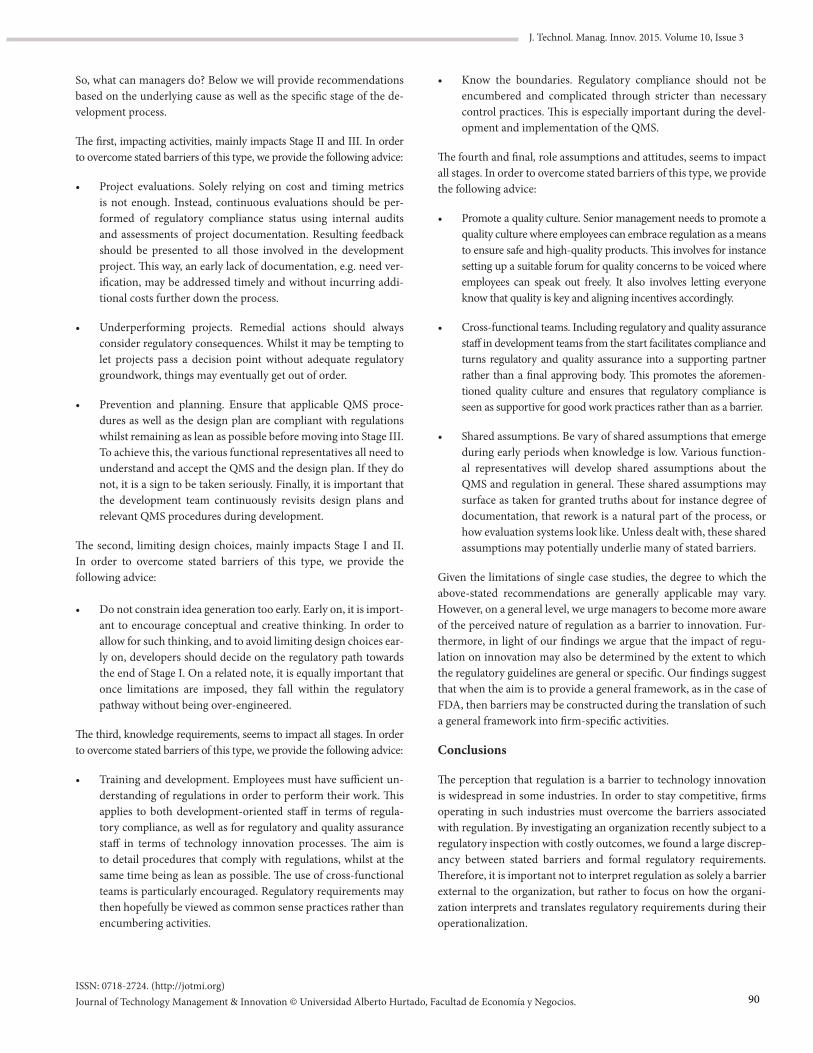
ISSN: 0718-2724. (http://jotmi.org)Journal of Technology Management & Innovation © Universidad Alberto Hurtado, Facultad de Economía y Negocios.
J. Technol. Manag. Innov. 2015. Volume 10, Issue 3
So, what can managers do? Below we will provide recommendations based on the underlying cause as well as the specific stage of the de-velopment process.
The first, impacting activities, mainly impacts Stage II and III. In order to overcome stated barriers of this type, we provide the following advice:
• Project evaluations. Solely relying on cost and timing metrics is not enough. Instead, continuous evaluations should be per-formed of regulatory compliance status using internal audits and assessments of project documentation. Resulting feedback should be presented to all those involved in the development project. This way, an early lack of documentation, e.g. need ver-ification, may be addressed timely and without incurring addi-tional costs further down the process.
• Underperforming projects. Remedial actions should always consider regulatory consequences. Whilst it may be tempting to let projects pass a decision point without adequate regulatory groundwork, things may eventually get out of order.
• Prevention and planning. Ensure that applicable QMS proce-dures as well as the design plan are compliant with regulations whilst remaining as lean as possible before moving into Stage III. To achieve this, the various functional representatives all need to understand and accept the QMS and the design plan. If they do not, it is a sign to be taken seriously. Finally, it is important that the development team continuously revisits design plans and relevant QMS procedures during development.
The second, limiting design choices, mainly impacts Stage I and II. In order to overcome stated barriers of this type, we provide the following advice:
• Do not constrain idea generation too early. Early on, it is import-ant to encourage conceptual and creative thinking. In order to allow for such thinking, and to avoid limiting design choices ear-ly on, developers should decide on the regulatory path towards the end of Stage I. On a related note, it is equally important that once limitations are imposed, they fall within the regulatory pathway without being over-engineered.
The third, knowledge requirements, seems to impact all stages. In order to overcome stated barriers of this type, we provide the following advice:
• Training and development. Employees must have sufficient un-derstanding of regulations in order to perform their work. This applies to both development-oriented staff in terms of regula-tory compliance, as well as for regulatory and quality assurance staff in terms of technology innovation processes. The aim is to detail procedures that comply with regulations, whilst at the same time being as lean as possible. The use of cross-functional teams is particularly encouraged. Regulatory requirements may then hopefully be viewed as common sense practices rather than encumbering activities.
• Know the boundaries. Regulatory compliance should not be encumbered and complicated through stricter than necessary control practices. This is especially important during the devel-opment and implementation of the QMS.
The fourth and final, role assumptions and attitudes, seems to impact all stages. In order to overcome stated barriers of this type, we provide the following advice:
• Promote a quality culture. Senior management needs to promote a quality culture where employees can embrace regulation as a means to ensure safe and high-quality products. This involves for instance setting up a suitable forum for quality concerns to be voiced where employees can speak out freely. It also involves letting everyone know that quality is key and aligning incentives accordingly.
• Cross-functional teams. Including regulatory and quality assurance staff in development teams from the start facilitates compliance and turns regulatory and quality assurance into a supporting partner rather than a final approving body. This promotes the aforemen-tioned quality culture and ensures that regulatory compliance is seen as supportive for good work practices rather than as a barrier.
• Shared assumptions. Be vary of shared assumptions that emerge during early periods when knowledge is low. Various function-al representatives will develop shared assumptions about the QMS and regulation in general. These shared assumptions may surface as taken for granted truths about for instance degree of documentation, that rework is a natural part of the process, or how evaluation systems look like. Unless dealt with, these shared assumptions may potentially underlie many of stated barriers.
Given the limitations of single case studies, the degree to which the above-stated recommendations are generally applicable may vary. However, on a general level, we urge managers to become more aware of the perceived nature of regulation as a barrier to innovation. Fur-thermore, in light of our findings we argue that the impact of regu-lation on innovation may also be determined by the extent to which the regulatory guidelines are general or specific. Our findings suggest that when the aim is to provide a general framework, as in the case of FDA, then barriers may be constructed during the translation of such a general framework into firm-specific activities.
Conclusions
The perception that regulation is a barrier to technology innovation is widespread in some industries. In order to stay competitive, firms operating in such industries must overcome the barriers associated with regulation. By investigating an organization recently subject to a regulatory inspection with costly outcomes, we found a large discrep-ancy between stated barriers and formal regulatory requirements. Therefore, it is important not to interpret regulation as solely a barrier external to the organization, but rather to focus on how the organi-zation interprets and translates regulatory requirements during their operationalization.
90
ISSN: 0718-2724. (http://jotmi.org)Journal of Technology Management & Innovation © Universidad Alberto Hurtado, Facultad de Economía y Negocios.
J. Technol. Manag. Innov. 2015. Volume 10, Issue 3
References
Ashford, N. A., & Heaton, G. R. (1983). Regulation and technological innovation in the chemical industry. Law and Contemporary Problems, 46(3), 109-157. http://dx.doi.org/10.2307/1191559
Barczak, G., Griffin, A., & Kahn, K. B. (2009). Perspective: trends and drivers of success in NPD practices: Results of the 2003 PDMA best practices study*. Journal of Product Innovation Management, 26(1), 3-23. http://dx.doi.org/10.1111/j.1540-5885.2009.00331.x
Cooper, R. G. (2008). Perspective: The Stage‐Gate® idea‐to‐launch process—Update, what’s new, and NexGen systems*. Journal of Product Innovation Management, 25(3), 213-232. http://dx.doi.org/10.1111/j.1540-5885.2008.00296.x
Cooper, R. G., Edgett, S. J. & Kleinschmidt, E. J. (2002). Optimizing the stage-gate process: What best-practice companies are doing - part one. Research-Technology Management, 45(5), 21-27.
Dodgson, M., Gann, D. M., & Salter, A. (2008). The management of technological innovation: Strategy and practice. Oxford, UK: Oxford University Press.
Eisenberg, R. S. (2007). The Role of the FDA in Innovation Policy. Michigan Telecommunications and Technology Law Review, 13(2), 345-389.
Garud, R., & Rappa, M. A. (1994). A socio-cognitive model of technology evolution: The case of cochlear implants. Organization Science, 5(3), 344-362. http://dx.doi.org/10.1287/orsc.5.3.344
Georg, S., Røpke, I., & Jørgensen, U. (1992). Clean technology - Innovation and environmental regulation. Environmental and Resource Economics, 2(6), 533-550. http://dx.doi.org/10.1007/BF00330282
Hadjimanolis, A. (2003). The barriers approach to innovation. In L. Shavinina (Eds.), The International Handbook on Innovation (pp. 559-573). Oxford, UK: Elsevier Science. http://dx.doi.org/10.1016/b978-008044198-6/50038-3
Hall, L. A., & Bagchi-Sen, S. (2002). A study of R&D, innovation, and business performance in the Canadian biotechnology industry. Technovation, 22(4), 231-244. http://dx.doi.org/10.1016/s0166-4972(01)00016-5
Hauptman, O., & Roberts, E. B. (1987). FDA regulation of product risk and its impact upon young biomedical firms. Journal of Product Innovation Management, 4(2), 138-148. http://dx.doi.org/10.1111/1540-5885.420138
Herzlinger, R. E. (2006). Why innovation in health care is so hard. Harvard Business Review, 84(5), 58-68. http://www.ncbi.nlm.nih.gov/pubmed/16649698
Kaplan, A. V., Baim, D. S., Smith, J. J., Feigal, D. A., Simons, M., Jefferys, D., Fogarty, T. J., Kuntz, R. E., & Leon, M. B. (2004). Medical device development from prototype to regulatory approval. Circulation, 109(25), 3068-3072. http://dx.doi.org/10.1161/01.cir.0000134695.65733.64
Louis, M. R., & Bartunek, J. M. (1992). Insider/Outsider research teams: Collaboration across diverse perspectives. Journal of Management Inquiry, 1(2), 101-110. http://dx.doi.org/10.1177/105649269212002
Maxwell, J. W. (1998). Minimum quality standards as a barrier to innovation. Economics Letters, 58(3), 355-360. http://dx.doi.org/10.1016/s0165-1765(97)00293-0
Pearce, D. W., & Turner, R. K. (1984). The economic evaluation of low and non-waste technologies. Resources and Conservation, 11(1), 27-43. http://dx.doi.org/10.1016/0166-3097(84)90003-8
Pietzsch, J. B., Shluzas, L. A., Paté-Cornell, M. E., Yock, P. G., & Linehan, J. H. (2009). Stage-gate process for the development of medical devices. Journal of Medical Devices, 3(2), 021004-1-021004-15. http://dx.doi.org/10.1115/1.3148836
Rothwell, R. (1980). The impact of regulation on innovation: Some US data. Technological Forecasting and Social Change, 17(1), 7-34. http://dx.doi.org/10.1016/0040-1625(80)90055-4
91
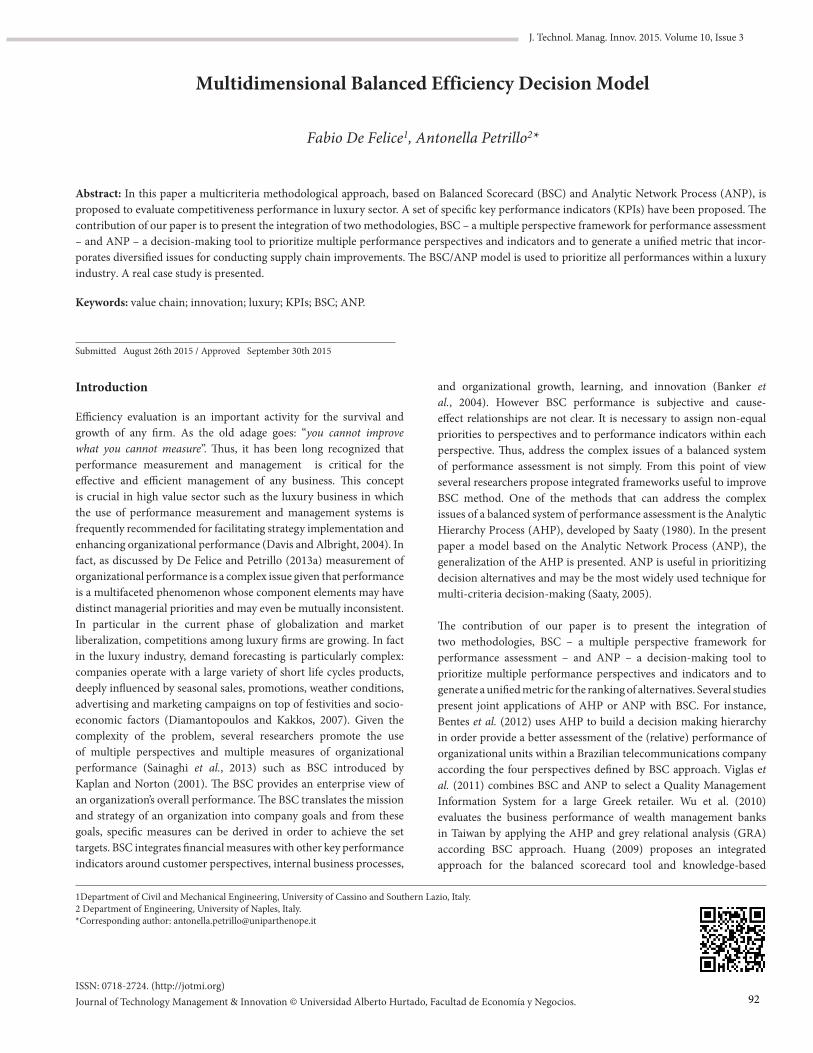
J. Technol. Manag. Innov. 2015. Volume 10, Issue 3
ISSN: 0718-2724. (http://jotmi.org)Journal of Technology Management & Innovation © Universidad Alberto Hurtado, Facultad de Economía y Negocios.
Multidimensional Balanced Efficiency Decision Model
Fabio De Felice1, Antonella Petrillo2*
Abstract: In this paper a multicriteria methodological approach, based on Balanced Scorecard (BSC) and Analytic Network Process (ANP), is proposed to evaluate competitiveness performance in luxury sector. A set of specific key performance indicators (KPIs) have been proposed. The contribution of our paper is to present the integration of two methodologies, BSC – a multiple perspective framework for performance assessment – and ANP – a decision-making tool to prioritize multiple performance perspectives and indicators and to generate a unified metric that incor-porates diversified issues for conducting supply chain improvements. The BSC/ANP model is used to prioritize all performances within a luxuryindustry. A real case study is presented.
Keywords: value chain; innovation; luxury; KPIs; BSC; ANP.
Submitted August 26th 2015 / Approved September 30th 2015
Introduction
Efficiency evaluation is an important activity for the survival and growth of any firm. As the old adage goes: “you cannot improve what you cannot measure”. Thus, it has been long recognized that performance measurement and management is critical for the effective and efficient management of any business. This concept is crucial in high value sector such as the luxury business in which the use of performance measurement and management systems is frequently recommended for facilitating strategy implementation and enhancing organizational performance (Davis and Albright, 2004). In fact, as discussed by De Felice and Petrillo (2013a) measurement of organizational performance is a complex issue given that performance is a multifaceted phenomenon whose component elements may have distinct managerial priorities and may even be mutually inconsistent. In particular in the current phase of globalization and market liberalization, competitions among luxury firms are growing. In fact in the luxury industry, demand forecasting is particularly complex: companies operate with a large variety of short life cycles products, deeply influenced by seasonal sales, promotions, weather conditions, advertising and marketing campaigns on top of festivities and socio-economic factors (Diamantopoulos and Kakkos, 2007). Given the complexity of the problem, several researchers promote the use of multiple perspectives and multiple measures of organizational performance (Sainaghi et al., 2013) such as BSC introduced by Kaplan and Norton (2001). The BSC provides an enterprise view of an organization’s overall performance. The BSC translates the mission and strategy of an organization into company goals and from these goals, specific measures can be derived in order to achieve the set targets. BSC integrates financial measures with other key performance indicators around customer perspectives, internal business processes,
and organizational growth, learning, and innovation (Banker et al., 2004). However BSC performance is subjective and cause-effect relationships are not clear. It is necessary to assign non-equal priorities to perspectives and to performance indicators within each perspective. Thus, address the complex issues of a balanced system of performance assessment is not simply. From this point of view several researchers propose integrated frameworks useful to improve BSC method. One of the methods that can address the complex issues of a balanced system of performance assessment is the Analytic Hierarchy Process (AHP), developed by Saaty (1980). In the present paper a model based on the Analytic Network Process (ANP), the generalization of the AHP is presented. ANP is useful in prioritizing decision alternatives and may be the most widely used technique for multi-criteria decision-making (Saaty, 2005).
The contribution of our paper is to present the integration of two methodologies, BSC – a multiple perspective framework for performance assessment – and ANP – a decision-making tool to prioritize multiple performance perspectives and indicators and to generate a unified metric for the ranking of alternatives. Several studies present joint applications of AHP or ANP with BSC. For instance, Bentes et al. (2012) uses AHP to build a decision making hierarchy in order provide a better assessment of the (relative) performance of organizational units within a Brazilian telecommunications company according the four perspectives defined by BSC approach. Viglas et al. (2011) combines BSC and ANP to select a Quality Management Information System for a large Greek retailer. Wu et al. (2010) evaluates the business performance of wealth management banks in Taiwan by applying the AHP and grey relational analysis (GRA) according BSC approach. Huang (2009) proposes an integrated approach for the balanced scorecard tool and knowledge-based
1Department of Civil and Mechanical Engineering, University of Cassino and Southern Lazio, Italy.2 Department of Engineering, University of Naples, Italy. *Corresponding author: [email protected]
92
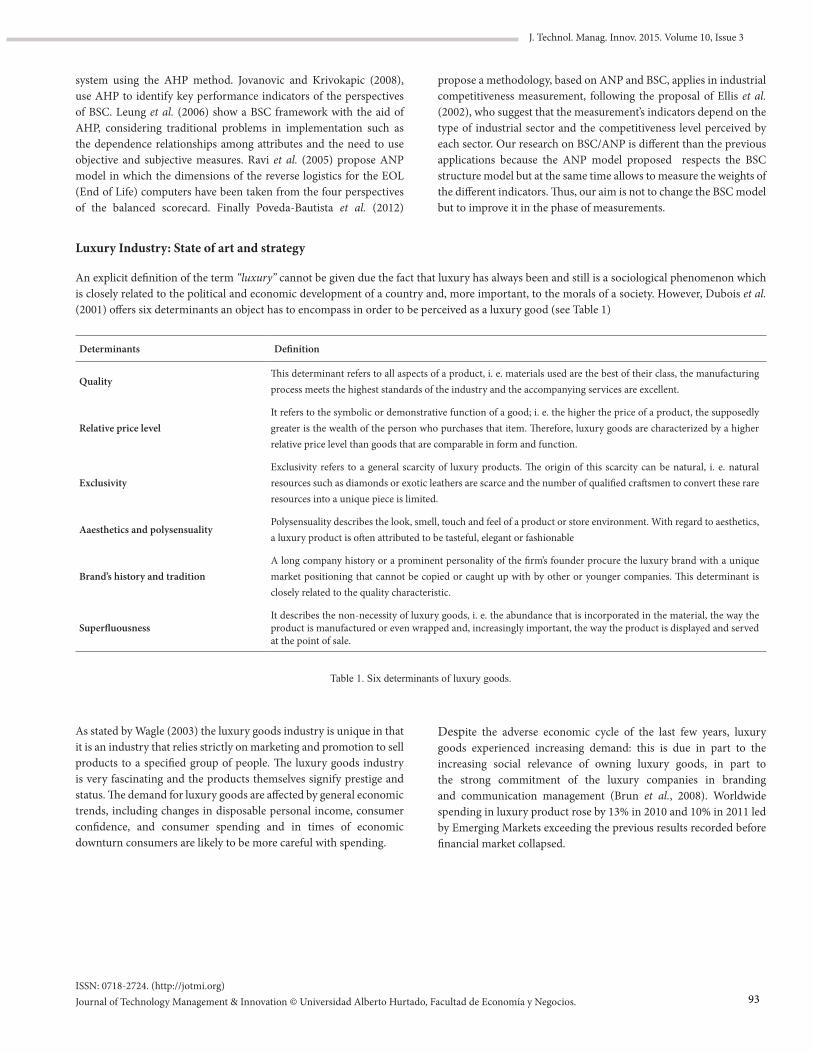
ISSN: 0718-2724. (http://jotmi.org)Journal of Technology Management & Innovation © Universidad Alberto Hurtado, Facultad de Economía y Negocios.
J. Technol. Manag. Innov. 2015. Volume 10, Issue 3
system using the AHP method. Jovanovic and Krivokapic (2008), use AHP to identify key performance indicators of the perspectives of BSC. Leung et al. (2006) show a BSC framework with the aid of AHP, considering traditional problems in implementation such as the dependence relationships among attributes and the need to use objective and subjective measures. Ravi et al. (2005) propose ANP model in which the dimensions of the reverse logistics for the EOL (End of Life) computers have been taken from the four perspectives of the balanced scorecard. Finally Poveda-Bautista et al. (2012)
propose a methodology, based on ANP and BSC, applies in industrial competitiveness measurement, following the proposal of Ellis et al. (2002), who suggest that the measurement’s indicators depend on the type of industrial sector and the competitiveness level perceived by each sector. Our research on BSC/ANP is different than the previous applications because the ANP model proposed respects the BSC structure model but at the same time allows to measure the weights of the different indicators. Thus, our aim is not to change the BSC model but to improve it in the phase of measurements.
Luxury Industry: State of art and strategy
An explicit definition of the term “luxury” cannot be given due the fact that luxury has always been and still is a sociological phenomenon which is closely related to the political and economic development of a country and, more important, to the morals of a society. However, Dubois et al. (2001) offers six determinants an object has to encompass in order to be perceived as a luxury good (see Table 1)
Table 1. Six determinants of luxury goods.
Determinants Definition
QualityThis determinant refers to all aspects of a product, i. e. materials used are the best of their class, the manufacturing process meets the highest standards of the industry and the accompanying services are excellent.
Relative price levelIt refers to the symbolic or demonstrative function of a good; i. e. the higher the price of a product, the supposedly greater is the wealth of the person who purchases that item. Therefore, luxury goods are characterized by a higher relative price level than goods that are comparable in form and function.
ExclusivityExclusivity refers to a general scarcity of luxury products. The origin of this scarcity can be natural, i. e. natural resources such as diamonds or exotic leathers are scarce and the number of qualified craftsmen to convert these rare resources into a unique piece is limited.
Aaesthetics and polysensualityPolysensuality describes the look, smell, touch and feel of a product or store environment. With regard to aesthetics, a luxury product is often attributed to be tasteful, elegant or fashionable
Brand’s history and traditionA long company history or a prominent personality of the firm’s founder procure the luxury brand with a unique market positioning that cannot be copied or caught up with by other or younger companies. This determinant is closely related to the quality characteristic.
SuperfluousnessIt describes the non-necessity of luxury goods, i. e. the abundance that is incorporated in the material, the way the product is manufactured or even wrapped and, increasingly important, the way the product is displayed and served at the point of sale.
As stated by Wagle (2003) the luxury goods industry is unique in that it is an industry that relies strictly on marketing and promotion to sell products to a specified group of people. The luxury goods industry is very fascinating and the products themselves signify prestige and status. The demand for luxury goods are affected by general economic trends, including changes in disposable personal income, consumer confidence, and consumer spending and in times of economic downturn consumers are likely to be more careful with spending.
Despite the adverse economic cycle of the last few years, luxury goods experienced increasing demand: this is due in part to the increasing social relevance of owning luxury goods, in part to the strong commitment of the luxury companies in branding and communication management (Brun et al., 2008). Worldwide spending in luxury product rose by 13% in 2010 and 10% in 2011 led by Emerging Markets exceeding the previous results recorded before financial market collapsed.
93
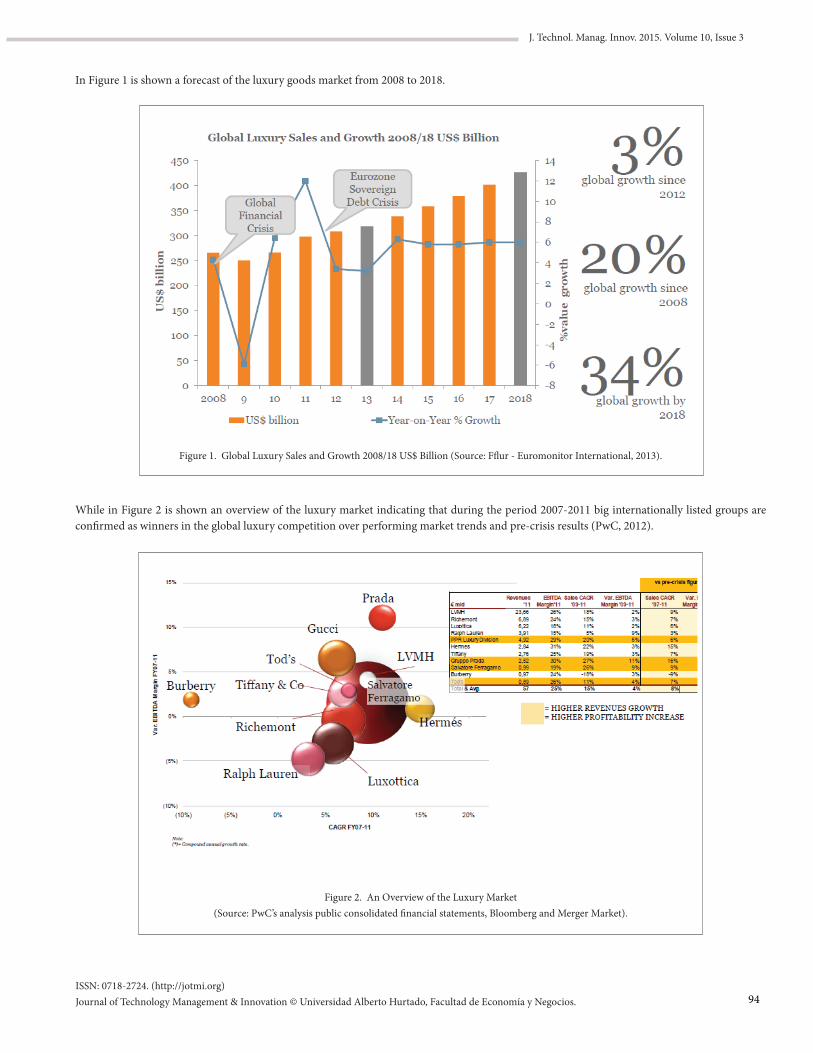
ISSN: 0718-2724. (http://jotmi.org)Journal of Technology Management & Innovation © Universidad Alberto Hurtado, Facultad de Economía y Negocios.
J. Technol. Manag. Innov. 2015. Volume 10, Issue 3
In Figure 1 is shown a forecast of the luxury goods market from 2008 to 2018.
Figure 1. Global Luxury Sales and Growth 2008/18 US$ Billion (Source: Fflur - Euromonitor International, 2013).
While in Figure 2 is shown an overview of the luxury market indicating that during the period 2007-2011 big internationally listed groups are confirmed as winners in the global luxury competition over performing market trends and pre-crisis results (PwC, 2012).
Figure 2. An Overview of the Luxury Market (Source: PwC’s analysis public consolidated financial statements, Bloomberg and Merger Market).
94
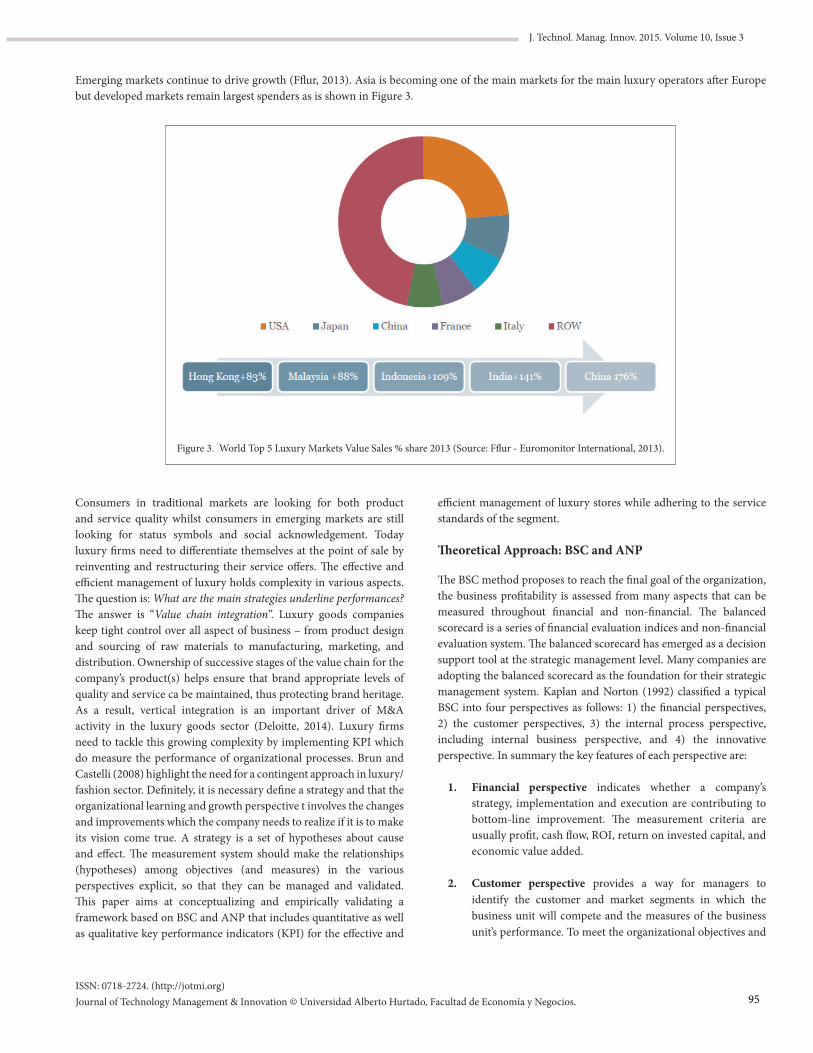
ISSN: 0718-2724. (http://jotmi.org)Journal of Technology Management & Innovation © Universidad Alberto Hurtado, Facultad de Economía y Negocios.
J. Technol. Manag. Innov. 2015. Volume 10, Issue 3
Emerging markets continue to drive growth (Fflur, 2013). Asia is becoming one of the main markets for the main luxury operators after Europe but developed markets remain largest spenders as is shown in Figure 3.
Figure 3. World Top 5 Luxury Markets Value Sales % share 2013 (Source: Fflur - Euromonitor International, 2013).
Consumers in traditional markets are looking for both product and service quality whilst consumers in emerging markets are still looking for status symbols and social acknowledgement. Today luxury firms need to differentiate themselves at the point of sale by reinventing and restructuring their service offers. The effective and efficient management of luxury holds complexity in various aspects. The question is: What are the main strategies underline performances? The answer is “Value chain integration”. Luxury goods companies keep tight control over all aspect of business – from product design and sourcing of raw materials to manufacturing, marketing, and distribution. Ownership of successive stages of the value chain for the company’s product(s) helps ensure that brand appropriate levels of quality and service ca be maintained, thus protecting brand heritage. As a result, vertical integration is an important driver of M&A activity in the luxury goods sector (Deloitte, 2014). Luxury firms need to tackle this growing complexity by implementing KPI which do measure the performance of organizational processes. Brun and Castelli (2008) highlight the need for a contingent approach in luxury/fashion sector. Definitely, it is necessary define a strategy and that the organizational learning and growth perspective t involves the changes and improvements which the company needs to realize if it is to make its vision come true. A strategy is a set of hypotheses about cause and effect. The measurement system should make the relationships (hypotheses) among objectives (and measures) in the various perspectives explicit, so that they can be managed and validated. This paper aims at conceptualizing and empirically validating a framework based on BSC and ANP that includes quantitative as well as qualitative key performance indicators (KPI) for the effective and
efficient management of luxury stores while adhering to the service standards of the segment.
Theoretical Approach: BSC and ANP
The BSC method proposes to reach the final goal of the organization, the business profitability is assessed from many aspects that can be measured throughout financial and non-financial. The balanced scorecard is a series of financial evaluation indices and non-financial evaluation system. The balanced scorecard has emerged as a decision support tool at the strategic management level. Many companies are adopting the balanced scorecard as the foundation for their strategic management system. Kaplan and Norton (1992) classified a typical BSC into four perspectives as follows: 1) the financial perspectives, 2) the customer perspectives, 3) the internal process perspective, including internal business perspective, and 4) the innovative perspective. In summary the key features of each perspective are:
1. Financial perspective indicates whether a company’s strategy, implementation and execution are contributing to bottom-line improvement. The measurement criteria are usually profit, cash flow, ROI, return on invested capital, and economic value added.
2. Customer perspective provides a way for managers to identify the customer and market segments in which the business unit will compete and the measures of the business unit’s performance. To meet the organizational objectives and
95
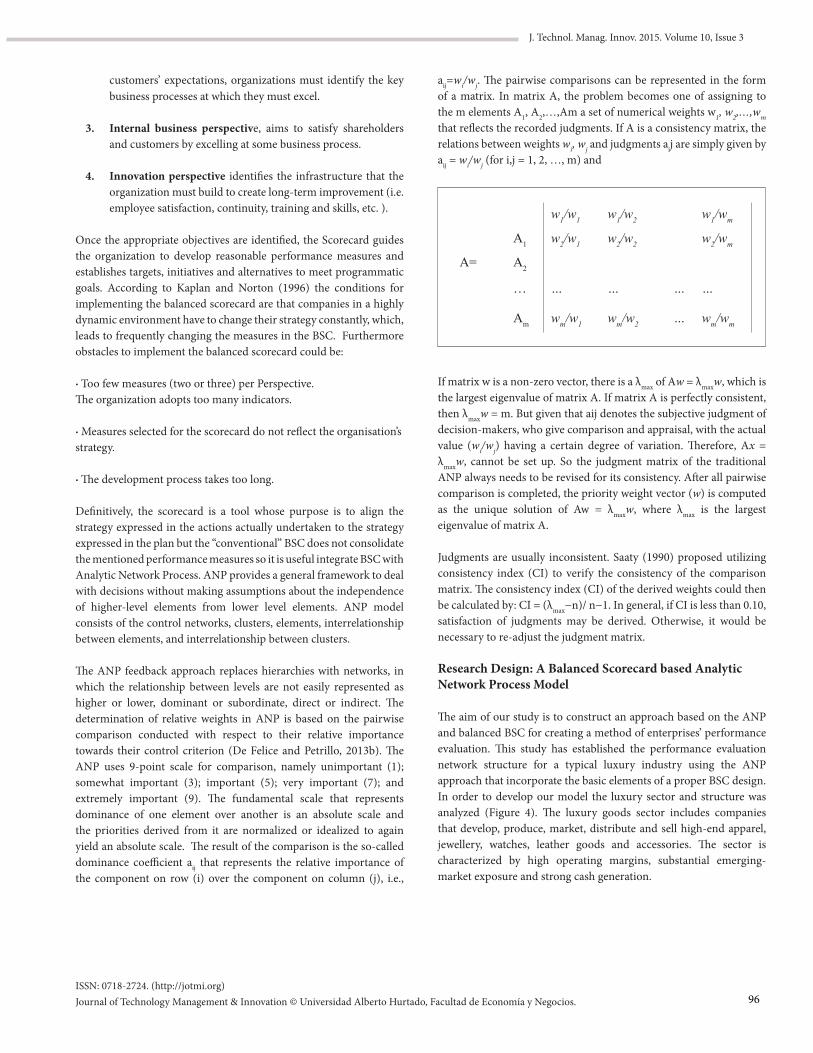
ISSN: 0718-2724. (http://jotmi.org)Journal of Technology Management & Innovation © Universidad Alberto Hurtado, Facultad de Economía y Negocios.
J. Technol. Manag. Innov. 2015. Volume 10, Issue 3
customers’ expectations, organizations must identify the key business processes at which they must excel.
3. Internal business perspective, aims to satisfy shareholders and customers by excelling at some business process.
4. Innovation perspective identifies the infrastructure that the organization must build to create long-term improvement (i.e. employee satisfaction, continuity, training and skills, etc. ).
Once the appropriate objectives are identified, the Scorecard guides the organization to develop reasonable performance measures and establishes targets, initiatives and alternatives to meet programmatic goals. According to Kaplan and Norton (1996) the conditions for implementing the balanced scorecard are that companies in a highly dynamic environment have to change their strategy constantly, which, leads to frequently changing the measures in the BSC. Furthermore obstacles to implement the balanced scorecard could be:
· Too few measures (two or three) per Perspective. The organization adopts too many indicators.
· Measures selected for the scorecard do not reflect the organisation’s strategy.
· The development process takes too long.
Definitively, the scorecard is a tool whose purpose is to align the strategy expressed in the actions actually undertaken to the strategy expressed in the plan but the “conventional” BSC does not consolidate the mentioned performance measures so it is useful integrate BSC with Analytic Network Process. ANP provides a general framework to deal with decisions without making assumptions about the independence of higher-level elements from lower level elements. ANP model consists of the control networks, clusters, elements, interrelationship between elements, and interrelationship between clusters.
The ANP feedback approach replaces hierarchies with networks, in which the relationship between levels are not easily represented as higher or lower, dominant or subordinate, direct or indirect. The determination of relative weights in ANP is based on the pairwise comparison conducted with respect to their relative importance towards their control criterion (De Felice and Petrillo, 2013b). The ANP uses 9-point scale for comparison, namely unimportant (1); somewhat important (3); important (5); very important (7); and extremely important (9). The fundamental scale that represents dominance of one element over another is an absolute scale and the priorities derived from it are normalized or idealized to again yield an absolute scale. The result of the comparison is the so-called dominance coefficient aij that represents the relative importance of the component on row (i) over the component on column (j), i.e.,
aij=wi/wj. The pairwise comparisons can be represented in the form of a matrix. In matrix A, the problem becomes one of assigning to the m elements A1, A2,…,Am a set of numerical weights w1, w2,…,wm that reflects the recorded judgments. If A is a consistency matrix, the relations between weights wi, wj and judgments aij are simply given by aij = wi/wj (for i,j = 1, 2, …, m) and
w1/w1 w1/w2 w1/wm
A1 w2/w1 w2/w2 w2/wm
A= A2
… … … … …
Am wm/w1 wm/w2 … wm/wm
If matrix w is a non-zero vector, there is a λmax of Aw = λmaxw, which is the largest eigenvalue of matrix A. If matrix A is perfectly consistent, then λmaxw = m. But given that aij denotes the subjective judgment of decision-makers, who give comparison and appraisal, with the actual value (wi/wj) having a certain degree of variation. Therefore, Ax = λmaxw, cannot be set up. So the judgment matrix of the traditional ANP always needs to be revised for its consistency. After all pairwise comparison is completed, the priority weight vector (w) is computed as the unique solution of Aw = λmaxw, where λmax is the largest eigenvalue of matrix A.
Judgments are usually inconsistent. Saaty (1990) proposed utilizing consistency index (CI) to verify the consistency of the comparison matrix. The consistency index (CI) of the derived weights could then be calculated by: CI = (λmax−n)/ n−1. In general, if CI is less than 0.10, satisfaction of judgments may be derived. Otherwise, it would be necessary to re-adjust the judgment matrix.
Research Design: A Balanced Scorecard based Analytic Network Process Model
The aim of our study is to construct an approach based on the ANP and balanced BSC for creating a method of enterprises’ performance evaluation. This study has established the performance evaluation network structure for a typical luxury industry using the ANP approach that incorporate the basic elements of a proper BSC design. In order to develop our model the luxury sector and structure was analyzed (Figure 4). The luxury goods sector includes companies that develop, produce, market, distribute and sell high-end apparel, jewellery, watches, leather goods and accessories. The sector is characterized by high operating margins, substantial emerging-market exposure and strong cash generation.
96
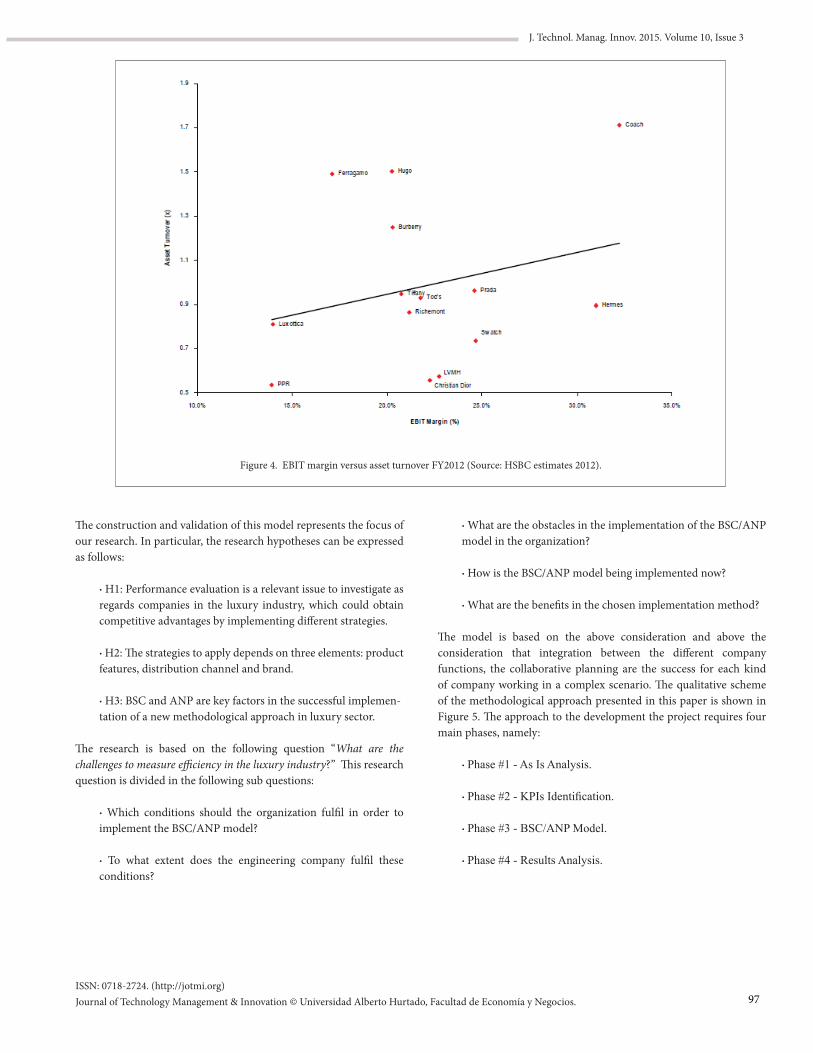
ISSN: 0718-2724. (http://jotmi.org)Journal of Technology Management & Innovation © Universidad Alberto Hurtado, Facultad de Economía y Negocios.
J. Technol. Manag. Innov. 2015. Volume 10, Issue 3
Figure 4. EBIT margin versus asset turnover FY2012 (Source: HSBC estimates 2012).
The construction and validation of this model represents the focus of our research. In particular, the research hypotheses can be expressed as follows:
· H1: Performance evaluation is a relevant issue to investigate as regards companies in the luxury industry, which could obtain competitive advantages by implementing different strategies.
· H2: The strategies to apply depends on three elements: product features, distribution channel and brand.
· H3: BSC and ANP are key factors in the successful implemen- tation of a new methodological approach in luxury sector.
The research is based on the following question “What are the challenges to measure efficiency in the luxury industry?” This research question is divided in the following sub questions:
· Which conditions should the organization fulfil in order to implement the BSC/ANP model?
· To what extent does the engineering company fulfil these conditions?
· What are the obstacles in the implementation of the BSC/ANP model in the organization?
· How is the BSC/ANP model being implemented now?
· What are the benefits in the chosen implementation method?
The model is based on the above consideration and above the consideration that integration between the different company functions, the collaborative planning are the success for each kind of company working in a complex scenario. The qualitative scheme of the methodological approach presented in this paper is shown in Figure 5. The approach to the development the project requires four main phases, namely:
· Phase #1 - As Is Analysis.
· Phase #2 - KPIs Identification.
· Phase #3 - BSC/ANP Model.
· Phase #4 - Results Analysis.
97
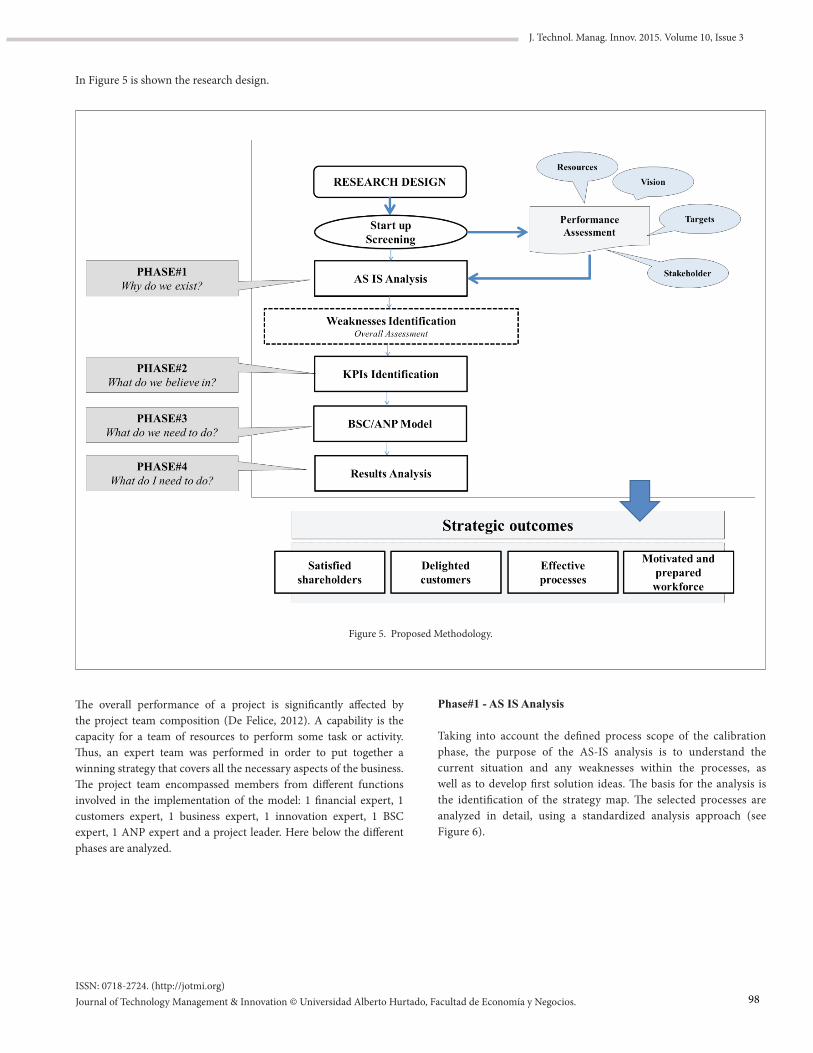
ISSN: 0718-2724. (http://jotmi.org)Journal of Technology Management & Innovation © Universidad Alberto Hurtado, Facultad de Economía y Negocios.
J. Technol. Manag. Innov. 2015. Volume 10, Issue 3
In Figure 5 is shown the research design.
The overall performance of a project is significantly affected by the project team composition (De Felice, 2012). A capability is the capacity for a team of resources to perform some task or activity. Thus, an expert team was performed in order to put together a winning strategy that covers all the necessary aspects of the business. The project team encompassed members from different functions involved in the implementation of the model: 1 financial expert, 1 customers expert, 1 business expert, 1 innovation expert, 1 BSC expert, 1 ANP expert and a project leader. Here below the different phases are analyzed.
Phase#1 - AS IS Analysis
Taking into account the defined process scope of the calibration phase, the purpose of the AS-IS analysis is to understand the current situation and any weaknesses within the processes, as well as to develop first solution ideas. The basis for the analysis is the identification of the strategy map. The selected processes are analyzed in detail, using a standardized analysis approach (see Figure 6).
Figure 5. Proposed Methodology.
98
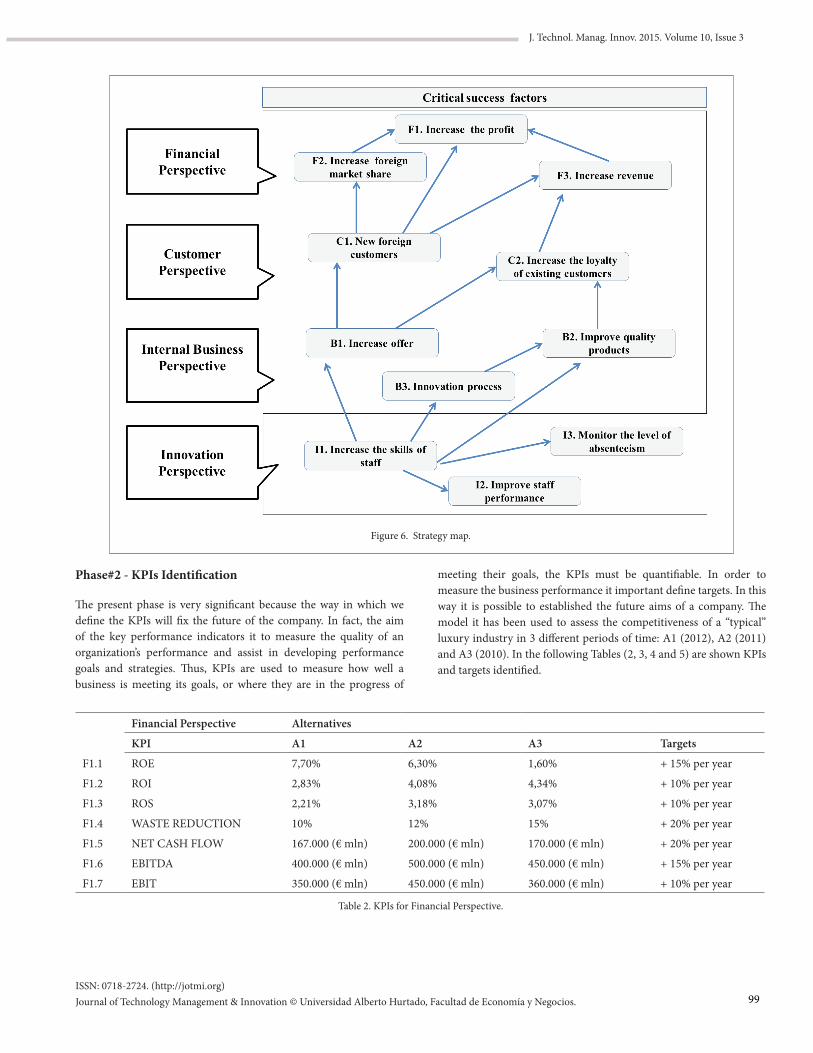
ISSN: 0718-2724. (http://jotmi.org)Journal of Technology Management & Innovation © Universidad Alberto Hurtado, Facultad de Economía y Negocios.
J. Technol. Manag. Innov. 2015. Volume 10, Issue 3
Phase#2 - KPIs Identification
The present phase is very significant because the way in which we define the KPIs will fix the future of the company. In fact, the aim of the key performance indicators it to measure the quality of an organization’s performance and assist in developing performance goals and strategies. Thus, KPIs are used to measure how well a business is meeting its goals, or where they are in the progress of
Figure 6. Strategy map.
meeting their goals, the KPIs must be quantifiable. In order to measure the business performance it important define targets. In this way it is possible to established the future aims of a company. The model it has been used to assess the competitiveness of a “typical” luxury industry in 3 different periods of time: A1 (2012), A2 (2011) and A3 (2010). In the following Tables (2, 3, 4 and 5) are shown KPIs and targets identified.
Financial Perspective Alternatives
KPI A1 A2 A3 Targets
F1.1 ROE 7,70% 6,30% 1,60% + 15% per year
F1.2 ROI 2,83% 4,08% 4,34% + 10% per year
F1.3 ROS 2,21% 3,18% 3,07% + 10% per year
F1.4 WASTE REDUCTION 10% 12% 15% + 20% per year
F1.5 NET CASH FLOW 167.000 (€ mln) 200.000 (€ mln) 170.000 (€ mln) + 20% per year
F1.6 EBITDA 400.000 (€ mln) 500.000 (€ mln) 450.000 (€ mln) + 15% per year
F1.7 EBIT 350.000 (€ mln) 450.000 (€ mln) 360.000 (€ mln) + 10% per year
Table 2. KPIs for Financial Perspective.
99
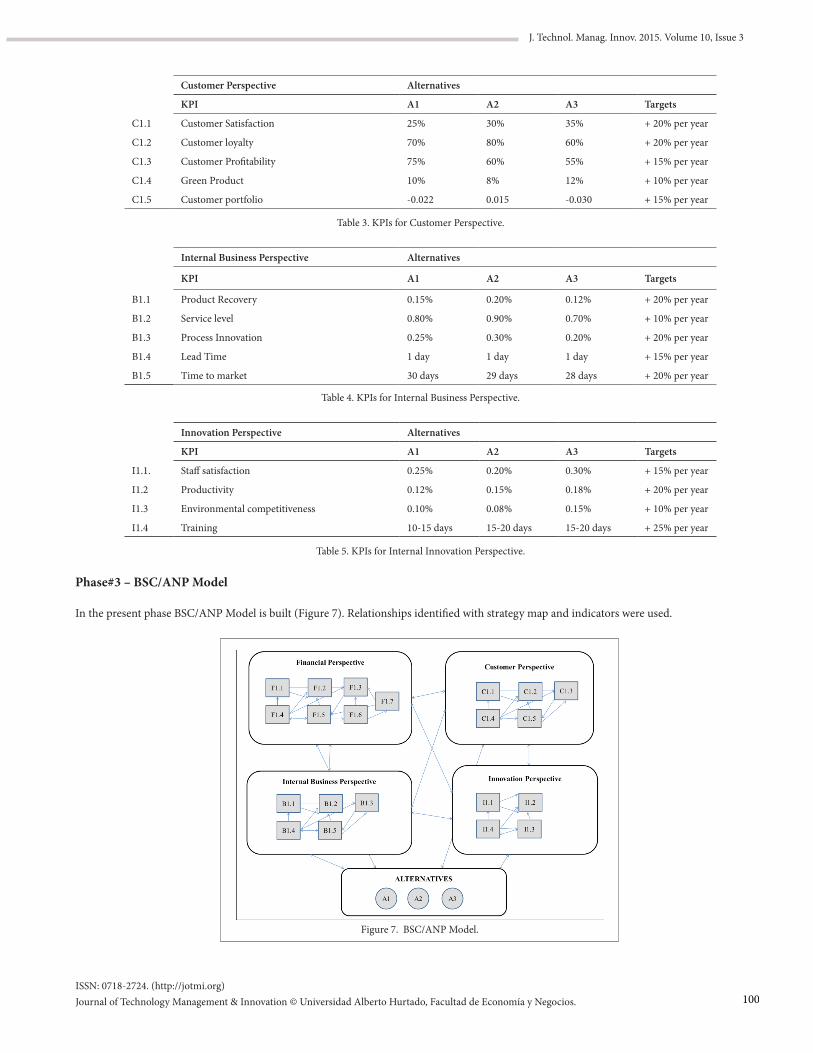
ISSN: 0718-2724. (http://jotmi.org)Journal of Technology Management & Innovation © Universidad Alberto Hurtado, Facultad de Economía y Negocios.
J. Technol. Manag. Innov. 2015. Volume 10, Issue 3
Customer Perspective Alternatives
KPI A1 A2 A3 Targets
C1.1 Customer Satisfaction 25% 30% 35% + 20% per year
C1.2 Customer loyalty 70% 80% 60% + 20% per year
C1.3 Customer Profitability 75% 60% 55% + 15% per year
C1.4 Green Product 10% 8% 12% + 10% per year
C1.5 Customer portfolio -0.022 0.015 -0.030 + 15% per year
Table 3. KPIs for Customer Perspective.
Internal Business Perspective Alternatives
KPI A1 A2 A3 Targets
B1.1 Product Recovery 0.15% 0.20% 0.12% + 20% per year
B1.2 Service level 0.80% 0.90% 0.70% + 10% per year
B1.3 Process Innovation 0.25% 0.30% 0.20% + 20% per year
B1.4 Lead Time 1 day 1 day 1 day + 15% per year
B1.5 Time to market 30 days 29 days 28 days + 20% per year
Table 4. KPIs for Internal Business Perspective.
Innovation Perspective Alternatives
KPI A1 A2 A3 Targets
I1.1. Staff satisfaction 0.25% 0.20% 0.30% + 15% per year
I1.2 Productivity 0.12% 0.15% 0.18% + 20% per year
I1.3 Environmental competitiveness 0.10% 0.08% 0.15% + 10% per year
I1.4 Training 10-15 days 15-20 days 15-20 days + 25% per year
Table 5. KPIs for Internal Innovation Perspective.
Phase#3 – BSC/ANP Model
In the present phase BSC/ANP Model is built (Figure 7). Relationships identified with strategy map and indicators were used.
Figure 7. BSC/ANP Model.
100
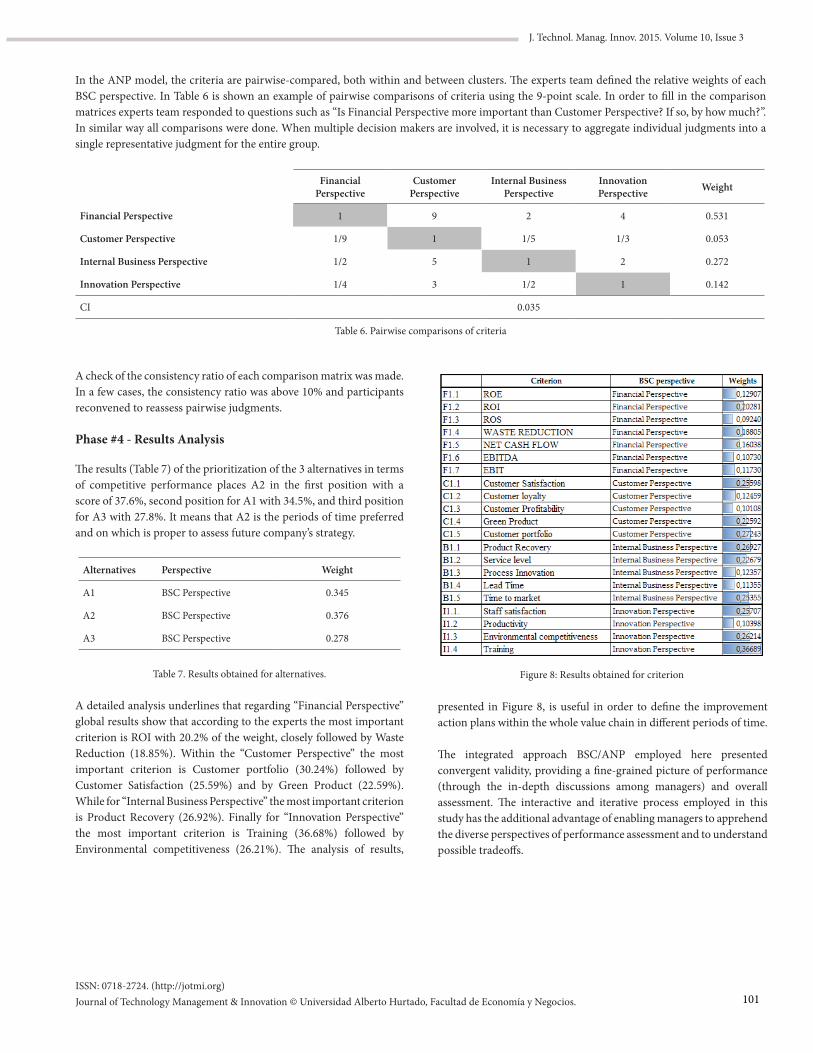
ISSN: 0718-2724. (http://jotmi.org)Journal of Technology Management & Innovation © Universidad Alberto Hurtado, Facultad de Economía y Negocios.
J. Technol. Manag. Innov. 2015. Volume 10, Issue 3
In the ANP model, the criteria are pairwise-compared, both within and between clusters. The experts team defined the relative weights of each BSC perspective. In Table 6 is shown an example of pairwise comparisons of criteria using the 9-point scale. In order to fill in the comparison matrices experts team responded to questions such as “Is Financial Perspective more important than Customer Perspective? If so, by how much?”. In similar way all comparisons were done. When multiple decision makers are involved, it is necessary to aggregate individual judgments into a single representative judgment for the entire group.
Financial Perspective
Customer Perspective
Internal Business Perspective
Innovation Perspective Weight
Financial Perspective 1 9 2 4 0.531
Customer Perspective 1/9 1 1/5 1/3 0.053
Internal Business Perspective 1/2 5 1 2 0.272
Innovation Perspective 1/4 3 1/2 1 0.142
CI 0.035
Table 6. Pairwise comparisons of criteria
A check of the consistency ratio of each comparison matrix was made. In a few cases, the consistency ratio was above 10% and participants reconvened to reassess pairwise judgments.
Phase #4 - Results Analysis
The results (Table 7) of the prioritization of the 3 alternatives in terms of competitive performance places A2 in the first position with a score of 37.6%, second position for A1 with 34.5%, and third position for A3 with 27.8%. It means that A2 is the periods of time preferred and on which is proper to assess future company’s strategy.
Alternatives Perspective Weight
A1 BSC Perspective 0.345
A2 BSC Perspective 0.376
A3 BSC Perspective 0.278
Table 7. Results obtained for alternatives.
A detailed analysis underlines that regarding “Financial Perspective” global results show that according to the experts the most important criterion is ROI with 20.2% of the weight, closely followed by Waste Reduction (18.85%). Within the “Customer Perspective” the most important criterion is Customer portfolio (30.24%) followed by Customer Satisfaction (25.59%) and by Green Product (22.59%). While for “Internal Business Perspective” the most important criterion is Product Recovery (26.92%). Finally for “Innovation Perspective” the most important criterion is Training (36.68%) followed by Environmental competitiveness (26.21%). The analysis of results,
presented in Figure 8, is useful in order to define the improvement action plans within the whole value chain in different periods of time.
The integrated approach BSC/ANP employed here presented convergent validity, providing a fine-grained picture of performance (through the in-depth discussions among managers) and overall assessment. The interactive and iterative process employed in this study has the additional advantage of enabling managers to apprehend the diverse perspectives of performance assessment and to understand possible tradeoffs.
Figure 8: Results obtained for criterion
101
ISSN: 0718-2724. (http://jotmi.org)Journal of Technology Management & Innovation © Universidad Alberto Hurtado, Facultad de Economía y Negocios.
J. Technol. Manag. Innov. 2015. Volume 10, Issue 3
Conclusions and further research developments
Based on the review of the literature and the findings of the present study we can conclude that it is relevant for any organization to have clear goals and the metrics and their corresponding weights that directly contribute to reach the goals. The ANP model efficiently contributes to define the necessary indicators. The present research shows that a combination of balanced scorecard and ANP approach can provide to the decision maker a more realistic and accurate representation of the problem. This paper have formulated a simple strategy and transformed that into an analytical BSC multicriteria model base on simple assumed cause-and-effect relationships between various performance measures. The results obtained for all the different indicators allow to analyze enterprises’ performance.
The major contribution of this research lies in the development of a comprehensive model, which incorporates diversified issues for conducting value chain improvements in luxury sector. We believe that our modeling process ensures a proper evaluation of this particular problem. In our opinion this tool constitutes a very promising future research line in the field of enterprises’ strategic management assessment. The most obvious advantage of using our model is that it provides a consistent decision making. Future research aims to investigate a more complex BSC/ANP model using several alternatives and considering different relationship among elements in different scenario.
References
Bentes, A.V., Carneiro J., Ferreira da Silva J., Kimura, H. (2012). Multidimensional assessment of organizational performance: Integrating BSC and AHP. Journal of Business Research, 65, 1790–1799.
Brun, A., Caniato, F., Caridi, M., Castelli, C., Miragliotta, G., Ronchi, S., Sianesi, A., Spina, G. (2008). Logistics and supply chain management in luxury fashion retail: Empirical investigation of Italian firms. International Journal of Production Economics, 114, 554–570.
Brun, A., Castelli, C. (2008). Supply chain strategy in the fashion industry: Developing a portfolio model depending on product, retail channel and brand. International Journal of Production Economics, 116, 169–181.
Davis, S., Albright, T. (2004). An investigation of the effect of balanced scorecard implementation on financial performance. Management Accounting Research, 15(2), 135–153.
Diamantopoulos A., Kakkos N. (2007). Managerial assessments of export performance: conceptual framework and empirical illustration. Journal of International Mark, 15(3), 1-31.
Banker R.D., Chang H., Janakiraman S.N., Konstans C. (2004). A balanced scorecard analysis of performance metrics. European Journal of Operational Research, 154, 423–436.
De Felice, F., Petrillo, A. (2013b). Key success factors for organizational innovation in the fashion industry. International Journal of Engineering Business Management, 5, 47-57.
De Felice, F., Petrillo, A. (2013b). Multicriteria approach for process modelling in strategic environmental management planning. International Journal of Simulation and Process Modelling, 8(1), 6-16.
De Felice, F. (2012). Editorial Research and applications of AHP/ANP and MCDA for decision making in manufacturing. International Journal of Production Research, 50(17), 4735–4737.
Deloitte (2014). Global Powers of luxury goods 2014 in the hands of customers, from http://www2.deloitte.com/gr/en/pages/consumer-business/articles/global-powers-of-luxury-goods-2014.html .
Dubois, B. et al. (2001). Consumer Rapport to Luxury – Analyzing Complex and Ambivalent Attitudes. Paris: Les Cahiers de Recherche (HEC).
Ellis S., Elnatha D., Raz T. (2002). Applying benchmarking: an organizational learning perspective. Human System Management, 21(3), 183-191.
Fflur R. (2013). The state of the luxury Market. Euromonitor International.
Belge, A., Rambourg, E., Dargnies, S., (2012). EMEA Equity Research Luxury goods July 2012. HSBC
Huang, H.C. (2009). Designing a knowledge-based system for strategic planning: A balanced scorecard perspective. Expert Systems with Applications, 36, 209–218.
Jovanonic J, Krivokapic Z. (2008). AHP in implementation of Balanced Scorecard. International Journal of Quality Research, 2(1), 59–67.
Kaplan, R., Norton D. (1992). The balanced scorecard: measures that drive performance. Harvard Business Review, 70, 71–79.
Kaplan, R., Norton D., (1996). Using the balanced scorecard as a strategic management system. Harvard business review, 74(1), 75, 1996.
Kaplan, R., Norton, D. (2001). The Strategy-Focused Organization: How Balanced Scorecard Companies Thrive in the New Business Environment, Harvard Business School Press, Boston. Massachusetts.
PricewaterhouseCoopers PwC 2012. Market Vision Luxury Challenges and opportunities in the new luxury world: winners and strategic drivers - https://www.pwc.com/it/it/publications/assets/docs/luxury-market-vision-2012.pdf.
Lee, M.C. (2007). A Method of Performance Evaluation by Using the Analytic Network Process and Balanced Score Car. International
102
ISSN: 0718-2724. (http://jotmi.org)Journal of Technology Management & Innovation © Universidad Alberto Hurtado, Facultad de Economía y Negocios.
J. Technol. Manag. Innov. 2015. Volume 10, Issue 3
Conference on Convergence Information Technology, 21-23 Nov. 2007, pp. 235 – 240.
Leung, L.C., Lam, K.C., Cao D. (2006). Implementing the balanced scorecard using the analytic hierarchy process & the analytic network process. Journal of the Operational Research Society, 57, 682–691.
Poveda-Bautista, R., Baptista D.C., García-Melón, M. (2012). Setting competitiveness indicators using BSC and ANP. International Journal of Production Research, 50(17), 4738-4752.
Ravia; V., Shankara, R., Tiwari, M.K. (2005). Analyzing alternatives in reverse logistics for end-of-life computers: ANP and balanced scorecard approach. Computers & Industrial Engineering, 48, 327–356.
Saaty, T.L. (1980). The Analytic Hierarchy Process. McGraw-Hill, New York.
Saaty, T.L (2005). Theory and Applications of the Analytic Network Process: Decision Making with Benefits, Opportunities, Costs, and Risks. RWS Publications, Pittsburgh, PA.
Saaty, T.L. (1990). How to make a decision: The analytic hierarchy process. European Journal of Operations Research, 48, 9–26.
Sainaghi R., Phillips, P., Corti, V. (2013). Measuring hotel performance: Using a balanced scorecard perspectives’ approach. International Journal of Hospitality Management, 34, 150– 159.
Viglas, K., Fitsilis, P., Kameas, A. (2011). An integrated approach for selecting information systems: a case study. Technology and Investment, 2, 142–153.
Wu C.R., Lin C.T., Tsai P.H. (2010). Evaluating business performance of wealth management banks. European Journal of Operational Research, 207, 971–979.
DRISCOLL, M., Wagle, Y. (2003). Industry Profile: The industry that suits everyone. Standard and Poor’s Industry Surveys. (3 Jul. 2003): 4.pag. Online. S&P. 22 Oct. 2003.
103
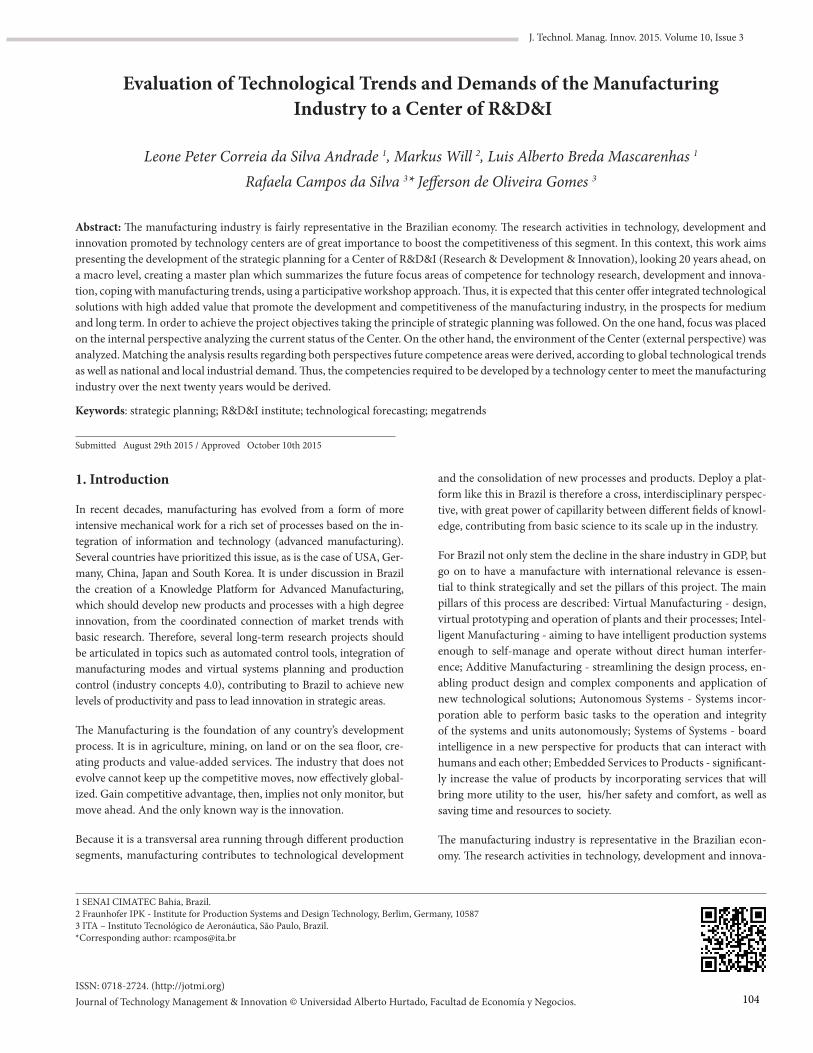
ISSN: 0718-2724. (http://jotmi.org)Journal of Technology Management & Innovation © Universidad Alberto Hurtado, Facultad de Economía y Negocios.
J. Technol. Manag. Innov. 2015. Volume 10, Issue 3
Evaluation of Technological Trends and Demands of the Manufacturing Industry to a Center of R&D&I
Leone Peter Correia da Silva Andrade 1, Markus Will 2, Luis Alberto Breda Mascarenhas 1
Rafaela Campos da Silva 3* Jefferson de Oliveira Gomes 3
Submitted August 29th 2015 / Approved October 10th 2015
1 SENAI CIMATEC Bahia, Brazil.2 Fraunhofer IPK - Institute for Production Systems and Design Technology, Berlim, Germany, 105873 ITA – Instituto Tecnológico de Aeronáutica, São Paulo, Brazil.*Corresponding author: [email protected]
Abstract: The manufacturing industry is fairly representative in the Brazilian economy. The research activities in technology, development and innovation promoted by technology centers are of great importance to boost the competitiveness of this segment. In this context, this work aims presenting the development of the strategic planning for a Center of R&D&I (Research & Development & Innovation), looking 20 years ahead, on a macro level, creating a master plan which summarizes the future focus areas of competence for technology research, development and innova-tion, coping with manufacturing trends, using a participative workshop approach. Thus, it is expected that this center offer integrated technological solutions with high added value that promote the development and competitiveness of the manufacturing industry, in the prospects for medium and long term. In order to achieve the project objectives taking the principle of strategic planning was followed. On the one hand, focus was placed on the internal perspective analyzing the current status of the Center. On the other hand, the environment of the Center (external perspective) was analyzed. Matching the analysis results regarding both perspectives future competence areas were derived, according to global technological trends as well as national and local industrial demand. Thus, the competencies required to be developed by a technology center to meet the manufacturing industry over the next twenty years would be derived.
Keywords: strategic planning; R&D&I institute; technological forecasting; megatrends
1. Introduction
In recent decades, manufacturing has evolved from a form of more intensive mechanical work for a rich set of processes based on the in-tegration of information and technology (advanced manufacturing). Several countries have prioritized this issue, as is the case of USA, Ger-many, China, Japan and South Korea. It is under discussion in Brazil the creation of a Knowledge Platform for Advanced Manufacturing, which should develop new products and processes with a high degree innovation, from the coordinated connection of market trends with basic research. Therefore, several long-term research projects should be articulated in topics such as automated control tools, integration of manufacturing modes and virtual systems planning and production control (industry concepts 4.0), contributing to Brazil to achieve new levels of productivity and pass to lead innovation in strategic areas.
The Manufacturing is the foundation of any country’s development process. It is in agriculture, mining, on land or on the sea floor, cre-ating products and value-added services. The industry that does not evolve cannot keep up the competitive moves, now effectively global-ized. Gain competitive advantage, then, implies not only monitor, but move ahead. And the only known way is the innovation.
Because it is a transversal area running through different production segments, manufacturing contributes to technological development
and the consolidation of new processes and products. Deploy a plat-form like this in Brazil is therefore a cross, interdisciplinary perspec-tive, with great power of capillarity between different fields of knowl-edge, contributing from basic science to its scale up in the industry.
For Brazil not only stem the decline in the share industry in GDP, but go on to have a manufacture with international relevance is essen-tial to think strategically and set the pillars of this project. The main pillars of this process are described: Virtual Manufacturing - design, virtual prototyping and operation of plants and their processes; Intel-ligent Manufacturing - aiming to have intelligent production systems enough to self-manage and operate without direct human interfer-ence; Additive Manufacturing - streamlining the design process, en-abling product design and complex components and application of new technological solutions; Autonomous Systems - Systems incor-poration able to perform basic tasks to the operation and integrity of the systems and units autonomously; Systems of Systems - board intelligence in a new perspective for products that can interact with humans and each other; Embedded Services to Products - significant-ly increase the value of products by incorporating services that will bring more utility to the user, his/her safety and comfort, as well as saving time and resources to society.
The manufacturing industry is representative in the Brazilian econ-omy. The research activities in technology, development and innova-
104
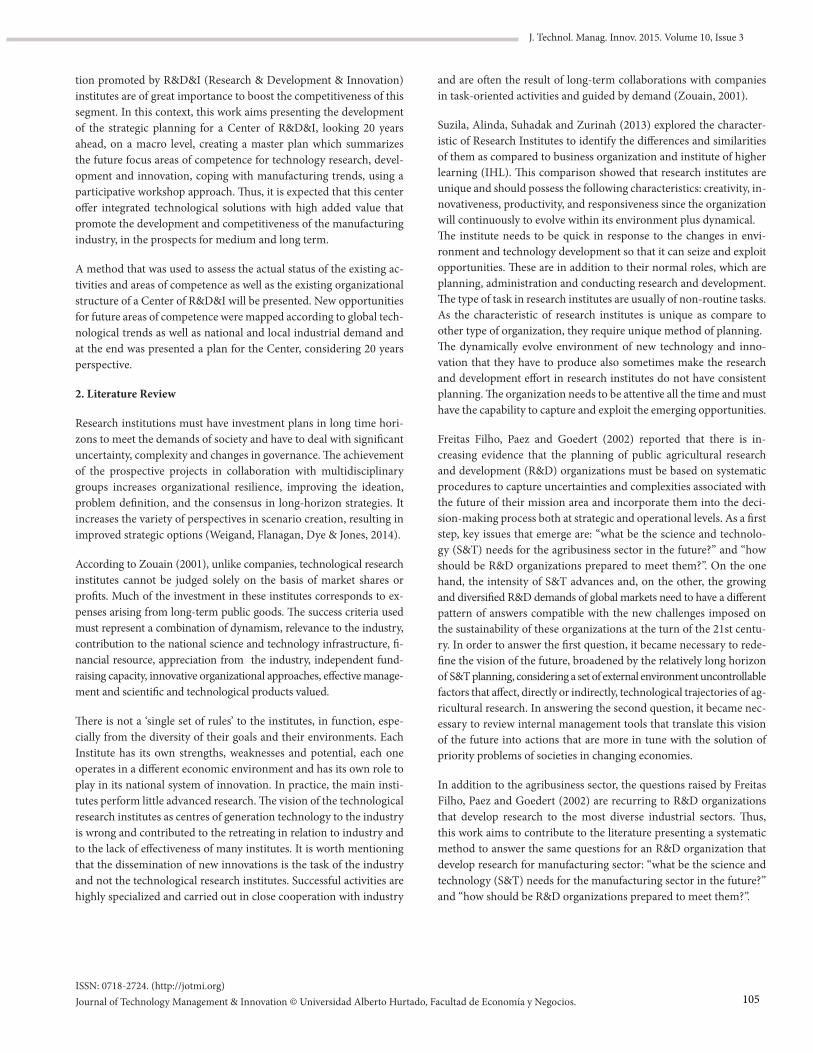
ISSN: 0718-2724. (http://jotmi.org)Journal of Technology Management & Innovation © Universidad Alberto Hurtado, Facultad de Economía y Negocios.
J. Technol. Manag. Innov. 2015. Volume 10, Issue 3
tion promoted by R&D&I (Research & Development & Innovation) institutes are of great importance to boost the competitiveness of this segment. In this context, this work aims presenting the development of the strategic planning for a Center of R&D&I, looking 20 years ahead, on a macro level, creating a master plan which summarizes the future focus areas of competence for technology research, devel-opment and innovation, coping with manufacturing trends, using a participative workshop approach. Thus, it is expected that this center offer integrated technological solutions with high added value that promote the development and competitiveness of the manufacturing industry, in the prospects for medium and long term.
A method that was used to assess the actual status of the existing ac-tivities and areas of competence as well as the existing organizational structure of a Center of R&D&I will be presented. New opportunities for future areas of competence were mapped according to global tech-nological trends as well as national and local industrial demand and at the end was presented a plan for the Center, considering 20 years perspective.
2. Literature Review
Research institutions must have investment plans in long time hori-zons to meet the demands of society and have to deal with significant uncertainty, complexity and changes in governance. The achievement of the prospective projects in collaboration with multidisciplinary groups increases organizational resilience, improving the ideation, problem definition, and the consensus in long-horizon strategies. It increases the variety of perspectives in scenario creation, resulting in improved strategic options (Weigand, Flanagan, Dye & Jones, 2014).
According to Zouain (2001), unlike companies, technological research institutes cannot be judged solely on the basis of market shares or profits. Much of the investment in these institutes corresponds to ex-penses arising from long-term public goods. The success criteria used must represent a combination of dynamism, relevance to the industry, contribution to the national science and technology infrastructure, fi-nancial resource, appreciation from the industry, independent fund-raising capacity, innovative organizational approaches, effective manage-ment and scientific and technological products valued.
There is not a ‘single set of rules’ to the institutes, in function, espe-cially from the diversity of their goals and their environments. Each Institute has its own strengths, weaknesses and potential, each one operates in a different economic environment and has its own role to play in its national system of innovation. In practice, the main insti-tutes perform little advanced research. The vision of the technological research institutes as centres of generation technology to the industry is wrong and contributed to the retreating in relation to industry and to the lack of effectiveness of many institutes. It is worth mentioning that the dissemination of new innovations is the task of the industry and not the technological research institutes. Successful activities are highly specialized and carried out in close cooperation with industry
and are often the result of long-term collaborations with companies in task-oriented activities and guided by demand (Zouain, 2001).
Suzila, Alinda, Suhadak and Zurinah (2013) explored the character-istic of Research Institutes to identify the differences and similarities of them as compared to business organization and institute of higher learning (IHL). This comparison showed that research institutes are unique and should possess the following characteristics: creativity, in-novativeness, productivity, and responsiveness since the organization will continuously to evolve within its environment plus dynamical.The institute needs to be quick in response to the changes in envi-ronment and technology development so that it can seize and exploit opportunities. These are in addition to their normal roles, which are planning, administration and conducting research and development. The type of task in research institutes are usually of non-routine tasks. As the characteristic of research institutes is unique as compare to other type of organization, they require unique method of planning.The dynamically evolve environment of new technology and inno-vation that they have to produce also sometimes make the research and development effort in research institutes do not have consistent planning. The organization needs to be attentive all the time and must have the capability to capture and exploit the emerging opportunities. Freitas Filho, Paez and Goedert (2002) reported that there is in-creasing evidence that the planning of public agricultural research and development (R&D) organizations must be based on systematic procedures to capture uncertainties and complexities associated with the future of their mission area and incorporate them into the deci-sion-making process both at strategic and operational levels. As a first step, key issues that emerge are: ‘‘what be the science and technolo-gy (S&T) needs for the agribusiness sector in the future?’’ and ‘‘how should be R&D organizations prepared to meet them?’’. On the one hand, the intensity of S&T advances and, on the other, the growing and diversified R&D demands of global markets need to have a different pattern of answers compatible with the new challenges imposed on the sustainability of these organizations at the turn of the 21st centu-ry. In order to answer the first question, it became necessary to rede-fine the vision of the future, broadened by the relatively long horizon of S&T planning, considering a set of external environment uncontrollable factors that affect, directly or indirectly, technological trajectories of ag-ricultural research. In answering the second question, it became nec-essary to review internal management tools that translate this vision of the future into actions that are more in tune with the solution of priority problems of societies in changing economies.
In addition to the agribusiness sector, the questions raised by Freitas Filho, Paez and Goedert (2002) are recurring to R&D organizations that develop research to the most diverse industrial sectors. Thus, this work aims to contribute to the literature presenting a systematic method to answer the same questions for an R&D organization that develop research for manufacturing sector: ‘‘what be the science and technology (S&T) needs for the manufacturing sector in the future?’’ and ‘‘how should be R&D organizations prepared to meet them?’’.
105
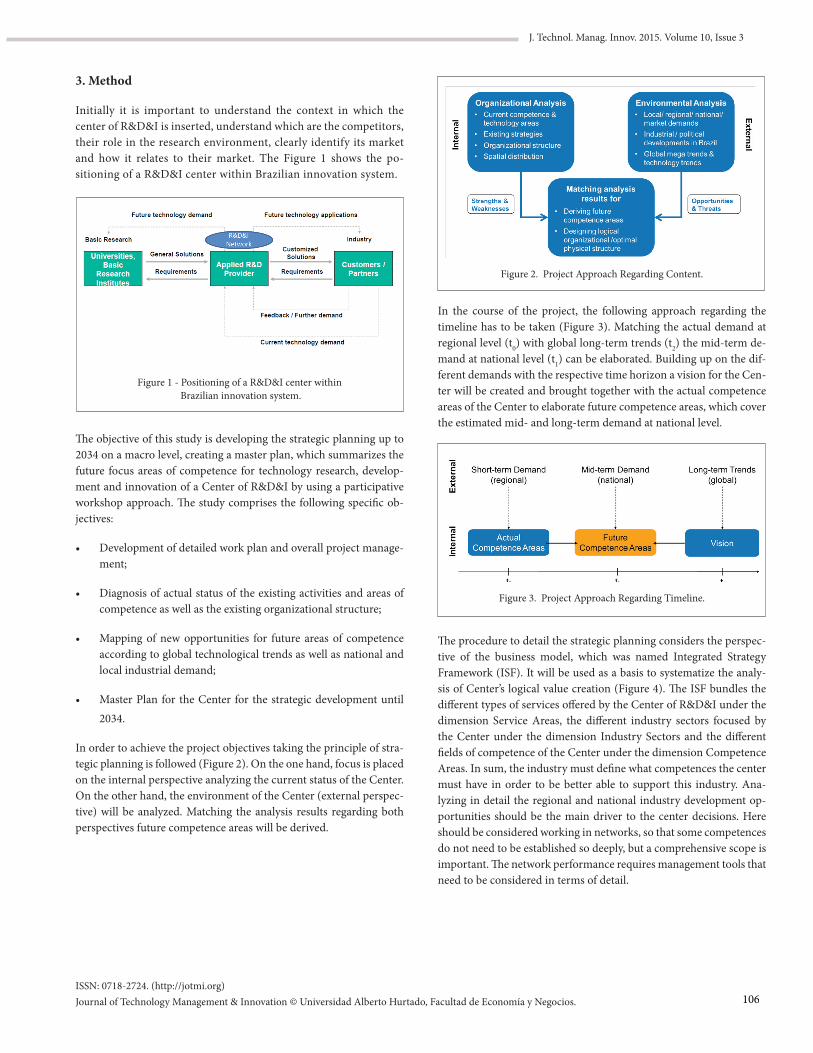
ISSN: 0718-2724. (http://jotmi.org)Journal of Technology Management & Innovation © Universidad Alberto Hurtado, Facultad de Economía y Negocios.
J. Technol. Manag. Innov. 2015. Volume 10, Issue 3
3. Method
Initially it is important to understand the context in which the center of R&D&I is inserted, understand which are the competitors, their role in the research environment, clearly identify its market and how it relates to their market. The Figure 1 shows the po-sitioning of a R&D&I center within Brazilian innovation system.
The objective of this study is developing the strategic planning up to 2034 on a macro level, creating a master plan, which summarizes the future focus areas of competence for technology research, develop-ment and innovation of a Center of R&D&I by using a participative workshop approach. The study comprises the following specific ob-jectives:
• Development of detailed work plan and overall project manage-ment;
• Diagnosis of actual status of the existing activities and areas of competence as well as the existing organizational structure;
• Mapping of new opportunities for future areas of competence according to global technological trends as well as national and local industrial demand;
• Master Plan for the Center for the strategic development until 2034.
In order to achieve the project objectives taking the principle of stra-tegic planning is followed (Figure 2). On the one hand, focus is placed on the internal perspective analyzing the current status of the Center. On the other hand, the environment of the Center (external perspec-tive) will be analyzed. Matching the analysis results regarding both perspectives future competence areas will be derived.
In the course of the project, the following approach regarding the timeline has to be taken (Figure 3). Matching the actual demand at regional level (t0) with global long-term trends (t2) the mid-term de-mand at national level (t1) can be elaborated. Building up on the dif-ferent demands with the respective time horizon a vision for the Cen-ter will be created and brought together with the actual competence areas of the Center to elaborate future competence areas, which cover the estimated mid- and long-term demand at national level.
The procedure to detail the strategic planning considers the perspec-tive of the business model, which was named Integrated Strategy Framework (ISF). It will be used as a basis to systematize the analy-sis of Center’s logical value creation (Figure 4). The ISF bundles the different types of services offered by the Center of R&D&I under the dimension Service Areas, the different industry sectors focused by the Center under the dimension Industry Sectors and the different fields of competence of the Center under the dimension Competence Areas. In sum, the industry must define what competences the center must have in order to be better able to support this industry. Ana-lyzing in detail the regional and national industry development op-portunities should be the main driver to the center decisions. Here should be considered working in networks, so that some competences do not need to be established so deeply, but a comprehensive scope is important. The network performance requires management tools that need to be considered in terms of detail.
Figure 1 - Positioning of a R&D&I center within Brazilian innovation system.
Figure 2. Project Approach Regarding Content.
Figure 3. Project Approach Regarding Timeline.
106
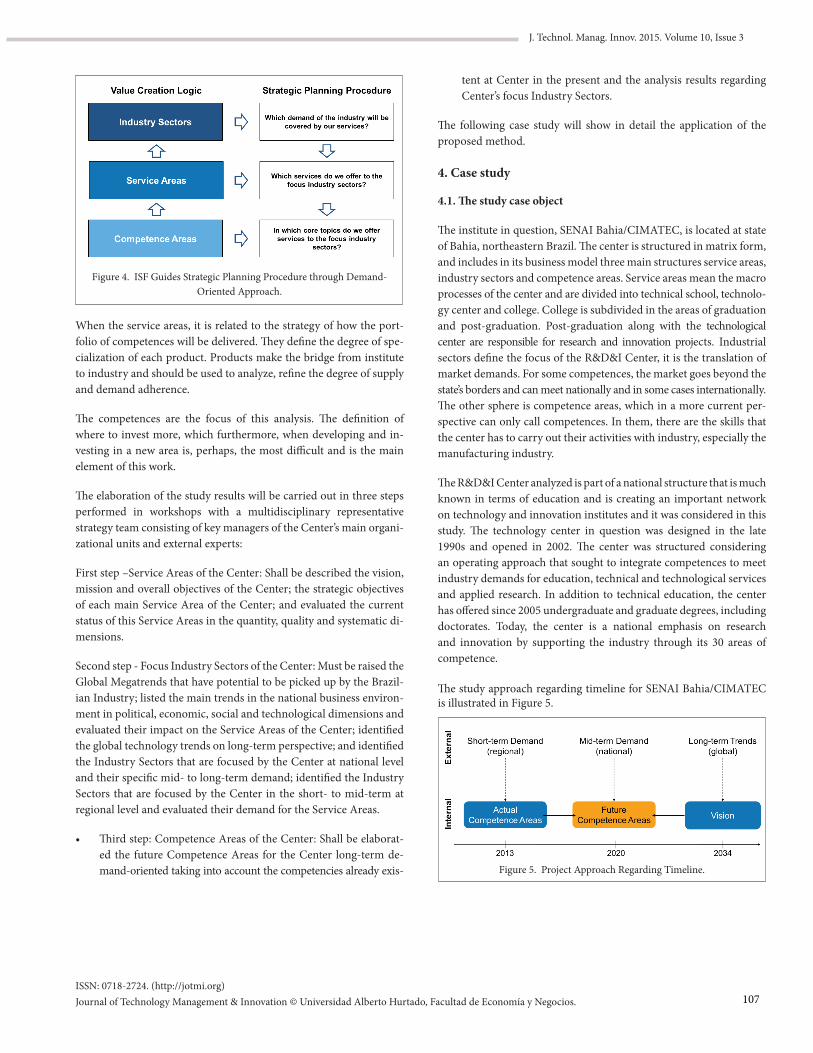
ISSN: 0718-2724. (http://jotmi.org)Journal of Technology Management & Innovation © Universidad Alberto Hurtado, Facultad de Economía y Negocios.
J. Technol. Manag. Innov. 2015. Volume 10, Issue 3
When the service areas, it is related to the strategy of how the port-folio of competences will be delivered. They define the degree of spe-cialization of each product. Products make the bridge from institute to industry and should be used to analyze, refine the degree of supply and demand adherence.
The competences are the focus of this analysis. The definition of where to invest more, which furthermore, when developing and in-vesting in a new area is, perhaps, the most difficult and is the main element of this work.
The elaboration of the study results will be carried out in three steps performed in workshops with a multidisciplinary representative strategy team consisting of key managers of the Center’s main organi-zational units and external experts:
First step –Service Areas of the Center: Shall be described the vision, mission and overall objectives of the Center; the strategic objectives of each main Service Area of the Center; and evaluated the current status of this Service Areas in the quantity, quality and systematic di-mensions.
Second step - Focus Industry Sectors of the Center: Must be raised the Global Megatrends that have potential to be picked up by the Brazil-ian Industry; listed the main trends in the national business environ-ment in political, economic, social and technological dimensions and evaluated their impact on the Service Areas of the Center; identified the global technology trends on long-term perspective; and identified the Industry Sectors that are focused by the Center at national level and their specific mid- to long-term demand; identified the Industry Sectors that are focused by the Center in the short- to mid-term at regional level and evaluated their demand for the Service Areas.
• Third step: Competence Areas of the Center: Shall be elaborat-ed the future Competence Areas for the Center long-term de-mand-oriented taking into account the competencies already exis-
tent at Center in the present and the analysis results regarding Center’s focus Industry Sectors.
The following case study will show in detail the application of the proposed method.
4. Case study
4.1. The study case object
The institute in question, SENAI Bahia/CIMATEC, is located at state of Bahia, northeastern Brazil. The center is structured in matrix form, and includes in its business model three main structures service areas, industry sectors and competence areas. Service areas mean the macro processes of the center and are divided into technical school, technolo-gy center and college. College is subdivided in the areas of graduation and post-graduation. Post-graduation along with the technological center are responsible for research and innovation projects. Industrial sectors define the focus of the R&D&I Center, it is the translation of market demands. For some competences, the market goes beyond the state’s borders and can meet nationally and in some cases internationally. The other sphere is competence areas, which in a more current per-spective can only call competences. In them, there are the skills that the center has to carry out their activities with industry, especially the manufacturing industry.
The R&D&I Center analyzed is part of a national structure that is much known in terms of education and is creating an important network on technology and innovation institutes and it was considered in this study. The technology center in question was designed in the late 1990s and opened in 2002. The center was structured considering an operating approach that sought to integrate competences to meet industry demands for education, technical and technological services and applied research. In addition to technical education, the center has offered since 2005 undergraduate and graduate degrees, including doctorates. Today, the center is a national emphasis on research and innovation by supporting the industry through its 30 areas of competence.
The study approach regarding timeline for SENAI Bahia/CIMATEC is illustrated in Figure 5.
Figure 5. Project Approach Regarding Timeline.
Figure 4. ISF Guides Strategic Planning Procedure through Demand-Oriented Approach.
107
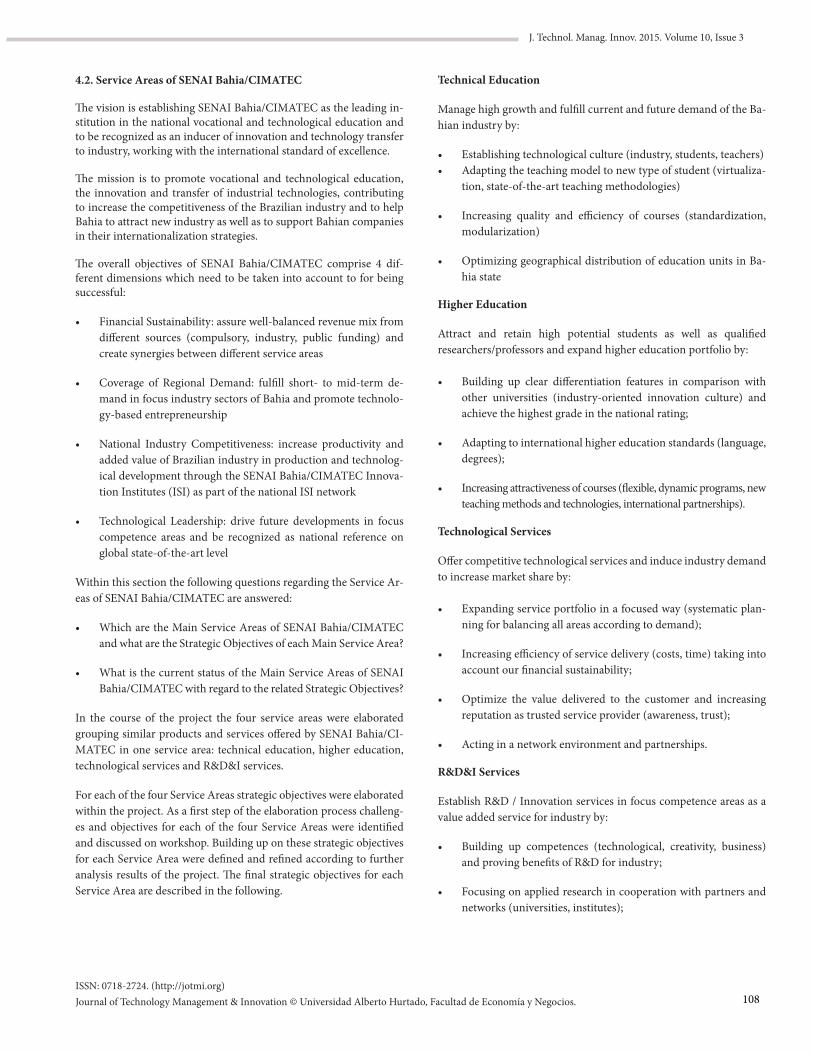
ISSN: 0718-2724. (http://jotmi.org)Journal of Technology Management & Innovation © Universidad Alberto Hurtado, Facultad de Economía y Negocios.
J. Technol. Manag. Innov. 2015. Volume 10, Issue 3
4.2. Service Areas of SENAI Bahia/CIMATEC
The vision is establishing SENAI Bahia/CIMATEC as the leading in-stitution in the national vocational and technological education and to be recognized as an inducer of innovation and technology transfer to industry, working with the international standard of excellence.
The mission is to promote vocational and technological education, the innovation and transfer of industrial technologies, contributing to increase the competitiveness of the Brazilian industry and to help Bahia to attract new industry as well as to support Bahian companies in their internationalization strategies.
The overall objectives of SENAI Bahia/CIMATEC comprise 4 dif-ferent dimensions which need to be taken into account to for being successful:
• Financial Sustainability: assure well-balanced revenue mix from different sources (compulsory, industry, public funding) and create synergies between different service areas
• Coverage of Regional Demand: fulfill short- to mid-term de-mand in focus industry sectors of Bahia and promote technolo-gy-based entrepreneurship
• National Industry Competitiveness: increase productivity and added value of Brazilian industry in production and technolog-ical development through the SENAI Bahia/CIMATEC Innova-tion Institutes (ISI) as part of the national ISI network
• Technological Leadership: drive future developments in focus competence areas and be recognized as national reference on global state-of-the-art level
Within this section the following questions regarding the Service Ar-eas of SENAI Bahia/CIMATEC are answered:
• Which are the Main Service Areas of SENAI Bahia/CIMATEC and what are the Strategic Objectives of each Main Service Area?
• What is the current status of the Main Service Areas of SENAI Bahia/CIMATEC with regard to the related Strategic Objectives?
In the course of the project the four service areas were elaborated grouping similar products and services offered by SENAI Bahia/CI-MATEC in one service area: technical education, higher education, technological services and R&D&I services.
For each of the four Service Areas strategic objectives were elaborated within the project. As a first step of the elaboration process challeng-es and objectives for each of the four Service Areas were identified and discussed on workshop. Building up on these strategic objectives for each Service Area were defined and refined according to further analysis results of the project. The final strategic objectives for each Service Area are described in the following.
Technical Education
Manage high growth and fulfill current and future demand of the Ba-hian industry by:
• Establishing technological culture (industry, students, teachers)• Adapting the teaching model to new type of student (virtualiza-
tion, state-of-the-art teaching methodologies)
• Increasing quality and efficiency of courses (standardization, modularization)
• Optimizing geographical distribution of education units in Ba-hia state
Higher Education
Attract and retain high potential students as well as qualified researchers/professors and expand higher education portfolio by:
• Building up clear differentiation features in comparison with other universities (industry-oriented innovation culture) and achieve the highest grade in the national rating;
• Adapting to international higher education standards (language, degrees);
• Increasing attractiveness of courses (flexible, dynamic programs, new teaching methods and technologies, international partnerships).
Technological Services
Offer competitive technological services and induce industry demand to increase market share by:
• Expanding service portfolio in a focused way (systematic plan-ning for balancing all areas according to demand);
• Increasing efficiency of service delivery (costs, time) taking into account our financial sustainability;
• Optimize the value delivered to the customer and increasing reputation as trusted service provider (awareness, trust);
• Acting in a network environment and partnerships.
R&D&I Services
Establish R&D / Innovation services in focus competence areas as a value added service for industry by:
• Building up competences (technological, creativity, business) and proving benefits of R&D for industry;
• Focusing on applied research in cooperation with partners and networks (universities, institutes);
108
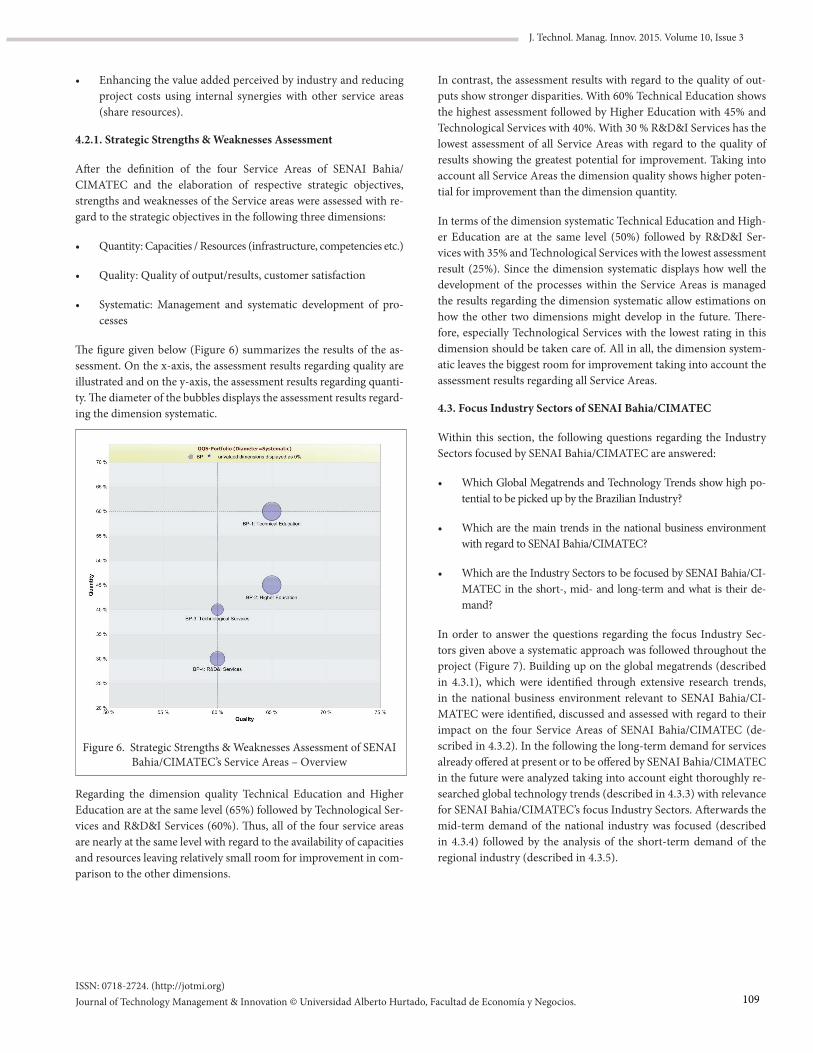
ISSN: 0718-2724. (http://jotmi.org)Journal of Technology Management & Innovation © Universidad Alberto Hurtado, Facultad de Economía y Negocios.
J. Technol. Manag. Innov. 2015. Volume 10, Issue 3
• Enhancing the value added perceived by industry and reducing project costs using internal synergies with other service areas (share resources).
4.2.1. Strategic Strengths & Weaknesses Assessment
After the definition of the four Service Areas of SENAI Bahia/CIMATEC and the elaboration of respective strategic objectives, strengths and weaknesses of the Service areas were assessed with re-gard to the strategic objectives in the following three dimensions:
• Quantity: Capacities / Resources (infrastructure, competencies etc.)
• Quality: Quality of output/results, customer satisfaction
• Systematic: Management and systematic development of pro-cesses
The figure given below (Figure 6) summarizes the results of the as-sessment. On the x-axis, the assessment results regarding quality are illustrated and on the y-axis, the assessment results regarding quanti-ty. The diameter of the bubbles displays the assessment results regard-ing the dimension systematic.
Figure 6. Strategic Strengths & Weaknesses Assessment of SENAI Bahia/CIMATEC’s Service Areas – Overview
Regarding the dimension quality Technical Education and Higher Education are at the same level (65%) followed by Technological Ser-vices and R&D&I Services (60%). Thus, all of the four service areas are nearly at the same level with regard to the availability of capacities and resources leaving relatively small room for improvement in com-parison to the other dimensions.
In contrast, the assessment results with regard to the quality of out-puts show stronger disparities. With 60% Technical Education shows the highest assessment followed by Higher Education with 45% and Technological Services with 40%. With 30 % R&D&I Services has the lowest assessment of all Service Areas with regard to the quality of results showing the greatest potential for improvement. Taking into account all Service Areas the dimension quality shows higher poten-tial for improvement than the dimension quantity.
In terms of the dimension systematic Technical Education and High-er Education are at the same level (50%) followed by R&D&I Ser-vices with 35% and Technological Services with the lowest assessment result (25%). Since the dimension systematic displays how well the development of the processes within the Service Areas is managed the results regarding the dimension systematic allow estimations on how the other two dimensions might develop in the future. There-fore, especially Technological Services with the lowest rating in this dimension should be taken care of. All in all, the dimension system-atic leaves the biggest room for improvement taking into account the assessment results regarding all Service Areas.
4.3. Focus Industry Sectors of SENAI Bahia/CIMATEC
Within this section, the following questions regarding the Industry Sectors focused by SENAI Bahia/CIMATEC are answered:
• Which Global Megatrends and Technology Trends show high po-tential to be picked up by the Brazilian Industry?
• Which are the main trends in the national business environment with regard to SENAI Bahia/CIMATEC?
• Which are the Industry Sectors to be focused by SENAI Bahia/CI-MATEC in the short-, mid- and long-term and what is their de-mand?
In order to answer the questions regarding the focus Industry Sec-tors given above a systematic approach was followed throughout the project (Figure 7). Building up on the global megatrends (described in 4.3.1), which were identified through extensive research trends, in the national business environment relevant to SENAI Bahia/CI-MATEC were identified, discussed and assessed with regard to their impact on the four Service Areas of SENAI Bahia/CIMATEC (de-scribed in 4.3.2). In the following the long-term demand for services already offered at present or to be offered by SENAI Bahia/CIMATEC in the future were analyzed taking into account eight thoroughly re-searched global technology trends (described in 4.3.3) with relevance for SENAI Bahia/CIMATEC’s focus Industry Sectors. Afterwards the mid-term demand of the national industry was focused (described in 4.3.4) followed by the analysis of the short-term demand of the regional industry (described in 4.3.5).
109
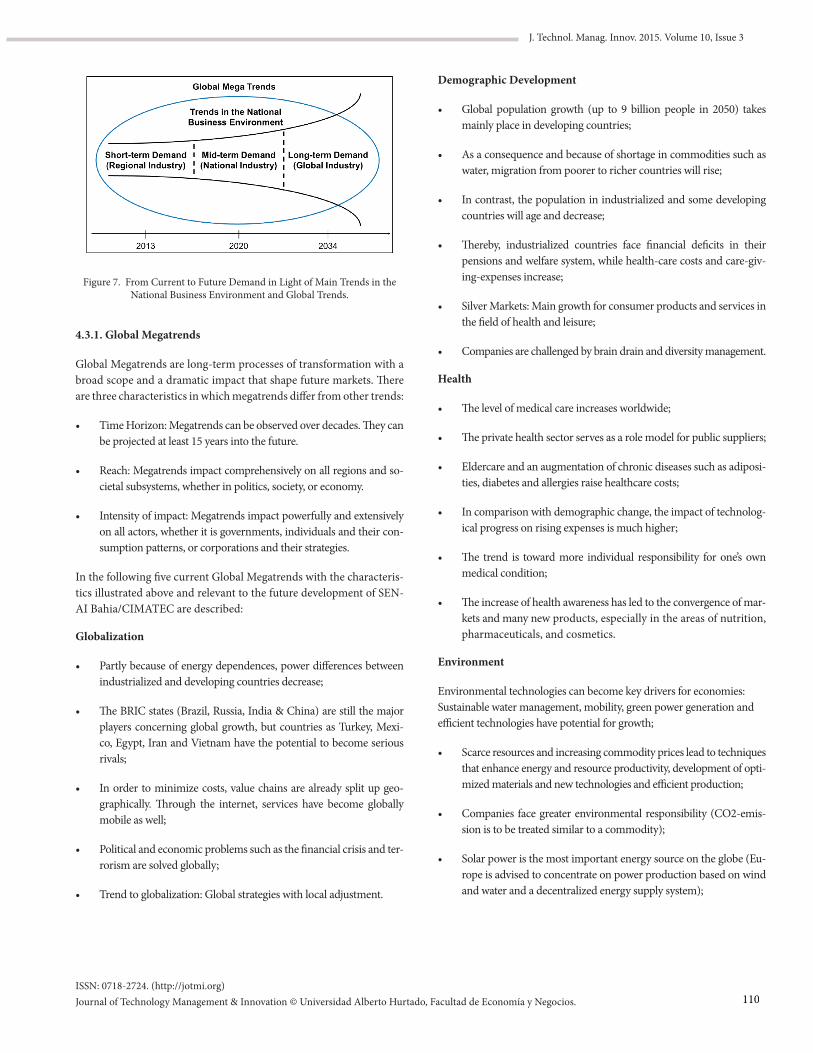
ISSN: 0718-2724. (http://jotmi.org)Journal of Technology Management & Innovation © Universidad Alberto Hurtado, Facultad de Economía y Negocios.
J. Technol. Manag. Innov. 2015. Volume 10, Issue 3
Figure 7. From Current to Future Demand in Light of Main Trends in the National Business Environment and Global Trends.
4.3.1. Global Megatrends
Global Megatrends are long-term processes of transformation with a broad scope and a dramatic impact that shape future markets. There are three characteristics in which megatrends differ from other trends:
• Time Horizon: Megatrends can be observed over decades. They can be projected at least 15 years into the future.
• Reach: Megatrends impact comprehensively on all regions and so-cietal subsystems, whether in politics, society, or economy.
• Intensity of impact: Megatrends impact powerfully and extensively on all actors, whether it is governments, individuals and their con-sumption patterns, or corporations and their strategies.
In the following five current Global Megatrends with the characteris-tics illustrated above and relevant to the future development of SEN-AI Bahia/CIMATEC are described:
Globalization
• Partly because of energy dependences, power differences between industrialized and developing countries decrease;
• The BRIC states (Brazil, Russia, India & China) are still the major players concerning global growth, but countries as Turkey, Mexi-co, Egypt, Iran and Vietnam have the potential to become serious rivals;
• In order to minimize costs, value chains are already split up geo-graphically. Through the internet, services have become globally mobile as well;
• Political and economic problems such as the financial crisis and ter-rorism are solved globally;
• Trend to globalization: Global strategies with local adjustment.
Demographic Development
• Global population growth (up to 9 billion people in 2050) takes mainly place in developing countries;
• As a consequence and because of shortage in commodities such as water, migration from poorer to richer countries will rise;
• In contrast, the population in industrialized and some developing countries will age and decrease;
• Thereby, industrialized countries face financial deficits in their pensions and welfare system, while health-care costs and care-giv-ing-expenses increase;
• Silver Markets: Main growth for consumer products and services in the field of health and leisure;
• Companies are challenged by brain drain and diversity management.
Health
• The level of medical care increases worldwide;
• The private health sector serves as a role model for public suppliers;
• Eldercare and an augmentation of chronic diseases such as adiposi-ties, diabetes and allergies raise healthcare costs;
• In comparison with demographic change, the impact of technolog-ical progress on rising expenses is much higher;
• The trend is toward more individual responsibility for one’s own medical condition;
• The increase of health awareness has led to the convergence of mar-kets and many new products, especially in the areas of nutrition, pharmaceuticals, and cosmetics.
Environment
Environmental technologies can become key drivers for economies: Sustainable water management, mobility, green power generation and efficient technologies have potential for growth;
• Scarce resources and increasing commodity prices lead to techniques that enhance energy and resource productivity, development of opti-mized materials and new technologies and efficient production;
• Companies face greater environmental responsibility (CO2-emis-sion is to be treated similar to a commodity);
• Solar power is the most important energy source on the globe (Eu-rope is advised to concentrate on power production based on wind and water and a decentralized energy supply system);
110
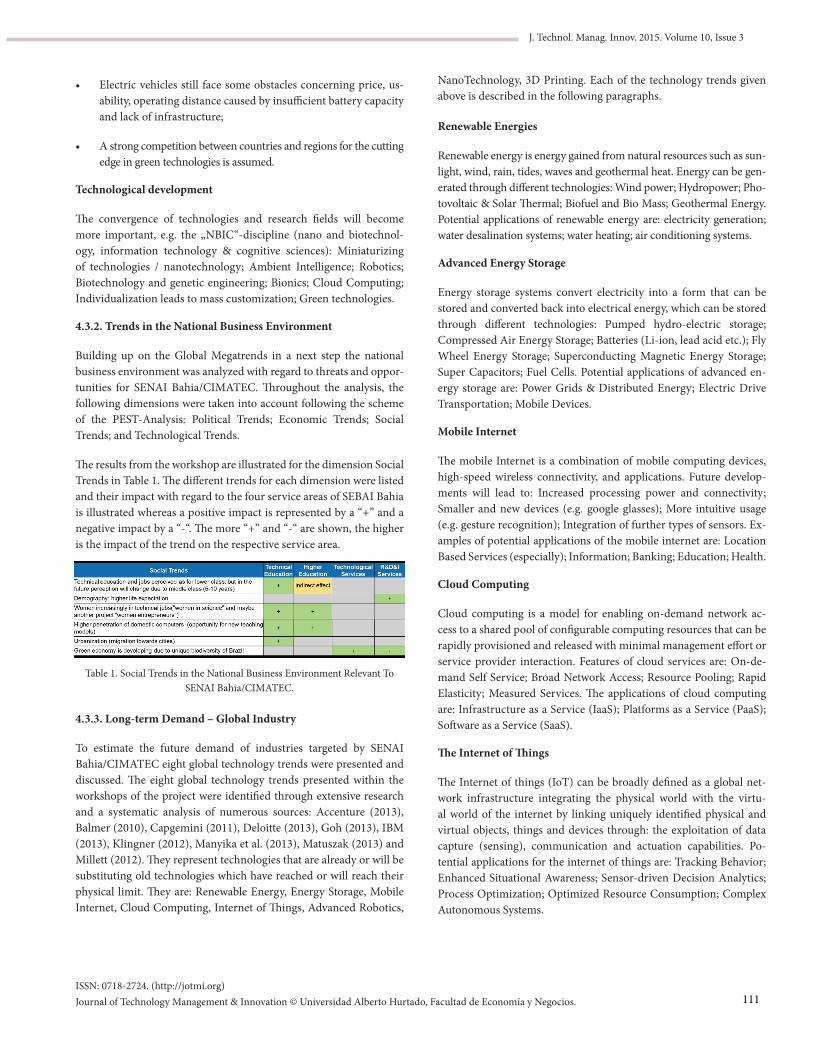
ISSN: 0718-2724. (http://jotmi.org)Journal of Technology Management & Innovation © Universidad Alberto Hurtado, Facultad de Economía y Negocios.
J. Technol. Manag. Innov. 2015. Volume 10, Issue 3
• Electric vehicles still face some obstacles concerning price, us-ability, operating distance caused by insufficient battery capacity and lack of infrastructure;
• A strong competition between countries and regions for the cutting edge in green technologies is assumed.
Technological development
The convergence of technologies and research fields will become more important, e.g. the „NBIC“-discipline (nano and biotechnol-ogy, information technology & cognitive sciences): Miniaturizing of technologies / nanotechnology; Ambient Intelligence; Robotics; Biotechnology and genetic engineering; Bionics; Cloud Computing; Individualization leads to mass customization; Green technologies.
4.3.2. Trends in the National Business Environment
Building up on the Global Megatrends in a next step the national business environment was analyzed with regard to threats and oppor-tunities for SENAI Bahia/CIMATEC. Throughout the analysis, the following dimensions were taken into account following the scheme of the PEST-Analysis: Political Trends; Economic Trends; Social Trends; and Technological Trends.
The results from the workshop are illustrated for the dimension Social Trends in Table 1. The different trends for each dimension were listed and their impact with regard to the four service areas of SEBAI Bahia is illustrated whereas a positive impact is represented by a “+” and a negative impact by a “-“. The more “+” and “-“ are shown, the higher is the impact of the trend on the respective service area.
4.3.3. Long-term Demand – Global Industry
To estimate the future demand of industries targeted by SENAI Bahia/CIMATEC eight global technology trends were presented and discussed. The eight global technology trends presented within the workshops of the project were identified through extensive research and a systematic analysis of numerous sources: Accenture (2013), Balmer (2010), Capgemini (2011), Deloitte (2013), Goh (2013), IBM (2013), Klingner (2012), Manyika et al. (2013), Matuszak (2013) and Millett (2012). They represent technologies that are already or will be substituting old technologies which have reached or will reach their physical limit. They are: Renewable Energy, Energy Storage, Mobile Internet, Cloud Computing, Internet of Things, Advanced Robotics,
NanoTechnology, 3D Printing. Each of the technology trends given above is described in the following paragraphs.
Renewable Energies
Renewable energy is energy gained from natural resources such as sun-light, wind, rain, tides, waves and geothermal heat. Energy can be gen-erated through different technologies: Wind power; Hydropower; Pho-tovoltaic & Solar Thermal; Biofuel and Bio Mass; Geothermal Energy. Potential applications of renewable energy are: electricity generation; water desalination systems; water heating; air conditioning systems.
Advanced Energy Storage
Energy storage systems convert electricity into a form that can be stored and converted back into electrical energy, which can be stored through different technologies: Pumped hydro-electric storage; Compressed Air Energy Storage; Batteries (Li-ion, lead acid etc.); Fly Wheel Energy Storage; Superconducting Magnetic Energy Storage; Super Capacitors; Fuel Cells. Potential applications of advanced en-ergy storage are: Power Grids & Distributed Energy; Electric Drive Transportation; Mobile Devices.
Mobile Internet
The mobile Internet is a combination of mobile computing devices, high-speed wireless connectivity, and applications. Future develop-ments will lead to: Increased processing power and connectivity; Smaller and new devices (e.g. google glasses); More intuitive usage (e.g. gesture recognition); Integration of further types of sensors. Ex-amples of potential applications of the mobile internet are: Location Based Services (especially); Information; Banking; Education; Health.
Cloud Computing
Cloud computing is a model for enabling on-demand network ac-cess to a shared pool of configurable computing resources that can be rapidly provisioned and released with minimal management effort or service provider interaction. Features of cloud services are: On-de-mand Self Service; Broad Network Access; Resource Pooling; Rapid Elasticity; Measured Services. The applications of cloud computing are: Infrastructure as a Service (IaaS); Platforms as a Service (PaaS); Software as a Service (SaaS).
The Internet of Things
The Internet of things (IoT) can be broadly defined as a global net-work infrastructure integrating the physical world with the virtu-al world of the internet by linking uniquely identified physical and virtual objects, things and devices through: the exploitation of data capture (sensing), communication and actuation capabilities. Po-tential applications for the internet of things are: Tracking Behavior; Enhanced Situational Awareness; Sensor-driven Decision Analytics; Process Optimization; Optimized Resource Consumption; Complex Autonomous Systems.
Table 1. Social Trends in the National Business Environment Relevant To SENAI Bahia/CIMATEC.
111
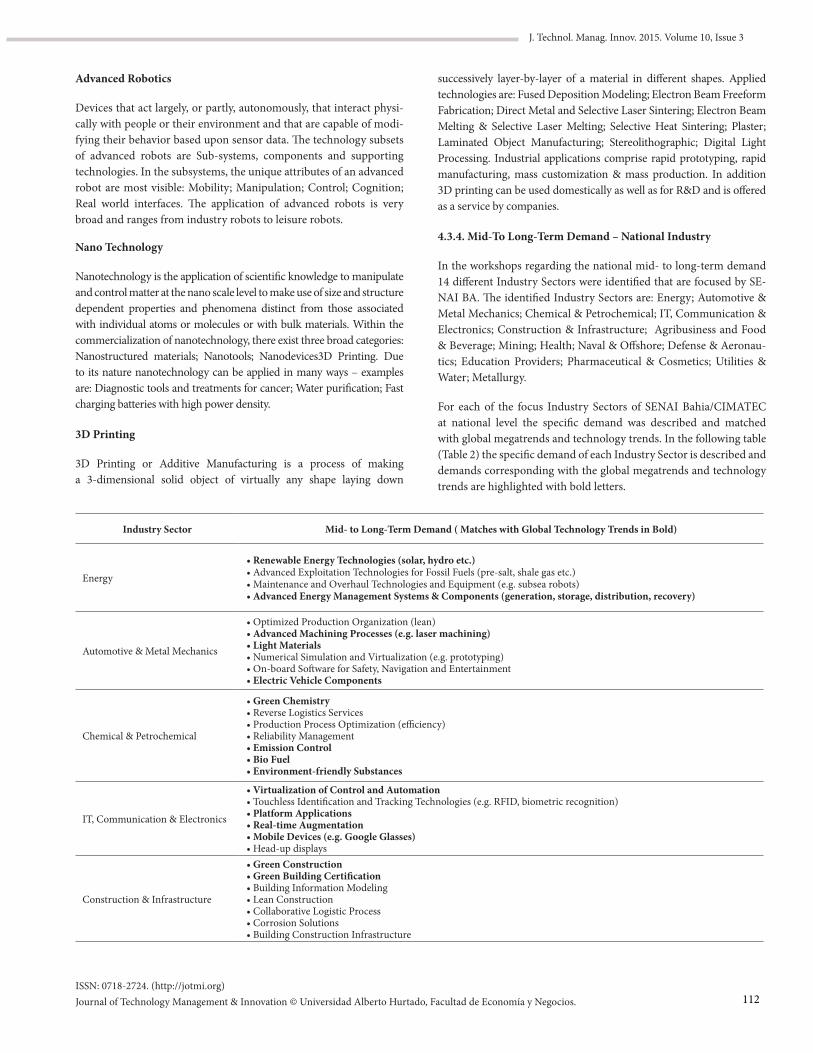
ISSN: 0718-2724. (http://jotmi.org)Journal of Technology Management & Innovation © Universidad Alberto Hurtado, Facultad de Economía y Negocios.
J. Technol. Manag. Innov. 2015. Volume 10, Issue 3
Advanced Robotics
Devices that act largely, or partly, autonomously, that interact physi-cally with people or their environment and that are capable of modi-fying their behavior based upon sensor data. The technology subsets of advanced robots are Sub-systems, components and supporting technologies. In the subsystems, the unique attributes of an advanced robot are most visible: Mobility; Manipulation; Control; Cognition; Real world interfaces. The application of advanced robots is very broad and ranges from industry robots to leisure robots.
Nano Technology
Nanotechnology is the application of scientific knowledge to manipulate and control matter at the nano scale level to make use of size and structure dependent properties and phenomena distinct from those associated with individual atoms or molecules or with bulk materials. Within the commercialization of nanotechnology, there exist three broad categories: Nanostructured materials; Nanotools; Nanodevices3D Printing. Due to its nature nanotechnology can be applied in many ways – examples are: Diagnostic tools and treatments for cancer; Water purification; Fast charging batteries with high power density.
3D Printing
3D Printing or Additive Manufacturing is a process of making a 3-dimensional solid object of virtually any shape laying down
successively layer-by-layer of a material in different shapes. Applied technologies are: Fused Deposition Modeling; Electron Beam Freeform Fabrication; Direct Metal and Selective Laser Sintering; Electron Beam Melting & Selective Laser Melting; Selective Heat Sintering; Plaster; Laminated Object Manufacturing; Stereolithographic; Digital Light Processing. Industrial applications comprise rapid prototyping, rapid manufacturing, mass customization & mass production. In addition 3D printing can be used domestically as well as for R&D and is offered as a service by companies.
4.3.4. Mid-To Long-Term Demand – National Industry
In the workshops regarding the national mid- to long-term demand 14 different Industry Sectors were identified that are focused by SE-NAI BA. The identified Industry Sectors are: Energy; Automotive & Metal Mechanics; Chemical & Petrochemical; IT, Communication & Electronics; Construction & Infrastructure; Agribusiness and Food & Beverage; Mining; Health; Naval & Offshore; Defense & Aeronau-tics; Education Providers; Pharmaceutical & Cosmetics; Utilities & Water; Metallurgy.
For each of the focus Industry Sectors of SENAI Bahia/CIMATEC at national level the specific demand was described and matched with global megatrends and technology trends. In the following table (Table 2) the specific demand of each Industry Sector is described and demands corresponding with the global megatrends and technology trends are highlighted with bold letters.
Industry Sector Mid- to Long-Term Demand ( Matches with Global Technology Trends in Bold)
Energy
• Renewable Energy Technologies (solar, hydro etc.)•AdvancedExploitationTechnologiesforFossilFuels(pre-salt,shalegasetc.)•MaintenanceandOverhaulTechnologiesandEquipment(e.g.subsearobots)• Advanced Energy Management Systems & Components (generation, storage, distribution, recovery)
Automotive & Metal Mechanics
•OptimizedProductionOrganization(lean)• Advanced Machining Processes (e.g. laser machining)• Light Materials•NumericalSimulationandVirtualization(e.g.prototyping)•On-boardSoftwareforSafety,NavigationandEntertainment• Electric Vehicle Components
Chemical & Petrochemical
•Green Chemistry•ReverseLogisticsServices•ProductionProcessOptimization(efficiency)•ReliabilityManagement• Emission Control• Bio Fuel• Environment-friendly Substances
IT, Communication & Electronics
• Virtualization of Control and Automation•TouchlessIdentificationandTrackingTechnologies(e.g.RFID,biometricrecognition)• Platform Applications• Real-time Augmentation• Mobile Devices (e.g. Google Glasses)•Head-updisplays
Construction & Infrastructure
• Green Construction• Green Building Certification•BuildingInformationModeling•LeanConstruction•CollaborativeLogisticProcess•CorrosionSolutions•BuildingConstructionInfrastructure
112
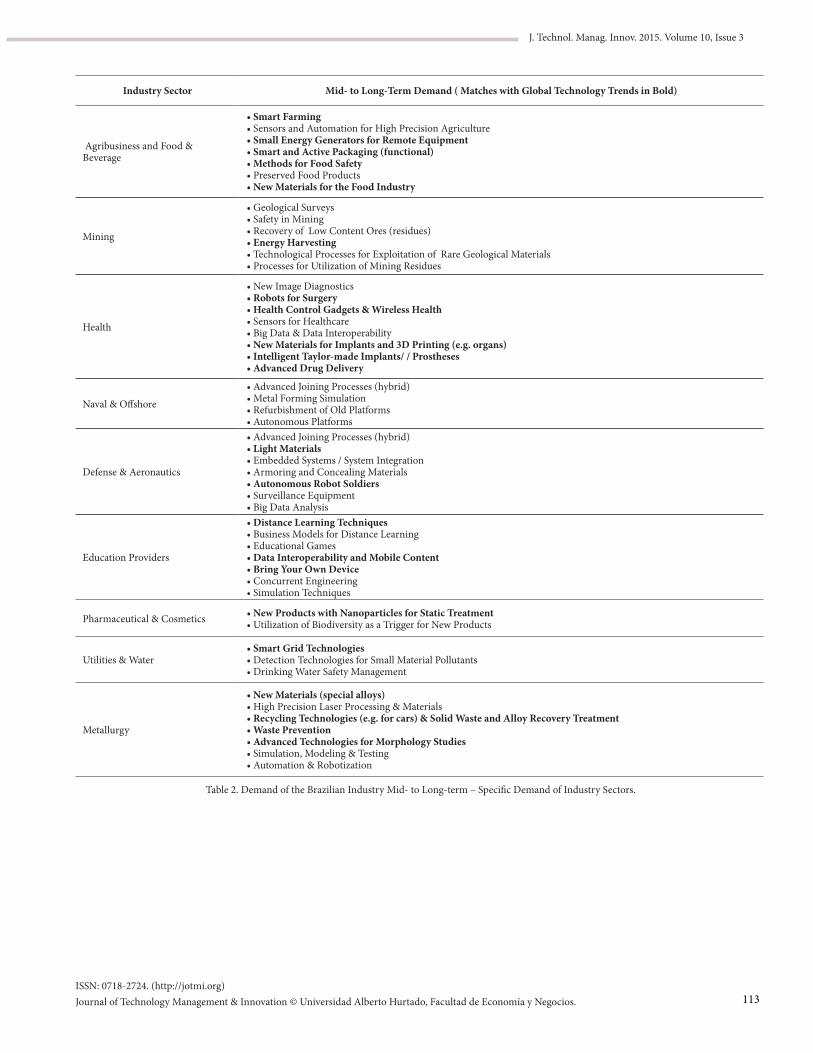
ISSN: 0718-2724. (http://jotmi.org)Journal of Technology Management & Innovation © Universidad Alberto Hurtado, Facultad de Economía y Negocios.
J. Technol. Manag. Innov. 2015. Volume 10, Issue 3
Industry Sector Mid- to Long-Term Demand ( Matches with Global Technology Trends in Bold)
Agribusiness and Food & Beverage
• Smart Farming•SensorsandAutomationforHighPrecisionAgriculture• Small Energy Generators for Remote Equipment• Smart and Active Packaging (functional)• Methods for Food Safety•PreservedFoodProducts• New Materials for the Food Industry
Mining
•GeologicalSurveys•SafetyinMining•RecoveryofLowContentOres(residues)• Energy Harvesting•TechnologicalProcessesforExploitationofRareGeologicalMaterials•ProcessesforUtilizationofMiningResidues
Health
•NewImageDiagnostics• Robots for Surgery• Health Control Gadgets & Wireless Health•SensorsforHealthcare•BigData&DataInteroperability• New Materials for Implants and 3D Printing (e.g. organs)• Intelligent Taylor-made Implants/ / Prostheses• Advanced Drug Delivery
Naval & Offshore
•AdvancedJoiningProcesses(hybrid)•MetalFormingSimulation•RefurbishmentofOldPlatforms•AutonomousPlatforms
Defense & Aeronautics
•AdvancedJoiningProcesses(hybrid)• Light Materials•EmbeddedSystems/SystemIntegration•ArmoringandConcealingMaterials• Autonomous Robot Soldiers•SurveillanceEquipment•BigDataAnalysis
Education Providers
• Distance Learning Techniques•BusinessModelsforDistanceLearning•EducationalGames• Data Interoperability and Mobile Content• Bring Your Own Device•ConcurrentEngineering•SimulationTechniques
Pharmaceutical & Cosmetics • New Products with Nanoparticles for Static Treatment•UtilizationofBiodiversityasaTriggerforNewProducts
Utilities & Water• Smart Grid Technologies•DetectionTechnologiesforSmallMaterialPollutants•DrinkingWaterSafetyManagement
Metallurgy
• New Materials (special alloys)•HighPrecisionLaserProcessing&Materials• Recycling Technologies (e.g. for cars) & Solid Waste and Alloy Recovery Treatment• Waste Prevention• Advanced Technologies for Morphology Studies•Simulation,Modeling&Testing•Automation&Robotization
Table 2. Demand of the Brazilian Industry Mid- to Long-term – Specific Demand of Industry Sectors.
113
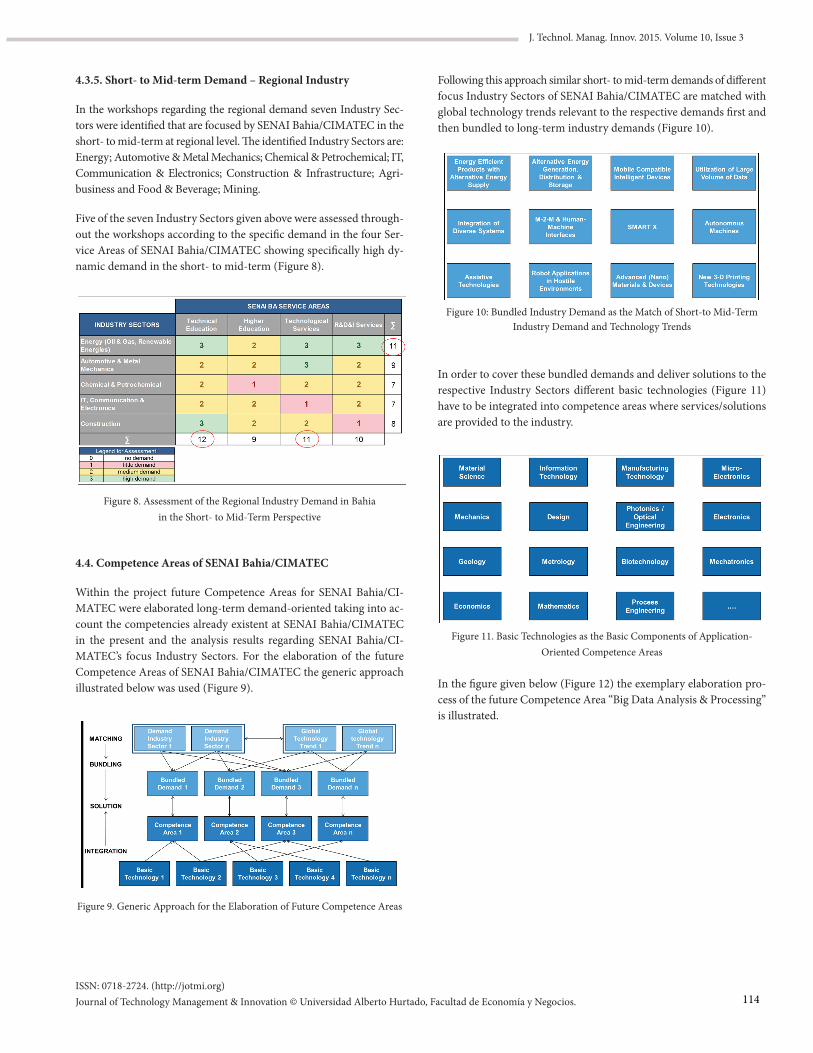
ISSN: 0718-2724. (http://jotmi.org)Journal of Technology Management & Innovation © Universidad Alberto Hurtado, Facultad de Economía y Negocios.
J. Technol. Manag. Innov. 2015. Volume 10, Issue 3
4.3.5. Short- to Mid-term Demand – Regional Industry
In the workshops regarding the regional demand seven Industry Sec-tors were identified that are focused by SENAI Bahia/CIMATEC in the short- to mid-term at regional level. The identified Industry Sectors are: Energy; Automotive & Metal Mechanics; Chemical & Petrochemical; IT, Communication & Electronics; Construction & Infrastructure; Agri-business and Food & Beverage; Mining.
Five of the seven Industry Sectors given above were assessed through-out the workshops according to the specific demand in the four Ser-vice Areas of SENAI Bahia/CIMATEC showing specifically high dy-namic demand in the short- to mid-term (Figure 8).
Figure 8. Assessment of the Regional Industry Demand in Bahia in the Short- to Mid-Term Perspective
4.4. Competence Areas of SENAI Bahia/CIMATEC
Within the project future Competence Areas for SENAI Bahia/CI-MATEC were elaborated long-term demand-oriented taking into ac-count the competencies already existent at SENAI Bahia/CIMATEC in the present and the analysis results regarding SENAI Bahia/CI-MATEC’s focus Industry Sectors. For the elaboration of the future Competence Areas of SENAI Bahia/CIMATEC the generic approach illustrated below was used (Figure 9).
Figure 9. Generic Approach for the Elaboration of Future Competence Areas
Following this approach similar short- to mid-term demands of different focus Industry Sectors of SENAI Bahia/CIMATEC are matched with global technology trends relevant to the respective demands first and then bundled to long-term industry demands (Figure 10).
Figure 10: Bundled Industry Demand as the Match of Short-to Mid-Term Industry Demand and Technology Trends
In order to cover these bundled demands and deliver solutions to the respective Industry Sectors different basic technologies (Figure 11) have to be integrated into competence areas where services/solutions are provided to the industry.
Figure 11. Basic Technologies as the Basic Components of Application-Oriented Competence Areas
In the figure given below (Figure 12) the exemplary elaboration pro-cess of the future Competence Area “Big Data Analysis & Processing” is illustrated.
114
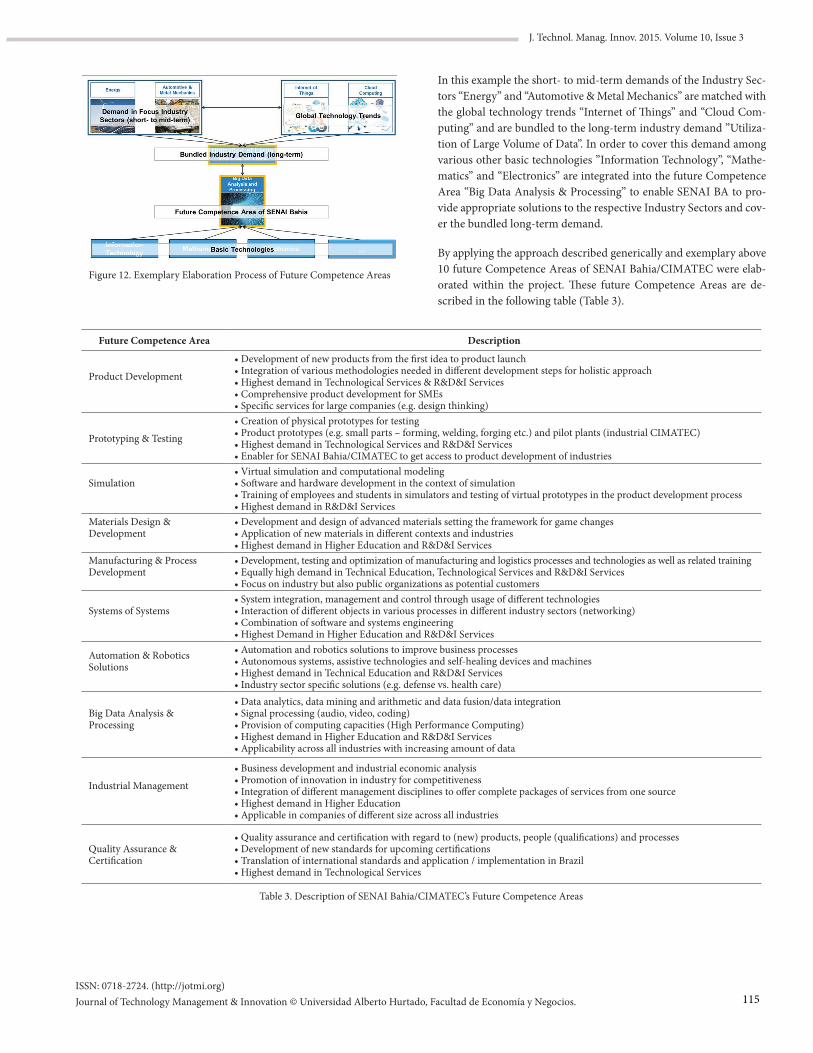
ISSN: 0718-2724. (http://jotmi.org)Journal of Technology Management & Innovation © Universidad Alberto Hurtado, Facultad de Economía y Negocios.
J. Technol. Manag. Innov. 2015. Volume 10, Issue 3
Figure 12. Exemplary Elaboration Process of Future Competence Areas
In this example the short- to mid-term demands of the Industry Sec-tors “Energy” and “Automotive & Metal Mechanics” are matched with the global technology trends “Internet of Things” and “Cloud Com-puting” and are bundled to the long-term industry demand ”Utiliza-tion of Large Volume of Data”. In order to cover this demand among various other basic technologies ”Information Technology”, “Mathe-matics” and “Electronics” are integrated into the future Competence Area “Big Data Analysis & Processing” to enable SENAI BA to pro-vide appropriate solutions to the respective Industry Sectors and cov-er the bundled long-term demand.
By applying the approach described generically and exemplary above 10 future Competence Areas of SENAI Bahia/CIMATEC were elab-orated within the project. These future Competence Areas are de-scribed in the following table (Table 3).
Future Competence Area Description
Product Development
•Developmentofnewproductsfromthefirstideatoproductlaunch•Integrationofvariousmethodologiesneededindifferentdevelopmentstepsforholisticapproach•HighestdemandinTechnologicalServices&R&D&IServices•ComprehensiveproductdevelopmentforSMEs•Specificservicesforlargecompanies(e.g.designthinking)
Prototyping & Testing
•Creationofphysicalprototypesfortesting•Productprototypes(e.g.smallparts–forming,welding,forgingetc.)andpilotplants(industrialCIMATEC)•HighestdemandinTechnologicalServicesandR&D&IServices•EnablerforSENAIBahia/CIMATECtogetaccesstoproductdevelopmentofindustries
Simulation•Virtualsimulationandcomputationalmodeling•Softwareandhardwaredevelopmentinthecontextofsimulation•Trainingofemployeesandstudentsinsimulatorsandtestingofvirtualprototypesintheproductdevelopmentprocess•HighestdemandinR&D&IServices
Materials Design & Development
•Developmentanddesignofadvancedmaterialssettingtheframeworkforgamechanges•Applicationofnewmaterialsindifferentcontextsandindustries•HighestdemandinHigherEducationandR&D&IServices
Manufacturing & Process Development
•Development,testingandoptimizationofmanufacturingandlogisticsprocessesandtechnologiesaswellasrelatedtraining•EquallyhighdemandinTechnicalEducation,TechnologicalServicesandR&D&IServices•Focusonindustrybutalsopublicorganizationsaspotentialcustomers
Systems of Systems•Systemintegration,managementandcontrolthroughusageofdifferenttechnologies•Interactionofdifferentobjectsinvariousprocessesindifferentindustrysectors(networking)•Combinationofsoftwareandsystemsengineering•HighestDemandinHigherEducationandR&D&IServices
Automation & Robotics Solutions
•Automationandroboticssolutionstoimprovebusinessprocesses•Autonomoussystems,assistivetechnologiesandself-healingdevicesandmachines•HighestdemandinTechnicalEducationandR&D&IServices•Industrysectorspecificsolutions(e.g.defensevs.healthcare)
Big Data Analysis & Processing
•Dataanalytics,dataminingandarithmeticanddatafusion/dataintegration•Signalprocessing(audio,video,coding)•Provisionofcomputingcapacities(HighPerformanceComputing)•HighestdemandinHigherEducationandR&D&IServices•Applicabilityacrossallindustrieswithincreasingamountofdata
Industrial Management
•Businessdevelopmentandindustrialeconomicanalysis•Promotionofinnovationinindustryforcompetitiveness•Integrationofdifferentmanagementdisciplinestooffercompletepackagesofservicesfromonesource•HighestdemandinHigherEducation•Applicableincompaniesofdifferentsizeacrossallindustries
Quality Assurance & Certification
•Qualityassuranceandcertificationwithregardto(new)products,people(qualifications)andprocesses•Developmentofnewstandardsforupcomingcertifications•Translationofinternationalstandardsandapplication/implementationinBrazil•HighestdemandinTechnologicalServices
Table 3. Description of SENAI Bahia/CIMATEC’s Future Competence Areas
115
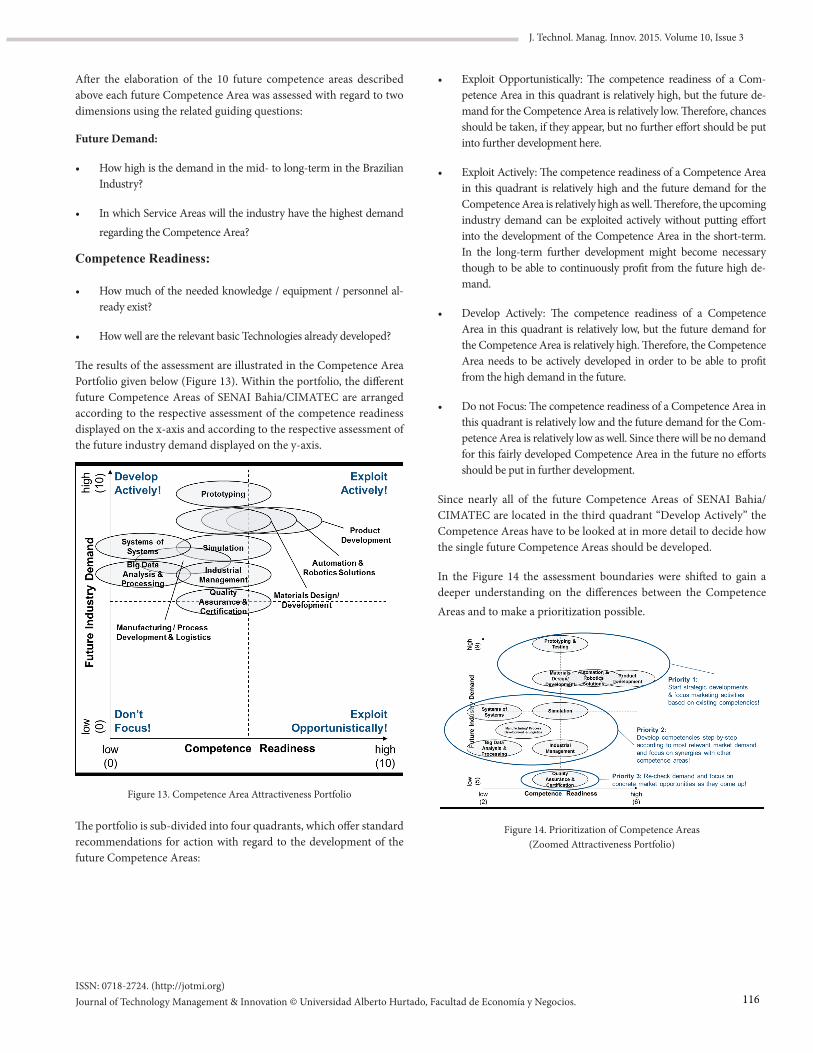
ISSN: 0718-2724. (http://jotmi.org)Journal of Technology Management & Innovation © Universidad Alberto Hurtado, Facultad de Economía y Negocios.
J. Technol. Manag. Innov. 2015. Volume 10, Issue 3
After the elaboration of the 10 future competence areas described above each future Competence Area was assessed with regard to two dimensions using the related guiding questions:
Future Demand:
• How high is the demand in the mid- to long-term in the Brazilian Industry?
• In which Service Areas will the industry have the highest demand regarding the Competence Area?
Competence Readiness:
• How much of the needed knowledge / equipment / personnel al-ready exist?
• How well are the relevant basic Technologies already developed?
The results of the assessment are illustrated in the Competence Area Portfolio given below (Figure 13). Within the portfolio, the different future Competence Areas of SENAI Bahia/CIMATEC are arranged according to the respective assessment of the competence readiness displayed on the x-axis and according to the respective assessment of the future industry demand displayed on the y-axis.
Figure 13. Competence Area Attractiveness Portfolio
The portfolio is sub-divided into four quadrants, which offer standard recommendations for action with regard to the development of the future Competence Areas:
• Exploit Opportunistically: The competence readiness of a Com-petence Area in this quadrant is relatively high, but the future de-mand for the Competence Area is relatively low. Therefore, chances should be taken, if they appear, but no further effort should be put into further development here.
• Exploit Actively: The competence readiness of a Competence Area in this quadrant is relatively high and the future demand for the Competence Area is relatively high as well. Therefore, the upcoming industry demand can be exploited actively without putting effort into the development of the Competence Area in the short-term. In the long-term further development might become necessary though to be able to continuously profit from the future high de-mand.
• Develop Actively: The competence readiness of a Competence Area in this quadrant is relatively low, but the future demand for the Competence Area is relatively high. Therefore, the Competence Area needs to be actively developed in order to be able to profit from the high demand in the future.
• Do not Focus: The competence readiness of a Competence Area in this quadrant is relatively low and the future demand for the Com-petence Area is relatively low as well. Since there will be no demand for this fairly developed Competence Area in the future no efforts should be put in further development.
Since nearly all of the future Competence Areas of SENAI Bahia/CIMATEC are located in the third quadrant “Develop Actively” the Competence Areas have to be looked at in more detail to decide how the single future Competence Areas should be developed.
In the Figure 14 the assessment boundaries were shifted to gain a deeper understanding on the differences between the Competence Areas and to make a prioritization possible.
Figure 14. Prioritization of Competence Areas (Zoomed Attractiveness Portfolio)
116
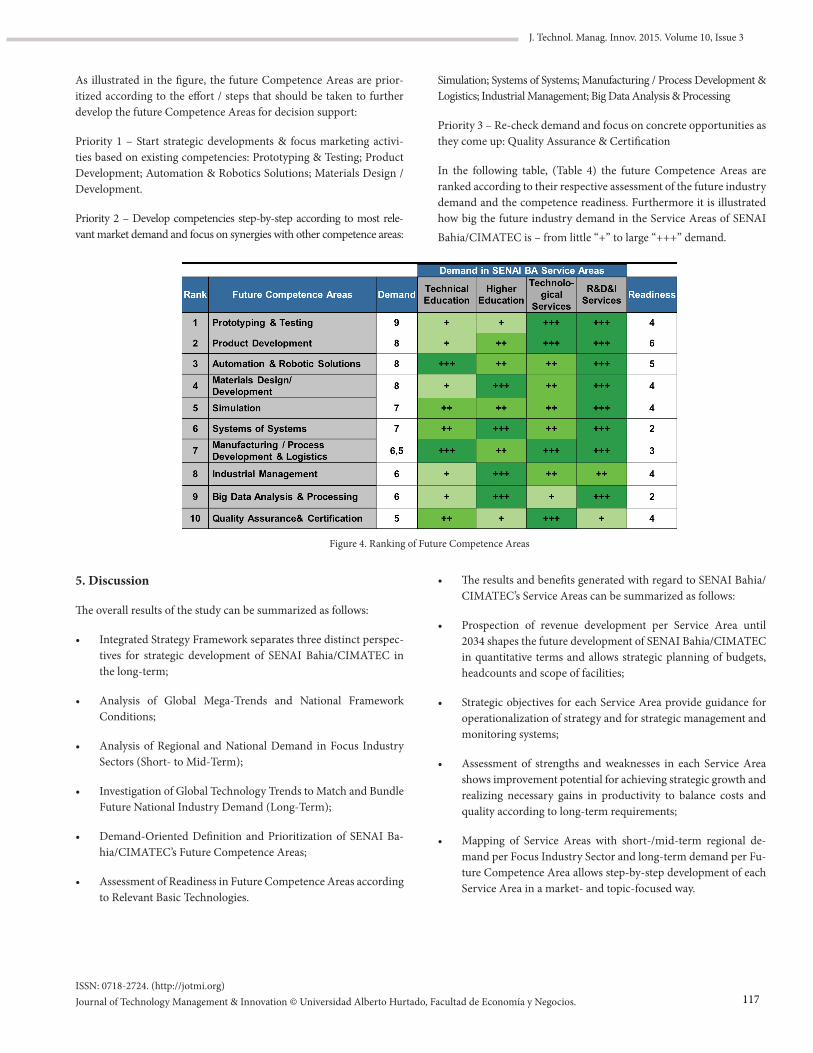
ISSN: 0718-2724. (http://jotmi.org)Journal of Technology Management & Innovation © Universidad Alberto Hurtado, Facultad de Economía y Negocios.
J. Technol. Manag. Innov. 2015. Volume 10, Issue 3
As illustrated in the figure, the future Competence Areas are prior-itized according to the effort / steps that should be taken to further develop the future Competence Areas for decision support:
Priority 1 – Start strategic developments & focus marketing activi-ties based on existing competencies: Prototyping & Testing; Product Development; Automation & Robotics Solutions; Materials Design / Development.
Priority 2 – Develop competencies step-by-step according to most rele-vant market demand and focus on synergies with other competence areas:
5. Discussion
The overall results of the study can be summarized as follows:
• Integrated Strategy Framework separates three distinct perspec-tives for strategic development of SENAI Bahia/CIMATEC inthe long-term;
• Analysis of Global Mega-Trends and National FrameworkConditions;
• Analysis of Regional and National Demand in Focus IndustrySectors (Short- to Mid-Term);
• Investigation of Global Technology Trends to Match and Bundle Future National Industry Demand (Long-Term);
• Demand-Oriented Definition and Prioritization of SENAI Ba-hia/CIMATEC’s Future Competence Areas;
• Assessment of Readiness in Future Competence Areas according to Relevant Basic Technologies.
Simulation; Systems of Systems; Manufacturing / Process Development & Logistics; Industrial Management; Big Data Analysis & Processing
Priority 3 – Re-check demand and focus on concrete opportunities as they come up: Quality Assurance & Certification
In the following table, (Table 4) the future Competence Areas are ranked according to their respective assessment of the future industry demand and the competence readiness. Furthermore it is illustrated how big the future industry demand in the Service Areas of SENAI Bahia/CIMATEC is – from little “+” to large “+++” demand.
Figure 4. Ranking of Future Competence Areas
• The results and benefits generated with regard to SENAI Bahia/CIMATEC’s Service Areas can be summarized as follows:
• Prospection of revenue development per Service Area until2034 shapes the future development of SENAI Bahia/CIMATEC in quantitative terms and allows strategic planning of budgets,headcounts and scope of facilities;
• Strategic objectives for each Service Area provide guidance foroperationalization of strategy and for strategic management and monitoring systems;
• Assessment of strengths and weaknesses in each Service Areashows improvement potential for achieving strategic growth and realizing necessary gains in productivity to balance costs andquality according to long-term requirements;
• Mapping of Service Areas with short-/mid-term regional de-mand per Focus Industry Sector and long-term demand per Fu-ture Competence Area allows step-by-step development of eachService Area in a market- and topic-focused way.
117
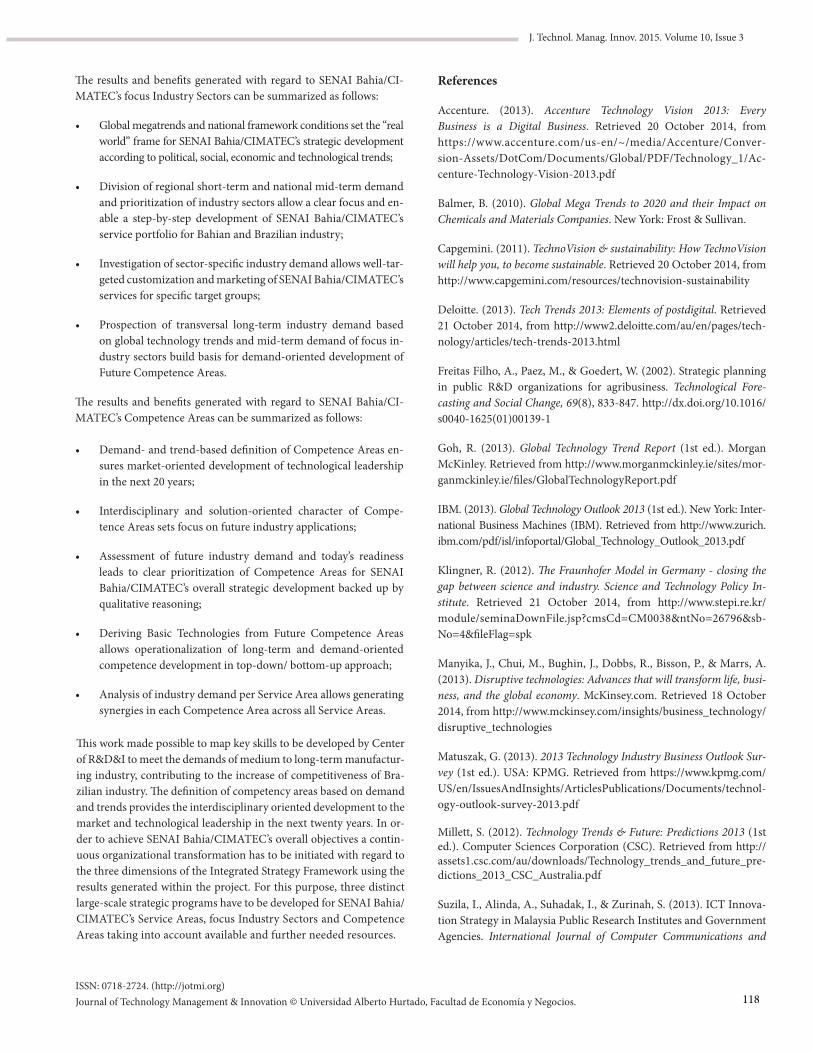
ISSN: 0718-2724. (http://jotmi.org)Journal of Technology Management & Innovation © Universidad Alberto Hurtado, Facultad de Economía y Negocios.
J. Technol. Manag. Innov. 2015. Volume 10, Issue 3
The results and benefits generated with regard to SENAI Bahia/CI-MATEC’s focus Industry Sectors can be summarized as follows:
• Global megatrends and national framework conditions set the “real world” frame for SENAI Bahia/CIMATEC’s strategic developmentaccording to political, social, economic and technological trends;
• Division of regional short-term and national mid-term demandand prioritization of industry sectors allow a clear focus and en-able a step-by-step development of SENAI Bahia/CIMATEC’sservice portfolio for Bahian and Brazilian industry;
• Investigation of sector-specific industry demand allows well-tar-geted customization and marketing of SENAI Bahia/CIMATEC’s services for specific target groups;
• Prospection of transversal long-term industry demand basedon global technology trends and mid-term demand of focus in-dustry sectors build basis for demand-oriented development ofFuture Competence Areas.
The results and benefits generated with regard to SENAI Bahia/CI-MATEC’s Competence Areas can be summarized as follows:
• Demand- and trend-based definition of Competence Areas en-sures market-oriented development of technological leadershipin the next 20 years;
• Interdisciplinary and solution-oriented character of Compe-tence Areas sets focus on future industry applications;
• Assessment of future industry demand and today’s readinessleads to clear prioritization of Competence Areas for SENAIBahia/CIMATEC’s overall strategic development backed up byqualitative reasoning;
• Deriving Basic Technologies from Future Competence Areasallows operationalization of long-term and demand-orientedcompetence development in top-down/ bottom-up approach;
• Analysis of industry demand per Service Area allows generating synergies in each Competence Area across all Service Areas.
This work made possible to map key skills to be developed by Center of R&D&I to meet the demands of medium to long-term manufactur-ing industry, contributing to the increase of competitiveness of Bra-zilian industry. The definition of competency areas based on demand and trends provides the interdisciplinary oriented development to the market and technological leadership in the next twenty years. In or-der to achieve SENAI Bahia/CIMATEC’s overall objectives a contin-uous organizational transformation has to be initiated with regard to the three dimensions of the Integrated Strategy Framework using the results generated within the project. For this purpose, three distinct large-scale strategic programs have to be developed for SENAI Bahia/CIMATEC’s Service Areas, focus Industry Sectors and Competence Areas taking into account available and further needed resources.
References
Accenture. (2013). Accenture Technology Vision 2013: Every Business is a Digital Business. Retrieved 20 October 2014, from https://www.accenture.com/us-en/~/media/Accenture/Conver-sion-Assets/DotCom/Documents/Global/PDF/Technology_1/Ac-centure-Technology-Vision-2013.pdf
Balmer, B. (2010). Global Mega Trends to 2020 and their Impact on Chemicals and Materials Companies. New York: Frost & Sullivan.
Capgemini. (2011). TechnoVision & sustainability: How TechnoVision will help you, to become sustainable. Retrieved 20 October 2014, from http://www.capgemini.com/resources/technovision-sustainability
Deloitte. (2013). Tech Trends 2013: Elements of postdigital. Retrieved 21 October 2014, from http://www2.deloitte.com/au/en/pages/tech-nology/articles/tech-trends-2013.html
Freitas Filho, A., Paez, M., & Goedert, W. (2002). Strategic planning in public R&D organizations for agribusiness. Technological Fore-casting and Social Change, 69(8), 833-847. http://dx.doi.org/10.1016/s0040-1625(01)00139-1
Goh, R. (2013). Global Technology Trend Report (1st ed.). Morgan McKinley. Retrieved from http://www.morganmckinley.ie/sites/mor-ganmckinley.ie/files/GlobalTechnologyReport.pdf
IBM. (2013). Global Technology Outlook 2013 (1st ed.). New York: Inter-national Business Machines (IBM). Retrieved from http://www.zurich.ibm.com/pdf/isl/infoportal/Global_Technology_Outlook_2013.pdf
Klingner, R. (2012). The Fraunhofer Model in Germany - closing the gap between science and industry. Science and Technology Policy In-stitute. Retrieved 21 October 2014, from http://www.stepi.re.kr/module/seminaDownFile.jsp?cmsCd=CM0038&ntNo=26796&sb-No=4&fileFlag=spk
Manyika, J., Chui, M., Bughin, J., Dobbs, R., Bisson, P., & Marrs, A. (2013). Disruptive technologies: Advances that will transform life, busi-ness, and the global economy. McKinsey.com. Retrieved 18 October 2014, from http://www.mckinsey.com/insights/business_technology/disruptive_technologies
Matuszak, G. (2013). 2013 Technology Industry Business Outlook Sur-vey (1st ed.). USA: KPMG. Retrieved from https://www.kpmg.com/US/en/IssuesAndInsights/ArticlesPublications/Documents/technol-ogy-outlook-survey-2013.pdf
Millett, S. (2012). Technology Trends & Future: Predictions 2013 (1st ed.). Computer Sciences Corporation (CSC). Retrieved from http://assets1.csc.com/au/downloads/Technology_trends_and_future_pre-dictions_2013_CSC_Australia.pdf
Suzila, I., Alinda, A., Suhadak, I., & Zurinah, S. (2013). ICT Innova-tion Strategy in Malaysia Public Research Institutes and Government Agencies. International Journal of Computer Communications and
118

ISSN: 0718-2724. (http://jotmi.org)Journal of Technology Management & Innovation © Universidad Alberto Hurtado, Facultad de Economía y Negocios.
J. Technol. Manag. Innov. 2015. Volume 10, Issue 3
Networks (IJCCN), 3(3), 1-12. Retrieved from http://iartc.net/index.php/Networks/article/view/65/54
Weigand, K., Flanagan, T., Dye, K., & Jones, P. (2014). Collaborative foresight: complementing long-horizon strategic planning. Tech-
nological Forecasting and Social Change, 85, 134-152. http://dx.doi.org/10.1016/j.techfore.2013.08.016
Zouain, D. (2001). Gestao de instituicoes de pesquisa. Rio de Janeiro, Brasil: FGV Editora.
119
ISSN: 0718-2724. (http://jotmi.org)Journal of Technology Management & Innovation © Universidad Alberto Hurtado, Facultad de Economía y Negocios.
J. Technol. Manag. Innov. 2015. Volume 10, Issue 3
Application of Lean Manufacturing Tools in the Food and Beverage Industries
Rui Borges Lopes 1*, Filipa Freitas 2, Inês Sousa 3
Abstract: Recent years have shown an increasing use of lean manufacturing (LM) principles and tools in several industrial sectors. Already a well-established management philosophy, it has shown numerous successful applications even outside production environments. This work presents the application of some LM tools, and the corresponding shift in philosophy, in two Portuguese companies of the food and beverage industries. Main implementation issues are presented and discussed; followed by the results obtained from the application of LM tools in the production system of these companies. Significant gains are obtained in both companies and, more importantly, it instills a continuous improvement culture and increases production flexibility while reducing lead times.
Keywords: lean manufacturing; food and beverage industries; process innovation; case studies.
Introduction
As innovation is one of the critical success factors for productivity (Utterback & Abernathy, 1975) process innovation initiatives have been sought and undertaken by companies as means of staying com-petitive or ahead of the competition. Process innovation can be de-fined as the implementation of new or significantly improved produc-tion or delivery method, including significant changes in techniques, equipment and/or software (OECD, 2005, p. 49). It intends decreas-ing logistics or production costs, increase quality, or produce/deliver new or significantly improved products (OECD, 2005, p. 49).
Companies that do not institute continuous improvement after im-plementing process innovation are likely to revert to old practices (Davenport, 1993, p. 25). Lean manufacturing (LM) has shown to be a good example of process innovation in companies, having continu-ous improvement as one of its cornerstone.
LM intends reducing waste in human effort, inventory, time to market and manufacturing space to become highly responsive to customer demand, while delivering quality products efficiently (Womack et al., 1990). Originating from the automotive industry, LM has now been applied in several other sectors and even extended beyond produc-tion environments, showing impressive gains (Womack et al., 1990; George, 2003; Holden, 2011). A recent review on LM is by Marodin and Saurin (2013) which shows a steady increase in publications, where nearly half of the works concern companies located in USA or UK. Most studies were from the manufacturing (unspecified), ser-vice, automotive and electronic components sectors. For the case of the food industry only 3 works were found, which is in line with the findings by Dora et al. (2014) that show a generally low implementa-tion of LM practices in the food industry.
Submitted June 29th 2015 / Approved October 7th 2015
Despite the success record, lean practices have also brought about some risks. For example, in managing lean supply chains the re-duction in inventories has created high vulnerability to turbulences (Thun & Hoenig, 2011) – also in the case of food-related industries (Vlajic et al., 2012). This mixed success has mostly been noticed out-side of the production environment. Looking at a specific case, the red meat production and supply, Cox and Chicksand (2005) found that the inter-organisational aspects of lean (concerning supply) were neither easily applicable nor appropriate for most participants. The same authors however, point out that internal adoption of lean practices were found appropriate for all participants. This can also be concluded looking at the work by Simons and Zokaei (2005), show-ing that these practices may have interesting benefits in food-related production systems.
So, the main question arising at this point is: why is the food industry so unique concerning implementation of LM practices and why is it so behind the remaining sectors?
Concerning uniqueness of the sector, Dudbridge (2011) puts forward three main reasons: (1) political reasons, the supply of safe affordable and plentiful food is critical to nations, making this sector highly reg-ulated; (2) food business, huge quantities of food have to be shipped every day, making reliability of supply chains critical and availabili-ty of products and price competitiveness paramount for success; (3) food fashion, consumers are constantly tempted to try new products, making companies launch new products regularly and consequently increasing complexity in production.
Regarding implementation, LM is seen as not easily applicable to industries with large batch processes such as the food and beverage industries. Companies sell their products from large distribution cen-
1 Department of Economics, Management and Industrial Engineering / CIDMA, University of Aveiro, Portugal. 2, 3 Department of Economics, Management and Industrial Engineering, University of Aveiro, Portugal. *Corresponding author: [email protected]
120
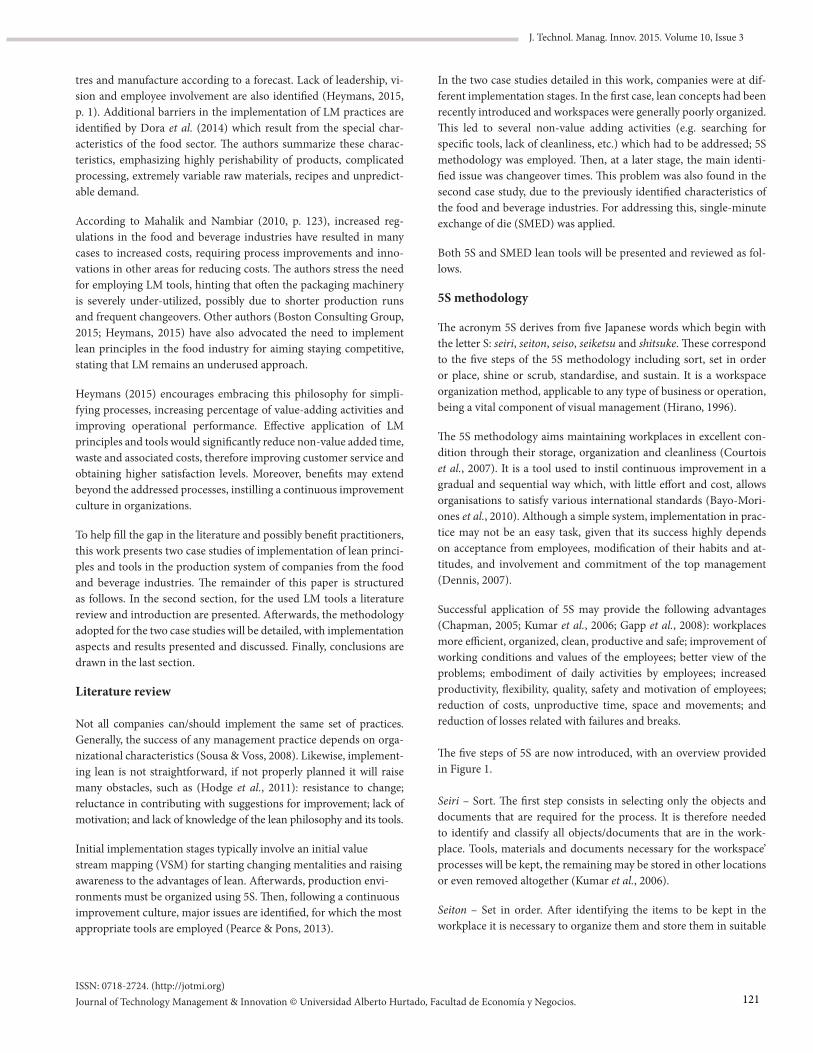
ISSN: 0718-2724. (http://jotmi.org)Journal of Technology Management & Innovation © Universidad Alberto Hurtado, Facultad de Economía y Negocios.
J. Technol. Manag. Innov. 2015. Volume 10, Issue 3
tres and manufacture according to a forecast. Lack of leadership, vi-sion and employee involvement are also identified (Heymans, 2015, p. 1). Additional barriers in the implementation of LM practices areidentified by Dora et al. (2014) which result from the special char-acteristics of the food sector. The authors summarize these charac-teristics, emphasizing highly perishability of products, complicatedprocessing, extremely variable raw materials, recipes and unpredict-able demand.
According to Mahalik and Nambiar (2010, p. 123), increased reg-ulations in the food and beverage industries have resulted in many cases to increased costs, requiring process improvements and inno-vations in other areas for reducing costs. The authors stress the need for employing LM tools, hinting that often the packaging machinery is severely under-utilized, possibly due to shorter production runs and frequent changeovers. Other authors (Boston Consulting Group, 2015; Heymans, 2015) have also advocated the need to implement lean principles in the food industry for aiming staying competitive, stating that LM remains an underused approach.
Heymans (2015) encourages embracing this philosophy for simpli-fying processes, increasing percentage of value-adding activities and improving operational performance. Effective application of LM principles and tools would significantly reduce non-value added time, waste and associated costs, therefore improving customer service and obtaining higher satisfaction levels. Moreover, benefits may extend beyond the addressed processes, instilling a continuous improvement culture in organizations.
To help fill the gap in the literature and possibly benefit practitioners, this work presents two case studies of implementation of lean princi-ples and tools in the production system of companies from the food and beverage industries. The remainder of this paper is structured as follows. In the second section, for the used LM tools a literature review and introduction are presented. Afterwards, the methodology adopted for the two case studies will be detailed, with implementation aspects and results presented and discussed. Finally, conclusions are drawn in the last section.
Literature review
Not all companies can/should implement the same set of practices. Generally, the success of any management practice depends on orga-nizational characteristics (Sousa & Voss, 2008). Likewise, implement-ing lean is not straightforward, if not properly planned it will raise many obstacles, such as (Hodge et al., 2011): resistance to change; reluctance in contributing with suggestions for improvement; lack of motivation; and lack of knowledge of the lean philosophy and its tools.
Initial implementation stages typically involve an initial value stream mapping (VSM) for starting changing mentalities and raising awareness to the advantages of lean. Afterwards, production envi-ronments must be organized using 5S. Then, following a continuous improvement culture, major issues are identified, for which the most appropriate tools are employed (Pearce & Pons, 2013).
In the two case studies detailed in this work, companies were at dif-ferent implementation stages. In the first case, lean concepts had been recently introduced and workspaces were generally poorly organized. This led to several non-value adding activities (e.g. searching for specific tools, lack of cleanliness, etc.) which had to be addressed; 5S methodology was employed. Then, at a later stage, the main identi-fied issue was changeover times. This problem was also found in the second case study, due to the previously identified characteristics of the food and beverage industries. For addressing this, single-minute exchange of die (SMED) was applied.
Both 5S and SMED lean tools will be presented and reviewed as fol-lows.
5S methodology
The acronym 5S derives from five Japanese words which begin with the letter S: seiri, seiton, seiso, seiketsu and shitsuke. These correspond to the five steps of the 5S methodology including sort, set in order or place, shine or scrub, standardise, and sustain. It is a workspace organization method, applicable to any type of business or operation, being a vital component of visual management (Hirano, 1996).
The 5S methodology aims maintaining workplaces in excellent con-dition through their storage, organization and cleanliness (Courtois et al., 2007). It is a tool used to instil continuous improvement in a gradual and sequential way which, with little effort and cost, allows organisations to satisfy various international standards (Bayo-Mori-ones et al., 2010). Although a simple system, implementation in prac-tice may not be an easy task, given that its success highly depends on acceptance from employees, modification of their habits and at-titudes, and involvement and commitment of the top management (Dennis, 2007).
Successful application of 5S may provide the following advantages (Chapman, 2005; Kumar et al., 2006; Gapp et al., 2008): workplaces more efficient, organized, clean, productive and safe; improvement of working conditions and values of the employees; better view of the problems; embodiment of daily activities by employees; increased productivity, flexibility, quality, safety and motivation of employees; reduction of costs, unproductive time, space and movements; and reduction of losses related with failures and breaks.
The five steps of 5S are now introduced, with an overview provided in Figure 1.
Seiri – Sort. The first step consists in selecting only the objects and documents that are required for the process. It is therefore needed to identify and classify all objects/documents that are in the work-place. Tools, materials and documents necessary for the workspace’ processes will be kept, the remaining may be stored in other locations or even removed altogether (Kumar et al., 2006).
Seiton – Set in order. After identifying the items to be kept in the workplace it is necessary to organize them and store them in suitable
121
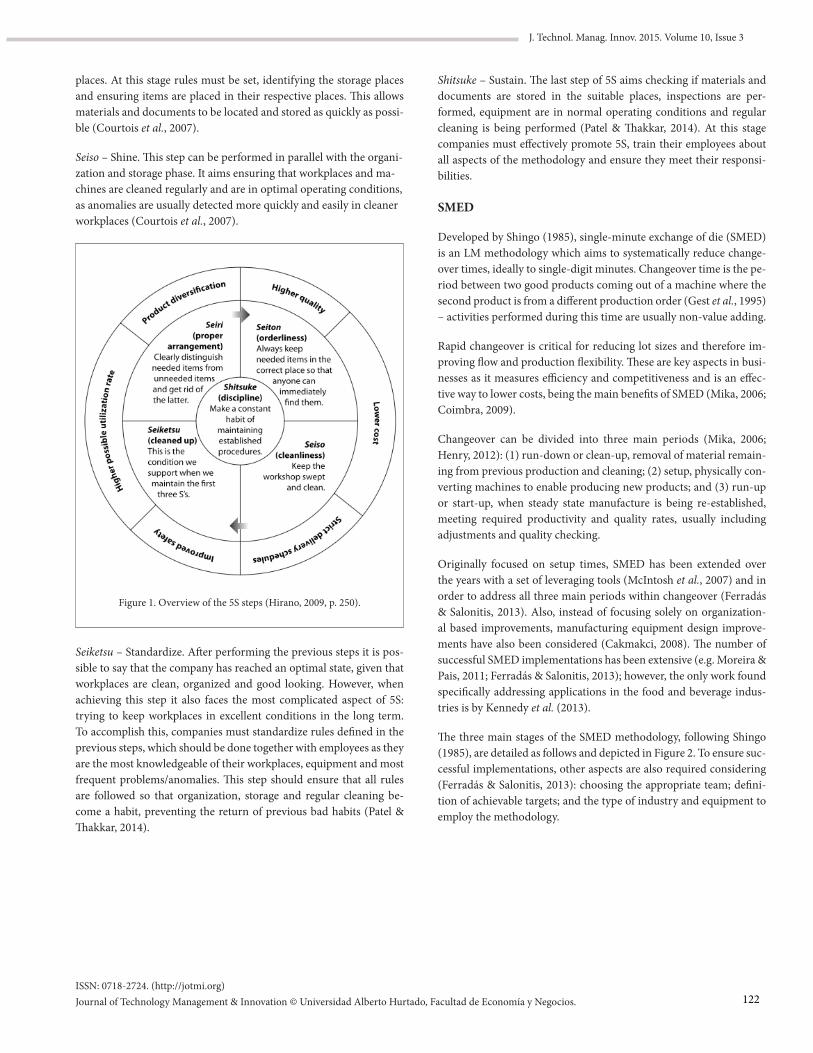
ISSN: 0718-2724. (http://jotmi.org)Journal of Technology Management & Innovation © Universidad Alberto Hurtado, Facultad de Economía y Negocios.
J. Technol. Manag. Innov. 2015. Volume 10, Issue 3
places. At this stage rules must be set, identifying the storage places and ensuring items are placed in their respective places. This allows materials and documents to be located and stored as quickly as possi-ble (Courtois et al., 2007).
Seiso – Shine. This step can be performed in parallel with the organi-zation and storage phase. It aims ensuring that workplaces and ma-chines are cleaned regularly and are in optimal operating conditions, as anomalies are usually detected more quickly and easily in cleaner workplaces (Courtois et al., 2007).
Seiketsu – Standardize. After performing the previous steps it is pos-sible to say that the company has reached an optimal state, given that workplaces are clean, organized and good looking. However, when achieving this step it also faces the most complicated aspect of 5S: trying to keep workplaces in excellent conditions in the long term. To accomplish this, companies must standardize rules defined in the previous steps, which should be done together with employees as they are the most knowledgeable of their workplaces, equipment and most frequent problems/anomalies. This step should ensure that all rules are followed so that organization, storage and regular cleaning be-come a habit, preventing the return of previous bad habits (Patel & Thakkar, 2014).
Shitsuke – Sustain. The last step of 5S aims checking if materials and documents are stored in the suitable places, inspections are per-formed, equipment are in normal operating conditions and regular cleaning is being performed (Patel & Thakkar, 2014). At this stage companies must effectively promote 5S, train their employees about all aspects of the methodology and ensure they meet their responsi-bilities.
SMED
Developed by Shingo (1985), single-minute exchange of die (SMED) is an LM methodology which aims to systematically reduce change-over times, ideally to single-digit minutes. Changeover time is the pe-riod between two good products coming out of a machine where the second product is from a different production order (Gest et al., 1995) – activities performed during this time are usually non-value adding.
Rapid changeover is critical for reducing lot sizes and therefore im-proving flow and production flexibility. These are key aspects in busi-nesses as it measures efficiency and competitiveness and is an effec-tive way to lower costs, being the main benefits of SMED (Mika, 2006; Coimbra, 2009).
Changeover can be divided into three main periods (Mika, 2006; Henry, 2012): (1) run-down or clean-up, removal of material remain-ing from previous production and cleaning; (2) setup, physically con-verting machines to enable producing new products; and (3) run-up or start-up, when steady state manufacture is being re-established, meeting required productivity and quality rates, usually including adjustments and quality checking.
Originally focused on setup times, SMED has been extended over the years with a set of leveraging tools (McIntosh et al., 2007) and in order to address all three main periods within changeover (Ferradás & Salonitis, 2013). Also, instead of focusing solely on organization-al based improvements, manufacturing equipment design improve-ments have also been considered (Cakmakci, 2008). The number of successful SMED implementations has been extensive (e.g. Moreira & Pais, 2011; Ferradás & Salonitis, 2013); however, the only work found specifically addressing applications in the food and beverage indus-tries is by Kennedy et al. (2013).
The three main stages of the SMED methodology, following Shingo (1985), are detailed as follows and depicted in Figure 2. To ensure suc-cessful implementations, other aspects are also required considering (Ferradás & Salonitis, 2013): choosing the appropriate team; defini-tion of achievable targets; and the type of industry and equipment to employ the methodology.
Figure 1. Overview of the 5S steps (Hirano, 2009, p. 250).
122
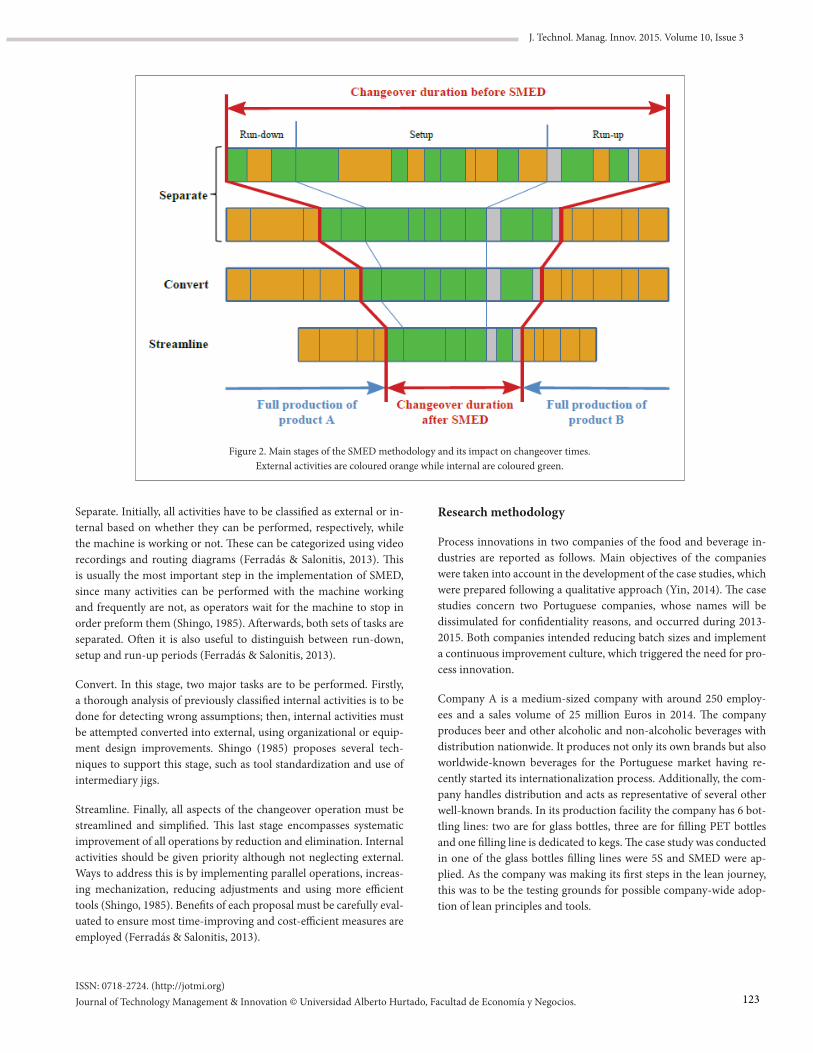
ISSN: 0718-2724. (http://jotmi.org)Journal of Technology Management & Innovation © Universidad Alberto Hurtado, Facultad de Economía y Negocios.
J. Technol. Manag. Innov. 2015. Volume 10, Issue 3
Separate. Initially, all activities have to be classified as external or in-ternal based on whether they can be performed, respectively, while the machine is working or not. These can be categorized using video recordings and routing diagrams (Ferradás & Salonitis, 2013). This is usually the most important step in the implementation of SMED, since many activities can be performed with the machine working and frequently are not, as operators wait for the machine to stop in order preform them (Shingo, 1985). Afterwards, both sets of tasks are separated. Often it is also useful to distinguish between run-down, setup and run-up periods (Ferradás & Salonitis, 2013).
Convert. In this stage, two major tasks are to be performed. Firstly, a thorough analysis of previously classified internal activities is to be done for detecting wrong assumptions; then, internal activities must be attempted converted into external, using organizational or equip-ment design improvements. Shingo (1985) proposes several tech-niques to support this stage, such as tool standardization and use of intermediary jigs.
Streamline. Finally, all aspects of the changeover operation must be streamlined and simplified. This last stage encompasses systematic improvement of all operations by reduction and elimination. Internal activities should be given priority although not neglecting external. Ways to address this is by implementing parallel operations, increas-ing mechanization, reducing adjustments and using more efficient tools (Shingo, 1985). Benefits of each proposal must be carefully eval-uated to ensure most time-improving and cost-efficient measures are employed (Ferradás & Salonitis, 2013).
Figure 2. Main stages of the SMED methodology and its impact on changeover times. External activities are coloured orange while internal are coloured green.
Research methodology
Process innovations in two companies of the food and beverage in-dustries are reported as follows. Main objectives of the companies were taken into account in the development of the case studies, which were prepared following a qualitative approach (Yin, 2014). The case studies concern two Portuguese companies, whose names will be dissimulated for confidentiality reasons, and occurred during 2013-2015. Both companies intended reducing batch sizes and implement a continuous improvement culture, which triggered the need for pro-cess innovation.
Company A is a medium-sized company with around 250 employ-ees and a sales volume of 25 million Euros in 2014. The company produces beer and other alcoholic and non-alcoholic beverages with distribution nationwide. It produces not only its own brands but also worldwide-known beverages for the Portuguese market having re-cently started its internationalization process. Additionally, the com-pany handles distribution and acts as representative of several other well-known brands. In its production facility the company has 6 bot-tling lines: two are for glass bottles, three are for filling PET bottles and one filling line is dedicated to kegs. The case study was conducted in one of the glass bottles filling lines were 5S and SMED were ap-plied. As the company was making its first steps in the lean journey, this was to be the testing grounds for possible company-wide adop-tion of lean principles and tools.
123
ISSN: 0718-2724. (http://jotmi.org)Journal of Technology Management & Innovation © Universidad Alberto Hurtado, Facultad de Economía y Negocios.
J. Technol. Manag. Innov. 2015. Volume 10, Issue 3
Company B is part of a major leading group in the Portuguese food industry. The group had a sales volume of 200 million Euros in 2014 and around 650 employees in five major production centres. The company produces mostly for the Portuguese market with its own brands – well-known and highly regarded in Portugal. The group also produces and owns other brands directed at international markets. The production centre where the case study took place is the biggest of its kind in the Iberian Peninsula and handles packaging of several varieties of pasta in a total of 9 packaging lines. The case study was specific to lines 1-5, the remaining being scheduled for SMED im-plementation at a later stage. In this case lean principles were already known to company employees, however, past failed SMED imple-mentations caused overall mistrust concerning lean.
For both case studies the approach to process innovation as proposed by Davenport (1993) was chosen; an overview can be seen in Fig-ure 3. Processes candidate for innovation were identified based on their impact on productivity and the hindrance they caused on future company strategies (namely, having more flexible production systems for making smaller batches). Identified change enablers were the LM management philosophy and its tools, and the companies’ employ-ees. Afterwards, main objectives were defined for the processes being addressed. The last two steps are more thoroughly detailed in the fol-lowing subsections, focusing on understanding current processes and using lean tools for helping designing new processes.
Figure 3. Framework for process innovation followed during the case studies (Davenport, 1993, p. 25).
Case study: Company A, application of 5S and SMED
This case study concerns one of the glass bottles filling lines of Com-pany A. The line fills: beer bottles of 20 cl, 25cl and 30cl; juice bottles of 33cl; and carbonated and soda water bottles of 33 cl. For each of these, several different flavours and brands are produced. A total of 14 machines are operating in the line.
For the implementation of the lean tools, firstly, employees were sensitized on the importance of the project, the lean concepts, and the main objective of the implementations that were about to occur. Then, they were informed and trained on the methods that were to be employed (5S and SMED) and motivated to achieve successful appli-cations. Methodology and results are reported as follows.
Application of 5S
The 5S methodology was applied on several workstations in the pre-viously mentioned filling line. Firstly, a detailed analysis was made on each of the workstations, evaluating organization of equipment and which tools and documents were needed to perform most common operations.
Main identified issues were materials disorganized, equipment parts on the floor, lack of identification of storage places, equipment shar-ing between workstations and excess of materials (some examples can be seen on Table 1, left-hand column). These issues were affecting productivity and were in some cases serious health risks: broken glass bottles, metal bottle caps and lighters could be found in storage boxes. Cleanliness was also a problem, being noticed the lack of inspection norms in the workspaces and general dirtiness of some storage places, parts and of the floor.
After the analysis on the current status of the shop floor, an eval-uation checklist was produced for each workstation with the main issues requiring addressing in each of the 5S steps. The checklist template can be seen in Table 2, which had column “observations” filled at this stage. In a brainstorm session with the team, the evalu-ation checklist was analysed and corrective measures were proposed to solve the issues.
Finally, corrective measures were implemented, consisting in tidying up, organizing, cleaning, normalizing and establishing control mea-sures in workstations. Afterwards, the evaluation checklist of Table 2 was performed again and was set as a routine task to instil a con-tinuous improvement environment and for ensuring the last 5S step: sustain.
124
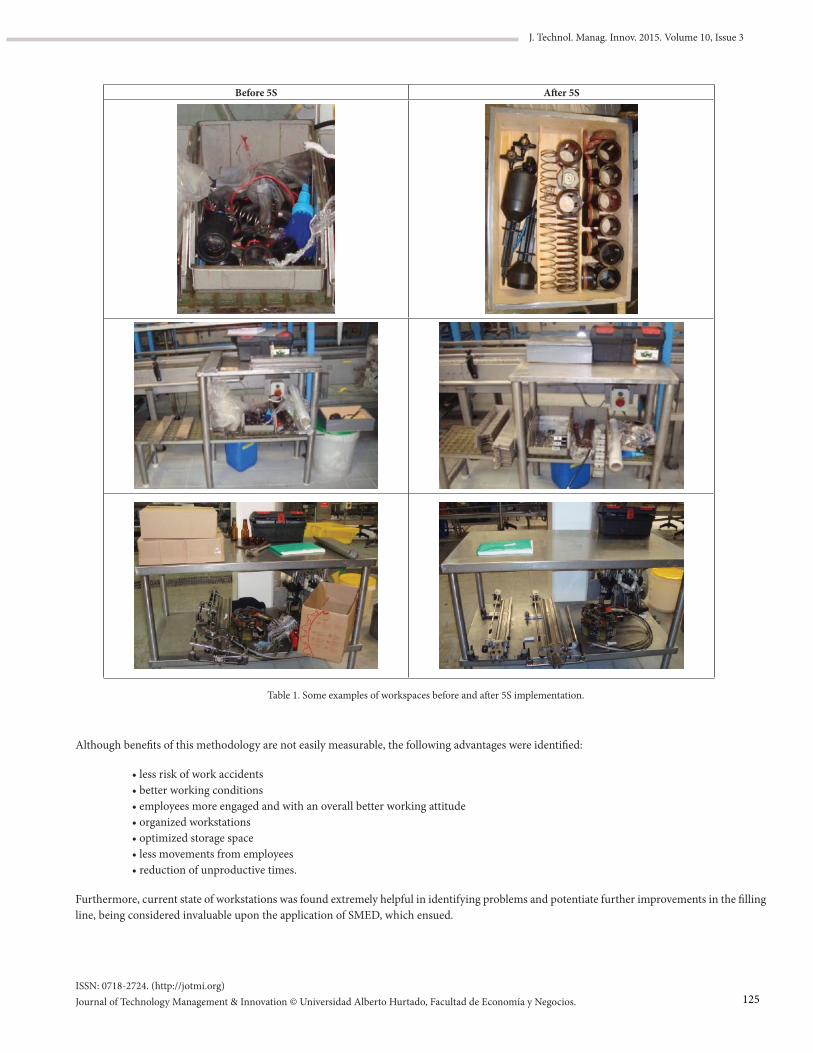
ISSN: 0718-2724. (http://jotmi.org)Journal of Technology Management & Innovation © Universidad Alberto Hurtado, Facultad de Economía y Negocios.
J. Technol. Manag. Innov. 2015. Volume 10, Issue 3
Before 5S After 5S
Table 1. Some examples of workspaces before and after 5S implementation.
Although benefits of this methodology are not easily measurable, the following advantages were identified:
• less risk of work accidents• better working conditions• employees more engaged and with an overall better working attitude• organized workstations• optimized storage space• less movements from employees• reduction of unproductive times.
Furthermore, current state of workstations was found extremely helpful in identifying problems and potentiate further improvements in the filling line, being considered invaluable upon the application of SMED, which ensued.
125
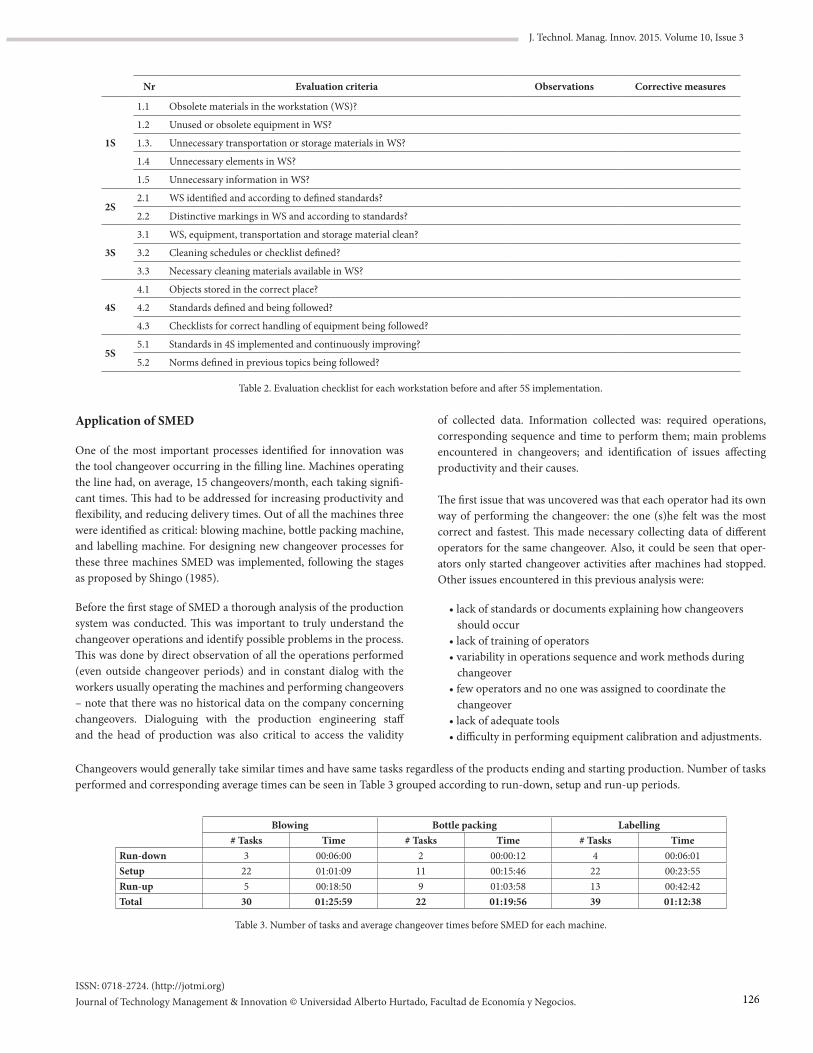
ISSN: 0718-2724. (http://jotmi.org)Journal of Technology Management & Innovation © Universidad Alberto Hurtado, Facultad de Economía y Negocios.
J. Technol. Manag. Innov. 2015. Volume 10, Issue 3
Nr Evaluation criteria Observations Corrective measures
1S
1.1 Obsolete materials in the workstation (WS)?
1.2 Unused or obsolete equipment in WS?
1.3. Unnecessary transportation or storage materials in WS?
1.4 Unnecessary elements in WS?
1.5 Unnecessary information in WS?
2S2.1 WS identified and according to defined standards?
2.2 Distinctive markings in WS and according to standards?
3S
3.1 WS, equipment, transportation and storage material clean?
3.2 Cleaning schedules or checklist defined?
3.3 Necessary cleaning materials available in WS?
4S
4.1 Objects stored in the correct place?
4.2 Standards defined and being followed?
4.3 Checklists for correct handling of equipment being followed?
5S5.1 Standards in 4S implemented and continuously improving?
5.2 Norms defined in previous topics being followed?
Table 2. Evaluation checklist for each workstation before and after 5S implementation.
Application of SMED
One of the most important processes identified for innovation was the tool changeover occurring in the filling line. Machines operating the line had, on average, 15 changeovers/month, each taking signifi-cant times. This had to be addressed for increasing productivity and flexibility, and reducing delivery times. Out of all the machines three were identified as critical: blowing machine, bottle packing machine, and labelling machine. For designing new changeover processes for these three machines SMED was implemented, following the stages as proposed by Shingo (1985).
Before the first stage of SMED a thorough analysis of the production system was conducted. This was important to truly understand the changeover operations and identify possible problems in the process. This was done by direct observation of all the operations performed (even outside changeover periods) and in constant dialog with the workers usually operating the machines and performing changeovers – note that there was no historical data on the company concerningchangeovers. Dialoguing with the production engineering staffand the head of production was also critical to access the validity
of collected data. Information collected was: required operations, corresponding sequence and time to perform them; main problems encountered in changeovers; and identification of issues affecting productivity and their causes.
The first issue that was uncovered was that each operator had its own way of performing the changeover: the one (s)he felt was the most correct and fastest. This made necessary collecting data of different operators for the same changeover. Also, it could be seen that oper-ators only started changeover activities after machines had stopped. Other issues encountered in this previous analysis were:
• lack of standards or documents explaining how changeoversshould occur
• lack of training of operators• variability in operations sequence and work methods during
changeover• few operators and no one was assigned to coordinate the
changeover• lack of adequate tools• difficulty in performing equipment calibration and adjustments.
Changeovers would generally take similar times and have same tasks regardless of the products ending and starting production. Number of tasks performed and corresponding average times can be seen in Table 3 grouped according to run-down, setup and run-up periods.
Blowing Bottle packing Labelling# Tasks Time # Tasks Time # Tasks Time
Run-down 3 00:06:00 2 00:00:12 4 00:06:01Setup 22 01:01:09 11 00:15:46 22 00:23:55Run-up 5 00:18:50 9 01:03:58 13 00:42:42Total 30 01:25:59 22 01:19:56 39 01:12:38
Table 3. Number of tasks and average changeover times before SMED for each machine.
126
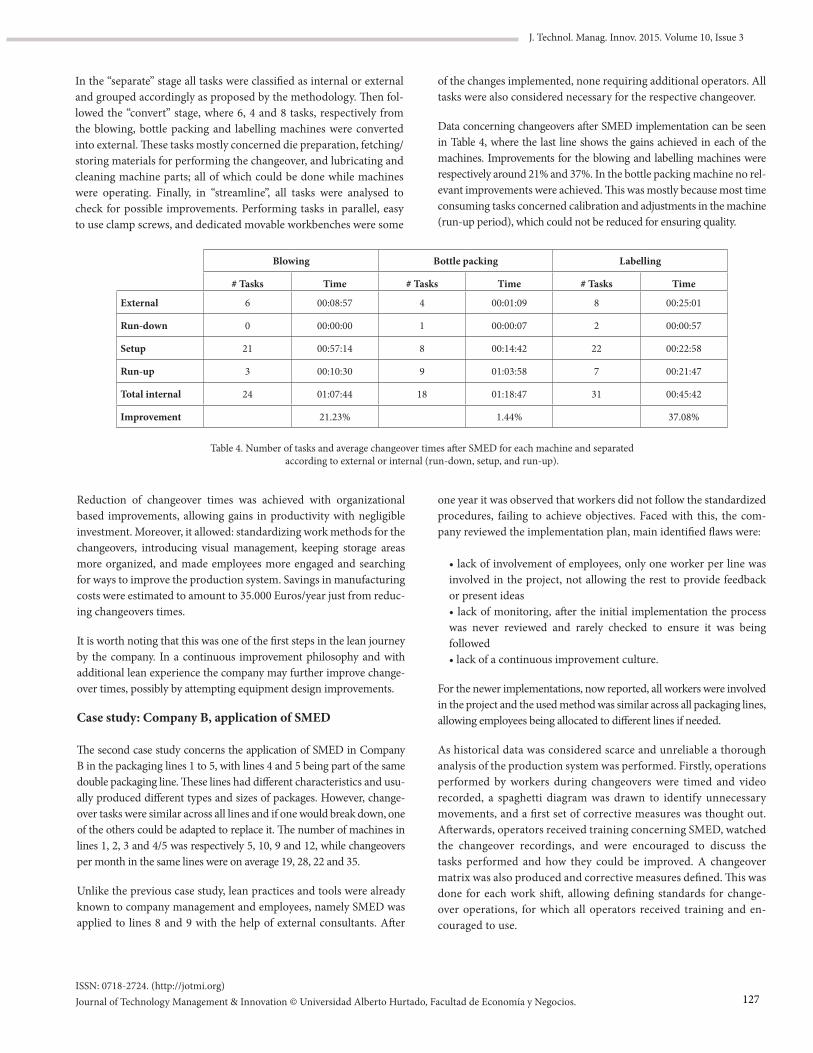
ISSN: 0718-2724. (http://jotmi.org)Journal of Technology Management & Innovation © Universidad Alberto Hurtado, Facultad de Economía y Negocios.
J. Technol. Manag. Innov. 2015. Volume 10, Issue 3
In the “separate” stage all tasks were classified as internal or external and grouped accordingly as proposed by the methodology. Then fol-lowed the “convert” stage, where 6, 4 and 8 tasks, respectively from the blowing, bottle packing and labelling machines were converted into external. These tasks mostly concerned die preparation, fetching/storing materials for performing the changeover, and lubricating and cleaning machine parts; all of which could be done while machines were operating. Finally, in “streamline”, all tasks were analysed to check for possible improvements. Performing tasks in parallel, easy to use clamp screws, and dedicated movable workbenches were some
of the changes implemented, none requiring additional operators. All tasks were also considered necessary for the respective changeover.
Data concerning changeovers after SMED implementation can be seen in Table 4, where the last line shows the gains achieved in each of the machines. Improvements for the blowing and labelling machines were respectively around 21% and 37%. In the bottle packing machine no rel-evant improvements were achieved. This was mostly because most time consuming tasks concerned calibration and adjustments in the machine (run-up period), which could not be reduced for ensuring quality.
Blowing Bottle packing Labelling
# Tasks Time # Tasks Time # Tasks Time
External 6 00:08:57 4 00:01:09 8 00:25:01
Run-down 0 00:00:00 1 00:00:07 2 00:00:57
Setup 21 00:57:14 8 00:14:42 22 00:22:58
Run-up 3 00:10:30 9 01:03:58 7 00:21:47
Total internal 24 01:07:44 18 01:18:47 31 00:45:42
Improvement 21.23% 1.44% 37.08%
Table 4. Number of tasks and average changeover times after SMED for each machine and separated according to external or internal (run-down, setup, and run-up).
Reduction of changeover times was achieved with organizational based improvements, allowing gains in productivity with negligible investment. Moreover, it allowed: standardizing work methods for the changeovers, introducing visual management, keeping storage areas more organized, and made employees more engaged and searching for ways to improve the production system. Savings in manufacturing costs were estimated to amount to 35.000 Euros/year just from reduc-ing changeovers times.
It is worth noting that this was one of the first steps in the lean journey by the company. In a continuous improvement philosophy and with additional lean experience the company may further improve change-over times, possibly by attempting equipment design improvements.
Case study: Company B, application of SMED
The second case study concerns the application of SMED in Company B in the packaging lines 1 to 5, with lines 4 and 5 being part of the same double packaging line. These lines had different characteristics and usu-ally produced different types and sizes of packages. However, change-over tasks were similar across all lines and if one would break down, one of the others could be adapted to replace it. The number of machines in lines 1, 2, 3 and 4/5 was respectively 5, 10, 9 and 12, while changeovers per month in the same lines were on average 19, 28, 22 and 35.
Unlike the previous case study, lean practices and tools were already known to company management and employees, namely SMED was applied to lines 8 and 9 with the help of external consultants. After
one year it was observed that workers did not follow the standardized procedures, failing to achieve objectives. Faced with this, the com-pany reviewed the implementation plan, main identified flaws were:
• lack of involvement of employees, only one worker per line wasinvolved in the project, not allowing the rest to provide feedbackor present ideas• lack of monitoring, after the initial implementation the processwas never reviewed and rarely checked to ensure it was beingfollowed• lack of a continuous improvement culture.
For the newer implementations, now reported, all workers were involved in the project and the used method was similar across all packaging lines, allowing employees being allocated to different lines if needed.
As historical data was considered scarce and unreliable a thorough analysis of the production system was performed. Firstly, operations performed by workers during changeovers were timed and video recorded, a spaghetti diagram was drawn to identify unnecessary movements, and a first set of corrective measures was thought out. Afterwards, operators received training concerning SMED, watched the changeover recordings, and were encouraged to discuss the tasks performed and how they could be improved. A changeover matrix was also produced and corrective measures defined. This was done for each work shift, allowing defining standards for change-over operations, for which all operators received training and en-couraged to use.
127
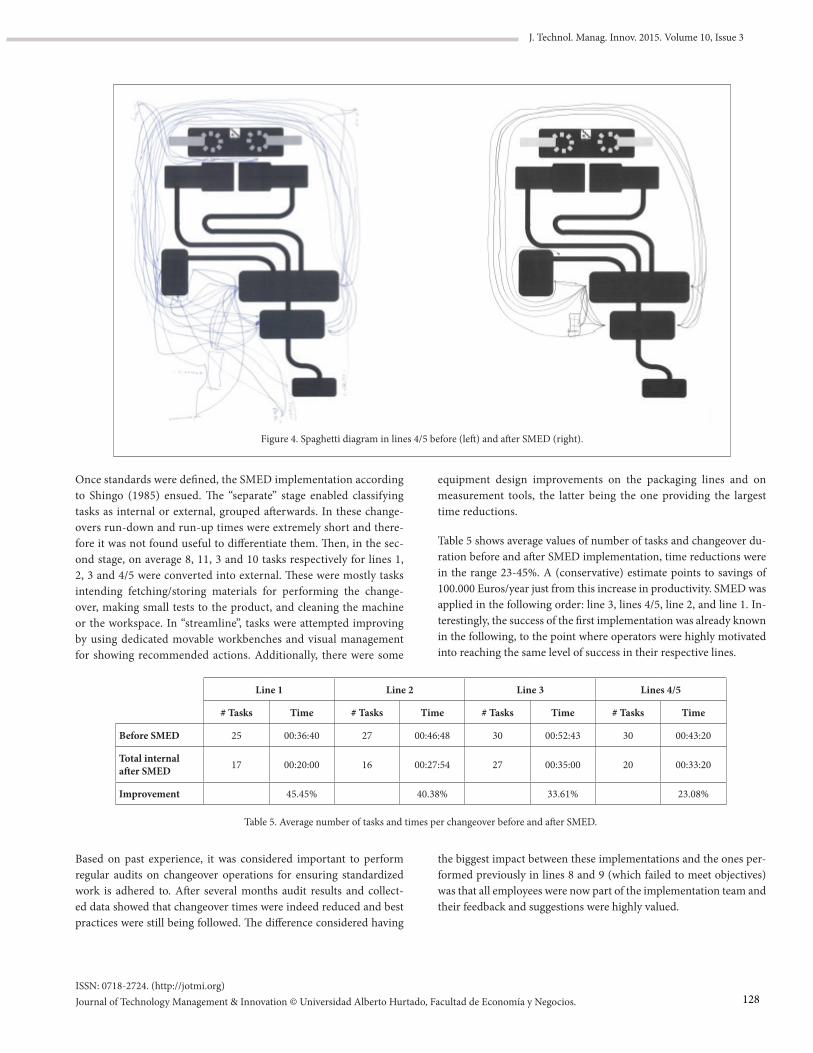
ISSN: 0718-2724. (http://jotmi.org)Journal of Technology Management & Innovation © Universidad Alberto Hurtado, Facultad de Economía y Negocios.
J. Technol. Manag. Innov. 2015. Volume 10, Issue 3
Once standards were defined, the SMED implementation according to Shingo (1985) ensued. The “separate” stage enabled classifying tasks as internal or external, grouped afterwards. In these change-overs run-down and run-up times were extremely short and there-fore it was not found useful to differentiate them. Then, in the sec-ond stage, on average 8, 11, 3 and 10 tasks respectively for lines 1, 2, 3 and 4/5 were converted into external. These were mostly tasks intending fetching/storing materials for performing the change-over, making small tests to the product, and cleaning the machine or the workspace. In “streamline”, tasks were attempted improving by using dedicated movable workbenches and visual management for showing recommended actions. Additionally, there were some
Line 1 Line 2 Line 3 Lines 4/5
# Tasks Time # Tasks Time # Tasks Time # Tasks Time
Before SMED 25 00:36:40 27 00:46:48 30 00:52:43 30 00:43:20
Total internal after SMED 17 00:20:00 16 00:27:54 27 00:35:00 20 00:33:20
Improvement 45.45% 40.38% 33.61% 23.08%
Table 5. Average number of tasks and times per changeover before and after SMED.
Figure 4. Spaghetti diagram in lines 4/5 before (left) and after SMED (right).
equipment design improvements on the packaging lines and on measurement tools, the latter being the one providing the largest time reductions.
Table 5 shows average values of number of tasks and changeover du-ration before and after SMED implementation, time reductions were in the range 23-45%. A (conservative) estimate points to savings of 100.000 Euros/year just from this increase in productivity. SMED was applied in the following order: line 3, lines 4/5, line 2, and line 1. In-terestingly, the success of the first implementation was already known in the following, to the point where operators were highly motivated into reaching the same level of success in their respective lines.
Based on past experience, it was considered important to perform regular audits on changeover operations for ensuring standardized work is adhered to. After several months audit results and collect-ed data showed that changeover times were indeed reduced and best practices were still being followed. The difference considered having
the biggest impact between these implementations and the ones per-formed previously in lines 8 and 9 (which failed to meet objectives) was that all employees were now part of the implementation team and their feedback and suggestions were highly valued.
128
ISSN: 0718-2724. (http://jotmi.org)Journal of Technology Management & Innovation © Universidad Alberto Hurtado, Facultad de Economía y Negocios.
J. Technol. Manag. Innov. 2015. Volume 10, Issue 3
Conclusions
In the last decades lean has been a major catalyst for organizational and process innovation in manufacturing companies. Despite suc-cessful applications being reported in several industrial sectors, con-cerning food and beverage industries these have been lacking. The characteristics of these sectors may have led to resistance in changing companies’ practices and embracing new management philosophies such as LM.
This work presents two case studies of companies of the food and beverage industries which have experienced successful LM applications. For the reported cases, several improvements could be found on imple-menting LM principles and tools, extending even beyond direct gains in productivity, e.g., improving production flexibility, increasing em-ployee engagement, and motivating a continuous improvement cul-ture. Based on these results, it can be concluded that this management philosophy can also be applied to these sectors making information in this paper of interest to general food and beverage manufacturers, particularly medium and large sized companies.
Moreover, this work reinforces employee engagement and empow-erment as critical to the success of lean implementations. In one of the case studies it was considered the main driver, as was the main difference to a previously failed application of SMED. Therefore, even though technical aspects are relevant and drivers for an initial process innovation using lean tools (techniques used in the presented case studies seem to more easily identify issues and/or help solving them) for maintaining process innovations employee engagement is critical.
As future work, a follow up on the level of lean implementation and cultural change in the companies addressed in this study is advised. Also, specifically concerning SMED, future work may focus on more accurately quantifying the impact of machine design changes and the impact in inventory reduction. Finally, another interesting research avenue may be comparing LM implementation results among compa-nies of different sectors. This would allow further understanding the potential and importance of process innovation in different industrial contexts.
Acknowledgements
This work was supported by Portuguese funds through the CIDMA – Center for Research and Development in Mathematics and Appli-cations, and the Portuguese Foundation for Science and Technology(“FCT – Fundação para a Ciência e a Tecnologia”), within projectPEst-OE/MAT/UI4106/2014.
References
Bayo-Moriones, A., Bello-Pintado, A., & Cerio, J. M. D. (2010). 5S use in manufacturing plants: Contextual factors and impact on operating performance. International Journal of Quality & Reliability Manage-ment, 27, 217-230. doi: 10.1108/02656711011014320
Boston Consulting Group (2015). Lean food-and-beverage man-ufacturing: Lower costs, better products, improved sustainability. Retrieved June 20, 2015, from http://www.bcg.com/documents/file49085.pdf
Cakmakci, M. (2008). Process improvement: Performance analysis of the setup time reduction-SMED in the automobile industry. The International Journal of Advanced Manufacturing Technology, 41, 168-179. doi: 10.1007/s00170-008-1434-4
Chapman, C. D. (2005). Clean house with lean 5S. Quality Progress, 38, 27-32.
Coimbra, E. A. (2009). Total flow management: Achieving excellence with kaizen and lean supply chains. Zug: Kaizen Institute.
Courtois, A., Martin-Bonnefous, C., & Pillet, M. (2007). Gestão da produção: Para uma gestão industrial ágil, criativa e cooperante. Lis-boa: Lidel.
Cox, A., & Chicksand, D. (2005). The limits of lean management think-ing: Multiple retailers and food and farming supply chains. European Management Journal, 23, 648-662. doi: 10.1016/j.emj.2005.10.010
Davenport, T. H. (1993). Process innovation: Reengineering work through information technology. Harvard Business Review Press.
Dennis, P. (2007). Lean production simplified. New York: Productivity Press.
Dora, M., Goubergen, D. V., Kumar, M., Molnar, A., & Gellynck, X. (2014). Application of lean practices in small and medium-sized food enterprises. British Food Journal, 116, 125-141. doi: 10.1108/BFJ-05-2012-0107
Dudbridge, M. (2011). Handbook of lean manufacturing in the food industry. Chichester: Wiley-Blackwell.
Ferradás, P. G., & Salonitis, K. (2013). Improving changeover time: A tailored SMED approach for welding cells. Procedia CIRP, 7, 598-603. doi: 10.1016/j.procir.2013.06.039
Gapp, R., Fisher, R., & Kobayashi, K. (2008). Implementing 5S within a Japanese context: An integrated management system. Management Decision, 46, 565-579. doi: 10.1108/00251740810865067
Gest, G., Culley, S. J., McIntosh, R. I., Mileham, A. R., & Owen, G. W. (1995). Review of fast tool change systems. Computer Integrated Manufacturing Systems, 8, 205-210. doi: 10.1016/0951-5240(95)00011-H
George, M. L. (2003). Lean six sigma for service: How to use lean speed and six sigma quality to improve services and transactions. McGraw-Hill.
Henry, J. R. (2012). Achieving lean changeover: Putting SMED to work. Boca Raton, FL: Productivity Press.
129
ISSN: 0718-2724. (http://jotmi.org)Journal of Technology Management & Innovation © Universidad Alberto Hurtado, Facultad de Economía y Negocios.
J. Technol. Manag. Innov. 2015. Volume 10, Issue 3
Heymans, B. (2015). Lean manufacturing and the food industry. Retrieved June 5, 2015, from http://www.flowmakers.com/articles/Articlefoodindustryandkaizen.pdf
Hirano, H. (1996). 5S for operators: 5 pillars of the visual workplace. Portland: Productivity Press.
Hirano, H. (2009). JIT implementation manual – The complete guide to just-in-time manufacturing: Volume 2 – Waste and the 5S’s. New York: Productivity Press.
Hodge, G. L., Ross, K. G., Joines, J. A., & Thoney, K. (2011). Adapting lean manufacturing principles to the textile industry. Production Planning & Control, 22, 237-247. doi: 10.1080/09537287.2010.498577
Holden, R. J. (2011). Lean thinking in emergency departments: A critical review. Annals of Emergency Medicine, 57, 265-278. doi: 10.1016/j.annemergmed.2010.08.001
Kennedy, I., Plunkett, A., & Haider, J. (2013). Implementation of lean principles in a food manufacturing company. In A. Azevedo (Ed.), Advances in Sustainable and Competitive Manufacturing Systems, Lecture Notes in Mechanical Engineering (pp. 1579-1590). Springer. doi: 10.1007/978-3-319-00557-7_127
Kumar, M., Antony, J., Singh, R. K., Tiwari, M. K., & Perry, D. (2006). Implementing the lean sigma framework in an Indian SME: A case study. Production Planning & Control, 17, 407-423. doi: 10.1080/09537280500483350
Mahalik, N. P., & Nambiar, A. N. (2010). Trends in food packaging and manufacturing systems and technology. Trends in Food Science & Technology, 21, 117-128. doi: 10.1016/j.tifs.2009.12.006
Marodin, G. A., & Saurin, T. A. (2013). Implementing lean production systems: Research areas and opportunities for future studies. International Journal of Production Research, 51, 6663-6680. doi: 10.1080/00207543.2013.826831
McIntosh, R., Owen, G., Culley, S., & Mileham, T. (2007). Changeover improvement: Reinterpreting Shingo’s “SMED” methodology. IEEE Transactions on Engineering Management, 54, 98-111. doi: 10.1109/TEM.2006.889070
Mika, G. (2006). Kaizen event implementation manual, 5th edition. Dearborn, MI: Society of Manufacturing Engineers.
Moreira, A. C., & Pais, G. C. S. (2011). Single minute exchange of die. A case study implementation. Journal of Technology Management & Innovation, 6, 129-146. doi: 10.4067/S0718-27242011000100011
OECD (2005). OSLO manual, guidelines for collecting and interpreting innovation data, 3rd Edition. OECD.
Patel, V. C., & Thakkar, H. (2014). Review on implementation of 5S in various organization. International Journal of Engineering Research and Applications, 4, 774-779.
Pearce, A., & Pons, D. (2013). Implementing lean practices: Managing the transformation risks. Journal of Industrial Engineering, 2013, 19 pages. doi: 10.1155/2013/790291
Shingo, S. (1985). A revolution in manufacturing: The SMED system. Cambridge, MA: Productivity Press.
Simons, D., & Zokaei, K. (2005). Application of lean paradigm in red meat processing. British Food Journal, 107, 192-211. doi: 10.1108/00070700510589495
Sousa, R., & Voss, C. A. (2008). Contingency research in operations management practices. Journal of Operations Management, 26, 697-713. doi: 10.1016/j.jom.2008.06.001
Thun, J. H., & Hoenig, D. (2011). An empirical analysis of supply chain risk management in the German automotive industry. International Journal of Production Economics, 131, 242-249. doi: 10.1016/j.ijpe.2009.10.010
Utterback, J. M., & Abernathy, W. J. (1975). A dynamic model of process and product innovation. Omega, 3, 639-656. doi: 10.1016/0305-0483(75)90068-7
Vlajic, J. V., Vorst, J. G. A. J., & Haijema, R. (2012). A framework for designing robust food supply chains. International Journal of Production Economics, 137, 176-189. doi: 10.1016/j.ijpe.2011.11.026
Womack, J. P., Jones, D. T., & Ross, D. (1990). The machine that changed the world. London: Macmillan.
Yin, R. K. (2014). Case study research: Design and methods. Sage publications.
130
J. Technol. Manag. Innov. 2015. Volume 10, Issue 3
ISSN: 0718-2724. (http://jotmi.org)Journal of Technology Management & Innovation © Universidad Alberto Hurtado, Facultad de Economía y Negocios.
Corporate Social Responsibility: A Case Study in Subsidiaries from Brazil and China
Caroline Prates 1*, Eugênio Pedrozo 2, Tania Silva 3
Abstract: Corporate Social Responsibility refers to the business’ role in providing Sustainable Development through fair and appropriate relation-ships with its stakeholders. This study aimed to describe and analyze the CSR evolution in two subsidiaries within the same group, one located in Brazil and other in China. In general, observed similarities in CSR evolution. In both companies, the order in which the dimensions received incentives was the same, first the economic, then the environmental and lastly the social dimension. However, some differences were noted, such as the initial situation of dimensions and the time to consolidate the pillars. In Chinese company, the inicial situation about environmental and social dimension was worst. Other point refers to time toward CSR. In Brazilian’ subsidiary, the CSR evolution occurredrslower. The last point refers to requirements of second order, given the non-observance of these in both subsidiaries.
Keywords: Corporate Social Responsibility; Multinational Companies; Brazil; China.
1, 2, 3 Management School, Federal University of Rio Grande do Sul PPGA/EA/UFRGS, Brazil.*Corresponding author: [email protected].
Submitted June 3rd 2015 / Approved October 7th 2015
1 Introduction
Despite the emergence and importance of the Sustainable Develop-ment worldwide, in some countries there are still problems that hin-der the evolution of this issue, especially in emerging contexts. Ac-cording to the Sustainable Development Indicators (SDI), published by the Brazilian Institute of Geography and Statistics (IBGE, 2010), socioeconomic inequalities and impacts on the environment are still widespread, which hampers the countries sustainable development. In 2012, the Global Membership Organization and Business Research of China (GMOBRC) presented a report showing that the country had experienced three decades of accelerated growth in GDP and had largely neglected environmental conservation in this period.
Conventional approaches have mainly focused on the role of gov-ernmental and non-governmental organizations in promoting infra-structure, health programs and job creation. However, recently the role of business in achieving sustainable development has come in-creasingly onto focus (Farias & Farias, 2010). By adopting attitudes that positively impact society in economic, social and environmental terms, companies have an important role in sustainable development in emerging countries. In this sense, CSR appears as an alternative to the heavy social demands and limited capacity of government institu-tions to act in relation to these problems (Steurer, Langer, Konrad, & Martinuzzi, 2005).
According to Frederick (1994), CSR is based on the notion that cor-porations have an obligation to work for the improvement of social welfare. Furthermore, in presenting an image related to socially le-gitimate values and principles, a corporation may be seeking to build confidence among its target publics (Vizeu & Matites, 2013). In line
to Barin-Cruz, Pedrozo and Martinet (2007) organizations, regardless of their size, should clear understand that they are facing a new global reality, where thinking environmentally and socially, without losing sight of the economic aspect is, besides being a responsible attitude, well regarded by consumers and thus results in the enhancement of the brand name. There is no need for organizations to pursue sus-tainability, since it will inevitably inhabit the world of work (Hop-kins, 2009). However, those companies that are better structured and adapted with regard to this subject, will be ahead in the business.
Based on this, the studies that encompass Multinational corporations (MNCs), gain prominence in this context, because are in the middle of this debate, considering their huge social and environmental im-pact on many countries (Barin-Cruz & Pedrozo, 2009).
Nevertheless, the paths traced by multinational corporations have been varied, especially with regards CSR in developing countries (Jamali, 2010). This debate has become quite intense in recent years, with both benefits and damages being seen to result from the interna-tionalization process in developing countries.
Given the above, this study seeks to understand the evolution of the efforts made by internationalized companies on behalf of society, in the three pillars, economic, social and environmental, that support sustainable development. The aim is to relate CSR practices from multinational corporations located in developing countries.
In order to understand the evolution of the subject in the enterprises, a case study was conducted in a major global player, referred to as X group in this study, within the electronics industry and an inter-national reference in the segment. The company, with its headquar-
131
J. Technol. Manag. Innov. 2015. Volume 10, Issue 3
ISSN: 0718-2724. (http://jotmi.org)Journal of Technology Management & Innovation © Universidad Alberto Hurtado, Facultad de Economía y Negocios.
ters in Japan, is among the leaders of the electronics sector and has subsidiaries all over the world. Among its subsidiaries, two units are responsible for developing and manufacturing of the same products, one located in China and the other in Brazil. The experience of these subsidiaries in relation to the issue and their contextualization lead them to compose the object of analysis of this research. In this case study was possible to find differences and similarities between two subsidiaries towards CSR.
A contribution of this research have been obtained at the theoretical level, given that it examines CSR in an emergent context. Still it is important to note that these studies, with Steurer et al. (2005) approach, were almost conducted in Europe, there are few empirical studies in Brazil and China. Moreover, other important contribution refers to the use of path dependence aslanalyticalestructure for historical researches.
In addition to this introduction, this paper is divided into five more sections. The second section refers to two theoretical approaches nec-essary to conduct the research. The third section describes the method-ology used. The fourth section provides a characterization about object of analysis and presents the results and discussions of this paper. After which, some final thoughts are expressed regarding this research.
2 Corporate Social Responsibility in Developing Countries
This chapter introduces the theoretical approaches used in this re-search. The first section presents the main approaches about CSR and its development in Brazil and China. In order to analyze the evolution of these events, the Path Dependence phenomenon is discussed in the second section.
2.1 From sustainable development to corporate social responsibility
According to the World Commission on Environment and Develop-ment, sustainable development is understood as one that meets the needs of the present without compromising the ability of future gen-erations to meet their own needs (WCED, 1987). Since sustainable development was first conceptualized, one of the divergent points among the currents of thought refers to its scope. The vast majority of scholars accept the three classical environmental, social and econom-ic dimensions, which are considered to make up the triple bottom line (Elkington, 2004). Regarding these dimensions there is debate about their relative priorities and how they should relate to each other in view of the integration, communication, exchanges and synergy be-tween the goals of the dimensions (Munasinghe, 2007).
Considering the area under study, the incorporation of the principles of sustainability into business practices has emerged as a prominent theme in both the academic and professional fields, since besides demonstrating an awareness of the role of business in society, it can also be seen as a differential within the market. Sustainable manage-ment has allowed corporations to implement strategies that encom-pass concerns of great importance to society on a local, regional or global level (Gray & Milne, 2002).
As Sustainable Development, the concept of CSR coupled with the relationship with internal and external stakeholders, is older than it looks, but became popular only after 1980 (Steurer et al., 2005). Contrary to neoclassical economists who saw firms as closed systems, only geared to its shareholders, after the mid-1980s, the business-so-ciety relations pave the corporate environment for its societal con-text (Dill, 1958). In 1984, Freeman’s book Strategic Management: A Stakeholder approach, stabilized the CSR as a popular research field through the use of strategic relationships with key business partners in order to promote a win-win game, that is, the broker sustainability through this good relationship with stakeholders, the company ac-quires competitive advantage.
CSR, in turn, emerges in the academic context, in the 1950s. How-ever, the diversity of definitions shows that there is no agreement on how the issue should be defined (Carrol & Shabana, 2010). Hopkins (2005) describes that in the literature there is no consensus on the question of whether CSR should be conceptualized as a purely vol-untary approach or how it should be strictly regulated, forcing com-panies to suit up. While there are these distinctions, this is the usual definition and more adopted by the academic community.
In last decades, CSR has progressively moved from ideology to reality and literature management has significantly contributed to the defini-tion and characterization of the phenomenon as well as for the devel-opment of discussions on best practices and their impact on the rep-utation and financial performance (Maon, Lindgren & Swaen, 2010). This change was also accompanied by an evolution of the concept of CSR, beyond the purely pragmatic and focused on the financial re-turn to a more holistic and integrative perspective.
The theme has grown into distinct research lines with different epis-temological positions (Gond & Matten, 2007). One line which has gained notoriety due to its dynamism and practical orientation relates to the business environment in order to investigate the processes that involve the application and integration of CSR activities and organi-zational structures (Maon & Swaen, 2009).
Maon and Swaen (2009) argue that for some corporations, the pres-sures to adopt responsible behavior have demanded real and import-ant changes in their daily activities, culture and organizational struc-tures in order to make CSR a core activity in the organization.
In this context is important related CSR with the main stakeholders. Steurer is one author who has discussed this subject in recent years, emphasizing the management of relationships with key stakeholders. The study by Steurer et al. (2005) proposed a framework that, in ad-dition to the traditionally known dimensions (economic, social and environmental) included also a fourth dimension (the second-order requirements), which emphasizes transparency, participation, re-flexivity, integration and intergeneration, particularly in view of the stakeholders.
The authors proposed fourteen points which were subdivided into the four dimensions (Table 1). This proposal can be used to map organiza-
132
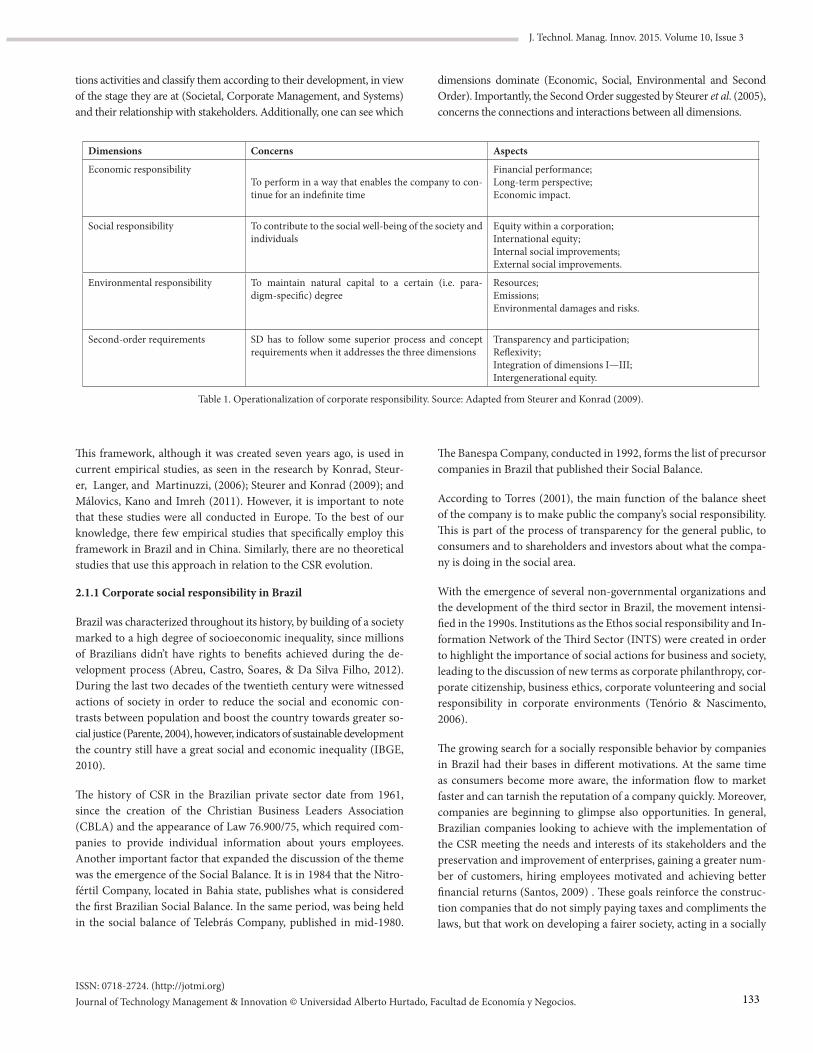
J. Technol. Manag. Innov. 2015. Volume 10, Issue 3
ISSN: 0718-2724. (http://jotmi.org)Journal of Technology Management & Innovation © Universidad Alberto Hurtado, Facultad de Economía y Negocios.
tions activities and classify them according to their development, in view of the stage they are at (Societal, Corporate Management, and Systems) and their relationship with stakeholders. Additionally, one can see which
Dimensions Concerns Aspects
Economic responsibilityTo perform in a way that enables the company to con-tinue for an indefinite time
Financial performance;Long-term perspective;Economic impact.
Social responsibility To contribute to the social well-being of the society and individuals
Equity within a corporation;International equity;Internal social improvements;External social improvements.
Environmental responsibility To maintain natural capital to a certain (i.e. para-digm-specific) degree
Resources;Emissions;Environmental damages and risks.
Second-order requirements SD has to follow some superior process and concept requirements when it addresses the three dimensions
Transparency and participation;Reflexivity;Integration of dimensions I—III;Intergenerational equity.
Table 1. Operationalization of corporate responsibility. Source: Adapted from Steurer and Konrad (2009).
dimensions dominate (Economic, Social, Environmental and Second Order). Importantly, the Second Order suggested by Steurer et al. (2005), concerns the connections and interactions between all dimensions.
This framework, although it was created seven years ago, is used in current empirical studies, as seen in the research by Konrad, Steur-er, Langer, and Martinuzzi, (2006); Steurer and Konrad (2009); and Málovics, Kano and Imreh (2011). However, it is important to note that these studies were all conducted in Europe. To the best of our knowledge, there few empirical studies that specifically employ this framework in Brazil and in China. Similarly, there are no theoretical studies that use this approach in relation to the CSR evolution.
2.1.1 Corporate social responsibility in Brazil
Brazil was characterized throughout its history, by building of a society marked to a high degree of socioeconomic inequality, since millions of Brazilians didn’t have rights to benefits achieved during the de-velopment process (Abreu, Castro, Soares, & Da Silva Filho, 2012). During the last two decades of the twentieth century were witnessed actions of society in order to reduce the social and economic con-trasts between population and boost the country towards greater so-cial justice (Parente, 2004), however, indicators of sustainable development the country still have a great social and economic inequality (IBGE, 2010).
The history of CSR in the Brazilian private sector date from 1961, since the creation of the Christian Business Leaders Association (CBLA) and the appearance of Law 76.900/75, which required com-panies to provide individual information about yours employees. Another important factor that expanded the discussion of the theme was the emergence of the Social Balance. It is in 1984 that the Nitro-fértil Company, located in Bahia state, publishes what is considered the first Brazilian Social Balance. In the same period, was being held in the social balance of Telebrás Company, published in mid-1980.
The Banespa Company, conducted in 1992, forms the list of precursor companies in Brazil that published their Social Balance.
According to Torres (2001), the main function of the balance sheet of the company is to make public the company’s social responsibility. This is part of the process of transparency for the general public, to consumers and to shareholders and investors about what the compa-ny is doing in the social area.
With the emergence of several non-governmental organizations and the development of the third sector in Brazil, the movement intensi-fied in the 1990s. Institutions as the Ethos social responsibility and In-formation Network of the Third Sector (INTS) were created in order to highlight the importance of social actions for business and society, leading to the discussion of new terms as corporate philanthropy, cor-porate citizenship, business ethics, corporate volunteering and social responsibility in corporate environments (Tenório & Nascimento, 2006).
The growing search for a socially responsible behavior by companies in Brazil had their bases in different motivations. At the same time as consumers become more aware, the information flow to market faster and can tarnish the reputation of a company quickly. Moreover, companies are beginning to glimpse also opportunities. In general, Brazilian companies looking to achieve with the implementation of the CSR meeting the needs and interests of its stakeholders and the preservation and improvement of enterprises, gaining a greater num-ber of customers, hiring employees motivated and achieving better financial returns (Santos, 2009) . These goals reinforce the construc-tion companies that do not simply paying taxes and compliments the laws, but that work on developing a fairer society, acting in a socially
133
J. Technol. Manag. Innov. 2015. Volume 10, Issue 3
ISSN: 0718-2724. (http://jotmi.org)Journal of Technology Management & Innovation © Universidad Alberto Hurtado, Facultad de Economía y Negocios.
responsible and transparent manner (Parente, 2004), contributing to more broadly, with the country’s sustainable development.
2.1.2 Corporate social responsibility in China
The movement of CSR in China was highlighted from the mid-1990s (Myllyvainio & Virkkala, 2006; Zhou, 2006; Abreu et al., 2012). Mul-tinationals have brought CSR from Western to the Chinese market during the anti-sweatshop campaign that built an opposition to the unacceptable conditions in the supply chain in developing countries (Pun, 2003).
The need for integration of CSR in China has been driven by in-ternational pressures motivated by the lack of concern about the health, safety, excessive working hours and adoption of labor laws below international standards which consequently resulted in the launch codes conducts business in relation to labor standards in China (Pun, 2003). Chinese companies only started to passively accept these rules, regulations and codes of conduct on working conditions, labor rights, labor conditions, health and safety because their buyers forced them to do so (Zhou, 2006). The relationship with the rest of the world became more narrow and intense and con-sequently China has become more dependent on other countries due to numerous commercial and political securities (Myllyvainio & Virkkala, 2006).
Another factor that raised discussions about Chinese social condi-tions was the increase in outsourcing of production from Western countries to China, due to low salaries paid by enterprises (Buhmann, 2005). Myllyvainio and Virkkala (2006) point out that China is one of the economies with greater supply of manpower, due to excess over 150 million people located only in rural areas.
From 1995 to 1998, only a few large multinationals and some large Chinese companies were looking for the implementation of codes of conduct, and only after the year 1998, a greater number of multi-national companies began to apply those (Abreu et al, 2012). Before 2001, the CSR was limited to the interior of the factories with ac-companying audits. Consumers, government and the media were not aware of CSR at that time. Even workers in factories that were present during audits knew the theme marginally (Pun, 2003).
According Myllyvainio and Virkkala (2006) the year 2005 was desig-nated as the period of CSR in the Chinese media, where events were organized aiming at building a harmonious society where there was a CSR within Chinese enterprises, having as ultimate goal draw more attention to social justice and solve problems for the common people, improving the quality of life. Economic growth was still a key point, but greater emphasis should be directed to the interests of the major-ity of the population (Myllyvainio & Virkkala, 2006).
In general, the CSR in China can be seen as an action to make Chinese companies more competitive in the global marketplace, and protect and enhance their brands, able to compete with major global compet-itors, addressing issues important to its employees, customers, inves-tors and stakeholders and becoming long-term, sustainable (Levine, 2008). Was prompted by international pressure and followed the model proposed in the West, which created guidelines and standards such as SA 8000 and ISO standards. The few local Chinese standards as CS9000T are recent. China is becoming a major player in CSR, but their practices and concepts are still recent (Wang & Juslin, 2009).
2.2 Path Dependence
The quest to understand what has motivated the development of ini-tiatives related to sustainability as well as the trajectory of these events requires an understanding of the historical facts, which, in this study, will be addressed by means of the phenomenon Path Dependence.
The term path dependence is used in the sense that all processes are dependent on the decisions taken in the past, which are each step had feedback of the others steps in the organizational trajectory, so that, the choices available in the present are the result of the choices made in the past.
According to Hoff (2011), although the idea of path dependence is generally be used in studies of technological spread or change, it has been increasingly common to find it applied in studies of Humanities and Social Sciences, where it is used in order to understand processes of change in societies. Moreover, some authors indicate that the avail-able technology is always a limiting factor for the adoption of more environmental friendly postures (Shrivastava, 1995; OECD, 2001). The choice of technologies, combined with the study of historical developments, suggest that some settings within an observed system arise from the trajectory that the system adopted (Hoff, 2011).
As a result, Hoff (2011), based on search of the literature, discussed previously studied elements within the concepts of path dependence, as well as the methods used for this type of study, and added to these elements from historical research, in an attempt to developing an analytical framework for the application of path dependence. The analytical framework built by the author can be seen in Figure 1.
For building the analytical framework, the author used contributions from Evolutionary Theory, through the studies of Nelson and Winter (1982) and other authors as Goldstone (1998), and Hansen (2002).
Hoff (2011) identifies five different moments that should be consid-ered in historical research: (i) antecedent conditions, (ii) Critical con-juncture, (iii) Structural persistence, (iv) Reactive sequence, and (v) Results.
134
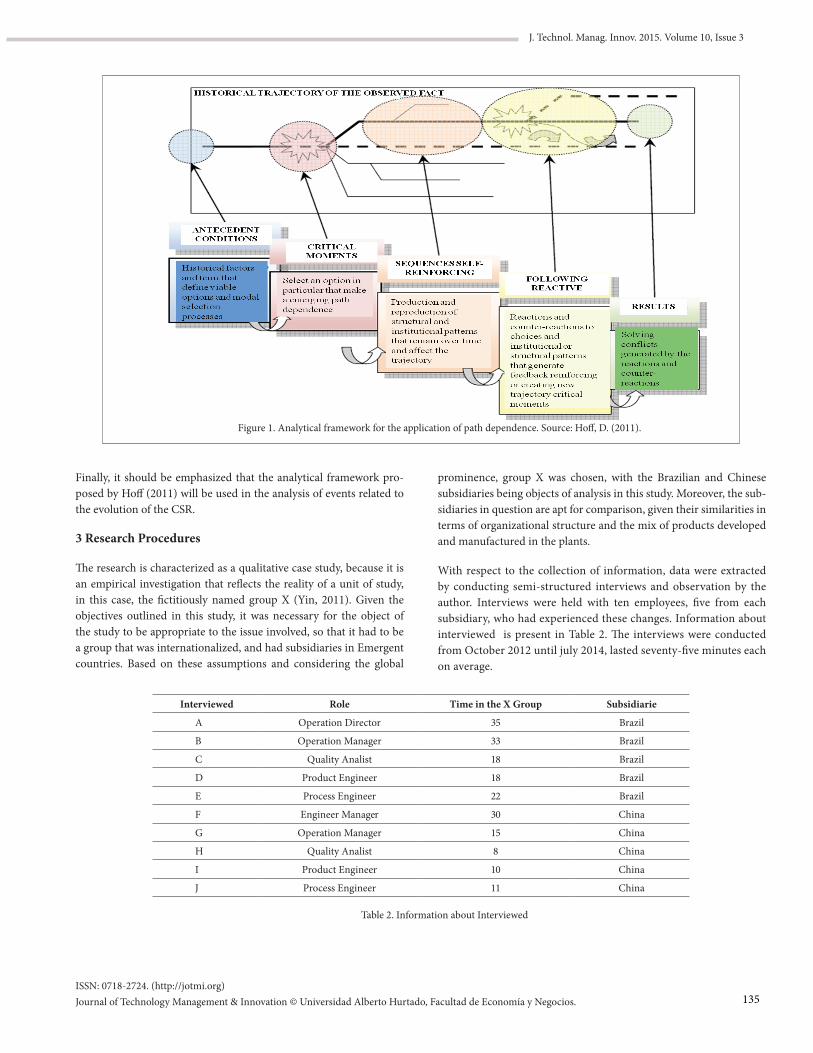
J. Technol. Manag. Innov. 2015. Volume 10, Issue 3
ISSN: 0718-2724. (http://jotmi.org)Journal of Technology Management & Innovation © Universidad Alberto Hurtado, Facultad de Economía y Negocios.
Finally, it should be emphasized that the analytical framework pro-posed by Hoff (2011) will be used in the analysis of events related to the evolution of the CSR.
3 Research Procedures
The research is characterized as a qualitative case study, because it is an empirical investigation that reflects the reality of a unit of study, in this case, the fictitiously named group X (Yin, 2011). Given the objectives outlined in this study, it was necessary for the object of the study to be appropriate to the issue involved, so that it had to be a group that was internationalized, and had subsidiaries in Emergent countries. Based on these assumptions and considering the global
prominence, group X was chosen, with the Brazilian and Chinese subsidiaries being objects of analysis in this study. Moreover, the sub-sidiaries in question are apt for comparison, given their similarities in terms of organizational structure and the mix of products developed and manufactured in the plants.
With respect to the collection of information, data were extracted by conducting semi-structured interviews and observation by the author. Interviews were held with ten employees, five from each subsidiary, who had experienced these changes. Information about interviewed is present in Table 2. The interviews were conducted from October 2012 until july 2014, lasted seventy-five minutes each on average.
Figure 1. Analytical framework for the application of path dependence. Source: Hoff, D. (2011).
Interviewed Role Time in the X Group Subsidiarie
A Operation Director 35 Brazil
B Operation Manager 33 Brazil
C Quality Analist 18 Brazil
D Product Engineer 18 Brazil
E Process Engineer 22 Brazil
F Engineer Manager 30 China
G Operation Manager 15 China
H Quality Analist 8 China
I Product Engineer 10 China
J Process Engineer 11 China
Table 2. Information about Interviewed
135
J. Technol. Manag. Innov. 2015. Volume 10, Issue 3
ISSN: 0718-2724. (http://jotmi.org)Journal of Technology Management & Innovation © Universidad Alberto Hurtado, Facultad de Economía y Negocios.
The observation by the author with focus in the subject was per-formed for seven months in Brazil (january-july, 2012) and for ten days in China (July, 2014). One of the authors worked in the Brazil company, because of this was possible to study these plant for more time. The same author visited the Chinese plant for 10 days to observe these points and conclude the interwiews.
In addition to the primary data, the study used secondary data sourc-es obtained by means of documentary observation in reports, compa-ny websites and other publications from the organization, as well as by consulting specialized media about the electronics industry. About the reports was analized indicators about enviromental and economic management, human resources, water control and risk management.Data analysis was performed in the light of the above-mentioned the-oretical references. The historical approach was taken in an attempt to understand the evolution of CSR for which Hoff (2011) path depen-dency’ analytical framework was used. The analytical categories and subcategories were predetermined based on the theoretical references (Steurer et al., 2005).
4 Analysis
4.1 The Case
The X Group, operating in the electronics industry, is present in about 40 locations with more than 50 plants installed. Among these plants, the Brazilian and Chinese subsidiary were studied.
4.1.1 The Brazilian subsidiary
The Brazilian subsidiary develops and manufactures capacitors. In the market, it is differentiated due to the quality of its products, not their price. It was founded in 1954 by the descendants of German immigrants in the state of Rio Grande do Sul. Its foundation was mo-tivated by the growth of the electronics industry, mainly focused on manufacturing radios. The constitution of the company represent the first critical moment of change. During this time, the only concern of the company was survive in the market, focusing in the economic improvements. Its founders did not control the efficiency of their pro-cesses and material consumption well as potential impacts that could be caused to the environment.
In Brazil, at that time, the prevailing economic model was the so-called, ‘developmentalism’, in which Brazil developed much of its infrastruc-ture in a short time and achieved high rates of economic growth. How-ever, the Governments accounts were often out of balance, the foreign debt multiplied and triggered a massive inflationary wave.
Due to the economic difficulties of the period, in 1957, the company was fully acquired by a multinational group, which marks the second critical moment of change. At the same time, the company began to supply not only the domestic market but also export, although on a small scale. In 1962, seeking to extend the business, its manufacturing facilities were transferred to the metropolitan area of Porto Alegre. That same year the product mix offered to the market began to be expanded.
Between 1969 and 1973, Brazil experienced the so-called Econom-ic Miracle, when the rapid growth of the industry created jobs and raised the income of many workers. In this same period, the company increased its sales in the domestic market and worked to improve the quality of its products and processes in order to reduce the amount of labor required to manufacture of capacitors. About 5% of its produc-tion was being sent to foreign markets, mostly in Europe. The controls in the factory was only about production quantity. The quality was in-spected in the final of the process, after the product has already been finalized. Didn’t have a concern about number of scrap or material consumption.
During the 1990s, the main theme of Fernando Collor’s Government was the failure of ‘developmentalist’ project as an engine for growth. From then on, there was growing trade liberalization and a series of privatizations. Several largely inefficient companies, especially in the computer industry, went bankrupt while the quality of products im-proved substantially.
During this period, the company needed to restructure its produc-tion technology and considerably reduced the number of employees in order to adapt to changing market demands and become more competitive. In addition, it directed efforts achieve greater quality and efficiency, acquiring, initially, the ISO 9000. In 1992, the company gained recognition within the group as a center of competence, and autonomy, as well as for producing, developing and negotiating new products without prior authorization from the headquarters. This fact corresponds to the third critical moment of change that occurred in the company. During this period, the company consolidated the eco-nomic pillar. By preparing for the foreign market before the opening of the markets in Brazilian it passed through the crisis more easily than other companies of similar size and so conquered its ‘indepen-dence’. With improvements in the process, it was possible to perform quality inspections during the process, reducing the scraps quantity. In addition, the company, in this period, began to manage their waste and take care of their disposal. Reduction of scraps controls were in-cluded in the process.
In Brazil, monetary stability was only achieved with the implemen-tation of the Real Plan in 1994. As a consequence of the end of high inflation, there has been an unprecedented improvement in terms of income for the lower classes. In the last decade, the company has come to export 70% of its products.
Later, in 1999, the company became part of another group, which grew out of the merger of two corporations and opened its capital on the stock market. The fourth critical moment of change occurred in 2002, with the change of name due to the earlier merger. Since then, the company introduced a series of changes and gained certifications: in 2003 it was certified ISO TS 16949, a prerequisite for supplying the automotive market; in 2004, it received ISO 14001 (environmental management); in 2005 it was awarded Outstanding Company “Sus-tainable RS”; and in 2008, it adopted the lean manufacturing system, striving for even more efficiency. It by obtaining the ISO 14001 certi-fication, by disposal and scrap control its environmental dimension
136
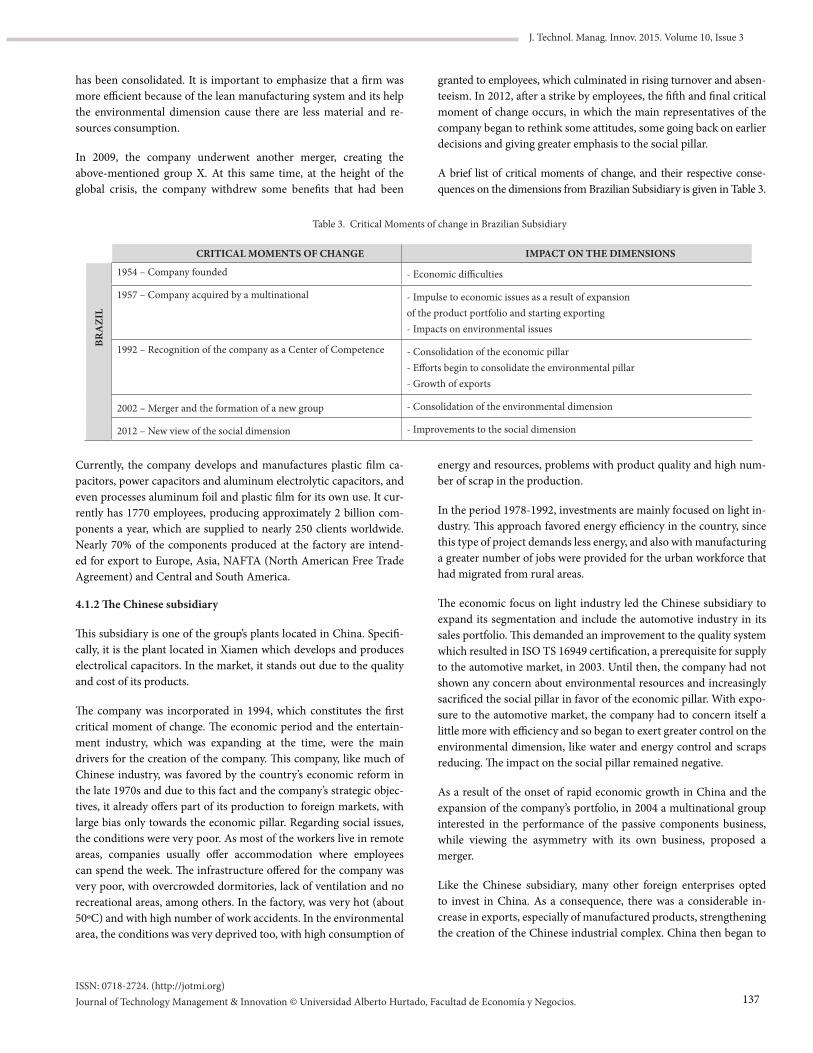
J. Technol. Manag. Innov. 2015. Volume 10, Issue 3
ISSN: 0718-2724. (http://jotmi.org)Journal of Technology Management & Innovation © Universidad Alberto Hurtado, Facultad de Economía y Negocios.
has been consolidated. It is important to emphasize that a firm was more efficient because of the lean manufacturing system and its help the environmental dimension cause there are less material and re-sources consumption.
In 2009, the company underwent another merger, creating the above-mentioned group X. At this same time, at the height of the global crisis, the company withdrew some benefits that had been
granted to employees, which culminated in rising turnover and absen-teeism. In 2012, after a strike by employees, the fifth and final critical moment of change occurs, in which the main representatives of the company began to rethink some attitudes, some going back on earlier decisions and giving greater emphasis to the social pillar.
A brief list of critical moments of change, and their respective conse-quences on the dimensions from Brazilian Subsidiary is given in Table 3.
Table 3. Critical Moments of change in Brazilian Subsidiary
CRITICAL MOMENTS OF CHANGE IMPACT ON THE DIMENSIONS
BRA
ZIL
1954 – Company founded - Economic difficulties
1957 – Company acquired by a multinational - Impulse to economic issues as a result of expansion of the product portfolio and starting exporting- Impacts on environmental issues
1992 – Recognition of the company as a Center of Competence - Consolidation of the economic pillar- Efforts begin to consolidate the environmental pillar- Growth of exports
2002 – Merger and the formation of a new group - Consolidation of the environmental dimension
2012 – New view of the social dimension - Improvements to the social dimension
Currently, the company develops and manufactures plastic film ca-pacitors, power capacitors and aluminum electrolytic capacitors, and even processes aluminum foil and plastic film for its own use. It cur-rently has 1770 employees, producing approximately 2 billion com-ponents a year, which are supplied to nearly 250 clients worldwide. Nearly 70% of the components produced at the factory are intend-ed for export to Europe, Asia, NAFTA (North American Free Trade Agreement) and Central and South America.
4.1.2 The Chinese subsidiary
This subsidiary is one of the group’s plants located in China. Specifi-cally, it is the plant located in Xiamen which develops and produces electrolical capacitors. In the market, it stands out due to the quality and cost of its products.
The company was incorporated in 1994, which constitutes the first critical moment of change. The economic period and the entertain-ment industry, which was expanding at the time, were the main drivers for the creation of the company. This company, like much of Chinese industry, was favored by the country’s economic reform in the late 1970s and due to this fact and the company’s strategic objec-tives, it already offers part of its production to foreign markets, with large bias only towards the economic pillar. Regarding social issues, the conditions were very poor. As most of the workers live in remote areas, companies usually offer accommodation where employees can spend the week. The infrastructure offered for the company was very poor, with overcrowded dormitories, lack of ventilation and no recreational areas, among others. In the factory, was very hot (about 50ºC) and with high number of work accidents. In the environmental area, the conditions was very deprived too, with high consumption of
energy and resources, problems with product quality and high num-ber of scrap in the production.
In the period 1978-1992, investments are mainly focused on light in-dustry. This approach favored energy efficiency in the country, since this type of project demands less energy, and also with manufacturing a greater number of jobs were provided for the urban workforce that had migrated from rural areas.
The economic focus on light industry led the Chinese subsidiary to expand its segmentation and include the automotive industry in its sales portfolio. This demanded an improvement to the quality system which resulted in ISO TS 16949 certification, a prerequisite for supply to the automotive market, in 2003. Until then, the company had not shown any concern about environmental resources and increasingly sacrificed the social pillar in favor of the economic pillar. With expo-sure to the automotive market, the company had to concern itself a little more with efficiency and so began to exert greater control on the environmental dimension, like water and energy control and scraps reducing. The impact on the social pillar remained negative. As a result of the onset of rapid economic growth in China and the expansion of the company’s portfolio, in 2004 a multinational group interested in the performance of the passive components business, while viewing the asymmetry with its own business, proposed a merger.
Like the Chinese subsidiary, many other foreign enterprises opted to invest in China. As a consequence, there was a considerable in-crease in exports, especially of manufactured products, strengthening the creation of the Chinese industrial complex. China then began to
137
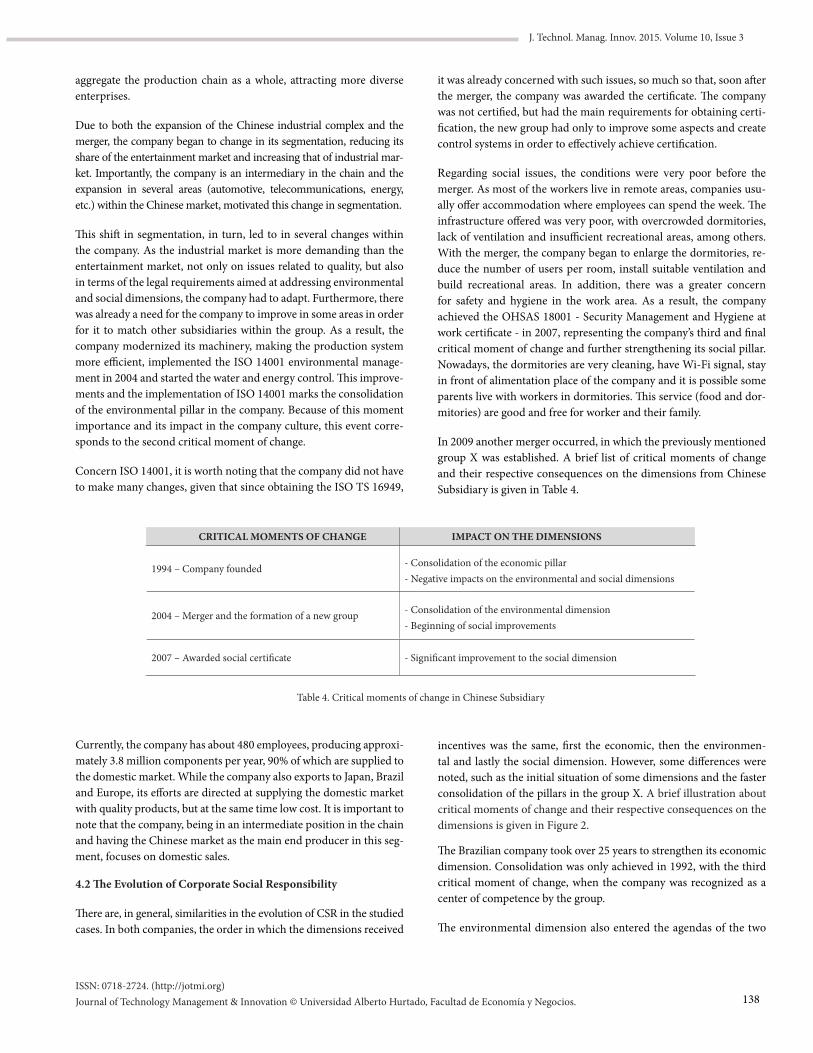
J. Technol. Manag. Innov. 2015. Volume 10, Issue 3
ISSN: 0718-2724. (http://jotmi.org)Journal of Technology Management & Innovation © Universidad Alberto Hurtado, Facultad de Economía y Negocios.
aggregate the production chain as a whole, attracting more diverse enterprises.
Due to both the expansion of the Chinese industrial complex and the merger, the company began to change in its segmentation, reducing its share of the entertainment market and increasing that of industrial mar-ket. Importantly, the company is an intermediary in the chain and the expansion in several areas (automotive, telecommunications, energy, etc.) within the Chinese market, motivated this change in segmentation.
This shift in segmentation, in turn, led to in several changes within the company. As the industrial market is more demanding than the entertainment market, not only on issues related to quality, but also in terms of the legal requirements aimed at addressing environmental and social dimensions, the company had to adapt. Furthermore, there was already a need for the company to improve in some areas in order for it to match other subsidiaries within the group. As a result, the company modernized its machinery, making the production system more efficient, implemented the ISO 14001 environmental manage-ment in 2004 and started the water and energy control. This improve-ments and the implementation of ISO 14001 marks the consolidation of the environmental pillar in the company. Because of this moment importance and its impact in the company culture, this event corre-sponds to the second critical moment of change.
Concern ISO 14001, it is worth noting that the company did not have to make many changes, given that since obtaining the ISO TS 16949,
it was already concerned with such issues, so much so that, soon after the merger, the company was awarded the certificate. The company was not certified, but had the main requirements for obtaining certi-fication, the new group had only to improve some aspects and create control systems in order to effectively achieve certification.
Regarding social issues, the conditions were very poor before the merger. As most of the workers live in remote areas, companies usu-ally offer accommodation where employees can spend the week. The infrastructure offered was very poor, with overcrowded dormitories, lack of ventilation and insufficient recreational areas, among others. With the merger, the company began to enlarge the dormitories, re-duce the number of users per room, install suitable ventilation and build recreational areas. In addition, there was a greater concern for safety and hygiene in the work area. As a result, the company achieved the OHSAS 18001 - Security Management and Hygiene at work certificate - in 2007, representing the company’s third and final critical moment of change and further strengthening its social pillar. Nowadays, the dormitories are very cleaning, have Wi-Fi signal, stay in front of alimentation place of the company and it is possible some parents live with workers in dormitories. This service (food and dor-mitories) are good and free for worker and their family.
In 2009 another merger occurred, in which the previously mentioned group X was established. A brief list of critical moments of change and their respective consequences on the dimensions from Chinese Subsidiary is given in Table 4.
CRITICAL MOMENTS OF CHANGE IMPACT ON THE DIMENSIONS
1994 – Company founded - Consolidation of the economic pillar- Negative impacts on the environmental and social dimensions
2004 – Merger and the formation of a new group - Consolidation of the environmental dimension- Beginning of social improvements
2007 – Awarded social certificate - Significant improvement to the social dimension
Currently, the company has about 480 employees, producing approxi-mately 3.8 million components per year, 90% of which are supplied to the domestic market. While the company also exports to Japan, Brazil and Europe, its efforts are directed at supplying the domestic market with quality products, but at the same time low cost. It is important to note that the company, being in an intermediate position in the chain and having the Chinese market as the main end producer in this seg-ment, focuses on domestic sales.
4.2 The Evolution of Corporate Social Responsibility
There are, in general, similarities in the evolution of CSR in the studied cases. In both companies, the order in which the dimensions received
Table 4. Critical moments of change in Chinese Subsidiary
incentives was the same, first the economic, then the environmen-tal and lastly the social dimension. However, some differences were noted, such as the initial situation of some dimensions and the faster consolidation of the pillars in the group X. A brief illustration about critical moments of change and their respective consequences on the dimensions is given in Figure 2.
The Brazilian company took over 25 years to strengthen its economic dimension. Consolidation was only achieved in 1992, with the third critical moment of change, when the company was recognized as a center of competence by the group.
The environmental dimension also entered the agendas of the two
138
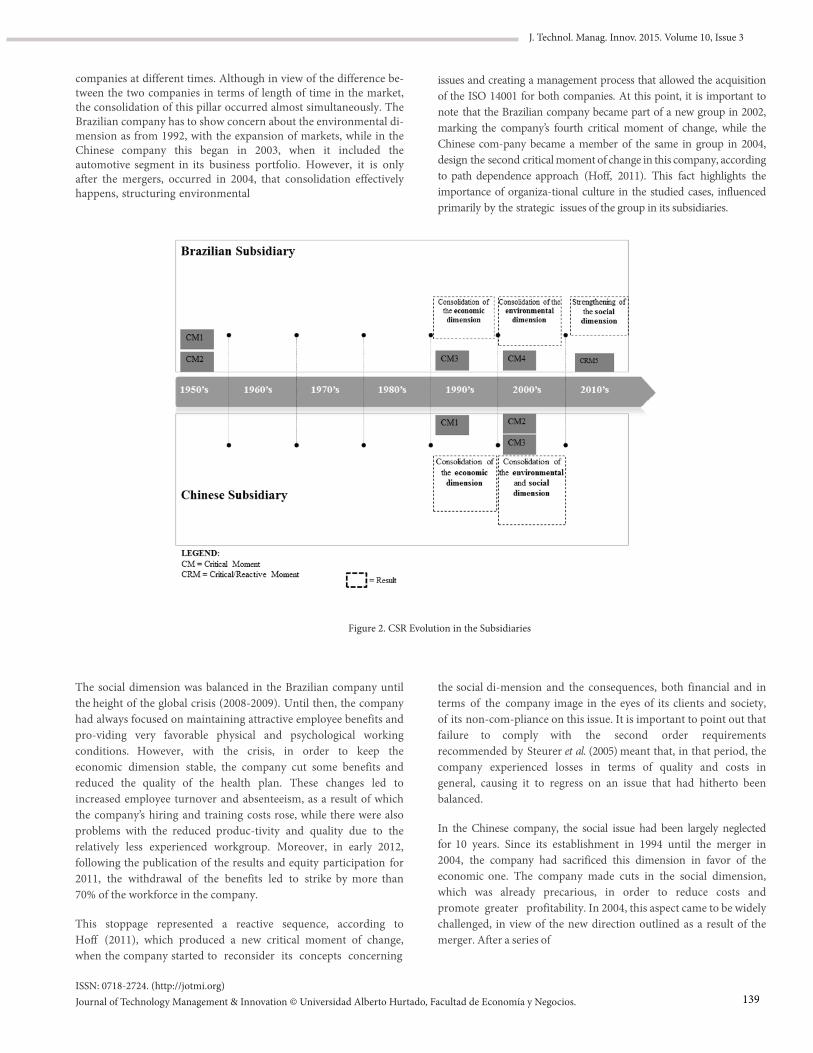
J. Technol. Manag. Innov. 2015. Volume 10, Issue 3
ISSN: 0718-2724. (http://jotmi.org)Journal of Technology Management & Innovation © Universidad Alberto Hurtado, Facultad de Economía y Negocios.
companies at different times. Although in view of the difference be-tween the two companies in terms of length of time in the market, the consolidation of this pillar occurred almost simultaneously. The Brazilian company has to show concern about the environmental di-mension as from 1992, with the expansion of markets, while in the Chinese company this began in 2003, when it included the automotive segment in its business portfolio. However, it is only after the mergers, occurred in 2004, that consolidation effectively happens, structuring environmental
issues and creating a management process that allowed the acquisition of the ISO 14001 for both companies. At this point, it is important to note that the Brazilian company became part of a new group in 2002, marking the company’s fourth critical moment of change, while the Chinese com-pany became a member of the same in group in 2004, design the second critical moment of change in this company, according to path dependence approach (Hoff, 2011). This fact highlights the importance of organiza-tional culture in the studied cases, influenced primarily by the strategic issues of the group in its subsidiaries.
The social dimension was balanced in the Brazilian company until the height of the global crisis (2008-2009). Until then, the company had always focused on maintaining attractive employee benefits and pro-viding very favorable physical and psychological working conditions. However, with the crisis, in order to keep the economic dimension stable, the company cut some benefits and reduced the quality of the health plan. These changes led to increased employee turnover and absenteeism, as a result of which the company’s hiring and training costs rose, while there were also problems with the reduced produc-tivity and quality due to the relatively less experienced workgroup. Moreover, in early 2012, following the publication of the results and equity participation for 2011, the withdrawal of the benefits led to strike by more than 70% of the workforce in the company.
This stoppage represented a reactive sequence, according to Hoff (2011), which produced a new critical moment of change, when the company started to reconsider its concepts concerning
Figure 2. CSR Evolution in the Subsidiaries
the social di-mension and the consequences, both financial and in terms of the company image in the eyes of its clients and society, of its non-com-pliance on this issue. It is important to point out that failure to comply with the second order requirements recommended by Steurer et al. (2005) meant that, in that period, the company experienced losses in terms of quality and costs in general, causing it to regress on an issue that had hitherto been balanced.
In the Chinese company, the social issue had been largely neglected for 10 years. Since its establishment in 1994 until the merger in 2004, the company had sacrificed this dimension in favor of the economic one. The company made cuts in the social dimension, which was already precarious, in order to reduce costs and promote greater profitability. In 2004, this aspect came to be widely challenged, in view of the new direction outlined as a result of the merger. After a series of
139
J. Technol. Manag. Innov. 2015. Volume 10, Issue 3
ISSN: 0718-2724. (http://jotmi.org)Journal of Technology Management & Innovation © Universidad Alberto Hurtado, Facultad de Economía y Negocios.
improvements in working conditions and also in the dormitories and living areas, in 2007, the Chinese company obtained OHSAS 18001 certification, which highlights the control and management of social aspects, health and safety at work. This certification has not been ob-tained by all the group’s subsidiaries - the Brazilian subsidiary has not been awarded this certificate, but it is the group aims to make it common in all its plants.
In both the Chinese and Brazilian cases, it is important to point out that the failure to comply with the fourth dimension, proposed by Steurer et al. (2005) as second-order requirements, meant that many aspects first had to be discredited before subsequently being im-proved. In the Chinese company, the same occurred to some degree with the environmental issue, which, during the economic growth phase only received attention after the misuse of funds was shown by the external market and, directly, in the social issue, given that the conditions for workers were sacrificed in order to maintain eco-nomic sustainability. In the Brazilian company, failure to comply with the fourth dimension was apparent in the period 2008 to 2009, at the height of the global crisis, in which social issues were negatively af-fected in order to maintain the economic dimension stable.
In short, it is possible to observe Chinese subsidiary toward CSR fast-er than Brazilian company. The initial condition in Chinese company were worst, but the changes occurred quickly while in Brazilian, the initial conditions were better, but the reaction was more slowly. This difference could be caused cause the year 2005 was designated as the period of CSR in the Chinese media, where events were organized aiming at building a harmonious society where there was a CSR with-in Chinese enterprises according Myllyvainio and Virkkala (2006).
In the contexts of the companies, there is a need for greater awareness regarding the second order requirements (Steurer et al., 2005), since they are intended to provide a greater balance between the dimen-sions. Probably, with the immersion of this fourth dimension within the organizational culture, a more linear evolution of CSR may be possible.
5 Final Remarks
CSR is a term that refers to the role of business in providing sustain-able development by maintaining a fair and appropriate relationship with its various stakeholders. It is particularly relevant today given the limited possibility of government organizations meeting all so-cial needs, especially in developing countries. In an effort to inves-tigate the topic in greater depth, this study has sought to describe and analyze the evolution of CSR in companies located in developing countries. Therefore, a study was conducted in two subsidiaries of the group X, one located in Brazil and the other in China.
There are, in general, similarities in the evolution of CSR in the studied cases. In both companies, the order in which the dimensions received in-centives was the same, first the economic, then the environmental and last-ly the social dimension. However, some differences were noted, such as the initial situation of some dimensions and the time to consolidate the pillars.
In Chinese company, the initial situation about environmental and social dimension was worse than Brazilian company. For economic di-mension this situation was different, the Chinese subsidiary had more conditions than Brazilian subsidiary because of the economic context and government approach.
Other point refers to time toward CSR. In Chinese’ subsidiary, the CSR evolution occurred faster than Brazilian’ Subsidiary. While Brazilian Company needed more than 50 years to promote CRS the Chinese’ Subsidiary required about 12 years to do this. Both Chinese Culture and the Political Context could be to influence this result. However the intensification of sustainable development in recent years and the creation of the Chinese subsidiary in the same period should be primarily responsible for this result faster.
Finally, results pointed that both Chinese and Brazilian companies didn’t observe the second-order requirements during the way toward CSR.
This study has contributed towards the analysis of CSR in companies located in developing countries. Others important contributions re-fers to the use of path dependence as analytical structure for historical researches and application of Steurer approach in emergent contexts.
For future researches, further studies including comparison with the holding company are suggested so that more specific details can be brought to light. Into recently formed younger companies, aris-ing from other contexts, may provide different results and so enrich this discussion. Finally, another approach that was quite prominent in this study and deserves further study concerns the second-order requirements. These requirements, identified as the fourth dimen-sion, were shown to be crucial for achieving a more homogeneous evolution of CSR in the companies. Research into these requirements within companies, as well as ways to operationalize the subject in the organizational environment, could help to bring about CSR more ful-ly and faster.
References
Abreu, M., Castro, F., Soares, F., & Da Silva Filho, J. (2012). A Com-parative Understanding of Corporate Social Responsibility of Textile Firms In Brazil And China. Journal of Cleaner Production, (20), 119-126. http://dx.doi:10.1016/j.jclepro.2011.08.010
Anderson, E., & Gatignon, H. (1986). Modes of foreign entry: a trans-action cost analysis and propositions. Journal of International Business Studies, 17(3), 1-26. http://dx.doi.org/10.1057/palgrave.jibs.8490432
Barin-Cruz, L., Pedrozo, E., & Martinet, A. (2007). Estratégias de Desenvolvimento Sustentável em grupos multinacionais: o estudo de dois casos franceses no setor do varejo. Revista de Gestão Social e Am-biental, (3), 58-78. http://dx.doi.org/10.5773/rgsa.v1i3.32
Barin-Cruz, L., & Pedrozo, E. (2009). Corporate social responsibility and green management- Relation between headquarters and subsidiary in multinational corporations. Management Decision, 47(7), 1174-1199. http://dx.doi.org/10.1108/00251740910978368
140
J. Technol. Manag. Innov. 2015. Volume 10, Issue 3
ISSN: 0718-2724. (http://jotmi.org)Journal of Technology Management & Innovation © Universidad Alberto Hurtado, Facultad de Economía y Negocios.
Buhmann, K. (2005). Corporate social responsibility in China: cur-rent issues and their relevance for implementation of law. The Copen-hagen Journal of Asian Studies, v. 22.
Carroll, A., & Shabana, K. (2010). The Business Case for Corporate Social Responsibility: A Review of Concepts, Research and Practice. International Journal of Management Reviews, 12(1), 85-105. http://dx.doi.org/10.1111/j.1468-2370.2009.00275.x
Dill, W. (1958). Environment as an Influence on Managerial Au-tonomy. Administrative Science Quartely, 2, 409-443. http://dx.doi.org/10.2307/2390794
Elkington, J. (2004). Enter the triple bottom line. In: Henriques, A.; Richardson, J. (Ed.). The triple bottom line: does it all add up. London: EarthScan. http://dx.doi.org/10.4324/9781849773348
Farias, C., & Farias, G. (2010). Cycles of poverty and con-sumption: the sustainability dilemma. Competitiveness Review: An International Business Journal, 20, 248-257. http://dx.doi.org/10.1108/10595421011047433
Frederick, W. (1994). From CSR1 to CSR2. Business and Society. 33 (2), 150-164. http://dx.doi.org/10.1177/000765039403300202
Garrido, I. (2007). A Relação entre Orientação para o Mercado Ex-terior, Estratégias de Internacionalização e Performance Exportadora (Doctoral dissertation). Federal University of Rio Grande do Sul, Por-to Alegre, Rio Grande do Sul, Brazil. Retrieved April 10, 2012, from http://www.lume.ufrgs.br/handle/10183/8849.
GMOBRC - Global Membership Organization and Business Research of China. (2012). Business and Sustainability in China: Company Responses to a National Priority. Retrieved July, 15, 2012 from http://www.prnewswire.com/news-releases/sustainability-in-china-report-details-how-com-panies-are-responding-to-a-national-priority-135166818.html.
Goldstone, J. (1998). Initial conditions, general laws, path depen-dence, and explanation in historical sociology. American Journal of Sociology, 104, p. 829. http://dx.doi.org/10.1086/210088
Gond, J., & Matten, D. (2007). Rethinking the business-society in-terface: beyond the functionalist gap. ICCSR Research Paper Series, Nottingham University Business School, 47.
Gray, R., & Milne, M. (2002). Sustainability reporting: Who’s kidding whom? Chartered Accountants Journal of New Zealand, 81, 66-70.
Hansen, R. (2002). Globalization, embedded realism, and path depen-dence: the other immigrants do Europe. Comparative Political Studies, 35, 259-283. http://dx.doi.org/10.1177/0010414002035003001
Hoff, D. (2011). A história importa: proposta de estrutura analítica para o estudo de path-dependence. Ensaios FEE, 32 (1), 7-30. Re-trieved April 15, 2012 from http://revistas.fee.tche.br/index.php/en-saios/article/view/2401.
Hollensen, S. (2004). Global marketing. 3. ed. Harlow: Prentice Hall.Hopkins, M. (2005). Measurement of corporate social responsibility. International Journal of Management and Decision Making, 6(3), 213-231. http://dx.doi.org/10.1504/ijmdm.2005.006549
Hopkins, M. (2009). 8 Reasons Sustainability will change manage-ment. MIT Sloan Management Review, 27, 27-31. http://dx.doi.org/10.1016/b978-0-7506-7968-8.00003-x
Instituto Brasileiro de Geografia e Estatística – IBGE (2012). Re-trieved April 23, 2012 from http://www.ibge.gov.br/home/presiden-cia/noticias/noticia_visualiza.php?id_noticia=1703&id_pagina=1.
Jamali, D. (2010). The CSR of MNC Subsidiaries in Developing Coun-tries: Global, Local, Substantive or Diluted? Journal of Business Ethics, 93, 181–200. http://dx.doi.org/10.1007/s10551-010-0560-8
Konrad, A., Steurer, R., Langer, M., & Martinuzzi, A. (2006). Empiri-cal Findings on Business-Society Relations in Europe, Journal of Busi-ness Ethics, 63, 89-105. http://dx.doi.org/10.1007/s10551-005-7055-z
Kotabe, M., & Helsen, K. (2000). Administração de marketing global. São Paulo: Atlas.
Levine, M. (2008). China’s CSR Expectations Mature. China Business Review. Retrieved February 05, 2013 from http://www.chinabusiness-review.com/public/0811/.
Maehler, A. (2011). Transferência de conhecimento em multinacio-nais: uma análise multidimensional de casos de empresas brasileiras no mercado português. (Doctoral dissertation). Federal University of Rio Grande do Sul, Porto Alegre, Rio Grande do Sul, Brazil. Retrieved April 10, 2012, from http://www.lume.ufrgs.br/handle/10183/36722.
Málovics, G., Kanó, I., Imreh, S. (2011). Companies, Stakeholders and Corporate Sustainability – Empirical Insights from Hungary. In: Environmental Management Accounting and Supply Chain Manage-ment, 27, 131-150. http://dx.doi.org/10.1007/978-94-007-1390-1_6
Maon, F., Lindgreen, A., Swaen, V. (2010). Organizational Stages and Cultural Phases: A Critical Review and a Consolidative Model of Corporate Social Responsibility Development. International Journal of Management Reviews, 12, 20-38. http://dx.doi.org/10.1111/j.1468-2370.2009.00278.x
Maon, F., Swaen, V. (2009). Shaping the Processual View of CSR: A Multipartite Sensemaking-Sensegiving Conceptualization. Proced-ings of Academy of Management Conference, 7-11, Chicago, Illinois, U.S.A.
Munasinghe, M. (2007). Sustainomics and sustainable development. Retrieved April, 10, 2012 from http://www.eoearth.org/view/arti-cle/156371 Myllyvainio, S., Virkkala, N. (2006). Corporate Social Re-sponsibility: a concept under translation in China. Dept. of Business, Economics, Statistics and Informatics. Orebro University, Suécia.
141
J. Technol. Manag. Innov. 2015. Volume 10, Issue 3
ISSN: 0718-2724. (http://jotmi.org)Journal of Technology Management & Innovation © Universidad Alberto Hurtado, Facultad de Economía y Negocios.
Nakos, G., Brouthers, K. D. (2002). Entry Mode Choice of SMEs in Central and Eastern Europe. Entrepreneurship Theory and Practice, 27, 47-63. http://dx.doi.org/10.1111/1540-8520.271003
Nelson, R.; Winter, S. (1982). Introduction. In: _______. A evolution-ary theory of economic change. Cambridge: Harvard.OECD. (2001). Sustainable development: critical issues. Paris: OECD Publications.
Parente, J. (2004). Responsabilidade social no varejo: conceitos, estra-tégias e casos no Brasil. São Paulo: Saraiva.
Pun, N. (2003). The moral economy of capital: transnational codes of conduct and labour rights in China. Chinese University confer-ence Chinese Trade Unions and the Labour Movement in the Market Economy.
Santos, R. (2009) Relação entre Responsabilidade Social Corporativa e identidade de marca: uma abordagem ética. Universidade (UFU), Uberlândia, MG.
Shrivastava, P. (1995). Industrial / environmental crises and corporate social responsibility. The Journal of Socio-Economics, Netherlands, 24, 211-227, Springer. http://dx.doi.org/10.1016/1053-5357(95)90036-5
Steurer, R., Langer, M., Konrad, A., & Martinuzzi, A. (2005). Cor-porations, Stakeholders and Sustainable Development I: A Theorical Exploration of Business-Society Relations, Journal of Business Ethics, 61, 263-281. http://dx.doi.org/10.1007/s10551-005-7054-0
Steurer, R., & Konrad, A. (2009). Business-society relations in Cen-tral-Eastern and Western Europe: How those who lead in sustain-ability reporting bridge the gap in corporate (social) responsibili-ty. Scandinavian Journal of Management, 25, 23-36. http://dx.doi.org/10.1016/j.scaman.2008.11.001
Tenório, F., & Nascimento, F. (2006). Responsabilidade social empre-sarial: teoria e prática. 2. ed. Rio de Janeiro: Fundação Getúlio Vargas.
Vizeu, F., & Matites, Q. (2013). Organizational Sacralization and Discursive Use of Corporate Mission Statements. Brazilian Admin-istration Review, 10(2), 176-194. http://dx.doi.org/10.1590/s1807-76922013000200005
Wang, L., & Juslin, H. (2009). The impact of Chinese Culture on Corporate Social Responsibility: The Harmony Approach. Journal of Business Ethics, 88(3), 433-451. http://dx.doi.org/10.1007/s10551-009-0306-7
WCED - World Commission for the Environment and Development. (1987). Our Common Future, Oxford, Oxford University Press.
Yin, R. (2011). Qualitative Research from Start to Finish. New York: The Guilford Press.
Zadek, S. (2004). The path to corporate responsibility. Harvard Busi-ness Review, 82(12), 125-132.
Zhou, W. (2006). Will CSR Work in China? Leading Perspectives, CSR in the People’s Republic of China. Beijing, Business for Social Re-sponsibility, 5-7.
142
J. Technol. Manag. Innov. 2015. Volume 10, Issue 3
ISSN: 0718-2724. (http://jotmi.org)Journal of Technology Management & Innovation © Universidad Alberto Hurtado, Facultad de Economía y Negocios.
Emprendimiento en la Tercera Edad: Una Revisión de la Situación Actual
Felipe Oelckers 1*
Abstract: A medida que la población envejece, los países han empezado a comprender la importancia del emprendimiento de la tercera edad como un mecanismo para extender la vida laboral, aumentar los ingresos y generar nuevas oportunidades, a fin de mantener a los adultos mayores activos, situación que significa, a su vez, un menor peso para la carga fiscal del país.
Este trabajo tiene como objetivo hacer una revisión de la literatura sobre el emprendimiento en la tercera edad, analizar las oportunidades y los obstáculos que enfrenta este creciente sector de la población. Asimismo, se exploran las razones y condiciones que determinan las causas por las que este fenómeno llegará, con el paso del tiempo, a tener una mayor importancia en la sociedad chilena.
Keywords: tercera edad, oportunidades, emprendimiento, barreras, envejecimiento, población.
Abstract: As the population ages and the retirement age increases, countries have begun to realize the importance of senior entrepreneurship, as a means to extend the working age, increase income for the elder, especially those with low pensions and to generate opportunities to keep this people economically active.
This paper aims to review the literature of elderly entrepreneurship, analyzing the opportunities and obstacles being faced by this sector of the population. The reasons and conditions that have made this phenomenon increasingly important to our society in Chile are also explored.
Keywords: Third age, opportunities, entrepreneurship, barriers, aging, population.
Introducción
Existen un sinnúmero de antecedentes que indican que la población mundial está envejeciendo (OECD, 2012). Entre los años 2000 y 2050 la proporción de la población mundial con más de 60 años de edad se duplicará, pasará de aproximadamente el 11% al 22% (OMS, 2012). Sin perjuicio de lo anterior, se espera que el número de personas de 60 años o más, aumente de 605 millones a 2000 millones en ese mismo periodo (OMS, 2012). Por otro lado, tanto en países desarrollados, como algunos en desarrollo, las tasas de natalidad han empezado a reducirse en forma muy rápida y las expectativas de vida han aumentado (Weber y Schaper 2004). En diversos países del mundo, tales como Italia y Japón, entre otros, existe una amplia población de adultos mayores dependientes de personas que pagan impuestos para sus pensiones (OECD, 2012).
De este modo, el aumento de la expectativa de vida en las economías desarrolladas, ha tensionado los recursos fiscales de las naciones (OECD 2001; OECD 2006). De hecho, los estados han tenido que realizar una serie de reformas para extender la edad de retiro y traspasar la responsabilidad y financiamiento de la jubilación a las propias personas (Wainright y Kibler, 2013). Actualmente en el Reino Unido, se ha hecho el ejercicio de calcular el ingreso a percibir bajo la hipótesis que cada adulto mayor retrasara su jubilación y trabajara
un año más. El resultado obtenido fue una especial contribución a la economía británica del orden de 13 billones de libras esterlinas (BIS, 2011). Ante este escenario, las personas de la tercera edad y adultos mayores emprendedores, tendrán un rol muy significativo en las actividades económicas del futuro (OECD, 2012). Los estudios realizados por Zhang (2008), concluyeron que los emprendedores de la tercera edad se jubilan más tarde que los empleados dependientes del mismo grupo etario. De hecho, el emprendimiento en adultos mayores ha estado desde hace muy poco tiempo concebido como políticas sociales y públicas destinadas a potenciar el desarrollo de nuevos ingresos económicos, cuando las pensiones son limitadas y existen escasas oportunidades para participar en el mercado laboral. (Webster y Walker 2005; Kautonen, 2012). Estas políticas pueden constituir un potencial remedio para enfrentar el proceso de envejecimiento acelerado de la población. (Maestas y Zissimopoulos, 2010).
Cabe destacar, asimismo, que los adultos mayores deben enfrentar una serie de barreras para lograr emprender (Loretto, 2010, Semana 2013). Actualmente, la edad y el estado de salud, constituyen elementos que están afectado negativamente las actividades empresariales de los adultos mayores (Kibler et al., 2011). Además, estas personas tienen numerosas probabilidades de experimentar discriminación por su edad en el momento de generar actividades empresariales (Dibden
Submitted April 23rd 2015 / Approve October 7th 2015
1 Escuela de Negocios, Universidad Adolfo Ibáñez, Viña del Mar, Chile, *Email: [email protected]
143
J. Technol. Manag. Innov. 2015. Volume 10, Issue 3
ISSN: 0718-2724. (http://jotmi.org)Journal of Technology Management & Innovation © Universidad Alberto Hurtado, Facultad de Economía y Negocios.
y Hibbett, 1993). Cabe agregar que la proporción de adultos mayores que están comenzando un emprendimiento, constituye la mitad de los jóvenes en la misma situación (Hart et al., 2004; Kautonen 2008) y el panorama empeora en comparación con el adulto mayor femenino (Mckay, 2001; Kautonen 2012; OECD 2012).
Por otro lado, en Australia, alrededor de un tercio de los dueños de empresas tienen 50 años o más y su número aumenta cada año, situación que contrasta con personas de menores edades. Este fenómeno ocurre también en forma evidente en muchos otros países del mundo (Weber y Schaper, 2004). De hecho, estudios desarrollados por Kautonen et al. (2009) concluyeron que los adultos mayores poseen más habilidades técnicas y administrativas que los emprendedores jóvenes. Además, las personas mayores, tienen los beneficios de la experiencia laboral (Kibler et al., 2011), situación que les permite enfrentar de mejor manera los problemas propios de un nuevo negocio. En efecto, es posible encontrar en ellos un profundo conocimiento de una industria, situación que normalmente no poseen los jóvenes. Lo anterior puede ayudar a la persona a identificar las brechas para crear nuevos negocios y aprovechar una oportunidad. (Kautonen, 2012). Sin embargo, numerosos adultos mayores en países desarrollados deciden no emprender, en consideración a que los beneficios estatales vinculados a ingresos por jubilación son suficientemente buenos. Dicha situación provoca desincentivos a desarrollar un negocio, perdiendo el conocimiento, la experiencia y el talento desarrollados en años anteriores (Halabisky 2012).
Por esta razón, entender y analizar el fenómeno expuesto y diseñar políticas públicas que apoyen el emprendimiento para este grupo etario, constituye un enorme reto que podrán enfrentar los países en los próximos años (Weber y Schaper, 2004). De hecho, la falta de datos empíricos (Kautonen, 2008) en esta área hace que las investigaciones del emprendimiento de personas de la tercera edad se manifieste como una motivación y un desafío para la investigación.
Envejecimiento de la población en Chile y empeoramiento de las condiciones económicas
Chile es el segundo país más envejecido de Latinoamérica, después de Uruguay (Canals, 2012). Actualmente el 15,6% de la población son considerados adultos mayores y para el año 2025 se espera que sean más del 20% (Senama, 2013). Hoy en día, el 57% de los adultos mayores se encuentran en calidad de jubilados y muchos de ellos aún están en condiciones de autovalencia física y cognitiva para seguir económicamente activos (Senama, 2013). La gran mayoría de los adultos mayores jubilados en Chile obtienen sólo un tercio de los ingresos que percibían en su vida laboral activa (Senama, 2011). Muchos de ellos se encuentran en desventaja económica, puesto que antes de cumplir la edad de jubilar los deponen de sus trabajos, entrando en situación de pobreza (Loretto, 2010). De hecho, en Chile la discriminación de edad, impide a estas personas las posibilidades de acceder a créditos o desarrollar un trabajo dependiente (Kornfeld, 2013).
El desarrollo del emprendimiento, podría constituir en Chile una buena alternativa para contrarrestar la falta de oportunidades
laborales en los adultos mayores. Sin embargo, el emprendimiento del adulto mayor no ha sido considerado en este país como una política pública clave a pesar de que el Estado promueve la actividad emprendedora.
La solución expuesta, además de potenciar el emprendimiento en el adulto mayor, permitiría contener por sobre la línea de pobreza a aquellas personas que tienen bajas pensiones o bien que no tienen una jubilación.
Vista la preponderancia que tendrá en el futuro este grupo etario en la sociedad chilena, considerar el emprendimiento del adulto mayor y fortalecer su desarrollo adquiere vital importancia como alternativa viable, no solo para el mejorar los ingresos y calidad de vida de las personas mayores, sino también, con el objeto de apoyarlos en el cambio psicológico que experimentan al sentirse valiosos y útiles a la sociedad, aportando sus conocimientos y experiencia al encontrar nuevamente un sentido para sus vidas.
Revisión de Literatura
Definición de emprendedor de la tercera edad
Arkebauer (1995) establece que los emprendedores de la tercera edad son aquellos que tienen sobre 50 años y más, y que poseen algún negocio sin importar su tamaño. Por otro lado, Baucus y Human (1994) se refieren a emprendedores de la tercera edad como aquellos que han emprendido negocios con más de 50 años, excluyendo los negocios generados en el pasado. A su vez, Blackburn et al. (2000) han definido a los emprendedores de la tercera edad, como individuos que operan un negocio con edad entre 50 y 75 años y que además hayan fundado el negocio con 50 años o más. En general, en investigaciones más recientes, este término se refiere a individuos con 50 años o más, que están en el proceso de comenzar un negocio o ya han comenzado uno (Kautonen, 2012). Sin embargo, no existe una definición absoluta y para efectos de este trabajo se tomará como emprendedores de la tercera edad en Chile, a aquellas personas que están activamente tratando de comenzar un negocio, han comenzado uno o bien son auto empleados (Levie, 2014) con 60 años o más.
En la literatura actual, se han identificado los siguientes temas para explicar las principales líneas de investigación que se han desarrollado para estudiar el fenómeno del emprendimiento del adulto mayor: Ambiente cultural y contexto emprendedor (Weber y Schaper, 2004; Kautonen,et al.,2009; Pilkova, el al.,2014); Acceso financiero y otros recursos (Hart et al., 2004; Kibler et al., 2011), Barreras para emprender (Curran y Blackburn, 2001; Singh y DeNoble, 2003, Levesque y Minniti, 2006; Kautonen et al., 2011; Kibler, et al., 2011, Kibler et al., 2012, Kautonen, et al., 2013), Capital humano (Singh y DeNoble, 2003; Weber y Schaper, 2004), Capital social (Baucus y Human, 1994; Singh y DeNoble, 2003; Kautonen, 2012), Historia de carrera (Baucus y Human, 1994; Kautonen et al., 2010), Emprendimiento femenino (McKay, 2001; Kautonen, 2008; Kautonen, 2012), Innovación (Botham y Graves, 2009; Colovic y Lamotte, 2012) Jubilaciones y emprendimiento (Wainright y Kibler,
144
J. Technol. Manag. Innov. 2015. Volume 10, Issue 3
ISSN: 0718-2724. (http://jotmi.org)Journal of Technology Management & Innovation © Universidad Alberto Hurtado, Facultad de Economía y Negocios.
2014), Motivaciones para emprender (Weber y Schaper, 2004; Kautonen et al., 2008; Kibler et. al., 2012, Kautonen et al., 2013) y finalmente Políticas Públicas (Kautonen, 2012; Halabisky 2012) A su vez, dado que cada una de las diferentes líneas de investigación descritas toman distintas perspectivas, se ha decido hacer una clasificación que aborda temas más amplios, con el fin de estudiarlos en mayor profundidad y claridad. A continuación se procederá a explicar cada una de estas materias.
1. Factores que están potenciando el emprendimiento de la tercera edad.
Motivación, predisposición y desarrollo innovador.Debido a los cambios socio-demográficos que se están generando, los adultos mayores están presionados “push” o bien atraídos “pull” a emprender. En relación al factor “push” los adultos mayores se ven presionados a emprender por varias razones: se encuentran desempleados, no pueden obtener beneficios sociales, tienen bajas pensiones, existe disconformidad laboral o bien tienen bajos salarios (Webster y Walker, 2005). De acuerdo a estudios desarrollados por McClelland et al. (2005) las personas a medida que envejecen van cambiando sus valores y visión de la vida, sumado a la insatisfacción con su actual situación laboral y la falta de oportunidades en el mercado laboral, genera la decisión de embarcarse en un emprendimiento por necesidad.
Por otro lado, existen factores “pull” que atraen a los adultos mayores a desarrollar un negocio. Estas causas son múltiples y de variado contenido, tales como: encontrar una oportunidad, buscar independencia, dejarle una herencia a sus hijos, flexibilidad laboral y ser su propio jefe (Karoly y Zissimopoulos, 2004; Webster y Walker, 2005). Estudios empíricos sobre la predisposición a emprender por parte de adultos mayores concluyen, que esta depende de la experiencia y carrera laboral desarrollada (Weber y Schaper, 2004). Haber tenido experiencia emprendedora o en actividades de gestión empresarial ocasiona que la predisposición a comenzar un negocio sea mayor (Kautonen et al., (2010). Lo dicho se confirma con estudios realizados también por Kautonen et al. (2013) al concluir que la relación entre la edad y el compromiso de los adultos mayores para emprender depende en gran medida del historial de la carrera desarrollada en el pasado.
Si consideramos estudios empíricos, podemos afirmar que estos han concluido que el emprendimiento del adulto mayor no necesariamente está relacionado con emprendimientos innovadores (Pilkova et al., 2014), pero efectivamente constituye una opción válida para aumentar las pensiones, extender la vida laboral y contrarrestar la falta de oportunidades laborales (Kautonen, et al., 2008). Aunque muy poco extendida e investigada, la capacidad de innovación de la tercera edad aún no es una fuente importante de creación de nuevos negocios, pero en el futuro se espera que sea un significativo factor para potenciar el emprendimiento en este grupo etario (Botham y Graves, 2009).
El emprendimiento como una alternativa a una pensión insuficiente.De acuerdo con Wainwright y Kibler (2013), el emprendimiento de la tercera edad tiene un particular interés de complementar las bajas pensiones, o bien, proveer de alguna renta adicional cuando no se cuenta con una jubilación adecuada. Este nuevo modelo se explica a partir de un retiro híbrido, donde las personas además de recibir una jubilación, en el caso de que la tengan, obtienen un ingreso a partir de un emprendimiento desde sus propios hogares (Clark, Munnell y Orszag, 2006; Wainwright y Kibler, 2013).
Es así como el emprendimiento del adulto mayor pasa a ser un modelo de retiro, principalmente a personas de la tercera edad que tienen bajas pensiones, debido a la dificultad de ahorro en el pasado por sus bajos salarios y también al escaso conocimiento financiero. (Munnel, Sunden y Taylor, 2002). Cabe agregar, que en el caso de aquellas personas que poseen mejores salarios y lograron ahorrar más durante su vida laboral activa, la volatilidad de los mercados financieros no aseguran tampoco un ingreso adecuado en el largo plazo (Froud et al., 2002). Por tanto, este modelo logra tener aún más sentido (Wainwright y Kibler, 2013).
Capital humano, social y acceso a recursos financieros.La personas de la tercera edad, sin duda, poseen los beneficios de contar con experiencia laboral, buenas habilidades administrativas y técnicas para poder emprender (Singh y DeNoble, 2003; Weber y Schaper, 2004; Kautonen et al., 2008). Los adultos mayores y con experiencia emprendedora desarrollada en el pasado tienen más posibilidades de comprometerse con nuevos emprendimientos en comparación a adultos mayores que trabajaron en actividades con bajos sueldos y que requerían poca preparación y habilidades (Fuchs, 1982; Kautonen et al., 2010).
Por otro lado, investigaciones confirman que el capital social está fomentando el emprendimiento de la tercera edad (Pilkova et al., 2014). Los adultos mayores que poseen en general amplias redes de contacto pueden facilitar y ayudar para el desarrollo y operación de un nuevo negocio (Bacus y Human, 1994; (Bruin y Firkin, 2001). Sin embargo, las redes para los adultos mayores empiezan a declinar con el tiempo en la medida que las personas se van retirando (Botham y Graves, 2009).
Singh y DeNoble (2003) en sus investigaciones concluyeron que los recursos financieros acumulados durante la vida laboral pueden materializarse en una fuente importante de ingresos destinados al apoyo de emprendimientos en etapas tardías. En la medida que las personas envejecen, aumenta la disposición a tomar más riesgos principalmente financieros puesto que ya no tienen hijos dependientes en materia económica (Kiber et al., 2011). Además hay estudios concluyentes respecto a que los adultos mayores de países desarrollados con recursos financieros logran mayor compromiso para desarrollar emprendimientos (Webster y Walker, 2005; Singh y DeNoble, 2003; Kibler et al., 2011).
145
J. Technol. Manag. Innov. 2015. Volume 10, Issue 3
ISSN: 0718-2724. (http://jotmi.org)Journal of Technology Management & Innovation © Universidad Alberto Hurtado, Facultad de Economía y Negocios.
El contexto del emprendedor y las instituciones relacionadas.El contexto emprendedor y las instituciones cumplen un rol muy importante en el desarrollo del emprendimiento de la tercera edad (Mrva y Stachova, 2014, Pilkova et al., 2014). La teoría de instituciones, de acuerdo con North (1990), representa las reglas de juego en una sociedad y determinan las acciones que desarrollan los agentes en una economía. De acuerdo con North (1990), existen dos tipos de instituciones: las formales e informales. El primer concepto tiene relación con las leyes, el marco legal y jurídico que regula la conducta social. El segundo concepto se refiere al ambiente social que tiene relación con las limitaciones originadas en la sociedad que son parte de la cultura.
En relación a las instituciones formales, estudios de Pilkova et al. (2014) concluyeron que existen diferencias significativas entre los países del este de Europa que poseen altos niveles de emprendimiento de la tercera edad y aquellos países que no lo poseen, fundamentalmente por las instituciones que apoyan este fenómeno. Las políticas concretas de soporte vienen dadas por apoyar en áreas relacionada con la burocracia e impuestos para la puesta en marcha de un negocio (Pilkova et al., 2014).
Investigaciones realizadas por Kautonen et al. (2009) sobre el ambiente social, concluyeron que este factor juega un rol muy importante para potenciar el emprendimiento en la tercera edad. Es así como el entorno familiar y de los amigos más cercanos pueden facilitar o bien obstaculizar el proceso de puesta en marcha de un negocio. Los ambientes de familiares y amigos que han tenido experiencia emprendedora pueden apoyar y fomentar el desarrollo emprendedor en la tercera edad (Kautonen et al., 2009). Varios estudios sobre la cultura y el emprendimiento del grupo etario que es materia de este trabajo, confirman que la apertura cultural de una sociedad hacia los adultos mayores tiene efectos positivos para que estas personas logren involucrarse en actividades emprendedoras (Weber y Schaper, 2004; Kautonen et al., 2011).
Envejecimiento activo y educación emprendedoraEste tema posee gran importancia, al punto que la Comisión Europea declaró el 2012 como el año del envejecimiento activo. De acuerdo con investigaciones de Kibler et al. (2012), las personas de la tercera edad buscan un envejecimiento dinámico, siendo el emprendimiento una herramienta que les permite tener un balance de trabajo, ingresos y tiempo libre. De acuerdo con Kibler et al. (2012), la búsqueda de este equilibrio se manifiesta fundamentalmente en dos aspectos: individual y social. El primero tiene relación con la identidad personal de mantenerse con actividades que los mantengan ocupados, generar ingresos para complementar la pensión y desarrollar sus propios intereses para promover sus valores personales en los productos o servicios que venden o que podrían vender. El segundo, se refiere a compatibilizar las responsabilidades empresariales con custodia de nietos, cuidados a familiares enfermos y voluntariado.
A su vez, este concepto se vincula con la educación emprendedora que ha empezado a tener cada vez más importancia. De acuerdo con Fernández y Rey (2010), se está asentando una estrategia política
y legislativa que determina con claridad el valor del fomento del espíritu emprendedor. Se refiere a que dicha política sería apta para incorporar la cultura emprendedora desde el principio de la educación hasta los últimos eslabones del sistema educativo, sin ignorar tampoco a los adultos mayores (Fernández y Rey, 2010).
2. Barreras que afectan al emprendimiento del adulto mayor
Envejecimiento y discriminación por edad: un problema en aumentoSegún Kibler et al. (2011), la edad es una de las barreras más importantes que afectan el desarrollo empresarial en la tercera edad. Según estudios desarrollados por Weber y Schaper (2004); Kautonen et al. (2009); McKay (2011) para muchos emprendedores adultos mayores, la edad no es una barrera para emprender, ya que muchos se sienten más jóvenes de lo que realmente son, sin embargo, perciben una discriminación de edad, como una barrera externa a ellos, que los dificulta para tener un emprendimiento. Esta discriminación de edad no ocurre en forma abstracta, ya que acontece en forma muy directa. (Kibler et al., 2011). Estudios desarrollados por Kautonen (2012) concluyen que la sociedad aún mantiene la percepción que los adultos mayores no deben involucrarse en actividades económicas y laborales. Además, son vistos como menos flexibles, menos comprometidos y menos capaces de hacer frente a cambios tecnológicos. Estudios realizados por Kibler et al. (2012) establecieron que algunos clientes cuestionan las habilidades de los adultos mayores para proveer de bienes y servicios debido a la edad. Este hecho es percibido por ellos como impedimento para aprovechar oportunidades y desarrollar un negocio (Kibler et al., 2012). La referida situación empeora en el colectivo de adultos mayores femenino. Actualmente, existen muy pocos emprendimientos de la tercera edad desarrollado por mujeres (Halabisky, 2012). Los estudios realizados por McKay (2001) concluyen que la sociedad aún mantiene la idea de que las mujeres de la tercera edad deben estar involucradas en el cuidado de los miembros de la familia, más que en la terea de emprender. De hecho, McKay (2001) concluye que las responsabilidades de cuidados familiares tienen un efecto importante en los emprendimientos de las adultas mayores, tanto en la fase de fundación de la empresa como en etapas posteriores. Según estudios de Hart et al. (2004) las mujeres de la tercera edad tienen menos posibilidades de emprender en comparación a los adultos mayores hombres.
Capital humano, social y acceso a recursos financieros.Generalmente, aquellos adultos mayores que comienzan con actividades emprendedoras lo hacen en negocios relacionados con los trabajos remunerados hechos en el pasado (Halabisky, 2012). Sin embargo, enfrentan problemas de escasez de habilidades emprendedoras para superar etapas preliminares de un negocio (Kautonen, 2012). Además, en algunos casos, sus habilidades están obsoletas y tienen dificultades para desarrollarse profesionalmente, especialmente al no poder utilizar las nuevas tecnologías. (Kadefors, 2011). Estudios han demostrado que el tipo de trabajo que haya desarrollado una persona, durante su vida activa, determinará si puede llegar a ser un emprendedor de la tercera edad y adquirir nuevas habilidades y conocimientos (Kibler et al., 2012).
146
J. Technol. Manag. Innov. 2015. Volume 10, Issue 3
ISSN: 0718-2724. (http://jotmi.org)Journal of Technology Management & Innovation © Universidad Alberto Hurtado, Facultad de Economía y Negocios.
De acuerdo a investigaciones de Kautonen (2012), el legado de una cultura de trabajo tradicional parece formar una barrera para un comportamiento más emprendedor. Los hombres que tuvieron puestos de trabajo de industria tradicional y que se sentían orgullosos de tenerlos, son muy reacios a aceptar nuevos tipos de trabajo o emprender una nueva actividad. Este hallazgo coincide con investigaciones previas, en que el historial de carrera de un individuo tiene un impacto significativo en la probabilidad de reinventarse para ser empresario en una edad mayor. (Fuchs, 1982; Kautonen et al, 2010)
Cabe mencionar que estudios empíricos desarrollados por Kibler et al. (2011) han concluido que el capital social es una barrera para poder emprender. En efecto, los adultos mayores que se encuentran jubilados manifiestan dificultades para el desarrollo de nuevas redes de contactos, principalmente cuando proyectan un pequeño negocio desde sus casas. Sin perjuicio de lo anterior, se presenta el interesante desafío para desarrollar nuevas habilidades sociales, diferentes a las conocidas en el pasado (Halabisky, 2012), principalmente cuando el emprendimiento tiene un giro diferente a la actividad laboral desarrollada en el último trabajo. Esto se complica aún más, cuando las redes de contactos quedan obsoletas porque los individuos han pasado mucho tiempo desempleados o jubilados (Kibler et al., 2012). De acuerdo con Kibler et al. (2011), las barreras que enfrentan los adultos mayores para conseguir recursos financieros para comenzar un negocio no son sustancialmente diferentes en comparación con otros emprendedores. Según Kautonen (2008), el acceso a recursos financieros se hace mucho más complejo para aquellos adultos mayores que están desempleados o que reciben bajas pensiones en comparación a individuos de la tercera edad que están trabajando y que además reciben una buena jubilación (Kautonen, 2012). Además, existen adultos mayores que poseen una posición financiera bastante más sólida por haber acumulado riquezas durante su vida, situación que los deja en la buena posición de prescindir de fuentes de financiamiento externas, aunque este no es el caso más común en personas que viven en economías emergentes. (Kibler et al., 2012)
Salud, costo de oportunidad del tiempo y desincentivos financierosA medida que las personas envejecen, como situación obvia, la salud comienza a deteriorase. Este fenómeno impacta los estilos de vida y obstaculiza los deseos de comenzar un negocio. Weber y Schaper (2004) concluyeron que los adultos mayores poseen bajos niveles de salud y energía para poder emprender. Además Singh y DeNoble (2003) logran establecer que cuando las personas envejecen y se les complica la salud, las actividades de ocio se vuelven más atractivas, afectado la motivación y predisposición a comenzar un negocio. Por otro lado, en muchos países se está introduciendo un seguro por enfermedad que permita romper con esta barrera. Dicha solución disminuye el temor de enfermarse y la inseguridad que surge frente a la posibilidad de ser incapaz de dar cumplimiento a los pagos que demande el negocio.
Interesante resulta mencionar que estudios realizados en algunos países desarrollados han demostrado que los adultos mayores se encuentran menos dispuestos y comprometidos a desarrollar
actividades que den resultados a futuro o a plazo (Halabisky, 2012). Ellos prefieren realizar en esta etapa de sus vidas una mayor cantidad de actividades de ocio y valoran menos los beneficios que se pueden generar en el futuro en consideración a la incertidumbre de cosechar esos nuevos recursos (Levesque y Minniti, 2006). La situación se complica, aún más, cuando los beneficios estatales vinculados a ingresos por jubilación puede desincentivar a los adultos mayores a emprender. Lo anterior ocurre cuando un negocio puede no ofrecer suficientes ingresos en comparación con lo que se podría percibir por jubilación. (Halabisky, 2012).
Estudios realizados por Kibler et al. (2011) indican que las personas mayores temen perder sus beneficios sociales o de pensiones si obtienen ingresos en un negocio. Estudios de la Comisión Europea (2012) demuestran que el 59 % de los adultos mayores de la Unión Europea, creen que no es beneficioso seguir trabajando más allá de los 55 años, debido a los beneficios del sistema de pensiones. De igual forma, estudios realizados por de Singh y DeNoble (2003) concluyeron que aquellos adultos mayores que disponen de altos niveles de recursos y riquezas, tienen menos interés de emprender, presentándose la riqueza como un desincentivo al emprendimiento.
Contexto emprendedor y las instituciones relacionadas. De acuerdo a información de Halabisky (2012), una cantidad considerable de adultos mayores han pasado su vida completa trabajando en organizaciones e instituciones para recibir un sueldo, sin haber tenido conciencia de las oportunidades que se ofrecen para emprender.
Según Kibler et al. (2012), los adultos mayores tienen un enorme desafío en acceder a la información para desarrollar un negocio. Esto se debe a que dichos individuos no entienden la información publicada por los diferentes sitios gubernamentales o agencias de apoyo al emprendimiento, señalando que la información está destinada más bien a jóvenes emprendedores que a adultos mayores (Kibler et al., 2012). A su vez, de acuerdo a investigaciones realizadas por Kautonen (2012), los emprendedores de la tercera edad piden más claridad en las regulaciones a sus negocios, junto con mayor flexibilidad laboral y algunas reglas tributarias que sirvan como apoyo y no como barreras para poder crear y hacer crecer un negocio. De igual forma, y de acuerdo con Kibler et al. (2011), los adultos mayores no entienden los aspectos legales que les permite generar un negocio, de tal forma que deben solicitar más apoyo por parte de instituciones del Estado.
Cabe mencionar, de acuerdo con Kautonen (2008), que en ambientes sociales donde nunca ha existido experiencia emprendedora es probable que se presente una gran barrera para realizar un negocio. Según dicho autor, los emprendedores de la tercera edad, en múltiples oportunidades, sienten gran inseguridad sobre sus ambiciones empresariales cuando los amigos y la familia constantemente les aconsejan que la idea de iniciar un negocio es demasiado arriesgada. Los resultados de estas opiniones negativas, incluyendo la falta de apoyo financiero, social y la extensión del proceso para concretar el negocio, ocasionan que los adultos mayores renuncien a la idea de emprender.
147
J. Technol. Manag. Innov. 2015. Volume 10, Issue 3
ISSN: 0718-2724. (http://jotmi.org)Journal of Technology Management & Innovation © Universidad Alberto Hurtado, Facultad de Economía y Negocios.
De acuerdo con Kautonen et al. (2009) un número considerable de emprendedores de la tercera edad trata de solucionar esta situación , refugiándose en nuevos amigos y en redes de contactos con el fin de obtener el apoyo emocional y la seguridad para llevar adelante una idea de un negocio.
Educación emprendedora. Estudios realizados por Baucus y Human (1994) confirman que el apoyo a negocios de los adultos mayores puede ser de gran ayuda para la superación de ciertas barreras, principalmente para aquellos emprendedores de la tercera edad que lo hacen por primera vez y que no cuentan con un ingreso estable y están en situación de vulnerabilidad social y pobreza. Sin embargo, Kautonen (2012) concluye que, a pesar que numerosos emprendedores de la tercera edad sienten que poseen los conocimientos y habilidades para llevar adelante un negocio, mencionan que es muy difícil contar con buenos mentores y coachers. La falta de buenos mentores que conozcan la realidad propia de los adultos mayores constituye una lamentable barrera para emprender (Kautonen, 2012).
3. Las asimetrías de condiciones entre adultos mayores y jóvenes en el emprendimiento.Para comenzar este apartado, es necesario explicar el significado de la comparación entre emprendedores de la tercera edad con su contraparte más joven. Hart et al. (2004), denomina “prime age” a emprendedores que poseen entre 20 y 49 años y “third age” a emprendedores de la tercera edad que poseen 50 años y más. Preliminarmente, se podría decir que cuando se comparan ambos grupos, el emprendimiento de la tercera edad podría visualizarse como una situación de poca importancia, sin embargo, este fenómeno no es marginal (Kautonen, 2009).
De acuerdo a diferentes estudios llevados a cabo por investigadores que compararon ambos grupos, se concluyó que existen diferencias sustanciales en varios aspectos, los cuales se describen a continuación. (Hart et al., 2004; Weber y Schaper, 2004; Kautonen, 2008; Kibler et al., 2011)
Motivación, predisposición y desarrollo innovador.Estudios evidencian que la proporción de adultos mayores que están comenzando un negocio es la mitad en comparación a los jóvenes (Hart et al., 2004; Kautonen, 2008). Con dicho antecedente, se puede concluir que los emprendedores de la tercera edad, tienen menos motivación y predisposición para emprender (Curran y Blackburn, 2001; Hart et al., 2004). Sin embargo, la tasa de sobrevivencia en el largo plazo de un negocio fundado por emprendedores de la tercera edad, es mayor en comparación a su contraparte joven (Cressy y Storey, 1995). Estudios realizados por Kautonen y Luoto (2008) concluyeron que, después de 5 años, el 70% de los negocios creados por adultos mayores se mantenían operando, mientras que aquellos fundados por jóvenes llegaban sólo al 28%. Esta situación se explica, porque en la medida que las personas envejecen aumentan sus competencias y habilidades emprendedoras, pero la motivación tiende a decaer. (Rotefoss y Kolvereid, 2005).
Resulta importante afirmar que estudios realizados por Colovic y Lamonette (2012) sobre innovación establecieron que los adultos
mayores son menos innovadores que su contraparte joven, esto referido tanto en innovación de productos como en innovación de procesos. Dicha situación se explica fundamentalmente porque los individuos de la tercera edad tienen problemas cognitivos que reducen la habilidad para crear productos innovadores, adoptar nuevas tecnologías y seguir capacitándose. De acuerdo con Botham y Graves (2009), los adultos mayores que innovan menos están en desventajas para crear nuevos negocios. Esta falta de innovación puede afectar el éxito de los negocios en el largo plazo. (Colovic y Lamonette, 2012)
Capital humano, social y acceso a recursos financierosEstudios desarrollados por Weber y Schaper (2004) y Kautonen et al. (2008) concluyeron que los adultos mayores poseen más habilidades técnicas y administrativas que los emprendedores jóvenes. Por otra parte, las personas de más edad tienen los beneficios de la experiencia laboral que les permite enfrentar los problemas de mejor manera en comparación a personas no familiarizadas con habilidades de negocios (Kibler et al., 2011). Asimismo, el profundo conocimiento de una industria, que no poseen los jóvenes, puede ayudar a la persona a identificar las brechas para crear nuevos negocios (Kautonen, 2012).
Sin embargo, de acuerdo a estudios de Botham y Graves (2009), el riesgo para las personas mayores en la creación de una empresa puede ser objetivamente mayor en comparación a los jóvenes. Si el negocio llega a fracasar, estas personas tienen menos tiempo y oportunidades de empleo para contrarrestar las pérdidas del negocio, adquirir nuevas habilidades, reinventarse laboralmente y generar una fuente alternativa de ingresos (Roberts, 1991). Los jóvenes se apegan menos a los negocios, ya sea vendiéndolos o cambiando de giro, generándose una reinvención laboral y de capital humano en consideración a que tienen más tiempo para restablecerse en algún negocio posterior (Hart et al., 2004).
Por otro lado, en comparación con su contraparte más joven, los emprendedores de la tercera edad poseen redes de contactos más desarrolladas, las cuales han sido acumuladas en una buena cantidad durante su carrera laboral (Kibler et al., 2012). Estas mismas redes pueden, posteriormente, ser empleadas en sus propios negocios. Estudios desarrollados por Kibler et al. (2012) descubrieron que los emprendedores de la tercera edad que utilizan el capital social adquirido de un trabajo anterior tenían menos dificultades para iniciar y administrar su empresa, situación que no se presenta con los jóvenes emprendedores.
Un tema fundamental que aparece en la literatura, independiente del tipo de emprendimiento que se establezca, se refiere al adecuado apoyo o presencia de capital para la formación de un negocio. (Blanchflower y Oswald, 1998; Lussier y Pfeifer, 2001). De acuerdo con Kibler et al. (2011), los adultos mayores enfrentan las mismas dificultades para conseguir recursos financieros en comparación con emprendedores más jóvenes. Sin embargo, en países desarrollados existen adultos mayores que poseen una posición financiera bastante más sólida que los emprendedores jóvenes, en consideración a las riquezas acumuladas durante su vida, que facilitan la formación de un negocio (Parker, 2001).
148
J. Technol. Manag. Innov. 2015. Volume 10, Issue 3
ISSN: 0718-2724. (http://jotmi.org)Journal of Technology Management & Innovation © Universidad Alberto Hurtado, Facultad de Economía y Negocios.
Contexto emprendedor e impacto económicoDe acuerdo a estudios realizados por Pilkova et al. (2014), se evidencia que la burocracia pública y carga fiscal vía impuestos podría tener un efecto más fuerte en desalentar la actividad emprendedora en la tercera edad, en comparación con la población más joven. Esta situación puede ser causada por una menor capacidad de las personas mayores de adaptarse a los entornos cambiantes y superar las barreras burocráticas estatales (Weber y Schaper, 2004).
Interesante es tener presente que investigaciones realizadas por Zhang (2008) establecen la existencia de altas tasas de autoempleo en adultos mayores, que contribuyen en forma importante al crecimiento económico. A su vez, los estudios de Curran y Blackburn (2001) concluyeron que los emprendedores de la tercera edad contribuyen en menor medida a la creación y contratación de empleo y, si esto llega a suceder, lo concretan en menor número de personas en relación a emprendedores más jóvenes. Lo expresado se vincula directamente con estudios realizados por Kautonen et al. (2013) que confirman el aserto que las personas mayores son más propensas a auto emplearse en comparación a su contraparte más joven.
Salud y niveles de educaciónEn relación a la salud y bienestar, estudios concluyeron que los adultos mayores tienen mayores desafíos que su contraparte joven para emprender, principalmente por los bajos niveles de energía y problemas de salud (Weber y Schaper, 2004). Estos factores perjudican notablemente el emprendimiento debido a que generan dificultades para las personas de la tercera edad cuando se trata de entregar el esfuerzo y la energía destinadas a hacer surgir sus negocios (Staudinger, 1999).
Weber y Schaper (2004) señalan que los adultos mayores poseen niveles de educación más bajos en relación a emprendedores jóvenes. Según Parker (2004), los emprendedores de la tercera edad no necesariamente buscaron un grado universitario para emprender. Este argumento en general puede estar afectando niveles más bajos de educación, principalmente para aquellos emprendedores de la tercera edad que comenzaron sus primeros negocios en forma muy temprana y que ya se encuentran establecidos. (Kautonen, 2008)
4. Programas de fomento y apoyo al emprendimiento del adulto mayor.De acuerdo con esta investigación, cada día en el mundo existen nuevos programas para potenciar el emprendimiento del adulto mayor y ayudar a generar nuevas fuentes de ingresos (Halabisky, 2012).
A continuación se describen algunos de estos programas:
Programas para promover los beneficios del emprendimiento.Un programa desarrollado en Europa que focaliza exclusivamente en mujeres de la tercera edad se denomina “Female Proyect”. Este programa ofrece capacitación y educación emprendedora en países tales como el Reino Unido, Holanda, Chipre y Malta y tiene apoyo de la Unión Europea y de empresas privadas. Dicha iniciativa apoya a las mujeres de la tercera edad, con el objeto de darles facilidades para comenzar su propio negocio. Básicamente, es una plataforma online
que incluye un set de herramientas, ofreciendo coaching y mentoring para promover un emprendimiento.
Un segundo programa, desarrollado por la Comisión Europea (2012), fue el proyecto “Grundtvig”. Este proyecto tenía como objetivo promover historias personales de emprendedores de la tercera edad con fin de dar a conocer el emprendimiento como una opción laboral (Halabisky, 2012).
Un tercer proyecto, también desarrollado en Europa, fue el denominado “Memoro”, cuyo objetivo fue recoger diferentes historias de empresarios de edad avanzada y hacer cortometrajes para promover el espíritu empresarial entre personas mayores (Best Agers, 2011).
Programas para el desarrollo de nuevas habilidades. Un primer programa que fue financiado a través del Fondo Social Europeo (FSE) en Hungría, promovía la integración de las personas de la tercera edad desfavorecidas en el mercado laboral, utilizando estrategias de emprendimiento y de esquemas de capacitación para ayudarlos a comenzar un negocio.
Un segundo proyecto, que se desarrolla en Canadá, llamado “Tiow”, tiene como objetivo capacitar a trabajadores de edad avanzada y en condiciones de vulnerabilidad social y pobreza para que puedan desarrollar sus propios emprendimientos. Esta iniciativa ofrece servicios de asistencia para mejorar habilidades emprendedoras y potenciar la experiencia empresarial (Halabisky, 2012).
Un tercer programa que se desarrolla en Australia, denominado “Neis”, es orientado a adultos mayores sobre 50 años que tienen problemas sociales y sufren discriminación por la edad para comenzar un negocio. Dicha iniciativa está financiada por el gobierno de Australia desde el año 2006 y entrega por siete semanas capacitación y educación emprendedora. Sin perjuicio de anterior, después de ese período brinda por doce meses coaching y mentoría uno a uno (Kautonen, 2012).
Programas para el desarrollo de redes y acceso a financiamiento.Un primer proyecto llamado “Biiugi”, desarrollado en Alemania, ofrece una plataforma en línea que permite a emprendedores de la tercera se edad conectarse con empresarios más experimentados con el objeto de obtener el asesoramiento y compartir experiencias.
Otra iniciativa desarrollada en Estados Unidos de Norteamérica es el programa “Score” que fue lanzado hace varias décadas para ayudar a los militares retirados a orientarlos y capacitarlos en administración de negocios. Uno de los servicios que aporta “Score” es ayudar a los empresarios de la tercera edad a encontrar mentores a través de una base de datos en línea y facilitar tutorías uno a uno. Este programa posee cerca de 9 millones de clientes (Kautonen, 2012).
En el Reino Unido, el programa “Prime” de la Fundación del Príncipe de Gales, entrega educación y acceso a financiero a adultos mayores de 50 años, que se encuentren desempleados o en situación de pobreza. Creado en 1998, apoya a adultos mayores desempleados y jubilados para que comiencen sus propios negocios. Proveen de información,
149
J. Technol. Manag. Innov. 2015. Volume 10, Issue 3
ISSN: 0718-2724. (http://jotmi.org)Journal of Technology Management & Innovation © Universidad Alberto Hurtado, Facultad de Economía y Negocios.
talleres, educación y capacitación, redes de contacto, coaching y préstamos (micro finanzas) a un costo muy bajo (Kautonen y Luoto, 2008)
Otro proyecto llamado “Mature Entrepreneur Project”, desarrollado en Polonia, tiene como objetivo apoyar la iniciativa empresarial para los mayores de 50 años con el objeto de mantener su negocio funcionado o bien comiencen uno. Los participantes reciben aportes en dinero para ayudarles a iniciar un negocio y también reciben capacitación y asesoramiento empresarial. Este proyecto fue llevado a la televisión para fomentar y promover el emprendimiento de los adultos mayores en ese país (Halabisky, 2012)
Discusión
Tomando en cuenta la revisión de la literatura y los cambios demográficos que se están generando, se puede apreciar que las personas de la tercera edad serán cada vez más importante en nuestra sociedad. Uno de los grandes desafíos de este nuevo escenario se refiere a tratar de aminorar de modo eficiente las situaciones de discriminación por parte de la sociedad que sufren los adultos mayores que aún se encuentran en buenas condiciones físicas y mentales.
En efecto, la marginación de la vida laboral activa constituye una realidad que sufren estas personas, impidiéndoles tener posibilidades de integrarse vitalmente al mercado laboral. Los referidos problemas de discriminación son significativos.
Surge, entonces, el emprendimiento, no sólo como una alternativa viable para mejorar los ingresos de las personas mayores y mejorar su calidad de vida, sino también como remedio para aminorar la desintegración del adulto mayor de la vida laboral en una sociedad.Para facilitar el entorno emprendedor de los adultos mayores se plantean las siguientes propuestas:
En primer lugar, es fundamental que el gobierno, con la ayuda de las agencias del estado, pueda intervenir a fin de mantener a las perso-nas mayores en la fuerza laboral. En efecto, si personas de este grupo etario pierden sus trabajos, existen altos riesgos de vulnerabilidad so-cial. Como sabemos y ya se ha expresado en este trabajo, los adultos mayores poseen un valioso capital humano acumulado a través de parte importante de sus vidas, que puede llegar a utilizarse para reali-zar actividades emprendedoras en años posteriores. Por otro lado, re-specto de aquellas personas que ya están jubiladas, resulta imperioso incentivarlas y capacitarlas a fin de obtener toda la riqueza basada en su experiencia laboral, profesional y social que estos adultos pueden ofrecer al generar emprendimientos de diversa índole.
Se propone crear en Chile el Año del envejecimiento activo, de tal manera de crear conciencia en la sociedad que las personas de la tercera edad, hoy por hoy, buscan un envejecimiento dinámico, siendo el emprendimiento una herramienta que les permite tener un balance de trabajo, ingresos y tiempo libre. Esta política ayudaría a mejorar la apertura cultural en Chile hacia los adultos mayores
para incentivarlos en actividades emprendedoras y no se sientan discriminados.
En segundo lugar, respecto de aquellos adultos mayores que actualmente no tienen jubilación o bien que su principal fuente de ingresos es la contribución de sus hijos o de sus familias, el emprendimiento es una opción atractiva para obtener una renta. El desarrollo de actividades empresariales y la conversión desde el trabajo dependiente al emprendimiento parece mejorar las alternativas de superación de las personas. (Kornfeld, 2013). A su vez, el emprendimiento también constituye una herramienta útil respecto de aquellos los adultos mayores que tienen una mejor posición económica y que lograron ahorrar más durante su vida laboral activa, puesto que no tienen totalmente asegurados sus ingresos, debido a los fuertes cambios que experimentan los mercados financieros.
Actualmente, el gobierno chileno ha estado siempre apoyando el entorno y la iniciativa emprendedora. Una gran cantidad de oportunidades para futuros empresarios están empezando a surgir en Chile. El gobierno no puede confiar solo en apoyar iniciativas emprendedoras en jóvenes. Creemos que ya es momento de mirar a los adultos mayores como futuros emprendedores y brindarles la oportunidad de mejorar los ingresos y fomentar, en lo posible, el desarrollo de negocios innovadores.
Para lo anterior, es necesario generar programas de apoyo, a fin de fomentar esta iniciativa y superar obstáculos, de la misma manera como se realiza en otras partes del mundo.
Resulta de alta relevancia no visualizar el apoyo a estos emprendedores como simples programas asistenciales.
Hoy en día, no existen en Chile programas de emprendimiento destinados exclusivamente a personas naturales de la tercera edad que apoyen y brinden seguimiento para comenzar un negocio. También presenciamos la carencia de buenos “coachers” y mentores que conozcan la realidad propia de un emprendedor de la tercera edad.
El Estado de Chile podría crear en algunas instituciones que fomentan el emprendimiento, tales como CORFO o SERCOTEC, junto con el SENAMA, programas destinados exclusivamente a apoyar a emprendedores en este grupo etario. Evidencias empíricas muestran que apoyar el emprendimiento del adulto mayor no solo ayuda a este grupo, sino también es la sociedad entera la que obtiene un notable provecho.
En tercer lugar, se propone un modelo de intervención para fomentar la motivación, salud y el desarrollo de nuevas habilidades. Esta propuesta busca incentivar el lanzamiento de nuevas empresas por parte de adultos mayores. La vejez trae, sin duda, un declive biológico y físico. La inactividad plantea un riesgo para que se generen diversas enfermedades crónicas. Por dicha razón, las personas de la tercera edad deberían mantenerse ocupadas, siendo el emprendimiento una opción para equilibrar sus vidas.La idea de este proyecto es incentivar a los adultos mayores a formar parte de incubadoras de negocios hechas a la medida para la creación
150
J. Technol. Manag. Innov. 2015. Volume 10, Issue 3
ISSN: 0718-2724. (http://jotmi.org)Journal of Technology Management & Innovation © Universidad Alberto Hurtado, Facultad de Economía y Negocios.
de nuevos emprendimientos. De esta forma, los conocimientos y la carrera laboral de este grupo etario podrían concretarse en buenas ideas para ser llevadas a la práctica.
Otro objetivo importante de esta propuesta se refiere a la creación de nuevas fuentes laborales e ingresos, la posibilidad de crear negocios familiares que permitan trascender a nuevas generaciones, de desarrollar nuevas habilidades y mejorar la calidad de vida. Por otro lado, permitirá en Chile generar nuevos conocimientos sobre el tema del emprendimiento en el adulto mayor.
En cuarto lugar, existen evidencias empíricas que sitúan a los adultos mayores en mejor posición para emprender que otros segmentos de la población, a pesar de todas las barreras que se presentan. Estas personas poseen experiencia laboral, capital social y capital humano, entre otros factores, que puede ser utilizado para emprender. También se debe considerar que los negocios fundados por adultos mayores tienen una tasa de sobrevivencia más alta que otros segmentos de la población, permitiendo desarrollar alternativas de negocios más viables en el largo plazo.
Se propone también la elaboración de programas destinados a que un cierto segmento de adultos mayores con antecedentes profesionales de alto nivel y que no requieren o no buscan emprender un negocio, puedan cumplir el rol de “coach” de negocios o mentor, con el fin ser colaboradores en el desarrollo de emprendimientos respecto de otros adultos mayores que requieren de su ayuda.
Asimismo, algunos adultos mayores pueden ayudar a sus coetáneos en otra dirección. En efecto, se trata de individuos más ricos, y en esta situación, se propone establecer un plan para que actúen como inversionistas ángeles y de este modo se involucren en los equipos de trabajo de emprendedores de tercera edad.
Finalmente, apoyar el emprendimiento del adulto mayor tiene un fuerte impacto en el desarrollo económico un país (Zhang, 2008).
En esta línea de acción, se manifiesta la urgente necesidad de planificar a nivel gubernamental y privado todas las directrices que permitan ubicar a los adultos mayores como nuevos emprendedores y, desde ese lugar, contribuir al desarrollo económico de Chile.
Conclusiones
Considerando los cambios demográficos de nuestra sociedad, se puede concluir que los adultos mayores tendrán cada vez más un rol más importante. Uno de los grandes desafíos que se presentan es mantener a estas personas activas y con buena calidad de vida. Por ello se propone al emprendimiento como una alternativa para contrarrestar la falta de oportunidades laborales y de ingreso.
Como sociedad no es apropiado olvidar que los adultos mayores pueden aún contribuir económicamente al país. Muchos de ellos se encuentran en buenas condiciones físicas y mentales, además tienen la motivación, la necesidad y la energía para participar y beneficiarse de un emprendimiento.
El gobierno de Chile debe iniciar el viaje de valorar y fomentar el emprendimiento del adulto mayor como una estrategia nacional, no solo como una medida destinada al bienestar personal de este grupo etario, sino también como estrategia para el desarrollo económico del país.
Generar programas de apoyo y fomento para esta iniciativa, resulta una medida adecuada, principalmente para aquellos adultos mayores que están en desventaja económica y que no pueden encontrar un trabajo.
Finalmente cabe hacer presente que el estudio del emprendimiento del adulto mayor es aún una disciplina en desarrollo e indudablemente tendrá en el futuro una creciente importancia para la investigación.
Referencias
Arkebauer, J. B. (1995). Golden Entrepreneuring: The Mature Person’s Guide to a Successful Business. NY: Mcgraw-Hill.
Best Agers (2011), Newsletter No. 4, pp. 1-10.
Blackburn, R., Hart, M. y O’reilly, M. (2000). Entrepreneurship in the Third Age: New Dawn or Misplaced Expectations? 23rd ISBA National Small Firms Policy and Research Conference, Aberdeen University.
Blackburn, R., Mackintosh, L. y North, J. (1998), Entrepreneurship in the Third Age, Kingston University Small Business Research Centre, Surrey.
Blanchflower, D. y Oswald, A. J. (1998). What Makes an Entrepreneur? Journal of Labour Economics, 16 (1), 26-59. http://dx.doi.org/10.1086/209881
Baucus, D. A. y Human, S.D. (1994). Second–career entrepreneurs: A multiple case study analysis of entrepreneurial processes and antecedent variables. Entrepreneurship Theory and Practice, 19 (2), 41–71.
BIS Department of Business and Innovation Skills (2011). Phasing out the Default Retirement Age: Government Response to Consultation. London: BIS.
Botham, R. y Graves, A. (2009). Third age entrepreneurs: Innovative business start ups in mid-life and beyond- understanding the drivers and removing the barriers. Interim Report to NESTA.
Canals, B. (2012). Contexto socio demográfico del envejecimiento en Chile. In. Academia Parlamentaria Cámara de Diputados de Chile (Eds.), Cuadernillos Hemiciclos (pp.50-55). Valparaíso: Cámara de diputados.
Clark, G., Munnell, A. y Orszag, J. (2006). The Oxford Handbook of Pensions and Retirement Income. OUP:Oxford. http://dx.doi.org/10.1093/oxfordhb/9780199272464.001.0001
Colovic, A. y Lamonette, O. (2012) Are third age entrepreneurs innovative? Evidence from GEM data. Revue Française de Gestion, 227, 127-141. http://dx.doi.org/10.2139/ssrn.2327021
151
J. Technol. Manag. Innov. 2015. Volume 10, Issue 3
ISSN: 0718-2724. (http://jotmi.org)Journal of Technology Management & Innovation © Universidad Alberto Hurtado, Facultad de Economía y Negocios.
Comisión Europea, (2012), Active Ageing, Special Flash Eurobarometer No. 378, pp.1-12.
Cressy, R. y Storey, D.J. (1995). New Firms and Their Banks. Warwick University Business School and NatWest.
Curran, J. y Blackburn, R. (2001). Older people and the enterprise society: age and self–employment propensities. Work, employment and society, 15 (4), 889–902. http://dx.doi.org/10.1177/095001701400438279
De Bruin, A., y Firkin, P. (2001). Self-employment of the older worker. Labour Market Dynamics Research Programme, Massey University.
Fernandez, L. S., y Rey, E. F. (2010). Competencias emprendedoras y desarrollo del espíritu empresarial en los centros educativos. Educación 21, 13(1). http://dx.doi.org/10.5944/educxx1.13.1.275
Froud, J., Haslam, C., Johal, S.,y Williams, K. (2002) Financialisation and the coupon pool. Capital and Class, 26, 119–151. http://dx.doi.org/10.1177/030981680207800106
Fuchs, V.C. (1982). Self-employment and labour force participation of older males, Journal of Human Resources, 17(3), 339-357. http://dx.doi.org/10.2307/145584
Halabisky, D. (2012). Entrepreneurial Activities in Europe - Senior Entrepreneurship. OECD Employment Policy Papers. http://dx.doi.org/10.1787/5jxrcml7lhxq-en
Hart, M., Anyadike-Danes, M. y Blackburn, R. (2004). Entrepreneurship and age in the UK: Comparing Third Age and Prime Age new venture creation across the regions. Paper presented at RENT XVIII, Copenhagen.
Hinz, T., y M. Jungbauer–Gans (1999). Starting a Business after Unemployment: Characteristics and Chances of Success – Empirical Evidence from a Regional German Labour Market. Entrepreneurship and Regional Development, 11(4), 317–333. http://dx.doi.org/10.1080/089856299283137
Kadefors, R. (2011), Costs and Benefits of Best Agers Employment, Best Agers Project Retrieved from http://www.best-agers-project.eu/
Karoly, L. A., y Zissimopoulos, J. (2004). Self-employment and the 50+ population.
Kautonen, T.; Down, S. y South, L. (2008). Enterprise support for older entrepreneurs: the case of Prime in the UK. Entrepreneurship and Regional Development, 14 (2), 85-101. http://dx.doi.org/10.1108/13552550810863071
Kautonen, T. (2008). Understanding the older entrepreneur: Comparing third age and prime age entrepreneurs in Finland. International Journal of Business Science and Applied Management, 3(3), 3-13.
Kautonen, T., y Luoto, S. (2008). Entrepreneurial intentions in the third age: The impact of career history. In University of Vaasa.
Kautonen, T., Tornikoski, E. y Kibler, E. (2009). Entrepreneurial intentions in the third age: the impact of perceived age norms. Small Business Econonomy, 37, 219–234. http://dx.doi. org/10.1177/0266242610368592
Kautonen, T.; Down, S.; Welter, F.; Vainio, P.; Palmroos, J.; Althoff, K. y Kolb, S. (2010). Involuntary self-employment as a public policy issue: a cross-country European review. International Journal of Entrepreneurial Behaviour & Research, 16 (2), 112-129. http://dx.doi. org/10.1108/13552551011027002
Kautonen, T., Van Gelderen, M. y Torniskoski, E. T. (2011). Predicting entrepreneurial behaviour: a test of the theory of planned behaviour. Applied Economics, 45 (6), 697-707. http://dx.doi.org/10.1080/00036 846.2011.610750
Kautonen, T. (2012). Senior Entrepreneurship. A background paper for the OECD centre for entrepreneurship. Smes and local development. Paris, France: OECD.
Kautonen, T., Down, S. y Minniti, M. (2013). Ageing and entrepreneurial preferences. Small Business Economics, 42(3), 579–594. http://dx.doi.org/10.1007/s11187-013-9489-5
Kibler, E., Wainwright, T., Kautonen, T., & Blackburn, R. (2011). (Work) Life after work: understanding barriers to older entrepreneurship in London. In ICSB World Conference Proceedings. International Council for Small business (ICSB).
Kibler, E., Wainwright, T., Kautonen, T.. y Blackburn R. (2012). Can social exclusion against older entrepreneurs be managed? Journal of Small Business Management. http://dx.doi.org/10.1111/jsbm.12194
Kornfeld, R. (2013). Chile y sus mayores, bienestar general en la vejez. In. Senama (Ed.) Encuesta calidad de vida y vejez, (pp. 19-20). Santiago de Chile: Pontificia Universidad Católica de Chile.
Levesque, M., y Minniti, M. (2006). The Effect of Aging on Entrepreneurial Behavior, Journal of Business Venturing, 21(2), 177–194. http://dx.doi.org/10.1016/j.jbusvent.2005.04.003
Levie, J. (2014). Global Entrepreneurship Monitor: Scotland 2013 Retrieved form http://www.gemconsortium.org/docs/download/3348
Loretto, W. (2010). Work and retirement in an ageing world: the case of older workers in the UK. Twenty-First Century Society, 5(3), 279–294. http://dx.doi.org/10.1080/17450144.2010.480831
Loretto, W. y White, P. (2006). Employers attitudes, practices and policies towards older workers. Human Resource Management Journal, 16, 313–330. http://dx.doi.org/10.1111/j.1748-8583.2006.00013.x
Lussier, R. y Pfeifer, S. 2001, A Crossnational Prediction Model of Business Success, Journal of Small Business Management, 39 (3), 228-239. http://dx.doi.org/10.1111/0447-2778.00021
152
J. Technol. Manag. Innov. 2015. Volume 10, Issue 3
ISSN: 0718-2724. (http://jotmi.org)Journal of Technology Management & Innovation © Universidad Alberto Hurtado, Facultad de Economía y Negocios.
Maestas, N. y Zissmopoulos, J. (2010). How Longer Working Lives Ease the Crunch of Population Ageing. The Journal of Economic Perspectives, 24 (1), 139–160. http://dx.doi.org/10.1257/jep.24.1.139
McClelland, E., Swail, J., Bell, J., & Ibbotson, P. (2005). Following the pathway of female entrepreneurs. International Journal of Entrepreneurial Behavior & Research, 11(2), 84–107. http://dx.doi.org/10.1108/13552550510590527
Mckay, R. (2001). Women entrepreneurs: Moving beyond family and flexibility. International Journal of Entrepreneurial Behaviour & Research, 7 (4), 148-165. http://dx.doi.org/10.1108/13552550510590527
Mrva, M., y Stachová, P. (2014). Regional development and support of SMEs–how university project can help. Procedia-Social and Behavioral Sciences, 110, 617-626. http://dx.doi.org/10.1016/j.sbspro.2013.12.906
Munnel, A., Sunden, A., Taylor, C. (2002) What determines 401(k) participation and contributions? Social Security Bulletin, 64, 64–75. http://dx.doi.org/10.2139/ssrn.253037
North, D.C (1990). Institutions, Institutional Change and Economic Performance. Cambridge: Cambridge University Press.
Oecd (2001). Fiscal Implications of Ageing: Projections of Age–Related. OECD Economic Outlook, 69 (4), 145–167.
Oecd (2006). Live Longer, Work Longer. Paris: OECD.
Oecd (2012). Policy Brief on Senior Entrepreneurship. Entrepreneurial Activities in Europe Retrieved from http://ec.europa.eu/social/BlobServlet?docId=9644&langId=en
Oecd (2012). Policy Brief on Senior Entrepreneurship. Luxembourg: European Commission.
Oms (Organización Mundial de la Salud) (2012). La buena salud añade vida a los años Retrieved from http://apps.who.int/iris/bitstream/10665/75254/1/WHO_DCO_WHD_2012.2_spa.pdf.
Parker, S.C. (2001). Prosperity not poverty: An investigation into the holdings and distribution of wealth of older British entrepreneurs. University of Durham, Department of Economics and Finance.
Parker, S..C. (2004). The Economics of Self-Employment and Entrepreneurship. Cambridge: Cambridge University Press.
Pilkova, A., Holienka, M. y Rehak, J. (2014). Senior entrepreneurship in the perspective of European entrepreneurial environment. Procedia Economics and Finance, 12, 523 – 532. http://dx.doi.org/10.1016/s2212-5671(14)00375-x
Roberts, E.B. (1991). Entrepreneurs in High Technology: Lessons from MIT and Beyond. Oxford: University Press.
Rotefoss, B. y Kolvereid, L. (2005). Aspiring, nascent and fledgling entrepreneurs: An investigation of the business start-up process. Entrepreneurship and Regional Development, 17 (2), 109-127. http://dx.doi.org/10.1080/08985620500074049
Senama, Servicio nacional del adulto mayor (2011). Encuesta nacional de inclusión y exclusión social del adulto mayor en Chile, Gobierno de Chile Retrieved form http://www.senama.cl/filesapp/SEGUNDA%20ENCUESTA.pdf.
Senama, Servicio nacional del adulto mayor (2013). Resultados Tercera Encuesta Nacional Calidad de Vida en la Vejez Retrieved from http://www.senama.cl/filesapp/Chile%20y%20sus%20mayores%202013,%20Encuesta%20de%20Calidad%20de%20Vida.pdf].
Singh y De Noble, A. (2003). Early Retirees as the Next Generation of Entrepreneurs. Entrepreneurship Theory and Practice, Vol. 23 (3), 207–226. http://dx.doi.org/10.1111/1540-8520.t01-1-00001
Staudinger, U. M. (1999). Older and Wiser? Integrating results on the relationship between age and wisdom-related performance. International Journal of Behavioral Development, 23 (3), 641-664. http://dx.doi.org/10.1080/016502599383739
Wainwright, T y Kibler, E. (2013). Beyond financialization: older entrepreneurship and retirement planning. Journal of Economic Geography, 14 (4), 849–864. http://dx.doi.org/10.1093/jeg/lbt023
Weber, P., y Schaper, M. (2004). Understanding the Grey Entrepreneur. Journal Enterprising Culture, 12 (2), 147-164. http://dx.doi.org/10.1142/s0218495804000087
Webster, B. y Walker, B. (2005). Smart training for the older entrepreneur. Presented at the International Council of Small Business World Conference, Melbourne, June 2005.
Zhang, T. (2008). Elderly Entrepreneurship in an Aging US Economy. Series on Economic Development and Growth. http://dx.doi.org/10.1142/6852
Zissmopoulos, J. M., y Karoly, L. A. (2007). Transitions to self-employment at older ages: The role of wealth, health, health insurance and other factors. Labour Economics, 14 (2), 269-295. http://dx.doi.org/10.1016/j.labeco.2005.08.002
153


