Embed Size (px)
Citation preview


waters. The same patches and E-dipole are hardly distinguishable in colour in the
RGB image (figure 7). In this example, better diagnostic performance of the SC
image is due to the use of spectral data covering full visible range. If the number of
clusters is large enough, the spectral information of initial imagery is mostly retained
in SC images on a pixel-by-pixel basis, therefore their diagnostic potential is high
insofar as spectral dependence of normalized radiance varies in space and time
under the influence of water exchange.
The maps of chlorophyll, CDOM, suspended matter and other oceanological
characteristics, retrieved from remotely sensed normalized radiance or reflectance,
are used at times as evidence of water exchange processes. As a rule, a retrieval
procedure involves a limited number of spectral windows and a model based on
assumptions that are difficult to validate when applied to highly variable aquatic
environment. Under these conditions, the SC images may represent a more reliable
diagnostic tool free of errors inherent to retrieval procedures.
InternationalJournalofRemote
Sensing
res76737.3d
21/12/05
08:50:23
TheCharlesworthGroup,Wakefield
+44(0)1924369598-Rev7.51n/W
(Jan202003)
138033
Figure 7. The RGB composite (top) and SC image (bottom) of the western study area forJD 163, 2000. The RGB image is a fragment of the original picture at http://www.soes.soton.ac.uk/staff/tt/eh/black.html, provided by the SeaWiFS Project, NASA/Goddard Space Flight Center and ORBIMAGE. The SC image is a copy of the uppermap in figure 4.
COLOURFIGURE
16 G. S. Karabashev et al.

composition of N- and S-dipoles also featured remarkable stability although they
radically differed from each other in types of radiance spectra.
Brightness temperature distribution for JDs 160 showed presence of both dipoles
known from ocean colour data but some discrepancies between the temperature and
radiance distributions occurred for JD 162 while no traces of vortex dipoles was
found in the temperature distribution for JD 164 (Karabashev et al. 2003).
InternationalJournalofRemote
Sensing
res76737.3d
21/12/05
08:50:03
TheCharlesworthGroup,Wakefield
+44(0)1924369598-Rev7.51n/W
(Jan202003)
138033
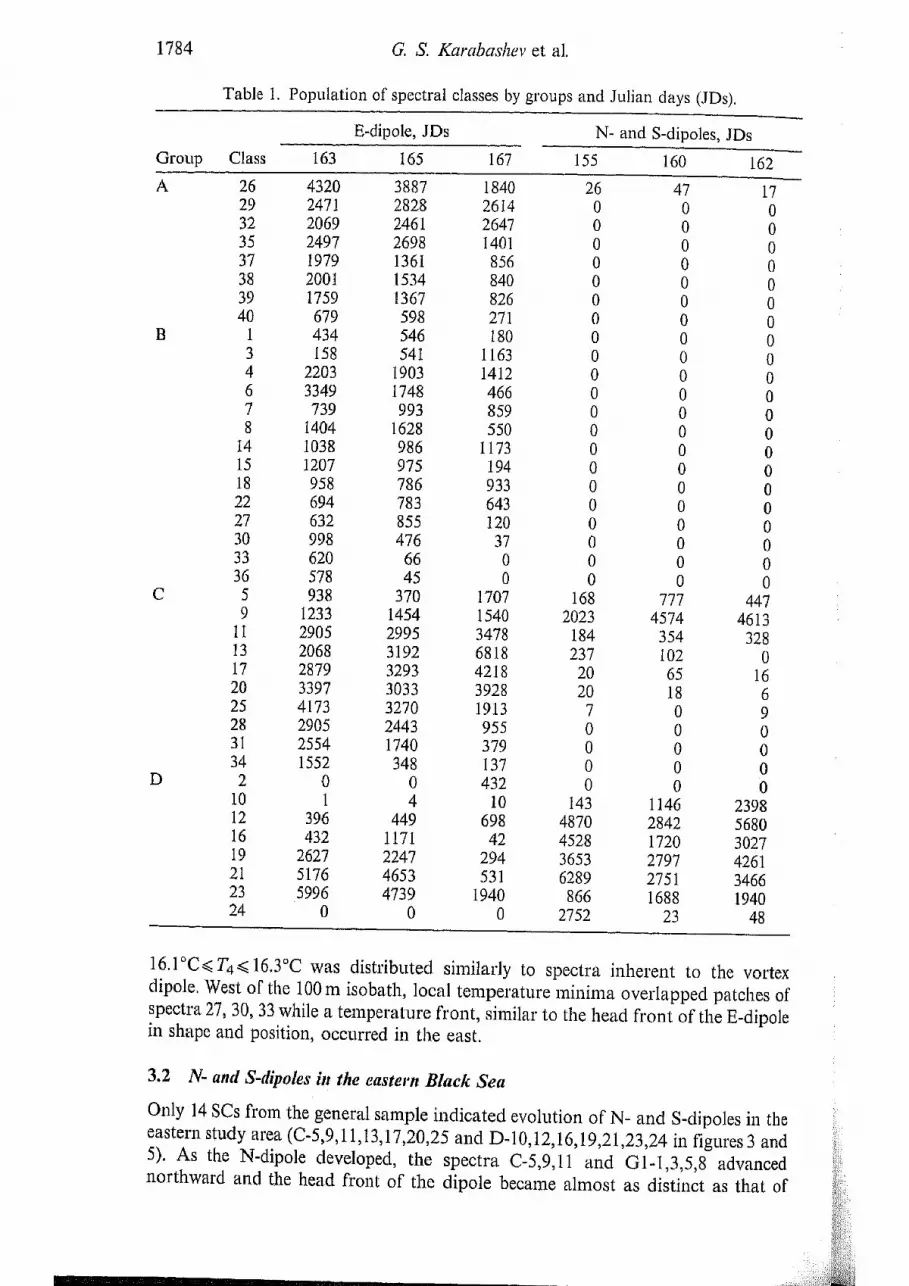
Figure 5. Spectral-cluster images of the N- and S-dipoles in the eastern study area (ESA) forJDs 155, 160, 162 (2001). K40, classes of groups C and D in figure 2(a); K20, classes of groupsG1–G3 in figure 2(b).
COLOURFIGURE
10 G. S. Karabashev et al.

same spectra indicated detached patches extended along the head front of the
S-dipole (figure 5, JDs 160 and 162). These elements were lacking in N-dipole. Thefronts of the dipoles gradually advanced in opposite directions but their shapes
changed slower as compared with the E-dipole (figures 4 and 5). The SC
InternationalJournalofRemote
Sensing
res76737.3d
21/12/05
08:49:53
TheCharlesworthGroup,Wakefield
+44(0)1924369598-Rev7.51n/W
(Jan202003)
138033
Figure 4. Spectral-cluster images of the western study area (WSA) for JDs 163, 165 and 167(2000) representing distributions of classes A–D (see figures 2 and 3).
COLOURFIGURE
Radiance spectrum and water exchange 9