Embed Size (px)
Citation preview
WHY SCHOOL REPORT CARDS
MERIT A FAILING GRADE
Kenneth R. Howe and Kevin Murray
University of Colorado Boulder
January 2015
National Education Policy Center
School of Education, University of Colorado Boulder
Boulder, CO 80309-0249
Telephone: (802) 383-0058
Email: [email protected]
http://nepc.colorado.edu
This is one of a series of briefs made possible in part by funding from
The Great Lakes Center for Education Research and Practice.
http://www.greatlakescenter.org
http://nepc.colorado.edu/publication
Kevin Welner
Project Director
Patricia H. Hinchey
Academic Editor
William Mathis
Managing Director
Erik Gunn
Managing Editor
Briefs published by the National Education Policy Center (NEPC) are blind peer -reviewed by
members of the Editorial Review Board. Visit http://nepc.colorado.edu to find all of these briefs.
For information on the editorial board and its members, visit: http://nepc.colorado.edu/editorial -
board.
Publishing Director: Alex Molnar
Suggested Citation:
Howe, K.R. & Murray, K. (2015). Why School Report Cards Merit a Failing Grade. Boulder, CO:
National Education Policy Center. Retrieved [date] from
http://nepc.colorado.edu/publication/why-school-report-cards-fail.
This material is provided free of cost to NEPC's readers, who may make non-commercial use of
the material as long as NEPC and its author(s) are credited as the source. For inquiries about
commercial use, please contact NEPC at [email protected].
http://nepc.colorado.edu/publication/why-school-report-cards-fail i of iii
WHY SCHOOL REPORT CARDS
MERIT A FAILING GRADE
Kenneth R. Howe and Kevin Murray, University of Colorado Boulder
Executive Summary
Sixteen states have adopted school report card accountability systems that assign A-F
letter grades to schools. Other states are now engaged in deliberation about whether they,
too, should adopt such systems.
This brief examines A-F accountability systems with respect to three kinds of validity.
First, we examine whether or not they are valid as a measure. That is, do these systems
validly measure school quality? Second, we examine whether or not they are valid as a
policy instrument. That is, how far do A-F accountability systems fulfill the stated aims of
their proponents—empowering parents, providing “simple” and “common sense” measures
of educational quality, and so on? Third, we examine whether or not A-F systems are valid
as a democratic framework. That is, how well do these systems align with the broader
goals of educating students for democratic citizenship and of incorporating parents and
community members in democratic deliberation about policies for their public schools?
We find that A-F accountability systems are invalid along each of these lines.
The Validity of School Reports Cards as Measure of School Quality . Despite the
proliferation of A-F grading systems, there has been little credible research on whether
letter grades validly measure and express school quality. We identify substantial problems
with letter grades as a measure of school quality. Expressing school quality via a single
composite grade is flawed. It is by no means clear what a single grade can mean across a
diverse array of criteria that include achievement, attendance rates, dropout rates, and
advanced class offerings. Little attention is devoted to justifying how these diverse criteria
are combined to create a single letter grade. Further, expressing school quality on a crude
five-point, A-F categorical scale produces considerable imprecision. Schools with the same
grade are represented as equivalent when they can differ substantially. Within the five
categories, differences are rendered invisible, and there is no way of knowing if the
difference, for example, between an “F” and a “D” is of the same magnitude as the
difference between a “D” and a “C.”
The Validity of School Report Cards as a Policy Instrument. There are strong reasons to
doubt that A-F school grades fulfill the stated aims articulated by their proponents.
Proponents argue that letter grades provide clear and simple information about school
performance. But while a grade is superficially clear and simple, it is not necessarily
“about school performance,” in the sense that the superficial understanding can reflect
patently invalid representations of school quality. Proponents argue further that letter
http://nepc.colorado.edu/publication/why-school-report-cards-fail ii of iii
grades empower parents and citizens to participate in decisions about schooling. But we
find that these grades are more likely to alienate parents from democratic participation in
the education of their children than to promote healthy school involvement. Finally,
proponents argue that letter grades drive school improvement. But the grading systems
neglect the central causes of aggregate school performance, such as community, family and
school resources. This renders the grading systems ill-suited to drive school improvement.
The Validity of School Report Cards as a Democratic Assessment Framework. Schools
have a central place in preparing democratic citizens who are able to engage in
collaborative democratic deliberation. These citizens, in turn, play a fundamental role in
deciding how future schools and society ought to be constructed. Yet no state A-F system
measures directly the educational outcomes required to foster an effective democratic
citizenry: civic engagement, the ability to engage with diverse others in democratic
deliberation, or weighing evidence carefully and revising our beliefs when warranted.
Except tangentially, these grades cannot tell us whether schools succeed in preparing
students to be good democratic citizens. Schools that are granted “A” letter grades in
existing accountability systems could fail to meet these democratic educational ends, while
schools given “F” letter grades might well meet them. Broadly, A-F letter grades do little to
promote democratic educational outcomes and indeed risk crowding these outcomes out of
schooling. Thus they are invalid as a democratic framework.
Recommendations
We endorse three recommendations offered recently by other researchers who examined
the validity of one state’s school report card systems:1
Eliminating “the single grade, which cannot be composed without adding together
unlike elements and promoting confusion and misunderstanding.”
Developing “a report card format that uses multiple school indicators that more
adequately reflect a school performance profile.”
Enlisting the services of assessment and evaluation experts in designing school
accountability systems.
We find these recommendations sound, but we suggest supplementing them with two
recommendations that take into consideration the need to consider the role and
responsibilities of an educational system within a democratic society. Accordingly, in
determining accountability systems for schools, policymakers should:
1 The Oklahoma Center for Education Policy and The Center for Educational Research and Evaluation. (January
2013). An examination of the Oklahoma state department of education’s report card. Norman and Stillwater,
OK: OCEP and CERE;
The Oklahoma Center for Education Policy and The Center for Educational Research and Evaluation. (October
2013). Oklahoma school grades: Hiding “poor” achievement. Norman and Stillwater, OK: OCEP and CERE.
http://nepc.colorado.edu/publication/why-school-report-cards-fail iii of iii
Enable democratic deliberation over the many possible purposes of schooling in a
democratic society before determining assessment criteria. This would facilitate the
use of indicators of “school quality” that reflect authentic conversation and the
voices and experiences of all members of our democratic society.
Ensure that accountability systems promote, rather than neglect or inhibit, the
formation of democratic character—which must be consciously cultivated. While
democratic outcomes may not be the only legitimate goal for public schools, they
surely should be counted among the most essential.
http://nepc.colorado.edu/publication/why-school-report-cards-fail 2 of 26
WHY SCHOOL REPORT CARDS
MERIT A FAILING GRADE
Introduction
Sixteen states have adopted accountability systems that assign A-F grades to schools.1
Other states are now engaged in deliberation, often contentious,2 about whether they, too,
should adopt such systems, and how such systems should be conceived and implemented.
Measures used to determine A-F grades for schools vary by state but often include
graduation rates, ACT/SAT participation and scores, standardized student achievement
test scores, growth in academic test scores, and attendance rates.
A-F grades have associated rewards and punishments, which vary by state. In Florida, for
example, the Opportunity Scholarship Program allows students who have attended schools
earning either one “F” or three consecutive years of “D” grades to exit and enroll in higher-
performing public schools within their district or any other district in the state, provided
space is available.3 The A-F accountability system in Indiana requires the State Board of
Education to intervene with a menu of options in schools that have received an “F” grade
for six consecutive years. Options include merging the school with a nearby higher-
performing school, assigning a “special management team” to operate all or some part of
the school, closing the school, and revising the school’s improvement plan, among others.4
Such state sanctions are examples of direct or bureaucratic accountability—systems where
state officials determine rewards and punishments.
Typically, however, A-F school grading systems also incorporate market accountability—
systems that allow parents and students to make choices about leaving one particular
school for another, taking funding with them. Vehicles for market accountability are often
choice and voucher programs. For example, the Indiana Choice Scholarship Program
provides eligible students with state funding for partial or full tuition costs at participating
choice schools, including religiously affiliated schools.5 Such programs make schools
indirectly accountable; when information about their performance is disseminated in A-F
grades, families decide whether or not students will remain in a school. Proponents of
choice systems maintain that allowing parents to remove their children from schools
receiving low grades will ultimately ensure that only high-performing schools survive.
A-F school grading systems have considerable intuitive appeal to policymakers and parents
as a good way to convey the quality of schools, to foster parental participation, and to spur
school improvement. There is reason to become skeptical of the validity of A-F school
grading systems, however, when one considers rationales and features more carefully, as
we do in this brief. Below we look closely, first, at the rationales states have offered for
implementing A-F report card systems; then, we examine such systems with respect to
three kinds of validity. The first is whether they are valid as a measure. That is, do these
http://nepc.colorado.edu/publication/why-school-report-cards-fail 3 of 26
systems validly measure school quality? Second, we examine whether or not A-F systems
are valid as a policy instrument. That is, how far do A-F accountability systems fulfill the
stated aims—empowering parents, providing “simple” and “common sense” measures of
educational quality, and so on—of their proponents? And third, we examine whether or not
A-F systems are valid as a democratic framework. That is, how well do these systems
align with the broader goals of educating students for democratic citizenship and of
incorporating parent and community members in democratic deliberation about policies
for their public schools?
Rationales: What Claims are Made for A-F Systems?
Implemented over the last fifteen years or so, the A-F grading systems are a somewhat
recent variation within the accountability movement in public education.6 Florida was the
first to adopt an A-F system. Jeb Bush, then governor of Florida, worked with the state
legislature to craft and implement his “A+ Education Plan” in 1999, which put school A-F
grades at the center. Students who attended schools that received an “F” two out of four
years were eligible to attend either a higher-performing public school or to receive a
voucher that could be used to attend a participating private school.7 While Florida
policymakers have substantially revised the original A+ Plan, A-F grades remain central to
Florida’s accountability system. Fifteen states have now followed Florida in constructing
accountability measures around A-F school grades. An important impetus for states that
have implemented or are considering implementing them is the No Child Left Behind
(NCLB) waiver process. Generally speaking, states that incorporate into their policies
accountability mechanisms such as A-F school grades and expanded choice are more likely
to be successful in receiving approval to waive the original, rigid accountability
requirements of the federal NCLB policy.
Rationales given for A-F systems are strikingly similar across states, as if they reverberate
in an echo chamber. Florida is frequently cited as an obvious success of A-F systems, and
other states frequently cite similar—or indeed, identical—rationales when they choose the
A-F path. For example, Jeb Bush’s Foundation for Florida’s Future argues:
Assigning a letter grade (A-F) is a way to report a school’s effectiveness in a
manner everyone can understand. Used along with rewards for improving
schools and support for schools that need to improve, grading schools
encourages them to make student achievement their primary focus.8
Similarly, the Arizona Department of Education writes that “the A-F Letter Grade System
was created to provide clear, easy to understand information to parents so that they could
base their educational decisions on the best information available about the overall
academic performance of schools and districts/charter holders.”9 And in Utah, A-F
proponents contend that:
With this important accountability system in place, Utah is empowering
everyone—whether school administrators, parents, classroom teachers or

http://nepc.colorado.edu/publication/why-school-report-cards-fail 4 of 26
citizens—to make informed choices and to identify ways to strengthen and
improve all of our schools for the benefit of every student in Utah.10
School report cards, proponents suggest, “give schools a tool to encourage more parental
and community involvement.”11 Such involvement is assumed to be important because
“schools with higher levels of parent and community involvement have a better chance of
succeeding.”12
Making an explicit link to the Florida system, Utah’s school grading website prominently
features a quote from Jeb Bush—“what gets measured gets done”—and provides other
rationales that reference Florida.13 The Indiana Department of Education suggests that
“giving schools letter grades for their performance—just as we do for our students—
ensures parents, students, educators and communities understand how their schools are
performing.”14 They write further that “Indiana’s A through F grading system gives
parents, students, educators and communities a clear and concise assessment of how well
their schools are doing.” The West Virginia Department of Education echoes Indiana with:
“giving schools letter grades for their performance—just as we do for our students—
ensures parents, students, educators and
communities understand how their schools are
performing.” 15 And further: “West Virginia’s A-F
school grading system gives parents, students,
educators and communities clear and concise
information on how well their schools are
doing.”
Private organizations such as Michelle Rhee’s
Students First, Jeb Bush’s Foundation for
Excellence in Education, and the American
Legislative Exchange Council (ALEC) have
added significant voices to the echo chamber,
advocating for the creation of more such A-F accountability systems. Students First,
perhaps the most visible and active advocate among these private organizations, now
assigns A-F grades and GPA scores to states based on the extent to which they “empower
parents,” “elevate the teaching profession,” and “spend wisely and govern well,” which the
organization takes to require, among other policies, assigning A-F grades to all K-12
schools.16 Students First writes: “Students First believes an A-F letter-grading system that
grades each K-12 school based on how well they serve their students is a powerful tool for
informing parent decision-making.”17 ALEC has also endorsed A-F letter grades.
Describing the adoption of letter grades in North Carolina, ALEC contends that A-F grades
are “a crucial step toward increasing transparency in the system”; such grades , one ALEC
report argues, describe school performance “on a universally understood scale.” 18
It appears, then, that the chorus in favor of A-F systems seems to be singing the same
refrain: A-F systems are said to be clear, concise systems that let everyone know how
schools are doing and encourage parents to be involved in school choices and systems.
Embedded in these claims, however, are several assumptions that need to be closely
To be meaningful, the letter
grade would need to
represent a school’s
performance pattern, but it
turns out that within-school
variation across subject
areas fluctuates a great deal.
http://nepc.colorado.edu/publication/why-school-report-cards-fail 5 of 26
examined. These include the assumption that these systems accurately and adequately
measure what they purport to measure (school quality) and that they actually advance
goals they purport to advance (parental empowerment, democratic engagement and
citizenship, and so on). They also include the assumption that fostering the democratic
aims of education need not be among the considerations that go into designing
accountability systems and assessing their validity. The following segments provide a close
examination of these assumptions, finding them questionable at best.
The Validity of School Report Cards
as a Measure of School Quality
Do state A-F school grades serve as valid indicators of school quality? Space limitations do
not permit a description of each of the 16 state systems (see the Appendix for detail on
individual state systems). To be sure, there are differences among state plans. Louisiana,
Maine, Mississippi, and Virginia, for example, appear to be the only states that move
beyond a narrow focus on reading and mathematics and include social studies proficiency
in their A-F grades.
Despite their proliferation and variation, there has been little or no credible research on
these state systems. What is known comes primarily from two recent reports produced by
university researchers at The Oklahoma Center for Education Policy and The Center for
Education Research and Evaluation.19 These reports raise substantial doubts about the
validity of the Oklahoma A-F system as a measure. To our knowledge, these reports supply
the only careful and relatively rigorous examinations of the validity of A-F school grading
systems as a measure of school quality to date, and so we rely heavily on them in this
analysis.
We found that all state A-F school grading systems share four pivotal features with
Oklahoma’s: (1) school quality is summarized in a single composite letter grade 20 on (2) a
five-point categorical scale (3) using proficiency levels to measure academic achievement.
And (4): A-F school report cards are composite scores of unmediated outcomes. This
fourth feature implicitly assumes that the school itself is primarily, if not exclusively,
responsible for student performance. Because the four features are, indeed, shared across
all state A-F systems, the findings from Oklahoma provide a source of criticisms that
generalize relatively straightforwardly across other state systems. Questions about and
criticisms of each component follow.
1. A single composite grade
A single composite score as an index of school qualities is a dubious proposition. It is by no
means clear what a single grade can mean across such a diverse array of criteria—
achievement, attendance rates, dropout rates, advanced class offerings, and so on (see the
Appendix for an illustration of the range of possible criteria). Little, if any, attention is
paid to how to justify combining the diverse components of each grade to render a value on
http://nepc.colorado.edu/publication/why-school-report-cards-fail 6 of 26
the A-F scale. For example, in addition to whether or not to include attendance as a
criterion, policymakers have to decide how heavily to weight it if they do: 10%? 20%?
Should improvement in achievement levels be calculated, or should only raw achievement
scores be included? The selection and weighting of criteria seem to have no basis other
than the seat-of-the pants intuitions of policymakers woefully lacking in technical
knowledge and skills.
2. Five-point scale
A-F grades exemplify a crude categorical scale. This produces considerable imprecision.
Schools with the same grade are represented as equivalent when they can differ
substantially. Within the five categories differences are rendered invisible, and there is no
way of knowing if the difference between an “F” and a “D” is of the same magnitude as the
difference between a “D” and an “C,” or if the difference between a “C” and “B” is of the
same magnitude as the difference between a “B” and an “A.” But the problem goes deeper
than simply imprecise scaling. Successfully remedying the problem of the imprecision of
the A-F scale assumes that the grades are potentially intelligible, if imprecise, indicators of
school quality, which is by no means evident. The numerical intervals of computed
composite scores that are translated into the various grades, like the weighing of the
various criteria that go into the computations, have no firmer basis than unprofessional
intuition. The fundamental problem here, that a more precise scale cannot remedy, is the
assumption, discussed in (1), that a single composite score for school quality is
meaningful.
3. Proficiency level as measures of academic achievement
The Oklahoma findings reveal serious problems of imprecision and lack of interpretability
associated with the use of proficiency levels to represent the academic achievement
component of school grades. Thirty-three percent of Oklahoma school grades are based on
student achievement values. However, the numerical test scores are grouped into only four
proficiency levels: unsatisfactory, limited knowledge, proficient, and advanced. It is these
calculated proficiency levels that are used in the grading formula—and also in calculations
of academic growth, weighted at 34% in the grading formula. The procedure of converting
original test score data to proficiency levels and using the new proficiency data to produce
values for achievement and growth introduces unnecessary imprecision because it
“amounts to throwing away information about examinee test performance”21 and thereby
masks otherwise detectable differences in student academic performance within
proficiency levels.22
Such conflating of data muddies its interpretation. Empirical analysis of Oklahoma school
grades revealed, for example, that there were practically no differences in average science
and reading scores among “A,” “B,” and “C” schools. Students in “C” schools had higher
average science scores than students in “B” schools. And students in “F” schools appeared
to have had higher average reading and math achievement than students in “D” schools.
Further, certain schools with lower letter grades performed better in mathematics than
http://nepc.colorado.edu/publication/why-school-report-cards-fail 7 of 26
schools with higher letter grades.23 Here it may be asked: “If a letter grade, which is based
primarily on standardized test scores,24 does not necessarily tell us anything about school
differences in reading, math, and science outcomes, what does it tell us?” 25 The answer
here seems to be that it tells us very little or nothing. To be meaningful, the letter grade
would need to represent a school’s performance pattern, but it turns out that within-school
variation across subject areas fluctuates a great deal. Thus, it is never clear what an “A” is
or what an “F” indicates.26
4. A-F school report cards as composite scores of unmediated outcomes
The findings of the celebrated Coleman Report,27 produced 50 years ago, have proved to be
impressively robust: schools account for a remarkably small amount of the variance in
student achievement scores (perceived as remarkably small in the mid-1960s).28 Credible
empirical research continues to show that school effects typically account for less than
30% of student academic performance.29 Using only student academic performance and
other isolated outcome measures to assign A-F school grades is, then, confusing—or even
deceptive—because it ignores and obscures many important factors that contribute to
school performance. Letter grades ignore, for example, the well-documented correlation
between socioeconomic status and attendance and graduation rates,30 and they attribute
academic proficiency changes directly to schools that students attended only most
recently.31 The “primary assumption of the A-F accountability system, that student test
scores can be dissected and manipulated into valid indicators of school performance, is
simply false.”32
Despite such weaknesses, A-F school report cards are one among many school
accountability systems spawned by No Child Left Behind’s mania for assessment. State
after state claims that school grades are intuitive and easy for parents and the public to
understand, since they are analogous with subject matter grades, with which virtually
everyone is familiar. School grades are thus touted as providing valuable information to
parents in their decision-making about schools, facilitating increased and more effective
participation on their part, and ultimately fostering school improvement.
These are largely claims about the validity of A-F school grading as a policy instrument,
the topic of the next section. However, we make the preliminary observation here that it is
unlikely that such grading systems can accomplish purported policy objectives if they fail
on the prerequisite of validity—if they do not in fact accurately measure school quality.
And they do in fact fail: as we show above, they do not and cannot provide an accurate
assessment of school quality. Although there is some evidence that parents do, indeed, find
school report cards useful in evaluating schools, especially when presented with appealing
graphics,33 this is a case in which the perceived “face validity” of school report cards—the
intuitive perception of validity—surely goes awry. “If [an A-F grading system] seems easy
to understand, it is only because the use of a single indicator to represent something
complex is familiar. We are used to letter grades. A truly comprehensive evaluation system
is best not boiled down to a single value because it masks the very complexity it is trying to
capture.”34 The formulas by which school report cards are computed are often not readily
http://nepc.colorado.edu/publication/why-school-report-cards-fail 8 of 26
available, and are inscrutably byzantine in any case. It would require a very atypical
parent, indeed, to understand what the grades mean, particularly when it is by no means
clear that they have any coherent meaning at all.
One final observation about the validity of A-F school grades as a measure of school
quality: no state A-F system includes among its criteria democratic citizenship, the ability
to engage in democratic dialogue with diverse others, and other public and civic
educational outcomes.35 How far can a letter grade that makes no mention of democratic
citizenship validly measure school quality in a democratic society?
In sum, there are very strong reasons to reject the validity of A-F school grading systems,
as currently conceived and implemented, as a measure of school quality. But the problems
that beset A-F school grading systems apply not just to current systems. There are no
technical fixes: the single summary evaluation on a crude five-point scale is irremediably
flawed.
The Validity of School Report Cards as a Policy Instrument
The question of validity as a policy instrument of A-F grading systems is the question of
how far such systems succeed in fulfilling proponents’ stated aims. Above, we detailed
evidence of an “echo chamber,” where rationales for A-F school grading systems were
similar, or indeed identical, across the states.
We identified three rationales commonly articulated by proponents: (1) A-F school grades
provide “simple” and “common sense” information to parents and communities about the
education of their children.36 (2) By providing such information, A-F school grades
encourage and empower citizens, parents, teachers, and administrators to participate in
and take rational control of decisions about schooling.37 (3) A-F school grading systems
work to improve schools to everyone’s benefit—as enabled and fostered by the realization
of rationales (1) and (2).38 We argue that there are good reasons to doubt each of these
rationales
Rationale 1—letter grades provide parents and communities with clear information about
school performance—is thoroughly undermined by the analysis of the previous section.
However simple and common sense school report cards may appear to the untrained eye, a
modicum of technical analysis reveals them to be patently invalid representations of school
quality. As previously observed, it follows that because school report cards are invalid as a
representation of school quality, so must be policy instruments based upon them. The
invalidity of school report cards as a representation of school quality leaves rationale one
adrift, anchored in nothing.
Like Rationale 1, Rationale 2—A-F school grades encourage and empower citizens,
parents, teachers, and administrators to participate in and take rational control over
decisions about schooling—finds its warrant in no more than common sense, apparently,
for supporters cite no empirical research in its defense. And, we found no empirical
research that speaks directly to the issue. We did find, however, a single recent study on
http://nepc.colorado.edu/publication/why-school-report-cards-fail 9 of 26
the general relationship between state accountability systems and parents’ attitudes
toward government, their political participation, and their involvement in the education of
their children. When the study’s findings are extrapolated to school report card systems,
they undermine the claim that A-F grading empowers stakeholders.39
Specifically, the study found that “parents residing in states with more developed
assessment systems express significantly lower trust in government, substantially
decreased confidence in government efficacy, and much more negative attitudes about
their children’s schools.”40 Accountability policies “demobilize parents by excluding them
from key educational decisions and enmeshing their children’s schools in a punitive testing
context that elicits parental anxiety and dissatisfaction.”41 Significantly, parents in these
states were less likely to participate substantively in the education of their children. When
parents are alienated from democratic deliberation about public schooling, as they are in
an A-F environment, they come to hold negative attitudes about schools in particular and
government generally; in this way, they are actually separated from substantial democratic
involvement with schools. Thus, rather than enhancing parental participation, more highly
developed accountability systems, such as those exemplified by A-F school grading
systems, actually suppressed it.42
Rationale 3—A-F school grading systems work to improve schools to everyone’s benefit
(as enabled and fostered by the realization of rationales 1 and 2)—fails along with the
others because of the cumulative relationship it bears to them. There are still further
problems with this claim. As observed previously, the factors incorporated into A-F school
report cards are confined to student academic performance and other outcome measures
in isolation from the social, cultural, and economic context and from the policies,
practices, and level of resources of schools. This is the source of two significant problems.
First, confining evaluation criteria to student academic performance and other outcome
measures in isolation from the social, cultural, and economic context and from policies,
practices, and resources of schools is unfair to teachers, administrators, students and
others: it holds them fully accountable for outcomes which they have limited power to
produce. Two of the cardinal requirements for fairly implementing high-stakes testing are:
1) that all students are taught in conditions that provide a fair opportunity to learn test
material, and 2) that the validity of reporting categories (proficiency levels, for example, or
A-F grades) be established.43 Neither of these requirements is met by school report card
systems.
The issue of fairness to those being held accountable is particularly germane to
bureaucratic accountability, where rewards and sanctions follow directly from the report
card evaluations and are assumed to be drivers of improvement. The so-called theory of
action underlying bureaucratic accountability may be questioned. Citing a recent white
paper authored by an impressive group of educational testing policy scholars, 44 the
Oklahoma researchers contend “it is a myth to think that using student test scores to
punish or reward schools is a driver of improvement.”45 In the view of these researchers,
failure to improve academic outcomes emerges not from individual actors’ failings, but
rather from lack of necessary resources. Given that A-F letter grades and consequent
http://nepc.colorado.edu/publication/why-school-report-cards-fail 10 of 26
interventions in Oklahoma do not meaningfully address profound differences in capacity
and school resources, there is little reason to believe that they will strengthen schools.
The second significant problem with confining evaluation criteria to student academic
performance and other outcome measures in isolation is that it precludes the capacity to
produce the formative knowledge needed to improve performance on desired outcomes. In
collapsing information from a limited number of outcome measures, grading plans divert
attention from how school policies, practices, and resources interact with out-of-school
factors and the characteristics of diverse students to produce (or fail to produce) desired
educational outcomes. The focus on isolated outcomes, combined with the crude summary
evaluations that grades on an A-F scale provide, undermines the claim that A-F grading
systems function in general to improve schools. In fact, they are particularly ill -suited to
address group-based gaps in achievement. In Oklahoma, for example, A-F letter grades
tended to obscure, rather than reveal, within-school achievement gaps. Schools marked
“A” and “B” were found to be least effective for minority students and students receiving
free or reduced-price lunch (FRL).46 Further, FRL students attending “D” and “F” schools
had better average math, reading, and science scores than FRL students in “A” and “B”
schools. The measure of school quality embedded in the Oklahoma A-F system is blind to
achievement gaps. Rather than making them visible and thus allowing communities and
policymakers to address them, letter grades in this case have rendered them invisible,
subsuming them into differences between schools.
Almost all state plans include achievement growth as a general criterion in addition to
achievement growth in the lowest quartile as a distinct criterion. Growth measures serve
as a way of controlling for the influence of different student characteristics by measuring
the difference between student achievement at the beginning and the end of a given period
of time, on the presumption that what happens in schools causes whatever difference exist.
But this is hardly sufficient to overcome the problems associated with an exclusive focus
on school outcomes: It neglects the role of social, cultural, and economic factors outside of
schools, as well as of the policies, practices and resources of schools—all of which play a
significant role in producing those outcomes.
In summary, there are strong reasons to doubt that A-F school grades fulfill the aims
articulated by their proponents and are valid as a policy instrument. Their neglect of
contextual features, and of the policies, practices, and resources of schools, renders them
ill-suited to drive school improvement. Rather than working to empower parents and
community members in a way that promotes school involvement, they are more likely to
alienate parents from democratic participation in the education of their children.
The Validity of School Report Cards
as a Democratic Assessment Framework
Even if A-F school grades proved valid as measure of quality and valid as policy
instrument—which they do not—there are still strong reasons to hold that they are invalid
as a democratic assessment framework. A-F systems appear to ignore entirely, for
http://nepc.colorado.edu/publication/why-school-report-cards-fail 11 of 26
example, the fundamental place of schooling in preparing democratic citizens who are able
to engage in collaborative democratic deliberation in order to determine how schools and
society ought to be constructed.
Questions about the validity of school report cards as measure of school quality and as a
policy instrument, cannot be—should not be—abstracted from the broader normative
discussion about the place of education within a robust democracy. Typically, however,
there is little or no public deliberation about which specific outcomes need to be
incorporated into assessment systems. For example, while such outcomes as job
preparation are commonly promoted, there is little discourse about why such preparation
is essential, how it is best defined, or how the need for such a practical outcome might be
balanced with others—like preparation for participation in active citizenship. Criteria
reflect particular political commitments, and they are currently being imposed with little
or no consideration of competing educational and social visions.
In contrast, in a democratic society the question of how schools ought to be structured
should be subject to continual democratic deliberation. Implementation of particular
visions should be open to continual revision as new reasons and contexts evolve.
Proponents of the A-F systems claim they produce democratic engagement as a matter of
course, as when, for example, Indiana policymakers state: “The greatest benefit of the A
through F school grading system is heightened community awareness and increased
dialogue and action among education stakeholders.”47 And yet, existing evidence suggests
that A-F systems conversely tend to stifle democratic control over educational structures.
In addition, no state A-F system measures directly the educational outcomes required to
foster an effective democratic citizenry: civic engagement; the ability to engage with
diverse others in authentic deliberation; understanding beliefs to be revisable and indeed
revising them in light of contradictory evidence; working to maintain the conditions of
democratic society, and so on. The general educational vision contained in A-F systems
neglects—or perhaps even undermines—the desirability of schools to cultivate in students
the prerequisite for democratic deliberation: democratic character, which includes the
knowledge, abilities, and dispositions needed for effective participation in democratic
politics. Michele Moses and John Rogers argue that democratic citizens must develop both
capacities for and commitments to democratic deliberation, such as listening, weighing
evidence, communicating with people from diverse backgrounds, and thinking critically
about, rather than merely accordance with, authority.48 Except tangentially, no difference
between “A” and “F” schools can tell us whether or not schools succeed in preparing
students to be good democratic citizens. Schools that are granted “A” letter grades in
existing accountability systems could be meeting these democratic educational ends
considerably less well than schools receiving lower grades.
A-F school grading systems appear consistent with, if not outright supportive of, a
narrowly vocationalist vision of schooling. Such systems commonly conflate education and
education for economic ends. Consider, for example, the rationales given for A-F school
grades in a Fall 2013 presentation produced by the Louisiana Department of Education
(DoE).49 The Louisiana DoE advances two arguments in support of letter grades. First, it
http://nepc.colorado.edu/publication/why-school-report-cards-fail 12 of 26
contends that “American education outcomes are not competitive internationally.” Reports
that many other countries have outperformed the U.S. educationally, the department
suggests, have substantive economic consequences: “there is substantial cost to our
country and our state associated with lower educational outcomes. Had the U.S. closed the
international achievement gap by 1998, the GDP could have been $1.3 trillion to $2.3
trillion higher in 2008.” Second, the department notes that “Louisiana graduates will
struggle to compete for jobs” because of inadequate school outcomes. Most new jobs, they
write, will require education after high school. A-F school grades are taken to be a part of
the solution to both of these (economic) problems. We find no discussion here of non-
market educational outcomes—cultivating, for example, good democratic citizens or
ensuring that students have studied and worked with diverse others.
Post-NCLB accountability systems, which include A-F school grades, have driven a
narrowing of the curriculum away from democratic educational outcomes, especially away
from the curricular content necessary for cultivating the democratic character.50 The
intense focus on content knowledge, particularly English and mathematics, created by
accountability systems has significantly limited attention to other subjects and goals,
including democratic outcomes.51 There is little reason to believe that A-F systems will,
without substantial revision, promote democratic education. Certainly they are not aimed
directly at cultivating “critical habits of the mind and the inclination to deliberate and
debate conscientiously on matters of social importance” which are central to democratic
character.52 A-F systems are thus invalid as a democratic framework: they do little to
promote democratic educational ends and indeed risk crowding these ends out of
schooling.
Much hangs on whether or not all students,
especially those who belong to historically
marginalized groups, are given the tools
necessary for participating in democratic politics.
In democratic society, these students should be
provided the abilities and knowledge for
protesting the unjust circumstances into which
they have been thrown, for giving voice to their
experiences and making those voices forceful in democratic politics. Otherwise, their
experiences and voices are denied, subsumed into dominant and narrow representations of
how schools and society ought to be organized. And, they are too often forced to comply
with these dominant representations even as these representations diminish their own
experiences and force them into alienating social and economic positions. Any
accountability system that fails to recognize the responsibility to cultivate the democratic
character might well be said to help maintain existing injustice along lines of social class,
gender, race, sexual orientation, and so on. To deny these historically marginalized groups
the very tools necessary for participating in democratic politics is to collaborate in the
process of consciously reproducing the highly unequal status quo. In this way, A-F systems
are complicit in maintaining the existing social order and, consequently, the power and
status of those who benefit from contemporary power arrangements.
The measure of school
quality embedded in the
Oklahoma A-F system is
blind to achievement gaps.
http://nepc.colorado.edu/publication/why-school-report-cards-fail 13 of 26
Conclusion and Recommendations
We endorse three recommendations of the Oklahoma researchers, who suggest to
policymakers:
Eliminating “the single grade, which cannot be composed without adding together
unlike elements and promoting confusion and misunderstanding.”53
Developing “a report card format that uses multiple school indicators that more
adequately reflect a school performance profile.”54
Enlisting the services of assessment and evaluation experts in designing school
accountability systems.
While we find these recommendations sound, we believe that alone they are too narrow,
that they fail to take into consideration the need to consider the role and responsibilities of
an educational system within a democratic society. Therefore, we add our own
recommendations to those above, noting we believe these are relevant not only to A-F
grading systems but to all school accountability systems.
Given the above discussion, we recommend that in determining accountability systems for
schools, policymakers:
Enable democratic deliberation over the many possible purposes of schooling in a
democratic society before determining assessment criteria. The indicators of
“school quality” must be determined through authentic conversation, reflecting the
voices and experiences of all members of our democratic society—not just the
narrow vision of policymakers.
Ensure that accountability systems promote, rather than neglect or inhibit, the
formation of democratic character—which must be consciously cultivated. While
democratic outcomes may not be the only legitimate goal for public schools, they
surely should be counted among the most essential.
http://nepc.colorado.edu/publication/why-school-report-cards-fail 14 of 26
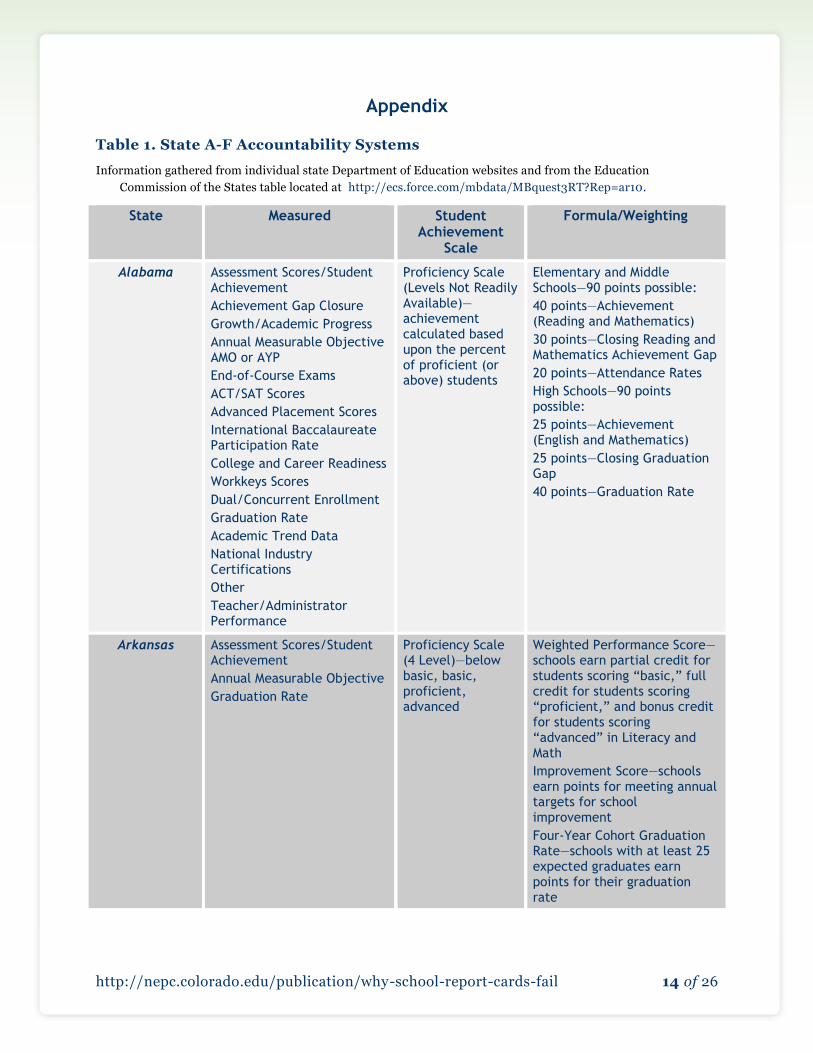
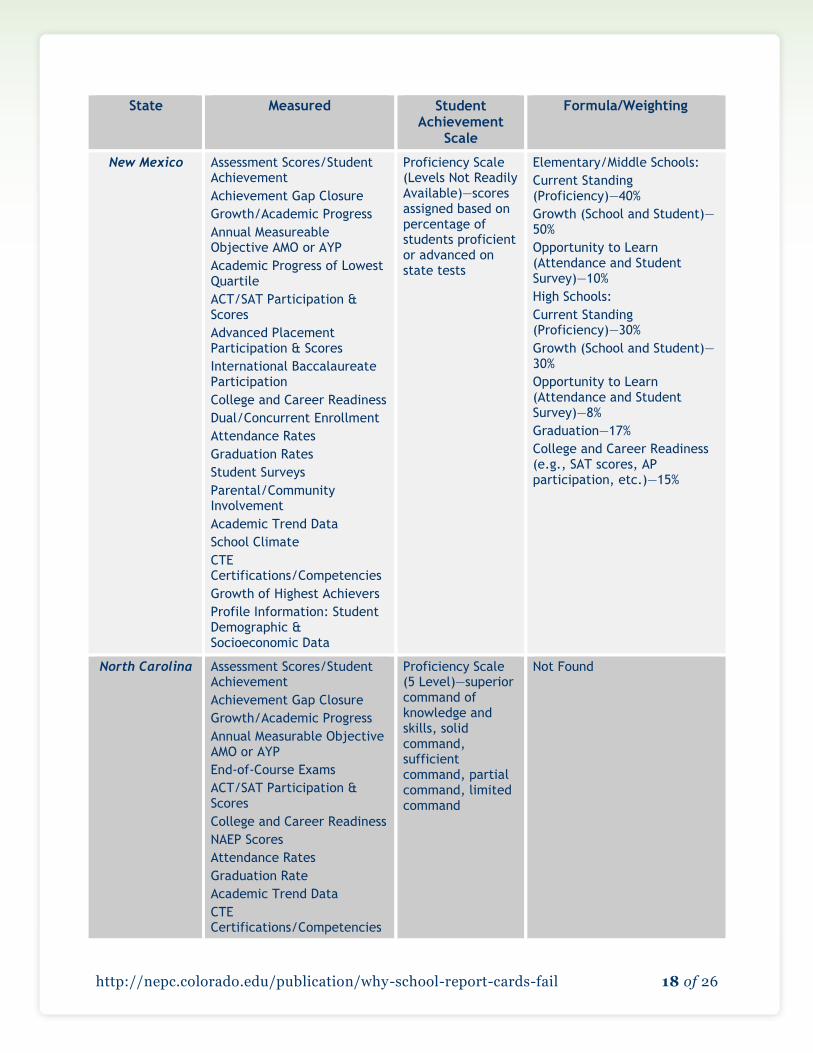
Appendix
Table 1. State A-F Accountability Systems
Information gathered from individual state Department of Education websites and from the Education
Commission of the States table located at http://ecs.force.com/mbdata/MBquest3RT?Rep=ar10.
State Measured Student Achievement
Scale
Formula/Weighting
Alabama Assessment Scores/Student Achievement
Achievement Gap Closure
Growth/Academic Progress
Annual Measurable Objective AMO or AYP
End-of-Course Exams
ACT/SAT Scores
Advanced Placement Scores
International Baccalaureate Participation Rate
College and Career Readiness
Workkeys Scores
Dual/Concurrent Enrollment
Graduation Rate
Academic Trend Data
National Industry Certifications
Other
Teacher/Administrator Performance
Proficiency Scale (Levels Not Readily Available)—achievement calculated based upon the percent of proficient (or above) students
Elementary and Middle Schools—90 points possible:
40 points—Achievement (Reading and Mathematics)
30 points—Closing Reading and Mathematics Achievement Gap
20 points—Attendance Rates
High Schools—90 points possible:
25 points—Achievement (English and Mathematics)
25 points—Closing Graduation Gap
40 points—Graduation Rate
Arkansas Assessment Scores/Student Achievement
Annual Measurable Objective
Graduation Rate
Proficiency Scale (4 Level)—below basic, basic, proficient, advanced
Weighted Performance Score—schools earn partial credit for students scoring “basic,” full credit for students scoring “proficient,” and bonus credit for students scoring “advanced” in Literacy and Math
Improvement Score—schools earn points for meeting annual targets for school improvement
Four-Year Cohort Graduation Rate—schools with at least 25 expected graduates earn points for their graduation rate
http://nepc.colorado.edu/publication/why-school-report-cards-fail 15 of 26
State Measured Student Achievement
Scale
Formula/Weighting
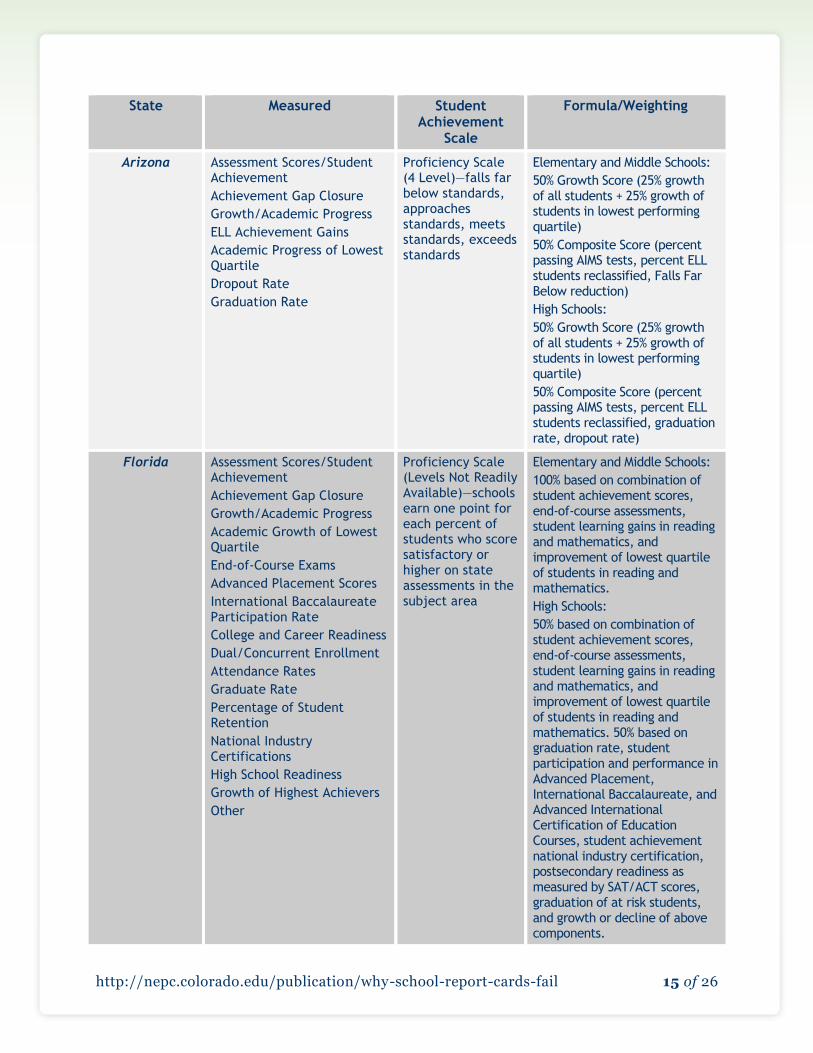
Arizona Assessment Scores/Student Achievement
Achievement Gap Closure
Growth/Academic Progress
ELL Achievement Gains
Academic Progress of Lowest Quartile
Dropout Rate
Graduation Rate
Proficiency Scale (4 Level)—falls far below standards, approaches standards, meets standards, exceeds standards
Elementary and Middle Schools:
50% Growth Score (25% growth of all students + 25% growth of students in lowest performing quartile)
50% Composite Score (percent passing AIMS tests, percent ELL students reclassified, Falls Far Below reduction)
High Schools:
50% Growth Score (25% growth of all students + 25% growth of students in lowest performing quartile)
50% Composite Score (percent passing AIMS tests, percent ELL students reclassified, graduation rate, dropout rate)
Florida Assessment Scores/Student Achievement
Achievement Gap Closure
Growth/Academic Progress
Academic Growth of Lowest Quartile
End-of-Course Exams
Advanced Placement Scores
International Baccalaureate Participation Rate
College and Career Readiness
Dual/Concurrent Enrollment
Attendance Rates
Graduate Rate
Percentage of Student Retention
National Industry Certifications
High School Readiness
Growth of Highest Achievers
Other
Proficiency Scale (Levels Not Readily Available)—schools earn one point for each percent of students who score satisfactory or higher on state assessments in the subject area
Elementary and Middle Schools:
100% based on combination of student achievement scores, end-of-course assessments, student learning gains in reading and mathematics, and improvement of lowest quartile of students in reading and mathematics.
High Schools:
50% based on combination of student achievement scores, end-of-course assessments, student learning gains in reading and mathematics, and improvement of lowest quartile of students in reading and mathematics. 50% based on graduation rate, student participation and performance in Advanced Placement, International Baccalaureate, and Advanced International Certification of Education Courses, student achievement national industry certification, postsecondary readiness as measured by SAT/ACT scores, graduation of at risk students, and growth or decline of above components.
http://nepc.colorado.edu/publication/why-school-report-cards-fail 16 of 26
State Measured Student Achievement
Scale
Formula/Weighting
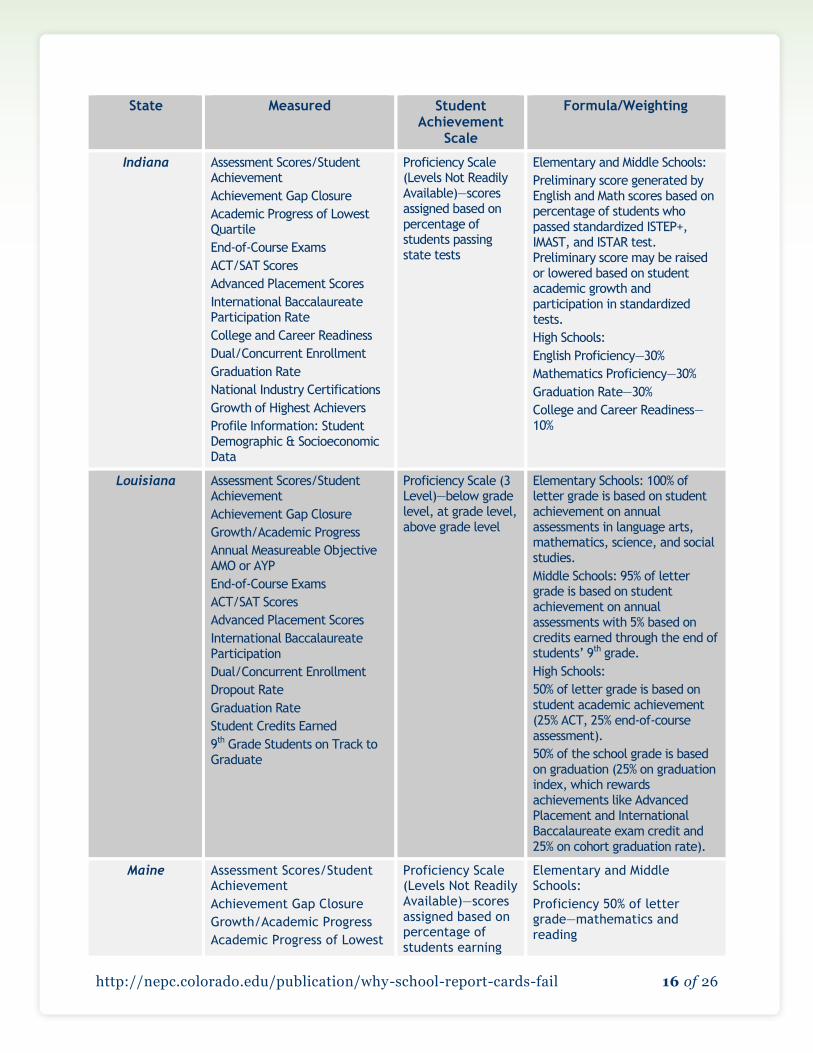
Indiana Assessment Scores/Student Achievement
Achievement Gap Closure
Academic Progress of Lowest Quartile
End-of-Course Exams
ACT/SAT Scores
Advanced Placement Scores
International Baccalaureate Participation Rate
College and Career Readiness
Dual/Concurrent Enrollment
Graduation Rate
National Industry Certifications
Growth of Highest Achievers
Profile Information: Student Demographic & Socioeconomic Data
Proficiency Scale (Levels Not Readily Available)—scores assigned based on percentage of students passing state tests
Elementary and Middle Schools:
Preliminary score generated by English and Math scores based on percentage of students who passed standardized ISTEP+, IMAST, and ISTAR test. Preliminary score may be raised or lowered based on student academic growth and participation in standardized tests.
High Schools:
English Proficiency—30%
Mathematics Proficiency—30%
Graduation Rate—30%
College and Career Readiness—10%
Louisiana Assessment Scores/Student Achievement
Achievement Gap Closure
Growth/Academic Progress
Annual Measureable Objective AMO or AYP
End-of-Course Exams
ACT/SAT Scores
Advanced Placement Scores
International Baccalaureate Participation
Dual/Concurrent Enrollment
Dropout Rate
Graduation Rate
Student Credits Earned
9th Grade Students on Track to Graduate
Proficiency Scale (3 Level)—below grade level, at grade level, above grade level
Elementary Schools: 100% of letter grade is based on student achievement on annual assessments in language arts, mathematics, science, and social studies.
Middle Schools: 95% of letter grade is based on student achievement on annual assessments with 5% based on credits earned through the end of students’ 9th grade.
High Schools:
50% of letter grade is based on student academic achievement (25% ACT, 25% end-of-course assessment).
50% of the school grade is based on graduation (25% on graduation index, which rewards achievements like Advanced Placement and International Baccalaureate exam credit and 25% on cohort graduation rate).
Maine
Assessment Scores/Student Achievement
Achievement Gap Closure
Growth/Academic Progress
Academic Progress of Lowest
Proficiency Scale (Levels Not Readily Available)—scores assigned based on percentage of students earning
Elementary and Middle Schools:
Proficiency 50% of letter grade—mathematics and reading
http://nepc.colorado.edu/publication/why-school-report-cards-fail 17 of 26
State Measured Student Achievement
Scale
Formula/Weighting
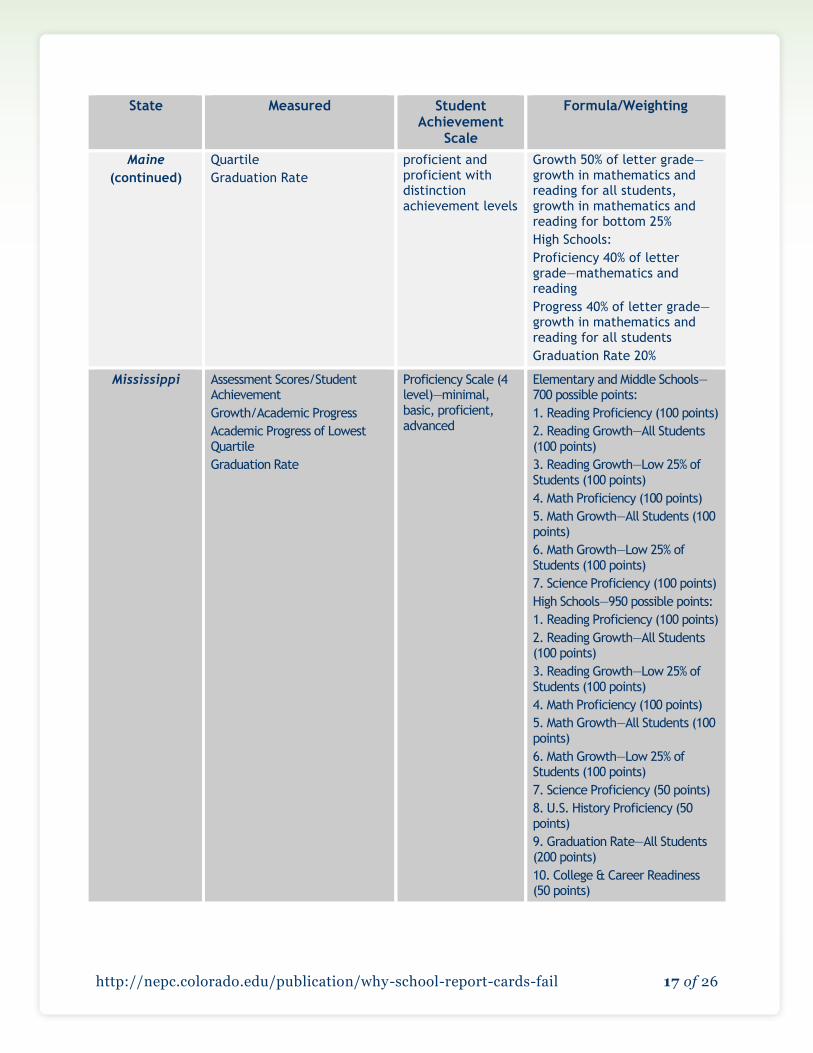
Maine
(continued)
Quartile
Graduation Rate
proficient and proficient with distinction achievement levels
Growth 50% of letter grade—growth in mathematics and reading for all students, growth in mathematics and reading for bottom 25%
High Schools:
Proficiency 40% of letter grade—mathematics and reading
Progress 40% of letter grade—growth in mathematics and reading for all students
Graduation Rate 20%
Mississippi Assessment Scores/Student Achievement
Growth/Academic Progress
Academic Progress of Lowest Quartile
Graduation Rate
Proficiency Scale (4 level)—minimal, basic, proficient, advanced
Elementary and Middle Schools—700 possible points:
1. Reading Proficiency (100 points)
2. Reading Growth—All Students (100 points)
3. Reading Growth—Low 25% of Students (100 points)
4. Math Proficiency (100 points)
5. Math Growth—All Students (100 points)
6. Math Growth—Low 25% of Students (100 points)
7. Science Proficiency (100 points)
High Schools—950 possible points:
1. Reading Proficiency (100 points)
2. Reading Growth—All Students (100 points)
3. Reading Growth—Low 25% of Students (100 points)
4. Math Proficiency (100 points)
5. Math Growth—All Students (100 points)
6. Math Growth—Low 25% of Students (100 points)
7. Science Proficiency (50 points)
8. U.S. History Proficiency (50 points)
9. Graduation Rate—All Students (200 points)
10. College & Career Readiness (50 points)
http://nepc.colorado.edu/publication/why-school-report-cards-fail 18 of 26
State Measured Student Achievement
Scale
Formula/Weighting
New Mexico Assessment Scores/Student Achievement
Achievement Gap Closure
Growth/Academic Progress
Annual Measureable Objective AMO or AYP
Academic Progress of Lowest Quartile
ACT/SAT Participation & Scores
Advanced Placement Participation & Scores
International Baccalaureate Participation
College and Career Readiness
Dual/Concurrent Enrollment
Attendance Rates
Graduation Rates
Student Surveys
Parental/Community Involvement
Academic Trend Data
School Climate
CTE Certifications/Competencies
Growth of Highest Achievers
Profile Information: Student Demographic & Socioeconomic Data
Proficiency Scale (Levels Not Readily Available)—scores assigned based on percentage of students proficient or advanced on state tests
Elementary/Middle Schools:
Current Standing (Proficiency)—40%
Growth (School and Student)—50%
Opportunity to Learn (Attendance and Student Survey)—10%
High Schools:
Current Standing (Proficiency)—30%
Growth (School and Student)—30%
Opportunity to Learn (Attendance and Student Survey)—8%
Graduation—17%
College and Career Readiness (e.g., SAT scores, AP participation, etc.)—15%
North Carolina Assessment Scores/Student Achievement
Achievement Gap Closure
Growth/Academic Progress
Annual Measurable Objective AMO or AYP
End-of-Course Exams
ACT/SAT Participation & Scores
College and Career Readiness
NAEP Scores
Attendance Rates
Graduation Rate
Academic Trend Data
CTE Certifications/Competencies
Proficiency Scale (5 Level)—superior command of knowledge and skills, solid command, sufficient command, partial command, limited command
Not Found
http://nepc.colorado.edu/publication/why-school-report-cards-fail 19 of 26
State Measured Student Achievement
Scale
Formula/Weighting
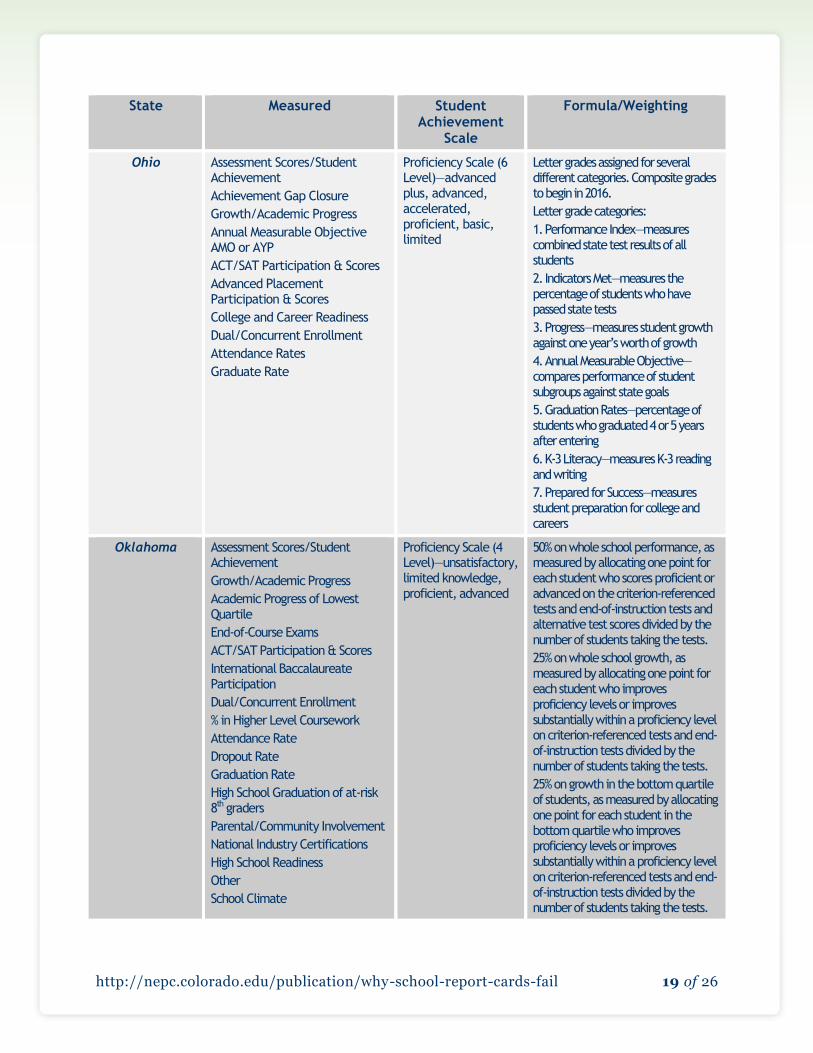
Ohio Assessment Scores/Student Achievement
Achievement Gap Closure
Growth/Academic Progress
Annual Measurable Objective AMO or AYP
ACT/SAT Participation & Scores
Advanced Placement Participation & Scores
College and Career Readiness
Dual/Concurrent Enrollment
Attendance Rates
Graduate Rate
Proficiency Scale (6 Level)—advanced plus, advanced, accelerated, proficient, basic, limited
Letter grades assigned for several different categories. Composite grades to begin in 2016.
Letter grade categories:
1. Performance Index—measures combined state test results of all students
2. Indicators Met—measures the percentage of students who have passed state tests
3. Progress—measures student growth against one year’s worth of growth
4. Annual Measurable Objective—compares performance of student subgroups against state goals
5. Graduation Rates—percentage of students who graduated 4 or 5 years after entering
6. K-3 Literacy—measures K-3 reading and writing
7. Prepared for Success—measures student preparation for college and careers
Oklahoma Assessment Scores/Student Achievement
Growth/Academic Progress
Academic Progress of Lowest Quartile
End-of-Course Exams
ACT/SAT Participation & Scores
International Baccalaureate Participation
Dual/Concurrent Enrollment
% in Higher Level Coursework
Attendance Rate
Dropout Rate
Graduation Rate
High School Graduation of at-risk 8th graders
Parental/Community Involvement
National Industry Certifications
High School Readiness
Other
School Climate
Proficiency Scale (4 Level)—unsatisfactory, limited knowledge, proficient, advanced
50% on whole school performance, as measured by allocating one point for each student who scores proficient or advanced on the criterion-referenced tests and end-of-instruction tests and alternative test scores divided by the number of students taking the tests.
25% on whole school growth, as measured by allocating one point for each student who improves proficiency levels or improves substantially within a proficiency level on criterion-referenced tests and end-of-instruction tests divided by the number of students taking the tests.
25% on growth in the bottom quartile of students, as measured by allocating one point for each student in the bottom quartile who improves proficiency levels or improves substantially within a proficiency level on criterion-referenced tests and end-of-instruction tests divided by the number of students taking the tests.
http://nepc.colorado.edu/publication/why-school-report-cards-fail 20 of 26
State Measured Student Achievement
Scale
Formula/Weighting
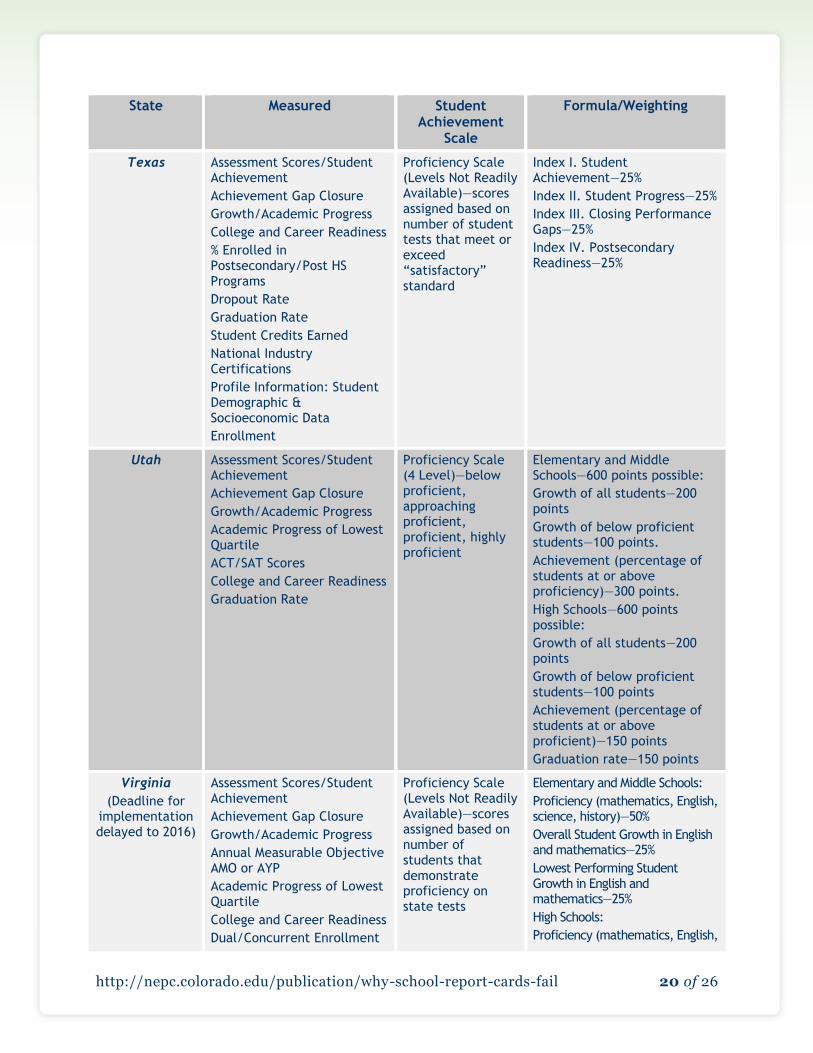
Texas Assessment Scores/Student Achievement
Achievement Gap Closure
Growth/Academic Progress
College and Career Readiness
% Enrolled in Postsecondary/Post HS Programs
Dropout Rate
Graduation Rate
Student Credits Earned
National Industry Certifications
Profile Information: Student Demographic & Socioeconomic Data
Enrollment
Proficiency Scale (Levels Not Readily Available)—scores assigned based on number of student tests that meet or exceed “satisfactory” standard
Index I. Student Achievement—25%
Index II. Student Progress—25%
Index III. Closing Performance Gaps—25%
Index IV. Postsecondary Readiness—25%
Utah Assessment Scores/Student Achievement
Achievement Gap Closure
Growth/Academic Progress
Academic Progress of Lowest Quartile
ACT/SAT Scores
College and Career Readiness
Graduation Rate
Proficiency Scale (4 Level)—below proficient, approaching proficient, proficient, highly proficient
Elementary and Middle Schools—600 points possible:
Growth of all students—200 points
Growth of below proficient students—100 points.
Achievement (percentage of students at or above proficiency)—300 points.
High Schools—600 points possible:
Growth of all students—200 points
Growth of below proficient students—100 points
Achievement (percentage of students at or above proficient)—150 points
Graduation rate—150 points
Virginia
(Deadline for implementation delayed to 2016)
Assessment Scores/Student Achievement
Achievement Gap Closure
Growth/Academic Progress
Annual Measurable Objective AMO or AYP
Academic Progress of Lowest Quartile
College and Career Readiness
Dual/Concurrent Enrollment
Proficiency Scale (Levels Not Readily Available)—scores assigned based on number of students that demonstrate proficiency on state tests
Elementary and Middle Schools:
Proficiency (mathematics, English, science, history)—50%
Overall Student Growth in English and mathematics—25%
Lowest Performing Student Growth in English and mathematics—25%
High Schools:
Proficiency (mathematics, English,
http://nepc.colorado.edu/publication/why-school-report-cards-fail 21 of 26
State Measured Student Achievement
Scale
Formula/Weighting
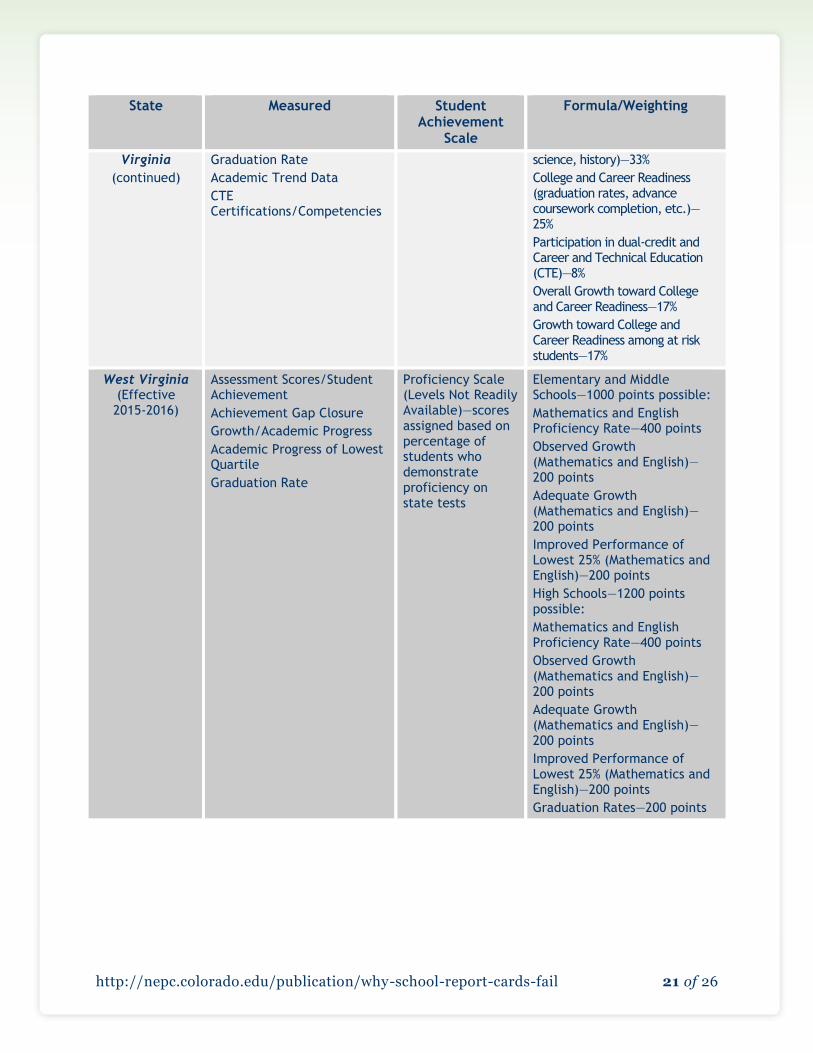
Virginia
(continued)
Graduation Rate
Academic Trend Data
CTE Certifications/Competencies
science, history)—33%
College and Career Readiness (graduation rates, advance coursework completion, etc.)—25%
Participation in dual-credit and Career and Technical Education (CTE)—8%
Overall Growth toward College and Career Readiness—17%
Growth toward College and Career Readiness among at risk students—17%
West Virginia (Effective 2015-2016)
Assessment Scores/Student Achievement
Achievement Gap Closure
Growth/Academic Progress
Academic Progress of Lowest Quartile
Graduation Rate
Proficiency Scale (Levels Not Readily Available)—scores assigned based on percentage of students who demonstrate proficiency on state tests
Elementary and Middle Schools—1000 points possible:
Mathematics and English Proficiency Rate—400 points
Observed Growth (Mathematics and English)—200 points
Adequate Growth (Mathematics and English)—200 points
Improved Performance of Lowest 25% (Mathematics and English)—200 points
High Schools—1200 points possible:
Mathematics and English Proficiency Rate—400 points
Observed Growth (Mathematics and English)—200 points
Adequate Growth (Mathematics and English)—200 points
Improved Performance of Lowest 25% (Mathematics and English)—200 points
Graduation Rates—200 points
http://nepc.colorado.edu/publication/why-school-report-cards-fail 22 of 26
Notes and References
1 For detailed information about state accountability systems, see:
Education Commission of the States (2013, December). School accountability “report cards.” Denver: Author.
Retrieved Jan. 21, 2015, from http://ecs.force.com/mbdata/MBquest3RT?Rep=ar10.
2 Controversy has followed A-F accountability systems. For discussion of Martinez v. New Mexico. See:
Ujifusa, A. (2014, April). A-F school grading targeted in N.M. equity suit. Education Week. Retrieved Jan. 21,
2015, from http://www.edweek.org/ew/articles/2014/04/23/29funding.h33.html
(in print as: N.M. lawsuit puts A-F school grading at center of funding-equity debate; 33 (29), 18-19).
Plaintiffs there argue, among other claims, that the New Mexico A-F accountability system works to separate
the neediest students from good teachers.
3 For additional information about the Florida Opportunity Scholarship Program (OSP), see:
Florida Department of Education (n.d.).Opportunity scholarship program FAQs. Tallahassee, FL: Office of
Independent Education and Parental Choice; Florida Department of Education. Retrieved Jan. 21, 2015, from
http://www.floridaschoolchoice.org/Information/osp/faqs.asp.
The OSP as initially implemented allowed students to enroll in participating private schools. The Florida
Supreme Court declared the OSP private school option unconstitutional in 2006. See:
Dillon, S. (2006, Jan. 6). Florida Supreme Court blocks school vouchers. The New York Times. Retrieved Jan.
21, 2015, from http://www.nytimes.com/2006/01/06/national/06florida.html.
4 For detailed information about Indiana School Accountability, see:
Ind. Code IC § 20-31-9 (Office of Code Revision, Indiana Legislative Services Agency {2010}). Retrieved Jan.
21, 2015, from http://www.in.gov/legislative/ic/2010/title20/ar31/ch9.html.
IC 20-31-9-4 details state intervention into schools that have received six consecutive “F” grades.
5 For a list of Indiana participating choice schools, see:
Indiana Department of Education (2014, Dec. 24). Participating schools. Indianapolis: Author. Retrieved Jan.
21, 2015, from http://www.doe.in.gov/choice/participating-schools.
6 For a detailed examination of the evolution of accountability systems, see:
Meens, D., & Howe, K. (in press). NCLB and its wake: Bad news for democracy. Teachers College Record.
7 See:
Figlio, D.N., & Lucas, M.E. (2004). What’s in a grade? School report cards and the housing market. The
American Economic Review, 94(3), 591-604.
8 Foundation for Florida’s Future (2014). Florida formula for student achievement; school grades Q&A.
Tallahassee, FL: Author. Retrieved Jan. 21, 2015, from
http://www.afloridapromise.org/Pages/Florida_Formula/Facts_on_the_FCAT_and_Floridas_Path_to_Succ
ess/School_Grades_Q_and_A.aspx.
http://nepc.colorado.edu/publication/why-school-report-cards-fail 23 of 26
9 Arizona Department of Education (2013, July 30). The A-F letter grade system. Phoenix: Author, 12.
Retrieved Jan. 21, 2015, from
http://www.azed.gov/research-evaluation/files/2013/08/2013-a-f-letter-grades-guide-for-parents.pdf.
10 Utah State Senate (2013). FAQs. Utah school grading. Salt Lake City: Author. Retrieved Jan. 21, 2015, from
http://utahschoolgrading.com/faq/.
11 Utah State Senate (2013). FAQs. Utah school grading. Salt Lake City: Author. Retrieved Jan. 21, 2015, from
http://utahschoolgrading.com/faq/.
12 Utah State Senate (2013). FAQs. Utah school grading. Salt Lake City: Author. Retrieved Jan. 21, 2015, from
http://utahschoolgrading.com/faq/.
13 Utah State Senate (2013). FAQs. Utah school grading. Salt Lake City: Author. Retrieved Jan. 21, 2015, from
http://utahschoolgrading.com/faq/.
See also the video embedded at:
Utah State Senate (2013).School grading 101. Utah school grading. Salt Lake City: Author. Retrieved Jan. 21,
2015, from http://utahschoolgrading.com/101/.
14 Indiana Department of Education (n.d.). A-F school accountability FAQ. Indianapolis: Author, 1. Retrieved
Jan. 21, 2015, from http://www.svcs.k12.in.us/Downloads/revised-f-faq-101712.pdf.
15 West Virginia Department of Education (n.d.). West Virginia’s A though F school grading system FAQs.
Charleston, WV: author, 1. Retrieved Jan. 21, 2014, from http://static.k12.wv.us/a-f/a-f_faqs_flyer.pdf.
16 For Students First A-F grades and GPA scores, see:
Students First (2014). State Policy Report Card 2014. Sacramento, CA: Author. Retrieved Jan. 21, 2014, from
http://reportcard.studentsfirst.org/.
For grade and GPA methodology, see:
Students First (2014). 2014 SPRC Methodology. State Policy Report Card 2014. Sacramento, CA: Author.
Retrieved Jan. 21, 2014, from http://reportcard.studentsfirst.org/assets/2014Methodology.pdf.
17 Students First (2014). Pillar: Empower Parents. State Policy Report Card 2014. Sacramento, CA: Author.
Retrieved Jan. 21, 2014, from
http://reportcard.studentsfirst.org/policy/empower_parents/empower_parents_with_information
18 Ladner, M., & Myslinksi, D.J. (2014). Report card on American education. Arlington, VA: American
Legislative Exchange Council, 2.
19 The Oklahoma Center for Education Policy and The Center for Educational Research and Evaluation (2013,
January). An examination of the Oklahoma state department of education’s report card . Norman and
Stillwater, OK: OCEP and CERE;
The Oklahoma Center for Education Policy and The Center for Educational Research and Evaluation. (October
2013). Oklahoma school grades: Hiding “poor” achievement. Norman and Stillwater, OK: OCEP and CERE.
20 The Ohio A-F accountability system does not yet assign single composite letter grades to express school
quality. Single letter grades will be assigned to schools beginning in 2016. Now the Ohio A-F system assigns a
variety of letter grades to schools for different outcomes: achievement, progress, graduation rate, gap closing,
and so on.
21 The Oklahoma Center for Education Policy and The Center for Educational Research and Evaluation (2013,
January). An examination of the Oklahoma state department of education’s report card . Norman and
Stillwater, OK: OCEP and CERE, 12.
http://nepc.colorado.edu/publication/why-school-report-cards-fail 24 of 26
22 Dean Ho, A. (2008). The problem with “proficiency”: Limitations of statistics and policy under No Child Left
Behind. Educational Researcher, 37(6), 351-360.
23 The Oklahoma Center for Education Policy and The Center for Educational Research and Evaluation. (2013,
October). Oklahoma school grades: Hiding “poor” achievement. Norman and Stillwater, OK: OCEP and
CERE, 12-14.
24 In Oklahoma, 33% of the grade in based on status achievement scores and another 34% is based on student
growth as a function achievement scores. In all states in which we were able to determine the weightings,
achievement scores are heavily weighed, accounting for a least 50% and often more. See the table for more
detail.
25 The Oklahoma Center for Education Policy and The Center for Educational Research and Evaluation. (2013,
October). Oklahoma school grades: Hiding “poor” achievement. Norman and Stillwater, OK: OCEP and
CERE, 13.
26 The Oklahoma Center for Education Policy and The Center for Educational Research and Evaluation (2013,
October). Oklahoma school grades: Hiding “poor” achievement. Norman and Stillwater, OK: OCEP and
CERE, 5.
27 Coleman, J.S., Campbell, E.Q., Hobson, C.J., McPartland, J., Mood, A.M., Weinfred, F.D., & York, R.L. (1966).
Equality of Educational Opportunity. Washington, D.C.: U.S. Department of Health, Education & Welfare.
28 Borman, G., & Dowling, M. (2010). Schools and inequality: A multilevel analysis of Coleman’s equality of
educational opportunity data. Teachers College Record, 122(5), 1201-1246.
29 The majority of available evidence reveals that approximately sixty percent of achievement outcomes is
explained by factors outside of classrooms and schools. See, for example:
Rowan, B., Correnti, R., & Miller, R. (2002). What large-scale survey research tells us about teacher effects on
student achievement: Insights from the Prospects Study of Elementary Schools. Teachers College Record,
104(8), 1525-1567;
Nye, B., Konstantopoulos, S., & Hedges, L.V. (2004). How large are teacher effects? Educational Evaluation
and Policy Analysis, 26(3), 237-257;
Rockoff, J.E. (2004). The impact of individual teachers on student achievement: Evidence from panel data.
The American Economic Review, 94(2), 247-252.
30 The Oklahoma Center for Education Policy and The Center for Educational Research and Evaluation (2013,
January). An examination of the Oklahoma state department of education’s report card . Norman and
Stillwater, OK: OCEP and CERE, 5.
31 The Oklahoma Center for Education Policy and The Center for Educational Research and Evaluation (2013,
January). An examination of the Oklahoma state department of education’s report card . Norman and
Stillwater, OK: OCEP and CERE, 15.
32 The Oklahoma Center for Education Policy and The Center for Educational Research and Evaluation (2013,
October). Oklahoma school grades: Hiding “poor” achievement. Norman and Stillwater, OK: OCEP and
CERE, 8.
33 See Mikulecky, M., & Christie, K. (2014). Rating states, grading schools: What parents and experts say states
should consider to make school accountability systems meaningful. Denver, Co: Education Commission of the
States, 9-13.
http://nepc.colorado.edu/publication/why-school-report-cards-fail 25 of 26
34 The Oklahoma Center for Education Policy and The Center for Educational Research and Evaluation. (2013,
January). An examination of the Oklahoma state department of education’s report card. Norman and
Stillwater, OK: OCEP and CERE, 18.
35 For detailed information about A-F school grade measures in each state, see:
Education Commission of the States (2013, December). School accountability “report cards.” Denver: Author.
Retrieved Jan. 21, 2015, from http://ecs.force.com/mbdata/MBquest3RT?Rep=ar10.
36 See, for example:
Students First (n.d.). Empowering parents with data: School report cards. Sacramento: Author. Retrieved
Jan. 21, 2015, from http://edref.3cdn.net/7f6ad0c1a7ad374c0f_com6idps5.pdf.
37 See, for example:
Arizona Department of Education (2013, July 30). The A-F letter grade system. Phoenix: Author, 12.
Retrieved Jan. 21, 2015, from
http://www.azed.gov/research-evaluation/files/2013/08/2013-a-f-letter-grades-guide-for-parents.pdf.
38 See, for example:
Utah State Senate (2013). FAQs. Utah school grading. Salt Lake City: Author. Retrieved Jan. 21, 2015, from
http://utahschoolgrading.com/faq/.
39 Rhodes, J.H. (2014). Learning citizenship? How state education reforms affect parents’ political attitudes and
behavior. Political Behavior (forthcoming). Rhodes’ review of the existing literature revealed little empirical
investigation into the effects of school accountability reform on democratic politics.
40 Rhodes, J.H. (2014). Learning citizenship? How state education reforms affect parents’ political attitudes and
behavior. Political Behavior (forthcoming), 3.
41 Rhodes, J.H. (2014). Learning citizenship? How state education reforms affect parents’ political attitudes and
behavior. Political Behavior (forthcoming), 3.
42 A-F school grading systems meet many of Rhodes’ criteria for determining which accountability systems count
as “highly developed” and thereby suppress parental participation. These highly developed accountability
systems include: (1) school ratings to measure school performance, (2) a statewide student-identification
system, allowing the state to link student test scores with schools or teachers, (3) rewards for high-performing
or improving schools, (4) assistance to low-performing schools, and (5) sanctions for lower-performing
schools. Thus Rhodes’ arguments apply broadly to A-F systems.
43 See:
American Educational Research Association (2000). AERA position statement on high-stakes testing in pre-k
– 12 education. Washington, DC: Retrieved Jan. 21, 2015, from
http://www.aera.net/Default.aspx?TabId=11083.
44 Baker, E. L., Barton, P. E., Darling-Hammond, L., Haertel, E., Ladd, H. F. Linn, R. L., Ravitch, D. Rothstein,
R. Shavelson, R. J., & Shepard, L. A. (2010). Problems with the use of student test scores to evaluate teachers.
Washington, DC: The Economic Policy Institute.
45 The Oklahoma Center for Education Policy and The Center for Educational Research and Evaluation. (October
2013). Oklahoma school grades: Hiding “poor” achievement. Norman and Stillwater, OK: OCEP and CERE,
27.
http://nepc.colorado.edu/publication/why-school-report-cards-fail 26 of 26
46 The Oklahoma Center for Education Policy and The Center for Educational Research and Evaluation. (October
2013). Oklahoma school grades: Hiding “poor” achievement. Norman and Stillwater, OK: OCEP and CERE,
27.
47 See:
Indiana Department of Education (n.d.). A-F school accountability FAQ. Indianapolis: Author, 2. Retrieved
Jan. 21, 2015, from http://www.svcs.k12.in.us/Downloads/revised-f-faq-101712.pdf.
48 Moses, M.S., & Rogers, J. (2013). Enhancing a nation’s democracy through equitable schools. In P. Carter and
K.G. Welner (Eds.), Closing the opportunity gap: What America must do to give every child an even chance
(207-216). New York: Oxford University Press.
49 Louisiana Department of Education. (2013). Louisiana believes: Letter grade results Fall 2013 [PowerPoint
slides]. Retrieved Jan. 21, 2015, from
http://www.louisianabelieves.com/docs/test-results/10-24-13-report-card-presentation-
(thursday).pdf?sfvrsn=4.
50 Meens, D., & Howe, K. (in press). NCLB and its wake: Bad news for democracy. Teachers College Record.
51 Robelen, E. (2011, December 8) Most teachers see the curriculum narrowing, survey finds (blog post).
EdWeekOnline. Retrieved December 18, 2014, from
http://blogs.edweek.org/edweek/curriculum/2011/12/most_teachers_see_the_curricul.html/.
National Center for Fair and Open Testing (FairTest) (2007, October). New evidence strengthens claim that
testing narrows curriculum. FairTest Examiner. Retrieved December 18, 2014, from
http://www.fairtest.org/new-evidence-strengthens-claim-testing-narrows-cur/.
52 Howe, K., & Means, D. (2012). Democracy left behind: How recent education reforms undermine local
control and democratic education. Boulder, CO: National Education Policy Center. Retrieved Jan. 21, 2015,
from http://nepc.colorado.edu/publication/democracy-left-behind.
53 The Oklahoma Center for Education Policy and The Center for Educational Research and Evaluation (2013,
January). An examination of the Oklahoma state department of education’s report card . Norman and
Stillwater, OK: OCEP and CERE, 6.
54 The Oklahoma Center for Education Policy and The Center for Educational Research and Evaluation (2013,
January). An examination of the Oklahoma state department of education’s report card . Norman and
Stillwater, OK: OCEP and CERE, 6.


