Embed Size (px)
Citation preview
EITI Board 29 June 2018
Key performance indicators Measuring the impact of the EITI
Key performance indicators of the EITI
2
KEY PERFORMANCE INDICATORS OF THE EITI
The EITI’s key performance indicators (KPI) are rooted in the organisation’sFigure 2: The theory of change and measure the effectiveness of the EITI’ international management1: at the international level, implementing country2 level and the International Secretariat and Board level.
• Impact indicators, or “big picture” indicators, measure the direction of travel of EITI countries based on indexes that measure the quality of governance. Although not attributable to any single organisation, selected proxy indicators such as investment climate, human capital spending, corruption and poverty levels are all relevant to the EITI’s goals. If the EITI is successfully being implemented in accordance with its Principles, countries should score better every year on those selected indexes. See Table 1: Impact indicators.
• Outcome indicators quantify the number of countries with transparent systems. These are based on the outcomes of Validation, the quality assurance mechanism of EITI implementation. It measures the number of countries that have achieved “satisfactory progress” or “beyond” on the related EITI Requirements.
The level of transparency can partly be attributed to EITI implementation. Other factors, such as political will and opportunity, as well as work by partners (for example the World Bank and NRGI) may also impact a country’s performance. See Table 2: Outcome indicators level 1 and Table 3: Outcome indicators level 2.
• Secretariat’s effectiveness indicators that monitor value for money. These can be directly linked to the International Secretariat’s and the EITI Board’s activity: input and output in relationship to the allocation of budget and staff time. See Table 1: Input, activities and output indicators.
The KPIs are the result of a review3 conducted by a working group in 2017 that produced a new proposal. The most significant change is the introduction of Validation results (outcome indicators) as key performance indicators. There are challenges in linking the EITI’s KPIs to Validation results, as these reflect the progress a country is making towards meeting the EITI Requirements based on data from EITI Reports, which is usually published with a two-year delay. However, it is data produced through the most rigorous process available for assessing progress and is closely linked to the EITI Principles4. The proposed changes ensure a framework that accommodates for any future alterations to the EITI Standard, as such changes will also affect Validation procedures and results.
1 The EITI Board and International Secretariat make up the EITI international management 2 For a list of implementing countries, see eiti.org/countries 3 The previous KPIs date from July 2010: https://eiti.org/document/eiti-process-outcome-indicators. For a comparison of the changes, email the [email protected]. The basis of this paper is Board paper 40-4-C 4 See http://eiti.org/document/eiti-principles
Key performance indicators of the EITI
3
Other changes involve refining the Secretariat’s effectiveness. The former framework did not sufficiently distinguish between the inputs/activities and immediate results (outputs).
The big picture indicators monitor the broadly-stated objectives, known as the EITI Principles. They have been revised as well, removing some where data availability was an issue. The Human Development index overall score and NRGI’s Resource Governance Index scores were added. The figures from these indicators are compared to global averages, where applicable, to show how EITI countries fare in comparison to the rest of world.
The International Secretariat begins reporting on these as of 2018. The performance is documented yearly in the Secretariat Work plan5, under the annex "Key Performance Indicators (KPIs)".
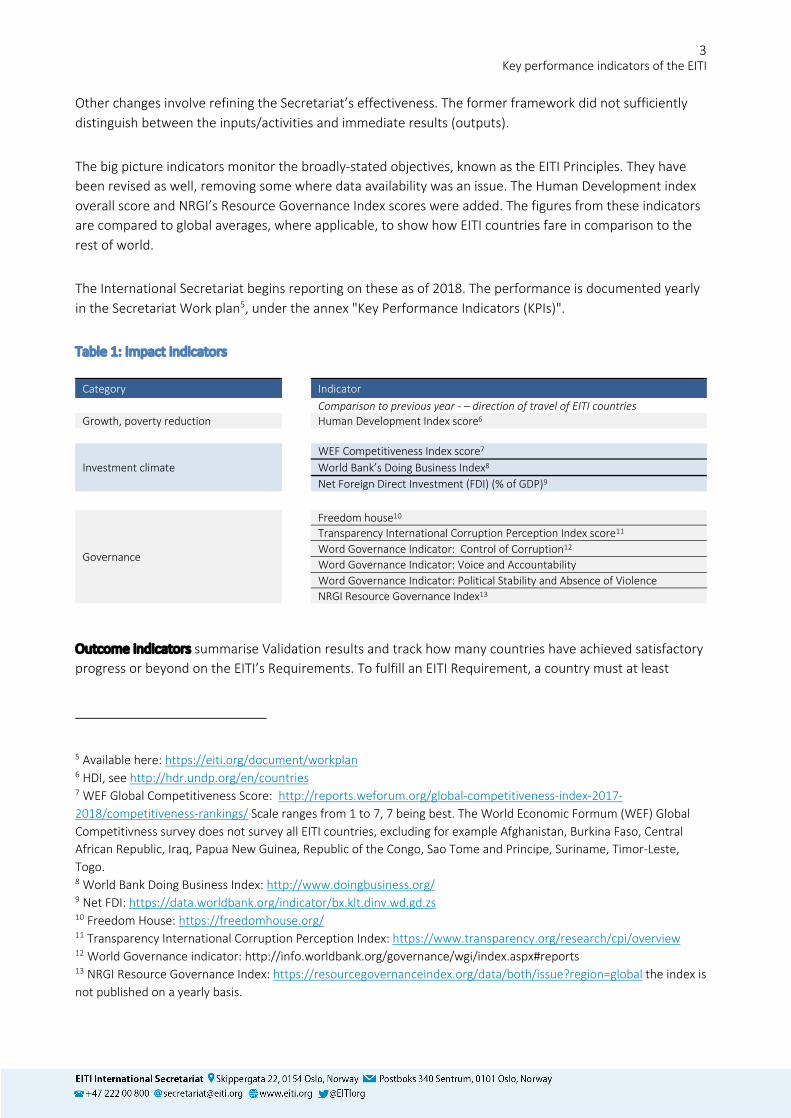
Table 1: Impact indicators
Category Indicator
Comparison to previous year - – direction of travel of EITI countries Growth, poverty reduction Human Development Index score6
Investment climate WEF Competitiveness Index score7 World Bank’s Doing Business Index8 Net Foreign Direct Investment (FDI) (% of GDP)9
Governance
Freedom house10 Transparency International Corruption Perception Index score11 Word Governance Indicator: Control of Corruption12 Word Governance Indicator: Voice and Accountability Word Governance Indicator: Political Stability and Absence of Violence NRGI Resource Governance Index13
Outcome indicators summarise Validation results and track how many countries have achieved satisfactory progress or beyond on the EITI’s Requirements. To fulfill an EITI Requirement, a country must at least
5 Available here: https://eiti.org/document/workplan 6 HDI, see http://hdr.undp.org/en/countries 7 WEF Global Competitiveness Score: http://reports.weforum.org/global-competitiveness-index-2017-2018/competitiveness-rankings/ Scale ranges from 1 to 7, 7 being best. The World Economic Formum (WEF) Global Competitivness survey does not survey all EITI countries, excluding for example Afghanistan, Burkina Faso, Central African Republic, Iraq, Papua New Guinea, Republic of the Congo, Sao Tome and Principe, Suriname, Timor-Leste, Togo. 8 World Bank Doing Business Index: http://www.doingbusiness.org/ 9 Net FDI: https://data.worldbank.org/indicator/bx.klt.dinv.wd.gd.zs 10 Freedom House: https://freedomhouse.org/ 11 Transparency International Corruption Perception Index: https://www.transparency.org/research/cpi/overview 12 World Governance indicator: http://info.worldbank.org/governance/wgi/index.aspx#reports 13 NRGI Resource Governance Index: https://resourcegovernanceindex.org/data/both/issue?region=global the index is not published on a yearly basis.
Key performance indicators of the EITI
4
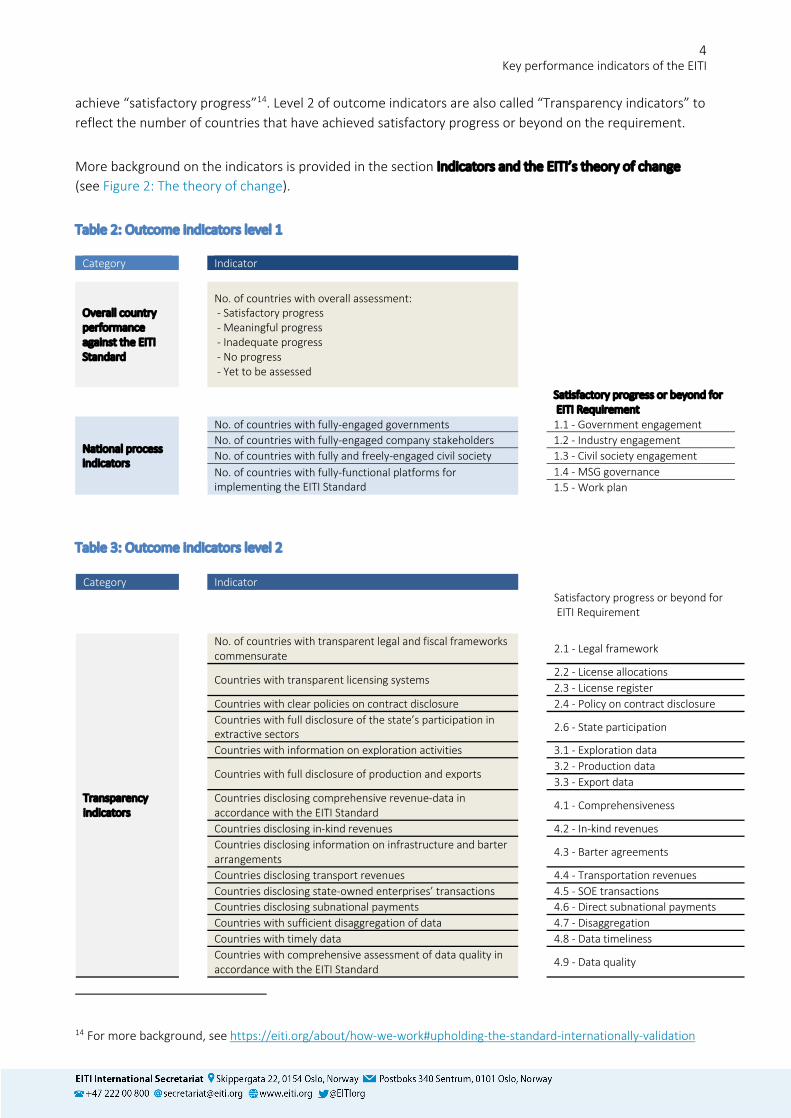
achieve “satisfactory progress”14. Level 2 of outcome indicators are also called “Transparency indicators” to reflect the number of countries that have achieved satisfactory progress or beyond on the requirement.
More background on the indicators is provided in the section Indicators and the EITI’s theory of change (see Figure 2: The theory of change).
Table 2: Outcome indicators level 1
Category Indicator
Overall country performance against the EITI Standard
No. of countries with overall assessment: - Satisfactory progress - Meaningful progress - Inadequate progress - No progress - Yet to be assessed
Satisfactory progress or beyond for
EITI Requirement
National process indicators
No. of countries with fully-engaged governments 1.1 - Government engagement No. of countries with fully-engaged company stakeholders 1.2 - Industry engagement No. of countries with fully and freely-engaged civil society 1.3 - Civil society engagement No. of countries with fully-functional platforms for
implementing the EITI Standard 1.4 - MSG governance
1.5 - Work plan
Table 3: Outcome indicators level 2
Category Indicator
Satisfactory progress or beyond for
EITI Requirement
Transparency indicators
No. of countries with transparent legal and fiscal frameworks commensurate
2.1 - Legal framework
Countries with transparent licensing systems
2.2 - License allocations 2.3 - License register Countries with clear policies on contract disclosure 2.4 - Policy on contract disclosure Countries with full disclosure of the state’s participation in
extractive sectors
2.6 - State participation
Countries with information on exploration activities 3.1 - Exploration data
Countries with full disclosure of production and exports 3.2 - Production data
3.3 - Export data Countries disclosing comprehensive revenue-data in
accordance with the EITI Standard
4.1 - Comprehensiveness
Countries disclosing in-kind revenues 4.2 - In-kind revenues Countries disclosing information on infrastructure and barter
arrangements
4.3 - Barter agreements
Countries disclosing transport revenues 4.4 - Transportation revenues Countries disclosing state-owned enterprises’ transactions 4.5 - SOE transactions Countries disclosing subnational payments 4.6 - Direct subnational payments Countries with sufficient disaggregation of data 4.7 - Disaggregation Countries with timely data 4.8 - Data timeliness Countries with comprehensive assessment of data quality in
accordance with the EITI Standard
4.9 - Data quality
14 For more background, see https://eiti.org/about/how-we-work#upholding-the-standard-internationally-validation
Key performance indicators of the EITI
5
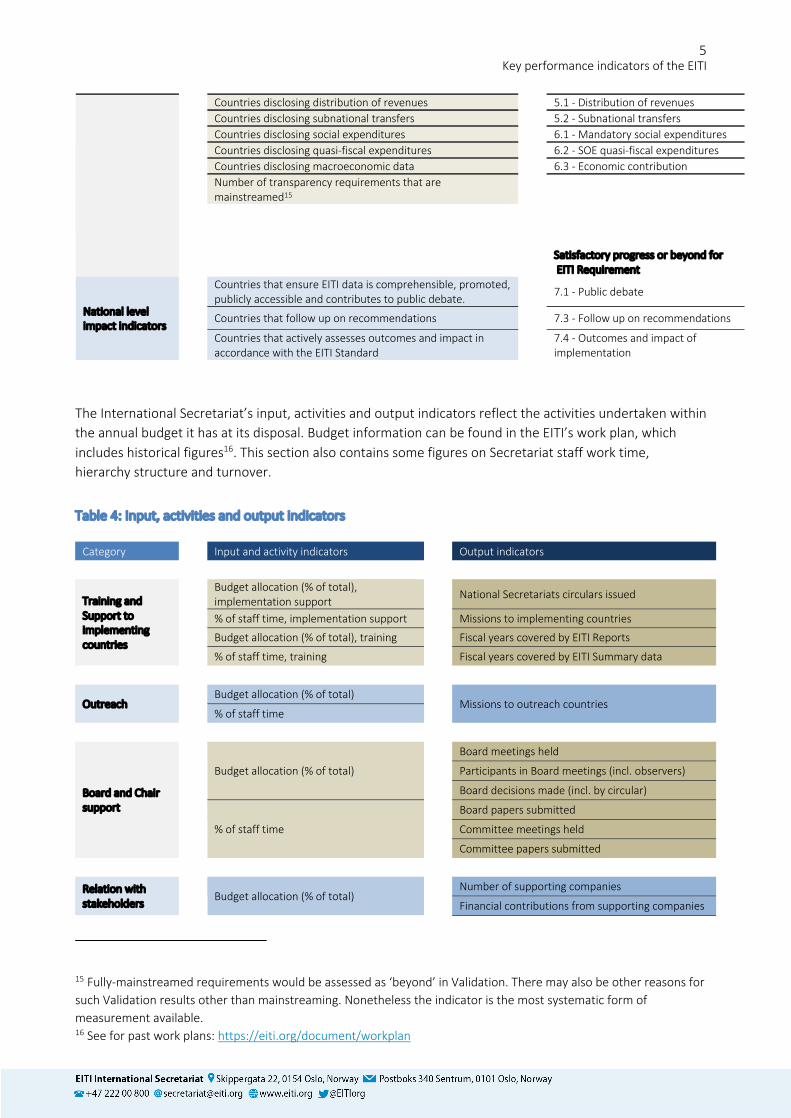
Countries disclosing distribution of revenues 5.1 - Distribution of revenues Countries disclosing subnational transfers 5.2 - Subnational transfers Countries disclosing social expenditures 6.1 - Mandatory social expenditures Countries disclosing quasi-fiscal expenditures 6.2 - SOE quasi-fiscal expenditures Countries disclosing macroeconomic data 6.3 - Economic contribution Number of transparency requirements that are
mainstreamed15
Satisfactory progress or beyond for
EITI Requirement
National level impact indicators
Countries that ensure EITI data is comprehensible, promoted, publicly accessible and contributes to public debate.
7.1 - Public debate
Countries that follow up on recommendations 7.3 - Follow up on recommendations
Countries that actively assesses outcomes and impact in accordance with the EITI Standard
7.4 - Outcomes and impact of implementation
The International Secretariat’s input, activities and output indicators reflect the activities undertaken within the annual budget it has at its disposal. Budget information can be found in the EITI’s work plan, which includes historical figures16. This section also contains some figures on Secretariat staff work time, hierarchy structure and turnover.
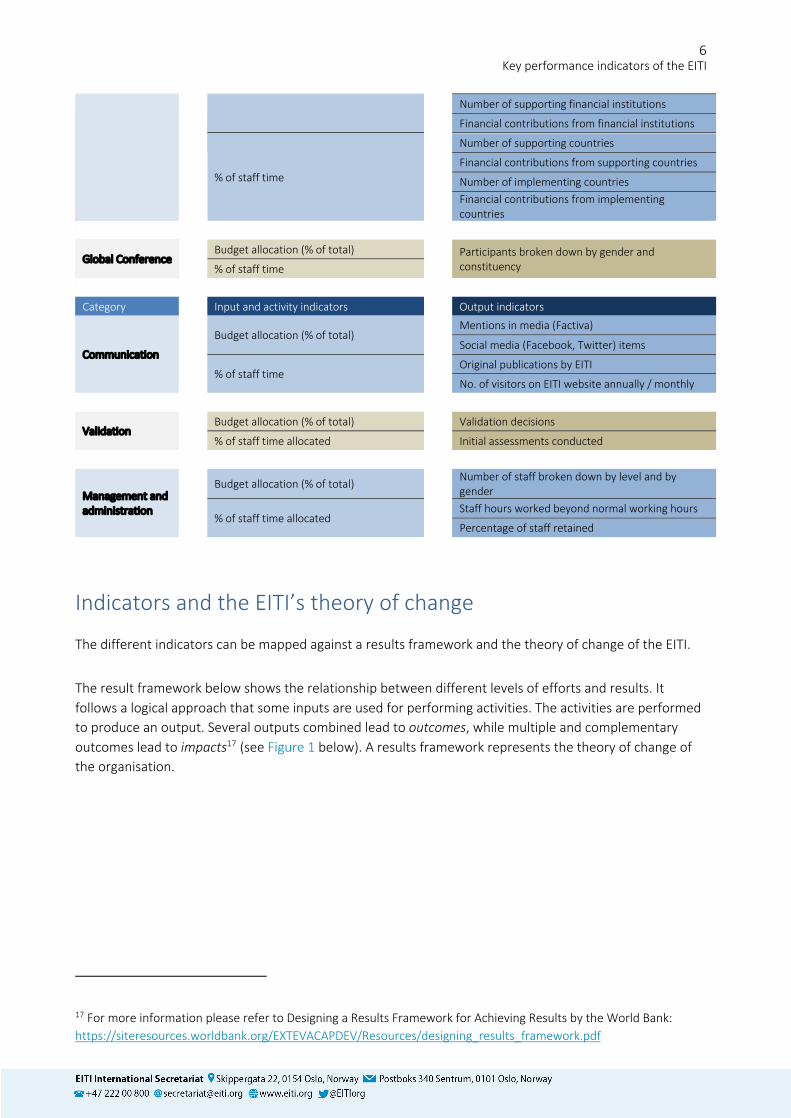
Table 4: Input, activities and output indicators
Category Input and activity indicators Output indicators
Training and Support to implementing countries
Budget allocation (% of total), implementation support
National Secretariats circulars issued
% of staff time, implementation support Missions to implementing countries
Budget allocation (% of total), training Fiscal years covered by EITI Reports
% of staff time, training Fiscal years covered by EITI Summary data
Outreach Budget allocation (% of total)
Missions to outreach countries % of staff time
Board and Chair support
Budget allocation (% of total)
Board meetings held
Participants in Board meetings (incl. observers)
Board decisions made (incl. by circular)
% of staff time
Board papers submitted
Committee meetings held
Committee papers submitted
Relation with stakeholders
Budget allocation (% of total)
Number of supporting companies
Financial contributions from supporting companies
15 Fully-mainstreamed requirements would be assessed as ‘beyond’ in Validation. There may also be other reasons for such Validation results other than mainstreaming. Nonetheless the indicator is the most systematic form of measurement available. 16 See for past work plans: https://eiti.org/document/workplan
Key performance indicators of the EITI
6
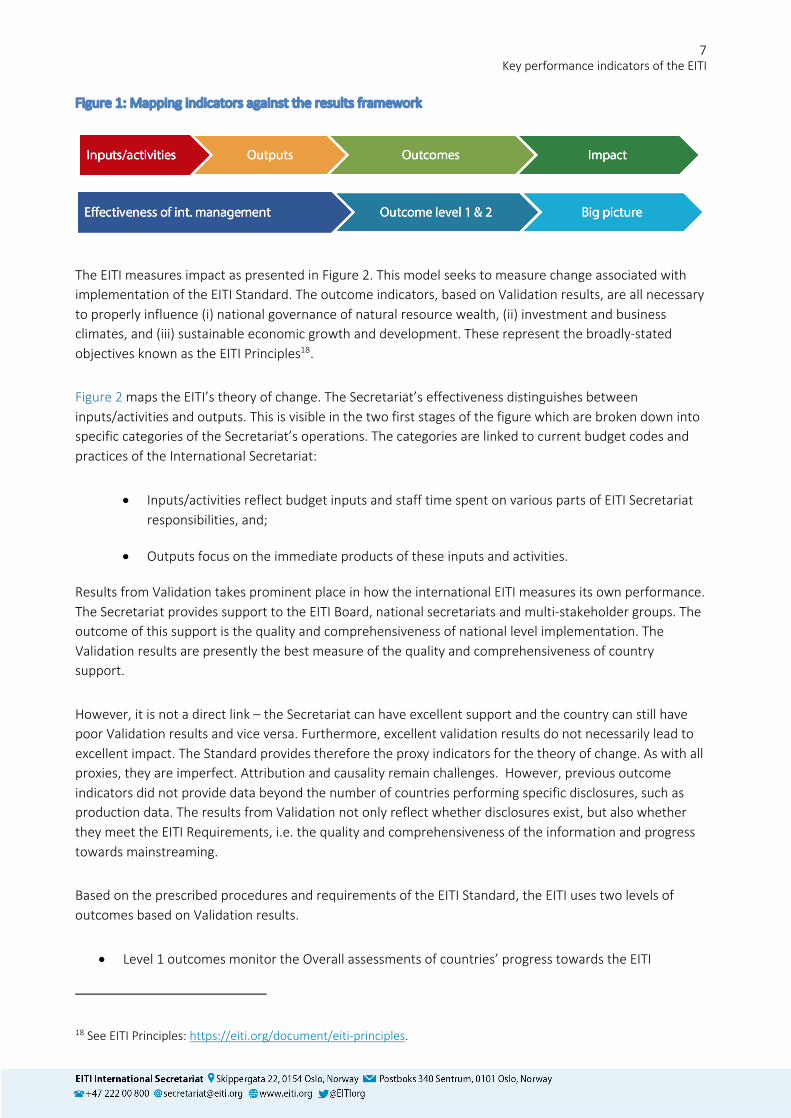
Number of supporting financial institutions
Financial contributions from financial institutions
% of staff time
Number of supporting countries
Financial contributions from supporting countries
Number of implementing countries
Financial contributions from implementing countries
Global Conference Budget allocation (% of total) Participants broken down by gender and
constituency % of staff time
Category Input and activity indicators Output indicators
Communication
Budget allocation (% of total)
Mentions in media (Factiva)
Social media (Facebook, Twitter) items
% of staff time
Original publications by EITI
No. of visitors on EITI website annually / monthly
Validation Budget allocation (% of total) Validation decisions
% of staff time allocated Initial assessments conducted
Management and administration
Budget allocation (% of total)
Number of staff broken down by level and by gender
% of staff time allocated
Staff hours worked beyond normal working hours
Percentage of staff retained
Indicators and the EITI’s theory of change
The different indicators can be mapped against a results framework and the theory of change of the EITI.
The result framework below shows the relationship between different levels of efforts and results. It follows a logical approach that some inputs are used for performing activities. The activities are performed to produce an output. Several outputs combined lead to outcomes, while multiple and complementary outcomes lead to impacts17 (see Figure 1 below). A results framework represents the theory of change of the organisation.
17 For more information please refer to Designing a Results Framework for Achieving Results by the World Bank: https://siteresources.worldbank.org/EXTEVACAPDEV/Resources/designing_results_framework.pdf
Key performance indicators of the EITI
7
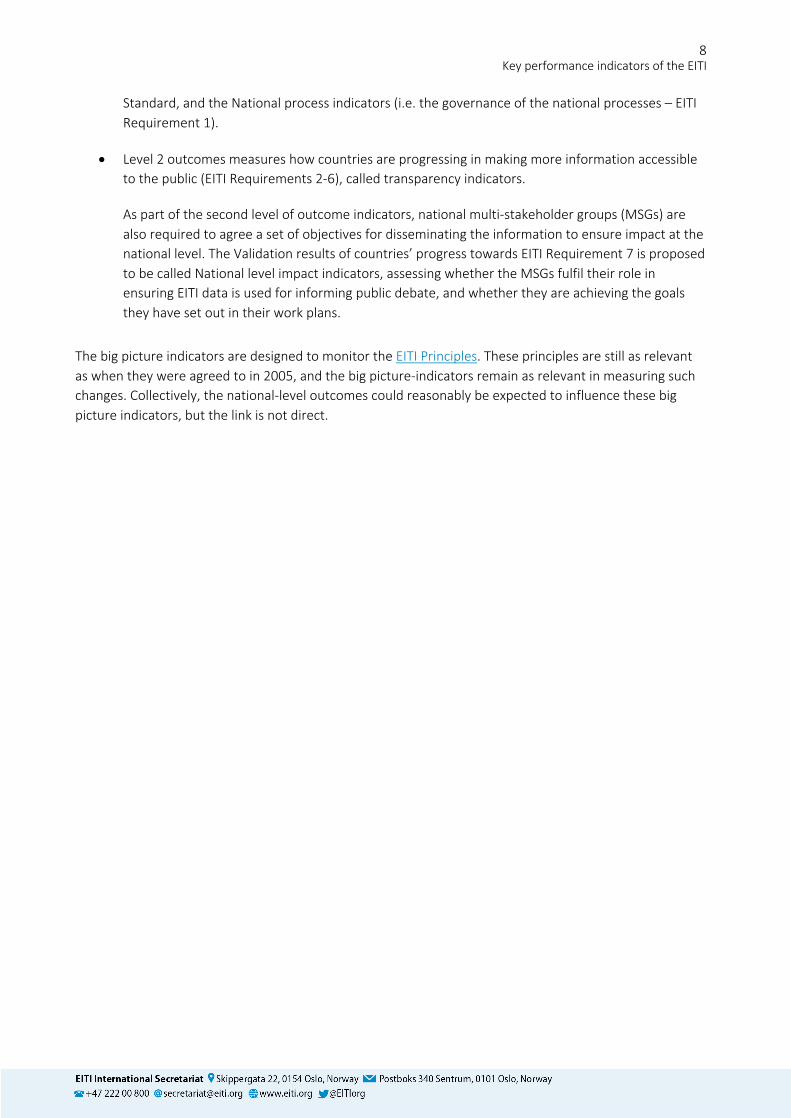
Figure 1: Mapping indicators against the results framework
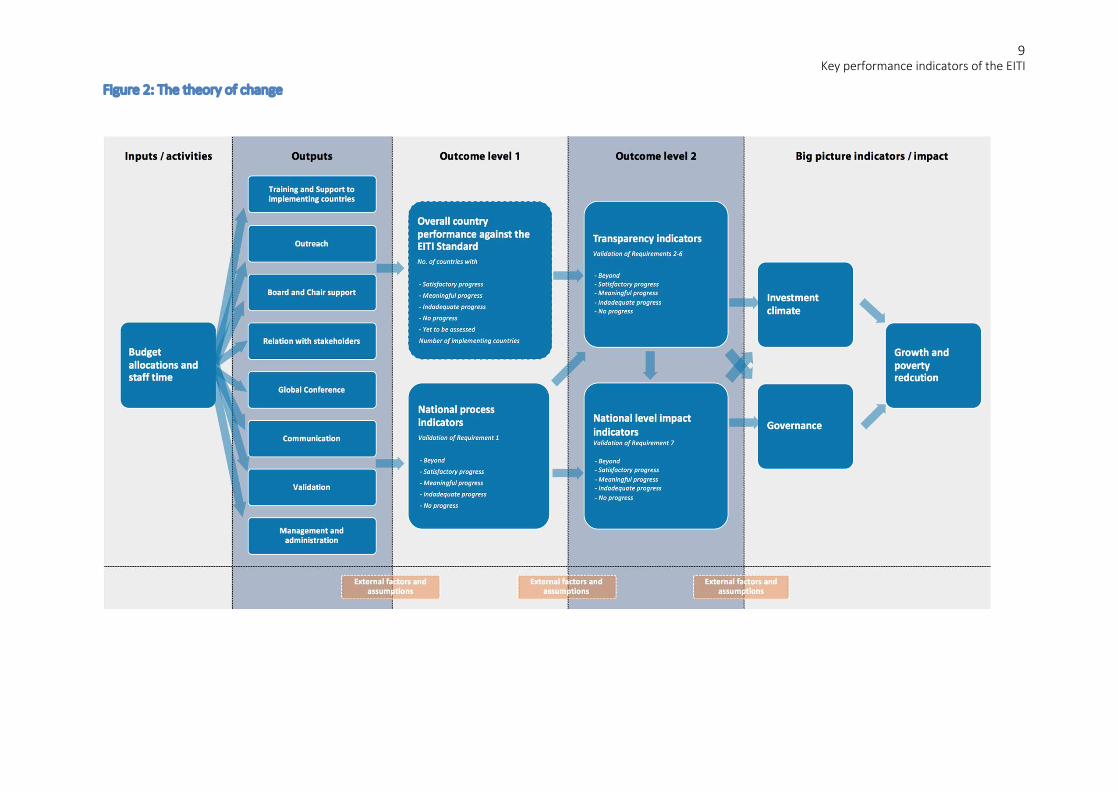
The EITI measures impact as presented in Figure 2. This model seeks to measure change associated with implementation of the EITI Standard. The outcome indicators, based on Validation results, are all necessary to properly influence (i) national governance of natural resource wealth, (ii) investment and business climates, and (iii) sustainable economic growth and development. These represent the broadly-stated objectives known as the EITI Principles18.
Figure 2 maps the EITI’s theory of change. The Secretariat’s effectiveness distinguishes between inputs/activities and outputs. This is visible in the two first stages of the figure which are broken down into specific categories of the Secretariat’s operations. The categories are linked to current budget codes and practices of the International Secretariat:
• Inputs/activities reflect budget inputs and staff time spent on various parts of EITI Secretariat responsibilities, and;
• Outputs focus on the immediate products of these inputs and activities.
Results from Validation takes prominent place in how the international EITI measures its own performance. The Secretariat provides support to the EITI Board, national secretariats and multi-stakeholder groups. The outcome of this support is the quality and comprehensiveness of national level implementation. The Validation results are presently the best measure of the quality and comprehensiveness of country support.
However, it is not a direct link – the Secretariat can have excellent support and the country can still have poor Validation results and vice versa. Furthermore, excellent validation results do not necessarily lead to excellent impact. The Standard provides therefore the proxy indicators for the theory of change. As with all proxies, they are imperfect. Attribution and causality remain challenges. However, previous outcome indicators did not provide data beyond the number of countries performing specific disclosures, such as production data. The results from Validation not only reflect whether disclosures exist, but also whether they meet the EITI Requirements, i.e. the quality and comprehensiveness of the information and progress towards mainstreaming.
Based on the prescribed procedures and requirements of the EITI Standard, the EITI uses two levels of outcomes based on Validation results.
• Level 1 outcomes monitor the Overall assessments of countries’ progress towards the EITI
18 See EITI Principles: https://eiti.org/document/eiti-principles.
Key performance indicators of the EITI
8
Standard, and the National process indicators (i.e. the governance of the national processes – EITI Requirement 1).
• Level 2 outcomes measures how countries are progressing in making more information accessible to the public (EITI Requirements 2-6), called transparency indicators.
As part of the second level of outcome indicators, national multi-stakeholder groups (MSGs) are also required to agree a set of objectives for disseminating the information to ensure impact at the national level. The Validation results of countries’ progress towards EITI Requirement 7 is proposed to be called National level impact indicators, assessing whether the MSGs fulfil their role in ensuring EITI data is used for informing public debate, and whether they are achieving the goals they have set out in their work plans.
The big picture indicators are designed to monitor the EITI Principles. These principles are still as relevant as when they were agreed to in 2005, and the big picture-indicators remain as relevant in measuring such changes. Collectively, the national-level outcomes could reasonably be expected to influence these big picture indicators, but the link is not direct.
Key performance indicators of the EITI
9
Figure 2: The theory of change
International Secretariat 2019 Work plan
10
Limitations to the framework: Regularity, timeliness and numbers
The outcome indicators are based on Validation results. These serve as the framework for the EITI to
measure realistic and attributable chains of effects of its activities. But as with any framework there are
challenges associated with this approach – external factors, timeliness and the number of indicators.
Firstly, there are assumptions and external factors beyond the EITI international management’s control,
which also influence these indicators. These are represented by the separate orange boxes in Figure 2. An
example of an external factor could be a change in government, influencing the context in which a national
secretariat and MSG operates. It may, for example, force national and international efforts towards
ensuring political buy-in rather than focusing on the EITI implementation. Alternatively, a change in
government can bring with it a more reform-oriented political leadership that provides a more conducive
environment. Commitment to reforms in the sector is also strongly influenced by commodity prices and
new discoveries. However, in the absence of external factors, positive or negative, the work of the EITI’s
international management should influence national EITI processes positively.
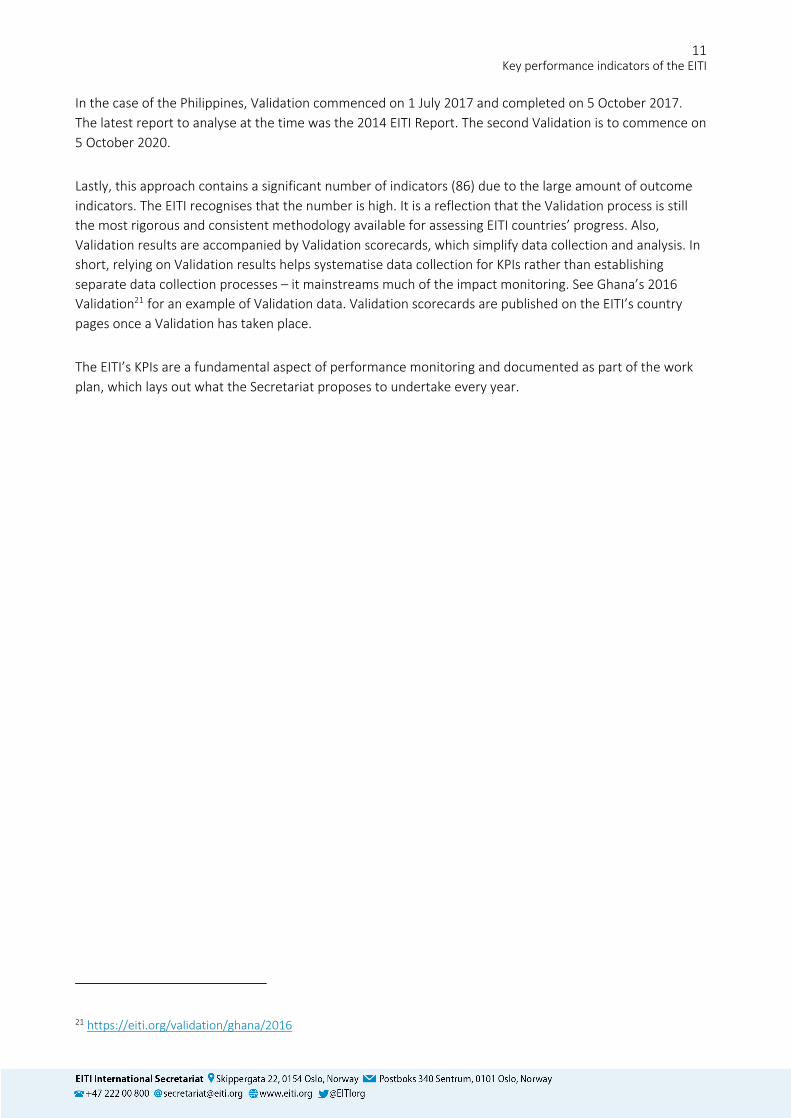
Second, Validation results stem from a rigorous process, but comes at a cost of timeliness. The current
procedure occurs only once every three years for each implementing country that is deemed to have
achieved satisfactory progress. This means that potentially the outcomes of EITI implementation will reflect
Board decisions that have taken place three years earlier19
. In addition, the current Validation process
focuses on the latest EITI Report of each implementing country. By factoring in the EITI’s timeliness
requirement (4.8), this means that the EITI’s outcome indicators could potentially reflect information that
is up to five years’ old (see Figure 3). The Secretariat does perform similar appraisals upon the publication
of each new EITI Report, but these do not follow the same in-depth quality assurance processes as
Validations. The Implementation Committee20
may wish to consider taking steps to make more regular
assessments to ensure that monitored effects of EITI implementation reflects more timely data.
Figure 3: Timeliness of KPIs
For example, Ghana’s Validation commenced on 1 July 2016 and was completed in March 2017. The
assessment of Ghana’s governance is based on the latest EITI Report available by the beginning of the
Validation, which was the 2014 EITI Report. The second Validation commenced on 8 March 2018.
19 An overview of Board decisions on Validations can be found here: https://eiti.org/document/validation-schedule-
decisions#completed
20 For the background and role of the Committee, see https://eiti.org/board-committees#implementation-committee
Validation results as outcome indicators: Potentially 5 years old
Timeliness of EITI data: Potentially 2 years old EITI Validation procedure: Potentially every 3 years
Key performance indicators of the EITI
11
In the case of the Philippines, Validation commenced on 1 July 2017 and completed on 5 October 2017.
The latest report to analyse at the time was the 2014 EITI Report. The second Validation is to commence on
5 October 2020.
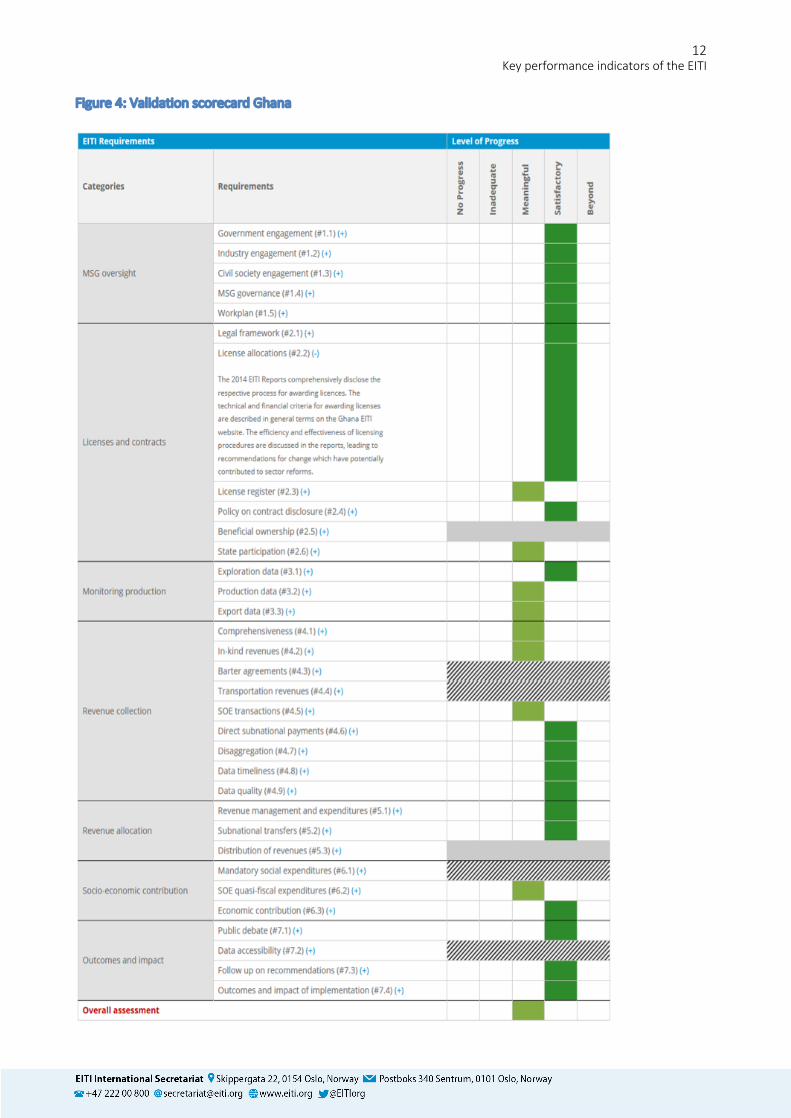
Lastly, this approach contains a significant number of indicators (86) due to the large amount of outcome
indicators. The EITI recognises that the number is high. It is a reflection that the Validation process is still
the most rigorous and consistent methodology available for assessing EITI countries’ progress. Also,
Validation results are accompanied by Validation scorecards, which simplify data collection and analysis. In
short, relying on Validation results helps systematise data collection for KPIs rather than establishing
separate data collection processes – it mainstreams much of the impact monitoring. See Ghana’s 2016
Validation21
for an example of Validation data. Validation scorecards are published on the EITI’s country
pages once a Validation has taken place.
The EITI’s KPIs are a fundamental aspect of performance monitoring and documented as part of the work
plan, which lays out what the Secretariat proposes to undertake every year.
21 https://eiti.org/validation/ghana/2016
Key performance indicators of the EITI
12
Figure 4: Validation scorecard Ghana


