Embed Size (px)
Citation preview
Astronomy & Astrophysicsmanuscript no. Be˙Chara˙V25 c© ESO 2011February 10, 2011
Kinematics and geometrical study of the Be stars 48 Per andψ Per with the VEGA/CHARA interferometer
O. Delaa1,3, Ph. Stee1, A. Meilland2, J. Zorec3, D. Mourard1, Ph. Berio1, D. Bonneau1,O. Chesneau1, J.M. Clausse1,P. Cruzalebes1, K. Perraut4, A. Marcotto1, A. Roussel1, A. Spang1, H. McAlister5,6, T. ten Brummelaar6, J.
Sturmann6, L. Sturmann6, N. Turner6, C. Farrington6, and P.J. Goldfinger6
1 Lab. H. Fizeau, CNRS UMR 6525, Univ. de Nice-Sophia Antipolis, Obs. de la Cote d’Azur, Avenue Copernic, 06130 Grasse, France2 Max Planck Intitut fur Radioastronomie, Auf dem Hugel 69, 53121 Bonn, Germany3 Institut d’Astrophysique de Paris, UMR 7095 du CNRS, Universite Pierre & Marie Curie, 98bis bd. Arago, 75014 Paris, France4 UJF/CNRS LAOG, 414, rue de la Piscine, Domaine Universitaire 38400 Saint-Martin dHres, France5 Georgia State University, P.O. Box 3969, Atlanta GA 30302-3969, USA6 CHARA Array, Mount Wilson Observatory, 91023 Mount Wilson CA, USA
Received; accepted
ABSTRACT
Context. Five different physical processes might be responsible for the formation of decretion disks around Be stars: fast rotation of thestar,stellar pulsations, binarity, stellar winds and magnetic fields. Our observations indicate that fast rotation seems toproduce a disk in Keplerianrotation, at least in the specific case of the two stars observed. We do not know if this observational result is a generality or not.Aims. We measure the size, orientation, shape, and kinematics of the disks around 2 Be stars, namely 48 Per andψ Per.Methods. We used the VEGA/CHARA interferometer with a spectral resolution of 5000 to obtain spectrally dispersed visibility modulus andphases within the Hα emission line.Results. We were able to estimate the disk extension in the continuum and in the Hα line, as well as flattening, for both stars. Both stars rotateat nearly a critical rotation, but while the disk of 48 Per seems to be in Keplerian rotation, our preliminary data suggestthat the disk ofψ Per ispossibly faster than Keplerian, similarly to what has been found forκ CMa with observations carried out in the near-IR. However, more data isneeded to confirm the fast rotation of the disk.Conclusions. Assuming a simple uniform disk model for the stellar photosphere in the continuum and a Gaussian brightness distribution in theline emission region, we obtain a ratio of the disk diameter over the photospheric diameter of 8 48 Per and 11 for andψ Per. We also foundthat the major axis of 48 Per is parallel to the polarization angle and not perpendicular to it as previously observed for many Be stars, includingψ Per. This might be due to the optical thickness of the disk, which is also responsible for the incoherent scattering of a non negligible part ofthe Hα line emission. To our knowledge, this is the first time that this effect has been measured in a Be star.
Key words. Techniques: high angular resolution – Techniques: interferometric – Stars: emission-line, Be – Stars: winds, outflows– Stars:individual (48 Per,ψ Per) – Stars: circumstellar matter
1. Introduction
Classical Be stars are main sequence B-type stars with highrotational velocities surrounded by a flattened rotating cir-cumstellar environment. This circumstellar environment pro-duces strong emission lines and is also responsible for an in-frared excess, due mainly to free-free and free-bound transi-tions (Gehrz et al. 1974). These two outstanding characteristicsdefine what is called the “Be phenomenon”. The geometry andstructure of the envelopes around Be stars have been intensivelystudied, and there is clear evidence that these environmentsare axisymmetric and flattened (Dougherty & Taylor 1992;Hanuschik 1996; Quirrenbach et al. 1997; Stee 2003; Kervella
Send offprint requests to: [email protected]
& Domiciano de Souza 2006; Tycner et al. 2008) with a verylow expansion velocity (Poeckert & Marlborough 1978b,a;Waters 1986; Waters et al. 1987; Waters & Marlborough 1992;Meilland et al. 2007a). Studies of accretion disks show thatdisks in hydrodynamic equilibrium and in Keplerian rotationshould be very thin, assuming that their vertical scale heightis governed by gas pressure alone. For a disk to be thicker,either additional mechanisms have to be invoked or we mustassume that the disk might not be in equilibrium (Bjorkman& Carciofi 2004). Alternatively, hydrostatic equilibrium mightnot be determined only by gas pressure but also by magneticfields (Arias et al. 2006; Zorec et al. 2007), resulting in an in-crease in their vertical scale height.
2 Delaa et al.: First interferometric CHARA/VEGA observations of Be stars
Many questions remain unsolved regarding the actual struc-ture of circumstellar envelopes around Be stars. To understandthis structure we need to understand the dominant mass ejec-tion mechanisms from the central star, as well as to resolvewhich of the different scenarios for redistribution of this mat-ter in the stellar environment may be correct. The study of thegeometry and kinematics of these envelopes can be used to re-strain theories of the various physical processes involvedin theproduction of circumstellar disks. Unfortunately, this cannot bedone using single telescopes since the typical angular extent ofthese disks is of a few mas. Consequently, long baseline in-terferometry combining high spatial and spectral resolution isthe most suitable technique for probing Be star circumstellarenvironments lead to new insights into Be star physics.
In the following, we present the first interferometricCHARA/VEGA observations of two Be stars: 48 Per andψ Per.In Sect. 2 we discuss the two targets and focus our attention onthe interferometric data already obtained. In Sect. 3 we brieflyintroduce the CHARA/VEGA instrument, our observations,and the data reduction process. The reduced data and first anal-ysis using geometrical models is presented in Sect. 4, whereasmore advanced modeling is presented in Sect. 5. Finally, resultsare discussed in Sect. 6 and, Sect. 7 concludes this study.
2. The targets
2.1. 48 Per
The source 48 Persei (HD 25940, B3 Ve) was shown to havedouble emission line profiles many years ago (Burbidge &Burbidge 1953) and there has been a great deal of controversyconcerning the inclination angle of this star, the total mass con-tained in the disk and the mass loss rate. Originally classified bySlettebak (1949) as a pole-on star Ruusalepp (1982), by com-puting line profiles for a sample of stars with a range of orienta-tions and angular velocities, found that the inclination of48 Perranges in fact between 35 deg and 40◦. More recently, usingthe Mk III interferometer equipped with a 100 Å spectral fil-ter centered on the Hα line combined with spectropolarimetricdata from the University of Wisconsins Pine BluffObservatory(PBO), Quirrenbach et al. (1997) obtained a diameter of 2.77± 0.56 mas for the circumstellar environment of 48 Per andfound that it was nearly spherical. They also estimated its incli-nation angle and confirmed the pole-on classification given bySlettebak (1949). Using the method of Barnes & Evans (1976)and Barnes et al. (1976), they derived a photospheric diameterof 0.34 mas with an error of about 20 %. From theoretical cal-culations with the SIMECA code in the Brγ continuum, Stee(2003) obtained estimates of the mass loss, opening angle andmass of the circumstellar disk of this star. He found a massloss rateM=6.31× 10⁻⁸ M⊙ yr−1, in good agreement with themass-loss rates found by Waters et al. (1987):M = 1.3× 10⁻⁸
M⊙ yr−1. However, Stee (2003) also obtained a disk openingangle of about 2◦, whereas Waters et al. (1987) inferred an an-gle of 28.4◦. Stee (2003) also calculated the total mass of thedisk to beM=11.2×10⁻¹⁰ M⊙, a value three times higher thanthe one given by Rinehart et al. (1999), i.e.M=3.7×10⁻¹⁰ M⊙.Grundstrom & Gies (2006) demonstrate that there are mono-
tonic relationships between the emission-line equivalentwidthand the ratio of the angular half-width at half-maximum of theprojected disk major axis to the radius of the star. They showedthat their predicted Hα disk radii are consistent with the onedirectly obtained by long baseline interferometry. They usedthese relationships to derive the ratioRd/R⋆, whereRd is thedisk radius andR⋆ is the stellar radius. For 48 Per, this ratio isequal to 7.4 ± 1.1, which is in good agreement with the valuedirectly obtained by interferometry: 7.2±1.5 Quirrenbach et al.(1997). They also estimated a disk inclination angle of 31◦ bycomparing the predicted ratio of the projected minor-to-majoraxis with the observed one.
2.2. ψ Per
The sourceψ Per (HD 22192, HR 1087) is classified as aB4IIIe Underhill et al. (1979) with a diameter of 4.7± 0.3 R⊙Bohm-Vitense (1989). It was listed by Campbell (1895) amongstars with Hα line emission. Since then,ψ Per has been exten-sively studied using spectroscopy and photometry, but it hashad fewer interferometric measurements than the well knownBe starγ Cas.
Taylor et al. (1987) carried out a VLA radio survey atNRAO of a small sample of Be stars with strong excess emis-sion in the IRAS bands, but the only star detected with radioemission at 4.86 GHz wasψ Per, at a level of 0.23± 0.04 mJy.After combining this radio flux with IR (JHKL bands) and far-UV IUE spectroscopic data, these authors concluded that thecircumstellar environment inψ Per was not spherical, but in-stead has a disk like structure. This result was confirmed byDougherty & Taylor (1992) with the VLA, who were able tofully resolve the radio emission at 15 GHz ofψ Per along itsmajor axis. They found it has a spatial extension of 111±16 masand a position angle for the major axis of 158◦ ± 10. However,the star could not be resolved along its minor axis at an upperlimit of 3σ representing 68 mas. Dougherty & Taylor (1992)concluded that their observations confirm the equatorial en-hanced circumstellar plasma distribution as the source of theBe star emission (Struve 1931).
Ten years later, Quirrenbach et al. (1997) calculated the di-ameter of the Hα emitting region using the Mk III optical inter-ferometer. Applying the method by Barnes & Evans (1976) andBarnes et al. (1976) of photospheric diameter determination,they derived a diameter of 0.35± 0.07 mas. With a Gaussianmodel of brightness distribution in the disk, they also mea-sured a diameter of 3.26± 0.23 mas for the circumstellar en-velope using an Hα filter with a bandwidth of 100 Å. Thisdiameter is roughly 30 times smaller than in the radio emis-sion, but the position angle for the minor axis of−33◦ ± 11◦
is in good agreement with the determination in the radio fre-quency. Interestingly, it implies that there is no misalignmentbetween the larger scale envelope out to∼ 100R⋆ where the ra-dio emission occurs, and both the inner zone of the disk wherethe polarization originates and the intermediate region wherethe Hα emission is produced. They also obtained an axial ratioof 0.47± 0.11 and concluded that the circumstellar environ-ment ofψ Per was clearly elongated in the visible, even though
Delaa et al.: First interferometric CHARA/VEGA observations of Be stars 3
Table 1.Log of observations. See Fig 1 for the orientation of baselines B1, B2, B3, and B4
Object Date Telescopes Projected Baseline r0 Detectors Calibrators(UTC) Length (m) Position Angle (deg) (cm)
ψ Per 07/10/2008 11h33 S1S2 (B1) 32.35 -20.92 9 Blue and Red HD 1230308/10/2008 06h52 S1S2 (B2) 32,54 18,38 8 Blue and Red HD 1230309/10/2008 07h48 W1W2 (B3) 98,32 128,6 9 Red only HD 1230309/10/2008 10h43 W1W2 (B4) 107,82 93,23 10 Red only HD 12303
48 Per 07/10/2008 12h48 S1S2 (B1) 31,84 -26,65 10 Blue and Red HD 1841108/10/2008 07h29 S1S2 (B2) 32,65 17,88 9 Blue and Red HD 1841109/10/2008 07h03 W1W2 (B3) 90,29 147,88 10 Blue and Red HD 1841109/10/2008 11h22 W1W2 (B4) 107,7 91,9 8 Blue and Red HD 18411
they were not able to resolve the minor axis in the radio wave-lengths, probably owing to the nearly edge-on projection ofthe disk. Using the SIMECA code, Stee (2003) derive an es-timate of theψ Per mass-loss rateM = 5.0 × 10⁻⁸ M⊙ yr−1,the mass of its diskM = 110−9 M⊙, and the opening angle ofthe disk∼ 1◦, which are consistent with similar determinationsby Waters et al. (1987) and Rinehart et al. (1999). All deter-minations by Stee (2003) were made using the Brγ continuumemission and interferometric data.
3. Observations and data reduction
The VEGA instrument (Mourard et al. 2009) at the CHARAarray (ten Brummelaar et al. 2005) is located on the MountWilson Observatory just north of Los Angeles in California,USA. It operates in the visible domain and benefits from botha high-resolution spectrograph and a polarimeter. The spectro-graph is designed to sample the visible band from 0.45 to 0.85µm and is equipped with two photon-counting detectors thatsimultaneously observe in two different spectral bands.
3.1. Observations
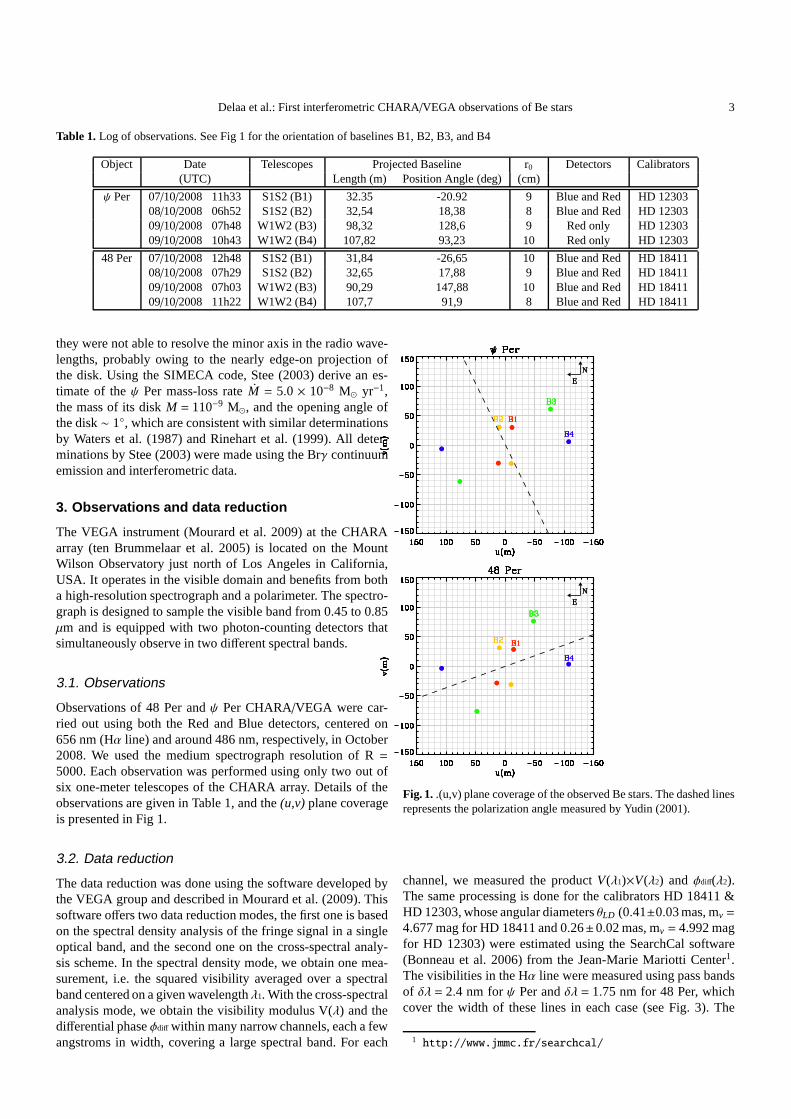
Observations of 48 Per andψ Per CHARA/VEGA were car-ried out using both the Red and Blue detectors, centered on656 nm (Hα line) and around 486 nm, respectively, in October2008. We used the medium spectrograph resolution of R=5000. Each observation was performed using only two out ofsix one-meter telescopes of the CHARA array. Details of theobservations are given in Table 1, and the(u,v) plane coverageis presented in Fig 1.
3.2. Data reduction
The data reduction was done using the software developed bythe VEGA group and described in Mourard et al. (2009). Thissoftware offers two data reduction modes, the first one is basedon the spectral density analysis of the fringe signal in a singleoptical band, and the second one on the cross-spectral analy-sis scheme. In the spectral density mode, we obtain one mea-surement, i.e. the squared visibility averaged over a spectralband centered on a given wavelengthλ1. With the cross-spectralanalysis mode, we obtain the visibility modulus V(λ) and thedifferential phaseφdiffwithin many narrow channels, each a fewangstroms in width, covering a large spectral band. For each
Fig. 1. .(u,v) plane coverage of the observed Be stars. The dashed linesrepresents the polarization angle measured by Yudin (2001).
channel, we measured the productV(λ1)×V(λ2) and φdiff(λ2).The same processing is done for the calibrators HD 18411 &HD 12303, whose angular diametersθLD (0.41±0.03 mas, mv =
4.677 mag for HD 18411 and 0.26±0.02 mas, mv = 4.992 magfor HD 12303) were estimated using the SearchCal software(Bonneau et al. 2006) from the Jean-Marie Mariotti Center1.The visibilities in the Hα line were measured using pass bandsof δλ = 2.4 nm forψ Per andδλ = 1.75 nm for 48 Per, whichcover the width of these lines in each case (see Fig. 3). The
1 http://www.jmmc.fr/searchcal/
4 Delaa et al.: First interferometric CHARA/VEGA observations of Be stars
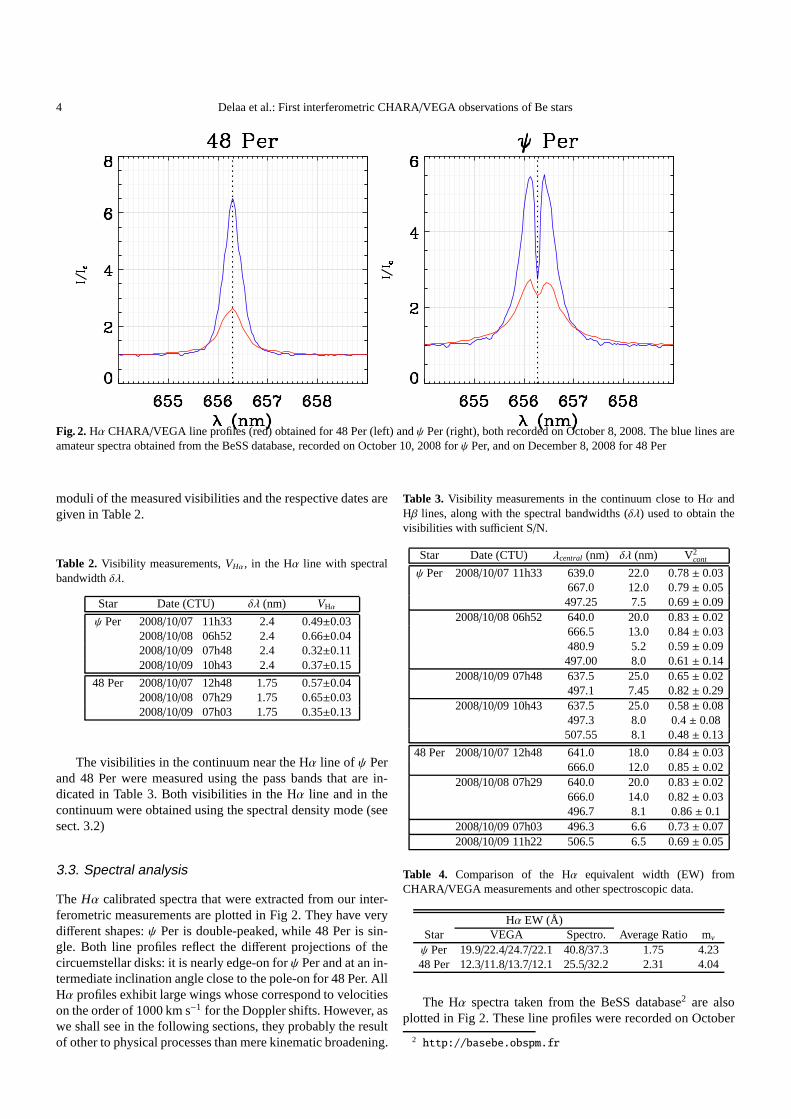
Fig. 2. Hα CHARA/VEGA line profiles (red) obtained for 48 Per (left) andψ Per (right), both recorded on October 8, 2008. The blue linesareamateur spectra obtained from the BeSS database, recorded on October 10, 2008 forψ Per, and on December 8, 2008 for 48 Per
moduli of the measured visibilities and the respective dates aregiven in Table 2.
Table 2. Visibility measurements,VHα, in the Hα line with spectralbandwidthδλ.
Star Date (CTU) δλ (nm) VHα
ψ Per 2008/10/07 11h33 2.4 0.49±0.032008/10/08 06h52 2.4 0.66±0.042008/10/09 07h48 2.4 0.32±0.112008/10/09 10h43 2.4 0.37±0.15
48 Per 2008/10/07 12h48 1.75 0.57±0.042008/10/08 07h29 1.75 0.65±0.032008/10/09 07h03 1.75 0.35±0.13
The visibilities in the continuum near the Hα line of ψ Perand 48 Per were measured using the pass bands that are in-dicated in Table 3. Both visibilities in the Hα line and in thecontinuum were obtained using the spectral density mode (seesect. 3.2)
3.3. Spectral analysis
The Hα calibrated spectra that were extracted from our inter-ferometric measurements are plotted in Fig 2. They have verydifferent shapes:ψ Per is double-peaked, while 48 Per is sin-gle. Both line profiles reflect the different projections of thecircuemstellar disks: it is nearly edge-on forψ Per and at an in-termediate inclination angle close to the pole-on for 48 Per. AllHα profiles exhibit large wings whose correspond to velocitieson the order of 1000 km s−1 for the Doppler shifts. However, aswe shall see in the following sections, they probably the resultof other to physical processes than mere kinematic broadening.
Table 3. Visibility measurements in the continuum close to Hα andHβ lines, along with the spectral bandwidths (δλ) used to obtain thevisibilities with sufficient S/N.
Star Date (CTU) λcentral (nm) δλ (nm) V2cont
ψ Per 2008/10/07 11h33 639.0 22.0 0.78± 0.03667.0 12.0 0.79± 0.05497.25 7.5 0.69± 0.09
2008/10/08 06h52 640.0 20.0 0.83± 0.02666.5 13.0 0.84± 0.03480.9 5.2 0.59± 0.09497.00 8.0 0.61± 0.14
2008/10/09 07h48 637.5 25.0 0.65± 0.02497.1 7.45 0.82± 0.29
2008/10/09 10h43 637.5 25.0 0.58± 0.08497.3 8.0 0.4± 0.08507.55 8.1 0.48± 0.13
48 Per 2008/10/07 12h48 641.0 18.0 0.84± 0.03666.0 12.0 0.85± 0.02
2008/10/08 07h29 640.0 20.0 0.83± 0.02666.0 14.0 0.82± 0.03496.7 8.1 0.86± 0.1
2008/10/09 07h03 496.3 6.6 0.73± 0.072008/10/09 11h22 506.5 6.5 0.69± 0.05
Table 4. Comparison of the Hα equivalent width (EW) fromCHARA/VEGA measurements and other spectroscopic data.
Hα EW (Å)Star VEGA Spectro. Average Ratio mv
ψ Per 19.9/22.4/24.7/22.1 40.8/37.3 1.75 4.2348 Per 12.3/11.8/13.7/12.1 25.5/32.2 2.31 4.04
The Hα spectra taken from the BeSS database2 are alsoplotted in Fig 2. These line profiles were recorded on October
2 http://basebe.obspm.fr
Delaa et al.: First interferometric CHARA/VEGA observations of Be stars 5
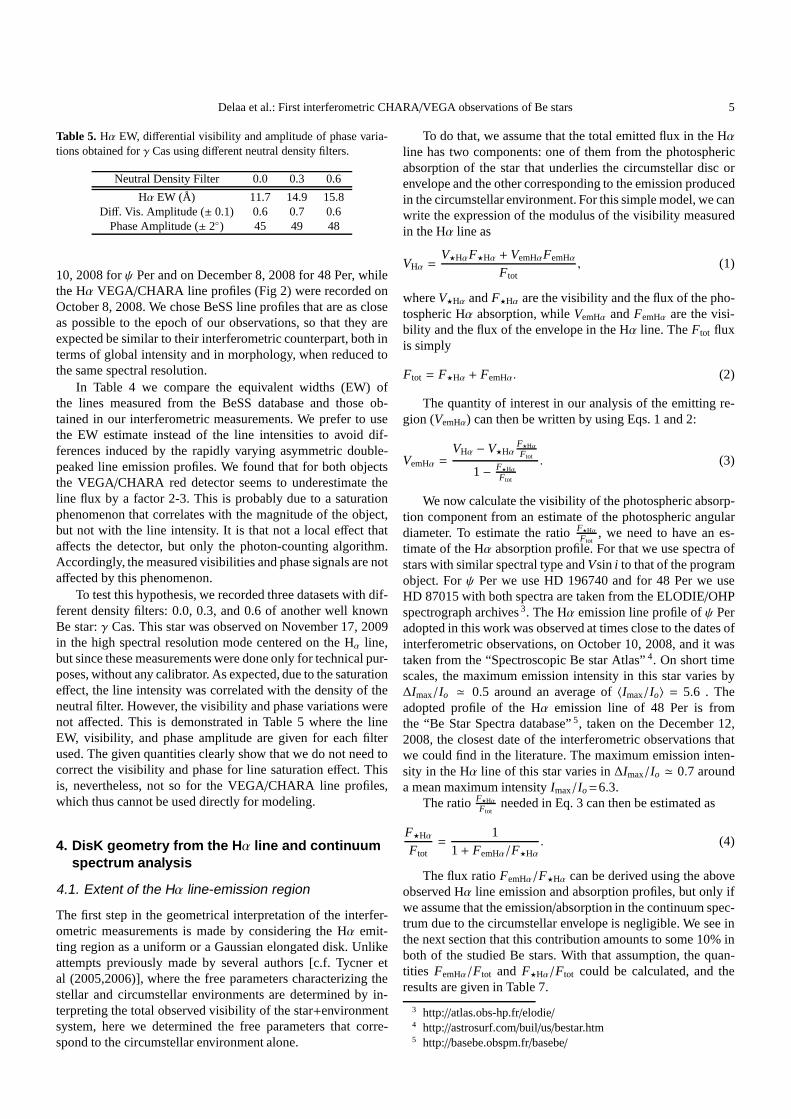
Table 5. Hα EW, differential visibility and amplitude of phase varia-tions obtained forγ Cas using different neutral density filters.
Neutral Density Filter 0.0 0.3 0.6
Hα EW (Å) 11.7 14.9 15.8Diff. Vis. Amplitude (± 0.1) 0.6 0.7 0.6
Phase Amplitude (± 2◦) 45 49 48
10, 2008 forψ Per and on December 8, 2008 for 48 Per, whilethe Hα VEGA/CHARA line profiles (Fig 2) were recorded onOctober 8, 2008. We chose BeSS line profiles that are as closeas possible to the epoch of our observations, so that they areexpected be similar to their interferometric counterpart,both interms of global intensity and in morphology, when reduced tothe same spectral resolution.
In Table 4 we compare the equivalent widths (EW) ofthe lines measured from the BeSS database and those ob-tained in our interferometric measurements. We prefer to usethe EW estimate instead of the line intensities to avoid dif-ferences induced by the rapidly varying asymmetric double-peaked line emission profiles. We found that for both objectsthe VEGA/CHARA red detector seems to underestimate theline flux by a factor 2-3. This is probably due to a saturationphenomenon that correlates with the magnitude of the object,but not with the line intensity. It is that not a local effect thataffects the detector, but only the photon-counting algorithm.Accordingly, the measured visibilities and phase signals are notaffected by this phenomenon.
To test this hypothesis, we recorded three datasets with dif-ferent density filters: 0.0, 0.3, and 0.6 of another well knownBe star:γ Cas. This star was observed on November 17, 2009in the high spectral resolution mode centered on the Hα line,but since these measurements were done only for technical pur-poses, without any calibrator. As expected, due to the saturationeffect, the line intensity was correlated with the density of theneutral filter. However, the visibility and phase variations werenot affected. This is demonstrated in Table 5 where the lineEW, visibility, and phase amplitude are given for each filterused. The given quantities clearly show that we do not need tocorrect the visibility and phase for line saturation effect. Thisis, nevertheless, not so for the VEGA/CHARA line profiles,which thus cannot be used directly for modeling.
4. DisK geometry from the Hα line and continuumspectrum analysis
4.1. Extent of the Hα line-emission region
The first step in the geometrical interpretation of the interfer-ometric measurements is made by considering the Hα emit-ting region as a uniform or a Gaussian elongated disk. Unlikeattempts previously made by several authors [c.f. Tycner etal (2005,2006)], where the free parameters characterizingthestellar and circumstellar environments are determined by in-terpreting the total observed visibility of the star+environmentsystem, here we determined the free parameters that corre-spond to the circumstellar environment alone.
To do that, we assume that the total emitted flux in the Hα
line has two components: one of them from the photosphericabsorption of the star that underlies the circumstellar disc orenvelope and the other corresponding to the emission producedin the circumstellar environment. For this simple model, wecanwrite the expression of the modulus of the visibility measuredin the Hα line as
VHα =V⋆HαF⋆Hα + VemHαFemHα
Ftot, (1)
whereV⋆Hα andF⋆Hα are the visibility and the flux of the pho-tospheric Hα absorption, whileVemHα andFemHα are the visi-bility and the flux of the envelope in the Hα line. TheFtot fluxis simply
Ftot = F⋆Hα + FemHα. (2)
The quantity of interest in our analysis of the emitting re-gion (VemHα) can then be written by using Eqs. 1 and 2:
VemHα =VHα − V⋆Hα
F⋆HαFtot
1− F⋆HαFtot
. (3)
We now calculate the visibility of the photospheric absorp-tion component from an estimate of the photospheric angulardiameter. To estimate the ratioF⋆Hα
Ftot, we need to have an es-
timate of the Hα absorption profile. For that we use spectra ofstars with similar spectral type andVsini to that of the programobject. Forψ Per we use HD 196740 and for 48 Per we useHD 87015 with both spectra are taken from the ELODIE/OHPspectrograph archives3. The Hα emission line profile ofψ Peradopted in this work was observed at times close to the dates ofinterferometric observations, on October 10, 2008, and it wastaken from the “Spectroscopic Be star Atlas”4. On short timescales, the maximum emission intensity in this star varies by∆Imax/Io ≃ 0.5 around an average of〈Imax/Io〉 = 5.6 . Theadopted profile of the Hα emission line of 48 Per is fromthe “Be Star Spectra database”5, taken on the December 12,2008, the closest date of the interferometric observationsthatwe could find in the literature. The maximum emission inten-sity in the Hα line of this star varies in∆Imax/Io ≃ 0.7 arounda mean maximum intensityImax/Io=6.3.
The ratioF⋆HαFtot
needed in Eq. 3 can then be estimated as
F⋆Hα
Ftot=
11+ FemHα/F⋆Hα
. (4)
The flux ratioFemHα/F⋆Hα can be derived using the aboveobserved Hα line emission and absorption profiles, but only ifwe assume that the emission/absorption in the continuum spec-trum due to the circumstellar envelope is negligible. We seeinthe next section that this contribution amounts to some 10% inboth of the studied Be stars. With that assumption, the quan-tities FemHα/Ftot and F⋆Hα/Ftot could be calculated, and theresults are given in Table 7.
3 http://atlas.obs-hp.fr/elodie/4 http://astrosurf.com/buil/us/bestar.htm5 http://basebe.obspm.fr/basebe/
6 Delaa et al.: First interferometric CHARA/VEGA observations of Be stars
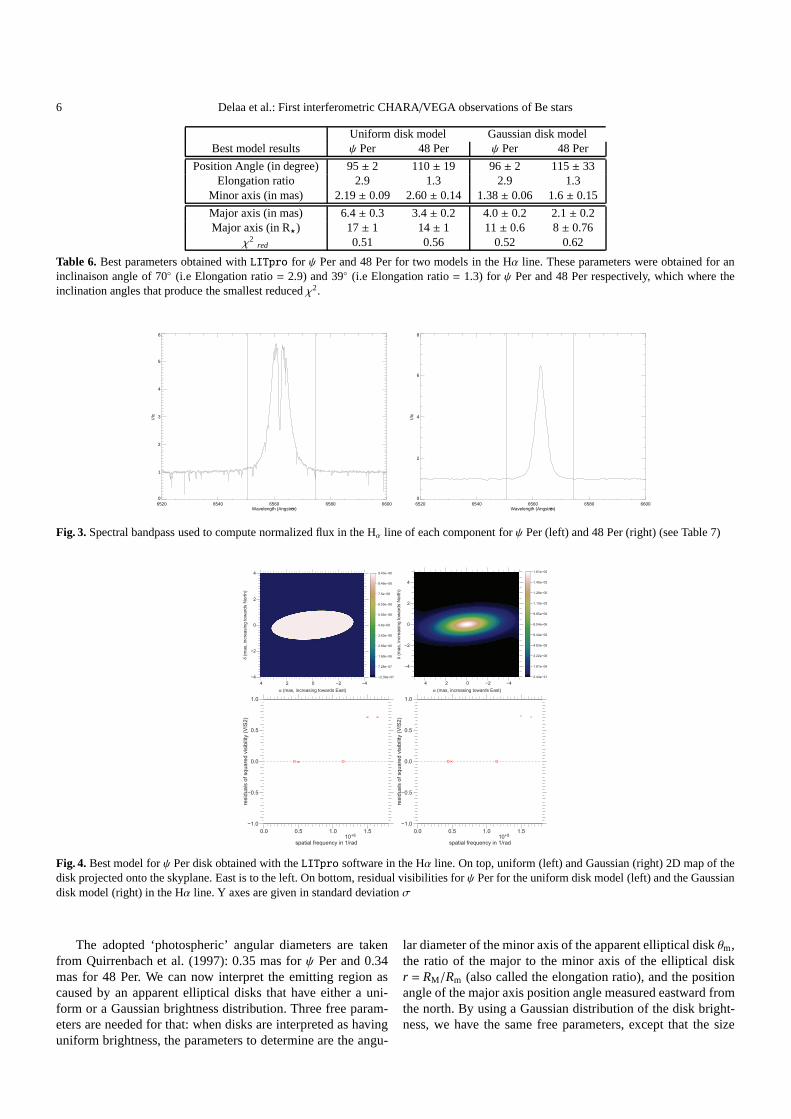
Uniform disk model Gaussian disk modelBest model results ψ Per 48 Per ψ Per 48 Per
Position Angle (in degree) 95± 2 110± 19 96± 2 115± 33Elongation ratio 2.9 1.3 2.9 1.3
Minor axis (in mas) 2.19± 0.09 2.60± 0.14 1.38± 0.06 1.6± 0.15
Major axis (in mas) 6.4± 0.3 3.4± 0.2 4.0± 0.2 2.1± 0.2Major axis (in R⋆) 17± 1 14± 1 11± 0.6 8± 0.76
χ2red 0.51 0.56 0.52 0.62
Table 6. Best parameters obtained withLITpro for ψ Per and 48 Per for two models in the Hα line. These parameters were obtained for aninclinaison angle of 70◦ (i.e Elongation ratio= 2.9) and 39◦ (i.e Elongation ratio= 1.3) forψ Per and 48 Per respectively, which where theinclination angles that produce the smallest reducedχ2.
6520 6540 6560 6580 6600Wavelength (Angström)
0
1
2
3
4
5
6
I/Ic
6520 6540 6560 6580 6600Wavelength (Angström)
0
2
4
6
8
I/Ic
Fig. 3.Spectral bandpass used to compute normalized flux in the Hα line of each component forψ Per (left) and 48 Per (right) (see Table 7)
−4−2 0 2 4
−4
−2
0
2
4
−2.39e−07
7.28e−07
1.69e−06
2.66e−06
3.63e−06
4.6e−06
5.56e−06
6.53e−06
7.5e−06
8.46e−06
9.43e−06
α (mas, increasing towards East)
δ (
mas,
incre
asin
g t
ow
ard
s N
ort
h)
−4−2 0 2 4
−4
−2
0
2
4
2.44e−21
1.61e−06
3.22e−06
4.83e−06
6.44e−06
8.04e−06
9.65e−06
1.13e−05
1.29e−05
1.45e−05
1.61e−05
α (mas, increasing towards East)
δ (
mas,
incre
asin
g t
ow
ard
s N
ort
h)
O O
0.0 0.5 1.0 1.510+8
−1.0
−0.5
0.0
0.5
1.0
spatial frequency in 1/rad
resid
uals
of
square
d v
isib
ility
(V
IS2)
O O
0.0 0.5 1.0 1.510+8
−1.0
−0.5
0.0
0.5
1.0
spatial frequency in 1/rad
resid
uals
of
square
d v
isib
ility
(V
IS2)
Fig. 4. Best model forψ Per disk obtained with theLITpro software in the Hα line. On top, uniform (left) and Gaussian (right) 2D map of thedisk projected onto the skyplane. East is to the left. On bottom, residual visibilities forψ Per for the uniform disk model (left) and the Gaussiandisk model (right) in the Hα line. Y axes are given in standard deviationσ
The adopted ‘photospheric’ angular diameters are takenfrom Quirrenbach et al. (1997): 0.35 mas forψ Per and 0.34mas for 48 Per. We can now interpret the emitting region ascaused by an apparent elliptical disks that have either a uni-form or a Gaussian brightness distribution. Three free param-eters are needed for that: when disks are interpreted as havinguniform brightness, the parameters to determine are the angu-
lar diameter of the minor axis of the apparent elliptical disk θm,the ratio of the major to the minor axis of the elliptical diskr = RM/Rm (also called the elongation ratio), and the positionangle of the major axis position angle measured eastward fromthe north. By using a Gaussian distribution of the disk bright-ness, we have the same free parameters, except that the size
Delaa et al.: First interferometric CHARA/VEGA observations of Be stars 7
−3−2−1 0 1 2 3
−3
−2
−1
0
1
2
3
−3.8e−07
1.15e−06
2.68e−06
4.22e−06
5.75e−06
7.28e−06
8.81e−06
1.03e−05
1.19e−05
1.34e−05
1.49e−05
α (mas, increasing towards East)δ (
mas,
incre
asin
g t
ow
ard
s N
ort
h)
−3−2−1 0 1 2 3
−3
−2
−1
0
1
2
3
1.38e−10
2.68e−06
5.36e−06
8.03e−06
1.07e−05
1.34e−05
1.61e−05
1.87e−05
2.14e−05
2.41e−05
2.68e−05
α (mas, increasing towards East)
δ (
mas,
incre
asin
g t
ow
ard
s N
ort
h)
L L L
0.0 0.5 1.0 1.510+8
−1.0
−0.5
0.0
0.5
1.0
spatial frequency in 1/rad
resid
uals
of
square
d v
isib
ility
(V
IS2)
L L L
0.0 0.5 1.0 1.510+8
−1.0
−0.5
0.0
0.5
1.0
spatial frequency in 1/radre
sid
uals
of
square
d v
isib
ility
(V
IS2)
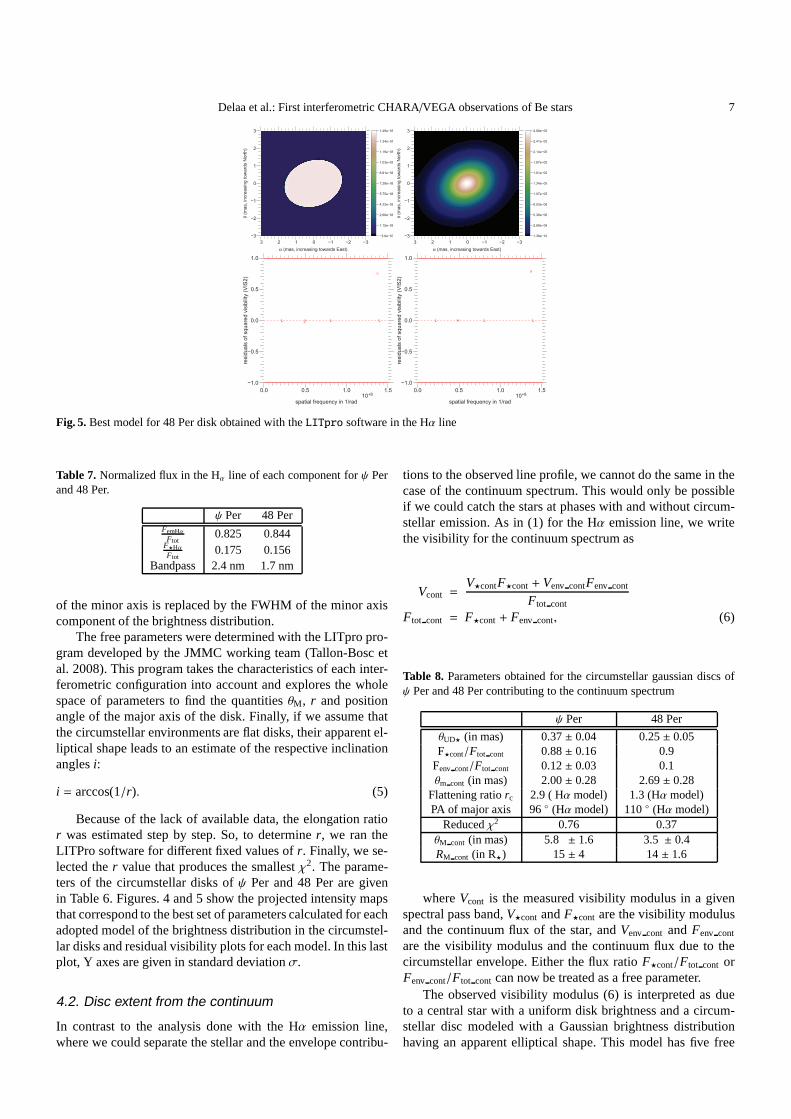
Fig. 5.Best model for 48 Per disk obtained with theLITpro software in the Hα line
Table 7. Normalized flux in the Hα line of each component forψ Perand 48 Per.
ψ Per 48 PerFemHα
Ftot0.825 0.844
F⋆HαFtot
0.175 0.156Bandpass 2.4 nm 1.7 nm
of the minor axis is replaced by the FWHM of the minor axiscomponent of the brightness distribution.
The free parameters were determined with the LITpro pro-gram developed by the JMMC working team (Tallon-Bosc etal. 2008). This program takes the characteristics of each inter-ferometric configuration into account and explores the wholespace of parameters to find the quantitiesθM , r and positionangle of the major axis of the disk. Finally, if we assume thatthe circumstellar environments are flat disks, their apparent el-liptical shape leads to an estimate of the respective inclinationanglesi:
i = arccos(1/r). (5)
Because of the lack of available data, the elongation ratior was estimated step by step. So, to determiner, we ran theLITPro software for different fixed values ofr. Finally, we se-lected ther value that produces the smallestχ2. The parame-ters of the circumstellar disks ofψ Per and 48 Per are givenin Table 6. Figures. 4 and 5 show the projected intensity mapsthat correspond to the best set of parameters calculated foreachadopted model of the brightness distribution in the circumstel-lar disks and residual visibility plots for each model. In this lastplot, Y axes are given in standard deviationσ.
4.2. Disc extent from the continuum
In contrast to the analysis done with the Hα emission line,where we could separate the stellar and the envelope contribu-
tions to the observed line profile, we cannot do the same in thecase of the continuum spectrum. This would only be possibleif we could catch the stars at phases with and without circum-stellar emission. As in (1) for the Hα emission line, we writethe visibility for the continuum spectrum as
Vcont =V⋆contF⋆cont+ Venv contFenv cont
Ftot cont
Ftot cont = F⋆cont+ Fenv cont, (6)
Table 8. Parameters obtained for the circumstellar gaussian discs ofψ Per and 48 Per contributing to the continuum spectrum
ψ Per 48 Per
θUD⋆ (in mas) 0.37± 0.04 0.25± 0.05F⋆cont/Ftot cont 0.88± 0.16 0.9
Fenv cont/Ftot cont 0.12± 0.03 0.1θm cont (in mas) 2.00± 0.28 2.69± 0.28
Flattening ratiorc 2.9 ( Hα model) 1.3 (Hα model)PA of major axis 96 ◦ (Hα model) 110◦ (Hα model)
Reducedχ2 0.76 0.37θM cont (in mas) 5.8 ± 1.6 3.5 ± 0.4RM cont (in R⋆) 15± 4 14± 1.6
whereVcont is the measured visibility modulus in a givenspectral pass band,V⋆cont andF⋆cont are the visibility modulusand the continuum flux of the star, andVenv cont andFenv cont
are the visibility modulus and the continuum flux due to thecircumstellar envelope. Either the flux ratioF⋆cont/Ftot cont orFenv cont/Ftot cont can now be treated as a free parameter.
The observed visibility modulus (6) is interpreted as dueto a central star with a uniform disk brightness and a circum-stellar disc modeled with a Gaussian brightness distributionhaving an apparent elliptical shape. This model has five free
8 Delaa et al.: First interferometric CHARA/VEGA observations of Be stars
U U
0.0 0.5 1.0 1.5 2.010+8
−1.5
−1.0
−0.5
0.0
0.5
1.0
spatial frequency in 1/rad
resid
uals
of
square
d v
isib
ility
(V
IS2)
D D
0.0 0.5 1.0 1.5 2.010+8
−1.0
−0.5
0.0
0.5
1.0
spatial frequency in 1/rad
resid
uals
of
square
d v
isib
ility
(V
IS2)
Fig. 6.Residual plot for our best model forψ Per (left) and 48 Per (right) in the continuum.
parameters: the stellar angular diameterθUD⋆;,the angular di-ameter of the minor axis of the Gaussian disk contributing tothe continuum fluxθm cont, the normalized stellar continuumflux F⋆cont/Ftot cont, the ratio of the major to the minor axis ofthe elliptical disk emitting in the continuum (flattening ratio)rc=RM cont/Rm cont, and the position angle of the major axis ofthe elliptical disk position angle measured eastward from thenorth. The free parameters were calculated as before using theLITpro software. In this analysis we made two assumptions:that the elongation of the continuum emitting zone is the sameas for the Hα line emission and that the position angle derivedpreviously with the Hα emission line is also the same for thecontinuum. Because there is not enough data for 48 Per at ourdisposal, we also preferred to fit the flux ratioF⋆cont/Ftot cont
in this star and adopt the value that produces the bestχ2. Thequantities that characterize the circumstellar region contribut-ing to the emitted continuum spectrum in the program stars ob-tained are summarized in Table 8, and residual visibilitiesareplotted in Fig. 6 .
Taking the roughly 20% uncertainties affecting the Barnes-Evans method into account, we note that our results concerningthe stellar angular diameters derived from the continuum spec-trum are in good agreement with those reported by Quirrenbachet al. (1997), i.e. 0.33 mas forψ Per and 0.34 mas for 48 Per.Regarding the angular diameters of the circumstellar contin-uum emitting regions, our estimate forψ Per is twice as large asin Quirrenbach et al. (1997), while for 48 Per it is very closetothe value obtained by these authors (2.77±0.56 mas). However,these comparisons can be misleading, since the emission in Bestars is known to be fairly variable.
Finally, we stress that our W1W2 projected baseline of108.8 m enabled us to resolve the central star of 48 Per, whileQuirrenbach et al. (1997) probably could not resolve it withthe31.5 m baseline of the MkIII.
5. Modeling the circumstellar envelope
5.1. Data in the differential analysis mode
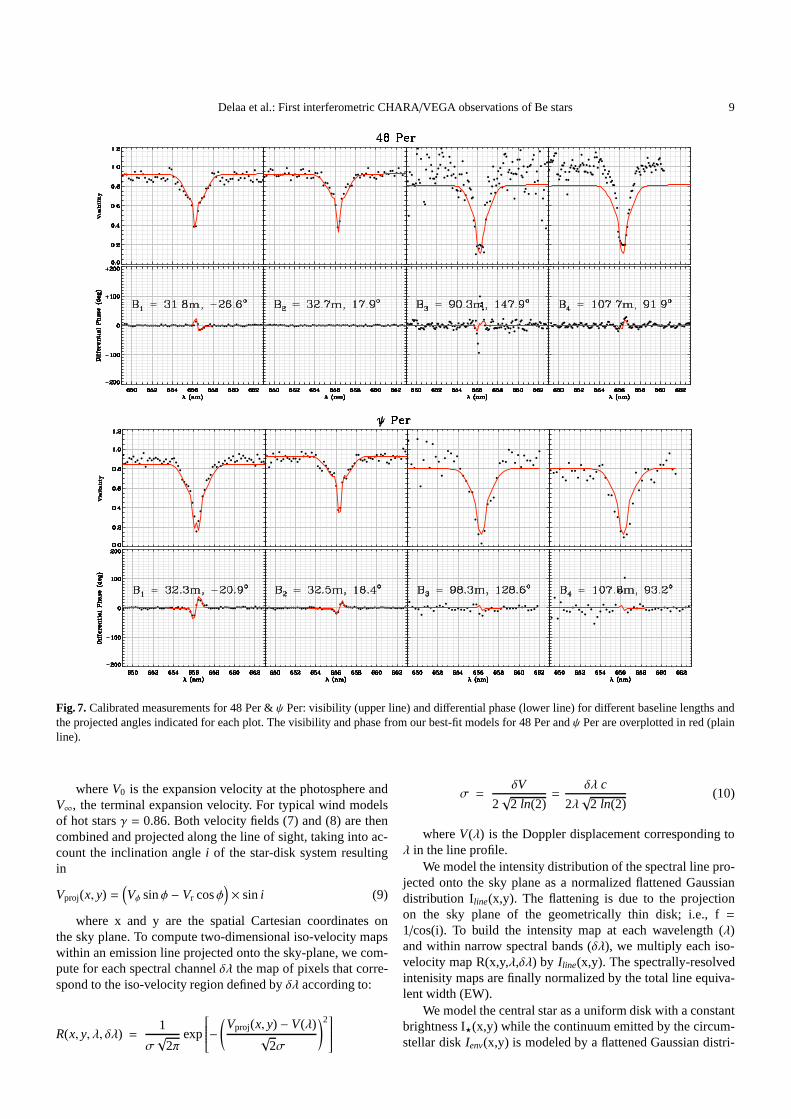
Data for 48 Per andψ Per using the cross-spectral density anal-ysis mode are presented in Fig. 7. For each star, we have plottedthe visibility and the differential phase as a function of wave-
length around the Hα line. The visibility curves clearly indicatethat the Hα region is partially resolved; that is, the visibilityis less than 1.0, with the shortest baselines and fully resolvedwith the longest baselines. We also notice the large broaden-ing in the wings of the visibility curves. Two hypothesis willbe discussed in Sect. 5.3 to explain this effect. We see that thedifferential phase plots exhibit “S” shapes, which are clear sig-natures for rotating disks (Meilland et al. 2007b). The absenceof this “S” shape for the B2 baseline observation of 48 Per per-haps comes from the B2 baseline being oriented close to thedirection of the stellar rotational axis so that no photocenterdisplacement, which produces a fringe phase shift, is expectedin this direction. Finally, let us note the complex behaviorof thedifferential phase for the largest baselines. This is most proba-bly because the disk is fully resolved. There is a direct relationbetween photocenter displacements and fringe phase shifts, butthis is only a first-order effect when the object is unresolved orbarely resolved. Observations on the larger baselines are sensi-tive to small-scale features on the disk itself, which are neitherconsidered nor reproduced by our simple kinematic disk modelpresented in the next section.
5.2. The kinematic disk model
To constrain the kinematics in the circumstellar environment ofboth stars, we have used a simple model that was developed inorder to allow fast fitting of observations concerning rotatingand/or expanding geometrically thin disks around stars. For therotation velocity the model adopts a simple power law:
Vφ = Vrot
(
rR⋆
)β
(7)
whereVrot is the stellar rotational velocity andr the distanceto the center of the star. In this modelβ = −0.5 corresponds toKeplerian rotation, andVrot can be considered proportional orequal to the stellar critical velocityVc =
√
2GM⋆/3Rp, whereM⋆ is the stellar mass andRp its polar radius. The expansionvelocity is assumed to be given by a CAK wind model (Castoret al. 1975):
Vr = V0 + (V∞ − V0)(
1− R⋆
r
)γ
(8)
Delaa et al.: First interferometric CHARA/VEGA observations of Be stars 9
Fig. 7. Calibrated measurements for 48 Per &ψ Per: visibility (upper line) and differential phase (lower line) for different baseline lengths andthe projected angles indicated for each plot. The visibility and phase from our best-fit models for 48 Per andψ Per are overplotted in red (plainline).
whereV0 is the expansion velocity at the photosphere andV∞, the terminal expansion velocity. For typical wind modelsof hot starsγ = 0.86. Both velocity fields (7) and (8) are thencombined and projected along the line of sight, taking into ac-count the inclination anglei of the star-disk system resultingin
Vproj(x, y) =(
Vφ sinφ − Vr cosφ)
× sini (9)
where x and y are the spatial Cartesian coordinates onthe sky plane. To compute two-dimensional iso-velocity mapswithin an emission line projected onto the sky-plane, we com-pute for each spectral channelδλ the map of pixels that corre-spond to the iso-velocity region defined byδλ according to:
R(x, y, λ, δλ) =1
σ√
2πexp
−(
Vproj(x, y) − V(λ)√
2σ
)2
σ =δV
2√
2 ln(2)=
δλ c
2λ√
2 ln(2)(10)
whereV(λ) is the Doppler displacement corresponding toλ in the line profile.
We model the intensity distribution of the spectral line pro-jected onto the sky plane as a normalized flattened Gaussiandistribution Iline(x,y). The flattening is due to the projectionon the sky plane of the geometrically thin disk; i.e., f=1/cos(i). To build the intensity map at each wavelength (λ)and within narrow spectral bands (δλ), we multiply each iso-velocity map R(x,y,λ,δλ) by Iline(x,y). The spectrally-resolvedintenisity maps are finally normalized by the total line equiva-lent width (EW).
We model the central star as a uniform disk with a constantbrightness I⋆(x,y) while the continuum emitted by the circum-stellar diskIenv(x,y) is modeled by a flattened Gaussian distri-
10 Delaa et al.: First interferometric CHARA/VEGA observations of Be stars
bution with the same flattening as Iline(x,y). As for Iline(x,y),I⋆(x,y) and Ienv(x,y) are normalized by their respective totalflux. The envelope flux in the continuum Fenv is constant, whilethe relative flux of the central star F⋆ to the total flux is afunction of wavelength to be able to consider photospheric lineand/or strong absorption features such as shell lines.
Finally, we obtain the total emission maps for each spectralchannel by adding the three contributions with their relativefluxes:
Itot(x, y, λ, δλ) = I⋆(x, y) × F⋆(λ) + Ienv(x, y) × Fenv (11)
+ Iline(x, y) × R(x, y, λ, δλ) × EW.
This simple model enables us to calculate a 256×256×100data cube corresponding to 256× 256 pixels of the map and100 different wavelengths in the line and nearby continuum.This calculation takes less than one second on a “standard”computer. The computed maps can then be rotated to fit theobservational position angle and/or scaled using the stellar ra-diusR⋆ and distanced. The wavelength dependent visibilitiesand phases for several baselines can then be calculated usingstandard Fourier transform methods. The total computing timefor one simulated interferometric dataset is a few seconds to al-low us to perform automatic model fitting as for instance withthe Levenberg-Marquart method. However, this procedure in-volves calculation of some 10 free parameters, whose determi-nation may in some cases be somewhat longze.
5.3. Line wing broadening
After having computed hundreds of models we were not able toreproduce all of the observed data. It was not possible to simul-taneously fit the large wings in the visibility, the intensity pro-file that would correspond to more than 1000 kms−1 of Dopplerdisplacement, and the narrower differential phase variations ofa few hundred km s−1. Despite the poor fits of the line wings,we did manage to simultaneously fit the central part of the lineintensity, both the visibility and the differential phase, with apure rotating disk model having a smaller stellar radii, wherethe major-axis is oriented perpendicularly to the polarizationangle inψ Per and parallel to it for 48 Per. In what followswe explore some hypotheses that could in principle explain theorigin of these wide spread wings.
The polar wind hypothesis: In this hypothesis we considera quickly expanding spherical stellar wind. Since the polarterminal wind velocities in Be stars determined from fra-UVlines are in the range 1000-2000 kms−1, they are compatiblewith the Doppler displacements of the emission line wings.Nevertheless, it is unlikely that polar winds contribute signif-icantly to the emission in the Hα line, as the density in thepolar wind is by some orders of magnitude lower than in theequatorial plane. Kervella & Domiciano de Souza (2007) andMeilland et al. (2007b) measured polar wind contributions andfound that they are only a few percent of the total near-infraredflux in the Be stars Achernar andα Arae. However, these windswere not spherical and they would create a differential phase
signal in the line. Moreover, this hypothesis cannot explain theline broadening inψ Per, which is a Be-shell star likely seenedge-on. Consequently, the projected polar wind velocity can-not produce components in the line of sight large enough toaccount for the measured broadening up to some 103 km s−1.
Keplerian shear hypothesis: The Keplerian shear providessignificant Doppler gradients thereby enabling the photonstrapped in optically thick layers to escape easily from the cir-cumstellar envelopes and produce significantly enlarged wingsin emission lines (Horne & Marsh 1986). The Doppler widthof an intrinsic Gaussian line profile can be enlarged by a“turbulent-like” term due to the differential rotation in the diskprojected towards the observer. For circumstellar media opti-cally thick enough wide P Cyg line profiles can be produced,but also bottle-like line shapes with line wings that are broaderfor the higher the inclination angles. The same shear can alsoproduce extremely large absorption wings. These effects werestudied by Arias et al. (2007).
The incoherent scattering hypothesis: A non-coherent scat-tering redistribution is one where the frequency of radiationre-emitted within the lines does not depend only on the radi-ation absorbed in the same frequency. Discussions of the con-sequences of this incoherent redistribution in the formation ofabsorption line wings date back to Spitzer (1944) and Munch(1949). More systematic accounts on this process can be foundin Mihalas (1978). The influence of the incoherent electronscattering on the emission line formation in Wolf-Rayet starswas studied by Castor et al. (1970). The combination of kine-matics, incoherent scattering and non-LTE effects on the sourcefunction of Balmer lines in circumstellar envelopes, can pro-duce broadened wine-bottle-like line profiles with extendedwings (Hummel & Dachs 1992).
In this work we decided to explore only this last effect asexplained in the next section.
5.4. Emission line broadening by incoherent scattering
The line broadening by incoherent scattering in the Hα emis-sion line is estimated here by introducing two parameters toour kinematic-model: the global ratio of the scattered photonsand the spectral width of the scattering. This ad-hoc treatmentof the phenomenon is certainly a major caveat in our approach.Better calculations of this effect can be performed by using re-cent models, such as the non-LTE radiative transferBEDIS Kcode developed by Sigut & Jones (2007).
For both objects we have taken the Hα photospheric lineunderlying the circumstellar emission line into account. Forthis, we used the photospheric line profiles obtained usinga SYNSPEC model (Hubeny 1988; Hubeny & Lanz 1995),broadened by the corresponding rotational velocity. In thecaseof objects seen at high inclination angles one has to also con-sider the absorption of the stellar radiation by the circum-stellar disk itself. Whenever the disk opacity in the lines ishigh enough, a deep-narrow absorption appears at the centerof emission lines. The resulting double-peaked emission lineswith a narrow absorption at its center are called “Be-shell”lineprofiles.ψ Per exhibits such line profiles, and is therefore ex-
Delaa et al.: First interferometric CHARA/VEGA observations of Be stars 11
Table 9.Best-fit kinematic-model parameters for 48 Per andψ Per, with the position angle of the major axis.
Disk geometry in the continuum Disk geometry in the line Diskkinematics non-coherent scatteringStar FWHMc (R⋆) i (◦) P.A. (◦) Fenv EWl (Å) FWHM l (R⋆) Vrot (km s−1) β ( Eq. 6 ) Width (Å) Ratioψ Per 15±5 75±8 115±20 0.15±0.05 43±4 20±4 400±20 -0.35±0.05 20±6 0.4±0.148 Per 9±2 30±10 108±1 0.1±0.05 36±3 9±1 440±30 -0.5±0.1 18±4 0.4±0.1
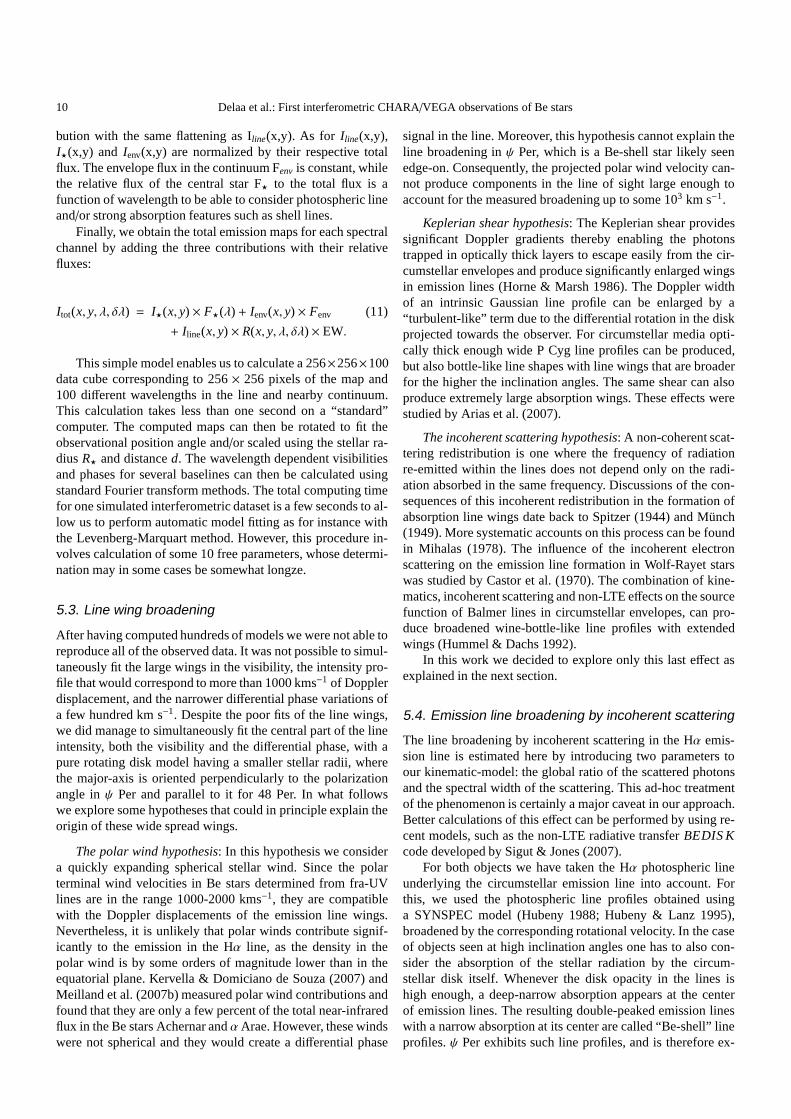
Fig. 8. 48 Per (right) and ψ Per (left) fit of the Hα line profiles. red dotted line: Simulated stellar absorption line, including shellabsorption for ψ Per. Blue line: BeSS spectrum convolved with CHARA/VEGA spectral-resolution. Red solid line: line computed fromthe best-fit kinematic model. Note the good agreement at the center of the line, whereas our model produces line wings too largecompared to the amateur spectrum.
pected to have a high inclination angle. To include this phenom-ena in our model, we modified the relative stellar flux F⋆(λ), byadding a strong and narrow absorption at the center of the Hα
line.Previous spectrally resolved interferometric observations
(Meilland et al. 2007a,b) and spectroscopic follow-ups(Miroshnichenko et al. 2003; Vinicius et al. 2006) showed evi-dence that the kinematics in the equatorial plan was dominatedby rotation. Thus, because of the lack of available measure-ments for our targets and the introduction of additional param-eters needed to take into account the incoherent scatteringef-fect, we decided to neglect the expansion in the equatorial disk(i.e., V0 = V∞ = 0 kms−1).
We ran several hundred models for each target to probe theparameter space. The visibility and phase for the best-fit mod-els for 48 Per andψ Per are overplotted in Fig. 7, and the fits ofthe Hα spectra are plotted in Fig 8. The corresponding param-eter values of the kinematic model are given in Table 9. Errorson the parameters are only “local” estimates based on the mea-sured errors on the visibility and phase. The uniqueness of thebest-fitted models are not clearly established because the effectof many parameters on the visibility and phase are not fullyindependent. Consequently, these models have to be consid-ered as ”best” models but not unique ones. We note, however,that the agreement between the model and observed differen-tial phases is better for the short baselines (B1 and B2) than forthe longer ones (B3 and B4). This is mainly because the cir-cumstellar disk is resolved at the longest baselines, so that thephase variations are dominated by a smaller structure, and ourmodel does not take this behavior into account. We also note
that while we obtain good agreement at the center of the line,our model produces line wings that are too broad for the ob-served spectrum, but close to the interferometric ones. This isprobably due to our add-hoc way of modeling the incoherentscattering so it is discussed in the next section.
6. Discussion
6.1. Comparison of the disk extensions between theLITpro and the kinematic models
In Figs. 3 and 4, we present the maps ofψ Per and 48 Perdisk that we obtained with the LITpro Software in the wholeHα line. We used two models to fit our data: a uniform and aGaussian disk model. The free parameters for these two modelsare the minor axis, the position angle, and the flattening ratio ofthe disk, but we can also choose to fix one parameter and let theother two remain free. For our purpose, and due to the limitedmeasurements we obtained, we fixed the flattening ratio, know-ing the inclination angle of the disk, which was previously de-rived from the simple kinematic disk model used to interpretthe differential phases (see previous section). For both modelswe obtained a small reducedχ2 (see Table 6), but we were notable to clearly differentiate the two models. If we compare theLITpro models and the kinematics disk model (see Table 9), weobtain good agreement for 48 Per for the Gaussian disk model(see the right part of Table 6), whereas forψ Per, the LITpromodel provides a disk extension that is somehow smaller thanthe one obtained with the kinematic disk model.
12 Delaa et al.: First interferometric CHARA/VEGA observations of Be stars
6.2. Disk orientation and polarization measurements
Quirrenbach et al. (1997) estimate a minimum inclination ofi =62◦ for ψ Per andi = 27◦ for 48 Per from a fit of an ellipsoidalGaussian and clearly explain that they cannot determine thisinclination directly from their observations. From our simplekinematic model we obtain respectivelyi = 75± 8◦ and i =30± 10◦, in agreement with the LITpro fit in the whole Hα linebut with a stronger constraint since the differential phase andthe shape of the emission line profile are very sensitive to thisinclination angle.
With these inclination angles, we obtain a position anglefor the disk major axis of 115± 20◦ and 108± 1◦ for ψ Perand 48 Per, which again agree with our independent fit withinthe whole Hα line with the LITpro code. Yudin (2001) obtaina polarization of 0.17% for 48 Per and a position angle for themajor axis of 110◦. This position angle is very close to our mea-surement of 108◦ for the major axis position, thus the polariza-tion seems to be parallel to the disk, which is quite unusual fora Be star. The polarization position angle in an optically thinaxisymmetric disk is usually perpendicular to the plane of thedisk since it mainly comes from electron scattering (Brown &McLean 1977). On the other had, if the polar regions of the en-velope, i.e. a polar stellar wind as already observed forα Araeand Achernar, are dense enough, they can dominate the polar-ization and the polarization position angle will be parallel to theplane of the disk (Wood et al. 1996). Since 48 Per is supposedto be seen close to the polar regions (i = 30±10◦ from our spec-trally resolved measurements), we may in fact be detecting anextended stellar wind rather than an equatorial disk.
The situation is clearer forψ Per, where we obtained amajor-axis position angle of 115± 20◦, whereas the polariza-tion position angle determined by Yudin (2001) is 35◦, i.e., thepolarization position angle is nearly perpendicular to themajoraxis of the disk. This is not a surprise sinceψ Per is a strong Be-shell with an inclination anglei = 75± 8◦, close to the edge-oncase; thus, even if the equatorial optical depth is large enoughto produce a shell-line profile, the polar wind, if present, is notdense enough to dominate the polarized light.
6.3. Disc kinematics and stars
The kinematics of both disks are compatible with pure, rotatingmodels. In the case of 48 Per, the rotation is clearly Keplerian,with a rotational velocity at the photosphere of 440± 20kms−1,thus compatible with the critical velocity of 397± 20 km s−1
determined by Fremat et al. (2005) and exponentβ = −0.5 ±0.05 in the velocity law (7). Forψ Per, the rotational velocityat the photosphere is also compatible with the critical velocityi.e. 400±20 km s−1 (compared to 386± 21 km s−1), but β =−0.35± 0.50 This would imply that the disk is rotating fasterthan Keplerian motion requires. Such a rotational exponentβ
in the rotation law (7) has already been obtained by Meillandet al. (2007a) for the Be starκ CMa, butκ CMa was rotatingat only 52% of its critical velocity. However, we have to keepin mind that our simple geometrically thin model might not befully suitable for stars seen under high inclinations.
It nevertheless appears that both stars are rotating close totheir critical velocity. Consequently, we can assume that themain physical phenomena responsible for the mass ejection forthese Be stars is the stellar rotation itself. This effect has re-cently studied by Cranmer (2005) who finds that, from a de-tailed statistical determination of the equatorial rotation ratesof classical Be stars, rapid rotation is likely to be linked tothe ejection of gas that forms the observed circumstellar disks.Interestingly, he also finds that below 18000 K the thresholdratio Vmin/Vcrit (whereVmin is the minimum equatorial veloc-ity, andVcrit is the critical rotation speed) goes to unity asTeff
decreases towards the end of the B spectral class. Thus, it isrel-atively easy for these Be stars to form a Keplerian disk thanksto their proximity to critical rotation. This is clearly thecasefor ψ Per and 48 Per, two Be stars with aTeff on the order of16000 K, as obtained by Fremat et al. (2005).
7. Conclusion
We observed two very different Be stars: 48 Per, a nearly pole-on Be star, andψ Per, a Be-shell star close to edge-on geom-etry. Both stars are found to be nearly critical rotators even if48 Per seems to shelter a Keplerian rotating disk, whereas forψ Per the rotation is found to be faster [withβ = −0.35 in law(7)]. However, considering the limitations inherent in oursim-ple model, this last fact must be taken with caution.
One other interesting result is that the major-axis of 48 Peris parallel to the polarization angle and not perpendiculartoit, as already observed for many Be stars (i.e. includingψ Per).This might be due to the disk optical thickness, which is alsore-sponsible for the incoherent scattering of a non negligiblepartof the line emission. To our knowledge, this is the first time thatthis effect for a Be star has been seen.
Assuming a simple uniform disk model for the stellar pho-tosphere for the continuum and a Gaussian distribution of thebrightness in the whole line emission regions, we obtained aratio of the disk diameter Ddisk to the photospheric diameterD⋆ of ∼ 8 and∼ 11 respectively for 48 Per andψ Per, whichare to be compared with the ratios 8.0 and 9.4 obtained byQuirrenbach et al. (1997). This agreement is somehow surpris-ing since Quirrenbach et al. (1997) assumes a photospheric di-ameter from the Barnes-Evans relation, whereas our measure-ments include the contribution to the continuum of the enve-lope free-free and free-bound emission. The envelope ofψ Perappears to be 2 times more flattened than the one for 48 Per,which is not surprising since 48 Per is seen close to a pole-oninclination, whereasψ Per is seen equator-on.
Acknowledgements. VEGA is a collaboration between CHARA andOCA/LAOG/CRAL/LESIA that has been supported by the Frenchprograms PNPS and ASHRA, by INSU, and by the Region PACA. Theproject has obviously benefited from the strong support of the OCAand CHARA technical teams. The CHARA Array is operated withsupport from the National Science Foundation through grantAST-0908253, the W. M. Keck Foundation, the NASA Exoplanet ScienceInstitute, and from Georgia State University. This work made useof the BeSS database, operated at GEPI, Observatoire de Meudon,France: http://basebe.obspm.fr, use of the Jean-Marie Mariotti Center
Delaa et al.: First interferometric CHARA/VEGA observations of Be stars 13
SearchCal service6 co-developed by FIZEAU and LAOG, and ofCDS Astronomical Databases SIMBAD and VIZIER7.This workalso made use of the Jean-Marie Mariotti CenterLITpro service co-developed by CRAL, LAOG, and FIZEAU.8
References
Arias, M. L., Zorec, J., Cidale, L., et al. 2006, A&A, 460, 821Arias, M. L., Zorec, J., & Fremat, Y. 2007, in Astronomical
Society of the Pacific Conference Series, Vol. 361, ActiveOB-Stars: Laboratories for Stellare and CircumstellarPhysics, ed. A. T. Okazaki, S. P. Owocki, & S. Stefl, 419
Barnes, T. G. & Evans, D. S. 1976, MNRAS, 174, 489Barnes, T. G., Evans, D. S., & Parsons, S. B. 1976, MNRAS,
174, 503Bjorkman, J. E. & Carciofi, A. C. 2004, in Bulletin of the
American Astronomical Society, Vol. 36, Bulletin of theAmerican Astronomical Society, 773
Bonneau, D., Clausse, J., Delfosse, X., et al. 2006, A&A, 456,789
Brown, J. C. & McLean, I. S. 1977, A&A, 57, 141Burbidge, G. R. & Burbidge, E. M. 1953, ApJ, 117, 407Campbell, W. W. 1895, ApJ, 2, 177Castor, J. I., Abbott, D. C., & Klein, R. I. 1975, ApJ, 195, 157Castor, J. I., Smith, L. F., & van Blerkom, D. 1970, ApJ, 159,
1119Cranmer, S. R. 2005, ApJ, 634, 585Dougherty, S. M. & Taylor, A. R. 1992, Nature, 359, 808Fremat, Y., Zorec, J., Hubert, A., & Floquet, M. 2005, A&A,
440, 305Gehrz, R. D., Hackwell, J. A., & Jones, T. W. 1974, ApJ, 191,
675Grundstrom, E. D. & Gies, D. R. 2006, ApJ, 651, L53Hanuschik, R. W. 1996, A&A, 308, 170Horne, K. & Marsh, T. R. 1986, MNRAS, 218, 761Hubeny, I. 1988, Computer Physics Communications, 52, 103Hubeny, I. & Lanz, T. 1995, ApJ, 439, 875Hummel, W. & Dachs, J. 1992, A&A, 262, L17Kervella, P. & Domiciano de Souza, A. 2006, A&A, 453, 1059Kervella, P. & Domiciano de Souza, A. 2007, A&A, 474, L49Meilland, A., Millour, F., Stee, P., et al. 2007a, A&A, 464, 73Meilland, A., Stee, P., Vannier, M., et al. 2007b, A&A, 464, 59Mihalas, D. 1978, Stellar atmospheres/2nd edition/, ed.
Mihalas, D.Miroshnichenko, A. S., Bjorkman, K. S., Morrison, N. D., et al.
2003, A&A, 408, 305Mourard, D., Clausse, J. M., Marcotto, A., et al. 2009, A&A,
508, 1073Munch, G. 1949, ApJ, 109, 275Poeckert, R. & Marlborough, J. M. 1978a, ApJ, 220, 940Poeckert, R. & Marlborough, J. M. 1978b, ApJS, 38, 229Quirrenbach, A., Bjorkman, K. S., Bjorkman, J. E., et al. 1997,
ApJ, 479, 477Rinehart, S. A., Houck, J. R., & Smith, J. D. 1999, AJ, 118,
29746 Available at http://www.jmmc.fr/searchcal7 Available at http://cdsweb.u-strasbg.fr/8 LITpro softwar! e available at http://www.jmmc.fr/litpro
Ruusalepp, M. 1982, in IAU Symposium, Vol. 98, Be Stars, ed.M. Jaschek & H.-G. Groth, 303–310
Sigut, T. A. A. & Jones, C. E. 2007, ApJ, 668, 481Slettebak, A. 1949, ApJ, 110, 498Spitzer, Jr., L. 1944, ApJ, 99, 1Stee, P. 2003, A&A, 403, 1023Struve, O. 1931, ApJ, 73, 94Taylor, A. R., Waters, L. B. F. M., Lamers, H. J. G. L. M., Persi,
P., & Bjorkman, K. S. 1987, MNRAS, 228, 811ten Brummelaar, T. A., McAlister, H. A., Ridgway, S. T., et al.
2005, ApJ, 628, 453Tycner, C., Jones, C. E., Sigut, T. A. A., et al. 2008, ApJ, 689,
461Underhill, A. B., Divan, L., Prevot-Burnichon, M., & Doazan,
V. 1979, MNRAS, 189, 601Vinicius, M. M. F., Zorec, J., Leister, N. V., & Levenhagen,
R. S. 2006, A&A, 446, 643Waters, L. B. F. M. 1986, A&A, 162, 121Waters, L. B. F. M., Cote, J., & Lamers, H. J. G. L. M. 1987,
A&A, 185, 206Waters, L. B. F. M. & Marlborough, J. M. 1992, A&A, 256,
195Wood, K., Bjorkman, J. E., Whitney, B., & Code, A. 1996, ApJ,
461, 847Yudin, R. V. 2001, A&A, 368, 912Zorec, J., Arias, M. L., Cidale, L., & Ringuelet, A. E. 2007,
A&A, 470, 239


![VPAS12ST MANUAL [Recovered] - Cerwin-Vega](https://img.pdfslide.net/doc/110x75/631720f771e3f2062906a9be/vpas12st-manual-recovered-cerwin-vega.jpg)


