Embed Size (px)
Citation preview
Kinetic Studies of Low Severity VisbreakingKamal L. Kataria,† Rohit P. Kulkarni,† Aniruddha B. Pandit,*,†
Jyeshtharaj B. Joshi,† and Manmohan Kumar‡
Institute of Chemical Technology, University of Mumbai, Matunga, Mumbai - 400 019, India, andIndian Institute of Petroleum, Dehradun, India
Thermal cracking of vacuum residues and asphalts obtained from operating Indian refinerieswere studied in a batch reactor. The temperature was varied in the range 400-430 °C, and thebatch time was varied from 0 to 15 min. The pressure was kept at a constant value of 1.2 MPathrough out the experiment. The variation in the composition of the cracked gas fraction foreach feed was studied by gas chromatography. The resulting visbroken products were furthercharacterized in terms of its different industrially important boiling cuts. A five lump kineticmodel, comprising of gas (C1-C5), gasoline (IBP-150), LGO (150-350), VGO (350-500), and VR(500+) has been developed. The variation in the kinetic parameters with change in the feedproperties has been discussed. Also, an attempt has been made to seek a relationship betweenthe feed properties with the kinetic rate parameters and the activation energies.
1. IntroductionThermal cracking of heavy oils and vacuum residues
has been advanced as an up-gradation process so as tomeet the increasing demand for lighter fuels. Thermalcracking by carbon rejection methods such as visbreak-ing, delayed coking, and resid catalytic cracking andhydrogen addition methods such as hydrovisbreaking,hydrocracking, etc. are some of the important residueup-gradation processes. In these methods, visbreakingand delayed coking contribute about 32 and 30% re-spectively in terms of the total residue volume pro-cessed. These are followed by hydroprocessing and resi-due FCC with respective contributions of 19 and 15%.Deasphalting, the physical method of residue process-ing, contributes the remaining 3.5%.1 Visbreaking, aviscosity reduction process, is a mild liquid phase py-rolysis of large molecules to smaller ones to form lightersand gaseous products and offers some additional ben-efits. The process severity is controlled by the inter-changeable operational variables (being essentially afirst-order reaction) such as temperature and the resi-dence time. In the past decade, most of the visbreakingunits have been modified from coil-type (high temper-ature and lower residence time route) to coil-soaker(high residence time and lower temperature route),thereby reducing the process temperature by about 10°C. This modification has enhanced the yields of gas andgasoline. Further, the concurrent visbroken productsobtained attain a relatively superior quality of the fueloil and require zero to low quantity of cutterstock forproperty adjustments.
For a given feed, the extent of conversion, selectivityto gas and gasoline, coking behavior, and stability ofthe visbroken product are directly related to the feedcharacteristics, such as paraffin, asphaltene content,aromaticity, heteroatom content, etc., and vary to alarge extent from feed to feed. The extent of conver-sion of a particular feed within the stability range iscalled the crackability of the feed.2 To investigate therole of feed properties on the crackability, several re-
search groups3-13 have studied the kinetics of visbreak-ing of heavy oils and residues from a large number ofsources in a batch or continuous manner. These studieswere primarily focused on thermal cracking behaviorof feeds such as (i) model compounds having character-istics similar to heavy oil (average boiling point, viscos-ity, etc.) and (ii) actual heavy oils that includes atmos-pheric residue (AR), vacuum residue (VR), and theirblends which act as major feeds for the visbreakingunits.
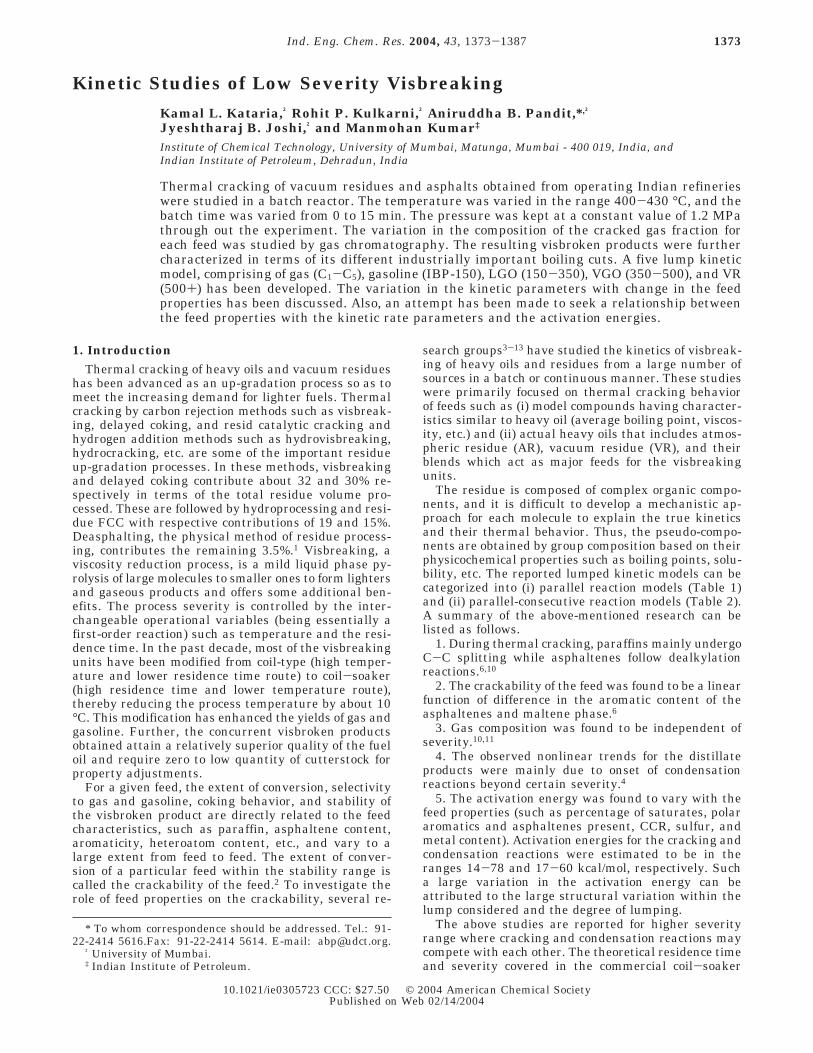
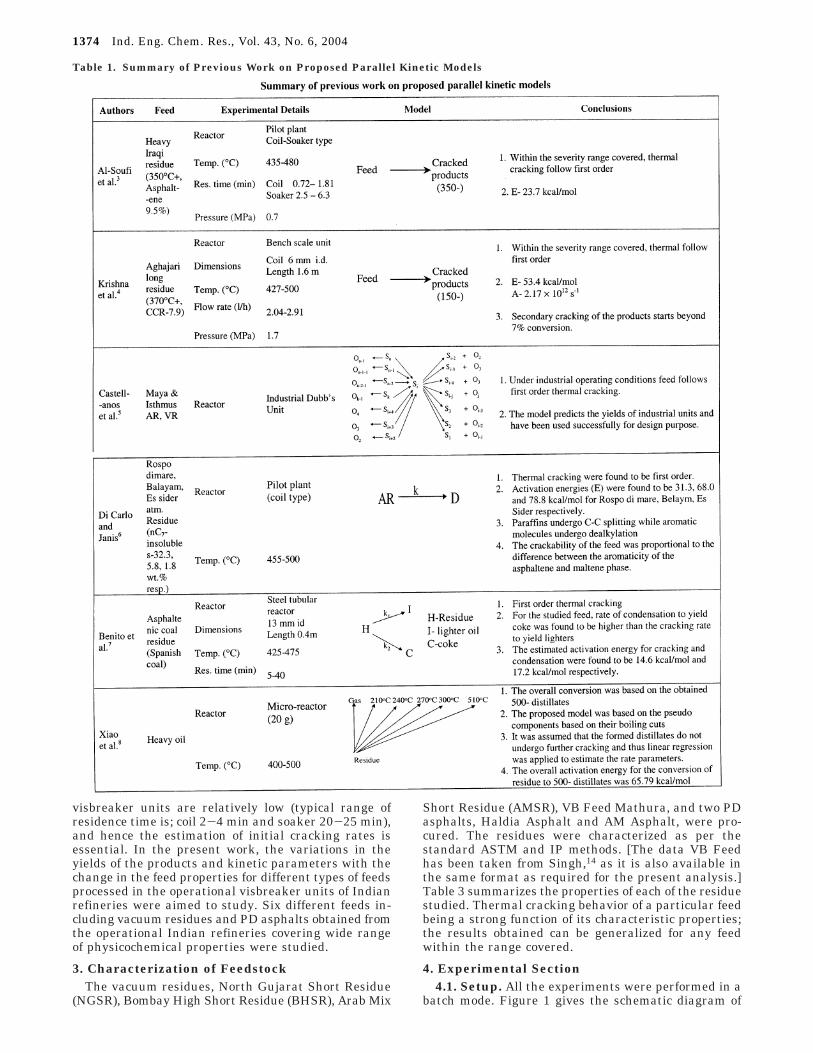
The residue is composed of complex organic compo-nents, and it is difficult to develop a mechanistic ap-proach for each molecule to explain the true kineticsand their thermal behavior. Thus, the pseudo-compo-nents are obtained by group composition based on theirphysicochemical properties such as boiling points, solu-bility, etc. The reported lumped kinetic models can becategorized into (i) parallel reaction models (Table 1)and (ii) parallel-consecutive reaction models (Table 2).A summary of the above-mentioned research can belisted as follows.
1. During thermal cracking, paraffins mainly undergoC-C splitting while asphaltenes follow dealkylationreactions.6,10
2. The crackability of the feed was found to be a linearfunction of difference in the aromatic content of theasphaltenes and maltene phase.6
3. Gas composition was found to be independent ofseverity.10,11
4. The observed nonlinear trends for the distillateproducts were mainly due to onset of condensationreactions beyond certain severity.4
5. The activation energy was found to vary with thefeed properties (such as percentage of saturates, polararomatics and asphaltenes present, CCR, sulfur, andmetal content). Activation energies for the cracking andcondensation reactions were estimated to be in theranges 14-78 and 17-60 kcal/mol, respectively. Sucha large variation in the activation energy can beattributed to the large structural variation within thelump considered and the degree of lumping.
The above studies are reported for higher severityrange where cracking and condensation reactions maycompete with each other. The theoretical residence timeand severity covered in the commercial coil-soaker
* To whom correspondence should be addressed. Tel.: 91-22-2414 5616.Fax: 91-22-2414 5614. E-mail: [email protected].
† University of Mumbai.‡ Indian Institute of Petroleum.
1373Ind. Eng. Chem. Res. 2004, 43, 1373-1387
10.1021/ie0305723 CCC: $27.50 © 2004 American Chemical SocietyPublished on Web 02/14/2004
visbreaker units are relatively low (typical range ofresidence time is; coil 2-4 min and soaker 20-25 min),and hence the estimation of initial cracking rates isessential. In the present work, the variations in theyields of the products and kinetic parameters with thechange in the feed properties for different types of feedsprocessed in the operational visbreaker units of Indianrefineries were aimed to study. Six different feeds in-cluding vacuum residues and PD asphalts obtained fromthe operational Indian refineries covering wide rangeof physicochemical properties were studied.
3. Characterization of FeedstockThe vacuum residues, North Gujarat Short Residue
(NGSR), Bombay High Short Residue (BHSR), Arab Mix
Short Residue (AMSR), VB Feed Mathura, and two PDasphalts, Haldia Asphalt and AM Asphalt, were pro-cured. The residues were characterized as per thestandard ASTM and IP methods. [The data VB Feedhas been taken from Singh,14 as it is also available inthe same format as required for the present analysis.]Table 3 summarizes the properties of each of the residuestudied. Thermal cracking behavior of a particular feedbeing a strong function of its characteristic properties;the results obtained can be generalized for any feedwithin the range covered.
4. Experimental Section4.1. Setup. All the experiments were performed in a
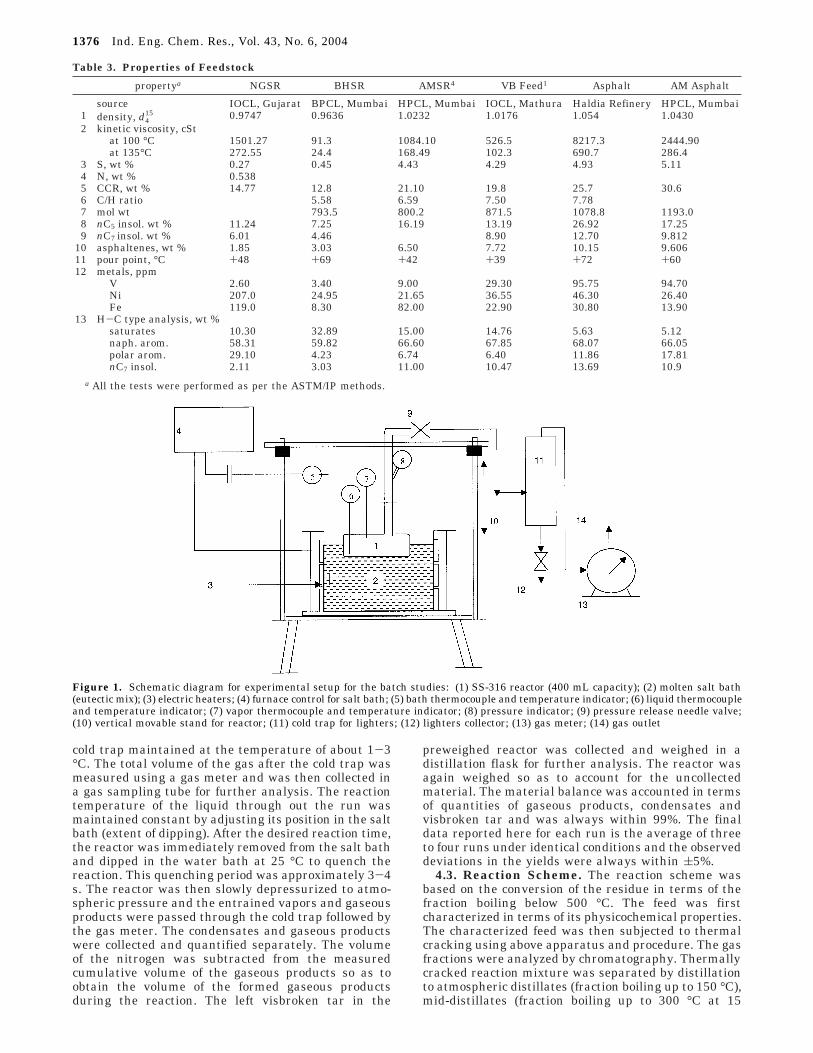
batch mode. Figure 1 gives the schematic diagram of
Table 1. Summary of Previous Work on Proposed Parallel Kinetic Models
1374 Ind. Eng. Chem. Res., Vol. 43, No. 6, 2004
the experimental setup. The reactor used was a hori-zontal 400 mL SS-316 bomb, with the provision of mea-suring the liquid and vapor temperature. The reactorwas pressurized with nitrogen and was maintained withthe help of a pressure-regulating needle valve. The mol-ten salt (eutectic mixture of KNO3, NaNO3, and NaNO2with 53, 7, and 40 wt %, respectively) bath was used asthe heating medium. The cold trap was used to separatethe gas from the entrained lighters. A gas meter wasused to quantify the extent of gaseous products.
4.2. Experimental Procedure. The molten salt bathwas heated electrically and the temperature was con-trolled within (2 °C using a PID controller. The bathtemperature was kept always higher by 50 °C than thedesired reaction temperature so as to maintain thethermal gradient. The reactor was charged with ap-proximately 120 ( 0.5 g of the sample and was pres-surized with N2 at room temperature to 0.6 MPa g. Sincethe cracking reactions start at around 350 °C and the
desired reaction temperature was in the range of 400-430 °C for the residence time of 0-15 min, it wasnecessary to shorten the heating time. For this purpose,the heating was carried out in two stages. In the firststage, the reactor was placed just above the molten saltsurface so as to preheat the residue to 300 °C using theconvective heat of the salt bath. As soon as the liquidattained 300 °C, the reactor was dipped in the moltensalt bath with constant rocking of the reactor so as toassure uniform mixing of the residue. The reactiontemperature was attained in a time period of 1.5-2 min.The temperatures of the liquid and vapor fraction weremeasured simultaneously at an interval of 15 s. Thereactor attained an absolute pressure of 1.2 MPa beforethe reaction temperatures were reached. The excesspressure in each run was released and was maintainedat a constant value of 1.2 MPa using the pressure-regulating needle valve. The gas and the entrainedlighters (low boiling fractions) were passed through the
Table 2. Summary of the Reported Parallel Consecutive Kinetic Models
Ind. Eng. Chem. Res., Vol. 43, No. 6, 2004 1375
cold trap maintained at the temperature of about 1-3°C. The total volume of the gas after the cold trap wasmeasured using a gas meter and was then collected ina gas sampling tube for further analysis. The reactiontemperature of the liquid through out the run wasmaintained constant by adjusting its position in the saltbath (extent of dipping). After the desired reaction time,the reactor was immediately removed from the salt bathand dipped in the water bath at 25 °C to quench thereaction. This quenching period was approximately 3-4s. The reactor was then slowly depressurized to atmo-spheric pressure and the entrained vapors and gaseousproducts were passed through the cold trap followed bythe gas meter. The condensates and gaseous productswere collected and quantified separately. The volumeof the nitrogen was subtracted from the measuredcumulative volume of the gaseous products so as toobtain the volume of the formed gaseous productsduring the reaction. The left visbroken tar in the
preweighed reactor was collected and weighed in adistillation flask for further analysis. The reactor wasagain weighed so as to account for the uncollectedmaterial. The material balance was accounted in termsof quantities of gaseous products, condensates andvisbroken tar and was always within 99%. The finaldata reported here for each run is the average of threeto four runs under identical conditions and the observeddeviations in the yields were always within (5%.
4.3. Reaction Scheme. The reaction scheme wasbased on the conversion of the residue in terms of thefraction boiling below 500 °C. The feed was firstcharacterized in terms of its physicochemical properties.The characterized feed was then subjected to thermalcracking using above apparatus and procedure. The gasfractions were analyzed by chromatography. Thermallycracked reaction mixture was separated by distillationto atmospheric distillates (fraction boiling up to 150 °C),mid-distillates (fraction boiling up to 300 °C at 15
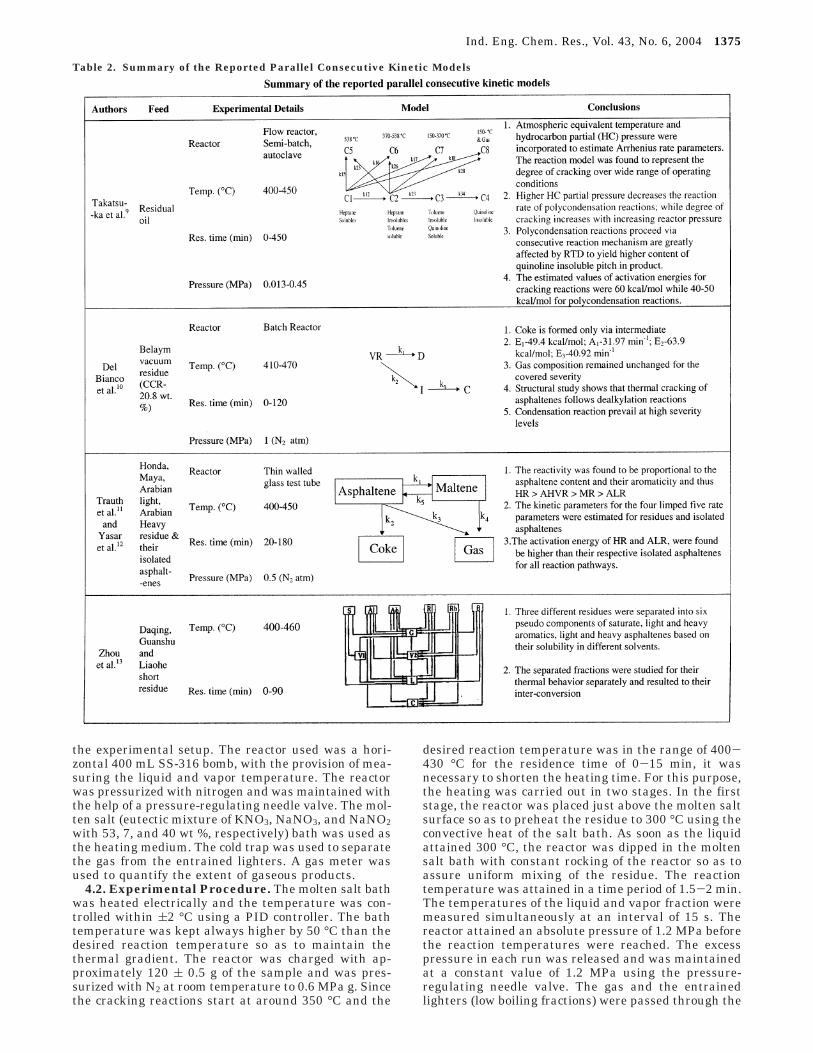
Table 3. Properties of Feedstock
propertya NGSR BHSR AMSR4 VB Feed1 Asphalt AM Asphalt
source IOCL, Gujarat BPCL, Mumbai HPCL, Mumbai IOCL, Mathura Haldia Refinery HPCL, Mumbai1 density, d4
15 0.9747 0.9636 1.0232 1.0176 1.054 1.04302 kinetic viscosity, cSt
at 100 °C 1501.27 91.3 1084.10 526.5 8217.3 2444.90at 135°C 272.55 24.4 168.49 102.3 690.7 286.4
3 S, wt % 0.27 0.45 4.43 4.29 4.93 5.114 N, wt % 0.5385 CCR, wt % 14.77 12.8 21.10 19.8 25.7 30.66 C/H ratio 5.58 6.59 7.50 7.787 mol wt 793.5 800.2 871.5 1078.8 1193.08 nC5 insol. wt % 11.24 7.25 16.19 13.19 26.92 17.259 nC7 insol. wt % 6.01 4.46 8.90 12.70 9.812
10 asphaltenes, wt % 1.85 3.03 6.50 7.72 10.15 9.60611 pour point, °C +48 +69 +42 +39 +72 +6012 metals, ppm
V 2.60 3.40 9.00 29.30 95.75 94.70Ni 207.0 24.95 21.65 36.55 46.30 26.40Fe 119.0 8.30 82.00 22.90 30.80 13.90
13 H-C type analysis, wt %saturates 10.30 32.89 15.00 14.76 5.63 5.12naph. arom. 58.31 59.82 66.60 67.85 68.07 66.05polar arom. 29.10 4.23 6.74 6.40 11.86 17.81nC7 insol. 2.11 3.03 11.00 10.47 13.69 10.9
a All the tests were performed as per the ASTM/IP methods.
Figure 1. Schematic diagram for experimental setup for the batch studies: (1) SS-316 reactor (400 mL capacity); (2) molten salt bath(eutectic mix); (3) electric heaters; (4) furnace control for salt bath; (5) bath thermocouple and temperature indicator; (6) liquid thermocoupleand temperature indicator; (7) vapor thermocouple and temperature indicator; (8) pressure indicator; (9) pressure release needle valve;(10) vertical movable stand for reactor; (11) cold trap for lighters; (12) lighters collector; (13) gas meter; (14) gas outlet
1376 Ind. Eng. Chem. Res., Vol. 43, No. 6, 2004
mmHg pressure) and finally the vacuum gas oil (fractionboiling up to 500 °C at a pressure of 0.2 mmHg). Theseparated distillates were subjected to SIMDIST analy-sis to obtain their SIM-DIST boiling point curve. Theleft out 500+ visbroken residue was then analyzed forits stability.
4.4 Analysis of the Reaction Products.Gas Analysis. The gas fraction was analyzed usingsimple gas chromatography (GC), also called a refinerygas analyzer (RGA), equipped with a packed column(30% squalein, 5 m) and flame ionization detector (FID).
Distillates Analysis. Two samples comprising (i) themixture of atmospheric distillates and the mid-distil-lates and (ii) vacuum distillates were analyzed sepa-rately using simulated distillation (SIMDIST). TheSIMDIST was operated as per the ASTM Ext. D-2887method using HP-6890 series GC equipped with fusedsilica column (cross-linked methyl silicone gum) of 10m × 0.9 µm × 0.53 µm and CS2 as diluent. The TBPcurves were obtained by the above analysis for each run(Figure 2) and were used to predict the weight fractionsof different pseudo-boiling-components considered in thereaction scheme.
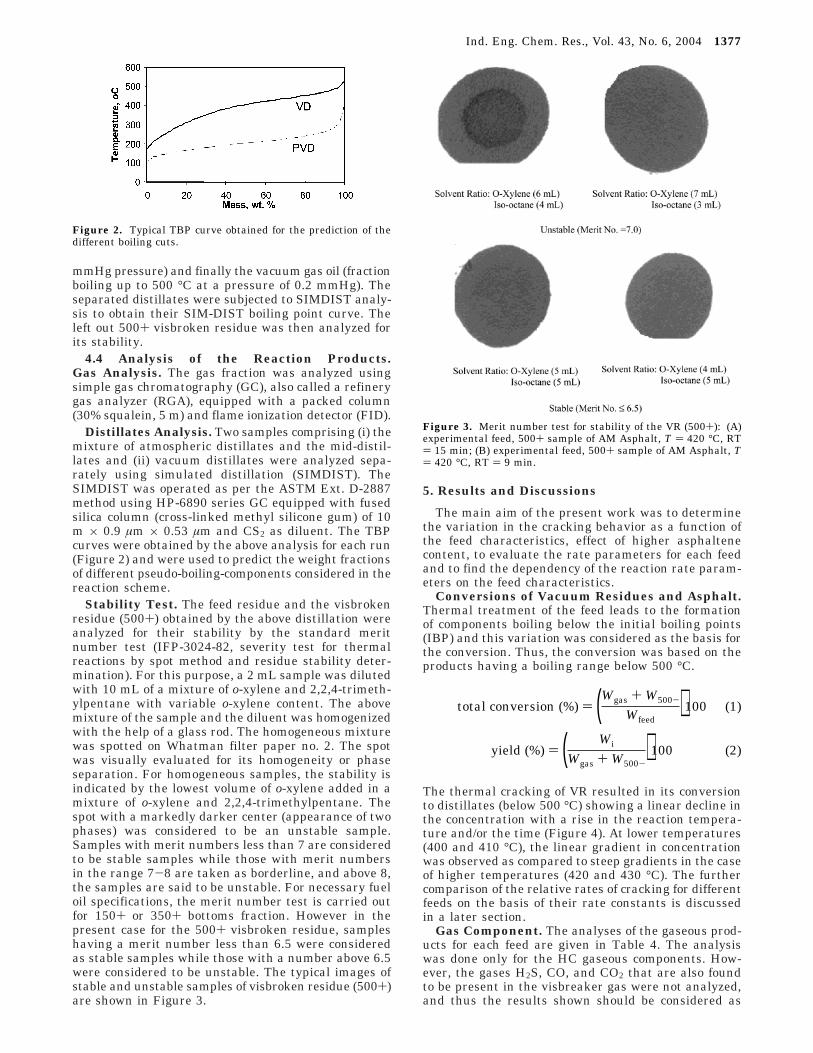
Stability Test. The feed residue and the visbrokenresidue (500+) obtained by the above distillation wereanalyzed for their stability by the standard meritnumber test (IFP-3024-82, severity test for thermalreactions by spot method and residue stability deter-mination). For this purpose, a 2 mL sample was dilutedwith 10 mL of a mixture of o-xylene and 2,2,4-trimeth-ylpentane with variable o-xylene content. The abovemixture of the sample and the diluent was homogenizedwith the help of a glass rod. The homogeneous mixturewas spotted on Whatman filter paper no. 2. The spotwas visually evaluated for its homogeneity or phaseseparation. For homogeneous samples, the stability isindicated by the lowest volume of o-xylene added in amixture of o-xylene and 2,2,4-trimethylpentane. Thespot with a markedly darker center (appearance of twophases) was considered to be an unstable sample.Samples with merit numbers less than 7 are consideredto be stable samples while those with merit numbersin the range 7-8 are taken as borderline, and above 8,the samples are said to be unstable. For necessary fueloil specifications, the merit number test is carried outfor 150+ or 350+ bottoms fraction. However in thepresent case for the 500+ visbroken residue, sampleshaving a merit number less than 6.5 were consideredas stable samples while those with a number above 6.5were considered to be unstable. The typical images ofstable and unstable samples of visbroken residue (500+)are shown in Figure 3.
5. Results and Discussions
The main aim of the present work was to determinethe variation in the cracking behavior as a function ofthe feed characteristics, effect of higher asphaltenecontent, to evaluate the rate parameters for each feedand to find the dependency of the reaction rate param-eters on the feed characteristics.
Conversions of Vacuum Residues and Asphalt.Thermal treatment of the feed leads to the formationof components boiling below the initial boiling points(IBP) and this variation was considered as the basis forthe conversion. Thus, the conversion was based on theproducts having a boiling range below 500 °C.
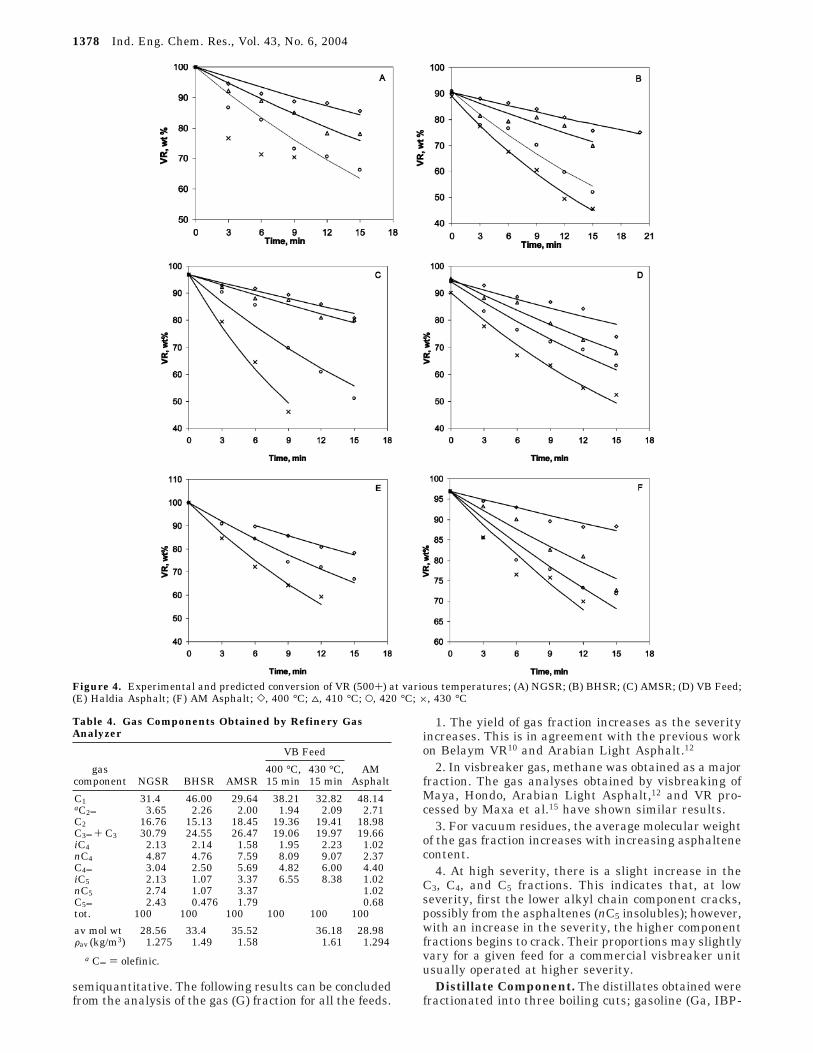
The thermal cracking of VR resulted in its conversionto distillates (below 500 °C) showing a linear decline inthe concentration with a rise in the reaction tempera-ture and/or the time (Figure 4). At lower temperatures(400 and 410 °C), the linear gradient in concentrationwas observed as compared to steep gradients in the caseof higher temperatures (420 and 430 °C). The furthercomparison of the relative rates of cracking for differentfeeds on the basis of their rate constants is discussedin a later section.
Gas Component. The analyses of the gaseous prod-ucts for each feed are given in Table 4. The analysiswas done only for the HC gaseous components. How-ever, the gases H2S, CO, and CO2 that are also foundto be present in the visbreaker gas were not analyzed,and thus the results shown should be considered as
Figure 2. Typical TBP curve obtained for the prediction of thedifferent boiling cuts.
Figure 3. Merit number test for stability of the VR (500+): (A)experimental feed, 500+ sample of AM Asphalt, T ) 420 °C, RT) 15 min; (B) experimental feed, 500+ sample of AM Asphalt, T) 420 °C, RT ) 9 min.
total conversion (%) ) (Wgas + W500-
Wfeed)100 (1)
yield (%) ) ( Wi
Wgas + W500-)100 (2)
Ind. Eng. Chem. Res., Vol. 43, No. 6, 2004 1377
semiquantitative. The following results can be concludedfrom the analysis of the gas (G) fraction for all the feeds.
1. The yield of gas fraction increases as the severityincreases. This is in agreement with the previous workon Belaym VR10 and Arabian Light Asphalt.12
2. In visbreaker gas, methane was obtained as a majorfraction. The gas analyses obtained by visbreaking ofMaya, Hondo, Arabian Light Asphalt,12 and VR pro-cessed by Maxa et al.15 have shown similar results.
3. For vacuum residues, the average molecular weightof the gas fraction increases with increasing asphaltenecontent.
4. At high severity, there is a slight increase in theC3, C4, and C5 fractions. This indicates that, at lowseverity, first the lower alkyl chain component cracks,possibly from the asphaltenes (nC5 insolubles); however,with an increase in the severity, the higher componentfractions begins to crack. Their proportions may slightlyvary for a given feed for a commercial visbreaker unitusually operated at higher severity.
Distillate Component. The distillates obtained werefractionated into three boiling cuts; gasoline (Ga, IBP-
Figure 4. Experimental and predicted conversion of VR (500+) at various temperatures; (A) NGSR; (B) BHSR; (C) AMSR; (D) VB Feed;(E) Haldia Asphalt; (F) AM Asphalt; ], 400 °C; 4, 410 °C; O, 420 °C; ×, 430 °C
Table 4. Gas Components Obtained by Refinery GasAnalyzer
VB Feed
gascomponent NGSR BHSR AMSR
400 °C,15 min
430 °C,15 min
AMAsphalt
C1 31.4 46.00 29.64 38.21 32.82 48.14aC2d 3.65 2.26 2.00 1.94 2.09 2.71C2 16.76 15.13 18.45 19.36 19.41 18.98C3d + C3 30.79 24.55 26.47 19.06 19.97 19.66iC4 2.13 2.14 1.58 1.95 2.23 1.02nC4 4.87 4.76 7.59 8.09 9.07 2.37C4d 3.04 2.50 5.69 4.82 6.00 4.40iC5 2.13 1.07 3.37 6.55 8.38 1.02nC5 2.74 1.07 3.37 1.02C5d 2.43 0.476 1.79 0.68tot. 100 100 100 100 100 100
av mol wt 28.56 33.4 35.52 36.18 28.98Fav (kg/m3) 1.275 1.49 1.58 1.61 1.294
a Cd ) olefinic.
1378 Ind. Eng. Chem. Res., Vol. 43, No. 6, 2004
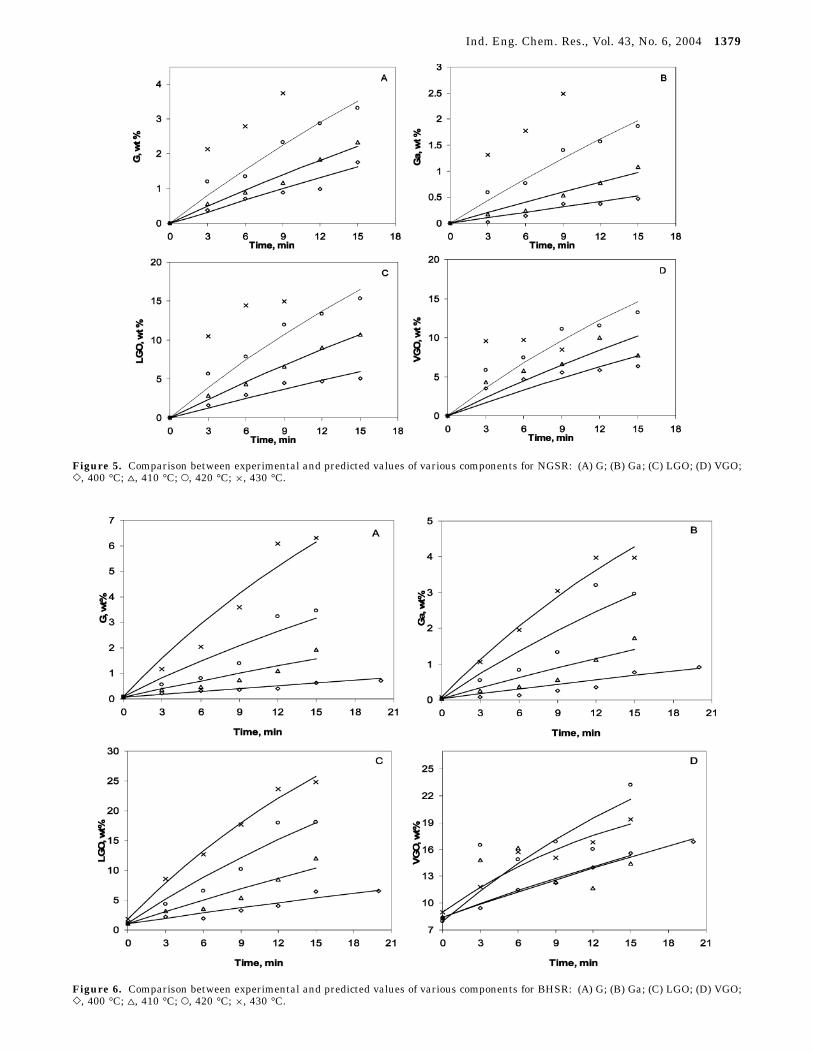
Figure 5. Comparison between experimental and predicted values of various components for NGSR: (A) G; (B) Ga; (C) LGO; (D) VGO;], 400 °C; 4, 410 °C; O, 420 °C; ×, 430 °C.
Figure 6. Comparison between experimental and predicted values of various components for BHSR: (A) G; (B) Ga; (C) LGO; (D) VGO;], 400 °C; 4, 410 °C; O, 420 °C; ×, 430 °C.
Ind. Eng. Chem. Res., Vol. 43, No. 6, 2004 1379
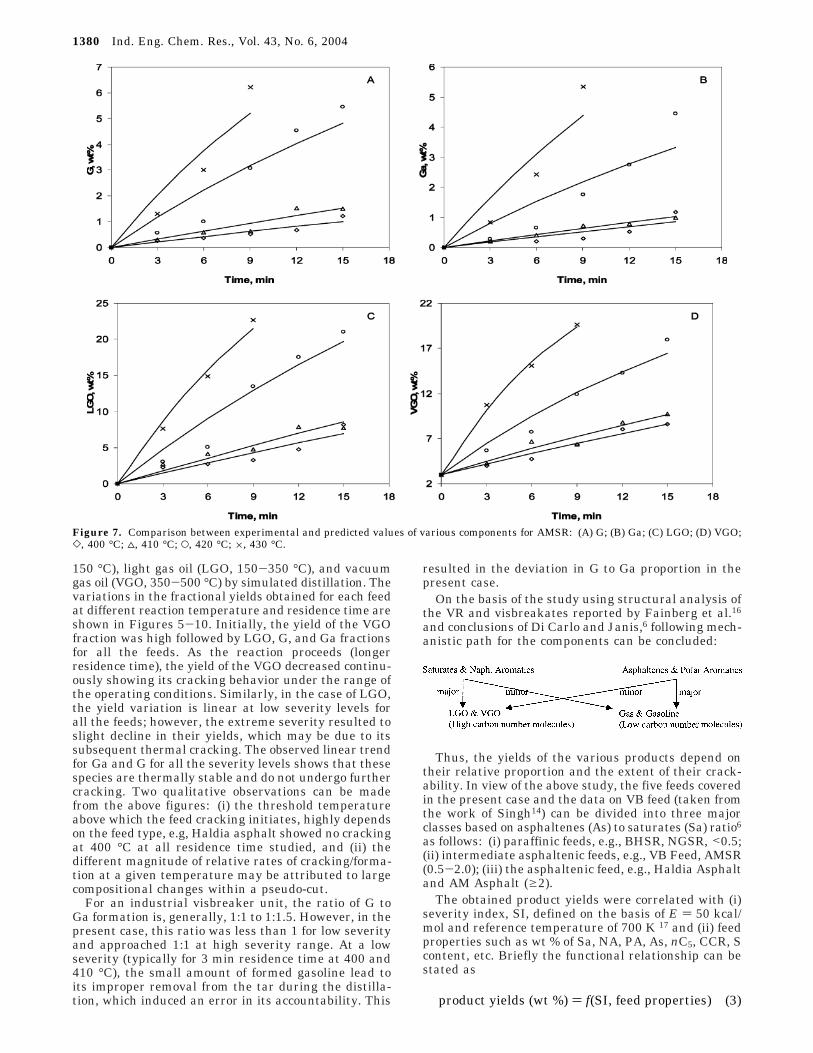
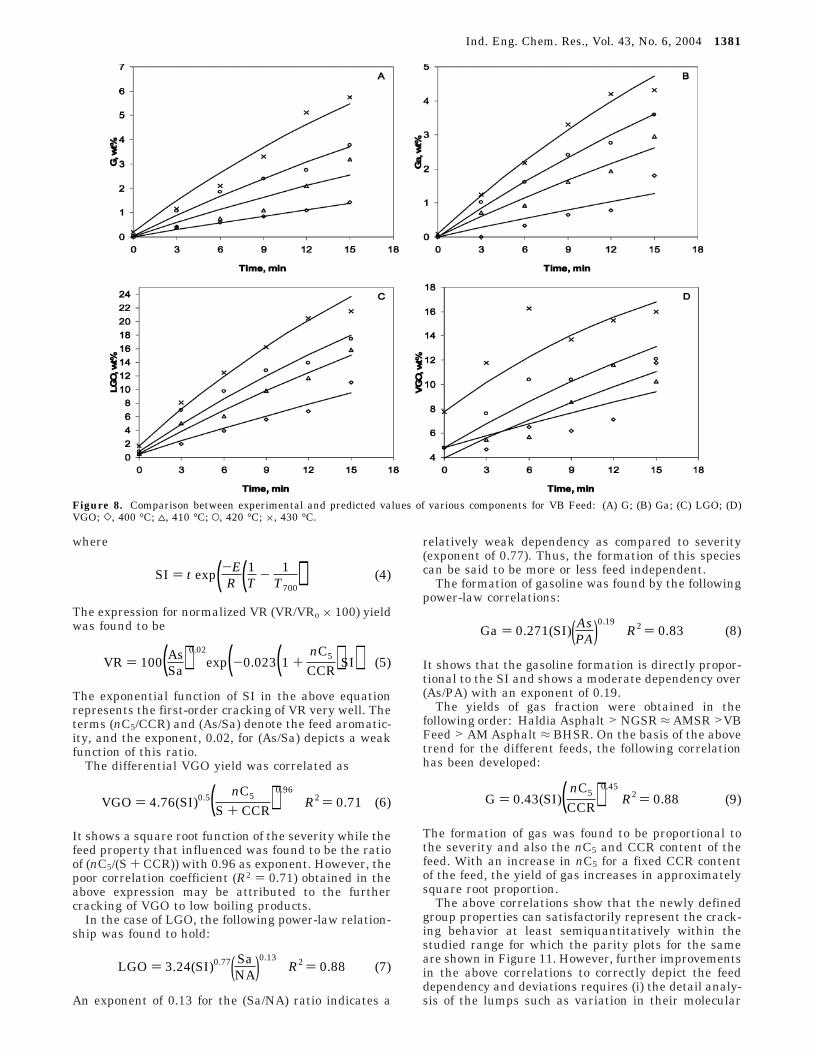
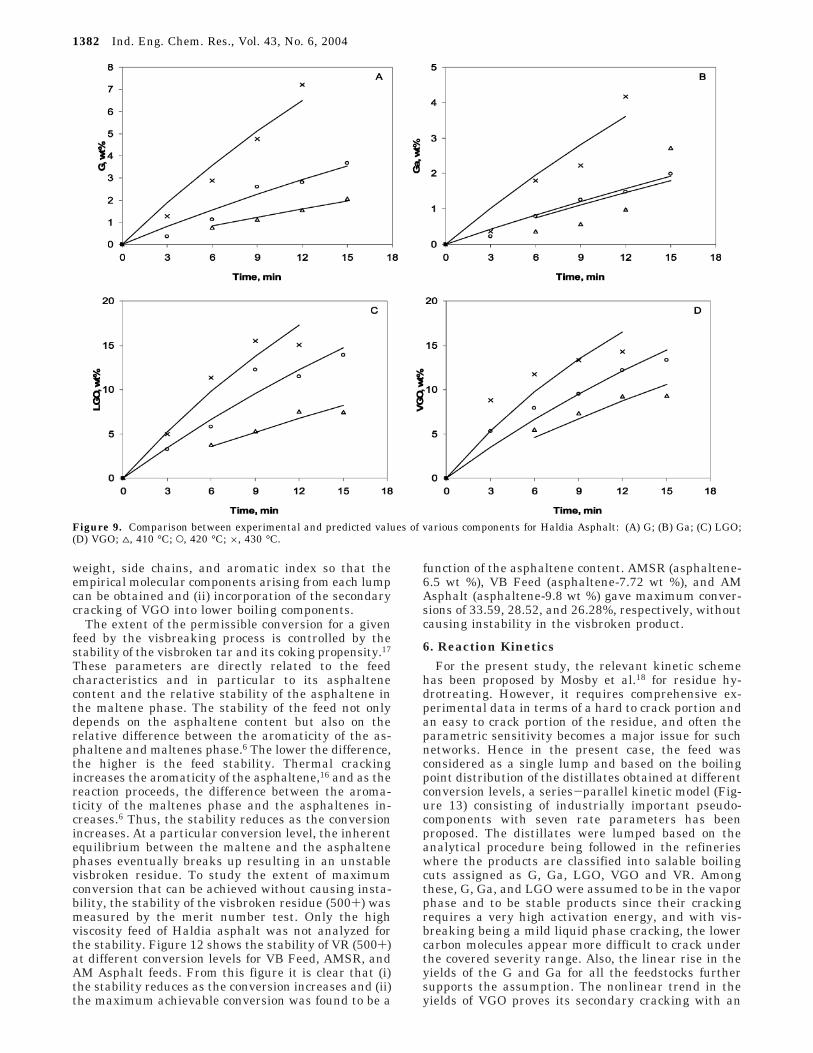
150 °C), light gas oil (LGO, 150-350 °C), and vacuumgas oil (VGO, 350-500 °C) by simulated distillation. Thevariations in the fractional yields obtained for each feedat different reaction temperature and residence time areshown in Figures 5-10. Initially, the yield of the VGOfraction was high followed by LGO, G, and Ga fractionsfor all the feeds. As the reaction proceeds (longerresidence time), the yield of the VGO decreased continu-ously showing its cracking behavior under the range ofthe operating conditions. Similarly, in the case of LGO,the yield variation is linear at low severity levels forall the feeds; however, the extreme severity resulted toslight decline in their yields, which may be due to itssubsequent thermal cracking. The observed linear trendfor Ga and G for all the severity levels shows that thesespecies are thermally stable and do not undergo furthercracking. Two qualitative observations can be madefrom the above figures: (i) the threshold temperatureabove which the feed cracking initiates, highly dependson the feed type, e.g, Haldia asphalt showed no crackingat 400 °C at all residence time studied, and (ii) thedifferent magnitude of relative rates of cracking/forma-tion at a given temperature may be attributed to largecompositional changes within a pseudo-cut.
For an industrial visbreaker unit, the ratio of G toGa formation is, generally, 1:1 to 1:1.5. However, in thepresent case, this ratio was less than 1 for low severityand approached 1:1 at high severity range. At a lowseverity (typically for 3 min residence time at 400 and410 °C), the small amount of formed gasoline lead toits improper removal from the tar during the distilla-tion, which induced an error in its accountability. This
resulted in the deviation in G to Ga proportion in thepresent case.
On the basis of the study using structural analysis ofthe VR and visbreakates reported by Fainberg et al.16
and conclusions of Di Carlo and Janis,6 following mech-anistic path for the components can be concluded:
Thus, the yields of the various products depend ontheir relative proportion and the extent of their crack-ability. In view of the above study, the five feeds coveredin the present case and the data on VB feed (taken fromthe work of Singh14) can be divided into three majorclasses based on asphaltenes (As) to saturates (Sa) ratio6
as follows: (i) paraffinic feeds, e.g., BHSR, NGSR, <0.5;(ii) intermediate asphaltenic feeds, e.g., VB Feed, AMSR(0.5-2.0); (iii) the asphaltenic feed, e.g., Haldia Asphaltand AM Asphalt (g2).
The obtained product yields were correlated with (i)severity index, SI, defined on the basis of E ) 50 kcal/mol and reference temperature of 700 K 17 and (ii) feedproperties such as wt % of Sa, NA, PA, As, nC5, CCR, Scontent, etc. Briefly the functional relationship can bestated as
Figure 7. Comparison between experimental and predicted values of various components for AMSR: (A) G; (B) Ga; (C) LGO; (D) VGO;], 400 °C; 4, 410 °C; O, 420 °C; ×, 430 °C.
product yields (wt %) ) f(SI, feed properties) (3)
1380 Ind. Eng. Chem. Res., Vol. 43, No. 6, 2004
where
The expression for normalized VR (VR/VRo × 100) yieldwas found to be
The exponential function of SI in the above equationrepresents the first-order cracking of VR very well. Theterms (nC5/CCR) and (As/Sa) denote the feed aromatic-ity, and the exponent, 0.02, for (As/Sa) depicts a weakfunction of this ratio.
The differential VGO yield was correlated as
It shows a square root function of the severity while thefeed property that influenced was found to be the ratioof (nC5/(S + CCR)) with 0.96 as exponent. However, thepoor correlation coefficient (R2 ) 0.71) obtained in theabove expression may be attributed to the furthercracking of VGO to low boiling products.
In the case of LGO, the following power-law relation-ship was found to hold:
An exponent of 0.13 for the (Sa/NA) ratio indicates a
relatively weak dependency as compared to severity(exponent of 0.77). Thus, the formation of this speciescan be said to be more or less feed independent.
The formation of gasoline was found by the followingpower-law correlations:
It shows that the gasoline formation is directly propor-tional to the SI and shows a moderate dependency over(As/PA) with an exponent of 0.19.
The yields of gas fraction were obtained in thefollowing order: Haldia Asphalt > NGSR ≈ AMSR >VBFeed > AM Asphalt ≈ BHSR. On the basis of the abovetrend for the different feeds, the following correlationhas been developed:
The formation of gas was found to be proportional tothe severity and also the nC5 and CCR content of thefeed. With an increase in nC5 for a fixed CCR contentof the feed, the yield of gas increases in approximatelysquare root proportion.
The above correlations show that the newly definedgroup properties can satisfactorily represent the crack-ing behavior at least semiquantitatively within thestudied range for which the parity plots for the sameare shown in Figure 11. However, further improvementsin the above correlations to correctly depict the feeddependency and deviations requires (i) the detail analy-sis of the lumps such as variation in their molecular
Figure 8. Comparison between experimental and predicted values of various components for VB Feed: (A) G; (B) Ga; (C) LGO; (D)VGO; ], 400 °C; 4, 410 °C; O, 420 °C; ×, 430 °C.
SI ) t exp(-ER (1
T- 1
T700)) (4)
VR ) 100(AsSa)0.02
exp(-0.023(1 +nC5
CCR)SI) (5)
VGO ) 4.76(SI)0.5( nC5
S + CCR)0.96
R2 ) 0.71 (6)
LGO ) 3.24(SI)0.77( SaNA)0.13
R2 ) 0.88 (7)
Ga ) 0.271(SI)(AsPA)0.19
R2 ) 0.83 (8)
G ) 0.43(SI)( nC5
CCR)0.45
R2 ) 0.88 (9)
Ind. Eng. Chem. Res., Vol. 43, No. 6, 2004 1381
weight, side chains, and aromatic index so that theempirical molecular components arising from each lumpcan be obtained and (ii) incorporation of the secondarycracking of VGO into lower boiling components.
The extent of the permissible conversion for a givenfeed by the visbreaking process is controlled by thestability of the visbroken tar and its coking propensity.17
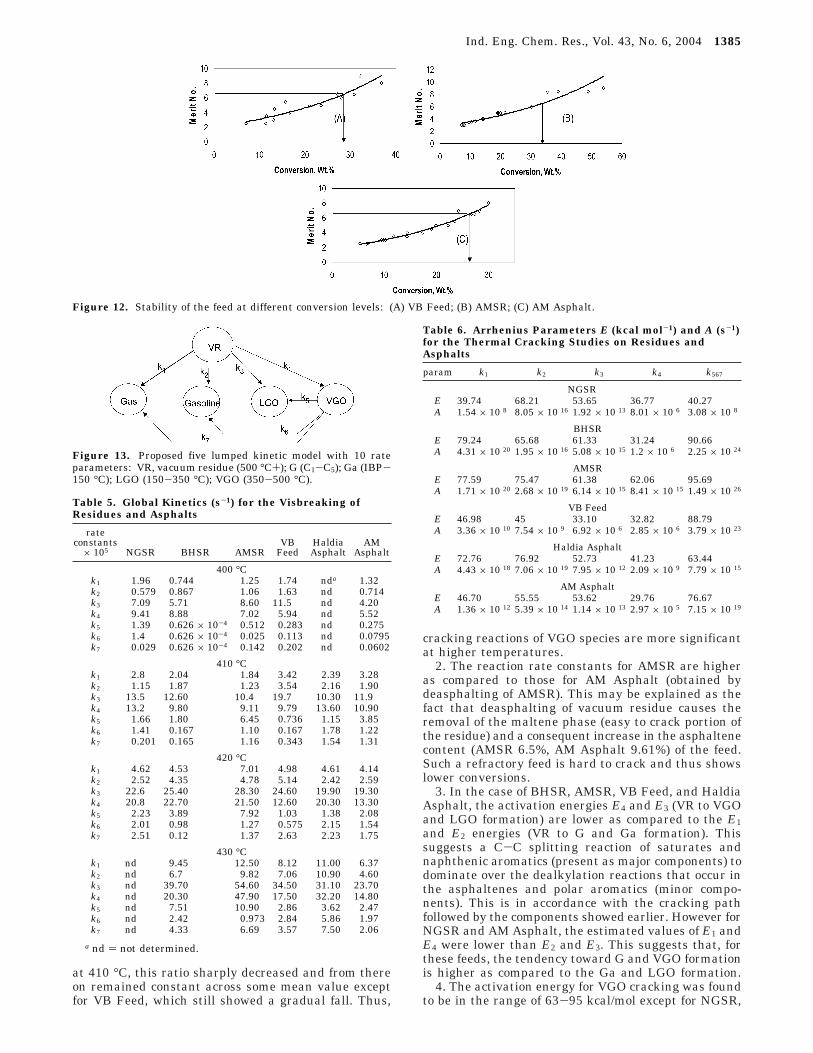
These parameters are directly related to the feedcharacteristics and in particular to its asphaltenecontent and the relative stability of the asphaltene inthe maltene phase. The stability of the feed not onlydepends on the asphaltene content but also on therelative difference between the aromaticity of the as-phaltene and maltenes phase.6 The lower the difference,the higher is the feed stability. Thermal crackingincreases the aromaticity of the asphaltene,16 and as thereaction proceeds, the difference between the aroma-ticity of the maltenes phase and the asphaltenes in-creases.6 Thus, the stability reduces as the conversionincreases. At a particular conversion level, the inherentequilibrium between the maltene and the asphaltenephases eventually breaks up resulting in an unstablevisbroken residue. To study the extent of maximumconversion that can be achieved without causing insta-bility, the stability of the visbroken residue (500+) wasmeasured by the merit number test. Only the highviscosity feed of Haldia asphalt was not analyzed forthe stability. Figure 12 shows the stability of VR (500+)at different conversion levels for VB Feed, AMSR, andAM Asphalt feeds. From this figure it is clear that (i)the stability reduces as the conversion increases and (ii)the maximum achievable conversion was found to be a
function of the asphaltene content. AMSR (asphaltene-6.5 wt %), VB Feed (asphaltene-7.72 wt %), and AMAsphalt (asphaltene-9.8 wt %) gave maximum conver-sions of 33.59, 28.52, and 26.28%, respectively, withoutcausing instability in the visbroken product.
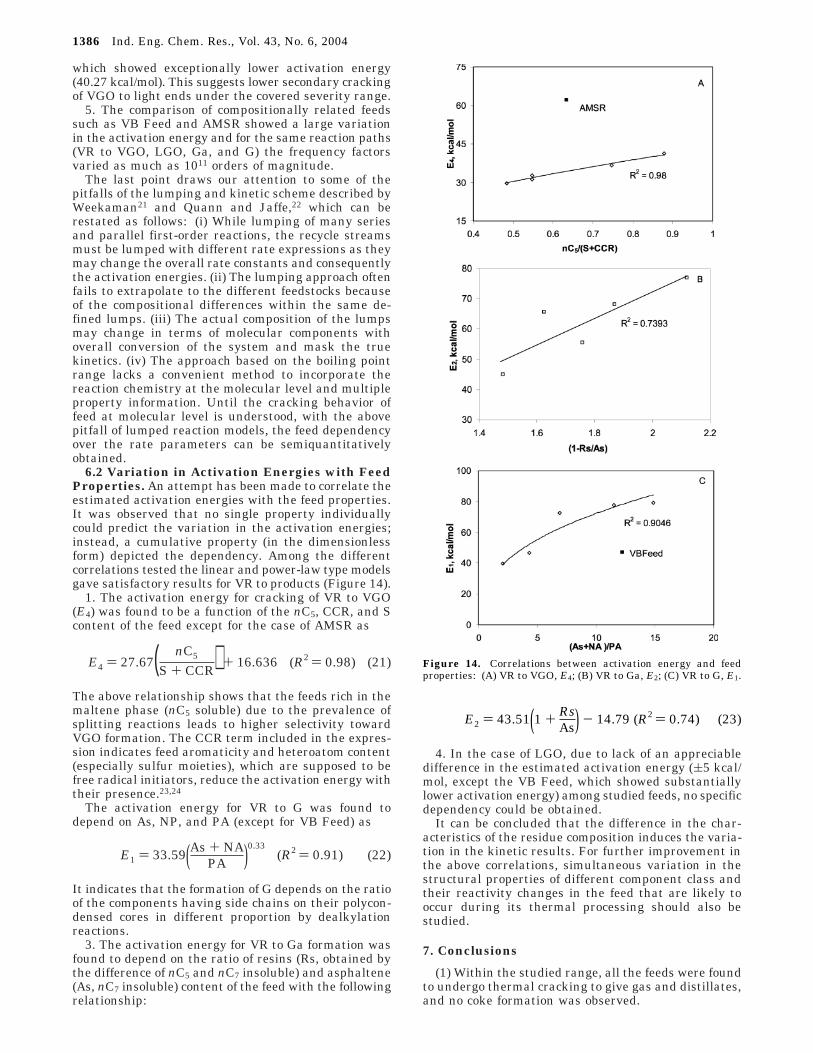
6. Reaction KineticsFor the present study, the relevant kinetic scheme
has been proposed by Mosby et al.18 for residue hy-drotreating. However, it requires comprehensive ex-perimental data in terms of a hard to crack portion andan easy to crack portion of the residue, and often theparametric sensitivity becomes a major issue for suchnetworks. Hence in the present case, the feed wasconsidered as a single lump and based on the boilingpoint distribution of the distillates obtained at differentconversion levels, a series-parallel kinetic model (Fig-ure 13) consisting of industrially important pseudo-components with seven rate parameters has beenproposed. The distillates were lumped based on theanalytical procedure being followed in the refinerieswhere the products are classified into salable boilingcuts assigned as G, Ga, LGO, VGO and VR. Amongthese, G, Ga, and LGO were assumed to be in the vaporphase and to be stable products since their crackingrequires a very high activation energy, and with vis-breaking being a mild liquid phase cracking, the lowercarbon molecules appear more difficult to crack underthe covered severity range. Also, the linear rise in theyields of the G and Ga for all the feedstocks furthersupports the assumption. The nonlinear trend in theyields of VGO proves its secondary cracking with an
Figure 9. Comparison between experimental and predicted values of various components for Haldia Asphalt: (A) G; (B) Ga; (C) LGO;(D) VGO; 4, 410 °C; O, 420 °C; ×, 430 °C.
1382 Ind. Eng. Chem. Res., Vol. 43, No. 6, 2004
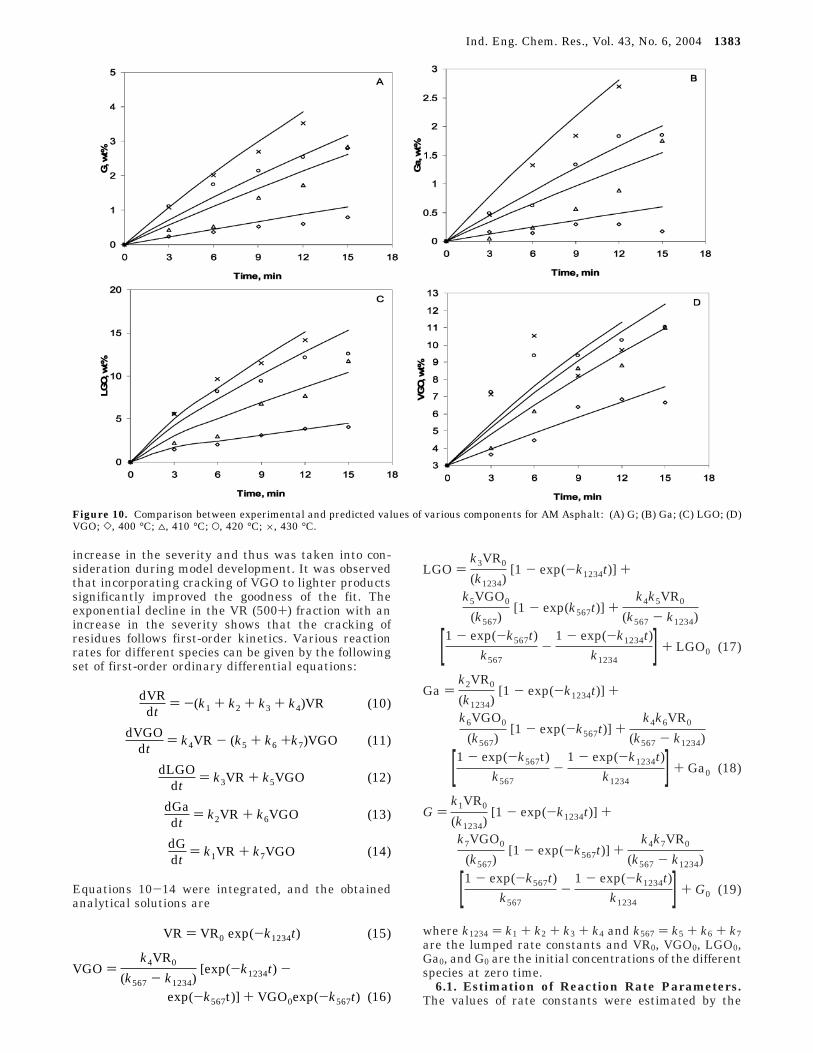
increase in the severity and thus was taken into con-sideration during model development. It was observedthat incorporating cracking of VGO to lighter productssignificantly improved the goodness of the fit. Theexponential decline in the VR (500+) fraction with anincrease in the severity shows that the cracking ofresidues follows first-order kinetics. Various reactionrates for different species can be given by the followingset of first-order ordinary differential equations:
Equations 10-14 were integrated, and the obtainedanalytical solutions are
where k1234 ) k1 + k2 + k3 + k4 and k567 ) k5 + k6 + k7are the lumped rate constants and VR0, VGO0, LGO0,Ga0, and G0 are the initial concentrations of the differentspecies at zero time.
6.1. Estimation of Reaction Rate Parameters.The values of rate constants were estimated by the
LGO )k3VR0
(k1234)[1 - exp(-k1234t)] +
k5VGO0
(k567)[1 - exp(k567t)] +
k4k5VR0
(k567 - k1234)
[1 - exp(-k567t)k567
-1 - exp(-k1234t)
k1234] + LGO0 (17)
Ga )k2VR0
(k1234)[1 - exp(-k1234t)] +
k6VGO0
(k567)[1 - exp(-k567t)] +
k4k6VR0
(k567 - k1234)
[1 - exp(-k567t)k567
-1 - exp(-k1234t)
k1234] + Ga0 (18)
G )k1VR0
(k1234)[1 - exp(-k1234t)] +
k7VGO0
(k567)[1 - exp(-k567t)] +
k4k7VR0
(k567 - k1234)
[1 - exp(-k567t)k567
-1 - exp(-k1234t)
k1234] + G0 (19)
Figure 10. Comparison between experimental and predicted values of various components for AM Asphalt: (A) G; (B) Ga; (C) LGO; (D)VGO; ], 400 °C; 4, 410 °C; O, 420 °C; ×, 430 °C.
dVRdt
) -(k1 + k2 + k3 + k4)VR (10)
dVGOdt
) k4VR - (k5 + k6 +k7)VGO (11)
dLGOdt
) k3VR + k5VGO (12)
dGadt
) k2VR + k6VGO (13)
dGdt
) k1VR + k7VGO (14)
VR ) VR0 exp(-k1234t) (15)
VGO )k4VR0
(k567 - k1234)[exp(-k1234t) -
exp(-k567t)] + VGO0exp(-k567t) (16)
Ind. Eng. Chem. Res., Vol. 43, No. 6, 2004 1383
minimization of sum of square of errors (SSE) usingconstrained optimization algorithms. The objective func-tion is given by
The good guess values for the rate constants wereobtained by using Luus and Jaakola19 direct searchderivative free optimization procedure. This procedureuses random search points and systematic contractionof the search region. Further, the converged solution
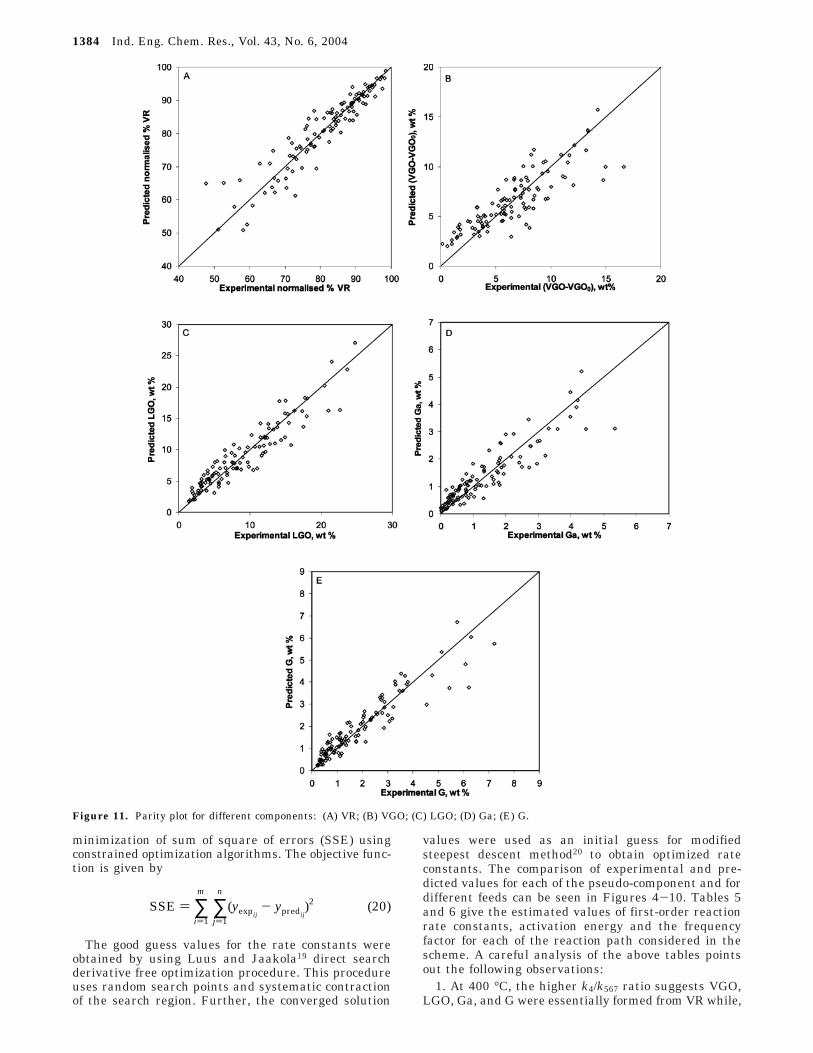
values were used as an initial guess for modifiedsteepest descent method20 to obtain optimized rateconstants. The comparison of experimental and pre-dicted values for each of the pseudo-component and fordifferent feeds can be seen in Figures 4-10. Tables 5and 6 give the estimated values of first-order reactionrate constants, activation energy and the frequencyfactor for each of the reaction path considered in thescheme. A careful analysis of the above tables pointsout the following observations:
1. At 400 °C, the higher k4/k567 ratio suggests VGO,LGO, Ga, and G were essentially formed from VR while,
Figure 11. Parity plot for different components: (A) VR; (B) VGO; (C) LGO; (D) Ga; (E) G.
SSE ) ∑i)1
m
∑j)1
n
(yexpij- ypredij
)2 (20)
1384 Ind. Eng. Chem. Res., Vol. 43, No. 6, 2004
at 410 °C, this ratio sharply decreased and from thereon remained constant across some mean value exceptfor VB Feed, which still showed a gradual fall. Thus,
cracking reactions of VGO species are more significantat higher temperatures.
2. The reaction rate constants for AMSR are higheras compared to those for AM Asphalt (obtained bydeasphalting of AMSR). This may be explained as thefact that deasphalting of vacuum residue causes theremoval of the maltene phase (easy to crack portion ofthe residue) and a consequent increase in the asphaltenecontent (AMSR 6.5%, AM Asphalt 9.61%) of the feed.Such a refractory feed is hard to crack and thus showslower conversions.
3. In the case of BHSR, AMSR, VB Feed, and HaldiaAsphalt, the activation energies E4 and E3 (VR to VGOand LGO formation) are lower as compared to the E1and E2 energies (VR to G and Ga formation). Thissuggests a C-C splitting reaction of saturates andnaphthenic aromatics (present as major components) todominate over the dealkylation reactions that occur inthe asphaltenes and polar aromatics (minor compo-nents). This is in accordance with the cracking pathfollowed by the components showed earlier. However forNGSR and AM Asphalt, the estimated values of E1 andE4 were lower than E2 and E3. This suggests that, forthese feeds, the tendency toward G and VGO formationis higher as compared to the Ga and LGO formation.
4. The activation energy for VGO cracking was foundto be in the range of 63-95 kcal/mol except for NGSR,
Figure 12. Stability of the feed at different conversion levels: (A) VB Feed; (B) AMSR; (C) AM Asphalt.
Figure 13. Proposed five lumped kinetic model with 10 rateparameters: VR, vacuum residue (500 °C+); G (C1-C5); Ga (IBP-150 °C); LGO (150-350 °C); VGO (350-500 °C).
Table 5. Global Kinetics (s-1) for the Visbreaking ofResidues and Asphalts
rateconstants
× 105 NGSR BHSR AMSRVB
FeedHaldiaAsphalt
AMAsphalt
400 °Ck1 1.96 0.744 1.25 1.74 nda 1.32k2 0.579 0.867 1.06 1.63 nd 0.714k3 7.09 5.71 8.60 11.5 nd 4.20k4 9.41 8.88 7.02 5.94 nd 5.52k5 1.39 0.626 × 10⁻⁴ 0.512 0.283 nd 0.275k6 1.4 0.626 × 10⁻⁴ 0.025 0.113 nd 0.0795k7 0.029 0.626 × 10⁻⁴ 0.142 0.202 nd 0.0602
410 °Ck1 2.8 2.04 1.84 3.42 2.39 3.28k2 1.15 1.87 1.23 3.54 2.16 1.90k3 13.5 12.60 10.4 19.7 10.30 11.9k4 13.2 9.80 9.11 9.79 13.60 10.90k5 1.66 1.80 6.45 0.736 1.15 3.85k6 1.41 0.167 1.10 0.167 1.78 1.22k7 0.201 0.165 1.16 0.343 1.54 1.31
420 °Ck1 4.62 4.53 7.01 4.98 4.61 4.14k2 2.52 4.35 4.78 5.14 2.42 2.59k3 22.6 25.40 28.30 24.60 19.90 19.30k4 20.8 22.70 21.50 12.60 20.30 13.30k5 2.23 3.89 7.92 1.03 1.38 2.08k6 2.01 0.98 1.27 0.575 2.15 1.54k7 2.51 0.12 1.37 2.63 2.23 1.75
430 °Ck1 nd 9.45 12.50 8.12 11.00 6.37k2 nd 6.7 9.82 7.06 10.90 4.60k3 nd 39.70 54.60 34.50 31.10 23.70k4 nd 20.30 47.90 17.50 32.20 14.80k5 nd 7.51 10.90 2.86 3.62 2.47k6 nd 2.42 0.973 2.84 5.86 1.97k7 nd 4.33 6.69 3.57 7.50 2.06
a nd ) not determined.
Table 6. Arrhenius Parameters E (kcal mol-1) and A (s-1)for the Thermal Cracking Studies on Residues andAsphalts
param k1 k2 k3 k4 k567
NGSRE 39.74 68.21 53.65 36.77 40.27A 1.54 × 10 8 8.05 × 10 16 1.92 × 10 13 8.01 × 10 6 3.08 × 10 8
BHSRE 79.24 65.68 61.33 31.24 90.66A 4.31 × 10 20 1.95 × 10 16 5.08 × 10 15 1.2 × 10 6 2.25 × 10 24
AMSRE 77.59 75.47 61.38 62.06 95.69A 1.71 × 10 20 2.68 × 10 19 6.14 × 10 15 8.41 × 10 15 1.49 × 10 26
VB FeedE 46.98 45 33.10 32.82 88.79A 3.36 × 10 10 7.54 × 10 9 6.92 × 10 6 2.85 × 10 6 3.79 × 10 23
Haldia AsphaltE 72.76 76.92 52.73 41.23 63.44A 4.43 × 10 18 7.06 × 10 19 7.95 × 10 12 2.09 × 10 9 7.79 × 10 15
AM AsphaltE 46.70 55.55 53.62 29.76 76.67A 1.36 × 10 12 5.39 × 10 14 1.14 × 10 13 2.97 × 10 5 7.15 × 10 19
Ind. Eng. Chem. Res., Vol. 43, No. 6, 2004 1385
which showed exceptionally lower activation energy(40.27 kcal/mol). This suggests lower secondary crackingof VGO to light ends under the covered severity range.
5. The comparison of compositionally related feedssuch as VB Feed and AMSR showed a large variationin the activation energy and for the same reaction paths(VR to VGO, LGO, Ga, and G) the frequency factorsvaried as much as 1011 orders of magnitude.
The last point draws our attention to some of thepitfalls of the lumping and kinetic scheme described byWeekaman21 and Quann and Jaffe,22 which can berestated as follows: (i) While lumping of many seriesand parallel first-order reactions, the recycle streamsmust be lumped with different rate expressions as theymay change the overall rate constants and consequentlythe activation energies. (ii) The lumping approach oftenfails to extrapolate to the different feedstocks becauseof the compositional differences within the same de-fined lumps. (iii) The actual composition of the lumpsmay change in terms of molecular components withoverall conversion of the system and mask the truekinetics. (iv) The approach based on the boiling pointrange lacks a convenient method to incorporate thereaction chemistry at the molecular level and multipleproperty information. Until the cracking behavior offeed at molecular level is understood, with the abovepitfall of lumped reaction models, the feed dependencyover the rate parameters can be semiquantitativelyobtained.
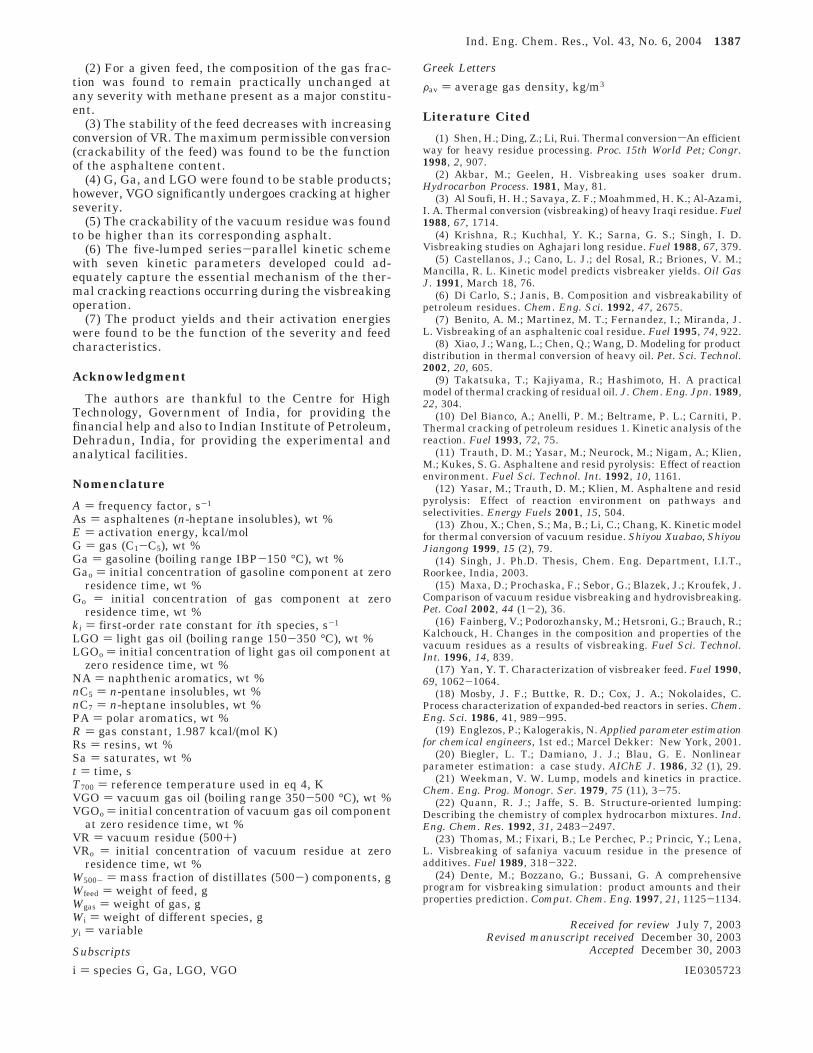
6.2 Variation in Activation Energies with FeedProperties. An attempt has been made to correlate theestimated activation energies with the feed properties.It was observed that no single property individuallycould predict the variation in the activation energies;instead, a cumulative property (in the dimensionlessform) depicted the dependency. Among the differentcorrelations tested the linear and power-law type modelsgave satisfactory results for VR to products (Figure 14).
1. The activation energy for cracking of VR to VGO(E4) was found to be a function of the nC5, CCR, and Scontent of the feed except for the case of AMSR as
The above relationship shows that the feeds rich in themaltene phase (nC5 soluble) due to the prevalence ofsplitting reactions leads to higher selectivity towardVGO formation. The CCR term included in the expres-sion indicates feed aromaticity and heteroatom content(especially sulfur moieties), which are supposed to befree radical initiators, reduce the activation energy withtheir presence.23,24
The activation energy for VR to G was found todepend on As, NP, and PA (except for VB Feed) as
It indicates that the formation of G depends on the ratioof the components having side chains on their polycon-densed cores in different proportion by dealkylationreactions.
3. The activation energy for VR to Ga formation wasfound to depend on the ratio of resins (Rs, obtained bythe difference of nC5 and nC7 insoluble) and asphaltene(As, nC7 insoluble) content of the feed with the followingrelationship:
4. In the case of LGO, due to lack of an appreciabledifference in the estimated activation energy ((5 kcal/mol, except the VB Feed, which showed substantiallylower activation energy) among studied feeds, no specificdependency could be obtained.
It can be concluded that the difference in the char-acteristics of the residue composition induces the varia-tion in the kinetic results. For further improvement inthe above correlations, simultaneous variation in thestructural properties of different component class andtheir reactivity changes in the feed that are likely tooccur during its thermal processing should also bestudied.
7. Conclusions
(1) Within the studied range, all the feeds were foundto undergo thermal cracking to give gas and distillates,and no coke formation was observed.
E4 ) 27.67( nC5
S + CCR) + 16.636 (R2 ) 0.98) (21)
E1 ) 33.59(As + NAPA )0.33
(R2 ) 0.91) (22)
Figure 14. Correlations between activation energy and feedproperties: (A) VR to VGO, E4; (B) VR to Ga, E2; (C) VR to G, E1.
E2 ) 43.51(1 + RsAs) - 14.79 (R2 ) 0.74) (23)
1386 Ind. Eng. Chem. Res., Vol. 43, No. 6, 2004
(2) For a given feed, the composition of the gas frac-tion was found to remain practically unchanged atany severity with methane present as a major constitu-ent.
(3) The stability of the feed decreases with increasingconversion of VR. The maximum permissible conversion(crackability of the feed) was found to be the functionof the asphaltene content.
(4) G, Ga, and LGO were found to be stable products;however, VGO significantly undergoes cracking at higherseverity.
(5) The crackability of the vacuum residue was foundto be higher than its corresponding asphalt.
(6) The five-lumped series-parallel kinetic schemewith seven kinetic parameters developed could ad-equately capture the essential mechanism of the ther-mal cracking reactions occurring during the visbreakingoperation.
(7) The product yields and their activation energieswere found to be the function of the severity and feedcharacteristics.
Acknowledgment
The authors are thankful to the Centre for HighTechnology, Government of India, for providing thefinancial help and also to Indian Institute of Petroleum,Dehradun, India, for providing the experimental andanalytical facilities.
Nomenclature
A ) frequency factor, s-1
As ) asphaltenes (n-heptane insolubles), wt %E ) activation energy, kcal/molG ) gas (C1-C5), wt %Ga ) gasoline (boiling range IBP-150 °C), wt %Gao ) initial concentration of gasoline component at zero
residence time, wt %Go ) initial concentration of gas component at zero
residence time, wt %ki ) first-order rate constant for ith species, s-1
LGO ) light gas oil (boiling range 150-350 °C), wt %LGOo ) initial concentration of light gas oil component at
zero residence time, wt %NA ) naphthenic aromatics, wt %nC5 ) n-pentane insolubles, wt %nC7 ) n-heptane insolubles, wt %PA ) polar aromatics, wt %R ) gas constant, 1.987 kcal/(mol K)Rs ) resins, wt %Sa ) saturates, wt %t ) time, sT700 ) reference temperature used in eq 4, KVGO ) vacuum gas oil (boiling range 350-500 °C), wt %VGOo ) initial concentration of vacuum gas oil component
at zero residence time, wt %VR ) vacuum residue (500+)VRo ) initial concentration of vacuum residue at zero
residence time, wt %W500- ) mass fraction of distillates (500-) components, gWfeed ) weight of feed, gWgas ) weight of gas, gWi ) weight of different species, gyi ) variable
Subscripts
i ) species G, Ga, LGO, VGO
Greek Letters
Fav ) average gas density, kg/m3
Literature Cited
(1) Shen, H.; Ding, Z.; Li, Rui. Thermal conversionsAn efficientway for heavy residue processing. Proc. 15th World Pet; Congr.1998, 2, 907.
(2) Akbar, M.; Geelen, H. Visbreaking uses soaker drum.Hydrocarbon Process. 1981, May, 81.
(3) Al Soufi, H. H.; Savaya, Z. F.; Moahmmed, H. K.; Al-Azami,I. A. Thermal conversion (visbreaking) of heavy Iraqi residue. Fuel1988, 67, 1714.
(4) Krishna, R.; Kuchhal, Y. K.; Sarna, G. S.; Singh, I. D.Visbreaking studies on Aghajari long residue. Fuel 1988, 67, 379.
(5) Castellanos, J.; Cano, L. J.; del Rosal, R.; Briones, V. M.;Mancilla, R. L. Kinetic model predicts visbreaker yields. Oil GasJ. 1991, March 18, 76.
(6) Di Carlo, S.; Janis, B. Composition and visbreakability ofpetroleum residues. Chem. Eng. Sci. 1992, 47, 2675.
(7) Benito, A. M.; Martinez, M. T.; Fernandez, I.; Miranda, J.L. Visbreaking of an asphaltenic coal residue. Fuel 1995, 74, 922.
(8) Xiao, J.; Wang, L.; Chen, Q.; Wang, D. Modeling for productdistribution in thermal conversion of heavy oil. Pet. Sci. Technol.2002, 20, 605.
(9) Takatsuka, T.; Kajiyama, R.; Hashimoto, H. A practicalmodel of thermal cracking of residual oil. J. Chem. Eng. Jpn. 1989,22, 304.
(10) Del Bianco, A.; Anelli, P. M.; Beltrame, P. L.; Carniti, P.Thermal cracking of petroleum residues 1. Kinetic analysis of thereaction. Fuel 1993, 72, 75.
(11) Trauth, D. M.; Yasar, M.; Neurock, M.; Nigam, A.; Klien,M.; Kukes, S. G. Asphaltene and resid pyrolysis: Effect of reactionenvironment. Fuel Sci. Technol. Int. 1992, 10, 1161.
(12) Yasar, M.; Trauth, D. M.; Klien, M. Asphaltene and residpyrolysis: Effect of reaction environment on pathways andselectivities. Energy Fuels 2001, 15, 504.
(13) Zhou, X.; Chen, S.; Ma, B.; Li, C.; Chang, K. Kinetic modelfor thermal conversion of vacuum residue. Shiyou Xuabao, ShiyouJiangong 1999, 15 (2), 79.
(14) Singh, J. Ph.D. Thesis, Chem. Eng. Department, I.I.T.,Roorkee, India, 2003.
(15) Maxa, D.; Prochaska, F.; Sebor, G.; Blazek, J.; Kroufek, J.Comparison of vacuum residue visbreaking and hydrovisbreaking.Pet. Coal 2002, 44 (1-2), 36.
(16) Fainberg, V.; Podorozhansky, M.; Hetsroni, G.; Brauch, R.;Kalchouck, H. Changes in the composition and properties of thevacuum residues as a results of visbreaking. Fuel Sci. Technol.Int. 1996, 14, 839.
(17) Yan, Y. T. Characterization of visbreaker feed. Fuel 1990,69, 1062-1064.
(18) Mosby, J. F.; Buttke, R. D.; Cox, J. A.; Nokolaides, C.Process characterization of expanded-bed reactors in series. Chem.Eng. Sci. 1986, 41, 989-995.
(19) Englezos, P.; Kalogerakis, N. Applied parameter estimationfor chemical engineers, 1st ed.; Marcel Dekker: New York, 2001.
(20) Biegler, L. T.; Damiano, J. J.; Blau, G. E. Nonlinearparameter estimation: a case study. AIChE J. 1986, 32 (1), 29.
(21) Weekman, V. W. Lump, models and kinetics in practice.Chem. Eng. Prog. Monogr. Ser. 1979, 75 (11), 3-75.
(22) Quann, R. J.; Jaffe, S. B. Structure-oriented lumping:Describing the chemistry of complex hydrocarbon mixtures. Ind.Eng. Chem. Res. 1992, 31, 2483-2497.
(23) Thomas, M.; Fixari, B.; Le Perchec, P.; Princic, Y.; Lena,L. Visbreaking of safaniya vacuum residue in the presence ofadditives. Fuel 1989, 318-322.
(24) Dente, M.; Bozzano, G.; Bussani, G. A comprehensiveprogram for visbreaking simulation: product amounts and theirproperties prediction. Comput. Chem. Eng. 1997, 21, 1125-1134.
Received for review July 7, 2003Revised manuscript received December 30, 2003
Accepted December 30, 2003
IE0305723
Ind. Eng. Chem. Res., Vol. 43, No. 6, 2004 1387


