Embed Size (px)
Citation preview
Kinetics, structure and function of a supramolecular polymer inwaterCitation for published version (APA):Lafleur, R. P. M. (2017). Kinetics, structure and function of a supramolecular polymer in water. TechnischeUniversiteit Eindhoven.
Document status and date:Published: 14/11/2017
Document Version:Publisher’s PDF, also known as Version of Record (includes final page, issue and volume numbers)
Please check the document version of this publication:
• A submitted manuscript is the version of the article upon submission and before peer-review. There can beimportant differences between the submitted version and the official published version of record. Peopleinterested in the research are advised to contact the author for the final version of the publication, or visit theDOI to the publisher's website.• The final author version and the galley proof are versions of the publication after peer review.• The final published version features the final layout of the paper including the volume, issue and pagenumbers.Link to publication
General rightsCopyright and moral rights for the publications made accessible in the public portal are retained by the authors and/or other copyright ownersand it is a condition of accessing publications that users recognise and abide by the legal requirements associated with these rights.
• Users may download and print one copy of any publication from the public portal for the purpose of private study or research. • You may not further distribute the material or use it for any profit-making activity or commercial gain • You may freely distribute the URL identifying the publication in the public portal.
If the publication is distributed under the terms of Article 25fa of the Dutch Copyright Act, indicated by the “Taverne” license above, pleasefollow below link for the End User Agreement:www.tue.nl/taverne
Take down policyIf you believe that this document breaches copyright please contact us at:[email protected] details and we will investigate your claim.
Download date: 08. Jan. 2022
Kinetics, structure and function of a supramolecular polymer in water
PROEFSCHRIFT
ter verkrijging van de graad van doctor aan de Technische Universiteit Eindhoven, op gezag van de rector magnificus prof.dr.ir. F.P.T. Baaijens, voor een commissie aangewezen door het College voor Promoties, in het
openbaar te verdedigen op dinsdag 14 november 2017 om 16:00 uur
door
René Paul Maria Lafleur
geboren te Sittard
Dit proefschrift is goedgekeurd door de promotoren en de samenstelling van de promotiecommissie is als volgt: voorzitter: prof.dr. P.A.J. Hilbers 1e promotor: prof.dr. E.W. Meijer 2e promotor: prof.dr. M. Merkx leden: prof.dr. J.S. Moore (University of Illinois) dr. P. Besenius (Johannes Gutenberg-Universität Mainz)
dr. G.M. Pavan (SUPSI) prof.dr. N.A.J.M. Sommerdijk prof.dr.ir. J.C.M. van Hest
Het onderzoek dat in dit proefschrift wordt beschreven is uitgevoerd in overeenstemming met de TU/e Gedragscode Wetenschapsbeoefening.


Cover image: ICMS Animation Studio, TU/e Printed by: Gildeprint Drukkerijen A catalogue record is available from the Eindhoven University of Technology Library. ISBN: 978-90-386-4376-2 This work has been financially supported by the Netherlands Organisation for Scientific Research and the Ministry of Education, Culture and Science.
Table of Contents
Chapter 1
Introduction to one-dimensional supramolecular polymers in water
1.1 Natural supramolecular polymers ………………………………………………… 2
1.2 Synthetic supramolecular polymers ………………………………………………. 4
1.3 Kinetics of synthetic supramolecular polymers …………………………………... 6
1.4 Aim and thesis content ……………………………………………………………. 10
1.5 References ………………………………………………………………………… 11
Chapter 2
Dynamic diversity of supramolecular polymers in water as revealed by hydrogen/deuterium
exchange
2.1 Introduction ………………………………………….……………………………. 16
2.2 The initial H/D exchange experiment ……………………...……………………... 17
2.3 Validation of HDX-MS …………………………………………………………… 18
2.4 Time-resolved H/D exchange of C12BTA supramolecular polymers …………….. 21
2.5 H/D exchange as a function of temperature ………………………………………. 21
2.6 Effect of the molecular structure on the H/D exchange kinetics …………………. 24
2.7 CD spectroscopy reveals the emergence of structured domains ………………….. 26
2.8 Discussion ………………………………………………………………………… 27
2.9 Conclusion ………………………………………………………………………… 28
2.10 Experimental section and supplementary information …………………………... 28
2.11 References ……………………………………………………………………….. 31
Chapter 3
Consequences of a cosolvent on the molecular dynamics of a supramolecular polymer
3.1 Introduction ……………………………………………………………………….. 34
3.2 Influence of solvent composition on the morphology ……………………………. 35
3.3 Kinetics of supramolecular polymers in equilibrium ……………………………... 38
3.4 Cosolvent dependent polymerization kinetics ……………………………………. 40
3.5 Cosolvent dependent depolymerization kinetics …………………………………. 41
3.6 Internal structure of supramolecular polymers in equilibrium …………………… 46
3.7 Conclusions ……………………………………………………………………….. 49
3.8 Experimental section and supplementary information ………………………….... 50
3.9 References ……………………………………………………………………….... 54
Chapter 4
Hydrophobic mismatch controls supramolecular copolymerization rates
4.1 Introduction ……………………………………………………………………….. 58
4.2 Temperature response of supramolecular copolymers …………………………..... 59
4.3 Design of the HDX-MS experiment ……………………………………………… 61
4.4 HDX-MS of supramolecular copolymerization …………………………………... 62
4.5 Copolymerization monitored by UV-absorption …………………………………. 65
4.6 Conclusions ……………………………………………………………………….. 67
4.7 Supplementary information ………………………………………………………. 67
4.8 References ………………………………………………………………………… 72
Chapter 5
Into the structure of a supramolecular polymer at molecular resolution
5.1 Introduction ……………………………………………………………………….. 76
5.2 Electron tomography using GOx …………………………………………………. 77
5.3 Dimensions of the supramolecular polymers ……………………………………... 80
5.4 An unexpected twist ………………………………………………………………. 82
5.5 Conclusions and outlook ………………………………………………………….. 85
5.6 Experimental section and supplementary information ……………………………. 86
5.7 References ………………………………………………………………………… 91
Chapter 6
Synthesis of protein – BTA conjugates
6.1 Introduction ……………………………………………………………………….. 94
6.2 Synthesis of reactive BTAs ……………………………………………………….. 96
6.3 Synthesis of reactive fluorescent proteins ………………………………………… 99
6.4 Bioconjugation reactions …………………………………………………………. 102
6.5 Discussion and conclusions ………………………………………………………. 106
6.6 Experimental section ……………………………………………………………… 106
6.7 References ………………………………………………………………………… 113
Summary ……………………………………………………………………………... 115
Curriculum vitae …………………………………………………………………….. 119
Dankwoord / Acknowledgements …………………………………………………... 121
1
Chapter 1
Introduction to one-dimensional supramolecular polymers
in water
Abstract:
One-dimensional supramolecular polymers in water have unique and diverse properties due
to the non-covalent interactions between their building blocks. Studies of natural
supramolecular polymers such as actin filaments, microtubules and amyloid fibrils have
demonstrated the diversity in both the structure and dynamics that can emerge from non-
covalent interactions. Inspired by the complex functions that these polymers can perform,
chemists have designed and synthetized monomers that also rely on the hydrophobic effect,
polar and electrostatic interactions to form supramolecular polymers in water. Recent insights
have revealed that kinetic processes dominate the assembly of these monomers. This can
result in polymers with different structural and dynamic properties. In this chapter, key
examples from the literature are used to illustrate the current understanding of the structural
and dynamic aspects of both natural and synthetic polymers. In addition, established and
emerging techniques that are used to study the kinetics of supramolecular polymers in water
are reviewed and compared.
2
1.1 Natural supramolecular polymers
Life is possible because individual molecules cooperate at a nanometer length scale. The
molecules that determine the shape and internal organization of the smallest living entity, the
cell, have in common the propensity to self-assemble. This way, the interactions between
molecules enable the formation of various structured components of the cell, such as the cell
membrane and the cytoskeleton. The cell membrane can be formed merely by the interactions
of lipids. The cytoskeleton is built from proteins, and their assembly and disassembly
requires the consumption of energy. Whether a source of energy is involved or not, the fact
that the components of the cell are all based on molecules that interact, rather than being
covalently attached to one another, causes the structures to be intrinsically dynamic and
therefore allow important functions such as cellular movement and cell division. Depending
on the strength of the interactions between the molecules, different types of kinetics arise. A
good example of the cellular components that illustrate this dynamic diversity, are the one-
dimensional supramolecular polymers that form the cytoskeleton and amyloid fibrils.
Three main classes of polymers form the cytoskeleton of a cell: actin filaments,
microtubules and intermediate filaments, the latter of which have been studied the least.1 The
actin filaments have a prominent role in cell motility.2 The protein monomer that self-
assembles into the supramolecular polymers is actin, and the main driving forces are the
hydrophobic effect and electrostatic interactions. Additional salt bridges in between the
polymers result in the formation of a helical actin filament that is a bundle of two polymers.3
The actin monomers polymerize via the nucleation – elongation mechanism,4 and due to their
structural asymmetry they grow rapidly at one end of the polymer while depolymerizing at
the other end of the polymer.5 When sufficient ATP-bound actin is available, the polymers
will continue to grow rapidly, but under certain conditions the assembly and disassembly
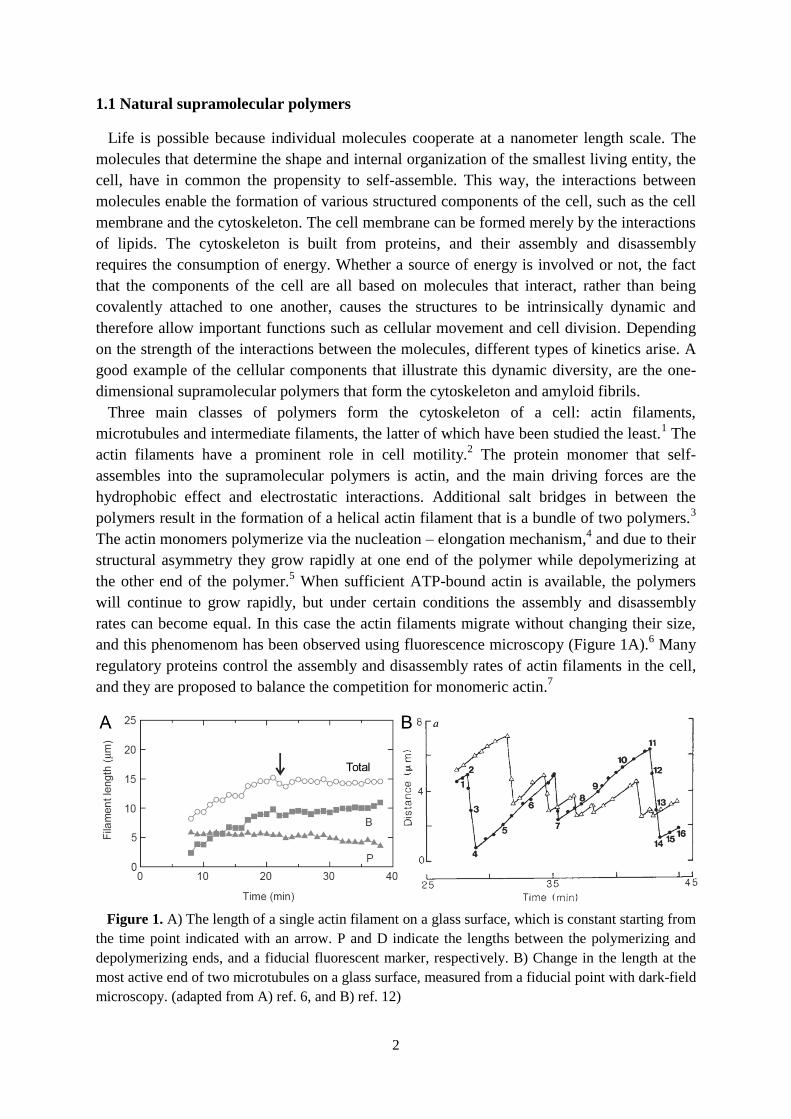
rates can become equal. In this case the actin filaments migrate without changing their size,
and this phenomenom has been observed using fluorescence microscopy (Figure 1A).6 Many
regulatory proteins control the assembly and disassembly rates of actin filaments in the cell,
and they are proposed to balance the competition for monomeric actin.7
Figure 1. A) The length of a single actin filament on a glass surface, which is constant starting from
the time point indicated with an arrow. P and D indicate the lengths between the polymerizing and
depolymerizing ends, and a fiducial fluorescent marker, respectively. B) Change in the length at the
most active end of two microtubules on a glass surface, measured from a fiducial point with dark-field
microscopy. (adapted from A) ref. 6, and B) ref. 12)
3
One of the cellular processes in which microtubules play an important role is cell division.
Microtubules are formed through the polymerization of a protein dimer governed by
hydrophobic and polar interactions. Similarly to the actin filaments, electrostatic interactions
cause the bundling of polymers, but this time more polymers are involved and all together
they form a hollow cylinder.8 Although microtubules were also observed to grow at only one
end of the polymers due to structural dissimilarity of the polymer tips,9 their polymerization
and depolymerization mechanisms are less well understood.10
Microtubules rapidly switch
between phases of steady polymerization and rapid depolymerization (Figure 1B).11,12
Amyloid fibrils exhibit completely different dynamic behavior as compared to the one-
dimensional supramolecular polymers involved in the cytoskeleton. The most important
reason for this is their polymerization towards a thermodynamic equilibrium; no source of
energy is involved in either their assembly or disassembly. Amyloid fibrils can be formed by
many different proteins or polypeptides that have lost their function through (partial)
unfolding, and the intermolecular interactions that affect their formation depend on the
protein monomer. Typically the fibrils are rich in ß-sheets that are stabilized by hydrogen
bonds. Their presence in human cells is strongly associated with for example Alzheimer’s
disease and type ll diabetes.13
A recently disclosed atomic model of a fibril extracted from an
individual diagnosed with Alzheimer’s disease demonstrates an important role for
hydrophobic and polar interactions.14
The proteins or polypeptides that form the fibrils
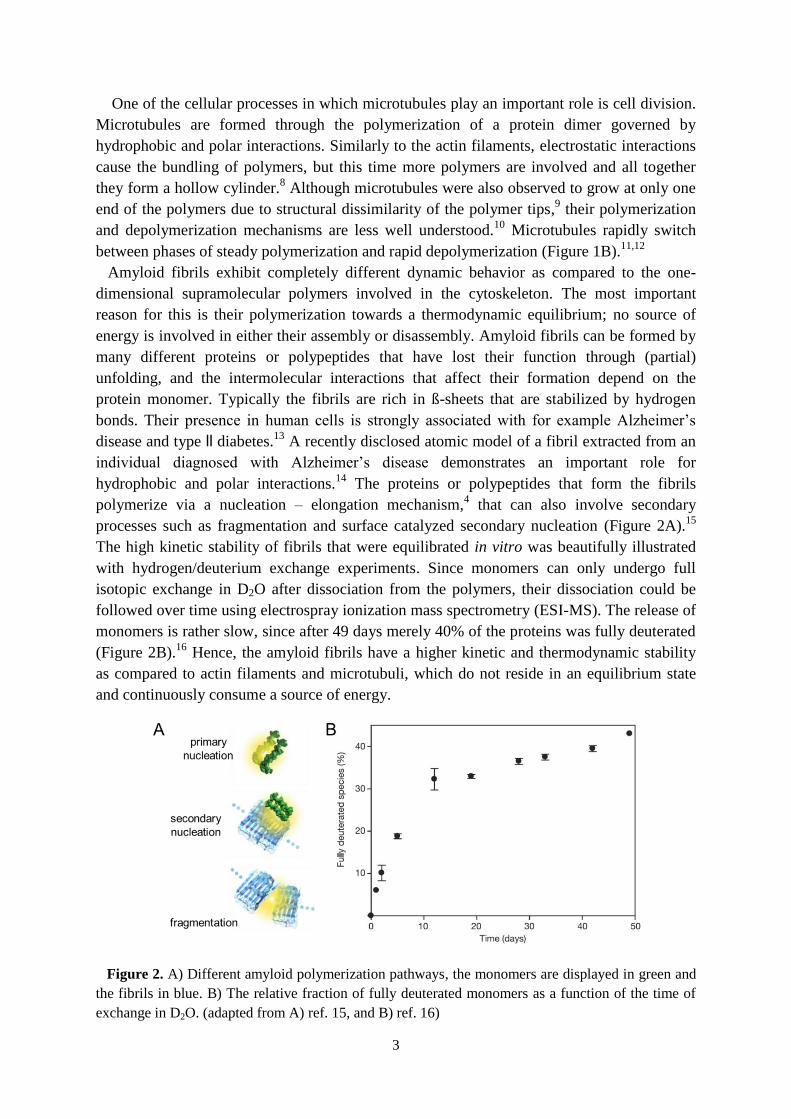
polymerize via a nucleation – elongation mechanism,4 that can also involve secondary
processes such as fragmentation and surface catalyzed secondary nucleation (Figure 2A).15
The high kinetic stability of fibrils that were equilibrated in vitro was beautifully illustrated
with hydrogen/deuterium exchange experiments. Since monomers can only undergo full
isotopic exchange in D2O after dissociation from the polymers, their dissociation could be
followed over time using electrospray ionization mass spectrometry (ESI-MS). The release of
monomers is rather slow, since after 49 days merely 40% of the proteins was fully deuterated
(Figure 2B).16
Hence, the amyloid fibrils have a higher kinetic and thermodynamic stability
as compared to actin filaments and microtubuli, which do not reside in an equilibrium state
and continuously consume a source of energy.
Figure 2. A) Different amyloid polymerization pathways, the monomers are displayed in green and
the fibrils in blue. B) The relative fraction of fully deuterated monomers as a function of the time of
exchange in D2O. (adapted from A) ref. 15, and B) ref. 16)
4
1.2 Synthetic supramolecular polymers
Inspired by the naturally occurring supramolecular polymers, synthetic supramolecular
polymers are prepared to better understand the underlying principles of self-assembly. This
knowledge can subsequently be exploited to create supramolecular polymers with new
functions, or to interfere with the pathological processes associated with natural polymers. In
contrast to the natural polymers like actin filaments and microtubules, synthetic polymers that
assemble by consuming a source of energy are limited.17,18
In comparison with the amyloid
fibrils, many of the synthetic polymers in water do not advance towards thermodynamic
equilibrium but reside in kinetically trapped states, and are therefore highly sensitive to their
method of preparation. Their progress towards functional supramolecular polymers depends
on kinetic characterization, and some of the methodologies involved will be outlined in the
next section.
A large number of synthetic supramolecular polymers have been studied in water,19
and
often their self-assembly relies on a combination of the hydrophobic effect with hydrogen
bonds or aromatic interactions. When sufficiently protected from water as a competitive
solvent, hydrogen bond interactions can be used to assemble highly organized architectures.
One beautiful and early example are the nanotubes reported by Fenniri et al.20
The hydrogen
bonds that form between the amides of self-assembling peptides are often combined with
aromatic interactions.21,22
Because aromatic interactions can result in strong association
between the monomers, systems that rely predominantly on aromatic interactions are also
prominently presented in the literature. Well-studied examples in this class are monomers
that contain both a rigid aromatic part and a flexible domain,23
and those based on perylene
diimide dyes.24
Here, we will highlight two systems in which the key interactions responsible
for the polymerization of natural polymers: the hydrophobic effect, polar (H-bonds) and
electrostatic interactions, have been applied to create synthetic one-dimensional polymers,
and are clearly pinpointed by experiment and simulation.
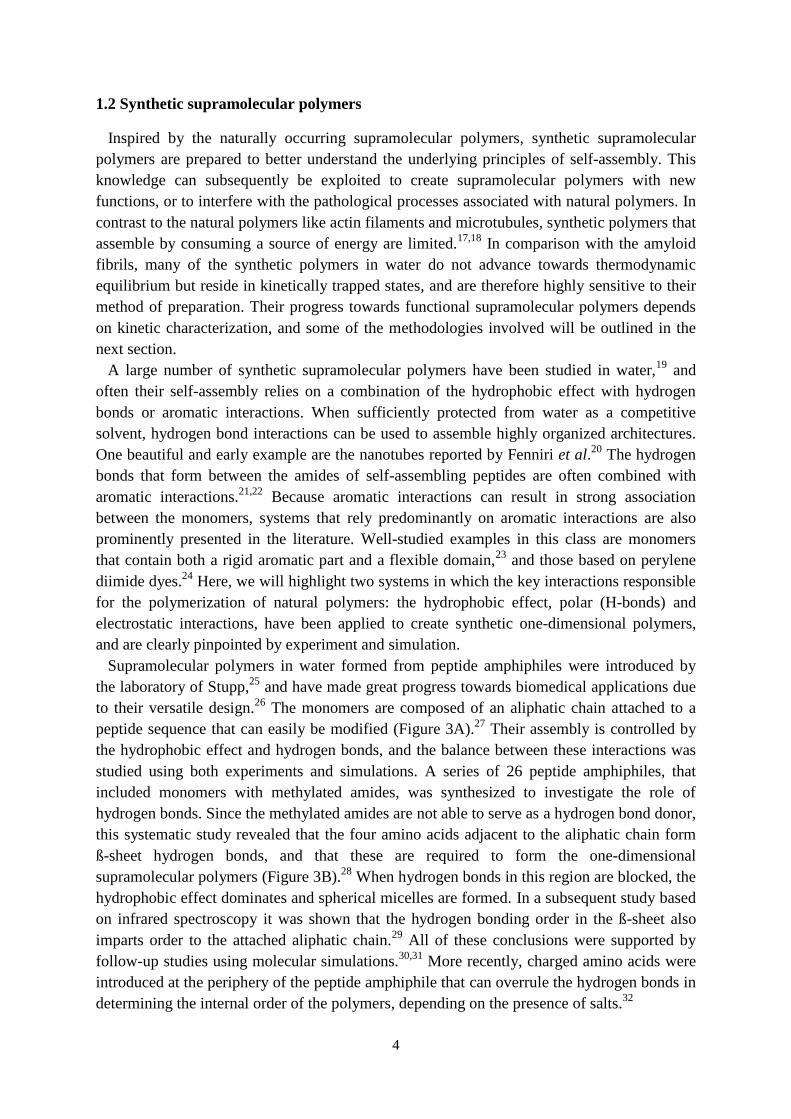
Supramolecular polymers in water formed from peptide amphiphiles were introduced by
the laboratory of Stupp,25
and have made great progress towards biomedical applications due
to their versatile design.26
The monomers are composed of an aliphatic chain attached to a
peptide sequence that can easily be modified (Figure 3A).27
Their assembly is controlled by
the hydrophobic effect and hydrogen bonds, and the balance between these interactions was
studied using both experiments and simulations. A series of 26 peptide amphiphiles, that
included monomers with methylated amides, was synthesized to investigate the role of
hydrogen bonds. Since the methylated amides are not able to serve as a hydrogen bond donor,
this systematic study revealed that the four amino acids adjacent to the aliphatic chain form
ß-sheet hydrogen bonds, and that these are required to form the one-dimensional
supramolecular polymers (Figure 3B).28
When hydrogen bonds in this region are blocked, the
hydrophobic effect dominates and spherical micelles are formed. In a subsequent study based
on infrared spectroscopy it was shown that the hydrogen bonding order in the ß-sheet also
imparts order to the attached aliphatic chain.29
All of these conclusions were supported by
follow-up studies using molecular simulations.30,31
More recently, charged amino acids were
introduced at the periphery of the peptide amphiphile that can overrule the hydrogen bonds in
determining the internal order of the polymers, depending on the presence of salts.32
5
Figure 3. A) Chemical structure of a peptide amphiphile and a CryoTEM image of the polymers
(adapted from ref. 26). B) Three-dimensional representation of a polymer containing a hydrophobic
pocket composed of aliphatic chains (a), a ß-sheet region (b) and a peripheral peptide region (c).28
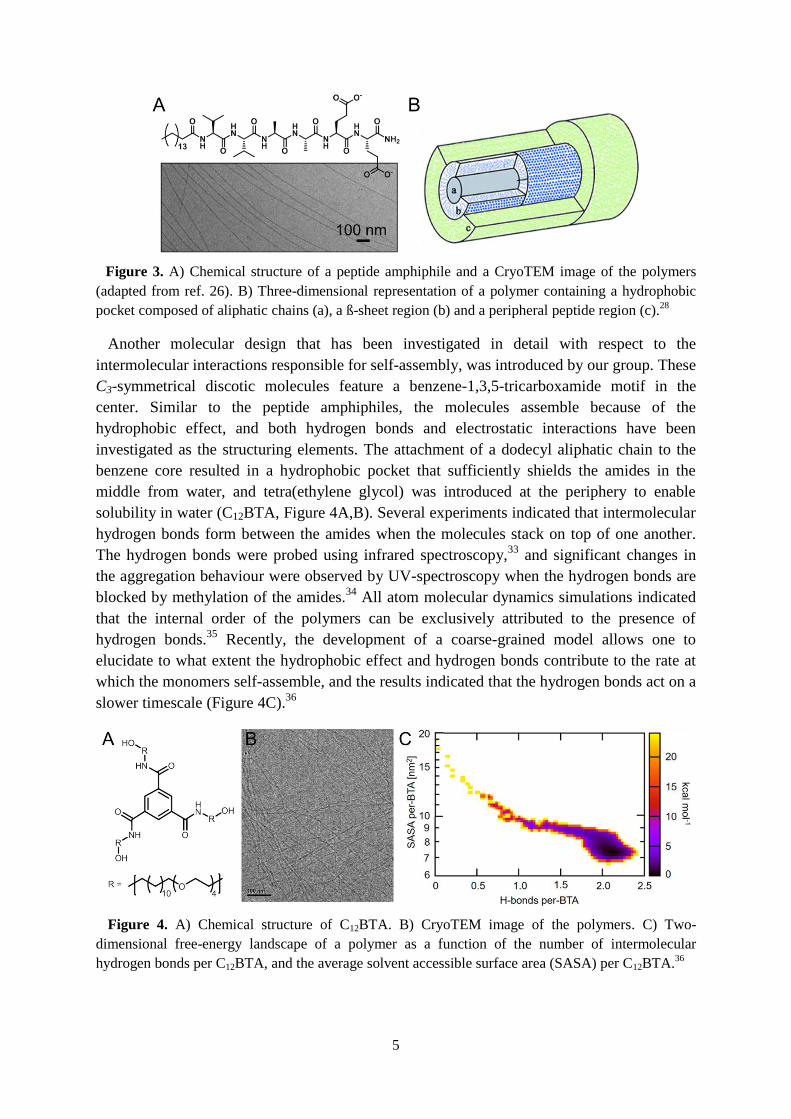
Another molecular design that has been investigated in detail with respect to the
intermolecular interactions responsible for self-assembly, was introduced by our group. These
C3-symmetrical discotic molecules feature a benzene-1,3,5-tricarboxamide motif in the
center. Similar to the peptide amphiphiles, the molecules assemble because of the
hydrophobic effect, and both hydrogen bonds and electrostatic interactions have been
investigated as the structuring elements. The attachment of a dodecyl aliphatic chain to the
benzene core resulted in a hydrophobic pocket that sufficiently shields the amides in the
middle from water, and tetra(ethylene glycol) was introduced at the periphery to enable
solubility in water (C12BTA, Figure 4A,B). Several experiments indicated that intermolecular
hydrogen bonds form between the amides when the molecules stack on top of one another.
The hydrogen bonds were probed using infrared spectroscopy,33
and significant changes in
the aggregation behaviour were observed by UV-spectroscopy when the hydrogen bonds are
blocked by methylation of the amides.34
All atom molecular dynamics simulations indicated
that the internal order of the polymers can be exclusively attributed to the presence of
hydrogen bonds.35
Recently, the development of a coarse-grained model allows one to
elucidate to what extent the hydrophobic effect and hydrogen bonds contribute to the rate at
which the monomers self-assemble, and the results indicated that the hydrogen bonds act on a
slower timescale (Figure 4C).36
Figure 4. A) Chemical structure of C12BTA. B) CryoTEM image of the polymers. C) Two-
dimensional free-energy landscape of a polymer as a function of the number of intermolecular
hydrogen bonds per C12BTA, and the average solvent accessible surface area (SASA) per C12BTA.36
6
A dual component system based on charged benzene-1,3,5-tricarboxamide derivatives was
studied by Besenius and coworkers.37
Peptides were attached to the benzene core that encode
a ß-sheet secondary structure and were either positively or negatively charged. The ß-sheets
were confirmed using circular dichroism studies. Remarkably, molecular dynamics
simulations indicated that interactions between the cores inside the polymers are absent,
suggesting that once polymerized, electrostatic interactions dominate the assembly.
Accordingly, the authors have shown that the contribution of the hydrophobic effect could be
increased by substituting the neutral amino acids of the peptides for more hydrophobic ones.
In summary, the non-covalent interactions abundant in natural polymers have been
successfully transferred to synthetic polymers, and were clearly identified in the discussed
systems. As discussed previously, many other interesting supramolecular polymers have been
investigated, and the interested reader is referred to a recent review for detailed information.19
Some of the other supramolecular polymers will be featured in the next section, where the
focus is on kinetic studies.
1.3 Kinetics of synthetic supramolecular polymers
Kinetic measurements are essential for the characterization of assembled supramolecular
polymers because of their inherently dynamic existence. In addition, in recent years it has
become clear that due to the presence of kinetically trapped states, the methodology applied
to prepare the polymers determines which self-assembled states are formed. Hence, kinetic
studies are not only required to characterize the polymers once they are formed, but are also
key to the development of non-covalent synthesis protocols to reproducibly direct the
assembly towards the target architectures. One example is the preparation of kinetically
trapped supramolecular polymers in water with control over both their diameter and length.38
The continuous development of evermore complex models is anticipated to accelerate the
control over supramolecular polymerization.39
Especially, the synergy between experiment
and model to gain control over supramolecular polymerization has been well demonstrated
for both natural and synthetic polymers.40,41
Kinetic studies in organic solvents have revealed
the presence of competing polymerization mechanisms.41
A detailed understanding of these
mechanisms has led to the development of living supramolecular polymerization strategies to
prepare one-dimensional assemblies of controlled length.42-44
In addition, studies on the time-
evolution of porphyrin molecules in organic solvent have recently allowed to control a
supramolecular polymerization towards polymers or two-dimensional sheets.45
However, due
to the complexity of water as a solvent and the high kinetic barriers it typically imposes,46
experimental and computational details regarding polymerization in water are still limited. In
this section, several experimental techniques will be described that are being used to study
the kinetics of synthetic supramolecular polymers in water.
The most accessible and straightforward manner of studying the kinetics of one-
dimensional synthetic supramolecular polymers in water is spectroscopy. Using circular
dichroism spectroscopy (CD), an amphiphilic perylene diimide featuring a terpyridine
platinum complex was studied by the group of Rybtchinski.47
The monomer assembled into
kinetically trapped polymers that are CD silent, but upon adding THF the CD signal changed
slowly over time during the course of multiple days. Two different metastable states could be
7
identified and the slow kinetics beautifully demonstrated the high kinetic barriers that can be
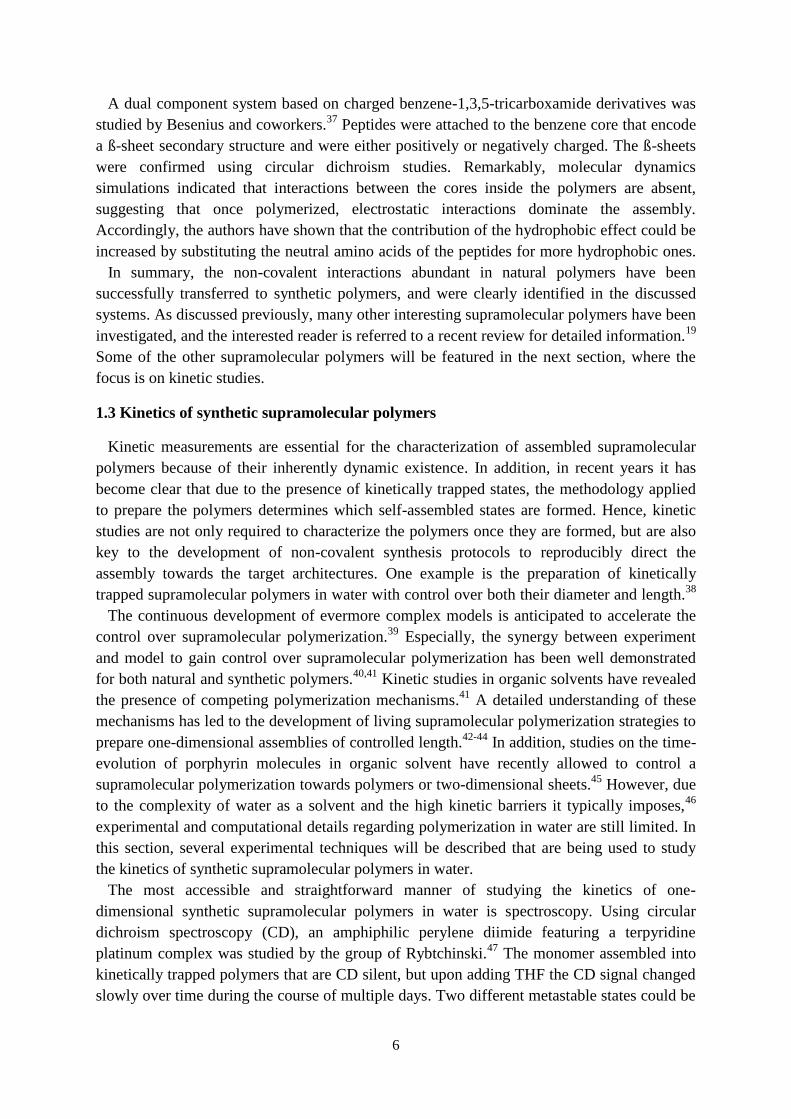
involved. To circumvent the strong kinetic trapping often associated with perylene diimides,
Hermans and coworkers synthesized a different perylene diimide (Figure 5A), and
subsequently reduced it to prevent it from polymerizing due to electrostatic repulsion.48
Upon
oxidation, the neutral monomers assemble into nanorods via a nucleated growth process that
could be followed using UV-spectroscopy, and neutral seeds obtained from the nanorods
could be used to accelerate the polymerization (Figure 5).48,49
Figure 5. A) Chemical structure of the perylene diimide derivative. B) Normalized optical density
(absorption and minor scattering) at 528 nm over time. C) Nanorods by TEM (adapted from ref. 49).
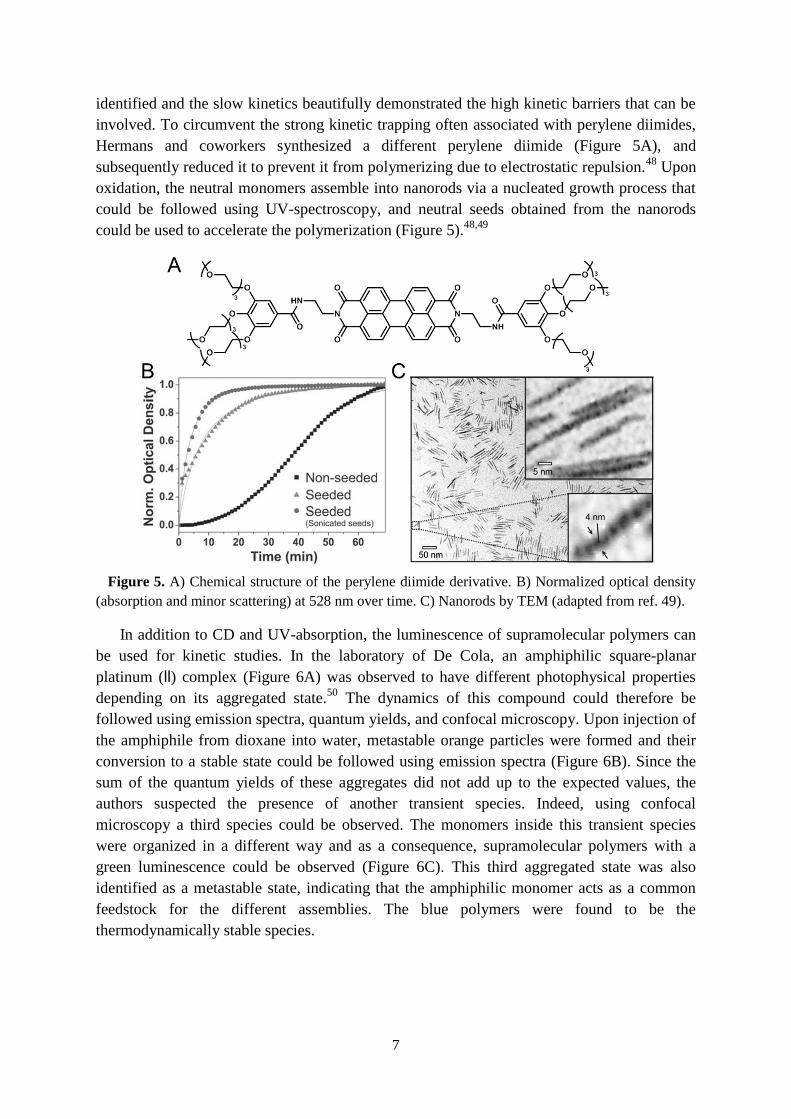
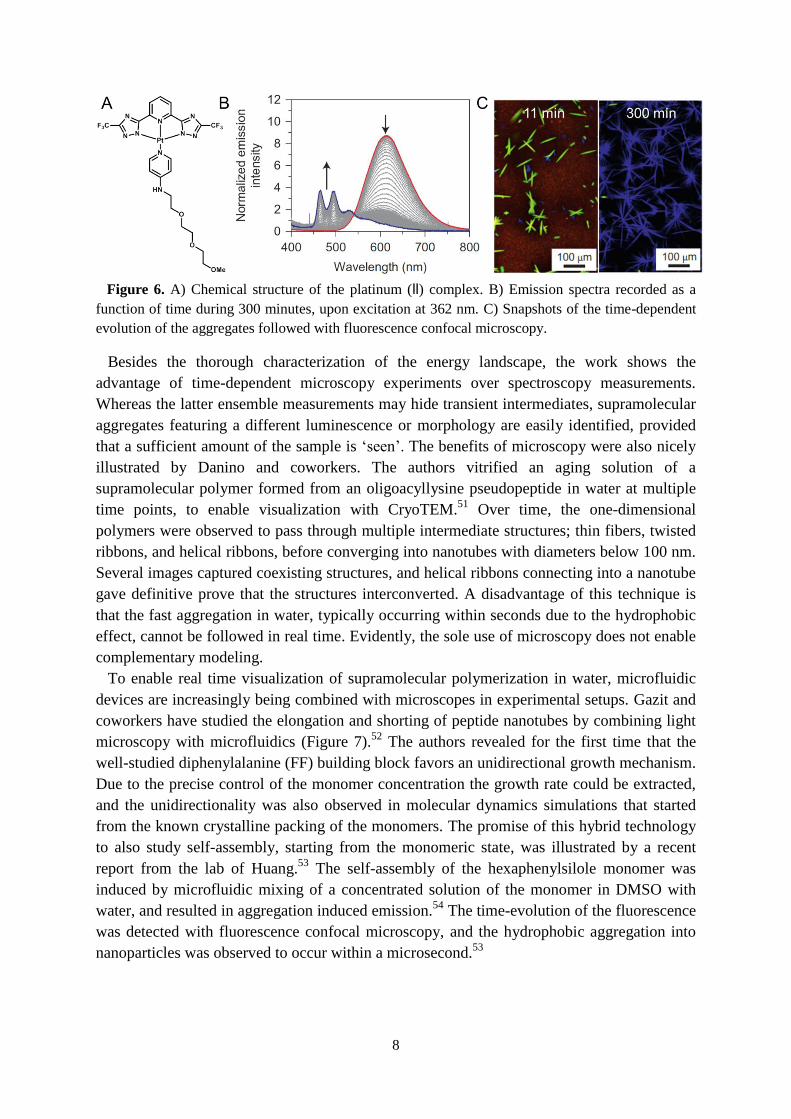
In addition to CD and UV-absorption, the luminescence of supramolecular polymers can
be used for kinetic studies. In the laboratory of De Cola, an amphiphilic square-planar
platinum (ll) complex (Figure 6A) was observed to have different photophysical properties
depending on its aggregated state.50
The dynamics of this compound could therefore be
followed using emission spectra, quantum yields, and confocal microscopy. Upon injection of
the amphiphile from dioxane into water, metastable orange particles were formed and their
conversion to a stable state could be followed using emission spectra (Figure 6B). Since the
sum of the quantum yields of these aggregates did not add up to the expected values, the
authors suspected the presence of another transient species. Indeed, using confocal
microscopy a third species could be observed. The monomers inside this transient species
were organized in a different way and as a consequence, supramolecular polymers with a
green luminescence could be observed (Figure 6C). This third aggregated state was also
identified as a metastable state, indicating that the amphiphilic monomer acts as a common
feedstock for the different assemblies. The blue polymers were found to be the
thermodynamically stable species.
8
Figure 6. A) Chemical structure of the platinum (ll) complex. B) Emission spectra recorded as a
function of time during 300 minutes, upon excitation at 362 nm. C) Snapshots of the time-dependent
evolution of the aggregates followed with fluorescence confocal microscopy.
Besides the thorough characterization of the energy landscape, the work shows the
advantage of time-dependent microscopy experiments over spectroscopy measurements.
Whereas the latter ensemble measurements may hide transient intermediates, supramolecular
aggregates featuring a different luminescence or morphology are easily identified, provided
that a sufficient amount of the sample is ‘seen’. The benefits of microscopy were also nicely
illustrated by Danino and coworkers. The authors vitrified an aging solution of a
supramolecular polymer formed from an oligoacyllysine pseudopeptide in water at multiple
time points, to enable visualization with CryoTEM.51
Over time, the one-dimensional
polymers were observed to pass through multiple intermediate structures; thin fibers, twisted
ribbons, and helical ribbons, before converging into nanotubes with diameters below 100 nm.
Several images captured coexisting structures, and helical ribbons connecting into a nanotube
gave definitive prove that the structures interconverted. A disadvantage of this technique is
that the fast aggregation in water, typically occurring within seconds due to the hydrophobic
effect, cannot be followed in real time. Evidently, the sole use of microscopy does not enable
complementary modeling.
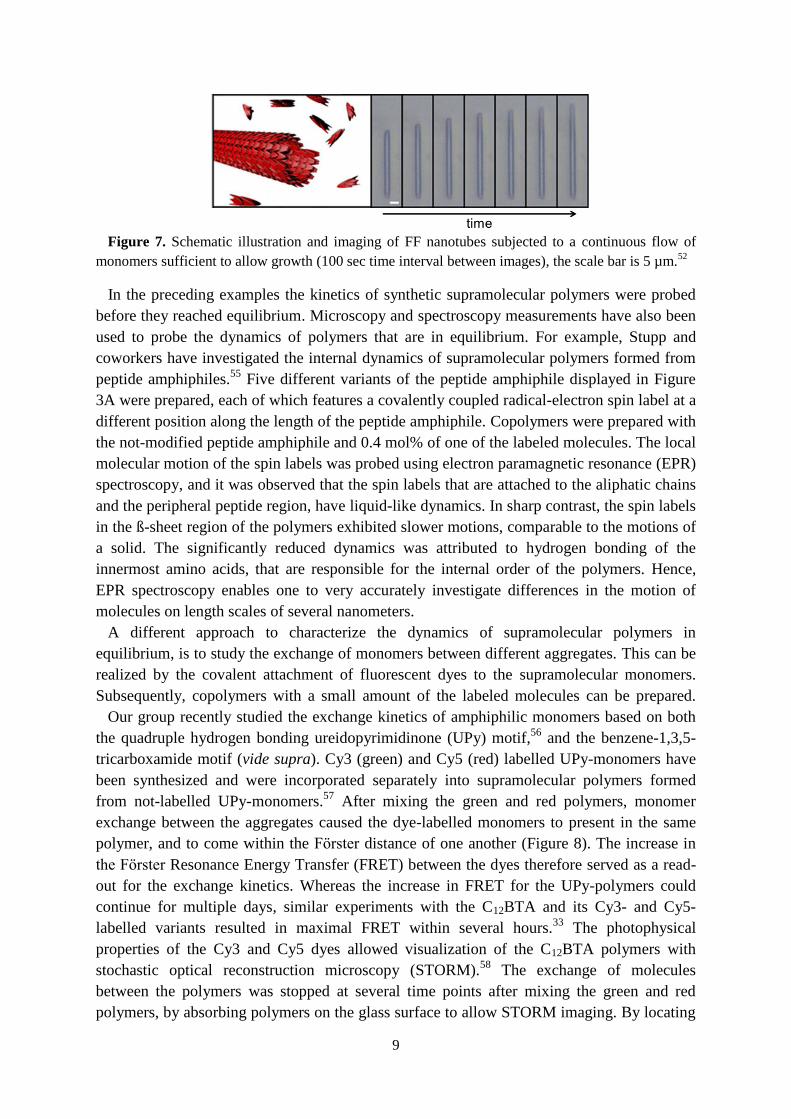
To enable real time visualization of supramolecular polymerization in water, microfluidic
devices are increasingly being combined with microscopes in experimental setups. Gazit and
coworkers have studied the elongation and shorting of peptide nanotubes by combining light
microscopy with microfluidics (Figure 7).52
The authors revealed for the first time that the
well-studied diphenylalanine (FF) building block favors an unidirectional growth mechanism.
Due to the precise control of the monomer concentration the growth rate could be extracted,
and the unidirectionality was also observed in molecular dynamics simulations that started
from the known crystalline packing of the monomers. The promise of this hybrid technology
to also study self-assembly, starting from the monomeric state, was illustrated by a recent
report from the lab of Huang.53
The self-assembly of the hexaphenylsilole monomer was
induced by microfluidic mixing of a concentrated solution of the monomer in DMSO with
water, and resulted in aggregation induced emission.54
The time-evolution of the fluorescence
was detected with fluorescence confocal microscopy, and the hydrophobic aggregation into
nanoparticles was observed to occur within a microsecond.53
9
Figure 7. Schematic illustration and imaging of FF nanotubes subjected to a continuous flow of
monomers sufficient to allow growth (100 sec time interval between images), the scale bar is 5 µm.52
In the preceding examples the kinetics of synthetic supramolecular polymers were probed
before they reached equilibrium. Microscopy and spectroscopy measurements have also been
used to probe the dynamics of polymers that are in equilibrium. For example, Stupp and
coworkers have investigated the internal dynamics of supramolecular polymers formed from
peptide amphiphiles.55
Five different variants of the peptide amphiphile displayed in Figure
3A were prepared, each of which features a covalently coupled radical-electron spin label at a
different position along the length of the peptide amphiphile. Copolymers were prepared with
the not-modified peptide amphiphile and 0.4 mol% of one of the labeled molecules. The local
molecular motion of the spin labels was probed using electron paramagnetic resonance (EPR)
spectroscopy, and it was observed that the spin labels that are attached to the aliphatic chains
and the peripheral peptide region, have liquid-like dynamics. In sharp contrast, the spin labels
in the ß-sheet region of the polymers exhibited slower motions, comparable to the motions of
a solid. The significantly reduced dynamics was attributed to hydrogen bonding of the
innermost amino acids, that are responsible for the internal order of the polymers. Hence,
EPR spectroscopy enables one to very accurately investigate differences in the motion of
molecules on length scales of several nanometers.
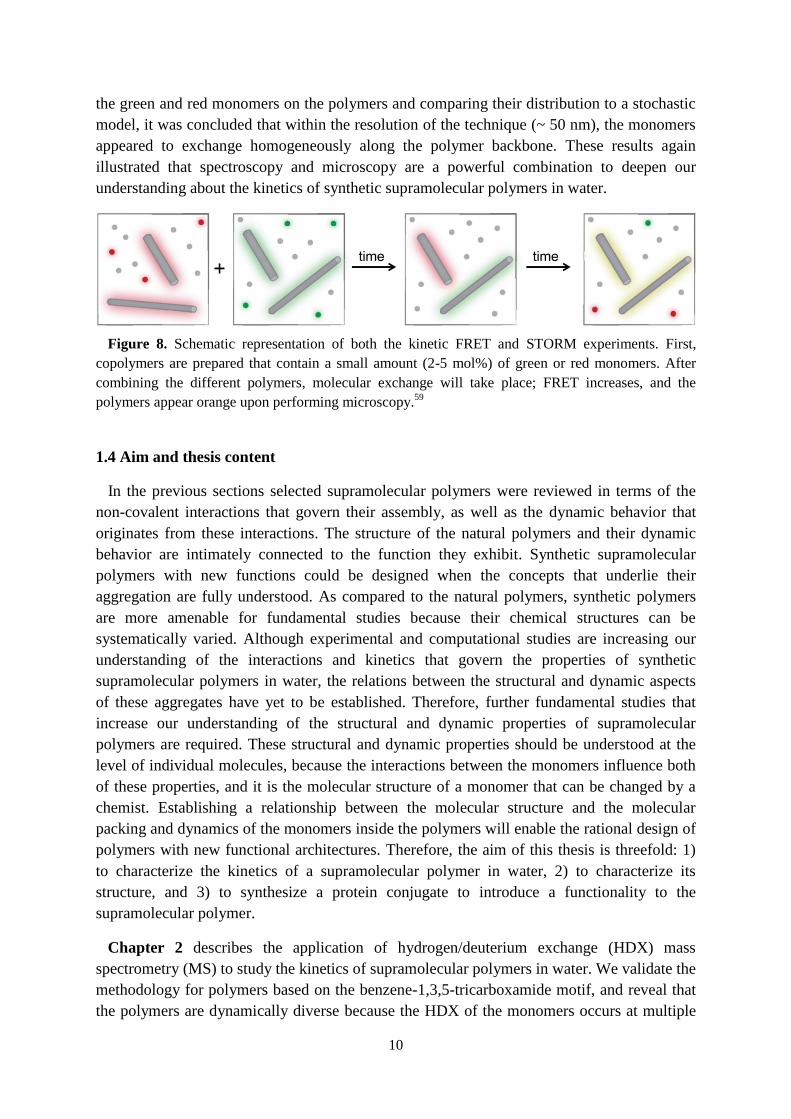
A different approach to characterize the dynamics of supramolecular polymers in
equilibrium, is to study the exchange of monomers between different aggregates. This can be
realized by the covalent attachment of fluorescent dyes to the supramolecular monomers.
Subsequently, copolymers with a small amount of the labeled molecules can be prepared.
Our group recently studied the exchange kinetics of amphiphilic monomers based on both
the quadruple hydrogen bonding ureidopyrimidinone (UPy) motif,56
and the benzene-1,3,5-
tricarboxamide motif (vide supra). Cy3 (green) and Cy5 (red) labelled UPy-monomers have
been synthesized and were incorporated separately into supramolecular polymers formed
from not-labelled UPy-monomers.57
After mixing the green and red polymers, monomer
exchange between the aggregates caused the dye-labelled monomers to present in the same
polymer, and to come within the Fӧrster distance of one another (Figure 8). The increase in
the Fӧrster Resonance Energy Transfer (FRET) between the dyes therefore served as a read-
out for the exchange kinetics. Whereas the increase in FRET for the UPy-polymers could
continue for multiple days, similar experiments with the C12BTA and its Cy3- and Cy5-
labelled variants resulted in maximal FRET within several hours.33
The photophysical
properties of the Cy3 and Cy5 dyes allowed visualization of the C12BTA polymers with
stochastic optical reconstruction microscopy (STORM).58
The exchange of molecules
between the polymers was stopped at several time points after mixing the green and red
polymers, by absorbing polymers on the glass surface to allow STORM imaging. By locating
10
the green and red monomers on the polymers and comparing their distribution to a stochastic
model, it was concluded that within the resolution of the technique (~ 50 nm), the monomers
appeared to exchange homogeneously along the polymer backbone. These results again
illustrated that spectroscopy and microscopy are a powerful combination to deepen our
understanding about the kinetics of synthetic supramolecular polymers in water.
Figure 8. Schematic representation of both the kinetic FRET and STORM experiments. First,
copolymers are prepared that contain a small amount (2-5 mol%) of green or red monomers. After
combining the different polymers, molecular exchange will take place; FRET increases, and the
polymers appear orange upon performing microscopy.59
1.4 Aim and thesis content
In the previous sections selected supramolecular polymers were reviewed in terms of the
non-covalent interactions that govern their assembly, as well as the dynamic behavior that
originates from these interactions. The structure of the natural polymers and their dynamic
behavior are intimately connected to the function they exhibit. Synthetic supramolecular
polymers with new functions could be designed when the concepts that underlie their
aggregation are fully understood. As compared to the natural polymers, synthetic polymers
are more amenable for fundamental studies because their chemical structures can be
systematically varied. Although experimental and computational studies are increasing our
understanding of the interactions and kinetics that govern the properties of synthetic
supramolecular polymers in water, the relations between the structural and dynamic aspects
of these aggregates have yet to be established. Therefore, further fundamental studies that
increase our understanding of the structural and dynamic properties of supramolecular
polymers are required. These structural and dynamic properties should be understood at the
level of individual molecules, because the interactions between the monomers influence both
of these properties, and it is the molecular structure of a monomer that can be changed by a
chemist. Establishing a relationship between the molecular structure and the molecular
packing and dynamics of the monomers inside the polymers will enable the rational design of
polymers with new functional architectures. Therefore, the aim of this thesis is threefold: 1)
to characterize the kinetics of a supramolecular polymer in water, 2) to characterize its
structure, and 3) to synthesize a protein conjugate to introduce a functionality to the
supramolecular polymer.
Chapter 2 describes the application of hydrogen/deuterium exchange (HDX) mass
spectrometry (MS) to study the kinetics of supramolecular polymers in water. We validate the
methodology for polymers based on the benzene-1,3,5-tricarboxamide motif, and reveal that
the polymers are dynamically diverse because the HDX of the monomers occurs at multiple
11
timescales. We show the influence of temperature and small changes in the molecular
structure of the monomers on the HDX kinetics of the polymers.
In chapter 3, we study the kinetics of the supramolecular polymer formed from the
C12BTA in the presence of acetonitrile (ACN) as a cosolvent. Experiments to probe the
morphology of the equilibrated aggregates show that the polymers disappear abruptly at a
critical fraction of ACN. However, HDX-MS experiments show gradual changes in the HDX
rates of the polymers in response to an increasing fraction of ACN. Kinetic UV-experiments
to probe both the assembly and disassembly rates of the polymers indicate that the polymers
equilibrate more slowly at the critical fraction of ACN. Finally, molecular dynamics
simulations show that ACN interferes with the internal packing of the polymers.
In chapter 4, we revisit the benzene-1,3,5-tricarboxamide derivatives that were studied in
chapter 2 and show that monomers, that differ in the apolar part of the molecules, can be
copolymerized. To this end, we compare the lower critical solution temperature transitions of
dual component systems to solutions containing one benzene-1,3,5-tricarboxamide
derivative. Subsequently, a HDX-MS methodology is developed to study the kinetics of
copolymerization in water. In addition, we use the UV-absorption of the copolymers as a
read-out to investigate the copolymerization rates. The results indicate that the hydrophobic
mismatch between the molecules plays an important role in the coassembly kinetics.
Towards the second aim, in chapter 5 cryogenic electron tomography is used to
characterize the structure of the supramolecular aggregates formed from the C12BTA at the
nanometer level. Three-dimensional models of two supramolecular polymers are obtained by
segmentation. Their combination with a detailed analysis of the cross sections of these
polymers, leads us to conclude that supramolecular polymers formed from the C12BTA can
wrap around one another to form a double helix. In addition, we show that the monomers
form a self-assembled monolayer at the air-water interface, and aggregate into particles that
have an irregular morphology and a diameter below three nanometer.
For the third objective, in chapter 6 we explore the feasibility of the cyanobenzothiazole
condensation, Michael addition with a maleimide, and native chemical ligation reactions to
covalently attach a cyan or yellow fluorescent protein to the C12BTA. The reactive groups
required are first introduced to the C12BTA and proteins in a selective manner. The
conjugation reactions indicate that the cyanobenzothiazole-functionalized BTA is not
reactive, and that protein functionalization with a cysteine is best performed at the C-terminus
of the fluorescent proteins, because of side reactions with an N-terminal cysteine. The native
chemical ligation reaction results in the highest conversion to the protein conjugates.
1.5 References
(1) Fletcher, D. A.; Mullins, R. D. Nature 2010, 463, 485. (2) Pollard, T. D.; Cooper, J. A. Science 2009, 326, 1208. (3) von der Ecken, J.; Muller, M.; Lehman, W.; Manstein, D. J.; Penczek, P. A.; Raunser, S. Nature
2015, 519, 114. (4) Zhao, D.; Moore, J. S. Organic & Biomolecular Chemistry 2003, 1, 3471. (5) Wegner, A. Journal of Molecular Biology 1976, 108, 139. (6) Fujiwara, I.; Takahashi, S.; Tadakuma, H.; Funatsu, T.; Ishiwata, S. Nature cell biology 2002, 4,
666. (7) Suarez, C.; Kovar, D. R. Nature reviews. Molecular cell biology 2016, 17, 799.
12
(8) Nogales, E.; Whittaker, M.; Milligan, R. A.; Downing, K. H. Cell 1999, 96, 79. (9) Mandelkow, E. M.; Mandelkow, E.; Milligan, R. A. The Journal of cell biology 1991, 114, 977. (10) Akhmanova, A.; Steinmetz, M. O. Nature reviews. Molecular cell biology 2015, 16, 711. (11) Mitchison, T.; Kirschner, M. Nature 1984, 312, 237. (12) Horio, T.; Hotani, H. Nature 1986, 321, 605. (13) Knowles, T. P. J.; Vendruscolo, M.; Dobson, C. M. Nature reviews. Molecular cell biology
2014, 15, 384. (14) Fitzpatrick, A. W. P.; Falcon, B.; He, S.; Murzin, A. G.; Murshudov, G.; Garringer, H. J.;
Crowther, R. A.; Ghetti, B.; Goedert, M.; Scheres, S. H. W. Nature 2017, 547, 185. (15) Cohen, S. I.; Linse, S.; Luheshi, L. M.; Hellstrand, E.; White, D. A.; Rajah, L.; Otzen, D. E.;
Vendruscolo, M.; Dobson, C. M.; Knowles, T. P. Proceedings of the National Academy of Sciences USA 2013, 110, 9758.
(16) Carulla, N.; Caddy, G. L.; Hall, D. R.; Zurdo, J.; Gairi, M.; Feliz, M.; Giralt, E.; Robinson, C. V.; Dobson, C. M. Nature 2005, 436, 554.
(17) Boekhoven, J.; Brizard, A. M.; Kowlgi, K. N. K.; Koper, G. J. M.; Eelkema, R.; van Esch, J. H. Angewandte Chemie International Edition 2010, 49, 4825.
(18) Boekhoven, J.; Hendriksen, W. E.; Koper, G. J. M.; Eelkema, R.; van Esch, J. H. Science 2015, 349, 1075.
(19) Krieg, E.; Bastings, M. M. C.; Besenius, P.; Rybtchinski, B. Chemical Reviews 2016, 116, 2414. (20) Fenniri, H.; Mathivanan, P.; Vidale, K. L.; Sherman, D. M.; Hallenga, K.; Wood, K. V.; Stowell,
J. G. Journal of the American Chemical Society 2001, 123, 3854. (21) Adler-Abramovich, L.; Gazit, E. Chemical Society Reviews 2014, 43, 6881. (22) Fleming, S.; Ulijn, R. V. Chemical Society Reviews 2014, 43, 8150. (23) Kim, H.-J.; Kim, T.; Lee, M. Accounts of Chemical Research 2011, 44, 72. (24) Görl, D.; Zhang, X.; Würthner, F. Angewandte Chemie International Edition 2012, 51, 6328. (25) Hartgerink, J. D.; Beniash, E.; Stupp, S. I. Science 2001, 294, 1684. (26) Cui, H.; Webber, M. J.; Stupp, S. I. Peptide Science 2010, 94, 1. (27) Silva, G. A.; Czeisler, C.; Niece, K. L.; Beniash, E.; Harrington, D. A.; Kessler, J. A.; Stupp, S. I.
Science 2004, 303, 1352. (28) Paramonov, S. E.; Jun, H.-W.; Hartgerink, J. D. Journal of the American Chemical Society 2006,
128, 7291. (29) Jiang, H.; Guler, M. O.; Stupp, S. I. Soft Matter 2007, 3, 454. (30) Velichko, Y. S.; Stupp, S. I.; de la Cruz, M. O. The Journal of Physical Chemistry B 2008, 112,
2326. (31) Lee, O.-S.; Stupp, S. I.; Schatz, G. C. Journal of the American Chemical Society 2011, 133,
3677. (32) Tantakitti, F.; Boekhoven, J.; Wang, X.; Kazantsev, R. V.; Yu, T.; Li, J.; Zhuang, E.; Zandi, R.;
Ortony, J. H.; Newcomb, C. J.; Palmer, L. C.; Shekhawat, G. S.; de la Cruz, M. O.; Schatz, G. C.; Stupp, S. I. Nature Materials 2016, 15, 469.
(33) Leenders, C. M. A.; Baker, M. B.; Pijpers, I. A. B.; Lafleur, R. P. M.; Albertazzi, L.; Palmans, A. R. A.; Meijer, E. W. Soft Matter 2016, 12, 2887.
(34) Leenders, C. M.; Albertazzi, L.; Mes, T.; Koenigs, M. M.; Palmans, A. R.; Meijer, E. W. Chemical communications 2013, 49, 1963.
(35) Garzoni, M.; Baker, M. B.; Leenders, C. M. A.; Voets, I. K.; Albertazzi, L.; Palmans, A. R. A.; Meijer, E. W.; Pavan, G. M. Journal of the American Chemical Society 2016.
(36) Bochicchio, D.; Pavan, G. M. ACS Nano 2017, 11, 1000. (37) Frisch, H.; Unsleber, J. P.; Lüdeker, D.; Peterlechner, M.; Brunklaus, G.; Waller, M.; Besenius,
P. Angewandte Chemie International Edition 2013, 52, 10097. (38) Pal, A.; Malakoutikhah, M.; Leonetti, G.; Tezcan, M.; Colomb-Delsuc, M.; Nguyen, V. D.; van
der Gucht, J.; Otto, S. Angewandte Chemie International Edition 2015, 54, 7852.
13
(39) Markvoort, A. J.; Eikelder, H. M. M. t.; Hilbers, P. A. J.; de Greef, T. F. A. ACS Central Science 2016, 2, 232.
(40) Oosawa, F.; Kasai, M. Journal of Molecular Biology 1962, 4, 10. (41) Korevaar, P. A.; George, S. J.; Markvoort, A. J.; Smulders, M. M. J.; Hilbers, P. A. J.; Schenning,
A. P. H. J.; De Greef, T. F. A.; Meijer, E. W. Nature 2012, 481, 492. (42) Ogi, S.; Sugiyasu, K.; Manna, S.; Samitsu, S.; Takeuchi, M. Nature Chemistry 2014, 6, 188. (43) Ogi, S.; Stepanenko, V.; Sugiyasu, K.; Takeuchi, M.; Würthner, F. Journal of the American
Chemical Society 2015, 137, 3300. (44) Kang, J.; Miyajima, D.; Mori, T.; Inoue, Y.; Itoh, Y.; Aida, T. Science 2015, 347, 646. (45) Fukui, T.; Kawai, S.; Fujinuma, S.; Matsushita, Y.; Yasuda, T.; Sakurai, T.; Seki, S.; Takeuchi, M.;
Sugiyasu, K. Nature Chemistry 2017, 9, 493. (46) Chandler, D. Nature 2005, 437, 640. (47) Tidhar, Y.; Weissman, H.; Wolf, S. G.; Gulino, A.; Rybtchinski, B. Chemistry – A European
Journal 2011, 17, 6068. (48) Leira-Iglesias, J.; Sorrenti, A.; Sato, A.; Dunne, P. A.; Hermans, T. M. Chemical
communications 2016, 52, 9009. (49) Zhang, X.; Görl, D.; Stepanenko, V.; Würthner, F. Angewandte Chemie International Edition
2014, 53, 1270. (50) Aliprandi, A.; Mauro, M.; De Cola, L. Nature Chemistry 2016, 8, 10. (51) Ziserman, L.; Lee, H.-Y.; Raghavan, S. R.; Mor, A.; Danino, D. Journal of the American
Chemical Society 2011, 133, 2511. (52) Arnon, Z. A.; Vitalis, A.; Levin, A.; Michaels, T. C. T.; Caflisch, A.; Knowles, T. P. J.; Adler-
Abramovich, L.; Gazit, E. Nature Communications 2016, 7, 13190. (53) Jiang, L.; Cao, S.; Cheung, P. P.-H.; Zheng, X.; Leung, C. W. T.; Peng, Q.; Shuai, Z.; Tang, B. Z.;
Yao, S.; Huang, X. Nature Communications 2017, 8, 15639. (54) Hong, Y.; Lam, J. W. Y.; Tang, B. Z. Chemical Society Reviews 2011, 40, 5361. (55) Ortony, J. H.; Newcomb, C. J.; Matson, J. B.; Palmer, L. C.; Doan, P. E.; Hoffman, B. M.; Stupp,
S. I. Nature Materials 2014, 13, 812. (56) Sijbesma, R. P.; Beijer, F. H.; Brunsveld, L.; Folmer, B. J.; Hirschberg, J. H.; Lange, R. F.; Lowe,
J. K.; Meijer, E. W. Science 1997, 278, 1601. (57) Hendrikse, S. I. S.; Wijnands, S. P. W.; Lafleur, R. P. M.; Pouderoijen, M. J.; Janssen, H. M.;
Dankers, P. Y. W.; Meijer, E. W. Chemical communications 2017, 53, 2279. (58) Albertazzi, L.; Martinez-Veracoechea, F. J.; Leenders, C. M. A.; Voets, I. K.; Frenkel, D.; Meijer,
E. W. Proceedings of the National Academy of Sciences 2013, 110, 12203. (59) Pujals, S.; Tao, K.; Terradellas, A.; Gazit, E.; Albertazzi, L. Chemical communications 2017, 53,
2279.

14
15
Chapter 2
Dynamic diversity of supramolecular polymers in water as
revealed by hydrogen/deuterium exchange
Abstract:
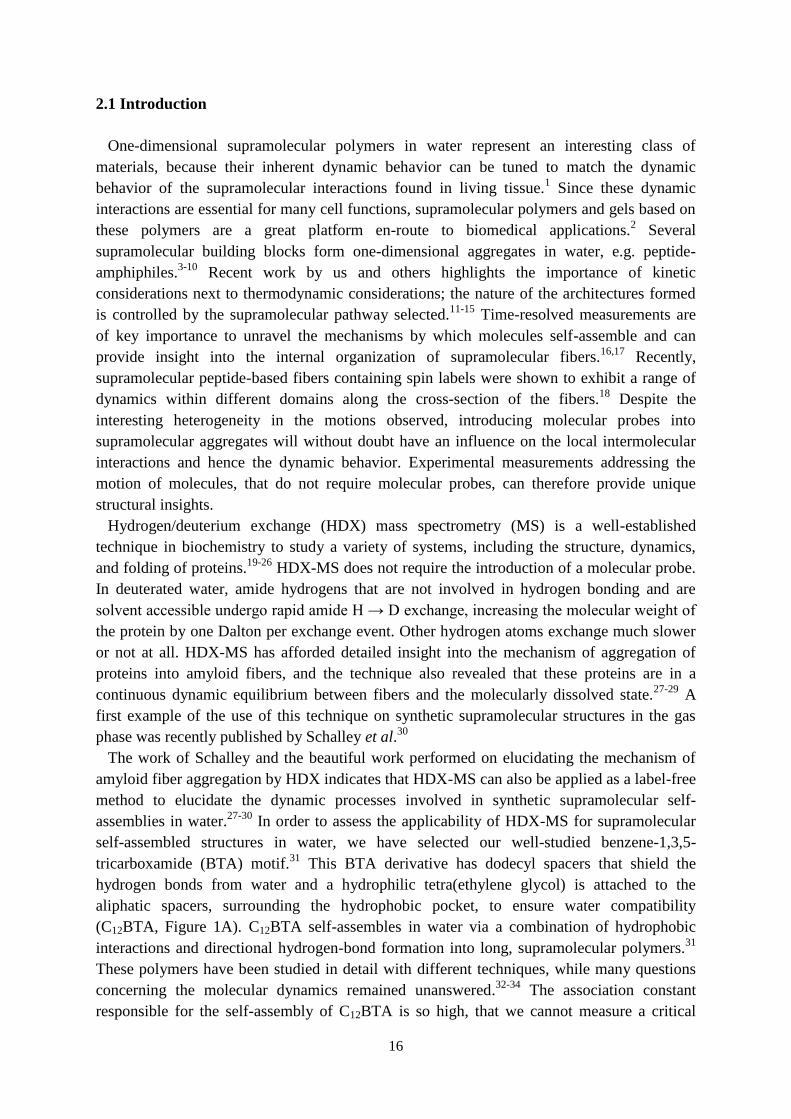
Numerous self-assembling molecules have been synthesized with the aim to mimic both the
structural and dynamic properties found in living systems. Here we show the application of
hydrogen/deuterium exchange (HDX) mass spectrometry (MS) to unravel the structural
dynamics of synthetic supramolecular polymers in water. We have selected benzene-1,3,5-
tricarboxamide (BTA) derivatives that self-assemble in H2O to illustrate the strength of this
technique for supramolecular polymers. The BTA structure has six exchangeable hydrogen
atoms and we follow their exchange as a function of time after diluting the H2O solution with
a 100-fold excess of D2O. The kinetic H/D exchange profiles reveal that these supramolecular
polymers in water are dynamically diverse; a notion that has previously not been observed
using other techniques. In addition, we report that small changes in the molecular structure
can be used to control the dynamics of synthetic supramolecular polymers in water.
This work has been published:
Lou, X.*; Lafleur, R. P. M.*; Leenders, C. M. A.; Schoenmakers, S. M. C.; Matsumoto, N.
M.; Baker, M. B.; van Dongen, J. L. J.; Palmans, A. R. A.; Meijer, E. W. Nature
Communications 2017, 8, 15420.
16
2.1 Introduction
One-dimensional supramolecular polymers in water represent an interesting class of
materials, because their inherent dynamic behavior can be tuned to match the dynamic
behavior of the supramolecular interactions found in living tissue.1 Since these dynamic
interactions are essential for many cell functions, supramolecular polymers and gels based on
these polymers are a great platform en-route to biomedical applications.2 Several
supramolecular building blocks form one-dimensional aggregates in water, e.g. peptide-
amphiphiles.3-10
Recent work by us and others highlights the importance of kinetic
considerations next to thermodynamic considerations; the nature of the architectures formed
is controlled by the supramolecular pathway selected.11-15
Time-resolved measurements are
of key importance to unravel the mechanisms by which molecules self-assemble and can
provide insight into the internal organization of supramolecular fibers.16,17
Recently,
supramolecular peptide-based fibers containing spin labels were shown to exhibit a range of
dynamics within different domains along the cross-section of the fibers.18
Despite the
interesting heterogeneity in the motions observed, introducing molecular probes into
supramolecular aggregates will without doubt have an influence on the local intermolecular
interactions and hence the dynamic behavior. Experimental measurements addressing the
motion of molecules, that do not require molecular probes, can therefore provide unique
structural insights.
Hydrogen/deuterium exchange (HDX) mass spectrometry (MS) is a well-established
technique in biochemistry to study a variety of systems, including the structure, dynamics,
and folding of proteins.19-26
HDX-MS does not require the introduction of a molecular probe.
In deuterated water, amide hydrogens that are not involved in hydrogen bonding and are
solvent accessible undergo rapid amide H → D exchange, increasing the molecular weight of
the protein by one Dalton per exchange event. Other hydrogen atoms exchange much slower
or not at all. HDX-MS has afforded detailed insight into the mechanism of aggregation of
proteins into amyloid fibers, and the technique also revealed that these proteins are in a
continuous dynamic equilibrium between fibers and the molecularly dissolved state.27-29
A
first example of the use of this technique on synthetic supramolecular structures in the gas
phase was recently published by Schalley et al.30
The work of Schalley and the beautiful work performed on elucidating the mechanism of
amyloid fiber aggregation by HDX indicates that HDX-MS can also be applied as a label-free
method to elucidate the dynamic processes involved in synthetic supramolecular self-
assemblies in water.27-30
In order to assess the applicability of HDX-MS for supramolecular
self-assembled structures in water, we have selected our well-studied benzene-1,3,5-
tricarboxamide (BTA) motif.31
This BTA derivative has dodecyl spacers that shield the
hydrogen bonds from water and a hydrophilic tetra(ethylene glycol) is attached to the
aliphatic spacers, surrounding the hydrophobic pocket, to ensure water compatibility
(C12BTA, Figure 1A). C12BTA self-assembles in water via a combination of hydrophobic
interactions and directional hydrogen-bond formation into long, supramolecular polymers.31
These polymers have been studied in detail with different techniques, while many questions
concerning the molecular dynamics remained unanswered.32-34
The association constant
responsible for the self-assembly of C12BTA is so high, that we cannot measure a critical
17
association concentration of the cylindrical and/or spherical aggregates yet. This is in line
with the very large aspect ratio of these supramolecular polymers. Molecular dynamics (all-
atom MD) simulations on C12BTA in water revealed the molecular fluctuations of the
supramolecular polymer.32
Previous experimental investigations focused on dye-labeled
variants of C12BTA co-assembled with C12BTA. The formed supramolecular fibers were
investigated by Förster Resonance Energy Transfer (FRET) and stochastic optical
reconstruction microscopy (STORM),33,34
which revealed that the dye-labeled monomers
exchange from fiber-to-fiber by a release-incorporation mechanism. This monomer exchange
showed half-lives in the order of hours at room temperature and appeared to occur randomly,
within the 50 nanometer resolution of the STORM technique, along the entire supramolecular
polymers.34
In this chapter, we show that HDX-MS is a promising technique to study the dynamics of
the water-soluble supramolecular polymer based on the benzene-1,3,5-tricarboxamide (BTA)
motif, i.e. the physical movements of the constituent monomers, without the use of molecular
probes. In the first part we show the H → D exchange of supramolecular polymers formed
from C12BTA and validate the method of HDX-MS. In the second part of the chapter, time-
resolved measurements reveal, to our surprise, that the HDX of BTA polymers in water is
governed by different processes that occur at different timescales. In addition, control over
the polymer dynamics was achieved by varying the temperature and molecular structure. Our
results show that HDX-MS is a powerful method for the investigation of synthetic
supramolecular self-assembly in water, and the different timescales observed suggest that the
supramolecular polymers studied here are structurally diverse. The work described was
performed in close collaboration with Xianwen Lou.
Results
2.2 The initial H/D exchange experiment
The BTA-based supramolecular polymers formed from C12BTA were made in H2O using a
non-covalent synthetic protocol by heating, vortexing, followed by slow cooling. Once
formed, the 500 µM C12BTA-H2O solution was diluted 100 times into D2O, after which mass
spectra were taken in time, by using electrospray ionization mass spectrometry (ESI-MS).
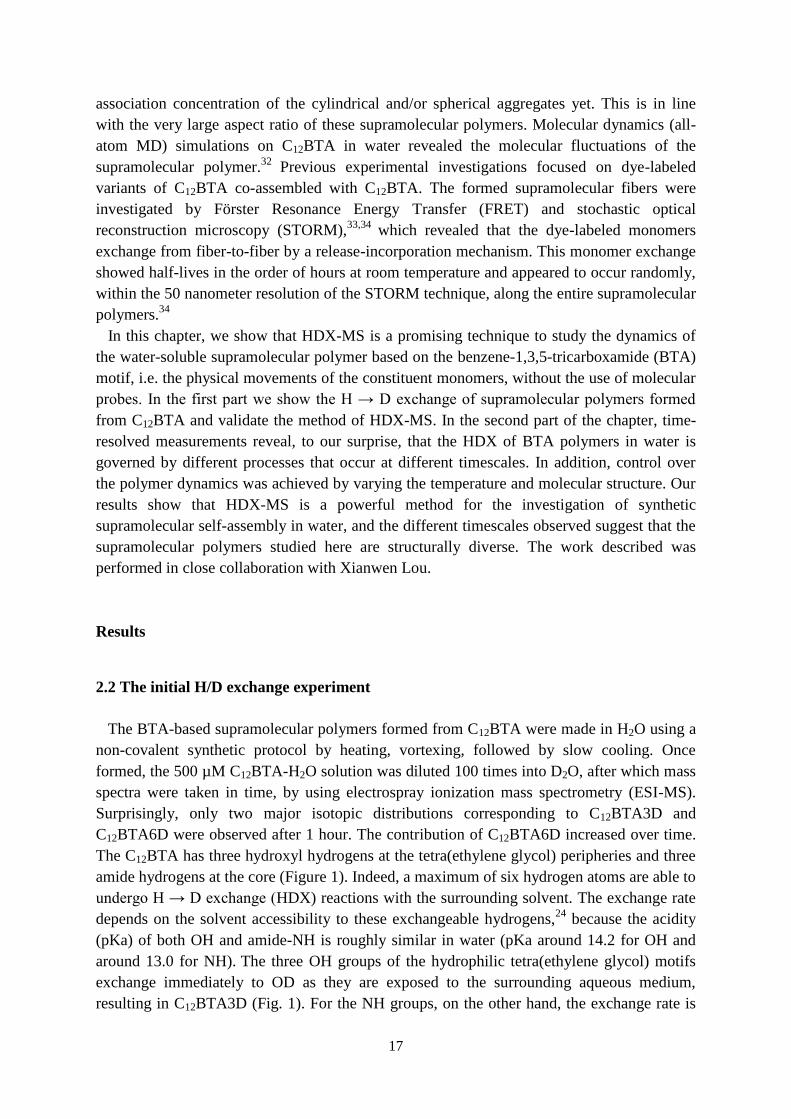
Surprisingly, only two major isotopic distributions corresponding to C12BTA3D and
C12BTA6D were observed after 1 hour. The contribution of C12BTA6D increased over time.
The C12BTA has three hydroxyl hydrogens at the tetra(ethylene glycol) peripheries and three
amide hydrogens at the core (Figure 1). Indeed, a maximum of six hydrogen atoms are able to
undergo H → D exchange (HDX) reactions with the surrounding solvent. The exchange rate
depends on the solvent accessibility to these exchangeable hydrogens,24
because the acidity
(pKa) of both OH and amide-NH is roughly similar in water (pKa around 14.2 for OH and
around 13.0 for NH). The three OH groups of the hydrophilic tetra(ethylene glycol) motifs
exchange immediately to OD as they are exposed to the surrounding aqueous medium,
resulting in C12BTA3D (Fig. 1). For the NH groups, on the other hand, the exchange rate is
18
much slower due to the reduced water accessibility, caused by the formation of the
hydrophobic pocket. Remarkably, some of the amide exchange of NH to ND occured at a
time scale of hours, whereas other amides were not deuterated even after multiple days.
Before going into the details of these interesting time-resolved observations, we will first
validate the method of HDX-MS for supramolecular polymers.
Figure 1. A) Chemical structures of C12BTA and its deuterated analogues C12BTA3D and
C12BTA6D, schematic representation of the supramolecular polymers formed in water and an
illustration of the H/D exchange process. B) ESI-MS spectrum of C12BTA diluted into D2O after
one hour of exchange.
2.3 Validation of HDX-MS
To validate the method, we assessed whether the isotopic distributions recorded with MS
are representative of the real isotopic distributions in solution for the supramolecular
polymers based on C12BTA. There is the possibility that H/D exchange takes place during
electrospray ionization (ESI). A viable way to validate the HDX-MS method is to find the
conditions necessary to completely quench the H/D exchange. If the exchange is completely
quenched in solution, the contribution of the HDX that occurs in the ESI chamber can be
determined. A number of methods described in the literature (including: extraction with a dry
aprotic organic solvent, cooling down to 0°C at pH=2.3, and freeze-drying to remove
H2O/D2O followed by re-dissolving in a dry aprotic organic solvent) were evaluated by
Xianwen Lou for their ability to quench the exchange.35,36
Under these conditions, the
exchange was never quenched effectively. However, at 0°C, a temperature at which the
exchange of dye-labeled monomers between different supramolecular polymers in solution is
19
significantly slowed down,33
less than 7% of C12BTA6D was obtained after HDX for 1
minute (Supplementary Tables 1-2) by diluting C12BTA-H2O 100 times in D2O. This value is
in the same range as observed for proteins, which is typically <4%.25
Thus, despite the
difficulty of finding the experimental conditions required to completely quench the H/D
exchange, and considering the relatively fast exchange rate directly after dilution of a
C12BTA-H2O solution into D2O (vide infra), we conclude that the contribution of H/D
exchange in the ESI chamber is limited for our synthetic supramolecular polymers.
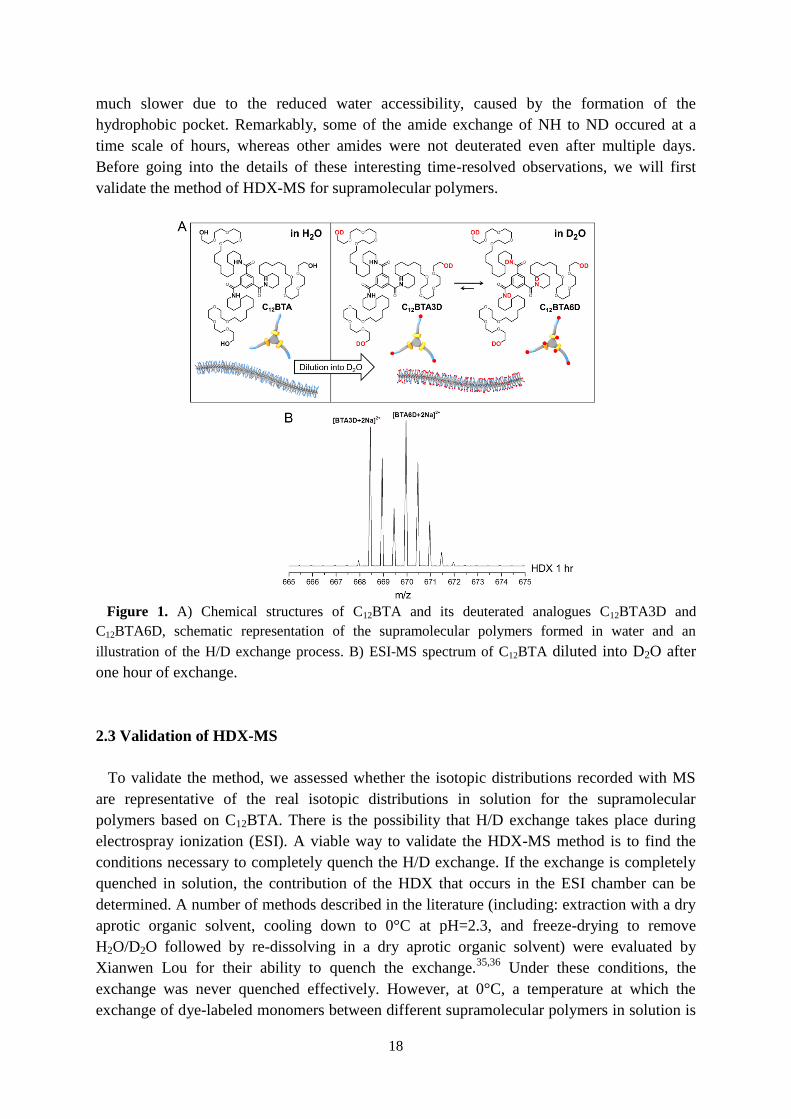
In the ESI-MS measurements of the C12BTA polymers in water, peaks of singly, doubly
and triply charged sodium adducts of the BTA molecules were observed, among which the
doubly charged ion was the most pronounced species (Figure 2A). Although we observed a
large difference in the signal intensity in a given mass spectrum, no difference in the
respective isotopic distributions was observed for the ions with different charges. Therefore,
the doubly charged ions were used for probing HDX of the supramolecular polymers. We
never observed masses corresponding to dimers or lower oligomers in the MS spectra,
indicating that full depolymerization of the supramolecular polymers occurred as a
consequence of the ionization settings we employed.
Figure 2. A) ESI-MS spectrum of C12BTA with the doubly charged ion as the most prominent ion.
B) HDX-MS spectra of doubly charged sodium adducts of C12BTA obtained after the dilution of a
500 µM C12BTA-H2O solution 100 times into D2O or H2O. The spectra at four different stages are
presented in different colors. The green spectrum is a reference spectrum of C12BTA diluted into H2O;
the black spectrum and the red spectrum are recorded after HDX for 1 and 24 hours, respectively; the
blue spectrum is the spectrum of a control measurement where the polymers were diluted 100 times
into a solvent mixture containing acetonitrile (ACN/D2O = 1/1 (v/v)). C) Mass spectrum obtained
after the dilution of a 500 µM C12BTA-H2O solution into D2O and HDX for 1 hour. The numbers in
the round brackets are the corresponding relative intensities.
20
A reference mass spectrum of a C12BTA sample without deuterium exchange was measured
by the dilution of a 500 µM C12BTA-H2O solution 100 times into H2O (Figure 2B, spectrum
in green). The isotopic pattern due to the naturally occurring isotopes of the composing
elements is observed in this reference spectrum. On the contrary, after the dilution of a 500
µM C12BTA-H2O 100 times into D2O and HDX for one hour, two major isotopic
distributions corresponding to [C12BTA3D + 2Na]2+
and [C12BTA6D + 2Na]2+
were observed
(Figure 2B, black spectrum). The isotopic pattern for [C12BTA3D + 2Na]2+
is the result of the
rapid exchange of the hydrogens of the OH groups for deuterium, and the pattern for
[C12BTA6D + 2Na]2+
is the result of HDX of both the OH and the NH groups. By calculating
and comparing the relative peak intensities in the isotopic distributions, it was observed that
the relative intensity of the first two neighboring isotopic peaks for C12BTA3D (m/z at 668.46
and 668.96, Figure 2C) was the same as that for the non-deuterated BTA counterpart
(C12BTA, m/z at 666.95 and 667.45, green spectrum). This indicates that indeed no
C12BTA4D was present after HDX for one hour. In the presence of C12BTA4D, the relative
intensity of the second isotopic peak (m/z at 668.96) has to be significantly higher. A similar
analysis indicates that C12BTA5D was absent when the contribution of the trace amount of
H2O in the sample to the formation of C12BTA5D was subtracted. The isotopic patterns
observed, therefore, correspond to two distinct isotopic distributions of C12BTA3D and
C12BTA6D without considerable contribution of C12BTA4D and C12BTA5D (Figure 2B,
spectra in black and red).
The intensity of the isotopic pattern for [C12BTA6D + 2Na]2+
increased with exchange time
(Figure 2B, red spectrum for HDX after 24 hours). When calculating the percentage of
C12BTA3D, the overlap of the isotopic peaks of C12BTA3D and C12BTA6D should be taken
into account. After one hour of HDX, around 50% of C12BTA3D was transformed to
C12BTA6D. After 24 h about 25% of C12BTA3D remained, while still no 4D or 5D species
were observed. As a control experiment, a 500 µM BTA solution in H2O was diluted 100
times into acetonitrile/D2O (1/1 v/v), since acetonitrile is known to dissolve BTAs.37
All
C12BTA3D was immediately transformed to C12BTA6D (Figure 2B, blue spectrum). The tiny
peak in front of C12BTA6D is due to the presence of a trace amount of the original H2O.
In the experiments discussed above, BTA polymers prepared in H2O were exposed to D2O
leading to the replacement of H by D in an exchange-in scenario. To investigate whether the
deuterium labels would affect the strength of the intermolecular hydrogen bonds and, as a
result, the HDX rate of BTA molecules in the polymers, experiments were also performed in
a reversed scenario of exchange-out. In this case, BTA-based supramolecular polymers were
prepared in D2O and fully deuterated before they were diluted into H2O. No considerable
influence of the D-labels on the HDX behavior was observed. Similarly, the exchange rate in
the ‘exchange-out’ mode was fast in the beginning with about 50% exchanged after one hour,
and slowed down significantly afterwards with about 25% not exchanged after 24 hours. This
result indicates that the possible difference in the strength of the ND···OC and NH···OC
hydrogen bonds is not a factor that contributes to the observed decrease in the HDX rate over
time.
21
2.4 Time-resolved H/D exchange of C12BTA supramolecular polymers
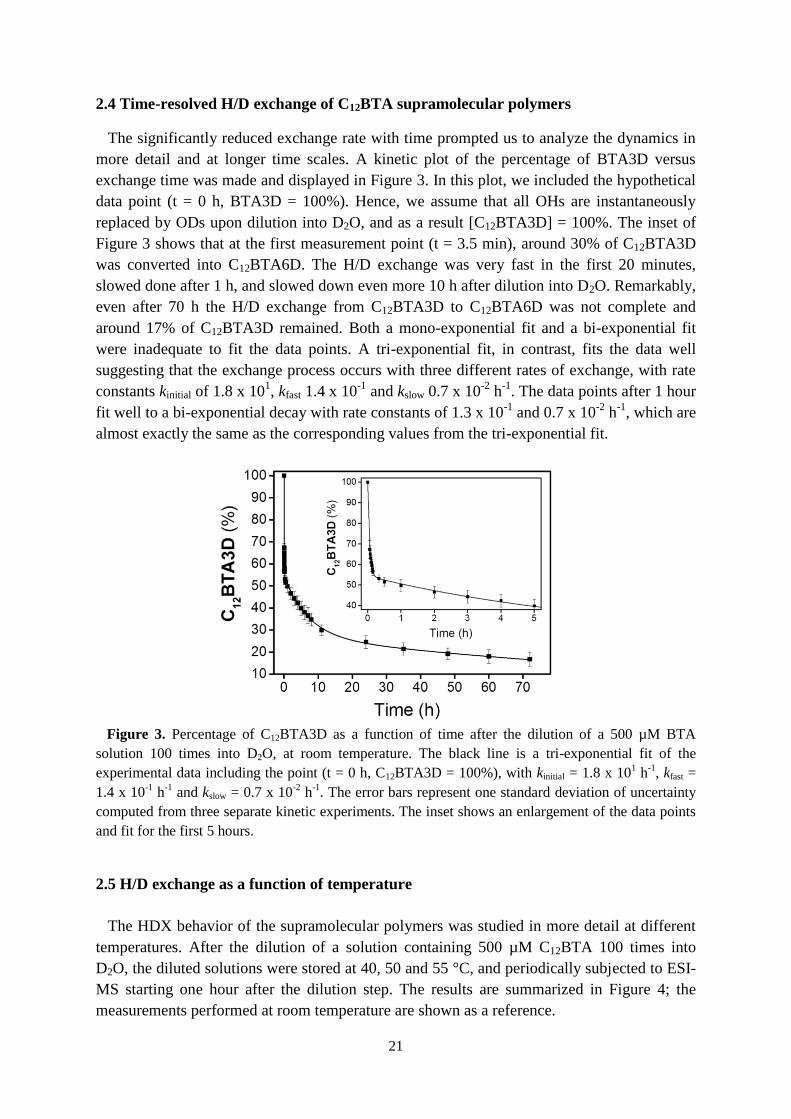
The significantly reduced exchange rate with time prompted us to analyze the dynamics in
more detail and at longer time scales. A kinetic plot of the percentage of BTA3D versus
exchange time was made and displayed in Figure 3. In this plot, we included the hypothetical
data point (t = 0 h, BTA3D = 100%). Hence, we assume that all OHs are instantaneously
replaced by ODs upon dilution into D2O, and as a result [C12BTA3D] = 100%. The inset of
Figure 3 shows that at the first measurement point (t = 3.5 min), around 30% of C12BTA3D
was converted into C12BTA6D. The H/D exchange was very fast in the first 20 minutes,
slowed done after 1 h, and slowed down even more 10 h after dilution into D2O. Remarkably,
even after 70 h the H/D exchange from C12BTA3D to C12BTA6D was not complete and
around 17% of C12BTA3D remained. Both a mono-exponential fit and a bi-exponential fit
were inadequate to fit the data points. A tri-exponential fit, in contrast, fits the data well
suggesting that the exchange process occurs with three different rates of exchange, with rate
constants kinitial of 1.8 x 101, kfast 1.4 x 10
-1 and kslow 0.7 x 10
-2 h
-1. The data points after 1 hour
fit well to a bi-exponential decay with rate constants of 1.3 x 10⁻¹
and 0.7 x 10⁻²
h-1
, which are
almost exactly the same as the corresponding values from the tri-exponential fit.
Figure 3. Percentage of C12BTA3D as a function of time after the dilution of a 500 µM BTA
solution 100 times into D2O, at room temperature. The black line is a tri-exponential fit of the
experimental data including the point (t = 0 h, C12BTA3D = 100%), with kinitial = 1.8 x 101 h
-1, kfast =
1.4 x 10⁻¹
h-1
and kslow = 0.7 x 10⁻²
h-1
. The error bars represent one standard deviation of uncertainty
computed from three separate kinetic experiments. The inset shows an enlargement of the data points
and fit for the first 5 hours.
2.5 H/D exchange as a function of temperature
The HDX behavior of the supramolecular polymers was studied in more detail at different
temperatures. After the dilution of a solution containing 500 µM C12BTA 100 times into
D2O, the diluted solutions were stored at 40, 50 and 55 °C, and periodically subjected to ESI-
MS starting one hour after the dilution step. The results are summarized in Figure 4; the
measurements performed at room temperature are shown as a reference.
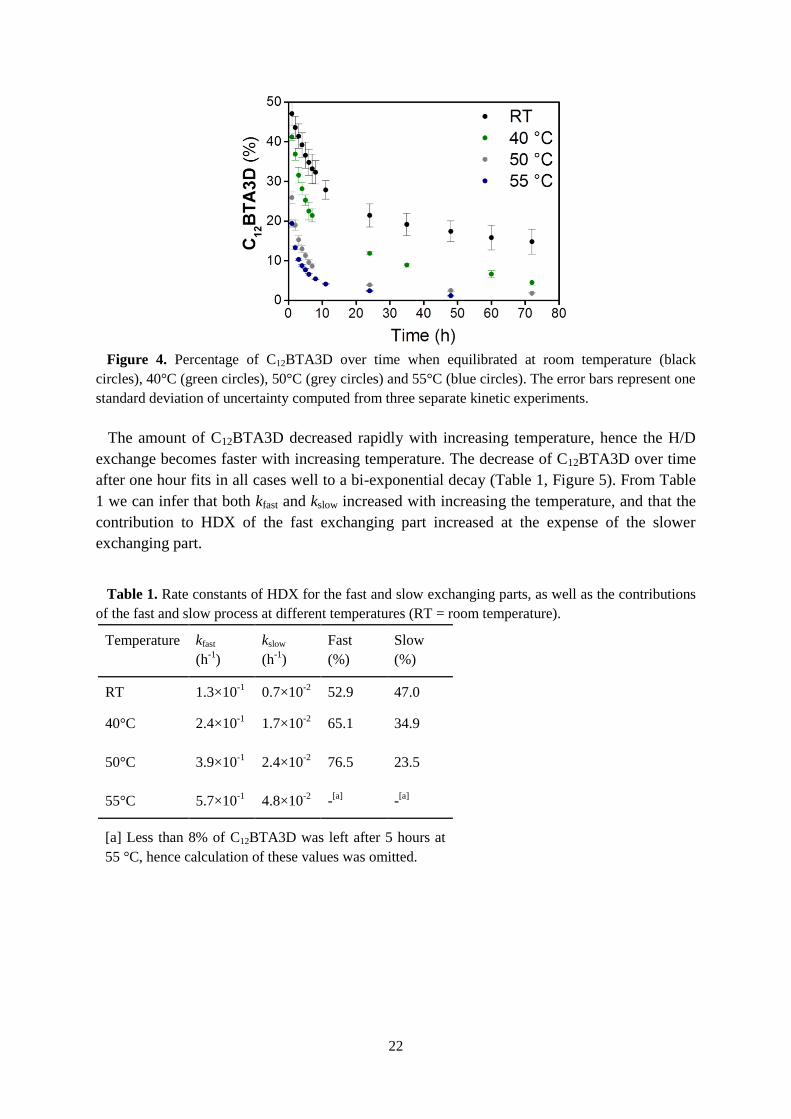
22
Figure 4. Percentage of C12BTA3D over time when equilibrated at room temperature (black
circles), 40°C (green circles), 50°C (grey circles) and 55°C (blue circles). The error bars represent one
standard deviation of uncertainty computed from three separate kinetic experiments.
The amount of C12BTA3D decreased rapidly with increasing temperature, hence the H/D
exchange becomes faster with increasing temperature. The decrease of C12BTA3D over time
after one hour fits in all cases well to a bi-exponential decay (Table 1, Figure 5). From Table
1 we can infer that both kfast and kslow increased with increasing the temperature, and that the
contribution to HDX of the fast exchanging part increased at the expense of the slower
exchanging part.
Table 1. Rate constants of HDX for the fast and slow exchanging parts, as well as the contributions
of the fast and slow process at different temperatures (RT = room temperature).
Temperature kfast
(h-1
)
kslow
(h-1
)
Fast
(%)
Slow
(%)
RT 1.3×10⁻¹
0.7×10⁻²
52.9 47.0
40°C
50°C
55°C
2.4×10⁻¹
3.9×10⁻¹
5.7×10⁻¹
1.7×10⁻²
2.4×10⁻²
4.8×10⁻²
65.1
76.5
-[a]
34.9
23.5
-[a]
[a] Less than 8% of C12BTA3D was left after 5 hours at
55 °C, hence calculation of these values was omitted.
23
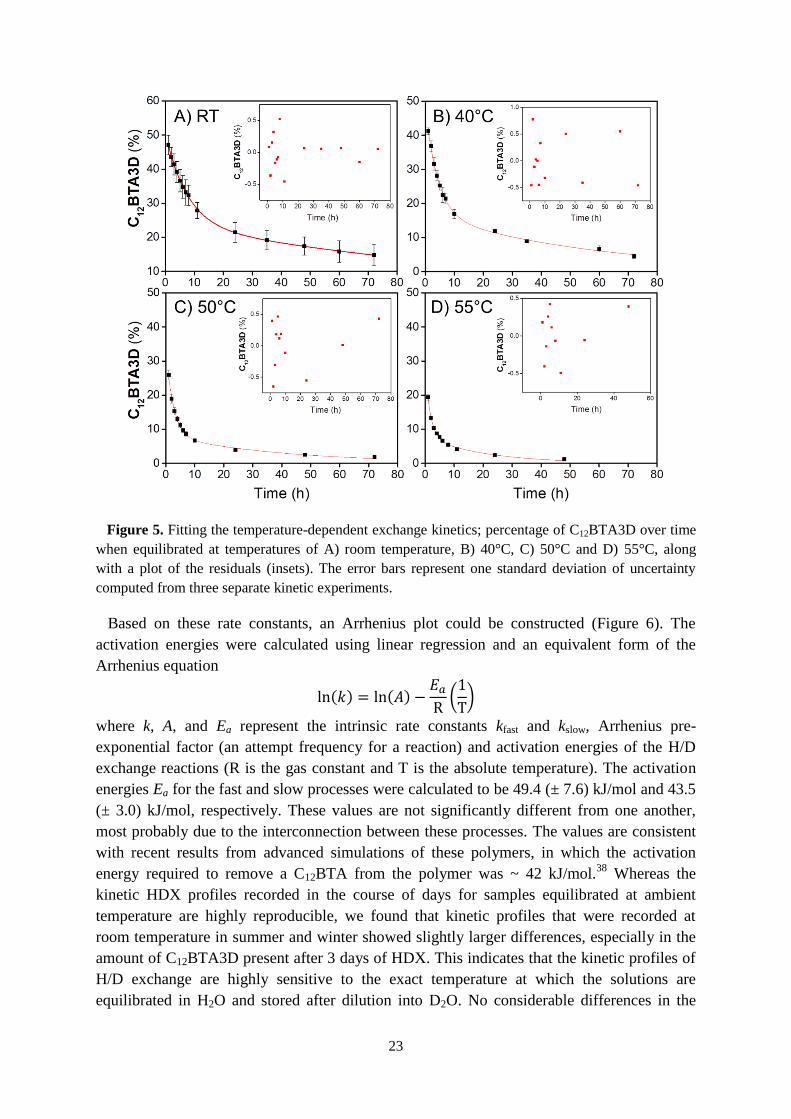
Figure 5. Fitting the temperature-dependent exchange kinetics; percentage of C12BTA3D over time
when equilibrated at temperatures of A) room temperature, B) 40°C, C) 50°C and D) 55°C, along
with a plot of the residuals (insets). The error bars represent one standard deviation of uncertainty
computed from three separate kinetic experiments.
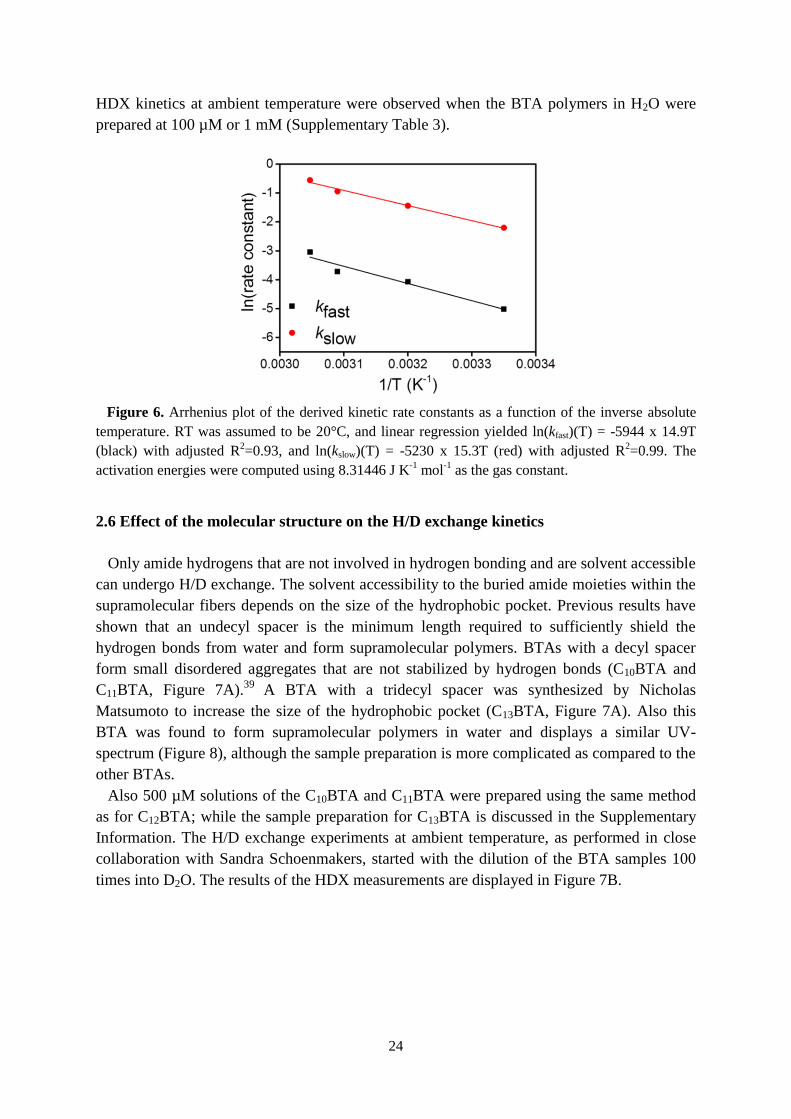
Based on these rate constants, an Arrhenius plot could be constructed (Figure 6). The
activation energies were calculated using linear regression and an equivalent form of the
Arrhenius equation
ln(𝑘) = ln(𝐴) −𝐸𝑎R(1
T)
where k, A, and Ea represent the intrinsic rate constants kfast and kslow, Arrhenius pre-
exponential factor (an attempt frequency for a reaction) and activation energies of the H/D
exchange reactions (R is the gas constant and T is the absolute temperature). The activation
energies Ea for the fast and slow processes were calculated to be 49.4 (± 7.6) kJ/mol and 43.5
(± 3.0) kJ/mol, respectively. These values are not significantly different from one another,
most probably due to the interconnection between these processes. The values are consistent
with recent results from advanced simulations of these polymers, in which the activation
energy required to remove a C12BTA from the polymer was ~ 42 kJ/mol.38
Whereas the
kinetic HDX profiles recorded in the course of days for samples equilibrated at ambient
temperature are highly reproducible, we found that kinetic profiles that were recorded at
room temperature in summer and winter showed slightly larger differences, especially in the
amount of C12BTA3D present after 3 days of HDX. This indicates that the kinetic profiles of
H/D exchange are highly sensitive to the exact temperature at which the solutions are
equilibrated in H2O and stored after dilution into D2O. No considerable differences in the
24
HDX kinetics at ambient temperature were observed when the BTA polymers in H2O were
prepared at 100 µM or 1 mM (Supplementary Table 3).
Figure 6. Arrhenius plot of the derived kinetic rate constants as a function of the inverse absolute
temperature. RT was assumed to be 20°C, and linear regression yielded ln(kfast)(T) = -5944 x 14.9T
(black) with adjusted R2=0.93, and ln(kslow)(T) = -5230 x 15.3T (red) with adjusted R
2=0.99. The
activation energies were computed using 8.31446 J K-1
mol-1
as the gas constant.
2.6 Effect of the molecular structure on the H/D exchange kinetics
Only amide hydrogens that are not involved in hydrogen bonding and are solvent accessible
can undergo H/D exchange. The solvent accessibility to the buried amide moieties within the
supramolecular fibers depends on the size of the hydrophobic pocket. Previous results have
shown that an undecyl spacer is the minimum length required to sufficiently shield the
hydrogen bonds from water and form supramolecular polymers. BTAs with a decyl spacer
form small disordered aggregates that are not stabilized by hydrogen bonds (C10BTA and
C11BTA, Figure 7A).39
A BTA with a tridecyl spacer was synthesized by Nicholas
Matsumoto to increase the size of the hydrophobic pocket (C13BTA, Figure 7A). Also this
BTA was found to form supramolecular polymers in water and displays a similar UV-
spectrum (Figure 8), although the sample preparation is more complicated as compared to the
other BTAs.
Also 500 µM solutions of the C10BTA and C11BTA were prepared using the same method
as for C12BTA; while the sample preparation for C13BTA is discussed in the Supplementary
Information. The H/D exchange experiments at ambient temperature, as performed in close
collaboration with Sandra Schoenmakers, started with the dilution of the BTA samples 100
times into D2O. The results of the HDX measurements are displayed in Figure 7B.
25
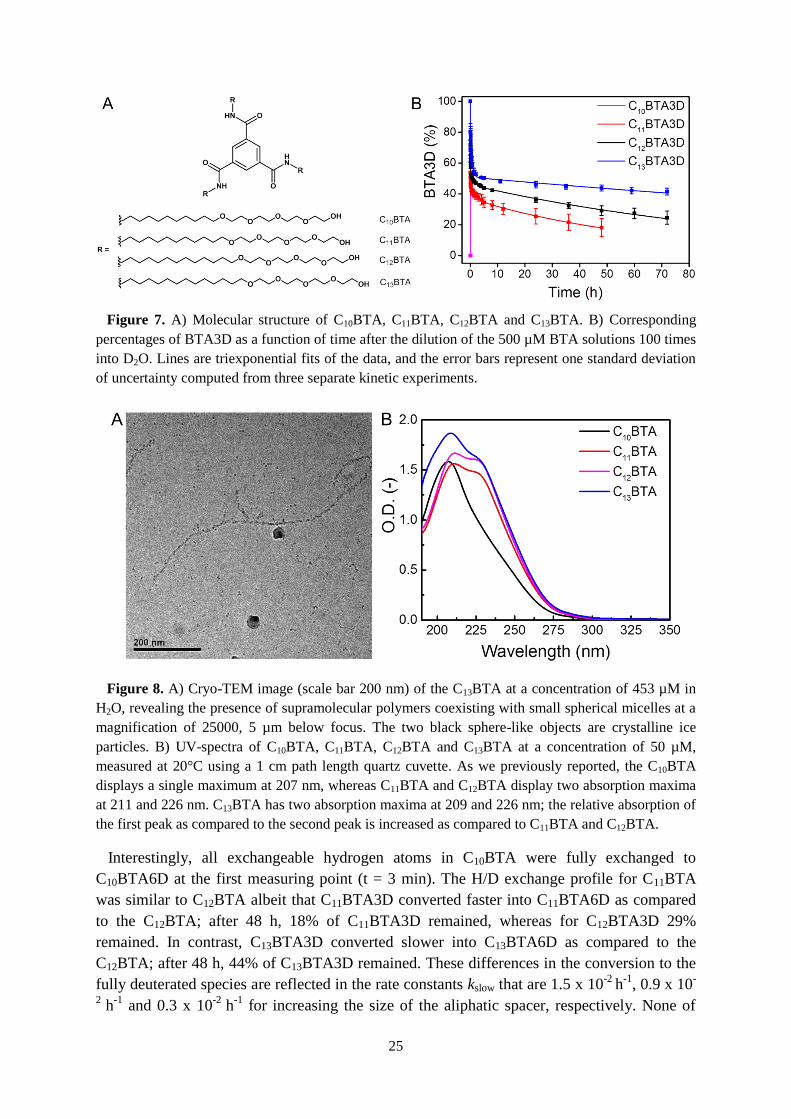
Figure 7. A) Molecular structure of C10BTA, C11BTA, C12BTA and C13BTA. B) Corresponding
percentages of BTA3D as a function of time after the dilution of the 500 µM BTA solutions 100 times
into D2O. Lines are triexponential fits of the data, and the error bars represent one standard deviation
of uncertainty computed from three separate kinetic experiments.
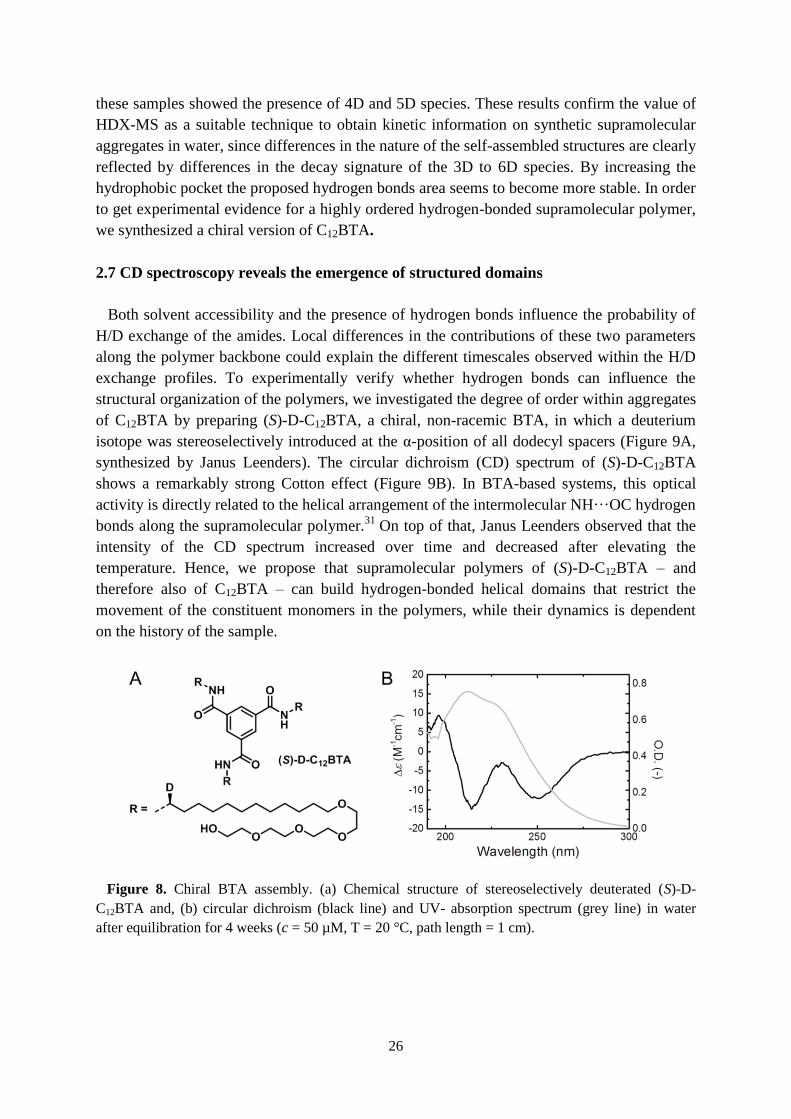
Figure 8. A) Cryo-TEM image (scale bar 200 nm) of the C13BTA at a concentration of 453 µM in
H2O, revealing the presence of supramolecular polymers coexisting with small spherical micelles at a
magnification of 25000, 5 µm below focus. The two black sphere-like objects are crystalline ice
particles. B) UV-spectra of C10BTA, C11BTA, C12BTA and C13BTA at a concentration of 50 µM,
measured at 20°C using a 1 cm path length quartz cuvette. As we previously reported, the C10BTA
displays a single maximum at 207 nm, whereas C11BTA and C12BTA display two absorption maxima
at 211 and 226 nm. C13BTA has two absorption maxima at 209 and 226 nm; the relative absorption of
the first peak as compared to the second peak is increased as compared to C11BTA and C12BTA.
Interestingly, all exchangeable hydrogen atoms in C10BTA were fully exchanged to
C10BTA6D at the first measuring point (t = 3 min). The H/D exchange profile for C11BTA
was similar to C12BTA albeit that C11BTA3D converted faster into C11BTA6D as compared
to the C12BTA; after 48 h, 18% of C11BTA3D remained, whereas for C12BTA3D 29%
remained. In contrast, C13BTA3D converted slower into C13BTA6D as compared to the
C12BTA; after 48 h, 44% of C13BTA3D remained. These differences in the conversion to the
fully deuterated species are reflected in the rate constants kslow that are 1.5 x 10⁻²
h-1
, 0.9 x 10-
2 h
-1 and 0.3 x 10
-2 h
-1 for increasing the size of the aliphatic spacer, respectively. None of
26
these samples showed the presence of 4D and 5D species. These results confirm the value of
HDX-MS as a suitable technique to obtain kinetic information on synthetic supramolecular
aggregates in water, since differences in the nature of the self-assembled structures are clearly
reflected by differences in the decay signature of the 3D to 6D species. By increasing the
hydrophobic pocket the proposed hydrogen bonds area seems to become more stable. In order
to get experimental evidence for a highly ordered hydrogen-bonded supramolecular polymer,
we synthesized a chiral version of C12BTA.
2.7 CD spectroscopy reveals the emergence of structured domains
Both solvent accessibility and the presence of hydrogen bonds influence the probability of
H/D exchange of the amides. Local differences in the contributions of these two parameters
along the polymer backbone could explain the different timescales observed within the H/D
exchange profiles. To experimentally verify whether hydrogen bonds can influence the
structural organization of the polymers, we investigated the degree of order within aggregates
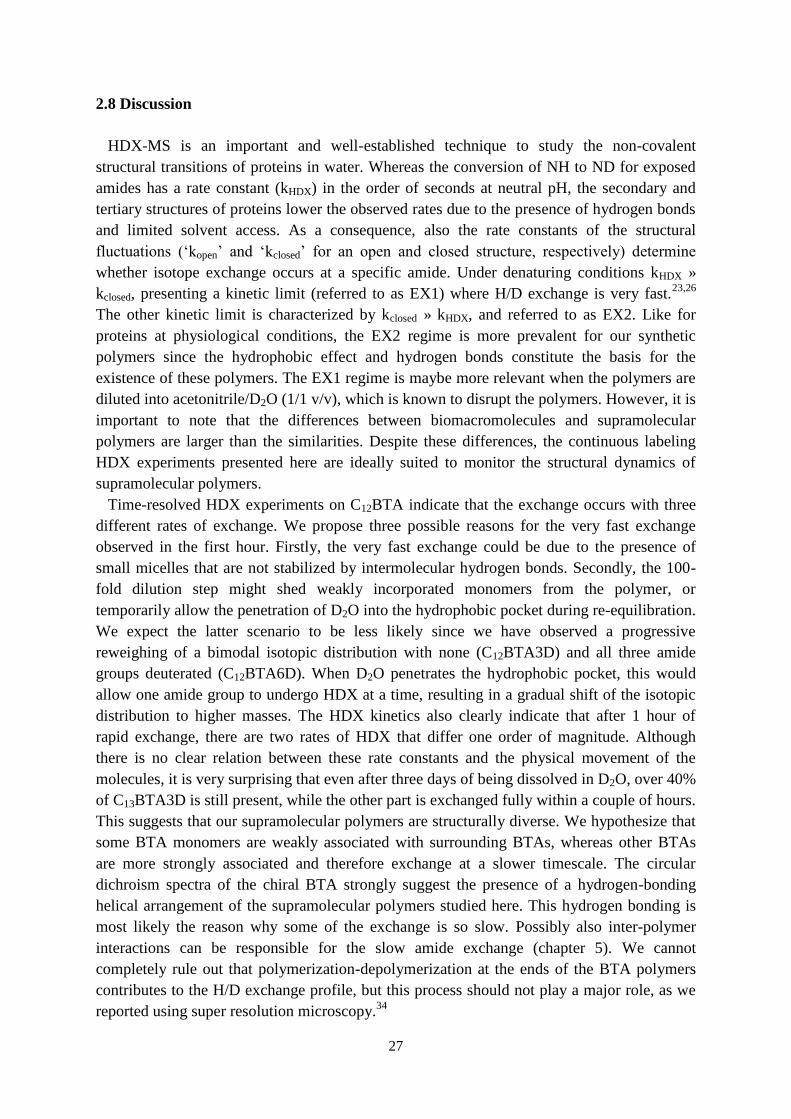
of C12BTA by preparing (S)-D-C12BTA, a chiral, non-racemic BTA, in which a deuterium
isotope was stereoselectively introduced at the α-position of all dodecyl spacers (Figure 9A,
synthesized by Janus Leenders). The circular dichroism (CD) spectrum of (S)-D-C12BTA
shows a remarkably strong Cotton effect (Figure 9B). In BTA-based systems, this optical
activity is directly related to the helical arrangement of the intermolecular NH···OC hydrogen
bonds along the supramolecular polymer.31
On top of that, Janus Leenders observed that the
intensity of the CD spectrum increased over time and decreased after elevating the
temperature. Hence, we propose that supramolecular polymers of (S)-D-C12BTA – and
therefore also of C12BTA – can build hydrogen-bonded helical domains that restrict the
movement of the constituent monomers in the polymers, while their dynamics is dependent
on the history of the sample.
Figure 8. Chiral BTA assembly. (a) Chemical structure of stereoselectively deuterated (S)-D-
C12BTA and, (b) circular dichroism (black line) and UV- absorption spectrum (grey line) in water
after equilibration for 4 weeks (c = 50 µM, T = 20 °C, path length = 1 cm).
27
2.8 Discussion
HDX-MS is an important and well-established technique to study the non-covalent
structural transitions of proteins in water. Whereas the conversion of NH to ND for exposed
amides has a rate constant (kHDX) in the order of seconds at neutral pH, the secondary and
tertiary structures of proteins lower the observed rates due to the presence of hydrogen bonds
and limited solvent access. As a consequence, also the rate constants of the structural
fluctuations (‘kopen’ and ‘kclosed’ for an open and closed structure, respectively) determine
whether isotope exchange occurs at a specific amide. Under denaturing conditions kHDX »
kclosed, presenting a kinetic limit (referred to as EX1) where H/D exchange is very fast.23,26
The other kinetic limit is characterized by kclosed » kHDX, and referred to as EX2. Like for
proteins at physiological conditions, the EX2 regime is more prevalent for our synthetic
polymers since the hydrophobic effect and hydrogen bonds constitute the basis for the
existence of these polymers. The EX1 regime is maybe more relevant when the polymers are
diluted into acetonitrile/D2O (1/1 v/v), which is known to disrupt the polymers. However, it is
important to note that the differences between biomacromolecules and supramolecular
polymers are larger than the similarities. Despite these differences, the continuous labeling
HDX experiments presented here are ideally suited to monitor the structural dynamics of
supramolecular polymers.
Time-resolved HDX experiments on C12BTA indicate that the exchange occurs with three
different rates of exchange. We propose three possible reasons for the very fast exchange
observed in the first hour. Firstly, the very fast exchange could be due to the presence of
small micelles that are not stabilized by intermolecular hydrogen bonds. Secondly, the 100-
fold dilution step might shed weakly incorporated monomers from the polymer, or
temporarily allow the penetration of D2O into the hydrophobic pocket during re-equilibration.
We expect the latter scenario to be less likely since we have observed a progressive
reweighing of a bimodal isotopic distribution with none (C12BTA3D) and all three amide
groups deuterated (C12BTA6D). When D2O penetrates the hydrophobic pocket, this would
allow one amide group to undergo HDX at a time, resulting in a gradual shift of the isotopic
distribution to higher masses. The HDX kinetics also clearly indicate that after 1 hour of
rapid exchange, there are two rates of HDX that differ one order of magnitude. Although
there is no clear relation between these rate constants and the physical movement of the
molecules, it is very surprising that even after three days of being dissolved in D2O, over 40%
of C13BTA3D is still present, while the other part is exchanged fully within a couple of hours.
This suggests that our supramolecular polymers are structurally diverse. We hypothesize that
some BTA monomers are weakly associated with surrounding BTAs, whereas other BTAs
are more strongly associated and therefore exchange at a slower timescale. The circular
dichroism spectra of the chiral BTA strongly suggest the presence of a hydrogen-bonding
helical arrangement of the supramolecular polymers studied here. This hydrogen bonding is
most likely the reason why some of the exchange is so slow. Possibly also inter-polymer
interactions can be responsible for the slow amide exchange (chapter 5). We cannot
completely rule out that polymerization-depolymerization at the ends of the BTA polymers
contributes to the H/D exchange profile, but this process should not play a major role, as we
reported using super resolution microscopy.34
28
The kinetic data are reproducible, although we have observed that small changes in the rate
constants kslow and kfast are sensitive to temperature and time of aging. This observation calls
for the importance of carefully monitoring and reporting the temperatures at which the
samples are equilibrated before and after the dilution step. This pronounced sensitivity is
likely due to the fact that with HDX-MS, all molecules present in solution are used for the
readout. When a molecular probe (e.g. spin label, dye) is employed, typically only a fraction
of the molecules is labeled and therefore analyzed. Previously we reported similar kinetic
profiles for C11BTA and C12BTA based on FRET experiments.39
Here, we have observed
clear differences in the HDX kinetics while gradually increasing the size of the aliphatic
spacer of the molecules in steps of one CH2 unit from C10BTA to C13BTA. These results
indicate that small changes in the molecular structure can be used to control the exchange
dynamics of a synthetic supramolecular polymer, and confirm that HDX-MS is a suitable
technique to obtain such kinetic information. Given the fact that the major advantage of a
supramolecular polymer as compared to a covalent polymer is its dynamic nature, we
anticipate that the ability to control the dynamics like we have shown here will be very
important for future investigations.
2.9 Conclusion
In conclusion, we demonstrated that HDX-MS is a powerful technique for probing the
dynamics of supramolecular polymers in water. Although it does not inherently provide
structural data, HDX-MS can provide detailed information at a molecular level for synthetic
supramolecular polymers without the limitations of introducing molecular labels. The
different rate constants observed reveal that the BTA polymers are dynamically diverse; the
ability of BTA monomers to move within or in and out of the supramolecular polymers is
likely a continuously changing variant over the entire polymer. We anticipate that the
observed dynamic diversity is not limited to the BTA polymers discussed here, and that
HDX-MS will be widely applied to characterize many other supramolecular structures, such
as bis-ureas, cyclohexyltrisamides, peptide amphiphiles and perylene bisimides.3-7
In chapter 3, we will report on our investigations on how the presence of a cosolvent in
water influences the dynamics of supramolecular polymers formed from C12BTA. Kinetic
UV-experiments are used to study how the cosolvent affects the polymerization and
depolymerization of the polymers, and time-resolved HDX experiments are used to
characterize their dynamics after equilibration. In chapter 4, we explore the feasibility of
preparing copolymers from the C10BTA with the other BTA polymers studied in this chapter.
In addition, we will devise a new HDX experiment suitable for studying the kinetics of
supramolecular copolymerization.
2.10 Experimental section and supplementary information
Instrumentation. HDX-MS measurements were carried out using a XevoTM
G2 QTof mass
spectrometer (Waters) with a capillary voltage of 2.7 kV and a cone voltage of 20 V. The source
temperature was set at 100°C, the desolvation temperature at 400°C, and the gas flow at 500 L/h. The
sample solutions subjected to HDX were introduced into the mass spectrometer using a Harvard
29
syringe pump (11 Plus, Harvard Apparatus) at a flow rate of 50 µL/min. CD measurements were
performed on a Jasco J-815 spectropolarimeter where the sensitivity, time constant and scan rate were
chosen appropriately. UV-vis absorbance spectra were recorded on a Jasco V-650 UV-vis
spectrometer equipped with a Jasco ETCT-762 temperature controller.
BTA sample preparation. The solid C12BTA was weighed into a glass vial. Deionized water
was added to the glass vial in order to obtain a concentration of 500 µM in H2O. The mixture was
subsequently stirred, using a magnetic stir bar, at a temperature of 80 °C for 15 minutes. The hot and
hazy mixture was vortexed for 15 seconds, and then left to equilibrate at room temperature overnight.
The sample was diluted 100 times in D2O (including 0.5 mM sodium acetate to facilitate detection)
using a balance, resulting in a concentration of 5 µM. The as-prepared BTA-solution was
subsequently stored either in an oven for H/D exchange at 40, 50 or 55 °C for the duration of the
experiment or at room temperature. Aliquots were periodically taken from the 5 µM solution and were
subjected to electrospray ionization mass spectrometry (ESI-MS). The sample preparation method for
C10BTA and C11BTA samples was identical. Because of its reduced water-solubility, the sample
preparation for C13BTA deviates. The solid C13BTA was weighed into a glass vial and deionized
water was subsequently added to this glass vial to obtain a concentration of 50 µM in H2O. The
mixture was then stirred using a magnetic stir bar at a temperature of 80°C for 15 minutes. The hot
and hazy mixture was vortexed for 15 seconds, and then left to equilibrate at room temperature
overnight. After performing a UV-absorption measurement of the C13BTA sample, a significant
amount of UV-absorption at wavelengths above 300 nm was observed. Since BTA-aggregates in
water usually do not absorb light in this region, this is probably due to not proper dissolution of the
C13BTA aggregates. Therefore, the C13BTA sample was filtered using a 0.2 µm syringe filter (Supor
membrane, PALL Corporation). Using a stream of N2 (g), water was evaporated from the sample to
increase the concentration for HDX-MS measurements. The final concentrations of the C13BTA
samples prepared for the exchange experiments were determined using calibration curves based on the
absorbance of C12BTA at 250 nm. The concentrations of the obtained C13BTA samples in H2O, before
the 100-fold dilution step, were 151 µM, 276 µM and 453 µM. As compared to the other BTAs, the
UV-absorption maximum at 209 nm is typically elevated relative to the UV-absorption maximum at
226 nm; a representative UV-spectrum is displayed in Figure 8B.
Calculating the percentage of C12BTA3D. Upon diluting a BTA-H2O solution 100 times
into D2O, C12BTA will quickly be transformed into C12BTA3D, because the hydrogens of the OH
groups of C12BTA will be instantaneously replaced by deuterium. Subsequently, HDX of the amide
groups will take place. When calculating the percentage of not exchanged C12BTA, the overlapping
isotopic peaks of C12BTA3D and C12BTA6D, and the presence of 1% H2O (w/w, with molar ratio of
1.1%), should be taken into account. As can be seen in Table S2, the base peak of [C12BTA3D +
2Na]2+
(with a peak intensity of I668.46) at m/z of 668.46 will result in an isotopic peak at m/z of 669.97
(with a peak intensity of 10.43% of I668.46, in bold), that will overlap with the base peak of [C12BTA6D
+ 2Na]2+
(in bold). Considering the presence of 1.1% (molar ratio) of H2O in a HDX solution, all
hydrogen atoms (3 OH and 3 NH) cannot be completely replaced by deuterium. Statistically, the
ratios of BTA4D : BTA5D : BTA6D are, 1.86×10⁻³
: 6.67×10⁻²
: 1. Although the amount of BTA4D
formed is negligible, the amount of BTA5D (6.6%) has to be taken into consideration when
calculating the percentage of C12BTA3D. Based on the discussion above, BTA3D% is calculated by
the following equation,
𝐵𝑇𝐴3𝐷% =𝐼668.46
𝐼668.46 + ((𝐼669.97 − 0.1043𝐼668.46) × 1.066)× 100
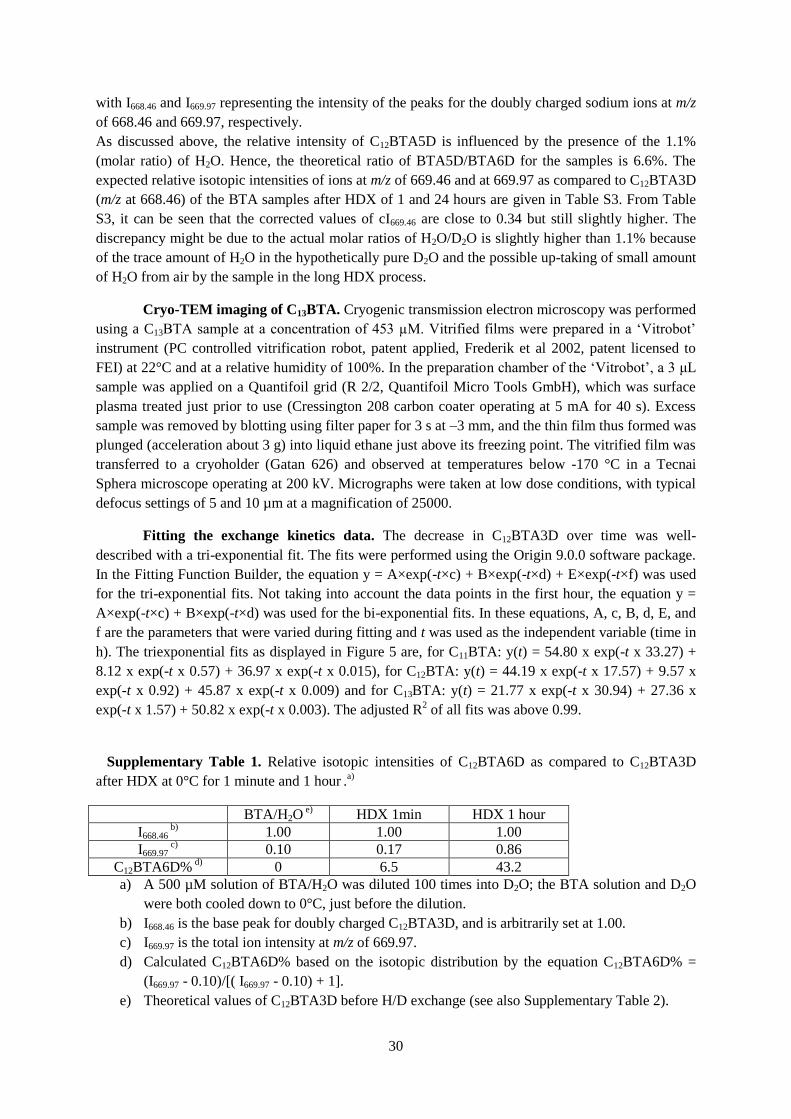
30
with I668.46 and I669.97 representing the intensity of the peaks for the doubly charged sodium ions at m/z
of 668.46 and 669.97, respectively.
As discussed above, the relative intensity of C12BTA5D is influenced by the presence of the 1.1%
(molar ratio) of H2O. Hence, the theoretical ratio of BTA5D/BTA6D for the samples is 6.6%. The
expected relative isotopic intensities of ions at m/z of 669.46 and at 669.97 as compared to C12BTA3D
(m/z at 668.46) of the BTA samples after HDX of 1 and 24 hours are given in Table S3. From Table
S3, it can be seen that the corrected values of cI669.46 are close to 0.34 but still slightly higher. The
discrepancy might be due to the actual molar ratios of H2O/D2O is slightly higher than 1.1% because
of the trace amount of H2O in the hypothetically pure D2O and the possible up-taking of small amount
of H2O from air by the sample in the long HDX process.
Cryo-TEM imaging of C13BTA. Cryogenic transmission electron microscopy was performed
using a C13BTA sample at a concentration of 453 µM. Vitrified films were prepared in a ‘Vitrobot’
instrument (PC controlled vitrification robot, patent applied, Frederik et al 2002, patent licensed to
FEI) at 22°C and at a relative humidity of 100%. In the preparation chamber of the ‘Vitrobot’, a 3 μL
sample was applied on a Quantifoil grid (R 2/2, Quantifoil Micro Tools GmbH), which was surface
plasma treated just prior to use (Cressington 208 carbon coater operating at 5 mA for 40 s). Excess
sample was removed by blotting using filter paper for 3 s at –3 mm, and the thin film thus formed was
plunged (acceleration about 3 g) into liquid ethane just above its freezing point. The vitrified film was
transferred to a cryoholder (Gatan 626) and observed at temperatures below -170 °C in a Tecnai
Sphera microscope operating at 200 kV. Micrographs were taken at low dose conditions, with typical
defocus settings of 5 and 10 µm at a magnification of 25000.
Fitting the exchange kinetics data. The decrease in C12BTA3D over time was well-
described with a tri-exponential fit. The fits were performed using the Origin 9.0.0 software package.
In the Fitting Function Builder, the equation y = A×exp(-t×c) + B×exp(-t×d) + E×exp(-t×f) was used
for the tri-exponential fits. Not taking into account the data points in the first hour, the equation y =
A×exp(-t×c) + B×exp(-t×d) was used for the bi-exponential fits. In these equations, A, c, B, d, E, and
f are the parameters that were varied during fitting and t was used as the independent variable (time in
h). The triexponential fits as displayed in Figure 5 are, for C11BTA: y(t) = 54.80 x exp(-t x 33.27) +
8.12 x exp(-t x 0.57) + 36.97 x exp(-t x 0.015), for C12BTA: y(t) = 44.19 x exp(-t x 17.57) + 9.57 x
exp(-t x 0.92) + 45.87 x exp(-t x 0.009) and for C13BTA: y(t) = 21.77 x exp(-t x 30.94) + 27.36 x
exp(-t x 1.57) + 50.82 x exp(-t x 0.003). The adjusted R2 of all fits was above 0.99.
Supplementary Table 1. Relative isotopic intensities of C12BTA6D as compared to C12BTA3D
after HDX at 0°C for 1 minute and 1 hour .a)
BTA/H2O e)
HDX 1min HDX 1 hour
I668.46 b)
1.00 1.00 1.00
I669.97 c)
0.10 0.17 0.86
C12BTA6D% d)
0 6.5 43.2
a) A 500 µM solution of BTA/H2O was diluted 100 times into D2O; the BTA solution and D2O
were both cooled down to 0°C, just before the dilution.
b) I668.46 is the base peak for doubly charged C12BTA3D, and is arbitrarily set at 1.00.
c) I669.97 is the total ion intensity at m/z of 669.97.
d) Calculated C12BTA6D% based on the isotopic distribution by the equation C12BTA6D% =
(I669.97 - 0.10)/[( I669.97 - 0.10) + 1].
e) Theoretical values of C12BTA3D before H/D exchange (see also Supplementary Table 2).
31
Supplementary Table 2. Theoretical isotopic distributions of doubly charged sodiated C12BTA,
C12BTA3D and C12BTA6D ions. These calculations were performed using IsoPro Software. The
isotopic distribution of [C12BTA + 2Na]2+
is displayed in Fig. 2b (the green spectrum).
C12BTA
[(C69H129N3O18) + 2Na]2+
C12BTA3D
[(C69H126N3O18D3) + 2Na]2+
C12BTA6D
[(C69H123N3O18D6) + 2Na]2+
Mass abundance mass abundance mass abundance
666.95 100.00 668.46 100.00 669.97 100.00
667.45 77.86 668.96 77.86 670.47 77.86
667.96 33.60 669.46 33.60 670.97 33.60
668.46 10.43 669.97 10.43 671.47 10.43
668.96 2.58 670.47 2.58 671.98 2.58
Supplementary Table 3. C12BTA3D% after HDX of BTA-based supramolecular polymers at
different concentrationsa).
HDX time 1 mM b)
0.5 mM b)
0.1 mM b)
5 min 58.5 57.1 58.4
30 min 47.8 47.5 45.5
1 hour 46.2 46.4 44.7
24 hour 36.0 34.9 36.3
a) The BTA samples prepared in H2O were diluted 100 times into D2O.
b) Concentrations of the BTA-H2O solutions, all prepared according to the method described
above.
2.11 References
(1) Aida, T.; Meijer, E. W.; Stupp, S. I. Science 2012, 335, 813. (2) Boekhoven, J.; Stupp, S. I. Advanced Materials 2014, 26, 1642. (3) Görl, D.; Zhang, X.; Würthner, F. Angewandte Chemie International Edition 2012, 51, 6328. (4) Obert, E.; Bellot, M.; Bouteiller, L.; Andrioletti, F.; Lehen-Ferrenbach, C.; Boué, F. Journal of
the American Chemical Society 2007, 129, 15601. (5) Chebotareva, N.; Bomans, P. H. H.; Frederik, P. M.; Sommerdijk, N. A. J. M.; Sijbesma, R. P.
Chemical communications 2005, 4967. (6) Heeres, A.; van der Pol, C.; Stuart, M.; Friggeri, A.; Feringa, B. L.; van Esch, J. Journal of the
American Chemical Society 2003, 125, 14252. (7) Hartgerink, J. D.; Beniash, E.; Stupp, S. I. Proceedings of the National Academy of Sciences
2002, 99, 5133. (8) Jonkheijm, P.; Fransen, M.; Schenning, A. P. H. J.; Meijer, E. W. Journal of the Chemical
Society, Perkin Transactions 2 2001, 1280. (9) Brunsveld, L.; Lohmeijer, B. G. G.; Vekemans, J. A. J. M.; Meijer, E. W. Chemical
communications 2000, 2305. (10) Kroon, J. M.; B. M. Koehorst, R.; van Dijk, M.; Sanders, G. M.; J. R. Sudholter, E. Journal of
Materials Chemistry 1997, 7, 615. (11) Ogi, S.; Sugiyasu, K.; Manna, S.; Samitsu, S.; Takeuchi, M. Nature Chemistry 2014, 6, 188. (12) Korevaar, P. A.; George, S. J.; Markvoort, A. J.; Smulders, M. M. J.; Hilbers, P. A. J.; Schenning,
A. P. H. J.; De Greef, T. F. A.; Meijer, E. W. Nature 2012, 481, 492.
32
(13) Carnall, J. M. A.; Waudby, C. A.; Belenguer, A. M.; Stuart, M. C. A.; Peyralans, J. J.-P.; Otto, S. Science 2010, 327, 1502.
(14) Görl, D.; Zhang, X.; Stepanenko, V.; Würthner, F. Nature Communications 2015, 6. (15) Kang, J.; Miyajima, D.; Mori, T.; Inoue, Y.; Itoh, Y.; Aida, T. Science 2015, 347, 646. (16) van der Zwaag, D.; Pieters, P. A.; Korevaar, P. A.; Markvoort, A. J.; Spiering, A. J. H.; de Greef,
T. F. A.; Meijer, E. W. Journal of the American Chemical Society 2015, 137, 12677. (17) Korevaar, P. A.; Newcomb, C. J.; Meijer, E. W.; Stupp, S. I. Journal of the American Chemical
Society 2014, 136, 8540. (18) Ortony, J. H.; Newcomb, C. J.; Matson, J. B.; Palmer, L. C.; Doan, P. E.; Hoffman, B. M.; Stupp,
S. I. Nature Materials 2014, 13, 812. (19) Katta, V.; Chait, B. T. Rapid communications in mass spectrometry : RCM 1991, 5, 214. (20) Miranker, A.; Robinson, C.; Radford, S.; Aplin, R.; Dobson, C. Science 1993, 262, 896. (21) Zhang, Z.; Smith, D. L. Protein Science 1993, 2, 522. (22) Bai, Y.; Sosnick, T.; Mayne, L.; Englander, S. Science 1995, 269, 192. (23) Smith, D. L.; Deng, Y.; Zhang, Z. Journal of Mass Spectrometry 1997, 32, 135. (24) Wales, T. E.; Engen, J. R. Mass spectrometry reviews 2006, 25, 158. (25) Englander, S. W. Annual Review of Biophysics and Biomolecular Structure 2000, 29, 213. (26) Konermann, L.; Pan, J.; Liu, Y.-H. Chemical Society Reviews 2011, 40, 1224. (27) Carulla, N.; Caddy, G. L.; Hall, D. R.; Zurdo, J.; Gairi, M.; Feliz, M.; Giralt, E.; Robinson, C. V.;
Dobson, C. M. Nature 2005, 436, 554. (28) Carulla, N.; Zhou, M.; Arimon, M.; Gairí, M.; Giralt, E.; Robinson, C. V.; Dobson, C. M.
Proceedings of the National Academy of Sciences 2009, 106, 7828. (29) Zhang, Y.; Rempel, D. L.; Zhang, J.; Sharma, A. K.; Mirica, L. M.; Gross, M. L. Proceedings of
the National Academy of Sciences 2013, 110, 14604. (30) Qi, Z.; Schlaich, C.; Schalley, C. A. Chemistry – A European Journal 2013, 19, 14867. (31) Leenders, C. M.; Albertazzi, L.; Mes, T.; Koenigs, M. M.; Palmans, A. R.; Meijer, E. W.
Chemical communications 2013, 49, 1963. (32) Baker, M. B.; Albertazzi, L.; Voets, I. K.; Leenders, C. M. A.; Palmans, A. R. A.; Pavan, G. M.;
Meijer, E. W. Nature Communications 2015, 6. (33) Albertazzi, L.; Martinez-Veracoechea, F. J.; Leenders, C. M. A.; Voets, I. K.; Frenkel, D.; Meijer,
E. W. Proceedings of the National Academy of Sciences 2013, 110, 12203. (34) Albertazzi, L.; van der Zwaag, D.; Leenders, C. M. A.; Fitzner, R.; van der Hofstad, R. W.;
Meijer, E. W. Science 2014, 344, 491. (35) Bai, Y.; Milne, J. S.; Mayne, L.; Englander, S. W. Proteins: Structure, Function, and
Bioinformatics 1993, 17, 75. (36) Hoshino, M.; Katou, H.; Yamaguchi, K.-i.; Goto, Y. Biochimica et Biophysica Acta (BBA) -
Biomembranes 2007, 1768, 1886. (37) Smulders, M. M. J.; Schenning, A. P. H. J.; Meijer, E. W. Journal of the American Chemical
Society 2008, 130, 606. (38) Bochicchio, D.; Salvalaglio, M.; Pavan, G. M. Nature Communications 2017, 8, 147. (39) Leenders, C. M. A.; Baker, M. B.; Pijpers, I. A. B.; Lafleur, R. P. M.; Albertazzi, L.; Palmans, A.
R. A.; Meijer, E. W. Soft Matter 2016, 12, 2887.
33
Chapter 3
Consequences of a cosolvent on the molecular dynamics of a
supramolecular polymer
Abstract:
Cosolvents are commonly used to perform self-assembly in water. In this chapter we
investigate the influence of a cosolvent on the stability and dynamics of a supramolecular
polymer in water. The gradual increase in the amount of the cosolvent results in an abrupt
change in the morphology of the supramolecular polymers at a critical cosolvent fraction. In
contrast, it causes a gradual increase in the dynamics of the polymers. By using different
mixing strategies to prepare the polymers, the influence of the cosolvent on the assembly and
disassembly of the polymers is studied. It is shown that the monomers rapidly assemble in
water upon injection from the good solvent. Due to their strong association we observe an
interesting kinetic response of the polymers when their disassembly was encouraged upon
adding the good solvent. We observe that the longest equilibration time occurs at the critical
solvent fraction. Molecular dynamics simulations are presented to compare the molecular
dynamics of the polymers in pure water, to the dynamics of the polymers in the presence of
cosolvent. The detailed analysis provides a molecular rationale for the kinetic phenomena in
terms of the hydrophobic and hydrogen bond interactions that are involved in the assembly of
the polymers. The results show the importance of the solution conditions during the non-
covalent synthesis of supramolecular polymers, as well as after their preparation.
34
3.1 Introduction
In recent years many small molecules have been synthesized that can self-assemble to form
one-dimensional supramolecular polymers in water and biomedical applications employing
these polymers have started to emerge.1-3
The non-covalent interactions between the
monomers is the key feature of supramolecular polymers that gives rise to interesting
properties such as stimuli-responsiveness and environmental adaptation.4 As a consequence
of the non-covalent interactions, supramolecular polymers are dynamic entities where
monomers can associate or dissociate at any given point in time. The extent to which
monomers are able to move within or between supramolecular polymers determines the
ability of the polymers, or the materials formed thereof, to adapt to changes in their
environment. The future development of these polymers for biomedical applications will
therefore heavily rely on the characterization of, and ultimately gaining the control over, the
kinetic properties of supramolecular polymers in water.
The majority of small synthetic building blocks that are prepared with the aim of forming
supramolecular polymers in water are amphiphiles, i.e. they contain a hydrophobic part as
well as a hydrophilic part.3 Typically, these amphiphiles cannot be directly combined with
water to form supramolecular polymers. To perform non-covalent synthesis in water, the
monomers are often first dissolved in a good solvent and are subsequently transferred to
water. This methodology is not limited to small supramolecular building blocks,5,6
it is also a
well-established method to assemble block copolymers in water,7-10
and central to the more
recently discovered aggregation-induced emission fluorogens.11-13
The solution conditions
that are temporarily encountered during such a non-covalent synthesis protocol can have a
profound influence on the supramolecular architectures that are formed.14-16
To control a non-
covalent synthesis in water towards the target architectures, it is therefore important to
consider the consequences of the cosolvent on the supramolecular kinetics.
The solvent composition has been shown to influence the architecture of supramolecular
nanostructures in equilibrated solutions.17-21
In addition, experimental studies have
highlighted the time-dependence of these morphological transformations.15,22,23
The cosolvent
dependent time evolution of these transformations was studied using spectroscopic
measurements like UV – visible absorption and circular dichroism, and recently also using
fluorescence.24
Kinetic and coarse-grained models were developed and qualitatively capture
the experimental observations.25,26
Kinetic studies on morphologically equilibrated
supramolecular aggregates were performed in the absence of a good solvent, or in the
presence of marginal amounts thereof. These studies focused either on the internal dynamics
of the aggregates using electron paramagnetic resonance spectroscopy,27
or the exchange of
molecules between the supramolecular aggregates using fluorescence spectroscopy28-30
or
stochastic optical reconstruction microscopy.31
In chapter 2, to circumvent the influence of
attached probes like fluorescent dyes on the molecular movements, and to be able to reveal
the kinetics of all molecules present in the solution, we introduced the hydrogen/deuterium
exchange mass spectrometry (HDX-MS) method as a novel approach.
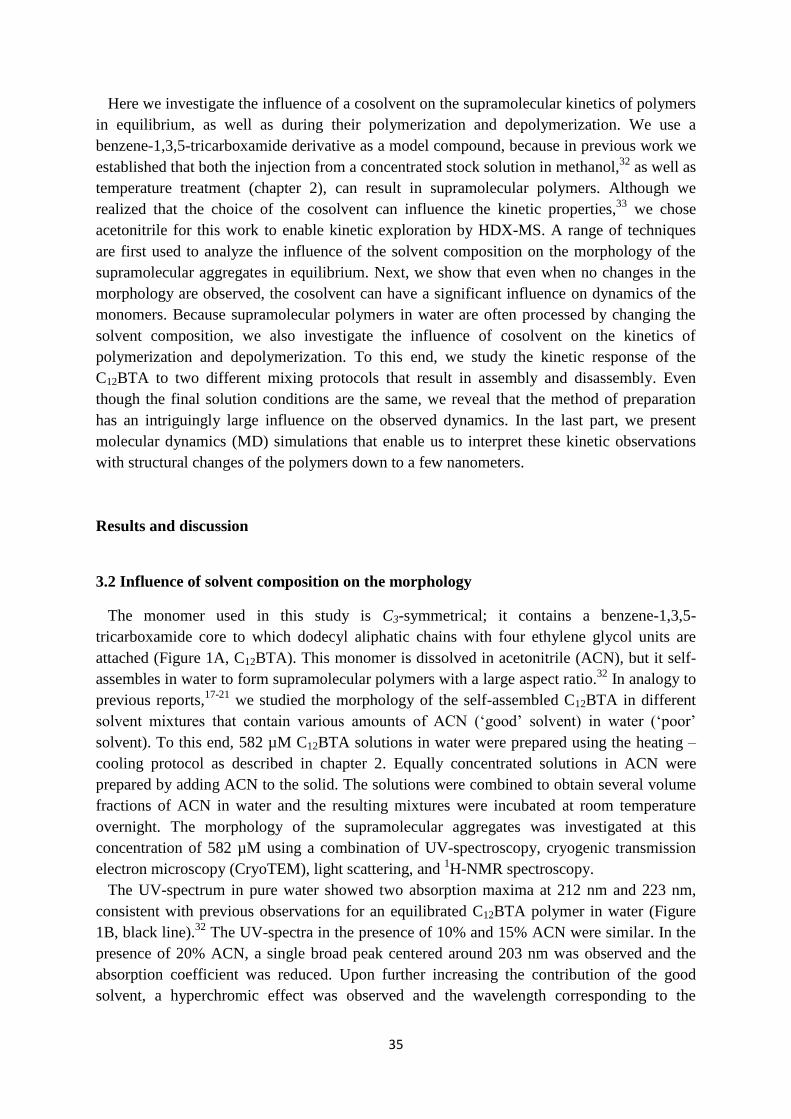
35
Here we investigate the influence of a cosolvent on the supramolecular kinetics of polymers
in equilibrium, as well as during their polymerization and depolymerization. We use a
benzene-1,3,5-tricarboxamide derivative as a model compound, because in previous work we
established that both the injection from a concentrated stock solution in methanol,32
as well as
temperature treatment (chapter 2), can result in supramolecular polymers. Although we
realized that the choice of the cosolvent can influence the kinetic properties,33
we chose
acetonitrile for this work to enable kinetic exploration by HDX-MS. A range of techniques
are first used to analyze the influence of the solvent composition on the morphology of the
supramolecular aggregates in equilibrium. Next, we show that even when no changes in the
morphology are observed, the cosolvent can have a significant influence on dynamics of the
monomers. Because supramolecular polymers in water are often processed by changing the
solvent composition, we also investigate the influence of cosolvent on the kinetics of
polymerization and depolymerization. To this end, we study the kinetic response of the
C12BTA to two different mixing protocols that result in assembly and disassembly. Even
though the final solution conditions are the same, we reveal that the method of preparation
has an intriguingly large influence on the observed dynamics. In the last part, we present
molecular dynamics (MD) simulations that enable us to interpret these kinetic observations
with structural changes of the polymers down to a few nanometers.
Results and discussion
3.2 Influence of solvent composition on the morphology
The monomer used in this study is C3-symmetrical; it contains a benzene-1,3,5-
tricarboxamide core to which dodecyl aliphatic chains with four ethylene glycol units are
attached (Figure 1A, C12BTA). This monomer is dissolved in acetonitrile (ACN), but it self-
assembles in water to form supramolecular polymers with a large aspect ratio.32
In analogy to
previous reports,17-21
we studied the morphology of the self-assembled C12BTA in different
solvent mixtures that contain various amounts of ACN (‘good’ solvent) in water (‘poor’
solvent). To this end, 582 µM C12BTA solutions in water were prepared using the heating –
cooling protocol as described in chapter 2. Equally concentrated solutions in ACN were
prepared by adding ACN to the solid. The solutions were combined to obtain several volume
fractions of ACN in water and the resulting mixtures were incubated at room temperature
overnight. The morphology of the supramolecular aggregates was investigated at this
concentration of 582 µM using a combination of UV-spectroscopy, cryogenic transmission
electron microscopy (CryoTEM), light scattering, and 1H-NMR spectroscopy.
The UV-spectrum in pure water showed two absorption maxima at 212 nm and 223 nm,
consistent with previous observations for an equilibrated C12BTA polymer in water (Figure
1B, black line).32
The UV-spectra in the presence of 10% and 15% ACN were similar. In the
presence of 20% ACN, a single broad peak centered around 203 nm was observed and the
absorption coefficient was reduced. Upon further increasing the contribution of the good
solvent, a hyperchromic effect was observed and the wavelength corresponding to the
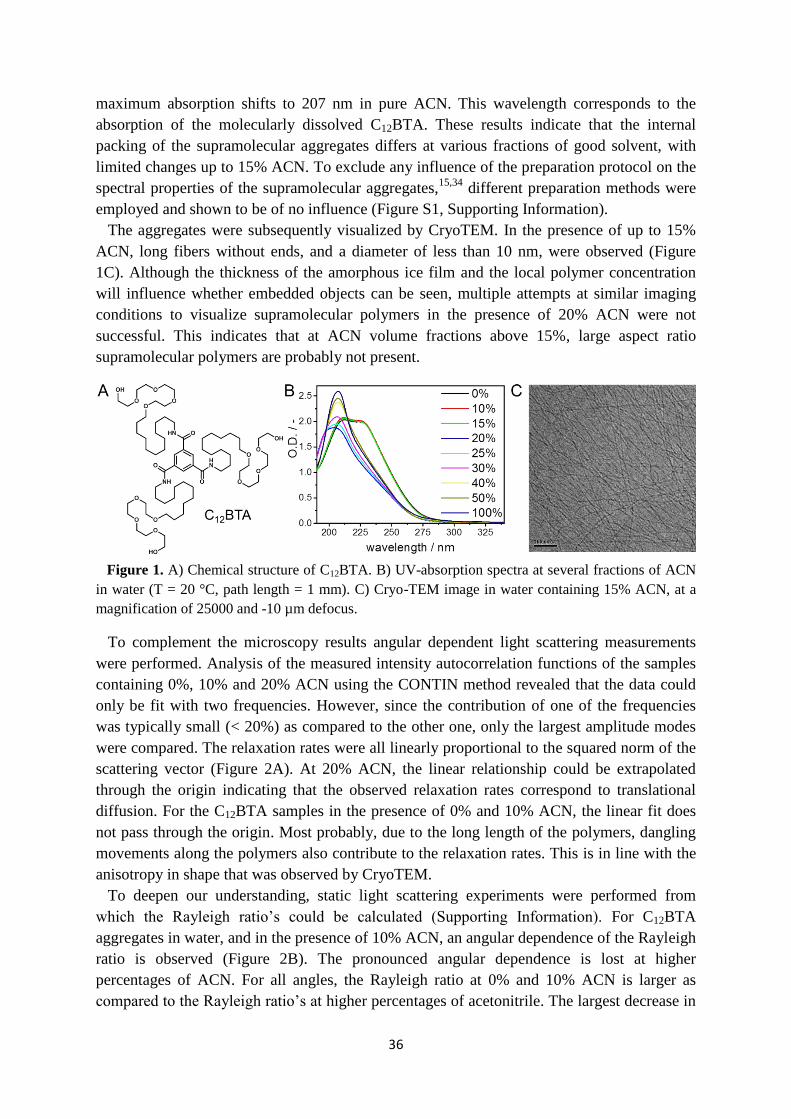
36
maximum absorption shifts to 207 nm in pure ACN. This wavelength corresponds to the
absorption of the molecularly dissolved C12BTA. These results indicate that the internal
packing of the supramolecular aggregates differs at various fractions of good solvent, with
limited changes up to 15% ACN. To exclude any influence of the preparation protocol on the
spectral properties of the supramolecular aggregates,15,34
different preparation methods were
employed and shown to be of no influence (Figure S1, Supporting Information).
The aggregates were subsequently visualized by CryoTEM. In the presence of up to 15%
ACN, long fibers without ends, and a diameter of less than 10 nm, were observed (Figure
1C). Although the thickness of the amorphous ice film and the local polymer concentration
will influence whether embedded objects can be seen, multiple attempts at similar imaging
conditions to visualize supramolecular polymers in the presence of 20% ACN were not
successful. This indicates that at ACN volume fractions above 15%, large aspect ratio
supramolecular polymers are probably not present.
Figure 1. A) Chemical structure of C12BTA. B) UV-absorption spectra at several fractions of ACN
in water (T = 20 °C, path length = 1 mm). C) Cryo-TEM image in water containing 15% ACN, at a
magnification of 25000 and -10 µm defocus.
To complement the microscopy results angular dependent light scattering measurements
were performed. Analysis of the measured intensity autocorrelation functions of the samples
containing 0%, 10% and 20% ACN using the CONTIN method revealed that the data could
only be fit with two frequencies. However, since the contribution of one of the frequencies
was typically small (< 20%) as compared to the other one, only the largest amplitude modes
were compared. The relaxation rates were all linearly proportional to the squared norm of the
scattering vector (Figure 2A). At 20% ACN, the linear relationship could be extrapolated
through the origin indicating that the observed relaxation rates correspond to translational
diffusion. For the C12BTA samples in the presence of 0% and 10% ACN, the linear fit does
not pass through the origin. Most probably, due to the long length of the polymers, dangling
movements along the polymers also contribute to the relaxation rates. This is in line with the
anisotropy in shape that was observed by CryoTEM.
To deepen our understanding, static light scattering experiments were performed from
which the Rayleigh ratio’s could be calculated (Supporting Information). For C12BTA
aggregates in water, and in the presence of 10% ACN, an angular dependence of the Rayleigh
ratio is observed (Figure 2B). The pronounced angular dependence is lost at higher
percentages of ACN. For all angles, the Rayleigh ratio at 0% and 10% ACN is larger as
compared to the Rayleigh ratio’s at higher percentages of acetonitrile. The largest decrease in
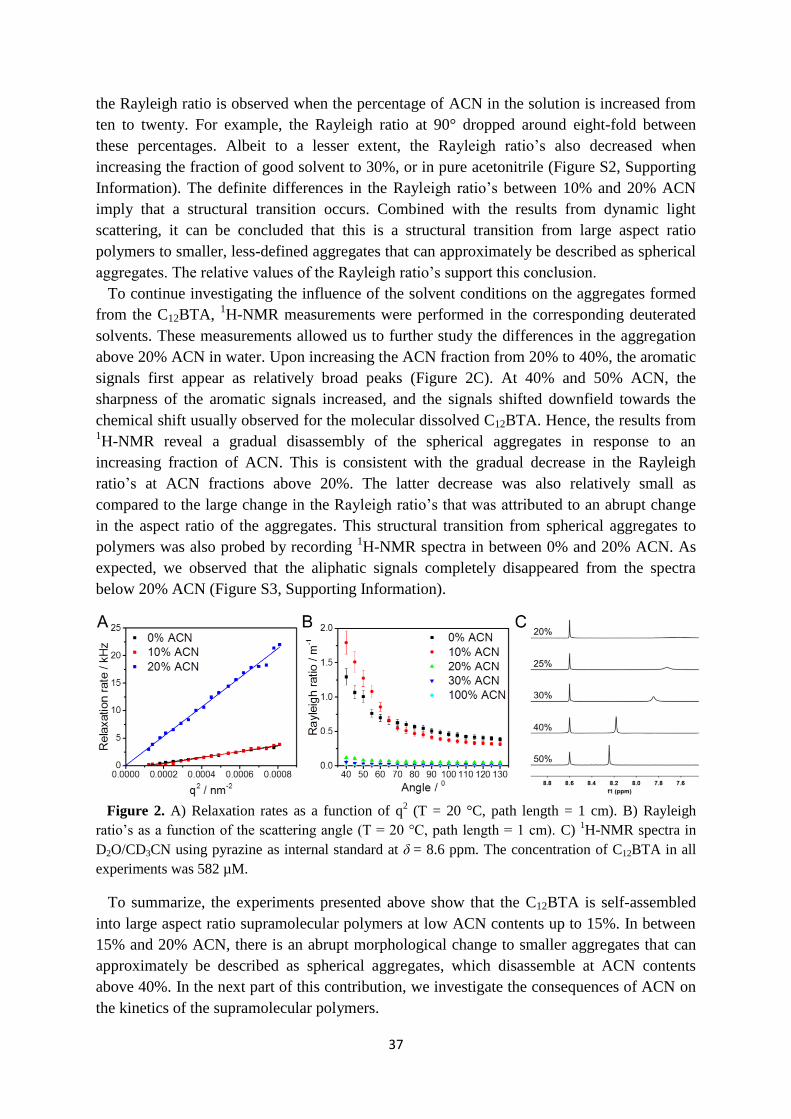
37
the Rayleigh ratio is observed when the percentage of ACN in the solution is increased from
ten to twenty. For example, the Rayleigh ratio at 90° dropped around eight-fold between
these percentages. Albeit to a lesser extent, the Rayleigh ratio’s also decreased when
increasing the fraction of good solvent to 30%, or in pure acetonitrile (Figure S2, Supporting
Information). The definite differences in the Rayleigh ratio’s between 10% and 20% ACN
imply that a structural transition occurs. Combined with the results from dynamic light
scattering, it can be concluded that this is a structural transition from large aspect ratio
polymers to smaller, less-defined aggregates that can approximately be described as spherical
aggregates. The relative values of the Rayleigh ratio’s support this conclusion.
To continue investigating the influence of the solvent conditions on the aggregates formed
from the C12BTA, 1H-NMR measurements were performed in the corresponding deuterated
solvents. These measurements allowed us to further study the differences in the aggregation
above 20% ACN in water. Upon increasing the ACN fraction from 20% to 40%, the aromatic
signals first appear as relatively broad peaks (Figure 2C). At 40% and 50% ACN, the
sharpness of the aromatic signals increased, and the signals shifted downfield towards the
chemical shift usually observed for the molecular dissolved C12BTA. Hence, the results from 1H-NMR reveal a gradual disassembly of the spherical aggregates in response to an
increasing fraction of ACN. This is consistent with the gradual decrease in the Rayleigh
ratio’s at ACN fractions above 20%. The latter decrease was also relatively small as
compared to the large change in the Rayleigh ratio’s that was attributed to an abrupt change
in the aspect ratio of the aggregates. This structural transition from spherical aggregates to
polymers was also probed by recording 1H-NMR spectra in between 0% and 20% ACN. As
expected, we observed that the aliphatic signals completely disappeared from the spectra
below 20% ACN (Figure S3, Supporting Information).
Figure 2. A) Relaxation rates as a function of q2 (T = 20 °C, path length = 1 cm). B) Rayleigh
ratio’s as a function of the scattering angle (T = 20 °C, path length = 1 cm). C) 1H-NMR spectra in
D2O/CD3CN using pyrazine as internal standard at δ = 8.6 ppm. The concentration of C12BTA in all
experiments was 582 µM.
To summarize, the experiments presented above show that the C12BTA is self-assembled
into large aspect ratio supramolecular polymers at low ACN contents up to 15%. In between
15% and 20% ACN, there is an abrupt morphological change to smaller aggregates that can
approximately be described as spherical aggregates, which disassemble at ACN contents
above 40%. In the next part of this contribution, we investigate the consequences of ACN on
the kinetics of the supramolecular polymers.
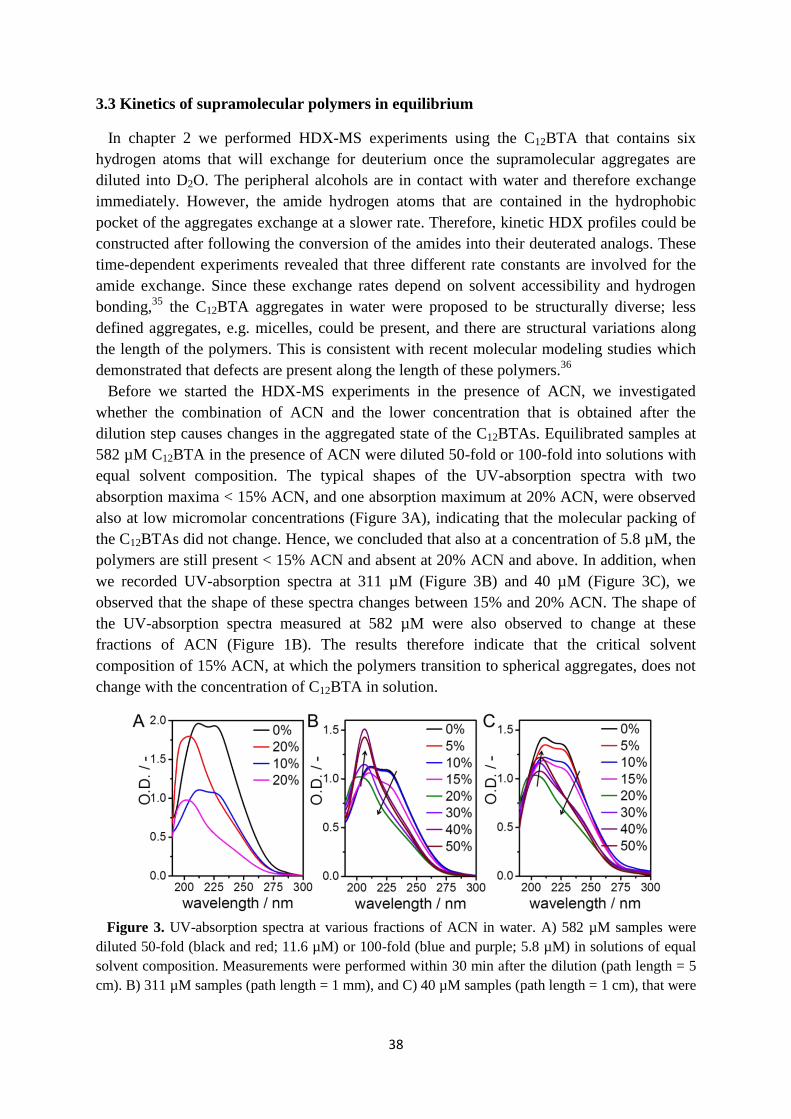
38
3.3 Kinetics of supramolecular polymers in equilibrium
In chapter 2 we performed HDX-MS experiments using the C12BTA that contains six
hydrogen atoms that will exchange for deuterium once the supramolecular aggregates are
diluted into D2O. The peripheral alcohols are in contact with water and therefore exchange
immediately. However, the amide hydrogen atoms that are contained in the hydrophobic
pocket of the aggregates exchange at a slower rate. Therefore, kinetic HDX profiles could be
constructed after following the conversion of the amides into their deuterated analogs. These
time-dependent experiments revealed that three different rate constants are involved for the
amide exchange. Since these exchange rates depend on solvent accessibility and hydrogen
bonding,35
the C12BTA aggregates in water were proposed to be structurally diverse; less
defined aggregates, e.g. micelles, could be present, and there are structural variations along
the length of the polymers. This is consistent with recent molecular modeling studies which
demonstrated that defects are present along the length of these polymers.36
Before we started the HDX-MS experiments in the presence of ACN, we investigated
whether the combination of ACN and the lower concentration that is obtained after the
dilution step causes changes in the aggregated state of the C12BTAs. Equilibrated samples at
582 µM C12BTA in the presence of ACN were diluted 50-fold or 100-fold into solutions with
equal solvent composition. The typical shapes of the UV-absorption spectra with two
absorption maxima < 15% ACN, and one absorption maximum at 20% ACN, were observed
also at low micromolar concentrations (Figure 3A), indicating that the molecular packing of
the C12BTAs did not change. Hence, we concluded that also at a concentration of 5.8 µM, the
polymers are still present < 15% ACN and absent at 20% ACN and above. In addition, when
we recorded UV-absorption spectra at 311 µM (Figure 3B) and 40 µM (Figure 3C), we
observed that the shape of these spectra changes between 15% and 20% ACN. The shape of
the UV-absorption spectra measured at 582 µM were also observed to change at these
fractions of ACN (Figure 1B). The results therefore indicate that the critical solvent
composition of 15% ACN, at which the polymers transition to spherical aggregates, does not
change with the concentration of C12BTA in solution.
Figure 3. UV-absorption spectra at various fractions of ACN in water. A) 582 µM samples were
diluted 50-fold (black and red; 11.6 µM) or 100-fold (blue and purple; 5.8 µM) in solutions of equal
solvent composition. Measurements were performed within 30 min after the dilution (path length = 5
cm). B) 311 µM samples (path length = 1 mm), and C) 40 µM samples (path length = 1 cm), that were
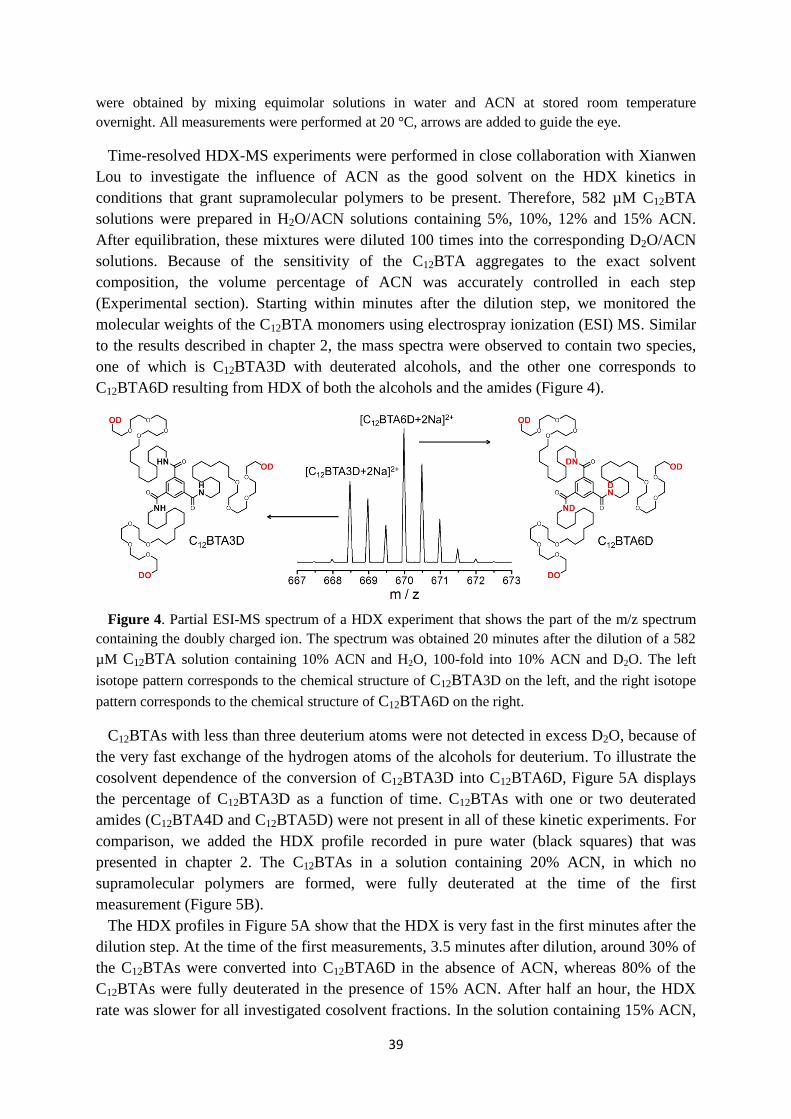
39
were obtained by mixing equimolar solutions in water and ACN at stored room temperature
overnight. All measurements were performed at 20 °C, arrows are added to guide the eye.
Time-resolved HDX-MS experiments were performed in close collaboration with Xianwen
Lou to investigate the influence of ACN as the good solvent on the HDX kinetics in
conditions that grant supramolecular polymers to be present. Therefore, 582 µM C12BTA
solutions were prepared in H2O/ACN solutions containing 5%, 10%, 12% and 15% ACN.
After equilibration, these mixtures were diluted 100 times into the corresponding D2O/ACN
solutions. Because of the sensitivity of the C12BTA aggregates to the exact solvent
composition, the volume percentage of ACN was accurately controlled in each step
(Experimental section). Starting within minutes after the dilution step, we monitored the
molecular weights of the C12BTA monomers using electrospray ionization (ESI) MS. Similar
to the results described in chapter 2, the mass spectra were observed to contain two species,
one of which is C12BTA3D with deuterated alcohols, and the other one corresponds to
C12BTA6D resulting from HDX of both the alcohols and the amides (Figure 4).
Figure 4. Partial ESI-MS spectrum of a HDX experiment that shows the part of the m/z spectrum
containing the doubly charged ion. The spectrum was obtained 20 minutes after the dilution of a 582
µM C12BTA solution containing 10% ACN and H2O, 100-fold into 10% ACN and D2O. The left
isotope pattern corresponds to the chemical structure of C12BTA3D on the left, and the right isotope
pattern corresponds to the chemical structure of C12BTA6D on the right.
C12BTAs with less than three deuterium atoms were not detected in excess D2O, because of
the very fast exchange of the hydrogen atoms of the alcohols for deuterium. To illustrate the
cosolvent dependence of the conversion of C12BTA3D into C12BTA6D, Figure 5A displays
the percentage of C12BTA3D as a function of time. C12BTAs with one or two deuterated
amides (C12BTA4D and C12BTA5D) were not present in all of these kinetic experiments. For
comparison, we added the HDX profile recorded in pure water (black squares) that was
presented in chapter 2. The C12BTAs in a solution containing 20% ACN, in which no
supramolecular polymers are formed, were fully deuterated at the time of the first
measurement (Figure 5B).
The HDX profiles in Figure 5A show that the HDX is very fast in the first minutes after the
dilution step. At the time of the first measurements, 3.5 minutes after dilution, around 30% of
the C12BTAs were converted into C12BTA6D in the absence of ACN, whereas 80% of the
C12BTAs were fully deuterated in the presence of 15% ACN. After half an hour, the HDX
rate was slower for all investigated cosolvent fractions. In the solution containing 15% ACN,
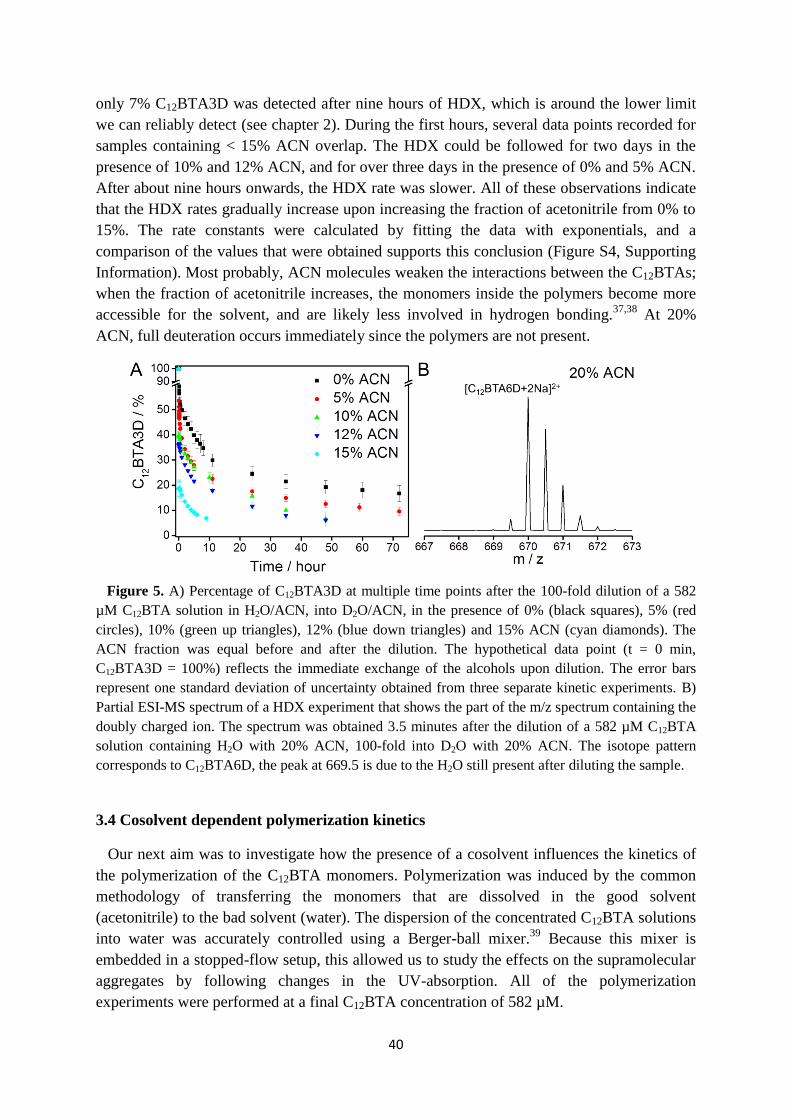
40
only 7% C12BTA3D was detected after nine hours of HDX, which is around the lower limit
we can reliably detect (see chapter 2). During the first hours, several data points recorded for
samples containing < 15% ACN overlap. The HDX could be followed for two days in the
presence of 10% and 12% ACN, and for over three days in the presence of 0% and 5% ACN.
After about nine hours onwards, the HDX rate was slower. All of these observations indicate
that the HDX rates gradually increase upon increasing the fraction of acetonitrile from 0% to
15%. The rate constants were calculated by fitting the data with exponentials, and a
comparison of the values that were obtained supports this conclusion (Figure S4, Supporting
Information). Most probably, ACN molecules weaken the interactions between the C12BTAs;
when the fraction of acetonitrile increases, the monomers inside the polymers become more
accessible for the solvent, and are likely less involved in hydrogen bonding.37,38
At 20%
ACN, full deuteration occurs immediately since the polymers are not present.
Figure 5. A) Percentage of C12BTA3D at multiple time points after the 100-fold dilution of a 582
µM C12BTA solution in H2O/ACN, into D2O/ACN, in the presence of 0% (black squares), 5% (red
circles), 10% (green up triangles), 12% (blue down triangles) and 15% ACN (cyan diamonds). The
ACN fraction was equal before and after the dilution. The hypothetical data point (t = 0 min,
C12BTA3D = 100%) reflects the immediate exchange of the alcohols upon dilution. The error bars
represent one standard deviation of uncertainty obtained from three separate kinetic experiments. B)
Partial ESI-MS spectrum of a HDX experiment that shows the part of the m/z spectrum containing the
doubly charged ion. The spectrum was obtained 3.5 minutes after the dilution of a 582 µM C12BTA
solution containing H2O with 20% ACN, 100-fold into D2O with 20% ACN. The isotope pattern
corresponds to C12BTA6D, the peak at 669.5 is due to the H2O still present after diluting the sample.
3.4 Cosolvent dependent polymerization kinetics
Our next aim was to investigate how the presence of a cosolvent influences the kinetics of
the polymerization of the C12BTA monomers. Polymerization was induced by the common
methodology of transferring the monomers that are dissolved in the good solvent
(acetonitrile) to the bad solvent (water). The dispersion of the concentrated C12BTA solutions
into water was accurately controlled using a Berger-ball mixer.39
Because this mixer is
embedded in a stopped-flow setup, this allowed us to study the effects on the supramolecular
aggregates by following changes in the UV-absorption. All of the polymerization
experiments were performed at a final C12BTA concentration of 582 µM.
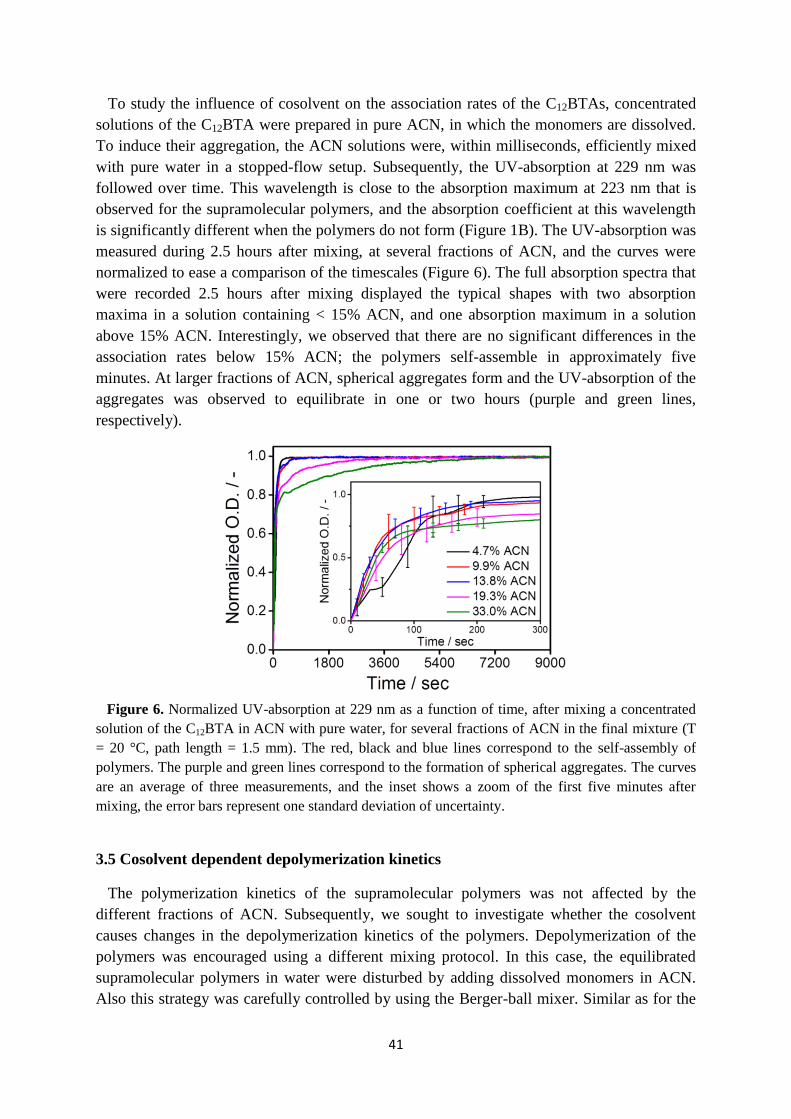
41
To study the influence of cosolvent on the association rates of the C12BTAs, concentrated
solutions of the C12BTA were prepared in pure ACN, in which the monomers are dissolved.
To induce their aggregation, the ACN solutions were, within milliseconds, efficiently mixed
with pure water in a stopped-flow setup. Subsequently, the UV-absorption at 229 nm was
followed over time. This wavelength is close to the absorption maximum at 223 nm that is
observed for the supramolecular polymers, and the absorption coefficient at this wavelength
is significantly different when the polymers do not form (Figure 1B). The UV-absorption was
measured during 2.5 hours after mixing, at several fractions of ACN, and the curves were
normalized to ease a comparison of the timescales (Figure 6). The full absorption spectra that
were recorded 2.5 hours after mixing displayed the typical shapes with two absorption
maxima in a solution containing < 15% ACN, and one absorption maximum in a solution
above 15% ACN. Interestingly, we observed that there are no significant differences in the
association rates below 15% ACN; the polymers self-assemble in approximately five
minutes. At larger fractions of ACN, spherical aggregates form and the UV-absorption of the
aggregates was observed to equilibrate in one or two hours (purple and green lines,
respectively).
Figure 6. Normalized UV-absorption at 229 nm as a function of time, after mixing a concentrated
solution of the C12BTA in ACN with pure water, for several fractions of ACN in the final mixture (T
= 20 °C, path length = 1.5 mm). The red, black and blue lines correspond to the self-assembly of
polymers. The purple and green lines correspond to the formation of spherical aggregates. The curves
are an average of three measurements, and the inset shows a zoom of the first five minutes after
mixing, the error bars represent one standard deviation of uncertainty.
3.5 Cosolvent dependent depolymerization kinetics
The polymerization kinetics of the supramolecular polymers was not affected by the
different fractions of ACN. Subsequently, we sought to investigate whether the cosolvent
causes changes in the depolymerization kinetics of the polymers. Depolymerization of the
polymers was encouraged using a different mixing protocol. In this case, the equilibrated
supramolecular polymers in water were disturbed by adding dissolved monomers in ACN.
Also this strategy was carefully controlled by using the Berger-ball mixer. Similar as for the
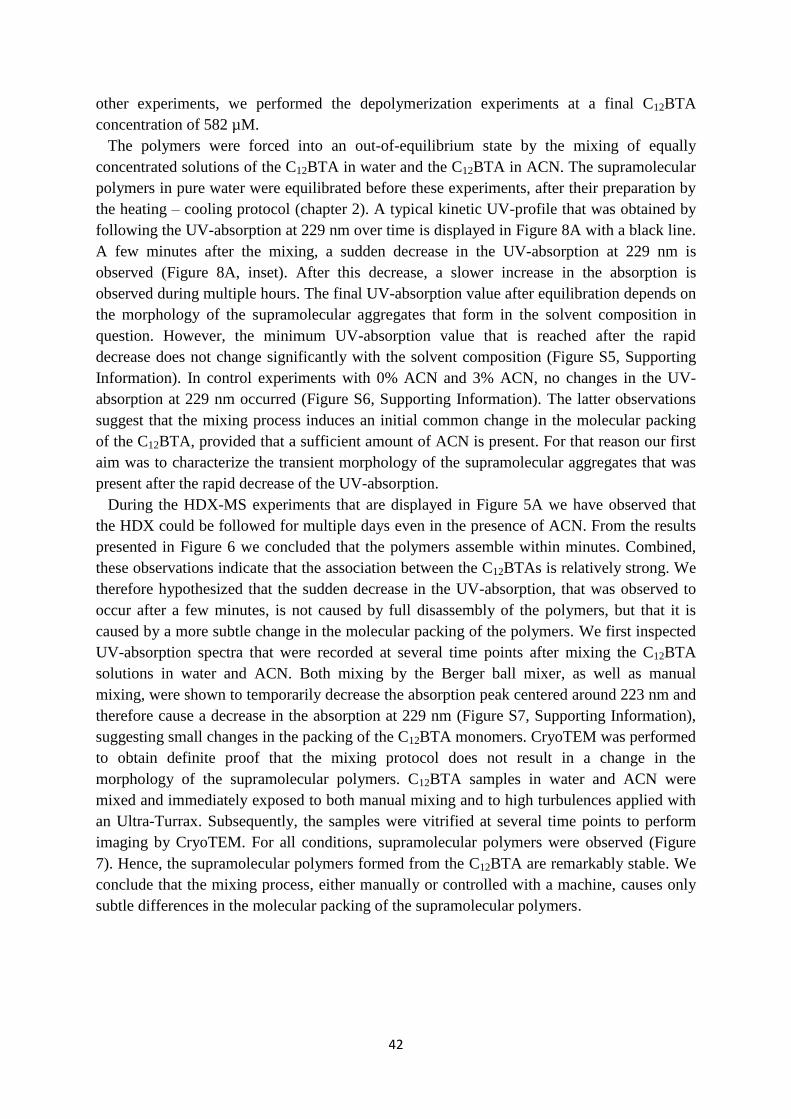
42
other experiments, we performed the depolymerization experiments at a final C12BTA
concentration of 582 µM.
The polymers were forced into an out-of-equilibrium state by the mixing of equally
concentrated solutions of the C12BTA in water and the C12BTA in ACN. The supramolecular
polymers in pure water were equilibrated before these experiments, after their preparation by
the heating – cooling protocol (chapter 2). A typical kinetic UV-profile that was obtained by
following the UV-absorption at 229 nm over time is displayed in Figure 8A with a black line.
A few minutes after the mixing, a sudden decrease in the UV-absorption at 229 nm is
observed (Figure 8A, inset). After this decrease, a slower increase in the absorption is
observed during multiple hours. The final UV-absorption value after equilibration depends on
the morphology of the supramolecular aggregates that form in the solvent composition in
question. However, the minimum UV-absorption value that is reached after the rapid
decrease does not change significantly with the solvent composition (Figure S5, Supporting
Information). In control experiments with 0% ACN and 3% ACN, no changes in the UV-
absorption at 229 nm occurred (Figure S6, Supporting Information). The latter observations
suggest that the mixing process induces an initial common change in the molecular packing
of the C12BTA, provided that a sufficient amount of ACN is present. For that reason our first
aim was to characterize the transient morphology of the supramolecular aggregates that was
present after the rapid decrease of the UV-absorption.
During the HDX-MS experiments that are displayed in Figure 5A we have observed that
the HDX could be followed for multiple days even in the presence of ACN. From the results
presented in Figure 6 we concluded that the polymers assemble within minutes. Combined,
these observations indicate that the association between the C12BTAs is relatively strong. We
therefore hypothesized that the sudden decrease in the UV-absorption, that was observed to
occur after a few minutes, is not caused by full disassembly of the polymers, but that it is
caused by a more subtle change in the molecular packing of the polymers. We first inspected
UV-absorption spectra that were recorded at several time points after mixing the C12BTA
solutions in water and ACN. Both mixing by the Berger ball mixer, as well as manual
mixing, were shown to temporarily decrease the absorption peak centered around 223 nm and
therefore cause a decrease in the absorption at 229 nm (Figure S7, Supporting Information),
suggesting small changes in the packing of the C12BTA monomers. CryoTEM was performed
to obtain definite proof that the mixing protocol does not result in a change in the
morphology of the supramolecular polymers. C12BTA samples in water and ACN were
mixed and immediately exposed to both manual mixing and to high turbulences applied with
an Ultra-Turrax. Subsequently, the samples were vitrified at several time points to perform
imaging by CryoTEM. For all conditions, supramolecular polymers were observed (Figure
7). Hence, the supramolecular polymers formed from the C12BTA are remarkably stable. We
conclude that the mixing process, either manually or controlled with a machine, causes only
subtle differences in the molecular packing of the supramolecular polymers.
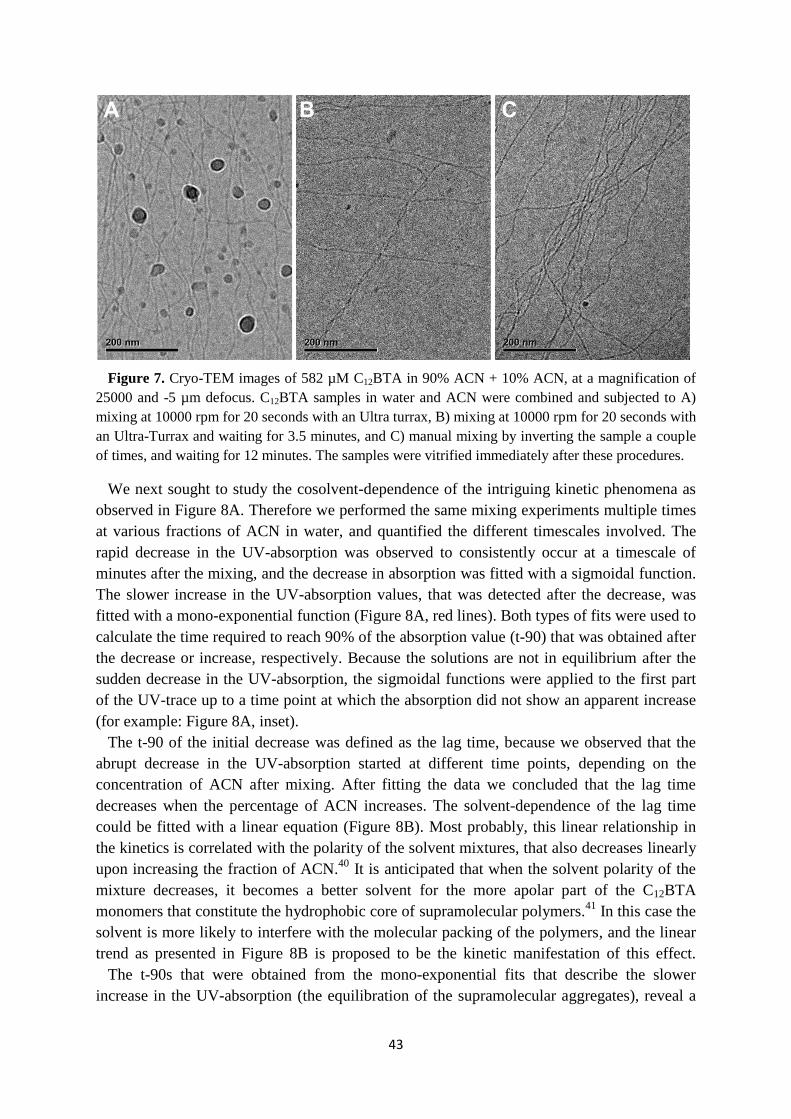
43
Figure 7. Cryo-TEM images of 582 µM C12BTA in 90% ACN + 10% ACN, at a magnification of
25000 and -5 µm defocus. C12BTA samples in water and ACN were combined and subjected to A)
mixing at 10000 rpm for 20 seconds with an Ultra turrax, B) mixing at 10000 rpm for 20 seconds with
an Ultra-Turrax and waiting for 3.5 minutes, and C) manual mixing by inverting the sample a couple
of times, and waiting for 12 minutes. The samples were vitrified immediately after these procedures.
We next sought to study the cosolvent-dependence of the intriguing kinetic phenomena as
observed in Figure 8A. Therefore we performed the same mixing experiments multiple times
at various fractions of ACN in water, and quantified the different timescales involved. The
rapid decrease in the UV-absorption was observed to consistently occur at a timescale of
minutes after the mixing, and the decrease in absorption was fitted with a sigmoidal function.
The slower increase in the UV-absorption values, that was detected after the decrease, was
fitted with a mono-exponential function (Figure 8A, red lines). Both types of fits were used to
calculate the time required to reach 90% of the absorption value (t-90) that was obtained after
the decrease or increase, respectively. Because the solutions are not in equilibrium after the
sudden decrease in the UV-absorption, the sigmoidal functions were applied to the first part
of the UV-trace up to a time point at which the absorption did not show an apparent increase
(for example: Figure 8A, inset).
The t-90 of the initial decrease was defined as the lag time, because we observed that the
abrupt decrease in the UV-absorption started at different time points, depending on the
concentration of ACN after mixing. After fitting the data we concluded that the lag time
decreases when the percentage of ACN increases. The solvent-dependence of the lag time
could be fitted with a linear equation (Figure 8B). Most probably, this linear relationship in
the kinetics is correlated with the polarity of the solvent mixtures, that also decreases linearly
upon increasing the fraction of ACN.40
It is anticipated that when the solvent polarity of the
mixture decreases, it becomes a better solvent for the more apolar part of the C12BTA
monomers that constitute the hydrophobic core of supramolecular polymers.41
In this case the
solvent is more likely to interfere with the molecular packing of the polymers, and the linear
trend as presented in Figure 8B is proposed to be the kinetic manifestation of this effect.
The t-90s that were obtained from the mono-exponential fits that describe the slower
increase in the UV-absorption (the equilibration of the supramolecular aggregates), reveal a
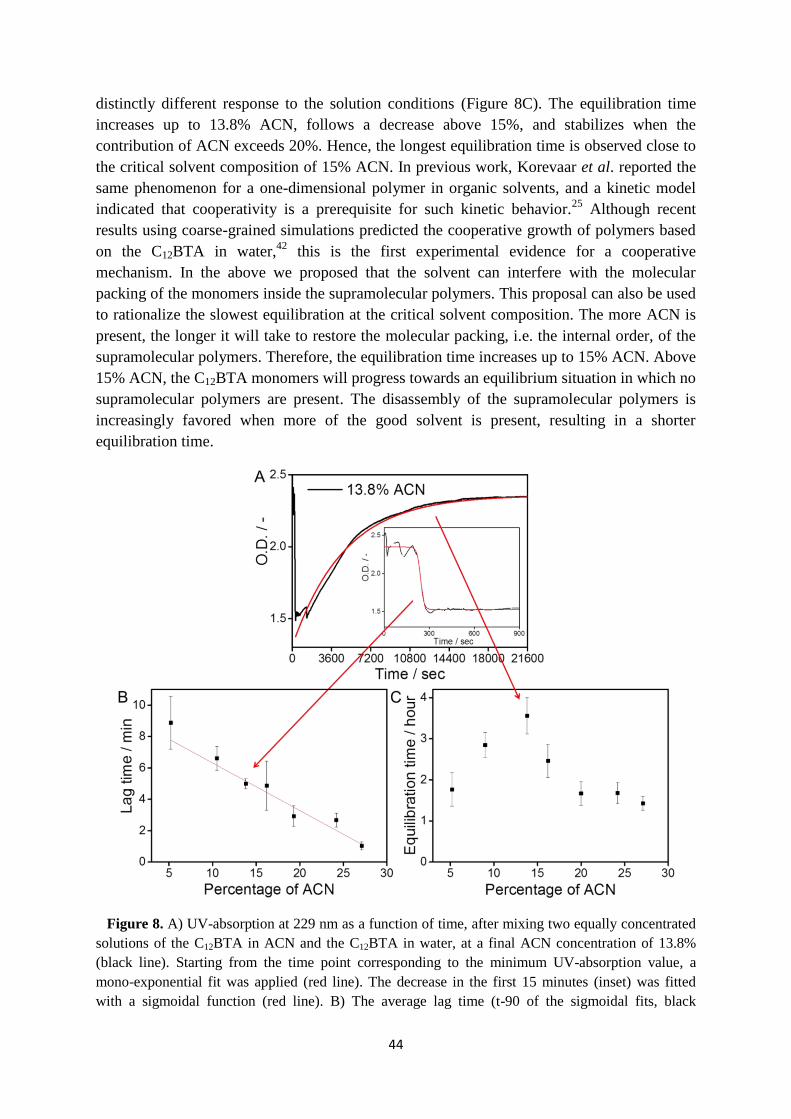
44
distinctly different response to the solution conditions (Figure 8C). The equilibration time
increases up to 13.8% ACN, follows a decrease above 15%, and stabilizes when the
contribution of ACN exceeds 20%. Hence, the longest equilibration time is observed close to
the critical solvent composition of 15% ACN. In previous work, Korevaar et al. reported the
same phenomenon for a one-dimensional polymer in organic solvents, and a kinetic model
indicated that cooperativity is a prerequisite for such kinetic behavior.25
Although recent
results using coarse-grained simulations predicted the cooperative growth of polymers based
on the C12BTA in water,42
this is the first experimental evidence for a cooperative
mechanism. In the above we proposed that the solvent can interfere with the molecular
packing of the monomers inside the supramolecular polymers. This proposal can also be used
to rationalize the slowest equilibration at the critical solvent composition. The more ACN is
present, the longer it will take to restore the molecular packing, i.e. the internal order, of the
supramolecular polymers. Therefore, the equilibration time increases up to 15% ACN. Above
15% ACN, the C12BTA monomers will progress towards an equilibrium situation in which no
supramolecular polymers are present. The disassembly of the supramolecular polymers is
increasingly favored when more of the good solvent is present, resulting in a shorter
equilibration time.
Figure 8. A) UV-absorption at 229 nm as a function of time, after mixing two equally concentrated
solutions of the C12BTA in ACN and the C12BTA in water, at a final ACN concentration of 13.8%
(black line). Starting from the time point corresponding to the minimum UV-absorption value, a
mono-exponential fit was applied (red line). The decrease in the first 15 minutes (inset) was fitted
with a sigmoidal function (red line). B) The average lag time (t-90 of the sigmoidal fits, black
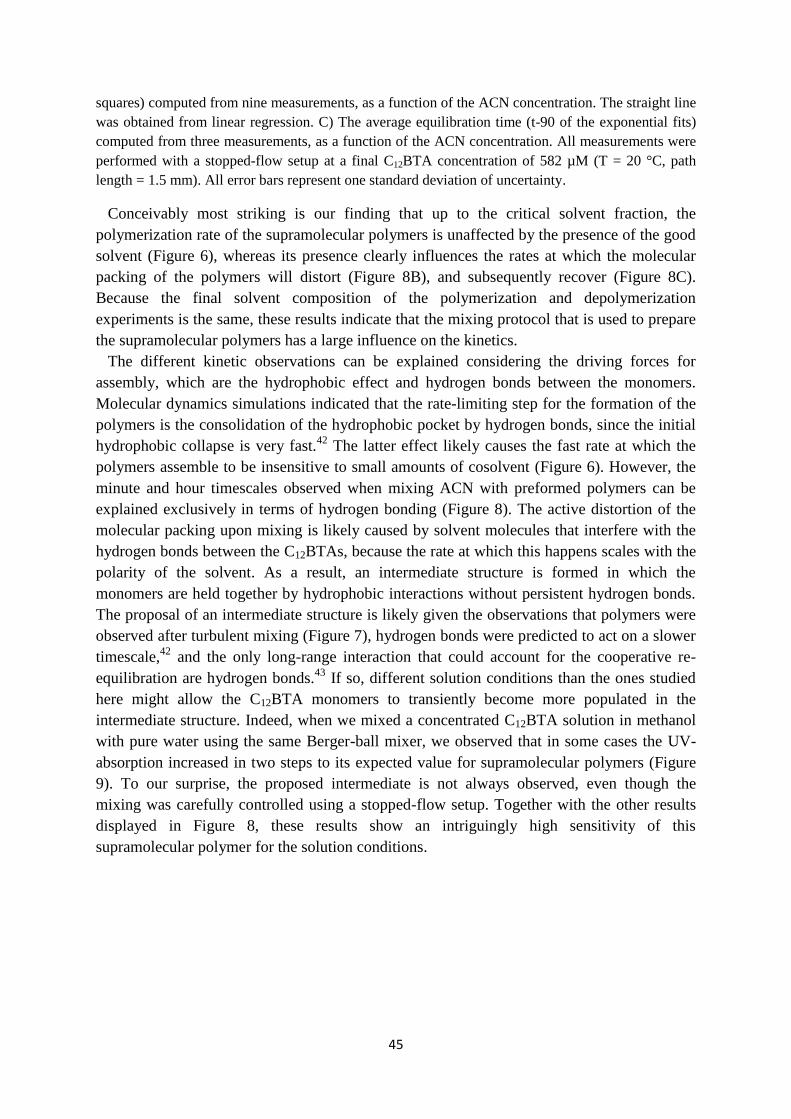
45
squares) computed from nine measurements, as a function of the ACN concentration. The straight line
was obtained from linear regression. C) The average equilibration time (t-90 of the exponential fits)
computed from three measurements, as a function of the ACN concentration. All measurements were
performed with a stopped-flow setup at a final C12BTA concentration of 582 µM (T = 20 °C, path
length = 1.5 mm). All error bars represent one standard deviation of uncertainty.
Conceivably most striking is our finding that up to the critical solvent fraction, the
polymerization rate of the supramolecular polymers is unaffected by the presence of the good
solvent (Figure 6), whereas its presence clearly influences the rates at which the molecular
packing of the polymers will distort (Figure 8B), and subsequently recover (Figure 8C).
Because the final solvent composition of the polymerization and depolymerization
experiments is the same, these results indicate that the mixing protocol that is used to prepare
the supramolecular polymers has a large influence on the kinetics.
The different kinetic observations can be explained considering the driving forces for
assembly, which are the hydrophobic effect and hydrogen bonds between the monomers.
Molecular dynamics simulations indicated that the rate-limiting step for the formation of the
polymers is the consolidation of the hydrophobic pocket by hydrogen bonds, since the initial
hydrophobic collapse is very fast.42
The latter effect likely causes the fast rate at which the
polymers assemble to be insensitive to small amounts of cosolvent (Figure 6). However, the
minute and hour timescales observed when mixing ACN with preformed polymers can be
explained exclusively in terms of hydrogen bonding (Figure 8). The active distortion of the
molecular packing upon mixing is likely caused by solvent molecules that interfere with the
hydrogen bonds between the C12BTAs, because the rate at which this happens scales with the
polarity of the solvent. As a result, an intermediate structure is formed in which the
monomers are held together by hydrophobic interactions without persistent hydrogen bonds.
The proposal of an intermediate structure is likely given the observations that polymers were
observed after turbulent mixing (Figure 7), hydrogen bonds were predicted to act on a slower
timescale,42
and the only long-range interaction that could account for the cooperative re-
equilibration are hydrogen bonds.43
If so, different solution conditions than the ones studied
here might allow the C12BTA monomers to transiently become more populated in the
intermediate structure. Indeed, when we mixed a concentrated C12BTA solution in methanol
with pure water using the same Berger-ball mixer, we observed that in some cases the UV-
absorption increased in two steps to its expected value for supramolecular polymers (Figure
9). To our surprise, the proposed intermediate is not always observed, even though the
mixing was carefully controlled using a stopped-flow setup. Together with the other results
displayed in Figure 8, these results show an intriguingly high sensitivity of this
supramolecular polymer for the solution conditions.
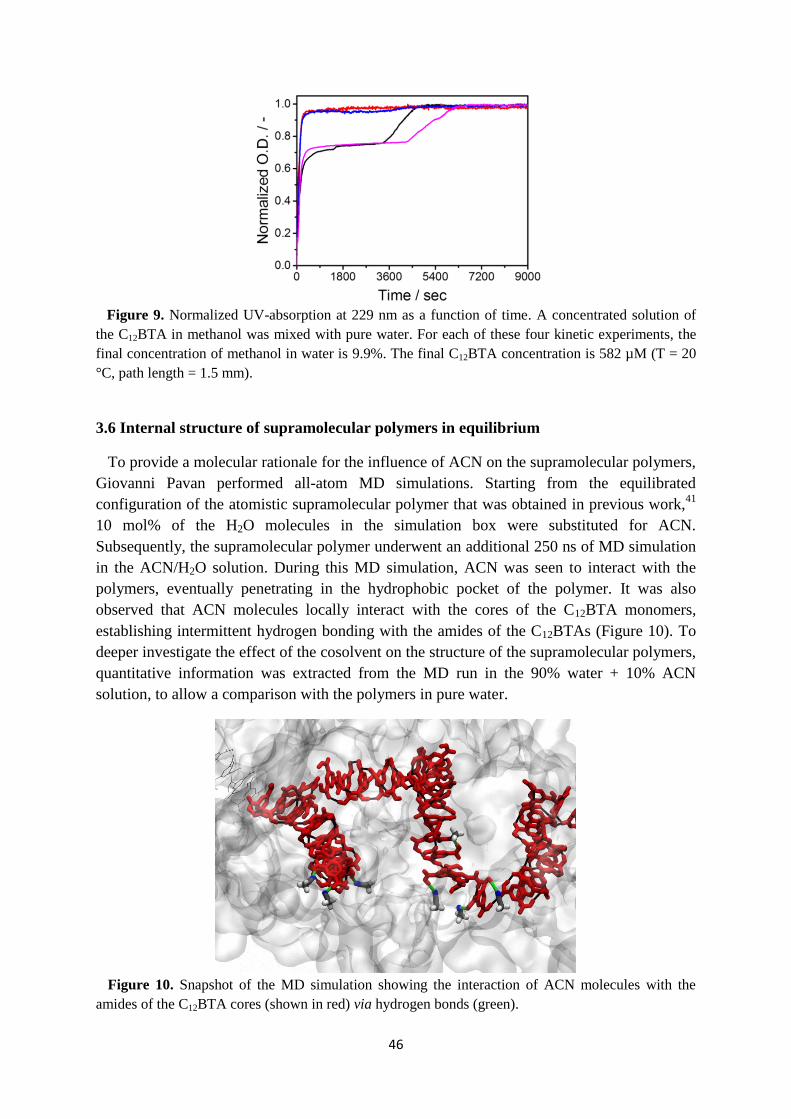
46
Figure 9. Normalized UV-absorption at 229 nm as a function of time. A concentrated solution of
the C12BTA in methanol was mixed with pure water. For each of these four kinetic experiments, the
final concentration of methanol in water is 9.9%. The final C12BTA concentration is 582 µM (T = 20
°C, path length = 1.5 mm).
3.6 Internal structure of supramolecular polymers in equilibrium
To provide a molecular rationale for the influence of ACN on the supramolecular polymers,
Giovanni Pavan performed all-atom MD simulations. Starting from the equilibrated
configuration of the atomistic supramolecular polymer that was obtained in previous work,41
10 mol% of the H2O molecules in the simulation box were substituted for ACN.
Subsequently, the supramolecular polymer underwent an additional 250 ns of MD simulation
in the ACN/H2O solution. During this MD simulation, ACN was seen to interact with the
polymers, eventually penetrating in the hydrophobic pocket of the polymer. It was also
observed that ACN molecules locally interact with the cores of the C12BTA monomers,
establishing intermittent hydrogen bonding with the amides of the C12BTAs (Figure 10). To
deeper investigate the effect of the cosolvent on the structure of the supramolecular polymers,
quantitative information was extracted from the MD run in the 90% water + 10% ACN
solution, to allow a comparison with the polymers in pure water.
Figure 10. Snapshot of the MD simulation showing the interaction of ACN molecules with the
amides of the C12BTA cores (shown in red) via hydrogen bonds (green).
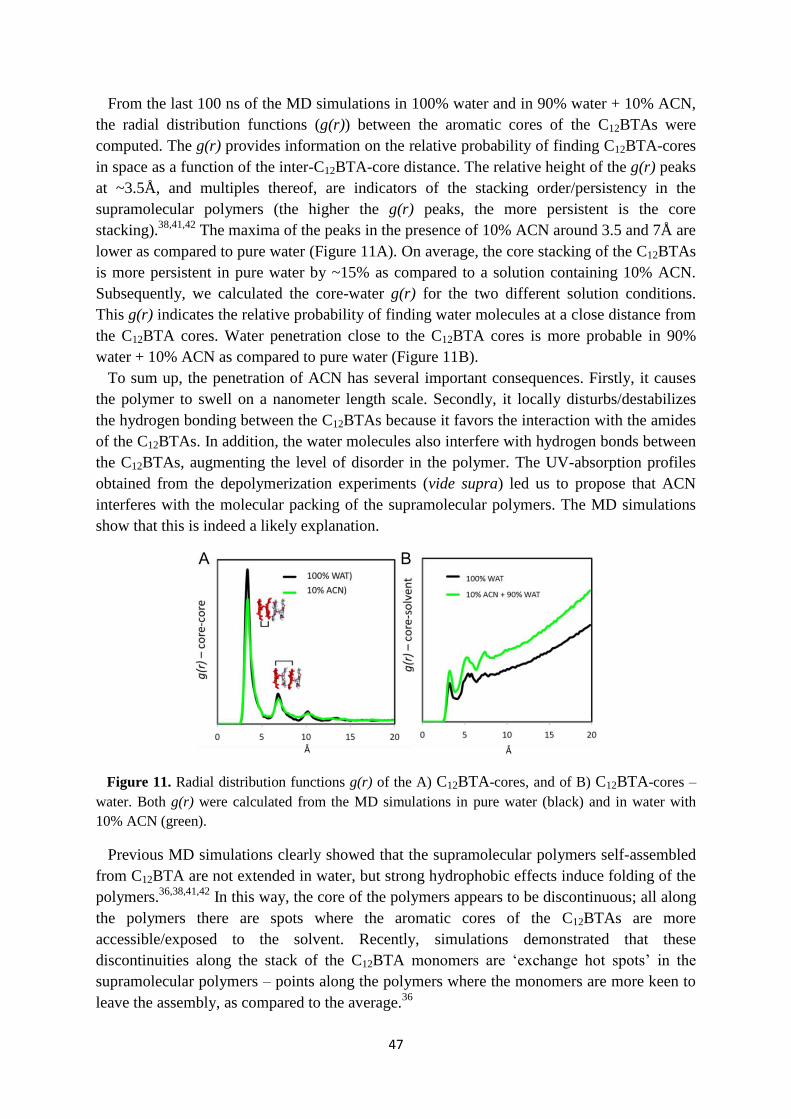
47
From the last 100 ns of the MD simulations in 100% water and in 90% water + 10% ACN,
the radial distribution functions (g(r)) between the aromatic cores of the C12BTAs were
computed. The g(r) provides information on the relative probability of finding C12BTA-cores
in space as a function of the inter-C12BTA-core distance. The relative height of the g(r) peaks
at ~3.5Å, and multiples thereof, are indicators of the stacking order/persistency in the
supramolecular polymers (the higher the g(r) peaks, the more persistent is the core
stacking).38,41,42
The maxima of the peaks in the presence of 10% ACN around 3.5 and 7Å are
lower as compared to pure water (Figure 11A). On average, the core stacking of the C12BTAs
is more persistent in pure water by ~15% as compared to a solution containing 10% ACN.
Subsequently, we calculated the core-water g(r) for the two different solution conditions.
This g(r) indicates the relative probability of finding water molecules at a close distance from
the C12BTA cores. Water penetration close to the C12BTA cores is more probable in 90%
water + 10% ACN as compared to pure water (Figure 11B).
To sum up, the penetration of ACN has several important consequences. Firstly, it causes
the polymer to swell on a nanometer length scale. Secondly, it locally disturbs/destabilizes
the hydrogen bonding between the C12BTAs because it favors the interaction with the amides
of the C12BTAs. In addition, the water molecules also interfere with hydrogen bonds between
the C12BTAs, augmenting the level of disorder in the polymer. The UV-absorption profiles
obtained from the depolymerization experiments (vide supra) led us to propose that ACN
interferes with the molecular packing of the supramolecular polymers. The MD simulations
show that this is indeed a likely explanation.
Figure 11. Radial distribution functions g(r) of the A) C12BTA-cores, and of B) C12BTA-cores –
water. Both g(r) were calculated from the MD simulations in pure water (black) and in water with
10% ACN (green).
Previous MD simulations clearly showed that the supramolecular polymers self-assembled
from C12BTA are not extended in water, but strong hydrophobic effects induce folding of the
polymers.36,38,41,42
In this way, the core of the polymers appears to be discontinuous; all along
the polymers there are spots where the aromatic cores of the C12BTAs are more
accessible/exposed to the solvent. Recently, simulations demonstrated that these
discontinuities along the stack of the C12BTA monomers are ‘exchange hot spots’ in the
supramolecular polymers – points along the polymers where the monomers are more keen to
leave the assembly, as compared to the average.36
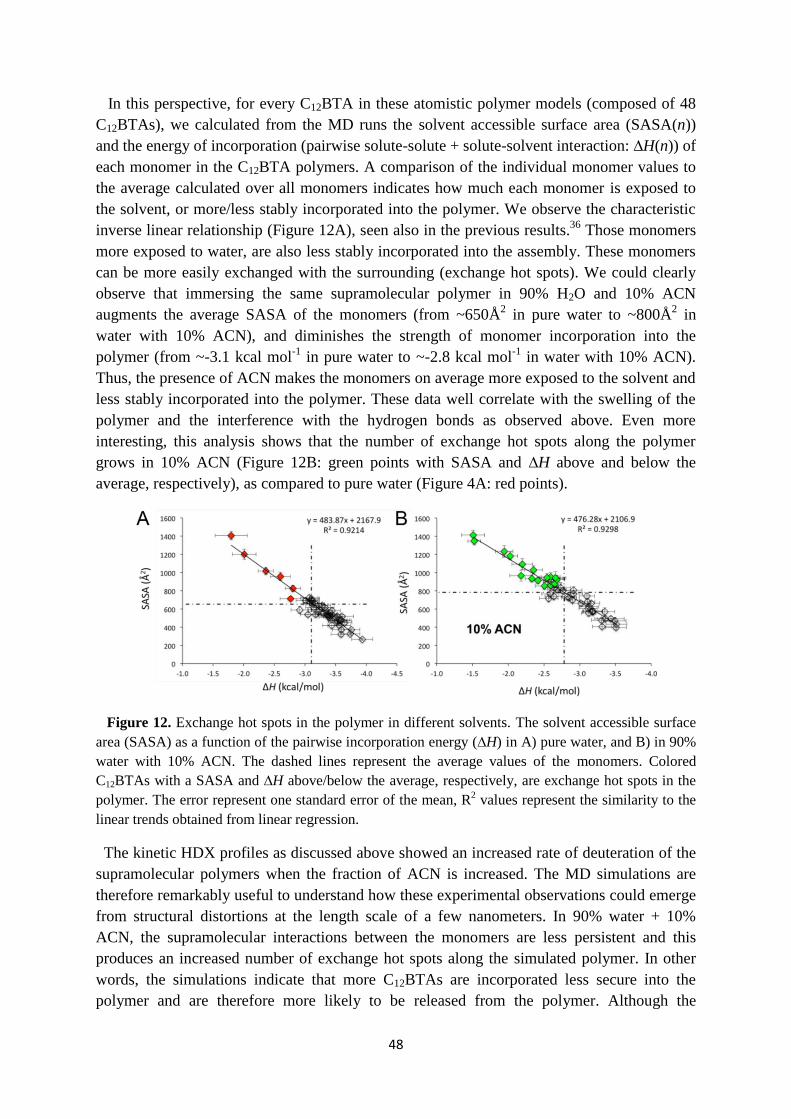
48
In this perspective, for every C12BTA in these atomistic polymer models (composed of 48
C12BTAs), we calculated from the MD runs the solvent accessible surface area (SASA(n))
and the energy of incorporation (pairwise solute-solute + solute-solvent interaction: ∆H(n)) of
each monomer in the C12BTA polymers. A comparison of the individual monomer values to
the average calculated over all monomers indicates how much each monomer is exposed to
the solvent, or more/less stably incorporated into the polymer. We observe the characteristic
inverse linear relationship (Figure 12A), seen also in the previous results.36
Those monomers
more exposed to water, are also less stably incorporated into the assembly. These monomers
can be more easily exchanged with the surrounding (exchange hot spots). We could clearly
observe that immersing the same supramolecular polymer in 90% H2O and 10% ACN
augments the average SASA of the monomers (from ~650Å2 in pure water to ~800Å
2 in
water with 10% ACN), and diminishes the strength of monomer incorporation into the
polymer (from ~-3.1 kcal mol-1
in pure water to ~-2.8 kcal mol-1
in water with 10% ACN).
Thus, the presence of ACN makes the monomers on average more exposed to the solvent and
less stably incorporated into the polymer. These data well correlate with the swelling of the
polymer and the interference with the hydrogen bonds as observed above. Even more
interesting, this analysis shows that the number of exchange hot spots along the polymer
grows in 10% ACN (Figure 12B: green points with SASA and ∆H above and below the
average, respectively), as compared to pure water (Figure 4A: red points).
Figure 12. Exchange hot spots in the polymer in different solvents. The solvent accessible surface
area (SASA) as a function of the pairwise incorporation energy (∆H) in A) pure water, and B) in 90%
water with 10% ACN. The dashed lines represent the average values of the monomers. Colored
C12BTAs with a SASA and ∆H above/below the average, respectively, are exchange hot spots in the
polymer. The error represent one standard error of the mean, R2 values represent the similarity to the
linear trends obtained from linear regression.
The kinetic HDX profiles as discussed above showed an increased rate of deuteration of the
supramolecular polymers when the fraction of ACN is increased. The MD simulations are
therefore remarkably useful to understand how these experimental observations could emerge
from structural distortions at the length scale of a few nanometers. In 90% water + 10%
ACN, the supramolecular interactions between the monomers are less persistent and this
produces an increased number of exchange hot spots along the simulated polymer. In other
words, the simulations indicate that more C12BTAs are incorporated less secure into the
polymer and are therefore more likely to be released from the polymer. Although the
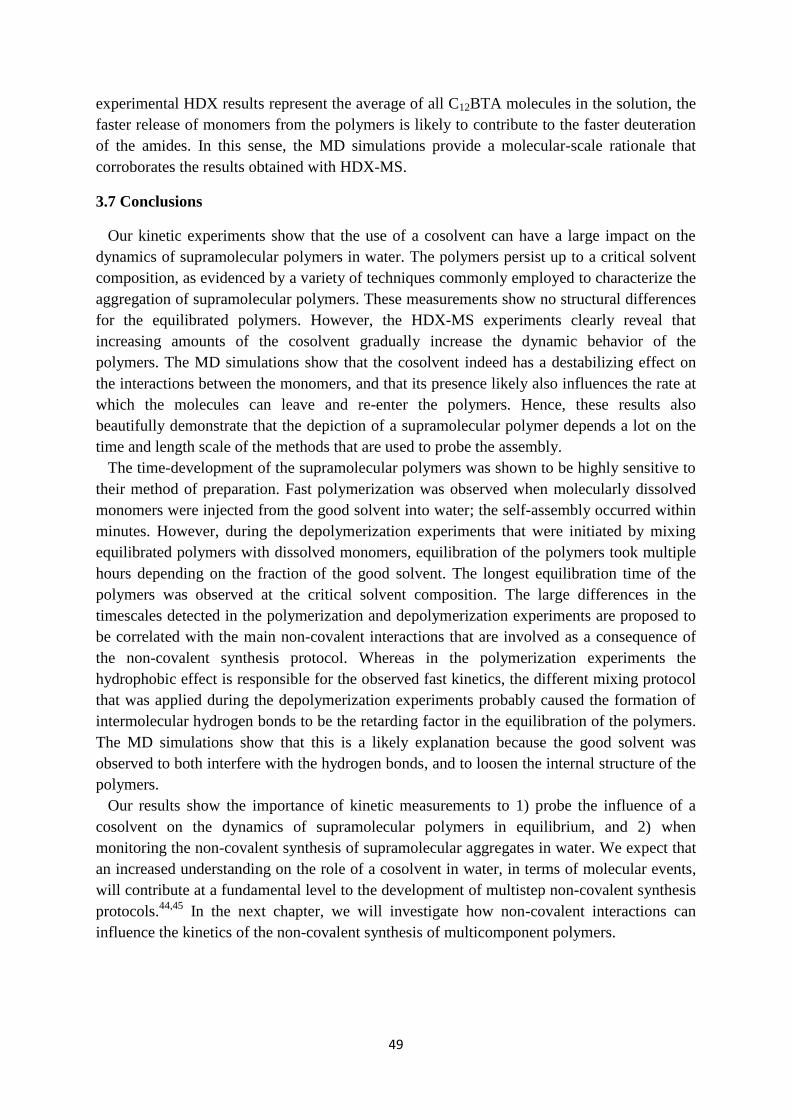
49
experimental HDX results represent the average of all C12BTA molecules in the solution, the
faster release of monomers from the polymers is likely to contribute to the faster deuteration
of the amides. In this sense, the MD simulations provide a molecular-scale rationale that
corroborates the results obtained with HDX-MS.
3.7 Conclusions
Our kinetic experiments show that the use of a cosolvent can have a large impact on the
dynamics of supramolecular polymers in water. The polymers persist up to a critical solvent
composition, as evidenced by a variety of techniques commonly employed to characterize the
aggregation of supramolecular polymers. These measurements show no structural differences
for the equilibrated polymers. However, the HDX-MS experiments clearly reveal that
increasing amounts of the cosolvent gradually increase the dynamic behavior of the
polymers. The MD simulations show that the cosolvent indeed has a destabilizing effect on
the interactions between the monomers, and that its presence likely also influences the rate at
which the molecules can leave and re-enter the polymers. Hence, these results also
beautifully demonstrate that the depiction of a supramolecular polymer depends a lot on the
time and length scale of the methods that are used to probe the assembly.
The time-development of the supramolecular polymers was shown to be highly sensitive to
their method of preparation. Fast polymerization was observed when molecularly dissolved
monomers were injected from the good solvent into water; the self-assembly occurred within
minutes. However, during the depolymerization experiments that were initiated by mixing
equilibrated polymers with dissolved monomers, equilibration of the polymers took multiple
hours depending on the fraction of the good solvent. The longest equilibration time of the
polymers was observed at the critical solvent composition. The large differences in the
timescales detected in the polymerization and depolymerization experiments are proposed to
be correlated with the main non-covalent interactions that are involved as a consequence of
the non-covalent synthesis protocol. Whereas in the polymerization experiments the
hydrophobic effect is responsible for the observed fast kinetics, the different mixing protocol
that was applied during the depolymerization experiments probably caused the formation of
intermolecular hydrogen bonds to be the retarding factor in the equilibration of the polymers.
The MD simulations show that this is a likely explanation because the good solvent was
observed to both interfere with the hydrogen bonds, and to loosen the internal structure of the
polymers.
Our results show the importance of kinetic measurements to 1) probe the influence of a
cosolvent on the dynamics of supramolecular polymers in equilibrium, and 2) when
monitoring the non-covalent synthesis of supramolecular aggregates in water. We expect that
an increased understanding on the role of a cosolvent in water, in terms of molecular events,
will contribute at a fundamental level to the development of multistep non-covalent synthesis
protocols.44,45
In the next chapter, we will investigate how non-covalent interactions can
influence the kinetics of the non-covalent synthesis of multicomponent polymers.
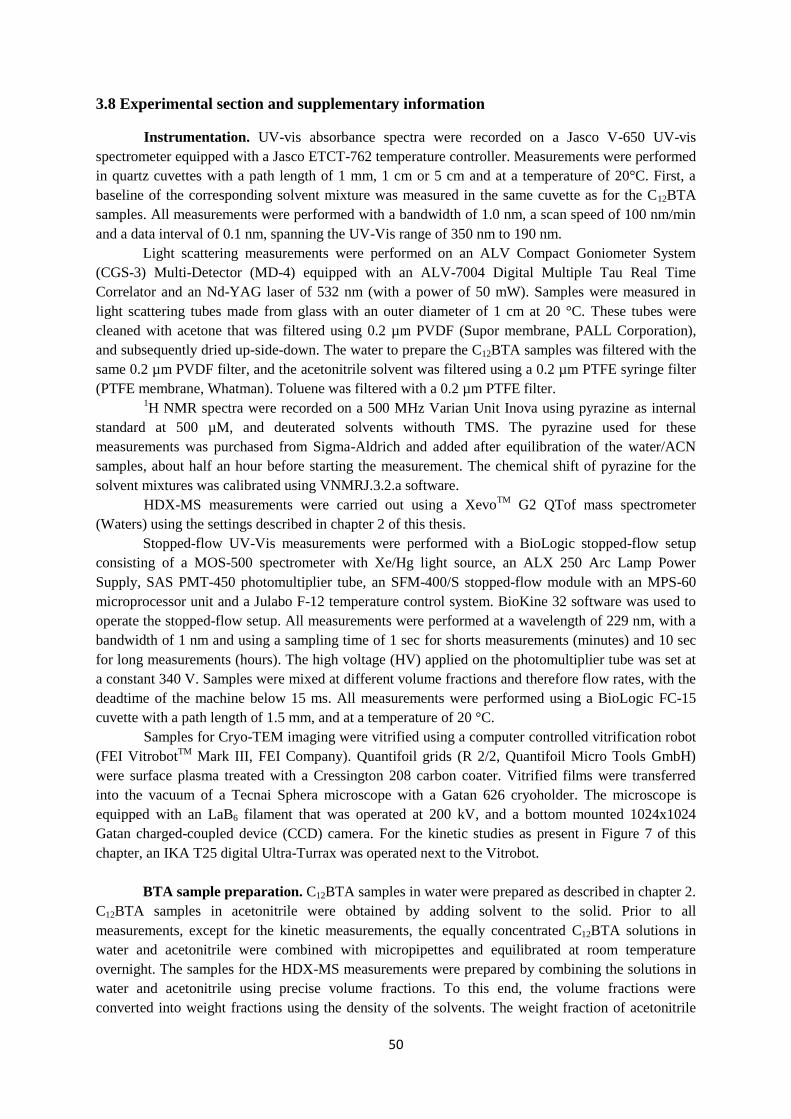
50
3.8 Experimental section and supplementary information
Instrumentation. UV-vis absorbance spectra were recorded on a Jasco V-650 UV-vis
spectrometer equipped with a Jasco ETCT-762 temperature controller. Measurements were performed
in quartz cuvettes with a path length of 1 mm, 1 cm or 5 cm and at a temperature of 20°C. First, a
baseline of the corresponding solvent mixture was measured in the same cuvette as for the C12BTA
samples. All measurements were performed with a bandwidth of 1.0 nm, a scan speed of 100 nm/min
and a data interval of 0.1 nm, spanning the UV-Vis range of 350 nm to 190 nm.
Light scattering measurements were performed on an ALV Compact Goniometer System
(CGS-3) Multi-Detector (MD-4) equipped with an ALV-7004 Digital Multiple Tau Real Time
Correlator and an Nd-YAG laser of 532 nm (with a power of 50 mW). Samples were measured in
light scattering tubes made from glass with an outer diameter of 1 cm at 20 °C. These tubes were
cleaned with acetone that was filtered using 0.2 µm PVDF (Supor membrane, PALL Corporation),
and subsequently dried up-side-down. The water to prepare the C12BTA samples was filtered with the
same 0.2 µm PVDF filter, and the acetonitrile solvent was filtered using a 0.2 µm PTFE syringe filter
(PTFE membrane, Whatman). Toluene was filtered with a 0.2 µm PTFE filter. 1H NMR spectra were recorded on a 500 MHz Varian Unit Inova using pyrazine as internal
standard at 500 µM, and deuterated solvents withouth TMS. The pyrazine used for these
measurements was purchased from Sigma-Aldrich and added after equilibration of the water/ACN
samples, about half an hour before starting the measurement. The chemical shift of pyrazine for the
solvent mixtures was calibrated using VNMRJ.3.2.a software.
HDX-MS measurements were carried out using a XevoTM
G2 QTof mass spectrometer
(Waters) using the settings described in chapter 2 of this thesis.
Stopped-flow UV-Vis measurements were performed with a BioLogic stopped-flow setup
consisting of a MOS-500 spectrometer with Xe/Hg light source, an ALX 250 Arc Lamp Power
Supply, SAS PMT-450 photomultiplier tube, an SFM-400/S stopped-flow module with an MPS-60
microprocessor unit and a Julabo F-12 temperature control system. BioKine 32 software was used to
operate the stopped-flow setup. All measurements were performed at a wavelength of 229 nm, with a
bandwidth of 1 nm and using a sampling time of 1 sec for shorts measurements (minutes) and 10 sec
for long measurements (hours). The high voltage (HV) applied on the photomultiplier tube was set at
a constant 340 V. Samples were mixed at different volume fractions and therefore flow rates, with the
deadtime of the machine below 15 ms. All measurements were performed using a BioLogic FC-15
cuvette with a path length of 1.5 mm, and at a temperature of 20 °C.
Samples for Cryo-TEM imaging were vitrified using a computer controlled vitrification robot
(FEI VitrobotTM
Mark III, FEI Company). Quantifoil grids (R 2/2, Quantifoil Micro Tools GmbH)
were surface plasma treated with a Cressington 208 carbon coater. Vitrified films were transferred
into the vacuum of a Tecnai Sphera microscope with a Gatan 626 cryoholder. The microscope is
equipped with an LaB6 filament that was operated at 200 kV, and a bottom mounted 1024x1024
Gatan charged-coupled device (CCD) camera. For the kinetic studies as present in Figure 7 of this
chapter, an IKA T25 digital Ultra-Turrax was operated next to the Vitrobot.
BTA sample preparation. C12BTA samples in water were prepared as described in chapter 2.
C12BTA samples in acetonitrile were obtained by adding solvent to the solid. Prior to all
measurements, except for the kinetic measurements, the equally concentrated C12BTA solutions in
water and acetonitrile were combined with micropipettes and equilibrated at room temperature
overnight. The samples for the HDX-MS measurements were prepared by combining the solutions in
water and acetonitrile using precise volume fractions. To this end, the volume fractions were
converted into weight fractions using the density of the solvents. The weight fraction of acetonitrile
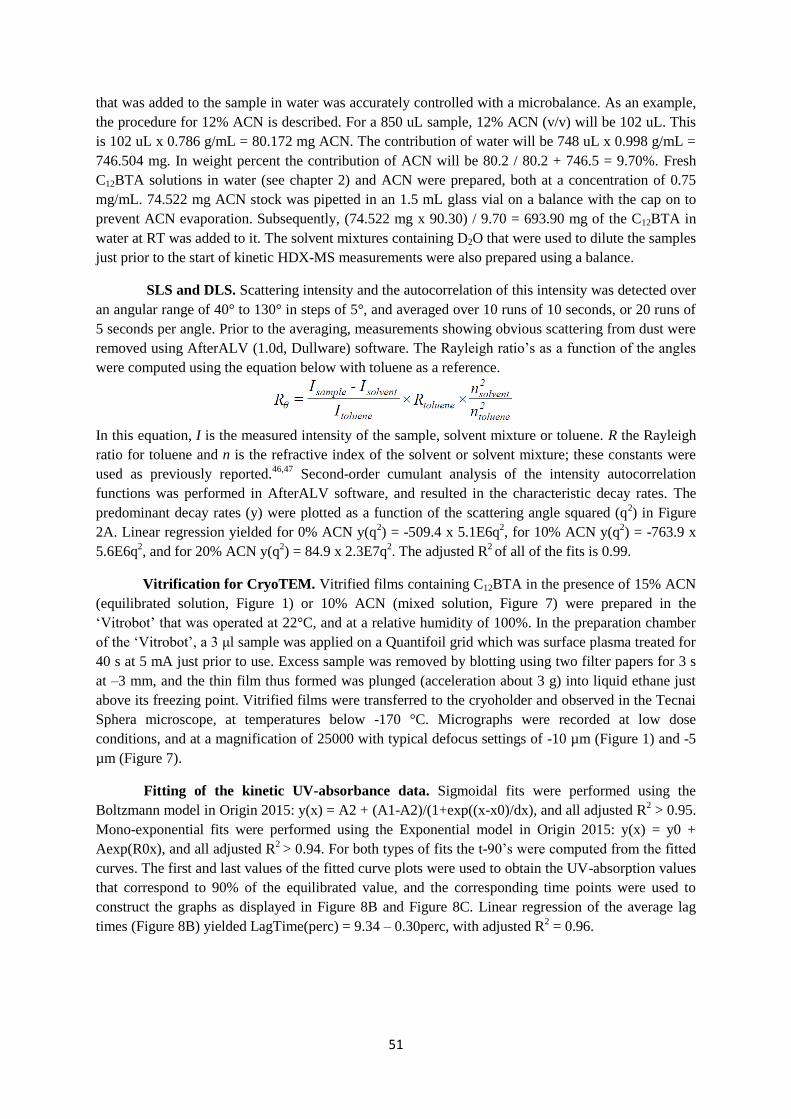
51
that was added to the sample in water was accurately controlled with a microbalance. As an example,
the procedure for 12% ACN is described. For a 850 uL sample, 12% ACN (v/v) will be 102 uL. This
is 102 uL x 0.786 g/mL = 80.172 mg ACN. The contribution of water will be 748 uL x 0.998 g/mL =
746.504 mg. In weight percent the contribution of ACN will be 80.2 / 80.2 + 746.5 = 9.70%. Fresh
C12BTA solutions in water (see chapter 2) and ACN were prepared, both at a concentration of 0.75
mg/mL. 74.522 mg ACN stock was pipetted in an 1.5 mL glass vial on a balance with the cap on to
prevent ACN evaporation. Subsequently, (74.522 mg x 90.30) / 9.70 = 693.90 mg of the C12BTA in
water at RT was added to it. The solvent mixtures containing D2O that were used to dilute the samples
just prior to the start of kinetic HDX-MS measurements were also prepared using a balance.
SLS and DLS. Scattering intensity and the autocorrelation of this intensity was detected over
an angular range of 40° to 130° in steps of 5°, and averaged over 10 runs of 10 seconds, or 20 runs of
5 seconds per angle. Prior to the averaging, measurements showing obvious scattering from dust were
removed using AfterALV (1.0d, Dullware) software. The Rayleigh ratio’s as a function of the angles
were computed using the equation below with toluene as a reference.
In this equation, I is the measured intensity of the sample, solvent mixture or toluene. R the Rayleigh
ratio for toluene and n is the refractive index of the solvent or solvent mixture; these constants were
used as previously reported.46,47
Second-order cumulant analysis of the intensity autocorrelation
functions was performed in AfterALV software, and resulted in the characteristic decay rates. The
predominant decay rates (y) were plotted as a function of the scattering angle squared (q2) in Figure
2A. Linear regression yielded for 0% ACN y(q2) = -509.4 x 5.1E6q
2, for 10% ACN y(q
2) = -763.9 x
5.6E6q2, and for 20% ACN y(q
2) = 84.9 x 2.3E7q
2. The adjusted R
2 of all of the fits is 0.99.
Vitrification for CryoTEM. Vitrified films containing C12BTA in the presence of 15% ACN
(equilibrated solution, Figure 1) or 10% ACN (mixed solution, Figure 7) were prepared in the
‘Vitrobot’ that was operated at 22°C, and at a relative humidity of 100%. In the preparation chamber
of the ‘Vitrobot’, a 3 μl sample was applied on a Quantifoil grid which was surface plasma treated for
40 s at 5 mA just prior to use. Excess sample was removed by blotting using two filter papers for 3 s
at –3 mm, and the thin film thus formed was plunged (acceleration about 3 g) into liquid ethane just
above its freezing point. Vitrified films were transferred to the cryoholder and observed in the Tecnai
Sphera microscope, at temperatures below -170 °C. Micrographs were recorded at low dose
conditions, and at a magnification of 25000 with typical defocus settings of -10 µm (Figure 1) and -5
µm (Figure 7).
Fitting of the kinetic UV-absorbance data. Sigmoidal fits were performed using the
Boltzmann model in Origin 2015: y(x) = A2 + (A1-A2)/(1+exp((x-x0)/dx), and all adjusted R2 > 0.95.
Mono-exponential fits were performed using the Exponential model in Origin 2015: y(x) = y0 +
Aexp(R0x), and all adjusted R2
> 0.94. For both types of fits the t-90’s were computed from the fitted
curves. The first and last values of the fitted curve plots were used to obtain the UV-absorption values
that correspond to 90% of the equilibrated value, and the corresponding time points were used to
construct the graphs as displayed in Figure 8B and Figure 8C. Linear regression of the average lag
times (Figure 8B) yielded LagTime(perc) = 9.34 – 0.30perc, with adjusted R2 = 0.96.
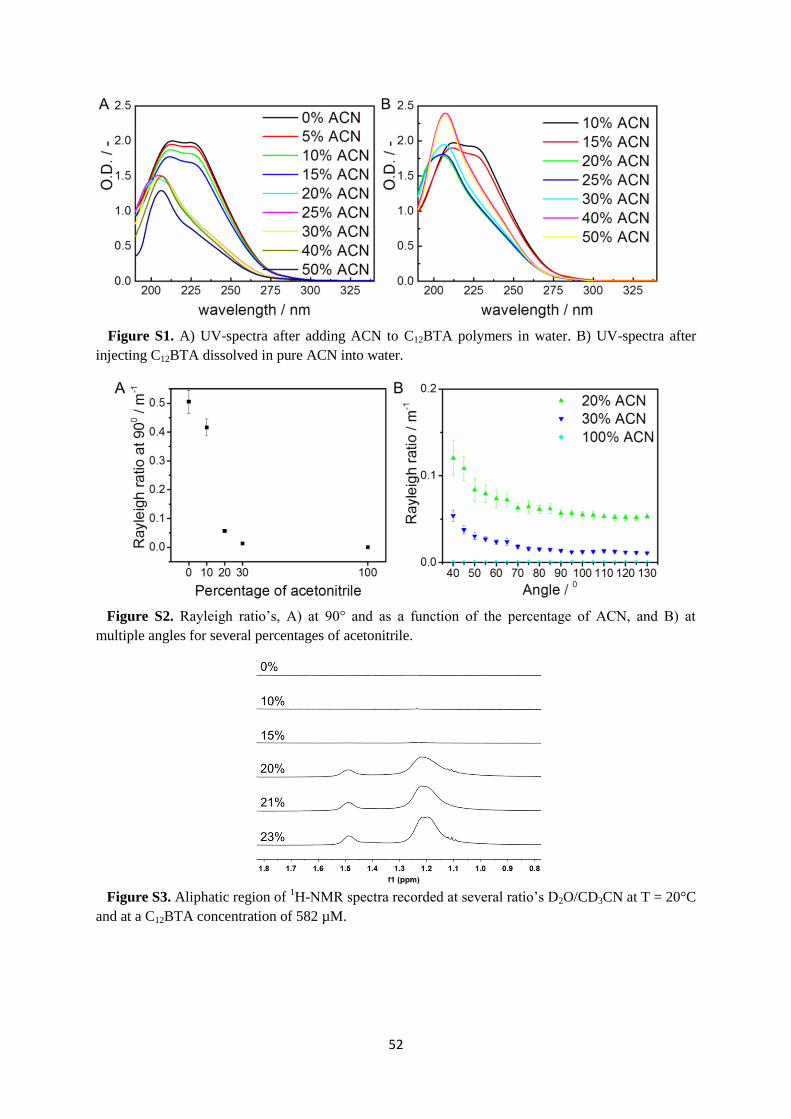
52
Figure S1. A) UV-spectra after adding ACN to C12BTA polymers in water. B) UV-spectra after
injecting C12BTA dissolved in pure ACN into water.
Figure S2. Rayleigh ratio’s, A) at 90° and as a function of the percentage of ACN, and B) at
multiple angles for several percentages of acetonitrile.
Figure S3. Aliphatic region of
1H-NMR spectra recorded at several ratio’s D2O/CD3CN at T = 20°C
and at a C12BTA concentration of 582 µM.
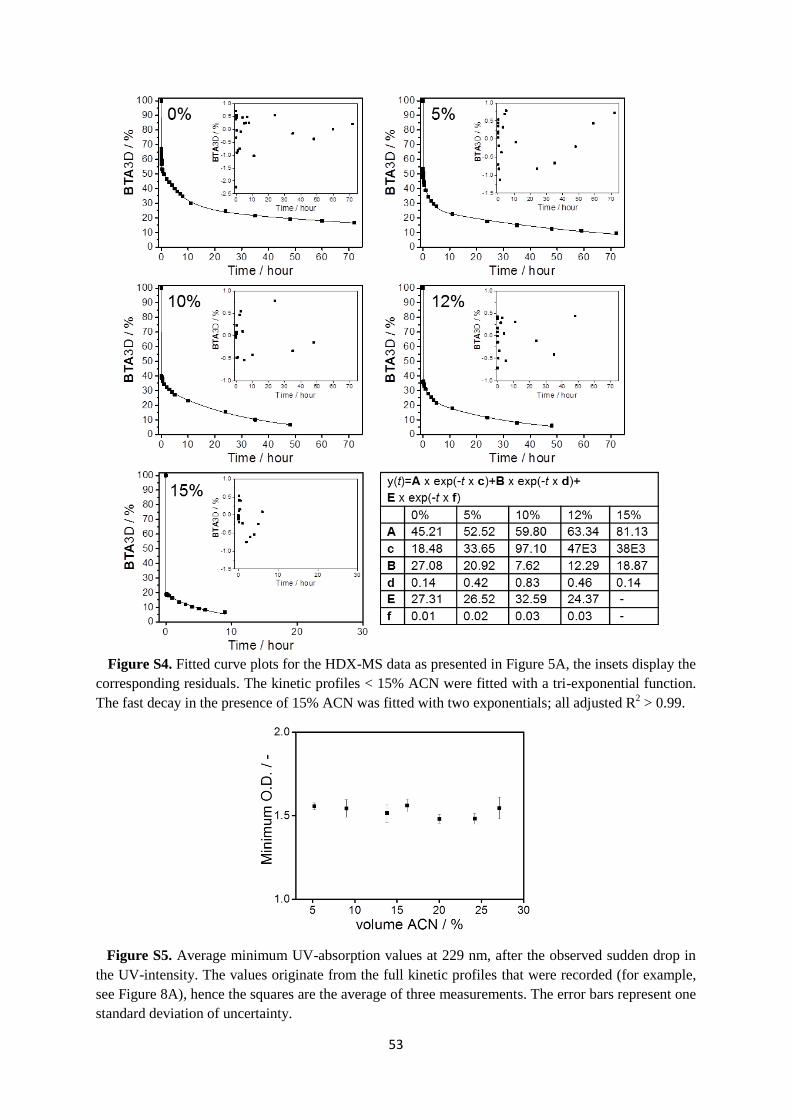
53
Figure S4. Fitted curve plots for the HDX-MS data as presented in Figure 5A, the insets display the
corresponding residuals. The kinetic profiles < 15% ACN were fitted with a tri-exponential function.
The fast decay in the presence of 15% ACN was fitted with two exponentials; all adjusted R2 > 0.99.
Figure S5. Average minimum UV-absorption values at 229 nm, after the observed sudden drop in
the UV-intensity. The values originate from the full kinetic profiles that were recorded (for example,
see Figure 8A), hence the squares are the average of three measurements. The error bars represent one
standard deviation of uncertainty.
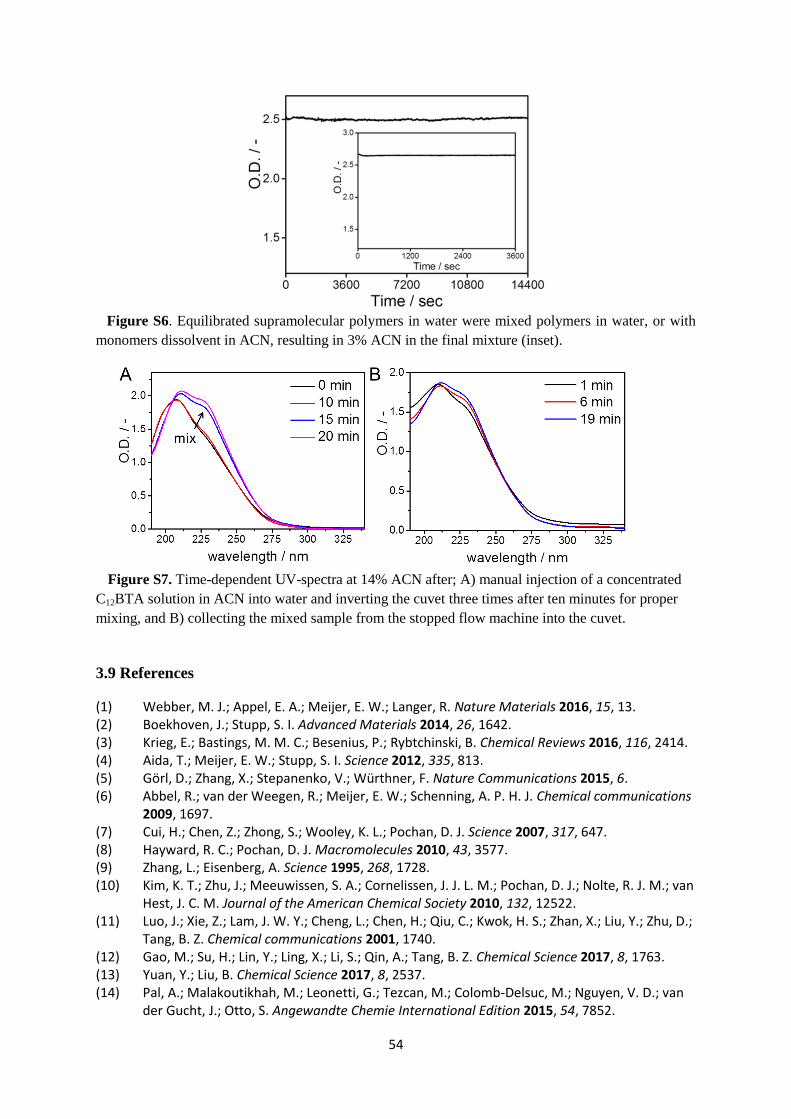
54
Figure S6. Equilibrated supramolecular polymers in water were mixed polymers in water, or with
monomers dissolvent in ACN, resulting in 3% ACN in the final mixture (inset).
Figure S7. Time-dependent UV-spectra at 14% ACN after; A) manual injection of a concentrated
C12BTA solution in ACN into water and inverting the cuvet three times after ten minutes for proper
mixing, and B) collecting the mixed sample from the stopped flow machine into the cuvet.
3.9 References
(1) Webber, M. J.; Appel, E. A.; Meijer, E. W.; Langer, R. Nature Materials 2016, 15, 13. (2) Boekhoven, J.; Stupp, S. I. Advanced Materials 2014, 26, 1642. (3) Krieg, E.; Bastings, M. M. C.; Besenius, P.; Rybtchinski, B. Chemical Reviews 2016, 116, 2414. (4) Aida, T.; Meijer, E. W.; Stupp, S. I. Science 2012, 335, 813. (5) Görl, D.; Zhang, X.; Stepanenko, V.; Würthner, F. Nature Communications 2015, 6. (6) Abbel, R.; van der Weegen, R.; Meijer, E. W.; Schenning, A. P. H. J. Chemical communications
2009, 1697. (7) Cui, H.; Chen, Z.; Zhong, S.; Wooley, K. L.; Pochan, D. J. Science 2007, 317, 647. (8) Hayward, R. C.; Pochan, D. J. Macromolecules 2010, 43, 3577. (9) Zhang, L.; Eisenberg, A. Science 1995, 268, 1728. (10) Kim, K. T.; Zhu, J.; Meeuwissen, S. A.; Cornelissen, J. J. L. M.; Pochan, D. J.; Nolte, R. J. M.; van
Hest, J. C. M. Journal of the American Chemical Society 2010, 132, 12522. (11) Luo, J.; Xie, Z.; Lam, J. W. Y.; Cheng, L.; Chen, H.; Qiu, C.; Kwok, H. S.; Zhan, X.; Liu, Y.; Zhu, D.;
Tang, B. Z. Chemical communications 2001, 1740. (12) Gao, M.; Su, H.; Lin, Y.; Ling, X.; Li, S.; Qin, A.; Tang, B. Z. Chemical Science 2017, 8, 1763. (13) Yuan, Y.; Liu, B. Chemical Science 2017, 8, 2537. (14) Pal, A.; Malakoutikhah, M.; Leonetti, G.; Tezcan, M.; Colomb-Delsuc, M.; Nguyen, V. D.; van
der Gucht, J.; Otto, S. Angewandte Chemie International Edition 2015, 54, 7852.
55
(15) Tidhar, Y.; Weissman, H.; Wolf, S. G.; Gulino, A.; Rybtchinski, B. Chemistry – A European Journal 2011, 17, 6068.
(16) Korevaar, P. A.; Newcomb, C. J.; Meijer, E. W.; Stupp, S. I. Journal of the American Chemical Society 2014, 136, 8540.
(17) Ivnitski, D.; Amit, M.; Silberbush, O.; Atsmon-Raz, Y.; Nanda, J.; Cohen-Luria, R.; Miller, Y.; Ashkenasy, G.; Ashkenasy, N. Angewandte Chemie International Edition 2016, 55, 9988.
(18) Gillissen, M. A. J.; Koenigs, M. M. E.; Spiering, J. J. H.; Vekemans, J. A. J. M.; Palmans, A. R. A.; Voets, I. K.; Meijer, E. W. Journal of the American Chemical Society 2014, 136, 336.
(19) Po, C.; Tam, A. Y.-Y.; Wong, K. M.-C.; Yam, V. W.-W. Journal of the American Chemical Society 2011, 133, 12136.
(20) Denkova, A. G.; Bomans, P. H. H.; Coppens, M. O.; Sommerdijk, N. A. J. M.; Mendes, E. Soft Matter 2011, 7, 6622.
(21) Boekhoven, J.; Brizard, A. M.; van Rijn, P.; Stuart, M. C. A.; Eelkema, R.; van Esch, J. H. Angewandte Chemie International Edition 2011, 50, 12285.
(22) Lin, X.; Kurata, H.; Prabhu, D. D.; Yamauchi, M.; Ohba, T.; Yagai, S. Chemical communications 2017, 53, 168.
(23) Baram, J.; Weissman, H.; Tidhar, Y.; Pinkas, I.; Rybtchinski, B. Angewandte Chemie International Edition 2014, 53, 4123.
(24) Aliprandi, A.; Mauro, M.; De Cola, L. Nature Chemistry 2016, 8, 10. (25) Korevaar, P. A.; Schaefer, C.; de Greef, T. F.; Meijer, E. W. Journal of the American Chemical
Society 2012, 134, 13482. (26) Fu, I. W.; Markegard, C. B.; Nguyen, H. D. Langmuir 2015, 31, 315. (27) Ortony, J. H.; Newcomb, C. J.; Matson, J. B.; Palmer, L. C.; Doan, P. E.; Hoffman, B. M.; Stupp,
S. I. Nature Materials 2014, 13, 812. (28) Hendrikse, S. I. S.; Wijnands, S. P. W.; Lafleur, R. P. M.; Pouderoijen, M. J.; Janssen, H. M.;
Dankers, P. Y. W.; Meijer, E. W. Chemical communications 2017, 53, 2279. (29) Petkau-Milroy, K.; Uhlenheuer, D. A.; Spiering, A. J. H.; Vekemans, J. A. J. M.; Brunsveld, L.
Chemical Science 2013. (30) Reulen, S. W. A.; Merkx, M. Bioconjugate chemistry 2010, 21, 860. (31) Albertazzi, L.; van der Zwaag, D.; Leenders, C. M. A.; Fitzner, R.; van der Hofstad, R. W.;
Meijer, E. W. Science 2014, 344, 491. (32) Leenders, C. M.; Albertazzi, L.; Mes, T.; Koenigs, M. M.; Palmans, A. R.; Meijer, E. W.
Chemical communications 2013, 49, 1963. (33) Jonkheijm, P.; van der Schoot, P.; Schenning, A. P. H. J.; Meijer, E. W. Science 2006, 313, 80. (34) Carnall, J. M. A.; Waudby, C. A.; Belenguer, A. M.; Stuart, M. C. A.; Peyralans, J. J.-P.; Otto, S.
Science 2010, 327, 1502. (35) Konermann, L.; Pan, J.; Liu, Y.-H. Chemical Society Reviews 2011, 40, 1224. (36) Bochicchio, D.; Salvalaglio, M.; Pavan, G. M. Nature Communications 2017, 8, 147. (37) Leenders, C. M. A.; Baker, M. B.; Pijpers, I. A. B.; Lafleur, R. P. M.; Albertazzi, L.; Palmans, A.
R. A.; Meijer, E. W. Soft Matter 2016, 12, 2887. (38) Garzoni, M.; Baker, M. B.; Leenders, C. M. A.; Voets, I. K.; Albertazzi, L.; Palmans, A. R. A.;
Meijer, E. W.; Pavan, G. M. Journal of the American Chemical Society 2016. (39) Berger, R. L.; Balko, B.; Chapman, H. F. Review of Scientific Instruments 1968, 39, 493. (40) Marcus, Y.; Migron, Y. The Journal of Physical Chemistry 1991, 95, 400. (41) Baker, M. B.; Albertazzi, L.; Voets, I. K.; Leenders, C. M. A.; Palmans, A. R. A.; Pavan, G. M.;
Meijer, E. W. Nature Communications 2015, 6. (42) Bochicchio, D.; Pavan, G. M. ACS Nano 2017, 11, 1000. (43) Kulkarni, C.; Balasubramanian, S.; George, S. J. ChemPhysChem 2013, 14, 661. (44) Zhuang, Z.; Jiang, T.; Lin, J.; Gao, L.; Yang, C.; Wang, L.; Cai, C. Angewandte Chemie
International Edition 2016, 55, 12522.
56
(45) Yang, C.; Gao, L.; Lin, J.; Wang, L.; Cai, C.; Wei, Y.; Li, Z. Angewandte Chemie International Edition 2017, 56, 5546.
(46) Wu, H. Chemical Physics 2010, 367, 44. (47) Bertie, J. E.; Lan, Z. The Journal of Physical Chemistry B 1997, 101, 4111.
57
Chapter 4
Hydrophobic mismatch controls supramolecular
copolymerization rates
Abstract:
Multicomponent supramolecular polymers are receiving increased attention in recent years in
both fundamental and application-oriented studies. However, limited studies have been
devoted to investigate the non-covalent synthesis of supramolecular copolymers in water.
Here we explore the formation of copolymers using a series of water soluble benzene-1,3,5-
tricarboxamide derivatives, that differ in their hydrophobic/hydrophilic balance due to
differences in the alkyl chain lengths that constitute the hydrophobic part of the monomers.
The copolymers are a binary system in which the length of the alkyl chain is gradually
increased for one of the components. Turbidity measurements are used to show that random
copolymers can be formed simply by the mixing of solutions. The kinetics of
copolymerization is studied using a new experimental approach based on hydrogen/deuterium
exchange mass spectrometry (HDX-MS). It is shown that upon gradually increasing the
difference in the alkyl chain lengths of the monomers, the rate of copolymerization is
retarded in a non-linear way. The same trend is observed when we follow the
copolymerization with UV-spectroscopy. The results demonstrate that the hydrophobic
mismatch between the monomers determines the rate at which the supramolecular
copolymers form.
This work was performed in close collaboration with Sandra Schoenmakers.
58
4.1 Introduction
Supramolecular polymers are ideal candidates for the development of functional
architectures, because their dynamic nature provides access to a versatile set of copolymers
by the mixing of different building blocks. The combination of different monomers can result
in multicomponent supramolecular polymers with properties that are difficult to attain with
single component systems. For example, supramolecular copolymers in water have already
been successfully prepared for the introduction of bioactivity,1-4
to enable drug delivery,5,6
and for imaging.7,8
Moreover, this modular approach has also been used to acquire a
fundamental understanding of the dynamics of aqueous supramolecular polymers.1,9-12
Since
the majority of these polymers are able to form hydrogels, supramolecular multicomponent
materials with unique thermal,13
electronic,14
and mechanical properties are emerging.15,16
Essential for the further development of supramolecular copolymers in water, is an
increased understanding of the features that govern their self-assembly kinetics.17
This
requires a combination of time-resolved measurements and systematic changes of the
building blocks. Although small changes in the molecular structure are already expanding the
control over self-assembly pathways in organic solvents,18,19
the translation to an aqueous
environment is notoriously challenging. The main reason for this is that when changing the
hydrophobic/hydrophilic balance, one has to walk a thin line between too soluble compounds
(no aggregation) and molecules that precipitate. As of yet, this property cannot be predicted a
priori. In addition, even small changes in the molecular structure that do not affect the
hydrophobic/hydrophilic balance, often lead to large morphological changes of the
supramolecular aggregates.20-22
These subtleties are also reflected in the assembly of
sophisticated supramolecular copolymers, because often this requires thoughtful solution
processing methodology.23,24
Most probably, these challenges have prevented an accurate
characterization of the copolymerization kinetics of supramolecular polymers in water.
In this work, we aim to prepare copolymers using a series of amphiphilic benzene-1,3,5-
tricarboxamide (BTA) derivatives, and to characterize the timescales associated with the
copolymerization. Alkyl chains that consist of ten, eleven, twelve or thirteen methylene units
are attached to the benzene core, and tetra(ethylene glycol) enables these molecules to be
studied in water (Figure 1). In chapter 2 and in previous work,25
we reported on the
morphological and dynamic characterization of the single-component supramolecular
aggregates formed from these building blocks. The C10BTA does not form ordered
supramolecular assemblies, whereas the C11BTA, C12BTA, and C13BTA all form high aspect
ratio supramolecular polymers.
In chapter 2, we have used hydrogen/deuterium exchange mass spectrometry (HDX-MS) to
study the dynamics of these supramolecular aggregates. The molecules presented in Figure 1
were assembled in H2O and diluted 100-fold into D2O to induce HDX. At multiple time
points after the dilution, aliquots of the 5 µM solution in D2O were analyzed with
electrospray ionization (ESI) mass spectrometry. The hydrogen atoms at the periphery
exchanged immediately for deuterium, and the hydrogen atoms of the amides inside the
hydrophobic pockets exchanged at a much slower rate. For the supramolecular polymers
formed from C11BTA, C12BTA, and C13BTA, the amide HDX could be followed for multiple
days. However, the C10BTA monomers were fully deuterated already three minutes after the
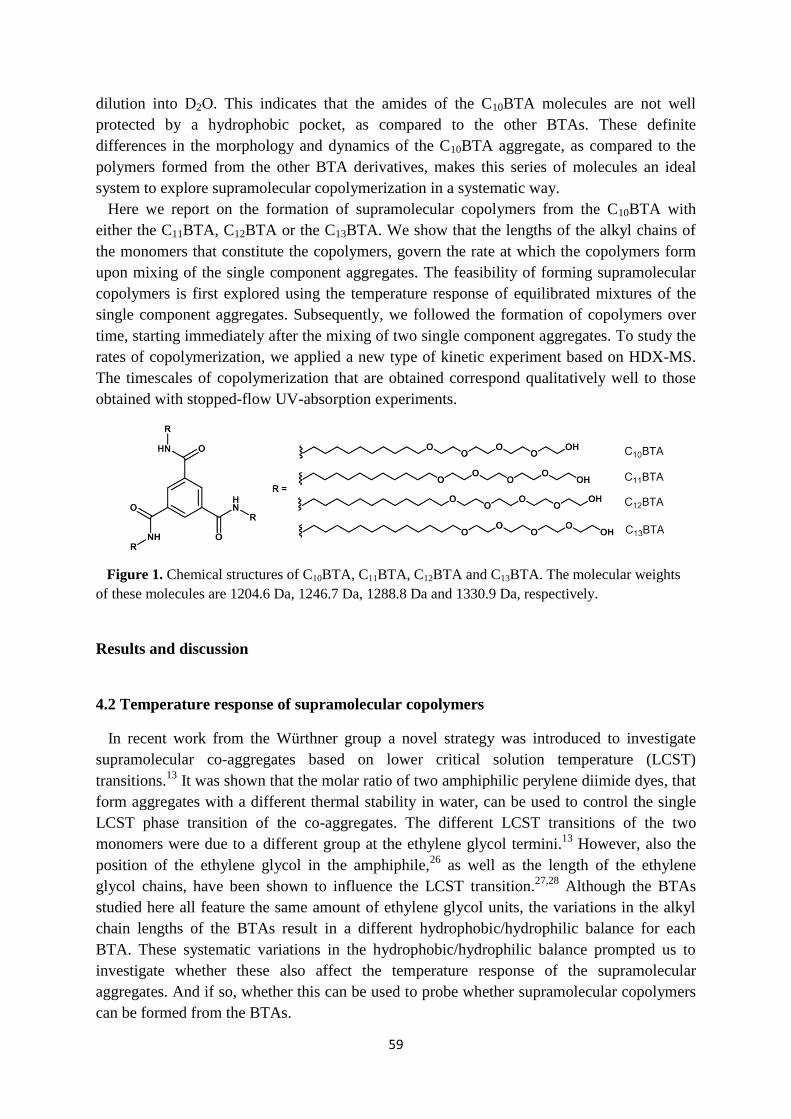
59
dilution into D2O. This indicates that the amides of the C10BTA molecules are not well
protected by a hydrophobic pocket, as compared to the other BTAs. These definite
differences in the morphology and dynamics of the C10BTA aggregate, as compared to the
polymers formed from the other BTA derivatives, makes this series of molecules an ideal
system to explore supramolecular copolymerization in a systematic way.
Here we report on the formation of supramolecular copolymers from the C10BTA with
either the C11BTA, C12BTA or the C13BTA. We show that the lengths of the alkyl chains of
the monomers that constitute the copolymers, govern the rate at which the copolymers form
upon mixing of the single component aggregates. The feasibility of forming supramolecular
copolymers is first explored using the temperature response of equilibrated mixtures of the
single component aggregates. Subsequently, we followed the formation of copolymers over
time, starting immediately after the mixing of two single component aggregates. To study the
rates of copolymerization, we applied a new type of kinetic experiment based on HDX-MS.
The timescales of copolymerization that are obtained correspond qualitatively well to those
obtained with stopped-flow UV-absorption experiments.
Figure 1. Chemical structures of C10BTA, C11BTA, C12BTA and C13BTA. The molecular weights
of these molecules are 1204.6 Da, 1246.7 Da, 1288.8 Da and 1330.9 Da, respectively.
Results and discussion
4.2 Temperature response of supramolecular copolymers
In recent work from the Würthner group a novel strategy was introduced to investigate
supramolecular co-aggregates based on lower critical solution temperature (LCST)
transitions.13
It was shown that the molar ratio of two amphiphilic perylene diimide dyes, that
form aggregates with a different thermal stability in water, can be used to control the single
LCST phase transition of the co-aggregates. The different LCST transitions of the two
monomers were due to a different group at the ethylene glycol termini.13
However, also the
position of the ethylene glycol in the amphiphile,26
as well as the length of the ethylene
glycol chains, have been shown to influence the LCST transition.27,28
Although the BTAs
studied here all feature the same amount of ethylene glycol units, the variations in the alkyl
chain lengths of the BTAs result in a different hydrophobic/hydrophilic balance for each
BTA. These systematic variations in the hydrophobic/hydrophilic balance prompted us to
investigate whether these also affect the temperature response of the supramolecular
aggregates. And if so, whether this can be used to probe whether supramolecular copolymers
can be formed from the BTAs.
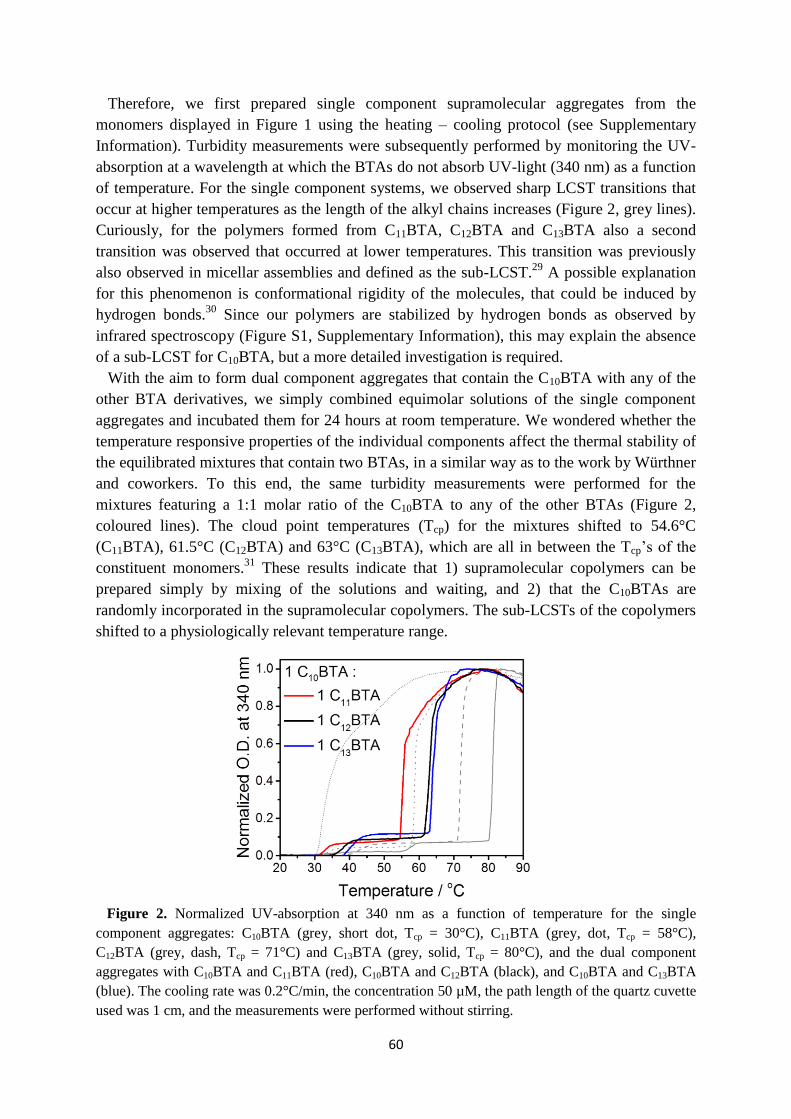
60
Therefore, we first prepared single component supramolecular aggregates from the
monomers displayed in Figure 1 using the heating – cooling protocol (see Supplementary
Information). Turbidity measurements were subsequently performed by monitoring the UV-
absorption at a wavelength at which the BTAs do not absorb UV-light (340 nm) as a function
of temperature. For the single component systems, we observed sharp LCST transitions that
occur at higher temperatures as the length of the alkyl chains increases (Figure 2, grey lines).
Curiously, for the polymers formed from C11BTA, C12BTA and C13BTA also a second
transition was observed that occurred at lower temperatures. This transition was previously
also observed in micellar assemblies and defined as the sub-LCST.29
A possible explanation
for this phenomenon is conformational rigidity of the molecules, that could be induced by
hydrogen bonds.30
Since our polymers are stabilized by hydrogen bonds as observed by
infrared spectroscopy (Figure S1, Supplementary Information), this may explain the absence
of a sub-LCST for C10BTA, but a more detailed investigation is required.
With the aim to form dual component aggregates that contain the C10BTA with any of the
other BTA derivatives, we simply combined equimolar solutions of the single component
aggregates and incubated them for 24 hours at room temperature. We wondered whether the
temperature responsive properties of the individual components affect the thermal stability of
the equilibrated mixtures that contain two BTAs, in a similar way as to the work by Würthner
and coworkers. To this end, the same turbidity measurements were performed for the
mixtures featuring a 1:1 molar ratio of the C10BTA to any of the other BTAs (Figure 2,
coloured lines). The cloud point temperatures (Tcp) for the mixtures shifted to 54.6°C
(C11BTA), 61.5°C (C12BTA) and 63°C (C13BTA), which are all in between the Tcp’s of the
constituent monomers.31
These results indicate that 1) supramolecular copolymers can be
prepared simply by mixing of the solutions and waiting, and 2) that the C10BTAs are
randomly incorporated in the supramolecular copolymers. The sub-LCSTs of the copolymers
shifted to a physiologically relevant temperature range.
Figure 2. Normalized UV-absorption at 340 nm as a function of temperature for the single
component aggregates: C10BTA (grey, short dot, Tcp = 30°C), C11BTA (grey, dot, Tcp = 58°C),
C12BTA (grey, dash, Tcp = 71°C) and C13BTA (grey, solid, Tcp = 80°C), and the dual component
aggregates with C10BTA and C11BTA (red), C10BTA and C12BTA (black), and C10BTA and C13BTA
(blue). The cooling rate was 0.2°C/min, the concentration 50 µM, the path length of the quartz cuvette
used was 1 cm, and the measurements were performed without stirring.
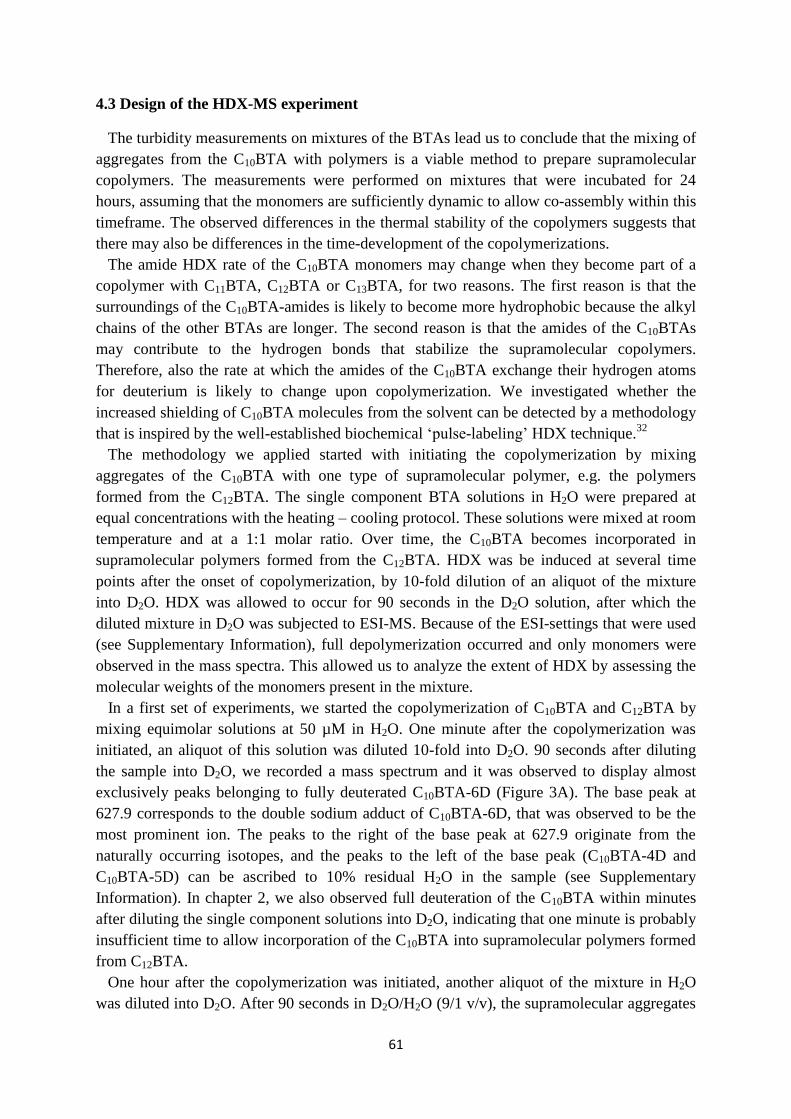
61
4.3 Design of the HDX-MS experiment
The turbidity measurements on mixtures of the BTAs lead us to conclude that the mixing of
aggregates from the C10BTA with polymers is a viable method to prepare supramolecular
copolymers. The measurements were performed on mixtures that were incubated for 24
hours, assuming that the monomers are sufficiently dynamic to allow co-assembly within this
timeframe. The observed differences in the thermal stability of the copolymers suggests that
there may also be differences in the time-development of the copolymerizations.
The amide HDX rate of the C10BTA monomers may change when they become part of a
copolymer with C11BTA, C12BTA or C13BTA, for two reasons. The first reason is that the
surroundings of the C10BTA-amides is likely to become more hydrophobic because the alkyl
chains of the other BTAs are longer. The second reason is that the amides of the C10BTAs
may contribute to the hydrogen bonds that stabilize the supramolecular copolymers.
Therefore, also the rate at which the amides of the C10BTA exchange their hydrogen atoms
for deuterium is likely to change upon copolymerization. We investigated whether the
increased shielding of C10BTA molecules from the solvent can be detected by a methodology
that is inspired by the well-established biochemical ‘pulse-labeling’ HDX technique.32
The methodology we applied started with initiating the copolymerization by mixing
aggregates of the C10BTA with one type of supramolecular polymer, e.g. the polymers
formed from the C12BTA. The single component BTA solutions in H2O were prepared at
equal concentrations with the heating – cooling protocol. These solutions were mixed at room
temperature and at a 1:1 molar ratio. Over time, the C10BTA becomes incorporated in
supramolecular polymers formed from the C12BTA. HDX was be induced at several time
points after the onset of copolymerization, by 10-fold dilution of an aliquot of the mixture
into D2O. HDX was allowed to occur for 90 seconds in the D2O solution, after which the
diluted mixture in D2O was subjected to ESI-MS. Because of the ESI-settings that were used
(see Supplementary Information), full depolymerization occurred and only monomers were
observed in the mass spectra. This allowed us to analyze the extent of HDX by assessing the
molecular weights of the monomers present in the mixture.
In a first set of experiments, we started the copolymerization of C10BTA and C12BTA by
mixing equimolar solutions at 50 µM in H2O. One minute after the copolymerization was
initiated, an aliquot of this solution was diluted 10-fold into D2O. 90 seconds after diluting
the sample into D2O, we recorded a mass spectrum and it was observed to display almost
exclusively peaks belonging to fully deuterated C10BTA-6D (Figure 3A). The base peak at
627.9 corresponds to the double sodium adduct of C10BTA-6D, that was observed to be the
most prominent ion. The peaks to the right of the base peak at 627.9 originate from the
naturally occurring isotopes, and the peaks to the left of the base peak (C10BTA-4D and
C10BTA-5D) can be ascribed to 10% residual H2O in the sample (see Supplementary
Information). In chapter 2, we also observed full deuteration of the C10BTA within minutes
after diluting the single component solutions into D2O, indicating that one minute is probably
insufficient time to allow incorporation of the C10BTA into supramolecular polymers formed
from C12BTA.
One hour after the copolymerization was initiated, another aliquot of the mixture in H2O
was diluted into D2O. After 90 seconds in D2O/H2O (9/1 v/v), the supramolecular aggregates
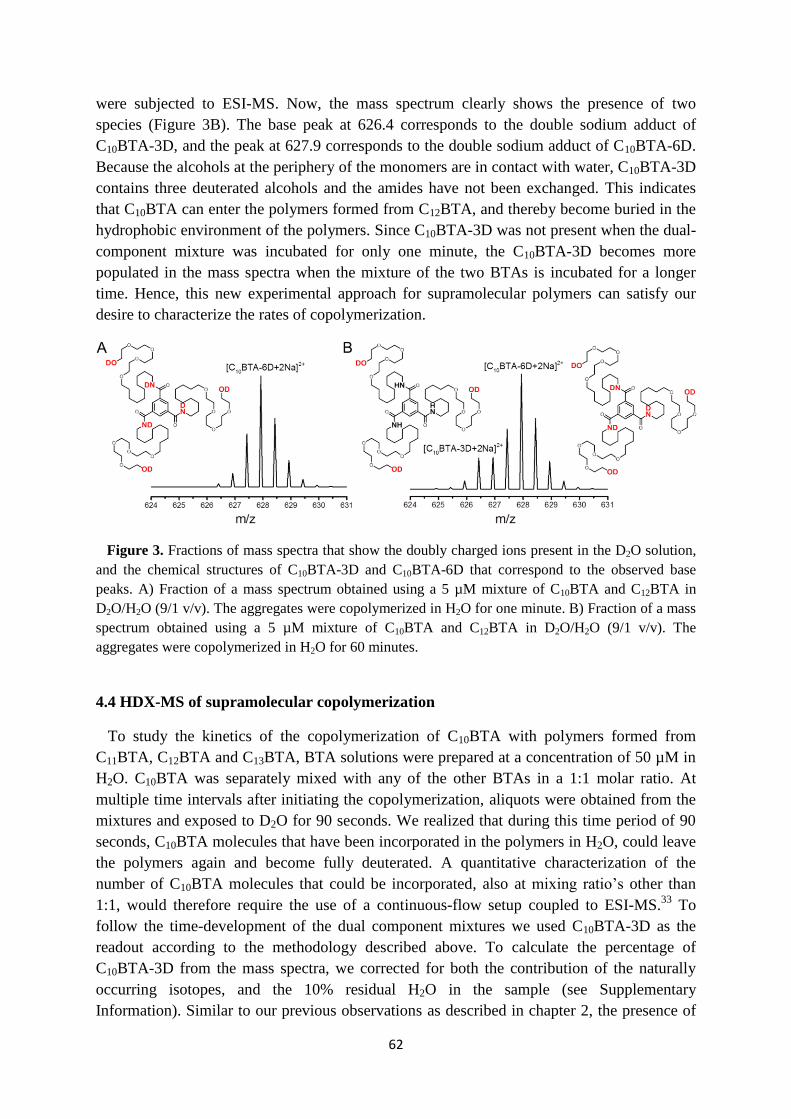
62
were subjected to ESI-MS. Now, the mass spectrum clearly shows the presence of two
species (Figure 3B). The base peak at 626.4 corresponds to the double sodium adduct of
C10BTA-3D, and the peak at 627.9 corresponds to the double sodium adduct of C10BTA-6D.
Because the alcohols at the periphery of the monomers are in contact with water, C10BTA-3D
contains three deuterated alcohols and the amides have not been exchanged. This indicates
that C10BTA can enter the polymers formed from C12BTA, and thereby become buried in the
hydrophobic environment of the polymers. Since C10BTA-3D was not present when the dual-
component mixture was incubated for only one minute, the C10BTA-3D becomes more
populated in the mass spectra when the mixture of the two BTAs is incubated for a longer
time. Hence, this new experimental approach for supramolecular polymers can satisfy our
desire to characterize the rates of copolymerization.
Figure 3. Fractions of mass spectra that show the doubly charged ions present in the D2O solution,
and the chemical structures of C10BTA-3D and C10BTA-6D that correspond to the observed base
peaks. A) Fraction of a mass spectrum obtained using a 5 µM mixture of C10BTA and C12BTA in
D2O/H2O (9/1 v/v). The aggregates were copolymerized in H2O for one minute. B) Fraction of a mass
spectrum obtained using a 5 µM mixture of C10BTA and C12BTA in D2O/H2O (9/1 v/v). The
aggregates were copolymerized in H2O for 60 minutes.
4.4 HDX-MS of supramolecular copolymerization
To study the kinetics of the copolymerization of C10BTA with polymers formed from
C11BTA, C12BTA and C13BTA, BTA solutions were prepared at a concentration of 50 µM in
H2O. C10BTA was separately mixed with any of the other BTAs in a 1:1 molar ratio. At
multiple time intervals after initiating the copolymerization, aliquots were obtained from the
mixtures and exposed to D2O for 90 seconds. We realized that during this time period of 90
seconds, C10BTA molecules that have been incorporated in the polymers in H2O, could leave
the polymers again and become fully deuterated. A quantitative characterization of the
number of C10BTA molecules that could be incorporated, also at mixing ratio’s other than
1:1, would therefore require the use of a continuous-flow setup coupled to ESI-MS.33
To
follow the time-development of the dual component mixtures we used C10BTA-3D as the
readout according to the methodology described above. To calculate the percentage of
C10BTA-3D from the mass spectra, we corrected for both the contribution of the naturally
occurring isotopes, and the 10% residual H2O in the sample (see Supplementary
Information). Similar to our previous observations as described in chapter 2, the presence of
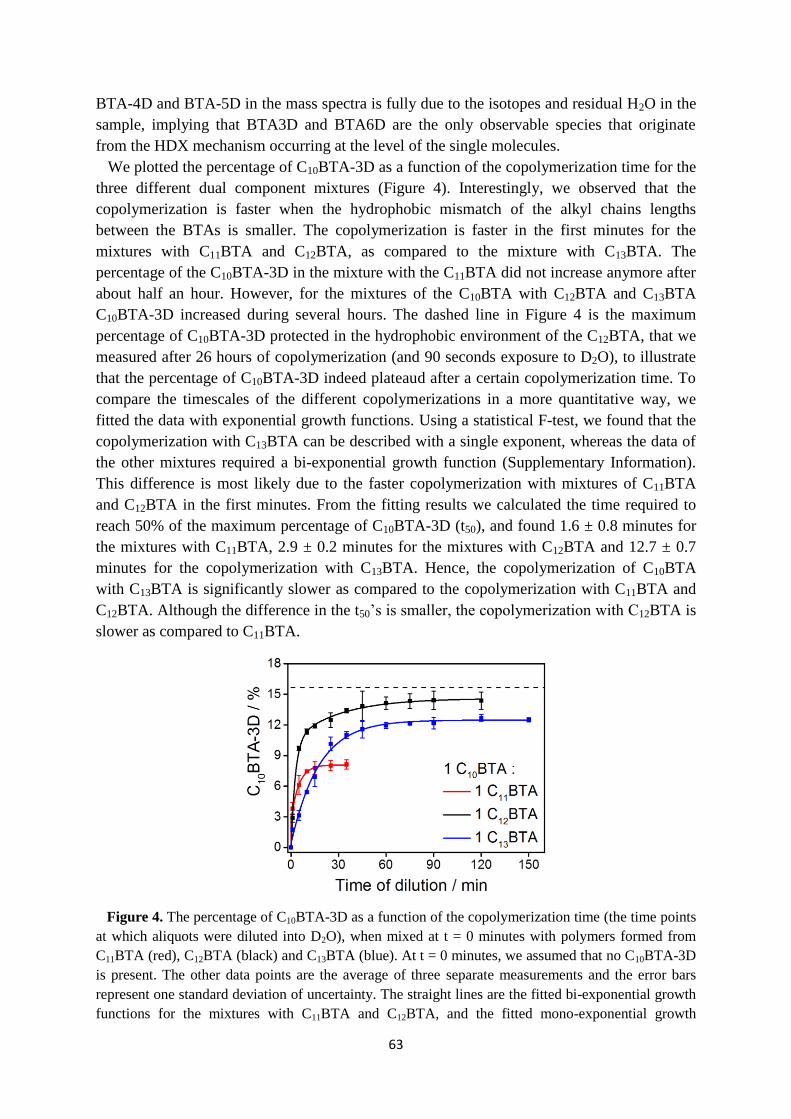
63
BTA-4D and BTA-5D in the mass spectra is fully due to the isotopes and residual H2O in the
sample, implying that BTA3D and BTA6D are the only observable species that originate
from the HDX mechanism occurring at the level of the single molecules.
We plotted the percentage of C10BTA-3D as a function of the copolymerization time for the
three different dual component mixtures (Figure 4). Interestingly, we observed that the
copolymerization is faster when the hydrophobic mismatch of the alkyl chains lengths
between the BTAs is smaller. The copolymerization is faster in the first minutes for the
mixtures with C11BTA and C12BTA, as compared to the mixture with C13BTA. The
percentage of the C10BTA-3D in the mixture with the C11BTA did not increase anymore after
about half an hour. However, for the mixtures of the C10BTA with C12BTA and C13BTA
C10BTA-3D increased during several hours. The dashed line in Figure 4 is the maximum
percentage of C10BTA-3D protected in the hydrophobic environment of the C12BTA, that we
measured after 26 hours of copolymerization (and 90 seconds exposure to D2O), to illustrate
that the percentage of C10BTA-3D indeed plateaud after a certain copolymerization time. To
compare the timescales of the different copolymerizations in a more quantitative way, we
fitted the data with exponential growth functions. Using a statistical F-test, we found that the
copolymerization with C13BTA can be described with a single exponent, whereas the data of
the other mixtures required a bi-exponential growth function (Supplementary Information).
This difference is most likely due to the faster copolymerization with mixtures of C11BTA
and C12BTA in the first minutes. From the fitting results we calculated the time required to
reach 50% of the maximum percentage of C10BTA-3D (t50), and found 1.6 ± 0.8 minutes for
the mixtures with C11BTA, 2.9 ± 0.2 minutes for the mixtures with C12BTA and 12.7 ± 0.7
minutes for the copolymerization with C13BTA. Hence, the copolymerization of C10BTA
with C13BTA is significantly slower as compared to the copolymerization with C11BTA and
C12BTA. Although the difference in the t50’s is smaller, the copolymerization with C12BTA is
slower as compared to C11BTA.
Figure 4. The percentage of C10BTA-3D as a function of the copolymerization time (the time points
at which aliquots were diluted into D2O), when mixed at t = 0 minutes with polymers formed from
C11BTA (red), C12BTA (black) and C13BTA (blue). At t = 0 minutes, we assumed that no C10BTA-3D
is present. The other data points are the average of three separate measurements and the error bars
represent one standard deviation of uncertainty. The straight lines are the fitted bi-exponential growth
functions for the mixtures with C11BTA and C12BTA, and the fitted mono-exponential growth
64
function for the mixture with C13BTA. The dashed line is the average percentage of C10BTA-3D
obtained after 26 hours of copolymerization with C12BTA. All experiments were performed at room
temperature (~ 20°C) and at a concentration of 50 µM.
The different maximum percentages of C10BTA-3D that were attained by the mixtures
cannot be interpreted in terms of molecular events; in addition to the molecular movements
that occur during the 90 seconds exposure to D2O, the copolymers that are being formed may
have a different kinetic stability that is changing over time. To deepen our understanding of
the kinetic differences observed for the variations in the alkyl chain length, we have also
calculated and plotted the percentage of C11BTA-3D, C12BTA-3D and C13BTA-3D of the
corresponding copolymerization experiments with C10BTA (Figure 5A). Curiously, we
observed that during the first minutes the contribution of C11BTA-3D and C12BTA-3D is
slightly increased, whereas for C13BTA-3D a temporary decrease is observed. Hence, during
the first minutes when C10BTA already becomes incorporated in the polymers, C10BTA also
influences the amide HDX of the other component. This implies that there is a synergistic
effect when C10BTA molecules are incorporated into the polymers of C11BTA and C12BTA,
because they were stabilized during the first minutes. Although these trends and the
difference with C13BTA seem to be consistent with the first minutes of the kinetic traces
displayed in Figure 4, currently no experimental techniques are available to investigate these
structures at both the time and spatial resolution required to provide further details. To
exclude any influence of the mixing protocol on the HDX kinetics, we also mixed equimolar
solutions containing the same BTA and plotted the percentage of BTA-3D as a function of
the copolymerization time (Figure 5B). The absence of variations in BTA-3D% implies that
the effects observed in Figure 5A are indeed due to the presence of C10BTA. On close
inspection, the values of BTA-3D% in the single component systems are lower as compared
to the steady values of BTA-3D% in the two component experiments. Certainly, C10BTA has
a stabilizing effect on the copolymers and this is in line with previous observations
(unpublished results).
Figure 5. The percentage of C11BTA-3D, C12BTA-3D and C13BTA-3D: A) as a function of the
copolymerization time with C10BTA colored as red, black and blue, respectively, and B) as a function
of time after the 1:1 mixing with an equally concentrated BTA solution containing the same BTA. In
both graphs, all data points are the average of three separate measurements and the error bars
represent one standard deviation of uncertainty.
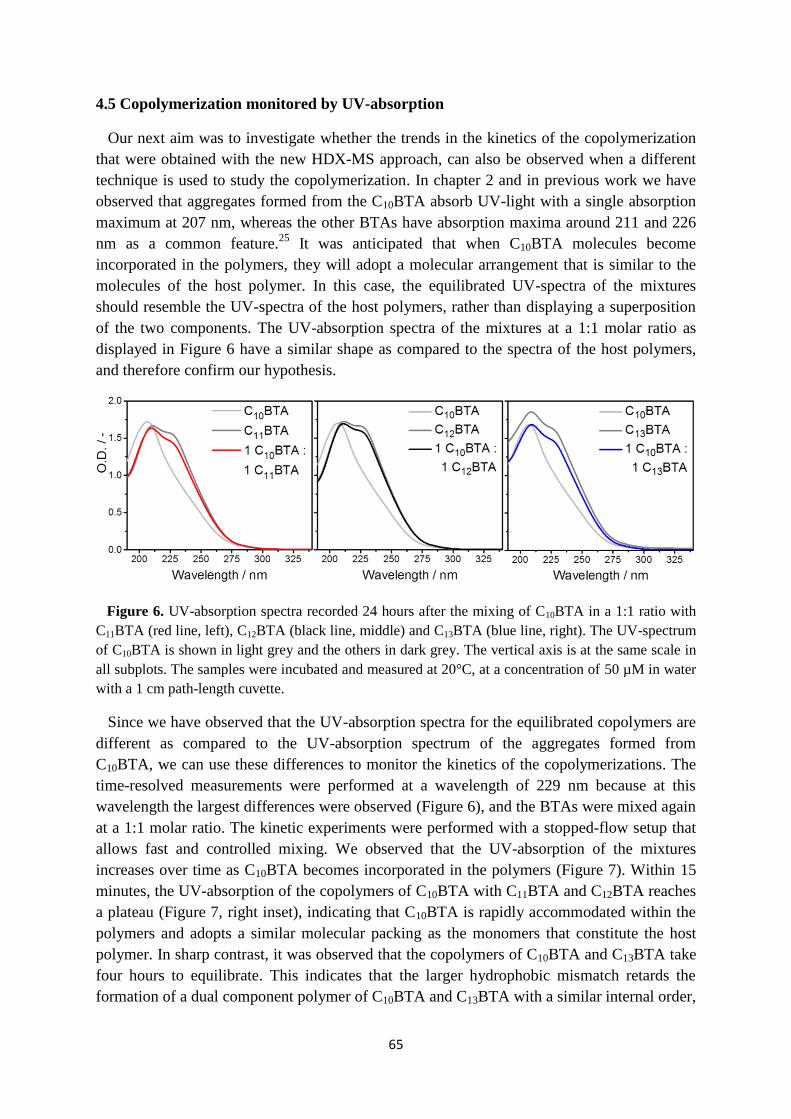
65
4.5 Copolymerization monitored by UV-absorption
Our next aim was to investigate whether the trends in the kinetics of the copolymerization
that were obtained with the new HDX-MS approach, can also be observed when a different
technique is used to study the copolymerization. In chapter 2 and in previous work we have
observed that aggregates formed from the C10BTA absorb UV-light with a single absorption
maximum at 207 nm, whereas the other BTAs have absorption maxima around 211 and 226
nm as a common feature.25
It was anticipated that when C10BTA molecules become
incorporated in the polymers, they will adopt a molecular arrangement that is similar to the
molecules of the host polymer. In this case, the equilibrated UV-spectra of the mixtures
should resemble the UV-spectra of the host polymers, rather than displaying a superposition
of the two components. The UV-absorption spectra of the mixtures at a 1:1 molar ratio as
displayed in Figure 6 have a similar shape as compared to the spectra of the host polymers,
and therefore confirm our hypothesis.
Figure 6. UV-absorption spectra recorded 24 hours after the mixing of C10BTA in a 1:1 ratio with
C11BTA (red line, left), C12BTA (black line, middle) and C13BTA (blue line, right). The UV-spectrum
of C10BTA is shown in light grey and the others in dark grey. The vertical axis is at the same scale in
all subplots. The samples were incubated and measured at 20°C, at a concentration of 50 µM in water
with a 1 cm path-length cuvette.
Since we have observed that the UV-absorption spectra for the equilibrated copolymers are
different as compared to the UV-absorption spectrum of the aggregates formed from
C10BTA, we can use these differences to monitor the kinetics of the copolymerizations. The
time-resolved measurements were performed at a wavelength of 229 nm because at this
wavelength the largest differences were observed (Figure 6), and the BTAs were mixed again
at a 1:1 molar ratio. The kinetic experiments were performed with a stopped-flow setup that
allows fast and controlled mixing. We observed that the UV-absorption of the mixtures
increases over time as C10BTA becomes incorporated in the polymers (Figure 7). Within 15
minutes, the UV-absorption of the copolymers of C10BTA with C11BTA and C12BTA reaches
a plateau (Figure 7, right inset), indicating that C10BTA is rapidly accommodated within the
polymers and adopts a similar molecular packing as the monomers that constitute the host
polymer. In sharp contrast, it was observed that the copolymers of C10BTA and C13BTA take
four hours to equilibrate. This indicates that the larger hydrophobic mismatch retards the
formation of a dual component polymer of C10BTA and C13BTA with a similar internal order,
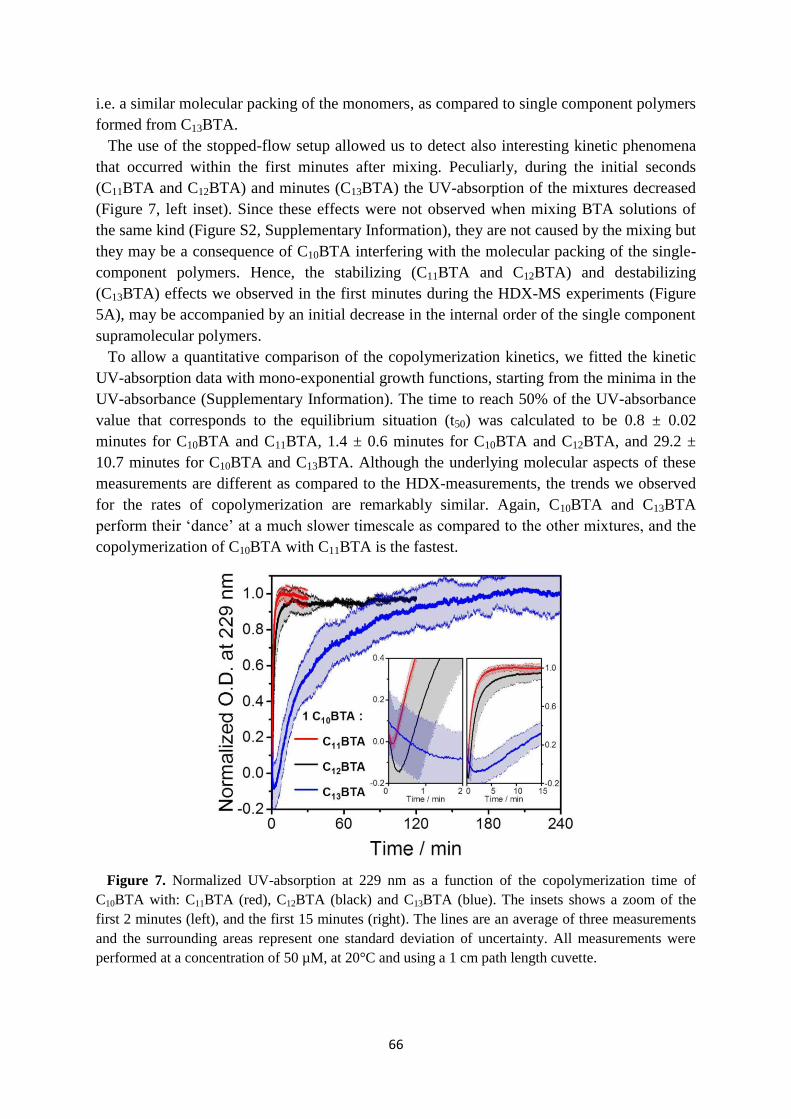
66
i.e. a similar molecular packing of the monomers, as compared to single component polymers
formed from C13BTA.
The use of the stopped-flow setup allowed us to detect also interesting kinetic phenomena
that occurred within the first minutes after mixing. Peculiarly, during the initial seconds
(C11BTA and C12BTA) and minutes (C13BTA) the UV-absorption of the mixtures decreased
(Figure 7, left inset). Since these effects were not observed when mixing BTA solutions of
the same kind (Figure S2, Supplementary Information), they are not caused by the mixing but
they may be a consequence of C10BTA interfering with the molecular packing of the single-
component polymers. Hence, the stabilizing (C11BTA and C12BTA) and destabilizing
(C13BTA) effects we observed in the first minutes during the HDX-MS experiments (Figure
5A), may be accompanied by an initial decrease in the internal order of the single component
supramolecular polymers.
To allow a quantitative comparison of the copolymerization kinetics, we fitted the kinetic
UV-absorption data with mono-exponential growth functions, starting from the minima in the
UV-absorbance (Supplementary Information). The time to reach 50% of the UV-absorbance
value that corresponds to the equilibrium situation (t50) was calculated to be 0.8 ± 0.02
minutes for C10BTA and C11BTA, 1.4 ± 0.6 minutes for C10BTA and C12BTA, and 29.2 ±
10.7 minutes for C10BTA and C13BTA. Although the underlying molecular aspects of these
measurements are different as compared to the HDX-measurements, the trends we observed
for the rates of copolymerization are remarkably similar. Again, C10BTA and C13BTA
perform their ‘dance’ at a much slower timescale as compared to the other mixtures, and the
copolymerization of C10BTA with C11BTA is the fastest.
Figure 7. Normalized UV-absorption at 229 nm as a function of the copolymerization time of
C10BTA with: C11BTA (red), C12BTA (black) and C13BTA (blue). The insets shows a zoom of the
first 2 minutes (left), and the first 15 minutes (right). The lines are an average of three measurements
and the surrounding areas represent one standard deviation of uncertainty. All measurements were
performed at a concentration of 50 µM, at 20°C and using a 1 cm path length cuvette.
67
4.6 Conclusions
Supramolecular copolymers in water are a topic of recent interest, and the features that
control the rates at which they form have yet to be addressed. In this contribution, we have
reported the formation of supramolecular copolymers using a series of BTAs with differences
in the length of the alkyl chains. Turbidity measurements indicated that supramolecular
copolymers can be formed and that the monomers randomly co-assemble. To study the
influence of the alkyl chain length on the kinetics of copolymerization, we designed and
tested a novel HDX-MS approach that was inspired by the ‘pulse-labeling’ HDX technique
well-known in biochemistry. The HDX-MS results led us to conclude that the smaller the
hydrophobic mismatch, the faster the rates of copolymerization. Kinetic UV-absorption
measurements further support this conclusion. We observed that C10BTA is incorporated at a
significantly slower rate in polymers formed from C13BTA, indicating that the effect is not
linear. The presence of a sub-LCST that was revealed during our turbidity measurements, as
well as the transient effects observed in the first minutes or seconds during the HDX- and
UV-experiments, require further investigation. Future studies could also systematically
address the influence of other interactions on the rates of copolymerization, by involving for
example aromatic, charge-transfer or electrostatic interactions.34-36
In addition, valuable
information may be obtained using different mixing ratio’s, studying the influence of
isodesmic and cooperative polymerization mechanisms on copolymerization, and using
systems in which co-assembly can be triggered by a change in the solution conditions.37
Only
by understanding the key features that dictate supramolecular copolymerization and studying
the consequences on the properties of the polymers, we can unlock the full potential of
supramolecular polymers towards functional architectures and materials.
Reflecting on the results in chapter 2, we illustrated in Figure 7 of that chapter that the
HDX kinetics of the single component polymers gradually becomes slower upon increasing
the alkyl chain length from eleven to thirteen carbon atoms. From Figure 5 in this chapter we
concluded that the copolymers with C10BTA are kinetically more stable as compared to the
single component polymers. From these observations we could not have predicted the
significantly slower copolymerization of C10BTA with C13BTA, as compared to the other
mixtures. Hence, this indicates the importance of studying the kinetics of the non-covalent
synthesis of multicomponent polymers, because the kinetics are difficult to deduce from the
dynamics of the constituent building blocks. In the next chapter we will switch from kinetic
studies to an in-depth structural characterization of the supramolecular polymers formed from
the C12BTA.
4.7 Supplementary information
Instrumentation and materials. HDX-MS measurements were carried out using a Xevo G2
QTof mass spectrometer (Waters) with a capillary voltage of 2.7 kV, a sampling cone voltage of 80 V
and an extraction cone voltage of 4.0 V. The source temperature was set at 100 °C, the desolvation
temperature at 400 °C, the cone gas flow at 10 L/h and the desolvation gas flow at 500 L/h. The
sample solutions subjected to HDX were introduced into the mass spectrometer using a Harvard
syringe pump (11 Plus, Harvard Apparatus) at a flow rate of 50 µL/min, and the signal was
accumulated during 60 seconds.
68
Stopped-flow UV-Vis measurements were performed with a BioLogic stopped-flow setup
consisting of a MOS-500 spectrometer with Xe/Hg light source, an ALX 250 Arc Lamp Power
Supply, SAS PMT-450 photomultiplier tube, an SFM-400/S stopped-flow module with an MPS-60
microprocessor unit and a Julabo F-12 temperature control system. BioKine 32 software was used to
operate the stopped-flow setup. All measurements were performed at a wavelength of 229 nm, with a
bandwidth of 1 nm and using a sampling time of 1 sec. The high voltage (HV) applied on the
photomultiplier tube was set at a constant 340 V. Samples were mixed in a 1:1 ratio at a flow rate of
14 mL/s. All measurements were performed using a BioLogic TC-100/10C cuvet with a path length
of 1 cm, and at a temperature of 20 °C.
UV-Vis absorbance spectra were recorded on a Jasco V-650 UV-Vis spectrometer equipped
with a Jasco ETCT-762 temperature controller. Measurements were performed in a Quartz cuvet with
a path length of 1 cm at 20 °C, and were corrected using MQ-water as a baseline. All measurements
were performed with a bandwidth of 1.0 nm, a scan speed of 100 nm/min and a data interval of 0.1
nm, spanning the UV-Vis range of 350 nm to 190 nm. The turbidity measurements were performed
with a bandwidth of 1.0 nm and were recorded at 340 nm by sampling every 0.5 °C. A heating-
cooling program with a start temperature of 20 °C, a temperature ramp of 0.2 °C/min and a maximum
temperature of 90 °C was used. Some hysteresis was observed between the heating and cooling
curves. Since the latter displayed the clearest transitions, the cooling curves were used to create Figure
2 in the chapter.
Infrared spectra were recorded on a Perkin Elmer Spectrum Two FT-IR spectrometer,
equipped with a Perkin Elmer Universal ATR Sampler Accessory. Solution FT-IR measurements
were performed using a CaF2 Liquid Cell with an optical path length of 0.05 mm. For the solution
samples, first a background of the appropriate solvent was measured. All spectra were measured at
room temperature from 700 cm-1
to 4000 cm-1
. The solid state samples were averaged over 16 scans
and the solution samples were averaged over 128 scans.
The synthesis of the BTAs used in this chapter was previously reported.25
The water used to
prepare the BTA samples was purified on an EMD Millipore Milli-Q Integral Water Purification
System, and subsequently filtered using a 0.2 µm syringe filter (Supor membrane, PALL
Corporation).
BTA sample preparation. The solid C12BTA was weighed out and added to a glass vial.
Filtered MQ-water was added to obtain a concentration of 50 µM. The mixture was stirred, with a
magnetic stirring bar, at 80 °C for 15 minutes. The hot and hazy mixture was vortexed for 15 seconds
and was subsequently left to equilibrate at room temperature overnight. Since C10BTA and C11BTA
are oily substances, they were transferred from the weighing boat to the glass vial with CHCl3. The
CHCl3 was evaporated by blowing a constant stream of N2 (g) 1 cm above the solvent level, before
filtered MQ-water was added to obtain a concentration of 50 µM. The same heating and vortexing
protocol as used for C12BTA was followed. C13BTA samples were prepared by adding the solid
material to a glass vial. Approximately 300 µL CHCl3 was added and the sample was vortexed for 15
seconds to dissolve the BTA. The CHCl3 was evaporated with a stream of N2 (g) approximately 1 cm
above the solvent level. Then, filtered MQ-water was added to obtain a concentration of 50-100 µM.
The sample was stirred, with a magnetic stirring bar, at 80 °C for 15 minutes. Subsequently, the hot
and hazy mixture was vortexed for 15 seconds and was left to equilibrate at room temperature
overnight. The next day, the C13BTA sample was filtered with a 0.2 µm syringe filter (Supor
membrane, PALL Corporation) to remove precipitates. By blowing a constant stream of N2 (g) 1 cm
above the solvent level, while stirring, water was evaporated from the sample to increase the
concentration to 50 µM. The concentration was determined with UV-spectroscopy, using calibration
curves based on the absorbance of C12BTA at 250 nm. All samples were left to equilibrate overnight

69
before the copolymerization experiments. UV-spectra recorded of copolymers (Figure 6) were
recorded 24 h after mixing. The mixtures containing two BTAs that were used for the turbidity
experiments were equilibrated 24 h before use.
HDX-MS of copolymerization. To study the incorporation of C10BTA into a supramolecular
polymer with HDX-MS, 50 µM samples of the pre-assembled C10BTA were added to 50 µM samples
of a supramolecular polymer (at t = 0 min), and a timer was started. The samples were vortexed for 3
seconds to mix the samples. 20 µL aliquots of this sample in H2O were periodically taken and were
diluted 10 times into D2O (including 0.5 mM sodium acetate to facilitate the detection), by adding 180
µL D2O using a micropipette. All samples were stored at room temperature during the course of the
HDX experiments (~ 20°C). Within 30 seconds the diluted samples were transferred to the syringe.
Samples were injected with a syringe pump and the signal was left to equilibrate for one minute
before starting the measurement. The measurements were started exactly 90 seconds after the dilution
according to the timer, and they were accumulated over one minute at a flow rate of 50 µL/min to
account for instabilities in the signal. Before the measurements, the system was calibrated.
Calculating the percentage of BTA3D. Because 20 µL of the BTA sample solutions in
water were diluted into 180 µL D2O, 10 vol% of H2O was present in the diluted samples. This results
in monomers with incomplete HDX, hence more BTA-1D, BTA-2D, BTA-4D and BTA-5D will be
detected. The statistical ratio BTA-1D : BTA-2D : BTA-3D is 3.7x10⁻³
: 8.3x10⁻²
: 1 and the statistical
ratio BTA-4D : BTA-5D : BTA-6D is 1.9x10⁻¹
: 6.7x10⁻¹
: 1. Therefore, we took the presence of BTA-
2D, BTA-4D and BTA-5D into account when calculating the percentage of BTA-3D. Moreover, all
intensities were corrected for the isotope overlap of BTA-3D. The isotope patterns were calculated
with Bruker Compass IsotopePattern. For C10BTA-3D, this resulted in the following formula:
C10BTA-3D% = I626.42
I625.92 + I626.42 + (I626.92 - 0.71I626.42) + (I627.42 - 0.29I626.42) + (I627.93 - 0.08I626.42) × 100% ,
with I626.42 the intensity corresponding to C10BTA-3D and I625.92 the intensity corresponding to
C10BTA-2D. (I626.92-0.71I626.42) is the intensity corresponding to C10BTA-4D, (I627.42-0.29I626.42) is the
intensity corresponding to C10BTA-5D, and (I627.93-0.08I626.42) is the intensity corresponding to
C10BTA-6D, with 0.71, 0.29 and 0.08 following from the calculated isotope patterns. To calculate the
percentage of BTA3D of the other BTAs, similar formula’s were applied:
C11BTA-3D% = I647.44
I646.94 + I647.44 + (I647.94 - 0.75I647.44) + (I648.45 - 0.31I647.44) + (I648.95 - 0.09I647.44) × 100%
C12BTA-3D% = I668.46
I667.96 + I668.46 + (I668.97 - 0.78I668.46) + (I669.47 - 0.34I668.46) + (I669.97 - 0.10I668.46) × 100%
C13BTA-3D% = I689.47
I688.97 + I689.47 + (I689.97 - 0.81I689.47) + (I690.47 - 0.36I689.47) + (I690.98 - 0.12I689.47) × 100%
Fitting the percentage of C10BTA-3D. The percentage of C10BTA-3D was averaged over
three measurements and was plotted as a function of time using Origin 2015. These kinetic traces
were fitted with functions available in Origin 2015; the percentage of C10BTA-3D in the mixtures was
fitted with the ExpGro2 function, y = A1*exp(t/t1) + A2*exp(t/t2) + y0 and with the ExpGro1
function, y = A1*exp(t/t1) + y0. A1, t1, A2, t2 and y0 are the parameters being varied during the
fitting and t is the independent variable (time in minutes). A statistical F-test was subsequently used to
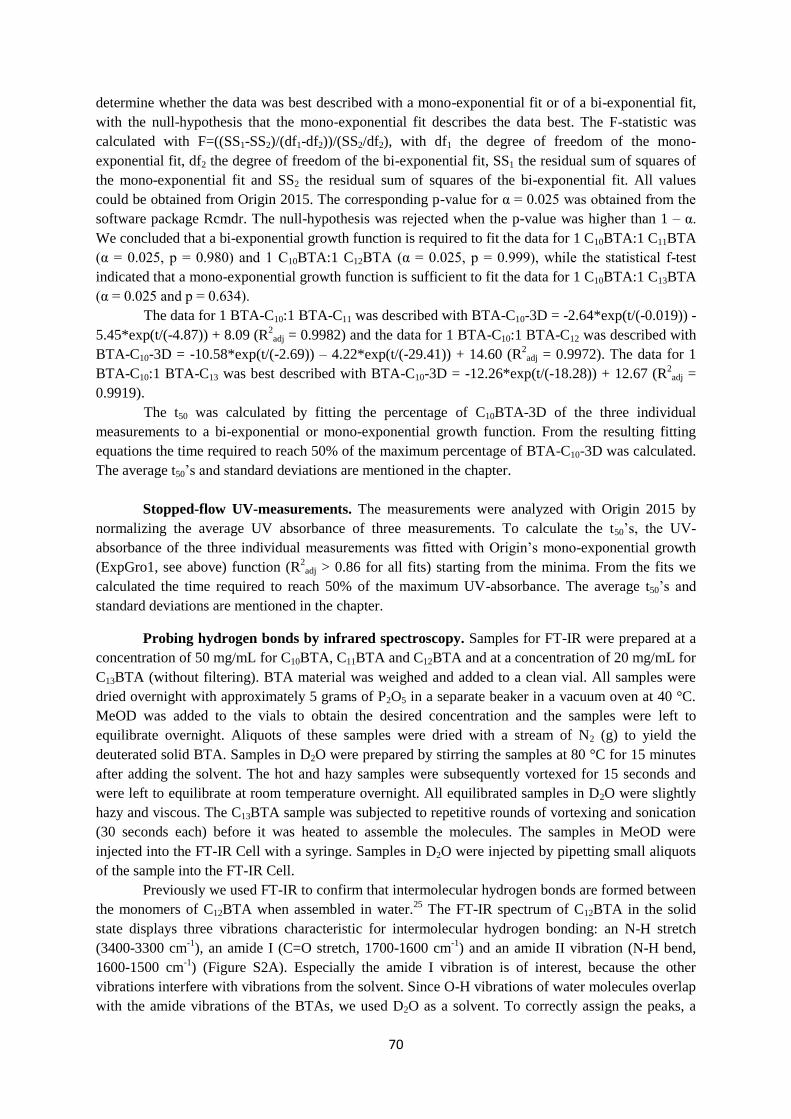
70
determine whether the data was best described with a mono-exponential fit or of a bi-exponential fit,
with the null-hypothesis that the mono-exponential fit describes the data best. The F-statistic was
calculated with F=((SS1-SS2)/(df1-df2))/(SS2/df2), with df1 the degree of freedom of the mono-
exponential fit, df2 the degree of freedom of the bi-exponential fit, SS1 the residual sum of squares of
the mono-exponential fit and SS2 the residual sum of squares of the bi-exponential fit. All values
could be obtained from Origin 2015. The corresponding p-value for α = 0.025 was obtained from the
software package Rcmdr. The null-hypothesis was rejected when the p-value was higher than 1 – α.
We concluded that a bi-exponential growth function is required to fit the data for 1 C10BTA:1 C11BTA
(α = 0.025, p = 0.980) and 1 C10BTA:1 C12BTA (α = 0.025, p = 0.999), while the statistical f-test
indicated that a mono-exponential growth function is sufficient to fit the data for 1 C10BTA:1 C13BTA
(α = 0.025 and p = 0.634).
The data for 1 BTA-C10:1 BTA-C11 was described with BTA-C10-3D = -2.64*exp(t/(-0.019)) -
5.45*exp(t/(-4.87)) + 8.09 (R2adj = 0.9982) and the data for 1 BTA-C10:1 BTA-C12 was described with
BTA-C10-3D = -10.58*exp(t/(-2.69)) – 4.22*exp(t/(-29.41)) + 14.60 (R2adj = 0.9972). The data for 1
BTA-C10:1 BTA-C13 was best described with BTA-C10-3D = -12.26*exp(t/(-18.28)) + 12.67 (R2
adj =
0.9919).
The t50 was calculated by fitting the percentage of C10BTA-3D of the three individual
measurements to a bi-exponential or mono-exponential growth function. From the resulting fitting
equations the time required to reach 50% of the maximum percentage of BTA-C10-3D was calculated.
The average t50’s and standard deviations are mentioned in the chapter.
Stopped-flow UV-measurements. The measurements were analyzed with Origin 2015 by
normalizing the average UV absorbance of three measurements. To calculate the t50’s, the UV-
absorbance of the three individual measurements was fitted with Origin’s mono-exponential growth
(ExpGro1, see above) function (R2adj > 0.86 for all fits) starting from the minima. From the fits we
calculated the time required to reach 50% of the maximum UV-absorbance. The average t50’s and
standard deviations are mentioned in the chapter.
Probing hydrogen bonds by infrared spectroscopy. Samples for FT-IR were prepared at a
concentration of 50 mg/mL for C10BTA, C11BTA and C12BTA and at a concentration of 20 mg/mL for
C13BTA (without filtering). BTA material was weighed and added to a clean vial. All samples were
dried overnight with approximately 5 grams of P2O5 in a separate beaker in a vacuum oven at 40 °C.
MeOD was added to the vials to obtain the desired concentration and the samples were left to
equilibrate overnight. Aliquots of these samples were dried with a stream of N2 (g) to yield the
deuterated solid BTA. Samples in D2O were prepared by stirring the samples at 80 °C for 15 minutes
after adding the solvent. The hot and hazy samples were subsequently vortexed for 15 seconds and
were left to equilibrate at room temperature overnight. All equilibrated samples in D2O were slightly
hazy and viscous. The C13BTA sample was subjected to repetitive rounds of vortexing and sonication
(30 seconds each) before it was heated to assemble the molecules. The samples in MeOD were
injected into the FT-IR Cell with a syringe. Samples in D2O were injected by pipetting small aliquots
of the sample into the FT-IR Cell.
Previously we used FT-IR to confirm that intermolecular hydrogen bonds are formed between
the monomers of C12BTA when assembled in water.25
The FT-IR spectrum of C12BTA in the solid
state displays three vibrations characteristic for intermolecular hydrogen bonding: an N-H stretch
(3400-3300 cm-1
), an amide I (C=O stretch, 1700-1600 cm-1
) and an amide II vibration (N-H bend,
1600-1500 cm-1
) (Figure S2A). Especially the amide I vibration is of interest, because the other
vibrations interfere with vibrations from the solvent. Since O-H vibrations of water molecules overlap
with the amide vibrations of the BTAs, we used D2O as a solvent. To correctly assign the peaks, a
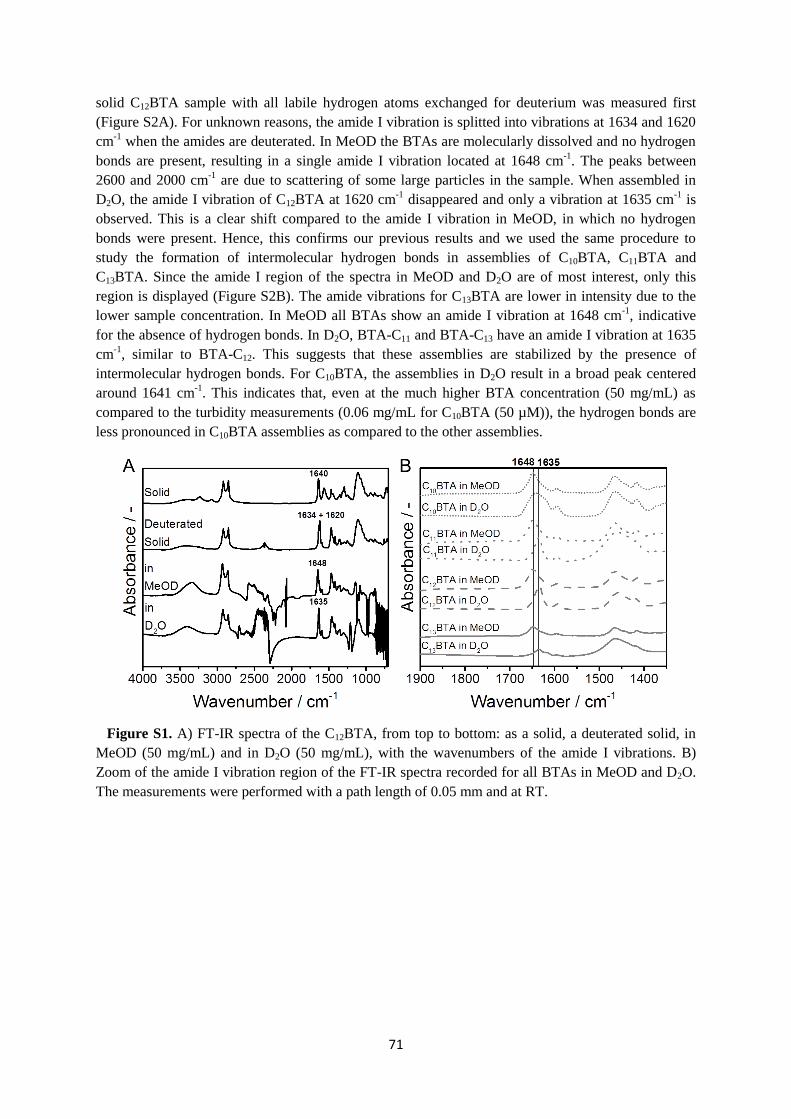
71
solid C12BTA sample with all labile hydrogen atoms exchanged for deuterium was measured first
(Figure S2A). For unknown reasons, the amide I vibration is splitted into vibrations at 1634 and 1620
cm-1
when the amides are deuterated. In MeOD the BTAs are molecularly dissolved and no hydrogen
bonds are present, resulting in a single amide I vibration located at 1648 cm-1
. The peaks between
2600 and 2000 cm-1
are due to scattering of some large particles in the sample. When assembled in
D2O, the amide I vibration of C12BTA at 1620 cm-1
disappeared and only a vibration at 1635 cm-1
is
observed. This is a clear shift compared to the amide I vibration in MeOD, in which no hydrogen
bonds were present. Hence, this confirms our previous results and we used the same procedure to
study the formation of intermolecular hydrogen bonds in assemblies of C10BTA, C11BTA and
C13BTA. Since the amide I region of the spectra in MeOD and D2O are of most interest, only this
region is displayed (Figure S2B). The amide vibrations for C13BTA are lower in intensity due to the
lower sample concentration. In MeOD all BTAs show an amide I vibration at 1648 cm-1
, indicative
for the absence of hydrogen bonds. In D2O, BTA-C11 and BTA-C13 have an amide I vibration at 1635
cm-1
, similar to BTA-C12. This suggests that these assemblies are stabilized by the presence of
intermolecular hydrogen bonds. For C10BTA, the assemblies in D2O result in a broad peak centered
around 1641 cm-1
. This indicates that, even at the much higher BTA concentration (50 mg/mL) as
compared to the turbidity measurements (0.06 mg/mL for C10BTA (50 µM)), the hydrogen bonds are
less pronounced in C10BTA assemblies as compared to the other assemblies.
Figure S1. A) FT-IR spectra of the C12BTA, from top to bottom: as a solid, a deuterated solid, in
MeOD (50 mg/mL) and in D2O (50 mg/mL), with the wavenumbers of the amide I vibrations. B)
Zoom of the amide I vibration region of the FT-IR spectra recorded for all BTAs in MeOD and D2O.
The measurements were performed with a path length of 0.05 mm and at RT.
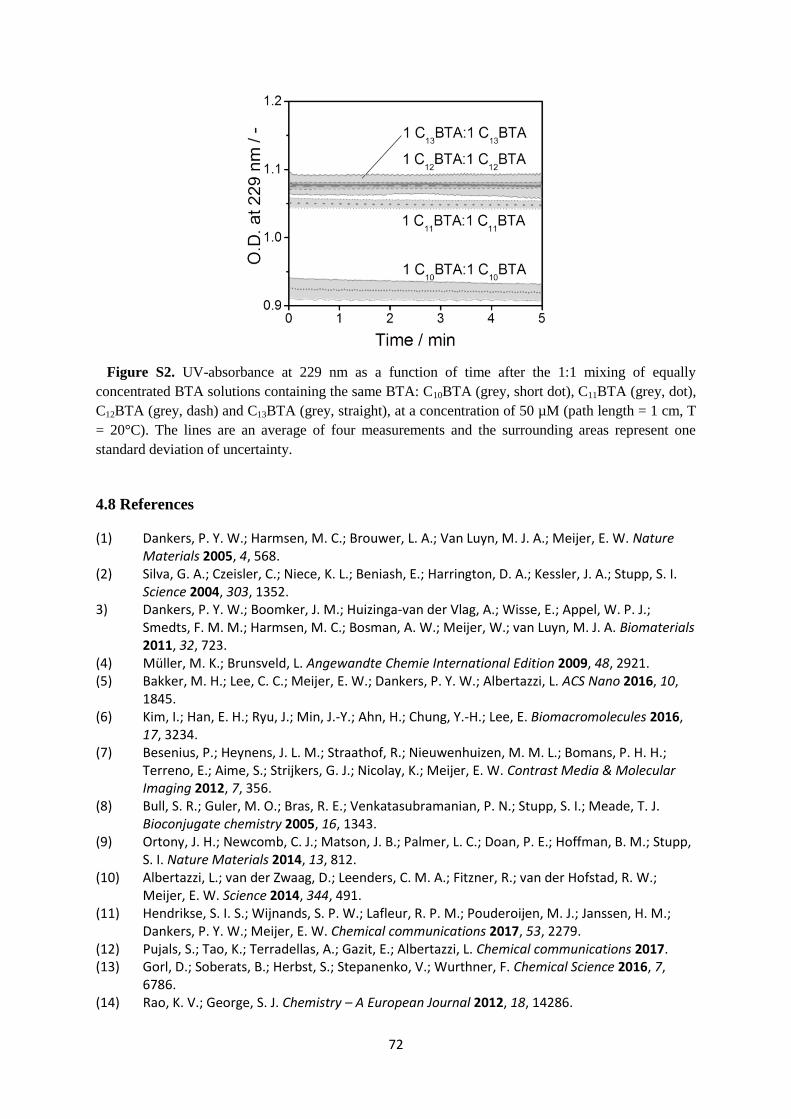
72
Figure S2. UV-absorbance at 229 nm as a function of time after the 1:1 mixing of equally
concentrated BTA solutions containing the same BTA: C10BTA (grey, short dot), C11BTA (grey, dot),
C12BTA (grey, dash) and C13BTA (grey, straight), at a concentration of 50 µM (path length = 1 cm, T
= 20°C). The lines are an average of four measurements and the surrounding areas represent one
standard deviation of uncertainty.
4.8 References
(1) Dankers, P. Y. W.; Harmsen, M. C.; Brouwer, L. A.; Van Luyn, M. J. A.; Meijer, E. W. Nature Materials 2005, 4, 568.
(2) Silva, G. A.; Czeisler, C.; Niece, K. L.; Beniash, E.; Harrington, D. A.; Kessler, J. A.; Stupp, S. I. Science 2004, 303, 1352.
3) Dankers, P. Y. W.; Boomker, J. M.; Huizinga-van der Vlag, A.; Wisse, E.; Appel, W. P. J.; Smedts, F. M. M.; Harmsen, M. C.; Bosman, A. W.; Meijer, W.; van Luyn, M. J. A. Biomaterials 2011, 32, 723.
(4) Müller, M. K.; Brunsveld, L. Angewandte Chemie International Edition 2009, 48, 2921. (5) Bakker, M. H.; Lee, C. C.; Meijer, E. W.; Dankers, P. Y. W.; Albertazzi, L. ACS Nano 2016, 10,
1845. (6) Kim, I.; Han, E. H.; Ryu, J.; Min, J.-Y.; Ahn, H.; Chung, Y.-H.; Lee, E. Biomacromolecules 2016,
17, 3234. (7) Besenius, P.; Heynens, J. L. M.; Straathof, R.; Nieuwenhuizen, M. M. L.; Bomans, P. H. H.;
Terreno, E.; Aime, S.; Strijkers, G. J.; Nicolay, K.; Meijer, E. W. Contrast Media & Molecular Imaging 2012, 7, 356.
(8) Bull, S. R.; Guler, M. O.; Bras, R. E.; Venkatasubramanian, P. N.; Stupp, S. I.; Meade, T. J. Bioconjugate chemistry 2005, 16, 1343.
(9) Ortony, J. H.; Newcomb, C. J.; Matson, J. B.; Palmer, L. C.; Doan, P. E.; Hoffman, B. M.; Stupp, S. I. Nature Materials 2014, 13, 812.
(10) Albertazzi, L.; van der Zwaag, D.; Leenders, C. M. A.; Fitzner, R.; van der Hofstad, R. W.; Meijer, E. W. Science 2014, 344, 491.
(11) Hendrikse, S. I. S.; Wijnands, S. P. W.; Lafleur, R. P. M.; Pouderoijen, M. J.; Janssen, H. M.; Dankers, P. Y. W.; Meijer, E. W. Chemical communications 2017, 53, 2279.
(12) Pujals, S.; Tao, K.; Terradellas, A.; Gazit, E.; Albertazzi, L. Chemical communications 2017. (13) Gorl, D.; Soberats, B.; Herbst, S.; Stepanenko, V.; Wurthner, F. Chemical Science 2016, 7,
6786. (14) Rao, K. V.; George, S. J. Chemistry – A European Journal 2012, 18, 14286.
73
(15) Fernandez-Castano Romera, M.; Lafleur, R. P. M.; Guibert, C.; Voets, I. K.; Storm, C.; Sijbesma, R. P. Angewandte Chemie 2017.
(16) Kieltyka, R. E.; Pape, A. C. H.; Albertazzi, L.; Nakano, Y.; Bastings, M. M. C.; Voets, I. K.; Dankers, P. Y. W.; Meijer, E. W. Journal of the American Chemical Society 2013, 135, 11159.
(17) Besenius, P. Journal of Polymer Science Part A: Polymer Chemistry 2017, 55, 34. (18) Fukui, T.; Kawai, S.; Fujinuma, S.; Matsushita, Y.; Yasuda, T.; Sakurai, T.; Seki, S.; Takeuchi, M.;
Sugiyasu, K. Nature Chemistry 2017, 9, 493. (19) Ogi, S.; Stepanenko, V.; Thein, J.; Würthner, F. Journal of the American Chemical Society
2016, 138, 670. (20) Cui, H.; Cheetham, A. G.; Pashuck, E. T.; Stupp, S. I. Journal of the American Chemical Society
2014, 136, 12461. (21) Pramanik, P.; Ray, D.; Aswal, V. K.; Ghosh, S. Angewandte Chemie International Edition 2017,
56, 3516. (22) Yu, Z.; Erbas, A.; Tantakitti, F.; Palmer, L. C.; Jackman, J. A.; Olvera de la Cruz, M.; Cho, N.-J.;
Stupp, S. I. Journal of the American Chemical Society 2017, 139, 7823. (23) Görl, D.; Zhang, X.; Stepanenko, V.; Würthner, F. Nature Communications 2015, 6. (24) Pal, A.; Malakoutikhah, M.; Leonetti, G.; Tezcan, M.; Colomb-Delsuc, M.; Nguyen, V. D.; van
der Gucht, J.; Otto, S. Angewandte Chemie International Edition 2015, 54, 7852. (25) Leenders, C. M. A.; Baker, M. B.; Pijpers, I. A. B.; Lafleur, R. P. M.; Albertazzi, L.; Palmans, A.
R. A.; Meijer, E. W. Soft Matter 2016, 12, 2887. (26) Cui, J.; Kwon, J. E.; Kim, H.-J.; Whang, D. R.; Park, S. Y. ACS Applied Materials & Interfaces
2017, 9, 2883. (27) Lutz, J.-F.; Hoth, A. Macromolecules 2006, 39, 893. (28) Kouwer, P. H. J.; Koepf, M.; Le Sage, V. A. A.; Jaspers, M.; van Buul, A. M.; Eksteen-Akeroyd,
Z. H.; Woltinge, T.; Schwartz, E.; Kitto, H. J.; Hoogenboom, R.; Picken, S. J.; Nolte, R. J. M.; Mendes, E.; Rowan, A. E. Nature 2013, 493, 651.
(29) Fuller, J. M.; Raghupathi, K. R.; Ramireddy, R. R.; Subrahmanyam, A. V.; Yesilyurt, V.; Thayumanavan, S. Journal of the American Chemical Society 2013, 135, 8947.
(30) Raghupathi, K. R.; Sridhar, U.; Byrne, K.; Raghupathi, K.; Thayumanavan, S. Journal of the American Chemical Society 2015, 137, 5308.
(31) Zhang, Q.; Weber, C.; Schubert, U. S.; Hoogenboom, R. Materials Horizons 2017, 4, 109. (32) Konermann, L.; Simmons, D. A. Mass spectrometry reviews 2003, 22, 1. (33) Simmons, D. A.; Konermann, L. Biochemistry 2002, 41, 1906. (34) Gabriel, G. J.; Iverson, B. L. Journal of the American Chemical Society 2002, 124, 15174. (35) Rao, K. V.; Jayaramulu, K.; Maji, T. K.; George, S. J. Angewandte Chemie International Edition
2010, 49, 4218. (36) Frisch, H.; Nie, Y.; Raunser, S.; Besenius, P. Chemistry – A European Journal 2015, 21, 3304. (37) Ardoña, H. A. M.; Draper, E. R.; Citossi, F.; Wallace, M.; Serpell, L. C.; Adams, D. J.; Tovar, J. D.
Journal of the American Chemical Society 2017, 139, 8685.

74
75
Chapter 5
Into the structure of a supramolecular polymer at
molecular resolution
Abstract:
The structure and function of natural macromolecules and complex synthetic structures are
closely related. Here we aim to characterize the structure of a supramolecular polymer in
water. We perform cryogenic electron tomography to obtain a three-dimensional view of the
supramolecular aggregates formed from C12BTA. To this end, we use graphene oxide sheets
to suspend the samples, that results in increased image contrast. By careful analysis of the
three-dimensional data and a comparison with conventional Cryo-TEM, we reveal the
existence of three different supramolecular aggregates. The C12BTA monomer self-assembles
into densely packed monolayers at the air-water interface. In addition, small aggregates with
diameters less than three nanometers are present in solution. Intriguingly, double helices
composed of two stacks of C12BTAs are also observed to exist and have a regular pitch of 23
nanometers. The results demonstrate that it is possible to unveil complex architectures
formed from supramolecular polymers, at length scales that are close to the resolution and
noise limit. A relationship between the structures observed in this chapter and the kinetic
studies as presented in the previous chapters is proposed.
76
5.1 Introduction
The structure and function of biological macromolecules are closely related. Structural
studies are therefore key to our understanding of how such macromolecules operate in their
biological environment. Whereas ground-breaking structural studies on for example G-
protein coupled receptors (GPCRs), ribosomes and ion channels were performed using X-ray
crystallography,1-3
recent technical developments in cryogenic transmission electron
microscopy (Cryo-TEM) are currently accelerating their structural characterization.4-10
Complementary to the improvements that have leveraged the use of Cryo-TEM for structural
studies, is the use of molecular models to aid in data interpretation. Structural refinement can
be performed using all-atom simulations such as molecular dynamics flexible fitting or
Rosetta structure prediction.11-14
Elegant structure to function relationships involving synthetic small molecules are also at
the forefront of science.15
The self-assembled architectures formed from building blocks as
simple as tripeptides can be used to control optical and electrochemical properties.16
The
variations in the functions of the materials arise from the different supramolecular
architectures of the peptides in aqueous solution. In some cases such small molecule based
supramolecular polymers in aqueous solution can be structurally characterized in great detail
due to a crystalline packing of the molecules.17,18
However, usually the supramolecular
polymers lack any periodicity in the electron density.19
To determine the molecular packing
of the synthetic supramolecular polymers one cannot rely on a large number of atomically
identical copies as compared to the biological macromolecules. For these biological
structures, imaging identical copies is an important prerequisite to achieve sub-nanometer
resolution with single-particle Cryo-TEM.20
Moreover, the atomic structures of the synthetic
supramolecular monomers in water are usually not known as compared to the amino acids, let
alone preferences for certain conformations, hence the accurate modeling of large synthetic
structures presents a formidable challenge. For these reasons, the number of supramolecular
polymers resolved at Ångstrӧm resolution pales in comparison to the biological
macromolecules.
Since supramolecular polymers in water are interesting for biomedical applications,16,21
we
aim for a combined experimental and computational methodology to expand the structural
characterization of these polymers in water down to a nanometer length scale.22,23
Of
particular importance for the direct structural characterization of solution-born nanostructures
is Cryo-TEM.24-29
When multiple views from different directions of a self-assembled
aggregate are combined, cryo-electron tomography (Cryo-ET) can yield three-dimensional
information that cannot be obtained using any other experimental technique.30
Recently,
Kotov et al. have shown the power of combining Cryo-ET with atomistic molecular
dynamics simulations to reveal the self-organization of inorganic nanoparticles.31
The
simulations are notably useful to decipher the interactions responsible for the self-organized
structure.
Here we report on the combination of Cryo-ET and all-atom molecular dynamics
simulations to reveal the structure of a synthetic supramolecular polymer in water at a
molecular resolution. For this purpose, we selected the water-soluble benzene-1,3,5-
tricarboxamide monomer that forms supramolecular polymers with a diameter below ten
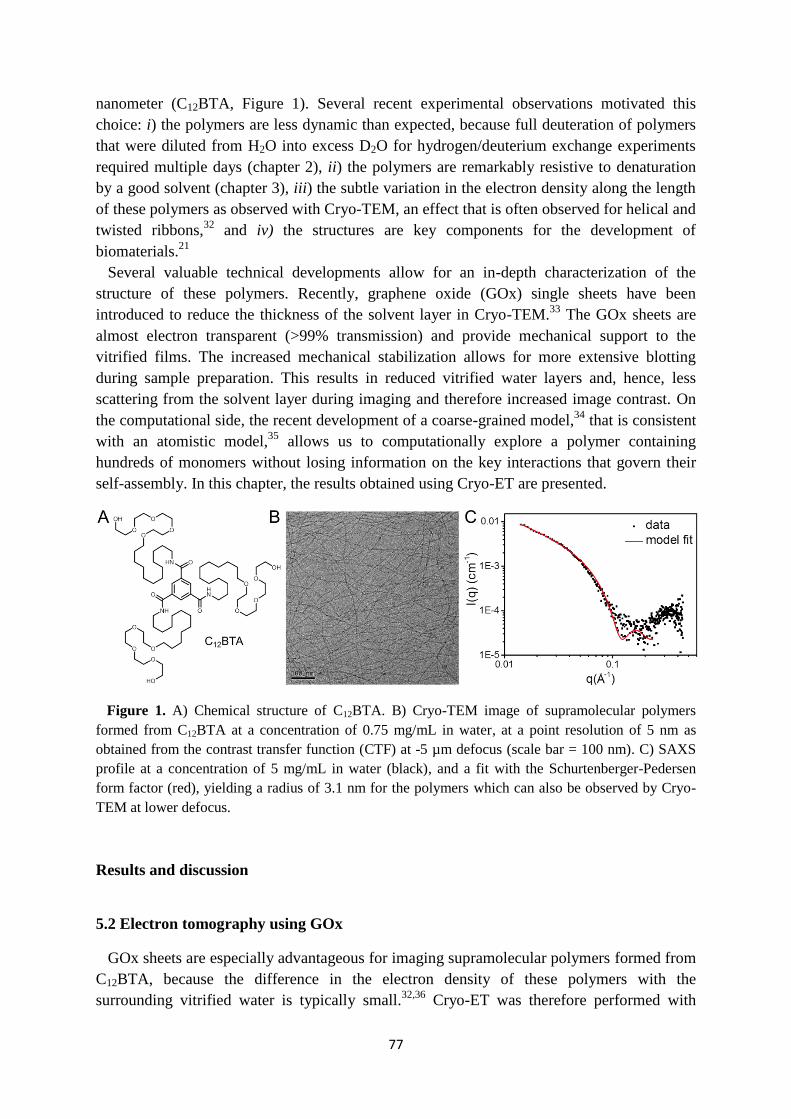
77
nanometer (C12BTA, Figure 1). Several recent experimental observations motivated this
choice: i) the polymers are less dynamic than expected, because full deuteration of polymers
that were diluted from H2O into excess D2O for hydrogen/deuterium exchange experiments
required multiple days (chapter 2), ii) the polymers are remarkably resistive to denaturation
by a good solvent (chapter 3), iii) the subtle variation in the electron density along the length
of these polymers as observed with Cryo-TEM, an effect that is often observed for helical and
twisted ribbons,32
and iv) the structures are key components for the development of
biomaterials.21
Several valuable technical developments allow for an in-depth characterization of the
structure of these polymers. Recently, graphene oxide (GOx) single sheets have been
introduced to reduce the thickness of the solvent layer in Cryo-TEM.33
The GOx sheets are
almost electron transparent (>99% transmission) and provide mechanical support to the
vitrified films. The increased mechanical stabilization allows for more extensive blotting
during sample preparation. This results in reduced vitrified water layers and, hence, less
scattering from the solvent layer during imaging and therefore increased image contrast. On
the computational side, the recent development of a coarse-grained model,34
that is consistent
with an atomistic model,35
allows us to computationally explore a polymer containing
hundreds of monomers without losing information on the key interactions that govern their
self-assembly. In this chapter, the results obtained using Cryo-ET are presented.
Figure 1. A) Chemical structure of C12BTA. B) Cryo-TEM image of supramolecular polymers
formed from C12BTA at a concentration of 0.75 mg/mL in water, at a point resolution of 5 nm as
obtained from the contrast transfer function (CTF) at -5 µm defocus (scale bar = 100 nm). C) SAXS
profile at a concentration of 5 mg/mL in water (black), and a fit with the Schurtenberger-Pedersen
form factor (red), yielding a radius of 3.1 nm for the polymers which can also be observed by Cryo-
TEM at lower defocus.
Results and discussion
5.2 Electron tomography using GOx
GOx sheets are especially advantageous for imaging supramolecular polymers formed from
C12BTA, because the difference in the electron density of these polymers with the
surrounding vitrified water is typically small.32,36
Cryo-ET was therefore performed with
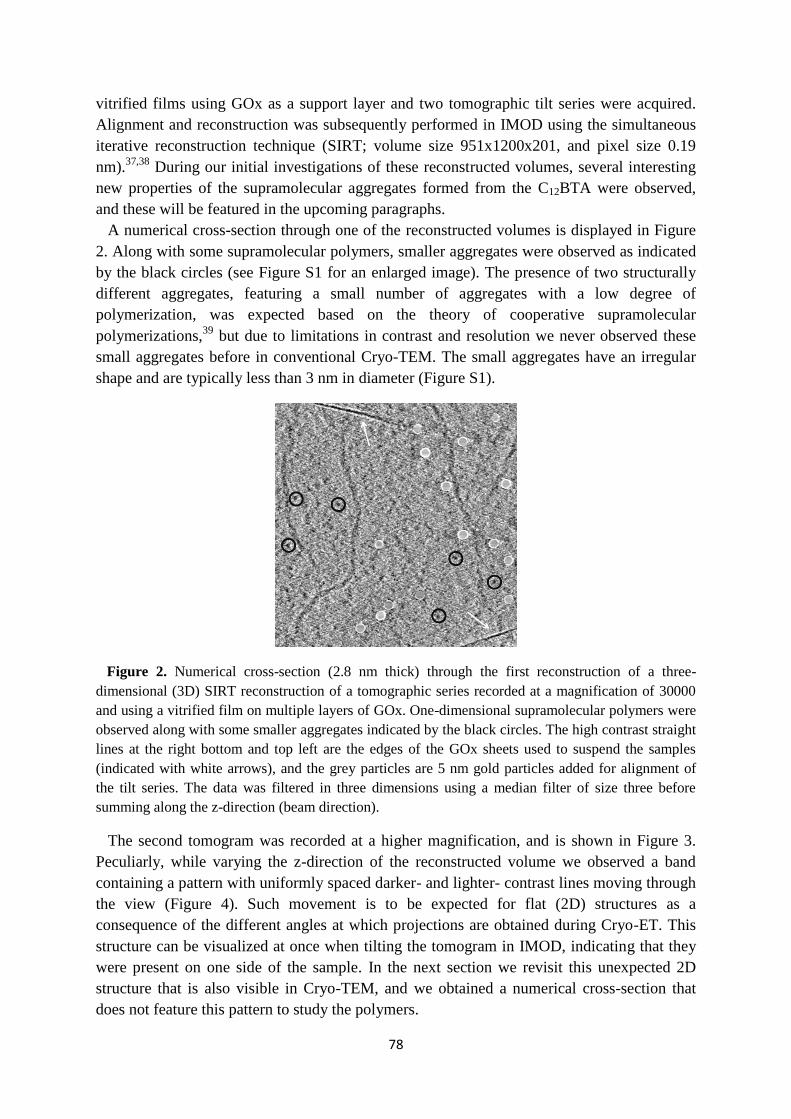
78
vitrified films using GOx as a support layer and two tomographic tilt series were acquired.
Alignment and reconstruction was subsequently performed in IMOD using the simultaneous
iterative reconstruction technique (SIRT; volume size 951x1200x201, and pixel size 0.19
nm).37,38
During our initial investigations of these reconstructed volumes, several interesting
new properties of the supramolecular aggregates formed from the C12BTA were observed,
and these will be featured in the upcoming paragraphs.
A numerical cross-section through one of the reconstructed volumes is displayed in Figure
2. Along with some supramolecular polymers, smaller aggregates were observed as indicated
by the black circles (see Figure S1 for an enlarged image). The presence of two structurally
different aggregates, featuring a small number of aggregates with a low degree of
polymerization, was expected based on the theory of cooperative supramolecular
polymerizations,39
but due to limitations in contrast and resolution we never observed these
small aggregates before in conventional Cryo-TEM. The small aggregates have an irregular
shape and are typically less than 3 nm in diameter (Figure S1).
Figure 2. Numerical cross-section (2.8 nm thick) through the first reconstruction of a three-
dimensional (3D) SIRT reconstruction of a tomographic series recorded at a magnification of 30000
and using a vitrified film on multiple layers of GOx. One-dimensional supramolecular polymers were
observed along with some smaller aggregates indicated by the black circles. The high contrast straight
lines at the right bottom and top left are the edges of the GOx sheets used to suspend the samples
(indicated with white arrows), and the grey particles are 5 nm gold particles added for alignment of
the tilt series. The data was filtered in three dimensions using a median filter of size three before
summing along the z-direction (beam direction).
The second tomogram was recorded at a higher magnification, and is shown in Figure 3.
Peculiarly, while varying the z-direction of the reconstructed volume we observed a band
containing a pattern with uniformly spaced darker- and lighter- contrast lines moving through
the view (Figure 4). Such movement is to be expected for flat (2D) structures as a
consequence of the different angles at which projections are obtained during Cryo-ET. This
structure can be visualized at once when tilting the tomogram in IMOD, indicating that they
were present on one side of the sample. In the next section we revisit this unexpected 2D
structure that is also visible in Cryo-TEM, and we obtained a numerical cross-section that
does not feature this pattern to study the polymers.
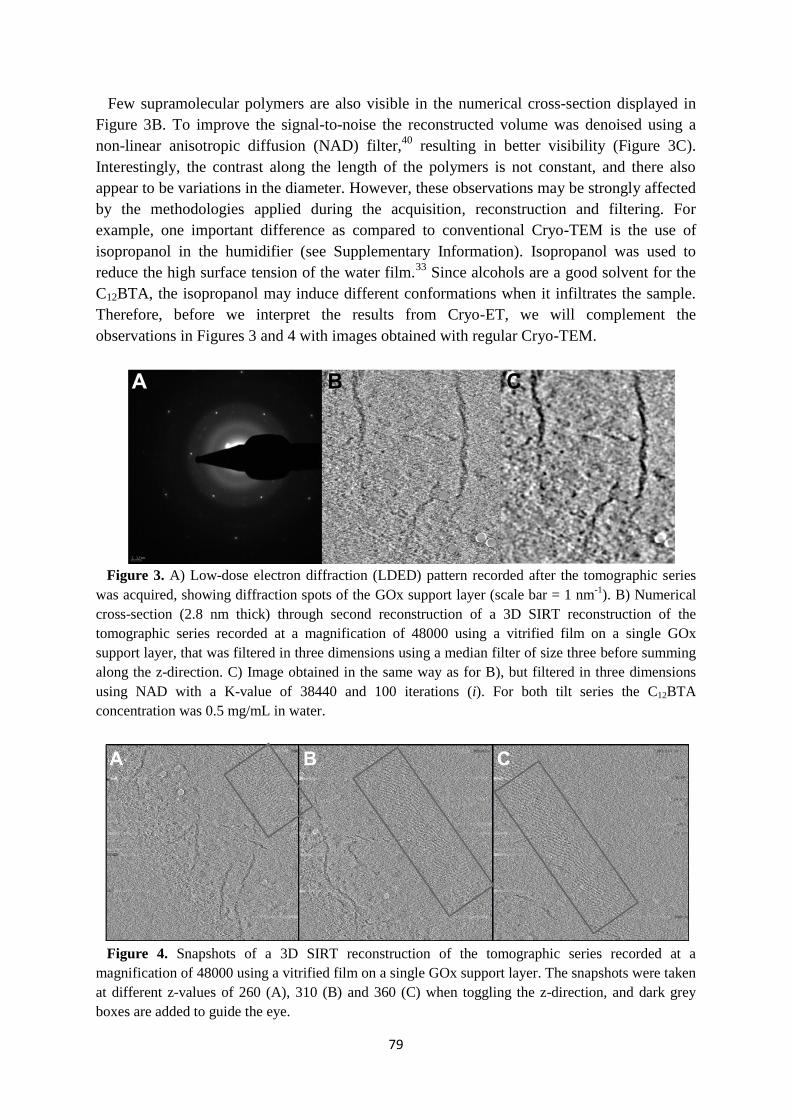
79
Few supramolecular polymers are also visible in the numerical cross-section displayed in
Figure 3B. To improve the signal-to-noise the reconstructed volume was denoised using a
non-linear anisotropic diffusion (NAD) filter,40
resulting in better visibility (Figure 3C).
Interestingly, the contrast along the length of the polymers is not constant, and there also
appear to be variations in the diameter. However, these observations may be strongly affected
by the methodologies applied during the acquisition, reconstruction and filtering. For
example, one important difference as compared to conventional Cryo-TEM is the use of
isopropanol in the humidifier (see Supplementary Information). Isopropanol was used to
reduce the high surface tension of the water film.33
Since alcohols are a good solvent for the
C12BTA, the isopropanol may induce different conformations when it infiltrates the sample.
Therefore, before we interpret the results from Cryo-ET, we will complement the
observations in Figures 3 and 4 with images obtained with regular Cryo-TEM.
Figure 3. A) Low-dose electron diffraction (LDED) pattern recorded after the tomographic series
was acquired, showing diffraction spots of the GOx support layer (scale bar = 1 nm-1
). B) Numerical
cross-section (2.8 nm thick) through second reconstruction of a 3D SIRT reconstruction of the
tomographic series recorded at a magnification of 48000 using a vitrified film on a single GOx
support layer, that was filtered in three dimensions using a median filter of size three before summing
along the z-direction. C) Image obtained in the same way as for B), but filtered in three dimensions
using NAD with a K-value of 38440 and 100 iterations (i). For both tilt series the C12BTA
concentration was 0.5 mg/mL in water.
Figure 4. Snapshots of a 3D SIRT reconstruction of the tomographic series recorded at a
magnification of 48000 using a vitrified film on a single GOx support layer. The snapshots were taken
at different z-values of 260 (A), 310 (B) and 360 (C) when toggling the z-direction, and dark grey
boxes are added to guide the eye.
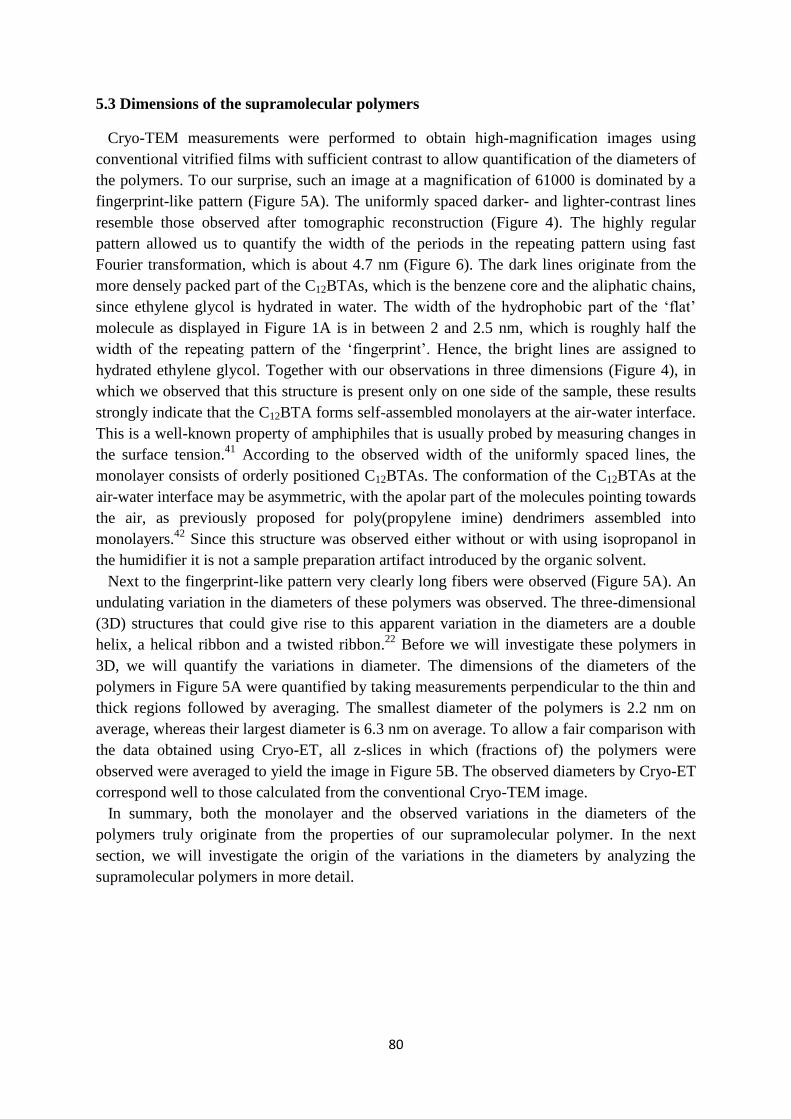
80
5.3 Dimensions of the supramolecular polymers
Cryo-TEM measurements were performed to obtain high-magnification images using
conventional vitrified films with sufficient contrast to allow quantification of the diameters of
the polymers. To our surprise, such an image at a magnification of 61000 is dominated by a
fingerprint-like pattern (Figure 5A). The uniformly spaced darker- and lighter-contrast lines
resemble those observed after tomographic reconstruction (Figure 4). The highly regular
pattern allowed us to quantify the width of the periods in the repeating pattern using fast
Fourier transformation, which is about 4.7 nm (Figure 6). The dark lines originate from the
more densely packed part of the C12BTAs, which is the benzene core and the aliphatic chains,
since ethylene glycol is hydrated in water. The width of the hydrophobic part of the ‘flat’
molecule as displayed in Figure 1A is in between 2 and 2.5 nm, which is roughly half the
width of the repeating pattern of the ‘fingerprint’. Hence, the bright lines are assigned to
hydrated ethylene glycol. Together with our observations in three dimensions (Figure 4), in
which we observed that this structure is present only on one side of the sample, these results
strongly indicate that the C12BTA forms self-assembled monolayers at the air-water interface.
This is a well-known property of amphiphiles that is usually probed by measuring changes in
the surface tension.41
According to the observed width of the uniformly spaced lines, the
monolayer consists of orderly positioned C12BTAs. The conformation of the C12BTAs at the
air-water interface may be asymmetric, with the apolar part of the molecules pointing towards
the air, as previously proposed for poly(propylene imine) dendrimers assembled into
monolayers.42
Since this structure was observed either without or with using isopropanol in
the humidifier it is not a sample preparation artifact introduced by the organic solvent.
Next to the fingerprint-like pattern very clearly long fibers were observed (Figure 5A). An
undulating variation in the diameters of these polymers was observed. The three-dimensional
(3D) structures that could give rise to this apparent variation in the diameters are a double
helix, a helical ribbon and a twisted ribbon.22
Before we will investigate these polymers in
3D, we will quantify the variations in diameter. The dimensions of the diameters of the
polymers in Figure 5A were quantified by taking measurements perpendicular to the thin and
thick regions followed by averaging. The smallest diameter of the polymers is 2.2 nm on
average, whereas their largest diameter is 6.3 nm on average. To allow a fair comparison with
the data obtained using Cryo-ET, all z-slices in which (fractions of) the polymers were
observed were averaged to yield the image in Figure 5B. The observed diameters by Cryo-ET
correspond well to those calculated from the conventional Cryo-TEM image.
In summary, both the monolayer and the observed variations in the diameters of the
polymers truly originate from the properties of our supramolecular polymer. In the next
section, we will investigate the origin of the variations in the diameters by analyzing the
supramolecular polymers in more detail.
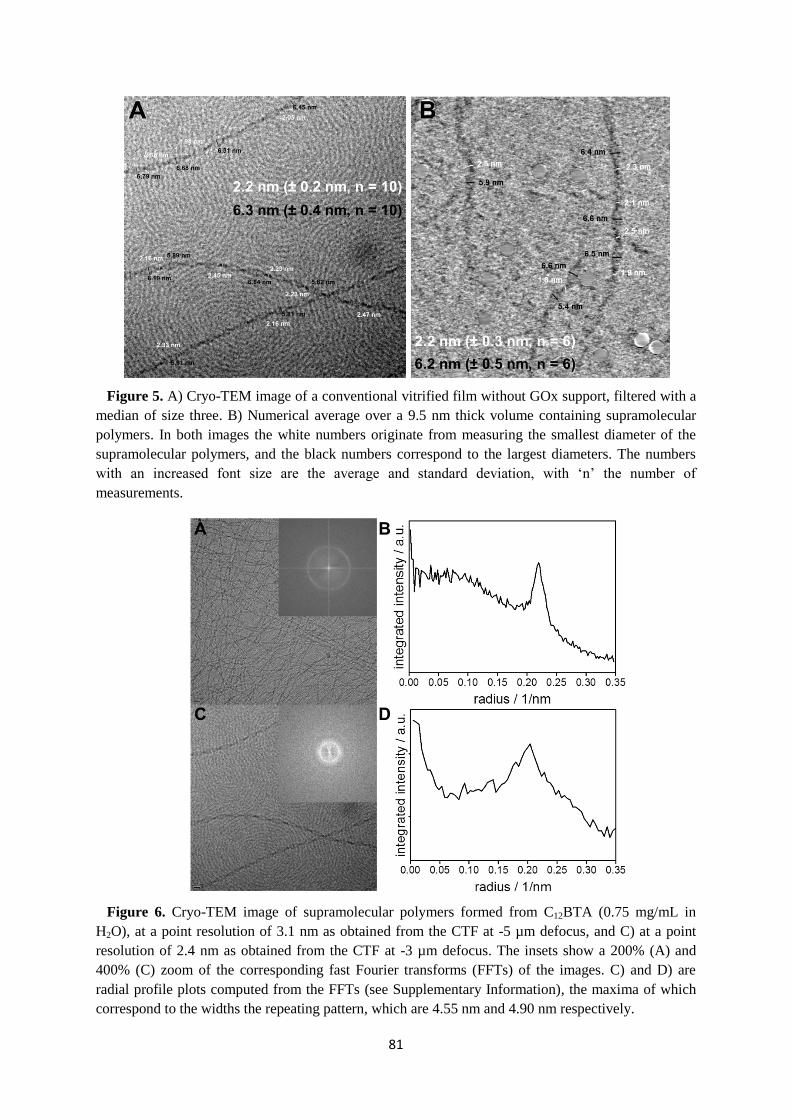
81
Figure 5. A) Cryo-TEM image of a conventional vitrified film without GOx support, filtered with a
median of size three. B) Numerical average over a 9.5 nm thick volume containing supramolecular
polymers. In both images the white numbers originate from measuring the smallest diameter of the
supramolecular polymers, and the black numbers correspond to the largest diameters. The numbers
with an increased font size are the average and standard deviation, with ‘n’ the number of
measurements.
Figure 6. Cryo-TEM image of supramolecular polymers formed from C12BTA (0.75 mg/mL in
H2O), at a point resolution of 3.1 nm as obtained from the CTF at -5 µm defocus, and C) at a point
resolution of 2.4 nm as obtained from the CTF at -3 µm defocus. The insets show a 200% (A) and
400% (C) zoom of the corresponding fast Fourier transforms (FFTs) of the images. C) and D) are
radial profile plots computed from the FFTs (see Supplementary Information), the maxima of which
correspond to the widths the repeating pattern, which are 4.55 nm and 4.90 nm respectively.
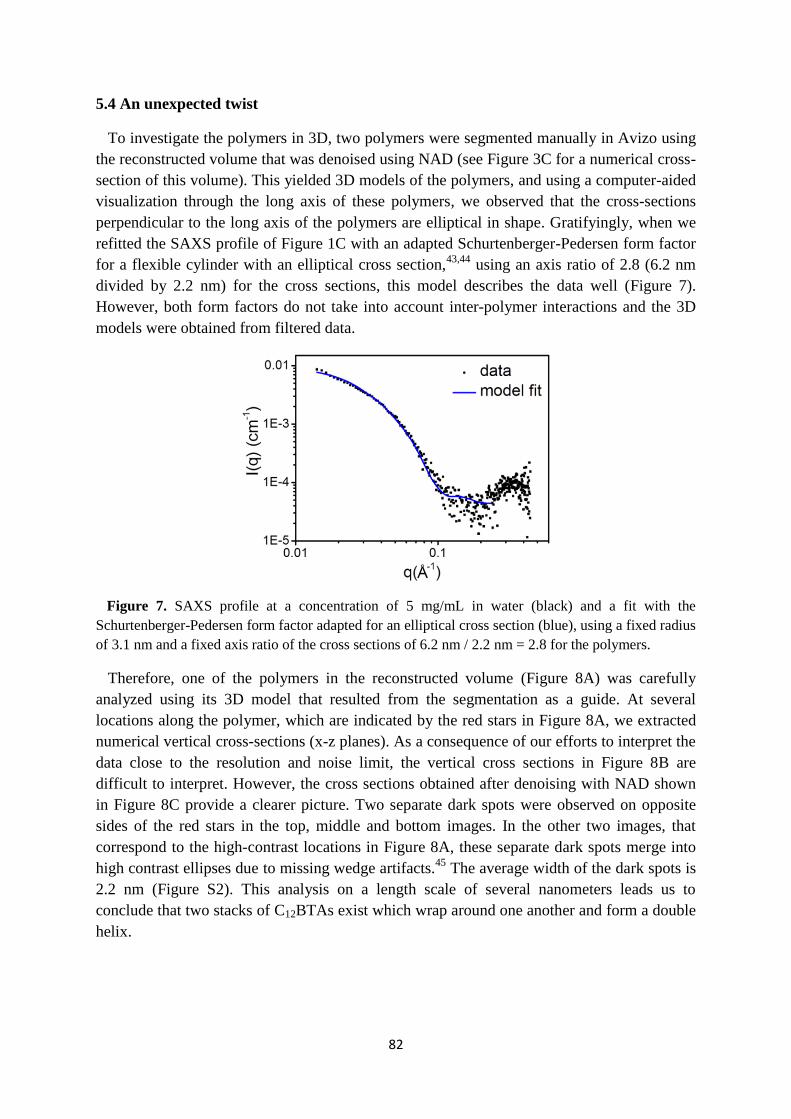
82
5.4 An unexpected twist
To investigate the polymers in 3D, two polymers were segmented manually in Avizo using
the reconstructed volume that was denoised using NAD (see Figure 3C for a numerical cross-
section of this volume). This yielded 3D models of the polymers, and using a computer-aided
visualization through the long axis of these polymers, we observed that the cross-sections
perpendicular to the long axis of the polymers are elliptical in shape. Gratifyingly, when we
refitted the SAXS profile of Figure 1C with an adapted Schurtenberger-Pedersen form factor
for a flexible cylinder with an elliptical cross section,43,44
using an axis ratio of 2.8 (6.2 nm
divided by 2.2 nm) for the cross sections, this model describes the data well (Figure 7).
However, both form factors do not take into account inter-polymer interactions and the 3D
models were obtained from filtered data.
Figure 7. SAXS profile at a concentration of 5 mg/mL in water (black) and a fit with the
Schurtenberger-Pedersen form factor adapted for an elliptical cross section (blue), using a fixed radius
of 3.1 nm and a fixed axis ratio of the cross sections of 6.2 nm / 2.2 nm = 2.8 for the polymers.
Therefore, one of the polymers in the reconstructed volume (Figure 8A) was carefully
analyzed using its 3D model that resulted from the segmentation as a guide. At several
locations along the polymer, which are indicated by the red stars in Figure 8A, we extracted
numerical vertical cross-sections (x-z planes). As a consequence of our efforts to interpret the
data close to the resolution and noise limit, the vertical cross sections in Figure 8B are
difficult to interpret. However, the cross sections obtained after denoising with NAD shown
in Figure 8C provide a clearer picture. Two separate dark spots were observed on opposite
sides of the red stars in the top, middle and bottom images. In the other two images, that
correspond to the high-contrast locations in Figure 8A, these separate dark spots merge into
high contrast ellipses due to missing wedge artifacts.45
The average width of the dark spots is
2.2 nm (Figure S2). This analysis on a length scale of several nanometers leads us to
conclude that two stacks of C12BTAs exist which wrap around one another and form a double
helix.
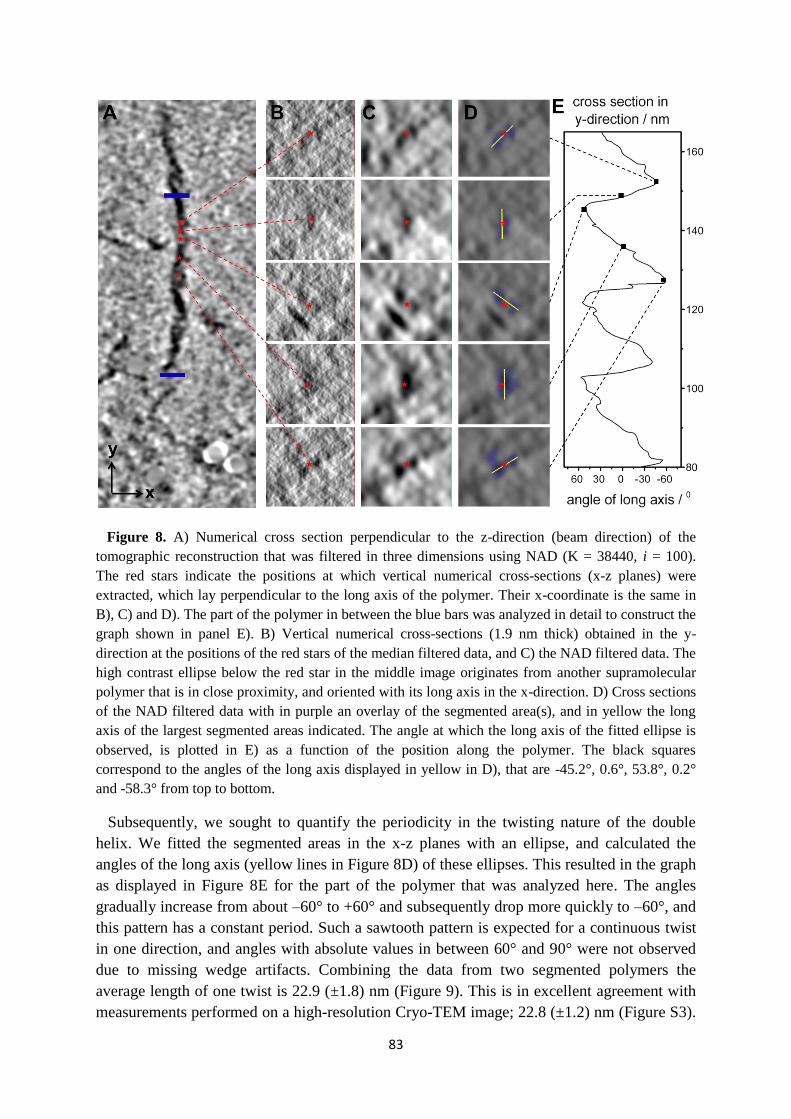
83
Figure 8. A) Numerical cross section perpendicular to the z-direction (beam direction) of the
tomographic reconstruction that was filtered in three dimensions using NAD (K = 38440, i = 100).
The red stars indicate the positions at which vertical numerical cross-sections (x-z planes) were
extracted, which lay perpendicular to the long axis of the polymer. Their x-coordinate is the same in
B), C) and D). The part of the polymer in between the blue bars was analyzed in detail to construct the
graph shown in panel E). B) Vertical numerical cross-sections (1.9 nm thick) obtained in the y-
direction at the positions of the red stars of the median filtered data, and C) the NAD filtered data. The
high contrast ellipse below the red star in the middle image originates from another supramolecular
polymer that is in close proximity, and oriented with its long axis in the x-direction. D) Cross sections
of the NAD filtered data with in purple an overlay of the segmented area(s), and in yellow the long
axis of the largest segmented areas indicated. The angle at which the long axis of the fitted ellipse is
observed, is plotted in E) as a function of the position along the polymer. The black squares
correspond to the angles of the long axis displayed in yellow in D), that are -45.2°, 0.6°, 53.8°, 0.2°
and -58.3° from top to bottom.
Subsequently, we sought to quantify the periodicity in the twisting nature of the double
helix. We fitted the segmented areas in the x-z planes with an ellipse, and calculated the
angles of the long axis (yellow lines in Figure 8D) of these ellipses. This resulted in the graph
as displayed in Figure 8E for the part of the polymer that was analyzed here. The angles
gradually increase from about –60° to +60° and subsequently drop more quickly to –60°, and
this pattern has a constant period. Such a sawtooth pattern is expected for a continuous twist
in one direction, and angles with absolute values in between 60° and 90° were not observed
due to missing wedge artifacts. Combining the data from two segmented polymers the
average length of one twist is 22.9 (±1.8) nm (Figure 9). This is in excellent agreement with
measurements performed on a high-resolution Cryo-TEM image; 22.8 (±1.2) nm (Figure S3).
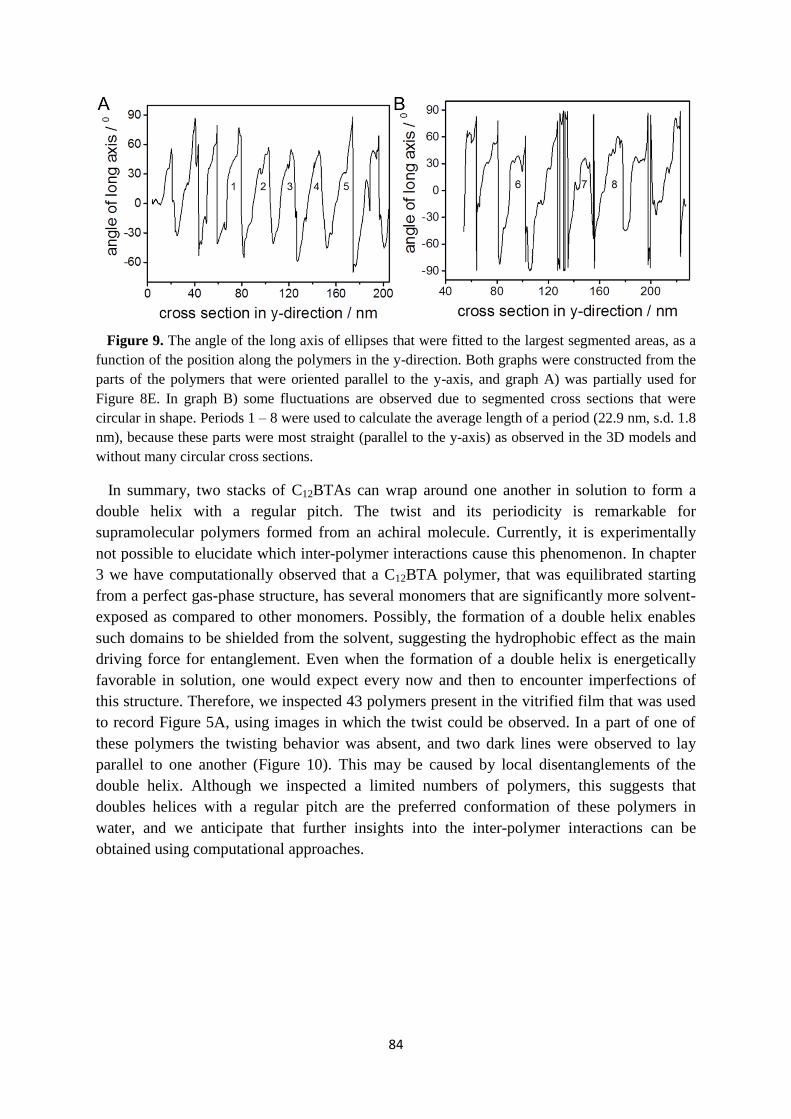
84
Figure 9. The angle of the long axis of ellipses that were fitted to the largest segmented areas, as a
function of the position along the polymers in the y-direction. Both graphs were constructed from the
parts of the polymers that were oriented parallel to the y-axis, and graph A) was partially used for
Figure 8E. In graph B) some fluctuations are observed due to segmented cross sections that were
circular in shape. Periods 1 – 8 were used to calculate the average length of a period (22.9 nm, s.d. 1.8
nm), because these parts were most straight (parallel to the y-axis) as observed in the 3D models and
without many circular cross sections.
In summary, two stacks of C12BTAs can wrap around one another in solution to form a
double helix with a regular pitch. The twist and its periodicity is remarkable for
supramolecular polymers formed from an achiral molecule. Currently, it is experimentally
not possible to elucidate which inter-polymer interactions cause this phenomenon. In chapter
3 we have computationally observed that a C12BTA polymer, that was equilibrated starting
from a perfect gas-phase structure, has several monomers that are significantly more solvent-
exposed as compared to other monomers. Possibly, the formation of a double helix enables
such domains to be shielded from the solvent, suggesting the hydrophobic effect as the main
driving force for entanglement. Even when the formation of a double helix is energetically
favorable in solution, one would expect every now and then to encounter imperfections of
this structure. Therefore, we inspected 43 polymers present in the vitrified film that was used
to record Figure 5A, using images in which the twist could be observed. In a part of one of
these polymers the twisting behavior was absent, and two dark lines were observed to lay
parallel to one another (Figure 10). This may be caused by local disentanglements of the
double helix. Although we inspected a limited numbers of polymers, this suggests that
doubles helices with a regular pitch are the preferred conformation of these polymers in
water, and we anticipate that further insights into the inter-polymer interactions can be
obtained using computational approaches.
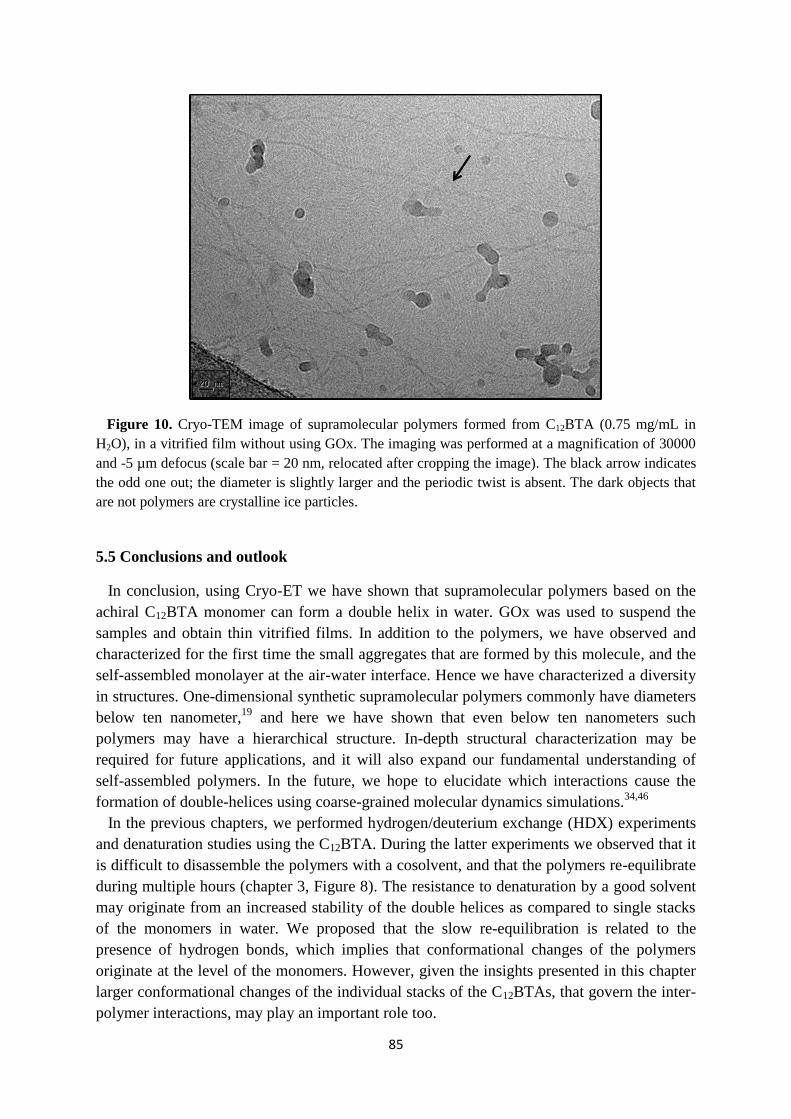
85
Figure 10. Cryo-TEM image of supramolecular polymers formed from C12BTA (0.75 mg/mL in
H2O), in a vitrified film without using GOx. The imaging was performed at a magnification of 30000
and -5 µm defocus (scale bar = 20 nm, relocated after cropping the image). The black arrow indicates
the odd one out; the diameter is slightly larger and the periodic twist is absent. The dark objects that
are not polymers are crystalline ice particles.
5.5 Conclusions and outlook
In conclusion, using Cryo-ET we have shown that supramolecular polymers based on the
achiral C12BTA monomer can form a double helix in water. GOx was used to suspend the
samples and obtain thin vitrified films. In addition to the polymers, we have observed and
characterized for the first time the small aggregates that are formed by this molecule, and the
self-assembled monolayer at the air-water interface. Hence we have characterized a diversity
in structures. One-dimensional synthetic supramolecular polymers commonly have diameters
below ten nanometer,19
and here we have shown that even below ten nanometers such
polymers may have a hierarchical structure. In-depth structural characterization may be
required for future applications, and it will also expand our fundamental understanding of
self-assembled polymers. In the future, we hope to elucidate which interactions cause the
formation of double-helices using coarse-grained molecular dynamics simulations.34,46
In the previous chapters, we performed hydrogen/deuterium exchange (HDX) experiments
and denaturation studies using the C12BTA. During the latter experiments we observed that it
is difficult to disassemble the polymers with a cosolvent, and that the polymers re-equilibrate
during multiple hours (chapter 3, Figure 8). The resistance to denaturation by a good solvent
may originate from an increased stability of the double helices as compared to single stacks
of the monomers in water. We proposed that the slow re-equilibration is related to the
presence of hydrogen bonds, which implies that conformational changes of the polymers
originate at the level of the monomers. However, given the insights presented in this chapter
larger conformational changes of the individual stacks of the C12BTAs, that govern the inter-
polymer interactions, may play an important role too.
86
In the time-resolved HDX-MS experiments we observed three different timescales for the
amide HDX of the C12BTA: minutes, hours, and days (chapter 2, Figure 3). Although the
electron microscopy results give a static depiction of the aggregates formed from the
C12BTA, they imply that the monomers are continuously exchanging between a self-
assembled monolayer at the air-water interface, small aggregates in solution, and polymers in
the form of double helices. In the microscopy results the number of C12BTA molecules
present at the air-water interface is over-represented as compared to the molecules in
solution, because of the very large surface-to-volume ratio in vitrified films. However, they
are still anticipated to contribute to the fast amide HDX observed in the first minutes. In
addition, the small aggregates present in solution are expected to be responsible for the fast
amide HDX in the first minutes. The reason for this is the fast and complete deuteration of
the C10BTA (chapter 2, Figure 7B); this amphiphile is also expected to form monolayers and
small aggregates in solution. The formation of a monolayer is a property that is well-known
for amphiphiles,41
and light scattering experiments have indicated that the C10BTA is also
capable of aggregation, albeit not into high aspect ratio polymers. With Cryo-TEM we were
unable to visualize aggregates of the C10BTA,36
which is consistent with the fact that we also
did not observe the small aggregates formed from the C12BTA before. Due to the low contrast
of the C12BTA (and C10BTA) in Cryo-TEM, the presence of disorganized single stacks of
monomers can not be excluded. Such disorganized aggregates could also contribute to the
fast amide HDX. We propose that the amide HDX that occurs during hours and days is due to
existence of the double helices, in which the monomers are located in a hydrophobic
environment that, in contrast to the other aggregates formed from the C12BTA, is stabilized
by intermolecular hydrogen bonds. Possibly, some parts of the polymers receive additional
stabilization by inter-polymer interactions that prevent local disentanglements, causing some
monomers to exchange only at a timescale of days.
5.6 Experimental section and supplementary information
Instrumentation and materials. Samples were vitrified using a computer controlled
vitrification robot (FEI VitrobotTM
Mark III, FEI Company). Quantifoil grids (R 2/2, Quantifoil Micro
Tools GmbH) were surface plasma treated with a Cressington 208 carbon coater. Vitrified films were
imaged using a Tecnai Sphera microscope equipped with an LaB6 filament operating at 200 kV and a
bottom mounted 1024x1024 Gatan charged-coupled device (CCD) camera, or a CryoTITAN
equipped with a field emission gun operating at 300 kV, a post-column Gatan energy filter, and a
2048 x 2048 Gatan CCD camera. Small angle X-ray scattering measurements were performed with a
SAXSLAB GANESHA 300 XL SAXS system equipped with a GeniX 3D Cu Ultra Low Divergence
micro focus sealed tube source producing X-rays with a wavelength of 1.54 Å at a flux of 1 x 10⁸
photons s-1
and a Pilatus 300 K silicon pixel detector with 487 x 619 pixels of 172 µm2 in size with a
q-range of 0.15 ≤ q ≤ 4.5 nm-1
with q = 4π/λsin(θ/2). Silver behenate was used for calibration of the
beam centre and the q-range. Samples were contained in 2 mm quartz capillaries (Hilgenberg Gmbh,
Germany). The two-dimensional SAXS patterns were brought to an absolute intensity scale using the
calibrated detector response function, known sample-to-detector distance, measured incident and
transmitted beam intensities.
Vitrification without GOx. Samples of the C12BTA in MilliQ water were prepared at 0.75
mg/mL using the heating-cooling method as described in chapter 2. The Vitrobot was operated at
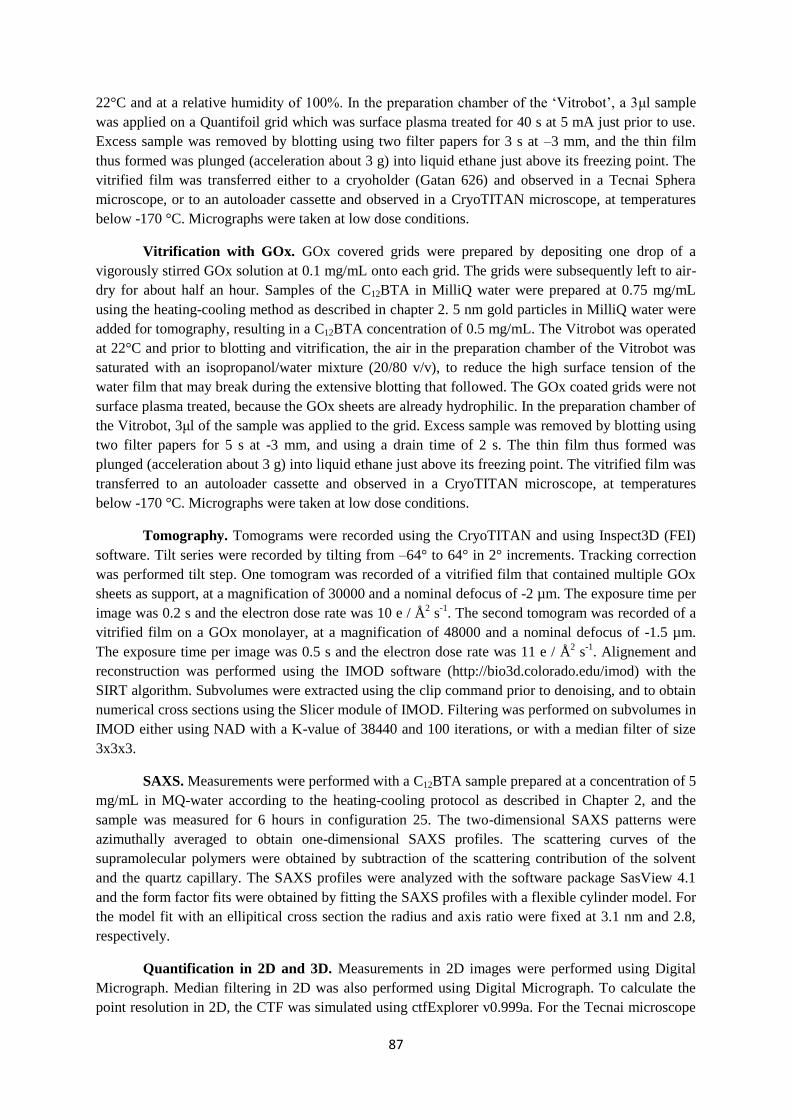
87
22°C and at a relative humidity of 100%. In the preparation chamber of the ‘Vitrobot’, a 3μl sample
was applied on a Quantifoil grid which was surface plasma treated for 40 s at 5 mA just prior to use.
Excess sample was removed by blotting using two filter papers for 3 s at –3 mm, and the thin film
thus formed was plunged (acceleration about 3 g) into liquid ethane just above its freezing point. The
vitrified film was transferred either to a cryoholder (Gatan 626) and observed in a Tecnai Sphera
microscope, or to an autoloader cassette and observed in a CryoTITAN microscope, at temperatures
below -170 °C. Micrographs were taken at low dose conditions.
Vitrification with GOx. GOx covered grids were prepared by depositing one drop of a
vigorously stirred GOx solution at 0.1 mg/mL onto each grid. The grids were subsequently left to air-
dry for about half an hour. Samples of the C12BTA in MilliQ water were prepared at 0.75 mg/mL
using the heating-cooling method as described in chapter 2. 5 nm gold particles in MilliQ water were
added for tomography, resulting in a C12BTA concentration of 0.5 mg/mL. The Vitrobot was operated
at 22°C and prior to blotting and vitrification, the air in the preparation chamber of the Vitrobot was
saturated with an isopropanol/water mixture (20/80 v/v), to reduce the high surface tension of the
water film that may break during the extensive blotting that followed. The GOx coated grids were not
surface plasma treated, because the GOx sheets are already hydrophilic. In the preparation chamber of
the Vitrobot, 3μl of the sample was applied to the grid. Excess sample was removed by blotting using
two filter papers for 5 s at -3 mm, and using a drain time of 2 s. The thin film thus formed was
plunged (acceleration about 3 g) into liquid ethane just above its freezing point. The vitrified film was
transferred to an autoloader cassette and observed in a CryoTITAN microscope, at temperatures
below -170 °C. Micrographs were taken at low dose conditions.
Tomography. Tomograms were recorded using the CryoTITAN and using Inspect3D (FEI)
software. Tilt series were recorded by tilting from –64° to 64° in 2° increments. Tracking correction
was performed tilt step. One tomogram was recorded of a vitrified film that contained multiple GOx
sheets as support, at a magnification of 30000 and a nominal defocus of -2 µm. The exposure time per
image was 0.2 s and the electron dose rate was 10 e / Å2 s
-1. The second tomogram was recorded of a
vitrified film on a GOx monolayer, at a magnification of 48000 and a nominal defocus of -1.5 µm.
The exposure time per image was 0.5 s and the electron dose rate was 11 e / Å2 s
-1. Alignement and
reconstruction was performed using the IMOD software (http://bio3d.colorado.edu/imod) with the
SIRT algorithm. Subvolumes were extracted using the clip command prior to denoising, and to obtain
numerical cross sections using the Slicer module of IMOD. Filtering was performed on subvolumes in
IMOD either using NAD with a K-value of 38440 and 100 iterations, or with a median filter of size
3x3x3.
SAXS. Measurements were performed with a C12BTA sample prepared at a concentration of 5
mg/mL in MQ-water according to the heating-cooling protocol as described in Chapter 2, and the
sample was measured for 6 hours in configuration 25. The two-dimensional SAXS patterns were
azimuthally averaged to obtain one-dimensional SAXS profiles. The scattering curves of the
supramolecular polymers were obtained by subtraction of the scattering contribution of the solvent
and the quartz capillary. The SAXS profiles were analyzed with the software package SasView 4.1
and the form factor fits were obtained by fitting the SAXS profiles with a flexible cylinder model. For
the model fit with an ellipitical cross section the radius and axis ratio were fixed at 3.1 nm and 2.8,
respectively.
Quantification in 2D and 3D. Measurements in 2D images were performed using Digital
Micrograph. Median filtering in 2D was also performed using Digital Micrograph. To calculate the
point resolution in 2D, the CTF was simulated using ctfExplorer v0.999a. For the Tecnai microscope
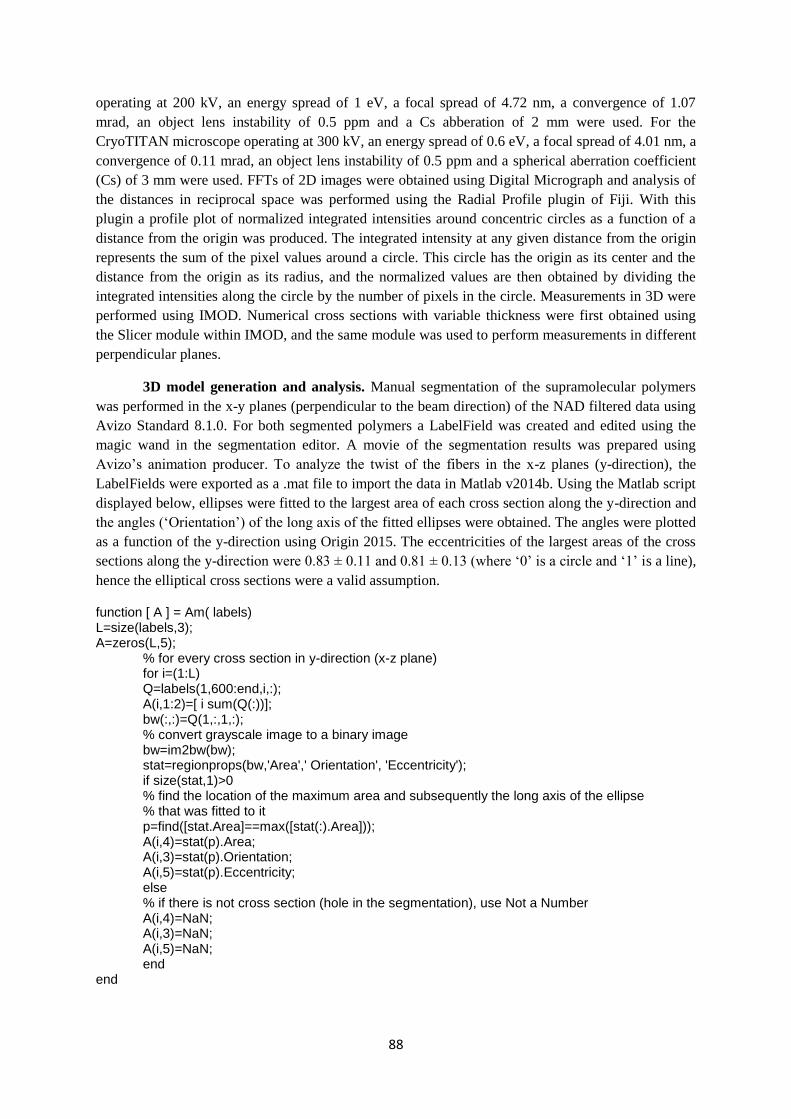
88
operating at 200 kV, an energy spread of 1 eV, a focal spread of 4.72 nm, a convergence of 1.07
mrad, an object lens instability of 0.5 ppm and a Cs abberation of 2 mm were used. For the
CryoTITAN microscope operating at 300 kV, an energy spread of 0.6 eV, a focal spread of 4.01 nm, a
convergence of 0.11 mrad, an object lens instability of 0.5 ppm and a spherical aberration coefficient
(Cs) of 3 mm were used. FFTs of 2D images were obtained using Digital Micrograph and analysis of
the distances in reciprocal space was performed using the Radial Profile plugin of Fiji. With this
plugin a profile plot of normalized integrated intensities around concentric circles as a function of a
distance from the origin was produced. The integrated intensity at any given distance from the origin
represents the sum of the pixel values around a circle. This circle has the origin as its center and the
distance from the origin as its radius, and the normalized values are then obtained by dividing the
integrated intensities along the circle by the number of pixels in the circle. Measurements in 3D were
performed using IMOD. Numerical cross sections with variable thickness were first obtained using
the Slicer module within IMOD, and the same module was used to perform measurements in different
perpendicular planes.
3D model generation and analysis. Manual segmentation of the supramolecular polymers
was performed in the x-y planes (perpendicular to the beam direction) of the NAD filtered data using
Avizo Standard 8.1.0. For both segmented polymers a LabelField was created and edited using the
magic wand in the segmentation editor. A movie of the segmentation results was prepared using
Avizo’s animation producer. To analyze the twist of the fibers in the x-z planes (y-direction), the
LabelFields were exported as a .mat file to import the data in Matlab v2014b. Using the Matlab script
displayed below, ellipses were fitted to the largest area of each cross section along the y-direction and
the angles (‘Orientation’) of the long axis of the fitted ellipses were obtained. The angles were plotted
as a function of the y-direction using Origin 2015. The eccentricities of the largest areas of the cross
sections along the y-direction were 0.83 ± 0.11 and 0.81 ± 0.13 (where ‘0’ is a circle and ‘1’ is a line),
hence the elliptical cross sections were a valid assumption.
function [ A ] = Am( labels) L=size(labels,3); A=zeros(L,5);
% for every cross section in y-direction (x-z plane) for i=(1:L) Q=labels(1,600:end,i,:); A(i,1:2)=[ i sum(Q(:))]; bw(:,:)=Q(1,:,1,:); % convert grayscale image to a binary image bw=im2bw(bw); stat=regionprops(bw,'Area',' Orientation', 'Eccentricity'); if size(stat,1)>0 % find the location of the maximum area and subsequently the long axis of the ellipse % that was fitted to it p=find([stat.Area]==max([stat(:).Area])); A(i,4)=stat(p).Area; A(i,3)=stat(p).Orientation; A(i,5)=stat(p).Eccentricity; else % if there is not cross section (hole in the segmentation), use Not a Number A(i,4)=NaN; A(i,3)=NaN; A(i,5)=NaN; end
end
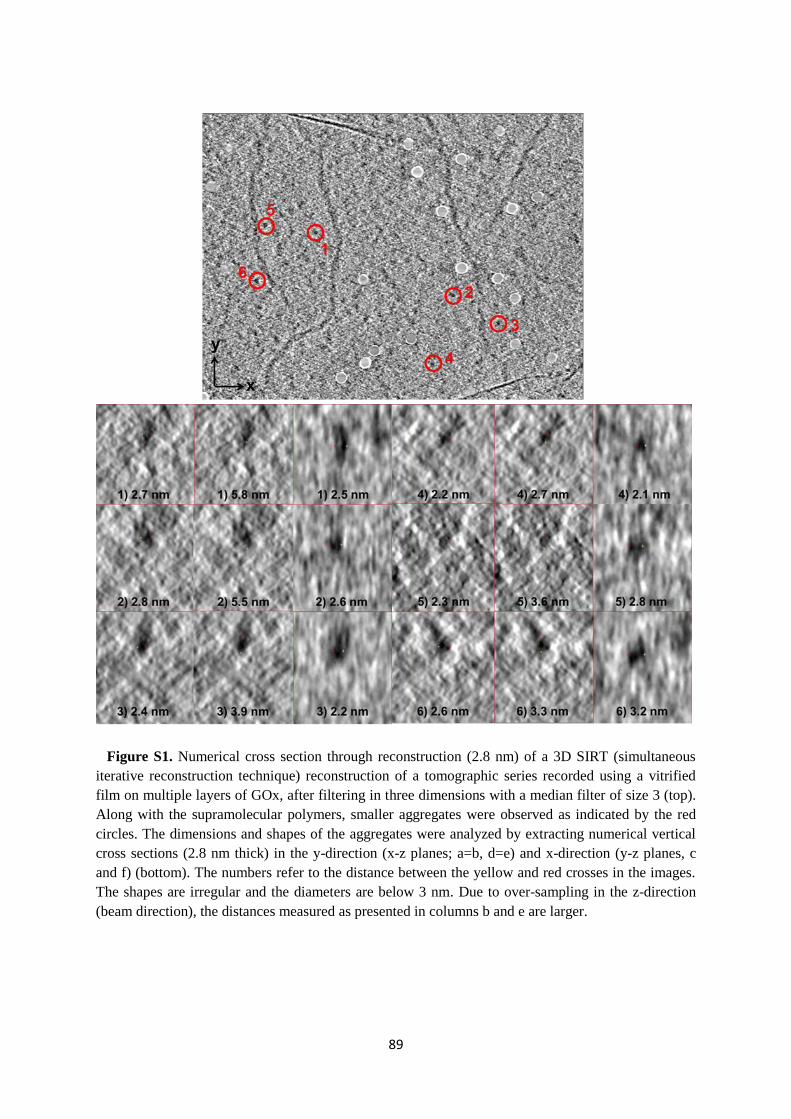
89
Figure S1. Numerical cross section through reconstruction (2.8 nm) of a 3D SIRT (simultaneous
iterative reconstruction technique) reconstruction of a tomographic series recorded using a vitrified
film on multiple layers of GOx, after filtering in three dimensions with a median filter of size 3 (top).
Along with the supramolecular polymers, smaller aggregates were observed as indicated by the red
circles. The dimensions and shapes of the aggregates were analyzed by extracting numerical vertical
cross sections (2.8 nm thick) in the y-direction (x-z planes; a=b, d=e) and x-direction (y-z planes, c
and f) (bottom). The numbers refer to the distance between the yellow and red crosses in the images.
The shapes are irregular and the diameters are below 3 nm. Due to over-sampling in the z-direction
(beam direction), the distances measured as presented in columns b and e are larger.
90
Figure S2. Numerical vertical cross sections that are equal to those displayed in Figure 7,
originating from the NAD (left) and median filtered data (middle and right). The measurements in
white are the diameters of the single stacks of molecules, and those in black correspond to the width
of the bundle.
Figure S3. Cryo-TEM image of supramolecular polymers formed from C12BTA (0.75 mg/mL in
H2O), in a vitrified film without using GOx. The imaging was performed at a magnification of 61000
and 5 µm below focus, and subsequently a median filter of size three was applied. The white numbers
originate from measuring the periods of the twist of the supramolecular polymers, and the numbers
with an increased font size are the average and standard deviation, with ‘n’ the number of
measurements.
91
5.7 References
(1) Rasmussen, S. G. F.; DeVree, B. T.; Zou, Y.; Kruse, A. C.; Chung, K. Y.; Kobilka, T. S.; Thian, F. S.; Chae, P. S.; Pardon, E.; Calinski, D.; Mathiesen, J. M.; Shah, S. T. A.; Lyons, J. A.; Caffrey, M.; Gellman, S. H.; Steyaert, J.; Skiniotis, G.; Weis, W. I.; Sunahara, R. K.; Kobilka, B. K. Nature 2011, 477, 549.
(2) Ban, N.; Nissen, P.; Hansen, J.; Moore, P. B.; Steitz, T. A. Science 2000, 289, 905. (3) Doyle, D. A.; Morais Cabral, J.; Pfuetzner, R. A.; Kuo, A.; Gulbis, J. M.; Cohen, S. L.; Chait, B. T.;
MacKinnon, R. Science 1998, 280, 69. (4) Liang, Y.-L.; Khoshouei, M.; Radjainia, M.; Zhang, Y.; Glukhova, A.; Tarrasch, J.; Thal, D. M.;
Furness, S. G. B.; Christopoulos, G.; Coudrat, T.; Danev, R.; Baumeister, W.; Miller, L. J.; Christopoulos, A.; Kobilka, B. K.; Wootten, D.; Skiniotis, G.; Sexton, P. M. Nature 2017, 546, 118.
(5) Zhang, Y.; Sun, B.; Feng, D.; Hu, H.; Chu, M.; Qu, Q.; Tarrasch, J. T.; Li, S.; Sun Kobilka, T.; Kobilka, B. K.; Skiniotis, G. Nature 2017, 546, 248.
(6) Amunts, A.; Brown, A.; Bai, X.-c.; Llácer, J. L.; Hussain, T.; Emsley, P.; Long, F.; Murshudov, G.; Scheres, S. H. W.; Ramakrishnan, V. Science 2014, 343, 1485.
(7) Desai, N.; Brown, A.; Amunts, A.; Ramakrishnan, V. Science 2017, 355, 528. (8) Hite, R. K.; Tao, X.; MacKinnon, R. Nature 2017, 541, 52. (9) Park, E.; Campbell, E. B.; MacKinnon, R. Nature 2017, 541, 500. (10) Tao, X.; Hite, R. K.; MacKinnon, R. Nature 2017, 541, 46. (11) Trabuco, L. G.; Villa, E.; Mitra, K.; Frank, J.; Schulten, K. Structure (London, England : 1993)
2008, 16, 673. (12) Zhao, G.; Perilla, J. R.; Yufenyuy, E. L.; Meng, X.; Chen, B.; Ning, J.; Ahn, J.; Gronenborn, A. M.;
Schulten, K.; Aiken, C.; Zhang, P. Nature 2013, 497, 643. (13) Wang, R. Y.-R.; Kudryashev, M.; Li, X.; Egelman, E. H.; Basler, M.; Cheng, Y.; Baker, D.;
DiMaio, F. Nature Methods 2015, 12, 335. (14) Walls, A. C.; Tortorici, M. A.; Bosch, B.-J.; Frenz, B.; Rottier, P. J. M.; DiMaio, F.; Rey, F. A.;
Veesler, D. Nature 2016, 531, 114. (15) Štacko, P.; Kistemaker, J. C. M.; van Leeuwen, T.; Chang, M.-C.; Otten, E.; Feringa, B. L.
Science 2017, 356, 964. (16) Lampel, A.; McPhee, S. A.; Park, H.-A.; Scott, G. G.; Humagain, S.; Hekstra, D. R.; Yoo, B.;
Frederix, P. W. J. M.; Li, T.-D.; Abzalimov, R. R.; Greenbaum, S. G.; Tuttle, T.; Hu, C.; Bettinger, C. J.; Ulijn, R. V. Science 2017, 356, 1064.
(17) Weingarten, A. S.; Kazantsev, R. V.; Palmer, L. C.; McClendon, M.; Koltonow, A. R.; SamuelAmanda, P. S.; Kiebala, D. J.; Wasielewski, M. R.; Stupp, S. I. Nature Chemistry 2014, 6, 964.
(18) Shahar, C.; Baram, J.; Tidhar, Y.; Weissman, H.; Cohen, S. R.; Pinkas, I.; Rybtchinski, B. ACS Nano 2013, 7, 3547.
(19) Krieg, E.; Bastings, M. M. C.; Besenius, P.; Rybtchinski, B. Chemical Reviews 2016, 116, 2414. (20) Fernandez-Leiro, R.; Scheres, S. H. W. Nature 2016, 537, 339. (21) Webber, M. J.; Appel, E. A.; Meijer, E. W.; Langer, R. Nature Materials 2016, 15, 13. (22) Merg, A. D.; Boatz, J. C.; Mandal, A.; Zhao, G.; Mokashi-Punekar, S.; Liu, C.; Wang, X.; Zhang,
P.; van der Wel, P. C. A.; Rosi, N. L. Journal of the American Chemical Society 2016, 138, 13655.
(23) Friedl, C.; Renger, T.; Berlepsch, H. v.; Ludwig, K.; Schmidt am Busch, M.; Megow, J. The Journal of Physical Chemistry C 2016, 120, 19416.
(24) Cui, H.; Hodgdon, T. K.; Kaler, E. W.; Abezgauz, L.; Danino, D.; Lubovsky, M.; Talmon, Y.; Pochan, D. J. Soft Matter 2007, 3, 945.
(25) Zhong, S.; Pochan, D. J. Polymer Reviews 2010, 50, 287. (26) Newcomb, C. J.; Moyer, T. J.; Lee, S. S.; Stupp, S. I. Current Opinion in Colloid & Interface
Science 2012, 17, 350.
92
(27) Friedrich, H.; Frederik, P. M.; de With, G.; Sommerdijk, N. A. J. M. Angewandte Chemie International Edition 2010, 49, 7850.
(28) Patterson, J. P.; Xu, Y.; Moradi, M.-A.; Sommerdijk, N. A. J. M.; Friedrich, H. Accounts of Chemical Research 2017, 50, 1495.
(29) Evans, J. E.; Friedrich, H. MRS Bulletin 2016, 41, 516. (30) McKenzie, B. E.; Friedrich, H.; Wirix, M. J. M.; de Visser, J. F.; Monaghan, O. R.; Bomans, P. H.
H.; Nudelman, F.; Holder, S. J.; Sommerdijk, N. A. J. M. Angewandte Chemie International Edition 2015, 54, 2457.
(31) Yang, M.; Chan, H.; Zhao, G.; Bahng, J. H.; Zhang, P.; Král, P.; Kotov, N. A. Nature Chemistry 2017, 9, 287.
(32) Leenders, C. M.; Albertazzi, L.; Mes, T.; Koenigs, M. M.; Palmans, A. R.; Meijer, E. W. Chemical communications 2013, 49, 1963.
(33) van de Put, M. W. P.; Patterson, J. P.; Bomans, P. H. H.; Wilson, N. R.; Friedrich, H.; van Benthem, R. A. T. M.; de With, G.; O'Reilly, R. K.; Sommerdijk, N. A. J. M. Soft Matter 2015, 11, 1265.
(34) Bochicchio, D.; Pavan, G. M. ACS Nano 2017, 11, 1000. (35) Baker, M. B.; Albertazzi, L.; Voets, I. K.; Leenders, C. M. A.; Palmans, A. R. A.; Pavan, G. M.;
Meijer, E. W. Nature Communications 2015, 6. (36) Leenders, C. M. A.; Baker, M. B.; Pijpers, I. A. B.; Lafleur, R. P. M.; Albertazzi, L.; Palmans, A.
R. A.; Meijer, E. W. Soft Matter 2016, 12, 2887. (37) Gilbert, P. Journal of Theoretical Biology 1972, 36, 105. (38) Kremer, J. R.; Mastronarde, D. N.; McIntosh, J. R. Journal of structural biology 1996, 116, 71. (39) De Greef, T. F. A.; Smulders, M. M. J.; Wolffs, M.; Schenning, A. P. H. J.; Sijbesma, R. P.;
Meijer, E. W. Chemical Reviews 2009, 109, 5687. (40) Frangakis, A. S.; Hegerl, R. Journal of structural biology 2001, 135, 239. (41) Hamley, I. W. John Wiley & Sons, Ltd. 2007. (42) Schenning, A. P. H. J.; Elissen-Román, C.; Weener, J.-W.; Baars, M. W. P. L.; van der Gaast, S.
J.; Meijer, E. W. Journal of the American Chemical Society 1998, 120, 8199. (43) Pedersen, J. S.; Schurtenberger, P. Macromolecules 1996, 29, 7602. (44) Chen, W.-R.; Butler, P. D.; Magid, L. J. Langmuir 2006, 22, 6539. (45) Orlova, E. V.; Saibil, H. R. Chemical Reviews 2011, 111, 7710. (46) Bochicchio, D.; Pavan, G. M. The Journal of Physical Chemistry Letters 2017, 3813.
93
Chapter 6
Synthesis of protein – BTA conjugates
Abstract:
The advancement of synthetic one-dimensional supramolecular polymers towards biomedical
applications will benefit from the introduction of biological components such as proteins. In
this chapter we explore three different reactions to prepare protein – BTA conjugates: the
cyanobenzothiazole condensation, Michael addition with a maleimide, and native chemical
ligation. Cyan and yellow fluorescent proteins (CFP and YFP) were functionalized with
either an N-terminal cysteine or a C-terminal thioester using expressed protein ligation. BTA
derivatives with a cyanobenzothiazole group, maleimide group, and cysteine were
synthesized. The results show that the cyanobenzothiazole reaction does not work, and this is
proposed to be due to hydrophobic shielding of the cyanobenzothiazole group on the BTA.
The Michael addition with the maleimide-functionalized BTA and N-terminal cysteine CFP
had a poor conversion due to side reactions of both the protein and the BTA. The native
chemical ligation reaction between the BTA with a cysteine and proteins with a C-terminal
thioester resulted in the highest conversion. However, the amino acid cysteine that remains
after this reaction resulted in the attachment of another BTA with a cysteine by disulfide
bond formation. Future directions towards the synthesis and purification of protein – BTA
conjugates are presented.
94
6.1 Introduction
In the previous chapters we have extensively characterized the structure and kinetics of the
water-soluble benzene-1,3,5-tricarboxamide (BTA) motif containing a dodecane spacer and
tetra(ethylene glycol) at the periphery (C12BTA). The results showed that this molecule
polymerizes cooperatively into high aspect ratio polymers. Hydrogen/deuterium exchange
experiments showed that the rate at which amide HDX occurs for these polymers, i.e. the
stability at which the monomers are incorporated into the polymers, can be controlled. The
kinetic stability of the polymers can be tuned either by small changes in the chemical
structure of the monomers (chapter 2), or by the copolymerization of two different monomers
(chapter 4). This fundamental knowledge may serve as a basis for the development of these
polymers towards biomedical applications. In this regard, high aspect ratio polymers are
promising candidates for drug delivery,1-4
targeting,5,6
and the engineering of artificial cell
environments.7,8
In their current form the single-component polymers formed from the
C12BTA lack any feature that would render them active in a biological environment.
Recently, a number of functional units have been incorporated, ranging from dyes for super
resolution microscopy and peptides for cell binding to cations for siRNA complexation.9-11
So far, proteins have not been incorporated. Since proteins perform many functions that are
essential for life, they are an interesting target to introduce another function into the BTA-
based supramolecular polymers. Therefore, the aim of this chapter is to synthesize C12BTA –
protein conjugates.
The coupling of synthetic macromolecules to proteins is well-established.12
For example,
poly(ethylene glycol) is frequently used to enhance the pharmacokinetic properties of
therapeutic proteins.13
In addition, other covalent polymers have successfully been applied to
stabilize growth factors and enzymes.14-16
Growth factors, enzymes and fluorescent proteins
have also been attached to high aspect ratio supramolecular polymers, but mostly in a non-
covalent fashion using electrostatic interactions or molecular recognition.17-21
There are
several disadvantages of this non-covalent approach, especially using electrostatic
interactions. The density of the proteins along the supramolecular polymers is difficult to
control. Also the time during which the proteins remain associated with the supramolecular
polymers, is hard to control. It would therefore be advantageous to covalently couple proteins
to supramolecular polymers formed from C12BTA for the following reasons. Covalent
conjugation may allow control over the time span at which the proteins remain associated
with the polymers. In chapter 4 it has been shown that for dual component polymers, both
monomers present inside the copolymers show a slower amide HDX rate, implying that they
are more stably incorporated into the polymers. The stability of monomers inside these
polymers may be increased further, for example by using monomers that contain sterically
larger groups such as sugars at the periphery.22
This strategy has already been successfully
applied using lipidated proteins. The release of lipidated proteins was slower from sterically
stabilized liposomes (slow release), as compared to the release from micelles (fast release).23
In addition, the covalent coupling may enable purification of the protein conjugates. This
way, the number of proteins that are displayed by the supramolecular polymers can be
controlled using different molar ratio’s of functionalized and not functionalized monomers.
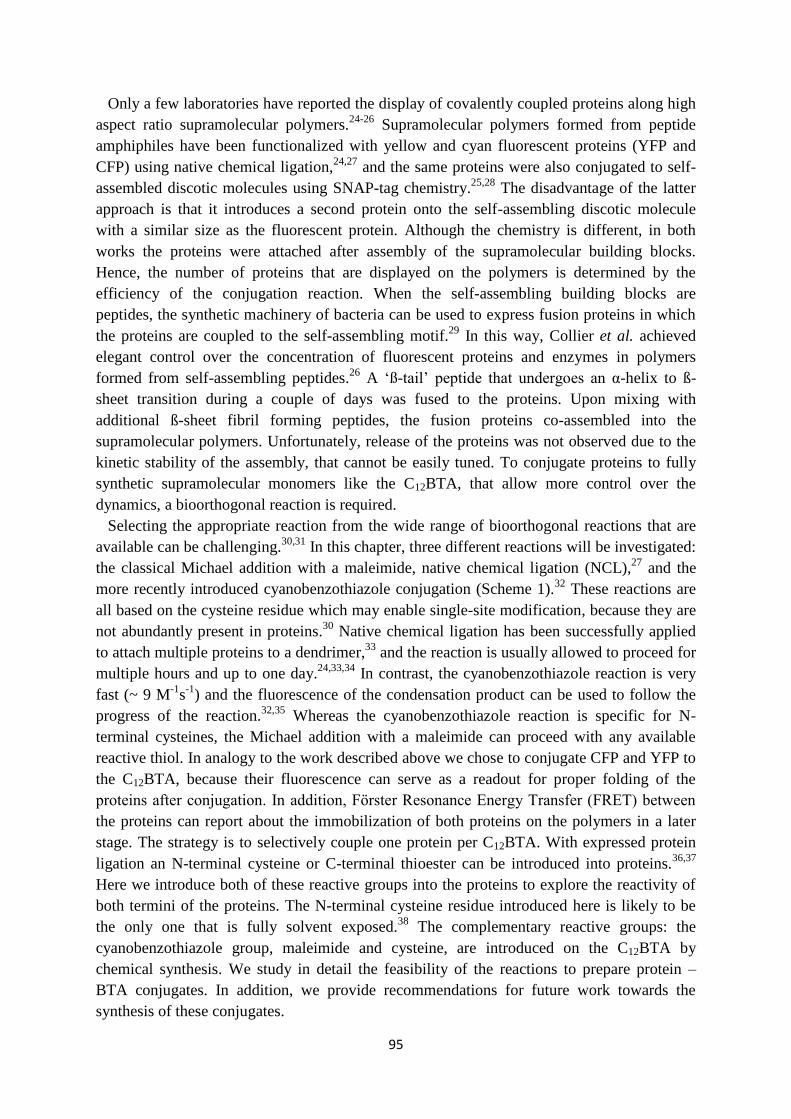
95
Only a few laboratories have reported the display of covalently coupled proteins along high
aspect ratio supramolecular polymers.24-26
Supramolecular polymers formed from peptide
amphiphiles have been functionalized with yellow and cyan fluorescent proteins (YFP and
CFP) using native chemical ligation,24,27
and the same proteins were also conjugated to self-
assembled discotic molecules using SNAP-tag chemistry.25,28
The disadvantage of the latter
approach is that it introduces a second protein onto the self-assembling discotic molecule
with a similar size as the fluorescent protein. Although the chemistry is different, in both
works the proteins were attached after assembly of the supramolecular building blocks.
Hence, the number of proteins that are displayed on the polymers is determined by the
efficiency of the conjugation reaction. When the self-assembling building blocks are
peptides, the synthetic machinery of bacteria can be used to express fusion proteins in which
the proteins are coupled to the self-assembling motif.29
In this way, Collier et al. achieved
elegant control over the concentration of fluorescent proteins and enzymes in polymers
formed from self-assembling peptides.26
A ‘ß-tail’ peptide that undergoes an α-helix to ß-
sheet transition during a couple of days was fused to the proteins. Upon mixing with
additional ß-sheet fibril forming peptides, the fusion proteins co-assembled into the
supramolecular polymers. Unfortunately, release of the proteins was not observed due to the
kinetic stability of the assembly, that cannot be easily tuned. To conjugate proteins to fully
synthetic supramolecular monomers like the C12BTA, that allow more control over the
dynamics, a bioorthogonal reaction is required.
Selecting the appropriate reaction from the wide range of bioorthogonal reactions that are
available can be challenging.30,31
In this chapter, three different reactions will be investigated:
the classical Michael addition with a maleimide, native chemical ligation (NCL),27
and the
more recently introduced cyanobenzothiazole conjugation (Scheme 1).32
These reactions are
all based on the cysteine residue which may enable single-site modification, because they are
not abundantly present in proteins.30
Native chemical ligation has been successfully applied
to attach multiple proteins to a dendrimer,33
and the reaction is usually allowed to proceed for
multiple hours and up to one day.24,33,34
In contrast, the cyanobenzothiazole reaction is very
fast (~ 9 M-1
s-1
) and the fluorescence of the condensation product can be used to follow the
progress of the reaction.32,35
Whereas the cyanobenzothiazole reaction is specific for N-
terminal cysteines, the Michael addition with a maleimide can proceed with any available
reactive thiol. In analogy to the work described above we chose to conjugate CFP and YFP to
the C12BTA, because their fluorescence can serve as a readout for proper folding of the
proteins after conjugation. In addition, Fӧrster Resonance Energy Transfer (FRET) between
the proteins can report about the immobilization of both proteins on the polymers in a later
stage. The strategy is to selectively couple one protein per C12BTA. With expressed protein
ligation an N-terminal cysteine or C-terminal thioester can be introduced into proteins.36,37
Here we introduce both of these reactive groups into the proteins to explore the reactivity of
both termini of the proteins. The N-terminal cysteine residue introduced here is likely to be
the only one that is fully solvent exposed.38
The complementary reactive groups: the
cyanobenzothiazole group, maleimide and cysteine, are introduced on the C12BTA by
chemical synthesis. We study in detail the feasibility of the reactions to prepare protein –
BTA conjugates. In addition, we provide recommendations for future work towards the
synthesis of these conjugates.
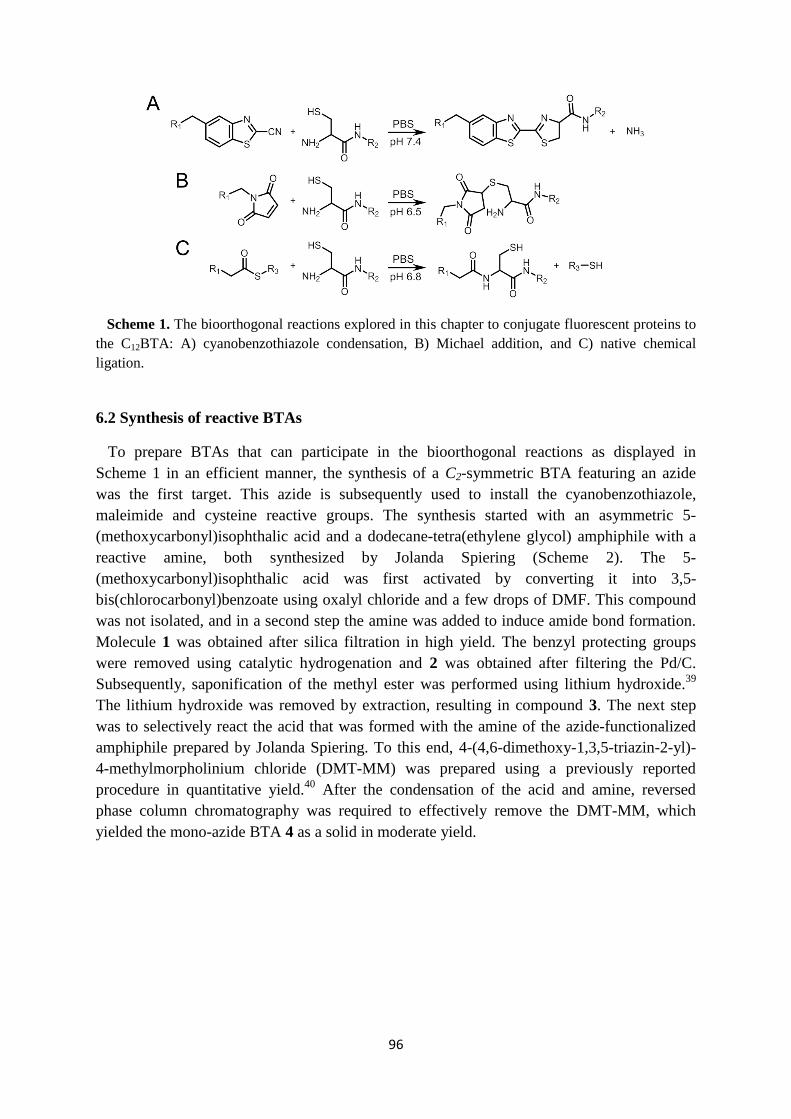
96
Scheme 1. The bioorthogonal reactions explored in this chapter to conjugate fluorescent proteins to
the C12BTA: A) cyanobenzothiazole condensation, B) Michael addition, and C) native chemical
ligation.
6.2 Synthesis of reactive BTAs
To prepare BTAs that can participate in the bioorthogonal reactions as displayed in
Scheme 1 in an efficient manner, the synthesis of a C2-symmetric BTA featuring an azide
was the first target. This azide is subsequently used to install the cyanobenzothiazole,
maleimide and cysteine reactive groups. The synthesis started with an asymmetric 5-
(methoxycarbonyl)isophthalic acid and a dodecane-tetra(ethylene glycol) amphiphile with a
reactive amine, both synthesized by Jolanda Spiering (Scheme 2). The 5-
(methoxycarbonyl)isophthalic acid was first activated by converting it into 3,5-
bis(chlorocarbonyl)benzoate using oxalyl chloride and a few drops of DMF. This compound
was not isolated, and in a second step the amine was added to induce amide bond formation.
Molecule 1 was obtained after silica filtration in high yield. The benzyl protecting groups
were removed using catalytic hydrogenation and 2 was obtained after filtering the Pd/C.
Subsequently, saponification of the methyl ester was performed using lithium hydroxide.39
The lithium hydroxide was removed by extraction, resulting in compound 3. The next step
was to selectively react the acid that was formed with the amine of the azide-functionalized
amphiphile prepared by Jolanda Spiering. To this end, 4-(4,6-dimethoxy-1,3,5-triazin-2-yl)-
4-methylmorpholinium chloride (DMT-MM) was prepared using a previously reported
procedure in quantitative yield.40
After the condensation of the acid and amine, reversed
phase column chromatography was required to effectively remove the DMT-MM, which
yielded the mono-azide BTA 4 as a solid in moderate yield.
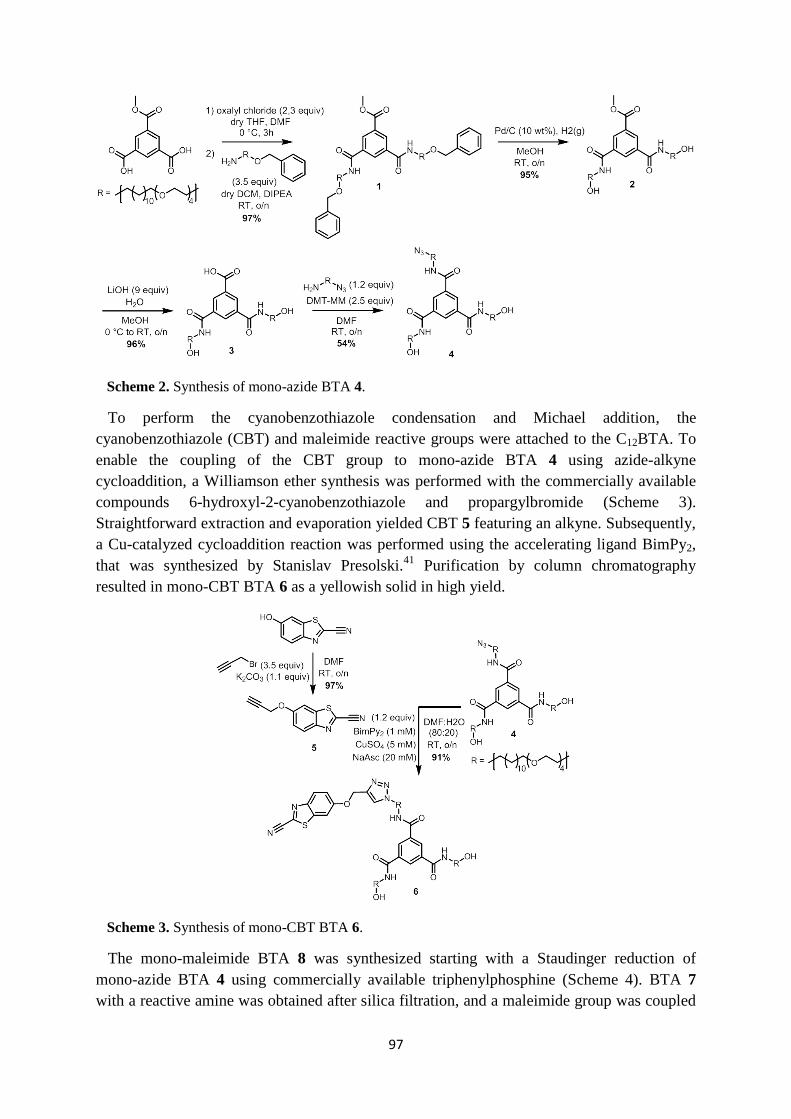
97
Scheme 2. Synthesis of mono-azide BTA 4.
To perform the cyanobenzothiazole condensation and Michael addition, the
cyanobenzothiazole (CBT) and maleimide reactive groups were attached to the C12BTA. To
enable the coupling of the CBT group to mono-azide BTA 4 using azide-alkyne
cycloaddition, a Williamson ether synthesis was performed with the commercially available
compounds 6-hydroxyl-2-cyanobenzothiazole and propargylbromide (Scheme 3).
Straightforward extraction and evaporation yielded CBT 5 featuring an alkyne. Subsequently,
a Cu-catalyzed cycloaddition reaction was performed using the accelerating ligand BimPy2,
that was synthesized by Stanislav Presolski.41
Purification by column chromatography
resulted in mono-CBT BTA 6 as a yellowish solid in high yield.
Scheme 3. Synthesis of mono-CBT BTA 6.
The mono-maleimide BTA 8 was synthesized starting with a Staudinger reduction of
mono-azide BTA 4 using commercially available triphenylphosphine (Scheme 4). BTA 7
with a reactive amine was obtained after silica filtration, and a maleimide group was coupled
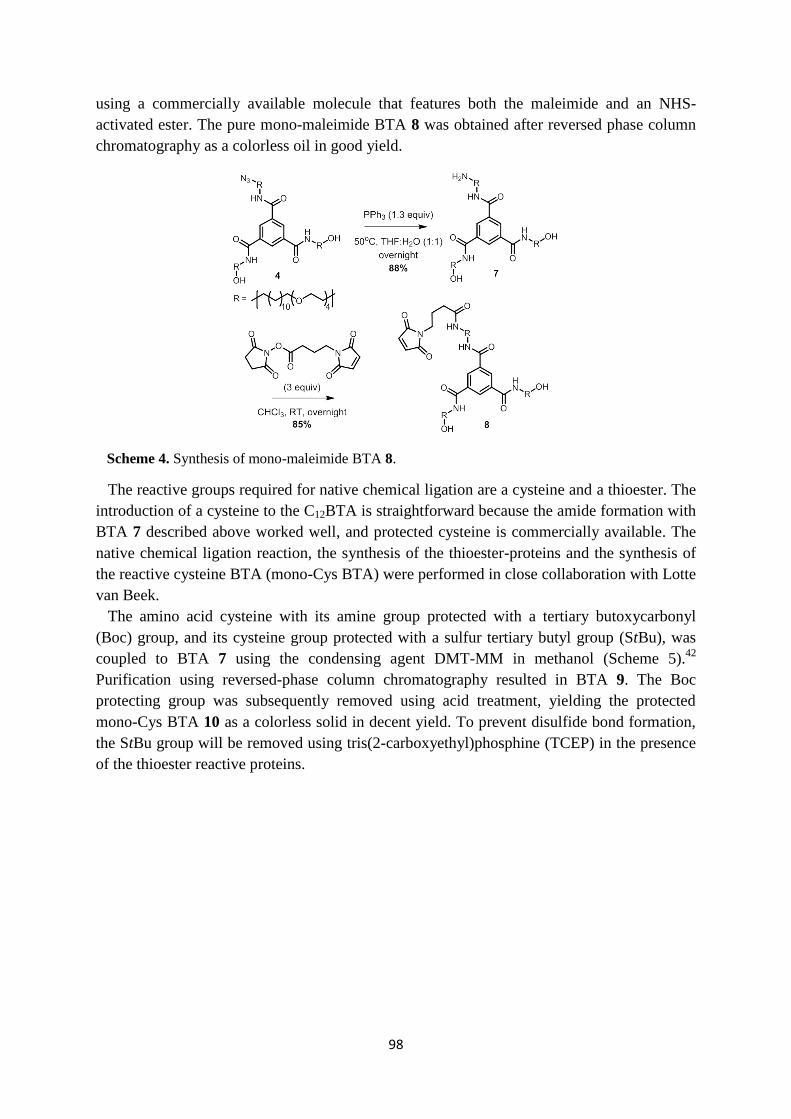
98
using a commercially available molecule that features both the maleimide and an NHS-
activated ester. The pure mono-maleimide BTA 8 was obtained after reversed phase column
chromatography as a colorless oil in good yield.
Scheme 4. Synthesis of mono-maleimide BTA 8.
The reactive groups required for native chemical ligation are a cysteine and a thioester. The
introduction of a cysteine to the C12BTA is straightforward because the amide formation with
BTA 7 described above worked well, and protected cysteine is commercially available. The
native chemical ligation reaction, the synthesis of the thioester-proteins and the synthesis of
the reactive cysteine BTA (mono-Cys BTA) were performed in close collaboration with Lotte
van Beek.
The amino acid cysteine with its amine group protected with a tertiary butoxycarbonyl
(Boc) group, and its cysteine group protected with a sulfur tertiary butyl group (StBu), was
coupled to BTA 7 using the condensing agent DMT-MM in methanol (Scheme 5).42
Purification using reversed-phase column chromatography resulted in BTA 9. The Boc
protecting group was subsequently removed using acid treatment, yielding the protected
mono-Cys BTA 10 as a colorless solid in decent yield. To prevent disulfide bond formation,
the StBu group will be removed using tris(2-carboxyethyl)phosphine (TCEP) in the presence
of the thioester reactive proteins.
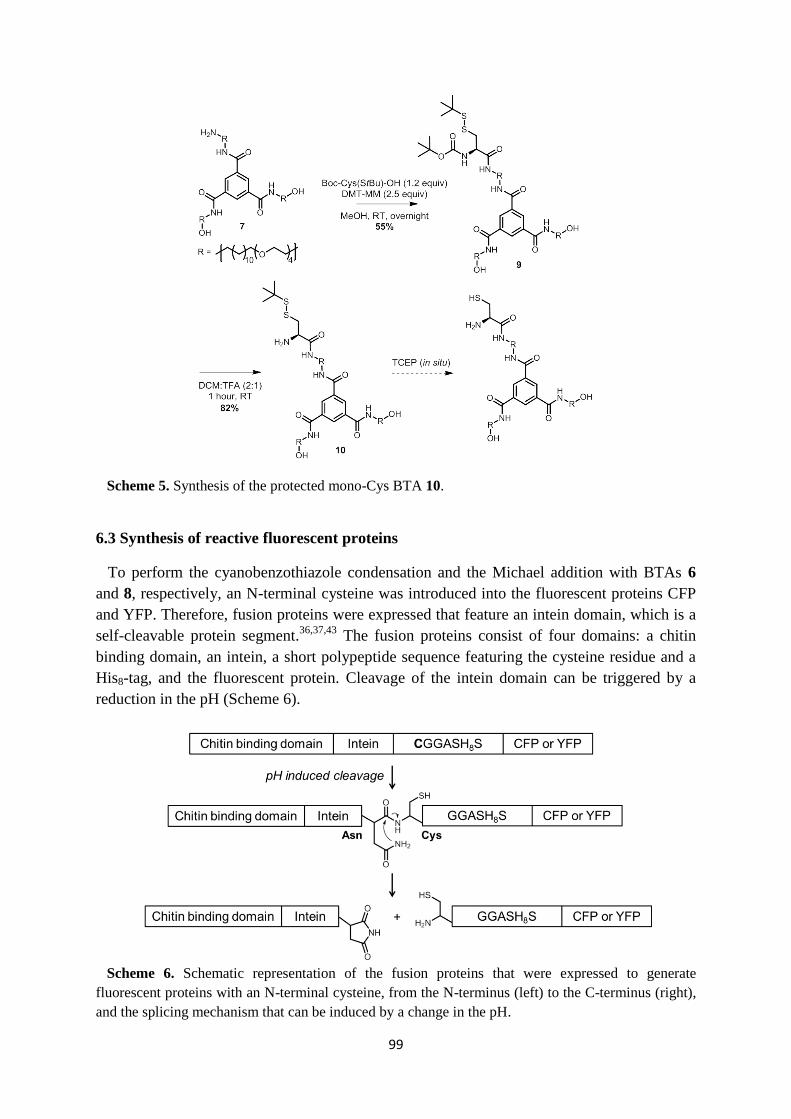
99
Scheme 5. Synthesis of the protected mono-Cys BTA 10.
6.3 Synthesis of reactive fluorescent proteins
To perform the cyanobenzothiazole condensation and the Michael addition with BTAs 6
and 8, respectively, an N-terminal cysteine was introduced into the fluorescent proteins CFP
and YFP. Therefore, fusion proteins were expressed that feature an intein domain, which is a
self-cleavable protein segment.36,37,43
The fusion proteins consist of four domains: a chitin
binding domain, an intein, a short polypeptide sequence featuring the cysteine residue and a
His8-tag, and the fluorescent protein. Cleavage of the intein domain can be triggered by a
reduction in the pH (Scheme 6).
Scheme 6. Schematic representation of the fusion proteins that were expressed to generate
fluorescent proteins with an N-terminal cysteine, from the N-terminus (left) to the C-terminus (right),
and the splicing mechanism that can be induced by a change in the pH.
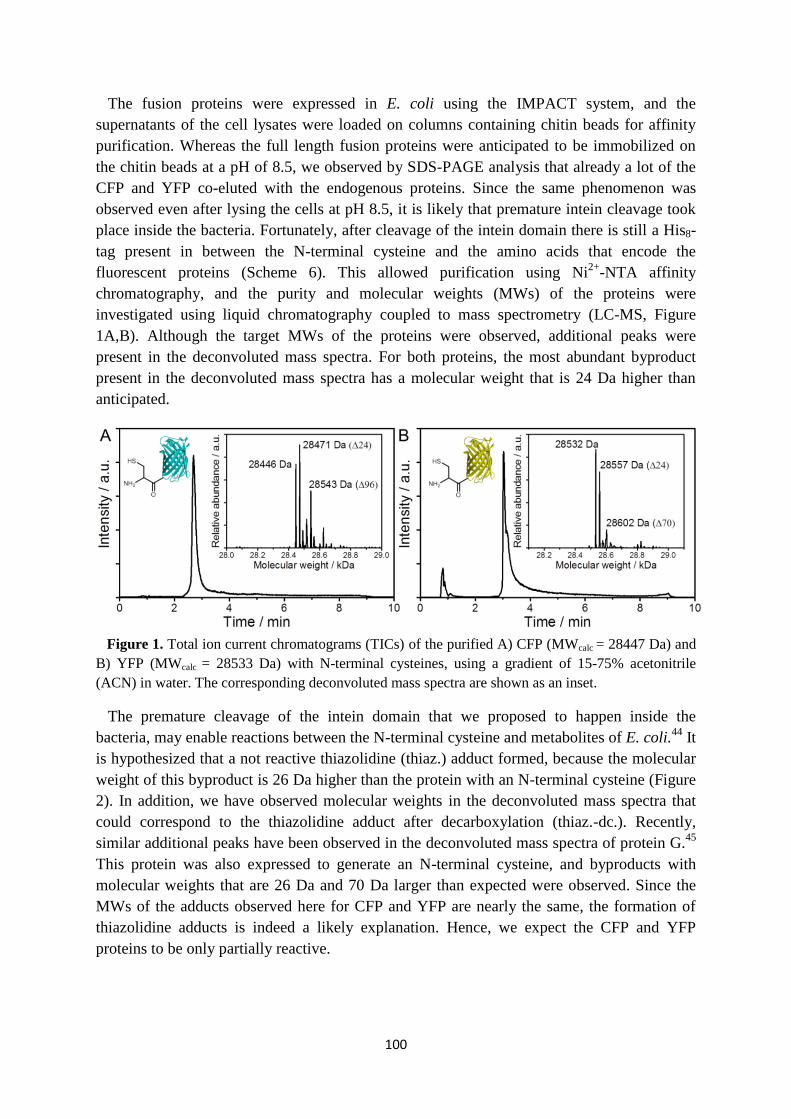
100
The fusion proteins were expressed in E. coli using the IMPACT system, and the
supernatants of the cell lysates were loaded on columns containing chitin beads for affinity
purification. Whereas the full length fusion proteins were anticipated to be immobilized on
the chitin beads at a pH of 8.5, we observed by SDS-PAGE analysis that already a lot of the
CFP and YFP co-eluted with the endogenous proteins. Since the same phenomenon was
observed even after lysing the cells at pH 8.5, it is likely that premature intein cleavage took
place inside the bacteria. Fortunately, after cleavage of the intein domain there is still a His8-
tag present in between the N-terminal cysteine and the amino acids that encode the
fluorescent proteins (Scheme 6). This allowed purification using Ni2+
-NTA affinity
chromatography, and the purity and molecular weights (MWs) of the proteins were
investigated using liquid chromatography coupled to mass spectrometry (LC-MS, Figure
1A,B). Although the target MWs of the proteins were observed, additional peaks were
present in the deconvoluted mass spectra. For both proteins, the most abundant byproduct
present in the deconvoluted mass spectra has a molecular weight that is 24 Da higher than
anticipated.
Figure 1. Total ion current chromatograms (TICs) of the purified A) CFP (MWcalc = 28447 Da) and
B) YFP (MWcalc = 28533 Da) with N-terminal cysteines, using a gradient of 15-75% acetonitrile
(ACN) in water. The corresponding deconvoluted mass spectra are shown as an inset.
The premature cleavage of the intein domain that we proposed to happen inside the
bacteria, may enable reactions between the N-terminal cysteine and metabolites of E. coli.44
It
is hypothesized that a not reactive thiazolidine (thiaz.) adduct formed, because the molecular
weight of this byproduct is 26 Da higher than the protein with an N-terminal cysteine (Figure
2). In addition, we have observed molecular weights in the deconvoluted mass spectra that
could correspond to the thiazolidine adduct after decarboxylation (thiaz.-dc.). Recently,
similar additional peaks have been observed in the deconvoluted mass spectra of protein G.45
This protein was also expressed to generate an N-terminal cysteine, and byproducts with
molecular weights that are 26 Da and 70 Da larger than expected were observed. Since the
MWs of the adducts observed here for CFP and YFP are nearly the same, the formation of
thiazolidine adducts is indeed a likely explanation. Hence, we expect the CFP and YFP
proteins to be only partially reactive.
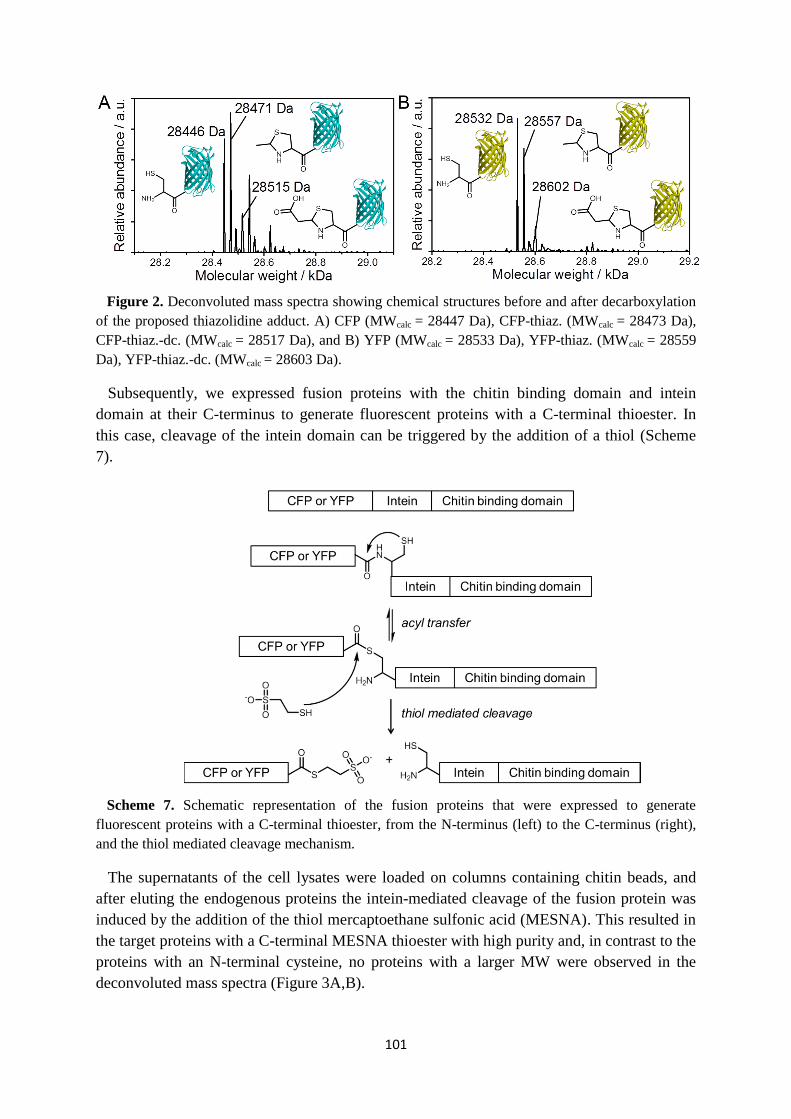
101
Figure 2. Deconvoluted mass spectra showing chemical structures before and after decarboxylation
of the proposed thiazolidine adduct. A) CFP (MWcalc = 28447 Da), CFP-thiaz. (MWcalc = 28473 Da),
CFP-thiaz.-dc. (MWcalc = 28517 Da), and B) YFP (MWcalc = 28533 Da), YFP-thiaz. (MWcalc = 28559
Da), YFP-thiaz.-dc. (MWcalc = 28603 Da).
Subsequently, we expressed fusion proteins with the chitin binding domain and intein
domain at their C-terminus to generate fluorescent proteins with a C-terminal thioester. In
this case, cleavage of the intein domain can be triggered by the addition of a thiol (Scheme
7).
Scheme 7. Schematic representation of the fusion proteins that were expressed to generate
fluorescent proteins with a C-terminal thioester, from the N-terminus (left) to the C-terminus (right),
and the thiol mediated cleavage mechanism.
The supernatants of the cell lysates were loaded on columns containing chitin beads, and
after eluting the endogenous proteins the intein-mediated cleavage of the fusion protein was
induced by the addition of the thiol mercaptoethane sulfonic acid (MESNA). This resulted in
the target proteins with a C-terminal MESNA thioester with high purity and, in contrast to the
proteins with an N-terminal cysteine, no proteins with a larger MW were observed in the
deconvoluted mass spectra (Figure 3A,B).
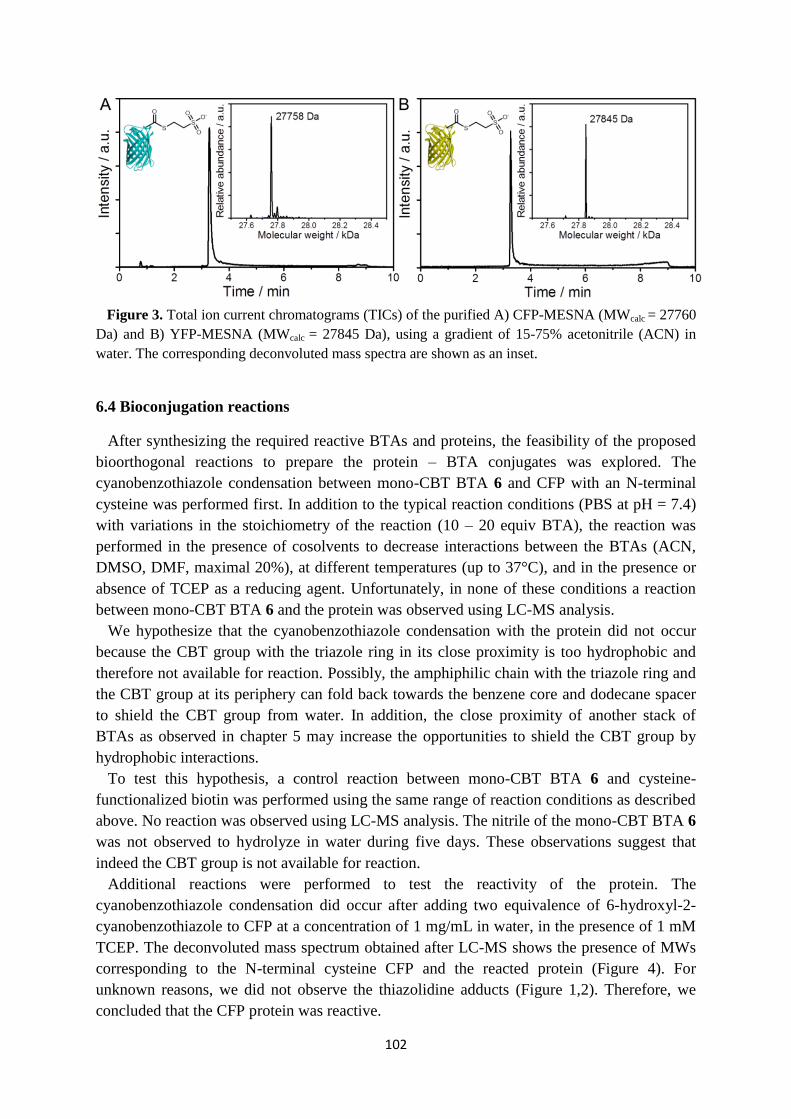
102
Figure 3. Total ion current chromatograms (TICs) of the purified A) CFP-MESNA (MWcalc = 27760
Da) and B) YFP-MESNA (MWcalc = 27845 Da), using a gradient of 15-75% acetonitrile (ACN) in
water. The corresponding deconvoluted mass spectra are shown as an inset.
6.4 Bioconjugation reactions
After synthesizing the required reactive BTAs and proteins, the feasibility of the proposed
bioorthogonal reactions to prepare the protein – BTA conjugates was explored. The
cyanobenzothiazole condensation between mono-CBT BTA 6 and CFP with an N-terminal
cysteine was performed first. In addition to the typical reaction conditions (PBS at pH = 7.4)
with variations in the stoichiometry of the reaction (10 – 20 equiv BTA), the reaction was
performed in the presence of cosolvents to decrease interactions between the BTAs (ACN,
DMSO, DMF, maximal 20%), at different temperatures (up to 37°C), and in the presence or
absence of TCEP as a reducing agent. Unfortunately, in none of these conditions a reaction
between mono-CBT BTA 6 and the protein was observed using LC-MS analysis.
We hypothesize that the cyanobenzothiazole condensation with the protein did not occur
because the CBT group with the triazole ring in its close proximity is too hydrophobic and
therefore not available for reaction. Possibly, the amphiphilic chain with the triazole ring and
the CBT group at its periphery can fold back towards the benzene core and dodecane spacer
to shield the CBT group from water. In addition, the close proximity of another stack of
BTAs as observed in chapter 5 may increase the opportunities to shield the CBT group by
hydrophobic interactions.
To test this hypothesis, a control reaction between mono-CBT BTA 6 and cysteine-
functionalized biotin was performed using the same range of reaction conditions as described
above. No reaction was observed using LC-MS analysis. The nitrile of the mono-CBT BTA 6
was not observed to hydrolyze in water during five days. These observations suggest that
indeed the CBT group is not available for reaction.
Additional reactions were performed to test the reactivity of the protein. The
cyanobenzothiazole condensation did occur after adding two equivalence of 6-hydroxyl-2-
cyanobenzothiazole to CFP at a concentration of 1 mg/mL in water, in the presence of 1 mM
TCEP. The deconvoluted mass spectrum obtained after LC-MS shows the presence of MWs
corresponding to the N-terminal cysteine CFP and the reacted protein (Figure 4). For
unknown reasons, we did not observe the thiazolidine adducts (Figure 1,2). Therefore, we
concluded that the CFP protein was reactive.
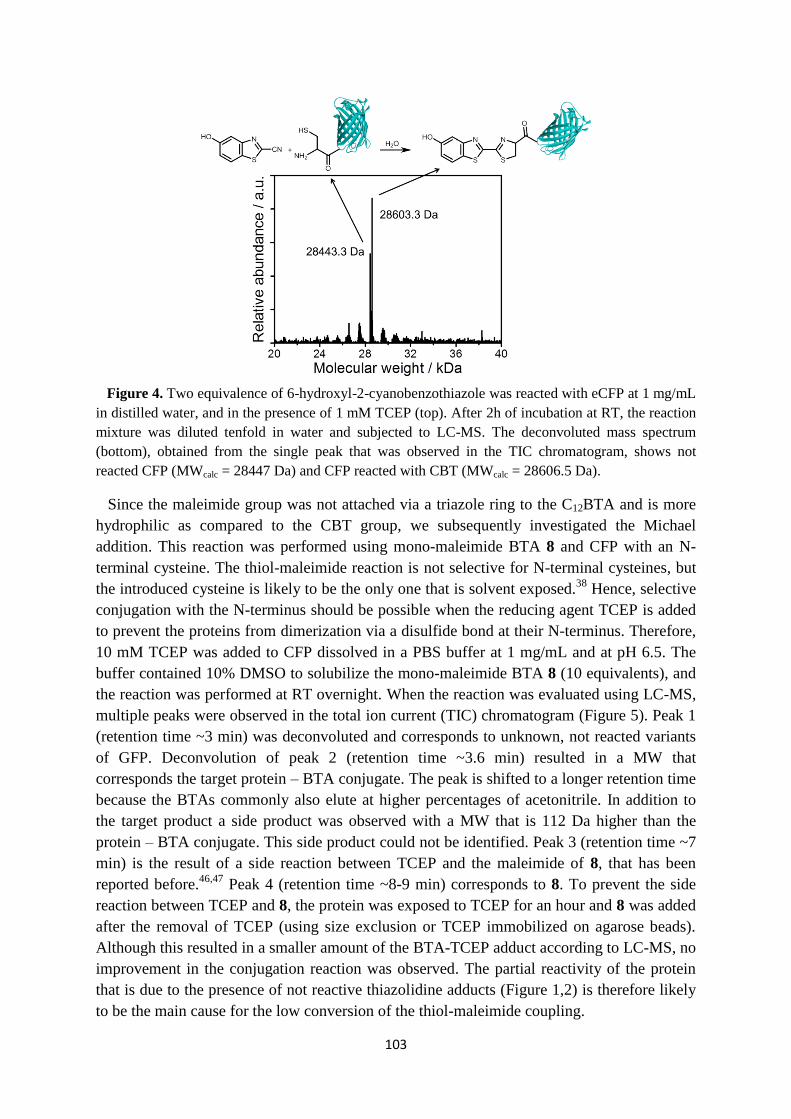
103
Figure 4. Two equivalence of 6-hydroxyl-2-cyanobenzothiazole was reacted with eCFP at 1 mg/mL
in distilled water, and in the presence of 1 mM TCEP (top). After 2h of incubation at RT, the reaction
mixture was diluted tenfold in water and subjected to LC-MS. The deconvoluted mass spectrum
(bottom), obtained from the single peak that was observed in the TIC chromatogram, shows not
reacted CFP (MWcalc = 28447 Da) and CFP reacted with CBT (MWcalc = 28606.5 Da).
Since the maleimide group was not attached via a triazole ring to the C12BTA and is more
hydrophilic as compared to the CBT group, we subsequently investigated the Michael
addition. This reaction was performed using mono-maleimide BTA 8 and CFP with an N-
terminal cysteine. The thiol-maleimide reaction is not selective for N-terminal cysteines, but
the introduced cysteine is likely to be the only one that is solvent exposed.38
Hence, selective
conjugation with the N-terminus should be possible when the reducing agent TCEP is added
to prevent the proteins from dimerization via a disulfide bond at their N-terminus. Therefore,
10 mM TCEP was added to CFP dissolved in a PBS buffer at 1 mg/mL and at pH 6.5. The
buffer contained 10% DMSO to solubilize the mono-maleimide BTA 8 (10 equivalents), and
the reaction was performed at RT overnight. When the reaction was evaluated using LC-MS,
multiple peaks were observed in the total ion current (TIC) chromatogram (Figure 5). Peak 1
(retention time ~3 min) was deconvoluted and corresponds to unknown, not reacted variants
of GFP. Deconvolution of peak 2 (retention time ~3.6 min) resulted in a MW that
corresponds the target protein – BTA conjugate. The peak is shifted to a longer retention time
because the BTAs commonly also elute at higher percentages of acetonitrile. In addition to
the target product a side product was observed with a MW that is 112 Da higher than the
protein – BTA conjugate. This side product could not be identified. Peak 3 (retention time ~7
min) is the result of a side reaction between TCEP and the maleimide of 8, that has been
reported before.46,47
Peak 4 (retention time ~8-9 min) corresponds to 8. To prevent the side
reaction between TCEP and 8, the protein was exposed to TCEP for an hour and 8 was added
after the removal of TCEP (using size exclusion or TCEP immobilized on agarose beads).
Although this resulted in a smaller amount of the BTA-TCEP adduct according to LC-MS, no
improvement in the conjugation reaction was observed. The partial reactivity of the protein
that is due to the presence of not reactive thiazolidine adducts (Figure 1,2) is therefore likely
to be the main cause for the low conversion of the thiol-maleimide coupling.
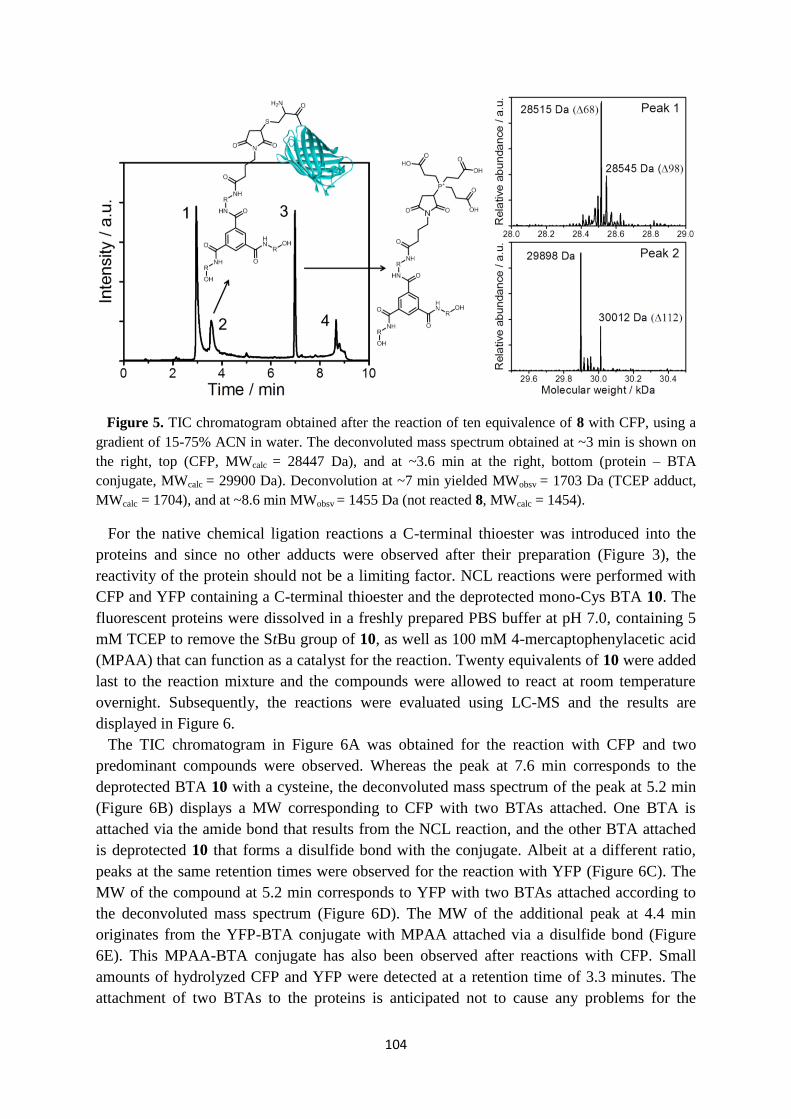
104
Figure 5. TIC chromatogram obtained after the reaction of ten equivalence of 8 with CFP, using a
gradient of 15-75% ACN in water. The deconvoluted mass spectrum obtained at ~3 min is shown on
the right, top (CFP, MWcalc = 28447 Da), and at ~3.6 min at the right, bottom (protein – BTA
conjugate, MWcalc = 29900 Da). Deconvolution at ~7 min yielded MWobsv = 1703 Da (TCEP adduct,
MWcalc = 1704), and at ~8.6 min MWobsv = 1455 Da (not reacted 8, MWcalc = 1454).
For the native chemical ligation reactions a C-terminal thioester was introduced into the
proteins and since no other adducts were observed after their preparation (Figure 3), the
reactivity of the protein should not be a limiting factor. NCL reactions were performed with
CFP and YFP containing a C-terminal thioester and the deprotected mono-Cys BTA 10. The
fluorescent proteins were dissolved in a freshly prepared PBS buffer at pH 7.0, containing 5
mM TCEP to remove the StBu group of 10, as well as 100 mM 4-mercaptophenylacetic acid
(MPAA) that can function as a catalyst for the reaction. Twenty equivalents of 10 were added
last to the reaction mixture and the compounds were allowed to react at room temperature
overnight. Subsequently, the reactions were evaluated using LC-MS and the results are
displayed in Figure 6.
The TIC chromatogram in Figure 6A was obtained for the reaction with CFP and two
predominant compounds were observed. Whereas the peak at 7.6 min corresponds to the
deprotected BTA 10 with a cysteine, the deconvoluted mass spectrum of the peak at 5.2 min
(Figure 6B) displays a MW corresponding to CFP with two BTAs attached. One BTA is
attached via the amide bond that results from the NCL reaction, and the other BTA attached
is deprotected 10 that forms a disulfide bond with the conjugate. Albeit at a different ratio,
peaks at the same retention times were observed for the reaction with YFP (Figure 6C). The
MW of the compound at 5.2 min corresponds to YFP with two BTAs attached according to
the deconvoluted mass spectrum (Figure 6D). The MW of the additional peak at 4.4 min
originates from the YFP-BTA conjugate with MPAA attached via a disulfide bond (Figure
6E). This MPAA-BTA conjugate has also been observed after reactions with CFP. Small
amounts of hydrolyzed CFP and YFP were detected at a retention time of 3.3 minutes. The
attachment of two BTAs to the proteins is anticipated not to cause any problems for the
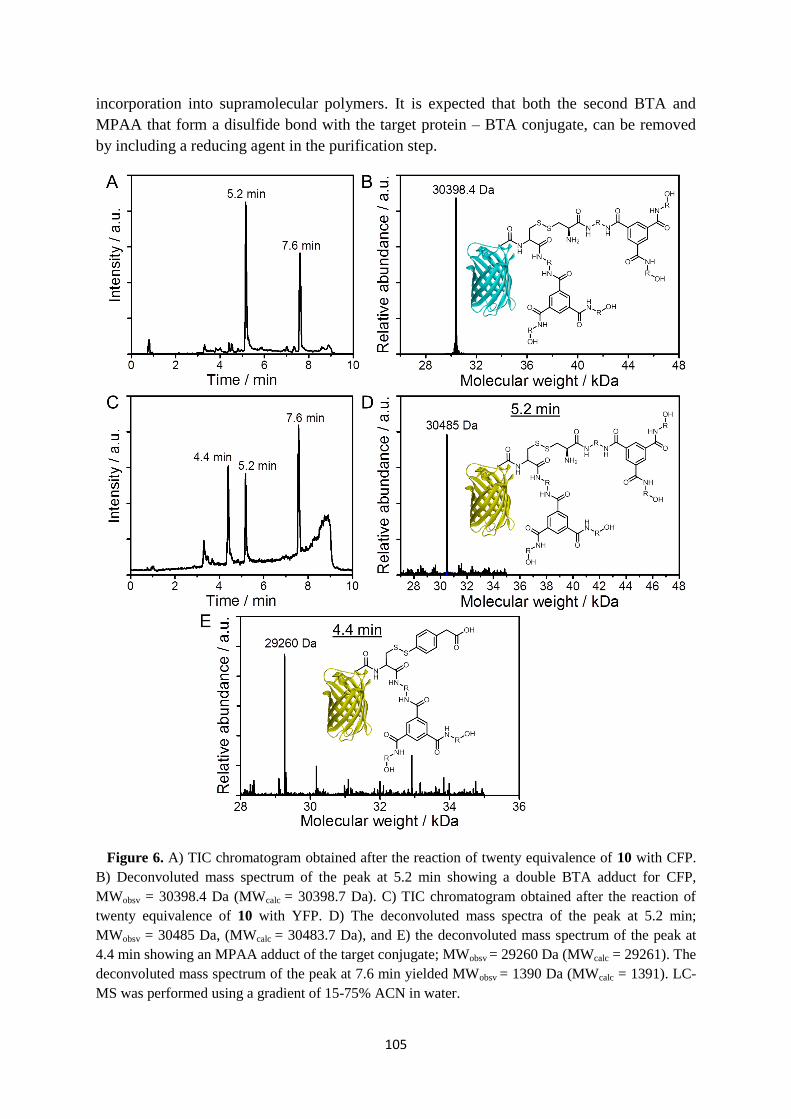
105
incorporation into supramolecular polymers. It is expected that both the second BTA and
MPAA that form a disulfide bond with the target protein – BTA conjugate, can be removed
by including a reducing agent in the purification step.
Figure 6. A) TIC chromatogram obtained after the reaction of twenty equivalence of 10 with CFP.
B) Deconvoluted mass spectrum of the peak at 5.2 min showing a double BTA adduct for CFP,
MWobsv = 30398.4 Da (MWcalc = 30398.7 Da). C) TIC chromatogram obtained after the reaction of
twenty equivalence of 10 with YFP. D) The deconvoluted mass spectra of the peak at 5.2 min;
MWobsv = 30485 Da, (MWcalc = 30483.7 Da), and E) the deconvoluted mass spectrum of the peak at
4.4 min showing an MPAA adduct of the target conjugate; MWobsv = 29260 Da (MWcalc = 29261). The
deconvoluted mass spectrum of the peak at 7.6 min yielded MWobsv = 1390 Da (MWcalc = 1391). LC-
MS was performed using a gradient of 15-75% ACN in water.
106
6.5 Discussion and conclusions
Our aim was to synthesize protein – BTA conjugates based on the cysteine residue in a
selective manner. BTAs with a cyanobenzothiazole group, a maleimide group, and the amino
acid cysteine were synthesized. In addition, the fluorescent proteins CFP and YFP have been
prepared with either an N-terminal cysteine or a C-terminal thioester. The
cyanobenzothiazole reaction did not result in the target compounds, probably because the
CBT group was not available for reaction due to hydrophobic interactions. A low conversion
for the thiol-maleimide coupling was observed, because not all proteins contained an N-
terminal cysteine that was available for reaction. We hypothesize that a part of the N-terminal
cysteines was blocked due to the formation of unreactive thiazolidine adducts. The presence
of the proposed adducts can be investigated by the addition of O-methylhydroxylamine. This
molecule has been shown to regenerate the N-terminal cysteine, and could therefore also be
used to increase the conversion of the thiol-maleimide coupling.48
However, since the
maleimide group of the BTA was also observed to react with TCEP, it is antipicated to be
difficult to reach high conversions with this reaction. No side reactions were observed when
performing native chemical ligation reactions. The proteins prepared with a C-terminal
thioester were observed to be very reactive, since no significant amount of unreacted protein
was present after the reactions. However, the NCL reaction also yielded oxidized versions of
the target constructs with either another BTA or the catalyst MPAA attached. The BTA or
MPAA are attached via the thiol of the cysteine that remains after the NCL reaction. In a
subsequent purification step, it may be possible to remove these adducts using a reducing
agent. To prevent the formation of disulfide bonds between two protein – BTA constructs, the
thiols may be blocked by reacting them with maleimide.
In conclusion, native chemical ligation is the most promising strategy to obtain protein –
BTA conjugates when comparing the reactions performed in this chapter. However, further
research should be devoted to purification, and also different approaches for covalent protein
conjugation may be explored. Since the excess of BTA will be difficult to remove, the most
straightforward approach to obtain pure protein – BTA conjugates may be to use an excess of
the protein instead. Subsequent purification by ultracentrifugation may be used to remove not
reacted protein.23
Several laboratories have reported successful conjugation reactions with
non-natural amino acids.45,49,50
In this chapter an asymmetric BTA with an azide was
prepared. Therefore, the introduction of a non-natural amino acid that features an alkyne to
react with the mono-azide BTA is also anticipated to be a good strategy to prepare protein –
BTA conjugates.51
6.6 Experimental section
Instrumentation. 1H NMR and
13C NMR spectra were recorded on a Varian Mercury Vx 400
MHz (100 MHz for 13
C), a Bruker 400 MHz NMR or a 500 MHz Varian Unit Inova spectrometer.
Chemical shifts are given in ppm (δ) values relative to tetramethylsilane (TMS). Splitting patterns are
labelled as s, singlet; d, doublet; dd, double doublet; t, triplet; q, quartet; quin, quintet; m, multiplet
and b stands for broad.
Matrix-assisted laser desorption/ionisation (MALDI) mass spectra were obtained on a
PerSeptive Biosystems Voyager DE-PRO spectrometer or a Bruker autoflex speed spectrometer using
107
α-cyano-4-hydroxycinnamic acid (CHCA) and 2-[(2E)-3-(4-tert-butylphenyl)-2-methylprop-2-
enylidene]malononitrile (DCTB) as matrices. Purity and exact mass of compounds were also
determined using a LCQ Fleet (ThermoScientific Finnigan) ion trap mass spectrometer equipped with
a Surveyor autosampler and ThermoScientific Finnigan detector. Solvents were pumped with a flow
of 0.2 ml/min using Shimadzu SCL-10A pumps. The compounds were run over a reverse phase C18
column in an acetonitrile gradient of 5%-100% in water supplemented with 0.1% formic acid prior to
mass analysis. Magtran was used for deconvolution of the m/z spectra. Proteins at 0.1 mg/mL in MQ
were analyzed using LC-QTOF-MS, which was performed using a Waters Xevo G2 QTOF LC-MS.
An Agilent Polaris C18-A RP column was used and elution was performed using an acetonitrile
gradient from 15% to 75% over 10 minutes.
Infrared spectra were recorded on a Perkin Elmer Spectrum One 1600 FT-IR spectrometer or
a Perkin Elmer Spectrum Two FT-IR spectrometer, equipped with a Perkin Elmer Universal ATR
Sampler Accessory.
Reactions were followed by thin-layer chromatography (TLC) using 60-F254 silica gel plates
from Merck and visualized by UV light at 254 nm. Amines were detected with ninhydrin staining.
Column chromatography was performed on a Biotage IsoleraTM Prime chromatography
system using a 24 g Grace silica column. Reverse phase column chromatography was achieved using
a 36 g reversed phase KP-C18-HS Grace Biotage column.
Chemical synthesis.
methyl 3,5-bis((1-phenyl-2,5,8,11,14-pentaoxahexacosan-26-yl)carbamoyl)benzoate (1)
Reaction 1. A dry 10 mL round bottom flask under Argon was charged with 5-
(methoxycarbonyl)isophthalic acid (100 mg, 0,446 mmol), 3 mL dry THF (stored under Argon after
collection with dry solvent system), and a few droplets of dry DMF (also under Argon) were added.
The stirred solution was cooled to 0 °C and oxalyl dichloride (174 µl, 2,052 mmol) was added
dropwise. The reaction is exotherm; a white precipitate was immediately formed. The reaction
mixture was stirred for three hours and allowed to warm to RT. After three hours, little solvent was
visible because a lot of white precipitate formed. ~ 1 mL toluene was added to quench the reaction
and the solvent was evaporated, resulting in a white solid which could be dissolved in
dichloromethane.
Reaction 2. The product of reaction one: methyl 3,5-bis(chlorocarbonyl)benzoate (116 mg, 0,444
mmol) was dissolved in 1.5 mL dry DCM. 1-phenyl-2,5,8,11,14-pentaoxahexacosan-26-amine (735
mg, 1,572 mmol), while under a flow of N2(g), was dissolved in 1600 uL dry DCM and 300 uL dry
DIPEA (new bottle) and added dropwise to the stirred solution at RT. A red colour was formed
immediately, and the reaction mixture was coloured like a good wine. The reaction was performed
overnight at RT. The reaction mixture was concentrated in vacuo, yielding a red oil. The mixture was
filtered twice over silica (3g) to remove the not reacted amine, using chloroform:methanol (97.5:2.5)
as the eluent. Pure fractions were concentrated in vacuo. Yield = 487 mg, 97%. 1H NMR (400 MHz,
CDCl3): δ = 8.54 (d, J = 1.7 Hz, 2H), 8.41 (t, J = 1.7 Hz, 1H), 7.39 – 7.22 (m, 10H), 6.45 (t, J = 5.7
Hz, 2H), 4.55 (s, 4H), 3.96 (s, 3H), 3.70 – 3.59 (m, 28H), 3.58 – 3.52 (m, 4H), 3.44 (m, 8H), 1.58 (m,
8H), 1.26 (m, 32H). 13
C NMR (100 MHz, CDCl3): δ = 165.80, 165.50, 138.20, 135.49, 131.01,
130.45, 129.59, 128.32, 127.72, 127.56, 109.99, 77.32, 77.20, 77.00, 76.68, 73.23, 71.51, 70.63,
70.60, 70.59, 70.03, 69.41, 52.58, 40.38, 29.59, 29.56, 29.50, 29.48, 29.45, 29.41, 29.25, 26.96, 26.04.
FT-IR (ATR) ν (cm-1): 3346, 2924, 2854, 1728, 1648, 1663, 1538, 1454, 1350, 1255, 1103, 1029,
946, 772, 741, 698, 607. MALDI (CHCA/DCTB), 0.5 mg/mL in CHCl3 sample. Calculated: 1123.5
Da, observed: 1145.75 Da [M+Na].
108
methyl 3,5-bis((1-hydroxy-3,6,9,12-tetraoxatetracosan-24-yl)carbamoyl)benzoate (2)
A round bottom flask (10 ml) was charged with methyl 3,5-bis((1-phenyl-2,5,8,11,14-
pentaoxahexacosan-26-yl)carbamoyl)benzoate (200 mg, 0,178 mmol), methanol (4 ml), and N2(g)
was led through the (uncovered) stirred solution for 15 minutes. Subsequently, 20 mg Pd/C (10 wt%,
Merck) was added and a balloon filled with H2(g) was connected. The reaction mixture was stirred
under H2(g) atmosphere at room temperature overnight. The reaction mixture was filtered through a
double layer of filter paper to remove Pd/C by washing three times with 5 mL methanol. The product
was concentrated in vacuo. Yield = 160 mg, 95%. 1H NMR (400 MHz, CDCl3): δ = 8.53 (d, J = 1.6
Hz, 2H), 8.43 (t, J = 1.6 Hz, 1H), 3.95 (s, J = 1.8 Hz, 3H), 3.76 – 3.53 (m, 32H), 3.51 – 3.39 (m, 8H),
2.23 (b, 2H), 1.59 (m, 8H), 1.26 (m, 32H). 13
C NMR (100 MHz, CDCl3): δ = 165.83, 165.62, 135.45,
130.97, 130.46, 129.73, 77.31, 77.20, 77.00, 76.68, 72.57, 71.54, 70.59, 70.55, 70.54, 70.49, 70.24,
69.99, 61.69, 52.58, 40.39, 29.52, 29.50, 29.49, 29.46, 29.43, 29.38, 29.24, 26.95, 26.00. FT-IR
(ATR) ν (cm-1): 3333, 2923, 2854, 1728, 1645, 1539, 1444, 1349, 1257, 1105, 941, 714. LCMS:
calculated: 943.3 Da, observed after deconvolution: 943 Da.
3,5-bis((1-hydroxy-3,6,9,12-tetraoxatetracosan-24-yl)carbamoyl)benzoic acid (3)
A round bottom flask (10 ml) was charged with methyl 3,5-bis((1-hydroxy-3,6,9,12-
tetraoxatetracosan-24-yl)carbamoyl)benzoate (121 mg, 0,128 mmol) and 2 ml methanol. The solution
was stirred on ice for 15 minutes. Subsequently, lithium hydroxide (27,6 mg, 1,155 mmol) in 0,4 MQ
water was added dropwise to the solution. The reaction mixture was stirred overnight and allowed to
warm to RT. The basic (pH=11) reaction mixture was acidified (pH=2) using 1M HCl in H2O, and the
methanol was evaporated. The H2O layer was diluted and extracted three times using CHCl3, the
organic layers were combined and concentrated in vacuo. Yield = 114 mg, 96%. 1H NMR (400 MHz,
CDCl3): δ = 8.55 (d, J = 1.6 Hz, 2H), 8.50 (t, J = 1.7 Hz, 1H), 7.00 (s, 2H), 3.77 – 3.54 (m, 32H), 3.44
(m, 8H), 1.58 (m, 8H), 1.44 – 1.15 (m, 32H). 13
C NMR (100 MHz, CDCl3): δ = 167.12, 165.97,
135.32, 131.11, 130.86, 77.31, 77.20, 76.99, 76.67, 72.50, 71.55, 70.58, 70.56, 70.52, 70.49, 70.27,
69.97, 61.63, 40.36, 29.47, 29.41, 29.38, 29.33, 29.31, 29.12, 26.84, 26.00. FT-IR (ATR) ν (cm-1):
3336, 3075, 2923, 2854, 1722, 1646, 1595, 1541, 1455, 1350, 1260, 1180, 1104, 940, 885, 746, 676.
LCMS: calculated: 929.2 Da, observed after deconvolution: 928.8 Da.
N1-(1-azido-3,6,9,12-tetraoxatetracosan-24-yl)-N3,N5-bis(1-hydroxy-3,6,9,12-
tetraoxatetracosan-24-yl)benzene-1,3,5-tricarboxamide (4)
A 10 mL round bottom flask was charged with 3,5-bis((1-hydroxy-3,6,9,12-tetraoxatetracosan-24-
yl)carbamoyl)benzoic acid (112 mg, 0,121 mmol) and 1-azido-3,6,9,12-tetraoxatetracosan-24-amine
(58,4 mg, 0,145 mmol) dissolved in 2 mL DMF. The solution was stirred for half an hour, after which
4-(4,6-dimethoxy-1,3,5-triazin-2-yl)-4-methylmorpholinium chloride (DMT-MM, 84 mg, 0,302
mmol) in 0.5 mL DMF was added dropwise. The reaction mixture was stirred at RT overnight. The
reaction mixture was concentrated with a flow of N2(g) and the resulting concentrated solution was
purified by reversed phase column chromatography using an isocratic flow
(acetonitrile/tetrahydrofuran/water 7/1/2 v/v/v). Combined fractions were concentrated in vacuo to
remove tetrahydrofuran and acetonitrile. Subsequently, the product was extracted three times from the
water using chloroform. The organic layers were combined and concentrated in vacuo, yielding a
colourless film. Yield = 86 mg, 54%. 1H NMR (400 MHz, CDCl3): δ = 8.37 (s, 3H, Ar), 6.81 (t, J =
5.2 Hz, 3H, CH2NHC=O), 3.77 – 3.52 (m, 46H, O-(CH2)2-O, O-(CH2)2-OH, OCH2CH2N3), 3.50 –
3.33 (m, 14H, CH2CH2NHC=O, CH2CH2CH2O, N3-CH2), 1.69 – 1.47 (m, 12H, CH2CH2CH2O,
CH2CH2NHC=O), 1.41 – 1.16 (m, 48H, aliphatic). 13
C NMR (100 MHz, CDCl3): δ = 165.81, 135.20,
132.20, 128.10, 77.31, 77.19, 76.99, 76.67, 72.43, 71.53, 70.67, 70.62, 70.60, 70.55, 70.50, 70.45,
70.44, 70.23, 70.03, 70.00, 69.88, 61.60, 50.66, 40.32, 29.60, 29.53, 29.50, 29.49, 29.46, 29.45, 29.43,
109
29.39, 29.36, 29.34, 29.24, 29.13, 26.96, 26.86, 26.05, 25.98. FT-IR (ATR) ν (cm-1): 3335, 3074,
2923, 2854, 2102, 1649, 1597, 1537, 1465, 1349, 1287, 1262, 1106, 941, 883, 803, 707, 557. LCMS:
calculated: 1313.8 Da, observed after deconvolution: 1313.5 Da.
6-(prop-2-yn-1-yloxy)benzo[d]thiazole-2-carbonitrile (5)
A 10 mL round bottom flask was charged with 6-hydroxybenzo[d]thiazole-2-carbonitrile (32,0 mg,
0,182 mmol), potassium carbonate (27,6 mg, 0,200 mmol) and 3.5 mL DMF, was stirred for half an
hour. 71.16 uL of 80 wt% propargyl bromide in toluene (1.335 g/mL) was added dropwise, and the
mixture was stirred at RT overnight. The reaction mixture was diluted in 17,5 mL CHCl3, and 17,5
mL H2O was added. The chloroform layer was washed a second time with H2O. The chloroform layer
was concentrated in vacuo, and subsequently dried further using a flow of N2(g). Yield = 38 mg, 97%. 1H NMR (400 MHz, CDCl3): δ = 8.11 (d, J = 9.1 Hz, 1H), 7.48 (d, J = 2.5 Hz, 1H), 7.30 (dd, 1H),
4.81 (d, J = 2.4 Hz, 2H), 2.59 (t, J = 2.4 Hz, 1H). 13
C NMR (100 MHz, CDCl3): δ = 158.17, 147.37,
137.13, 134.00, 125.97, 118.82, 113.07, 104.66, 77.43, 77.20, 56.45. MALDI (CHCA/DCTB), 0.5
mg/mL in CHCl3. Calculated: 214.2 Da, observed: 215.2 Da [M+H].
N1-(1-(4-(((2-cyanobenzo[d]thiazol-6-yl)oxy)methyl)-1H-1,2,3-triazol-1-yl)-3,6,9,12-
tetraoxatetracosan-24-yl)-N3,N5-bis(1-hydroxy-3,6,9,12-tetraoxatetracosan-24-yl)benzene-1,3,5-
tricarboxamide (6)
A small glass vial was charged with N1-(1-azido-3,6,9,12-tetraoxatetracosan-24-yl)-N3,N5-bis(1-
hydroxy-3,6,9,12-tetraoxatetracosan-24-yl)benzene-1,3,5-tricarboxamide (92 mg, 0,070 mmol), 6-
(prop-2-yn-1-yloxy)benzo[d]thiazole-2-carbonitrile (30 mg, 0,140 mmol) and 2,25 ml DMF. 321,5 µl
of a 10 mM BimPy2 stock solution in DMF was mixed with 4.0 mg copper sulfate in 321,5 µl H2O by
stirring for 15 minutes (to let BimPy2 coordinate copper). A (fresh) 200 mM stock solution of sodium
ascorbate was prepared by dissolving 15.8 mg in 400 µl H2O. 312.5 µl of this stock was added to the
stirred solution of BimPy2 and CuSO4. The resulting mixture was added dropwise to the azide and
alkyne in solution, upon which the solution turned greenish-brown. The vial was sealed with parafilm
to prevent refreshment of the air and stirred overnight at RT. The reaction mixture was concentrated
to half of its volume using a flow of N2(g) and diluted in 40 mL DCM. Extraction was performed by
addition of 40 mL H2O (twice) and the organic layer was collected. DCM was evaporated to 0.5 mL
and 3g Silica gel was used to perform column chromatography with chloroform and 2% methanol as
the eluent. Fractions were concentrated in vacuo. Yield = 97 mg, 91%. 1H NMR (400 MHz, CDCl3): δ
= 8.36 (s, 3H, Ar), 8.07 (d, J = 9.1 Hz, 1H, OCCHCS), 7.92 (s, 1H, NCHCCH2), 7.57 (d, J = 2.5 Hz,
1H, OCCHCHC), 7.29 (dd, J = 9.1, 2.5 Hz, 1H, OCCHCHC), 6.72 – 6.62 (b, 3H, CH2NHC=O), 5.31
(s, 2H, NCHCCH2O), 4.60 – 4.50 (t, 2H, OCH2CH2N), 3.86 (t, 2H, OCH2CH2N), 3.77 – 3.34 (m,
60H, O-(CH2)2-O, O-(CH2)2-OH, CH2CH2NHC=O, CH2CH2CH2O), 1.57 (m, 12H, CH2CH2CH2O,
CH2CH2NHC=O), 1.24 (m, 48H, aliphatic). FT-IR (ATR) ν (cm-1): 3334, 3073, 2924, 2854, 2228,
1651, 1600, 1538, 1480, 1466, 1350, 1286, 1259, 1235, 1119, 1000, 921, 829, 709, 613, 583. LCMS:
calculated: 1528 Da, observed after deconvolution: 1528.1 Da.
N1-(1-amino-3,6,9,12-tetraoxatetracosan-24-yl)-N3,N5-bis(1-hydroxy-3,6,9,12-
tetraoxatetracosan-24-yl)benzene-1,3,5-tricarboxamide (7)
N1-(1-azido-3,6,9,12-tetraoxatetracosan-24-yl)-N3,N5-bis(1-hydroxy-3,6,9,12-tetraoxatetracosan-24-
yl)benzene-1,3,5-tricarboxamide (165,5 mg, 0,126 mmol) in a 10 mL round bottom flask was
dissolved using 3 mL THF/H2O (1:1). Triphenylphosphine (43,0 mg, 0,164 mmol) was also dissolved
in 3 mL THF/H2O (1:1) and both solutions were combined in a dropwise fashion while stirring. The
reaction mixture was heated to 50 °C and stirred under an Argon atmosphere overnight. The solvent
was removed in vacuo and the obtained oil was purified using column chromatography with an
110
isocratic flow (CHCl3/methanol 9/1 (v/v)) to elute byproducts, that was afterwards changed to include
isopropylamine and elute the product (CHCl3/methanol/isopropylamine 90/5/5 (v/v/v)). After
concentrating the collected fractions in vacuo, the product was obtained as a slightly yellow oil that
solified upon additional drying with a flow of N2(g) to remove any residual isopropylamine. Yield =
143 mg, 88%. 1H NMR (400 MHz, CDCl3): δ = 8.38 (s, 3H, Ar), 6.81 – 6.75 (m, 3H, CH2NHC=O),
3.77 – 3.52 (m, 46H, O-(CH2)2-O, O-(CH2)2-OH, OCH2CH2NH2), 3.51 – 3.38 (m, 12H,
CH2CH2NHC=O, CH2CH2CH2O), 2.85 (t, J = 5.2 Hz, 2H, NH2-CH2), 1.63 – 1.52 (m, 12H,
CH2CH2CH2O, CH2CH2NHC=O), 1.42 – 1.20 (m, 48H, aliphatic). 13
C NMR (100 MHz, CDCl3): δ =
165.75, 135.19, 128.10, 77.33, 77.21, 77.01, 76.69, 73.17, 72.51, 71.53, 70.61, 70.59, 70.56, 70.32,
70.28, 70.04, 70.02, 61.69, 41.69, 40.34, 29.56, 29.54, 29.51, 29.49, 29.44, 29.41, 29.38, 29.21, 26.92,
26.02. FT-IR (ATR) ν (cm-1): 3316, 3073, 2923, 2854, 1651, 1596, 1538, 1465, 1350, 1290, 1110,
943, 885, 773, 708, 571. LCMS: calculated: 1287.8 Da, observed after deconvolution: 1287.9 Da.
N1-(1-(2,5-dioxo-2,5-dihydro-1H-pyrrol-1-yl)-4-oxo-8,11,14,17-tetraoxa-5-azanonacosan-
29-yl)-N3,N5-bis(1-hydroxy-3,6,9,12-tetraoxatetracosan-24-yl)benzene-1,3,5-tricarboxamide (8 )
2,5-dioxopyrrolidin-1-yl 4-(2,5-dioxo-2,5-dihydro-1H-pyrrol-1-yl)butanoate (44,0 mg, 0,157 mmol)
was dissolved in 590 uL CDCl3, and N1-(1-amino-3,6,9,12-tetraoxatetracosan-24-yl)-N3,N5-bis(1-
hydroxy-3,6,9,12-tetraoxatetracosan-24-yl)benzene-1,3,5-tricarboxamide (70 mg, 0,054 mmol) was
dissolved in 2 mL CDCl3. The latter was added dropwise and the reaction mixture was stirred at RT
overnight. The reaction mixture was concentrated in vacuo and purified using reversed-phase column
chromatography with a Biotage SNAP Cartridge (KP-C18-HS, 30g). Byproduct eluted before 70%
ACN, the product came off around 80% ACN. Fractions were concentrated in vacuo and further dried
using a flow of N2(g), the product was obtained as a colourless oil. Yield = 67.5 mg, 85%. 1H NMR
(400 MHz, CDCl3): δ = 8.39 (s, 3H, Ar), 6.77 (t, J = 5.8 Hz, 3H, CH2NHC=O), 6.71 (s, 2H,
COCHCHCO), 6.35 (s, 1H, CH2CONHCH2), 3.80 – 3.35 (m, 62H, O-(CH2)2-O, O-(CH2)2-OH,
OCH2CH2NH, CH2CH2NHC=O, COCH2CH2CH2N, CH2CH2CH2O), 2.18 (t, J = 7.4 Hz, 2H,
COCH2CH2CH2N), 1.94 (m, 2H, COCH2CH2CH2N), 1.72 – 1.48 (m, 12H, CH2CH2CH2O,
CH2CH2NHC=O), 1.28 (m, 48H, aliphatic). 13
C NMR (100 MHz, CDCl3): δ = 165.79 , 135.23 ,
134.08 , 128.08 , 77.20 , 72.54 , 71.52 , 70.58 , 70.54 , 70.52 , 70.28 , 70.18 , 69.99 , 69.83 , 61.68 ,
40.35 , 39.24 , 37.25 , 33.50 , 29.54 , 29.52 , 29.50 , 29.48 , 29.43 , 29.40 , 29.37 , 29.21 , 26.92 ,
26.01 , 24.68. FT-IR (ATR) ν (cm-1): 3332, 3075, 2924, 2854, 1709, 1650, 1537, 1454, 1408, 1350,
1288, 1111, 944, 831, 696. MALDI (CHCA/DCTB), 1 mg/mL in CHCl3 sample. Calculated: 1452.9
Da, observed: 1475 Da [M+Na].
(tert-butyl (R)-(1-(3,5-bis((1-hydroxy-3,6,9,12-tetraoxatetracosan-24-yl)carbamoyl)phenyl)-
33,33-dimethyl-1,28-dioxo-15,18,21,24-tetraoxa-31,32-dithia-2,27-diazatetratriacontan-29-
yl)carbamate) (9)
A round-bottom flask (25 mL) was charged with 7 (135.5 mg, 0.105 mmol) dissolved in CH3OH (3
mL). In a separate vial, R)-2-((tert-butoxycarbonyl)amino)-3-(tert-butyldisulfanyl)propanoic acid
(42.5 mg, 0.137 mmol) was dissolved in CH3OH (3 mL) and added dropwise to the round-bottom
flask. DMTMM (92.8 mg, 0.389 mmol) was dissolved in CH3OH (2 mL) and added last to the round-
bottom flask in a dropwise fashion. The reaction was stirred under argon at RT overnight. The
reaction mixture was concentrated in vacuo and redissolved in 50% ACN/50% H2O for liquid loading
and subsequent purification using reversed-phase chromatography (KPC18-HS –column, 30g). Side
products eluted up to 80% ACN. The gradient was increased to 100% ACN to elute the product as a
single peak. The collected fractions were concentrated in vacuo. Yield = 92 mg, 55 %. 1H NMR (400
MHz, CDCl3): δ = 8.37 (s, 3H), 6.81 (b, 3H), 5.52 (b, 1H), 4.38 (d, 1H), 3.72-3.41 (m, 52H), 3.09 (d,
2H), 1.63-1.60 (m, 12H), 1.45 (s, 9H), 1.33 (s, 9H), 1.26 (m, 48H, aliphatic). 13
C NMR (100 MHz,
111
CDCl3): δ = 170.36, 165.86, 155.30, 135.17, 128.20, 106.24, 80.09, 77.28, 76.77, 72.48, 69.98, 61.65,
54.26, 48.17, 42.85, 40.35, 39.45, 29.82, 29.51, 29.44, 29.38, 28.30, 26.95, 26.01. FT-IR (ATR) ν
(cm-1): 3319, 2923, 2854, 1714, 1649, 1535, 1457, 1364, 1286, 1108, 940, 872, 707, 571. LCMS:
calculated: 1578 Da, observed after deconvolution: 1578.3 Da.
((R)-N1-(6-amino-2,2-dimethyl-7-oxo-11,14,17,20-tetraoxa-3,4-dithia-8-azadotriacontan-32-
yl)-N3,N5-bis(1-hydroxy-3,6,9,12-tetraoxatetracosan-24-yl)benzene-1,3,5-tricarboxamide) (10)
A round-bottom flask (100 mL) was charged with 9 (92.0 mg, 0.058 mmol) dissolved in CHCl3 (4
mL). TFA (2 mL) was added dropwise under stirring. The reaction mixture was concentrated in
vacuo. The products were redissolved in CHCl3 to remove residual TFA by co-evaporation. This step
was repeated three times. Yield = 75 mg, 82%. 1H NMR (400 MHz, CDCl3): δ = 8.53 (b, 1H,
CH2NHCO), 8.43 (s, 3H, Ar), 7.55 (m, 3H, CH2NHC=O), 4.26 (t, 1H, COCH-NH2,CH2), 3.72-3.37
(m, 60H, O-(CH2)2-O, O-(CH2)2-OH, OCH2CH2NH, CH2CH2NHC=O, CH2CH2CH2O), 3.16 (d, 2H,
CH-NH2, CH2-S), 1.59-1.53 (m, 12H, CH2CH2CH2O, CH2CH2NHC=O), 1.30 (m, 57H, S-
CH3,CH3,CH3, aliphatic). 13
C NMR (100 MHz, CDCl3): δ = 166.14, 142.16, 135.17, 128.43, 107.34,
77.26, 76.75, 72.37, 71.64, 71.58, 70.66, 70.41, 70.31, 70.24, 70.21, 70.03, 69.87, 69.77, 69.44, 61.40,
48.48, 40.35, 29.78, 29.42, 29.37, 29.31, 29.29, 29.16, 29.10, 26.85, 25.93, 25.81. FT-IR (ATR) ν
(cm-1): 3008, 2918, 2850, 1739, 1659, 1540, 1463, 1365, 1216, 1132, 756, 667, 537, 458. LCMS:
calculated: 1479.1 Da, observed after deconvolution: 1479 Da.
Protein expression and purification.
CFP and YFP with an N-terminal cysteine
The pTWIN vectors encoding fusion proteins to generate eCFP and eYFP with an N-terminal cysteine
were genetically engineered and transformed into E. coli BL21(DE3) by Ralph Bosmans using a
previously described method.52
The same expression conditions were used for both proteins and
stirring was performed at 250 rpm. A preculture was performed in 20 mL LB medium with 0.1
mg/mL ampicillin and was incubated at 37 °C overnight. The cultures grew overnight to an OD600 nm
around 2.4. This preculture was transferred to 2 L LB medium (0.1 mg/mL ampicillin). This culture
was incubated at 37 °C for 2.5-3 hours until the OD600 reached 0.5-0.7. 0.5 mM IPTG was added to
the medium to induce protein synthesis and incubation was continued overnight at 15°C. The next
morning the culture was sedimented by centrifugation for 20 minutes at 6000 rcf and a temperature of
4 °C. After all the culture was centrifuged, 2.5 mL/gr BugBuster™ and 2.5 µL/gr Benzonase®
Nuclease was added to the cell pellet. The cells were lysed for one hour. The mixture was
subsequently centrifuged for 45 minutes at 40.000 rcf and a temperature of 4 °C. The supernatant was
directly used for purification.
Two columns with 10 mL chitin beads were prepared and a buffer containing 20 mM NaH2PO4, 500
mM NaCl, 1 mM EDTA with pH to 8.5 was used to equilibrate the column. The column was rinsed at
least three times before loading the proteins onto the column. After loading the proteins, washing was
performed with the same buffer used to equilibrate the columns (5 column volumes). Elution of the
target fusion protein was induced by washing with the buffer adjusted to pH 7. eYFP and eCFP were
observed to elute before this step, hence Ni2+
-NTA chromatography was performed.
Unless stated otherwise, the buffers used for Ni2+
-NTA chromatography contained 100 mM sodium
phosphate and 10 mM Tris-Cl, at pH 8. Chromatography was performed with two His60 Ni
Superflow Cartridges (Clontech, 1 mL bed volume each) set in series and connected to a pump with a
set flow rate of 1 ml/min. The column was equilibrated with 10 mM imidazole added to the buffer for
10 minutes. Proteins were loaded and washing steps were performed with 10 mM, 20 mM and 33 mM
imidazole for 20 minutes each. Elution of the target proteins was performed with 100 mM imidazole
112
for 20 minutes. The columns were regenerated with 500 mM imidazole (pH = 5) for 10 minutes and
500 mM imidazole (pH = 3) for 5 minutes. Spin filtration to remove imidazole was performed with 10
kDa Amicon®Ultra-4 Centrifugal filters at 3800 x g for 20 minutes. This step was repeated three
times to wash with dH2O. From every wash and elution step a 25 µl was taken to analyze protein’s
molecular weight and purity on an SDS-PAGE gel. 48 mg CFP was obtained and 27 mg YFP was
obtained, per litre of culture.
CFP and YFP with a C-terminal thioester
The pTXB1 vectors encoding fusion proteins to generate eCFP and eYFP, respectively, with a C-
terminal thioester were genetically engineered and transformed into E. coli BL21(DE3) by Sanne
Reulen.34
The same expression conditions were used for both proteins. A pipette-tip with a small
amount of bacteria from the glycerol stock was added to 25 mL LB medium containing 0.1 mg/mL
ampicillin. The small culture was grown at 37 °C while stirring at 250 rpm overnight. The culture was
transferred to 2 L LB medium containing 0.1 mg/mL ampicillin and grown at 37 °C and 150 rpm,
until an optical density at 600 nm (OD600) of 0.65 was measured. Protein expression was induced by
the addition of 0.5 mM IPTG and the culture was incubated at 15 °C at 140 rpm overnight. The cells
were harvested via centrifugation at 8000 rpm for 10 min at 4 °C on a ThermoScientific Sorvall
Evolution RC centrifuge (rotor F10 6x500Y or F126x 500LEX), resulting in 3.82 g and 5.73 g cell
pellet per litre culture for eCFP and eYFP, respectively. A gram cell pellet was dispersed in 5 mL
Bugbuster and 5 μL benzonase (stock 250 ug/μL) under shaking at room temperature for 50 minutes.
After centrifugation of the cell lysate for 40 min at 4 °C at 18000 rpm using a ThermoScientific
Sorvall Evolution RC (SA-300 rotor), the supernatant containing the proteins was ready for
purification.
Per 5 gram cell pellet, a 9 mL chitin column (New England Biolabs) was poored and equilibrated with
10 column volumes (cv) of washing buffer (25 mM NaH2PO4, 0.5 mM EDTA, 0.5 M NaCl, pH 8).
The supernatant was directly loaded on the column. Its flowthrough was run through the column once
more, before the column was washed with 10 cv washing buffer. Cleavage buffer (25 mM NaH2PO4,
0.5 mM EDTA, 0.5 M NaCl, 500 mM MESNA, pH 6.0) was flushed through the column (3 cv). The
flow was stopped and the column was incubated at room termperature overnight, 4-5 mL cleavage
buffer on top. Elution was performed using 3 cvs of cleavage buffer. 15 mL 10 kDa MWCO Amicon
filters were cleaned using MQ, after which the protein was rebuffered to storage buffer (25 mM
NaH2PO4, 0.1 mM EDTA, 50 mM NaCl, 20 mM MESNA, pH 7) and concentrated to 10-40 mg/mL
on an Eppendorf Centrifuge 5424. Aliquots were stored at -80 °C. 8 mg CFP-MESNA was obtained
and 5 mg YFP-MESNA was obtained, from 1 L cultures each.
Bioconjugation reactions.
Cyanobenzothiazole condensation
Reactions between mono-CBT BTA 6 and CFP with an N-terminal cysteine were performed in
phosphate buffered saline (PBS) at pH 7.4 (readjusted after adding TCEP), and at a protein
concentration of 1 mg/mL. Typically 10 – 20 equivalents of 6 were added to a glass vial from a
concentrated stock solution in chloroform, and the chloroform was allowed to evaporate. The protein
in PBS at pH 7.4 containing 1 mM TCEP was added to the glass vial. The vial was stirred at room
temperature overnight. TCEP was always freshly dissolved before use, and in case cosolvents were
used these were added last. Reactions were performed on a milligram scale.
Michael addition
Reactions between mono-maleimide BTA 8 and CFP with an N-terminal cysteine were performed in
PBS containing 10% DMSO and 10 mM TCEP (freshly added) at pH 6.5, and at a protein
113
concentration of 1 mg/mL. A glass vial on ice was first charged with 10 equivalents of 8, and CFP
dissolved in buffer was subsequently added dropwise while stirring. DMSO was added last since 8
was observed to not fully dissolve in buffer without DMSO. The reaction mixture was allowed to
warm to room temperature overnight. Reactions were performed on a milligram scale.
Native chemical ligation
Reactions between deprotected mono-Cys BTA 10 and CFP- and YFP-MESNA were performed in
PBS at pH 7.0, and at a protein concentration of 0.5 mg/mL. The proteins were first dissolved in a
freshly prepared buffer containing 5 mM TCEP and 100 mM MPAA for half an hour. Meanwhile, a
concentrated stock of 10 in chloroform was used to charge a glass vial with 20 equivalents of 10, and
the chloroform was allowed to evaporate. The protein in buffer was subsequently added in a dropwise
fashion, and the reaction was stirred at room temperature overnight. Reactions were performed on a
milligram scale.
6.7 References
(1) Geng, Y.; Dalhaimer, P.; Cai, S.; Tsai, R.; Tewari, M.; Minko, T.; Discher, D. E. Nature nanotechnology 2007, 2, 249.
(2) Moyer, T. J.; Finbloom, J. A.; Chen, F.; Toft, D. J.; Cryns, V. L.; Stupp, S. I. Journal of the American Chemical Society 2014, 136, 14746.
(3) Sharifi, F.; Sooriyarachchi, A. C.; Altural, H.; Montazami, R.; Rylander, M. N.; Hashemi, N. ACS Biomaterials Science & Engineering 2016, 2, 1411.
(4) Lin, R.; Cheetham, A. G.; Zhang, P.; Cui, H. Chemical communications 2013, 49, 4968. (5) Kim, I.; Han, E. H.; Ryu, J.; Min, J.-Y.; Ahn, H.; Lee, E. Biomacromolecules 2016, 17, 3234. (6) Moyer, T. J.; Kassam, H. A.; Bahnson, E. S. M.; Morgan, C. E.; Tantakitti, F.; Chew, T. L.; Kibbe,
M. R.; Stupp, S. I. Small 2015, 11, 2750. (7) Baker, B. M.; Trappmann, B.; Wang, W. Y.; Sakar, M. S.; Kim, I. L.; Shenoy, V. B.; Burdick, J. A.;
Chen, C. S. Nature Materials 2015, 14, 1262. (8) Silva, G. A.; Czeisler, C.; Niece, K. L.; Beniash, E.; Harrington, D. A.; Kessler, J. A.; Stupp, S. I.
Science 2004, 303, 1352. (9) Albertazzi, L.; van der Zwaag, D.; Leenders, C. M. A.; Fitzner, R.; van der Hofstad, R. W.;
Meijer, E. W. Science 2014, 344, 491. (10) Baker, M. B.; Gosens, R. P. J.; Albertazzi, L.; Matsumoto, N. M.; Palmans, A. R. A.; Meijer, E.
W. ChemBioChem 2016, 17, 207. (11) Bakker, M. H.; Lee, C. C.; Meijer, E. W.; Dankers, P. Y. W.; Albertazzi, L. ACS Nano 2016, 10,
1845. (12) Tolstyka, Z. P.; Maynard, H. D. In Polymer Science: A Comprehensive Reference; Möller, M.,
Ed.; Elsevier: Amsterdam, 2012, p 317. (13) Alconcel, S. N. S.; Baas, A. S.; Maynard, H. D. Polymer Chemistry 2011, 2, 1442. (14) Keefe, A. J.; Jiang, S. Nature Chemistry 2012, 4, 59. (15) Fuhrmann, G.; Grotzky, A.; Lukić, R.; Matoori, S.; Luciani, P.; Yu, H.; Zhang, B.; Walde, P.;
Schlüter, A. D.; Gauthier, M. A.; Leroux, J.-C. Nature Chemistry 2013, 5, 582. (16) Nguyen, T. H.; Kim, S.-H.; Decker, C. G.; Wong, D. Y.; Loo, J. A.; Maynard, H. D. Nature
Chemistry 2013, 5, 221. (17) Lee, S. S.; Fyrner, T.; Chen, F.; Álvarez, Z.; Sleep, E.; Chun, D. S.; Weiner, J. A.; Cook, R. W.;
Freshman, R. D.; Schallmo, M. S.; Katchko, K. M.; Schneider, A. D.; Smith, J. T.; Yun, C.; Singh, G.; Hashmi, S. Z.; McClendon, M. T.; Yu, Z.; Stock, S. R.; Hsu, W. K.; Hsu, E. L.; Stupp, S. I. Nature Nanotechnology 2017, 12, 821.
(18) Shah, R. N.; Shah, N. A.; Del Rosario Lim, M. M.; Hsieh, C.; Nuber, G.; Stupp, S. I. Proceedings of the National Academy of Sciences 2010, 107, 3293.
114
(19) Stendahl, J. C.; Wang, L.-J.; Kaufman, D. B.; Stupp, S. I. Transplantation 2008, 86, 478. (20) Baldwin, A. J.; Bader, R.; Christodoulou, J.; MacPhee, C. E.; Dobson, C. M.; Barker, P. D.
Journal of the American Chemical Society 2006, 128, 2162. (21) DiMaio, J. T. M.; Raymond, D. M.; Nilsson, B. L. Organic & Biomolecular Chemistry 2017, 15,
5279. (22) Leenders, C. M. A.; Jansen, G.; Frissen, M. M. M.; Lafleur, R. P. M.; Voets, I. K.; Palmans, A. R.
A.; Meijer, E. W. Chemistry – A European Journal 2016, 22, 4608. (23) Reulen, S. W. A.; Merkx, M. Bioconjugate chemistry 2010, 21, 860. (24) Khan, S.; Sur, S.; Dankers, P. Y. W.; da Silva, R. M. P.; Boekhoven, J.; Poor, T. A.; Stupp, S. I.
Bioconjugate chemistry 2014, 25, 707. (25) Petkau-Milroy, K.; Uhlenheuer, D. A.; Spiering, A. J. H.; Vekemans, J. A. J. M.; Brunsveld, L.
Chemical Science 2013. (26) Hudalla, G. A.; Sun, T.; Gasiorowski, J. Z.; Han, H.; Tian, Y. F.; Chong, A. S.; Collier, J. H. Nature
Materials 2014, 13, 829. (27) Dawson, P.; Muir, T.; Clark-Lewis, I.; Kent, S. Science 1994, 266, 776. (28) Keppler, A.; Gendreizig, S.; Gronemeyer, T.; Pick, H.; Vogel, H.; Johnsson, K. Nature
Biotechnology 2003, 21, 86. (29) Baxa, U.; Speransky, V.; Steven, A. C.; Wickner, R. B. Proceedings of the National Academy of
Sciences 2002, 99, 5253. (30) Sletten, E. M.; Bertozzi, C. R. Angewandte Chemie International Edition 2009, 48, 6974. (31) Patterson, D. M.; Nazarova, L. A.; Prescher, J. A. ACS Chemical Biology 2014, 9, 592. (32) Ren, H.; Xiao, F.; Zhan, K.; Kim, Y. P.; Xie, H.; Xia, Z.; Rao, J. Angewandte Chemie 2009, 48,
9658. (33) van Baal, I.; Malda, H.; Synowsky, S. A.; van Dongen, J. L. J.; Hackeng, T. M.; Merkx, M.;
Meijer, E. W. Angewandte Chemie International Edition 2005, 44, 5052. (34) Reulen, S. W. A.; Brusselaars, W. W. T.; Langereis, S.; Mulder, W. J. M.; Breurken, M.; Merkx,
M. Bioconjugate chemistry 2007, 18, 590. (35) Liang, G.; Ren, H.; Rao, J. Nature Chemistry 2010, 2, 54. (36) Muir, T. W.; Sondhi, D.; Cole, P. A. Proceedings of the National Academy of Sciences 1998, 95,
6705. (37) Evans, T. C., Jr.; Benner, J.; Xu, M. Q. The Journal of biological chemistry 1999, 274, 3923. (38) Yang, F.; Moss, L. G.; Phillips, G. N. Nature Biotechnology 1996, 14, 1246. (39) Dayal, B.; Salen, G.; Toome, B.; Tint, G. S.; Shefer, S.; Padia, J. Steroids 1990, 55, 233. (40) Kunishima, M.; Kawachi, C.; Iwasaki, F.; Terao, K.; Tani, S. Tetrahedron Letters 1999, 40,
5327. (41) Presolski, S. I.; Hong, V.; Cho, S.-H.; Finn, M. G. Journal of the American Chemical Society
2010, 132, 14570. (42) Kunishima, M.; Kawachi, C.; Hioki, K.; Terao, K.; Tani, S. Tetrahedron 2001, 57, 1551. (43) Xu, M. Q.; Perler, F. B. The EMBO journal 1996, 15, 5146. (44) Gentle, I. E.; De Souza, D. P.; Baca, M. Bioconjugate chemistry 2004, 15, 658. (45) Rosier, B. J. H. M.; Cremers, G. A. O.; Engelen, W.; Merkx, M.; Brunsveld, L.; de Greef, T. F. A.
Chemical communications 2017, 53, 7393. (46) Shafer, D. E.; Inman, J. K.; Lees, A. Analytical Biochemistry 2000, 282, 161. (47) Maret, B.; Regnier, T.; Rossi, J.-C.; Garrelly, L.; Vial, L.; Pascal, R. RSC Advances 2014, 4, 7725. (48) Villain, M.; Vizzavona, J.; Rose, K. Chemistry & biology 2001, 8, 673. (49) Mahdavi, A.; Hamblin, G. D.; Jindal, G. A.; Bagert, J. D.; Dong, C.; Sweredoski, M. J.; Hess, S.;
Schuman, E. M.; Tirrell, D. A. Journal of the American Chemical Society 2016, 138, 4278. (50) Kim, C. H.; Axup, J. Y.; Schultz, P. G. Current Opinion in Chemical Biology 2013, 17, 412. (51) Deiters, A.; Schultz, P. G. Bioorganic & Medicinal Chemistry Letters 2005, 15, 1521. (52) Bosmans, R. P. G.; Hendriksen, W. E.; Verheijden, M.; Eelkema, R.; Jonkheijm, P.; van Esch, J.
H.; Brunsveld, L. Chemistry – A European Journal 2015, 21, 18466.
115
Summary
Kinetics, structure and function of a supramolecular polymer in water
One-dimensional supramolecular polymers in water are dynamic assemblies due to the non-
covalent interactions between the monomers. In living cells, one-dimensional supramolecular
polymers are involved in processes like cellular movement and cell division. These complex
functions are possible because of the controlled assembly and disassembly of the polymers at
the nanometer length scale. Natural supramolecular polymers therefore provide a source of
inspiration to scientists that aim to prepare functional synthetic supramolecular polymers.
This requires a good understanding of the principles of self-assembly, and for that reason
many different monomers have been synthesized that can self-assemble into polymers.
However, detailed studies on the assembly and disassembly of supramolecular polymers in
water are still limited due to the complexity of this solvent. To advance the non-covalent
synthesis with supramolecular monomers in water, time-resolved measurements are required.
In addition, time-resolved measurements can increase our understanding on the dynamics of
the polymers once they are formed. Therefore, the first aim of this thesis is to characterize the
kinetics of a supramolecular polymer in water. Three chapters are devoted to characterize the
assembly, disassembly and dynamics of polymers based on the benzene-1,3,5-tricarboxamide
motif. The dynamics of the polymers depend on the strength of the interactions between the
monomers, and these interactions are intimately connected to the arrangement of the
monomers that constitute the polymers. Therefore, the second aim is to characterize the
structure of a benzene-1,3,5-tricarboxamide based polymer. Since supramolecular polymers
are promising candidates as a component of biomaterials, the third aim of this thesis is to
synthesize a benzene-1,3,5-tricarboxamide – protein conjugate to introduce a functionality.
In chapter 2 the technique of hydrogen/deuterium exchange (HDX) mass spectrometry
(MS) is applied to study the dynamics of synthetic supramolecular polymers in water. The
method is validated for polymers that consist of monomers with the benzene-1,3,5-
tricarboxamide motif as the central part of the molecule. Alkyl chains with eleven, twelve, or
thirteen carbon atoms are attached to this motif, and tetra(ethylene glycol) at the periphery
results in the water solubility of the polymers. The polymers are assembled in H2O using a
carefully controlled preparation protocol, and subsequently diluted into D2O. The
hydrogen/deuterium exchange of the amides within the hydrophobic pocket of the polymers
is followed over time, and these hydrogen atoms are observed to exchange all at once for
deuterium. The time-dependent amide HDX of the sample in D2O reveals that multiple
timescales are involved in the conversion of the monomers to their fully deuterated species,
varying from minutes to hours to days. It is proposed that some monomers are weakly
associated with surrounding monomers, whereas others interact more strongly with one
another and therefore their amide HDX is slower. In addition, it is shown that both the
temperature and the length of the alkyl chains can be used to control the dynamics of the
supramolecular polymers. Upon increasing the temperature, or gradually decreasing the
length of the alkyl chains from thirteen to twelve and eleven carbon atoms, the amide HDX
becomes faster. For a monomer with ten carbon atoms in the alkyl chains, that was previously
116
shown not to form polymers, all molecules are fully deuterated within minutes after the
dilution from H2O into D2O. Hence, HDX-MS is shown to be a very powerful technique to
study the dynamics of supramolecular aggregates in water.
In the next chapter the assembly and disassembly of benzene-1,3,5-tricarboxamide
monomers with alkyl chains containing twelve carbon atoms is studied. For this purpose a
cosolvent is used, because cosolvents are commonly employed to perform non-covalent
synthesis in water. First, the morphology of the equilibrated aggregates is studied in the
presence of acetonitrile, which is a good solvent for the monomers. Using a combination of
UV-spectroscopy, static and dynamic light scattering, cryogenic transmission electron
microscopy (CryoTEM) and 1H-NMR spectroscopy, it is shown that the supramolecular
polymers abruptly disappear above a critical solvent fraction of 15% acetonitrile in water. No
structural differences are observed for the polymers when increasing the percentage of
acetonitrile up to 15%. Subsequently, the polymers are diluted into a solution of equal solvent
composition, but containing D2O in stead of H2O. HDX-MS experiments reveal that upon
increasing the amount of good solvent, the polymers gradually become more dynamic. In the
presence of 20% acetonitrile, when the polymers are not present, all monomers are fully
deuterated within minutes after the dilution step. Molecular dynamics simulations show that
the presence of acetonitrile destabilizes the interactions between the monomers inside the
supramolecular polymers. The polymerization and depolymerization kinetics as a function of
time, and in the presence of various fractions of good solvent, is studied using stopped-flow
UV-absorption. The assembly of the monomers is followed after mixing concentrated stock
solutions in acetonitrile with water, and the results indicate that the polymers self-assemble
within minutes independent of the amount of acetonitrile present. The mixing of equilibrated
polymers in pure water with acetonitrile induces small changes in the molecular packing of
the supramolecular polymers; depolymerization of the polymers is not observed. Re-
equilibration of the polymers occurs during multiple hours, with the longest equilibration
time occurring at the critical solvent fraction of 15% acetonitrile in water.
The copolymerization of the benzene-1,3,5-tricarboxamide monomer with alkyl chains
containing ten carbon atoms, with polymers formed from monomers containing eleven,
twelve and thirteen carbon atoms, is studied in chapter 4. Aggregates of a single monomer are
first assembled in H2O using the carefully controlled preparation protocol introduced in
chapter 2. Subsequently, these aggregates are mixed to prepare dual component systems that
contain the monomer with alkyl chains containing ten carbon atoms. The dual component
solutions are incubated for 24 hours at room temperature. Turbidity measurements are used to
compare the cloud point temperatures of the dual component solutions to the solutions
containing only one type of monomer. Since the cloud point temperatures of the dual
component systems are in between the cloud point temperatures of the constituent
components, it is concluded that mixing and waiting is a viable method to prepare
supramolecular copolymers. Subsequently, an HDX-MS experiment is developed to study the
kinetics of the copolymerization. The results reveal that the smaller the difference in the alkyl
chain length between the monomers, the faster is the copolymerization. The most pronounced
difference in the rate at which the monomers with ten carbon atoms in the alkyl chains enter
the polymers, is observed when increasing the length of the alkyl chain of the other monomer
from twelve to thirteen carbon atoms. The same trend is observed when the copolymerization
117
is followed using stopped-flow UV-absorption.
The three-dimensional structure of the supramolecular polymers formed from benzene-
1,3,5-tricarboxamide monomers with twelve carbon atoms in the alkyl chains is studied in
detail with cryogenic electron tomography. Graphene oxide sheets are used to suspend the
samples to increase the contrast of the images in the tomographic tilt series. In the
reconstructed volumes three types of supramolecular aggregates are observed. In addition to
the supramolecular polymers, the benzene-1,3,5-tricarboxamide monomers are observed to
self-assemble into a monolayer at the air-water interface. Moreover, small aggregates with a
diameter of less than three nanometers are observed. A detailed analysis of the
supramolecular polymers indicates the existence of helical polymers that are composed of
two separate stacks of monomers. These helices have a regular pitch of 23 nanometers. The
results suggest that interactions between the different stacks of the monomers could provide
additional stabilization to the supramolecular polymers, and thereby influence the rate of
HDX of this polymer as observed in chapters 2 and 3.
In the last chapter, three different reactions are explored to prepare a benzene-1,3,5-
tricarboxamide – protein conjugate. The bioconjugation reactions that are tested are the
cyanobenzothiazole condensation, Michael addition with a maleimide, and native chemical
ligation. Fluorescent proteins are functionalized with an N-terminal cysteine or a C-terminal
thioester using expressed protein ligation. Water soluble benzene-1,3,5-tricarboxamide
derivatives containing a single cyanobenzothiazole, maleimide or cysteine reactive group are
synthesized. The monomers with a cyanobenzothiazole group do not react with the proteins
and control reactions indicate that this is due to hydrophobic shielding of the
cyanobenzothiazole group. The benzene-1,3,5-tricarboxamide with a maleimide group reacts
with the fluorescent proteins containing an N-terminal cysteine. However, the proteins were
only partially reactive which is probably due to the presence of not reactive thiazolidine
adducts. Native chemical ligation between proteins with a C-terminal thioester and a
benzene-1,3,5-tricarboxamide displaying a cysteine results in a high conversion to the target
protein conjugate. The thiol of the cysteine that remains after this reaction is available to form
disulfide bonds with other unreacted monomers, and approaches to circumvent this effect are
presented.

118
119
Curriculum vitae
René Lafleur was born on November 29th
, 1988 in Sittard, The
Netherlands. After finishing his secondary education at the Trevianum
Scholengroep in Sittard, he started studying Biomedical Engineering at
the Eindhoven University of Technology (The Netherlands), which he
completed cum laude in 2010. During his Master in Biomedical
Chemistry he performed an internship at the California Institute of
Technology (Pasadena, USA) in the laboratory of prof.dr. D.A. Tirrell,
studying artificial extracellular matrix proteins for biomaterials. His graduation project was
performed in the research group of prof.dr. E.W. Meijer, working on the dynamic clustering
of enzymes along a supramolecular scaffold. After graduating with Honorable Mention in
2013, René started his PhD research within the Institute of Complex Molecular Systems at
the Eindhoven University of Technology, under supervision of prof.dr. E.W. Meijer and
prof.dr. M. Merkx. The most important results of this research are presented in this thesis.

120
121
Dankwoord / Acknowledgements
De afgelopen jaren als promovendus zijn voorbij gevlogen alsof ik in een tijdmachine zat.
Dankzij veel mensen was dit een leuke en leerzame periode en ik wil iedereen daarvoor
middels dit dankwoord bedanken. Ik begin daarbij met de belangrijkste persoon tijdens mijn
promotietraject.
Bert, ik wil je heel erg bedanken voor de fijne begeleiding in de afgelopen jaren! Ik heb
veel van je geleerd om me te kunnen ontwikkelen als wetenschapper maar zeker ook als
persoon, omdat je oog hebt voor beide aspecten. Bedankt voor de prettige begeleiding en het
enorme vertrouwen, ook op de momenten waarop het onderzoek anders liep dan gepland.
Daarnaast wil ik je bedanken voor de mogelijkheid om het onderzoek aan de water-oplosbare
systemen voort te zetten.
Ik wil Maarten bedanken voor de begeleiding tijdens de eerste fase van mijn promotie, en
de feedback op dit proefschrift. Ook al bleek de koppeling met de eiwitten lastiger dan
gedacht, ik heb veel van dit onderzoek geleerd en met plezier deelgenomen aan de Protein
Engineering meetings. De grote stappen die jullie in de laatste jaren gemaakt hebben door het
combineren van eiwitten met DNA-nanotechnologie zijn bewonderingswaardig, en ik wens je
alle succes voor de toekomst.
I would like to thank Giovanni for being part of my defense committee and the nice
collaboration during the last years. I really appreciate our discussions at the interface of
experiment and simulation, and of course the simulations presented in chapter 3 of this thesis.
I am looking forward to our joint contributions to the field in the near future.
I am also grateful to Jeffrey Moore and Pol Besenius for being part of my defense
committee and traveling to Eindhoven.
Daarnaast wil ik Jan van Hest en Nico Sommerdijk bedanken voor hun deelname in mijn
promotiecommissie, en Peter Hilbers voor het voorzitten van de openbare verdediging. Nico,
hartelijk dank voor de mogelijkheid om elektronenmicroscopie te doen en het beschikbaar
stellen van de apparatuur en expertise om de BTA aggregaten in nog meer detail te kunnen
bestuderen.
Lou, thank you for collaborating on the kinetic studies of the BTAs, and the many HDX-
MS measurements you have performed. The relatively slow dynamics required long working
days and I really appreciate also your continued efforts to push forward the application of
HDX-MS to the supramolecular polymers. Moreover, I would like to thank you for the
critical feedback on written text and instructing Sandra on how to perform measurements.
Ik ben ook veel dank verschuldigd aan Paul Bomans voor de ondersteuning bij de
elektronenmicroscopie. Paul, zonder jouw hulp had het aantal succesvolle CryoTEM sessies
een heel stuk lager gelegen. Heel veel dank voor alle ‘troubleshooting’ de laatste jaren. Ik heb
het heel erg leuk gevonden om samen de tomografiemetingen te doen, welke geresulteerd
hebben in een mooi hoofdstuk. Daarnaast wil ik Rick bedanken voor de technische
ondersteuning, en Marcel bij wie mijn CryoTEM training gestart is en wie mij niet snel zal
laten vergeten hoe moeilijk deze techniek is. I also like to thank Heiner for his support when
analyzing the tomograms, and providing feedback on figures and text. Arthur wil ik bedanken
voor tomografische reconstructies, het 3D-printen van de BTA-fibers, en het me wegwijs
122
maken in de software op het tomolab.
Anja Palmans wil ik bedanken voor alle ondersteuning en het strak regelen van het
onderwijs voor de Scheikunde studenten.
Mijn kantoorgenoten wil ik bedanken voor het fijne werksfeertje en de gezellige
gesprekken over van alles en nog wat. ‘Herr’ Paffen, jij bent de enige waar ik het kantoor vier
jaren lang mee heb mogen delen, en het is jammer dat we elkaar niet tijdens het laatste uur bij
kunnen staan. Bedankt voor al je hulp met Matlab, het fitten van data, en zoveel meer. Ik
wens jou en je gezin alle goeds voor de toekomst en we houden contact. Daarnaast wil ik ook
Müge bedanken voor de gezelligheid op kantoor en de heerlijke versnaperingen. Hande,
Helen, Louis, Anneloes, Elisabeth en Andreas V wil ik ook bedanken voor hun prettige
aanwezigheid in STO 4.43. Jolanda wil ik bedanken voor de strakke organisatie en de
gezelligheid op Lab 2, het opschalen van de BTAs, en je vele andere activiteiten die er voor
zorgen dat er hier geen chaos uit zal breken. Luuk, Marleen en Hande, dank voor het delen
van de zuurkast.
Ik wil ook een aantal studenten bedanken voor de fijne samenwerking. Sandra, jouw inzet
heeft geleid tot een aantal mooie resultaten zoals beschreven in dit proefschrift. Ik bewonder
de precisie in je aanpak, en je kookkunsten als het om het bakken van taarten gaat. Lotte, jij
werkte aan een heel lastig project, maar dat we uiteindelijk een koppeling toch goed aan de
praat hebben gekregen is mede dankzij jouw inzet. Rens, jouw motivatie bleef ongeëvenaard.
Ik wens jullie allemaal veel succes met jullie promoties. I also would like to thank Camille,
Natalie, Austin and Joseph for the nice collaboration during the Dutch ‘Summer’.
Ellen en Simone, ik vind het super fijn dat jullie mijn paranimfen willen zijn tijdens mijn
promotie, waarvoor dank!
I am grateful to the current and previous members of the ‘aqueous’ lunchmeeting for their
support: Sjors, Simone, Misha, Katja, Balu, Nic, Janus, Matt and Lorenzo. Janus, jij hebt de
water-oplosbare BTAs voor het eerst op de kaart gezet en ik dank je voor je steun tijdens het
begin van mijn promotie, je goed gevoel voor humor en je kritische blik. Hoofdstuk 5 is voor
jou! Daan, bedankt voor je hulp en advies betreffende de metingen met de stopped-flow, ik
zal de setup in ere houden. Tevens dank voor de gezellige gesprekken aangaande het
onderzoek of verre vakantiebestemmingen. Nic, thank you for the synthetic support, your
enthousiasm, and many cryo-samples. You are a great person. Clément, thank you for
teaching me a lot about scattering experiments. I also like to thank the other group members:
Gijs, Mathijs, Marcin, José, Bea, Bas, Bas, Nate, Yiliu, Chidambar, Brigitte, Lafayette,
Ghislaine and Andreas R, and former members: Daan, Bram T, Anindita, Stan, Andreas H,
Patrick, Rob, Isja, Bram P, Martijn, Marko, Peter, Mellany and Miguel, for their support.
Neus, Ilja, Danilo, Travis, Nabila, Marcos, Wouter, Yao and Pranav, thanks for collaborating
on various projects.
Koen, Elmar en Ricky van de ICMS animatiestudio wil ik graag bedanken voor de
verschillende cartoons die jullie voor me gemaakt hebben van de BTA-fibers. Daarnaast dank
voor het prachtige filmpje van de groeiende BTA stack in water, en de mooie afbeelding voor
op de kaft van mijn proefschrift.
Vervolgens wil ik nog een aantal mensen bedanken voor hun ondersteuning. Hans voor het
bestellen van de chemicaliën en andere dure snuisterijen, en Henk voor de pakketjes. Ralf,
Lou en Joost voor metingen en het op orde houden van de analytische apparatuur. Jody,
123
Serge, Bram en Lech voor het onderhouden van de NMRs. Sheen voor de logistiek en
veiligheid inzake het ICMS-lab. Martina, Carla, Margot, Marjo, Jolanda, Joke, Nora, Janna,
Wendy en Cindy voor de secretariële support. Daarbij een speciaal woord van dank aan
Martina voor het herhaaldelijk redden van mijn gebruikersaccount.
Garry, jij bent de eerste persoon van ‘buiten het lab’ die ik wil bedanken, omdat je mij een
hoop vaardigheden hebt aangeleerd die belangrijk zijn bij het coachen en trainen van mensen,
vaardigheden die ook op de universiteit heel erg goed van pas komen. Dankzij jouw
begeleiding heb ik me kunnen kwalificeren als competentietrainer binnen Scouting
Nederland; hartelijk dank daarvoor. Ik ben ook erg blij deel uit te kunnen maken van de
bijzondere groep mensen die binnen ‘TraKa’ actief zijn. De kampen en leiderscursussen
geven onder jouw bewind veel mensen op een plezierige manier een flinke boost, waarvoor je
jouw Koninklijke onderscheiding dik hebt verdiend!
Dan zijn er nog een hoop mensen die buiten mijn promotie voor de nodige afleiding
gezorgd hebben. Veelal in de buitenlucht waren dat Lisa, Wil, Nathalie, Chris en Koen;
bedankt voor alle gezelligheid en het draaiende houden van de Scoutsgroep. Dave, Matthijs,
Sander, Janneke, Sabine, René, Hans en Garry; het was heel erg leuk om kampen met jullie te
draaien. Ellen, Vivian, Bas, Jolanda, Rachel, Roel, Frenk, Frank, Harry, Niels, Remco,
Sanne, Nikki, Youri en Mariska, bedankt voor alle gezelligheid.
Uiteraard wil ik ook mijn familie en bijna schoonfamilie bedanken voor de belangstelling
voor mijn onderzoek. Linda, Adrie, Richard, Wendy, Wijnand, Luca en Vigo, ik stel jullie
betrokkenheid erg op prijs.
Pap, mam en Luc, bedankt dat jullie er altijd voor mij zijn. Dankzij jullie steun ben ik zover
kunnen komen. Sinds ik het ouderlijk huis heb verlaten en zich meer in Eindhoven afspeelt is
het lastiger te volgen, maar jullie interesse blijft onverminderd en ik kan altijd bij jullie
terecht. Ongeacht waar de toekomst ons verder nog zal brengen, de thuisbasis is en blijft in
Susteren.
Simone, jij bent de grootste ontdekking die ik tijdens mijn promotie heb gedaan, en stiekem
al van een tijdje daarvoor. Bedankt voor alle ondersteuning en opofferingen tijdens de
moeilijke tijden, en voor al het moois dat we samen beleven. Jij bent het belangrijkste in mijn
leven, en ik kijk uit naar onze nieuwe avonturen. Ik houd van je.
René

124


