Embed Size (px)
Citation preview
Knowledge Brokering in Vocational Rehabilitation Agency Contexts
Kathleen M. Murphy, Bitnara “Jasmine” Park, Melissa Scardaville, Devin Dedrick, and Lee Nethercott Prepared for February 9, 2021, broadcast
Describe the targeted outcomes of the Center on Knowledge Translation for Employment Research (KTER Center).
Describe related research activities—research questions, activities, and findings—of the KTER Center’s study of knowledge brokering in vocational rehabilitation (VR) agency contexts.
Describe implications of the findings and future research topics.
Presentation Objectives
2
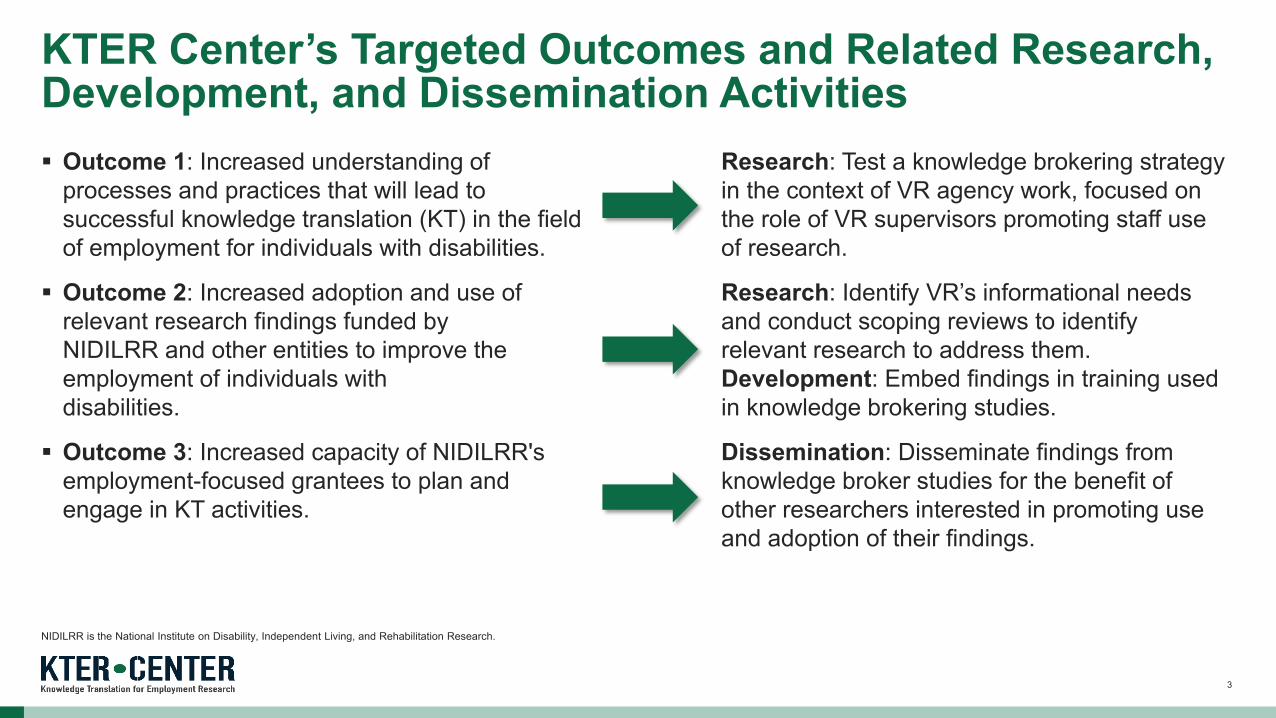
Outcome 1: Increased understanding of processes and practices that will lead to successful knowledge translation (KT) in the field of employment for individuals with disabilities.
Outcome 2: Increased adoption and use of relevant research findings funded by NIDILRR and other entities to improve the employment of individuals with disabilities.
Outcome 3: Increased capacity of NIDILRR's employment-focused grantees to plan and engage in KT activities.
KTER Center’s Targeted Outcomes and Related Research, Development, and Dissemination Activities
Research: Test a knowledge brokering strategy in the context of VR agency work, focused on the role of VR supervisors promoting staff use of research.
Research: Identify VR’s informational needs and conduct scoping reviews to identify relevant research to address them. Development: Embed findings in training used in knowledge brokering studies.
Dissemination: Disseminate findings from knowledge broker studies for the benefit of other researchers interested in promoting use and adoption of their findings.
3
NIDILRR is the National Institute on Disability, Independent Living, and Rehabilitation Research.
Can research liaisons (e.g., VR supervisors trained as knowledge brokers) who receive training and support in the use of research-based practices improve the use of relevant research by VR counselors, with the goal of increasing employment and job retention among VR consumers?
Did employment outcomes (e.g., greater entry to competitive employment and higher wages) of consumers served by VR counselors whose supervisors participated in the study improve compared with the employment outcomes of consumers served by VR counselors in the control group?
Research Questions for Knowledge Broker Study
4
VR supervisors were invited to participate in the study.
As part of signing up, they took a survey describing levels of “Research Orientation,” “Interactions,” and “Use of Resources,” along with demographic information.
They shared this survey with their counselors (or shared staff names with KTER Center staff, who sent those counselors the survey).
Then KTER staff randomly assigned all supervisors who signed up from a given state to one of two study groups: the training group or a comparison group that received no training.
Counselors were assigned to the same study group as their supervisors for the purposes of data collection, but no counselors received any direct training.
Study Activities
5
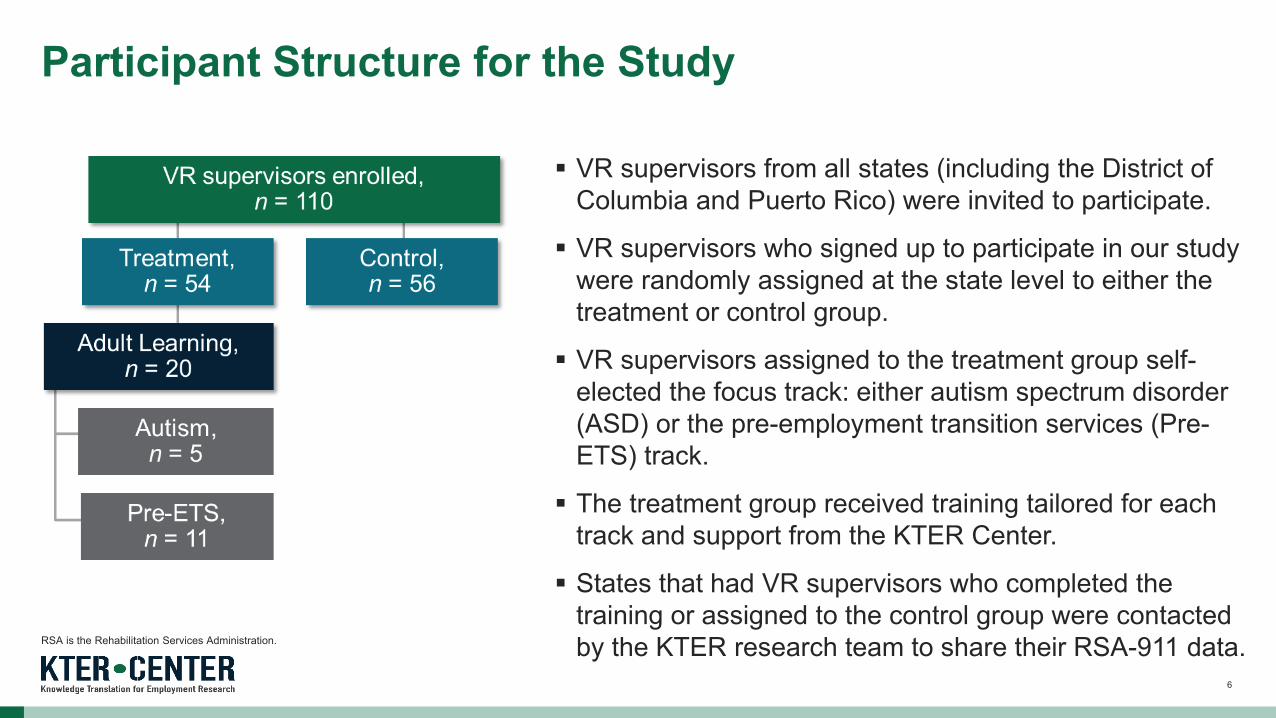
VR supervisors from all states (including the District of Columbia and Puerto Rico) were invited to participate.
VR supervisors who signed up to participate in our study were randomly assigned at the state level to either the treatment or control group.
VR supervisors assigned to the treatment group self-elected the focus track: either autism spectrum disorder (ASD) or the pre-employment transition services (Pre-ETS) track.
The treatment group received training tailored for each track and support from the KTER Center.
States that had VR supervisors who completed the training or assigned to the control group were contacted by the KTER research team to share their RSA-911 data.
Participant Structure for the Study
6
RSA is the Rehabilitation Services Administration.
All VR supervisors in the training group first participated in an online training module on tips for teaching adults.
Then they watched a second module that focused on either the employment of adults with autism or pre-employment transition services.
The modules included prerecorded slide presentations, with embedded quizzes, exercises, and research summaries available for download.
After training completed, KTER Center research staff sent follow-up surveys to all participants who completed at least one of the modules, to the counselors those training participants supervised, and to all supervisors and counselors in the control group.
Training and Follow-up Data Collection
7
Survey data: baseline and post-training for VR supervisors and to the counselors each supervised, in both training and comparison groups
Qualitative data: monthly follow-up interviews with training participants
Caseload data: analyses of RSA-911 data from states that had participants complete all data collection
Data Analyses: Three Datasets
8
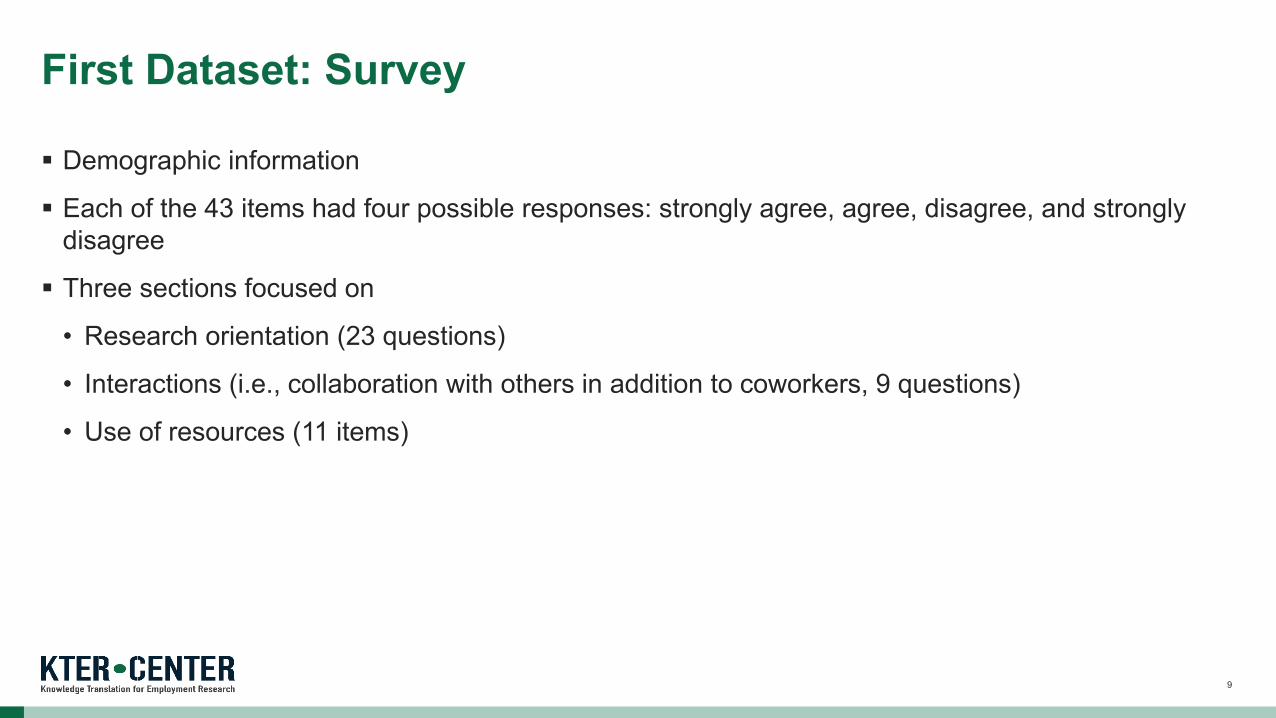
Demographic information
Each of the 43 items had four possible responses: strongly agree, agree, disagree, and strongly disagree
Three sections focused on
• Research orientation (23 questions)
• Interactions (i.e., collaboration with others in addition to coworkers, 9 questions)
• Use of resources (11 items)
First Dataset: Survey
9
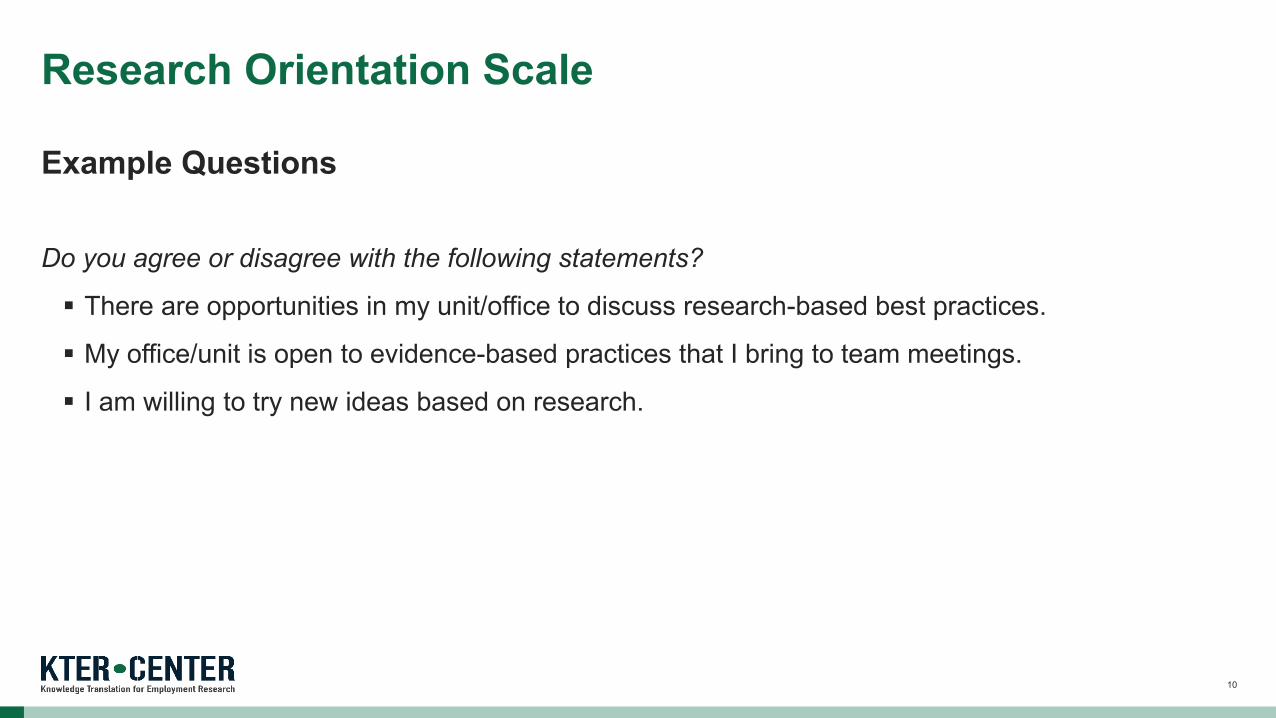
Do you agree or disagree with the following statements?
There are opportunities in my unit/office to discuss research-based best practices.
My office/unit is open to evidence-based practices that I bring to team meetings.
I am willing to try new ideas based on research.
Research Orientation Scale
Example Questions
10
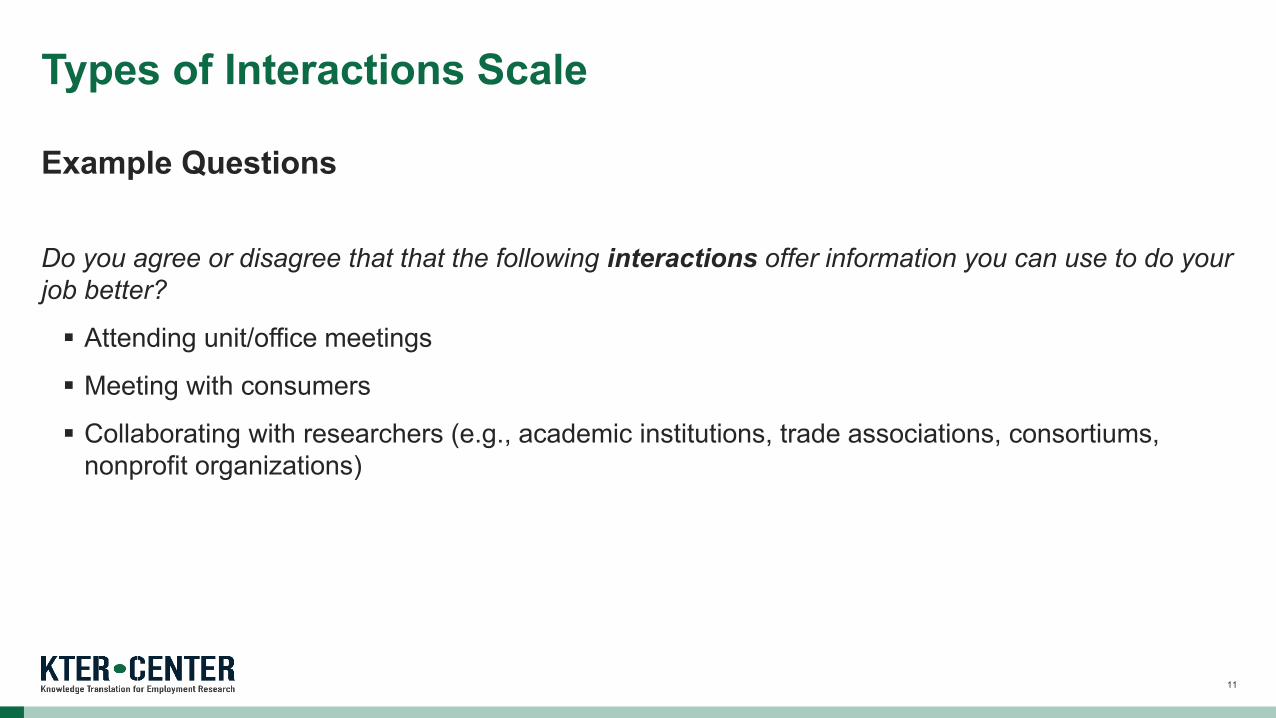
Do you agree or disagree that that the following interactions offer information you can use to do your job better?
Attending unit/office meetings
Meeting with consumers
Collaborating with researchers (e.g., academic institutions, trade associations, consortiums, nonprofit organizations)
Types of Interactions Scale
Example Questions
11
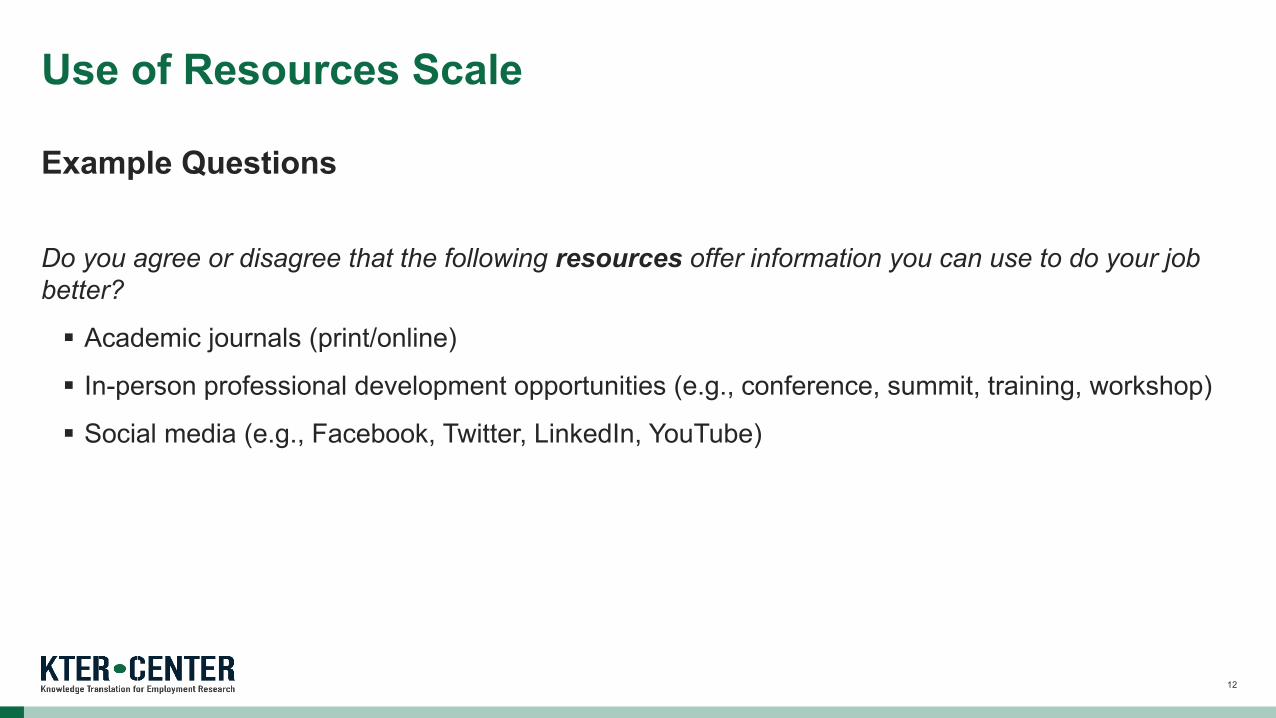
Do you agree or disagree that the following resources offer information you can use to do your job better?
Academic journals (print/online)
In-person professional development opportunities (e.g., conference, summit, training, workshop)
Social media (e.g., Facebook, Twitter, LinkedIn, YouTube)
Use of Resources Scale
Example Questions
12
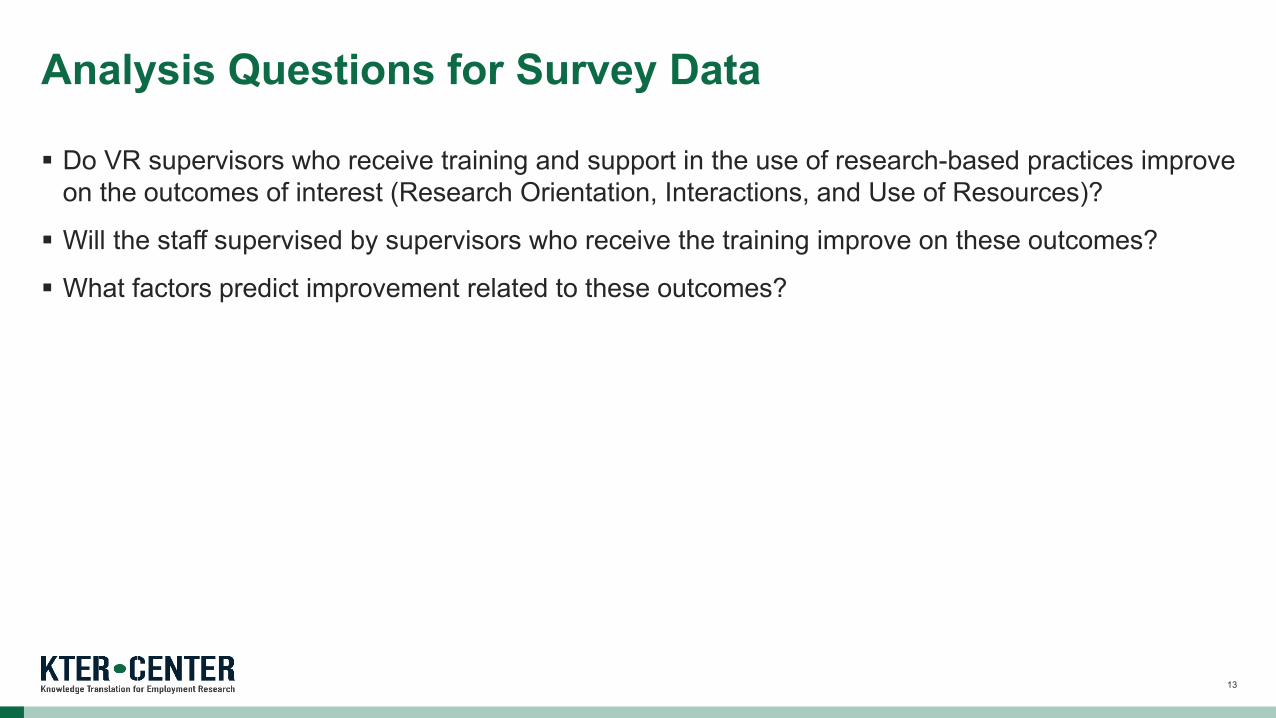
Do VR supervisors who receive training and support in the use of research-based practices improve on the outcomes of interest (Research Orientation, Interactions, and Use of Resources)?
Will the staff supervised by supervisors who receive the training improve on these outcomes?
What factors predict improvement related to these outcomes?
Analysis Questions for Survey Data
13
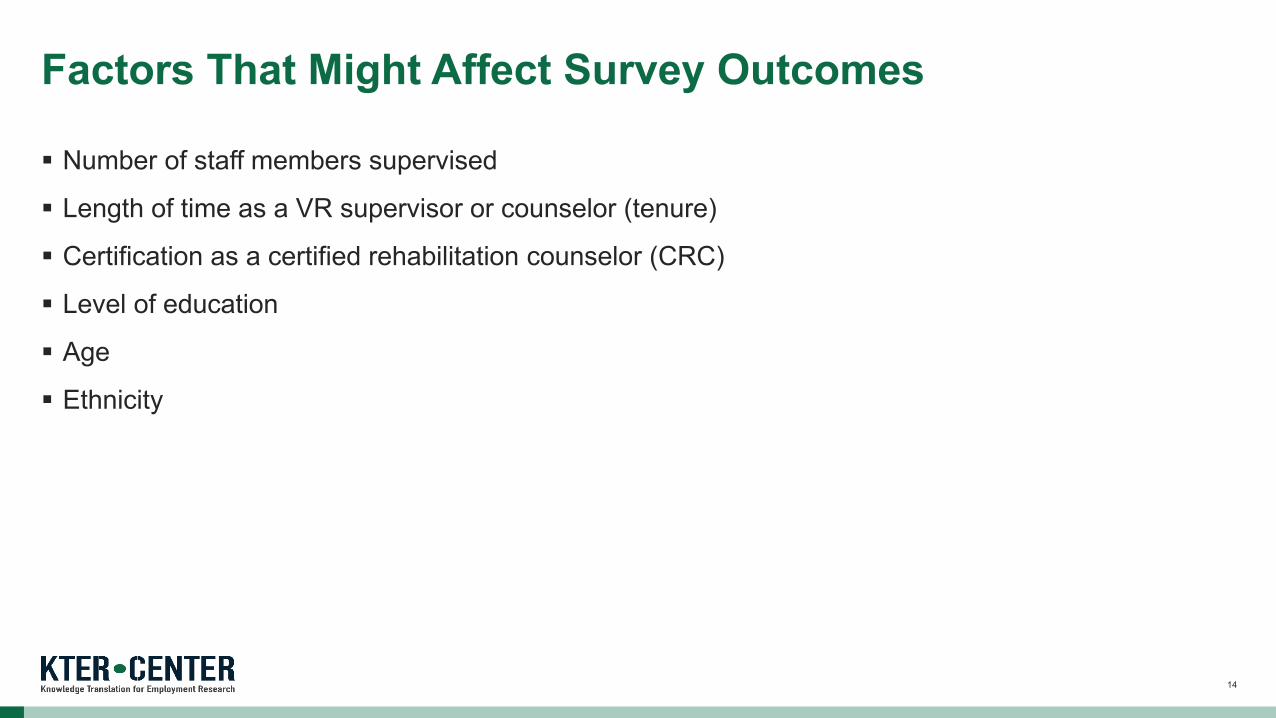
Number of staff members supervised
Length of time as a VR supervisor or counselor (tenure)
Certification as a certified rehabilitation counselor (CRC)
Level of education
Age
Ethnicity
Factors That Might Affect Survey Outcomes
14
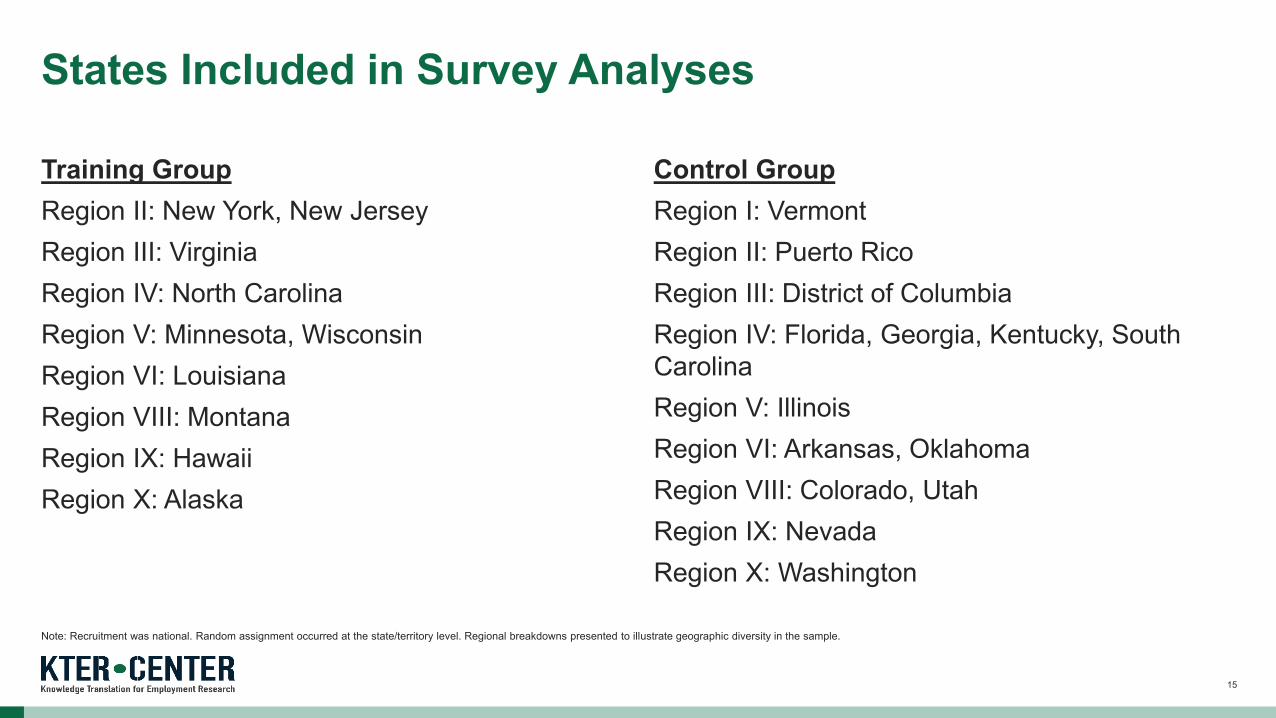
Training Group Region II: New York, New Jersey Region III: Virginia Region IV: North Carolina Region V: Minnesota, Wisconsin Region VI: Louisiana Region VIII: Montana Region IX: Hawaii Region X: Alaska
Control Group Region I: Vermont Region II: Puerto Rico Region III: District of Columbia Region IV: Florida, Georgia, Kentucky, South Carolina Region V: Illinois Region VI: Arkansas, Oklahoma Region VIII: Colorado, Utah Region IX: Nevada Region X: Washington
Note: Recruitment was national. Random assignment occurred at the state/territory level. Regional breakdowns presented to illustrate geographic diversity in the sample.
States Included in Survey Analyses
15
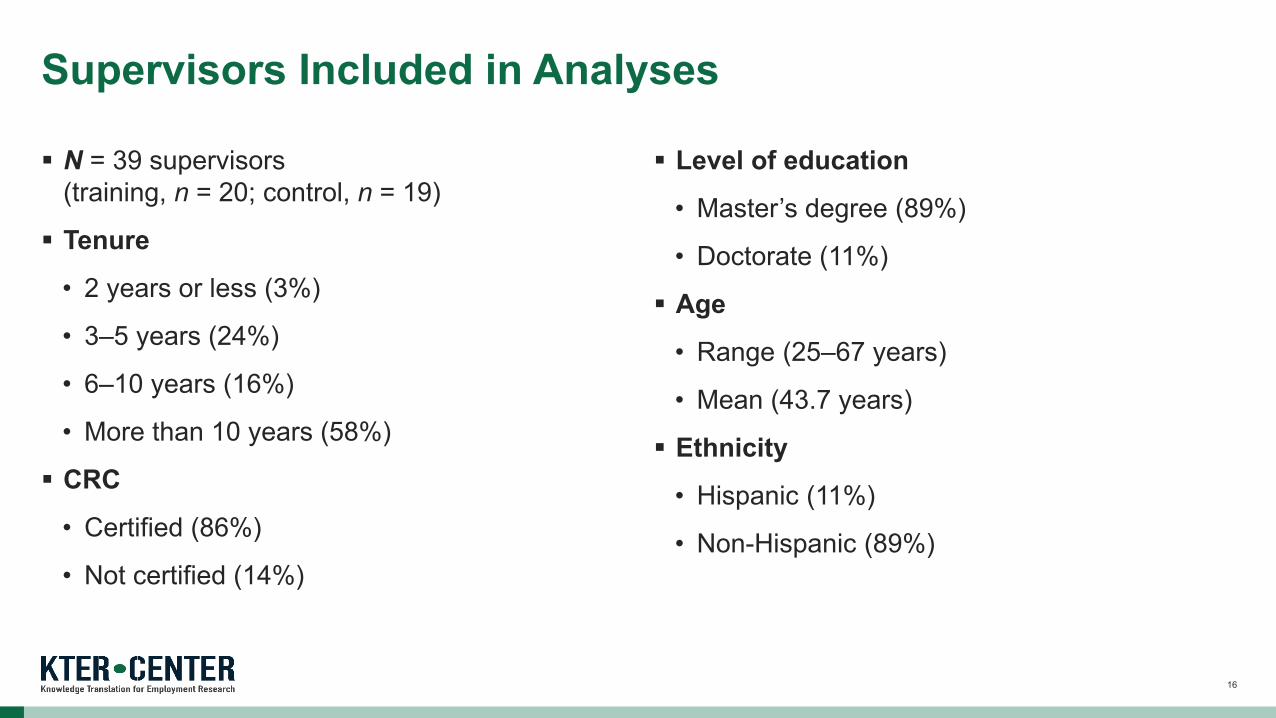
N = 39 supervisors (training, n = 20; control, n = 19)
Tenure
• 2 years or less (3%)
• 3–5 years (24%)
• 6–10 years (16%)
• More than 10 years (58%)
CRC
• Certified (86%)
• Not certified (14%)
16
Level of education
• Master’s degree (89%)
• Doctorate (11%)
Age
• Range (25–67 years)
• Mean (43.7 years)
Ethnicity
• Hispanic (11%)
• Non-Hispanic (89%)
Supervisors Included in Analyses
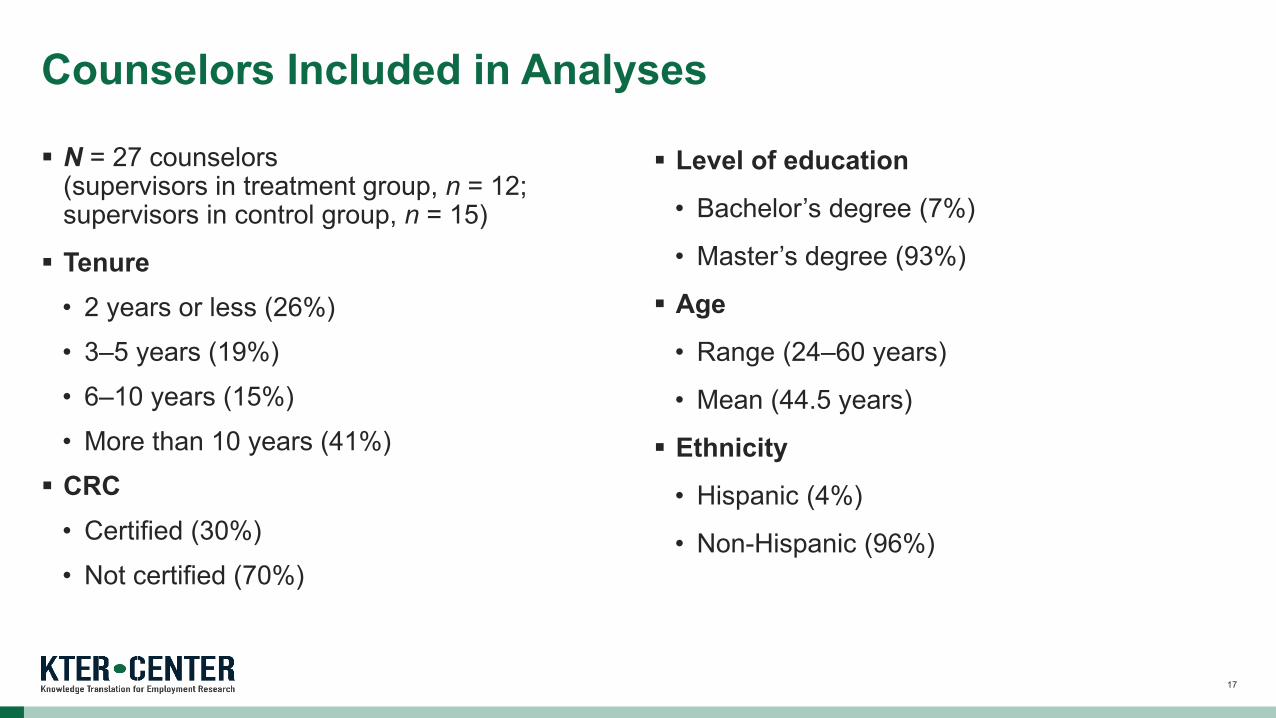
N = 27 counselors (supervisors in treatment group, n = 12; supervisors in control group, n = 15)
Tenure• 2 years or less (26%)• 3–5 years (19%)• 6–10 years (15%)• More than 10 years (41%) CRC
• Certified (30%)• Not certified (70%)
17
Level of education
• Bachelor’s degree (7%)
• Master’s degree (93%)
Age
• Range (24–60 years)
• Mean (44.5 years)
Ethnicity
• Hispanic (4%)
• Non-Hispanic (96%)
Counselors Included in Analyses
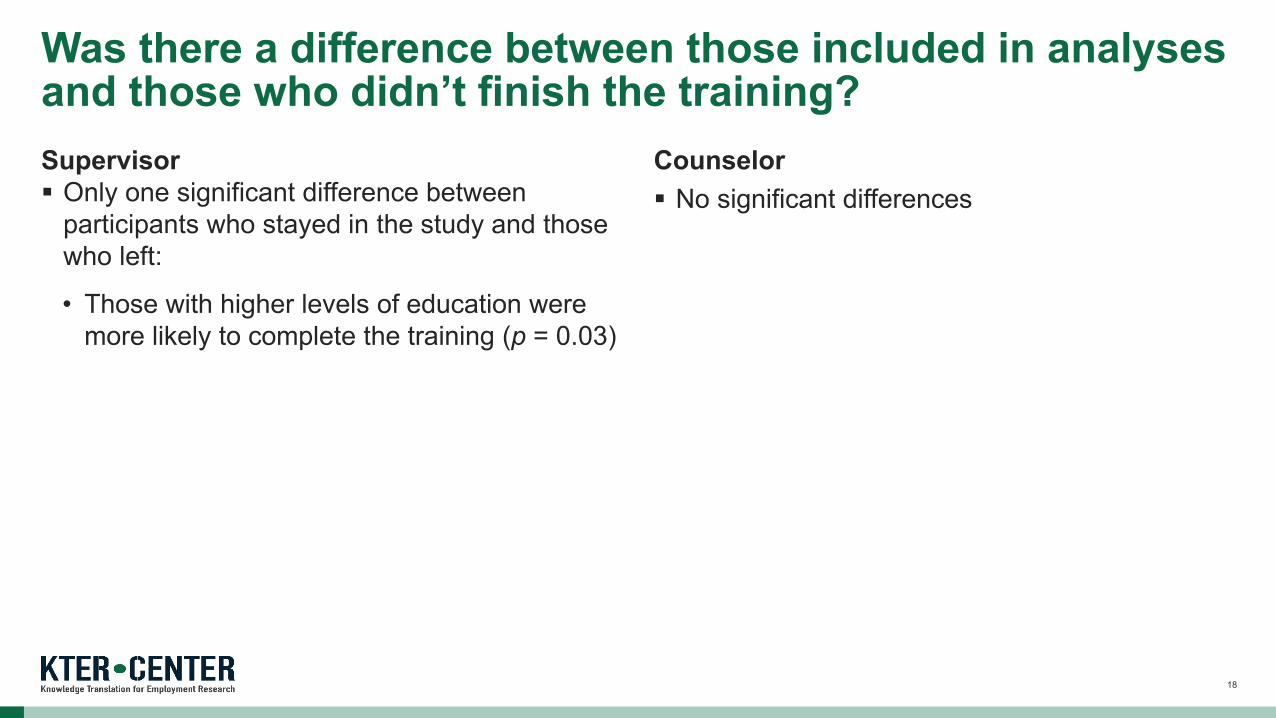
Supervisor Only one significant difference between
participants who stayed in the study and those who left:
• Those with higher levels of education were more likely to complete the training (p = 0.03)
Counselor No significant differences
Was there a difference between those included in analyses and those who didn’t finish the training?
18
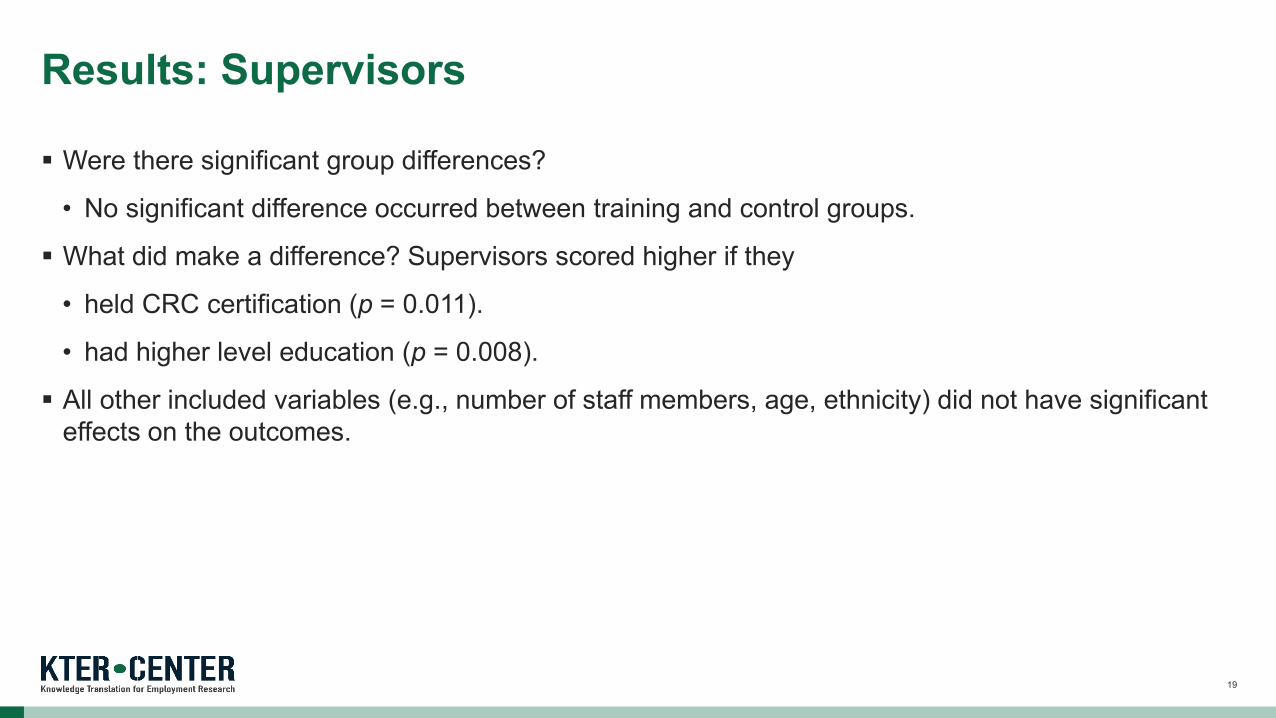
Were there significant group differences?
• No significant difference occurred between training and control groups.
What did make a difference? Supervisors scored higher if they
• held CRC certification (p = 0.011).
• had higher level education (p = 0.008).
All other included variables (e.g., number of staff members, age, ethnicity) did not have significant effects on the outcomes.
Results: Supervisors
19
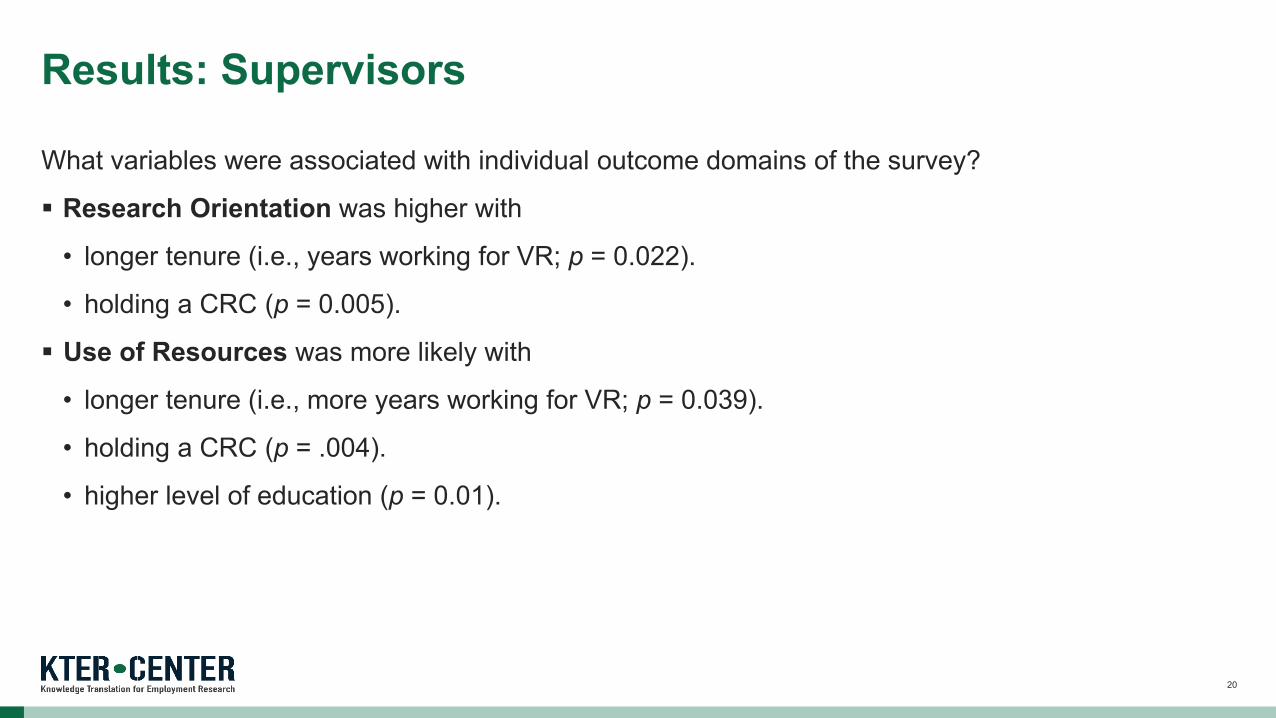
What variables were associated with individual outcome domains of the survey?
Research Orientation was higher with
• longer tenure (i.e., years working for VR; p = 0.022).
• holding a CRC (p = 0.005).
Use of Resources was more likely with
• longer tenure (i.e., more years working for VR; p = 0.039).
• holding a CRC (p = .004).
• higher level of education (p = 0.01).
Results: Supervisors
20
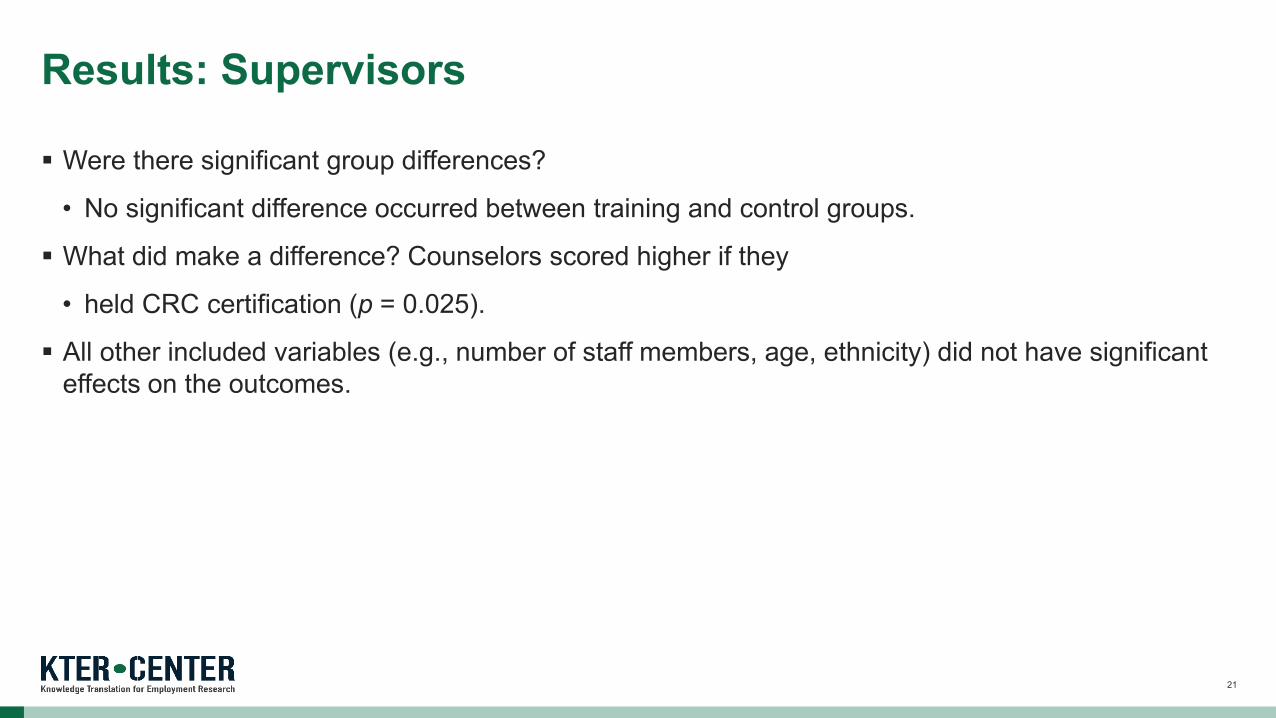
Were there significant group differences?
• No significant difference occurred between training and control groups.
What did make a difference? Counselors scored higher if they
• held CRC certification (p = 0.025).
All other included variables (e.g., number of staff members, age, ethnicity) did not have significant effects on the outcomes.
Results: Supervisors
21
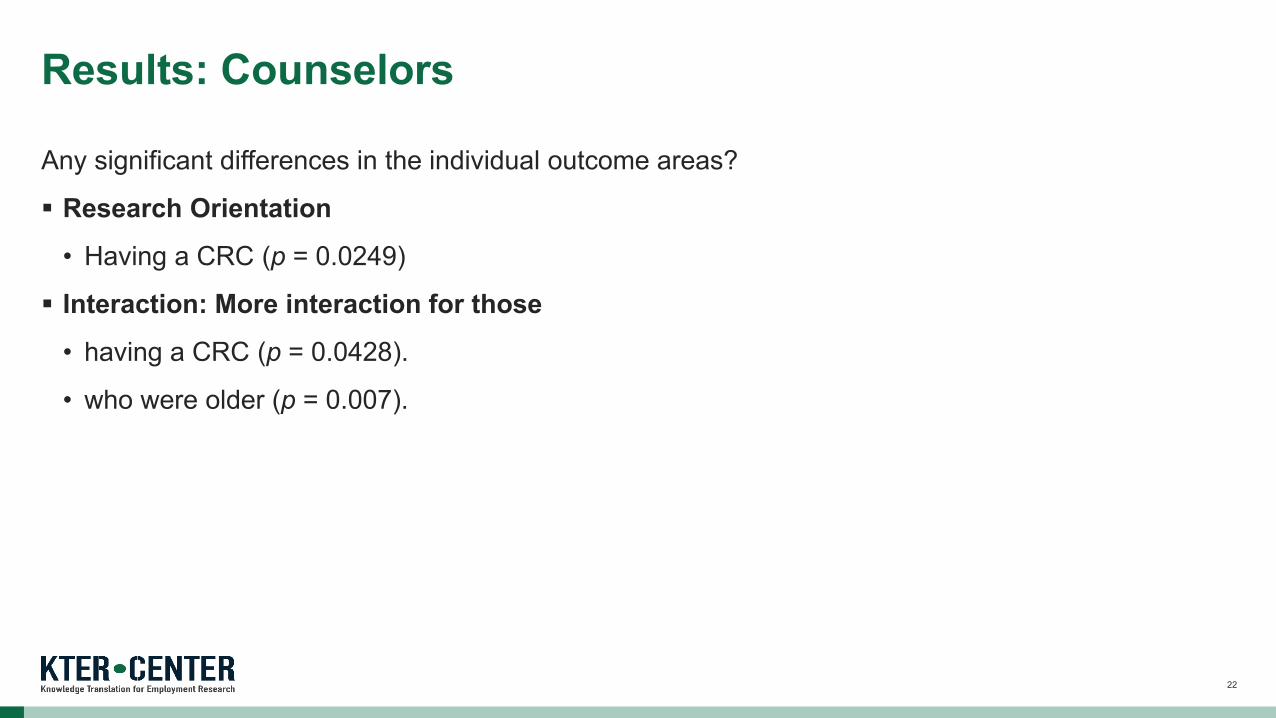
Any significant differences in the individual outcome areas?
Research Orientation
• Having a CRC (p = 0.0249)
Interaction: More interaction for those
• having a CRC (p = 0.0428).
• who were older (p = 0.007).
Results: Counselors
22
CRC certification
Tenure
Level of education
Age
Implications: Demographics Made a Stronger Impact Than Did the Training
23
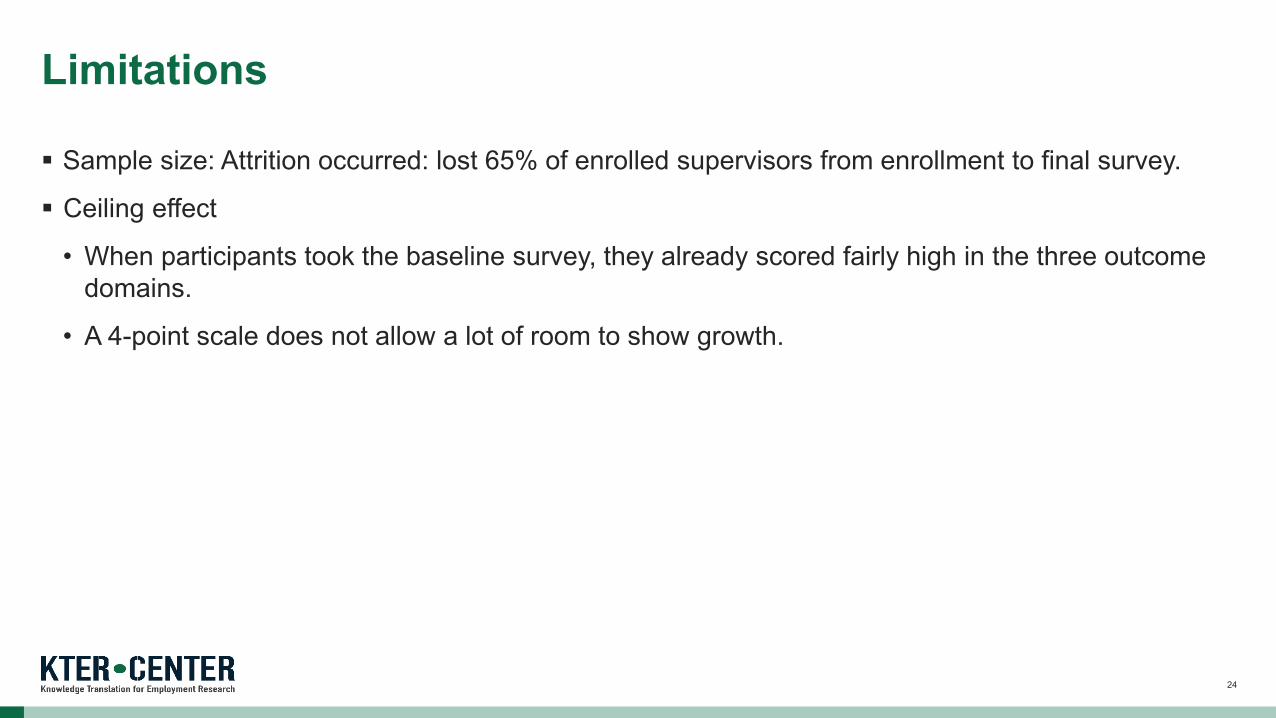
Sample size: Attrition occurred: lost 65% of enrolled supervisors from enrollment to final survey.
Ceiling effect
• When participants took the baseline survey, they already scored fairly high in the three outcome domains.
• A 4-point scale does not allow a lot of room to show growth.
Limitations
24
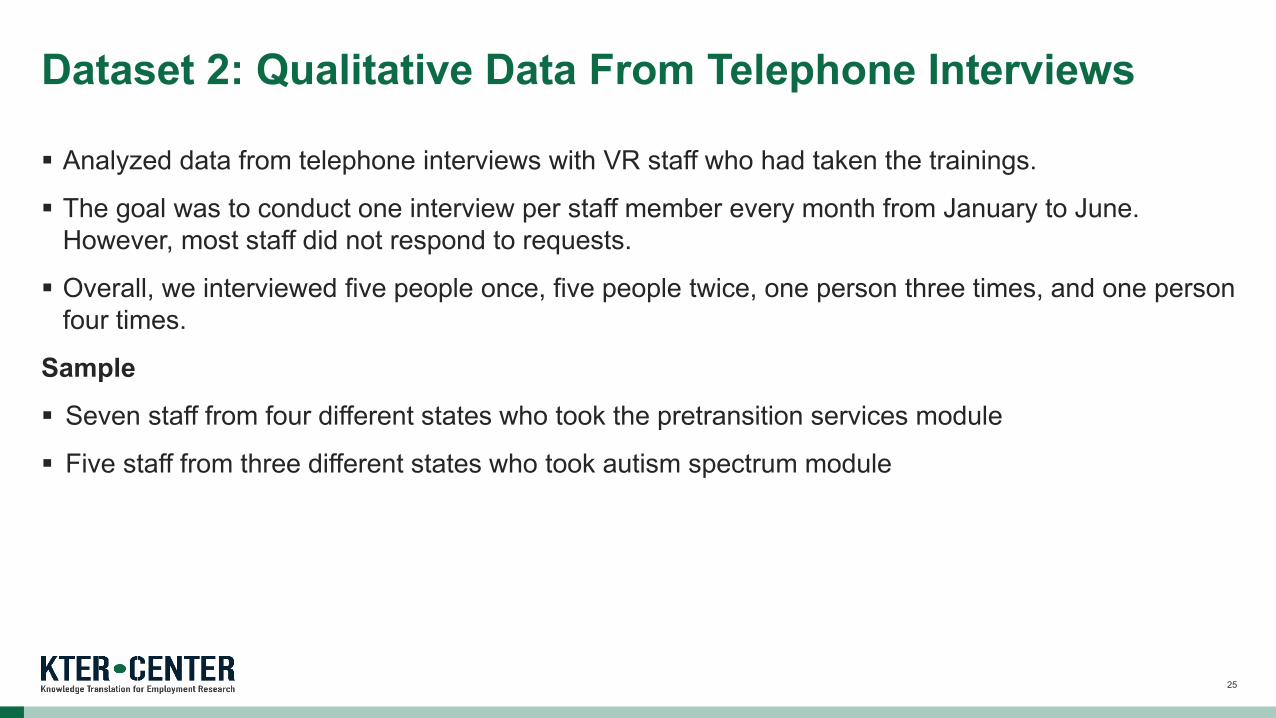
Analyzed data from telephone interviews with VR staff who had taken the trainings.
The goal was to conduct one interview per staff member every month from January to June. However, most staff did not respond to requests.
Overall, we interviewed five people once, five people twice, one person three times, and one person four times.
Sample
Seven staff from four different states who took the pretransition services module
Five staff from three different states who took autism spectrum module
Dataset 2: Qualitative Data From Telephone Interviews
25
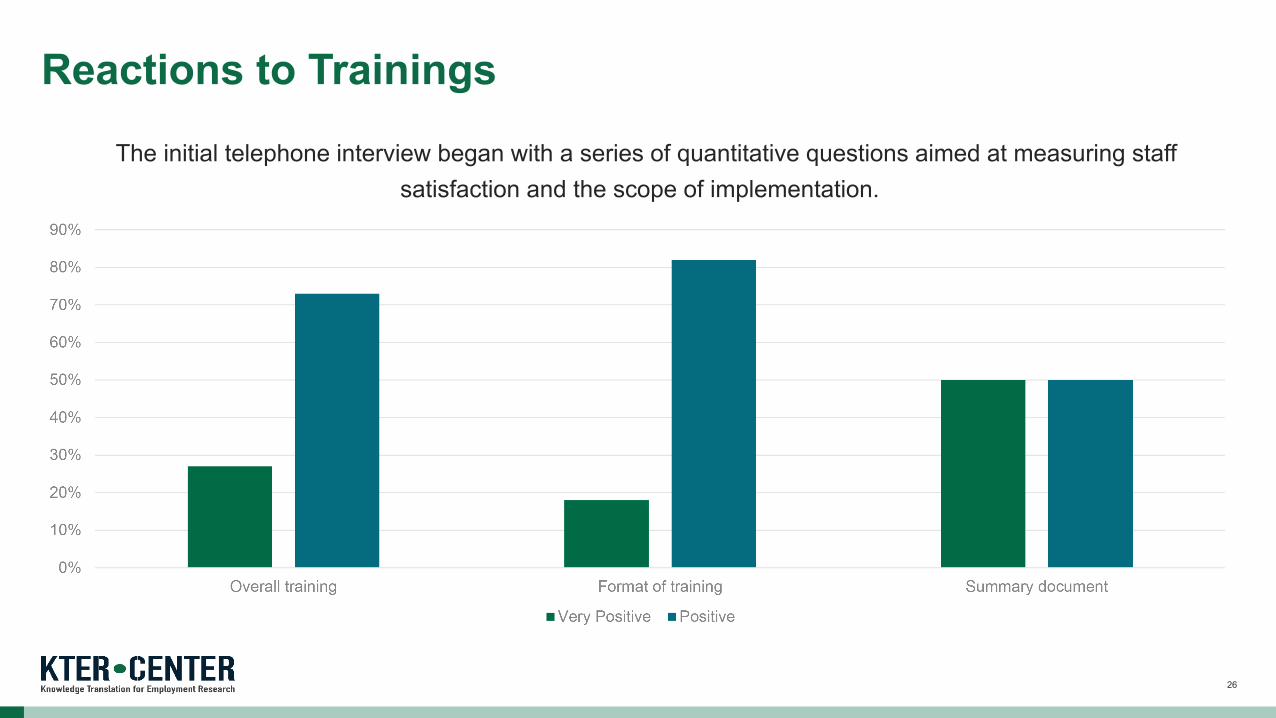
Reactions to Trainings
26
The initial telephone interview began with a series of quantitative questions aimed at measuring staff satisfaction and the scope of implementation.
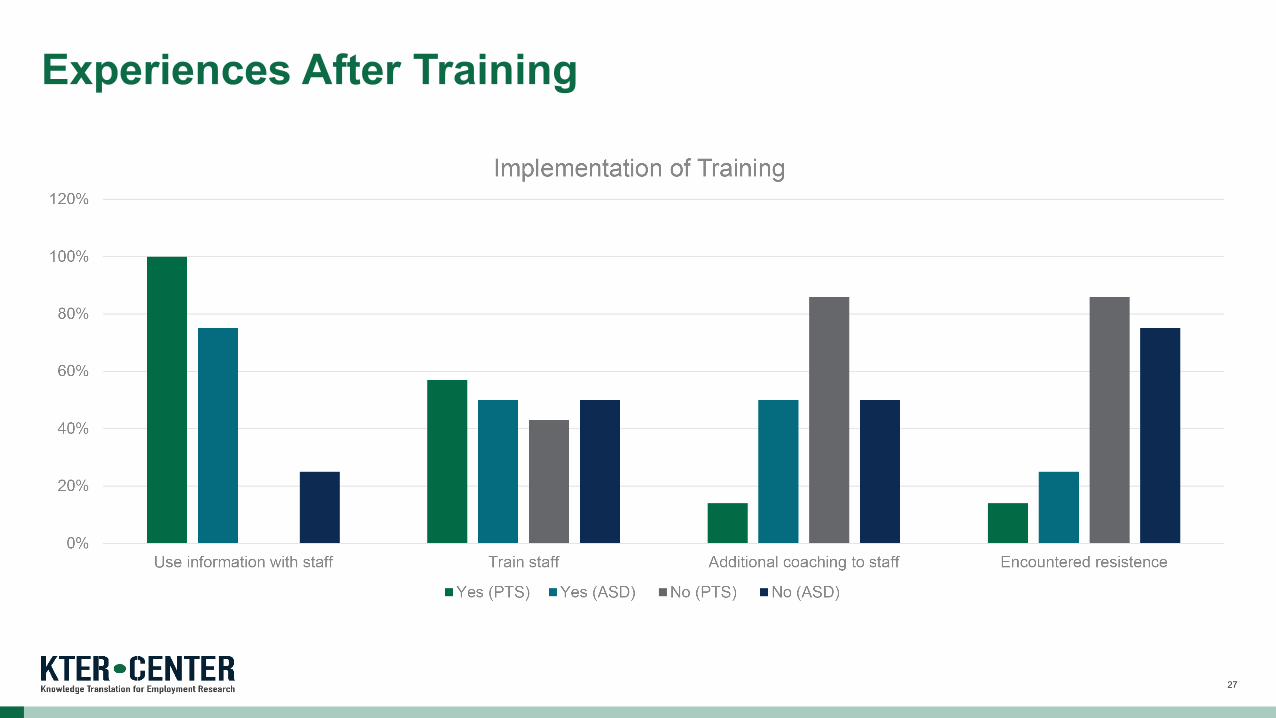
Experiences After Training
27
All participants said the trainings either increased their awareness of Pre-ETS or ASD or positively reinforced previous knowledge.
About 75% of the participants noted that they found the adult learning principles training very useful and have used those practices when they conduct internal trainings.
Changes on an Individual Level
28
About 50% of the VR counselors who took the ASD training noted that they appreciated statistics about ASD and have shared them with their staff.
VR counselors who took the Pre-ETS training talked more about using adult learning principles than the content in Pre-ETS likely because their departments already focused on Pre-ETS.
Changes on an Individual Level
29
Most participants noted that they found it very hard to enact change on an organizational level for the following reasons: Very high staff turnover made it difficult to impart lessons learned during the training. VR counselors are always “putting out fires” and do not have the resources to implement best
practices based on research. VR counselors have a lot of competing demands and do not often have the time or energy to attend
trainings or put new ideas into practice.
Changes on an Organizational Level
30
Despite these challenges, there were success stories.
Several participants mentioned that sharing the materials they received in the training is helping spur dialogue within their organization and sometimes at the state level about Pre-ETS, ASD, or adult learning principles.
One VR counselor shared that after she attended the Pre-ETS training, the VR agency created a new job category called “vocation rehabilitation specialist” who works specifically with youth. Three new staff were added.
Changes on an Organizational Level
31
Most VR counselors who attended the trainings did not respond to follow-up requests to receive additional assistance.
What are ways to increase participation in follow-up activities?
Most participants who did follow-up identified staff turnover as a barrier to implementing best practice.
How should trainings take staff turnover into account?
What can be done about high staff turnover?
States have very different cultures, resources, and mandates related to VR services.
How should trainings address the wide diversity in state VR agencies?
Future Research
32
Dataset 3: Rehabilitation Services Administration Case Service Report (RSA-911) Data Administrative data collected by each state VR agency each quarter
Intended to track the progress of VR agency services and their impact
Includes various information about individuals in the state VR service system, such as demographics, disability type, service interventions, and employment status
Advantages
• Large sample size across all states and jurisdictions
• Detailed information regarding individuals’ disability types, education and employment status, and services provided to them
33
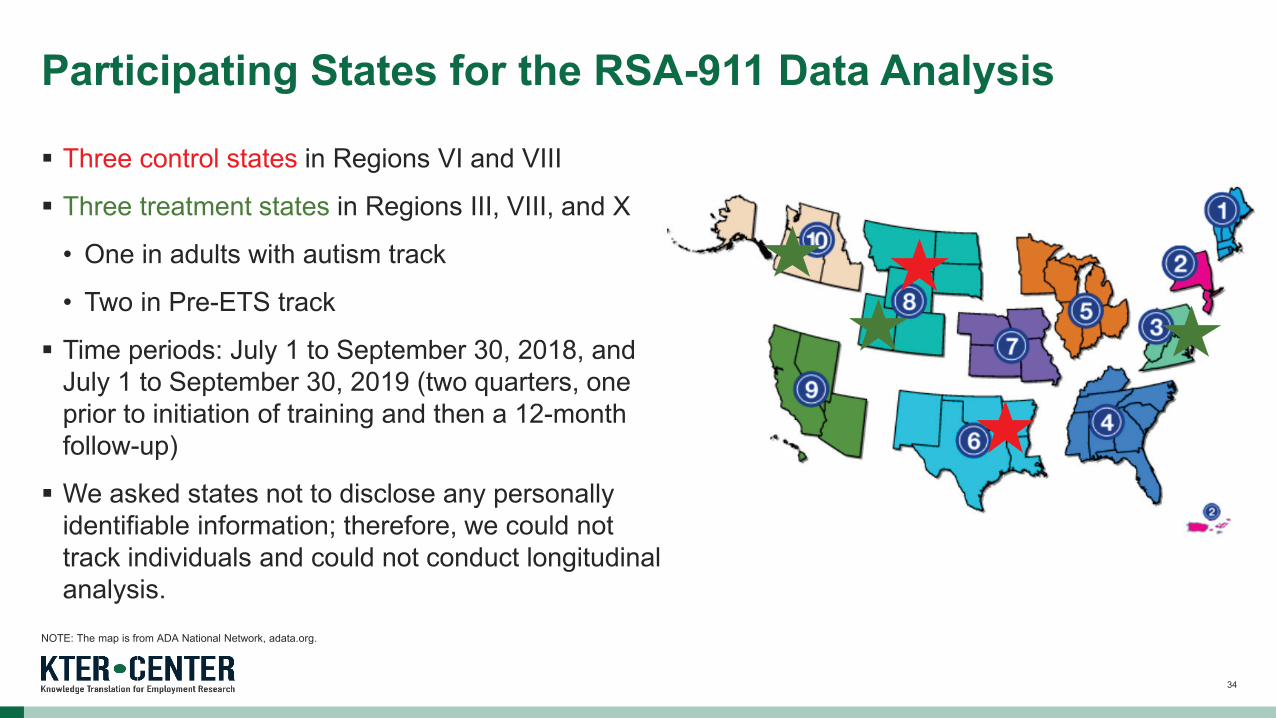
Three control states in Regions VI and VIII
Three treatment states in Regions III, VIII, and X
• One in adults with autism track
• Two in Pre-ETS track
Time periods: July 1 to September 30, 2018, and July 1 to September 30, 2019 (two quarters, one prior to initiation of training and then a 12-month follow-up)
We asked states not to disclose any personally identifiable information; therefore, we could not track individuals and could not conduct longitudinal analysis.
NOTE: The map is from ADA National Network, adata.org.
Participating States for the RSA-911 Data Analysis
34
Individuals with either primary or secondary disability source indicated as autism and who did not receive Pre-ETS
N = 5,900 (2018 = 2,700 and 2019 = 3,200)
90% of the analytic sample is from the treatment states for both years.
Analytic Sample: Adults With Autism Track
35
Individuals with a record of Pre-ETS
N = 25,100 (2018 = 7,200 and 2019 = 17,900)
83% and 90% of the analytic sample are from the treatment states for 2018 and 2019, respectively.
Analytic Sample: Pre-ETS Track
36
Individuals with autism who received Pre-ETS were considered only as the Pre-ETS track sample.
67% of the analytic sample is from one treatment state.
Analytic Sample
37
Employment outcome of individuals
• Employment status
• Hourly wage
• Hours worked in a week
VR services provided to individuals
• Percentage of individuals who received any services
• Percentage of individuals who received specific type of services
Outcomes of Interest
38
VR Service-Related Variables
We divided consumers into two groups: one that had received a service type, and the other that did not receive the service.
Five Pre-ETS groups, including, for example, job exploration counseling and workplace readiness training
Twelve training services, including for example, postsecondary education, occupational/vocational training, and basic academic remedial/literacy training
Eleven career services, including for example, assessment, diagnostic and treatment of impairments, short-term job supports, and benefits counseling
Eight other types of services, including for example, transportation and interpreter services (e.g., sign language)
39
Data were examined descriptively by treatment status.
Independent sample t-test with unequal variance was conducted for each year and tracked separately to compare whether the averages of outcome variables varied between the control and treatment states.
Outcome variables
• Employment outcome variables
• Proportion of individuals receiving VR services
Treatment versus control states
Analysis
40
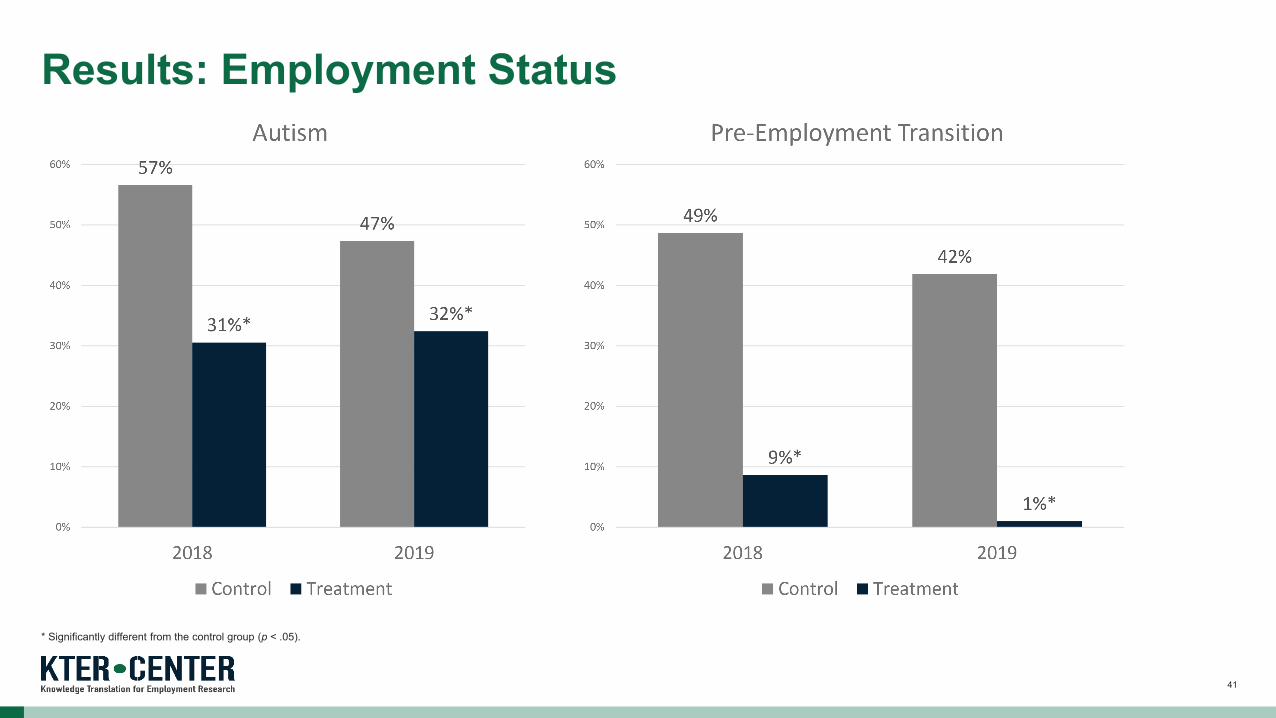
Results: Employment Status
41
* Significantly different from the control group (p < .05).
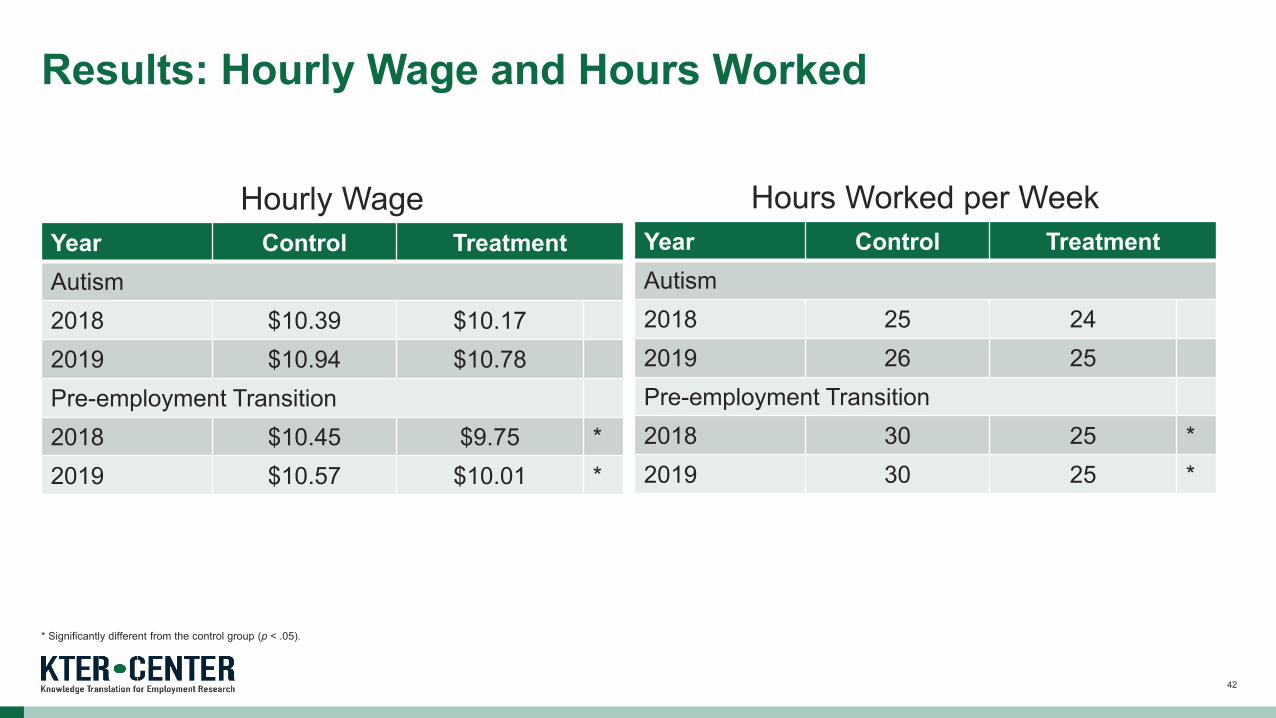
Year Control Treatment Autism 2018 $10.39 $10.17 2019 $10.94 $10.78 Pre-employment Transition 2018 $10.45 $9.75 * 2019 $10.57 $10.01 *
* Significantly different from the control group (p < .05).
Results: Hourly Wage and Hours Worked
Hourly Wage Year Control Treatment Autism 2018 25 24 2019 26 25 Pre-employment Transition 2018 30 25 * 2019 30 25 *
Hours Worked per Week
42
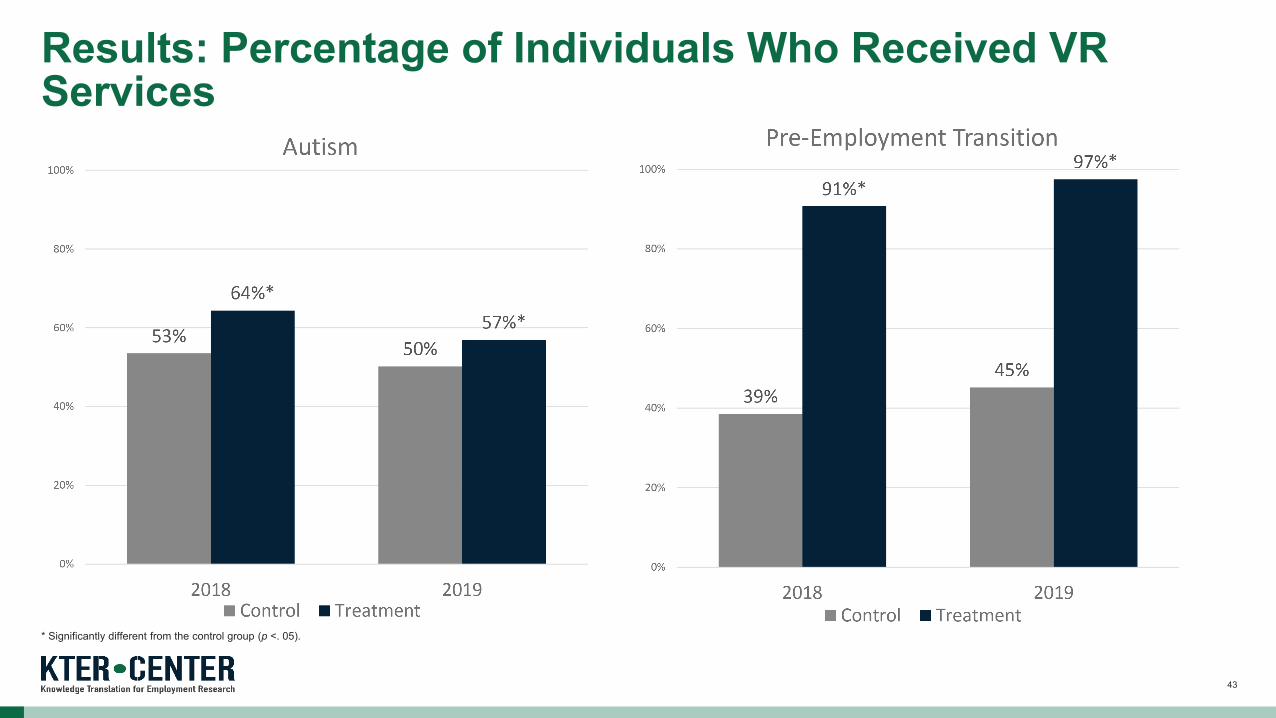
Results: Percentage of Individuals Who Received VR Services
43
* Significantly different from the control group (p <. 05).
2018 2019 Control Treatment Control Treatment
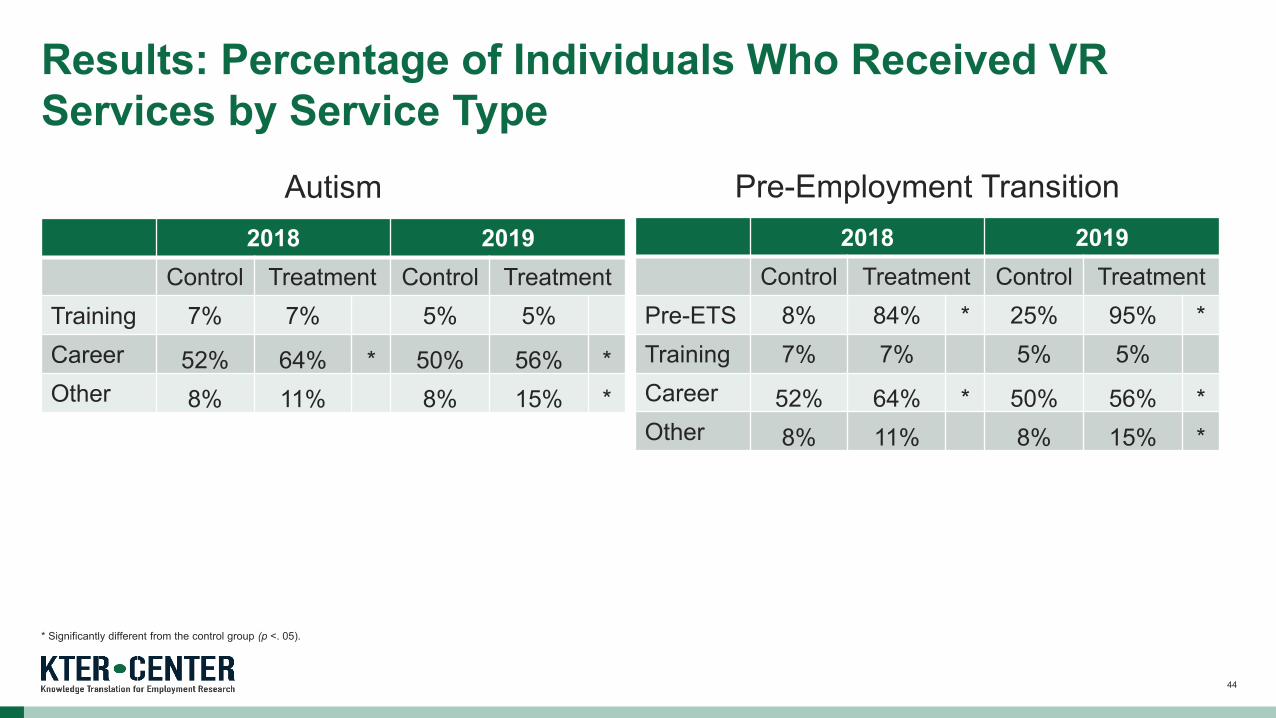
Training 7% 7% 5% 5% Career 52% 64% * 50% 56% * Other 8% 11% 8% 15% *
Results: Percentage of Individuals Who Received VR Services by Service Type
Autism 2018 2019
Control Treatment Control Treatment Pre-ETS 8% 84% * 25% 95% * Training 7% 7% 5% 5% Career 52% 64% * 50% 56% * Other 8% 11% 8% 15% *
Pre-Employment Transition
44
* Significantly different from the control group (p <. 05).
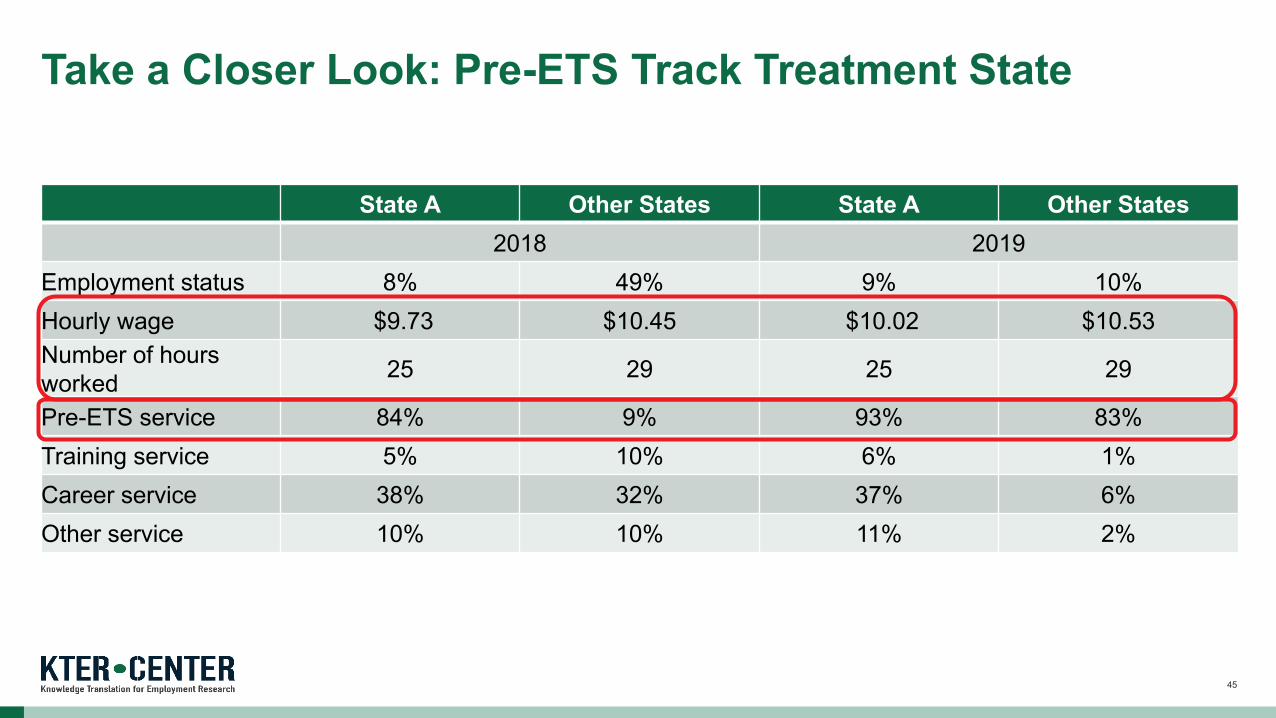
State A Other States State A Other States 2018 2019
Employment status 8% 49% 9% 10% Hourly wage $9.73 $10.45 $10.02 $10.53 Number of hours worked 25 29 25 29
Pre-ETS service 84% 9% 93% 83% Training service 5% 10% 6% 1% Career service 38% 32% 37% 6% Other service 10% 10% 11% 2%
Take a Closer Look: Pre-ETS Track Treatment State
45
For both tracks, the percentage of employed individuals was higher for the control states for both years.
No significant difference occurred in the hourly wage and the number of hours worked per week for the autism track.
Hourly wage and number of hours worked per week was higher for the control states for both years.
Any significant differences are not likely related to the study treatment.
Summary: Employment Outcome
46
For both years, the percentage of individuals who received VR services was higher for the treatment states.
For the autism track, the percentage of individuals who received career services was higher for the treatment states.
For the Pre-ETS track, the percentage of individuals who received Pre-ETS and career services was higher for the treatment states.
Causal conclusion should not be made even with some significant differences.
Summary: VR Services
47
Unable to conduct across-year comparisons.
Unable to link individuals served by the VR counselors whose supervisor participated in the study.
Potential spillover effects.
Using extant data (e.g., caseload data that state agencies collect, not data our research team itself collected).
Potential data entry errors/outliers could not be verified.
Limitations
48
Although employment outcomes may be more difficult to change, the service delivery practice seems changeable, with strong emphasis from state agency leadership and VR supervisors to use evidence-based practices.
Proper data collection and analysis can better inform how to improve VR services.
Implications
49
Contact Information, Evaluation and Disclaimer
For more information, please contact: Kathleen M. Murphy, PhD Principal Researcher, AIR Email: [email protected] Phone: 512-391-6541
Evaluation: https://survey.alchemer.com/s3/6089023/Evaluation-KTER-Knowledge-Brokering-and-VR-Webcast
The contents of this presentation were developed under grant number 90DP0077 from the National Institute on Disability, Independent Living, and Rehabilitation Research (NIDILRR). NIDILRR is a Center within the Administration for Community Living (ACL), Department of Health and Human Services (HHS). The contents do not necessarily represent the policy of NIDILRR, ACL, HHS, and you should not assume endorsement by the Federal Government.
50


