Embed Size (px)
Citation preview
Proceedings of the 2nd International Conference on Civil Engineering for Sustainable Development (ICCESD-2014), 14~16 February 2014, KUET, Khulna, Bangladesh
COMPUTATION OF DISCHARGE AND FLOW PARAMETERS IN LOWER MEGHNAESTUARY USING A ONE DIMENSIONAL UNSTEADY FLOW MODEL
Ali Mohammad Rezaie 1, Sumaiya1, Shah Alam1 , Ishtiaq Ahmed1, Hafez Ahmed1,Md. Nurul Kadir1 Muhammad Khalid Bin Siddique1, Mansur Ali Jisan1, Anisul
Haque2, Munsur Rahman2
1 Research Associate, Institute of Water and Flood Management (IWFM), BUET, Dhaka-1000,Bangladesh [email protected]
2Professor, Institute of Water and Flood Management (IWFM), BUET, Dhaka-1000, [email protected]
ABSTRACTThe Ganges-Brahmaputra-Meghna (GBM) delta is one of the most dynamic tide dominated delta inthe world. The huge flow generated in the upper catchment of the GBM basin is passing through theestuarine systems of the GBM delta. The particular features of these estuarine systems arecharacterized by extreme flow concentration in one single estuary, the Lower Meghna Estuary. Morethan 80% of the total flow of the entire GBM basin is passing through the Lower Meghna estuary(Rahman et al, 2013)*. Due to highly dynamic nature and huge flow volume, it is difficult to measurethe discharge in the Lower Meghna estuary. Till now, there is no measuring station and no reliableestimate of total flow volume which is passing through the Lower Meghna estuary. This also createsproblem when a full dynamic model (2D horizontal or 3D) needs to be applied to study the dynamicsof the estuarine systems of the GBM delta. In this study, a 1D dynamic model (HEC RAS unsteady) isapplied to compute the discharge in the Lower Meghna estuary. In the schematized model network,all the major rivers of the delta are included that contribute flow to the Lower Meghna estuary. Themodel is validated using measured water level available in the major rivers including the LowerMeghna estuary. The model can be used to generate the temporal variation of total discharge andthe flow volume passing through the Lower Meghna estuary for different upstream flooding scenario.The model can also be extended to compute the flow distribution in the other estuaries of the GBMestuarine systems including the flow contributing channels of the Sundarban systems. These will beextremely useful as measured discharges are not available in most of the channels in this regionbecause of the existing physical barriers in the Sundarban systems. The generated data can be usedas upstream boundary conditions in full 2D or 3D dynamic models.
Keywords: Ganges-Brahmaputra-Meghna, Estuarine systems, Flow volume, Lower Meghna, 1D model, Discharge
1. INTRODUCTIONThe Ganges–Brahmaputra–Meghna (GBM) river system is the third largestfreshwater outlet to the world’s oceans; it is exceeded only by the Amazonand the Congo rivers (Coleman, 1967). The Brahmaputra and Ganges encompassa number of countries in the South Asian region, including China, India,Nepal, and Bangladesh. The Brahmaputra, after travelling about 1800 kmthrough Tibet and India, enters northern Bangladesh through the northernborder; the Ganges flows for about 2000 km through India, and entersthrough the western side of Bangladesh. The headwaters of both the Ganges
2nd International Conference on Civil Engineering for Sustainable Development (ICCESD-2014)
River and the Brahmaputra River originate in the Himalayan mountain rangein China. The Ganges River flows southwest into India and then turnssoutheast, being joined by many tributaries. After flowing into Bangladesh,the Ganges, Brahmaputra and Meghna rivers join and flow into the Bay ofBengal as the Meghna River, particularly known as Lower Meghna River.Combined flow of these major rivers is drained through Lower Meghna Riverinto the Bay of Bengal via Lower Meghna Estuarine system. The estuary hasChittagong at the eastern side where in the north it has Noakhali. Togetherwith Tetulia River at the west of it, they formed the eastern estuarinesystem (Rahman et al, 2013).
The discrete flow dynamics of this river has made its coastal and estuarinesystem dynamic. Also, this region has diverse ecosystem resources includingthe Sundarban Mangrove forest. The functioning of these ecosystem resourceslargely depend on the water availability contributed by the complexestuarine networks of the region. The water discharge of this estuary isthe third highest, of all river systems in the world (Milliman, 1991) andthe sediment discharge from the Lower Meghna River is the highest (Coleman,1969). The knowledge on the physical processes and morpho-dynamics of thisriver is still inadequate though its high exposure to rapid erosion-accretion patterns and coastal hazards. Previous studies anticipated themorpho-dynamic characteristics of the river but due to insufficientdischarge stations over this estuarine system and lack of satisfactoryobserved data, there are only a few locations where we know the flow volumeand discharge carried down by Lower Meghna River.
2
2nd International Conference on Civil Engineering for Sustainable Development (ICCESD-2014)
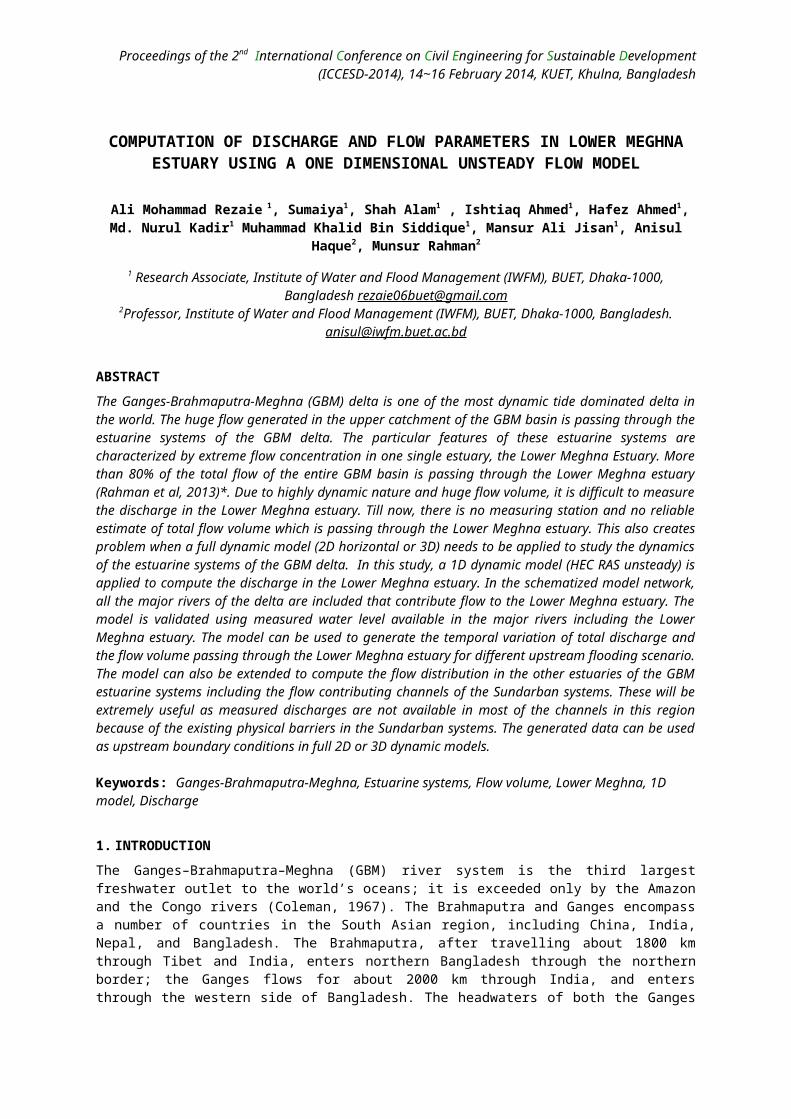
Figure 1: Map of the estuarine systems highlighting the Lower MeghnaEstuary and Chandpur location
So far available information is not adequate to have a detailedunderstanding of the flow dynamics and freshwater distribution in theseestuarine systems. Although Lower Meghna Estuary is the main drainage routeof the huge flow volume generated in the upstream catchment, no measureddischarge data is available in this estuary. Model studies are availableindicating flow distribution among different channels inside Meghna estuary(MES, 2001). But seasonal variation of flow volume in different floodingconditions (average, wet and dry) among this estuarine system is still notavailable. In this study a one dimensional numerical model (HEC RASunsteady) has been applied in the estuary of to analyze the discharge andflow volume in the Meghna estuary. However, because of the high populationdensity along the floodplain areas, discharge and flow volume computationare also necessary to delineate the present scenario as well as predict thefuture. There were several attempts of applying models of differentcomplexities in this region, i.e., 1D model (Chowdhury and Haque, 1988;
3
2nd International Conference on Civil Engineering for Sustainable Development (ICCESD-2014)
Islam and Chowdhury, 2002), 2D model (MES, 2001, Rahman et al. 2013) and 3Dmodel (Hussain, 2009). 1D models are useful for volumetric analysis, 2Dmodels for horizontal flow and transport fields and 3D models for complexsecondary current interactions. As this study focuses mainly on thevolumetric analysis, a 1D model is used. The study aims at analyzing thetemporal pattern of discharge variation and the volumetric flowdistribution among the Lower Meghna River.
2. THE HEC RAS UNSTEADY MODELDeveloped by the U.S. Army Corps of Engineers, HEC-RAS allows users toperform one-dimensional steady and unsteady flow calculations (HEC, 2002).In a HEC-RAS unsteady state simulation, water surface profiles are computedfrom one cross-section to the next by solving the standard step iterativeprocedure to solve the energy equation. The unsteady version of the HECRAS solves the St. Venant’s equations of mass and momentum conservation(HEC RAS, 2010). The energy equation is intended to calculate water surfaceprofiles for unsteady gradually varied flow. The numerical solution isperformed by using implicit finite difference method. The model canaccommodate branching of river networks with multiple junctions. The modelrequires upstream and downstream boundary conditions and detailedbathymetry of the river network. Time series of discharge has to bespecified as the upstream boundary condition and time series of water levelhas to be specified as the downstream boundary condition.
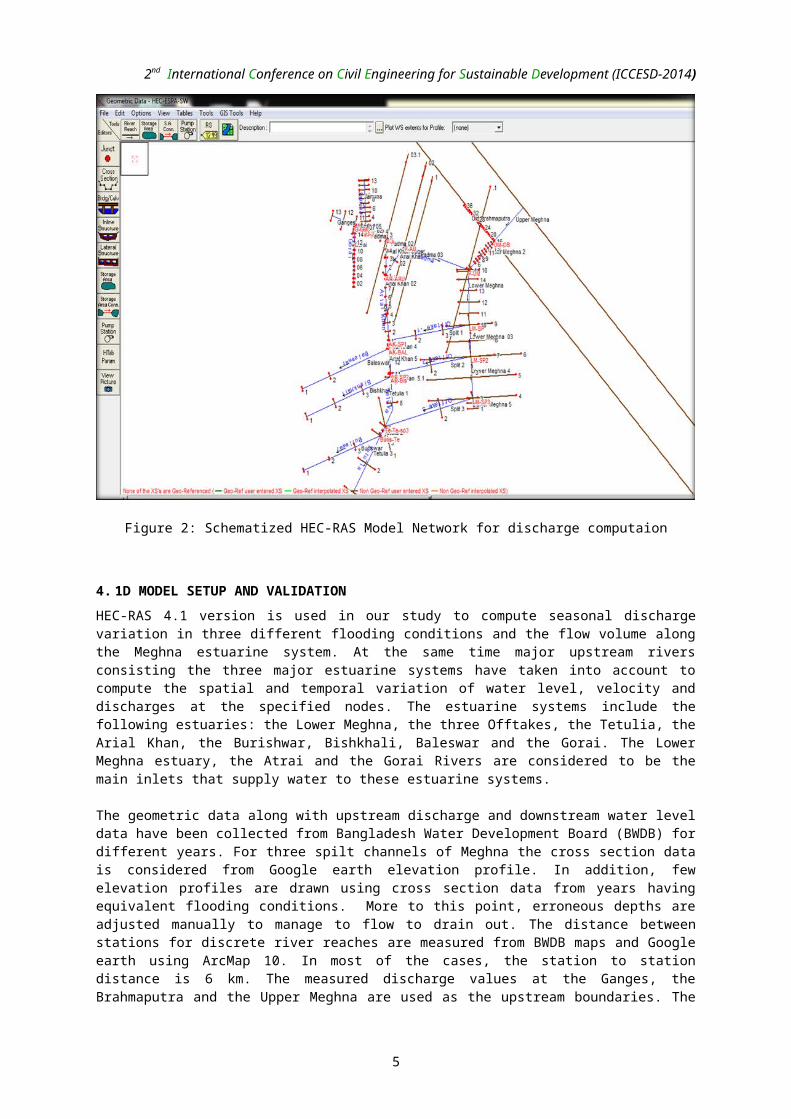
3. SCHEMATIZED REACH OF THE MODEL DOMAINThe estuarine network in the model domain is constructed based on thesignificance of the channels in the estuarine systems and availability ofthe cross section data. All the major rivers namely the Ganges, the Jamuna,the Old Brahmaputra, the Padma, the Upper Meghna and the Lower Meghna areincluded in the model network. The major distributaries in the estuarinesystems, the Gorai River and the Arial Khan River are also included in theschematized network.
The three important spill channels from the Lower Meghna estuary thatdischarges into the CES along with the Tetulia estuary are in the network.Buriswar estuary is a part of the CES and emerges from the Tetulia estuary.This estuary is included in the model network as a spill channel to accountits flow contribution to the CES. The schematized river and estuarinenetwork in the model domain is shown in Figure 2.
4
2nd International Conference on Civil Engineering for Sustainable Development (ICCESD-2014)
Figure 2: Schematized HEC-RAS Model Network for discharge computaion
4. 1D MODEL SETUP AND VALIDATIONHEC-RAS 4.1 version is used in our study to compute seasonal dischargevariation in three different flooding conditions and the flow volume alongthe Meghna estuarine system. At the same time major upstream riversconsisting the three major estuarine systems have taken into account tocompute the spatial and temporal variation of water level, velocity anddischarges at the specified nodes. The estuarine systems include thefollowing estuaries: the Lower Meghna, the three Offtakes, the Tetulia, theArial Khan, the Burishwar, Bishkhali, Baleswar and the Gorai. The LowerMeghna estuary, the Atrai and the Gorai Rivers are considered to be themain inlets that supply water to these estuarine systems.
The geometric data along with upstream discharge and downstream water leveldata have been collected from Bangladesh Water Development Board (BWDB) fordifferent years. For three spilt channels of Meghna the cross section datais considered from Google earth elevation profile. In addition, fewelevation profiles are drawn using cross section data from years havingequivalent flooding conditions. More to this point, erroneous depths areadjusted manually to manage to flow to drain out. The distance betweenstations for discrete river reaches are measured from BWDB maps and Googleearth using ArcMap 10. In most of the cases, the station to stationdistance is 6 km. The measured discharge values at the Ganges, theBrahmaputra and the Upper Meghna are used as the upstream boundaries. The
5
2nd International Conference on Civil Engineering for Sustainable Development (ICCESD-2014)
measured water levels at the most seaward limits of the Lower Meghnaestuary, the Tetulia estuary, the Burishwar estuary, the Bishkhali estuary,the Baleswar estuary and the Gorai River are used as the downstreamboundaries of the model. The initial flow conditions are set using openingdishcage value in respective rivers.
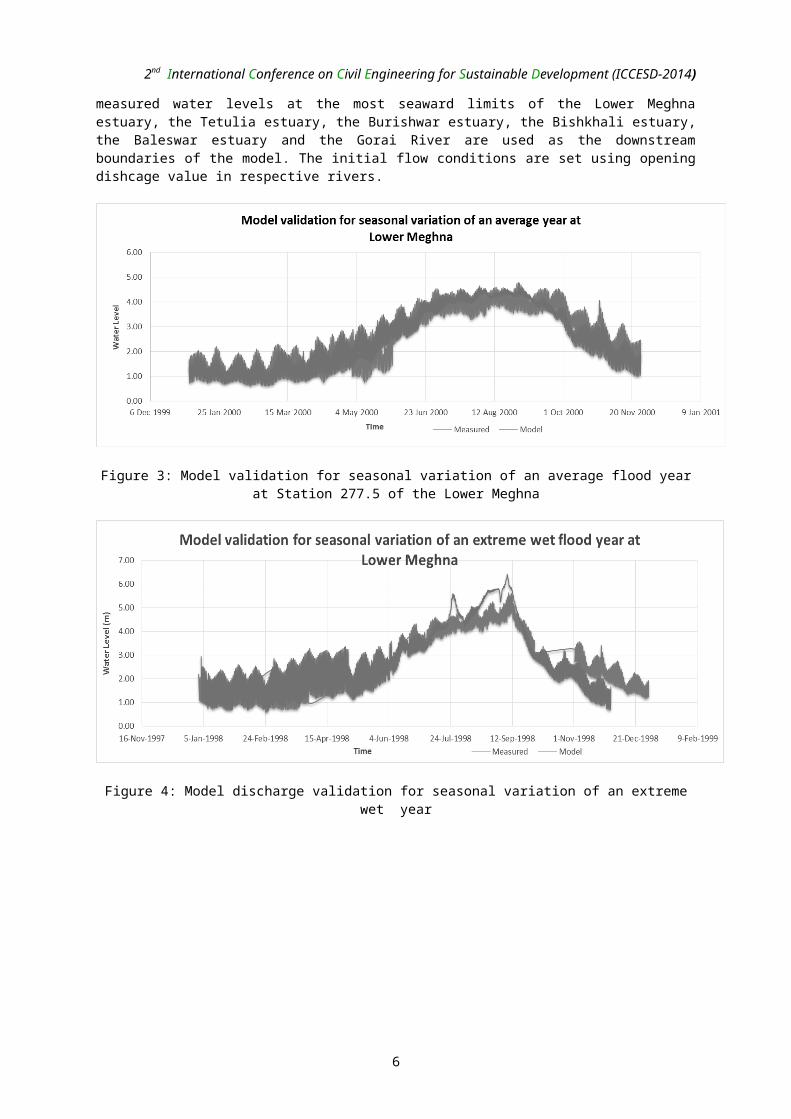
Figure 3: Model validation for seasonal variation of an average flood yearat Station 277.5 of the Lower Meghna
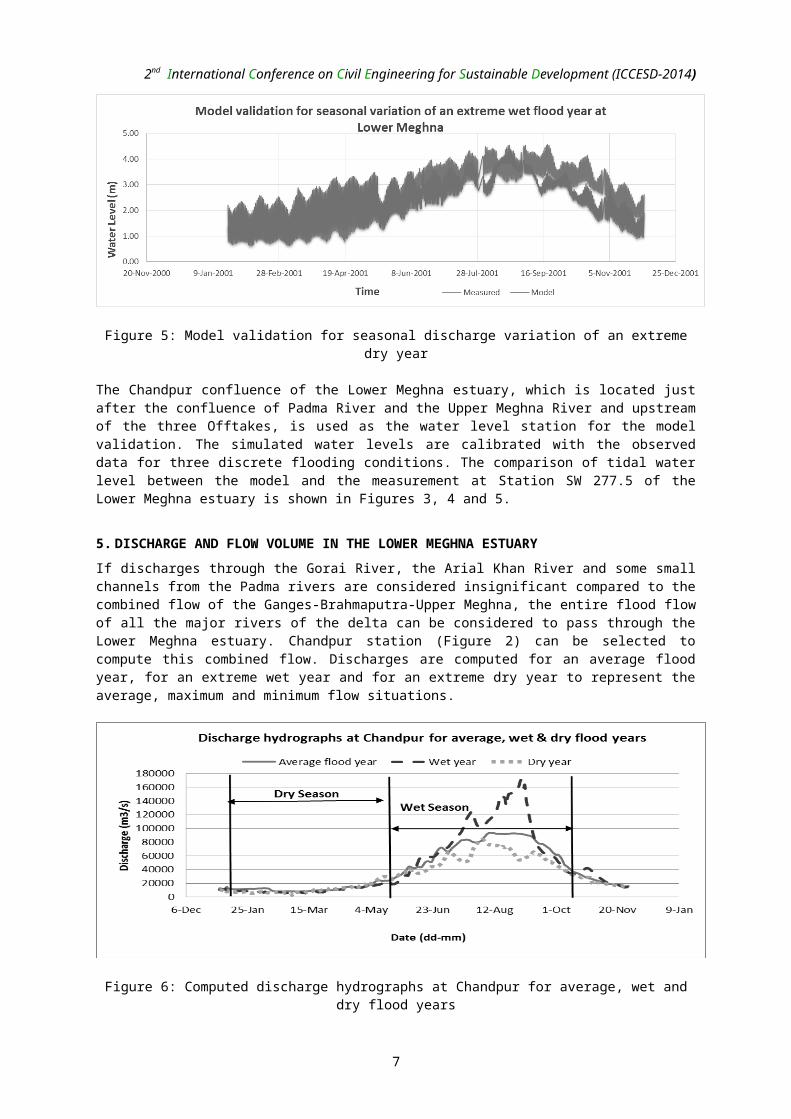
Figure 4: Model discharge validation for seasonal variation of an extremewet year
6
2nd International Conference on Civil Engineering for Sustainable Development (ICCESD-2014)
Figure 5: Model validation for seasonal discharge variation of an extremedry year
The Chandpur confluence of the Lower Meghna estuary, which is located justafter the confluence of Padma River and the Upper Meghna River and upstreamof the three Offtakes, is used as the water level station for the modelvalidation. The simulated water levels are calibrated with the observeddata for three discrete flooding conditions. The comparison of tidal waterlevel between the model and the measurement at Station SW 277.5 of theLower Meghna estuary is shown in Figures 3, 4 and 5.
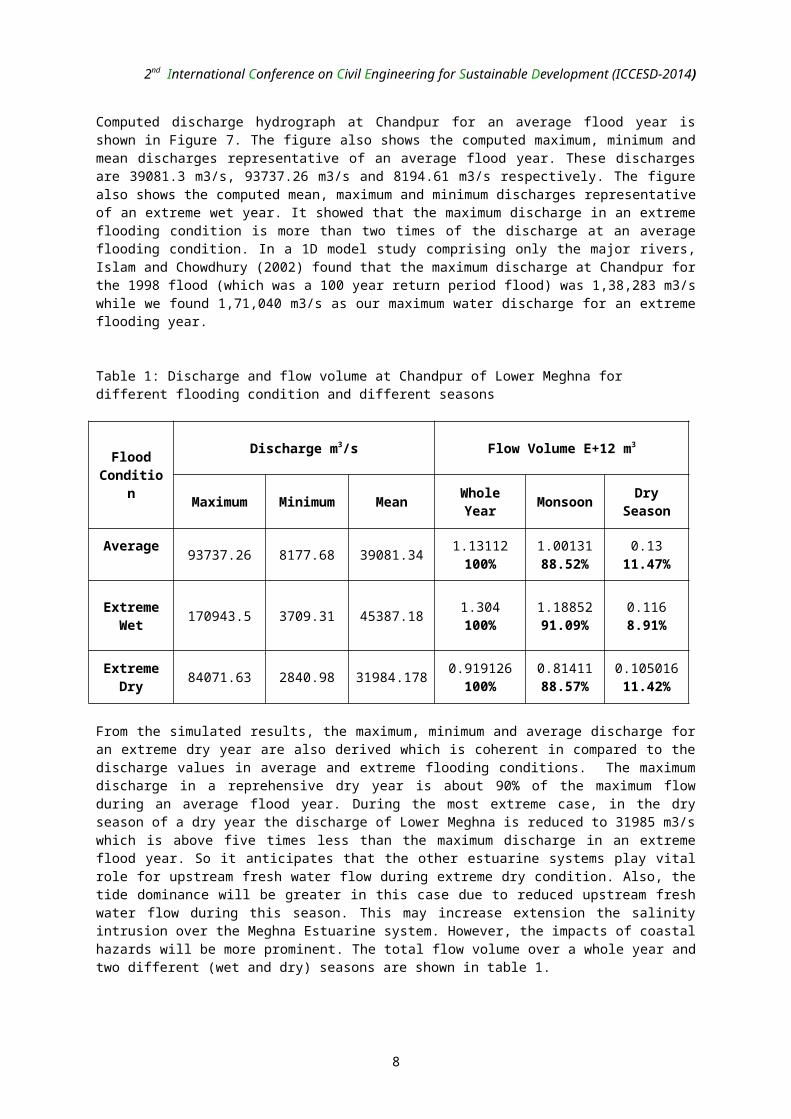
5. DISCHARGE AND FLOW VOLUME IN THE LOWER MEGHNA ESTUARYIf discharges through the Gorai River, the Arial Khan River and some smallchannels from the Padma rivers are considered insignificant compared to thecombined flow of the Ganges-Brahmaputra-Upper Meghna, the entire flood flowof all the major rivers of the delta can be considered to pass through theLower Meghna estuary. Chandpur station (Figure 2) can be selected tocompute this combined flow. Discharges are computed for an average floodyear, for an extreme wet year and for an extreme dry year to represent theaverage, maximum and minimum flow situations.
Figure 6: Computed discharge hydrographs at Chandpur for average, wet anddry flood years
7
2nd International Conference on Civil Engineering for Sustainable Development (ICCESD-2014)
Computed discharge hydrograph at Chandpur for an average flood year isshown in Figure 7. The figure also shows the computed maximum, minimum andmean discharges representative of an average flood year. These dischargesare 39081.3 m3/s, 93737.26 m3/s and 8194.61 m3/s respectively. The figurealso shows the computed mean, maximum and minimum discharges representativeof an extreme wet year. It showed that the maximum discharge in an extremeflooding condition is more than two times of the discharge at an averageflooding condition. In a 1D model study comprising only the major rivers,Islam and Chowdhury (2002) found that the maximum discharge at Chandpur forthe 1998 flood (which was a 100 year return period flood) was 1,38,283 m3/swhile we found 1,71,040 m3/s as our maximum water discharge for an extremeflooding year.
Table 1: Discharge and flow volume at Chandpur of Lower Meghna for different flooding condition and different seasons
FloodConditio
n
Discharge m3/s Flow Volume E+12 m3
Maximum Minimum Mean WholeYear Monsoon Dry
Season
Average 93737.26 8177.68 39081.34 1.13112100%
1.0013188.52%
0.1311.47%
ExtremeWet 170943.5 3709.31 45387.18 1.304
100%1.1885291.09%
0.1168.91%
ExtremeDry 84071.63 2840.98 31984.178 0.919126
100%0.8141188.57%
0.10501611.42%
From the simulated results, the maximum, minimum and average discharge foran extreme dry year are also derived which is coherent in compared to thedischarge values in average and extreme flooding conditions. The maximumdischarge in a reprehensive dry year is about 90% of the maximum flowduring an average flood year. During the most extreme case, in the dryseason of a dry year the discharge of Lower Meghna is reduced to 31985 m3/swhich is above five times less than the maximum discharge in an extremeflood year. So it anticipates that the other estuarine systems play vitalrole for upstream fresh water flow during extreme dry condition. Also, thetide dominance will be greater in this case due to reduced upstream freshwater flow during this season. This may increase extension the salinityintrusion over the Meghna Estuarine system. However, the impacts of coastalhazards will be more prominent. The total flow volume over a whole year andtwo different (wet and dry) seasons are shown in table 1.
8
2nd International Conference on Civil Engineering for Sustainable Development (ICCESD-2014)
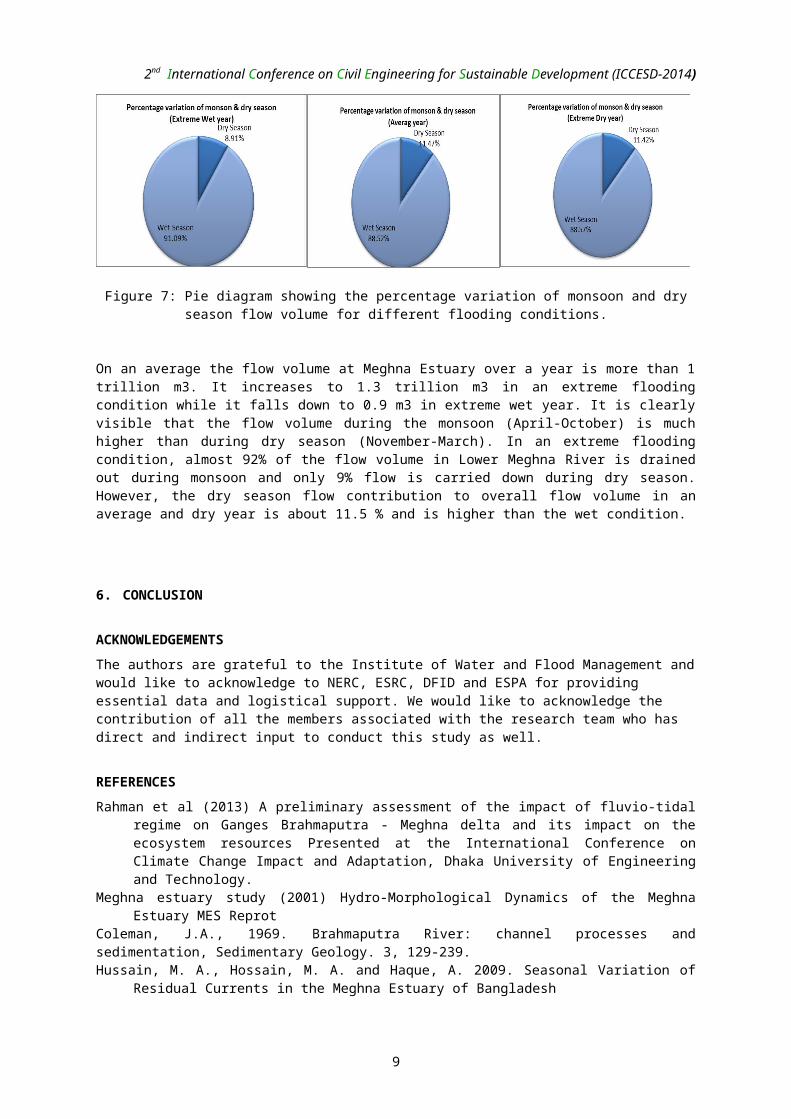
Figure 7: Pie diagram showing the percentage variation of monsoon and dryseason flow volume for different flooding conditions.
On an average the flow volume at Meghna Estuary over a year is more than 1trillion m3. It increases to 1.3 trillion m3 in an extreme floodingcondition while it falls down to 0.9 m3 in extreme wet year. It is clearlyvisible that the flow volume during the monsoon (April-October) is muchhigher than during dry season (November-March). In an extreme floodingcondition, almost 92% of the flow volume in Lower Meghna River is drainedout during monsoon and only 9% flow is carried down during dry season.However, the dry season flow contribution to overall flow volume in anaverage and dry year is about 11.5 % and is higher than the wet condition.
6. CONCLUSION
ACKNOWLEDGEMENTSThe authors are grateful to the Institute of Water and Flood Management andwould like to acknowledge to NERC, ESRC, DFID and ESPA for providing essential data and logistical support. We would like to acknowledge the contribution of all the members associated with the research team who has direct and indirect input to conduct this study as well.
REFERENCESRahman et al (2013) A preliminary assessment of the impact of fluvio-tidal
regime on Ganges Brahmaputra - Meghna delta and its impact on theecosystem resources Presented at the International Conference onClimate Change Impact and Adaptation, Dhaka University of Engineeringand Technology.
Meghna estuary study (2001) Hydro-Morphological Dynamics of the MeghnaEstuary MES Reprot
Coleman, J.A., 1969. Brahmaputra River: channel processes andsedimentation, Sedimentary Geology. 3, 129-239.Hussain, M. A., Hossain, M. A. and Haque, A. 2009. Seasonal Variation of
Residual Currents in the Meghna Estuary of Bangladesh
9
2nd International Conference on Civil Engineering for Sustainable Development (ICCESD-2014)
HEC-RAS Applications Guide (2010) Hydrologic Engineering Center US ArmyCorpsIslam, A.K.M.S. and Chowdhury, J.U. Hydrological Characteristics of the
1998 Flood in Major Rivers.Bangladesh Water Development Board Meghna Estuary Study, Volume 1: Main
ReportChowdhury and Haque, 1988. Numerical Simulation of Tides and Saline Water
Intrusion in the Meghna DeltaRajib Kamal, M. A. Matin, Sharmina Nasreen, 2013. Response of river flow
regime to various climate change scenarios in Ganges-Brahmaputra-Meghna basin.
M. A. Hussain, Y. Tajima, Y. Taguchi and K. Gunasekara, 2013. TidalCharacteristics Affected by Dynamic Morphology Change in the MeghnaEstuary.
AQUASTAT Survey, 2011. Irrigation in Southern and Eastern Asia in figures.Chowdhury R. & Ward N. 2004. Hydro-Meteorological variability in the
greater Ganges-Brahmaputra-Meghna basins.Junaid A. Salek, 1996. Negative Surges in the Meghna Estuary in
Bangladesh.Aaron C. Cook, 2008. Comparison of one-dimensional HEC-RAS with two-
dimensional FESWMS model in flood inundation mapping.Maminul H. Sarker, 2010. Impact of climate change on river and estuary
morphology and its consequences.W. Bauwens and J. J. Peters, 2008. Morphological and hydrodynamic
investigation on the confluence of the Padma-Meghna River and itsdownstream part up to Chandpur, Bangladesh.
10


