Embed Size (px)
Citation preview
Occupational Exposure to Vegetable Dust affects Lung Functions
58 January 2013 International Journal of Health and Rehabilitation Sciences Volume 2 Issue 1
ORIGINAL RESEARCH A Cross Sectional Study of Respiratory Symptoms
and Spirometry in Adults Exposed to Bio aerosol
in Vegetable Market in India
Geeta Kurhade, Arvind Kurhade, Mrunal S Phatak, Youssef Farid Dr. Geeta Kurhade is Senior
Lecturer, Physiology unit,
Department of Preclinical
Science, University of West
Indies, St Augustine campus,
Trinidad and Tobago.
Dr. Arvind Kurhade is
Lecturer, Microbiology Unit,
Department of Para Clinical
Sciences, EWMSC, Mt.Hope,
University of West Indies, St
Augustine campus, Trinidad
and Tobago.
Dr. Mrunal S Phatak is
Professor and Head,
Department of Physiology,
IGGMC, Nagpur,
Maharashtra, India.
Dr. Youssef Farid is
Lecturer, Physiology unit,
Department of Preclinical
Science, University of West
Indies, St Augustine campus,
Trinidad and Tobago.
Corresponding Author:
Dr. Geeta Kurhade
E-mail:
www.ijhrs.com
Background: Bio aerosol pollution of workplace environment mainly affects the airways
and mucous membrane many times culminating in respiratory distress and COPD. This
causes increased morbidity and loss of work hours for the affected individuals.
Objective: To estimate the prevalence of respiratory symptoms and lung functions in
individuals exposed to mixed bio aerosols in a vegetable market and to test the association of
age of an individual with various lung function tests.
Materials and Methods: Bio aerosol characteristics of air in the market were analysed by
Reusable Aluminium Two Stage Viable Anderson Cascade Impactor. Spirometry with
American Thoracic Society (ATS) standards was done in non-smoker 640 individuals; 210
individuals exposed to dust and 430 individuals living around the same area but not exposed
to dust. According to age 2 groups were made. Group A (20-30years) having 110 exposed
and 220 unexposed individuals .Group B (31-40years) having 100 exposed and 210
unexposed individuals. Spirometry results were compared between 2 groups using SPSS
software version 16.0.2 for student’s t test and F test to test the statistical significance at
p < 0.05 and confidence interval of 95%.
Results: The bio aerosol analysis revealed high level of polluting microbial components. In
exposed individuals compared to unexposed individuals prevalence of respiratory symptoms
was significantly high (p<0.05) and spirometry demonstrated significant reduction in Forced
Vital Capacity (FVC), Forced Expiratory Volume in 1 second (FEV1), Forced Expiratory
Flow at 25% - 75% Vital Capacity (25% -75%) and Peak Expiratory Flow Rate
(PEFR).There was significant positive correlation between age and decrease in all the
recorded spirometry parameters (p<0.05).
Conclusion: Occupational exposure to mixed organic dust is associated with significantly
higher respiratory symptoms and decreased spirometric values necessitating medical
attention. So there is need of preventive measures and health education in this population.
Keywords: Environmental vegetable dust, Bio aerosol, Occupational exposure, Respiratory
symptoms, Spirometry

Occupational Exposure to Vegetable Dust affects Lung Functions
59 January 2013 International Journal of Health and Rehabilitation Sciences Volume 2 Issue 1
INTRODUCTION Occupational exposure to vegetable dust
with a high quantity of inhalable particles and its
effect on respiratory system has been
investigated in many populations 1-6
. Louis
Pasteur described the first measurements of
airborne microorganisms in 1861. A century
later, the inhalation of spores from thermophilic
microorganisms was shown to induce attacks of
farmers' lung in patients with this disease, while
endotoxins originating from Gram-negative
bacteria were identified as causal agents for
byssinosis in cotton workers. Further
epidemiological and toxicological studies have
demonstrated inflammatory, respiratory, and
pathogenic effects following exposure to bio
aerosols. Exposure assessment is often
confounded by the diversity of bio aerosol
agents in the environment 7.
The bio load of such dust could include
contaminants such as bacteria, fungi, pollen,
insects and all grades of respiratory tract
infection may follow the long term exposure.
Constant inflammatory states in the lung may
eventually lead to tissue damage of smallest
bronchi and bronchioles followed by fibrosis,
with increased thickness of the walls resulting in
changes in airways resistance to produce
obstruction in the airways and respiratory
deficit7.
Although the World Health
Organisation has predicted that occupational
respiratory diseases will become the third
leading cause of death by 2020 8, little work has
been done to examine this problem in India
known for its agriculture based economy where
the population is more exposed to polluted,
mixed organic dust and only few studies have
characterized the composition of the microbial
flora of such dust9.
According to the ministry of health and
family welfare, India has 17 million persons
living with chronic obstructive pulmonary
disease, a number that is estimated to rise to 22
million by 201610
.The Out Patient Department
of three Medical institutions in the Nagpur,
Central India had noticeable number of patients
with different respiratory complaints and history
of occupation in the overcrowded busy
vegetable market. The dust in this particular
market place is a mixture of raw vegetable
material including tea, coffee, spices, grains and
other components such as wet and dry animal
excreta, fungi, bacteria the Inhalation of which
may expose workers to risks from infection,
allergy and may cause a variety of harmful
effects in the airways.
Given the significant number of
patients with respiratory complaints presenting
to the local hospitals from the vegetable ‘Cotton
market’, Nagpur; we conducted this cross
sectional study of the respiratory symptoms and
lung function of persons working there and
compared the results with biometrically matched
controls who were visiting and only occasionally
exposed to mixed bio aerosols. We also
evaluated the air quality of the market in terms
of microbes and suspended particulate matter
(SPM). The lung function tests were associated
with age of subjects.
MATERIALS AND METHODS
In this cross sectional study conducted
in summer 2009; after obtaining clearance from
Institutional Ethics committee, total 680 male
subjects in 20-40 years age group were
registered. Informed written consent was taken
from all the subjects. Those with history of
smoking, cardiovascular disease, beta blocker
usage; and those with poor cooperation and
those with unacceptable spirogram were
excluded. Finally 640 subjects completed the
study which included 210 subjects exposed to
mixed vegetable dust for 2-18 years and 430
age, weight and height matched randomly
selected unexposed controls using the same
exclusion criteria. No participants had any
contraindication for spirometry.
Air sampling and bio load analysis of the air Air sampling was done weekly for five
months during the months of March to July 2009
using reusable aluminium two stage Viable
Andersen Cascade Impactor (The Thermo
Scientific company, USA, Thermo Fisher
Scientific India Pvt. Ltd, Pawai, Mumbai , India) 11-12
operated at one meter height from the
ground extramurally for two minutes at the site.
The instrument was sterilised before use and
calibrated for flow rate at 28.3L/min.
Occupational Exposure to Vegetable Dust affects Lung Functions
60 January 2013 International Journal of Health and Rehabilitation Sciences Volume 2 Issue 1
Microbe’s analysis The microbiology department of
Government Medical College, Nagpur processed
and studied the biotic components. Tryptone
Glucose Yeast Extract (TGYE), Agar medium
plate was used on the upper stage of the sampler
for the enumeration and isolation of total viable
types of bacterial population present in air.
Eosin Methylene Blue (EMB) Agar Medium (Hi
Media) media plate was used on lower stage of
the sampler for gram- negative enteric bacteria
to find out the inhalable amount. Processing of
samples was done by serial dilution technique
(10-2 to 10-4) to get only a few cells per ml.
One ml of inoculums from each dilution poured
onto sterilized Petri plates of respective media
(TGYE & EMB) at 45 oC by using Pour plate
technique13
. Then plates were incubated at 37 ±
2oC for 24 to 48 hours. Total 83 types of isolates
were identified.
The level of bacterial contamination of
air is usually expressed in terms of number of
bacteria-carrying particles per m3 (bcp/m
3) or the
bio load (B). B is calculated from the following
equation:
B= 1000N/ RT
The colony-forming units are counted on the
sample plate, N is the number of colonies
counted on the sample plate, T is the duration of
the test in minutes and R is the air-sampling rate
in litres /min. Dose-response relationships have
not been established for most biological agents
and knowledge about threshold values is
sparse14
.
Common respiratory symptoms
Common respiratory symptoms were
recorded by simple interview using
questionnaire derived from other studies 15-16
and
results tabulated. One section of questionnaire
was completely devised to explore the frequency
and duration of exposure based on the detailed
history of the actual job. Spirometry was
performed in all subjects and controls from eight
to ten a.m.,in standing position and during the
same season using a calibrated Spirolab II
spirometer (MIR,Rome, Italy) following
American Thoracic Society (ATS) criteria 17
.Each individual repeated the maneuver three
to eight times to obtain 3 acceptable spirogram.
The spirogram with the highest value was used
for statistical analysis and interpretation.
Statistical Analysis The mean ± SD of predicted values with actual
values of spirometry results were compared
between the two age groups of subjects –with
each other and respective controls, using SPSS
version 16.0.2 software by application of
Student’s t test and F test. A 2-sided P value of
.05, with a confidence interval of 95%, was the
criterion for statistical significance. For some
data analysis X cell T Test and Free p-value
calculator for the student t test were used for
analysis18
.
RESULTS
Air analysis
The average suspended particulate
matter (SPM) and particulate matter (PM10)
levels exceeded Central Pollution Control Board
(CPCB) standards; 290 µg/m3 and 100 µg/m
3, as
compared to National Ambient Air Quality
Standards, 140 µg/m3 and 60 µg/m
3 respectively.
The pollution on this basis was labelled as
moderate 19
.
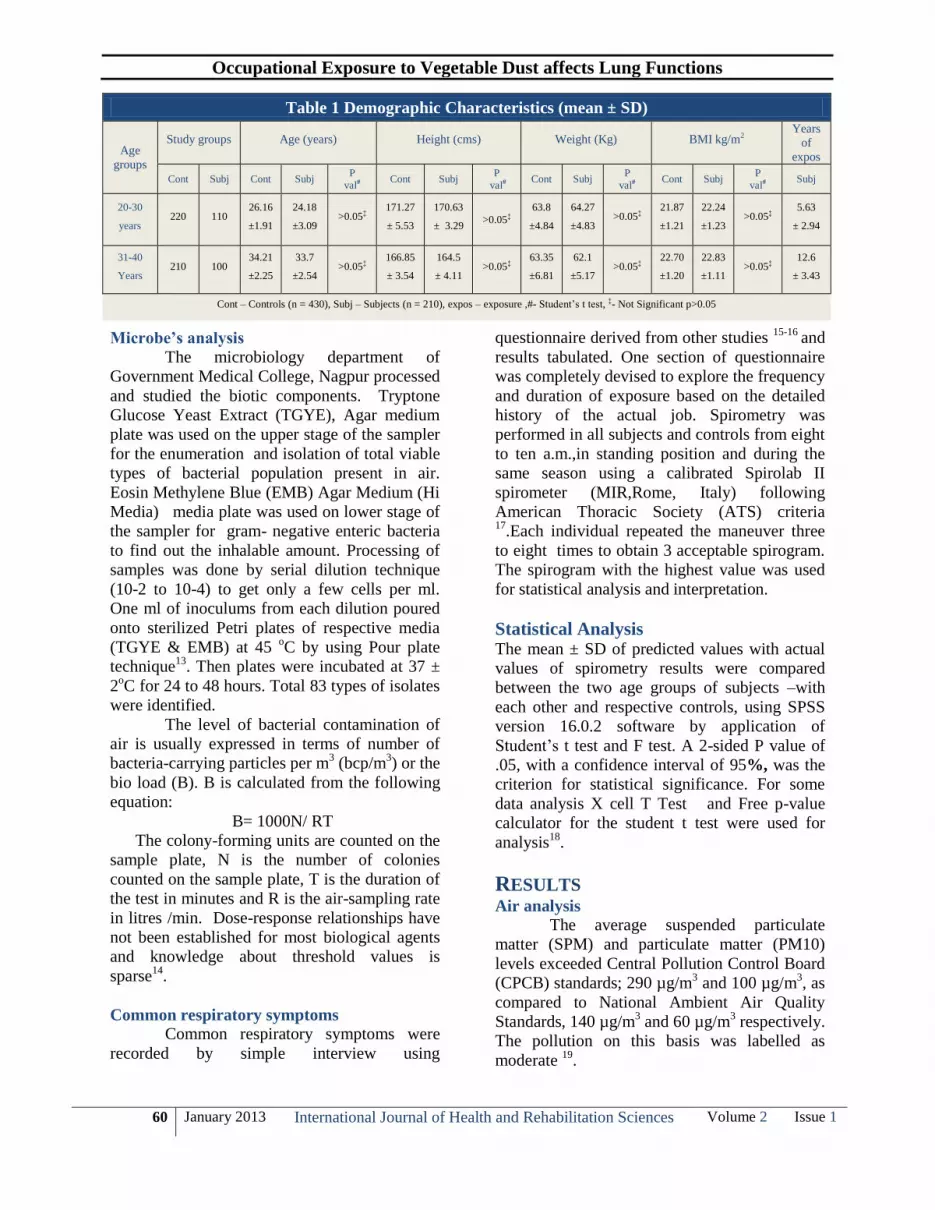
Table 1 Demographic Characteristics (mean ± SD)
Age
groups
Study groups Age (years) Height (cms) Weight (Kg) BMI kg/m2 Years
of
expos
Cont Subj Cont Subj P
val# Cont Subj
P
val# Cont Subj
P
val# Cont Subj
P
val# Subj
20-30
years 220 110
26.16
±1.91
24.18
±3.09 >0.05‡
171.27
± 5.53
170.63
± 3.29 >0.05‡
63.8
±4.84
64.27
±4.83 >0.05‡
21.87
±1.21
22.24
±1.23 >0.05‡
5.63
± 2.94
31-40
Years 210 100
34.21
±2.25
33.7
±2.54 >0.05‡
166.85
± 3.54
164.5
± 4.11 >0.05‡
63.35
±6.81
62.1
±5.17 >0.05‡
22.70
±1.20
22.83
±1.11 >0.05‡
12.6
± 3.43
Cont – Controls (n = 430), Subj – Subjects (n = 210), expos – exposure ,#- Student’s t test, ‡- Not Significant p>0.05

Occupational Exposure to Vegetable Dust affects Lung Functions
61 January 2013 International Journal of Health and Rehabilitation Sciences Volume 2 Issue 1
Total mean viable bacterial load was
1995.66 ± 1184.555 cfu/m3. Gram positive rod,
cocci, pleomorphic, Gram negative rod, vibrio,
filamentous, Gram negative/ positive
coccobacilli were grown. Filamentous bacteria
were maximum 38% followed by gram negative
rods (28%) and gram positive bacilli (23%).
The microbes culture demonstrated
presence of Citrobacter & Proteus including
Citrobacter freundii, Erwinia herbicola and
Escherichia coli, along with other gram-negative
bacteria i.e. Chryseomonas luteloa,.
Acinetobacter calcoaceticus, Pseudomonas
mendocina, Pseudomonas multophila and
Serratia plymuthica , Yersinia intermedia,
Escherichia (E. Coli), Providencia were also
reported. In one sewage water sample
Escherichia Coli, Vibrio carchariae, Vibrio.
diazotrophicus, Vibrio Metshnikovii were
demonstrated. Fungus reported were Aspergillus
fumigatus and Aspergillus flavus.
Spirometry Study group
The total six hundred and forty subjects
were classified in two groups.
Group A (20-30 years) comprised of
110 subjects (mean age 24.18±3.09
years) and 220 controls mean age
(26.16±1.91 years).
Group B (31-40 years) included 100
subjects (33.7±2.54 years) and 210
controls mean age (34.21±2.25 years).
Demographic characteristics of the groups
A and B of test group and controls matched for
age weight and height showed no significant
difference (Table 1). The mean duration of
exposure (directly working with or indirectly
passively exposed) in group A was 5.63 ± 2.94
years and that in group B 12.6 ± 3.43 years.
The prevalence of respiratory symptoms
in test group as compared to control group are
shown in Table 2. It is much higher and
statistically significant.
The results of spirometry in both the
groups A and B of subjects exposed to mixed
dust and in unexposed controls are shown in
Table 3. The results were compared in terms of
percent of predicted values of all spirometric
parameters. All the spirometric parameters
showed the decline in the percent difference
(between predicted and actual value).
In group A (age 20-30 years) the FVC,
FEV1, and FEV1/FVC, showed decline which
did not reach statistically significance; but
FEF25-75% and PEFR had very highly
significant decline statistically. All the
parameters with exception of FEV1/FVC had a
statistically significant decline when compared
to their controls.
In group B (age 31-40 years) the FVC,
and FEV1/FVC, showed decline which was not
statistically significant. The FEV1, FEF25-75%
and PEFR had very highly significant decline
statistically and 11% subjects were found to
have the findings of restrictive lung disease
Table 2 Incidence of Common Respiratory Symptoms in Past Three Months
Symptoms in Past 3 Months % of Subjects
(n=210)
% of Controls
(n=430)
p value
Frequent episodes of sneezing 18 5 <.001**
Fever 12 3 <.05*
Muscular aches 25 2 <.001**
A general unwell feeling (malaise) 35 4 <.0001
Dry cough 28 7 <.001**
Cough with phlegm / expectoration 22 4 <.001**
Shortness of breath 17 3 <.001**
Incidence of sore throat 30 3 <.0001**
Loss of appetite 43 5 <.0001**
Lack of energy 35 4 <.0001**
Failure to gain weight 14 5 <.001**
Consulted the physician for respiratory Symptoms
at least twice in last three months. 55 3 <.0001
**
**- Highly Significant p<0.001,
*- Significant p<0.05

Occupational Exposure to Vegetable Dust affects Lung Functions
62 January 2013 International Journal of Health and Rehabilitation Sciences Volume 2 Issue 1
(FEV1/FVC ≥ 70% and FVC <80%predicted) 20-
21. Very highly significant decline in all the
parameters was noted when group A was
compared to group B. Increased incidence of
respiratory symptoms in Group A could have
influence in the decline of lung function tests.
DISCUSSION In the present study we conducted the
analysis of the contaminated dust in terms of
suspended particulate matter and microbes; the
effect of exposure to such mixed vegetable dust
in terms of prevalent symptoms and lung
functions FVC, FEV1, FEV1/FVC, FEF25-75%
and PEFR in exposed Indian group and
compared them to matched controls in the two
age groups decade apart.
The descriptive cross sectional, random
sample study was conducted right at the work
place including spirometry just before or within
one hour of start of work shift. Disease and
exposure were ascertained simultaneously. This
study design was chosen because it was simple
and rapid in execution to provide rapid answers.
But the disadvantages were inability to study
exact etiology because the time sequence
between exposure and outcome could not be
ascertained; the study faced a high respondent
bias and over-representation of diseases of long
duration due to self reported health information.
We had no access to actual medical records of
these subjects.
The results of our study show decline in
all spirometric parameters especially in air flows
as shown by statistically very highly significant
decline in FEF25-75% and PEFR in the
exposed group when compared with the
unexposed group. The decline was more and
statistically very highly significant in group B
(age 31-40 years) and remained so when we
compared the younger age group A with elder B,
with longer duration of exposure and may
indicate involvement of medium and large
airways. Our subjects were not obese as per
Body mass index (BMI) calculations considering
that obesity is a potential common cause of
spirometric restriction 22
.
In a study 23
to assess exposure to
various constituents of organic dust generated
during the processing of hemp and
microbiological analysis of air quality
demonstrated significant bacterial and fungal
contamination in the air, so much that individual
identification of species was not possible.
In Australia a cross sectional study 24
of
1232 adult participants concluded that
occupational exposures to biological dusts were
associated with an increased risk of COPD
which was higher in women. In another study 25
240 workers of two Ukrainian fodder production
plants have been examined for respiratory
symptoms, lung function and bronchial
reactivity. In this study a comparison between
animal feed workers and internal controls
revealed work-related symptoms and lung
function effects predominantly indicating a
clinical picture related to chronic bronchitis.
Lung function clearly decreased with increasing
duration of employment. Obstruction of small
bronchi and bronchial hyper responsiveness
were the early signs of respiratory troubles in
exposed workers and may indicate involvement
of medium and large airways and on correlation
suggest that changes are the result of
inflammation and subsequent repair.
Table 3 Spirometry Results (% of predicted value) in the Study group (mean ± SD)
Parameter
Group A
(20-30 years) Group B
(31-40 years)
Subjects
(n= 110)
Control
(n= 220)
Subjects Vs
Control
P value#
Subjects
(n= 100)
Control
(n=210)
Subjects Vs
Control
P value#
Group A Vs
Group B
P value#
FVC 91.36 ±6.29 102.16 ±10.15 .05* 80.30±12.47 99.40±12.81 .473‡ 0.38‡
FEV1 % 90.5±7.44 102.72±9.66 .001** 91±9.4 102.42±11.11 .001** 0.001**
FEV1/FVC 102.90±3.26 100.61±4.32 .06‡ 109.1±6.77 97.64±4.66 .001** 0.05*
FEF25-75% 75.61±9.32 110.09±22.45 .02* 66.28±9.05 87.7±20.34 .000** 0.000**
PEFR 71.45±11.67 95.16±8.99 .0000** 67.14±12.17 93.2±11.33 .000** 0.05*
#- Student’s t test, **- Highly Significant p<0.001, *- Significant p<0.05, ‡- Not Significant p>0.05

Occupational Exposure to Vegetable Dust affects Lung Functions
63 January 2013 International Journal of Health and Rehabilitation Sciences Volume 2 Issue 1
A 5 year follow up study on 218
workers exposed to organic dust from
composting plants 26
showed accelerated decline
in FVC% and is associated with adverse acute
and chronic respiratory health effects. Our
subjects were non-smokers but some were
exposed to it passively. The order of severity of
the small airway disease (respiratory bronchioles
and membranous bronchioles) in non smoking
non agricultural workers; non smoking
agricultural workers (as our study group);
smoking non agricultural workers; smoking
agricultural workers have been studied27-28
.
In our study we observed reductions in
the FVC and/or the FEV1.
Disproportionate
reductions in the FEV1 as compared to the FVC
(and therefore the FEV1 -to-FVC ratio) is the
hallmark of obstructive lung diseases. The lung
diseases includes but is not limited to asthma,
acute and chronic bronchitis, emphysema,
bronchiectasis, pneumonia, and bronchiolitis29
.
The increased incidence of respiratory
symptoms in the subjects makes it necessary to
evaluate them so as to exclude these diseases.
FEF 25–75% gives an indication of what
is happening in the lower airways. It is a more
sensitive parameter and not as reproducible as
the others. It is a useful serial measurement
because it will be affected before FEV, so can
act as an early warning sign of small airway
disease. Our subjects had a very highly
significant decline in this value indicating the
small airway problem with exposure to
vegetable dust. The mechanism responsible for
the reduction in airflow as shown by decline in
FEF25-75% and PEFR can be bronchial spasm,
airway inflammation, increased intraluminal
secretions, and/or reduction in parenchymal
support of the airways due to loss of lung elastic
recoil.
CONCLUSION The results of this study show that
exposure to vegetable dust would expose the
population to a wide variety of harmful microbes
resulting in a variety of increased respiratory
symptoms and decrease lung capacities and
airflows during the years. Although more
comprehensive, long-term prospective and
specific studies are necessary, yet we
recommend control of pollution by taking
appropriate measures to inhibit the growth of
microbes; a detailed study of other harmful
components in such dust like fertilizers,
pesticides and insecticides. These contaminants
may cause general irritant or specific allergic
reactions in respiratory ducts and even lung
tissue. We also recommend providing standard
and appropriate protective tools (mask) for
workers who are exposed to dusts; and, finally,
periodic assessment of pulmonary function by
spirometry for workers who are exposed to
organic dusts and assessment of other preventive
action.
CONFLICTS OF INTEREST
None declared
REFERENCES
1. Ragnar Rylander MD. The role of endotoxin for
reactions after exposure to cotton dust.
Environmental & Occupational Health, Journal
Home. 2007; 12(6 ): Abstract Article first
published online. Available from:
http://onlinelibrary.wiley.com/doi/10.1002/ajim.
4700120607/abstract
2. Ragnar Rylander. Organic dust and lung disease:
The role of inflammation. Ann Agric Environ
Med 1999; 1:7-10.
3. O'Neill ME and Thorne PS Bio monitoring for
assessment of organic dust-induced lung
inflammation. Eur Respir J 2006; 27:1096-
1101.
4. Dutkiewicz J, Górny RL. Biologic factors
hazardous to health: classification and criteria
of exposure assessment. Med Pr. 2002;
53(1):29-39. [ in Polish]
5. Zenz C. Textbook of Occupational Medicine. In
Dickerson OB, Horvath EP 3rd
edition.Chicago:
Mosby; 1994.
6. Rom WN. Textbook of Environmental and
Occupational Medicine. 3rd ed. Philadelphia:
Lippincott-Raven; 1998.
7. Krewski D, Jerret M et al. Extended follow up
and spatial analysis of the American Cancer
Society study linking particulate air pollution
and mortality. Resp Rep Health Eff Inst. 2009;
140:5-11.
8. WHO strategy for prevention and control of
chronic respiratory diseases. Geneva: World
Health Organization; 2002.Available from
http://www.who. int / respiratory / publications/

Occupational Exposure to Vegetable Dust affects Lung Functions
64 January 2013 International Journal of Health and Rehabilitation Sciences Volume 2 Issue 1
who_mnc_cra_02.1.pdf. Accessed May 10,
2010.
9. Kakde Ub, Kakde HU. Incidence of post
harvest disease and airborne fungal spores in a
vegetable market. Acta Bot Croat. 2012; 71(1):
147-157.
10. Indoor Air Pollution (IAP) updates India –
Chest Research Foundations studies
respiratory disease. 2010January 25,
envhealth@usaid IAP news and research alerts.
Environmental Health at USAID.
11. Andersen A A. New sampler for the collection,
sizing, and enumeration of viable airborne
particles. J. Bacteriol. 1958; 76:471-484.
12. Anderrsen A A. A sampler for respiratory
health hazards assessment. Am.Ind Hyg. Assoc.
J 1966; 27: 260 - 265.
13. Krieg N R : Enrichment & Isolation. In:
Gerhasdt P, Murray RGE, Costilow RN, .
Nester EW, Wood WA, Krieg NR and Phillips
GB. (Eds). Manual of Methods for General.
Bacteriology, Am. Soc. Microbiol. Washington
DC. Lacy J and Dutkiewicz J.1981.
14. Douwes J, Thorne P, Pearce N, Heederik D. Bio
aerosol health effects and exposure assessment:
progress and prospects. Ann Occup Hyg. 2003;
47(3):187-200.
15. .Bellia V, Pistelli F, Giannini D, Scichilone N,
Catalano F, Spatafora M, et al. Questionnaires,
spirometry and PEF monitoring in
epidemiological studies on elderly respiratory
patients. Eur Respir J Suppl 2003; 40:21S-27S.
16. Boskabady MH, Fasihfar M, Maemoori G A.
Correlation between symptom score, wheeze,
reversibility of pulmonary function tests and
treatment response in asthma. Iran J Allergy
Asthma Immunol 2003; 2(2):61-67.
17. American Thoracic Society. Standardization of
spirometry, 1994 update. Am J Respir Crit Care
Med 1995; 152(3):1107-1136.
18. Daniel Soper.com [Internet] Statistics
Calculator version 2.0 Available from :
http://www.danielsoper.com/statcalc/calc08.asp
x
19. State of Environment Report: Maharashtra
Indira Gandhi Institute of Development
Research Mumbai-400065 (India) Maharashtra
Pollution Control Board sponsored by Ministry
of Environment and Forests, Govt. of India.
(FINAL DRAFT) Page 100-101
20. Knudson RJ, Lebowitz MD, Holberg CJ et al.
Changes in the normal maximal Expiratory
flow-volume curve with growth and aging. Am
Rev Respir Dis 1983;127:725 e 34.
21. American Thoracic Society. Respiratory health
hazards in agriculture. Am J Respir Crit Care
Med 1998;158:S1–S76.
22. Ray CS, Sue DY and Bray G. Effects of obesity
on respiratory function. Am Rev Respir Dis
1983; 128:501- 6.
23. David Fishwick, Lisa J. Allan, Anthony Wright
and Andrew D. Curran. Assessment of
Exposure to Organic Dust in a hemp Processing
Plant. The Annals of Occupational Hygiene
2001; 45 (7):577-583.
24. Matheson MC, Benke G, Raven J, Sim MR,
Kromhout H, Vermeulen R, John DP, Walters
EH, Abramson MJ. Biological dust exposure in
the workplace is a risk factor for chronic
obstructive pulmonary disease. Thorax 2005;
60: 645-651.
25. Kuchuk AA, Basanets A, Louhelainen K.
Broncho pulmonary pathology in workers
exposed to organic fodder dust. Ann Agric
Environ Med. 2000; 7(1):17-23.
26. Bunger J,Schappler-Scheele b, Hilgers r, Hallier
E. A 5 year follow up study on respiratory
disorders and lung function in workers exposed
to organic dust from composting plants. Int
Arch Occup Environ Health. 2007; 80: 306-
312.
27. Rylander R. Endotoxin in the environment-
exposure and effects. J Endotoxin Res 2002;
8:241–252.
28. Marc B. Schenker, Kent E. Pinkerton, Diane
Mitchell, Val Vallyathan, Brenda Elvine-Kreis,
Pneumoconiosis from Agricultural Dust
Exposure among Young California Farm
workers, Environmental Health Perspectives.
2009; 117: 998-994.
29. Thomas R.Gildea, Kevin McCarthy. Pulmonary
Function Testing. Cleveland Clinic
Publications, Monthly CME e news paper,
available from
http://www.clevelandclinicmeded.com/medical
pubs/diseasemanagement/pulmonary/pulmonar
y-function-testing/
For More Information Log on to
www.ijhrs.com


![[Accesibility and use of spirometry in primary care centers in Catalonia.]](https://img.pdfslide.net/doc/110x75/634e21803bdc8e881007badb/accesibility-and-use-of-spirometry-in-primary-care-centers-in-catalonia.jpg)


