Embed Size (px)
Citation preview

www.elsevier.com/locate/coastaleng
Coastal Engineering 52
Laboratory experiments on low-crested breakwaters
M. Kramer a,*, B. Zanuttigh b,1, J.W. van der Meer c,2, C. Vidal d,3, F.X. Gironella e,4
a Hydraulics and Coastal Engineering, Aalborg University, Sohngaardsholmsvej 57, DK-9000 Aalborg, Denmarkb University of Bologna, DISTART Idraulica, viale del Risorgimento, 2 - 40136 Bologna, Italy
c Infram, Location Geomatics Park, PO Box 16, 8316 ZG Marknesse, Netherlandsd University of Cantabria, E.T.S. I de Caminos, Canales y Puertos, Avda. de los Castros s/n, 39005 Santander, Spain
e Technical University of Catalonia, LIM/UPC, Jordi Girona 1-3, Barcelona 08034, Spain
Available online 2 November 2005
Abstract
New unique laboratory experiments on low-crested structures (LCSs) have been performed within the DELOS project. The
experiments were carried out in three European laboratories aiming at extending and completing existing available information
with respect to a wide range of engineering design properties such as structural stability, wave and current flows and wave
transmission. 3D wave basin tests were performed to provide information especially about the wave obliquity, where almost no
research has been done before. Flow velocities inside and close to the surface of structures were studied in a wave channel at
small scale, and scale effects regarding wave transmission and reflection were studied in a wave channel at a large scale facility.
The paper describes the experiments and associated databank with respect to objectives, test program, set-ups and
measurements. Results, guidelines and recommendations elaborated from the tests are included in the other companion papers
of the Coastal Engineering Special Issue on DELOS.
D 2005 Elsevier B.V. All rights reserved.
0378-3839/$ - see front matter D 2005 Elsevier B.V. All rights reserved.
doi:10.1016/j.coastaleng.2005.09.002
* Corresponding author. Tel.: +45 96357230; fax: +45 98142555.
E-mail addresses: [email protected] (M. Kramer),
[email protected] (B. Zanuttigh),
[email protected] (J.W. van der Meer),
[email protected] (C. Vidal), [email protected]
(F.X. Gironella).1 Tel.: +39 051 2093754; fax: +39 051 6448346.2 Tel.: +31 527 242341; fax: +31 527 241119.3 Tel.: +34 942 201810; fax: +34 942 201860.4 Tel.: +34 93 4016468; fax: +34 934011861.
1. Introduction
The laboratory experiments described here are part
of the research carried out for the European Project
DELOS (see acknowledgements for further informa-
tion). Experiments were carried out in 3 laboratories.
Wave basin tests were carried out in the laboratory at
Aalborg University (AAU), small scale wave channel
tests were performed at the University of Cantabria
(UCA) in Santander, and large scale wave channel tests
were completed at the Polytechnic University of
Catalonia (UPC) in Barcelona. Detailed reports about
the tests are available in the deliverables for the DELOS
(2005) 867–885

M. Kramer et al. / Coastal Engineering 52 (2005) 867–885868
project, see Kramer et al. (2003) for details regarding
wave basin tests, and for details regarding the wave
channel experiments, see Vidal and Gironella (2003).
In order to make ideal set-ups in the laboratory with
respect to each subject it was necessary to separate
testing with different purposes. In this way the wave
basin experiments at AAU were grouped in stability
tests, hydrodynamic tests and wave transmission tests.
The near and far field 2D hydrodynamics were studied
at small scale at UCA, and large scale 2D tests on wave
transmission and reflection were performed at UPC.
Tests were not performed at any specific scale, but the
following scales represent an approximate scale with
respect to typical full scale configurations. Structure
freeboard, wave height and wave period/steepness
were varied in all tests.
Wave basin tests at AAU (small scale, about 1:20):
! 69 stability tests were performed to investigate
structural damage to heads and trunks subject to
3D waves. Influence of wave obliquity was tested
on 2 structural set-ups with different crest widths.
! 88 hydrodynamic tests were completed to analyse
wave and current flows near the structures, and to
provide data for calibration of numerical models.
2 structural set-ups with a gap between the
roundheads and 2 set-ups with oblique structures
were tested in 2D and 3D waves.
! 168 wave transmission tests were performed with
the objective of studying influences of wave
Fig. 1. Layout of the wa
obliquities on transmitted wave energy, wave
directions and spectral changes. 3 structural set-
ups with rubble structures and 3 set-ups with
smooth plywood structures were tested in 2D and
3D waves.
Wave channel tests at UCA (small scale, about
1:10):
! 108 2D near and far field hydrodynamic tests
were performed to describe in detail the flow
inside and over the structure. Wave transmission
and run-up on the beach was also monitored. 2
structural set-ups with different crest widths were
tested in regular and irregular waves.
Wave channel tests at UPC (large scale, about 1:4):
! 66 wave transmission and reflection tests were
performed to investigate the influence of crest
width, structure slope, and scale effects on wave
transmission and reflection coefficients for LCSs.
2 structural set-ups with different crest widths
were tested in regular and irregular waves.
In the following the experiments are described with
respect to objectives, test program, set-ups and
measurements. The results elaborated from the tests
are included in the other companion papers of the
Coastal Engineering Special Issue on DELOS. Near-
structure morphodynamics was also studied experi-
mentally within DELOS, but this subject is treated
separately in the companion paper by Sumer et al.
(2005—this issue).
ve basin at AAU.

Fig. 3. Wedge paddle in the CIEM flume.
M. Kramer et al. / Coastal Engineering 52 (2005) 867–885 869
1.1. Description of the test facility at Aalborg
University
The wave basin experiments were carried out at
Aalborg University in the Hydraulics and Costal
Engineering Laboratory, Denmark during the summer
2002. The basin used for the DELOS tests is 12 m
long, 18 m wide and 1.0 m deep as shown in Fig. 1.
The paddle system is a snake-front piston type
composed of 25 actuators with a stroke length of 1.2
m, enabling generation of short-crested waves. The
wave generation software used for controlling the
paddle system is Profwaco developed by the labora-
tory. Regular and irregular short-crested waves with
peak periods up to approximately a maximum of 3 s
can be generated with acceptable result. Oblique 2D
and 3D waves can be generated.
A fixed seabed made of concrete was used in all
tests. The absorbing sidewalls were made of crates
(121�121 cm, 70 cm deep) filled with sea stones with
Dn50 of approximately 5 cm, see Fig. 1 (right). The
areas outside the crates were left empty in all the tests.
The beach was made of quarry rock withDn50=1.5 cm.
1.2. Description of the test facility at University of
Cantabria
The wave and current flume at UCA is 24 m
long, 0.60 m wide and 0.80 m high, see Fig. 2. The
piston-type wavemaker has two attached free
surface wave gauges integrated in an Active Wave
Absorption System (AWACSR) that allows the
absorption of reflected waves from the model. The
wavemaker and a rear absorbing beach occupy 4 m
at the left end of the flume; another 4 m is
occupied by a false bottom that can be partially or
totally removed to establish a current in the flume.
The remaining 16 m of the flume is available for
testing. Bottom and sidewalls in the testing area are
Fig. 2. Wave and curren
made of glass allowing the use of LDA or PIV
velocity measurements.
1.3. Description of the test facility at Polytechnic
University of Catalonia
The large scale tests were carried out in the CIEM
flume. A wedge paddle is used for wave generation,
see Fig. 3. The flume is 100 m long, 3 m wide and 5 m
deep, see Fig. 4. During the DELOS tests the bottom
was rigid, with a horizontal profile by the breakwater
section. A parabolic dissipative beach with homoge-
neous natural stone (average stone weight 0.5 kg) was
build to minimise multi-reflection effects behind the
breakwater.
2. Wave basin stability tests
2.1. Introduction
Several 2D laboratory experiments on trunk
armour layer stability of LCSs have been performed
in wave channels; see e.g. Ahrens (1987), Van der
Meer et al. (1996), and Loveless and Debski (1997).
To our knowledge only one 3D test series with long
t flume at UCA.

Fig. 4. Sketch of set-up in the CIEM flume during the DELOS tests.
M. Kramer et al. / Coastal Engineering 52 (2005) 867–885870
crested waves has been carried out on complete LCSs,
see Vidal et al. (1992). Only one structure geometry
was tested with cross-section slopes 1V:1.5H. The
results could therefore only quantify the influence of
freeboard on the stability for that specific geometry.
The task for the new stability tests on LCSs
(mainly roundhead but also trunk) was to supplement
existing tests in order to identify the influence on
rubble stone stability of: obliquity of short-crested
waves, wave height and steepness, crest width, and
freeboard. Recommendations for design are given in
Kramer and Burcharth (2003) and in the companion
paper by Burcharth et al. (submitted for publication).
The chosen set-up was based on a survey of the
geometry of 1248 existing low crested breakwaters
in the EU; see the companion paper by Lamberti et
al. (2005—this issue). Typical ranges of structural
geometries were identified and scaled by 1:20
leading to appropriate sizes of the structures with
Fig. 5. Wave basin layout an
respect to the size of the wave basin. The largest
possible armour stone sizes were chosen based on
existing knowledge about stability of LCSs and the
obtainable wave conditions in the basin. In this way
damage to the structure was likely for the highest
waves. Sufficiently large Reynolds numbers were
ensured to avoid problems with viscous scale effects
(the Reynolds numbers were about 3–5d 104 in the
tests).
69 tests were performed with irregular 3D waves
generated using a Jonswap spectra with peak en-
hancement factor 3.3 and a cosine power spreading
function with spreading parameter S =50, see Mit-
suyasu et al. (1975). The wave height was increased in
steps until severe damage occurred. Two wave
steepnesses of 0.02 and 0.04 and angle of incidences
in the range of �308 to +208 were generated
(08=normal incidence), see Fig. 5. The water depth
in front of the wave paddle was varied from 33 cm to
d bottom topography.

Fig. 6. Cross-section geometry.
M. Kramer et al. / Coastal Engineering 52 (2005) 867–885 871
48 cm giving water depths at the structure between
0.25 m and 0.40 m. Two different crest widths were
tested at different water levels giving freeboards
between –0.1 m and +0.05 m, see Fig. 6. Negative
freeboards represent submerged structures. The length
of the structure was 5 m. A circular roundhead with
crest radius equal to half the trunk crest width was
chosen.
2.2. LCS construction and materials
The trunk and the roundhead were constructed by
carefully selected quarry stones with mass density
2.65 t/m3. The stones were painted in different colours
to identify and quantify damage. Three types of
armour stones were used. Carefully selected stones
(Type A) were used in the test sections where damage
was measured, see Fig. 7. For the dummy section
between the trunk and roundhead test section a net
Fig. 7. Stone types in structural sect
with large masks (2�2 cm) was covering the surface
to avoid damage in that area. This made rebuilding
easier and gave less strict specifications for the armour
material (Type B). For the dummy section between
the sidewall (to the right on Fig. 7) and the trunk test
section, larger stones (Type C) were used to avoid
damage. Type A stones were used in 15 cm (5d Dn50)
strips on each side of the test sections to ensure correct
boundary conditions. More wide graded stones (Type
D) were used as core material. The porosity (n) for
armour Type A and core Type D was n(Type A)=0.44
and n(Type D)=0.43.
The roundhead was split in three sections of 608each, see Fig. 7. The three sections were called:
Seaward Head (SH), Middle Head (MH) and
Leeward Head (LH). The trunk was split in three
parts called: Seaward Slope (SS), Crest (C), and
Leeward Slope (LS). The damage was measured
within each section.
ions. Measures in centimeters.

Table 1
Test conditions
Test block Dir. [8] Freeboard [m] Wave steepness
Narrow crest (width=0.1 m)
1 0 0.05 0.02
2 0 0.05 0.04
3 0 0.00 0.02
4 0 0.00 0.04
5 0 �0.05 0.02
6 0 �0.05 0.04
7 0 �0.10 0.02
8 0 �0.10 0.04
Wide crest (width=0.25 m)
9 0 0.05 0.02
10 �20 0.05 0.02
11 �10 0.05 0.02
12 10 0.05 0.02
13 20 0.05 0.02
14 �30 0.05 0.02
15 0 0.00 0.02
16 0 �0.05 0.02
17 0 �0.10 0.02
M. Kramer et al. / Coastal Engineering 52 (2005) 867–885872
2.3. Measurements
Waves were recorded by an array of five wave
gauges of the resistance type to be used in
estimating incoming and reflected wave spectra,
see Fig. 7. At the position of the array almost 1.5 m
from the roundhead the influence of the roundhead
(reflection and diffraction) on the incoming waves is
believed to be negligible. However, the trunk
reflects some wave energy which is re-reflected by
the paddles. Therefore the waves in front of the
trunk might in reality be slightly higher with more
Fig. 8. Photo of set-up. Layout 1 at the left hand-side: two half round-head
side: a single breakwater inclined at 308 with respect to the beach.
wave breaking than at the array. Measurements from
the 3-gauge system and visual observations were
performed to quantify this effect. Recorded waves
were analysed with the software Wavelabn, devel-oped by the laboratory at AAU (http://hydrosoft.
civil.auc.dk/).
Digital video and digital photos were taken to
visualize and quantify the damage progression.
The target length of each test was 1000 waves. A
test block was defined by fixed water level, wave
direction, wave steepness, and spreading, see Table 1.
In each test block the significant wave height Hs was
increased in steps until severe damage was observed.
It was attempted to get four tests in each block.
However, this was not possible in all blocks due to the
progress of the damage. Target conditions were
therefore continuously adjusted according to target
damage during a test block. After each block the
breakwater was rebuilt.
3. Wave basin hydrodynamic tests
3.1. Introduction
The functionality of LCSs has been investigated in
the past 20–30 years through analytical, numerical
and experimental studies. The first documented
analysis of the effects of these structure on water
piling-up at the lee side was done by Diskin et al.
(1970). Later, among others, Debski and Loveless
(1997) carried out flume model tests to study wave
transmission, set-up, structural stability, overtopping
structures with a rip channel in between; Layout 2 at the right hand-

Fig. 9. Cross-section geometry and materials. At the left hand-side: narrow berm (top) and wide berm (bottom). At the right hand-side: materials
adopted referring to the labels reported in the figure. Measures in centimeters.
M. Kramer et al. / Coastal Engineering 52 (2005) 867–885 873
and filtration; Kobayashi and Wurjanto (1989) and
Losada et al. (1998) performed numerical studies on
wave transmission and return flow; Ruol and Faedo
(2002) experimentally analysed overtopping and
Fig. 10. The instrumented basin for layout 1, narrow berm. d�T marks W
structure), d5T marks ADVPs (I and II) and 3D ADVs (III and IV). Meas
filtration at emerged structures under breaking inci-
dent waves.
Few experimental studies on LCSs were per-
formed on 3D physical models; moreover, most
Gs, doT marks the 2D ADVs (F and B, in front and behind the
ures in centimeters.

M. Kramer et al. / Coastal Engineering 52 (2005) 867–885874
wave basin experiments in the literature, refer to
high non overtopped structures (Gourlay, 1974;
Mory and Hamm, 1997). In the works by Hamm
(1992) and Borthwick et al. (1997), some results can
be found regarding a weak rip perturbation of a
beach. Till now, the only available set of experiments
on emergent permeable structures are the model of
Elmer breakwaters (Ilic et al., 2000; Chapman et al.,
2000) and the analysis of the flow patterns around an
isolated breakwater performed by Sutherland et al.
(2000). Both these works refer to the case of a
narrow-berm structure. Haller et al. (2002) and
Drønen et al. (2002) examined rip current effects
and near-shore circulation on a barred beach with rip
channels. In all tested conditions, bars are imperme-
able and submerged. The work by Haller et al.
(2002) is limited to regular wave attacks, whereas
the work by Drønen et al. (2002) includes also
irregular waves; both provide detailed maps of mean
surface elevation and velocity only for regular
waves.
Fig. 11. The instrumented basin for layout 2, wide berm. d�T marks WGs,
d5T marks ADVPs (I and II) and 3D ADVs (III and IV). Measures in cen
The main objective of the hydrodynamic tests
performed within DELOS was to analyse waves and
currents around emergent and submerged LCSs,
describing wave set-up and overtopping discharge
conditions and providing data to verify and calibrate
numerical littoral circulation models. The hydrody-
namic tests within DELOS were carried out in the
short-crested wave basin at Aalborg University
described in Section 1.1.
Details on the measurements and on the data
analyses can be found in Zanuttigh and Lamberti
(2006). Measurements of water surface elevation,
velocity and wave intensity were used to calibrate
hydrodynamic models (Christensen et al., 2003;
Losada et al., 2005—this issue) and to compare their
performances (Johnson et al., 2005—this issue). Data
acquired at wave gauges placed over the structure were
elaborated using a wave-by-wave procedure to obtain
overtopping discharge that was then compared to the
one predicted using available formulae (Lamberti et
al., 2004; Caceres et al., 2005—this issue).
doT marks the 2D ADVs (F and B, in front and behind the structure),
timeters.

M. Kramer et al. / Coastal Engineering 52 (2005) 867–885 875
3.2. Layouts and cross-sections
Two layouts were designed, in scale 1:20 with
respect to a hypothetical prototype, to represent cases
of LCSs parallel and oblique to the coast. The first one
(Fig. 8, left hand-side) was a symmetric layout,
composed by two detached breakwaters forming a
rip channel in the middle. Wave plywood guide walls
at lateral boundaries from the wave maker till the
structure axis allowed obtaining a larger area of
uniform wave conditions. The second layout (Fig. 8,
right hand-side) consisted of a single breakwater
inclined at 308 with respect to the beach. A single
wave guide wall was placed from wave paddles to the
middle of the basin.
Two structures representing a semi-emergent
narrow berm and a semi-submerging wide berm
were tested with both layouts. Structures were
composed of an armour layer of rock on a core
with slopes 1:2 (cross-sections in Fig. 9). Structures
were designed according to typical structure
height—Dn50 ratios for existing LCSs, which usually
Table 2
Test conditions
Test no. F [m] hd [m] hs [m]
Zero freeboard 1 0.00 0.36 0.20
2 0.00 0.36 0.20
3 0.00 0.36 0.20
4 0.00 0.36 0.20
5 0.00 0.36 0.20
6 0.00 0.36 0.20
7 0.00 0.36 0.20
8 0.00 0.36 0.20
9 0.00 0.36 0.20
10 0.00 0.36 0.20
Emergent structure 1 0.03 0.33 0.17
2 0.03 0.33 0.17
3 0.03 0.33 0.17
4 0.03 0.33 0.17
5 0.03 0.33 0.17
6 0.03 0.33 0.17
Submerging structure 1 �0.07 0.43 0.27
2 �0.07 0.43 0.27
3 �0.07 0.43 0.27
4 �0.07 0.43 0.27
5 �0.07 0.43 0.27
6 �0.07 0.43 0.27
F is the freeboard, hd is water depth at the wave maker, hs is the water d
steepness, Hs is the significant wave height, Tp is the peak period, L0p is th
distribution. J3D denotes Jonswap 3D irregular waves, R denotes regular
is between 3.0 and 4.0 (up to 6.0 for particularly
mild seaward slopes). The materials adopted were
chosen among the materials available at the labora-
tory and are reported in the table at the right hand-
side of Fig. 9.
3.3. Measurements
The following field variables were studied: wave
amplitude, wave number, current intensity and direc-
tion, and set-up intensity. Measurements were carried
out with the following equipment: Acoustic Doppler
Velocimeters (ADVs) were used to obtain local xyz
velocities, Acoustic Doppler Profiler (ADVP) were
used to obtain velocity profiles at fixed points, and
Wave Gauges (WGs) were used to measure local free
surface elevation. The placement of measuring devi-
ces in the basin for layouts 1 and 2 is shown in the
Figs. 10 and 11, respectively.
The flow field was analysed using tracking of
drifters for regular waves and by monitoring dye
clouds for irregular waves. In order to examine rip
Wt Ws Hs [m] Tp [m] L0p [m] S H/hs
J 3D 0.02 0.090 1.70 4.50 50 0.45
J 3D 0.04 0.090 1.20 2.25 50 0.45
J 3D 0.02 0.040 1.13 2.00 50 0.20
J 3D 0.04 0.040 0.80 1.00 50 0.20
R 0.02 0.076 1.56 3.80 – 0.38
R 0.04 0.076 1.10 1.90 – 0.38
R 0.02 0.034 1.04 1.70 – 0.17
R 0.04 0.034 0.74 0.85 – 0.17
J 2D 0.02 0.090 1.70 4.50 – 0.45
J 2D 0.04 0.090 1.20 2.25 – 0.45
J 3D 0.02 0.076 1.57 3.82 50 0.45
J 3D 0.04 0.076 1.11 1.91 50 0.45
J 3D 0.02 0.034 1.04 1.70 50 0.20
J 3D 0.04 0.034 0.74 0.85 50 0.20
R 0.02 0.065 1.44 3.23 – 0.38
R 0.04 0.065 1.02 1.61 – 0.38
J 3D 0.02 0.121 1.97 6.07 50 0.45
J 3D 0.04 0.121 1.40 3.037 50 0.45
R 0.02 0.103 1.81 5.13 – 0.38
R 0.04 0.103 1.28 2.56 – 0.38
J 3D 0.02 0.054 1.32 2.70 50 0.20
J 3D 0.04 0.054 0.93 1.35 50 0.20
epth at the structure, Wt is the wave spectrum type, Ws is the wave
e deep water wave length, S is the spreading parameter in Mitsuyasu
waves.

M. Kramer et al. / Coastal Engineering 52 (2005) 867–885876
currents at the gap videos were captured from two
digital cameras, one placed by the side of the basin
and the other above the centre of the gap.
Wave attacks included regular, 2D irregular and 3D
irregular waves. The water depth was varied giving
zero, positive (+3 cm, emergent structure) and
negative freeboards (�7 cm, submerged structure).
A total of 22 different attacks (Table 2) were repeated
on both structures for both layouts, giving a total of 88
tests. Tested significant wave heights were in the
range 3.4 to 12.15cm and peak periods were within
the range 0.74 to 1.97 s. The main wave direction was
perpendicular to the beach and the wave spreading for
Jonswap 3D spectrum was 238. Tests with regular
waves aimed at describing the shape of wave and
current fields, whereas tests with irregular waves
aimed at evaluating effects of the actual shape of wave
Fig. 12. Views of the basin, 308 tests on ru
spectra and of the variability of wave height for the
same global wave parameters.
4. Wave basin transmission tests
4.1. Introduction
Wave transmission over LCSs has often been
subject for research, as the wave field behind these
structures determines what will happen in this area.
Detached LCSs are often parallel to the coastline and
with wave attack perpendicular to this coastline and
therefore, perpendicular to the structure. This situation
can be simulated by small scale physical modeling in a
wave flume. Results have been given by Van der Meer
and Daemen (1994) and d’Angremond et al. (1996).
bble and smooth plywood structure.
M. Kramer et al. / Coastal Engineering 52 (2005) 867–885 877
Recent research, including all data of the above given
references and new extensive data sets, has enlarged
the insight on the topic, see Briganti et al. (2003). The
results from 2D tests are prediction formulae for the
wave transmission coefficient Kt and a description of
change of spectral shape due to wave transmission.
The wave attack is not always perpendicular to
the structure. Under special environmental conditions
more oblique waves can occur. Groin systems or
breakwaters for harbours where structures are not
parallel to shore line are other examples in which
oblique wave attack occurs. But what are the
influences of obliqueness on the transmission? In
more detail:
! Are the prediction formulae for Kt still valid?
! Is the spectral change (more energy to high
frequencies) similar to perpendicular wave attack?
! Is there any influence of short-crestedness of
waves?
Fig. 13. Rubble structure layouts. d�T m
! Are wave directions similar in front of the structure
and after transmission?
Only a three-dimensional investigation in a short-
crested wave basin can give answer to these questions.
The present 3D tests were carried out in the short-
crested wave basin at Aalborg University described in
Section 1.1. Results elaborated from the wave
transmission tests can be found in Van der Meer et
al. (2003, 2005—this issue).
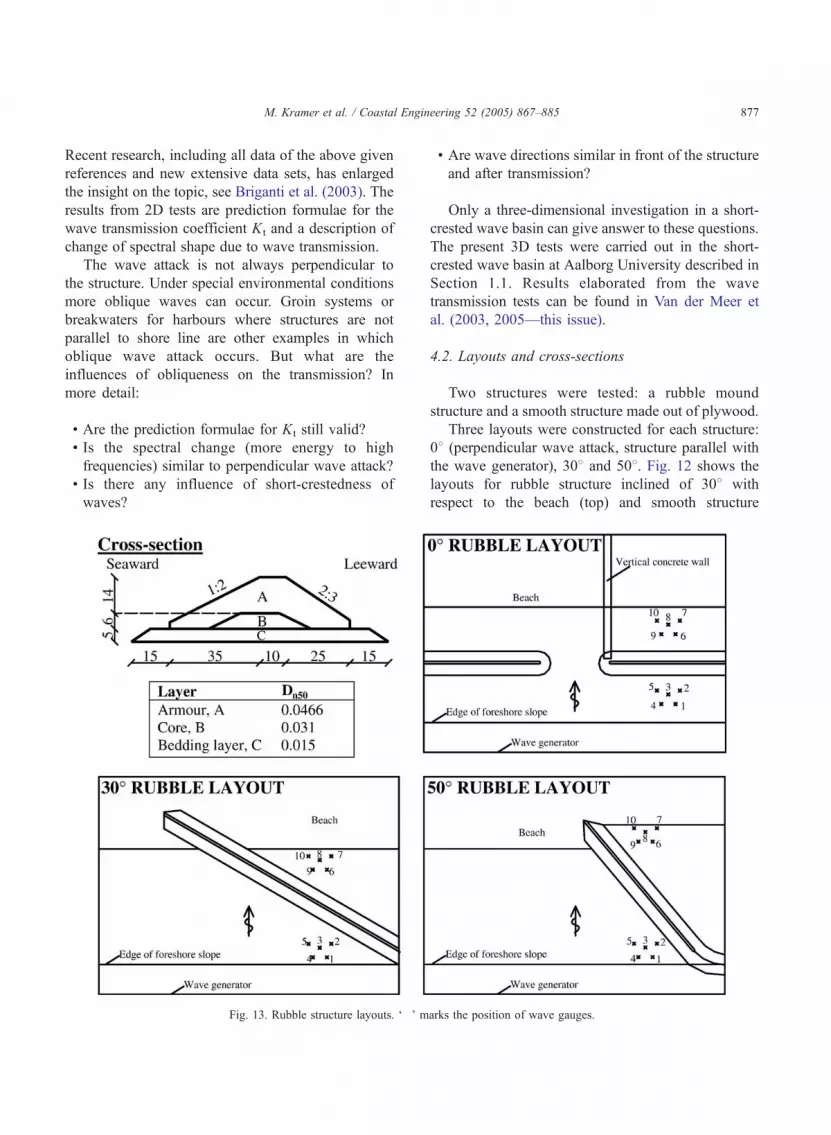
4.2. Layouts and cross-sections
Two structures were tested: a rubble mound
structure and a smooth structure made out of plywood.
Three layouts were constructed for each structure:
08 (perpendicular wave attack, structure parallel with
the wave generator), 308 and 508. Fig. 12 shows the
layouts for rubble structure inclined of 308 with
respect to the beach (top) and smooth structure
arks the position of wave gauges.

Fig. 14. Smooth structure layouts. d�T marks the position of wave gauges.
M. Kramer et al. / Coastal Engineering 52 (2005) 867–885878
(bottom). The schemes for the whole set of layouts
are presented in Fig. 13 (rubble structure) and Fig.
14 (smooth structure). The rubble mound structure
was 25 cm high with a crest width of 10 cm and it
was built of quarry rock. The cross-section con-
sisted of a bottom layer, a core and an outer
armour layer with the detailed characteristics:
W50=0.269 kg, Dn50=0.0466 m and a grading of
D85 /D15=1.25, see the cross-section scheme at the
top and left hand-side of Fig. 13. The smooth
structure had gentler slopes than the rubble mound
Fig. 15. Bottom topography for 08 rubbl
structure, which is also the case in reality. The
seaward slope was 1:3 and the leeward slope 1:2.
The structure height was 0.30 m and the crest
width 0.20 m.
The structures were placed on a horizontal plateau,
which was 0.16 m higher than the bottom of the basin.
This created a larger depth in front of the wave
generator and made it possible to generate very steep
and breaking waves in front of the structure, see Fig.
15. Reflection from the rear wall of the basin was
minimised using 1:5 rubble beach.
e layout. Measures in centimeters.

Table 3
Overall view of test program
Tests per structure 84 (10 long-crested, 74 short-crested)
Crest freeboard +0.05 m; 0.0 m; �0.05 m
Dimensionless freeboard
Rc/Hs
�0.7 to +0.8
Wave height Hs 0.07 m to 0.14 m
Wave steepness sop 0.02 and 0.04
Angles of wave attack b 08, 208, 308, 408, 508 and 608
M. Kramer et al. / Coastal Engineering 52 (2005) 867–885 879
4.3. Measurements
For both the rubble mound structure as well as for
the smooth structure 84 tests were performed. Table
3 gives an overall view. Three crest freeboards were
tested with two wave steepnesses and three wave
heights, giving 18 conditions for each wave direc-
tion. The main angles of wave attack were 08, 308and 508, but as the multi-directional wave generator
could also generate waves under an angle, a limited
number of tests were performed with 208, 408 and
608. A Jonswap spectrum with c =3.3 was used for
all the tests.
Only 10 of the 84 tests were performed with long-
crested waves. The remaining 74 short-crested tests
were performed with a cos2S spreading function with
S =50. Incident and transmitted wave conditions were
measured. Awave gauge array of 5 gauges was placed
in front of the structure to measure the incident waves
and a similar array behind the structure to measure the
transmitted waves, see the placements in Figs. 13 and
Fig. 16. Cross-sections of breakwater m
14. Measurements from the five-gauge array were
used to calculate the directional wave spectra.
A sampling rate of 30 Hz was used throughout the
experiments. The recorded length of each test was 15
min. Digital video of 3 min and digital photos were
taken for each test.
Reflections from the smooth structure were
expected to be large. Generation of standing waves
due to multi-reflections between wave generator and
structure in case of perpendicular wave attack was
likely to occur. To minimise this effect the structure
was inclined at 308, and 308 waves were generated
giving perpendicular wave attack. In this way a large
part of the reflected waves could escape the area
between the structure and the wave generator and get
absorbed in the absorbing sidewalls shown in Fig. 1.
5. Wave channel tests on near and far field
hydrodynamics
5.1. Introduction
Previous 2D experiments about hydrodynamics
around LCSs have focused on wave transformation in
the far field (reflection and transmission properties);
see e.g. Calabrese et al. (2002). To fulfil the DELOS
objectives 2D experiments were performed to analyse
both the near field and the far field hydrodynamics
around LCSs.
odels. Distances in centimeters.

Table 4
Characteristics of the materials
W15
[g]
W50
[g]
W85
[g]
Porosity
[�]
Density
[kg/m3]
Armour 119 153 206 0.53 2647
Core 3.14 4.31 5.60 0.49 2607
M. Kramer et al. / Coastal Engineering 52 (2005) 867–885880
The laboratory tests were carried out in the
laboratories of the University of Cantabria (UCA) in
the wave flume described in Section 1.2. Three
DELOS partners collaborated during the testing:
UCA, University of Bologna (UB) and University of
Roma 3 (UR3). Results elaborated from the tests can
be found in Garcia et al. (2004) and Losada et al.
(2005—this issue).
5.2. Layout and cross-sections
Two rubble mound LCSs with 0.25 m and 1.00 m
crest width were tested, see Fig. 16. Structure height,
front and back slope angles (1V/2H) and rubble
characteristics were the same for both structures. The
models had two layers; armour of selected gravel
and a gravel core with characteristics as shown in
Table 4.
The model was built on top of a 3.8 m long
horizontal stainless steel plate, which was located
0.10 m over the glass bottom of the flume, see Fig.
17. In front of the foot of the structure a Plexiglas
ramp with 1V/20H slope connected the false bottom
with the bottom of the flume. In the rear end an 8 m
long 1V/20H Plexiglas ramp simulated a beach.
Between the horizontal and the inclined false
bottom one rectangular aperture, 0.08 m wide,
allowed the water to flow below the beach to the
return piping system. Overtopping waves caused
set-up behind the structure, which drove the
Fig. 17. Experimental set-up. D
returning flow through the piping system to the
false bottom in front of the wave maker, closing the
circuit.
5.3. Measurements
The measured variables were free surface eleva-
tions, flow velocities, wave pressures and return
pipe discharges (due to the piling-up behind the
structure).
Fifteen free surface gauges were used to analyse
incident, reflected and transmitted waves, including
wave transformation over the model and on the
beach, see Fig. 18 photo 1. Three pressure gauges
were installed on the sea bed inside the LCS
structure core, to measure the wave transmission
inside the porous rubble. One three-dimensional
Acoustic Doppler Velocimeter (ADV) was located
in the lee side of the LCS to measure the flow
behind the structure.
Six one-dimensional Acoustic Doppler Profilers
(ADPs) were attached to a steel frame in pairs on the
structure, see Fig. 18 photo 2. The head of these
sensors was just protruding from the rubble surface,
allowing the measurement of flow velocity in the
direction of the beam in points 2 to 3 mm apart.
Another four ADPs (two pairs) were installed on the
false horizontal bottom behind the LCS. Further a pair
of ADPs were located on the beach ramp before the
swash zone, and finally three more individual ADPs
measured velocities in the swash zone.
LDA measurements of U, W velocities were
recorded at 12 points along the surface of the front
slope of the LCS. A digital video camera was used to
record the free surface over the LCS, see Fig. 18,
photo 3. For calibration of the video a 1 cm square
grid was attached to the flume glass. Finally, an
istances in centimeters.

Fig. 18. Instrumentation in the experiments.
M. Kramer et al. / Coastal Engineering 52 (2005) 867–885 881
acoustic probe was used to measure the flow in the
recirculation pipe.
The two cross-sections were tested at three water
levels giving three freeboards (�0.05, 0, and 0.05 m).
The total number of different wave conditions was 54
for regular waves and 54 for irregular waves. Wave
conditions are indicated in Table 5.
Table 5
Test conditions
Type Regular Irregular
H�Hs (m) 0.05 to 0.15 0.04 to 0.10
T�Tp (s) 1.6 to 3.2 1.6 to 3.2
L (m) 2.5 to 6.2
H/L 0.0081 to 0.059
F/H �1.0 to 1.0
B/L 0.041 to 0.40
H/h 0.13 to 0.50
h/L 0.049 to 0.16
6. Wave channel tests on wave transmission and
reflection
6.1. Introduction
The new DELOS wave transmission and reflection
experiments were carried out to supplement previous
experiments completed in the CIEM flume (Rivero et
al., 1997; Gironella and Sanchez-Arcilla, 1999;
Sanchez-Arcilla et al., 2000). The new tests were
performed with the following objectives:
! A new structure slope was tested to improve the
Iribarren number influence in formulae for reflec-
tion and transmission coefficients.
! Different crest widths were tested to determine the
effect of the parameters B/h, h/L, B/L on the
following subjects (B is the crest width, L is the
wave length and h is the water depth):
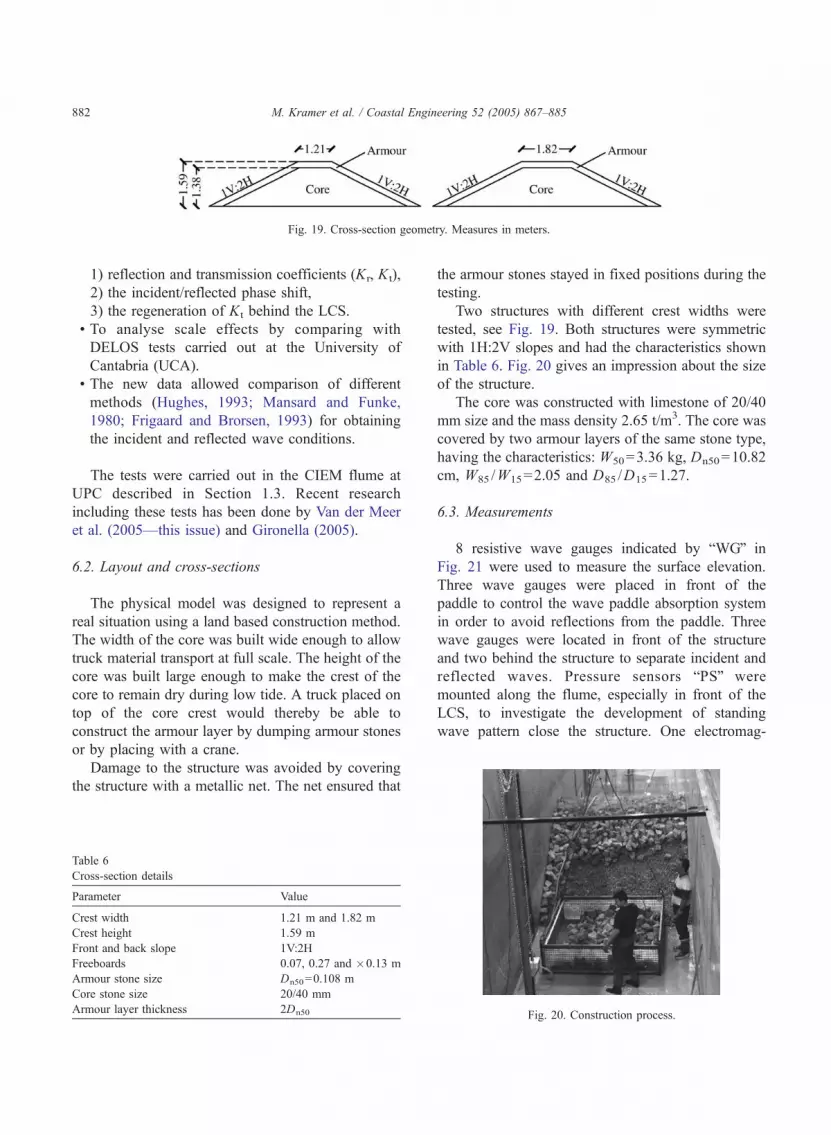
Fig. 19. Cross-section geometry. Measures in meters.
M. Kramer et al. / Coastal Engineering 52 (2005) 867–885882
1) reflection and transmission coefficients (Kr, Kt),
2) the incident/reflected phase shift,
3) the regeneration of Kt behind the LCS.
! To analyse scale effects by comparing with
DELOS tests carried out at the University of
Cantabria (UCA).
! The new data allowed comparison of different
methods (Hughes, 1993; Mansard and Funke,
1980; Frigaard and Brorsen, 1993) for obtaining
the incident and reflected wave conditions.
The tests were carried out in the CIEM flume at
UPC described in Section 1.3. Recent research
including these tests has been done by Van der Meer
et al. (2005—this issue) and Gironella (2005).
6.2. Layout and cross-sections
The physical model was designed to represent a
real situation using a land based construction method.
The width of the core was built wide enough to allow
truck material transport at full scale. The height of the
core was built large enough to make the crest of the
core to remain dry during low tide. A truck placed on
top of the core crest would thereby be able to
construct the armour layer by dumping armour stones
or by placing with a crane.
Damage to the structure was avoided by covering
the structure with a metallic net. The net ensured that
Table 6
Cross-section details
Parameter Value
Crest width 1.21 m and 1.82 m
Crest height 1.59 m
Front and back slope 1V:2H
Freeboards 0.07, 0.27 and �0.13 m
Armour stone size Dn50=0.108 m
Core stone size 20/40 mm
Armour layer thickness 2Dn50
the armour stones stayed in fixed positions during the
testing.
Two structures with different crest widths were
tested, see Fig. 19. Both structures were symmetric
with 1H:2V slopes and had the characteristics shown
in Table 6. Fig. 20 gives an impression about the size
of the structure.
The core was constructed with limestone of 20/40
mm size and the mass density 2.65 t/m3. The core was
covered by two armour layers of the same stone type,
having the characteristics: W50=3.36 kg, Dn50=10.82
cm, W85 /W15=2.05 and D85 /D15=1.27.
6.3. Measurements
8 resistive wave gauges indicated by bWGQ in
Fig. 21 were used to measure the surface elevation.
Three wave gauges were placed in front of the
paddle to control the wave paddle absorption system
in order to avoid reflections from the paddle. Three
wave gauges were located in front of the structure
and two behind the structure to separate incident and
reflected waves. Pressure sensors bPSQ were
mounted along the flume, especially in front of the
LCS, to investigate the development of standing
wave pattern close the structure. One electromag-
Fig. 20. Construction process.

Fig. 21. Instrumentation.
M. Kramer et al. / Coastal Engineering 52 (2005) 867–885 883
netic current meter was located in the same cross-
section as the wave gauge number 3 (WG3) to
separate incident and reflected waves using the
Hughes method (Hughes, 1993).
Wave conditions were chosen according to real
wave conditions by the Catalan Coast (West Mediter-
ranean Sea). Different irregular test conditions with
JONSWAP spectra and factor c =3.3 were tested.
Regular wave tests were performed with equivalent
root mean square wave height to the irregular waves,
and wave period equal to Tz in the irregular waves.
Table 7 shows the target wave conditions for the
waves in front of the paddle. All waves were
generated at three different water levels giving three
different freeboards, see Table 8.
The random waves were generated with the white
noise method from shift registers. 20 Hz sample
frequency was used during data acquisition.
7. Conclusions
The wave obliquity was one of the main param-
eters, which were studied in the wave basin experi-
ments. The experiments provide unique information
about the influences of this parameter where almost
no research has been done before. Flow velocities
inside and close to the surface of structures were some
of the parameters studied in the small scale wave
Table 7
Target wave conditions
Irregular waves Regular waves
Name Hs [m] Tp [s] Name H [m] T [s]
I1 0.30 2.50 R1 0.30 2.18
I2 0.50 3.09 R2 0.21 2.18
I3 0.40 3.09 R3 0.40 2.68
I4 0.30 3.09 R4 0.28 2.68
I5 0.40 3.58 R5 0.40 3.11
R6 0.28 3.11
flume tests. This subject is not only interesting with
respect to engineering design properties but it
provides also important ecological information on
living conditions for life forms attached to the
structure surface, because the flow velocities causes
exposure to the life forms due to drag forces.
The DELOS experiments have filled some gaps
within existing knowledge providing valuable infor-
mation for establishing design guidelines for low-
crested structures. The paper serves as a reference
paper for companion papers of the Coastal Engineer-
ing Special Issue on DELOS, giving the overview of
new experiments on low-crested breakwaters. The
paper is describing the experiments in order to spread
the knowledge about the unique test databank, and for
stimulation of further use of the databank. Please do
not hesitate to contact the authors for any requests
regarding obtaining the test reports and original data
for research purposes.
Acknowledgements
All the tests were performed for the EU-funded
project DELOS bEnvironmental Design of Low
Crested Coastal Defence StructuresQ within Work
Package 2.4 of Research Task 2, dedicated to the
hydrodynamics, morphodynamics and structural de-
sign of low-crested structures. The authors acknowl-
edge the strong effort and the good work by all the
people involved in the testing.
Table 8
Tested water depths
Water depth by
paddle [m]
Water depth by
LCS toe [m]
Freeboard [m]
2.62 1.52 +0.07 (emergent)
2.42 1.32 +0.27 (emergent)
2.82 1.72 �0.13 (submerged)

M. Kramer et al. / Coastal Engineering 52 (2005) 867–885884
References
Ahrens, J.P., 1987. Characteristics of Reef Breakwaters. Technical
report CERC-87-17, Waterways Experiment Station. US Army
Corps of Engineers.
Borthwick, A., Foote, Y., Ridehalgh, A., 1997. Measurements at A
Cusped Beach in the UKCRF. Coastal Dynamics ’97. ASCE,
pp. 953–963.
Briganti, R., van der Meer, J.W., Buccino, M., Calabrese, M., 2003.
Wave transmission behind low crested structures. ASCE, Proc.
Coastal Structures, Portland, Oregon.
Burcharth, H.F., Vidal, C., Lamberti, A., Franco, L., Noli, A., Van
der Meer, J.W., submitted for publication. Structural stability,
toe protection and construction peculiarities of low crested
breakwaters. Coastal Engineering, DELOS Special Issue.
Caceres, I., Sanchez Arcilla, A., Zanuttigh, B., Lamberti, A.,
Franco, L., 2005—this issue. Wave overtopping and inducing
currents at emergent low crested structures. Coast. Eng. 52.
doi:10.1016/j.coastaleng.2005.09.004.
Calabrese, M., Vicinanza, D., Buccino, M., 2002. Large-scale
experiments on the behaviour of low crested and submerged
breakwaters in presence of broken waves. Proc. 28th Int. Conf.
Coastal Engineering, World Scientific, vol. 2, pp. 1900–1912.
Chapman, B., Ilic, S., Simmonds, D., Chadwick, A., 2000. Physical
model evaluation of the hydrodynamic produced around a
detached breakwater scheme. In: Losada (Ed.), Coastal Struc-
tures d99. Balkema, pp. 803–812.
Christensen, E.D., Zanuttigh, B., Zyserman, J.A., 2003. Validation
of numerical models against laboratory measurements of
waves and currents around low-crested structures. In: Melby,
J.Proc. Coastal Structures (Portland, Oregon, Aug. 26th–29th),
876–888ASCE, Reston, VA.
d’Angremond, K., van der Meer, J.W., de Jong, R.J., 1996. Wave
transmission at low crested structures. ASCE, Proc. ICCE,
Orlando, Florida, pp. 3305–3318.
Debski, D., Loveless, J., 1997. The design and performance of
submerged breakwaters. Report, Ministry of Agricolture,
Fisheries and Food, contract CSA 2606 Bristol University ed.,
UK.
Diskin, M.H., Asce, A.M., Vajda, M.L., Amir, I., 1970. Piling-up
behind low and submerged permeable breakwaters. J. Waterw.
Harb. Div., ASCE 96, 353–372.
Drønen, N., Karunarathna, H., Fredsøe, J., Sumer, M., Deigaard, R.,
2002. An experimental study of rip channel flow. Coast. Eng.
45, 223–238.
Frigaard, P., Brorsen, M., 1993. A time domain method for
separating incident and reflected irregular waves. Coast. Eng.
24, 205–215.
Garcia, N., Lara, J.L., Losada, I.J., 2004. 2-D numerical analysis of
near-field flow at low-crested permeable breakwaters. Coast.
Eng. 51 (10), 991–1020.
Gironella, X., 2005. Analisis experimental a gran escala de diques
de baja cota de coronacion. PhD thesis, Dept. of Hydraulics,
Maritime and Environmental Engineering, Technical University
of Catalonia. In Spanish.
Gironella, X., Sanchez-Arcilla, A., 1999. Hydrodynamic
behaviour of submerged breakwaters. Some remarks based
on experimental results. Coastal Structures, Santander,
pp. 891–896.
Gourlay, G., 1974. Wave set-up and wave generated currents in the
lee of a breakwater or a headland. Proc. Coastal Eng. ’74,
pp. 1976–1995.
Haller, M., Dalrymple, R.A., Svendsen, I.A., 2002. Experimental
study of nearshore dynamics on a barred beach with rip
channels. J. Geophys. Res. 107 (C6), 1–21.
Hamm, L., 1992. Directional wave propagation over a rip
channel: an experiment. Proc. Coastal Eng. ’92, vol. 31. ASCE,
pp. 226–239.
Hughes, S.A., 1993. Laboratory wave reflection analysis using
co-located gages. Coastal Engineering, vol. 20. Elsevier,
pp. 223–247.
Ilic, S.B., Chapman, A., Chadwick, J., Pan, S., O’Connor, B.A.,
MacDonald, N.J., 2000. Laboratory measurements of flow
around a detached breakwater scheme. In: Losada (Ed.), Coastal
Structures ’99. Balkema, pp. 813–855.
Johnson, H.K., Karambas, Th., Avgeris, J., Zanuttigh, B.,
Gonzalez, D., Caceres, I., 2005—this issue. Modelling of
wave and currents around submerged breakwaters. Coast. Eng.
52. doi:10.1016/j.coastaleng.2005.09.011.
Kobayashi, N., Wurjanto, A., 1989. Wave transmission over
submerged breakwaters. J. Waterw. Port Coast. Ocean Eng.
115 (5), 662–680.
Kramer, M., Burcharth, H.F., 2003. Stability of low-crested break-
waters in shallow water short crested waves. Proc. Coastal
Structures 2003 Conference, Portland, Oregon, USA.
Kramer, M., Zanuttigh, B., Baoxing, W., Van der Meer, J.W.,
Lamberti, A., Burcharth, H.F., 2003. Wave basin experiments.
Internal report, DELOS deliverable D31, available from the
Internet www.delos.unibo.it.
Lamberti, A., Zanuttigh, B., Martinelli, L., 2004. Wave run-up,
overtopping and percolation over low crested structures. In:
Smith, J.M. (Ed.), Proc. Coastal Eng. 2004 (Lisbon,
Sept.19th–24th) vol. 4. World Scientific Publishing Co.,
USA, pp. 4178–4190.
Lamberti, A., Archetti, R., Kramer, M., Paphitis, D., Mosso, C.,
Risio, M.D., 2005—this issue. European experience of low
crested structures for coastal management. Coast. Eng. 52.
doi:10.1016/j.coastaleng.2005.09.010.
Losada, I.J., Dalrymple, R.A., Losada, M.A., 1998. Wave induced
mean flows in vertical rubble mound structures. Coast. Eng. 35,
251–282.
Losada, I., Lara, J.L., Damgaard, E., Garcia, N., 2005—this issue.
Modelling of velocity and turbulence fields around and within
low crested rubble-mound breakwaters. Coast. Eng. 52.
doi:10.1016/j.coastaleng.2005.09.008.
Loveless, J., Debski, D., 1997. The Design and Performance of
Submerged Breakwaters. Ministry of Agriculture Fisheries and
Food, contract CSA 2606, Department of Civil Engineering,
University of Bristol.
Mansard, E.P., Funke, E.R., 1980. The measurement of incident and
reflected spectra using a least square method. Proc. 17th Int.
Conf. On Coastal Engineering, vol. 1. ASCE, pp. 154–172.
Mitsuyasu, H., Tasai, F., Suhara, T., Mizuno, S., Onkusu, M.,
Honda, T., Rukiiski, K., 1975. Observations of the directional

M. Kramer et al. / Coastal Engineering 52 (2005) 867–885 885
spectrum of ocean waves using a cloverleaf buoy. J. Phys.
Oceanogr. I, 750–760.
Mory, M., Hamm, L., 1997. Wave height, setup and current around
a detached breakwater submitted to regular or random wave
forcing. Coast. Eng. 31, 77–96.
Rivero, F.J., S-Arcilla, A., Gironella, X., Corrons, A., 1997. Large-
scale hydrodynamic experiments on submerged breakwaters.
Coastal Dynamics’97.
Ruol, P., Faedo, A., 2002. Physical model study on low-crested
structures under breaking wave conditions. Proc. V MED-
COAST Workshops on Beaches of the Mediterranean and Black
Sea, Turkey, Ozhan, pp. 83–96.
Sanchez-Arcilla, A., Gironella, X., Verges, D., Sierra, J.P., Pena, C.,
Moreno, L., 2000. Submerged breakwaters and bbarsQ. Fromhydrodynamics to functional design. Proc. 27th Int. Conf. On
Coastal Engineering, vol. 2. ASCE, Sydney, Australia,
pp. 1821–1835.
Sumer, M., Fredsøe, J., Lamberti, A., Zanuttigh, B., Dixen, M.,
Gislason, K., Di Penta, A., 2005—this issue. Local scour and
erosion around low-crested structures. Coast. Eng. 52.
doi:10.1016/j.coastaleng.2005.09.012.
Sutherland, J., Whitehouse, R.J.S., Chapman, B., 2000. Scour and
deposition around a detached rubble-mound breakwater. In:
Losada (Ed.), Coastal Structures ’99. Balkema, pp. 897–904.
Van der Meer, J.W., Daemen, I.F.R., 1994. Stability and wave
transmission at low crested rubble mound structures. J. Waterw.
Port Coast. Ocean Eng., ASCE 1, 1–19.
Van der Meer, J.W., Tutuarima, W.H., Burger, G., 1996. Influence
of rock shape and grading on stability of low-crested structures.
Proc. 25th International Conference on Coastal Engineering,
Orlando, Florida, pp. 1957–1970. chapter 152.
Van der Meer, J.W., Wang, B., Wolters, A., Zanuttigh, B., Kramer,
M., 2003. Oblique wave transmission over low-crested struc-
tures. Proc. Coastal Structures 2003 Conference, Portland,
Oregon, USA.
Van der Meer, J.W., Briganti, R., Zanuttigh, B., Wang, B., 2005—
this issue. Wave transmission and reflection at low crested
structures: design formulae, oblique wave attack and spectral
change. Coast. Eng. 52. doi:10.1016/j.coastaleng.2005.09.005.
Vidal, C., Gironella, X., 2003. Wave channel experiments. Internal
report, DELOS deliverable D32, available from the Internet
www.delos.unibo.it.
Vidal, C., Losada, M.A., Medina, R., Mansard, E.P.D., Gomez-Pina,
G., 1992. A universal analysis for the stability of both low-
crested and submerged breakwaters. Proc. 23rd International
Conference on Coastal Engineering, Italy, pp. 1679–1692.
Zanuttigh, B., Lamberti, A., 2006. Experimental analysis and
numerical simulations of waves and current flows around low-
crested coastal defence structures. In: Demirbilek, Z. (Ed.),
Journal of Waterway, Port, Coastal and Ocean Engineering, vol.
132 (1), ASCE, Reston, VA.


