Embed Size (px)
Citation preview

onvl ORNL/TM-12903
OAK RIDGE NATIONAL LABORATORY
MJHr*TilSI MA 19I
Evaluation of Improved Techniques for the Removal of 9 0Sr and 1 3 7Cs from
Process Wastewater and Groundwater: Chabazite Zeolite Baseline Study
D. T. Bostick W. D. Arnold, Jr.
P. A. Taylor D. R. McTaggart M. W. Burgess
B. Guo
MANAGED BY MARTIN MARIETTA ENFRGY SYSTEMS, INC. FOR THE UNITED STATES DEPARTMENT OF ENERGY
,f% p ( B f sea.
KbCEIV HAY 1 9 1985
DISTRIBUTION OF THIS DOCUMENT IS UNLIMITED O S T l

This report has been reproduced directly from the best available copy.
Available to DOE and DOE contractors from the Office of Scientific and Technical Information, P.O. Box 62, Oak Ridge, TN 37831; prices available from (615) 576-8401, FTS 626-8401.
Available to the public from the National Technical Information Service, U.S. Department of Commerce, 5285 Port Royal Rd., Springfield, VA 22161.
This report was prepared as an account of work sponsored by an agency of the United States Government. Neither the United States Government nor any agency thereof, nor any of their employees, makes any warranty, express or implied, or assumes any legal liability or responsibility for the accuracy, completeness, or usefulness of any information, apparatus, product, or process disclosed, or represents that its use would not infringe privately owned rights. Reference herein to any specific commercial product, process, or service by trade name, trademark, manufacturer, or otherwise, does not necessarily constitute or imply its endorsement, recommendation, or favoring by the United States Government or any agency thereof. The views and opinions of authors expressed herein do not necessarily state or reflect those of the United States Government or any agency thereof.

DISCLAIMER
Portions of this document may be illegible in electronic image products. Images are produced from the best available original document.

ORNL/TM-12903
EVALUATION OF IMPROVED TECHNIQUES FOR THE REMOVAL OF »°Sr AND 1 3 7Cs FROM PROCESS
WASTEWATER AND GROUNDWATER: CHABAZITE ZEOLITE BASELINE STUDY
D. T. Bostick W.D. Arnold, Jr.
P. A. Taylor D. R. McTaggart M. W. Burgess
B. Guo
Manuscript Completed: November 28,1994 Date Published: April 1995
Prepared for U.S. DEPARTMENT OF ENERGY Office of Technology Development
Integrated Program for Efficient Separations Washington, D.C. 20874
Prepared by OAK RIDGE NATIONAL LABORATORY
Oak Ridge, Tennessee 37831-6285 managed by
MARTIN MARIETTA ENERGY SYSTEMS, INC. for the
U.S. DEPARTMENT OF ENERGY under contract DE-AC05-84OR21400
MASTER DISTRIBUTION OF THIS DOCUMENT IS UNLIMiT - ^


CONTENTS
Page
LIST OF TABLES v LIST OF FIGURES vii ACRONYMS AND ABBREVIATIONS ix ABSTRACT xi
1. INTRODUCTION 1
2. WASTE STREAM SELECTION AND SIMULANT FORMULATION 2 2.1 WASTE STREAM SELECTION 2 2.2 PWTP SIMULANT FORMULATION 5
3. DECONTAMINATION EFFICIENCY OF A STANDARD TREATMENT METHOD 9 3.1 SELECTION OF CHABAZITE AS THE BASELINE TREATMENT
METHOD 9 3.2 PREPARATION OF THE CHABAZITE ZEOLITE 11 3.3 KINETIC AND EQUILIBRIUM STUDIES WITH TSM-300
CHABAZITE ZEOLITE 11 3.3.1 Test Procedures 11 3.3.2 Determination of TSM-300 Equilibration Time 13 3.3.3 Sr and Cs Sorption Isotherms of TSM-300 13 3.3.4 Comparison of Washed Versus Unwashed Chabazite
Zeolite 17 3.3.5 Effect of Calcium, Sodium, Potassium, and Magnesium
on Sr and Cs Sorption 18
4. TREATMENT OF ACTUAL PWTP FEED PROCESS WATER WITH
TSM-300 19
5. SMALL-COLUMN TESTING OF WASHED TSM-300 25
6. SUMMARY 30
7. REFERENCES 32
iii


LIST OF TABLES
Page
1 DOE site groundwater and process wastewater compositions 3
2 Chemical analysis of PWTP feed samples and composition of simulant—metal analysis by ICP 6
3 Chemical analysis of PWTP feed samples and composition of simulant—anion analysis by ion chromatography 7
4. Radiochemical analysis of PWTP feed 7
5 Chemical formulation of 4 L of PWTP feed simulant 8
6 Sorption ratios for Sr and Cs (Rj) on washed and unwashed TSM-300 18
7 Composition of actual PWTP feed wastewater sample 22
4


LIST OF FIGURES
Page
1 Sr and Cs equilibration time on washed TSM-300 chabazite
zeolite 14
2 Sr sorption from PWTP simulant on TSM-300 15
3 Cs sorption fromPWTP simulant on TSM-300 16 4 Sr sorption as a function of total cation concentration
in PWTP simulant 20
5 Cs sorption as a function of total cation concentration
in PWTP simulant 21
6 Sr sorption from actual PWTP feed and PWTP feed simulant 23
7 Cs sorption from actual PWTP feed and PWTP feed simulant 24
8 Breakthrough curves for the major cation concentrations with washed TSM-300 28
9 Sr and Cs breakthrough curves for washed TSM-300 zeolite 29
vii


ACRONYMS AND ABBREVIATIONS
ESPIP Efficient Separations/Processes—Integrated Program FY fiscal year ICP inductively coupled plasma Kd distribution coefficient ORNL Oak Ridge National Laboratory PGDP Paducah Gaseous Diffusion Plant PWTP Process Waste Treatment Plant rcf relative centrifugal force R s sorption ratio WAG Waste Area Grouping


ABSTRACT
Standard waste treatment procedures for the removal of ^Sr and , 3 7 Cs from contaminated
groundwater and process wastewaters generate large volumes of secondary contaminated wastes.
Several new sorbent materials, ion exchangers, and other processes hold the promise of treating
large volumes of contaminated water while niinimizing the generation of secondary low-level
radioactive wastes. As part of the Efficient Separations/Processes—Integrated Program
(ESPIP), these new treatment techniques will be compared with standard processes to define
their effectiveness for the removal of radioactive strontium (Sr) and cesium (Cs), as well as to
gauge the quantity of secondary radioactive waste generated by the new processes.
This report summarizes the efforts made to design standardized testing procedures to evaluate
the sorption characteristics of a baseline wastewater treatment technique. Definition of the
experimental procedures, as well as a summary of the benchmark sorption technique, will
provide the framework with which to compare newly evolving treatment technologies.
Accomplishments include selecting the feed stream to the Process Waste Treatment Plant
(PWTP) at Oak Ridge National Laboratory as representative of the prototypical contaminated
wastewater of many DOE sites. Samples from the PWTP feed stream were collected and
analyzed for metals, anions, total Sr and Cs, radioactive Sr and Cs, alkalinity, pH, and density.
The cumulative sample data were used to formulate a simulant that will be used as a standard
waste surrogate for comparative testing of selected treatment methods.
Based on a literature review of current wastewater treatment technology, Sr and Cs sorption on
natural chabazite zeolite was selected as the baseline treatment method for the ESPIP study. A
stock supply of TSM-300 zeolite, acquired from Steelhead Specialty Minerals (Spokane,
Washington), was prepared by pretreating the sorbent with 2MNaCL removing the excess
sodium with water, air drying the washed zeolite, and finally selecting the -20 to +50 mesh
fraction for testing.
Testing of the standard zeolite treatment included determining the Sr and Cs sorption rates from
the wastewater simulant. The Sr and Cs sorption ratios were defined for the prepared
xi

zeolite and compared with those obtained on unwashed TSM-300. The Sr sorption isotherm
using batch testing on TSM-300 exhibited a curvilinear response. Strontium loading deviated
positively from linearity above a Sr loading of 2 meq/kg. The sorption ratio (RJ at low Sr
loading on the washed zeolite is approximately 17,000 L/kg; the comparable R, on unwashed
zeolite was 30% lower. The Cs sorption isotherm was found to be linear with Cs solution
concentration. The R, for Cs on prepared zeolite is 80,000 L/kg as compared with 50,000 L/kg
on the unwashed TSM-300. The effect of calcium, sodium, potassium, and magnesium on Sr
and Cs sorption was also determined over the concentration range at which each cation is
typically found in groundwater. Radionuclide sorption decreased as the concentration of any of
these cations increased. Potassium exhibited the most significant effect; the R, values for both
Sr and Cs decrease by 50% over a potassium concentration range of 0.13 to 1.0 meq/L.
Magnesium, sodium, and calcium significantly depress zeolite sorption capacity if they are
present in the 0- to 4-meq/L concentration range. Further loss of sorption capacity is minimal
above this concentration range. A 20% reduction in R, of either nuclide is observed when
sodium concentration in the simulant is increased from 0.65 to 1.35 meq/L. The R„ for Cs is
reduced by 35% when the calcium concentration in the simulant is doubled from 1.95 to 3.89
meq/L. The R, for Sr decreases by 80% over this same calcium concentration range.
The Sr and Cs sorption from actual PWTP feed wastewater on washed TSM-300 was tested,
both to serve as the baseline treatment methodology for actual process wastewater and as a
means to validate the composition of the PWTP feed simulant that will be used to test the new
treatment technologies. The sorption profiles of the actual PWTP feed sample were nearly
identical to those obtained with the simulant, although the R, values for Sr and Cs were
approximately 80% and 90%, respectively, of the corresponding values determined using the
simulant solution. Maximum Sr loading in the authentic wastewater was calculated to be
24 meq/kg, and maximum Cs loading was determined to be 0.17 meq/kg.
A small-column test with prepared TSM-300 using wastewater simulant is under way. Elution
results indicate that the chabazite zeolite has the following selectivity: Cs > Sr > Ca >
Mg > Na. Strontium breakthrough was first noted at approximately 3000 bed volumes; 50%
breakthrough was observed at 13,000 bed volumes. Incipient Cs breakthrough occurred at
12,500 bed volumes. On completion of this test, the efficiency of the benchmark waste
xii

treatment method should be defined and work will begin on comparison testing of the new
treatment technologies.
xiu

1. INTRODUCTION
Most U.S. Department of Energy (DOE) sites manage very large volumes of dilute liquid wastes
which must be treated before they can be discharged to the environment. The waste is composed
principally of contaminated groundwater and cooling water. Process wastewaters generated as a
result of research programs and radiochemical production contribute to a lesser extent to the
overall DOE inventory. The principal radionuclide contaminants of the radiological wastewaters
are ^Sr and l 3 7 Cs, which may also be contaminated with trace quantities of heavy metals and
organics.
Current treatment processes for the decontamination of the wastewaters typically involve the
removal of the radionuclides by ion exchange on organic resins and/or inorganic zeolites. One of
the drawbacks in using these technologies is the generation of large amounts of solid secondary
wastes, which must be disposed of as radioactive waste. Because the handling and disposal of
large quantities of contaminated solid waste are prohibitively expensive, new processes are
needed which will minimize the volume of the secondary waste produced during wastewater
treatment.
The goal of Subtask B under TTP OR1-3-20-12 is to test new sorbent materials,
ion-exchanger materials, or other processes which might be more selective for the removal of
^Sr and 1 3 7Cs than the standard treatment methods. New technologies to be included in the study
are those based on the use of engineered crystalline silicotitanates, pillard clays, solid-phase
extraction using selective molecular recognition compounds, and advanced ion-exchange and
solvent-extraction systems. Initial task activities have been directed toward laying the
groundwork for the comparative testing of the new technologies with a standard treatment
technique. Samples of the new innovative adsorbents will become available during the next
fiscal year. Laboratory efforts have focused on (1) selecting a process waste stream for
treatment studies that typified wastewater and groundwater encountered at DOE sites,
(2) formulating a simulant of the waste stream so that a standard waste solution can be used for
comparative testing of the selected treatment methods, (3) documenting the
decontamination efficiency for a benchmark treatment technique, and, finally, (4) treating an
actual sample of the selected waste stream with the standard technique. The development of a

defined waste simulant and the determination of the decontamination efficiency of the baseline
treatment technique will form the basis with which to compare the effectiveness of all new
treatment technologies that will be studied under this subtask.
2. WASTE STREAM SELECTION AND SIMULANT FORMULATION
2.1 WASTE STREAM SELECTION
The first task in the study was to select a waste stream that typifies groundwater and/or process
wastewaters generally encountered at DOE facilities. The appropriate selection of the waste
stream would ensure that data generated in the study would be applicable to other DOE sites.
Once the composition of the stream was determined by chemical analysis, a simulant would be
formulated and used for the standard testing of the various treatment technologies. The optimum
operating parameters of a baseline treatment process can then be determined with the simulant.
The effectiveness of the standard treatment process would then be evaluated on an authentic
sample of the waste stream.
A review of reported data suggested that the feed stream to die Process Waste Treatment Plant
(PWTP) at Oak Ridge National Laboratory (ORNL) appeared to have a composition similar to
that of typical DOE wastewater and/or groundwater. The wastewater is derived from
contaminated groundwater, once-through cooling water, evaporator condensates, and laboratory
wastewater generated on-site. The typical radionuclide composition of the feed is 750 Bq/L ^Sr
and 350 Bq/L 1 3 7Cs, although activities as high as 8000 Bq/L ^Sr and 1000 Bq/L 1 3 7Cs have
been observed.1 As can be seen in Table 1, the principal chemical constituents previously
reported for the PWTP feed are calcium, magnesium, and sodium bicarbonates, which are
introduced by contaminated groundwater. Table 1 also summarizes the composition of seep
water samples collected at three Waste Area Groupings (WAGs) located on the ORNL
reservation, as well as the composition of groundwater found at the Paducah Gaseous Diffusion
Plant (PGDP). Data describing a Hanford well sample are also included in the table to
demonstrate some extremes in sodium, silica, fluoride, and pH values which may be encountered
in the processing of low-level contaminated groundwater at DOE sites. The final column in the
2

Table 1. DOE site groundwater and process wastewater compositions
Concentration (mg/L)
PWTP
Element WAG-5* WAG-6 , , f WAG-r feed0 PGDPd Hanford' General
Al 0.21 NR 0.22 0.48 NR NR 0.003 to
0.083
B 0.33 <0.88 NR <0.08 NR 1.4 0 to 0.50
Ca 130 106 91 75 33.5 1.3 3.2 to 121
Co 0.008 < 0.044 0.035 < 0.004 NR NR NR
Cr NR 0.086 0.02 0.008 0.071 NR NDto
0.001
Cu NR <0.08 0.016 0.037 0.013 NR 0 to 0.015
Fe 0.65 <0.55 1.1 2.2 0.19 NR 0.001 to
6.6
K NR NR 4.1 2 NR 1.9 0.4 to 30
Mg 19 14.0 22 12 8.85 0.02 0.3 to 120
Mn 0.2 0.031 0.24 0.16 NR NR NDto
0.34
Na 25 8.06 130 64 19.3 299.2 6.1 to 129
Ni 0.016 0.161 0.11 0.024 0.061 Nr NDto
< 0.015
Pb NR <0.55 0.02 <0.2 NR NR NDto
0.038
Si 8.6 7.23 NR 2.6 NR 54.9 2.0 to 33.6
Sr 0.7 0.219 NR 0.19 NR NR 0.019 to
6.3
Zn NR <0.55 NR 0.27 0.015 NR NDto
<0.47

Table 1 (continued) Concentration (mg/L)
PWTP
Component WAG-5* WAG-6 a , f WAG-7* feed" PGDPd Hanford6 General
HC0 3 NR NR NR 93 NR 42.9 55 to 364
CO, NR NR NR 7 61.8* 34 0 t o 5
so4 58 NR 160 28 11.7 113.4 0.8 to 572
NO, NR NR 970 11 39 NR 0.0 to 17
CI 12 NR 13 11 28 214.8 2.0 to 92
F 1 NR 2.2 1 0.12 37.1 0.0 to 7.0
Alkalinity 300 200 280 125 103 NR NR
PH 6.0 to 8.7 4.8 to 7.9 6.6 to 8.6 NR 6.1 to 7.2 9.9 6.7 to 8.7
Conductivity 0.4 0.31 0.73 NR 0.4 NR NR
(ms/cm)
NR = not reported; ND = not detected. *Oak Ridge Reservation Environmental Report for 1990, Volume 2: Data Presentation, ES/ESH-18/V2. bORNL Analytical Chemistry Division analysis of sample submitted 07/30/93. CT. E. Kent, S. A. Richardson, A. C. Coroneos, A. J. Lucero, and J. J. Perona, Zeolite Ion-Exchange
System Development for Treatment ofORNL Process Wastewater, Letter Report, August 1993. dG. D. Del Cul, W. D. Bostick, et al., "Technetium-99 Removal from Process Solutions and
Contaminated Groundwater," Sep. Sci. Technol., 28 (1-3), 551 (1993). eG. F. Vandergrift, et al., "Interaction of Groundwater and Basalt Fissure Surfaces and Its Effect on
the Migration of Actinides" (1984). Conrad P. Staub, ed., Practical Handbook of Environmental Control, CRC Press, Boca Raton, Fla.,
1989. ^otal carbonate from alkalinity.
table summarizes the spread in concentrations of typical groundwater components.2 The composition of the PWTP feed wastewater certainly falls within the ranges of concentration of the general description for groundwater composition. It is also similar in content to groundwater samples of local DOE facilities (e.g., PGDP). The radiological content of the PWTP feed stream is typical of process wastewaters. The radioactivity of process wastewater is generally wimin 103 to 106 Bq/L,3 the primary nuclides being *& and 137Cs. As such, the feed to the PWTP appears to be a good selection for the representative waste stream for baseline testing of wastewater treatment techniques for this particular task.
4

2.2 PWTP SIMULANT FORMULATION
The second initiative of the program was to formulate a simulant that would reflect the current
composition of the PWTP feed. The simulant would ensure a constant composition of
wastewater for the comparative testing of the benchmark technology against new processes.
PWTP feed samples were collected on a weekly basis and submitted for inductively coupled
plasma (ICP) metal analysis, anion chromatographic analysis, total Sr and Cs content, "'Sr and
i34,i37£s a c t j v i t v > sample pH, and alkalinity. The analysis of pH and carbonate and bicarbonate
content was also determined on the day each sample was collected.4 The compositions of the
individual feed samples and their average compositions are summarized in Tables 2 through 4.
Table 2 identifies the average cation concentrations of the PWTP feed samples. The final
column in the table states the concentration of each cation to be included in the simulant. A
decision was made to include cations in the simulant that were present in concentrations equal
to or greater than 1 ppm in any of the analyzed PWTP feed samples. Strontium and Cs are
the exceptions to this delineation. Strontium was included at a level of 0.1 ppm to reflect the
average concentration of total Sr in the PWTP feed. This Sr concentration is also typical of
process water in the local DOE area and represents a midrange value present in groundwater.
Cesium was not detected above the 0.00005-ppm detection limit of the ICP-mass spectrome
ter. However, an average of 274 Bq/L 1 3 4 , 1 3 7 Cs was detected radiochemically, as presented in
Table 4. The total Cs added to the simulant is present at a tracer level of 1.12 x 10⁶ Bq/L 1 3 7Cs (equivalent to 0.00034 mg/L Cs). Both the levels of ^Sr and 1 3 7Cs activity in the
simulant were selected on the basis of the counting efficiency of the gamma spectrometer to be
used throughout the sorption studies.
The added 1 3 7Cs tracer activity also reflects the upper limit for Cs activity typical of process
wastewaters. All anions above the detection limit of the ion chromatograph were included in the
simulant. Values for the concentration level of each anion in the actual PWTP samples and the
selected concentrations for the simulant are listed in Table 3. Note that the selected cation and
anion contents in the simulant fall within the concentration ranges reported for general
groundwater composition as presented in Table 1.
5

Table 2. Chemical analysis of PWTP feed samples and composition of simulant — metal analysis by ICP
Concentration (ppm)
Element Sample 1 Sample 2 Sample 3 Avg Simulant
Ag <0.005 O.005 <0.005 <0.005 —
Al 0.140 O.050 0.540 0227 —
As <0.050 <0.0.050 <0.050 <0.050 —
B O.080 O.080 O.080 O.080 —
Ba 0.031 0.022 0.043 0.032 —
Be <0.001 O.001 <0.001 <0.001 —
Ca 35.000 37.000 44.000 38.667 39,0
Cd <0.005 <0.005 <0.005 <0.005 —
Co 0.052 <0.004 <0.004 0.017 —
Cr 0.049 <0.004 O.004 0.016 —
Cs <0.0005 O.00005 <0.00005 O.00005 0.00034
Cu 0.020 <0.007 0.034 0.018 —
Fe 0.190 <0.050 1.000 0.397 0.4
K 3.000 <2.000 <2.000 1.000 1.0
Li 0.008 O.005 O.005 0.003 —
Mg 7.500 7.900 8.700 8.033 8.0
Mn 0.180 0.003 0.024 0.069 —
Mo <0.040 <0.040 O.040 <0.040 —
Na 8.000 12.000 23.000 14.333 15.0
Ni <.010 <0.010 <0.010 <0.010 —
P 0.580 1.500 0.460 0.847 2
Pb <0.050 O.050 <0.050 O.050 —
Sb O.050 O.050 O.050 <0.050 —
Se O.050 <0.050 O.050 O.050 —
Si 3.400 2.500 3.300 3.067 3
Sn O.050 <0.050 <0.050 <0.050 —
Sr 0.089 0.100 0.120 0.103 0.1
Ti O.020 <0.020 <0.020 O.020 —
V <0.002 O.002 <0.002 <0.002 —
Zn 0.045 0.024 0.170 0.080 —
Zr <0.020 <0.020 <0.020 <0.020 —
6

Table 3 . Chemical analysis of PWTP feed samples and composition of simulant — anion analysis by ion chromatography
Concentration (mg/L)
Sample 1 Sample 2 Sample 3 Avg Simulant
Alkalinity" 105.0 110.0 120.0 111.7 126
Anions
cr F"
N 0 3 "
NCV
P O 4
3 -
S04
2"
8.3 8.4 9.3 8.7 8.7 0.8 0.9 0.8 0.8 0.8
4.3 4.0 7.6 5.3 5.3
<0.1 <0.1 <0.1 <0.1 —
<0.5 5.5 0.8 2.1 2.1
21.0 22.0 21.0 21.3 21.3
pH 8.45 8.52 9.30 8.8 8.3
"Measured as CaCO,.
Table 4. Radiochemical analysis of PWTP feed
Concentration (Bq/L)
Nuclide Sample 1 Sample 2 Sample 3 Average Simulant 1 3 4 Cs 2 0.32 0.12 0.8 —
1 3 7 Cs 450 120 250 273 1.1 x 10⁶
8 9 , 0 0 S r 360 330 370 353 8.8 x 10⁵
(as^Sr)
7

A summation of the average milliequivalents (meq) of cationic and anionic species present in the PWTP samples indicates that ICP and ion chromatographic data are in good agreement. Based on the chemical analysis, approximately 3.3 meq/L cationic species is present in solution as compared with 3.7 meq/L anionic species. Calculation of anionic charge was made by assuming that the silica is present as Si03
2~, that any phosphorus occurs as P04
3~, and that the average alkalinity is the result of 0.3 meq/L C03
2~ and 2.26 meq/L HC03~. Table 5 describes the formulation of wastewater simulant to prepare a 4-L solution containing the anions and cations at the selected concentrations presented in Tables 2 through 4. Inactive Sr, ^Sr, and 137Cs are added to the simulant just prior to experimentation to reduce the possibility of losing these cations by sorption onto labware.
Table 5. Chemical formulation of 4 L of PWTP feed simulant
Chemical Weight (g) Chemical Weight (g)
CaC03 0.36604 NaF 0.00707
Ca(N03)2 • 4H20 0.04037 Na3P04 • 12H20 0.03362
CaClj 0.00710 NajSiOs • 9H20 0.12548
MgS04 0.10174 NaHC03 0.10863
MgCt • 6H20 0.09582 K 2C0 3 0.00707
Ferri-Floc* 0.160 mL
'Solution containing 10,000 ppm iron and 25,800 ppm S0 4.
The difficulty encountered in preparing the simulant is that the solubility of CaC03 in water is limited to approximately 14 ppm, whereas the required quantity to prepare the wastewater simulant is 41 ppm. Several batches of the simulant were prepared to test the most effective means to add the reagents to nanopure water in a manner which would reduce the precipitation of the components. The fewest solids were formed when the calcium salts were added to 4 L of stirred nanopure water at room temperature, followed by the addition of the remainder of
8

the reagents. To improve the solubility of the calcium salts, dry ice was added to the solution to decrease the pH; stirring was continued for an additional hour. The simulant was then allowed to settle for 2 days before the solution was filtered with a 0.45-/*m cellulose nitrate membrane filter under house vacuum. Some solids were noted on the filter membrane, suggesting the loss by precipitation of some sparingly soluble salts (e.g., ferric, calcium, and silicate salts.) An acidified aliquot of the filtered solution was submitted for ICP analysis to determine the final concentration of cations in the simulant. According to the analysis, less than 10% of the calcium and magnesium was lost to precipitation. The simulant contained the target concentration of 15 ppm sodium. Ferric ion concentration was not detected above the 0.5-ppm detection limit of the ICP; the silica concentration of the filtrate was 5 ppm (equivalent to 13.6 ppm Si03
2~). The density of the wastewater simulant was 0.9965 g/L at 27°C. The final simulant solution was stored in a polypropylene container to minimize leaching of minerals or component loss to the storage vessel.
3. DECONTAMINATION EFFICIENCY OF A STANDARD TREATMENT METHOD
3.1 SELECTION OF CHABAZITE ZEOLITE AS THE BASELINE TREATMENT METHOD
Since the early 1900s, zeolites have been used for water treatment5 primarily as a means of removing calcium and magnesium in the softening of water. More recently, zeolites have been employed to remove heavy metals from process water and to decontaminate radioactive waste solutions.6 West Valley Nuclear Services Company,7,8 the British Nuclear Fuels, and the Savannah River Plant9 use zeolites to treat process wastewater containing Cs and/or Sr. As a result of a variety of bench-scale and pilot-scale treatability studies performed at ORNL, zeolite treatment has been selected to remove Cs and Sr from PWTP feed wastewater in a scheduled upgrade of the PWTP facility.1011,12 Use of zeolites has also been suggested for the decontamination of aqueous solutions generated during in situ soil flushing and leaching at contaminated DOE sites. The process has been demonstrated in bench-scale studies13 and has been proposed for use in the field. Considering the wealth of information available on zeolite treatment and the prevalent use of zeolites in the decontamination of process wastewater, ion
9

exchange on zeolites was selected as the reference treatment technique from which to compare new treatment technologies studied in this task.
The main body of research concerning the application of zeolites to ORNL wastewater decontamination has been performed using chabazite zeolite. Bench-scale tests indicated that chabazite zeolites have a very high sorption capacity for Cs. The sorption capacity for Sr is much lower than for Cs, although zeolites demonstrate the highest capacity for Sr removal in the presence of nonradioactive ions of any sorbent studied thus far. The natural zeolite was selected over the synthetic zeolite, Ionsiv IE-95, because the former was found to have a higher capacity for "Sr sorption.14
Stock chabazite zeolite was purchased from Steelhead Specialty Minerals under the product name TSM-300. The natural zeolite is mined from the Bowie deposit in Arizona by GSA Resources, Inc. (Cortaro, Arkansas). The product specification sheet describes the material as Carbasorb-Sodium, a natural herschelite-sodium chabazite (CHA) having a typical anhydrous chemical composition of
Si02:68.1% A1203: 18.59% FeA: 2.84% CaO: 0.27% MgO: 0.75% Nap: 8.32% KjO: 1.12%,
with the dominant cation being sodium. The chabazite has a framework of large ellipsoidal cavities; the entrance to these cavities is through six 8-ring pores having free diameters of 4.1 by 3.7 angstroms. The crystalline lattice structure accounts for the use of the zeolite in gas sorption applications, while limiting ion-exchange sites to the exterior surface of the lattice in liquid applications. The porous zeolite has a surface area of 500 to 600 m2/g. The zeolite exchange capacity, determined with ion exchange of ammonium ion, is 2.20 meq/g ammonia. The chabazite is stable to pH 4; below this value the material begins to dealuminate. The approximate exchange selectivities as stated in the product literature are
TT > Cs + > K + > Ag+ > Rb+ > NH 4
+ > Pb 2 + > Na+
= Ba+ > Sr2* > Ca 2 + > Li + ."
10

3.2 PREPARATION OF THE CHABAZITE ZEOLITE
A stock supply of the chabazite zeolite was prepared by first performing a sieve analysis16 on three 50-g portions of TSM-300 zeolite nominally sized as -20 to +50 mesh. Approximately 20% of the material was discarded as fines, having a mesh size greater than 50. The high fines content in the sample is typical of natural zeolites and is due to the friable nature of the chabazite zeolite, which is easily fractured during storage or handling. The -20/+50 fractions of the three zeolite samples were converted completely to the sodium form to remove any natural Cs or Sr that may be on the surface of the sorbent. The zeolite fractions were initially contacted with 200 mL of 2 N NaCl for 1 h; the samples were stirred constandy on a orbital shaker. After the zeolite samples were centrifuged, fresh NaCl solution was added to the zeolite and the process repeated for three additional saline washes. A fifth NaCl wash was performed by loading the individual fractions of the zeolite in a 1-in.- ID column. The salt solution was pumped upflow through the bed at a flow rate of 5 mL/min. Excess sodium was removed from the zeolite by subsequently passing approximately 1500 mL nanopure water through the column. ICP analysis of the final fraction of wash water indicated that no more than 14 ppm sodium was present in the final water rinsate. This level of free sodium in the water would reflect 7 /*g of free sodium per gram of zeolite, an insignificant quantity compared with the sodium content that would be present in 10-mL synthetic PWTP samples used for batch testing with up to 0.1 g of washed zeolite. The converted zeolites were air dried; the final water content of the dried material was determined to be 7.1 % (w/w). The dried zeolite fractions represent the stock supply of sorbent for the standard treatment method.
3.3 KINETIC AND EQUILIBRIUM STUDIES WITH TSM-300 CHABAZITE ZEOLITE
3.3.1 Test Procedures
Sorption measurements were made in batch equilibrium tests. The 10-mL solutions and exchanger (5-100 mg) were contacted in screw-cap polycarbonate centrifuge tubes by mixing on a Labquake shaker, which rocks the samples from -45° to +45° from horizontal at 20 cycles per minute. Three samples were included in each data set. Solution volumes were
11

determined by weights and density of the wastewater simulant. The chabazite zeolite was weighed directly and added to the tubes. The tubes were weighed at the beginning and the end of the equilibration periods to determine any solution loss. At the end of the equilibration period, the tubes were centrifuged for 30 min at 5000 relative centrifugal force (rcf). The solutions were clarified again either by transferring the supernate to a 12-mL tube and recentrifuging for 30 min at 5000 rcf or by filtering the centrifuged supernate using a plastic syringe fitted with a 0.45-/im-pore nylon membrane filter.
The ^Sr and I 3 7Cs count rates were determined with a Canberra Series 90 gamma spectrometer. Two-milliliter samples were counted for 1000 s in a germanium well detector. Data for ^Sr were corrected for the interference of 137Cs at the 514-keV peak by using a linear regression line developed using 137Cs standards.
Test data were used in the following calculations:
Decontamination factor (DF) = CJCt, Sorption ratio (R,, L/kg) = (C, - Q)V/CfW, Final concentrations in solution (Mf, meq/L) = M; x C/Cf, Final concentrations on the exchangers (Me, meq/kg) = Mf x R,,
where: Q = count rate of the initial solution, C f = count rate of the final solution, V = initial volume of the solution (mL), W = exchanger weight (g).
The sorption ratio (RJ is equivalent to the distribution coefficient (K^, if equilibrium conditions are assumed.
12
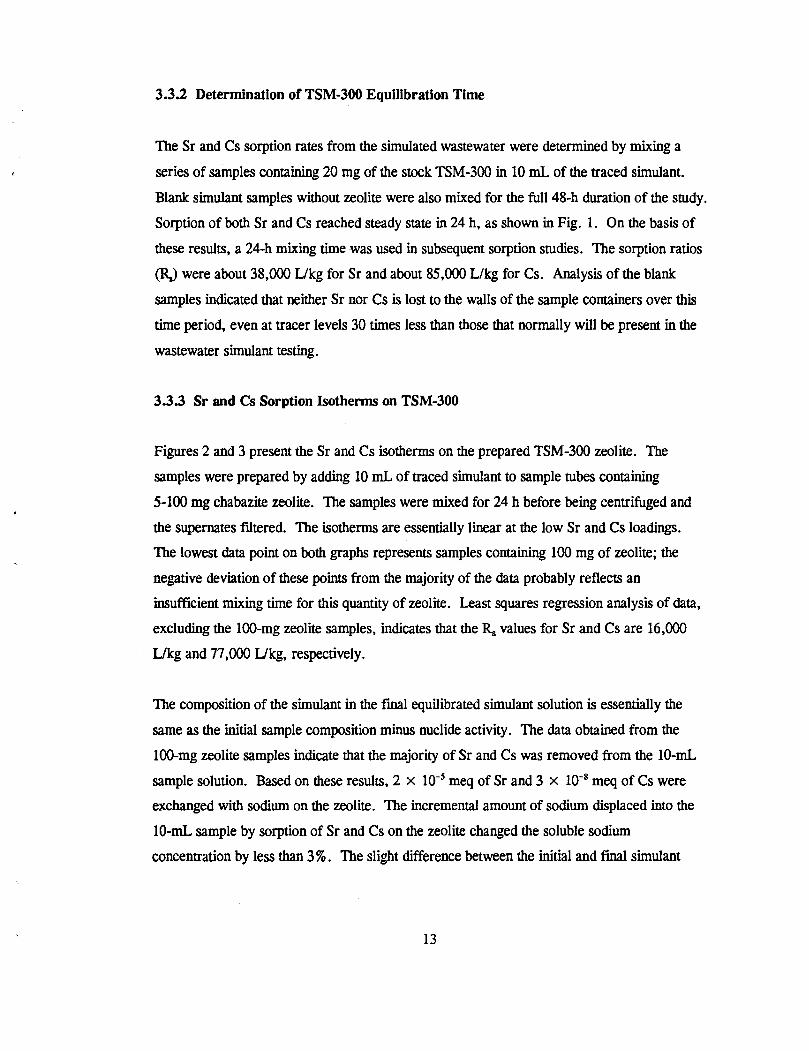
3.3.2 Determination of TSM-300 Equilibration Time
The Sr and Cs sorption rates from the simulated wastewater were determined by mixing a series of samples containing 20 mg of the stock TSM-300 in 10 mL of the traced simulant. Blank simulant samples without zeolite were also mixed for the full 48-h duration of the study. Sorption of both Sr and Cs reached steady state in 24 h, as shown in Fig. 1. On the basis of these results, a 24-h mixing time was used in subsequent sorption studies. The sorption ratios (RJ were about 38,000 L/kg for Sr and about 85,000 L/kg for Cs. Analysis of the blank samples indicated that neither Sr nor Cs is lost to the walls of the sample containers over this time period, even at tracer levels 30 times less than those that normally will be present in the wastewater simulant testing.
3 3 3 Sr and Cs Sorption Isotherms on TSM-300
Figures 2 and 3 present the Sr and Cs isotherms on the prepared TSM-300 zeolite. The samples were prepared by adding 10 mL of traced simulant to sample tubes containing 5-100 mg chabazite zeolite. The samples were mixed for 24 h before being centrifuged and the supernates filtered. The isotherms are essentially linear at the low Sr and Cs loadings. The lowest data point on both graphs represents samples containing 100 mg of zeolite; the negative deviation of these points from the majority of the data probably reflects an insufficient mixing time for this quantity of zeolite. Least squares regression analysis of data, excluding the 100-mg zeolite samples, indicates that the Rs values for Sr and Cs are 16,000 L/kg and 77,000 L/kg, respectively.
The composition of the simulant in the final equilibrated simulant solution is essentially the same as the initial sample composition minus nuclide activity. The data obtained from the 100-mg zeolite samples indicate that the majority of Sr and Cs was removed from the 10-mL sample solution. Based on these results, 2 x 10"5 meq of Sr and 3 x 10"8 meq of Cs were exchanged with sodium on the zeolite. The incremental amount of sodium displaced into the 10-mL sample by sorption of Sr and Cs on the zeolite changed the soluble sodium concentration by less than 3%. The slight difference between the initial and final simulant
13

• •
A • u 1.50E+02- A
Fact
c
J "5 1.00E+02-.5 't + * c o A Q 5.00E+01 -
* * 0Q0E-01 U . U U ^ U 1 — i i i i
0.0 10.0 20.0 30.0 40.0 50.0
Mixing Time ( h )
+ Sr ^ Cs
Fig. 1. Sr and Cs equilibration time on washed TSM-300 chabazite zeolite.
(Test conditions: 20 mg washed TSM-300 in 10 mL simulant, 0.00228 meq/L Sr and 3.23 x 10"6meq/L Cs initial concentration;Labquake mixing at 20 cycles/min, samples centrifuged at 5000 rcf for 30 min.)
14

\ JW-
10.000-\
JMt-A +
1.000-
AM
MA *
• +
0.100- ' I 1 ' ' ' " l ' ' J 1 1..U l_l_ 1 1 1 1.1 1 1 !•• 1 1 1 1 , 1 l -J-L
1.00E-06 1.0OOE-05 1.000E-04 1.00E-03 1.00E-02
Sr in Final Solution (meq/L)
•f" Unwashed J^ Washed
Fig. 2. Sr sorption from PWTP simulant on TSM-300.
(Test Procedure: 0.005-0.100 g TSM-300 in 10 mL solution; 24-h equilibration time; 0.00228 meq/L Sr initial concentration for lower data points; 0.05 meq/L Sr initial concentration for upper data point.)
15

: A 10.000 -
E
1.0Q0 - = •1+
0.100 - I
0.010 -
0.001 -
= MM-MA-
0 000 , i i i < 11 i i i i i 111 i i i i i 111 i i i i i i i 1 i i
1.00E-09 1.00E-08 1.00E-07 1.00E-06 1.000E-05 1.000E-04 1.00E-03
Cs in Final Solution (meq/L)
^ " Unwashed ^ Washed
Fig. 3. Cs sorption from PWTP simulant on TSM-300.
(Test Procedure: 0.005-0.100 g TSM-300 in 10 mL simulant: 24-h equilibration time:3.237 x 10"6 meq/L Cs initial concentration
for lower data points; 0.00032 meq/L Cs for upper data points.)
16

composition from batch processing most likely implies that sorption results from batch testing should be directly applicable in determining zeolite column performance with the simulant.
3.3.4 Comparison of Washed Versus Unwashed Chabazite Zeolite
Figures 2 and 3 also present the logarithmic graph of Sr and Cs isotherms for unwashed TSM-300; the numerical data for this study are summarized in Table 6. Again, the samples were prepared by adding 10 mL of traced PWTP feed simulant to sample tubes containing 5-100 mg chabazite zeolite. Two sources of zeolite were used: the first was the sodium-washed zeolite that is the standard stock for this task, and the second was zeolite that had been sieved to remove the fines, but had not been previously equilibrated with NaCl. The uppermost point in the Sr and Cs isotherms reflects the addition of higher levels of these cations to the wastewater simulant to determine the loading capacity of the zeolites at 0.05 meq/L Sr and 0.00032 meq/L Cs.
Experimental data indicate that the log-log plot of the Cs sorption isotherm is linear up to the maximum Cs loading of 180 meq/kg. The only deviation from this behavior with either the washed or the unwashed zeolite is seen in the 100-mg zeolite data.
The Sr sorption on washed zeolite exhibits a slightly curvilinear behavior; Sr loading on the zeolite deviates positively from linearity above a value of 2 meq Sr/kg. This behavior is apparent for both the washed and unwashed TSM-300. The approximate Rj, at low Sr loading is 15,400 L/kg.
The sorption profiles of washed versus unwashed zeolite indicate that Sr and Cs sorption are improved in samples containing the sodium-washed zeolite. The least squares regression analysis of the unwashed zeolite data indicates that the R, for Cs is 50,000 L/kg as compared with 80,000 L/kg for the washed zeolite. Data pertaining to the washed zeolite samples indicate that the maximum loading capacity in the PWTP feed simulant is approximately 0.23 meq/kg Cs on TSM-300. The maximum Cs loading on the unwashed zeolite at a comparable Cs simulant concentration is slightly lower, 0.17 meq/kg. The sorption of Sr on TSM-300 is more dependent on zeolite washing. This, in fact, should be the case since one of the primary
17

reasons for washing the natural zeolite is to remove natural Sr present on the TSM-300 as received. The maximum loading capacity of the simulant containing 0.1 ppm Sr is 29% greater when the zeolite is pretreated with NaCl. A loading capacity of about 31 meq/kg can be obtained on the pretreated zeolite as compared with 23 meq/kg on the untreated sorbent. The difference in Sr loading between treated and untreated zeolite at the lower Sr solution
Table 6. Sorption ratios for Sr and Cs (Rs) on washed and unwashed TSM-30Q
Avg Sr Rs (L/kg) AvgCsRs(L/kg) Initial Sr Initial Cs TSM-300 (meq/L) (meq/L) (g)
Washed Un
washed Washed Un
washed
2.28 x 10"3 3.23 X 10'6 0.0050 18,000 12,400 74,600 49,900
2.28 x 10⁻³ 3.23 x 10'6 0.0100 17,900 12,900 76,600 54,000
2.28 x 10'3 3.23 x 10"6 0.0200 39,300 20,600 85,800 54,600
2.28 x 10 3 3.23 x 10'6 0.0500 79,600 34,000 65,800 53,100
2.28 x 10~3 3.23 x 10"6 0.1000 65,900 22,800 31,300 36,100
2.28 x 10"3 3.20 x 10'4 0.0050 21,400 — 80,500 —
5.00 x 10"2 3.23 x 10"6 0.0050 23,300 — 76,300 —
concentrations is more typically 25%. It is obvious that removal of natural Sr from the chabazite zeolite is beneficial in cases where the ^Sr and 137Cs must compete for a relatively small number of available binding sites on the zeolite.
3.3.5 Effect of Calcium, Sodium, Potassium, and Magnesium on Sr and Cs Sorption
The effect of elevated calcium, sodium, potassium, and magnesium concentration on Sr and Cs sorption was studied using the washed TSM-300 zeolite stock. Higher concentrations of the individual cations were added as the chloride salts to the wastewater simulant to cover the concentration ranges of the individual cations found in typical groundwater. The total calcium ion in the simulant samples covered a range of 2-20 meq/L (as compared to 0.16-6 meq/L calcium in groundwater). The total sodium concentration in a second study covered a range of
18

0.5-6.5 meq/L (0.26-5.4 meq/L sodium present in groundwater). Potassium concentration was varied over the 0.025-1.03 meq/L range (0.01-0.8 meq/L potassium found in groundwater) to develop a third set of isotherms. In the final experiment, the magnesium concentration was adjusted to between 0.3 and 5 meq/L (0.025-10 meq/L magnesium in groundwater). The plots of Sr and Cs sorption ratios, R,, as a function of cation concentration in the wastewater simulant are given in Figs. 4 and 5. All cations depress the sorption capacity of the zeolite for Sr and Cs, particularly in the 0-4 meq/L concentration range of each cation. In agreement with vendor literature, potassium ion had the most significant effect on Sr and Cs sorption capacity in the low cation concentration range. The Rg for both Sr and Cs decreased by approximately 50% in simulant containing up to 1 meq/L potassium. The effect of 0-4 meq/L magnesium, calcium, or sodium on radionuclide sorption appears to be roughly equivalent in these batch experiments. The sorption ratio for Sr and Cs decreased by 82% and 64%, respectively, for the range of magnesium typically encountered in groundwater. The effect of calcium was not as significant as that of potassium, although its effect in the 2-5 meq/L calcium range appears to be more significant than that of sodium. Above approximately 8 meq/L of either calcium or sodium, the sorption ratios for Sr and Cs are essentially constant.
4. TREATMENT OF ACTUAL PWTP FEED PROCESS WATER WITH TSM-300
The Sr and Cs sorption from actual PWTP feed wastewater on washed TSM-300 was tested, both to serve as the baseline treatment process for actual process wastewater and as a means to validate the composition of the PWTP feed simulant that will be used in the testing of new technologies. Approximately 2 L of actual PWTP feed wastewater was collected and filtered through a 0.45-^m cellulose nitrate filter membrane. A portion of the filtrate was acidified for ICP analysis of metal content; aliquots were also submitted for anion chromatography and radiological analysis of Sr and Cs radionuclides. The filtered wastewater was analyzed in the laboratory for carbonate and bicarbonate content on the day the sample was collected. The major components of the actual wastewater sample are summarized in Table 7. Comparison
19

50000
Cation Cone, in Feed (meq/L)
Ca 4 Na + K • Mg
Fig. 4. Sr sorption as a function of total cation concentration in PWTP simulant.
(Test procedure: 0.020 g TSM-300 in 10 mL simulant; 24-h equilibration time; 2.26 x 10³ meq/L Sr initial concentration, cations added as chloride salts.)
20

100000
80000
60000
40000
20000 -
A 1
1 1 1 -
•
i i _. .
5 10 15 Cation Cone, in Feed (meq/L)
20
Ca ^ Na + K • Mg
Fig. 5. Cs sorption as a function of total cation concentration in PWTP simulant.
(Test procedure: 0.020 g washed TSM-300 in 10 mL simulant; 24-h equilibration time; 2.56 * 10"6 meq/L Cs initial concentration; cations added as the chloride salts.)
21
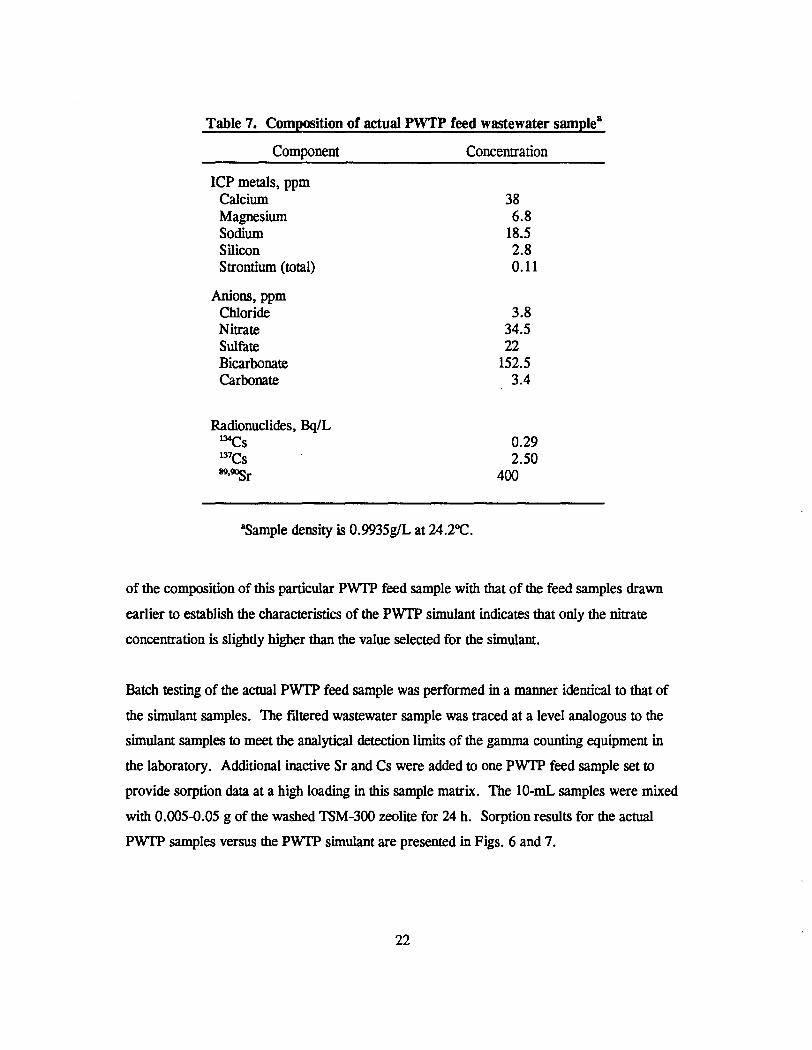
Table 7. Composition of actual PWTP feed wastewater sample8
Component Concentration
ICP metals, ppm Calcium Magnesium Sodium Silicon Strontium (total)
Anions, ppm Chloride Nitrate Sulfate Bicarbonate Carbonate
38 6.8
18.5 2.8 0.11
3.8 34.5 22
152.5 3.4
Radionuclides, Bq/L 134Cs 137Cs "*5r
0.29 2.50
400
aSample density is 0.9935g/L at 24.2°C.
of the composition of this particular PWTP feed sample with that of the feed samples drawn earlier to establish the characteristics of the PWTP simulant indicates that only the nitrate concentration is slightly higher than the value selected for the simulant.
Batch testing of the actual PWTP feed sample was performed in a manner identical to that of the simulant samples. The filtered wastewater sample was traced at a level analogous to the simulant samples to meet the analytical detection limits of the gamma counting equipment in the laboratory. Additional inactive Sr and Cs were added to one PWTP feed sample set to provide sorption data at a high loading in this sample matrix. The 10-mL samples were mixed with 0.005-0.05 g of the washed TSM-300 zeolite for 24 h. Sorption results for the actual PWTP samples versus the PWTP simulant are presented in Figs. 6 and 7.
22

100.000
0.100 1.00E-06 1.000E-05 1.000E-04 1.00E-03 1.00E-02
Sr in Final Solution (meq/L)
+ PWTP Feed Simulant ^ Actual PWTP Feed
Fig. 6. Sr sorption from actual PWTP feed and PWTP feed simulant.
(Test Procedure: 0.005-0.100 g TSM-300 in 10 mL solution; 24-h equilibration time; 0.00228 meq/L Sr initial simulant concentration for lower data points; 0.05 meq/L Sr initial simulant concentration for upper data points; 0.00251 meq/L Sr in actual PWTP feed sample.)
23

100.000- = +
A
10.000- !
1.000- :
0,100- ;
0.010 -
0.001 -
! y 0000 , 1 1 1 1 M l 1 • 1 • 1 l | | 1 1 1 l l l l 1 > 1 1 1 H ' 1 1 1 1 1 1 H I
1.00E-09 1.00E-08 1.00E-07 1.00E-06 1.O0OE-O5 1.000E-04 1.00E-03 1.00E-02
Cs in Final Solution (meq/L)
+ PWTP Feed Simulant ^ Actual PWTP Feed
Fig. 7. Cs sorption from actual PWTP feed and PWTP feed simulant.
(Test Procedure: 0.005-0.100 g TSM-300 in 10 mL solution; 24-h equilibration time; 2.46 * 10"6 meq/L Cs initial simulant concentration for lower data points; 3.2 * 10 4 meq/L Cs initial simulant concentration for upper data points; 2.57 * 10"6 meq/L Cs in actual PWTP feed sample.)
24

The sorption profiles of the actual PWTP wastewater samples are nearly identical to those of the simulant, although the R, values for Sr and Cs in the actual waste are 80% and 90%, respectively, of the corresponding values determined using the simulant solution. The maximum Sr loading in the actual wastewater sample was calculated to be 24 meq/kg as compared to 31 meq/kg in the simulant. The maximum loading capacity of Cs in the actual PWTP feed sample was determined to be 0.17 meq/kg as compared to 0.23 meq/kg in the simulant. The close agreement between the actual wastewater results and the simulant suggests that the simulant composition is a close match with that of the PWTP feed waste stream and, as such, validates its use as a test matrix for studying other treatment technologies for wastewater decontamination. The sorption data also imply that the decontamination factors for Sr and Cs in this particular sample will be approximately 7-30 and 30-300, respectively.
5. SMALL-COLUMN TESTING OF WASHED TSM-300
Small-column testing with washed TSM-300 will more accurately define the sorption characteristics of the benchmark material for treatment of actual PWTP feed wastewater. The dimensions of such a column were selected primarily on the basis of the diameter of the average zeolite particle,17 although results of previous small zeolite experiments were used to modify initial estimates to allow for practical limitations in preparing large volumes of simulant and in the duration of the column test. According to the literature report, the optimum column diameter should be at least 40 times greater than the average zeolite particle diameter of 0.059 cm (30 mesh). Therefore, the column diameter should be 2.36 cm or greater. The optimum length of the column should be greater than or equal to four times the column diameter, indicating that the zeolite column should be at least 9.44 cm in length. The volume of the zeolite bed would thus be 41.3 cm3. TSM-300 zeolite has a wet-packed density of 0.43 g/cm3, indicating that the amount of zeolite required to fill the optimum-sized column is 17.7 g. The Sr loading capacity for the zeolite from the simulant containing 0.1 ppm Sr (0.00228 meq/L) was determined in sorption isotherms to be about 30 meq/kg. Previous column testing has shown that a fairly complete breakthrough curve can be obtained by providing about half the amount of sorbent needed for saturation of the exchanger. For Sr sorption on TSM-300 from the PWTP feed simulant, this is 11.6 mg Sr for the 0.0177-kg zeolite column. This amount of Sr is contained in 116 L solution or 2820 bed volumes (BV).
25

An 8-mL/min flow rate of simulant through the column was selected on the basis of successful small-column zeolite tests run previously in the lab. The 8-mL/min flow rate for the 17.7 g TSM-300 column would require 10 days if optimum column parameters were used. The Cs capacity of the zeolite from the wastewater simulant containing 3.5 x 10"4 ppm was about 0.2 meq/kg as measured in the sorption isotherms. About 0.24 mg Cs will be needed (or 692 L simulant) to reach 50% of the Cs column capacity. At a flow rate of 8 mL/min of simulant, approximately 60 days will be required to observe Cs breakthrough.
The difficulty in preparing such large quantities of simulant and maintaining column equipment for 60 continuous days of operation suggested that the zeolite column should be downsized to improve the chance of completing the column test successfully. Therefore, the small-column zeolite test was performed in a 1.0-cm column rather than in the optimum diameter of 2.4 cm. The 1.0-cm column diameter is about 17 times the average particle size of the -20/+50 mesh zeolite. Results from previously reported column tests performed with 30 to 35 mesh Ionsiv IE-9618 were made in 1.0-, 1.5-, and 2.54-cm columns. Breakthrough results for magnesium, calcium, Sr, and Cs were about the same in the three columns when the bed depth-to-diameter ratio and the throughput rates were the same for the three column sizes. By inference, reducing the zeolite column diameter to 1 cm while maintaining the optimum values of the remaining parameters should not significantly alter the elution pattern of simulant components from the column. The smaller column would require the preparation of only 100 L of simulant and decrease the overall column test to 30 days.
A 1-cm column was prepared by slowly adding prepared TSM-300 stock zeolite from a weighed container to a 1-cm column containing a known volume of water. The zeolite was added to the column to a bed depth of 4.5 cm. The dry zeolite container was reweighed to determine the weight of zeolite added to the column. Excess water above the column bed was collected and weighed. The difference between the initial water volume in the column and the volume of water displaced by zeolite represents the pore volume of the zeolite column. The pore fraction is equivalent to the pore volume of the 1-cm column (2.5 mL) divided by the column volume calculated on the basis of a 4.5-cm bed height. The pore fraction of the 3.8-cm3 column was 0.655 cm3.
26

The 100-L simulant was prepared by adding dry chemicals to 100 L of nanopure water and adjusting the pH of the column feed by sparging C0 2 gas into the solution for about an hour. The pH of the solution would drop to 5; however, the pH stabilized to a value of 7 after
TM*
equilibrating for a few days. The solution was filtered with a 0A5-pcm Supor filter membrane recommended by the vendor for the clarification of groundwater samples. Stable Sr and Cs were added to the simulant at this point. A sample of the final simulant solution was analyzed for ICP metals and nuclide content. The ^Sr and 137Cs tracers were added to the first 15 L of the feed solution. Only 137Cs tracer was added to the remainder of the simulant solution to reduce the radiological dose rate accumulated in the column. A Rainin Rabbit peristaltic pump was used to transfer the simulant through a second 0.45-^m Supor filter membrane into the zeolite column. The flow rate of simulant feed was set at 1.28 mL/min to maintain a linear flow velocity similar to that in the earlier zeolite column tests. An automatic fraction collector was used to collect the column effluent over a 6-h period (or 460 mL). The actual fraction volume was determined by multiplying the value for the density of the simulant (0.9965 g/mL) by the tared weight of the solution in the fraction. Aliquots of each fraction were acidified and submitted for ICP analysis. The nuclide content of each fraction was also determined.
The breakthrough curves for the major cations, Sr and Cs, are presented in Figs. 8 and 9. The fractional breakthrough (C/C,,), defined as the ratio of the concentration of the cation in the column effluent as compared to the cation concentration in the feed, has been plotted against the number of BV of feed treated in the column. Figure 8 illustrates the initial displacement of sodium ion from the prepared zeolite as the cations in the feed are sorbed onto the column. Continued sorption of Sr and Cs on the zeolite results in the displacement of magnesium, beginning at 250 BV. Calcium is then displaced beginning at 500 BV. These curves imply that the selectivity of the treated zeolite is Ca > Mg > Na. The fraction breakthrough of the above cations stabilizes to a value of one at approximately 800 BV.
Trademark of Gelman Sciences.
27

$
5.00
4.00
3 . 0 0 -
2.00
1.00
0.00
SCO 1000 1500
Throughput (bed volumes)
A Na + Mg • Ca
2000
Fig. 8. Breakthrough curves for the major cation concentrations with washed TSM-300.
(Column parameters: 2.2 g washed TSM-300 zeolite contained in a 1-cm -ID column having a bed volume of 3.84 cm3. The PWTP simulant feed flow rate is 1.25 mL/min.)
28

-0.200 10000 20000 30000 40000
Throughput (bed volumes) 50000 60000
Sr A Cs
Fig. 9. Sr and Cs breakthrough curves for washed TSM-300 zeolite.
(Column parameters: 2.2 g washed TSM-300 zeolite contained in a 1-cm-ID column having a bed volume of 3.85 cm3. The PWTP simulant feed flow rate is 1.28 mL/min.)
29

Potassium concentration in the column effluent was not observed above the 1.5-mg/L detection
limit of the ICP spectrophotometer. Strontium is first observed in the column effluent at
approximately 3000 BV. Fractional breakthrough of 10% and 50% Sr occurs at 6500 and
13,000 BV, respectively. Under these experimental conditions, incipient breakthrough of Cs
is noted at 12,500 BV. This experiment will be continued until full breakthrough of Sr and Cs
is documented.
6. SUMMARY
The basic framework for comparing a baseline wastewater treatment technique with newly
emerging treatment processes has been developed. A prototypical waste stream has been
selected for the study so that a standard simulant can be formulated based on its composition.
The feed stream to the PWTP facility at ORNL was selected as the water source because it is
composed of radiologically contaminated groundwater and wastewater and matches the
composition of wastewaters prevalent at other DOE installations. Several samples of the PWTP
feed stream were collected and sampled for ICP metals, anions, and radionuclide composition. A
simulant of the feed stream was formulated that contained calcium, sodium, and magnesium as
the primary dissolved metal components. Bicarbonate, sulfate, chloride, and nitrate represent the
bulk of the anionic species. Inactive Sr was added at a level of 0.1 ppm to the simulant;
approximately 1 * 106 Bq/L of 8 5Sr and , 3 7 Cs was added to the simulant so that the
decontamination efficiency of the treatment methods could be followed adequately with available
gamma counting equipment.
Natural chabazite zeolite was selected as the benchmark sorbent for the removal of Sr and Cs
from contaminated wastewater. The zeolite (TSM-300) was purchased from Steelhead Specialty
Minerals, located in Spokane, Washington. A stock supply of TSM-300 was pretreated to
remove the natural Sr present on the zeolite as received. Pretreatment consisted of washing the
TSM-300 with 2 MNaCl, followed by a water rinse to remove excess sodium ion. The -20 to
+50 mesh fraction of the air-dried TSM-300 represents the reference sorbent for the remaining
studies in this task.
30

Testing of the standard zeolite treatment included determining the Sr and Cs sorption rates using batch testing procedures. Twenty-four hours is required to reach sorption equilibrium in 10-mL batch samples containing 0.005 to 0.05 g zeolite. A longer mixing time is required for samples containing greater amounts of TSM-300.
Strontium sorption on pretreated TSM-300 was observed in samples containing an initial solution concentration of 2.28 * 10"3 meq Sr/L. The Sr sorption isotherm exhibited a curvilinear profile; Sr loading deviated positively from linearity above a Sr loading of 2 meq/kg. The R, at low Sr loading on washed zeolite is approximately 17,000 L/kg; the comparable R, on unwashed zeolite is 30% lower. The difference in the behavior of the two sources of zeolite indicates the availability of additional sorption sites created when the natural Sr is removed during saline washing of TSM-300.
Cesium sorption was observed in samples containing an initial concentration of 3.23 x 10"6 meq/L Cs. The Cs sorption isotherm was found to be linear with Cs solution concentration. The R, for Cs on the prepared zeolite is 80,000 L/kg as compared with 50,000 L/kg on the unwashed TSM-300. The effect of potassium, magnesium, sodium and calcium on Sr and Cs sorption was determined on washed zeolite and found to depress radionuclide sorption, particularly over the 0-8 meq/L range.
On completion of testing with the simulant, the Sr and Cs sorption from actual PWTP feed wastewater was observed on washed TSM-300. The sorption profiles of the actual PWTP feed sample were nearly identical to those obtained with the simulant, indicating the close match between the chemical composition of the simulant and actual waste steam. Maximum loading from the actual wastewater sample onto treated TSM-300 was calculated to be 24 meq/kg Sr and 0.17 meq/kg Cs.
A small-column test has been initiated using a 1-cm-diameter column and 2.2 g of washed TSM-300 zeolite. The elution pattern of the major cations in the simulant suggests that the treated chabazite zeolite has a selectivity order of Cs > Sr > Ca > Mg > Na. Although the potassium elution front could not be observed during column testing, results from batch tests imply that potassium selectivity falls above that of calcium. Strontium breakthrough was first noted at approximately 3000 BV; 50% breakthrough was observed at 13,000 BV.
31

Incipient Cs breakthrough occurred at 12,500 BV. The column will be run to exhaustion in order to observe complete Sr and Cs breakthrough.
This report concludes the development of the testing procedures required to define the sorption behavior of the zeolite baseline wastewater treatment techniques. New sorbents will be similarly tested so that a direct comparison of sorption capacity can be made with the benchmark method.
® The relative merits of SuperLiq molecular recognition sorbents and the Savannah River
Laboratory resorcinol formaldehyde resin will be evaluated in the near future.
7. REFERENCES
1. S. M. Robinson and J. R. Parrott, Jr., Pilot-Scale Demonstration of Process Wastewater Decontamination Using Chabazite Zeolites, ORNL/TM-10836, December 1989.
2. C. P. Staub (ed.), Practical Handbook of Environmental Control, CRC Press, Boca Raton, Florida, 1989.
3. L. E. McNeese, J. B. Berry, G. E. Butterworth HI, E. D. Collins, T. H. Monk, B. D. Patton, and J. W. Snider, Overall Strategy and Program Plan for Management of Radioactivefy Contaminated Liquid Wastes and Transuranic Sludges at the Oak Ridge National Laboratory, ORNL/TM-10757, December 1988.
4. M. A. Franson (ed.), Standard Methods for ike Examination of Water and Wastewater, 18th ed., American Public Health Association, Washington, D.C., 1992, pp. 2-23 to 2-28.
5. G. V. James, Water Treatment: A Guide to the Treatment of Water and Effluents Purification, 3rd ed, The Darien Press Ltd., Edinburgh, United Kingdom, 1965, pp. 107-127.
6. A. Dyer and D. Keir, Zeolites, 4, 215-217 (1984).
7. P. Burns, et al., AIChESymp. Ser., 83 (259), 66-73 (1987).
8. D. C. Grant, et al., Effects of Process Variables on the Removal of Contaminants from Radioactive Waste Streams Using Zeolites, presented at the Waste Management '87 Symposium, Tucson, Arizona, March 1987.
9. R. H. Hawkins and J. H. Horton, Zeolite Prefilter to Reduce Pluggage in Zeolite Cesium Removal Column, DP-1245, Savannah River Laboratory, Aiken, South Carolina, January 1971.
10. S. M. Robinson and J. R. Parrot, Jr., Pilot-Scale Demonstration of Process Wastewater Decontamination Using Chabazite Zeolites, ORNL/TM-10836, December 1989.
32

11. S. M. Robinson and J. M. Begovich, Treatment Studies at the Process Waste Treatment Plant at Oak Pudge National Laboratory, ORNL/TM-10352, March 1991.
12. T. E. Kent, S. A. Richardson, A. C. Coroneous, A. J. Lucero, and J. J. Perona, Zeolite Ion-Exchange System Development for Treatment ofORNL Process Wastewater, Draft Letter Report, Chemical Technology Division, Oak Ridge National Laboratory, Oak Ridge, Tennessee, August 31, 1991.
13. R. L. Siegrist et al., DOE In Situ Reme&ation Integrated Program: In Situ Physical/Chemical Treatment Technologies — Subarea Program Plan, Environmental Sciences Division Publication 4238, Oak Ridge National Laboratory, June 1994.
14. S. M. Robinson, T. E. Kent, W. D. Arnold, and J. R. Parrott, Jr., The Development of a Zeolite System for Upgrade of the Process Waste Treatment Plant, ORNL/TM-12063, October 1993.
15. T. E. Eyde, "Using Zeolites in the Recovery of Heavy Metals from Mining Effluents," in Proceedings of the Extraction and Processing Division, TMS Annual Meeting, ed. J. P. Hager, Denver, Colorado (Feb. 21-25,1993).
16. Testing Sieves and Their Uses, Handbook 53, 1962 ed., The W. S. Tyler Company.
17. J. F. Relyea, "Theoretical and Experimental Considerations for Use of the Column Method for Determining Retardation Factors," Radioact. Waste Manage. Nuc. Fuel Cycle, 3, 151-156 (1982).
18. S. M. Robinson, W. D. Arnold, Jr., and C. W. Byers, MuUicomponent Liquid Ion Exchange with Chabadte Zeolites, ORNL/TM-12403, October 1993.
33


ORNL/TM-12903
DISTRIBUTION
1. W. D. Arnold, Jr. 26. D. R. McTaggart 2-11. D. A. Bostick 27. B. A. Moyer
12. M. W. Burgess 28. S. M. Robinson 13. J. L. Collins 29. F. S. Smith 14. N. H. Cutshall 30. P. A. Taylor 15. T. 0. Early 31. J. S. Watson 16. B. Z. Egan 32-33. Laboratory Records 17. B. B. Guo 34. Laboratory Records, RC
18-22. T. E. Kent 35. ORNL Patent Section 23. B. E. Lewis 36. Central Research Library 24. A. P. Malinauskas 37. Y-12 Technical Library 25. C. P. McGinnis Document Reference Center
EXTERNAL DISTRIBUTION
38. L. A. Bray, Pacific Northwest Laboratory, Building 300, Area MS-P7-25, P.O. Box 999, Richland, WA 99352
39. T. Brown, Pacific Northwest Laboratory, Battelle Boulevard, P.O. Box 999, Richland, WA 99352
40. T. A. Fryberger, Trevion II Building, 12800 Middlebrook Road, Germantown, MD 20874
41. S. M. Gibson, Trevion II Building, 12800 Middlebrook Road, Germantown, MD 20874
42. T. M. Kafka, 3M Company, #M Center-209-lW-24, St. Paul, MN 35144 43. R. D. Korynta, Department of Energy, Oak Ridge Operations, P.O. Box 2001, Oak
Ridge, TN 37831-8620 44. W. L. Kuhn, Pacific Northwest Laboratory, Battelle Boulevard, P.O. Box 999,
Richland, WA 99352 45. J. O. Moore, Oak Ridge Technical Program Officer, Department of Energy, Oak
Ridge Operations Office, P.O. Box 2001, Oak Ridge, TN 37831-8620 46. I. Tasker, Waste Policy Institute, 555 Quince Orchard Road Suite 600, Gaithersburg,
MD 20878-1437 47. J. Walker, Trevion II Building, 12800 Middlebrook Road, Germantown, MD 20874 48. Office of Assistant Manager, Energy Research and Development, Department of
Energy, Oak Ridge Operations, P.O. Box 2001, MS-8600, Oak Ridge, TN 37831 49-50. Office of Scientific and Technical Information, Department of Energy, P.O. Box 62,
Oak Ridge, TN 37831
35


