Embed Size (px)
Citation preview
ANGOC
CSO Land Reform
Monitoring in Asia
Founded in 1979, the Asian NGO Coalition for Agrarian Reform and Rural Development (ANGOC) is a regional association of 17 national and regional networks of non-government organizations (NGOs) in Asia actively engaged in promoting food security, agrarian reform, sustainable agriculture,
participatory governance, and rural development. ANGOC member networks and partners work in 14 Asian countries with an effective reach of some 3,000 NGO and community-based organizations (CBOs). ANGOC actively engages in joint field programs and policy debates with national governments, intergovernmental organizations (IGOs), and international financial institutions (IFIs).
The complexity of Asian realities and diversity of NGOs highlight the need for a development leadership to service the poor of Asia—providing a forum for articulation of their needs and aspirations as well as expression of Asian values and perspectives.
ANGOC73-K Dr. Lazcano StreetBarangay Laging Handa 1103Quezon City, PhilippinesP.O. Box 3107, QCCPO 1101, Quezon City, PhilippinesTel: +63-2 3510581 Fax: +63-2 3510011Email: [email protected]: www.angoc.org
ANGOC
CSO Land Reform Monitoring in Asia
Publication by the Asian NGO Coalition for Agrarian Reform and Rural Development (ANGOC).
Copyright 2012Quezon City, PhilippinesAll rights reserved
This publication may be freely cited, quoted, reproduced, stored in or introduced into a retrieval system, or transmitted in any form or by any means (electronic, mechanical, photocopying, recording, or otherwise) provided proper citation of the publishers is made.
In this publication, “$” refers to US dollars.
Citation:Asian NGO Coalition for Agrarian Reform and Rural Development. (2012). CSO Land Reform Monitoring in Asia. Quezon City, Philippines: Auhor.
ISBN # 978-971-8632-43-7
ANGOC
Foreword
Message
CSO Land Reform Monitoring Frameworkin Asia
Monitoring Land Reforms in Asia:Status Check
Country Reports
BangladeshCambodiaIndiaIndonesiaNepalPakistanPhilippines
CSO Land Reform Monitoring:A User’s Guide for Land Rights Advocates
Contents
7
9
11
20
52688095
109124137
153
Association for Land Reform and
Development (ALRD)
House # 1/3, Block- F Lalmatia, Dhaka-1207, Bangladesh
E-mail: [email protected]
Phone: +880 911 4660; 814 2031
Website: www.alrd.org
STAR Kampuchea
No.67, Street 123, Sangkat Toul Tompoung1, Khan
Chamkar Morn, Phnom Penh, Kingdom of Cambodia
Email: [email protected]
Tel: +855 23 211 612
Website: www.starkampuchea.org.kh
Association of Voluntary Agencies for Rural
Development (AVARD)
5 (FF), Institutional Area, Deen Dayal Upadhyay
Marg, Kamala Devi Bhavan, New Delhi - 110002,
India.
Tel: +91 11 23234690
Email: [email protected]
Website: www.avard.in
Consortium for Agrarian Reform/
Konsorsium Pembaruan Agraria
(KPA)
JL.Duren Tiga No.64 Jakarta Selatan, DKI, Jakarta, Indonesia
Tel: +62 22 7504967
Email: [email protected]
Website: http://www.kpa.or.id
Sajogyo Institute (SAINS)
Malabar 22, Bogor 16151, Indonesia
Tel: 62 251 8374048
Email: [email protected]
Website: http://www.pustaka-agraria.org/
Community Self Reliance Centre (CSRC)
Dhapasi, Kathmandu, Nepal
Tel: +977-01-4360486
Email: [email protected]
Website: http://www.csrcnepal.org
Society for Conservation and Protection of
Environment (SCOPE)
7/190 first floor DMCHS block 3, off shaheed-
e-millat Road, Karachi-75350, Pakistan
Tel: +92 21 34551226
Email: [email protected]
Website: www.scope.org.pk
Philippine Partnership for the Development
of Human Resources in Rural Areas
(PhilDHRRA)
59 C. Salvador Street, Loyola Heights, Quezon
City, Philippines
Telephone: +632 436 0702
E-mail: [email protected]
Website: www.phildhrra.net
Asian NGO Coalition for Agrarian Reform and
Rural Development (ANGOC)
73-K Dr. Lazcano Street
Brgy. Laging Handa 1103
Quezon City, Philippines
Tel: +63 2 3510581
Email: [email protected]
Website: www.angoc.org
LWA CSO Land Monitoring Focal Points
ANGOC
Foreword
In many developing countries of Asia, agrarian reform remains a central task of governments for reducing poverty,
strengthening food security, and improving the overall well-being of the rural poor. It requires that governments strengthen people’s access and sustainable use of land and productive resources – as means to secure the livelihoods especially of peasants, rural workers, indigenous peoples, rural women, and small producers.
Monitoring land reform programs (as well as land access for the rural poor) is therefore essential for its contribution to overall governance – land is equitably distributed, tenure rights are secure, and administration is sound and just. Good governance also refers to “the rules, mechanisms, processes and institutions through which land is accessed, used, controlled and transferred, and land-related conflicts are managed”.
Monitoring, however, is not the sole task of governments, but also that of civil society. It will also help civil society organizations (CSOs) sharpen their advocacy by providing accurate evidence and necessary information.
The development of a land reform monitoring framework was initiated by ANGOC and the Land Watch Asia (LWA) campaign. Piloted in seven Asian countries, this land monitoring framework articulates the key assumptions and indicators, and formulates the methodology and mechanisms for CSOs to undertake monitoring – in order to engage constructively
in policy dialogue with their governments, and to share their findings with other countries as part of the regional campaign. This monitoring framework does not provide a fixed, common set of indicators, but defines the direction and parameters for CSOs undertaking land monitoring in support of their policy advocacy work.
The monitoring initiative has produced a monitoring framework, together with a regional summary and seven country (abridged) reports where it has been piloted. Also, a user’s guide to CSO land reform monitoring captures the experience and lessons from piloting the land reform monitoring framework is included in this publication. The User’s Guide may be considered a work-in-progress.
The Land Watch Asia (LWA) campaign aims to ensure that access to land, agrarian reform, and equitable and sustainable development in rural areas are addressed in national and regional development agendas. The objectives of the campaign are to: take stock of significant changes in the policy and legal environments; undertake national and regional advocacy activities on access to land; jointly develop approaches and tools; and encourage the sharing of experiences on coalition-building and actions on land rights issues.
As a CSO monitoring mechanism, Land Watch Asia has identified five strategic areas for its campaign: capacity building; public awareness and media advocacy; alliance building and people-to-people solidarity; mobilizations;
and policy dialogues. Policy dialogue remains a strategic area for the LWA campaign, in order to engage governments and land-related institutions constructively. Policy dialogue has three sub-components: policy research; dialogue with governments and international organizations; and monitoring land reforms. Given that land reform is an ongoing political act, CSOs take the role of a public watchdog, i.e., monitoring land reforms as a step to ensure accountability from governments.
This publication is made possible with the assistance and partnership of the International Land Coalition and MISEREOR. The following organizations facilitated the pilot of the monitoring framework and preparation of reports for each country: ALRD (Bangladesh), STAR Kampuchea (Cambodia), AVARD (India), SAINS and KPA (Indonesia), CSRC (Nepal), SCOPE (Pakistan) and PhilDHRRA (Philippines). We would like to thank Roel R. Ravanera for crafting the monitoring framework, and Catherine Liamzon for anchoring the processes of finalizing the framework, writing the regional summary,
and drafting the user’s guide. ANGOC gratefully acknowledges the following who provided valuable insights at varying stages of sharpening the framework and user’s guide: Dr. Abul Barkat, Dr. Marideth Bravo, Dr. Praveen Jha, Annalisa Mauro, Dr. Hanz Meliczek, Antonio B. Quizon, and Dr. Laksmi Savitri.
Special thanks to Catherine Liamzon for steering the review and revision process, and for serving as the overall editor of this publication. Our appreciation to: Cristina Pavia for preparing the abridged versions of the pilot country reports; Frances Mae Carolina Ramos for reviewing the draft manuscripts; Marie Catherine Sta. Ana for the cover art; Gerard Jerome Dumlao for the book layout; and the production team: Maricel Tolentino, Joseph Onesa and Lennie Rose Cahusay.
Through this publication we share our land monitoring experiences. Your feedback will be warmly appreciated. Write to us at [email protected] or to the listed partners in this publication.
Nathaniel Don E. MarquezExecutive Director, ANGOC
ANGOC
Message
Over the last several years, we have witnessed a dramatic intensification of the rush for land and associated
natural resources (water, forest, fisheries) in all regions of the world, especially in developing countries. Land has become a key global resource, increasingly commoditized and disputed. Its governance has become more complex and difficult. The mission of the International Land Coalition (ILC) to promote secure access to land for the rural poor is more relevant than ever. But it has also become more challenging. In addition to the extensive power inequalities in the competition for land, we are confronted by fast-paced changes in the complexity of how this resource is used and managed.
Consequently, understanding changes in land governance is paramount. This allows being in a position to respond effectively to mounting challenges, especially those affecting the rural poor. This is the cause behind the strong belief of ILC in land monitoring as an essential and intrinsic component of efforts to promote improved land governance. Since 2004, ILC’s land monitoring efforts have focused on improving the understanding of land-related policies and laws responding to the real needs of rural people.
Many ILC members, both intergovernmental and civil society organizations, are engaged in monitoring initiatives at different levels and for varied purposes. Currently, a number of monitoring initiatives are generating and
aggregating land-related data, which contribute to improved transparency and enhanced accessibility to key information for open land governance debate, for the empowerment of grassroots organizations and for informed and inclusive societal choices.
Land Watch Asia has pioneered a regional two-pronged strategy consisting of land monitoring linked to land advocacy, and country-level engagement supported by effective regional coordination and collaboration. This strategy, coordinated by ANGOC, a founding member of ILC, has resulted in significant achievements, especially in influencing policy formulation and land and agrarian reform processes in many countries. There have been notable achievements in supporting the struggles of small farmers, the landless, indigenous peoples, and women to oppose evictions. The latter have become a greater risk, resulting from the higher value of land globally, especially in densely-populated countries and fast-growing economies of the Asian continent.
This report from Land Watch Asia shows a high level of maturity and competency, demonstrating that quality data generation and analysis should not be the exclusive prerogative of the academe and state agencies. Civil society have their own perspectives on the land governance debates, and the best way to stand for their causes is to back them with credible information that they generate themselves rather than from other typically biased sources.
The challenge for us at the ILC Secretariat and for the members of the Coalition is to improve coordination and synergy among the various land monitoring efforts at the country level to more effectively influence national land policy reform processes. We hope that in the context of the 15 to 20 focus countries within which ILC will be engaging in a substantive, strategic manner in the next four years, the shared intention of moving toward improved coordination of monitoring efforts could be put in practice and lead to palpable impacts. We also hope that the learning component of monitoring efforts would be strengthened, including thorough exchanges among members and partners at the regional level and between regions.
Let me conclude by expressing our deep gratitude to ANGOC for the trailblazing role it has played on systematic and comprehensive land monitoring activities led by civil society organizations, and for continuing to coordinate successfully the land monitoring initiative of the Land Watch Asia campaign. This has exceeded its benefits as a monitoring exercise, and is now a tool contributing to concrete changes in the life of the people. ILC is proud to have accompanied this initiative and is committed to continuing support for ILC Asia members in their land monitoring efforts.
Monitoring for better governance of the complexity of land is an endless process, and we will be here, working together.
Madiodio Niasse Director, International Land Coalition Secretariat
ANGOC
CSO Land Reform Monitoring Framework in Asia
Background
and Watch Asia (LWA) is a regional campaign to ensure that the rural poor’s access to land is addressed in national
and regional agendas towards sustainable development. The campaign involves civil society organizations (CSOs) in Bangladesh, Cambodia, India, Indonesia, Nepal, Pakistan, the Philippines, and Sri Lanka.
Convened by the Asian NGO Coalition for Agrarian Reform and Rural Development (ANGOC), LWA has several aims. First is to take stock of significant changes in the policy and legal environments in relation to land access of the rural poor. Second, advocacy activities promoting land access must be strategically positioned and strengthened at national and regional levels. Approaches and tools to this end must be conceived and pursued jointly among CSOs. Finally, lessons and experiences on coalition-building and actions on land rights issues must be shared.
ANGOC and LWA pursue its campaign activities with national governments, intergovernmental organizations, and regional institutions, which play critical roles
Paper prepared by Roel R. Ravanera for the Asian NGO Coalition for Agrarian Reform and Rural Development (ANGOC) and Land Watch Asia (LWA).
in protecting and enhancing the poor’s access to land. The campaign activities of LWA are strongly anchored on the participation of these stakeholders. Their roles retain a primacy to the overall strategy of the LWA campaign.
This monitoring framework has been developed to enhance the capacities of CSOs in monitoring agrarian reform, which forms one of the identified program areas of LWA within its policy advocacy component.
Rationale
The blight of rural poverty continues to afflict food producers in Asia – those who are marginalized and disadvantaged, including farmers, indigenous peoples, women, pastoralists, and fishers. Compounding their woes is poor access to land and other productive resources, in spite of policy and program initiatives on agrarian reform. The prolonged neglect of the agricultural sector has been a major reason behind rural poverty and hunger. However, in recent years, investments in agriculture have increased. The 2009 World Investment Report of the United Nations Conference on Trade and Development (UNCTAD) documented a growth of 17% in foreign direct investments (FDIs) in South, East, and Southeast Asia in 2008. Inflows in agriculture exceeded $3 billion per annum between 2005 and 2007, up from below $1 billion per annum between 1989 and 1991 (UNCTAD, 2009).
Growing commercial competition for land is accompanied by increasing investments in agriculture. Land grabs are also taking place amid a host of other challenges confronting rural communities throughout the region such as local elite interests, climate change, and poor policy and legal frameworks on land. Agricultural investments, in turn, are potential hosts for other tensions within the rural communities.
With this changing policy environment, issues and processes on land have grown more complex. The work of CSOs will require more research and understanding of the issues, fully appreciating, documenting, and analyzing differing contexts among the eight countries, and producing reliable data. The key result areas of these steps will inform CSO policy dialogues on land with government and intergovernmental institutions.
This CSO land reform monitoring initiative can provide feedback on the status and impacts of various interventions in local communities, especially those affecting women and cultural minorities. For beneficiaries of agrarian reform programs, land reform monitoring is a validation of greater security in land tenure and broader access to land. Its participatory nature could extend the purposes of monitoring into educating and empowering different stakeholders. Among like-minded institutions, land reform monitoring can be used in facilitating partnership, networking, and complementation.
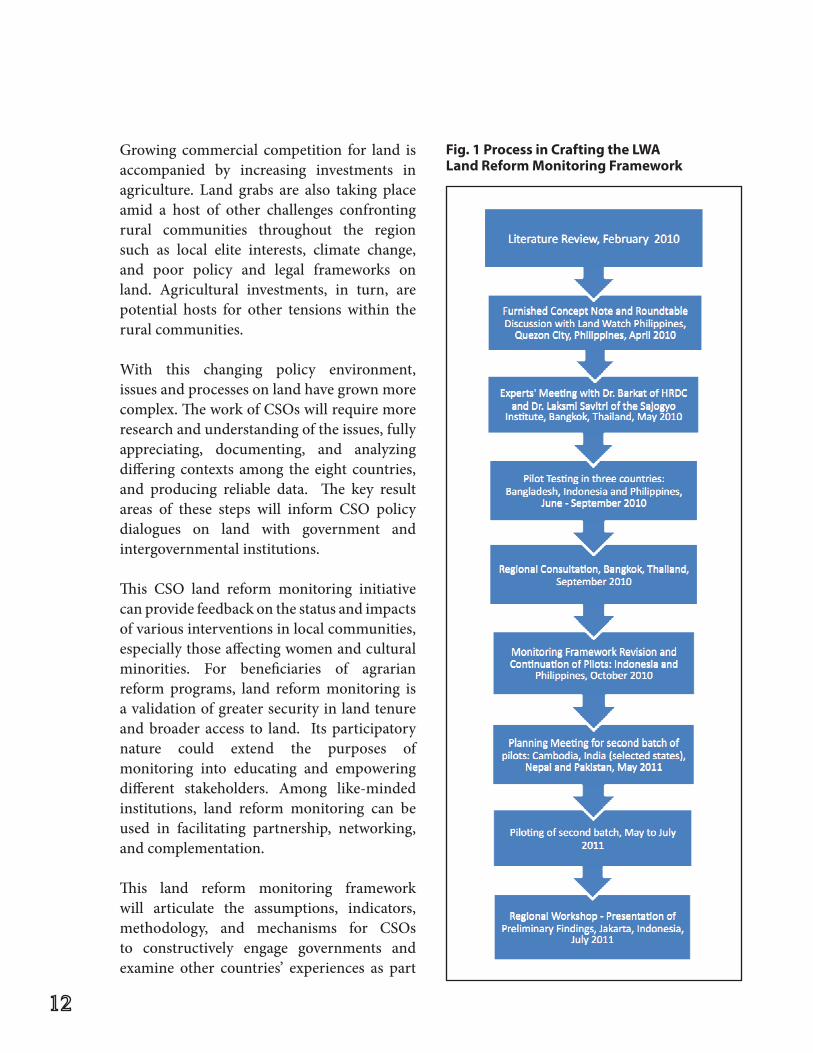
This land reform monitoring framework will articulate the assumptions, indicators, methodology, and mechanisms for CSOs to constructively engage governments and examine other countries’ experiences as part
Fig. 1 Process in Crafting the LWA Land Reform Monitoring Framework
ANGOC
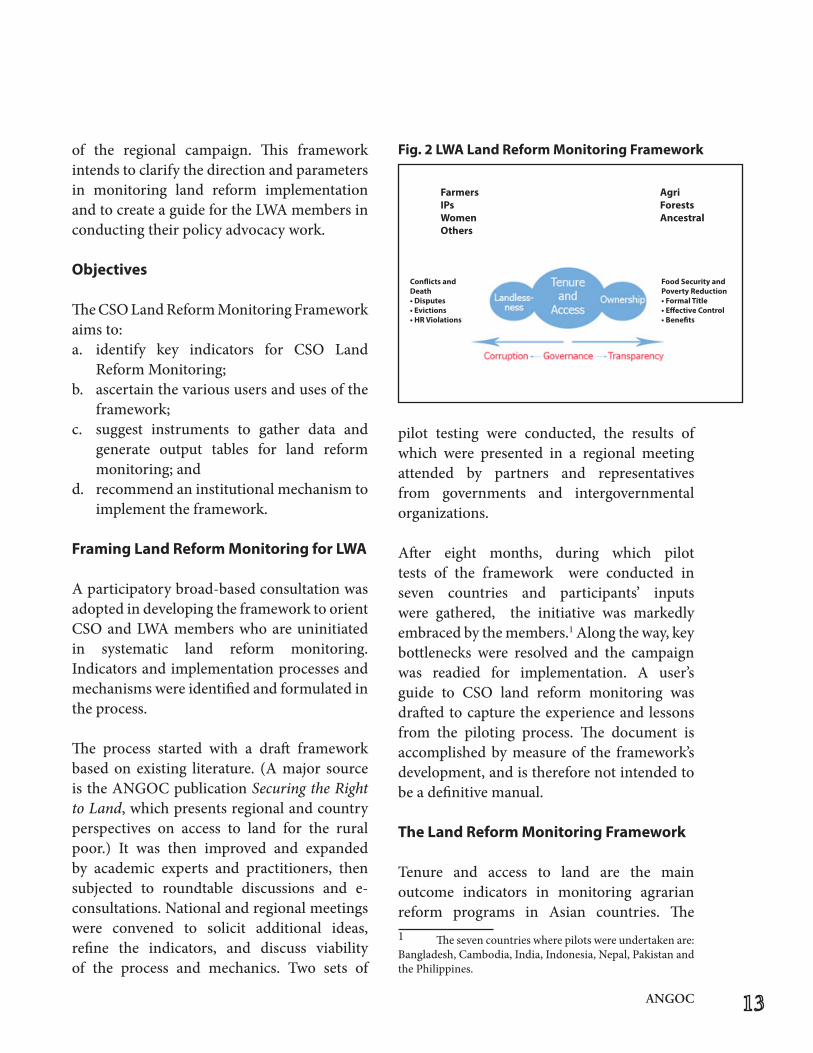
of the regional campaign. This framework intends to clarify the direction and parameters in monitoring land reform implementation and to create a guide for the LWA members in conducting their policy advocacy work.
Objectives
The CSO Land Reform Monitoring Framework aims to:a. identify key indicators for CSO Land
Reform Monitoring;b. ascertain the various users and uses of the
framework;c. suggest instruments to gather data and
generate output tables for land reform monitoring; and
d. recommend an institutional mechanism to implement the framework.
Framing Land Reform Monitoring for LWA
A participatory broad-based consultation was adopted in developing the framework to orient CSO and LWA members who are uninitiated in systematic land reform monitoring. Indicators and implementation processes and mechanisms were identified and formulated in the process.
The process started with a draft framework based on existing literature. (A major source is the ANGOC publication Securing the Right to Land, which presents regional and country perspectives on access to land for the rural poor.) It was then improved and expanded by academic experts and practitioners, then subjected to roundtable discussions and e-consultations. National and regional meetings were convened to solicit additional ideas, refine the indicators, and discuss viability of the process and mechanics. Two sets of
pilot testing were conducted, the results of which were presented in a regional meeting attended by partners and representatives from governments and intergovernmental organizations.
After eight months, during which pilot tests of the framework were conducted in seven countries and participants’ inputs were gathered, the initiative was markedly embraced by the members.1 Along the way, key bottlenecks were resolved and the campaign was readied for implementation. A user’s guide to CSO land reform monitoring was drafted to capture the experience and lessons from the piloting process. The document is accomplished by measure of the framework’s development, and is therefore not intended to be a definitive manual.
The Land Reform Monitoring Framework
Tenure and access to land are the main outcome indicators in monitoring agrarian reform programs in Asian countries. The 1 The seven countries where pilots were undertaken are: Bangladesh, Cambodia, India, Indonesia, Nepal, Pakistan and the Philippines.
Fig. 2 LWA Land Reform Monitoring Framework
FarmersIPsWomenOthers
AgriForestsAncestral
Conflicts and Death• Disputes• Evictions• HR Violations
Food Security andPoverty Reduction• Formal Title• Effective Control• Benefits
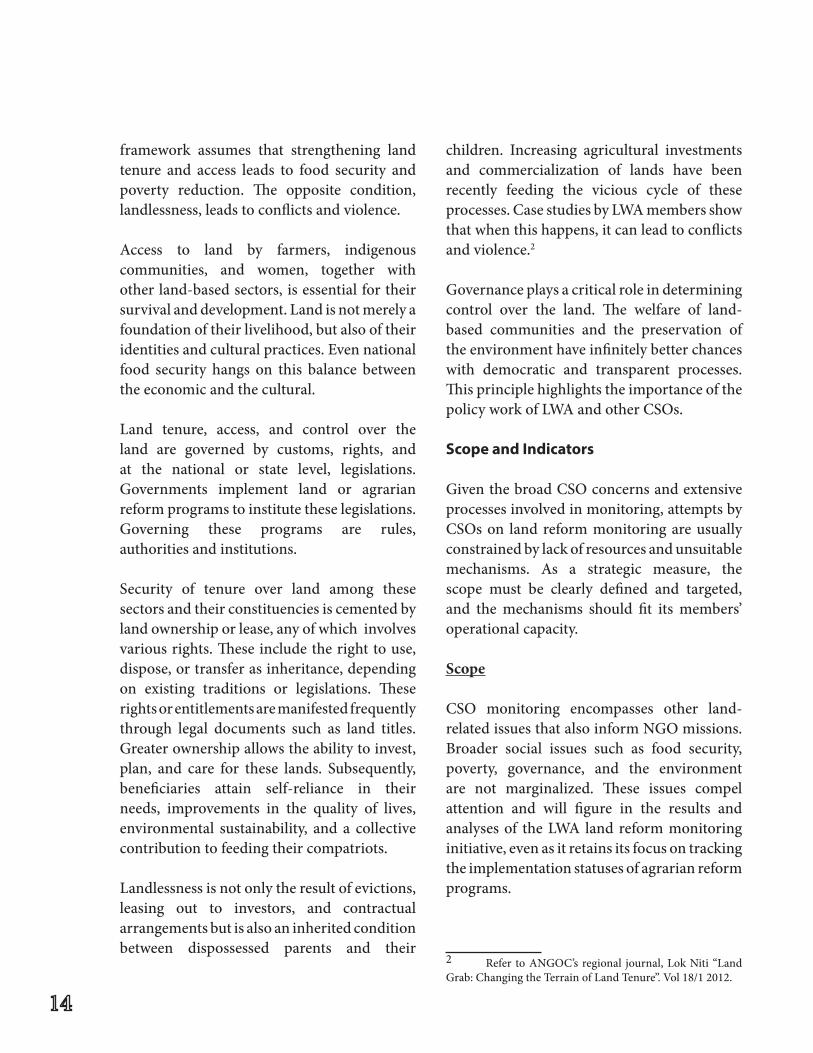
framework assumes that strengthening land tenure and access leads to food security and poverty reduction. The opposite condition, landlessness, leads to conflicts and violence.
Access to land by farmers, indigenous communities, and women, together with other land-based sectors, is essential for their survival and development. Land is not merely a foundation of their livelihood, but also of their identities and cultural practices. Even national food security hangs on this balance between the economic and the cultural.
Land tenure, access, and control over the land are governed by customs, rights, and at the national or state level, legislations. Governments implement land or agrarian reform programs to institute these legislations. Governing these programs are rules, authorities and institutions.
Security of tenure over land among these sectors and their constituencies is cemented by land ownership or lease, any of which involves various rights. These include the right to use, dispose, or transfer as inheritance, depending on existing traditions or legislations. These rights or entitlements are manifested frequently through legal documents such as land titles. Greater ownership allows the ability to invest, plan, and care for these lands. Subsequently, beneficiaries attain self-reliance in their needs, improvements in the quality of lives, environmental sustainability, and a collective contribution to feeding their compatriots.
Landlessness is not only the result of evictions, leasing out to investors, and contractual arrangements but is also an inherited condition between dispossessed parents and their
children. Increasing agricultural investments and commercialization of lands have been recently feeding the vicious cycle of these processes. Case studies by LWA members show that when this happens, it can lead to conflicts and violence.2
Governance plays a critical role in determining control over the land. The welfare of land-based communities and the preservation of the environment have infinitely better chances with democratic and transparent processes. This principle highlights the importance of the policy work of LWA and other CSOs.
Scope and Indicators
Given the broad CSO concerns and extensive processes involved in monitoring, attempts by CSOs on land reform monitoring are usually constrained by lack of resources and unsuitable mechanisms. As a strategic measure, the scope must be clearly defined and targeted, and the mechanisms should fit its members’ operational capacity.
Scope
CSO monitoring encompasses other land-related issues that also inform NGO missions. Broader social issues such as food security, poverty, governance, and the environment are not marginalized. These issues compel attention and will figure in the results and analyses of the LWA land reform monitoring initiative, even as it retains its focus on tracking the implementation statuses of agrarian reform programs.
2 Refer to ANGOC’s regional journal, Lok Niti “Land Grab: Changing the Terrain of Land Tenure”. Vol 18/1 2012.
ANGOC
Levels of Operation
LWA members operate at the local, state, national, and regional levels. Some of them conduct or have conducted land reform monitoring on their own as a component of other programs to address specific concerns.
For reasons of practicality, the LWA land reform monitoring initiative will operate at the national level in all countries except India, where agrarian reform programs are legislated and implemented at the state level. Governments in Asia have varied agrarian reform programs given the diversity of land characteristics and political environments. Land administration and availability of data also vary across countries.
There is value, however, in including selected indicators that will allow regional comparisons. The new wave of agricultural investments transcends national boundaries. Although many of these investments are agreed among Asian countries, these transactions have to be analyzed at the regional level. Moreover, regional institutions such as the Association of Southeast Asian Nations (ASEAN), South Asia Association for Regional Cooperation (SAARC) and the Asian Development Bank (ADB) are positioned as stakeholders in these land transactions.
Selecting the Indicators
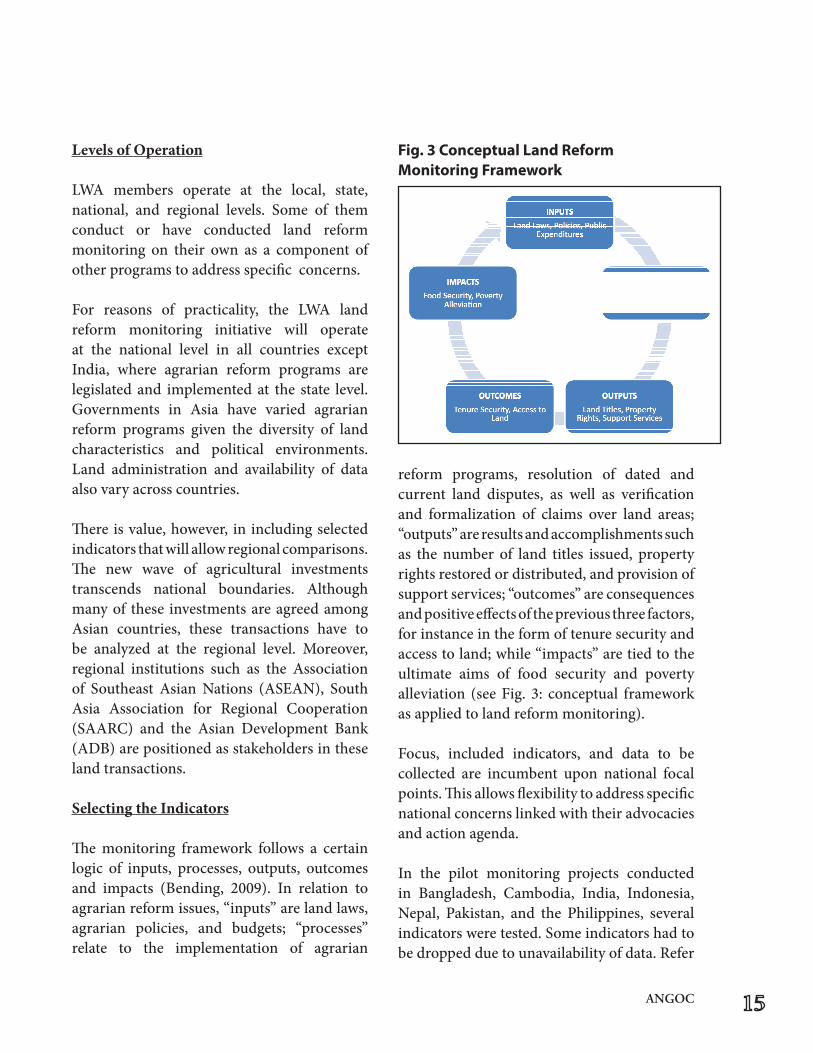
The monitoring framework follows a certain logic of inputs, processes, outputs, outcomes and impacts (Bending, 2009). In relation to agrarian reform issues, “inputs” are land laws, agrarian policies, and budgets; “processes” relate to the implementation of agrarian
reform programs, resolution of dated and current land disputes, as well as verification and formalization of claims over land areas; “outputs” are results and accomplishments such as the number of land titles issued, property rights restored or distributed, and provision of support services; “outcomes” are consequences and positive effects of the previous three factors, for instance in the form of tenure security and access to land; while “impacts” are tied to the ultimate aims of food security and poverty alleviation (see Fig. 3: conceptual framework as applied to land reform monitoring).
Focus, included indicators, and data to be collected are incumbent upon national focal points. This allows flexibility to address specific national concerns linked with their advocacies and action agenda.
In the pilot monitoring projects conducted in Bangladesh, Cambodia, India, Indonesia, Nepal, Pakistan, and the Philippines, several indicators were tested. Some indicators had to be dropped due to unavailability of data. Refer
Fig. 3 Conceptual Land Reform Monitoring Framework
to the regional summary of the results of the country pilot experiences “Monitoring Land Reforms in Asia: Status Check”.
Common Regional Indicators
While the national contexts vary and agrarian reform programs differ across countries, there is agreement in the desired outcome: greater access to land and stronger land tenure for the farmers and indigenous communities, particularly women and other disadvantaged sectors. After all the agrarian reform laws have been crafted, programs implemented and titles issued, summary questions for accomplishment remain: is the farmers’ tenure on land more secure? Do they have greater access to their lands?
Access to land, which “is the ability to use land and other natural resources, to control the resources and to transfer the rights to the land and take advantage of other opportunities”, (FAO in IFAD, 2008) covers the following issues:o Distribution or concentration of
land ownership, in this case, effective ownership or possession of a title deed as the legal owner, right to cultivate the land (usufructuary right), and the right to harvest the cultivation (benefits);
o Displacement of smallholders; ando Landlessness, “the state of those agricultural
workers not owning or renting land and without access to permanent employment” (FAO, 2003).
Land tenure, on the other hand, “refers to the rules, authorities, institutions, rights and norms that govern access to and control over land and related resources. It defines the rules
and rights that govern the appropriation, cultivation and use of natural resources on a given space or piece of land. It governs who can use what resources, for how long and under what conditions. Strictly speaking, it is not land itself that is owned, but rights and duties over it” (IFAD, 2008).
There are three main aspects of enhanced access to land: (i) strengthening land tenure security and land rights; (ii) increasing the amount of land that someone has access to; and (iii) improving the productivity of land. Alternatives to enhancing access to land for agriculture may include promotion of non-farm activities and urbanization (IFAD, 2008).
After a series of validation workshops and the piloting phase of the draft monitoring framework by the countries, the tables on the following page show a list of indicators that are generally available and accessible.
Additionally, indicators on inputs such as budgets and policies are also deemed important. LWA members may choose to pursue monitoring land-related policies (e.g., land use, women’s access to land, policies on other marginalized groups like indigenous peoples and fishers, and policies or guidelines on foreign investment in land) as well as agrarian reform budgets.
Establishing national and regional mechanisms for land reform monitoring3
LWA will undertake land reform monitoring in Asia. Members of LWA will take the lead in their respective countries. The ANGOC
3 For more details, refer to the user’s guide accompanying this CSO Land Reform Monitoring Framework.
ANGOC
Regional Secretariat will provide the necessary support in processing national data and consolidate them for regional comparisons.
NationalThe following activities will be undertaken at the national level:
1.Adoption of the monitoring frameworkA consultation process of adopting the proposed CSO Land Reform Monitoring Framework will be initiated. The framework may be revised according to the needs, relevance, and suitability to country situation. Agreed common regional indicators, however,
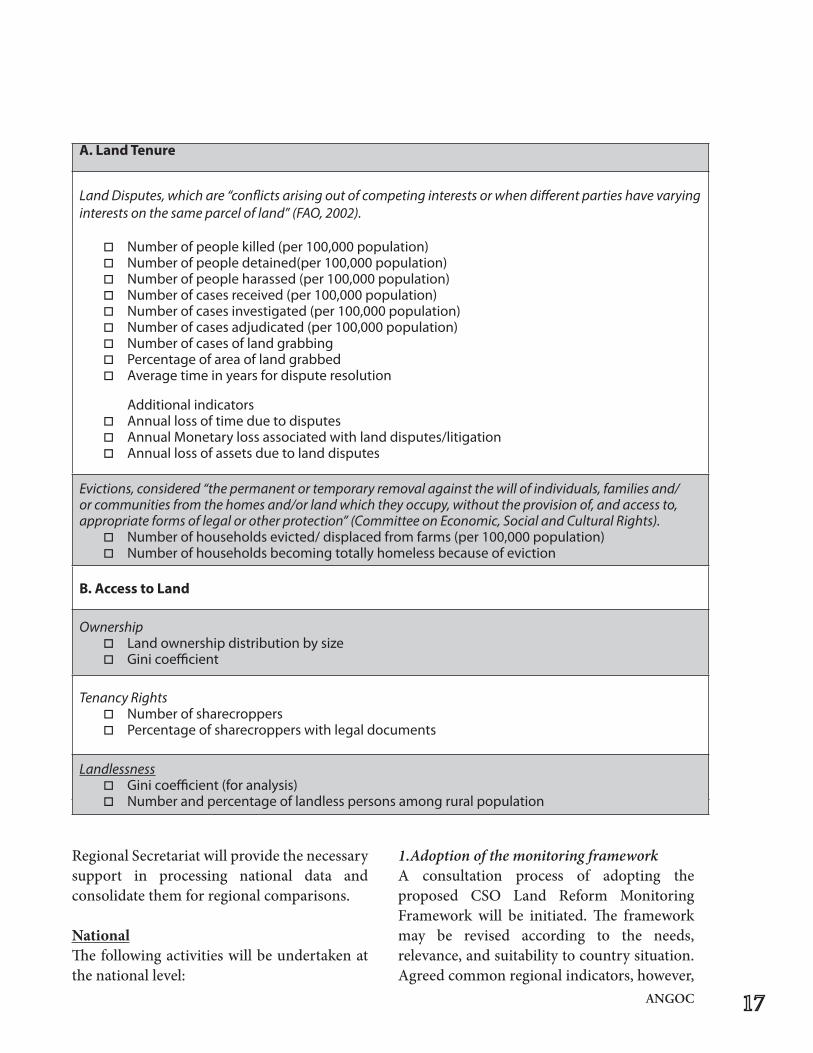
A. Land Tenure
Land Disputes, which are “conflicts arising out of competing interests or when different parties have varying interests on the same parcel of land” (FAO, 2002).
o Number of people killed (per 100,000 population)o Number of people detained(per 100,000 population)o Number of people harassed (per 100,000 population)o Number of cases received (per 100,000 population)o Number of cases investigated (per 100,000 population)o Number of cases adjudicated (per 100,000 population)o Number of cases of land grabbingo Percentage of area of land grabbed o Average time in years for dispute resolution
Additional indicators o Annual loss of time due to disputeso Annual Monetary loss associated with land disputes/litigationo Annual loss of assets due to land disputes
Evictions, considered “the permanent or temporary removal against the will of individuals, families and/or communities from the homes and/or land which they occupy, without the provision of, and access to, appropriate forms of legal or other protection” (Committee on Economic, Social and Cultural Rights).
o Number of households evicted/ displaced from farms (per 100,000 population) o Number of households becoming totally homeless because of eviction
B. Access to Land
Ownership o Land ownership distribution by size o Gini coefficient
Tenancy Rights o Number of sharecroppers o Percentage of sharecroppers with legal documents
Landlessnesso Gini coefficient (for analysis)o Number and percentage of landless persons among rural population
will be maintained and used by LWA members in all countries.2. Setting up national steering committees and secretariatsUsing the monitoring framework, members of LWA will set up their own National Steering Committee that will provide policy direction and guidance. It is suggested to build on various expertise and to include NGOs, farmer organizations, indigenous people’s organizations, members of the academe, and other relevant sector representatives. Government “champions”, whenever approp-riate, may be invited as members of the steering committee.
The National Steering Committee will be supported by a secretariat that will be responsible for day-to-day operations.
3. Conduct of land reform monitoringThe National Secretariat under the guidance of the steering committee will undertake land reform monitoring. It should not only collect and collate information but also provide analyses as bases for more strategic interventions among members. It should strengthen its information capacity to influence policy makers.
4. Data validationThe success of land reform monitoring depends largely on the credibility of data. Collected information will be validated and triangulated. Data sources should be researched and double- checked.
5. Dissemination of reportsReports will be produced annually. To influence programs and policy directions, reports will be submitted to appropriate government, intergovernmental organizations, and the
media. Forums and dialogues will also be convened to advocate urgent issues. Blogs and other information technology platforms will be utilized to reach a wider audience.
Geographic information system (GIS)-generated maps will also be used to enhance the presentation of monitoring data. These maps are powerful analytical, advocacy and communication tools, especially when employed in land issues. It can complement the data gathered by demonstrating relationships, such as the correlation between landlessness and poverty, visually.
Regional
At the regional level, a similar process and mechanism will be established; selected indicators for regional comparison will be central to analyses. Comparative analysis will figure greatly. Follow-up studies will also be conducted to substantiate data results.
Challenges encountered and lessons learned
Inputs from participating countries have revealed common ground through the pilot testing of the framework. A general agreement that there is a deficiency, if not absence, of successful implementation of essential land reform programs exists. For instance, in Indonesia, policies have been crafted but have not been implemented.
Representatives of Pakistan also share that the unavailability of “updated and reliable official data regarding land use and tenure” caused setbacks in the completion of their study. Another challenge is the scarcity of institutions directly advocating land rights
ANGOC
and its attendant issues. Land reform had been a strong movement in the early 1970s but has weakened in the past decades. Only recently has there been an urgent call for another large-scale advocacy, with the onset and exposition of massive land grabbing. Indigenous communities and women are major concerns of the participants. It has been observed that most of land acquisitions in the rural areas have reached the uplands, affecting many indigenous communities. And with the increases in population and demand for land, most of those left landless are women.
Postscript
The increasing competition for land that is anticipated to intensify in the near future requires good governance to balance competing interests of various sectors towards attaining food security and sustainable rural development. Monitoring these developments will be valuable in making sound and informed policy decisions. Inputs of CSOs will be critical for their ability to articulate the situations of farmers and other vulnerable sectors.
This framework provides the general para-meters for LWA members in monitoring land reform programs in their own countries. It is not meant to be a detailed manual but a reference for anchoring their policy and advocacy work. The accompanying user’s guide to CSO land reform monitoring provides the road map but leaves enough room for creativity and value additions.
For those who are more academically inclined and would want to pursue the development of Land Reform Development Index that has
been thoroughly discussed by some partners, this framework can serve as the foundation in developing quantifiable indicators using mathematical formulations.
If resources would allow, LWA should invest in establishing a database that will facilitate the collection, processing, and dissemination of data and results. Such database will be a valuable contribution in the efforts of CSOs to uphold land rights in rural Asia.
References
ANGOC. 2009. Securing the Right to Land: A CSO Overview on Access to Land in Asia. Quezon City.
ANGOC. Proceedings of regional workshops (May 2010, September 2010, May 2011, July 2011)
Bending, Tim. November 2009. Monitoring Secure Access to Land – Progress and Prospects. Draft paper prepared for ILC
FAO. 2002. Land Tenure and Rural Development. Land Tenure Studies. Rome.
IFAD. December, 2008. Improving access to land and tenure security.
PhilDHRRA. Philippine Asset Report Card. 2008.
Draft pilot country monitoring reports
United Nations Conference on Trade and Development. 2009. “World Investment Report 2009: Transnational Corporations, Agricultural Production and Development.” United Nations Conference on Trade and Industry, September 17, 2009. Accessed December 1, 2009. http://www.unctad.org/en/docs/wir2009 en.pdf
Launch pad
onitoring should be a regular feature in the activities of civil society organizations (CSOs) to
inform and shape policy advocacy with solid evidence. In 2010, the Asian NGO Coalition for Agrarian Reform and Rural Development (ANGOC) came up with the CSO Land Reform Monitoring Initiative to strengthen the land rights campaign in the region. The initiative is essentially an attempt to make the practice of monitoring more systematic and accessible to CSOs, in the process developing their capacities. The land reform monitoring framework sets the direction for CSOs to more strategically monitor land reform implementation in seven countries involved in the Land Watch Asia campaign – Bangladesh, Cambodia, India, Indonesia, Nepal, Pakistan, and the Philippines. The monitoring framework delineates scope, key indicators, and methodology for land monitoring, and suggests institutional mechanisms for its implementation.
CSOs have monitored several dimensions of land, ranging from land-related policies and budgets to land disputes and distribution of
land ownership. However, efforts have been patchy thus far. Some CSOs have been able to institutionalize monitoring, whereas most have only monitored intermittently, given time and resource constraints. Our “competitive advantage” as CSOs is our continued engagement with and unflagging support for rural communities, which can lend us the claim that we know what is actually happening on the ground.
This monitoring initiative strives to depict the real situation of the poor and landless, which tends to be glossed over in macroeconomic reports. It is a sincere effort to incite the public to go beyond numbers and understand the story they seek to tell. For instance, how many people have been removed forcibly from their homes to give way to oil palm plantations in Indonesia or socioeconomic concessions in Cambodia? How many peasants are landless? How many are small and marginal landowners? How many landowners are non-tillers? Are governments doing anything at all to enhance not only access to land but also ownership, and not only ownership but control of the land? These are but some of the questions that the monitoring initiative raises and seeks to answer, before they are subjected to analysis. This article presents a summary of the results of the pilot monitoring initiative, and is peppered with process notes to elaborate on the monitoring framework as tool. It primarily draws information from the pilot
Monitoring Land Reformsin Asia: Status Check
Regional summary prepared by Catherine Liamzon for the Asian NGO Coalition for Agrarian Reform and Rural Development (ANGOC) and Land Watch Asia (LWA).
ANGOC
monitoring reports submitted by Land Watch Asia country focal points. It also gleans data from government sources and NGO sources, as identified throughout the article. In some instances, we have referenced the original sources (as cited in the country reports) in footnotes, for the reader’s ease.
Without being overly ambitious in its scope, it serves as an overview on the common threads of land tenure and access to land that compose most of the fabric of today’s modern Asian societies.
Limitations
CSO monitoring suffers from several constraints. First, the issue of land invites a wide range of perspectives. The Asian experience on land ownership and access is so diverse, to say the least, making comparability questionable. Developing a framework for monitoring land reform in the region underwent several consultation processes, including pilot testing, which actively involved
members of the Land Watch Asia campaign. This was not a straightforward undertaking, as we were confronted by many challenges: availability, accessibility, and credibility of data; and relevance and comparability of the proposed indicators, to name a few.
At least for now, another limitation is that monitoring has focused on farmers. Fishers, forest dwellers, indigenous peoples, and other marginalized groups are as yet excluded, though countries have free rein to include these in monitoring.
Third, it seeks to supplement, or in other cases, challenge official data. However, CSOs cannot engage in extensive data gathering, so they cannot do without using government data. CSOs recognize though that official data shy away from saying how government policies and programs have affected communities adversely. Nor do the data readily admit government’s poor performance by stating the facts as they are: most governments are guilty of overstating performance and covering up failures.
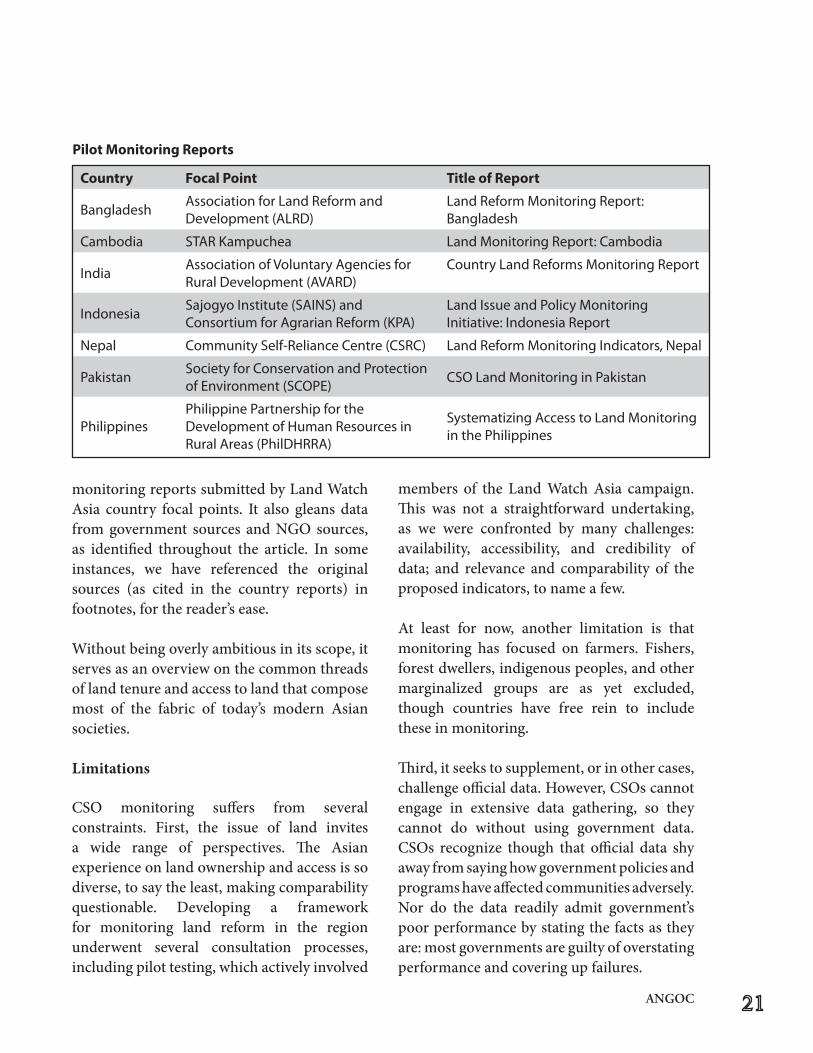
Country Focal Point Title of Report
BangladeshAssociation for Land Reform and Development (ALRD)
Land Reform Monitoring Report: Bangladesh
Cambodia STAR Kampuchea Land Monitoring Report: Cambodia
IndiaAssociation of Voluntary Agencies for Rural Development (AVARD)
Country Land Reforms Monitoring Report
IndonesiaSajogyo Institute (SAINS) and Consortium for Agrarian Reform (KPA)
Land Issue and Policy Monitoring Initiative: Indonesia Report
Nepal Community Self-Reliance Centre (CSRC) Land Reform Monitoring Indicators, Nepal
PakistanSociety for Conservation and Protection of Environment (SCOPE)
CSO Land Monitoring in Pakistan
Philippines Philippine Partnership for the Development of Human Resources in Rural Areas (PhilDHRRA)
Systematizing Access to Land Monitoring in the Philippines
Pilot Monitoring Reports
Finally, because monitoring should also be sustainable – and not just strategic – it should use indicators to which CSOs can remain faithful over the years. This implies the selection of indicators that are relatively inexpensive to monitor, yet relevant and doable. This is why we selected land disputes, land grabbing, and evictions, as some of the indicators to focus on strategically.
Monitoring “land reform” – what land reform?
For instance, monitoring land reform as such is problematic. Since the CSO land reform monitoring initiative was launched, it has been pointed out quite a few times that only programs actually being implemented can be monitored. In Indonesia’s case, land reform, let alone agrarian reform, has never been fully implemented. In the 1960s, the government initiated land reform. However, land reform was stigmatized due to “the war” against communism. Perceived as a subversive act rather than social justice measure, it was therefore discontinued.1 They therefore suggest calling it “land management”.
Furthermore, “land reform” connotes mere land distribution to the landless, and therefore becomes a limiting concept that renders an injustice to its genuine spirit. “Agrarian reform”, in contrast, is conceptually seen as broader in scope than land reform, to include fisheries and forestry. Moreover, agrarian reform is not merely about land redistribution, nor access to land. Instead, it encompasses a range of social services like credit, technology, post-harvest facilities, and irrigation.
1 SAJOGYO and KPA, August 2011. Land Issue and Policy Monitoring Initiative: Indonesia Report.
Another important distinction made is that agrarian reform, unlike land reform, implies structural change – restructuring access and ownership of land and water resources. This is nothing short of an overhaul of the existing structures of ownership of agrarian resources – to redress historical injustices and exploitative relationships.
However, for simplicity’s sake, we have decided to use land reform and agrarian reform interchangeably, unless otherwise indicated. Varying contexts of land reform in Asia The underlying assumption of the CSO land monitoring initiative is that the contexts vary per country, both in terms of land reform per se and the monitoring of land reform. The countries demonstrate diversity in histories, land use and tenure systems, land policies, and experiences in land reform. Also, the levels of CSO capacities, institutional relationships in land campaigns, levels of access to government, and relationships with state and other institutions, influence the degree of monitoring that country focal points can undertake.2
By no means exhaustive, this section presents a simple introduction to the diverse contexts for land reforms in Asia, and in turn, the focus of monitoring as chosen by the country focal points.
Bangladesh
Characterized by rising inequality and landlessness, Bangladesh has to be understood 2 ANGOC. 2011. CSO Monitoring Land Reform in Asia: Status Check; A Regional Workshop + Dialogue under the CSO Land Reform Monitoring Initiative. Highlights of the Proceed-ings. Jakarta, Indonesia, 13 – 14 July.
ANGOC
in the context of its political economy. Its economy is split between the powerful minority – comprising one million –and the “un-empowered’ majority of 149 million. Land reform has progressed at a snail’s pace, while moral support and financial resources for it are lacking. Activists have encountered harassment from government and opposition from land grabbers and powerful people. Longstanding unresolved issues of land reform comprise: acquisition and distribution of khas land; limited land rights of ethnic and religious minorities; women’s access to land; and fishers’ access to water bodies. Other issues include land grabbing and commercial shrimp farming. 3
Monitoring in Bangladesh has adhered generally to the proposed indicators laid out in the CSO land reform monitoring framework. It has looked at policies and the budget; as well as land disputes, evictions, ownership and distribution of land, and landlessness, in the context of the government’s khas land distribution program.
Cambodia
Land reform in Cambodia reached a milestone in 2001 with the promulgation of its Land Law. This was followed by laws and programs that improved access to land for the poor. The government’s Land Administration, Management and Distribution Program, aims to strengthen land tenure security and land markets, and prevent or resolve land disputes; manage land and natural resources equitably, sustainably and efficiently; and promote land distribution with equity. The Sub-decree on
3 Khas land pertains to government land for distribution in Bangladesh.
Social Land Concessions (SLCs) was issued in 2003 to give land to the poor, while the Sub-decree on Economic Land Concessions (ELCs) was issued in 2005 to grant state land for industrial and commercial agriculture use.
In recent years, land has come under intense demand and competition, due to domestic, regional and international economic trends. Cambodia is witnessing urbanization, real estate boom, special economic zones, hydropower projects, and economic corridors.
Monitoring has focused on four main components: inputs (laws and policies, programs, budget, and aid), land tenure (issuance and distribution of titles), access to land (landlessness, land grabbing, tenancy and sharecropping), and land disputes (cases received and resolved, affected households).
India
Land reform is a state subject in federal India. Land reform legislations, implemented in its early post-Independence period, resulted in the abolition of the zamindari system; redistribution of ceiling surplus land; tenancy reforms; regulation of sharecropping; and the provision of homestead lands to landless households, among others. However, the “unfinished task of land reforms” is enormous, especially given the large size, diversity, federal structure and uneven progress across states. Monitoring in India, then, is more practicable when done on a state level. AVARD has chosen to start monitoring in Bihar, based on the recent report and recommendations of the Bihar Land Reforms Commission.
At the national level, monitoring will check particularly the passage of the national land reforms policy and land use plan, and the implementation of other significant land-related policies such as the Forest Rights Act. Monitoring would ascertain the status of land reforms to strengthen dialogue by looking at: access to land and homestead; sharecropping; landlessness; protection of land of Scheduled Castes and Scheduled Tribes; land disputes; budget; land records and maps; and the reordering of the governance structure.
Indonesia The Basic Agrarian Law of 1960 serves as a basis for restructuring land control and ownership. However, taking into account the diverse agrarian systems within the country, it was drafted in broad and generic terms. The Basic Agrarian Law was only in effect from 1961 to 1965; no real agrarian reform has transpired since 1966. The government has a National Program on Agrarian Reform (PPAN), but so far “land reform” has entailed asset legalization and limited redistribution of land. This law needs to be supplemented with regulations specific to the local context, which are being discussed in the wake of the revival of land reform in the country. Indonesian NGOs have thus chosen to focus on monitoring policy, in particular the process of drafting the law.
Rather than the implementation of the agrarian reform program per se, monitoring has involved policy, programs and budget; land problems (landlessness, tenancy, and conflicts); and impacts, or the degree of land-related violence as manifested in evictions, deaths, and arrests.
Nepal
Nepal is a land- scarce country, whose agrarian system remains highly feudal to this day. Efforts at land reform have been unsuccessful thus far. The country, a fairly new democracy, has a window of opportunity for incorporating land reform in the constitutional drafting process, which has been protracted. Land reform commissions in 2009 and 2010 produced land reform reports with recommendations. However laudable they may be, their implementation is still wanting, and needs to be monitored.
CSOs have been lobbying for the formulation and implementation of land-related laws and government programs. Such focus has been a central component of its monitoring as well. Other monitoring variables include land ownership and distribution; disputes and conflicts; land fragmentation; displacements; rural-urban migration; and changes in landholdings.
Pakistan
Pakistan has had three land reform efforts under three different governments (1959, 1972, and 1977). The Land Reform Act of 1977 was an attempt to tackle land tenure insecurity and inequality in access to land, redress gaps in prior legislation and implement tenancy, land ceiling and land distribution reforms. However, land reform has never been able to take off in the country. Some provisions of the 1977 act have even been regarded as “un-Islamic” by the courts. Further, the country has a highly complex system of land laws and overlapping institutions based on legal customary and Shari‘a laws. The Corporate Farming Ordinance of 2000 facilitates
ANGOC
transnational corporations’ land leases. This policy is an additional and serious threat to any further attempts at enhancing the poor’s access to land in the country. On a more positive note, the vibrant peasant movements in the country can give land reform the impetus it needs to be carried out.
Obtaining updated and reliable data in Pakistan is a real challenge, but monitoring has managed to look at the legal framework, patterns of land distribution, tenancy, land disputes, and corporate farming.
Philippines The Philippines’ experiences in agrarian reform span more than two decades. The country already has a comprehensive legal and policy framework with the purport of enhancing access to land to basic sectors of society: farmers, fishers, indigenous peoples, and forest communities. In view of this, monitoring has extended beyond the traditional confines of agrarian reform implementation for small farmers, and into claiming ancestral lands of indigenous peoples and securing rights of fishers to municipal waters and foreshore lands. It looks at the government’s targeted areas for reform under three different laws: agrarian lands, municipal waters, and ancestral domains, vis-à-vis actual accomplishments. This focus on tenure security also includes threats such as disputes, overlapping claims, and encroachment.
In future, some of the policy issues for land monitoring will include: the completion of the land acquisition and distribution component of CARPER (by 2014); the provision of support services; budget; and the efficiency of the agrarian reform process and dispute resolution.
Status Check: Land Tenure
Land disputes Land disputes are “conflicts arising out of competing interests or when different parties have varying interests on the same parcel of land”.4 We use “conflicts” and “disputes” interchangeably.
Land-related killings, detainments and harassment
Land disputes may escalate to direct violence. Disputes attributed to land have resulted in killings, detainments, and harassment. The estimated total number of deaths in Bangladesh attributed to land litigation in 2002 was 32,073. Likewise, for the same year, an estimated total number of 1.18 million people were detained, while 26.3 million were harassed due to land litigation.
In Indonesia, six people were killed in agrarian disputes in the period 2007–2010. The Consortium for Agrarian Reform (KPA) logged the deaths of at least 19 farmers and activists in the struggle for land in 20 provinces during the Reform Era. In terms of arrests, at least 102 people were arrested from 2006 to 2010 in 14 cases; another source mentions 936 farmers and activists arrested from 1997 to 2000 and 217 for the period 2002–2009.5 Yet one more source (SPI) cites 18 deaths from 2007 to 2009; and 166 victims of agrarian conflict in 2007, 312 in 2008, and 84 in 2009.6
4 Food and Agriculture Organization. 2002. Land Tenure and Rural Development. Land Tenure Studies. Rome. 5 Excludes 2008. KPA was unable to compile data for the year 2008. 6 Serikat Petani Indonesia (Indonesian Farmers Union) cited in SAINS and KPA, 2011, Land Issue and Policy Moni-toring Initiative: Indonesia.
Forty-three criminalization cases and cases of officer violence were recorded in the country from 2004 to2010. In 2009, there were some 4,000 cases of human rights violations in the country: 62% of which were agrarian and environment-related issues.7
Plantations are the leading cause of mounting agrarian conflicts in Indonesia, making up 38% of the total number of disputes. Some 663 communities in 19 provinces face 172 plantation companies owned by either the government or private sector. Data compiled by KPA from 1998 to 2007 show 184 dispute cases in the country. Twenty-eight percent of disputes were on farms, while 16% were on forests. Compensation, public facilities, and mining make up the rest of the cases. Furthermore, according to the National Land Agency (BPN), 7,491 cases were reported in the span of 40 years. Agrarian conflicts covering 19 provinces are increasing.
Within the Philippines’ legal framework are mechanisms for settling land disputes; but in spite of this, farmers still fall prey to human rights violations.8 From 2005 to 2010, 16 people were reported killed, while 39 people were harassed and one person was detained. This is most likely understated, as specific data are compiled at the local level. Organizations monitoring and documenting incidents of agrarian-related violence against farmers documented a total of 2,377 cases, but timeframes for recording vary, while there are potential overlaps.9 7 Human Rights Commission, as cited by Gunawan (2011) and SAINS and KPA, 2011, Land Issue and Policy Monitoring Initiative: Indonesia.8 Philippine Partnership for the Development of Human Resources in Rural Areas (PhilDHRRA). 2011. Systematizing Access to Land Monitoring in the Philippines. 9 Organizations documenting agrarian-related violence are: Asian Human Rights Commission, Task Force Detain-
Landowner resistance in surrendering lands has also been a source of land disputes. One study found that land conflicts between farmers and other farmers are the number one type of conflict (41%), only followed by conflicts with former landowners (at 35%).10
Land-related cases received, investigated, and adjudicated The word “case” is variably applied to different country contexts. Conventionally, a case would pass through a dispute resolution system, whether formal or informal. But in other instances, a “case” is treated simply as an occurrence or incident recorded by NGOs or government.
If a case is filed or received, then it is, or should be, investigated. Adjudication is a formal form of conflict resolution, where a judge pronounces a verdict in clear favor of one party. The monitoring initiative’s indicators look at the number of cases that are received – or recorded; how many are investigated and how long does this take; and how many are actually adjudicated.
A significant part of cases are land-related in the countries covered. It is reasonable to assume that this is because of the high dependence on land in most countries, where agriculture is a primary source of livelihood. In Pakistan for instance, an estimated 60% to 80% of cases brought before lower-level civil courts and the high courts are land-related.11
ees of the Philippines, Task Force Mapalad, Partnership for Agrarian Reform and Rural Development Services, and FIAN International. 10 PhilDHRRA. 2008. Philippine Asset Reform Report Card. 11 United States Agency for International Development. November 2008. Pakistan Rule of Law Assessment Final Re-port.
ANGOC
Similarly, in Indonesia, data from the Supreme Justice shows that 60% to 70% of processed cases are land-related. Land disputes also comprise the largest category of cases – 31% of those filed – brought in the court system of Nepal.12 (Landlord-tenant disputes and family law cases that may include property disputes are separately classified and, comprise yet large portions of the total number of court cases.)
In some countries, informal and traditional dispute resolution mechanisms exist; only unresolved land dispute cases end up in court. However, cases in the formal court system can languish for several years. Court cases tend to be complex, requiring knowledge of the intricacies of the system, as well as substantial investments of time and financial resources. The protracted processes of litigation are often “delaying tactics” to preserve the status quo, thereby serving powerful interests.13 To illustrate, one study in Bangladesh reveals the disastrous effects of the “curse” of [inefficient] land litigation: families in litigation spend inordinate sums of money and time, only to become more destitute in the end– to the point of selling the land to recoup expenses – than when litigation began.14
For the abovementioned reasons, the formal court system does not benefit the poor. The scales of the judiciary seem tipped away from the poor. A suggestion that emerged in this monitoring initiative was to look into whether cases are settled in favor of the rich, or of the poor. In Cambodia, for example, 12 From 1999–2003, 40,000 cases brought in final courts were land disputes. 13 USAID Land Tenure and Property Portal and CSRC, 2012, Land Reform Monitoring Indicators, Nepal. 14 Abul Barkat and Prosanta K. Roy. 2004. Political Economy of Land Litigation in Bangladesh: A Case of Colossal National Wastage. Dhaka: Association for Land Reform and Rural Development / Nijera Kori.
complainants frequently lose even if land dispute cases proceed to the courts.15
In some countries, such as Bangladesh, the formal court system is the only recourse for dispute settlement. The annual number of new land-related cases in the country is 63,158: 206 cases per 100,000 population. Some five million acres (2.02 million ha) of Bangladesh’s privately-owned land are under litigation. The annual number of land-related litigation is 3.2 million. At the local level, settling disputes does not normally work; but at the same time, settling it at the higher levels is not an affordable option for the poor.
A tremendous backlog of 103,000 land cases awaited resolution in Nepal (2007). In 2010, 34,840 cases were registered; 14,583 were solved, based on data from the Department of Land Reform and Management. Because land cases take at least a year to resolve – but often several more - in the formal court system, the country’s poor and marginalized pursue claims in more accessible forums, such as the District Revenue Department Offices. Village development committees can handle 13 types of disputes, including land-related cases involving encroachment and boundary issues; however, not enough is presently known about how effectively the VDC courts are operating. In Pakistan, where a land recording and registration system is wanting, every party must prove its right to land when any question arises.16 By one estimate, there are over a million pending land cases across the country.
15 ANGOC. 2009. “Overcoming a Failure of Law and Political Will” (Cambodia Country Paper). Securing the Right to Land: A CSO Overview on Access to Land in Asia. 16 United States Agency for International Development. November 2008. Pakistan Rule of Law Assessment Final Re-port.
It takes anywhere from four to ten years for court cases to be resolved, during which the party in possession of the land delays adjudication to prolong use of the land. People are thus inclined to opt for the informal dispute resolution mechanisms at the panchayat level rather than the formal court system.
At any point in time, there are 1.4 million land-related cases in Bangladesh, only 25% of which are investigated – possibly the reason land litigation takes an average of 9.5 years. Civil suits take around 11.4 years, criminal suits 7.9 years, and revenue suits 7.5 years, according to survey results. Based on extrapolation, there are 82 adjudicated land-related cases per 100,000 population.
Attempts have been made in Bangladesh to quantify the impacts of these land disputes.17 The annual loss of time due to such disputes is staggering: an estimated 1,687 million hours.18 Furthermore, land disputes have cost the economy an estimated $3,824.6 million. In terms of loss of assets due to land disputes, the figure is pegged at about $1,772 million annually.
Each year, the Philippine Department of Agrarian Reform receives an astounding average of 46,000 and 14,000 Agrarian Law Implementation (ALI) and DAR Adjudication Board (DARAB) cases respectively. ALI has an average accomplishment rate of 94% in terms of cases resolved, while for DARAB it is 96%.
From 2000 onwards, the mounting DARAB cases filed can generally be due to the shift in focus of land acquisition to private lands.
17 Dr. Abul Barkat, Professor and Chair of the Department of Economics at the University of Dhaka, has made such attempts. 18 Extrapolated using annual number of land-related pending cases, number of persons involved in each case, and average loss of hours per year per person involved.
The percentage of resolved cases is high – but in whose favor? Also, the reality is that the absolute number of cases is high, and that they are pending for several years. For ALI, judicial and quasi judicial cases, some 7,889 cases are still pending, as of June 2009.
The average cost for legal assistance is P839/ha, while the average cost for adjudication is P1,049/ha. In terms of time, ALI cases lie in wait for an average of 1 year and 4 months, but this figure is probably understated.
Cambodia’s Cadastral Commission claims to have resolved 8,560 cases in 2010, which involve fewer households (about five) and 2 ha of land on average. It received 5,193 dispute cases, resolving 35% of cases: 34% are pending; 25% are rejected due to non-compliance; and 5% are withdrawn.
On the other hand, the NGO Forum on Cambodia recorded 236 land dispute cases in the country: only 17% as of 2009 have been resolved; 67% are pending. The rest (16%) were simply dropped, or information about them was insufficient. Of the 41 resolved cases in the country in 2009, the Cadastral Commission and the National Authority for Resolution of Land Disputes (NALRD) – the institutions primarily mandated to settle land disputes – settled only two, quite a small proportion. In their stead, the local authorities resolved 42%, while the court system resolved 22% of cases.
However, the 236 reported cases of land disputes are far from comprehensive. What they do say is that land disputes, which have been increasing in incidence, have been associated with strong economic growth, historically and geographically. Land disputes are concentrated in provinces where lands are
ANGOC
abundant and economic activities are rising. Land disputes peaked in 2008 during the real estate boom, and afterwards declined, coinciding with the country’s economic downturn. The average land dispute case involves 201 ha of land and 125 households. Land disputes have amounted to nearly 30,000 households over 47,500 ha of land. Disputes over lands of larger sizes are usually between forest-dependent communities and grantees ELCs.
Only 11% of cases recorded by KPA in Indonesia from 1945 – 2000 were investigated by stakeholders: government, legal aid agencies, and NGOs. 19 Six percent were investigated but not adjudicated, while a meager 5% were investigated and adjudicated. BPN claims the resolution of 1,778 cases, out of 7,491 reported cases, in the past 40 years. Of these, 4,581 were land disputes; 858, land conflicts; and 2,052, land cases on trial.20
Evictions and Displacements
Evictions refer to the forcible removal of people from the land against their will. Because of the nature of evictions, data are not easy to obtain. Macro-level data on evictions are generally unavailable, especially for big countries. Some NGOs monitor specific regions and provinces.
Households evicted or displaced from their farms due to loss of land – as caused by environmental hazards such as floods, desertification, tsunamis, typhoons – are excluded from this list, but represent an area that should be studied.
19 Based on KPA data (2002). Data set is from 1945 – 2000. 165 out of 1,455 cases were investigated. 20 National Land Agency (BPN) data, 2008, as cited in Gunawan (2010) and SAINS and KPA, Land Issue and Policy Monitoring Initiative: Indonesia Report (2011).
The annual eviction or displacement rate of households in Bangladesh has been estimated at 1%. This translates to 250,000 households annually displaced, or 200 households per 100,000 population.
The heightened demand for land in Cambodia – manifested in development projects, land disputes, and land grabbing – leaves an estimated 150,000 people at risk of eviction.21 In fact, in the period 2004 -2008, 14,300 families were evicted in the capital of Phnom Penh. In the longer period, from 1990 to 2008, 26,600 families were evicted – approximately a hundred thousand people – almost 10% of the number of Phnom Penh’s residents.
In Indonesia, for the period 2007–2009, a total of 61,350 households were evicted or displaced from farms.22
Over the last six decades, about 60 million people in India have been displaced from their lands to make way for development projects: an estimated 40% of these are Scheduled Tribes (STs), while 20% are Dalits or Scheduled Castes (SCs). Only about a third is estimated to have been resettled.
Although no data are available, in Pakistan, landlords evicting tenants-at-will or changing terms of working relations can only be expected to intensify as the demand for land increases.23
21 Amnesty International. 2008. Rights Razed: Forced Evic-tions in Cambodia, AI Index. 22 Serikat Petani Indonesia (Indonesian Farmers Union), 2010. Catatan Pembangunan Pertanian dan Pedesaan Korpo-ratisasi Pertanian telah Meminggirkan Pertanian Rakyat. Ja-karta: Dewan Pengurus Pusat Serikat Petani Indonesia. 23 Roots for Equity. 2005. Agrarian Reform Research in Pakistan. APRN Coordinated Research Conference on Agrar-ian Reform. 17-18 October 2005. Talisay, Negros, Philippines. Asia-Pacific Research Network.
Land Grabbing
Land grabbing means different things to different groups, but it implies one thing – land is taken without the consent or agreement of the other party.24 The term has come to be associated with large-scale acquisitions or leases of land for agriculture, including corporate farming, usually leading to evictions of communities. Unless explicitly stated otherwise, “land grabbing” as used in this article will refer to this general understanding.
In Bangladesh, land grabbing refers to powerful people occupying khas land. In point of fact, the Parliamentary Standing Committee of the land ministry reported that nearly 10,000 acres (4046.86 ha) of khas land in Dhaka and its environs are illegally occupied by real estate owners or the land grabbers. The estimated annual number of land grabbing cases exceeds 10,000. Land grabbed comprises approximately 27% of all agricultural land, and 6% of the country’s total land area. As well, agricultural land under contract farming is expanding. Land grabbers illegally occupy 88.5% of khas land, at the obvious expense of the landless and poor.
In Indonesia, it is defined as “seizure of land that has been cultivated and settled in by the people.”25 Although the people possess proof of ownership and pay taxes, their lands are still taken by government institutions and the private sector – often for military or plantation purposes. IHCS reports 43 cases of land grabbing – seven of these involve criminalization and violence.
24 ANGOC’s journal, Lok Niti, Vol. 18/1, 2012, “Land Grab: Changing the Terrain of Land Tenure” compiles cases from various countries and situates the land grabbing phe-nomenon in the Asian context. 25 Indonesian Human Rights Committee for Social Justice (IHCS), 2010.
Cambodia’s economic land concessions number about 139 scattered throughout 18 of the country’s 24 provinces. In 2010 alone, there were 85 large-scale and 47 small-scale ELCs with less than 1,000 ha. Total ELCs encompass about 1.5 million ha. Presently, there are 61 mining concessions and 21 SEZs.
All over India, special economic zones (SEZs) or free trade zones of big businesses and industries are mushrooming. State governments, too eager to generate employment and attract investments, have encouraged the establishment of SEZs; almost 500 approved SEZ projects (2008) cover approximately 60,000 ha of land for this “public purpose”, mostly on agricultural land that affects the livelihood of many poor farm holders.26
In Nepal, commercial pressures on land are being felt. The conversion of agricultural lands, especially in the Kathmandu Valley, along with areas in the hill districts and the Terai, for real estate development is increasing alongside land speculation. Overseas remittances fuel the real estate boom and the process of urbanization, leading to escalating prices of land.27
The influx of agricultural investments
Competition for land is increasing, and food security concerns represent one of the major drivers of this. Foreign governments are leasing or acquiring lands for their own food security. Meanwhile, foreign companies are looking for more commercial farmlands. Agriculture export processing zones are being set up in various parts of the region, often in prime agricultural lands.
26 ANGOC. 2009. Securing the Right to Land: A CSO Overview on Access to Land in Asia. 27 Bharat Shrestha. 2011. The Land Development Boom in Kathmandu Valley. ILC, CIRAD and College of Development Studies.
ANGOC
China is investing in agricultural lands in countries like Cambodia, Indonesia, Malaysia and the Philippines, while Gulf countries have poured significant investments into Pakistan. The United Arab Emirates bought 324,000 ha of farmland in Punjab and Sindh provinces in 2008, for instance.
Palm plantation areas are constantly expanding in Indonesia, which has overtaken Malaysia as the world’s largest producer of palm oil, with some 6.5 million devoted hectares. The country is friendly to investors for oil palm production, providing incentives like tax holidays and subsidies.
The Philippines is considered a lease hotspot. Media reports cite the leasing of farmlands by both foreign governments – Bahrain, China, Korea, Qatar and Saudi Arabia – and transnational companies. The Philippine government welcomes such foreign direct investments, establishing the Philippine Agricultural Development and Commercial Corporation (PADCC) to manage them.
Likewise, in Cambodia, economic land concessions are given to private companies up to 10,000 ha for a maximum of 99 years. Since 2004, an estimated 300,000 Cambodians have been victims of land grabbing – or 1 out of 50 citizens.28 In an Oxfam sample survey, 13% of the landless reported that their land was taken without compensation. Also, some case studies showed that ELCs overlapped with communities’ lands, involving more than 300 families per
28 Cambodian League for the Promotion and Defense of Human Rights (LICADHO). 2010. Freedom of Expression in Cambodia: The Illusion of Democracy. Phnom Penh.
case over an area from 8% to 25% of the granted ELC.29
Pakistan, through its Corporate Agriculture Farming (CAF) policy, offers incentives sweet enough to lure investors: 100% foreign equity investment; full repatriation of capital, profits and dividends; and exemption from labor laws. The Corporate Farming Ordinance (CFO) passed in 2001 enables stock-listed corporations to lease land in the country for a period of 99 years, broken into two periods of 50 and 49 years.30 Furthermore, transnational corporations can lease land with a maximum ceiling of 1500 acres (607.03 ha). The government itself is identifying state lands to lease under the CFO. Clandestine land deals have been made.
Status Check: Access to land
Indicators on access to land particularly refer to rural, agricultural lands. Definitions of “landlessness” differ from one country to another. It is generally understood as the absolute lack of land, but there are more nuances to the term. How the term “landlessness” is used in specific country contexts is explained below.
Land ownership and landlessness
Land ownership patterns are highly skewed in Asia. Simply stated, land is concentrated in the hands of a few, rich and powerful landowners; whereas many people own small parcels of land, if at all.
29 Ngo, Sothath and Chan, Sophal, (forthcoming). Economic Land Concessions and Local Communities. NGO Forum on Cambodia.30 Roots for Equity. 2005. Agrarian Reform Research in Pakistan. APRN Coordinated Research Conference on Agrar-ian Reform. 17-18 October 2005. Talisay, Negros, Philippines. Asia-Pacific Research Network.
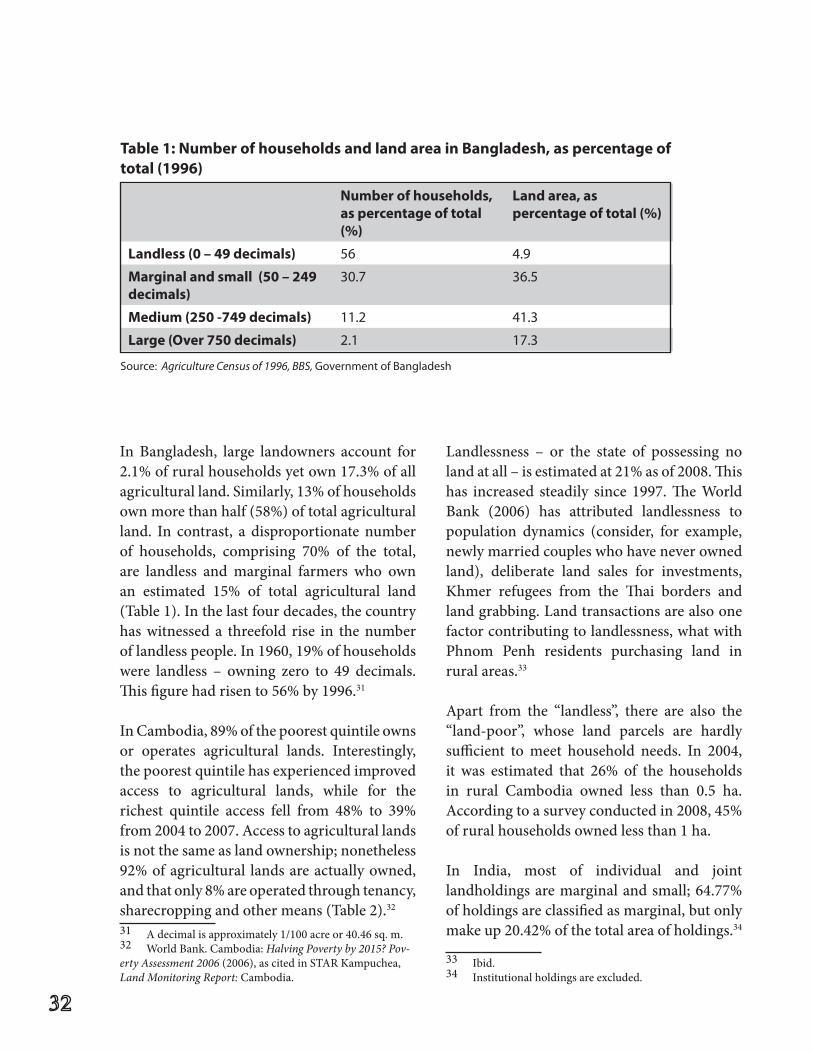
In Bangladesh, large landowners account for 2.1% of rural households yet own 17.3% of all agricultural land. Similarly, 13% of households own more than half (58%) of total agricultural land. In contrast, a disproportionate number of households, comprising 70% of the total, are landless and marginal farmers who own an estimated 15% of total agricultural land (Table 1). In the last four decades, the country has witnessed a threefold rise in the number of landless people. In 1960, 19% of households were landless – owning zero to 49 decimals. This figure had risen to 56% by 1996.31
In Cambodia, 89% of the poorest quintile owns or operates agricultural lands. Interestingly, the poorest quintile has experienced improved access to agricultural lands, while for the richest quintile access fell from 48% to 39% from 2004 to 2007. Access to agricultural lands is not the same as land ownership; nonetheless 92% of agricultural lands are actually owned, and that only 8% are operated through tenancy, sharecropping and other means (Table 2).32 31 A decimal is approximately 1/100 acre or 40.46 sq. m.32 World Bank. Cambodia: Halving Poverty by 2015? Pov-erty Assessment 2006 (2006), as cited in STAR Kampuchea, Land Monitoring Report: Cambodia.
Landlessness – or the state of possessing no land at all – is estimated at 21% as of 2008. This has increased steadily since 1997. The World Bank (2006) has attributed landlessness to population dynamics (consider, for example, newly married couples who have never owned land), deliberate land sales for investments, Khmer refugees from the Thai borders and land grabbing. Land transactions are also one factor contributing to landlessness, what with Phnom Penh residents purchasing land in rural areas.33
Apart from the “landless”, there are also the “land-poor”, whose land parcels are hardly sufficient to meet household needs. In 2004, it was estimated that 26% of the households in rural Cambodia owned less than 0.5 ha. According to a survey conducted in 2008, 45% of rural households owned less than 1 ha.
In India, most of individual and joint landholdings are marginal and small; 64.77% of holdings are classified as marginal, but only make up 20.42% of the total area of holdings.34
33 Ibid. 34 Institutional holdings are excluded.
Number of households, as percentage of total (%)
Land area, as percentage of total (%)
Landless (0 – 49 decimals) 56 4.9
Marginal and small (50 – 249 decimals)
30.7 36.5
Medium (250 -749 decimals) 11.2 41.3
Large (Over 750 decimals) 2.1 17.3
Table 1: Number of households and land area in Bangladesh, as percentage of total (1996)
Source: Agriculture Census of 1996, BBS, Government of Bangladesh
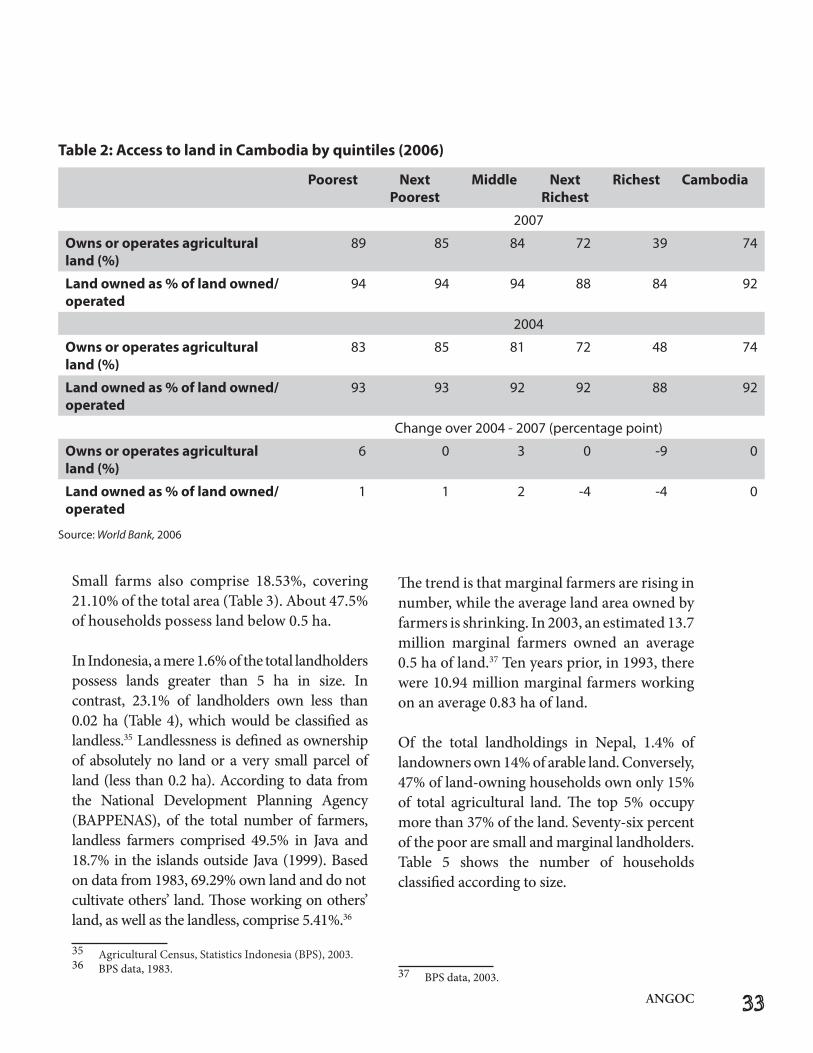
ANGOC
Small farms also comprise 18.53%, covering 21.10% of the total area (Table 3). About 47.5% of households possess land below 0.5 ha.
In Indonesia, a mere 1.6% of the total landholders possess lands greater than 5 ha in size. In contrast, 23.1% of landholders own less than 0.02 ha (Table 4), which would be classified as landless.35 Landlessness is defined as ownership of absolutely no land or a very small parcel of land (less than 0.2 ha). According to data from the National Development Planning Agency (BAPPENAS), of the total number of farmers, landless farmers comprised 49.5% in Java and 18.7% in the islands outside Java (1999). Based on data from 1983, 69.29% own land and do not cultivate others’ land. Those working on others’ land, as well as the landless, comprise 5.41%.36
35 Agricultural Census, Statistics Indonesia (BPS), 2003. 36 BPS data, 1983.
The trend is that marginal farmers are rising in number, while the average land area owned by farmers is shrinking. In 2003, an estimated 13.7 million marginal farmers owned an average 0.5 ha of land.37 Ten years prior, in 1993, there were 10.94 million marginal farmers working on an average 0.83 ha of land.
Of the total landholdings in Nepal, 1.4% of landowners own 14% of arable land. Conversely, 47% of land-owning households own only 15% of total agricultural land. The top 5% occupy more than 37% of the land. Seventy-six percent of the poor are small and marginal landholders. Table 5 shows the number of households classified according to size.
37 BPS data, 2003.
Poorest Next Poorest
Middle Next Richest
Richest Cambodia
2007
Owns or operates agricultural land (%)
89 85 84 72 39 74
Land owned as % of land owned/operated
94 94 94 88 84 92
2004
Owns or operates agricultural land (%)
83 85 81 72 48 74
Land owned as % of land owned/operated
93 93 92 92 88 92
Change over 2004 - 2007 (percentage point)
Owns or operates agricultural land (%)
6 0 3 0 -9 0
Land owned as % of land owned/operated
1 1 2 -4 -4 0
Table 2: Access to land in Cambodia by quintiles (2006)
Source: World Bank, 2006
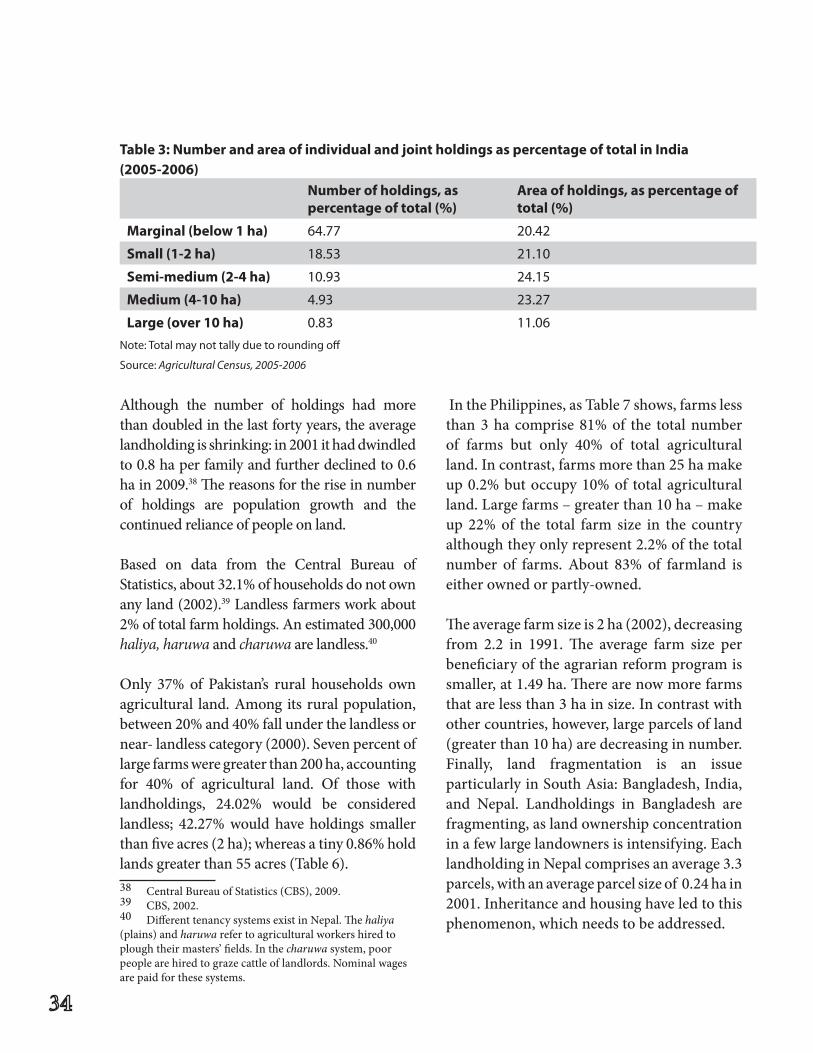
Although the number of holdings had more than doubled in the last forty years, the average landholding is shrinking: in 2001 it had dwindled to 0.8 ha per family and further declined to 0.6 ha in 2009.38 The reasons for the rise in number of holdings are population growth and the continued reliance of people on land.
Based on data from the Central Bureau of Statistics, about 32.1% of households do not own any land (2002).39 Landless farmers work about 2% of total farm holdings. An estimated 300,000 haliya, haruwa and charuwa are landless.40
Only 37% of Pakistan’s rural households own agricultural land. Among its rural population, between 20% and 40% fall under the landless or near- landless category (2000). Seven percent of large farms were greater than 200 ha, accounting for 40% of agricultural land. Of those with landholdings, 24.02% would be considered landless; 42.27% would have holdings smaller than five acres (2 ha); whereas a tiny 0.86% hold lands greater than 55 acres (Table 6). 38 Central Bureau of Statistics (CBS), 2009. 39 CBS, 2002.40 Different tenancy systems exist in Nepal. The haliya (plains) and haruwa refer to agricultural workers hired to plough their masters’ fields. In the charuwa system, poor people are hired to graze cattle of landlords. Nominal wages are paid for these systems.
In the Philippines, as Table 7 shows, farms less than 3 ha comprise 81% of the total number of farms but only 40% of total agricultural land. In contrast, farms more than 25 ha make up 0.2% but occupy 10% of total agricultural land. Large farms – greater than 10 ha – make up 22% of the total farm size in the country although they only represent 2.2% of the total number of farms. About 83% of farmland is either owned or partly-owned.
The average farm size is 2 ha (2002), decreasing from 2.2 in 1991. The average farm size per beneficiary of the agrarian reform program is smaller, at 1.49 ha. There are now more farms that are less than 3 ha in size. In contrast with other countries, however, large parcels of land (greater than 10 ha) are decreasing in number. Finally, land fragmentation is an issue particularly in South Asia: Bangladesh, India, and Nepal. Landholdings in Bangladesh are fragmenting, as land ownership concentration in a few large landowners is intensifying. Each landholding in Nepal comprises an average 3.3 parcels, with an average parcel size of 0.24 ha in 2001. Inheritance and housing have led to this phenomenon, which needs to be addressed.
Number of holdings, as percentage of total (%)
Area of holdings, as percentage of total (%)
Marginal (below 1 ha) 64.77 20.42
Small (1-2 ha) 18.53 21.10
Semi-medium (2-4 ha) 10.93 24.15
Medium (4-10 ha) 4.93 23.27
Large (over 10 ha) 0.83 11.06
Note: Total may not tally due to rounding off
Source: Agricultural Census, 2005-2006
Table 3: Number and area of individual and joint holdings as percentage of total in India (2005-2006)
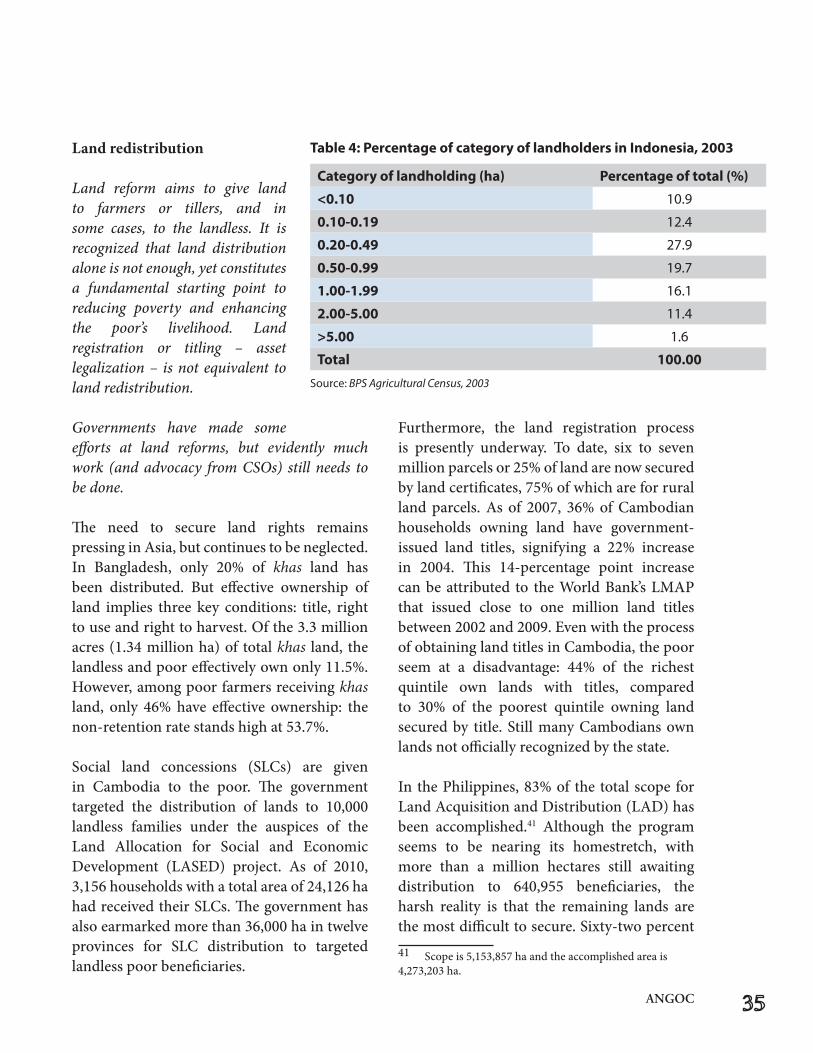
ANGOC
Land redistribution Land reform aims to give land to farmers or tillers, and in some cases, to the landless. It is recognized that land distribution alone is not enough, yet constitutes a fundamental starting point to reducing poverty and enhancing the poor’s livelihood. Land registration or titling – asset legalization – is not equivalent to land redistribution.
Governments have made some efforts at land reforms, but evidently much work (and advocacy from CSOs) still needs to be done.
The need to secure land rights remains pressing in Asia, but continues to be neglected. In Bangladesh, only 20% of khas land has been distributed. But effective ownership of land implies three key conditions: title, right to use and right to harvest. Of the 3.3 million acres (1.34 million ha) of total khas land, the landless and poor effectively own only 11.5%. However, among poor farmers receiving khas land, only 46% have effective ownership: the non-retention rate stands high at 53.7%.
Social land concessions (SLCs) are given in Cambodia to the poor. The government targeted the distribution of lands to 10,000 landless families under the auspices of the Land Allocation for Social and Economic Development (LASED) project. As of 2010, 3,156 households with a total area of 24,126 ha had received their SLCs. The government has also earmarked more than 36,000 ha in twelve provinces for SLC distribution to targeted landless poor beneficiaries.
Furthermore, the land registration process is presently underway. To date, six to seven million parcels or 25% of land are now secured by land certificates, 75% of which are for rural land parcels. As of 2007, 36% of Cambodian households owning land have government-issued land titles, signifying a 22% increase in 2004. This 14-percentage point increase can be attributed to the World Bank’s LMAP that issued close to one million land titles between 2002 and 2009. Even with the process of obtaining land titles in Cambodia, the poor seem at a disadvantage: 44% of the richest quintile own lands with titles, compared to 30% of the poorest quintile owning land secured by title. Still many Cambodians own lands not officially recognized by the state.
In the Philippines, 83% of the total scope for Land Acquisition and Distribution (LAD) has been accomplished.41 Although the program seems to be nearing its homestretch, with more than a million hectares still awaiting distribution to 640,955 beneficiaries, the harsh reality is that the remaining lands are the most difficult to secure. Sixty-two percent 41 Scope is 5,153,857 ha and the accomplished area is 4,273,203 ha.
Category of landholding (ha) Percentage of total (%)
<0.10 10.9
0.10-0.19 12.4
0.20-0.49 27.9
0.50-0.99 19.7
1.00-1.99 16.1
2.00-5.00 11.4
>5.00 1.6
Total 100.00
Source: BPS Agricultural Census, 2003
Table 4: Percentage of category of landholders in Indonesia, 2003
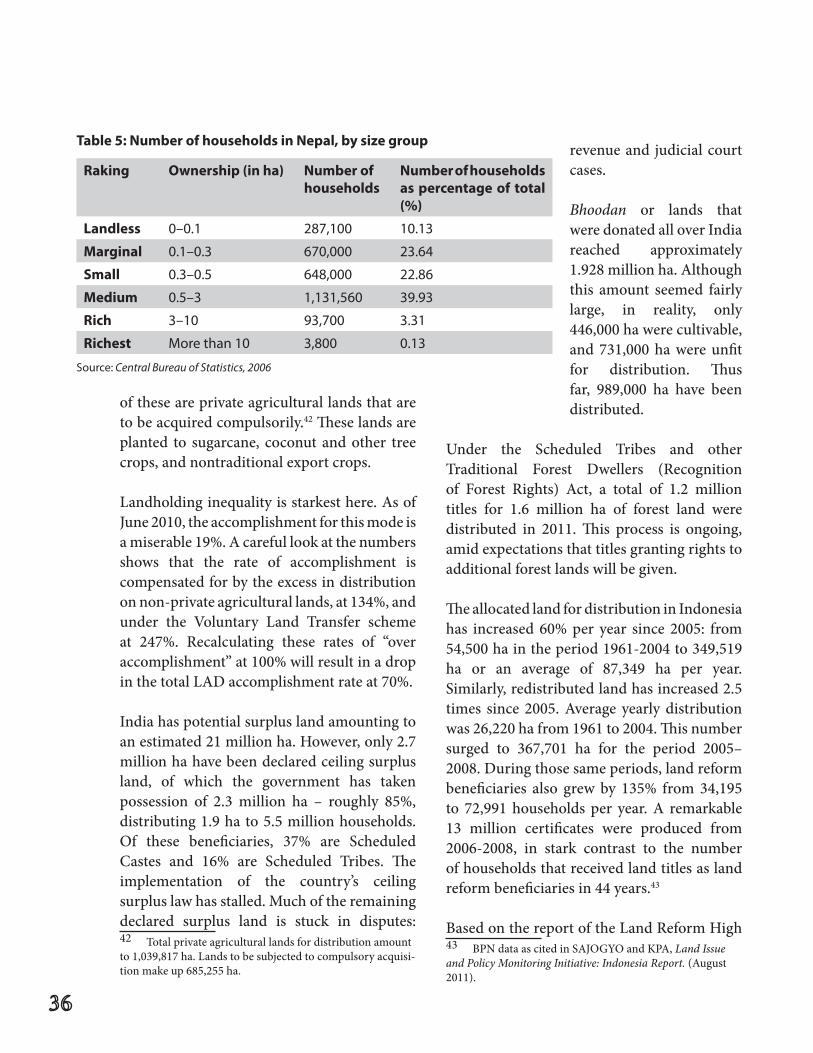
of these are private agricultural lands that are to be acquired compulsorily.42 These lands are planted to sugarcane, coconut and other tree crops, and nontraditional export crops.
Landholding inequality is starkest here. As of June 2010, the accomplishment for this mode is a miserable 19%. A careful look at the numbers shows that the rate of accomplishment is compensated for by the excess in distribution on non-private agricultural lands, at 134%, and under the Voluntary Land Transfer scheme at 247%. Recalculating these rates of “over accomplishment” at 100% will result in a drop in the total LAD accomplishment rate at 70%.
India has potential surplus land amounting to an estimated 21 million ha. However, only 2.7 million ha have been declared ceiling surplus land, of which the government has taken possession of 2.3 million ha – roughly 85%, distributing 1.9 ha to 5.5 million households. Of these beneficiaries, 37% are Scheduled Castes and 16% are Scheduled Tribes. The implementation of the country’s ceiling surplus law has stalled. Much of the remaining declared surplus land is stuck in disputes: 42 Total private agricultural lands for distribution amount to 1,039,817 ha. Lands to be subjected to compulsory acquisi-tion make up 685,255 ha.
revenue and judicial court cases.
Bhoodan or lands that were donated all over India reached approximately 1.928 million ha. Although this amount seemed fairly large, in reality, only 446,000 ha were cultivable, and 731,000 ha were unfit for distribution. Thus far, 989,000 ha have been distributed.
Under the Scheduled Tribes and other Traditional Forest Dwellers (Recognition of Forest Rights) Act, a total of 1.2 million titles for 1.6 million ha of forest land were distributed in 2011. This process is ongoing, amid expectations that titles granting rights to additional forest lands will be given.
The allocated land for distribution in Indonesia has increased 60% per year since 2005: from 54,500 ha in the period 1961-2004 to 349,519 ha or an average of 87,349 ha per year. Similarly, redistributed land has increased 2.5 times since 2005. Average yearly distribution was 26,220 ha from 1961 to 2004. This number surged to 367,701 ha for the period 2005–2008. During those same periods, land reform beneficiaries also grew by 135% from 34,195 to 72,991 households per year. A remarkable 13 million certificates were produced from 2006-2008, in stark contrast to the number of households that received land titles as land reform beneficiaries in 44 years.43
Based on the report of the Land Reform High 43 BPN data as cited in SAJOGYO and KPA, Land Issue and Policy Monitoring Initiative: Indonesia Report. (August 2011).
Raking Ownership (in ha) Number of households
Number of households as percentage of total (%)
Landless 0–0.1 287,100 10.13
Marginal 0.1–0.3 670,000 23.64
Small 0.3–0.5 648,000 22.86
Medium 0.5–3 1,131,560 39.93
Rich 3–10 93,700 3.31
Richest More than 10 3,800 0.13
Table 5: Number of households in Nepal, by size group
Source: Central Bureau of Statistics, 2006
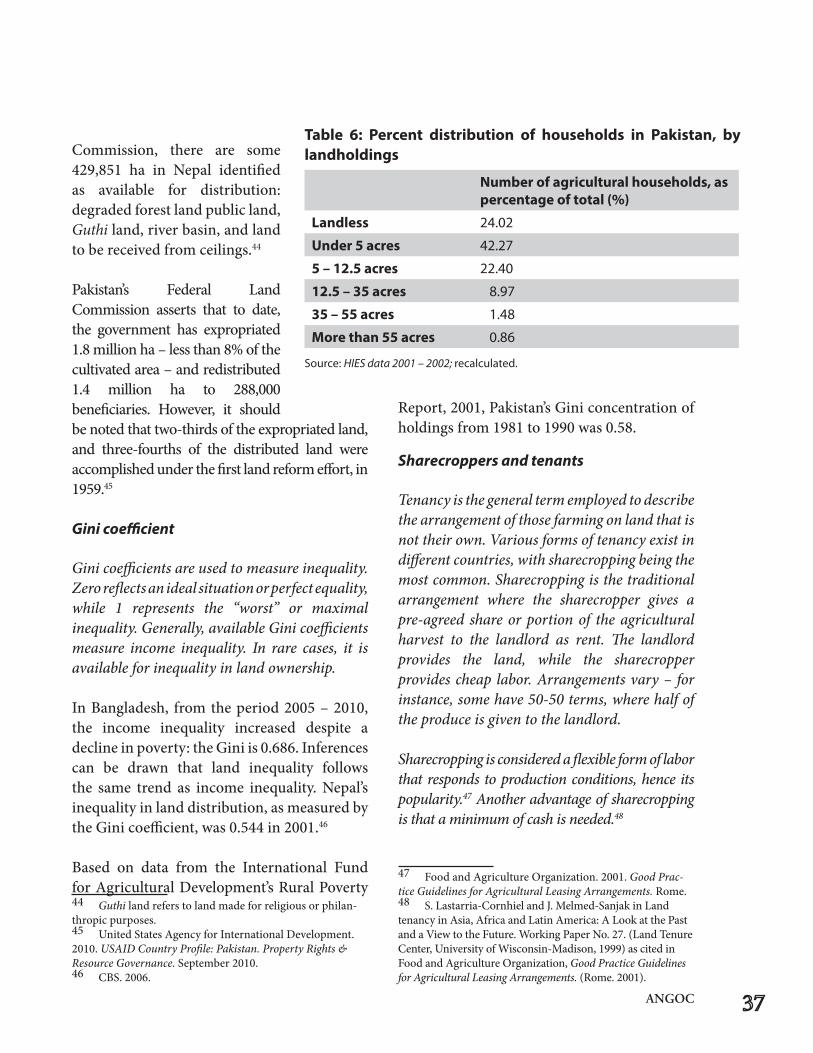
ANGOC
Commission, there are some 429,851 ha in Nepal identified as available for distribution: degraded forest land public land, Guthi land, river basin, and land to be received from ceilings.44
Pakistan’s Federal Land Commission asserts that to date, the government has expropriated 1.8 million ha – less than 8% of the cultivated area – and redistributed 1.4 million ha to 288,000 beneficiaries. However, it should be noted that two-thirds of the expropriated land, and three-fourths of the distributed land were accomplished under the first land reform effort, in 1959.45
Gini coefficient
Gini coefficients are used to measure inequality. Zero reflects an ideal situation or perfect equality, while 1 represents the “worst” or maximal inequality. Generally, available Gini coefficients measure income inequality. In rare cases, it is available for inequality in land ownership.
In Bangladesh, from the period 2005 – 2010, the income inequality increased despite a decline in poverty: the Gini is 0.686. Inferences can be drawn that land inequality follows the same trend as income inequality. Nepal’s inequality in land distribution, as measured by the Gini coefficient, was 0.544 in 2001.46
Based on data from the International Fund for Agricultural Development’s Rural Poverty 44 Guthi land refers to land made for religious or philan-thropic purposes. 45 United States Agency for International Development. 2010. USAID Country Profile: Pakistan. Property Rights & Resource Governance. September 2010.46 CBS. 2006.
Report, 2001, Pakistan’s Gini concentration of holdings from 1981 to 1990 was 0.58.
Sharecroppers and tenants
Tenancy is the general term employed to describe the arrangement of those farming on land that is not their own. Various forms of tenancy exist in different countries, with sharecropping being the most common. Sharecropping is the traditional arrangement where the sharecropper gives a pre-agreed share or portion of the agricultural harvest to the landlord as rent. The landlord provides the land, while the sharecropper provides cheap labor. Arrangements vary – for instance, some have 50-50 terms, where half of the produce is given to the landlord.
Sharecropping is considered a flexible form of labor that responds to production conditions, hence its popularity.47 Another advantage of sharecropping is that a minimum of cash is needed.48
47 Food and Agriculture Organization. 2001. Good Prac-tice Guidelines for Agricultural Leasing Arrangements. Rome.48 S. Lastarria-Cornhiel and J. Melmed-Sanjak in Land tenancy in Asia, Africa and Latin America: A Look at the Past and a View to the Future. Working Paper No. 27. (Land Tenure Center, University of Wisconsin-Madison, 1999) as cited in Food and Agriculture Organization, Good Practice Guidelines for Agricultural Leasing Arrangements. (Rome. 2001).
Number of agricultural households, as percentage of total (%)
Landless 24.02
Under 5 acres 42.27
5 – 12.5 acres 22.40
12.5 – 35 acres 8.97
35 – 55 acres 1.48
More than 55 acres 0.86
Table 6: Percent distribution of households in Pakistan, by landholdings
Source: HIES data 2001 – 2002; recalculated.
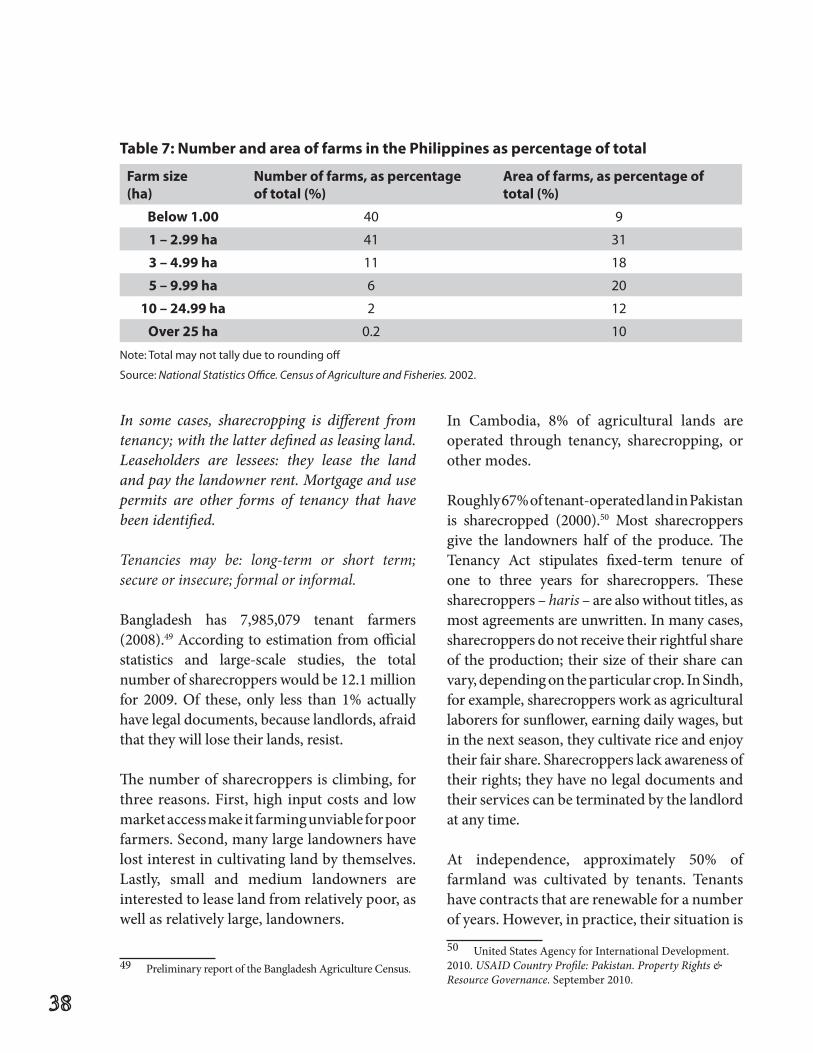
In some cases, sharecropping is different from tenancy; with the latter defined as leasing land. Leaseholders are lessees: they lease the land and pay the landowner rent. Mortgage and use permits are other forms of tenancy that have been identified.
Tenancies may be: long-term or short term; secure or insecure; formal or informal.
Bangladesh has 7,985,079 tenant farmers (2008).49 According to estimation from official statistics and large-scale studies, the total number of sharecroppers would be 12.1 million for 2009. Of these, only less than 1% actually have legal documents, because landlords, afraid that they will lose their lands, resist.
The number of sharecroppers is climbing, for three reasons. First, high input costs and low market access make it farming unviable for poor farmers. Second, many large landowners have lost interest in cultivating land by themselves. Lastly, small and medium landowners are interested to lease land from relatively poor, as well as relatively large, landowners.
49 Preliminary report of the Bangladesh Agriculture Census.
In Cambodia, 8% of agricultural lands are operated through tenancy, sharecropping, or other modes.
Roughly 67% of tenant-operated land in Pakistan is sharecropped (2000).50 Most sharecroppers give the landowners half of the produce. The Tenancy Act stipulates fixed-term tenure of one to three years for sharecroppers. These sharecroppers – haris – are also without titles, as most agreements are unwritten. In many cases, sharecroppers do not receive their rightful share of the production; their size of their share can vary, depending on the particular crop. In Sindh, for example, sharecroppers work as agricultural laborers for sunflower, earning daily wages, but in the next season, they cultivate rice and enjoy their fair share. Sharecroppers lack awareness of their rights; they have no legal documents and their services can be terminated by the landlord at any time.
At independence, approximately 50% of farmland was cultivated by tenants. Tenants have contracts that are renewable for a number of years. However, in practice, their situation is
50 United States Agency for International Development. 2010. USAID Country Profile: Pakistan. Property Rights & Resource Governance. September 2010.
Farm size(ha)
Number of farms, as percentage of total (%)
Area of farms, as percentage of total (%)
Below 1.00 40 9
1 – 2.99 ha 41 31
3 – 4.99 ha 11 18
5 – 9.99 ha 6 20
10 – 24.99 ha 2 12
Over 25 ha 0.2 10
Table 7: Number and area of farms in the Philippines as percentage of total
Note: Total may not tally due to rounding off
Source: National Statistics Office. Census of Agriculture and Fisheries. 2002.
ANGOC
insecure and can be evicted at any time, since their access to legal recourse is limited anyway.
Share-tenancy was abolished in the Philippines and completely replaced by leaseholding, which was seen as a path to land ownership. All sharecroppers have become lessees, whether or not a leasehold agreement has been executed. As of June 2009, there are almost 1.2 million holders of leasehold contracts covering 1.6 million ha or 18% of total farmland.
In Indonesia, the Regulation on Sharecropping has never been implemented. The practice still persists, informally. Data on sharecroppers are not documented by government or NGOs.
Of total agricultural land in Nepal, 9% remains under the tenancy system.51 According to national estimates, about 30% of the rural population rents agricultural land – almost all of whom enter sharecropping agreements as opposed to monetary payments. Some 541,000 tenants registered with the government to receive grants on half their tenanted land; but surveys suggest the number of tenants is at least thrice as high. Sharecropping, however, is said to be decreasing because of out-migration, and increased leaseholds for commercial farming.
In India, 38.5% of the total rural households leasing land are landless laborers. Seven percent of the total operated area in India (2003) was leased by 11.5% of rural households.52 Other estimates place tenancy between 15% and 35% – largely informal and therefore insecure. In certain regions, tenancy incidence goes up to as high as 50%. About 90% of the leased area is unrecorded and informal. 51 Community Self-Reliance Centre. 2005. Land First. Vol. 2. Kathmandu. 52 National Sample Survey Organisation. National Sample Survey, 60th round.
It should perhaps be mentioned here that feudal and exploitative practices still endure in some places, with sharecroppers and agricultural laborers facing high rents and insecure tenure, and receiving cruel or unfair treatment.
Bonded labor, particularly debt bondage exists in Nepal, for example. Haliya and haruwa are plowmen who have an annual contract to work on their landlords’ farms. However, the wages they receive are nominal, making it impossible to pay off the principal; they end up paying only the interest. Compounded interests eventually “bond” the whole family to the debt.53 Freed bonded laborers live in only slightly better conditions, but the government has a program to address their needs, particularly of the kamaiya.54 In certain parts of Pakistan a similar practice – begari or forced and free service – continues.55 Private jails as well as chained haris or sharecroppers were discovered. These haris were unable to pay their loans or their ancestors’. In both countries, landlords are known to resort to unscrupulous practices to retain these tillers in their service. This has prompted the Sindh High Court of Pakistan proposed amendments to the Sindh Tenancy Act, in order to reform the feudal relationship between landlords and sharecroppers.
53 ANGOC. Asserting Freedom from Central Control (Nepal Country Paper). Securing the Right to Land: A CSO Overview on Access to Land in Asia. Quezon City, Philip-pines. 54 Kamaiya is another bonded labor system in Nepal, widely prevalent in the five districts of the Mid-Western and Far-Western regions.55 Roots for Equity. 2005. Agrarian Reform Research in Pakistan. APRN Coordinated Research Conference on Agrar-ian Reform.
Budget, laws and policies
Budgeting for agrarian reform
Agrarian reform – or at least enhancing access to land – requires official government allocations for its implementation. This proposed indicator looks specifically at the agrarian reform budget, or lack thereof. It invites analysis based on how the budget is actually spent.
The budget earmarked specifically for agrarian reform is indicative of the degree of importance governments attach to it. Laws and programs that facilitate improving access to and control over land, but without the corresponding funding, are futile. In fact, infusing more funding is one of the most frequently made recommendations to push the agrarian reform agenda; the others include political will and the establishment of clear targets. Again, funding is certainly not the be-all and end-all of agrarian reform implementation, but it remains a significant avenue to achieve results in agrarian reform.
It is hardly surprising, then, that dismally performing governments in regard to agrarian reform are those same governments with minimal funding for it.
In countries like Bangladesh, no budgetary head or line item such as “agrarian reform budget” exists. For the first time in the country’s history, the national budget of FY 2010-2011 declared that 5,534 acres (2,250 ha) of khas land will be distributed among 34,452 landless households for the year – but this is not matched by any figure in the budget.
Nepal’s national budget merely allocates 0.01% to its Ministry of Land Reform and
Management. Of this already negligible amount, 70% is spent on human resource and administrative expenses. The remaining 30% leaves very limited scope for actual land reform program implementation.
Such goes to show that it is not so much the budgetary figure or allotment that is important, but rather where the money actually goes and how it is spent. Recognizing the inherent limitations of looking at only budget lines, several CSOs in various countries, as part and parcel of their watchdog role, have launched budget monitoring initiatives. They study the variances between government budget and actual spending, as well as the concrete outputs and outcomes of such expenditures. Close budget monitoring has yielded interesting results. For instance, in the Philippines, PhilDHRRA observed that over-releases from the agrarian reform fund were made – coincidentally or not – during election years (2004 and 2007).
Findings from budget monitoring in Cambodia show that a scant average of 0.45% of its annual total budget (2005-2010) is allotted for the land sector. In absolute terms, the budget for land is increasing, from nearly $2 million in 2005, to $6.5 million in 2010, though in relative terms the budget for land as percentage of the total national budget has remained fairly constant.
The Philippine Department of Agrarian Reform’s budget was almost Php20 million in 2010. From 2007 to 2010, more than Php63 million was allotted. Land tenure improvement received the lion’s share - 61% - of the budget for agrarian reform. In contrast, 35% was allocated to support services delivery, and a meager 4% to agrarian justice delivery. Given that the average cost for land
ANGOC
acquisition and distribution is Php92,600, and that some 1 million ha await redistribution, the government still needs Php96 billion to complete land acquisition and distribution.
Meanwhile, in 2008, the Government of Indonesia only allocated Rp23 billion for the National Program on Agrarian Reform (PPAN). According to the Revised State Plan on Revenue and Expenditure Budget, 2010, the total budget for the National Land Agency (BPN) stood at Rp2,951.6 billion. The amount allocated to agrarian reform implementation forms a small fraction of BPN’s budget – a manifestation of government’s lack of commitment to agrarian reform. An addition of Rp7 billion was made, part of which would supposedly fund draft acts and government decrees on land issues such as the agrarian reform government regulation for the implementation of Land Reform Plus and socialization government regulation on idle land policing.
Land-related laws and policies56
Legislation provides a strong basis – though never enough by itself – for enhancing access to land and upholding land rights of the poor. Table 8 provides a list of laws and policies that help make or break land reforms in Asia.
Conflicting laws and policies on land are not uncommon in the region. The national constitutions lay the basic framework enshrining principles of equality and social justice, only to clash with the neoliberal economic framework governments are pursuing. These principles are flouted by laws 56 A more detailed discussion of the legal and policy framework for access to land and security of tenure in Asia is available in Securing the Right to Land: An Overview on Access to Land in Asia (2nd ed).
promoting mining or corporate farming, since these more often than not adversely affect poor and landless communities. Take for example, Indonesia, which has eleven different acts making up a “jungle of regulation”. Such overlapping regulations produce several vertical and horizontal conflicts, and contradict the Indonesian Constitution’s mandate on using resources for the benefit of the people.
It is crucial to understand that overlapping laws and regulations on land are a principal source of disputes. Their raison d’être is to steer government programs and their implementation in a strategic direction. But when legal and policy instruments are at odds with one another, overlapping mandates and conflicts in implementation naturally ensue.
In Pakistan, some provinces have adopted the National Transfer of Property Act, the Registration Act and the Stamp Act. For these, land transfers must be registered with the Provincial Land Registrar, the Provincial Board of Revenue, or certain private housing and development authorities. These parallel systems do not coordinate information. Furthermore, provinces that have not adopted national legislation can adopt their own regulations that may be contrary to national legislation.57
The ministries of Bangladesh in charge of keeping land records, registration, and settlement are uncoordinated and inefficient. Likewise, proper coordination between the District Land Revenue Office and Survey Office is lacking in Nepal.
57 United States Agency for International Development. 2010. USAID Country Profile: Pakistan. Property Rights & Resource Governance. September 2010.
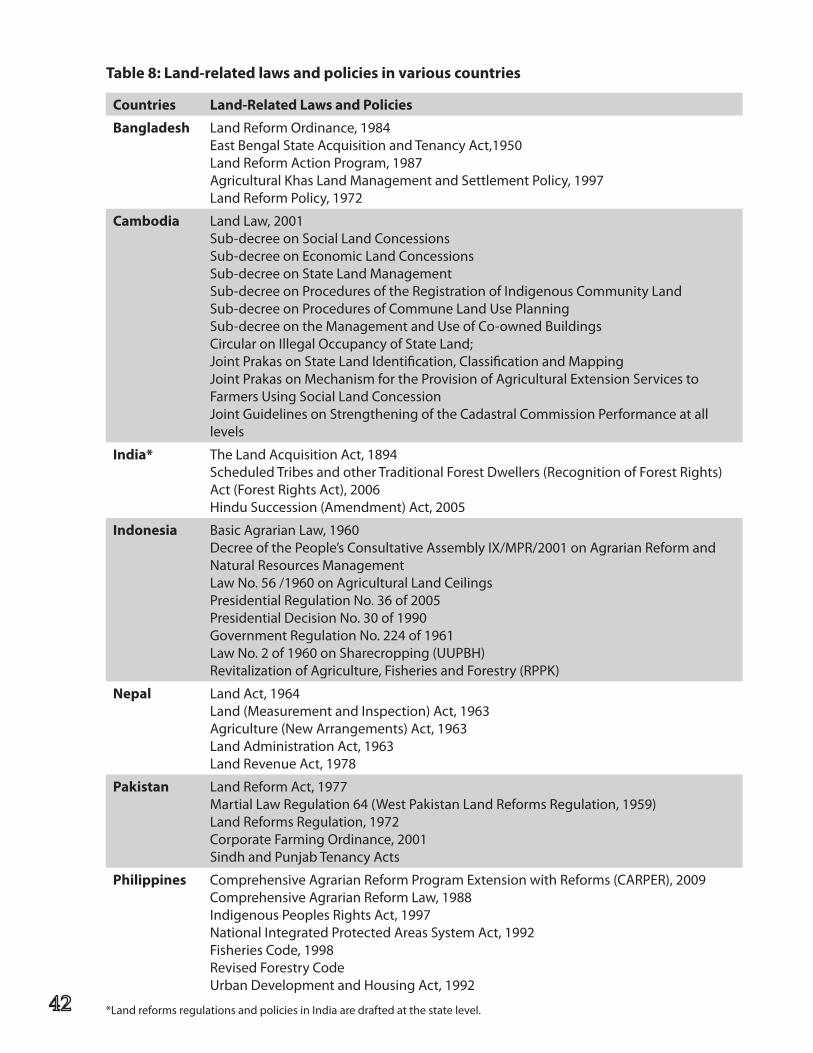
Countries Land-Related Laws and Policies
Bangladesh Land Reform Ordinance, 1984East Bengal State Acquisition and Tenancy Act,1950Land Reform Action Program, 1987 Agricultural Khas Land Management and Settlement Policy, 1997Land Reform Policy, 1972
Cambodia Land Law, 2001Sub-decree on Social Land ConcessionsSub-decree on Economic Land ConcessionsSub-decree on State Land ManagementSub-decree on Procedures of the Registration of Indigenous Community LandSub-decree on Procedures of Commune Land Use Planning Sub-decree on the Management and Use of Co-owned BuildingsCircular on Illegal Occupancy of State Land; Joint Prakas on State Land Identification, Classification and MappingJoint Prakas on Mechanism for the Provision of Agricultural Extension Services to Farmers Using Social Land ConcessionJoint Guidelines on Strengthening of the Cadastral Commission Performance at all levels
India* The Land Acquisition Act, 1894Scheduled Tribes and other Traditional Forest Dwellers (Recognition of Forest Rights) Act (Forest Rights Act), 2006Hindu Succession (Amendment) Act, 2005
Indonesia Basic Agrarian Law, 1960 Decree of the People’s Consultative Assembly IX/MPR/2001 on Agrarian Reform and Natural Resources Management Law No. 56 /1960 on Agricultural Land Ceilings Presidential Regulation No. 36 of 2005Presidential Decision No. 30 of 1990Government Regulation No. 224 of 1961Law No. 2 of 1960 on Sharecropping (UUPBH)Revitalization of Agriculture, Fisheries and Forestry (RPPK)
Nepal Land Act, 1964Land (Measurement and Inspection) Act, 1963Agriculture (New Arrangements) Act, 1963Land Administration Act, 1963Land Revenue Act, 1978
Pakistan Land Reform Act, 1977Martial Law Regulation 64 (West Pakistan Land Reforms Regulation, 1959)Land Reforms Regulation, 1972Corporate Farming Ordinance, 2001Sindh and Punjab Tenancy Acts
Philippines Comprehensive Agrarian Reform Program Extension with Reforms (CARPER), 2009Comprehensive Agrarian Reform Law, 1988 Indigenous Peoples Rights Act, 1997 National Integrated Protected Areas System Act, 1992Fisheries Code, 1998Revised Forestry Code Urban Development and Housing Act, 1992
Table 8: Land-related laws and policies in various countries
*Land reforms regulations and policies in India are drafted at the state level.
ANGOC
In the Philippines, indigenous peoples and farmers have fought over the same land, which was covered by two different laws – the Comprehensive Agrarian Reform Law versus the Indigenous Peoples Rights Act. Such is the case of the Mangyans in the island of Mindoro, who claimed the land as their ancestral domain. Unfortunately, the Department of Agrarian Reform (DAR) included the area under the land reform program, allowing farmers to till the land. The case highlighted the urgency of coordination between DAR and the National Commission on Indigenous Peoples (NCIP), a constitutional body mandated to promote indigenous peoples’ interests.
Policies on women, indigenous peoples and other marginalized groups
Access to and ownership of land of the rural poor are hardly ever equal. The monitoring initiative seeks to focus on monitoring laws and policies that promote equal rights for women, indigenous peoples and other marginalized groups. These marginalized groups have unique concerns that should be especially addressed. The different monitoring reports presented diverse dimensions of marginalized groups’ access to land: policy framework, present status, or specific cases.
Whenever possible, disaggregated land-related data by gender, ethnicity or other socio-economic groups for example, should be used. In future, CSOs can advocate for as well as generate disaggregated data on land.
Women
The importance of enhancing women’s access to land cannot be emphasized enough. Especially in South Asia, women are grossly discriminated against and thus severely
disadvantaged in terms of land ownership and access, because of cultural mindsets, inheritance laws, and prevailing social practices. In such countries where women’s access to land is severely restricted, it can be said that women arguably comprise the single biggest group of marginalized people.
The Islamic practice of tanazul – wherein a woman renounces her right to inherit the land – is prevalent in Bangladesh and Pakistan and impedes women’s land ownership. Though women in Pakistan can legally own land under statutory, religious and customary law, so far this is an urban phenomenon: rural women rarely own land.
Gender inequity in regard to land rights persists in India. In terms of inheritance, through the Hindu Succession (Amendment) Act, 2005, Hindu women in India, constituting some 80% of the female population, have equal land rights. However, in practice, this is not the case. Also, Muslims are governed by their personal law, which normally grants 62.5% to sons and 37.5% to daughters, regardless of their number.
Furthermore, Indian society is predominantly patriarchal, with a few notable exceptions. In some cases, activists have pushed for fresh land allotments for women or joint allotments of spouses.
Though women can inherit, purchase, lease, and benefit from government land allocations in Nepal, they only own 8% of registered landholdings and about 5% of the land. Their land ownership is concentrated in urban areas in the country’s eastern part. A 2006/07 directive waived land registration fees for land registered in the name of women, as well as
other disadvantaged groups, which caused land registration in women’s names to more than double. In 2008, 33% of landholdings registered in 11 districts were in women’s names.
In Cambodia, 70% of titles are issued in the name of both husband and wife; 20% are registered as women’s properties. Philippine laws allow women to own land, yet there are still persisting gender imbalances, especially in rural areas. For example, men have better access to credit, recognized as the primary property owners.
Studies of plantations in Indonesia by Women’s Solidarity present the consequent erosion of land ownership, alongside the traditional livelihood of women peasants. It has altered rural women’s role – from working their paddy fields or producing local crafts to serving as plantation laborers. Once, they were able to grow enough food to meet their families’ needs, but now have to buy food from outside.
Indigenous peoples
No formal definition of “indigenous peoples” exists, but the term broadly refers to ethnic groups or minorities, adivasis, Janajati, uplanders, masyarakat adat and Scheduled Tribes, among others. These groups have their own customary law and traditional institutions.
Indigenous peoples have had a long history of marginalization from their lands, as well as social exclusion and structured discrimination, no matter what country. Indigenous peoples’ rights must be seen through a different lens: a point not to be forgotten is that land is a source of cultural identity among indigenous peoples.
Indigenous peoples’ lands are usually endowed with natural and mineral resources that make it attractive for socio-economic development projects; but they stand to gain so little from these. Safeguard mechanisms such as free, prior and informed consent (FPIC) notwithstanding, they are continually exploited, threatened, evicted. Laws and policies passed to protect indigenous peoples’ right to self-determination, including land rights, where existent, are feebly enforced.
Compared with its neighbors, the Philippines is more progressive in terms of recognizing the rights of indigenous peoples, with the passage of the landmark Indigenous Peoples Rights Act (IPRA). Ancestral lands of indigenous peoples cover an estimated 7.7 million ha. As of 2010, 286 applications for Certificates of Ancestral Domain Titles (CADTs) were filed, a little over half (55%) of which have been approved, representing half of the total ancestral domain area. A CADT application takes an average of 3.4 years before it is finally approved, and even longer before the lands are awarded to the tribes.
The National Commission on Indigenous Peoples, the agency responsible for facilitating titling of ancestral lands, has established targets for certificates of ancestral domain titles for 2011–2014, which fall below previous levels of accomplishments.
Indigenous peoples in Indonesia are “legally” divested of their land through four government schemes. First, through transmigration or the resettling of people into customary or adat lands: people inhabiting densely populated areas like Java were resettled into less densely populated areas, including adat lands. Second, through certification or the provision of legal rights of ownership over land to private
ANGOC
entities. Third, concessions or the award of user rights and permits are given to companies for mining, logging, and plantations. This has resulted in many clashes, with peasants and indigenous peoples have put up resistance; some have been arrested. Lastly, “spatial reconstruction” occurs when the state seizes IP lands for development projects like airports, national parks, and tourism facilities.58
Similarly, India’s Scheduled Tribes and other traditional forest dwellers inhabit hilly and forested areas, many of which are mineral-rich or ideal for development projects such as irrigation, energy, and industry. But because they do not legally own such land, only having traditional usufruct rights, they are vulnerable to displacement. Government acquires the land without so much as consultation, compensation, and rehabilitation. Some estimated 24 million STs have been displaced from their lands over the past sixty years in the name of development.
The Forest Rights Act, 2006 finally came into force. It has brought a ray of hope for STs and other traditional forest dwellers, but “the sword of land acquisition [or] grabbing would still be hanging over their heads.”5959 At least, it has enabled STs as well as other traditional forest dwellers to receive titles for more than 160,000 ha of forest land. Also, the Provisions of Panchayats (Extension to Scheduled Areas) Act is another legislation that aims to safeguard the rights of IPs, requiring that land acquisitions must undergo prior consultation with the Tribal Gram Sabha or village assembly.
58 Quizon, Antonio. “Synthesis Report”. New Challenges and Increasing Pressures on Customary Land Rights in South-east Asia. Phnom Penh, Cambodia. 19 – 22 October 2009. ANGOC and Oxfam-Novib. 59 Association of Voluntary Agencies for Rural Develop-ment 2012. Country Land Reforms Monitoring Report.
However, as is often the case, implementation is lacking.
Meanwhile, vested interest groups grab ethnic minorities’ land in Bangladesh, where 32 different ethnic groups make up 1.2% of total households.
Finally, an estimated 80% of the indigenous population of Nepal comprises small and marginal landowners.
Other minorities
Minority groups include religious minorities and Dalits or Scheduled Castes.
Bangladesh’s Vested Property Act has suppressed the Hindu minority’s land rights, with about one million Hindu households having lost 2.1 million acres of land. Even with the repeal of this law, nothing has changed.
The Dalits or “untouchables” in the Hindu caste system suffer most from discrimination and socio-economic exclusion. They are predominantly landless and poor. Most of Nepal’s Dalits are landless – 44% in the Terai and 22% in the hills. In India, 20% of the estimated 60 million people displaced from development projects in the last six decades belong to SCs.
Roadblocks to land reform Specific country contexts indeed vary, but the road towards land rights is strewn with challenges common in the region. These issues emerged from the pilot monitoring conducted by the various country focal points.
More landless and marginal farmers, but on less land Despite land reform laws and programs, landlessness still persists. Over time, the proportion of rural households with no agricultural land has been growing. Likewise, marginal farmers are increasing in number, whereas the average land area is decreasing. The rise in number of holdings is attributed partly to population growth and dependence on agriculture for livelihood.
Land fragmentation is also happening particularly in South Asia, owing to inheritance practices.
Threats to land tenure: land disputes on the rise
The rising demand for land has intensified competition over it, especially in areas experiencing strong economic growth. Land disputes in the region are on a rising slope – not only in incidence, but in terms of the number of households and land area involved. Land conflicts ensue among various actors in different permutations. On one hand, former and present landlords, government officials, multinational corporations, assert their stake on communities’ land. On the other hand, there are the relatively “smaller” disputes that take place between farmers and other farmers.
All of these groups are fighting for the same piece of forest or agricultural land – to make way for plantation areas, urban areas, mining, military facilities, tourist facilities, and fishing areas, among others.
Their proximate causes are alike across the various countries covered. Overlapping and conflicting land-related laws are a major reason behind land disputes. Also, as previously explained, when laws and policies are not harmonized or strategically aligned, they result in confused mandates, roles, and responsibilities among land-related government agencies.
Also, land disputes can be traced at the source to inefficient land administrations and the weak implementation of land distribution programs. This includes poor land records and registries – characterized by inaccurate or fraudulent records – that continue to plague many countries.
Encroachment on public lands on one hand has been a source of tensions between governments and informal settlers or traditional dwellers. The increasing commercialization of agriculture, the expansion of special economic zones, and thriving economic activity also play a vital role in the rising incidence of land disputes.
Some causes are country-specific. For instance, high incidences of migration in Nepal during the conflict period add to the already complicated situation on land; and land disputes monitored include disagreements within families regarding order of succession and land partition. Landowner resistance to surrender lands in the Philippines is common. Land disputes are widespread in Asia, yet many of these slip under the radar. Those that tend to be noticed are those that erupt in physical violence – and even these are likely to be underreported. To be sure, there are untold stories of land disputes, especially in remote and isolated areas, or places beyond the reach
ANGOC
of CSOs or the media. Land rights are human rights: applying a human rights perspective to land is crucial to understanding the gravity of the situation confronting more than a million rural poor people in Asia. Those with insecure land tenure and access to land are vulnerable to land grabbing, dispossession from their land, and detainments, among others.
Farmers and land rights activists in Asia experience land-related violence, which assumes many forms: molestation, rape, direct terror, intimidation, kidnapping, arrests, detainments, beating, destruction of property, demolition or burning of homes, violent dispersal, evictions, and physical injury. Killings – including attempts – are the extreme manifestation of land-related violence. The figures may vary across the country, yet the fact remains: people are being killed in the name of land. That lives are lost at all points to the glaring absence of the rule of law and the failure of national governments to secure land rights for its people. Any death toll due to land disputes – especially one where farmers are murdered – cannot be condoned.
The mad scramble for farmland Governments are pursuing the expansion of areas for mining, plantations, contract farming, and special economic development zones. But these areas are often situated on community – including indigenous peoples’ – lands.
A crucial point in land grabbing is that it is often encouraged or facilitated by the host governments – the selfsame governments that have tarried in land distribution for the landless. They may limit foreign ownership of land, but they allow the lease of lands for long periods that can last nearly a century.
Lack of transparency emerges as a critical issue in the land grabbing discussion. Shady deals have been made; and without public consultation and access to such information, land grabbing only becomes easier.
Too often, those who stand to gain by corporatization of agriculture are the feudal elites, while the benefits reaching the poor, if any, are minimal.
Bureaucratic inertia
Without a land bureaucracy, laws and policies already in place cannot be implemented. As it were, throughout the region, agrarian reform is hampered by bureaucratic inertia. Most government staff lack the commitment and capacity to perform effectively their roles. Many civil servants in land ministries are overburdened and financial resources to implement programs are inadequate.
Land administration woes
An efficient and effective land administration system facilitates land reform.
Overlapping policies and conflicting mandates
Since the concept of land is broad, it is inclined to fall within the purview of not one, but several, government agencies. Worse than overlapping mandates are conflicting responsibilities, which are largely due to overlapping policies. Coordination – and cooperation – among such agencies tends to be poor and chaotic. It is the landless who bear the brunt of this problem.
Land records and registries
Part of land administration, land records and registries are in a dismal state in many countries, not least in Bangladesh, Cambodia, Nepal and Pakistan. Records are still manual i.e., not digitized, still subject to wear and tear, and therefore unreliable.60
Poor land records can also be traced to erroneous and inaccurate mapping and wrong land surveys. Mapping can be riddled with errors, as countries experience in varying degrees: erroneous description and demarcation of parcel boundaries; errors in trace copies of original cadastral maps; errors in file maps prepared in larger scale from original maps; mismatches between existing maps and new maps prepared by cadastral resurveying; and inaccurate subdivisions on cadastral maps.61 These lead to overlapping land titles, and multiple registrations of the same land by various parties or overlapping land titles.
In Bangladesh, the system is inefficient, non-transparent and corrupt. Multiple copies of documents and records of rights sit in different offices under different ministries, which suffer from a lack of coordination. It is easy to falsify records, hence allowing dual ownership to occur; in turn these lead to disputes and litigations.
Pakistan suffers from a land recording and registration system such that whenever
60 CSRC. 2012. Land Monitoring Indicators, Nepal. Kath-mandu. 61 These problems were summarized as experienced in Nepal (from the Nepal country paper), but findings from dif-ferent countries share a similar fate.
questions arise, each party must prove its ownership of the land.62
Many Cambodians do not have land records, as these were destroyed by the Khmer Rouge in the 1970s. Consequently, donors have exerted efforts to issue land titles to legitimize land ownership.
Nepal has a manual land registration system. Paper forms mean that records can be lost, destroyed, distorted or misinformed. Moreover, its maps are outdated and generally considered unreliable. Initiatives by the Ministry of Land Reform and Management include an electronic land information system and digital mapping.
Corruption
Corruption is unfortunately rampant in all countries, taking on different forms and running to various extents. It exists in the land administration system, and alarmingly, in the judicial system.63 Ironically, these agencies bear the onus of facilitating access to land as well as justice. Not only does corruption thwart the landless poor from justly obtaining land, it also deprives them of their already limited resources.
Prevalent styles of corruption include bribery. The wealthy and powerful pay bribes to government officials in order to keep their land and to win land dispute cases. For example, in Bangladesh, even if a landless beneficiary technically only needs to shell out Tk1 per acre for fees, almost all agents in the distribution mechanism accept bribes. Poor records form the basis for land-related corruption.
62 United States Agency for International Development. November 2008. Pakistan Rule of Law Assessment Final Re-port. 63 Sometimes, even the task of gathering data has required grease money. This is the case in Pakistan.
ANGOC
Not seeing the wood for the trees
Governments tend to focus on titling or asset legalization, but this is not tantamount to reform. Titles without the necessary support services only facilitate reconsolidation in some cases. Farmers, receiving little assistance from government in terms of credit, irrigation, technology and post-harvest services, will find it more challenging to make farming lucrative. They may have no recourse but to sell back their land, or simply get a better deal by putting it on the market.
Titles may be issued, but it does not automatically translate to improvements in people’s lives. Nor does it even mean that people have their land, have rights to use and harvest, and are in control of it.
Transcending figures, pushing more envelopes So we have gathered some evidence. We have compiled data. Far be it from this monitoring initiative to undertake “monitoring for monitoring’s sake”. As we have established, the figures are not enough. Analysis and interpretation of the data must be applied.
The numbers are hints – they signify the struggle for land. They try to tell us about the real stories of human rights violations that take place, of the violence and crimes committed against land rights activists and communities fighting to secure their land rights; of intimidation, kidnapping, murders, arrests, and direct terror.
Beyond the monitoring, there are stories of peasant movements – of people gathering strength in numbers and inspiring hope and
courage among thousands of those who are land-deprived. The Land Watch Asia campaign is a mosaic of these stories.
The results of the CSO land reform monitoring initiative have led to two kinds of recommendations. The first set has used the results to guide and inspire policy advocacy. The second proposes recommendations not only in terms of land reform monitoring per se but also in strengthening capacities of CSOs to propel the land rights campaign forward. CSOs must continue to exert more pressure on governments for legal and administrative reforms, coupled with redistributive land reform.
Go for genuine agrarian reform
Governments should implement a comprehensive and genuine agrarian reform, as opposed to commonly shallow and piecemeal efforts at redistributing land. Genuine agrarian reform denotes changing the unjust structures in society, of putting an end to feudal and exploitative relations. CSOs must push for an agrarian reform that goes beyond land redistribution and into the provision of a wide range of social services. Only then can agrarian reform be genuine, in that it is far-reaching and effects tangible improvements in the lives of beneficiaries.
Formulate and implement national land use policies The neoliberal growth model has spurred demand for agricultural land for infrastructure, industrialization and urbanization, and indigenous peoples’ lands in hilly areas and forests for mining and other industries. Given conflicting demands for land, a national land
use policy will take on the task of outlining or establishing national priorities for land use, which sectoral laws, e.g., forestry policy or agricultural policy, do not. It will harmonize various conflicting laws. Furthermore, without a land use law, the rural poor are at risk of losing their lands. A land use law will also help ensure food security and sustainable development.
Improve the bureaucracy
Widespread reforms are needed in all nooks and crannies of the land administration and management bureaus. This includes resolving conflicting policies and overlapping institutional mandates. Stamping out corruption in land administration is also needed. Lastly, it entails mustering the political will needed to implement land reform.
Resolve disputes more efficiently
Since land-related cases make up the majority of cases in the courts, the various formal dispute resolution mechanisms – in the court system or within the ministries of land reform – should be more efficient, fair and transparent. Dispute resolution at the grassroots level through local-level courts or traditional mechanisms has been suggested as a means of reducing the caseloads of higher-level courts.
Access to information
Data gaps exist as national data on land distribution, land disputes, and landlessness are outdated, unreliable, or simply unavailable in several countries. This impedes monitoring. With regard to land investments, access to timely and reliable information promotes transparency to these transactions. The general public, not least, communities, should have
access to information, especially where land deals are concerned. What next for CSOs? The CSO Land Reform Monitoring Initiative is in its incipient stages. It will always be a work in progress. In due time, it hopes to have established baseline data so progress in agrarian reform implementation can be more evenly measured. The Land Watch Asia campaign commits to continue monitoring land reform and the realization of land rights, and use the results as further basis for engaging national governments as well as intergovernmental organizations in policy discussions. CSOs also have to identify the appropriate mechanisms or avenues where the results can be strategically discussed.
Learning how to monitor better – and share better In specific regard to the monitoring initiative itself, not only the results, but the process has been valuable. CSOs should continue to beef up their capacities in undertaking monitoring and adding more rigor to their research. This can be done through capacity development programs, and continuous sharing of experiences for learning.
The monitoring initiative has shown that CSOs have done well monitoring inputs such as the formulation and implementation of land-related laws as well as budgets or financing for agrarian reform. Land disputes – their incidence, typologies, and sources – represent a promising area for CSOs to monitor. Land grabbing, including the impacts on communities, are also another area which CSOs can choose to concentrate its efforts on.
ANGOC
Land ownership and distribution, as well as landlessness, are trickier, but are well worth the investments of time, money and effort, since they expose the gravity of land inequality and land poverty.
CSOs have been researching on various land issues. The CSO land monitoring initiative represents another opportunity for CSOs to complement the results of existing studies with additional data, and share these findings with a variety of stakeholders.
But beyond sharing of information, CSOs are encouraged to come together and jointly analyze the data available. The different perspectives contribute to the thinking process, thereby enriching data analysis as well as increasing CSOs’ ownership of the monitoring initiative.
Empowering the landless
The CSO monitoring initiative aims to contribute to the empowerment process of the poor and landless, through the use of the results and analysis as inputs to education and awareness building and community organizing - in terms of what to demand vis-à-vis the government’s land policies or programs. Monitoring may be one part, but the heart of advocacy is poor people’s empowerment, mobilizing them to take concerted action for change.
Additional Sources
Amnesty International. 2008. Rights Razed: Forced Evictions in Cambodia. AI Index: ASA 23/002/2008.
ANGOC. 2011. CSO Monitoring Land Reform in Asia: Status check; A Regional Workshop + Dialogue under the CSO Land Reform Monitoring Initiative. Jakarta, Indonesia, 13 – 14 July 2011. Highlights of the Proceedings.
ANGOC. 2009. Securing the Right to Land: A CSO Overview on Access to Land in Asia. Quezon City, Philippines.
Barkat, Abul and Roy, Prosanta K. Roy. 2004. Political Economy of Land Litigation in Bangladesh: A Case of Colossal National Wastage. Dhaka: Association for Land Reform and Rural Development / Nijera Kori.
Shrestha, Bharat 2011. The Land Development Boom in Kathmandu Valley. ILC, CIRAD and College of Development Studies.
Food and Agriculture Organization. 2001. Good practice guidelines for agricultural leasing arrangements. Land Tenure Studies. Rome.
Food and Agriculture Organization. 2002. Land Tenure and Rural Development. Land Tenure Studies. Rome.
Quizon, Antonio. “Synthesis Report”. New Challenges and Increasing Pressures on Customary Land Rights in Southeast Asia. Phnom Penh, Cambodia. 19 – 22 October 2009. ANGOC and Oxfam-Novib.
Roots for Equity. 2005. Agrarian Reform Research in Pakistan. APRN Coordinated Research Conference on Agrarian Reform. 17-18 October 2005. Talisay, Negros, Philippines. Asia-Pacific Research Network. Retrieved from: http://aprnet.org/downloads/books/agrarianreform/agref-roots.pdf.
United States Agency for International Development. 2010. USAID Country Profile: Pakistan. Property Rights & Resource Governance. September 2010. Land Tenure and Property Rights Portal
United States Agency for International Development. November 2008. Pakistan Rule of Law Assessment Final Report.
Summary
n 2011, a new land use policy was tabled for discussion in the Parliament of Bangladesh. If passed, this would supersede the 2001
National Land Use Policy that critics found weak. In the meantime, determined land rights activists have maintained their position that agrarian and land reform requires radical, structural change in land ownership. Pre-conditions have to be addressed before the actual work can start to resolve the complexity of longstanding, core issues in agrarian reform. These issues are: (i) the distribution of khas agricultural land among the poor and landless, (ii) the limited land rights of the religious and ethnic minorities, (iii) women’s access to land, and (iv) the fishing community’s access to water bodies.
The major factors hindering the implement-ation of agrarian reform include: (i) insufficient and confusing laws and legal dispute settlement bodies, (ii) an inefficient administration system that churns out dual or multiple land ownership documents, and (iii) an expanding shrimp cultivation industry that edges out small farmers in favor of big shrimp farms. Urbanization poses severe challenges as well, drawing two different crowds. They are the
landless seeking employment and livelihood, and the resource-rich land grabbers seeking opportunities to own land rising in value.
The role of civil society including peasants’ organizations, non-government organizations, and other organizations, has never been
List of Acronyms used
ADB Asian Development BankARB Agrarian Reform BudgetANGOC Asian NGO Coalition for Agrarian Reform and Rural DevelopmentALRD Association for Land Reform and DevelopmentCIRDAP Centre on Integrated Rural Development for Asia and the PacificEPA Enemy Property ActILO International Labour OrganizationLRDI Land Reform Development IndexLRMT Land Reform Monitoring ToolLWA Land Watch AsiaNGO non-government organizationODA official development assistanceR&D research and developmentUNPFII United Nations Permanent Forum on Indigenous IssuesVPA Vested Property Act
Bangladesh
An abridged version of the paper, “Land Reform Monitoring Report: Bangladesh”, prepared by Dr. Abul Barkat for the Association for Land Reform and Development (ALRD)
ANGOC
fully recognized in government policies. Nonetheless, NGOs have formed networks with international support groups like ANGOC to drive their goals forward. The exercise of constructing the Land Reform Development Index (LRDI) and the Land Reform Monitoring Tool (LRMT) is the first of its kind in the country. It has been found of practical value in monitoring the directions of land reform. Furthermore, it makes it possible to identify areas (by block components, variables, and indicators) of priority interventions and advocacy towards pro-poor land reform.
Monitoring Indicators
The two broad blocks framing the issue of land reform are the input block comprising budget and land policies, and the outcome block, comprised of land tenure and access to land.
The key variables and indicators are shown on the table on the page 54.
Bangladesh has proposed a final monitoring tool and its use is discussed in the body of the report. Given this new tool and research findings, several suggestions are being raised for the consideration of key actors in agrarian reform. These are:
Government
• Sharethelandreformdevelopmentindexand the associated monitoring scheme and tools with the relevant persons/departments in the government and the academe.
NGOs and partners
• Sharethelandreformdevelopmentindexand the monitoring scheme and tools with land-rights based NGOs working in the field.
• Organize an expert group meeting towork out an expected ideal situation/normative scenario for each indicator by time deadline (e.g., reduce the number of people killed/100,000 population by 10 times by the year 2015, and so on).
• Organize large-scale disseminationmeeting (seminar, conference) to sensitize all relevant persons both at home and abroad including development partners.
• Continuemoreresearchonthisendeavorfor further refinement and consensus building involving the core team members deployed by ANGOC.
Context: Status of land reform
Limited access to land by the poor and rising inequality in society continues to confront 66% of the total population of Bangladesh (or 99 million people).
Central to agrarian reform are issues that have become harder to resolve given the land ownership structure. These issues are:
• the distribution of khas agricultural land among the poor and landless,
• thelimitedlandrightsofthereligiousand ethnic minorities,
• women'saccesstoland,and• fishing community's access to water
bodies
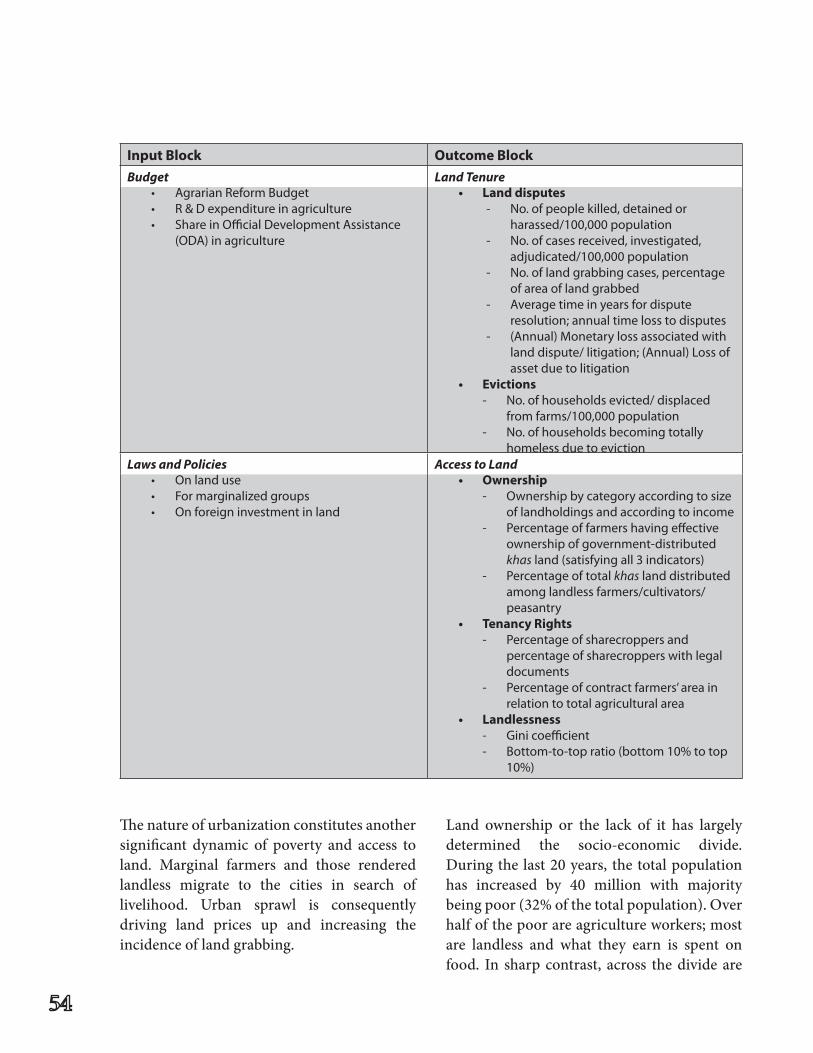
The nature of urbanization constitutes another significant dynamic of poverty and access to land. Marginal farmers and those rendered landless migrate to the cities in search of livelihood. Urban sprawl is consequently driving land prices up and increasing the incidence of land grabbing.
Land ownership or the lack of it has largely determined the socio-economic divide. During the last 20 years, the total population has increased by 40 million with majority being poor (32% of the total population). Over half of the poor are agriculture workers; most are landless and what they earn is spent on food. In sharp contrast, across the divide are
Input Block Outcome BlockBudget Land Tenure
• AgrarianReformBudget• R&Dexpenditureinagriculture• ShareinOfficialDevelopmentAssistance
(ODA) in agriculture
• Landdisputes- No. of people killed, detained or
harassed/100,000 population- No. of cases received, investigated,
adjudicated/100,000 population- No. of land grabbing cases, percentage
of area of land grabbed- Average time in years for dispute
resolution; annual time loss to disputes- (Annual) Monetary loss associated with
land dispute/ litigation; (Annual) Loss of asset due to litigation
• Evictions- No. of households evicted/ displaced
from farms/100,000 population- No. of households becoming totally
homeless due to evictionLaws and Policies Access to Land
• Onlanduse• Formarginalizedgroups• Onforeigninvestmentinland
• Ownership- Ownership by category according to size
of landholdings and according to income- Percentage of farmers having effective
ownership of government-distributed khas land (satisfying all 3 indicators)
- Percentage of total khas land distributed among landless farmers/cultivators/peasantry
• TenancyRights- Percentage of sharecroppers and
percentage of sharecroppers with legal documents
- Percentage of contract farmers’ area in relation to total agricultural area
• Landlessness- Gini coefficient- Bottom-to-top ratio (bottom 10% to top
10%)
ANGOC
the rich (2.7% of total population) who own large landholdings and other assets.
Land ownership status also determines both education and health divides, and more so the gender divide. Existing laws of inheritance, patriarchal values, and social practices perpetuate discrimination against women.
Widespread land grabbing victimizes many among the 32 different ethnic minority groups (1.2% of total households). About one million Hindu households have lost their 2.1 million acres (850,000 ha) because of the enlistment of their property under the Vested Property Act (VPA).1
Poor fishers’ access to khas-water-bodies is highly restricted, affecting the livelihood of about 38 million people. At best, 5% of the total 830,356 acres (336,000 ha) of khas-water-bodies available have been distributed among the poor, on lease basis. The fishers also have to contend with a complex and exploitative marketing system that involves six different intermediaries who benefit most from the value chains.
Shrimpcultivationinthecoastalareascoversabout 2 million ha and involves 1.5 million persons. The shrimp export industry has grown rapidly, contributing 10% to 12% of the country’s total export. The poor producers, however, have not benefited from this economic development; on the contrary, they have been made vulnerable to loss of property rights to scrupulous businessmen.
1 VPA continued as the Enemy Property Act (EPA) enacted during Indo-Pakistani War in 1965. Local influential people and land officials have maintained the reasons and complex mechanisms that uphold the VPA.
Conceptual Framework and selectedvariables and indicators
In the construction of a Land Reform Development Index (LRDI), the two broad blocks used to frame the issue of land reform were the input block comprising budget and land policies, and the outcome block, comprising land tenure and access to land.
Data pertaining to the input block was obtained directly from official government sources and in some cases, estimated. For the outcome block, data came mainly from relevant research studies. Some data from secondary sourceswere re-estimated to suit the purpose of the indicator; in other cases, due to unavailability of relevant data, expert judgment was sought.
There are six indicators for the input block falling under budget and policy/laws. For the outcome block, the five indicators falling under land tenure and access to land are specified further into 21 indicators.
Findings and Analysis
Input Indicators
1. Budget
i. Agrarian reform budget
There is no such budgetary heading as “agrarian reform budget” (ARB) in Bangladesh. The precise amount of ARB is not available, neither in revenue nor in development budget. What is contained in the national budget of the last financial year (2010-2011) is a declaration that 5,534 acres (2,250 ha) of khas land will be distributed among 34,352 landless households during the year.
This specification is a first in the history of Bangladesh. It is important therefore to obtain the data from sources at the Land Ministry and Ministry of Finance, not only on the ARB amounts but also financial outlays for all key components of land reform.
ii. R&D expenditure in agriculture as percentage of total agricultural budget and agricultural GDP
The total amount of R&D expenditure in FY 2010-2011 is Tk1,850 million ($26 million). The estimated R&D expenditure in agriculture is 2.26% of the agriculture budget and 0.12% of the agricultural GDP.
iii. ODA in agriculture
In FY 2008-2009, the total ODA was $1,794.9 million, of which agriculture’s share was $30.1 million. Therefore, the share of ODA in agriculture is 1.68%. The actual share may be higher because a part of ODA (“Rural development and institutions” with $57 million) can be attributed to ODA in agriculture, but to what extent it is difficult to ascertain.
2. Land Policies
Land policies pertaining to land reform are weak, both in terms of policy diversity and implementation mechanisms. Because the National Land Use Policy (2001) was a weak one, a new land use policy is now under discussion in Parliament. Specificpolicies for marginalized groups, namely for indigenous peoples, women, and fishers, and policies or guidelines on foreign investment in land are non-existent. However, various
laws and policies related to distribution of khas land do exist. However, implementation is unsatisfactory because, so far, only 12% of the total agricultural khas land has been distributed among the rural poor. The rest are in the hands of land grabbers with powerful connections.
Outcome Indicators
Land tenure - Variables and indicators
There are a number of indicators for land disputes and evictions, for which relevant values have been estimated based mainly on research studies published between 2002 and 2008.
1. Land disputes
Land dispute has been measured using 12 indicators. Indicator-wise values with associated implications are presented as follows.
i. Number of people killed per 100,000 population
In 2002, the estimated total number of deaths attributed to land litigation would be 32,073. Considering the 2002 population size of Bangladesh, the ratio comes to 25.1 deaths per 100,000 population. This indicator is a tricky one because ideally speaking, in a smooth, peaceful land reform endeavor, the ratio of killings should drop; however, in a real life situation where land is scarce and where a huge amount of distributable khas land is captured by land grabbers, the ratio of deaths (per 100,000 population)
ANGOC
may increase (in the initial phase of reform).
ii. Number of people detained per 100,000 population
The estimated total number of people detained due to land dispute/litigation would be 1.18 million in 2002. This means a ratio of 921 persons detained per 100,000 population.
iii. Number of persons harassed per 100,000 population
The estimated total number of people harassed due to land dispute/litigation would be 26.3 million in 2002. The ratio comes to 2,071 persons harassed per 100,000 population. It is important to note that the number of persons harassed due to land disputes/litigation depends mainly on three factors: the number of land dispute/litigations, number of persons involved in each dispute/litigation, and average years of litigation mitigation time (e.g., in Bangladesh, the total number of land litigation at any time is 1.4 million; on average 45 persons are involved in each litigation, and the average mitigation period is 9.5 years).
iv. Number of land-related cases received per 100,000 population
The annual number of new land-related cases (law suits) is 63,158. This means 206 cases per 100,000 population. This ratio is relatively high due to high dependence on land as well as stiff competition for access to and ownership
of land. Unless land-related legal and administrative reforms coupled with re-distributive land reform are pro-actively pursued, this ratio is bound to go upwards in an increasingly over-populated Bangladesh.
v. Number of land-related cases investigated per 100,000 population
Extrapolation based on research findings shows a ratio of 51 cases investigated per 100,000 population. Note that only 25% of cases are investigated within a year of filing. This might explain why it takes an average of 9.5 years to mitigate land litigation.
vi. Number of land-related cases adjudicated per 100,000 population
Based on the relevant research findings, the number of cases adjudicated has been extrapolated using information on the rate of disposal and on how long land disputes (litigation, suits) are pending in various types of court. Extrapolation shows a ratio of 82 land-related cases adjudicated per 100,000 population.
vii. Number of cases of land grabbing - not available
Land grabbing is rampant in Bangla-desh. Based on expert judgment, it has been estimated that the annual number of land grabbing cases is over 10,000.
viii. Percentage of area of land grabbed
It has been estimated by Dr. Abul Barkat that the area of land grabbed would be equivalent to 27% of all agricultural land and 16% of total land area in Bangladesh. This is a relatively high incidence.
ix. Average time in years for land dispute resolution
On average, it takes 9.5 years to resolve a land dispute—11.4 years for civil suits, 7.9 years for criminal suits, and 7.5 years for revenue suits (all are land- related disputes/litigation).
x. Annual loss of time due to disputes – not available
Extrapolation can be done based on the annual number of land-related pending cases (2.5 million cases), number of persons involved in each case (as plaintiff, defendant, their family members, and witnesses; 45 persons per case), and average loss of hours per year per person involved (15 hours per year per person). These show that the annual loss of time due to land disputes amounts to 1,687 million hours (or equivalent to 211 million work days).
xi. Annual monetary loss associated with land dispute/litigation
The estimated annual amount of monetary loss associated with land disputes/litigation is Tk248,599 million ($3,824.6 million) in 2002.
xii. Annual loss of asset due to land disputes/litigation
The study titled “Political Economy of Land Litigation in Bangladesh” provides data on this indicator. The estimated amount of annual loss of assets attributable to land litigation is Tk115,195 million ($1,772 million in 2002).
2. Evictions
This variable under the “land tenure” component has been measured using two indicators. Estimated values on these two indicators with associated implications are presented below.
i. Number of households evicted/displaced from farms per 100,000 population - not available
In order to estimate the annual number of households evicted/displaced from farms, a set of assumptions has been deployed, which includes 25 million rural households, and 1% annual eviction/displacement rate of rural farm households. Based on these, the approximate number of households evicted/displaced would be 250,000 annually, or over 200 households per 100,000 population. The actual number (ratio per 100,000 population) could be higher than this estimate because of displacement due to climate change and natural calamities (not included in the estimation).
ANGOC
ii. Number of households becomingtotally homeless due to eviction – not available
Based on informed judgment, it has been estimated that in 2008, over 5,000 households became totally homeless due to eviction.
Access to Land - Variables and indicators
This outcome component of land reform is the sum total of a) ownership, b) tenancy rights, and c) landlessness.
1. Land ownership
Land ownership has been measured using three indicators:
i. Ownership by category according to size of landholdings and income
Agriculture Census provides land ownership statistics by five landholding size categories, namely: landless, marginal, small, medium, and large. Census data from 1996 shows that land ownership is highly skewed with large landowners (only 2.1% of all rural households) owning 17.3% of all agricultural land while majority (70% of landless and marginal farmer households) own at best 15% of total agricultural land. Officially, almost all landless people live below the poverty line.
ii. Percentage of farmers having effective ownership of government-distributed khas land
This indicator shows the effective retention rate of land ownership among recipients of khas with reference to the owner possessing the deed in hand, the land itself (possession right), and the ownership over crops (right to harvest). Research shows that only 46% farmers have effective ownership over those lands, reflecting a high non-retention rate at 54%.
iii. Percentage of total khas land distributed among landless farmers/peasantry
As of 2001, at best 20% of total khas agricultural land had been distributed among landless farmers. Although the Agricultural Khas Land Management and Settlement Policy 1997 requiresthe distribution of khas annually, the low achievement implies that: first, a huge amount of khas land (80% of all khas) remains undistributed; and second, this huge amount of khas land is lying with the land grabbers. Both of these are core issues of land reform.
2. Tenancy rights
i. Number of sharecroppers
The number of sharecroppers is on the rise, from 7,985,079 in 2008 to 12.1 million in 2009. Of these, less than 1% have legal documents. The reasons for the increase in numbers are: • the high input cost and low
market access that discourages poor-landless-marginal farmers to continue with farming, preferring
to engage in non-agricultural activities or in informal sector jobs;
• many relatively large landownersdisinterested in cultivating land themselves, switching to non-agricultural activities; these landowners therefore, lease-out their agricultural land to the sharecroppers; and
• small and medium landownersinterested to lease-in land from the relatively poor and relatively large landowners.
ii. Percentage of sharecroppers with legal documents
Estimates based on informed judgment show that less than 1% of the sharecroppers in Bangladesh, have legal documents as sharecroppers. However, the Land Reform Law, 1984 has the provision of giving legal documents to the sharecroppers. Advocacy by ALRD and other land-rights NGOs and civil society may help accelerate the process of providing legal documents to the sharecroppers.
iii. Percentage of contract farmers’ area in relation to total agricultural area – not available
Experts opine that agricultural land under contract farming (for tobacco, shrimp cultivation, and the rich leasing-in from the poor) is on the rise. Estimates based on informed judgment show that the area under contract farming will not exceed 5% of the total agricultural area. The issue of contract
farming deserves serious thinking because of the resulting injustice on and impoverishment of the farmers and environmental deterioration. Contract farming for tobacco in the Chittagong Hill Tracts, for example, is a gross encroachment on the land rights of the indigenous peoples.
3. Landlessness
i. Gini-coefficient
Gini coefficient as a measure of inequality shows the highly unequal land ownership pattern in Bangladesh. The Gini coefficient is 0.686 (in 2005). Between 2005 and 2010, there has been a reduction in poverty from 40% to 31.5% (Household Income Expenditure Survey, BangladeshBureau of Statistics). However, thesame source reports that while poverty rates have declined, income inequality has increased. Therefore, an inference can be drawn that the Gini coefficient value has increased implying greater land inequality in Bangladesh. If so, this justifies the need for accelerated land reform in Bangladesh.
Finalizing the monitoring tool
The land reform development index (LRDI) and land reform monitoring tool (LRMT) is of high utility. It has practical value in monitoring the directions of land reform. This is because of the following reasons.
First, the state of land reform has been envisaged both in terms of inputs (e.g., budget, laws) and outcomes (land tenure and access to land).
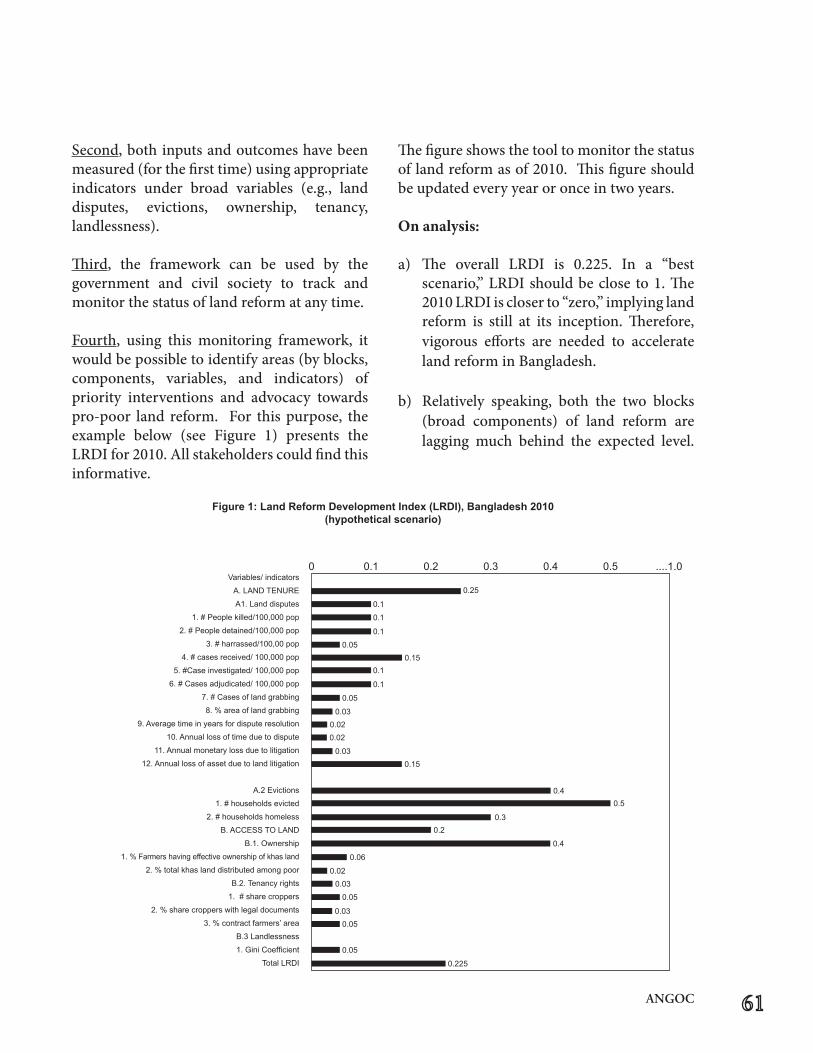
ANGOC
Second, both inputs and outcomes have been measured (for the first time) using appropriate indicators under broad variables (e.g., land disputes, evictions, ownership, tenancy, landlessness).
Third, the framework can be used by the government and civil society to track and monitor the status of land reform at any time.
Fourth, using this monitoring framework, it would be possible to identify areas (by blocks, components, variables, and indicators) of priority interventions and advocacy towards pro-poor land reform. For this purpose, the example below (see Figure 1) presents the LRDI for 2010. All stakeholders could find this informative.
The figure shows the tool to monitor the status of land reform as of 2010. This figure should be updated every year or once in two years.
On analysis:
a) The overall LRDI is 0.225. In a “best scenario,” LRDI should be close to 1. The 2010 LRDI is closer to “zero,” implying land reform is still at its inception. Therefore, vigorous efforts are needed to accelerate land reform in Bangladesh.
b) Relatively speaking, both the two blocks (broad components) of land reform are lagging much behind the expected level.
Figure 1: Land Reform Development Index (LRDI), Bangladesh 2010(hypothetical scenario)
0 0.1 0.2 0.3 0.4 0.5 ....1.0Variables/ indicators
A. LAND TENURE
A1. Land disputes
1. # People killed/100,000 pop
2. # People detained/100,000 pop
3. # harrassed/100,00 pop
4. # cases received/ 100,000 pop
5. #Case investigated/ 100,000 pop
6. # Cases adjudicated/ 100,000 pop
7. # Cases of land grabbing
8. % area of land grabbing
9. Average time in years for dispute resolution
10. Annual loss of time due to dispute
11. Annual monetary loss due to litigation
12. Annual loss of asset due to land litigation
A.2 Evictions
1. # households evicted
2. # households homeless
B. ACCESS TO LAND
B.1. Ownership
1. % Farmers having effective ownership of khas land
2. % total khas land distributed among poor
B.2. Tenancy rights
1. # share croppers
2. % share croppers with legal documents
3. % contract farmers’ area
B.3 Landlessness
1. Gini Coefficient
Total LRDI
0.25
0.1
0.1
0.1
0.050.15
0.1
0.1
0.05
0.030.020.02
0.030.15
0.40.5
0.30.2
0.4
0.06
0.020.03
0.05
0.030.05
0.05
0.225
Of the two components, the “access to land” block (with transformed value 0.2) is lagging behind the “land tenure” block (0.25 value). This implies that more
emphasis should be given on the “access to land” block.
c) Indicators with transformed value, say those equal to or less than 0.02 represent the least addressed domains of land reform. These areas needing aggressive interventions including advocacy efforts are:
• casesoflandgrabbing(0.05)• areaoflandgrabbing(0.03)• average time in years for dispute
resolution (0.02) • annual loss of time due to land
disputes (0.02) • annualmonetary loss due to land
litigation (0.03); • percentage of farmers having
effective ownership of government distributed land (0.05)
• percentage of total khas land distributed among poor (0.02)
• numberofsharecroppers(0.05)• percentage of sharecroppers with
legal documents (0.03) • percentageofcontractfarmers’area
out of total agricultural area (0.05) • Ginicoefficient(0.05)
The utility of this exercise shows precisely where to prioritize interventions, that is, where the transformed values are low.
Conclusion
Based on the research and exercises performed in this study, the following recommendations are being made:
Government
a. Share the land reform developmentindex and the associated monitoring scheme and tools with the relevant persons/departments in government and academia.
b. Discuss with the Land Ministry and the relevant bodies under it (DLRS, LandAppeal Board, etc.) the relevant values attributable to the agrarian reform budget.
c. Push for the declaration of the budget for the distribution of khas land to 34,532 landless households as indicated in the
National Budget, FY 2010-2011, Ministry of Finance.
d. Discuss with the Board of Investment the development of policies or guidelines for foreign investment.
Donors
At the regional and global level, through ANGOC, LWA, ILC-Asia:
a. Campaign with ADB, World Bank, and other international financing institutions about their role as investors on land.
b. Dialogue with intergovernmental organizations.
c. Advocate with UNPFII/ILO to amplify country-wise impact of ILO Convention No.107, 169 for Indigenous Peoples.
ANGOC
d. Dialogue with CIRDAP to institutionalize the land rights agenda at the Asia-Pacific regional level.
NGOs and partners
a. Share the land reform developmentindex and the monitoring scheme and tools with land-rights-based NGOs.
b. Organize an expert group meeting to work out an expected ideal situation/normative scenario for each indicator by time deadline (e.g., reduce number of people killed/100,000 population by 10 times by the year 2015, and so on).
c. Organize large-scale dissemination meeting (seminar, conference) to sensitize all relevant persons–both at home and abroad including the development partners of ALRD. Use publications, seminars, dialogues, trainings (for ALRD’s partners), radio, TV spot, ALRD’s newsletter, and website tools as communication medium.
d. Continue more research on this endeavor for further refinement and consensus building involving the core team members deployed by ANGOC.
How to prepare the Land ReformDevelopmentIndex(LRDI)tool
There is a value for each indicator, as shown in the table below. Convert or transform each value into a scale of ‘O’ to ‘1’, ‘O’ being the lowest value (worse situation) and ‘1’ being the highest value (best situation).
In order to perform the conversion exercise, an ideal or normative value for each indicator needs to be constructed or assumed. For example, under “land disputes” variable, the present obtained/estimated value for the indicator titled “number of people killed (per 100,000 population)” is 25.1. Presuming that a consensus has been reached that in an ideal situation (normative situation), the number of persons killed should be 10 times less than what it is today, i.e., from 25.1 persons killed/100,000 population the figure should go down to 2.51 persons (25.1 ÷ 10) person/100,000 population (most ideal situation, however, should be not 2.51 but ‘0’).
Now, in a 0 to 1 scale, the finally transformed value, as shown in Figure 1, would be 0.1 (2.51 ÷ 25.1). Using this estimation procedure coupled with judgmental normative situation (ideal situation), the transformed values for all 20 indicators (as shown in Figure 1) have been estimated.
The transformed value for a variable is an average value of all indicators representing the variable (e.g., the transformed value for variable “land dispute” is an average of transformed value of 12 indicators under this variable). Similarly, thetransformed value for the block/component “land tenure” is an average of the two variables representing this block (variables here are “land tenure” and “evictions”).
And finally, the land reform development index (LRDI) is a simple average of the two blocks/components, namely “land tenure” and the “access to land”. The higher the LRDI the better, while the lower the LRDI, the worse.
References
Abdullah, A. (1976), “Land Reform and Agrarian Change in Bangladesh”, Journal of Bangladesh DevelopmentStudies,Vol.N,No.1,BangladeshInstituteofDevelopmentStudies:Dhaka.
Ahmed, KU. and AA. Baroi. (1994), Bhumi Zorip PaddhatiTeknikalRules(inBangla):LandSurveyMethods and Technical Rules, Paira Prokashani: Dhaka.
Alim, A. (1979), Land Reform in Bangladesh, Associated Printers Ltd: Dhaka.
Barkat, A and PK. Roy, (2003), “Bangladesh: Community-based Property Rights and Human Rights - An Overview of resources, and legal and policy developments”, in Isabel de la Torre and David Barnhize, eds., The Blues of a Revolution: The Damaging Impacts of Shrimp Farming,publishedbyISANetandAPEX,USA.
Barkat, A. (2007a), Agrarian-Land-Aquarian Reform in Bangladesh: No Better Alternative in Development; presented at 16th Biennial Conference of the Bangladesh Economic Association, 12-15 December 2007.
Barkat,A.andA.Karim(2001),FisheriesSectorPolicyand Social Trends that Impact Livelihoods andPoverty, prepared for DFID, Dhaka.
Barkat, A. and S. Akhter (2001), “A MushroomingPopulation: The Threat of Slumization Insteadof Urbanization in Bangladesh”, The Harvard Asia Pacific Review, Winter Issue 2001, Harvard, Cambridge,MA,USA.
Barkat, A. and S. Zaman (2004), Indigenous People’sRights andAccess to PublicResources: Santal’sStruggleforSurvival,ALRD,Dhaka.
Barkat,A.Zaman,S.,Rahman,A.,Podder,A.,Ullah,M.,Hussain,KA.andSKS.Gupta(2000),AnInquiryinto Causes and Consequences of Deprivation of Hindu Minorities in Bangladesh through the Vested Property Act: Framework for a Realistic Solution,PRIPTrust:Dhaka.
Barkat, A., PK Roy, andMS Khan (2007), Char landin Bangladesh: Political Economy of Ignored Resources, published by Pathok Samabesh:Dhaka(ISBN984-8120-67-X).
Barkat,A.,S.ZamanandS.Raihan(2000),KhasLand:AStudyonExistingLawandPractices,Programmefor Research on Poverty Alleviation, Grameen Trust, Grameen Bank: Dhaka.
Barkat, A., S. Zaman and S. Raihan (2001), PoliticalEconomy of Khas Land in Bangladesh, ISBN984-31-1482-5 ALRD: Dhaka.
Barkat, A., S. Zaman, A. Rahman, and A. Poddar,(1997). Political Economy of Vested Property Act in Rural Bangladesh, Association for Land Reform and Development (ALRD), Dhaka.
Barkat,A.,SH.Khan,M.Rahman,S.Zaman,A.Poddar,S.Halim,NN.Ratna,M.Majid,AKM.Maksud,A. Karim, and S. Islam, (2002). Economic andSocial Impact Evaluation Study of the RuralElectrification Program in Bangladesh, Human Development Research Center, prepared for NRECA International Ltd., Partners of REB and USAID/RPPRProgram,Dhaka:October2002.
Barkat. A, and PK. Roy (2004), Political Economy of Land Litigation in Bangladesh: A Case of Colossal NationalWastage, publisher: Pathak Samabesh,Dhaka.
ANGOC
Barkat. A, and S Huda (1988), “Politico-economicEssence of Ethnic Conflicts in the Chittagong Hill Tracts of Bangladesh”, in Social ScienceReview, Vol. V, December 1988, No. 2, University of Dhaka, Dhaka.
Barkat.A,SZaman,SKhan,APodder,SHoque,andMTUddin (2008), Deprivation of Hindu Minority in Bangladesh: Living with Vested Property, Pathak Samabesh:Dhaka
Barkat. A. (2004), Land and Agrarian Reforms: An Inescapable Hurdle, presented as keynote paper on the occasion of Land Rights Day, Dhaka 9 June, 2004.
Barkat. A. (2004), Poverty and Access to Land in SouthAsia:BangladeshCountryStudy,NaturalResources Institute, University of Greenwich, UK.
Barkat. A. (2006), Rural Electricity Cooperatives in Bangladesh: Impact on Employment Creation and Poverty Reduction, presented at the Expert Group Meeting on Cooperatives and Employment, organized by United Nations Department of Economic and Social Affairs(UNDESA), in collaborationwith InternationalLabour Organization (ILO) and International Co-operative Alliance (ICA), Shanghai, China:18 May 2006
Barkat. A. (2007), Land Watch Country Paper: Bangladesh, prepared for Association for Land Reform and Development, Dhaka.
Chowdhury, AM., A. Hakim, and SA. Rashid (1997),“Historical Overview of the Land System inBangladesh”, in Land Vo1.3, No.3., Published by the Association for Land Reform and Development (ALRD), Dhaka.
Devasish Roy and SHalim (2004), “Protecting ForestCommon through Indigenous Knowledge Systems: Social Innovation for Economic andEcological Needs in the Chittagong Hill Tracts, Bangladesh”, in the Journal of Social Studies;Dhaka.
Gain, P. and S.Moral (1995), “Land Right, LandUseand Ethnic Minorities of Bangladesh”, in Land Journal, Vol. 2. No. 2, ALRD, Dhaka.
Government of Bangladesh (1972), The Bangladesh State Acquisition and Tenancy (Fourth (1972),President’s Order No. 135 (1972), Amendment) Order, 1972, Law Division, Ministry of Law and Parliamentary Affairs, Dhaka.
Government of Bangladesh (1976), Memo No. 522(4)-vi-192/76, dtd.26.11.76. Section VI, Ministry of Land Administration and Land Reforms, Dacca.
Government of Bangladesh (1982), Land Administration andLandReforms,MemoNo.537V-105/82-L.S.,dtd. 2712.82. Section V, Ministry of Law andLand Reforms, Dhaka.
Government of Bangladesh (1983), Land Administration and Land Reforms, Memo No. 115(20)-V-105/82(1)-L.S.,dtd.10.5.83,SectionV,Ministryof Law and Land Reforms, Dhaka.
GovernmentofBangladesh(1984),TheStateAcquisitionand Tenancy Act, 1980 (as modified up to 1983), Bangladesh Government Printing Press: Ministry of Law and Land Reforms Dhaka.
Government of Bangladesh (1986), Method of Settlement of Agricultural andNonagriculturalGovernment Khas Land, Ref. No. 8-46/84/24(64), dtd. 6.1.86, Ministry of Land Administration and Land Reforms, Dhaka.
Government of Bangladesh (1987a), Land Administration Manual, Land Administration Board, Ministry of Land, Dhaka.
Government of Bangladesh (1987b), Land Reforms Action Programme. Circular No. O1/1394 B.S.No. Land Cell/1-1/17, dtd. 1.7.87,. Ministry of Land, Land Reforms Cell, Dhaka.
Government of Bangladesh (1987c), Method of Settlement of Khas Agricultural Land Amongthe Landless, Memo No. 8-46/84/77, dtd. 8.2.87, Ministry of Land Administration and Land Reforms, Dhaka.
Government of Bangladesh (1993a), Bangladesh Population Census 1991, Vol. 2, Bangladesh Bureau of Statistics, Ministry of Planning,Dhaka.
Government of Bangladesh (1993b), Bhumi SanskerCommitteer Protibedon (in Bangla) Report of the Land Reform Committee (RLRC), Ministry of Land, Dhaka.
Government of Bangladesh (1994a), Bangladesh Population Census 1991, Analytical Report, Vol.1,BangladeshBureauofStatistics,StatisticsDivision, Ministry of Planning, Dhaka.
Government of Bangladesh (1994b), The Constitution of the People’s Republic of Bangladesh, Ministry of Law, Justice and Parliamentary Affairs, Dhaka.
Government of Bangladesh (1996a), Report on Labour ForceSurveyinBangladesh:1995-96,BangladeshBureauofStatistics,StatisticsDivision,Ministryof Planning, Bangladesh, Dhaka.
Government of Bangladesh (1996b), Bangladesh Population Census 1991, Community Series,Zila: Satkhira, Bangladesh Bureau of Statistics,StatisticsDivision,MinistryofPlanning,Dhaka.
Government of Bangladesh (1999a), Census of Agriculture, 1996. Agriculture Sample Survey1997, Volume-2, July 1999. Bangladesh Bureau of Statistics, Statistics Division, Ministry ofPlanning, Dhaka.
Government of Bangladesh (1999b), Bangladesh Population Census 1991, Vol.4, Bangladesh BureauofStatistics,StatisticsDivision,PlanningDivision, Ministry of Planning, Government of Bangladesh, Dhaka.
Government of Bangladesh (1999c), Census of Agriculture 1996, Vol. l, Bangladesh Bureau of Statistics,StatisticsDivision,PlanningDivision,Ministry of Planning, Dhaka.
Government of Bangladesh (1999d), Census of SlumAreas and Floating Population 1997, Volume 1, Bangladesh Bureau of Statistics, StatisticsDivision, Ministry of Planning, Dhaka.
Government of Bangladesh (2001c), Preliminary Report of Household Income and Expenditure Survey2000,BangladeshBureau of Statistics, StatisticsDivision, Ministry of Planning, Dhaka.
Government of Bangladesh (2003c), Population Census 2001, National Report (provisional), Bangladesh BureauofStatistics,StatisticsDivision,Ministryof Planning, Dhaka.
Government of Bangladesh (2010), Bangladesh Economic Review 2010, Ministry of Finance, Dhaka.
GovernmentofEastBengal(1951),TheEastBengalStateAcquisition and Tenancy Act, 1950. (East Bengal Act XXVIII of 1951), Legislative Department,Published by Superintendent: GovernmentPrinting, East Bengal Government Press: Dacca.
ANGOC
Haque, MS. (1989). Bhumi Proshahan Babystapona(in Bangla): The Land Administration Manual, Boighar Publisher: Chittagong, Bangladesh.
Hossain, T. (1995), Land Rights in Bangladesh: Problems of Management, University Press Limited, Dhaka.
Hossain, ZR. (1995), “Reform in Land Administration”, in Land, Vol. 1. No. 1, ALRD: Dhaka.
Jannuzi, FT. and JT. Peach (1990). “Bangladesh: A Strategy for Agrarian Reform”, in Prosterman,RL., Temple, MN. and Hanstad, TM. eds., Agrarian Reform and Grassroots Development: TenCaseStudies,LynneRiennerPublishers,Inc,USA.
Jansen, E. (1983), Rural Bangladesh: Competition for ScarceResources.WorkingPaper 162,DERAP:Dhaka.
Siddiqui, K. (1981), “Bangladeshi Bhumi-SanskarerRajnaitik Orthoniti “ (in Bangla) (Political Economy of Land Reform in Bangladesh), Bangladesh Institute of Development Studies:Dhaka.
Swapan Adnan (2004), Migration, Land and EthnicConflict: Causes of Poverty in the Chittagong Hill Tracts of Bangladesh, UPL: Dhaka.
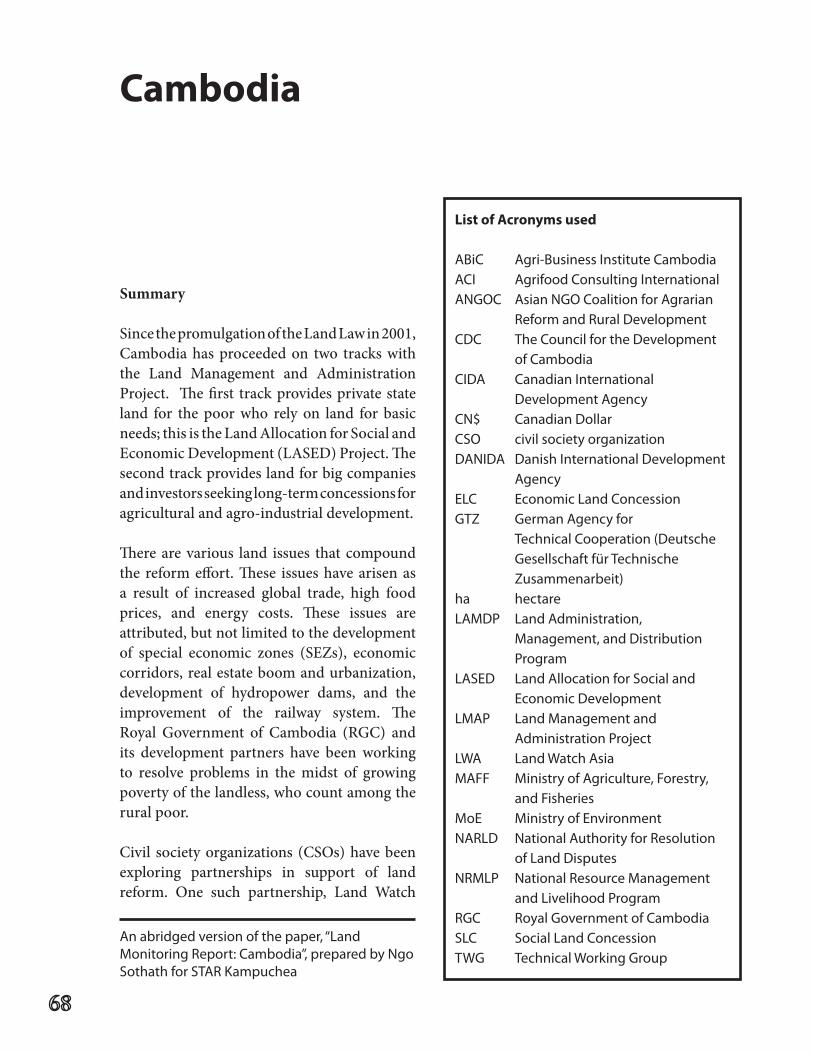
Cambodia
Summary
SincethepromulgationoftheLandLawin2001,Cambodia has proceeded on two tracks with the Land Management and Administration Project. The first track provides private state land for the poor who rely on land for basic needs;thisistheLandAllocationforSocialandEconomicDevelopment(LASED)Project.Thesecond track provides land for big companies and investors seeking long-term concessions for agricultural and agro-industrial development.
There are various land issues that compound the reform effort. These issues have arisen as a result of increased global trade, high food prices, and energy costs. These issues are attributed, but not limited to the development of special economic zones (SEZs), economiccorridors, real estate boom and urbanization, development of hydropower dams, and the improvement of the railway system. The Royal Government of Cambodia (RGC) and its development partners have been working to resolve problems in the midst of growing poverty of the landless, who count among the rural poor.
Civil societyorganizations (CSOs)havebeenexploring partnerships in support of land reform. One such partnership, Land Watch
List of Acronyms used
ABiC Agri-Business Institute CambodiaACI Agrifood Consulting InternationalANGOC Asian NGO Coalition for Agrarian Reform and Rural DevelopmentCDC The Council for the Development of Cambodia CIDA Canadian International Development Agency CN$ Canadian DollarCSO civilsocietyorganizationDANIDA Danish International Development Agency ELC Economic Land Concession GTZ German Agency for Technical Cooperation (Deutsche Gesellschaft für Technische Zusammenarbeit)ha hectareLAMDP Land Administration, Management, and Distribution ProgramLASED LandAllocationforSocialand Economic Development LMAP Land Management and Administration ProjectLWA Land Watch AsiaMAFF Ministry of Agriculture, Forestry, and Fisheries MoE Ministry of Environment NARLD National Authority for Resolution of Land Disputes NRMLP National Resource Management and Livelihood ProgramRGC Royal Government of CambodiaSLC SocialLandConcessionTWG Technical Working Group
An abridged version of the paper, “Land Monitoring Report: Cambodia”, prepared by Ngo SothathforSTARKampuchea
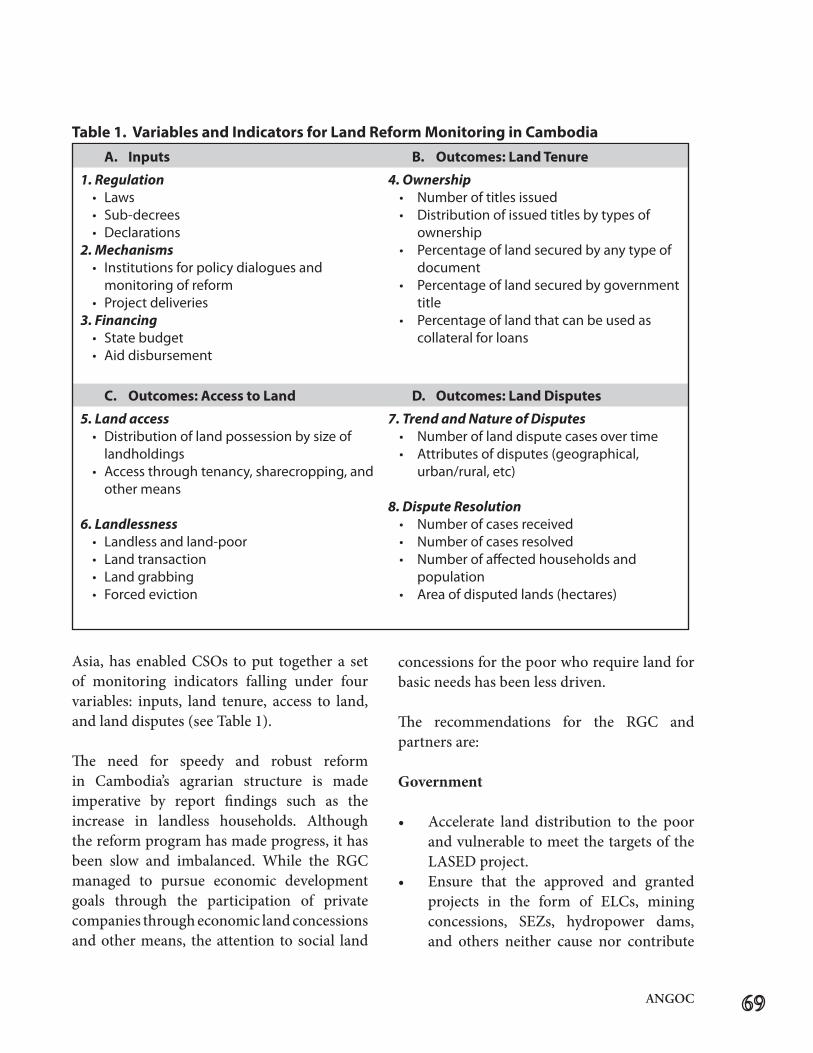
ANGOC
Asia,has enabledCSOs toput together a setof monitoring indicators falling under four variables: inputs, land tenure, access to land, and land disputes (see Table 1).
The need for speedy and robust reform in Cambodia’s agrarian structure is made imperative by report findings such as the increase in landless households. Although the reform program has made progress, it has been slow and imbalanced. While the RGC managed to pursue economic development goals through the participation of private companies through economic land concessions and other means, the attention to social land
concessions for the poor who require land for basic needs has been less driven.
The recommendations for the RGC and partners are:
Government
• Accelerate land distribution to the poorand vulnerable to meet the targets of the LASEDproject.
• Ensure that the approved and grantedprojects in the form of ELCs, mining concessions, SEZs, hydropower dams,and others neither cause nor contribute
A. Inputs B. Outcomes:LandTenure
1. Regulation • Laws• Sub-decrees• Declarations
2. Mechanisms • Institutionsforpolicydialoguesand
monitoring of reform• Projectdeliveries
3. Financing • Statebudget• Aiddisbursement
4. Ownership • Numberoftitlesissued• Distributionofissuedtitlesbytypesof
ownership • Percentageoflandsecuredbyanytypeof
document• Percentageoflandsecuredbygovernment
title• Percentageoflandthatcanbeusedas
collateral for loans
C. Outcomes: Access to Land D. Outcomes: Land Disputes
5. Land access• Distributionoflandpossessionbysizeof
landholdings • Accessthroughtenancy,sharecropping,and
other means
6. Landlessness• Landlessandland-poor• Landtransaction• Landgrabbing• Forcedeviction
7. Trend and Nature of Disputes • Numberoflanddisputecases over time• Attributesofdisputes(geographical,
urban/rural, etc)
8. Dispute Resolution • Numberofcasesreceived• Numberofcasesresolved• Numberofaffectedhouseholdsand
population • Areaofdisputedlands(hectares)
Table1.VariablesandIndicatorsforLandReformMonitoringinCambodia
to landlessness, land grabbing, and forced eviction of poor people whose lands are in the project sites. Where there is inevitable overlapping, the government should have a clear and good compensation policy and process for the affected people.
CSOs
• In continuing its monitoring, CSOsshould assess whether implementation hasyieldedfairbenefitsforthepoor.CSOsshould also draw valuable experiences and knowledge from other land reform programs and use this to inform the government and donors.
• CSOsshoulddocumentandsharepositiveimpacts of land reform with the goal of encouraging more reform processes. Innovative practices can be sought and promoted, which will also make them more credible program partners.
Donors
• WorkcloselywithboththeRGCandtheCSO counterparts to fund and monitorthe reform program.
Context: the status of land reform
About 94% of an estimated six to seven million agricultural lands are considered small farms* (ACI, 2005). Many of these farms are in the hands of the land-poor who cannot support basic household needs. This group includes the 26% of rural households owning even less than 0.5 ha of agricultural land.
Land tenure is uncertain for many. As of 2007, only 36% of lands are covered with titles (World Bank, 2009); most have been titled only in recent times through the systematic process of the Land Management and Administration Project (LMAP). This suggests that many landowners remain vulnerable to land grab or forced eviction. Among the poorest quintiles of the population, only 30% owned land secured by government title (World Bank, 2009).
Studies point to a trend of landlessness thatgrew faster between 1997 and 2004. This is attributed to several factors including the increasing population, rising prices of land that spur land grab, land administration and management decisions that grant Economic Land Concessions (ELCs) to private companies often at the risk of dispossessing local communities whose lands may overlap with boundaries. Another factor is the slow implementation of the Social Land Conces-sions(SLCs)thatcouldprotectsmallfarmers.Only 30% of the 3,150 households targeted havereceivedSLCsasof2010.
High estimates of victims of land grabbing and forced eviction underscore the imperative to address these issues. About 300,000 Cambodians have been dispossessed of lands since 2004 (LICADHO, 2010) and about 150,000 people are living at risk of eviction under threat from development projects, land disputes, and land grabbing (Amnesty International, 2008).
Land dispute cases showed an upward trend as well for the period 2001–2010. About 60% of the cases involved agricultural land. Dispute resolution was at a low of 17%, with an almost equal percentage (16%) unresolved due to lack
*less than 3 ha.
ANGOC
of information (NGO Forum on Cambodia, 2010). Further, the resolved cases were not mainly accomplished through the RGC’s Cadastral Commission or the NARLD, which were set up for this purpose.
Statefinancingfor landreformhasremainedconstant over the period 2005-2010.The land reform budget is a meager 0.45% on average of the government’s annual total budget. Aid disbursement for land reform, on the other hand, has been 3.8% of total aid for the years 2009 and 2010. Together with the government’s budget, about $40 million was made available for land reform expenditure between 2009 and 2010.
Conceptualframework
Adopting the framework introduced by the Asian NGO Coalition for Agrarian Reform and Rural Development (ANGOC) and Land Watch Asia to the local situation in Cambodia, CSOshavefinalizedmonitoringindicatorsaspresented in Table 1 (page 69).
Findings and Analysis
A. Inputs for Land Reform
1. Regulations
The Land Law of 2001 was intended to determine the regime of ownership for immovable properties in Cambodia for the purpose of guaranteeing the rights of ownership and other rights related to immovable property.
In 2003, the government launched the Land Administration, Management, and Distribu-tion Program (LAMDP), a 15-year program to
address the lack of farmers’ land tenure, lack of management over natural resources, and inequitable distribution of land.
Also in 2003, the government issued two sub-decrees.TheSocialLandConcessions(SLCs)provided for the transfer of private state land to the poor. The Economic Land Concessions (ELCs) on the other hand, granted contracts for agricultural and agro-industrial development to private companies up to the size limit of 10,000 ha per concessionaire for a maximum of 99 years.
In the further implementation of the Land Law, there are other policies and regulations that pertain to state land management, registration of indigenous community land, commune land use planning, the management and use of co-owned buildings, illegal occupancy of state land, state land identification, classification and mapping, mechanism for the provision of agricultural extension services to farmers using social land concession, and strengthening of the Cadastral Commission’s performance at all levels.
2. Mechanisms
a. The Cadastral Commission, established in 2002, aims to resolve conflicts at the district, provincial, and national levels related to unregistered, immovable properties.
b. The National Authority for Resolution of Land Disputes (NARLD) aims to resolve disputes beyond the jurisdiction of the Cadastral Commission that involved high-profile, influential people including senior police andmilitary officials. Sincethe membership of NARLD includes these influential sectors, their suitability to resolve disputeshasbeencriticized.(Schwedersky,
2010). To clarify, if the land in dispute were registered, even if these were high-profile
cases, these remained with the court system.
c. The Technical Working Group (TWG) on Land aims to improve coordination among government, donor community, and relevant NGOs. It also undertakes policy dialogue and monitoring of land reform programs.
d. Other critical mechanisms have been embedded in several major programs:
• LMAP (2002-09): The LandManagement and Administration Project was carried out in 11 out of 24 provinces, facilitating the issuance of about 1 million land titles through the systematic land titling process. The project strengthened the mechanisms for land dispute resolution by improving the capacity of the Cadastral Commission and providing legal assistance for the disadvantaged people. Donors like the World Bank, the GTZ (German Agency for Technical Cooperation), and the Government of Finland provided the initial budget of $35 million. The Canadian International Development Agency (CIDA) made available additional funds of CN$10 million.
• NRMLP (2006-10): The NaturalResource Management and Livelihood Program provided a mechanism for livelihood support for 707 communes in 14 provinces. The NRMLP aimed to produce the Commune Land Use Plan (CLUP) to define boundaries and allocations clearly, be it forestland,
farmland, residential lands, or reserved lands (The National Committee for Sub-National DemocraticDevelopment, 2009).
• LASED (2007-2012): The LandAllocation for Social and EconomicDevelopment Project implemented pilot measures in three provinces (Kratie, Kampong Cham and Kampong Thom) for granting social land concessions and linked these SLCswith parallelmeasures for ruraldevelopment: infrastructure, training, and access to markets. The program aims to develop a countrywide implementation strategy.
3. Financing
State Budget Allocation
From 2005 to 2010, the government allocated about $4.4 million per year to cover expenditure in the land sector. In absolute terms, the budget allocation has increased but in percentage terms, at only about 0.45% of the annual total budget, the allocation has remainedconstantoverthesameperiod.(SeeFigure 1.)
Aid Disbursement
The land sector reform in Cambodia has been financed by a variety of donors not limited to those supporting the NRMLP, LMAP, and LASED programs. Based on the onlinedatabase11of Official Development Assistance, aid disbursement reached about $35 million each year for 2009 and 2010 representing 3.8% of the total aid disbursement to Cambodia in both years.
1 http://cdc.khmer.biz/OwnReport/own report result.asp?ActionQuery=Search (accesses 21 Sept 2011)
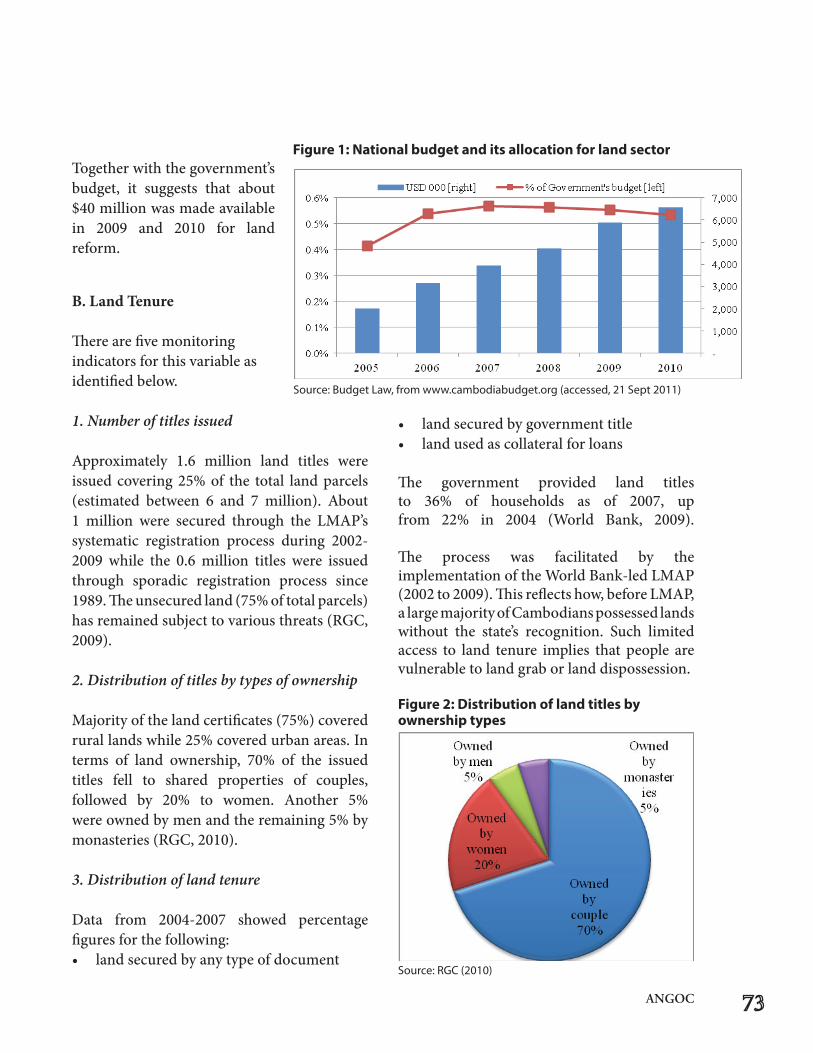
ANGOC
Together with the government’s budget, it suggests that about $40 million was made available in 2009 and 2010 for land reform.
B. Land Tenure
There are five monitoring indicators for this variable as identified below.
1. Number of titles issued
Approximately 1.6 million land titles were issued covering 25% of the total land parcels (estimated between 6 and 7 million). About 1 million were secured through the LMAP’s systematic registration process during 2002-2009 while the 0.6 million titles were issued through sporadic registration process since 1989. The unsecured land (75% of total parcels) has remained subject to various threats (RGC, 2009).
2. Distribution of titles by types of ownership
Majority of the land certificates (75%) covered rural lands while 25% covered urban areas. In terms of land ownership, 70% of the issued titles fell to shared properties of couples, followed by 20% to women. Another 5% were owned by men and the remaining 5% by monasteries (RGC, 2010).
3. Distribution of land tenure
Data from 2004-2007 showed percentage figures for the following: • landsecuredbyanytypeofdocument
• landsecuredbygovernmenttitle• landusedascollateralforloans
The government provided land titles to 36% of households as of 2007, up from 22% in 2004 (World Bank, 2009).
The process was facilitated by the implementation of the World Bank-led LMAP (2002 to 2009). This reflects how, before LMAP, a large majority of Cambodians possessed lands without the state’s recognition. Such limitedaccess to land tenure implies that people are vulnerable to land grab or land dispossession.
Source:RGC(2010)
Figure 2: Distribution of land titles by ownershiptypes
Figure1:Nationalbudgetanditsallocationforlandsector
Source:BudgetLaw,fromwww.cambodiabudget.org(accessed,21Sept2011)
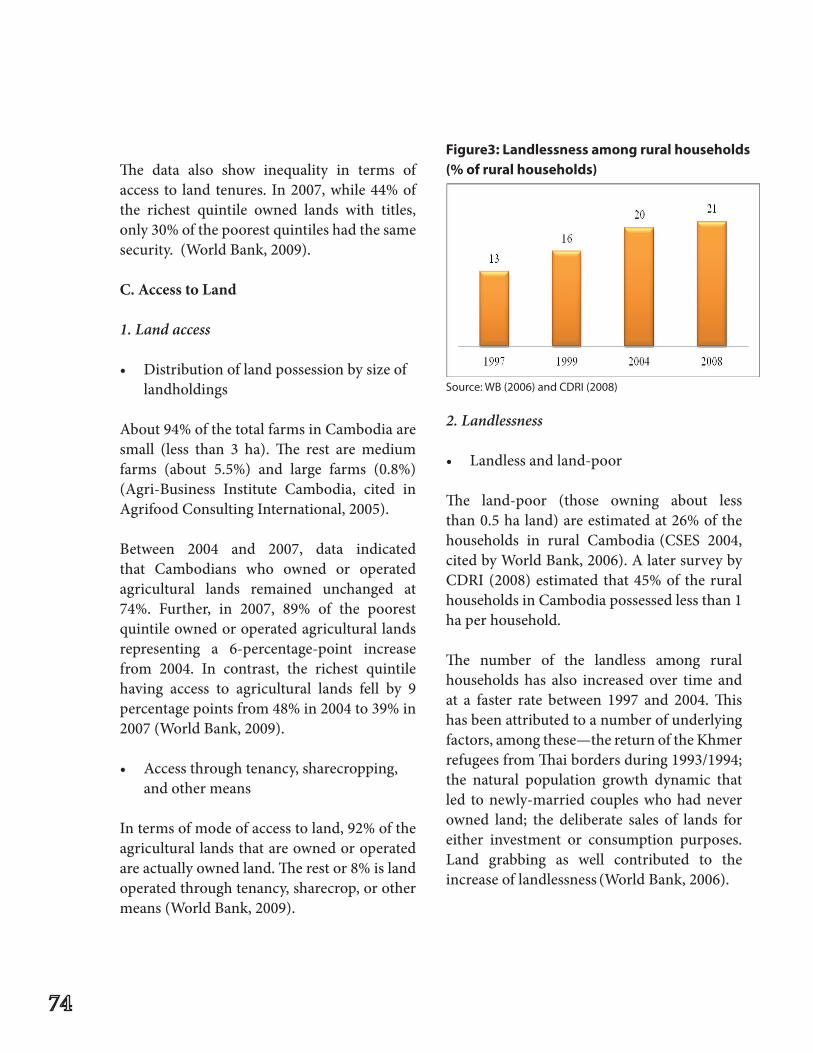
The data also show inequality in terms of access to land tenures. In 2007, while 44% of the richest quintile owned lands with titles, only 30% of the poorest quintiles had the same security. (World Bank, 2009).
C. Access to Land
1. Land access
• Distributionoflandpossessionbysizeoflandholdings
About 94% of the total farms in Cambodia are small (less than 3 ha). The rest are medium farms (about 5.5%) and large farms (0.8%) (Agri-Business Institute Cambodia, cited in Agrifood Consulting International, 2005).
Between 2004 and 2007, data indicated that Cambodians who owned or operated agricultural lands remained unchanged at 74%. Further, in 2007, 89% of the poorest quintile owned or operated agricultural lands representing a 6-percentage-point increase from 2004. In contrast, the richest quintile having access to agricultural lands fell by 9 percentage points from 48% in 2004 to 39% in 2007 (World Bank, 2009).
• Accessthroughtenancy,sharecropping,and other means
In terms of mode of access to land, 92% of the agricultural lands that are owned or operated are actually owned land. The rest or 8% is land operated through tenancy, sharecrop, or other means (World Bank, 2009).
2. Landlessness
• Landlessandland-poor
The land-poor (those owning about less than 0.5 ha land) are estimated at 26% of the households in rural Cambodia (CSES 2004,cited by World Bank, 2006). A later survey by CDRI (2008) estimated that 45% of the rural households in Cambodia possessed less than 1 ha per household.
The number of the landless among rural households has also increased over time and at a faster rate between 1997 and 2004. This has been attributed to a number of underlying factors, among these—the return of the Khmer refugees from Thai borders during 1993/1994; the natural population growth dynamic that led to newly-married couples who had never owned land; the deliberate sales of lands for either investment or consumption purposes. Land grabbing as well contributed to the increase of landlessness (World Bank, 2006).
Source:WB(2006)andCDRI(2008)
Figure3: Landlessness among rural households (%ofruralhouseholds)
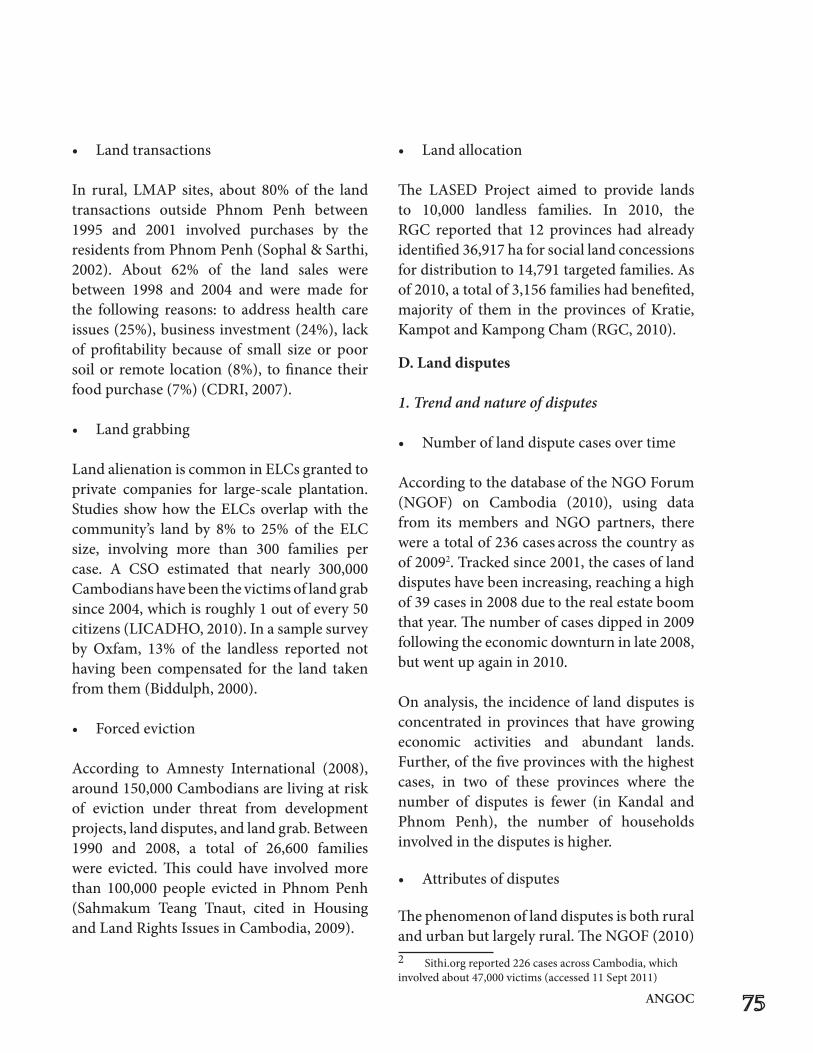
ANGOC
• Landtransactions
In rural, LMAP sites, about 80% of the land transactions outside Phnom Penh between 1995 and 2001 involved purchases by the residentsfromPhnomPenh(Sophal&Sarthi,2002). About 62% of the land sales were between 1998 and 2004 and were made for the following reasons: to address health care issues (25%), business investment (24%), lack of profitability because of small size or poor soil or remote location (8%), to finance their food purchase (7%) (CDRI, 2007).
• Landgrabbing
Land alienation is common in ELCs granted to private companies for large-scale plantation. Studies showhow theELCsoverlapwith thecommunity’s land by 8% to 25% of the ELC size, involving more than 300 families per case. A CSO estimated that nearly 300,000Cambodians have been the victims of land grab since 2004, which is roughly 1 out of every 50 citizens (LICADHO, 2010). In a sample survey by Oxfam, 13% of the landless reported not having been compensated for the land taken from them (Biddulph, 2000).
• Forcedeviction
According to Amnesty International (2008), around 150,000 Cambodians are living at risk of eviction under threat from development projects, land disputes, and land grab. Between 1990 and 2008, a total of 26,600 families were evicted. This could have involved more than 100,000 people evicted in Phnom Penh (Sahmakum Teang Tnaut, cited in Housingand Land Rights Issues in Cambodia, 2009).
• Landallocation
The LASED Project aimed to provide landsto 10,000 landless families. In 2010, the RGC reported that 12 provinces had already identified 36,917 ha for social land concessions for distribution to 14,791 targeted families. As of 2010, a total of 3,156 families had benefited, majority of them in the provinces of Kratie, Kampot and Kampong Cham (RGC, 2010).
D. Land disputes
1. Trend and nature of disputes
• Numberoflanddisputecasesovertime
According to the database of the NGO Forum (NGOF) on Cambodia (2010), using data from its members and NGO partners, there were a total of 236 cases across the country as of 20092. Tracked since 2001, the cases of land disputes have been increasing, reaching a high of 39 cases in 2008 due to the real estate boom that year. The number of cases dipped in 2009 following the economic downturn in late 2008, but went up again in 2010.
On analysis, the incidence of land disputes is concentrated in provinces that have growing economic activities and abundant lands. Further, of the five provinces with the highest cases, in two of these provinces where the number of disputes is fewer (in Kandal and Phnom Penh), the number of households involved in the disputes is higher.
• Attributesofdisputes
The phenomenon of land disputes is both rural and urban but largely rural. The NGOF (2010) 2 Sithi.orgreported226casesacrossCambodia,whichinvolvedabout47,000victims(accessed11Sept2011)
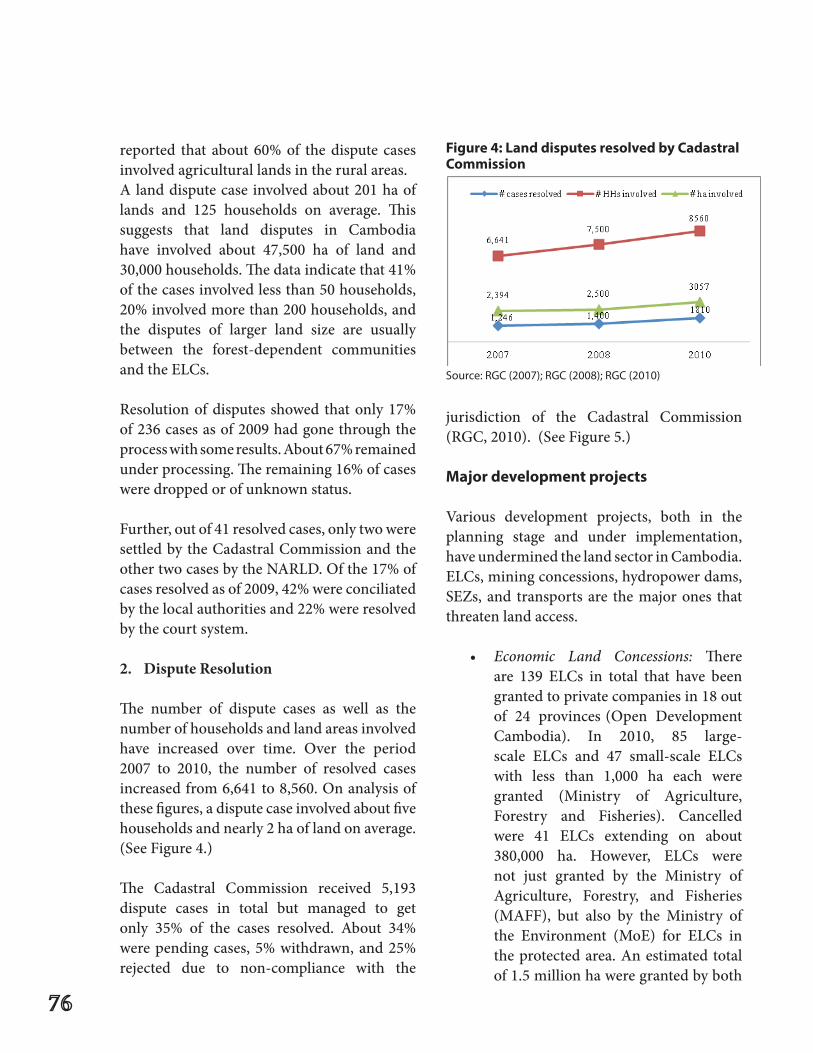
reported that about 60% of the dispute cases involved agricultural lands in the rural areas.A land dispute case involved about 201 ha of lands and 125 households on average. This suggests that land disputes in Cambodia have involved about 47,500 ha of land and 30,000 households. The data indicate that 41% of the cases involved less than 50 households, 20% involved more than 200 households, and the disputes of larger land size are usually between the forest-dependent communities and the ELCs.
Resolution of disputes showed that only 17% of 236 cases as of 2009 had gone through the process with some results. About 67% remained under processing. The remaining 16% of cases were dropped or of unknown status.
Further, out of 41 resolved cases, only two were settled by the Cadastral Commission and the other two cases by the NARLD. Of the 17% of cases resolved as of 2009, 42% were conciliated by the local authorities and 22% were resolved by the court system.
2. Dispute Resolution
The number of dispute cases as well as the number of households and land areas involved have increased over time. Over the period 2007 to 2010, the number of resolved cases increased from 6,641 to 8,560. On analysis of these figures, a dispute case involved about five households and nearly 2 ha of land on average. (SeeFigure4.)
The Cadastral Commission received 5,193 dispute cases in total but managed to get only 35% of the cases resolved. About 34% were pending cases, 5% withdrawn, and 25% rejected due to non-compliance with the
jurisdiction of the Cadastral Commission (RGC,2010).(SeeFigure5.)
Major development projects
Various development projects, both in the planning stage and under implementation, have undermined the land sector in Cambodia. ELCs, mining concessions, hydropower dams, SEZs,and transportsare themajorones thatthreaten land access.
• Economic Land Concessions: There are 139 ELCs in total that have been granted to private companies in 18 out of 24 provinces (Open Development Cambodia). In 2010, 85 large-scale ELCs and 47 small-scale ELCs with less than 1,000 ha each were granted (Ministry of Agriculture, Forestry and Fisheries). Cancelled were 41 ELCs extending on about 380,000 ha. However, ELCs were not just granted by the Ministry of Agriculture, Forestry, and Fisheries (MAFF), but also by the Ministry of the Environment (MoE) for ELCs in the protected area. An estimated total
of 1.5 million ha were granted by both
Figure 4: Land disputes resolved by Cadastral Commission
Source:RGC(2007);RGC(2008);RGC(2010)
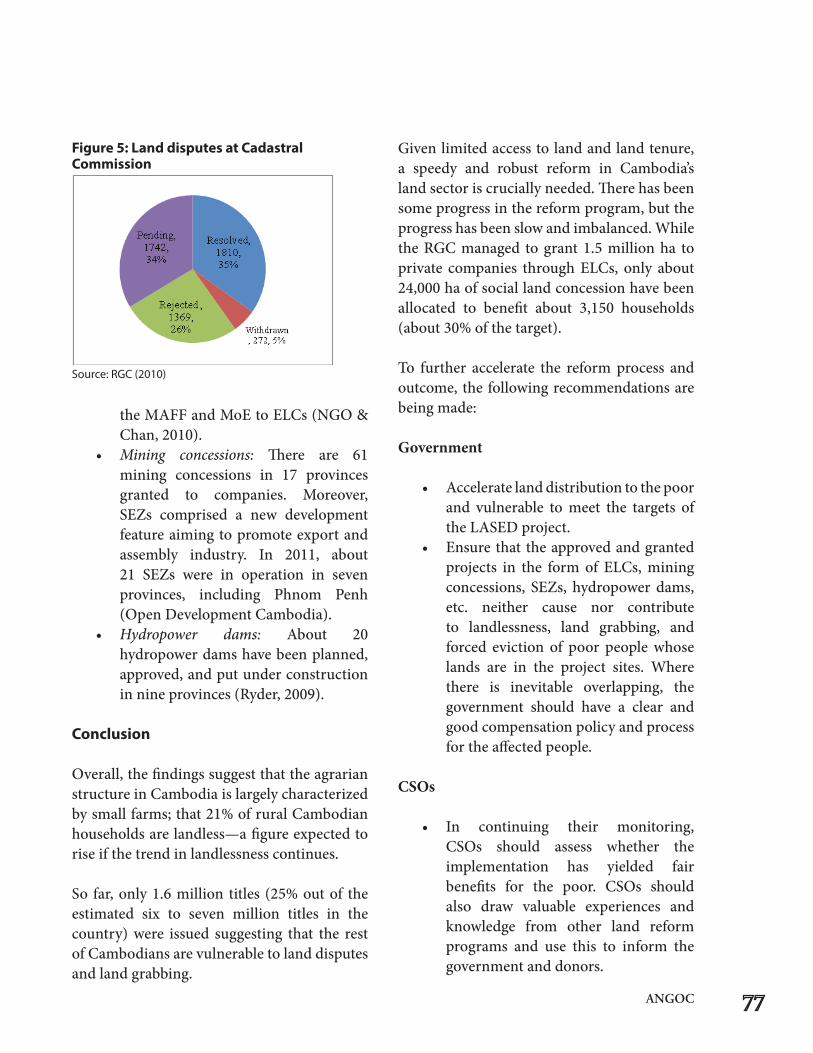
ANGOC
the MAFF and MoE to ELCs (NGO & Chan, 2010).
• Mining concessions: There are 61 mining concessions in 17 provinces granted to companies. Moreover, SEZs comprised a new developmentfeature aiming to promote export and assembly industry. In 2011, about 21 SEZs were in operation in sevenprovinces, including Phnom Penh (Open Development Cambodia).
• Hydropower dams: About 20 hydropower dams have been planned, approved, and put under construction in nine provinces (Ryder, 2009).
Conclusion
Overall, the findings suggest that the agrarian structure in Cambodia is largely characterized by small farms; that 21% of rural Cambodian households are landless—a figure expected to rise if the trend in landlessness continues.
Sofar,only1.6milliontitles (25%outof theestimated six to seven million titles in the country) were issued suggesting that the rest of Cambodians are vulnerable to land disputes and land grabbing.
Given limited access to land and land tenure, a speedy and robust reform in Cambodia’s land sector is crucially needed. There has been some progress in the reform program, but the progress has been slow and imbalanced. While the RGC managed to grant 1.5 million ha to private companies through ELCs, only about 24,000 ha of social land concession have been allocated to benefit about 3,150 households (about 30% of the target).
To further accelerate the reform process and outcome, the following recommendations are being made:
Government
• Acceleratelanddistributiontothepoorand vulnerable to meet the targets of theLASEDproject.
• Ensurethattheapprovedandgrantedprojects in the form of ELCs, mining concessions, SEZs, hydropowerdams,etc. neither cause nor contribute to landlessness, land grabbing, and forced eviction of poor people whose lands are in the project sites. Where there is inevitable overlapping, the government should have a clear and good compensation policy and process for the affected people.
CSOs
• In continuing their monitoring,CSOs should assess whether theimplementation has yielded fair
benefits for the poor. CSOs shouldalso draw valuable experiences and knowledge from other land reform programs and use this to inform the government and donors.
Figure 5: Land disputes at Cadastral Commission
Source:RGC(2010)
• CSOsshoulddocumentandsharethepositive impacts of land reform with the goal of encouraging more reform processes. Innovative practices can be sought and promoted, which will also make CSOs more credible programpartners.
Donors
• Work closelywith both theRGCandthe CSO counterparts to fund andmonitor the reform program.
References
Agri-BusinessInstituteCambodia.2005Survey.
Agrifood Consulting International (2005) ‘Cambodian AgrarianStructureStudy.’PhnomPenh:ACI.
Aide Memoire. (2002). Proposed Land Management and Administration Project (LMAP). Multi Donor Appraisal Mission 22-29 October 2001.
Amnesty International. (2008). Rights Razed: Forced Evictions in Cambodia, AI Index. Available from http://www.amnesty.org/en/library/asset/ ASA23/002/2008/en/bl328237-07c2-11dd-badf- 1352a91852c5/asa230022008eng.pdf (accessed 20 Sept2011)
Bora, Nuy. (2007). Civic Engagement Framework. Available from: http://siteresources. worldbank.org/INTCAMBODIA/ Resources/293755-1181597132695/KH-LASED- 2007.pdf(accessed,22Sept2011)
Biddulph, Robin. (2000). Interim Report on Findings of Landlessness and Development Information Tool (LADIT). Phnom Penh. Oxfam GB.
CDRI. (2007). Cambodia Land Titling Rural Baseline Survey Report. Phnom Penh: Cambodian Development Resource Institute (CDRI).
CDRI. (2008). Impact of High Food Prices in Cambodia. Phnom Penh: Cambodia Development Resource Institute (CDRI).
Grimsditch, M. & Henderson, N. (2009). Untitled: Tenure Insecurity and Inequality in theCambodianLandSector.PhnomPenh: BridgesAcrossBordersSoutheastAsia,Centreon Housing Rights and Evictions, Jesuit Refugee Service.
Housing and Land Rights Issues in Cambodia. (2009). Annex to Parallel Report submitted to the CommitteeonEconomic,Social,andCultural Rights concerning Article 11 of the Covenant. Available from: http://www.ngoforum.org.kh/eng/ llp/llpdocs/FinalLandandHousingAnnexto Para llelReport,FINALVersionApril09.pdf (Accessed 21 September2011).
Kingdom of Cambodia. (2001). Land Law. Phnom Penh: Kingdom of Cambodia
LICADHO. (2010). Freedom of Expression in Cambodia: The Illusion of Democracy. Phnom Penh: LICADHO
Ministry of Agriculture, Forestry, and Fisheries. www.ecl.maff.gov.kh(Accessed22Sept2011)
NationalCommitteeforSub-NationalDemocratic Development, 2009 NLRM & L http://www.ncdd.gov.kh/projects/natural- resource-management-and-livelihood-project, (Accessed22Sept2011)
ANGOC
Ngo,SothathandChan,Sophal.(2010).Does Agricultural Investment Benefit the Poor? Phnom Penh: Cambodian Economic Association.
Ngo,SothathandChan,Sophal.(forthcoming). Economic Land Concessions and Local Communities. NGO Forum on Cambodia.
NGOF.(2010).StatisticalAnalysisonLandDispute Occurring in Cambodia in 2009. Phnom Penh: NGO Forum on Cambodia Open Development Cambodia www.opendevelopmentcambodia.net (Accessed22Sept2011)
RGC.(2002).SubDecreeonOrganizationand Functioning of the Cadastral Commission (No. 47 ANK.BK/May 31, 2002). Phnom Penh: Royal Government of Cambodia
RGC.(2003).Sub-decreeonSocialLandConcessions No. 19 ANK/BK/ March 19, 2003. Phnom Penh: Royal Government of Cambodia.
RGC.(2005).Sub-decreeonEconomicLand Concessions No. 146 ANK/BK. Phnom Penh: Royal Government of Cambodia.
RGC. (2007). Mid Term Review of the National StrategicDevelopmentPlan2006-10.Phnom Penh: Royal Government of Cambodia.
RGC.(2007).ProgressReportoftheNationalStrategic Development Plan 2006-10. Phnom Penh: Royal Government of Cambodia.
RGC.(2010).NationalStrategicDevelopmentPlan Update 2009-13. Phnom Penh: Royal Government of Cambodia
Ryder, G. (2009). Powering 21st Century: Cambodia with Decentralized Generation. A Premier for Rethinking Cambodia’s Electricity Future. Phnom Penh: The NGO Forum on Cambodia and Probe International. Schwedersky,L.(2010).MechanismsofLandConflict Resolution in Rural Cambodia. From: http://www. observatori.org/documents/BA%20Thesis%20 Mechanisms%20of%20Land%20Conflict%20 Resolution%20in%20Rural%20Cambodia-1.pdf (Accessed21Sept2011).
SoSovannarith,RealSopheap,UchUtey,SyRathmony, BrettBallardandSarthiAcharya.(2001).Social Assessment of Land in Cambodia. Working Paper 20. Phnom Penh: Cambodia Development Resource Institute (CDRI).
Sophal,ChanandSarthi,Acharya.(2002).Land Transactions in Cambodia: An Analysis of Transfers and Transaction Records, Working Paper No. 22. Phnom Penh: Cambodia Development Resource Institute (CDRI).
WB. (2006). Cambodia: Halving Poverty by 2015? Poverty Assessment 2006. World Bank
WB, (2009). Poverty Profile and Trend in Cambodia. Findingsfromthe2007CambodiaSocio- EconomicSurvey(CSES).WorldBank.
Summary
n 2011-12, civil society organizations (CSOs) in India have been pressing fora national land reforms policy and a
land use plan as expected from the National Land Reforms Council (NLRC). The NLRC’s decision on the policy and plan would be based on the report of the government-constituted Committee on State Agrarian Relationsand the Unfinished Task of Land Reform bearing the sub-title, “An Agenda to Reform Agrarian Relations for Equity and Efficiency in Contemporary India”, covering seven vital areas.
At the state level in Bihar, meanwhile, the reports submitted by the Bihar Land Reforms Commission with vital recommendations on Bhoodan, mutation, sharecropping, ceiling on landholdings, contract farming, government estates, and Khas Mahal lands, and the reordering of the administrative structure provide the concrete basis for land reforms and its monitoring in the state.
Considering the greater urgency to expedite the decision on the land reforms policy and land use plan and to hasten the completion of the “unfinished task of land reforms”, which has
extended over several decades, Jansatyagraha - a people’s march - is being organized in October 2012 to press for expenditing the process. In addition, the urgency to increase public pressure arises from other serious considerations as evident from the changing country context of land reforms, the enhanced demand of agricultural land to be used for non-agricultural purposes; the displacement of millions of people, most of them poor, and the urgent need of their resettlement and rehabilitation; and the unprecedented agricultural slowdown during the post-liberalization era (1991-2006) due to highly reduced public investments and utter neglect.
Given the existing national and state-directed land reform measures, CSOs haverecommended a land reform monitoring program involving all key actors. It would be
India
List of Acronyms used
BPL Below Poverty LineBLRC Bihar Land Reforms CommissionCSO civilsocietyorganizationha hectareNLRC National Land Reforms CouncilPESA TheProvisionsofthePanchayats (ExtensiontotheScheduledAreas) Act,1996SCs ScheduledCastesSTs ScheduledTribes
An abridged version of the paper, “Country Land Monitoring Report”, prepared by the Association of Voluntary Agencies for Rural Development (AVARD)
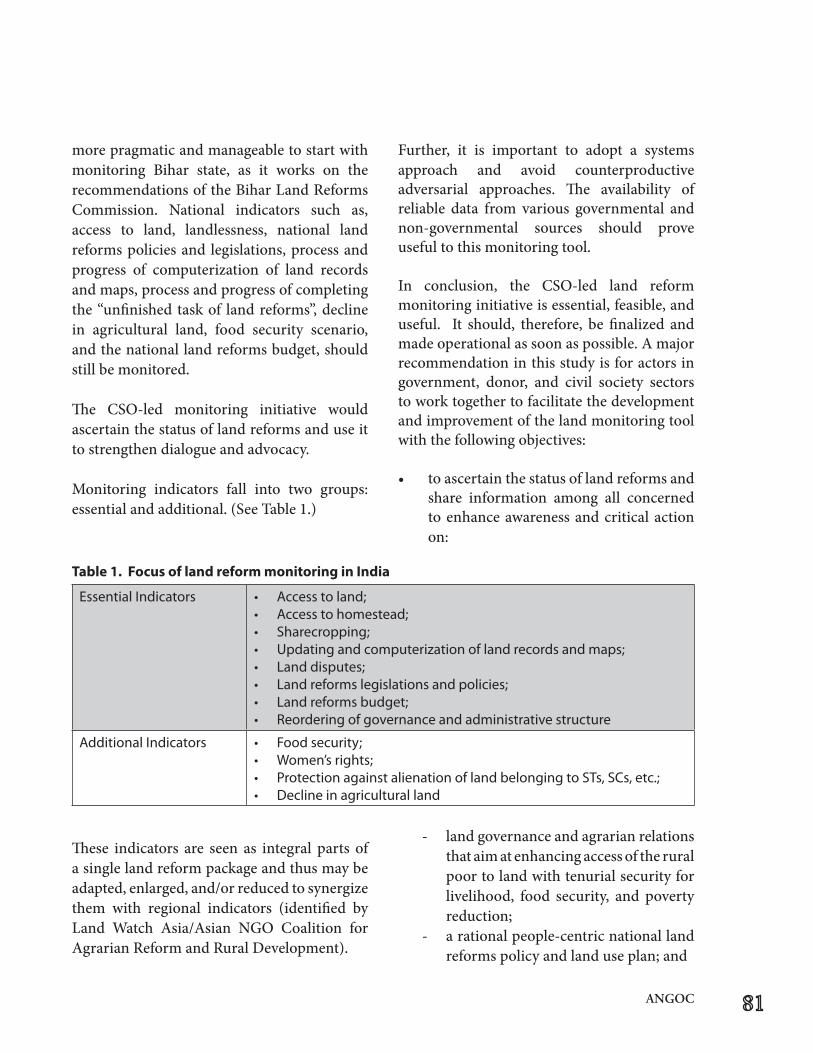
ANGOC
more pragmatic and manageable to start with monitoring Bihar state, as it works on the recommendations of the Bihar Land Reforms Commission. National indicators such as, access to land, landlessness, national land reforms policies and legislations, process and progress of computerization of land records and maps, process and progress of completing the “unfinished task of land reforms”, decline in agricultural land, food security scenario, and the national land reforms budget, should still be monitored.
The CSO-led monitoring initiative wouldascertain the status of land reforms and use it to strengthen dialogue and advocacy.
Monitoring indicators fall into two groups: essentialandadditional.(SeeTable1.)
These indicators are seen as integral parts of a single land reform package and thus may be adapted, enlarged, and/or reduced to synergize them with regional indicators (identified by Land Watch Asia/Asian NGO Coalition for Agrarian Reform and Rural Development).
Further, it is important to adopt a systems approach and avoid counterproductive adversarial approaches. The availability of reliable data from various governmental and non-governmental sources should prove useful to this monitoring tool.
In conclusion, the CSO-led land reformmonitoring initiative is essential, feasible, and useful. It should, therefore, be finalized and made operational as soon as possible. A major recommendation in this study is for actors in government, donor, and civil society sectors to work together to facilitate the development and improvement of the land monitoring tool with the following objectives:
• toascertainthestatusoflandreformsandshare information among all concerned to enhance awareness and critical action on:
- land governance and agrarian relations that aim at enhancing access of the rural poor to land with tenurial security for livelihood, food security, and poverty reduction;
- a rational people-centric national land reforms policy and land use plan; and
Essential Indicators • Accesstoland;• Accesstohomestead;• Sharecropping;• Updatingandcomputerizationoflandrecordsandmaps;• Landdisputes;• Landreformslegislationsandpolicies;• Landreformsbudget;• Reorderingofgovernanceandadministrativestructure
Additional Indicators • Foodsecurity;• Women’srights;• ProtectionagainstalienationoflandbelongingtoSTs,SCs,etc.;• Declineinagriculturalland
Table1.FocusoflandreformmonitoringinIndia
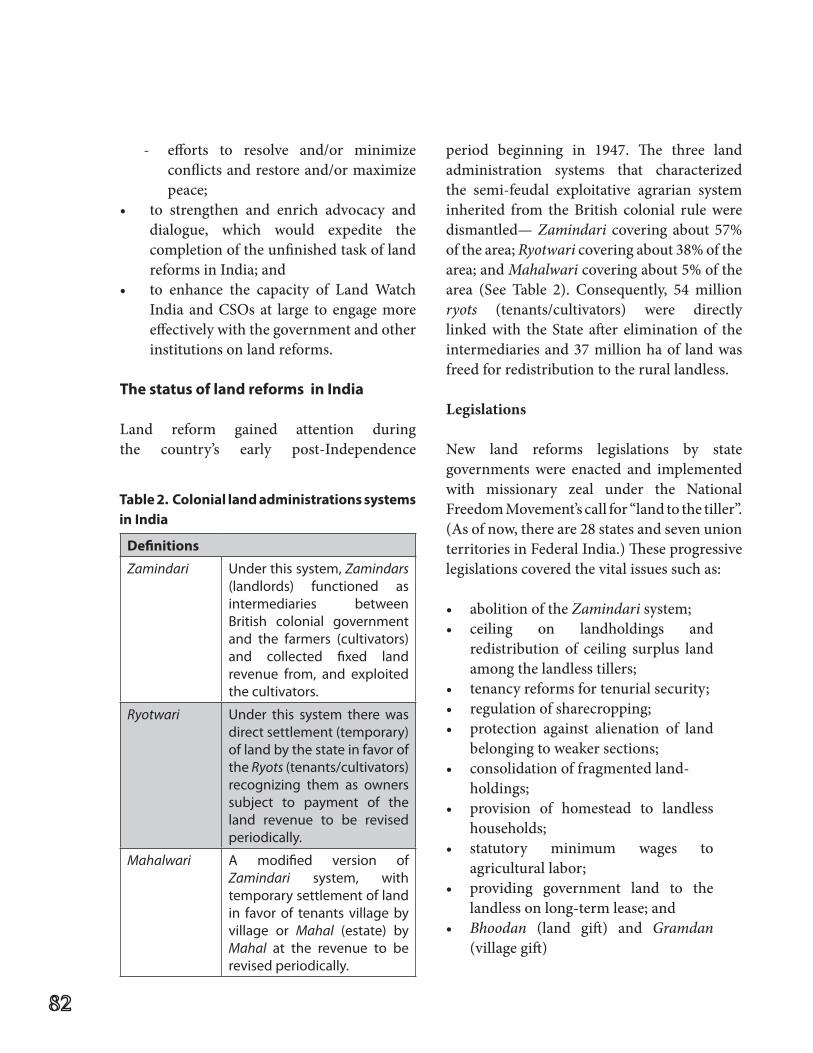
- efforts to resolve and/or minimize conflicts and restore and/or maximize peace;
• to strengthen and enrich advocacy anddialogue, which would expedite the completion of the unfinished task of land reforms in India; and
• to enhance the capacity of Land WatchIndia andCSOsat large to engagemoreeffectively with the government and other institutions on land reforms.
ThestatusoflandreformsinIndia
Land reform gained attention during the country’s early post-Independence
period beginning in 1947. The three land administration systems that characterized the semi-feudal exploitative agrarian system inherited from the British colonial rule were dismantled— Zamindari covering about 57% of the area; Ryotwari covering about 38% of the area; and Mahalwari covering about 5% of the area (See Table 2). Consequently, 54millionryots (tenants/cultivators) were directly linkedwith the State after eliminationof theintermediaries and 37 million ha of land was freed for redistribution to the rural landless.
Legislations
New land reforms legislations by state governments were enacted and implemented with missionary zeal under the National Freedom Movement’s call for “land to the tiller”. (As of now, there are 28 states and seven union territories in Federal India.) These progressive legislations covered the vital issues such as:
• abolitionoftheZamindari system;• ceiling on landholdings and
redistribution of ceiling surplus land among the landless tillers;
• tenancyreformsfortenurialsecurity;• regulationofsharecropping;• protection against alienation of land
belonging to weaker sections;• consolidationoffragmentedland-
holdings;• provision of homestead to landless
households;• statutory minimum wages to
agricultural labor;• providing government land to the
landless on long-term lease; and• Bhoodan (land gift) and Gramdan
(village gift)
Definitions
Zamindari Under this system, Zamindars (landlords) functioned as intermediaries between British colonial government and the farmers (cultivators) and collected fixed land revenue from, and exploited the cultivators.
Ryotwari Under this system there was direct settlement (temporary) of land by the state in favor of the Ryots (tenants/cultivators) recognizing them as owners subject to payment of the land revenue to be revised periodically.
Mahalwari A modified version of Zamindari system, with temporary settlement of land in favor of tenants village by village or Mahal (estate) by Mahal at the revenue to be revised periodically.
Table2.Coloniallandadministrationssystemsin India
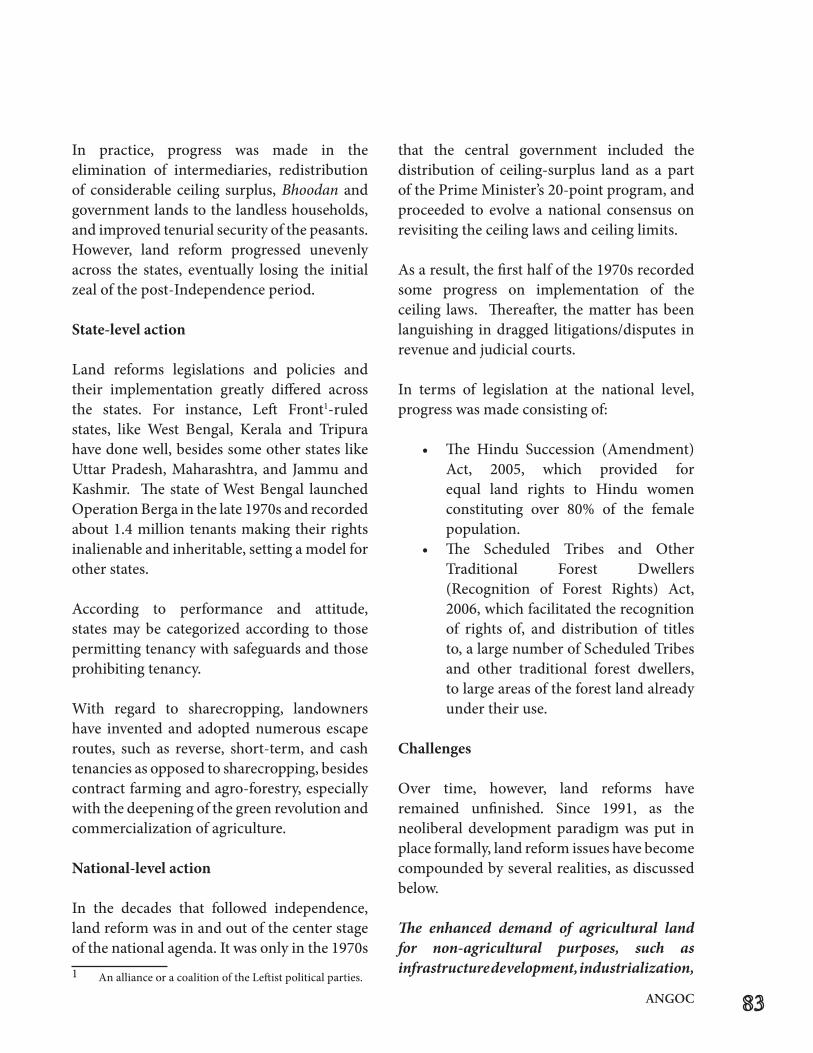
ANGOC
In practice, progress was made in the elimination of intermediaries, redistribution of considerable ceiling surplus, Bhoodan and government lands to the landless households, and improved tenurial security of the peasants. However, land reform progressed unevenly across the states, eventually losing the initial zeal of the post-Independence period.
State-level action
Land reforms legislations and policies and their implementation greatly differed across the states. For instance, Left Front1-ruled states, like West Bengal, Kerala and Tripura have done well, besides some other states like Uttar Pradesh, Maharashtra, and Jammu and Kashmir. The state of West Bengal launched Operation Berga in the late 1970s and recorded about 1.4 million tenants making their rights inalienable and inheritable, setting a model for other states.
According to performance and attitude, states may be categorized according to those permitting tenancy with safeguards and those prohibiting tenancy.
With regard to sharecropping, landowners have invented and adopted numerous escape routes, such as reverse, short-term, and cash tenancies as opposed to sharecropping, besides contract farming and agro-forestry, especially with the deepening of the green revolution and commercialization of agriculture.
National-level action
In the decades that followed independence, land reform was in and out of the center stage of the national agenda. It was only in the 1970s 1 An alliance or a coalition of the Leftist political parties.
that the central government included the distribution of ceiling-surplus land as a part of the Prime Minister’s 20-point program, and proceeded to evolve a national consensus on revisiting the ceiling laws and ceiling limits.
As a result, the first half of the 1970s recorded some progress on implementation of the ceiling laws. Thereafter, the matter has been languishing in dragged litigations/disputes in revenue and judicial courts.
In terms of legislation at the national level, progress was made consisting of:
• The Hindu Succession (Amendment)Act, 2005, which provided for equal land rights to Hindu women constituting over 80% of the female population.
• The Scheduled Tribes and OtherTraditional Forest Dwellers (Recognition of Forest Rights) Act, 2006, which facilitated the recognition of rights of, and distribution of titles to,alargenumberofScheduledTribesand other traditional forest dwellers, to large areas of the forest land already under their use.
Challenges
Over time, however, land reforms have remained unfinished. Since 1991, as theneoliberal development paradigm was put in place formally, land reform issues have become compounded by several realities, as discussed below.
The enhanced demand of agricultural land for non-agricultural purposes, such as infrastructure development, industrialization,
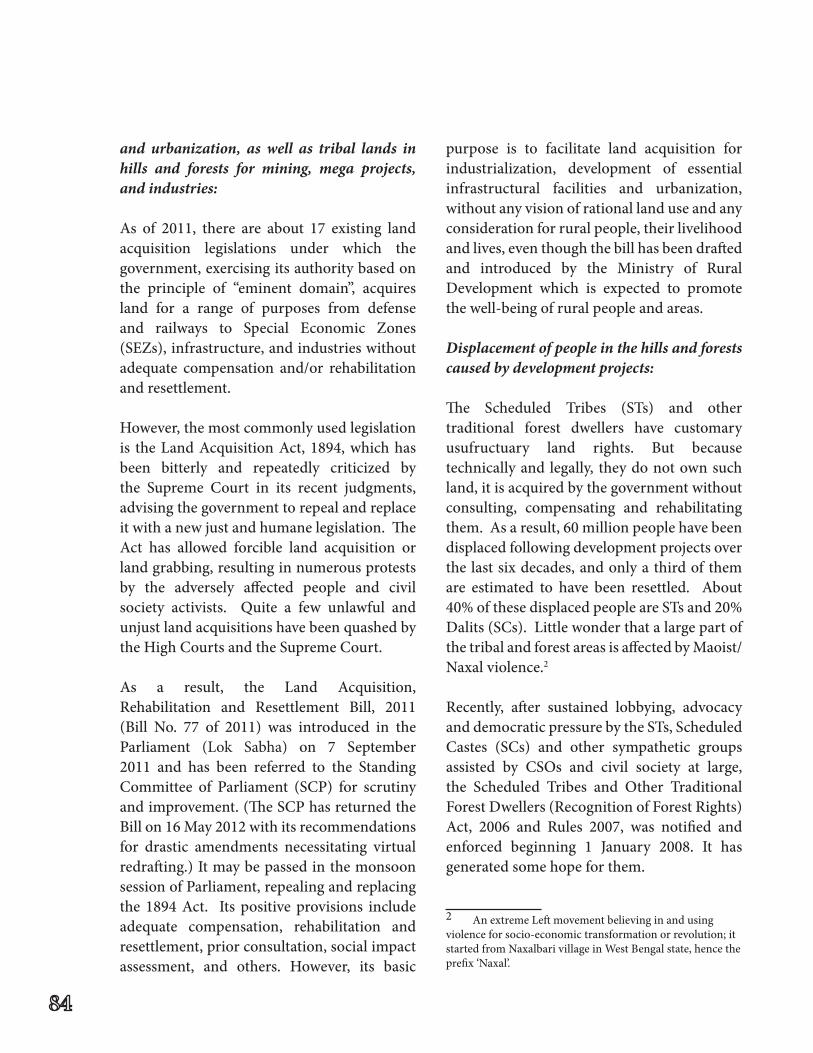
and urbanization, as well as tribal lands in hills and forests for mining, mega projects, and industries:
As of 2011, there are about 17 existing land acquisition legislations under which the government, exercising its authority based on the principle of “eminent domain”, acquires land for a range of purposes from defense and railways to Special Economic Zones(SEZs),infrastructure,andindustrieswithoutadequate compensation and/or rehabilitation and resettlement.
However, the most commonly used legislation is the Land Acquisition Act, 1894, which has been bitterly and repeatedly criticized by the Supreme Court in its recent judgments,advising the government to repeal and replace it with a new just and humane legislation. The Act has allowed forcible land acquisition or land grabbing, resulting in numerous protests by the adversely affected people and civil society activists. Quite a few unlawful and unjust land acquisitions have been quashed by theHighCourtsandtheSupremeCourt.
As a result, the Land Acquisition, Rehabilitation and Resettlement Bill, 2011 (Bill No. 77 of 2011) was introduced in the Parliament (Lok Sabha) on 7 September2011 and has been referred to the StandingCommittee of Parliament (SCP) for scrutinyandimprovement.(TheSCPhasreturnedtheBill on 16 May 2012 with its recommendations for drastic amendments necessitating virtual redrafting.) It may be passed in the monsoon session of Parliament, repealing and replacing the 1894 Act. Its positive provisions include adequate compensation, rehabilitation and resettlement, prior consultation, social impact assessment, and others. However, its basic
purpose is to facilitate land acquisition for industrialization, development of essential infrastructural facilities and urbanization, without any vision of rational land use and any consideration for rural people, their livelihood and lives, even though the bill has been drafted and introduced by the Ministry of Rural Development which is expected to promote the well-being of rural people and areas.
Displacement of people in the hills and forests caused by development projects:
The Scheduled Tribes (STs) and othertraditional forest dwellers have customary usufructuary land rights. But because technically and legally, they do not own such land, it is acquired by the government without consulting, compensating and rehabilitating them. As a result, 60 million people have been displaced following development projects over the last six decades, and only a third of them are estimated to have been resettled. About 40%ofthesedisplacedpeopleareSTsand20%Dalits(SCs).Littlewonderthatalargepartofthe tribal and forest areas is affected by Maoist/Naxal violence.2
Recently, after sustained lobbying, advocacy anddemocraticpressurebytheSTs,ScheduledCastes (SCs) and other sympathetic groupsassisted by CSOs and civil society at large,the Scheduled Tribes and Other TraditionalForest Dwellers (Recognition of Forest Rights) Act, 2006 and Rules 2007, was notified and enforced beginning 1 January 2008. It has generated some hope for them.
2 An extreme Left movement believing in and using violence for socio-economic transformation or revolution; it started from Naxalbari village in West Bengal state, hence the prefix ‘Naxal’.
ANGOC
Another legislation, the Provisions of Panchayats (Extension To Scheduled Areas)Act (PESA), 1996, provides for mandatoryprior consultation with the tribal Gram Sabha (villageassembly)intheFifthScheduletribalareas to acquire their land. But so far, this has been observed only in its breach.
Decline of about 2 million ha in the net area sown over the past decade
Such decline is likely to increase in thecoming years, jeopardizing lives, livelihood, and food security of the rural poor and rural people, notwithstanding the assertion in the Approach to the Twelfth Plan that it can be overcome by increasing agricultural productivity and avoiding acquisition of multi-crop irrigated land. Actually, there has already been an unprecedented agricultural slowdown during the post-liberalization era (1991-2006), primarily due to highly reduced public investments and utter neglect. Measures to reverse it have been initiated only in the Eleventh Plan (2007-2012) to ensure food security.
Highly uneven land distribution as reflected in Agricultural Census (2005-2006) data and other sources underlines the need to optimize the redistribution of land to the landless tillers. (This is discussed further in the next section.)
With regard to women’s land rights, on the whole, there is gross gender inequity. The Hindu Succession (Amendment) Act, 2005provides that in a joint Hindu family, the daughter shall, by birth, become a co-parcener in her own right in the same manner as the son and should have the same rights in the co-parcenery property as she would have had
if she had been a son, effective 20 December 2004. Thus, Hindu women have equal rights to land, but social complications muddle practice. Hindus constitute about 80.5% of the population of India. Muslims constitute about 13.4% of the population; but they are governed by their personal law, which is unfair to women, the common norm being 62.5% to sons and 37.5% to daughters irrespective of their number. Other religious groups, numerically much smaller, are governed by their traditional laws and practices. Only a few communities in India in states like Kerala and Meghalaya are matriarchal; the rest of Indian society is patriarchal. Besides, in some cases, civil society activists have tried to get fresh land allotments in favor of women and/or joint allotments in favor of wife and husband.
In the post-liberalization era formally in place since July 1991, a strong view was that the possibilities of land reforms had been exhausted and future growth would come only from private investments in agriculture and rural areas at large. This strong view was shared by many states that revised their land reform legislations. Even in the central government, it was believed that the distributive justice programs had been overtaken by a neoliberal development paradigm, notwithstanding the rhetoric of “Inclusive Growth” and “Faster, Sustainable and More Inclusive Growth” inthe Eleventh (2007-2012) and Twelfth (2012-2017) Five-Year Plans respectively. In practice, the neoliberal growth model excludes more than it includes since it is socially unjust, economically inefficient, politically unstable, and environmentally unsustainable.
“Faster, Sustainable and More InclusiveGrowth: An Approach to the 12th Five Year
Plan” (2012-2017) raises the following issues without providing rational, just, fair and humane answers to them:
• Whichlandshouldbeusedforwhichpurpose?
• How should land be acquired fornew purposes (industrialization/urbanization/ infrastructure develop-ment)?
• What form and quantum ofcompensation and rehabilitation should be provided to those whose lands are acquired?
Therefore, there is a pressing need for a national land reform policy and land use plan as well as enhancement of the access of the rural poor to land available from sources, such as ceiling surplus, Bhoodan, village commons, government estates and wasteland, industries, religious and educational institutions, forest, and homestead for equity and efficiency.
Food security
Food security is closely linked with land reforms, more so in India, where there is a large food-insecure population. Accordingly, the National Food Security Bill, 2011 (BillNo. 132 of 2011) has been introduced in the Parliament (Lok Sabha) on 22 December2011. It has been referred to the StandingCommittee of Parliament for in-depth scrutiny and improvement. It is expected to be passed in the monsoon session of the Parliament, providing for entitlements and rights to food for vulnerable sections with a total coverage of 63.5% of total (rural and urban) population of 1.21 billion. The categorization of recipients is as follows:
a) “priority households” (below poverty line [BPL] with maximum entitlements – 46% rural and 28% urban population;
b) “general households” with reduced entitlements – 29% rural and 22% urban population;
c) expecting and lactating BPL mothers;d) children in the age-group 3 months to 3
years; e) primary school children of 4 to 14 years of
age; andf) the destitute, handicapped, and others
similarly affected
Besides, under the National Rural Employment Guarantee Act, 2005, covering 200 underdeveloped districts since 2 February 2006 and extended to the whole of rural India since 1 April 2008, the government provides guaranteed hard manual wage-employment for 100 days per rural household per annum at minimum statutory wages, to facilitate food security and survival, and minimize migration of labor.
However, the above palliatives would only perpetuate dependency rather than dignified self-reliance among citizens.
Computerization of land records
Land records are either messy or incomplete or not updated in many of the states, not only hindering land reforms but also causing numerous disputes. Accordingly, updating and computerization of land records as well as digitization of maps in every state are essential. The process has started and it has already been completed in Karnataka, Madhya Pradesh, Gujarat, Tamil Nadu, Uttar Pradesh and Goa. However, it needs to be expedited and
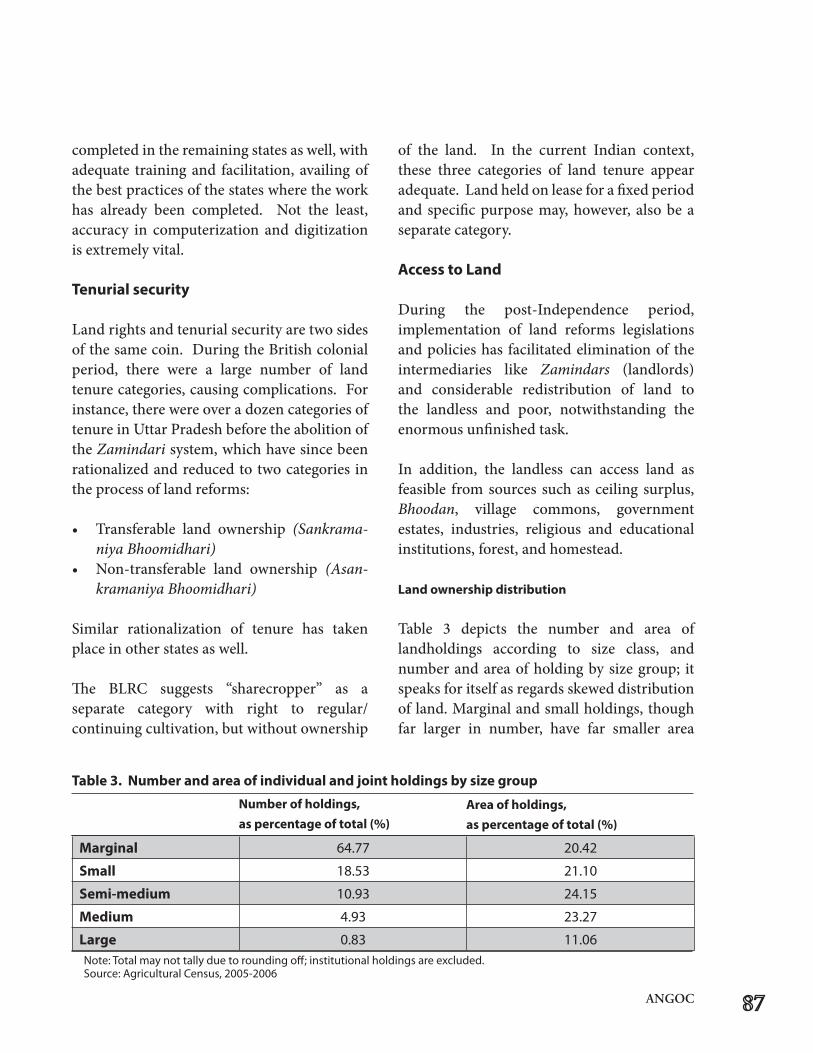
ANGOC
completed in the remaining states as well, with adequate training and facilitation, availing of the best practices of the states where the work has already been completed. Not the least, accuracy in computerization and digitization is extremely vital.
Tenurialsecurity
Land rights and tenurial security are two sides of the same coin. During the British colonial period, there were a large number of land tenure categories, causing complications. For instance, there were over a dozen categories of tenure in Uttar Pradesh before the abolition of the Zamindari system, which have since been rationalized and reduced to two categories in the process of land reforms:
• Transferable land ownership (Sankrama-niya Bhoomidhari)
• Non-transferable land ownership (Asan-kramaniya Bhoomidhari)
Similar rationalization of tenure has takenplace in other states as well.
The BLRC suggests “sharecropper” as a separate category with right to regular/continuing cultivation, but without ownership
of the land. In the current Indian context, these three categories of land tenure appear adequate. Land held on lease for a fixed period and specific purpose may, however, also be a separate category.
Access to Land
During the post-Independence period, implementation of land reforms legislations and policies has facilitated elimination of the intermediaries like Zamindars (landlords) and considerable redistribution of land to the landless and poor, notwithstanding the enormous unfinished task.
In addition, the landless can access land as feasible from sources such as ceiling surplus, Bhoodan, village commons, government estates, industries, religious and educational institutions, forest, and homestead.
Landownershipdistribution
Table 3 depicts the number and area of landholdings according to size class, and number and area of holding by size group; it speaks for itself as regards skewed distribution of land. Marginal and small holdings, though far larger in number, have far smaller area
Marginal 64.77 20.42
Small 18.53 21.10
Semi-medium 10.93 24.15
Medium 4.93 23.27
Large 0.83 11.06
Table3.Numberandareaofindividualandjointholdingsbysizegroup
Number of holdings, aspercentageoftotal(%)
Area of holdings, aspercentageoftotal(%)
Note: Total may not tally due to rounding off; institutional holdings are excluded.Source:AgriculturalCensus,2005-2006
of land; whereas the opposite is true in case of medium and large holdings. Marginal landholdings (64.77% of total) and small landholdings (18.53% of total) constitute the majority, but together, they only cover 41.52% of the total area of landholdings.
Ceiling surplus
As mentioned in the Committee’s report, 2.7 million ha of land has so far been declared ceiling surplus; 2.3 million ha (about 85%) of it has been taken possession of by the government and 1.9 million ha of it has been distributed to 5.5 million households (37% to theSCsand16%totheSTs).Therehasbeennofurther progress in the implementation of land ceiling, the surplus from which is estimated at 21 million ha. The bulk of the remaining land is, however, stuck in disputes in revenue and judicial court cases. This is just an illustration of the problem.
Bhoodan(gifted)land
There is considerable Bhoodan land to be distributed, notwithstanding a large number of “fake” Bhoodans of uncultivable lands. The total land donated all over India was 1.928 million ha, out of which, 0.989 million ha was distributed, although only 0.446 million ha was cultivable; and 0.731 million ha of the total donated land was unfit for distribution. Donations across the states were uneven, with farmore of them in the Statesof Jharkhand, Bihar, Odisha, Rajasthan, Uttar Pradesh, Madhya Pradesh, Andhra Pradesh, Maharashtra and Gujarat. However, Gramdan (village gift), although well-conceptualized for communitarian land management and use as well as village self-rule (Gram Swaraj),
was not realized for want of follow-up and socio-economic and political preparedness; otherwise, a total of about 146,807 gifted villages could have benefited.
Wasteland
Likewise, 63.85 million ha of government land is categorized as wasteland (land with or without scrub, water logged, marshy, affected by salinity/alkalinity, coastal/inland, shifting cultivation area, degraded pastures/grazing land, degraded land under plantation crops, sandy, mining/industrial lands). A major part of this wasteland can and should be reclaimed, developed and distributed to the landless.
Forest lands
As of 30 September 2011, a total 1,219,922titles for 1,601,524 ha of forest land have been distributed under the ScheduledTribesand Other Traditional Forest Dwellers (Recognition of Forest Rights) Act, 2006 and Rules, 2007 in India as a whole. The process continues and the titles for considerable additional forest land would be distributed in due time, notwithstanding insurmountable hurdles in it.
These are but a few examples of how the access of the rural poor to land can be enhanced considerably, if land reforms are systematically monitored, advocated, pushed, and facilitated.
It is, however, pertinent to underline that the recent legislations and bills (i.e., Forest Rights, Rural Employment Guarantee, Land Acquisition, Rehabilitation And Resettlement, Food Security), though vital and helpful,do not constitute a part of the original land reforms package.
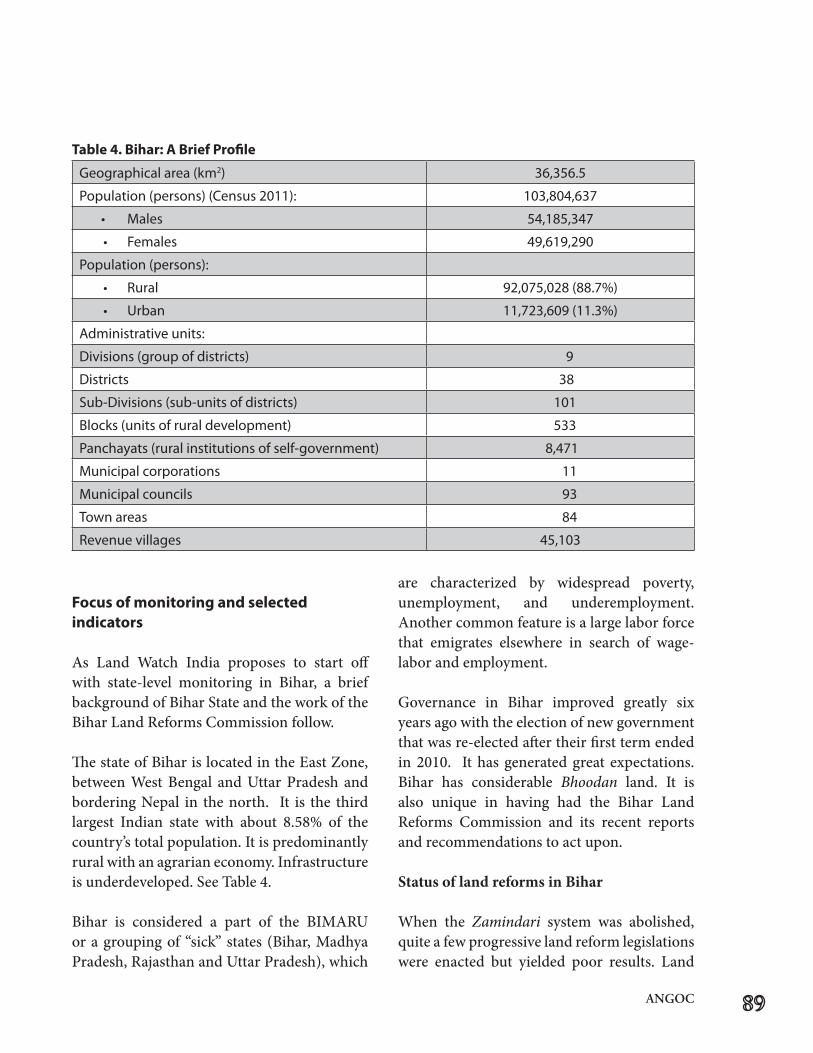
ANGOC
Focus of monitoring and selected indicators
As Land Watch India proposes to start off with state-level monitoring in Bihar, a brief backgroundofBiharStateandtheworkoftheBihar Land Reforms Commission follow.
The state of Bihar is located in the East Zone, between West Bengal and Uttar Pradesh and bordering Nepal in the north. It is the third largest Indian state with about 8.58% of the country’s total population. It is predominantly rural with an agrarian economy. Infrastructure isunderdeveloped.SeeTable4.
Bihar is considered a part of the BIMARU or a grouping of “sick” states (Bihar, Madhya Pradesh, Rajasthan and Uttar Pradesh), which
are characterized by widespread poverty, unemployment, and underemployment. Another common feature is a large labor force that emigrates elsewhere in search of wage-labor and employment.
Governance in Bihar improved greatly six years ago with the election of new government that was re-elected after their first term ended in 2010. It has generated great expectations.Bihar has considerable Bhoodan land. It is also unique in having had the Bihar Land Reforms Commission and its recent reports and recommendations to act upon.
Status of land reforms in Bihar
When the Zamindari system was abolished, quite a few progressive land reform legislations were enacted but yielded poor results. Land
Geographical area (km2) 36,356.5
Population (persons) (Census 2011): 103,804,637
• Males 54,185,347
• Females 49,619,290
Population (persons):
• Rural 92,075,028(88.7%)
• Urban 11,723,609(11.3%)
Administrative units:
Divisions (group of districts) 9
Districts 38
Sub-Divisions(sub-unitsofdistricts) 101
Blocks (units of rural development) 533
Panchayats (rural institutions of self-government) 8,471
Municipal corporations 11
Municipal councils 93
Town areas 84
Revenue villages 45,103
Table4.Bihar:ABriefProfile
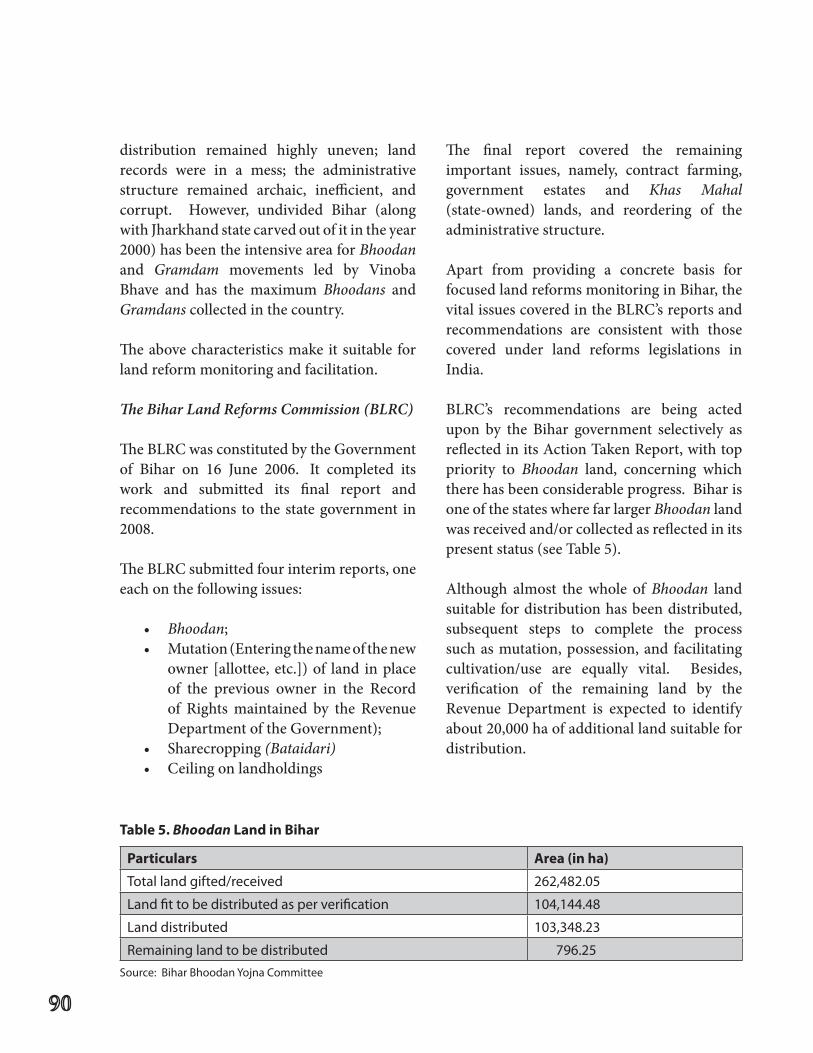
distribution remained highly uneven; land records were in a mess; the administrative structure remained archaic, inefficient, and corrupt. However, undivided Bihar (along with Jharkhand state carved out of it in the year 2000) has been the intensive area for Bhoodan and Gramdam movements led by Vinoba Bhave and has the maximum Bhoodans and Gramdans collected in the country.
The above characteristics make it suitable for land reform monitoring and facilitation.
The Bihar Land Reforms Commission (BLRC)
The BLRC was constituted by the Government of Bihar on 16 June 2006. It completed its work and submitted its final report and recommendations to the state government in 2008.
The BLRC submitted four interim reports, one each on the following issues:
• Bhoodan; • Mutation(Enteringthenameofthenew
owner [allottee, etc.]) of land in place of the previous owner in the Record of Rights maintained by the Revenue Department of the Government);
• Sharecropping(Bataidari)• Ceilingonlandholdings
The final report covered the remaining important issues, namely, contract farming, government estates and Khas Mahal (state-owned) lands, and reordering of the administrative structure.
Apart from providing a concrete basis for focused land reforms monitoring in Bihar, the vital issues covered in the BLRC’s reports and recommendations are consistent with those covered under land reforms legislations in India.
BLRC’s recommendations are being acted upon by the Bihar government selectively as reflected in its Action Taken Report, with top priority to Bhoodan land, concerning which there has been considerable progress. Bihar is one of the states where far larger Bhoodan land was received and/or collected as reflected in its present status (see Table 5).
Although almost the whole of Bhoodan land suitable for distribution has been distributed, subsequent steps to complete the process such as mutation, possession, and facilitating cultivation/use are equally vital. Besides, verification of the remaining land by the Revenue Department is expected to identify about 20,000 ha of additional land suitable for distribution.
Particulars Area(inha)
Total land gifted/received 262,482.05
Land fit to be distributed as per verification 104,144.48
Land distributed 103,348.23
Remaining land to be distributed 796.25
Table5.Bhoodan Land in Bihar
Source:BiharBhoodanYojnaCommittee
ANGOC
Similarly,BLRC’s recommendationsonotherissues are equally vital. For instance, it has recommended that ceiling surplus land should be distributed among 1.668 million landless agricultural labor households: 0.24 to 0.4 ha per household; as well as among 0.584 million landless and homeless rural households: 10 decimals of homestead per household, besides safeguarding the interests of the sharecroppers.
Indicators
• Essentialindicators:
1. Access to land
It may be relatively more systematic and effective to compute and monitor access to land source-wise as sub-categories. Access can be positive or negative, depending on whether it is enhanced or reduced (as in the case of increasing acquisition and/or grabbing of agricultural land for non-agricultural purposes).
2. Access to homestead
Access to homestead may be monitored separately, considering its greater importance.
3. Sharecropping
Considering the contentious issue of sharecropping, the terms of reference of the concerned Sub-Group of the Committeeincluded:
“To examine the issues of tenancy and sub-tenancy and suggest measures for recording of all agricultural tenants and a framework
to enable cultivators of land to lease in and lease out with suitable assurances for fair rent, security of tenure, and right to resumption.”
Nevertheless,theSub-Groupinitsreportfavorsthe West Bengal model of Operation Berga. As of 2003, 7% of the total operated area in India was being leased by 11.5% of rural households (NSS 60th Round). However, micro-studies indicate incidence of tenancy between 15% to 35%, most of it informal, hence insecure. Much higher incidence of tenancy extending up to 50% is also found in certain regions. Sharecropping continues to be the dominantform; but about 90% of the leased area is unrecorded and informal. In India as a whole, 35.8% of the total rural households leasing in land are landless laborers and 47.5% have land below 0.5 ha each. Therefore, safeguarding the interest of the poor disadvantaged sharecroppers is extremely vital.
4. Updating and computerization of land records and maps
This is an important indicator so that a clear picture is made available.
5. Land disputes
The number of disputes pending in revenue and/or judicial courts may be monitored with respect to the periods for which they have been pending such as: a) less than three years, b) three to five years, c) five to ten years, d) over ten years, etc. It takes decades for an average case to be decided finally, after going through a hierarchyofcourtsallthewaytotheSupremeCourt. Land dispute tribunals have been suggested to expedite disposal of the pending
cases. Deaths per 100,000 population or so in land related conflicts may not be relevant to the Indian context in view of the large population. However, monitoring and highlighting of absolute number of deaths may be vital and helpful.
6. Legislations and policies
Land reforms legislations and policies, without loopholes, are a prerequisite to effective land reforms, and hence merit inclusion among the indicators.TheCommitteeonStateAgrarianRelations and the Unfinished Task of Land Reforms has already submitted its report to enable the National Land Reforms Council to consider it and decide on the national land reforms policy and national land use plan, which should, therefore, be captured in this indicator for monitoring.
7. Land reform budget
Financial and human resources to implement land reforms legislations and policies, with improvements/amendments where needed, are extremely vital to monitor. Data on budget for land reforms are part of the total budget of the Government of India and state governments. It is not readily available, but can be accessed andprovidedinduetime.Sourcesincludethegovernment budget presented by the Finance Minister and passed by the National Parliament orStateLegislature.
8. Reordering of governance and adminis-trative structure
Land governance and related administrative structure, which are archaic, colonial, cumbersome, inefficient, and corrupt, need to be reordered, streamlined, and modernized.
Distribution of land by holding size along with landlessness is vital to be monitored since it reveals unevenness in the system. Every five years, the Agricultural Census in India provides the data from the village to the national level via intermediate levels. Additional Indicators:
9. Food security
Food security is a forceful argument against acquisition or grabbing of agricultural land for non-agricultural purposes as well as for redistribution of land to poor tillers for equity and efficiency.
10. Women’s rights
Women’s right to land, though extremely vital, is still in the initial stages of recognition in India. However, it can and should be monitored.
11. Protection against alienation of land belonging to STs, SCs, etc.
This is also a vital issue to be monitored.
12. Decline in agricultural land
This decline is primarily due to acquisition/grabbing of agricultural land for non-agricultural purposes, but also due to some other reasons. It merits monitoring.
These indicators are seen as integral parts of the same land reforms package and thus may be adapted, enlarged and/or reduced to synergize them with regional indicators (identified by Land Watch Asia/Asian NGO Coalition for Agrarian Reform and Rural Development).
ANGOC
Consolidation of fragmented landholdings demands monitoring, but may not be included among the indicators since, as of now, it has been relegated to the background for certain cogent reasons, such as its completion in states like Uttar Pradesh, but its failure to take off in states like Bihar. It is also ineffective due to flaws in the succession legislations, especially the HinduSuccessionAct, resulting in continualre-fragmentation in the process of succession from generation to generation.
Systems Approach TheproposedCSO land reformsmonitoringshould adopt a systems approach and avoid counterproductive adversarial approaches.
Availability of Data
India is relatively better placed regarding availability of reliable data from sources, such as:
• DecennialHumanCensus (the latest onedone in 2011);
• AgriculturalCensus conductedeveryfiveyears (the latest one done in 2010-2011);
• National Sample Survey (NSS)Organization (surveys done and reports produced periodically);
• FiveYearPlans–11th Plan (2007-2012) in existence and 12th Plan (2012-2017) under preparation as per its Approach;
• Datainreports/documentsoftherelevantMinistries and Departments of the government;
• Academic and applied researchinstitutions;
• Statistical handbooks, official and non-official;
• Books,periodicalsandnewspapers;• Internationalorganizations;and• Onlinesources.
Conclusion TheCSO-ledlandreformmonitoringinitiativeis essential, feasible, and useful. It should, therefore, be finalized and made operational as soon as possible.
A major recommendation of this study is for actors in government, donor, and civil society sectors to work together to facilitate the development and improvement of the land reforms monitoring tool with the following objectives:
• toascertainthestatusoflandreformsandshare information among all concerned to enhance awareness and critical action on:
i. land governance and agrarian relations, which aim to enhance access of the rural poor to land with tenurial security for livelihood, food security, and poverty reduction;
ii. a rational people-centric national land reforms policy and land use plan; and
iii. efforts to resolve and/or minimize conflicts and restore and/or maximize peace.
• to strengthen and enrich advocacy anddialogue for expediting the completion of the unfinished task of land reforms in India; and
• to enhance the capacity of Land WatchIndia and CSOs at large to engage withgovernments and other institutions on land reforms more effectively.
Report of The Bihar Land Reforms Commission (16.06.2006 to 16.06.2008) and Action Taken Report of the Revenue and Land Reforms Department, Government of Bihar, Patna.
SabaiBhoomiGopalKi:Bhoodan–GramdanAndolan Ki Kahani (Hindi) (All Land Belongs To God: TheStoryofBhoodan-GramdanMovement), Volumes I, II and III, Dr. Parag Cholkar, Gujarat Vidyapeeth, Ahmedabad (Gujarat), India.
StatusofBhoodanWorkinBihar–Reportofthe Bihar Bhoodan Yajna Committee, Patna carried inthejournal,Sansthakul(Hindi),January2012, GandhiSmarakNidhi,Rajghat,NewDelhi– 110002.
StatusReportonImplementationoftheScheduled Tribes and Other Traditional Forest Dwellers (Recognition of Forest Rights) Act, 2006 (as on 30thSeptember2011),MinistryofTribal Affairs,GovernmentofIndia,ShastriBhawan, New Delhi – 110001.
TheHinduSuccession(Amendment)Act,2005, Ministry of Law and Justice, Government of India, ShastriBhawan,NewDelhi–110001.
The Land Acquisition, Rehabilitation and Resettle- ment Bill, 2011 (Bill No.77 of 211), Ministry of Rural Development, Government of India, New Delhi – 110001.
TheNationalFoodSecurityBill,2011(BillNo.132 of 2011), Ministry of Consumer Affairs, Food and Public Distribution, Government of India, New Delhi – 110001.
ScheduledTribesAndOtherTraditionalForest Dwellers (Recognition of Forest Rights) Act, 2006 & Rules, 2007, Ministry of Law and Justice, GovernmentofIndia,ShastriBhawan,NewDelhi – 110001.
* Many other printed and online sources tapped and referred to, but not listed.
References:*
AccessToLandAndTenurialSecurityInIndia– Country Paper (2008), prepared by AVARD, Ekta Parishad and ANGOC
Agricultural Census, 2005-06; Ministry of Agriculture, Government of India, Krishi Bhawan, New Delhi – 110001;
An Agenda to Reform Agrarian Relations for Equity and Efficiency in Contemporary India- DraftReportoftheCommitteeonStateAgrarian Relations and Unfinished Task of Land Reforms, Ministry of Rural Development, Government of India, Krishi Bhawan, New Delhi – 110001.
Anasakti Dashan, July 2010-June 2011, Bhoodan Visheshank(Hindi),JournalofGandhiSmritiand DarshanSamiti,Rajghat,NewDelhi–110002.
BhoomiSamasyaAurBhoodan(1997)(Hindi), Nirmal Chandra, Gandhi Peace Foundation, New Delhi – 110002.
Census 2001, Registrar General and Census Commissioner, India, Ministry of Home Affairs, 2/ A, Mansingh Road, New Delhi – 110011.
Census 2011, Registrar General and Census Commissioner, India, Ministry of Home Affairs, 2/1, Mansingh Road, New Delhi – 110011.
Eleventh Five Year Plan (2007-12), Volumes I, II & III, Planning Commission, Government of India, New Delhi – 110001.
Faster,SustainableandMoreInclusiveGrowth– An Approach to the 12th Five Year Plan (2012-17), Planning Commission, Government of India, New Delhi – 110001.
LandReformsinIndia,DevenganaJha,MadrasSchool of Economics, Chennai.
Land Reforms And Politics – A Comparative Analysis (1974), \Prof. Hung-Chao Tai, University of California Press, Berkeley and Los Angeles, California.
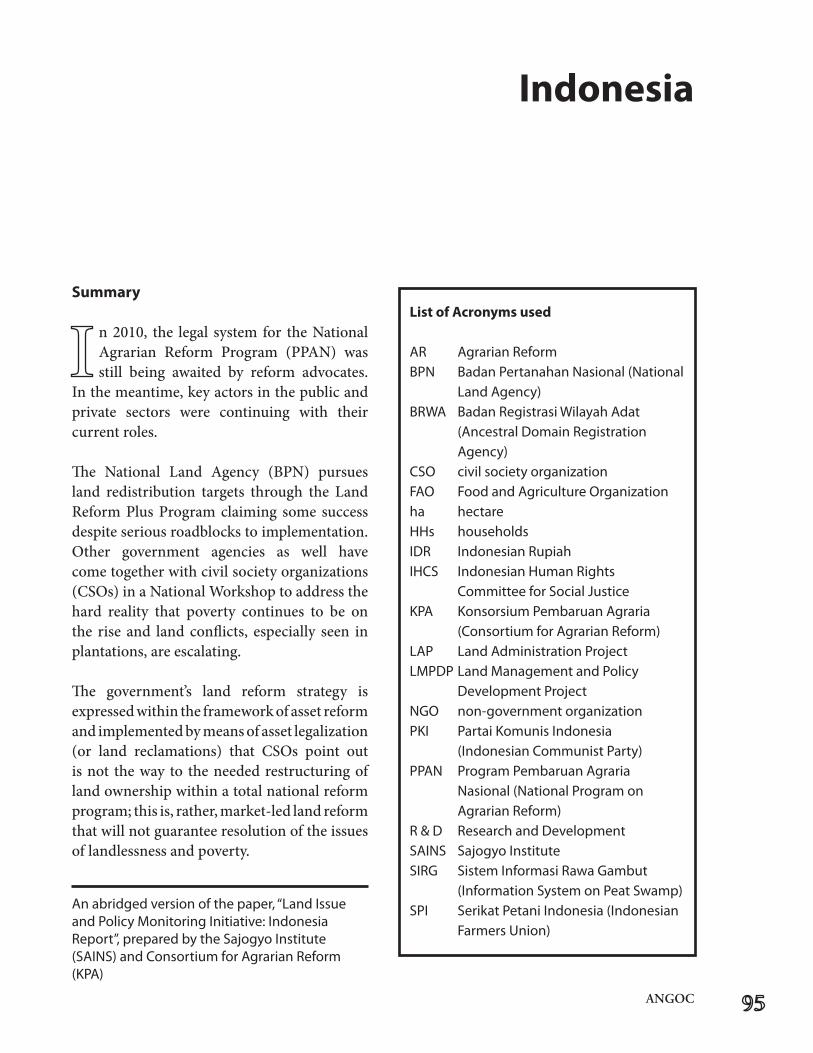
ANGOC
Indonesia
Summary
n 2010, the legal system for the National Agrarian Reform Program (PPAN) was still being awaited by reform advocates.
In the meantime, key actors in the public and private sectors were continuing with their current roles.
The National Land Agency (BPN) pursues land redistribution targets through the Land Reform Plus Program claiming some success despite serious roadblocks to implementation. Other government agencies as well have come together with civil society organizations (CSOs)inaNationalWorkshoptoaddressthehard reality that poverty continues to be on the rise and land conflicts, especially seen in plantations, are escalating.
The government’s land reform strategy is expressed within the framework of asset reform and implemented by means of asset legalization (or land reclamations) that CSOs point outis not the way to the needed restructuring of land ownership within a total national reform program; this is, rather, market-led land reform that will not guarantee resolution of the issues of landlessness and poverty.
List of Acronyms used
AR Agrarian ReformBPN Badan Pertanahan Nasional (National Land Agency) BRWA Badan Registrasi Wilayah Adat (Ancestral Domain Registration Agency)CSO civilsocietyorganizationFAO Food and Agriculture Organizationha hectareHHs householdsIDR Indonesian RupiahIHCS IndonesianHumanRights CommitteeforSocialJusticeKPA KonsorsiumPembaruanAgraria (Consortium for Agrarian Reform)LAP Land Administration Project LMPDP Land Management and Policy Development ProjectNGO non-government organizationPKI PartaiKomunisIndonesia (Indonesian Communist Party)PPAN Program Pembaruan Agraria Nasional (National Program on Agrarian Reform)R & D Research and DevelopmentSAINS SajogyoInstituteSIRG SistemInformasiRawaGambut (InformationSystemonPeatSwamp)SPI SerikatPetaniIndonesia(Indonesian Farmers Union)
An abridged version of the paper, “Land Issue and Policy Monitoring Initiative: Indonesia Report”,preparedbytheSajogyoInstitute(SAINS)andConsortiumforAgrarianReform(KPA)
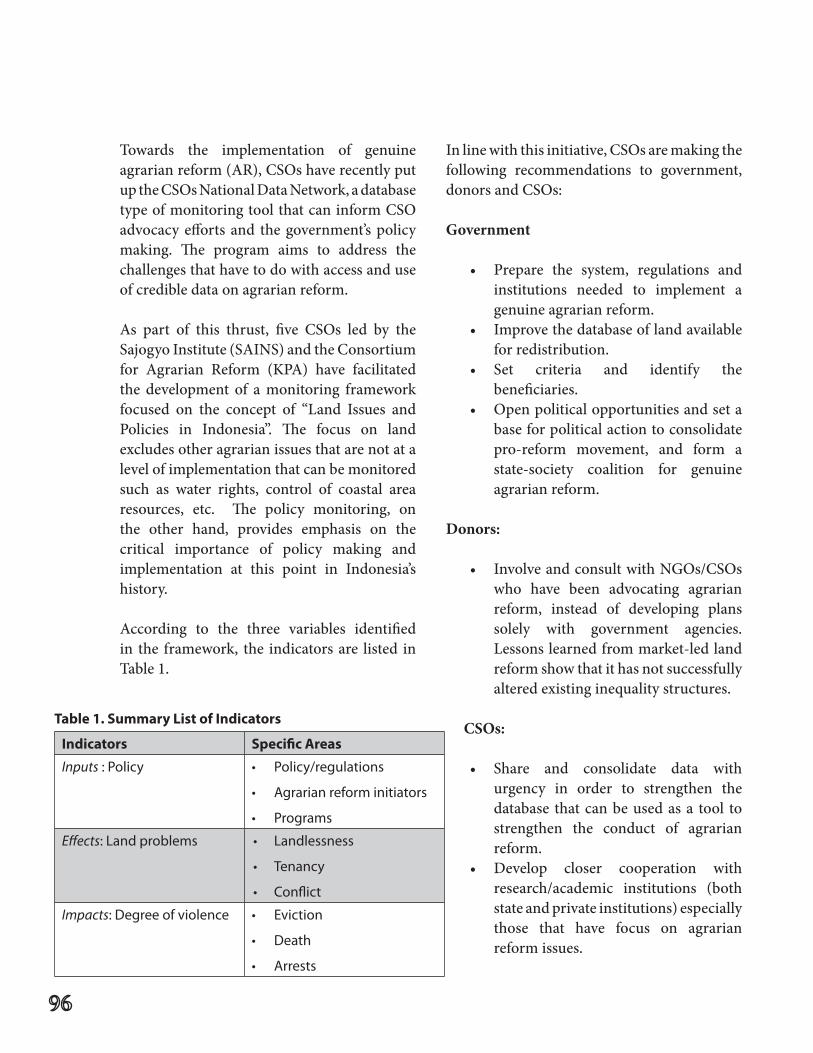
Towards the implementation of genuine agrarianreform(AR),CSOshaverecentlyputuptheCSOsNationalDataNetwork,adatabasetypeofmonitoringtoolthatcaninformCSOadvocacy efforts and the government’s policy making. The program aims to address the challenges that have to do with access and use of credible data on agrarian reform.
As part of this thrust, five CSOs led by theSajogyoInstitute(SAINS)andtheConsortiumfor Agrarian Reform (KPA) have facilitated the development of a monitoring framework focused on the concept of “Land Issues and Policies in Indonesia”. The focus on land excludes other agrarian issues that are not at a level of implementation that can be monitored such as water rights, control of coastal area resources, etc. The policy monitoring, on the other hand, provides emphasis on the critical importance of policy making and implementation at this point in Indonesia’s history.
According to the three variables identified in the framework, the indicators are listed in Table 1.
Inlinewiththisinitiative,CSOsaremakingthefollowing recommendations to government, donorsandCSOs:
Government
• Prepare the system, regulations andinstitutions needed to implement a genuine agrarian reform.
• Improvethedatabaseoflandavailablefor redistribution.
• Set criteria and identify thebeneficiaries.
• Openpoliticalopportunitiesandsetabase for political action to consolidate pro-reform movement, and form a state-society coalition for genuine agrarian reform.
Donors:
• InvolveandconsultwithNGOs/CSOswho have been advocating agrarian reform, instead of developing plans solely with government agencies. Lessons learned from market-led land reform show that it has not successfully altered existing inequality structures.
CSOs:
• Share and consolidate data withurgency in order to strengthen the database that can be used as a tool to strengthen the conduct of agrarian reform.
• Develop closer cooperation withresearch/academic institutions (both state and private institutions) especially those that have focus on agrarian reform issues.
Indicators Specific Areas
Inputs : Policy • Policy/regulations
• Agrarianreforminitiators
• Programs
Effects: Land problems • Landlessness
• Tenancy
• Conflict
Impacts: Degree of violence • Eviction
• Death
• Arrests
Table1.SummaryListofIndicators
ANGOC
Context: status of land reform in Indonesia
Ten years since land reform re-emerged as a national agenda, the restructuring of agrarian systems has remained unfulfilled. Over time, studies indicate that while the country’s total agricultural area based on census data from 1963 and 1983 had increased from 12,884,000 ha to 14,483,321 ha, the average number for each agricultural activity had decreased, from 1.05 ha in 1963 to 0.85 ha in 1983. A recent estimate from FAO (2004) in Kalsim (2010) shows that total agricultural land is 14.21 million ha in 2003.1
In general, many farmers continue to have no complete ownership over the land (70.75%) and most of them cultivate the land by themselves (82.75%). The scarcity of reliable data does not give a profile of the small farmer, but the landless are estimated for the period 1979-1984 by Gini coefficient measure at a high of 29% to 40%. Their access to land is less than 0.25 ha.
CSOsemphasizetheimportanceoffiveperiodsinthehistoryofAR(SeeTable2).
Conceptualframework A National Workshop composed of AR leaders in government and CSOs determined thecritical challenges faced by government agencies and the resistance met from various stakeholders. One workshop result is the establishmentoftheCSOs’NationalDatabaseNetwork.Thedatabasesystem,calledSMART,will receive constant input data from 15 participating CSOs including the neededdisaggregated data from government. The 1 http://dedikalsim files.wordpress.com/2011/03/pemb-infrastruktur-pert-2.pdf
availability of complete and updated data is positioned as an important component to establish a relevant strategy for agrarian movement and policy advocacy work. The team of CSOs will analyze the dataand produce a position paper annually for the use of AR stakeholders and advocates of agrarian issues and policy making.
The monitoring framework adopts a focus on “Land Issues and Policies in Indonesia” using indicators taken from the BPN programs. These indicators fall under three major variables: Input, Effect, and Impact. Further, the framework attempts to trace the progress of land reform over five periods in the country’s history. The periods were defined according to significant policies or political changes marking these periods (see Table 3).
Findings and Analysis
1. INPUTS
a. Policies
From the Sukarno Era until the presentReformation Era, the management of agrarian resources has become more fragmented and contradictory. There are 11 acts that digress from Article 33 of the Indonesian Constitution of 1945 in their vision, mission statements, and regulated resources. As a result, there are contradictions and overlaps in responsibilities among government authorities and in implementation processes. Over time, such agrarian resource management has relegated land function and invited overt and covert conflict because of sectoral claims over resources. These claims have dispossessed rural farmers from their lands.
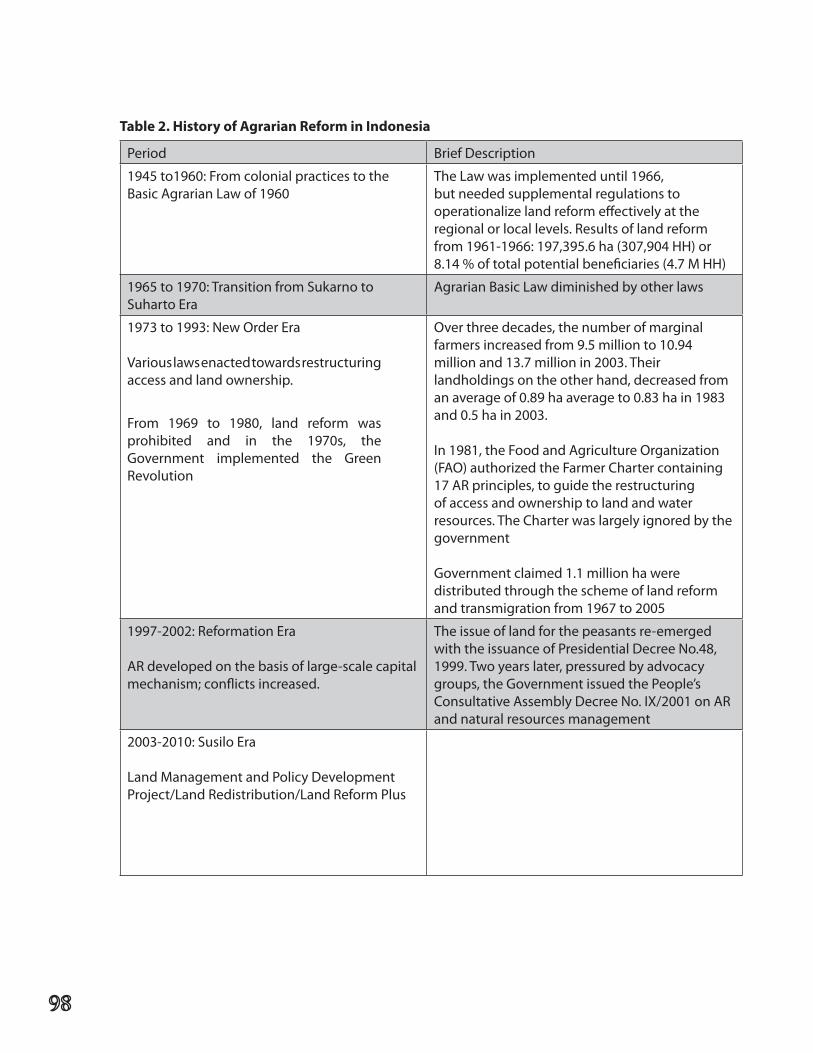
Period Brief Description
1945to1960:FromcolonialpracticestotheBasicAgrarianLawof1960
TheLawwasimplementeduntil1966,but needed supplemental regulations to operationalize land reform effectively at the regional or local levels. Results of land reform from1961-1966:197,395.6ha(307,904HH)or8.14%oftotalpotentialbeneficiaries(4.7MHH)
1965to1970:TransitionfromSukarnotoSuhartoEra
Agrarian Basic Law diminished by other laws
1973to1993:NewOrderEra
Various laws enacted towards restructuring access and land ownership.
From 1969 to 1980, land reform wasprohibited and in the 1970s, theGovernment implemented the Green Revolution
Over three decades, the number of marginal farmersincreasedfrom9.5millionto10.94millionand13.7millionin2003.Theirlandholdings on the other hand, decreased from anaverageof0.89haaverageto0.83hain1983and 0.5 ha in 2003.
In1981,theFoodandAgricultureOrganization(FAO) authorized the Farmer Charter containing 17ARprinciples,toguidetherestructuringof access and ownership to land and water resources. The Charter was largely ignored by the government
Government claimed 1.1 million ha were distributed through the scheme of land reform andtransmigrationfrom1967to2005
1997-2002:ReformationEra
AR developed on the basis of large-scale capital mechanism;conflictsincreased.
The issue of land for the peasants re-emerged withtheissuanceofPresidentialDecreeNo.48,1999. Two years later, pressured by advocacy groups, the Government issued the People’s Consultative Assembly Decree No. IX/2001 on AR and natural resources management
2003-2010:SusiloEra
Land Management and Policy Development Project/Land Redistribution/Land Reform Plus
Table2.HistoryofAgrarianReforminIndonesia
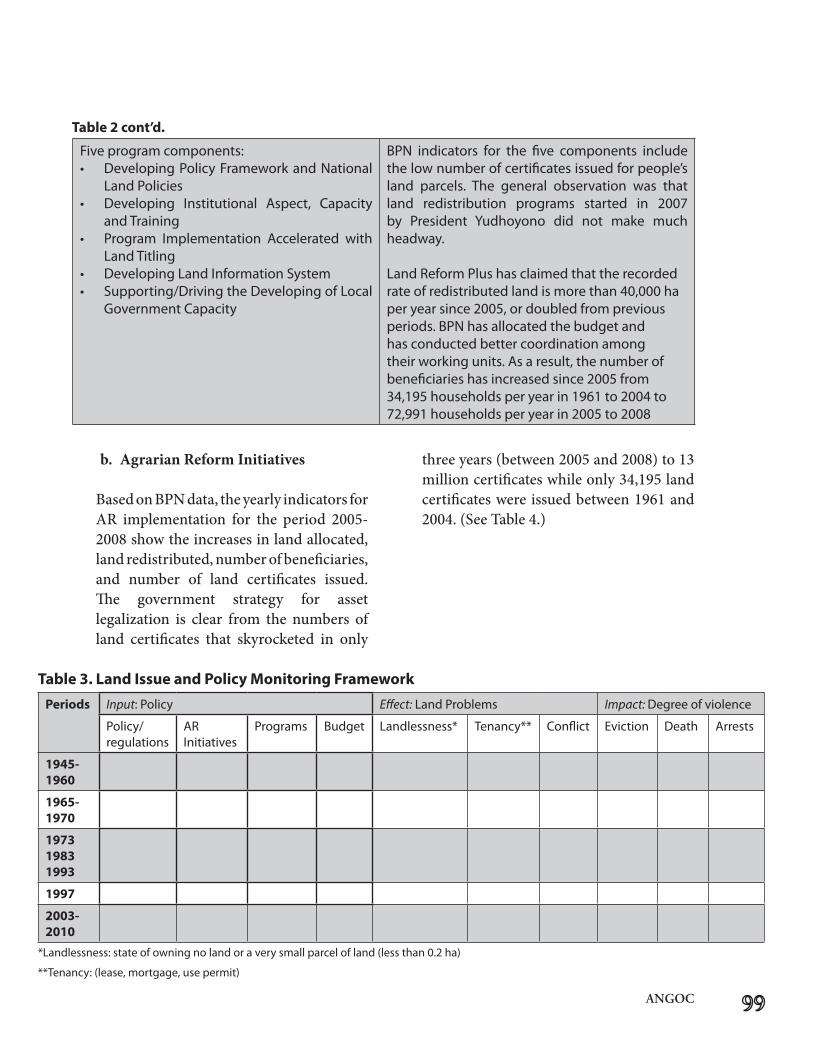
ANGOC
b. Agrarian Reform Initiatives
Based on BPN data, the yearly indicators for AR implementation for the period 2005-2008 show the increases in land allocated, land redistributed, number of beneficiaries, and number of land certificates issued. The government strategy for asset legalization is clear from the numbers of land certificates that skyrocketed in only
three years (between 2005 and 2008) to 13 million certificates while only 34,195 land certificates were issued between 1961 and 2004.(SeeTable4.)
Five program components: • DevelopingPolicyFrameworkandNational
Land Policies• Developing Institutional Aspect, Capacity
and Training• Program Implementation Accelerated with
Land Titling• DevelopingLandInformationSystem• Supporting/DrivingtheDevelopingofLocal
Government Capacity
BPN indicators for the five components include the low number of certificates issued for people’s land parcels. The general observation was that land redistribution programs started in 2007by President Yudhoyono did not make muchheadway.
Land Reform Plus has claimed that the recorded rateofredistributedlandismorethan40,000haper year since 2005, or doubled from previous periods. BPN has allocated the budget and has conducted better coordination among their working units. As a result, the number of beneficiaries has increased since 2005 from 34,195householdsperyearin1961to2004to72,991householdsperyearin2005to2008
Table2cont’d.
*Landlessness: state of owning no land or a very small parcel of land (less than 0.2 ha)
**Tenancy: (lease, mortgage, use permit)
Table3.LandIssueandPolicyMonitoringFrameworkPeriods Input: Policy Effect: Land Problems Impact: Degree of violence
Policy/regulations
AR Initiatives
Programs Budget Landlessness* Tenancy** Conflict Eviction Death Arrests
1945-1960
1965-1970
197319831993
1997
2003-2010
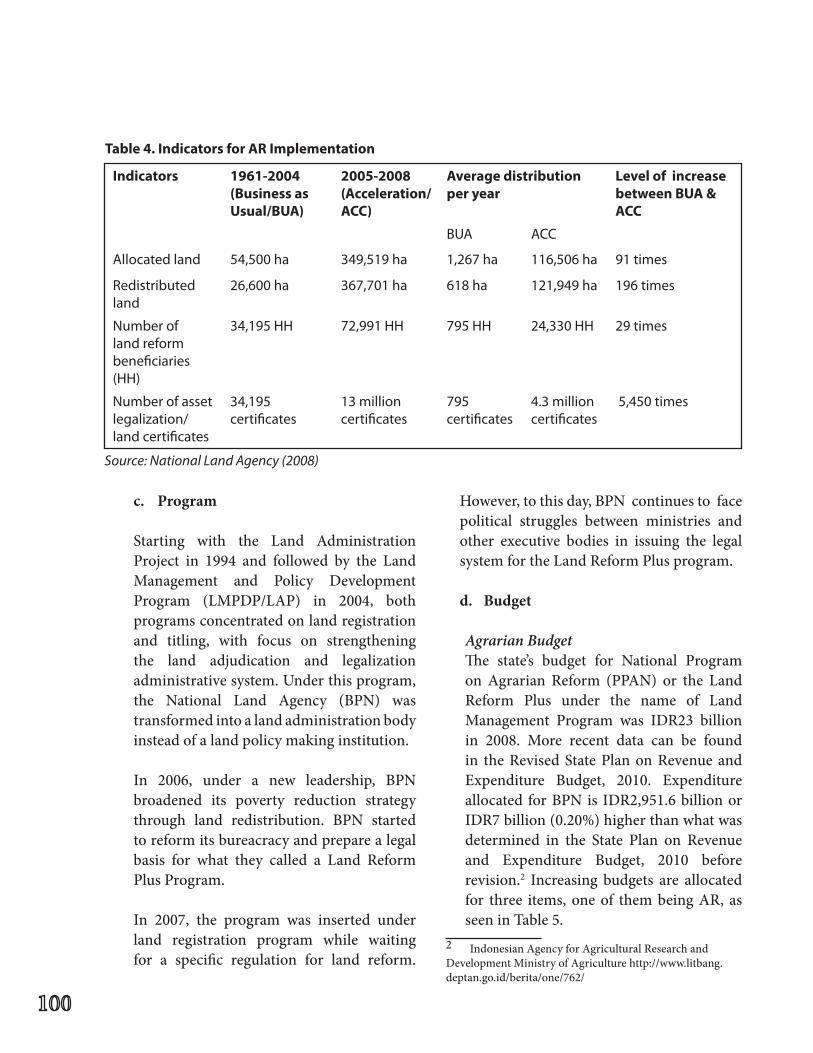
c. Program
Starting with the Land AdministrationProject in 1994 and followed by the Land Management and Policy Development Program (LMPDP/LAP) in 2004, both programs concentrated on land registration and titling, with focus on strengthening the land adjudication and legalization administrative system. Under this program, the National Land Agency (BPN) was transformed into a land administration body instead of a land policy making institution.
In 2006, under a new leadership, BPN broadened its poverty reduction strategy through land redistribution. BPN started to reform its bureacracy and prepare a legal basis for what they called a Land Reform Plus Program.
In 2007, the program was inserted under land registration program while waiting for a specific regulation for land reform.
However, to this day, BPN continues to face political struggles between ministries and other executive bodies in issuing the legal system for the Land Reform Plus program.
d. Budget
Agrarian BudgetThe state’s budget for National Program on Agrarian Reform (PPAN) or the Land Reform Plus under the name of Land Management Program was IDR23 billion in 2008. More recent data can be found in theRevisedStatePlanonRevenueandExpenditure Budget, 2010. Expenditure allocated for BPN is IDR2,951.6 billion or IDR7 billion (0.20%) higher than what was determined in the State Plan on Revenueand Expenditure Budget, 2010 before revision.2 Increasing budgets are allocated for three items, one of them being AR, as seen in Table 5.
2 Indonesian Agency for Agricultural Research and Development Ministry of Agriculture http://www.litbang.deptan.go.id/berita/one/762/
Indicators 1961-2004(Business as Usual/BUA)
2005-2008(Acceleration/ACC)
Average distribution per year
Level of increase betweenBUA&ACC
BUA ACC
Allocated land 54,500ha 349,519ha 1,267ha 116,506ha 91 times
Redistributed land
26,600ha 367,701ha 618ha 121,949ha 196times
Number of land reform beneficiaries (HH)
34,195HH 72,991HH 795HH 24,330HH 29 times
Number of asset legalization/ land certificates
34,195certificates
13 million certificates
795certificates
4.3millioncertificates
5,450times
Table4.IndicatorsforARImplementation
Source: National Land Agency (2008)
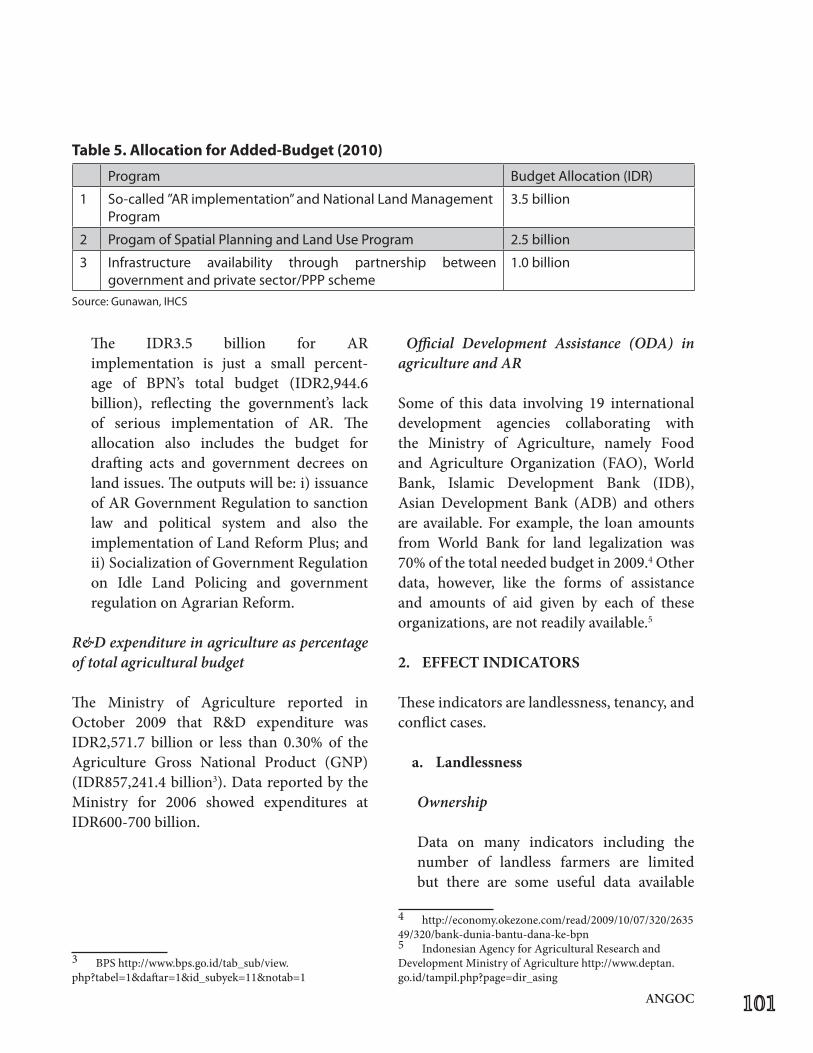
ANGOC
The IDR3.5 billion for AR implementation is just a small percent-age of BPN’s total budget (IDR2,944.6 billion), reflecting the government’s lack of serious implementation of AR. The allocation also includes the budget for drafting acts and government decrees on land issues. The outputs will be: i) issuance of AR Government Regulation to sanction law and political system and also the implementation of Land Reform Plus; and ii)SocializationofGovernmentRegulationon Idle Land Policing and government regulation on Agrarian Reform.
R&D expenditure in agriculture as percentage of total agricultural budget
The Ministry of Agriculture reported in October 2009 that R&D expenditure was IDR2,571.7 billion or less than 0.30% of the Agriculture Gross National Product (GNP) (IDR857,241.4 billion3). Data reported by the Ministry for 2006 showed expenditures at IDR600-700 billion.
3 BPShttp://www.bps.go.id/tab_sub/view.php?tabel=1&daftar=1&id_subyek=11¬ab=1
Official Development Assistance (ODA) in agriculture and AR
Some of this data involving 19 internationaldevelopment agencies collaborating with the Ministry of Agriculture, namely Food and Agriculture Organization (FAO), World Bank, Islamic Development Bank (IDB), Asian Development Bank (ADB) and others are available. For example, the loan amounts from World Bank for land legalization was 70% of the total needed budget in 2009.4 Other data, however, like the forms of assistance and amounts of aid given by each of these organizations, are not readily available.5
2. EFFECTINDICATORS
These indicators are landlessness, tenancy, and conflict cases.
a. Landlessness
Ownership
Data on many indicators including the number of landless farmers are limited but there are some useful data available
4 http://economy.okezone.com/read/2009/10/07/320/263549/320/bank-dunia-bantu-dana-ke-bpn5 Indonesian Agency for Agricultural Research and Development Ministry of Agriculture http://www.deptan.go.id/tampil.php?page=dir_asing
Program Budget Allocation (IDR)
1 So-called”ARimplementation”andNationalLandManagementProgram
3.5 billion
2 ProgamofSpatialPlanningandLandUseProgram 2.5 billion
3 Infrastructure availability through partnership between government and private sector/PPP scheme
1.0 billion
Table5.AllocationforAdded-Budget(2010)
Source:Gunawan,IHCS
ike the increasing land allocations for large-scale capital, e.g., palm plantation (the commodity with the biggest expansion). The increasing number of oil palm areas has resulted in the exclusion of farmers and the increase of agrarian disputes.
Data on ownership (by category) according to size of landholdings based on sectors e.g., plantation and agriculture were available:
• Land ownership of palm plantations in 30 provinces until February 2010 (SawitWatch,2010)
Existing and expansion areas of palm plantations from 2006 to 2009 are increasing, and consequently, so are agrarian conflicts in these communities. Women’s livelihood activities have also been affected. After paddyfields and gardens were converted to oil palm plantations, the women working those lands became contracted plantation workers with minimum wage of IDR 30,800 per day and no guarantee of health and safety.
• Land ownership of marginal farmers (SPIand IHCS,2008citingBPSdata, 2003)
Over three decades (1983-2003), the number of marginal farmers has increased from 9.5 million to 13.7 million. Their landholdings however, have decreased from an average of 0.89 ha to 0.5 ha in 2003.
• From1990 to 1991, landuse changes or conversion cases were documented from forest to dry land agriculture and to permanent structures. The highest percentages were 29% and 41%, indicating that the number of marginal farmers and the landless have increased with the change of forest status (Bachriadi & Wiradi, 2011).
b. Tenancy
Landlessness reached a high of 25% to 38% of the rural population with access to land at less than 0.25 ha. In 1973, the rate of landlessness was 35%; in 1983 it decreased to 25%, but increased again to 33% in 1993 and to 38% in 2003 (Bachriadi and Wiradi, 2011).
Percentage of sharecroppers
In 1999, 49.5% of farmers were landless in Java and 18.7% in islands outside Java (CASERinBappenas).Thisisapproximateddata as to the number of sharecroppers due to the unavailability of documentation, census, or other sources.
Percentage of sharecroppers with legal document
No data available.
Percentage of contract farmers’ area in relation to total agricultural area
No data available.
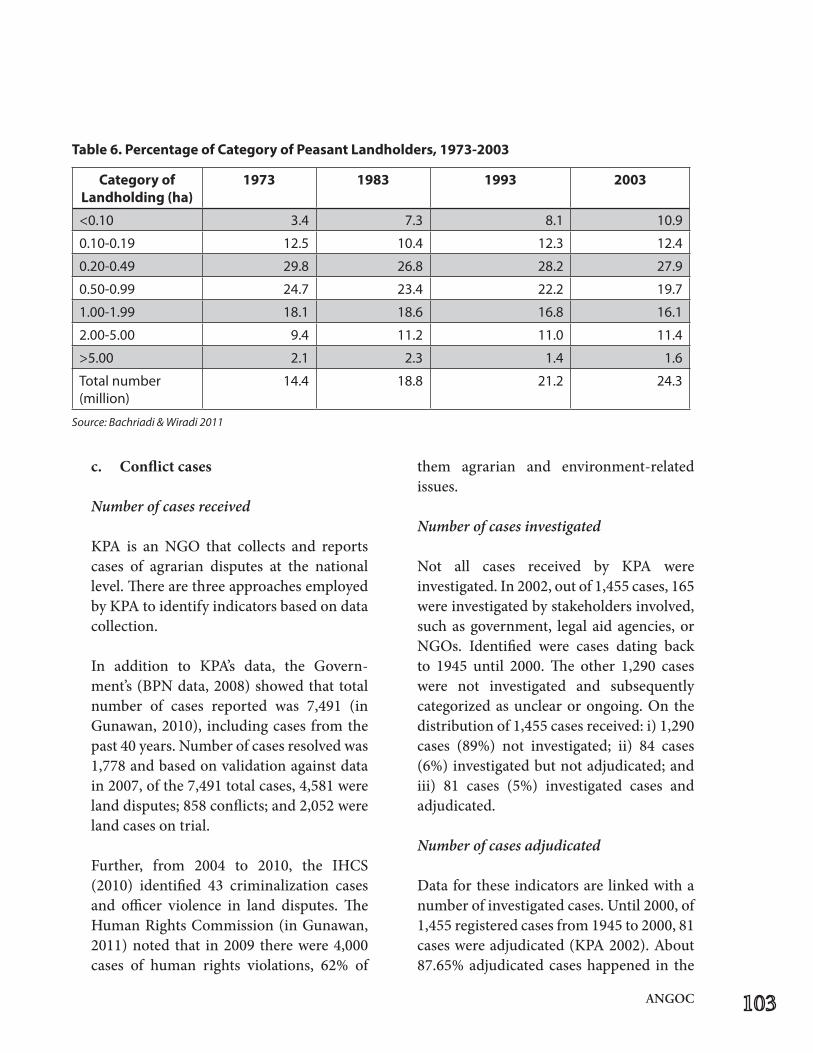
ANGOC
c. Conflict cases
Number of cases received
KPA is an NGO that collects and reports cases of agrarian disputes at the national level. There are three approaches employed by KPA to identify indicators based on data collection.
In addition to KPA’s data, the Govern-ment’s (BPN data, 2008) showed that total number of cases reported was 7,491 (in Gunawan, 2010), including cases from the past 40 years. Number of cases resolved was 1,778 and based on validation against data in 2007, of the 7,491 total cases, 4,581 were land disputes; 858 conflicts; and 2,052 were land cases on trial.
Further, from 2004 to 2010, the IHCS(2010) identified 43 criminalization cases and officer violence in land disputes. The Human Rights Commission (in Gunawan, 2011) noted that in 2009 there were 4,000 cases of human rights violations, 62% of
them agrarian and environment-related issues.
Number of cases investigated
Not all cases received by KPA were investigated. In 2002, out of 1,455 cases, 165 were investigated by stakeholders involved, such as government, legal aid agencies, or NGOs. Identified were cases dating back to 1945 until 2000. The other 1,290 cases were not investigated and subsequently categorized as unclear or ongoing. On the distribution of 1,455 cases received: i) 1,290 cases (89%) not investigated; ii) 84 cases (6%) investigated but not adjudicated; and iii) 81 cases (5%) investigated cases and adjudicated.
Number of cases adjudicated
Data for these indicators are linked with a number of investigated cases. Until 2000, of 1,455 registered cases from 1945 to 2000, 81 cases were adjudicated (KPA 2002). About 87.65% adjudicated cases happened in the
Category of Landholding(ha)
1973 1983 1993 2003
<0.10 3.4 7.3 8.1 10.9
0.10-0.19 12.5 10.4 12.3 12.4
0.20-0.49 29.8 26.8 28.2 27.9
0.50-0.99 24.7 23.4 22.2 19.7
1.00-1.99 18.1 18.6 16.8 16.1
2.00-5.00 9.4 11.2 11.0 11.4
>5.00 2.1 2.3 1.4 1.6
Total number (million)
14.4 18.8 21.2 24.3
Source: Bachriadi & Wiradi 2011
Table6.PercentageofCategoryofPeasantLandholders,1973-2003
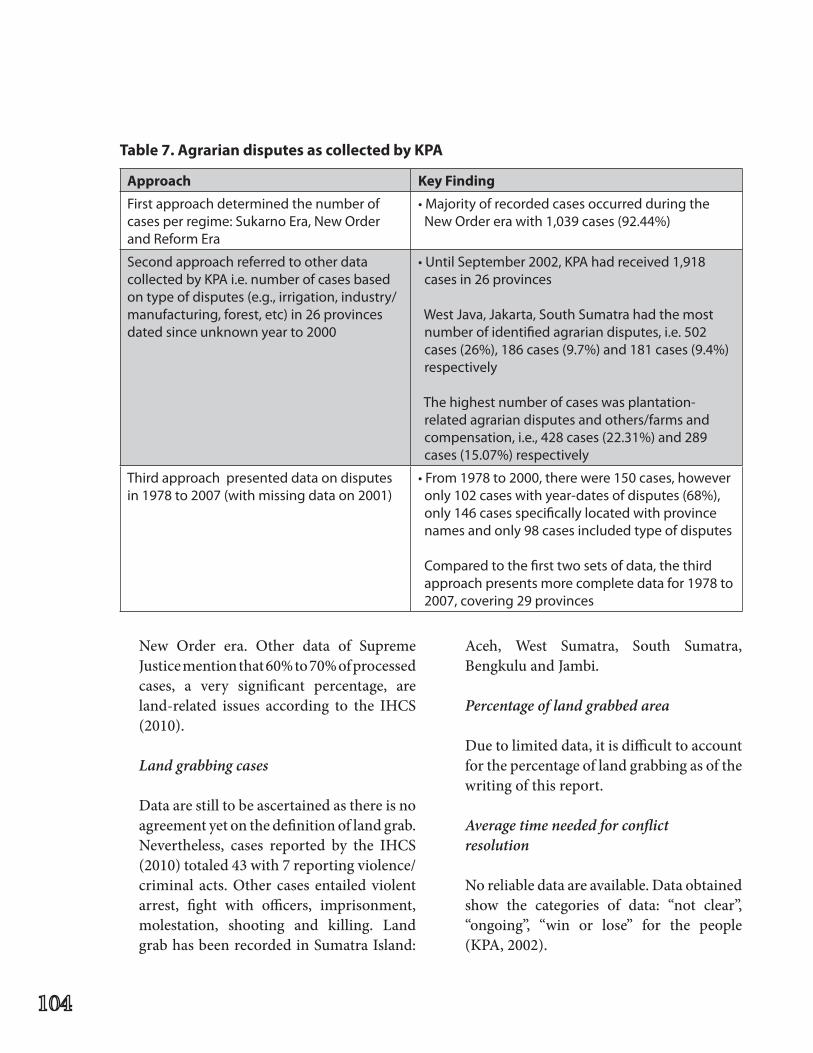
New Order era. Other data of SupremeJustice mention that 60% to 70% of processed cases, a very significant percentage, are land-related issues according to the IHCS(2010).
Land grabbing cases
Data are still to be ascertained as there is no agreement yet on the definition of land grab. Nevertheless, cases reported by the IHCS(2010) totaled 43 with 7 reporting violence/criminal acts. Other cases entailed violent arrest, fight with officers, imprisonment, molestation, shooting and killing. Land grabhasbeenrecordedinSumatraIsland:
Aceh, West Sumatra, South Sumatra,Bengkulu and Jambi.
Percentage of land grabbed area
Due to limited data, it is difficult to account for the percentage of land grabbing as of the writing of this report.
Average time needed for conflict resolution
No reliable data are available. Data obtained show the categories of data: “not clear”, “ongoing”, “win or lose” for the people (KPA, 2002).
Approach Key Finding
First approach determined the number of casesperregime:SukarnoEra,NewOrderand Reform Era
•MajorityofrecordedcasesoccurredduringtheNewOrdererawith1,039cases(92.44%)
SecondapproachreferredtootherdatacollectedbyKPAi.e.numberofcasesbasedon type of disputes (e.g., irrigation, industry/manufacturing,forest,etc)in26provincesdated since unknown year to 2000
•UntilSeptember2002,KPAhadreceived1,918casesin26provinces
WestJava,Jakarta,SouthSumatrahadthemost number of identified agrarian disputes, i.e. 502 cases(26%),186cases(9.7%)and181cases(9.4%) respectively
The highest number of cases was plantation- related agrarian disputes and others/farms and compensation,i.e.,428cases(22.31%)and289cases(15.07%)respectively
Third approach presented data on disputes in1978to2007(withmissingdataon2001)
•From1978to2000,therewere150cases,howeveronly102caseswithyear-datesofdisputes(68%),only146casesspecificallylocatedwithprovincenamesandonly98casesincludedtypeofdisputes
Compared to the first two sets of data, the third approachpresentsmorecompletedatafor1978to2007,covering29provinces
Table7.AgrariandisputesascollectedbyKPA
ANGOC
Annual loss due to conflict
No specific indicator.
Financial loss
No reliabledata available. So far, thedataaccessed are in terms of losing land for agriculture, costs incurred for medical treatment after experiencing violence, and loss for the children like their absence/inability to join national tests in school.
3. IMPACT INDICATORS
a. Evictions
Number of households evicted from agricultural land
TheIHCS(2010)statesthattherewerenineeviction cases from 2005 to 2007 occurring in Pasuruan (256 households [HHs]), Tulungagung (148 HHs), and West Nusa Tenggara (2,361 farmers). Additionally, there were also seven cases at the village level, but these were not available. Data from theIHCSwereforsamplingpurposesandnot enough to provide data at the national level.OtherdataofSPI(2010)showedthenumbers of households who were evicted/displaced from farms are 24,257 in 2007; 31,267 in 2008; and 5,835 in 2009.
Number of households made homeless due to eviction
There are no data available for this indicator.
b. Number of people killed
Data gathered revealed:• 18peoplediedduringtheperiod2007 to2009(SPI)• 4womenwerekilledand8injuredafter military shooting because of agrarian conflicts in Alastlogo, Lekok Sub District, Pasuruan Regency, East Java (SolidaritasPerempuan,2007).• Atleast19farmersandactivistsdiedin their struggle for land in 20 provinces during the Reform Era (KPA, 2000)• 2farmers’criminalizationcasescaused 6deaths(IHCS,2010)
c. Number of people arrested
Data gathered revealed 936 farmers arrested in 1997 to 2000 (KPA 2002); 102 people arrested from 2006 to 2010 (IHCS2010).
d. Cases of violence or harrassment
• Forms of violence experienced by farmers and activists were molestation, killing, shooting, kidnapping, arrest, house firing/ devastation, direct terror, intimidation, disappearances or rape (KPA, 2002). A total of 5,200 victims in 26 provinces were reported.• About 66 people in 21 cases were reported victims of violence in agrarian disputes.• Anothersource,IHCS(2010)reported that between 2006 to 2010 there have been 43 cases of intimidation terror, arrest, molestation, beating, fight with officers, demonstration, kidnapping, shooting and killing. But 13 out of 43 do not mention the
number of victims, saying only that they were indigenous or rural people. The other 30 cases mentioned the numbers of HH, people or land areas. • Otherdata fromSPI (2010) show the number of people who experienced agrarian conflict with those in control of resources. There were 166 in 2007, 312 in 2008, and 84 victims in 2009.
Conclusion
Basedontheindicators,CSOshaveconcludedthat agrarian reform in Indonesia after the 1960s has not progressed as reflected in documentation and studies done by NGOs. What was stated by President Yudhoyono in 2007 about land redistribution for poor farmers has not yet been realized. Presently, no regulation has been produced as a legal basis for agrarian program implementation in Indonesia. On the other hand, poverty has increased in 2007 by 16% to 17%, and military involvements in land conflicts have escalated from 2007 to 2010.
Land reclaiming actions, as a response to government inaction in resolving problems of increasing landlessness and poverty, are current modes of access to land. Land redistribution became secondary to asset legalization. The performance indicators of BPN programs overall, are based on numbers of land certificates produced by local offices that were unable to provide additional factual information about land/agrarian problems.
Government:
• Prepare the system, regulations andinstitutions needed to implement a genuine agrarian reform.
• Improvethedatabaseoflandavailablefor redistribution.
• Set criteria and identify thebeneficiaries.
• Openpoliticalopportunitiesandsetabase for political action to consolidate pro-reform movement, and form a state-society coalition for genuine agrarian reform.
Donors:
• InvolveandconsultwithNGOs/CSOswho have been advocating agrarian reform, instead of developing plans solely with government agencies. Lessons learned from market-led land reform show that it has not successfully altered existing inequality structures.
CSOs:
• Shareandconsolidatedatawithurgencyin order to strengthen the database that can be used as a tool to strengthen the conduct of agrarian reform.
• Develop closer cooperation withresearch/academic institutions (both state and private institution) especially those which have focus on agrarian reform issues.
References
Babbie,Earl.R.TheBasicsofSocialResearch.2007 Trade paperback, Wadsworth Publishing Company English 4th ed.
Bachriadi, D. 2004. “Konstelasi Upaya-upaya untuk Mengubah UUPA 1960”, bahan presentasi di InstituteofGlobalJustice(IGJ),September2004
ANGOC
Bachriadi,D.&G.Wiradi.2011.SixDecadesof Inequality. Land Tenure Problems in Indonesia. Bina Desa, KPA, ARC. Jakarta
BPS.SensusPertanian1963dalamStatistikIndonesia. StatisticalPocketbookofIndonesia1968dan1969. 1971: Jakarta.
-------.SensusPertanian1983:PenggunaanTanah Pertanian dan Kedudukan Petani. Buku 2: Jakarta
-------.SensusPertanian1993.StatistikPotensiDesa 1993. CV Nasional Jaya
ErizalJamal,Syahyuti,danAtenM.Hurun.2002. Reforma Agraria dan Masa Depan Pertanian. Jurnal Litbang Pertanian. Bogor. Pusat Penelitian danPengembanganSosialEkonomiPertanian
Fauzi, Noer. 2005, memahami Gerakan-gerakan Rakyat DuniaKetiga.Yogyakarta,INSISTPress, Forest Watch Indonesia. Data Table Korban 19 Provinsi (tidak dipublikasikan)
Gunawan. Inisiatif Pemantauan Land Reform. IndonesianHumanRightsCommitteeforSocial Justice(IHCS)
Gunawan (2011) Inisiatif Pemantauan Land Reform. IndonesianHumanRightsCommitteeforSocial Justice(IHCS)
Kantor Berita Antara. Indonesia Akan Tiru Program Penelitian Pertanian Brasil diakses dalam http://www.antaranews.com/view/ ?=1227176071&c=EKB&s=4September2010
Kasim,I.danE.Suhendar,1997.”Kebijakan Pertanahan New Order Mengabaikan Keadilan Demi Pertumbuhan Ekonomi”, dalam Fauzi, N. (Peny.), Tanah dan Pembangunan. Jakarta: SinarHarapan.
Koalisi Rakyat untuk Keadilan Perikanan (KIARA). 2010, Mempertegs Kelautan Kita
Konsorsium Pembaruan Agraria, 2000. Data Jumlah Kasus. Tidak dipublikasi.
-----------------------.DataJumlahKasusSengketa/ Konflik Agraria dan Jenis Kekerasan terhadap Petani yang terjadi pada Kasus yang Bersangkutan diEraReformEra(PascaSoeharto)di20Propinsi di Indonesia.(2010) Tidak dipublikasi.
-----------------------.. 2010. Data Jumlah Korban yang bisa teridentifikasi dari Tindak Kekerasan terhadap Petani dan Aktivis Pembela Petani yang Berjuang Merebut dan Mempertahankan Kembali Tanah yang terjadi pada Era Reform Era (Pasca Soeharto)di20PropinsidiIndonesia.(2010) Tidak dipublikasi.
Litbang Deptan. Apakah Mungkin Penelitian Pertanian “To be a World Class”? diakses dalam http://www. litbang.deptan.go.id/berita/one/762/4September 2010
Konsorsium Pembaruan Agraria. 2009. Tabulasi Kasus Sengketa2009.
Konsorsium Pembaruan Agraria. 2007. Data Konflik Agraria 2002-2007.
Konsorsium Pembaruan Agraria. 2002. Jumlah Sengketa.
Konsorsium Pembaruan Agraria. 2000. Jumlah Kasus.
Konsorsium Pembaruan Agraria. DB Konflik Agraria.
SawitWatch.2010.LuasanSawit.Tidakdipublikasi.
SerikatPetaniIndonesiadanIndonesianHuman RightsCommitteeforSocialJustice.2008. Laporan Pelanggaran Hak Asasi Petani Year 2007. Jakarta
SerikatPetaniIndonesia.2010.CatatanPembangunan Pertanian dan Pedesaan Korporatisasi Pertanian telah Meminggirkan Pertanian Rakyat. Jakarta: DewanPengurusPusatSerikatPetaniIndonesia
Soemardjono,Maria.2002,KebijakanPertanahan Antara Regulasi dan Implementasi, Jakarta, Kompas Media Nusantara.
----------------- --------, 2001, tanah dari rakyat, Oleh Rakyat dan Untuk rakyat, Jakarta, Media Transparansi Indonesia Cyber.
SolidaritasPerempuan.2010.Laporanperkembangan investigasi perkebunan kelapa sawit Di desa laronanga, labungga dan wanggudu raya kecamatan asera Kabupaten konawe utara - sulawesitenggaraSolidaritasPerempuanKendari 2010
SolidaritasPerempuan.2010.Laporaninvestigasi Solidaritasperempuankomunitaspalembanng Year 2010
SolidaritasPerempuan.2007.Laporansementara Konflik Tanah dan Posisi Perempuan Di Alastlogo Kecamatan Lekok,Kabupaten, Pasuruan, Jawa timur.24 Juni 2007
SuhendarE,danYohanaBudiWinarni,1997Petani dan Konflik Agraria, Bandung, AKATIGA Sumardjono,Maria.NurhasanIsmail.Ernan Rustiadi dan Abdullah Aman Damai. 2009. Kajian Kritis Pasal 33 Undang-undang no. 26 Year 2007 Tentang Penataan Ruang (Final Report). EnvironmentalSectorProgram(ESP)2 Kementerian Negara Lingkungan Hidup & DANIDA: Jakarta.
Winoto, Joyo. 2007. Reforma Agraria dan Keadilan Sosial.OrasiKepalaBadanPertanahanNasional RI,tanggal1Septermber2007padadiesnatalis ke 44 Institute Pertanian Bogor. Dapat diakses di: http://images.agrarianrc.multiply. multiplycontent.com/attachment/0/ RyavPgoKCsYAACTrEZkl/Joyo%20Winoto%20- %20RA%20dan%20Keadilan%20Sosial. pdf?nmid=64861044.
-----------------------. 2008, Tanah Untuk Rakyat, Risalah Tentang Reforma Agraria sebagai Agenda Bangsa, tanpa penerbit.
Wiradi,Gunawan.1999,ReformaAgrariaSebagai Basis Pembangunan Dalam Era Otonomi Daerah, Makalah pada seminar nasional persiapan KnuPkA, Jakarta.
----------------------- 2002, “Tantangan Gerakan PembaruanAgraria‘Post’TAP-MPRNo.IX/2001”, JurnalAnalisisSosial7(3):1-10,Bandung:Yayasan Akatiga.
-----------------------2009,RanahStudiAgraria. Penguasaan Tanah dan Hubungan Agraris, Yogyakarta:SekolahTinggiPertanahanNegara (STPN).
www.bps.go.id
www.deptan.go.id
www.litbang.deptan.go.id
www.okezone.com
ANGOC
Summary
fter five decades of pursuing land reform, Nepal is in the process of revising its legal framework governing
land rights. Forming the basis of this framework are principles articulated in key documents such as the 2007 Interim Constitution, the 2006 Comprehensive Peace Agreement, the 2007 Common Minimum Program of the National Consensus Government, and the Ministry of Land Reform and Management’s Three Year Interim Plan (2007/08–2009/10).
Ascivilsocietyorganizations(CSOs)continueto implement various land rights programs, a new initiative has been the development of CSO land reformmonitoring indicators.TheCommunity Self-Reliance Centre (CSRC)spearheads the effort in coordination with the Asian NGO Coalition for Agrarian Reform and Rural Development (ANGOC) and Land Watch Asia. In the course of developing the indicators, CSRC has analyzed the status,scope, issues, and challenges relevant to the monitoring indicators for land reform.
The monitoring indicators have been developed according to inputs, outputs, outcomes, impact, and processes involved. The latter
Nepal
List of Acronyms used
ADB Asian Development BankANGOC Asian NGO Coalition for Agrarian Reform and Rural DevelopmentCBS CentralBureauofStatisticsCPN Communist Party of NepalCSOs civilsocietyorganizationsCSRC CommunitySelf-RelianceCentreDanida Danish International Development AssistanceHUGOU Human Rights and Good Governance Advisory UnitDFID Department for International DevelopmentFAO Food and Agriculture Organization of the United Nations GON Government of NepalIDP internally displaced person IFAD International Fund for Agricultural DevelopmentNLRF National Land Rights ForumNGO non-government organizationMLRM Ministry of Land Reform and ManagementSAE SmallAreaEstimationUNDP United Nations Development Programme USAID UnitedStatesAgencyfor International DevelopmentVDCs village development committeesWB World BankWFP World Food Programme
An abridged version of the paper, “Land Reform Monitoring Indicators, Nepal”, prepared by the CommunitySelf-RelianceCentre(CSRC)
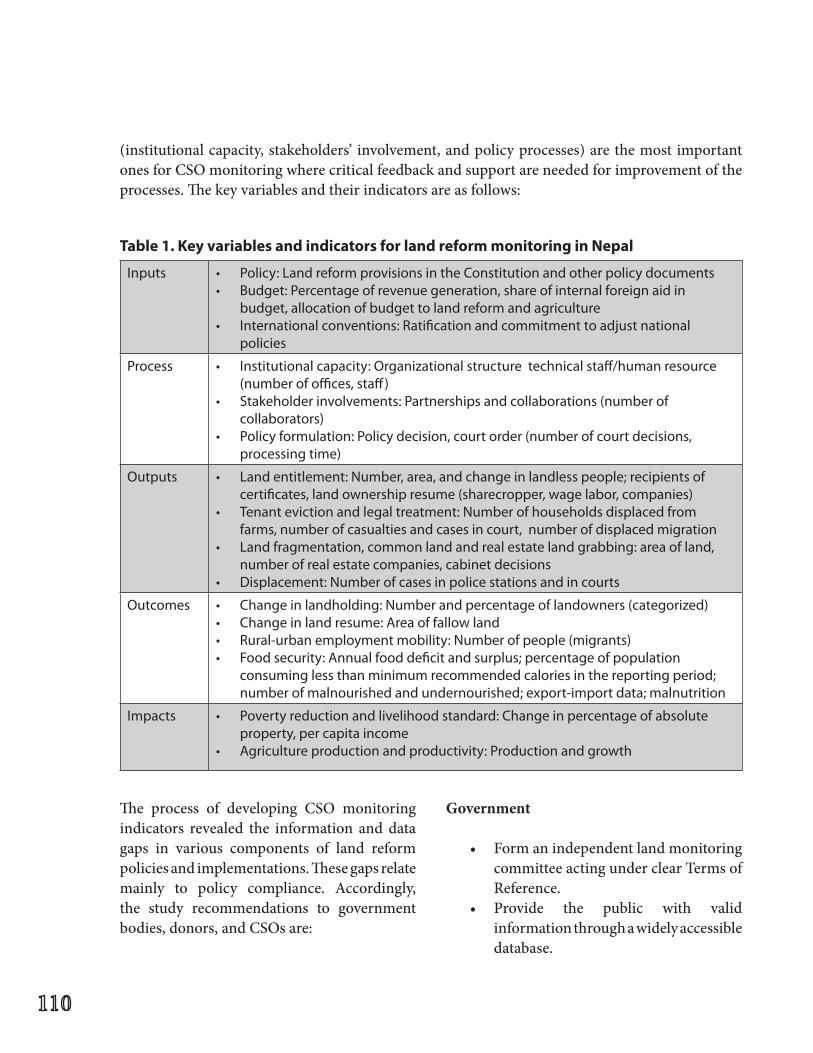
(institutional capacity, stakeholders’ involvement, and policy processes) are the most important onesforCSOmonitoringwherecriticalfeedbackandsupportareneededforimprovementoftheprocesses. The key variables and their indicators are as follows:
The process of developing CSO monitoringindicators revealed the information and data gaps in various components of land reform policies and implementations. These gaps relate mainly to policy compliance. Accordingly, the study recommendations to government bodies,donors,andCSOsare:
Government
• Formanindependentlandmonitoringcommittee acting under clear Terms of Reference.
• Provide the public with validinformation through a widely accessible database.
Inputs • Policy:LandreformprovisionsintheConstitutionandotherpolicydocuments• Budget:Percentageofrevenuegeneration,shareofinternalforeignaidin
budget, allocation of budget to land reform and agriculture• Internationalconventions:Ratificationandcommitmenttoadjustnational
policies
Process • Institutionalcapacity:Organizationalstructuretechnicalstaff/humanresource(number of offices, staff)
• Stakeholderinvolvements:Partnershipsandcollaborations(numberofcollaborators)
• Policyformulation:Policydecision,courtorder(numberofcourtdecisions,processing time)
Outputs • Landentitlement:Number,area,andchangeinlandlesspeople;recipientsofcertificates, land ownership resume (sharecropper, wage labor, companies)
• Tenantevictionandlegaltreatment:Numberofhouseholdsdisplacedfromfarms, number of casualties and cases in court, number of displaced migration
• Landfragmentation,commonlandand real estate land grabbing: area of land, number of real estate companies, cabinet decisions
• Displacement:Numberofcasesinpolicestationsandincourts
Outcomes • Changeinlandholding:Numberandpercentageoflandowners(categorized)• Changeinlandresume:Areaoffallowland• Rural-urbanemploymentmobility:Numberofpeople(migrants)• Foodsecurity:Annualfooddeficitandsurplus;percentageofpopulation
consuming less than minimum recommended calories in the reporting period; number of malnourished and undernourished; export-import data; malnutrition
Impacts • Povertyreductionandlivelihoodstandard:Changeinpercentageofabsoluteproperty, per capita income
• Agricultureproductionandproductivity:Productionandgrowth
Table1.KeyvariablesandindicatorsforlandreformmonitoringinNepal
ANGOC
• Ensure that the land reform policyframework includes all the stakeholders who can assist with the periodic review of indicators, collection, and release of recommendations.
• Ensure that the Land ReformCommission is an inclusive body, involving the landless sector.
• Makeeffectiveuseoftheinvestmentofbilateral agencies.
CSOs
• Form a common platform of allCSOsworking on land reform issues,particularly on the development of a uniform monitoring mechanism amongCSOs.
• Generateanduserelevantinformationand data that will inform the land reform advocacy campaign.
• Coordinate with other stakeholdersfor policy development and implementation.
Donors
• Provide funding support to thedevelopment of the land reform monitoring system, CSO capacitybuilding, and further research activities.
Context: Status of land reform
Land ownership in Nepal in the past five decades (1961-2011) shows the following disturbing trends:
• The number of landholdings hasmore than doubled, mainly because of population growth and continuous
dependence of people on land-based livelihoods.
• The average landholding has beendeclining continuously, reaching 0.8 ha (per family) in 2001, and declining furtherto0.6hain2009(CBS,2009).
• Cultivated land area increased verymarginally, especially in the last two decades. Only 21% of total area of the country is cultivable.
• Land fragmentation remains a majorproblem. There are about 3.3 parcels in each landholding with average parcel size of 0.24 ha in 2001. Such a smallsize of a parcel is also not suitable for the use of modern inputs, especially in building infrastructure like irrigation facilities.
The country’s low land productivity is the result of Nepal’s feudal agrarian system and its inherent exploitative relationships. In recent times, the issue of agrarian reform has become more contentious in the absence of opportunities to expand land for cultivation and to divide landholdings among the inheritors. Agrarian reform is also imperative to address the widespread poverty of marginal farmers and landless people whose access to and control of a productive resource are hindered by highly unequal land distribution.
Inequality in land distribution in terms of size and quality of the landholdings has always been correlated highly with economic status. As measured by the Gini coefficient, this inequalitywas0.544in2001(CBS,2006).About47% of land-owning households have claim to only 15% of the total agricultural land with an average size of less than 0.5 ha, while the top 5% occupy more than 37% of land. Marginal farmers and small cultivators own less than 1
acre or 1-2 acres (0.4 to 0.8 ha) only. About 29% households do not own any land (UNDP, 2004). The most impoverished groups are indigenous peoples (mostly marginal farmers) and Dalits (mostly landless, 44% living in Terai, 22% in the Hill region). The gender dimension of land distribution is even more critical: men own 92% of the landholdings (Adhikari, 2008).
The Land Act (effective since 1964) put a ceiling on lands an individual could own, provided for ways by which a tenant could have land under his name, and fixed the rent on land. The law has seen six amendments, indicative of major issues: the legislation contained significant loopholes; the land ceilings were set relatively high; and implementation of the ceiling provisions was lackluster in most areas. The Fourth and the Fifth amendments (done in 2001) were the major revisions. Only recently has a court ruled for the full implementation of theLandAct.Subsequently, theGovernmentof Nepal established a land reform commission to produce a report. This is to be made public eventually. But in the interim, doubts about the implementation of the commission’s recommendations heighten.
As for the national budget share and allocation for the land reform activities, only less than 1% of national budget is allocated to the Ministry of Land Reform and Management (MLRM). More than 70% of budget goes to human resource and administrative costs (Red book, Ministry of Finance, 2011).
Conceptualframeworkandindicators
CSRChasidentifiedanumberofkeyvariableswith corresponding indicators and verifiers, as well as identified data gaps that should be
addressed before monitoring can be done effectively.
A. Input indicators
1. Legal framework
Nepal is in the process of revising its legal framework governing land rights, with the expected adoption of a new framework in 2011. However, this has failed to materialize (as of early 2012). The new legal framework will be governed by principles set forth in the 2007 Interim Constitution, the 2006 Comprehensive Peace Agreement, the 2007 Common Minimum Program of the National Consensus Government, and the Ministry of Land Reform and Management’s Three Year Interim Plan (2007/08–2009/10) (GON Interim Constitution 2007a; GON and CPN Peace Agreement 2006; GON Common Program 2008; GON Interim Plan 2007b).
The Interim Constitution of Nepal, which became effective in 2007, grants every citizen the right to acquire, own, sell, and otherwise dispose of property. The Interim Constitution calls for the elimination of feudalism and prohibits forced labor and the exploitation of people on the basis of custom, tradition, or usage (GON Interim Constitution 2007a).
The process of developing the new legal framework from the current one takes into consideration a history of legal enactments. There have been 59 acts and 23 regulations that have been constituted for the purpose of land reform.
ANGOC
2. Budget share and allocation
An insignificant less-than-1% of national budget share and allocation for the land reform activities is a major hindrance to effective implementation. More than 70% of the budget goes to human resource and administrative costs (Red Book, Ministry of Finance, 2011).
3. International convention/commitment
There is no right to land explicit in the international legal framework. Land rights have been considered in several international principles and interpretive documents. They are invoked in a number of key areas but not defined wholly, suggesting that further consideration by the international community is necessary (Wickeri and Kalhan, 2010).
B. Process indicators
There are three process indicators that are the most critical for feedback and program implementation improvement, as analyzed byCSRC: institutional capacity, stakeholders’involvement and policy formulation process.
1. Institutional Capacity
The Ministry of Land Reform and Management (MLRM) is the main government agency responsible for land reform activities. Its Minister, State Minister and Secretary headdifferent divisions responsible for general administration, planning and coordination, land reform, land management training, land information, and a special program for freed bonded labor, haliya and haruwa/charuwa. However, its human resources and technical capacities are too limited to handle land reform activities.
2. Stakeholders’ involvement
The stakeholders in the land rights movement are peasant organizations, donor coalition partners, local CSOs, and internationalorganizations involved in land issues. Leading the movement are the National Land Rights Forum (NLRM), an umbrella organization of landless peasants supported financially by coalition partners; ActionAid Nepal, Care Nepal, Oxfam GB, Lutheran World Federation, Danida HUGOU, CCO/CEDA. The NLRF is organized into district chapters where local CSOs (like CSDR Banke, SWANDang, JanaChetana Dalit Sangam, Saptari, AbhiyanNepal Sunsari, CDECF, Sindhupalchok, RDSSindhupalchok) facilitate and support thecapacitybuildingactivities.Severaldonorfieldprojects are supported by IFAD, FAO, DFID, USAID,ADB,andWB.
3. Policy formulation process
Policy formulation is confined within the Ministry of Land Reform and Management. Its Three-Year Interim Plan (2007/08 to 2009/10) has a multi-focus on, among others: (i) land allocations for the poorest; (ii) reorganization of land administration, development of a land information system and digitization of the cadastre/land records; (iii) land registration for women and marginalized groups at half-price; (iv) development of a legal framework that includes leasing and cooperative farming; (v) review of the role and scope of the Guthi (Trust) Corporation and arrangements for administering Guthi land through revenue offices; (vi) capacity building for land officials; and (vii) removal of the backlog of pending land dispute cases (Alden Wiley et al. 2008).
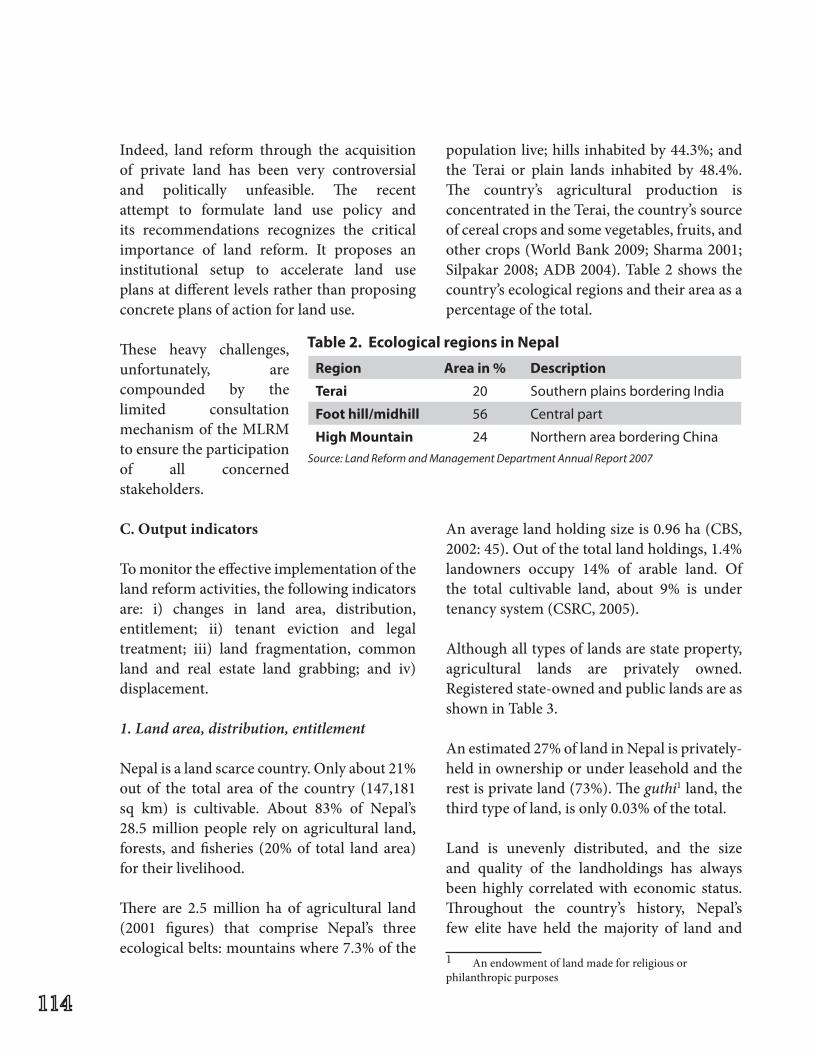
Indeed, land reform through the acquisition of private land has been very controversial and politically unfeasible. The recent attempt to formulate land use policy and its recommendations recognizes the critical importance of land reform. It proposes an institutional setup to accelerate land use plans at different levels rather than proposing concrete plans of action for land use.
These heavy challenges, unfortunately, are compounded by the limited consultation mechanism of the MLRM to ensure the participation of all concerned stakeholders.
C. Output indicators
To monitor the effective implementation of the land reform activities, the following indicators are: i) changes in land area, distribution, entitlement; ii) tenant eviction and legal treatment; iii) land fragmentation, common land and real estate land grabbing; and iv) displacement.
1. Land area, distribution, entitlement
Nepal is a land scarce country. Only about 21% out of the total area of the country (147,181 sq km) is cultivable. About 83% of Nepal’s 28.5 million people rely on agricultural land, forests, and fisheries (20% of total land area) for their livelihood.
There are 2.5 million ha of agricultural land (2001 figures) that comprise Nepal’s three ecological belts: mountains where 7.3% of the
population live; hills inhabited by 44.3%; and the Terai or plain lands inhabited by 48.4%. The country’s agricultural production is concentrated in the Terai, the country’s source of cereal crops and some vegetables, fruits, and othercrops(WorldBank2009;Sharma2001;Silpakar2008;ADB2004).Table2showsthecountry’s ecological regions and their area as a percentage of the total.
Anaveragelandholdingsizeis0.96ha(CBS,2002: 45). Out of the total land holdings, 1.4% landowners occupy 14% of arable land. Of the total cultivable land, about 9% is under tenancysystem(CSRC,2005).
Although all types of lands are state property, agricultural lands are privately owned. Registered state-owned and public lands are as shown in Table 3.
An estimated 27% of land in Nepal is privately-held in ownership or under leasehold and the rest is private land (73%). The guthi1 land, the third type of land, is only 0.03% of the total.
Land is unevenly distributed, and the size and quality of the landholdings has always been highly correlated with economic status. Throughout the country’s history, Nepal’s few elite have held the majority of land and
1 An endowment of land made for religious or philanthropic purposes
Region Area in % Description
Terai 20 SouthernplainsborderingIndia
Foot hill/midhill 56 Central part
High Mountain 24 Northern area bordering China Source: Land Reform and Management Department Annual Report 2007
Table2.EcologicalregionsinNepal
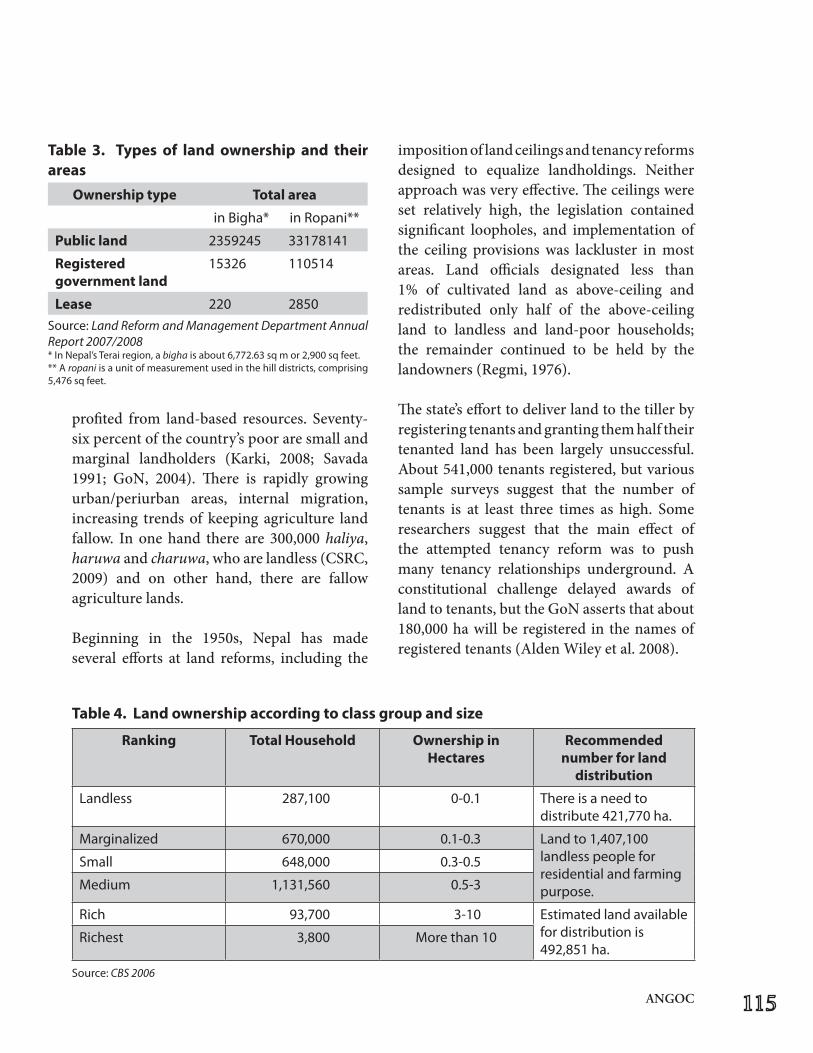
ANGOC
profited from land-based resources. Seventy-six percent of the country’s poor are small and marginal landholders (Karki, 2008; Savada1991; GoN, 2004). There is rapidly growing urban/periurban areas, internal migration, increasing trends of keeping agriculture land fallow. In one hand there are 300,000 haliya, haruwa and charuwa,whoarelandless(CSRC,2009) and on other hand, there are fallow agriculture lands.
Beginning in the 1950s, Nepal has made several efforts at land reforms, including the
imposition of land ceilings and tenancy reforms designed to equalize landholdings. Neither approach was very effective. The ceilings were set relatively high, the legislation contained significant loopholes, and implementation of the ceiling provisions was lackluster in most areas. Land officials designated less than 1% of cultivated land as above-ceiling and redistributed only half of the above-ceiling land to landless and land-poor households; the remainder continued to be held by the landowners (Regmi, 1976).
The state’s effort to deliver land to the tiller by registering tenants and granting them half their tenanted land has been largely unsuccessful. About 541,000 tenants registered, but various sample surveys suggest that the number of tenants is at least three times as high. Someresearchers suggest that the main effect of the attempted tenancy reform was to push many tenancy relationships underground. A constitutional challenge delayed awards of land to tenants, but the GoN asserts that about 180,000 ha will be registered in the names of registered tenants (Alden Wiley et al. 2008).
Ownershiptype Totalarea
in Bigha* in Ropani**
Publicland 2359245 33178141
Registeredgovernment land
15326 110514
Lease 220 2850
Source: Land Reform and Management Department Annual Report 2007/2008* In Nepal’s Terai region, a bighaisabout6,772.63sqmor2,900sqfeet.** A ropani is a unit of measurement used in the hill districts, comprising 5,476sqfeet.
Table 3. Types of land ownership and theirareas
Ranking TotalHousehold OwnershipinHectares
Recommendednumber for land
distribution
Landless 287,100 0-0.1 There is a need to distribute421,770ha.
Marginalized 670,000 0.1-0.3 Landto1,407,100landless people for residential and farming purpose.
Small 648,000 0.3-0.5
Medium 1,131,560 0.5-3
Rich 93,700 3-10 Estimated land available for distribution is 492,851ha.
Richest 3,800 More than 10
Source: CBS 2006
Table4.Landownershipaccordingtoclassgroupandsize
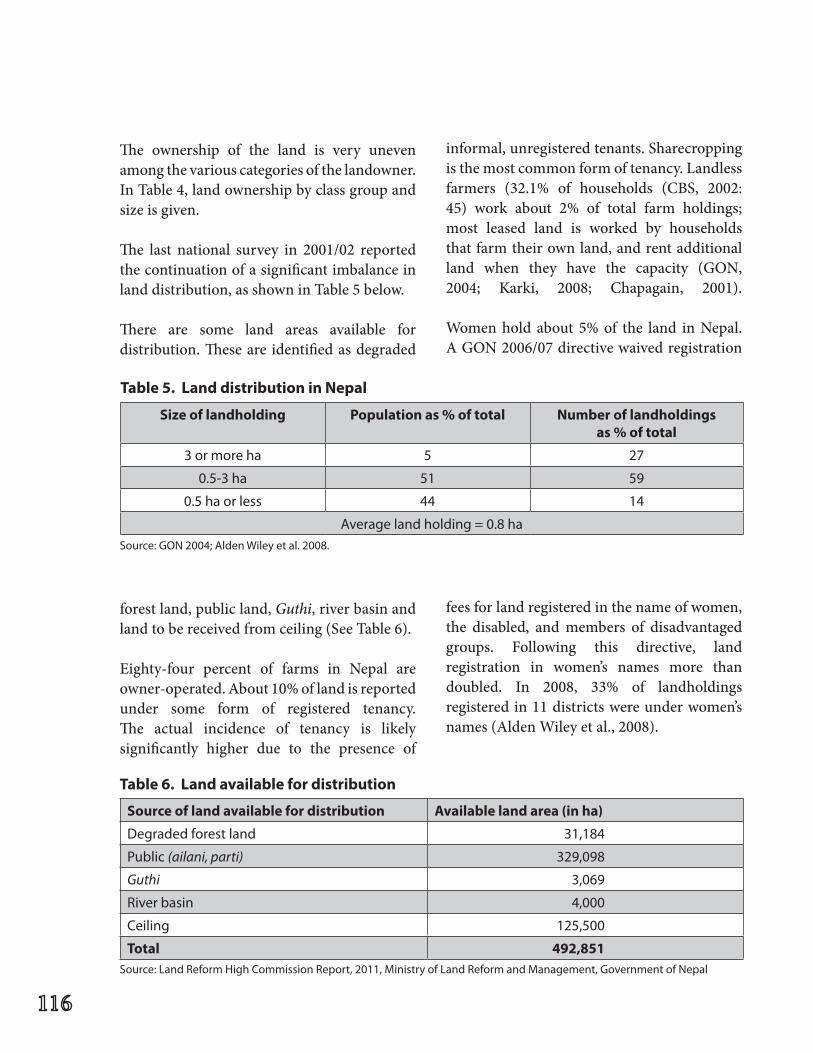
The ownership of the land is very uneven among the various categories of the landowner. In Table 4, land ownership by class group and size is given.
The last national survey in 2001/02 reported the continuation of a significant imbalance in land distribution, as shown in Table 5 below.
There are some land areas available for distribution. These are identified as degraded
forest land, public land, Guthi, river basin and landtobereceivedfromceiling(SeeTable6).
Eighty-four percent of farms in Nepal are owner-operated. About 10% of land is reported under some form of registered tenancy. The actual incidence of tenancy is likely significantly higher due to the presence of
informal,unregisteredtenants.Sharecroppingis the most common form of tenancy. Landless farmers (32.1% of households (CBS, 2002:45) work about 2% of total farm holdings; most leased land is worked by households that farm their own land, and rent additional land when they have the capacity (GON, 2004; Karki, 2008; Chapagain, 2001).
Women hold about 5% of the land in Nepal. A GON 2006/07 directive waived registration
fees for land registered in the name of women, the disabled, and members of disadvantaged groups. Following this directive, land registration in women’s names more than doubled. In 2008, 33% of landholdings registered in 11 districts were under women’s names (Alden Wiley et al., 2008).
Size of landholding Populationas%oftotal Number of landholdings as % of total
3 or more ha 5 27
0.5-3 ha 51 59
0.5 ha or less 44 14
Averagelandholding=0.8haSource:GON2004;AldenWileyetal.2008.
Table5.LanddistributioninNepal
Source of land available for distribution Availablelandarea(inha)
Degraded forest land 31,184
Public (ailani, parti) 329,098
Guthi 3,069
River basin 4,000
Ceiling 125,500
Total 492,851Source:LandReformHighCommissionReport,2011,MinistryofLandReformandManagement,GovernmentofNepal
Table6.Landavailablefordistribution
ANGOC
2. Tenant eviction and legal treatment
Numerous cases of tenant eviction and land disputes are not found in official records and are not addressed through a mechanism providinglegaltreatmenttothevictims.CSRChas also begun collecting data on this.
Among the categories of land disputes identified were:
• improper demarcation of parcelboundary on the ground;
• errorsintracecopyoforiginalcadastralmaps and wear and tear of documents;
• errors in filemaps prepared in largerscale from original maps;
• displacementinthelocationoffeatures,natural as well as cultural, with respect to existing maps.
Nepal’s Three-Year Interim Plan noted that there was a backlog of 103,000 land cases awaiting resolution (ADB 2007; Alden Wiley et al., 2008).
Adjudication of rights within the formal court system (district courts, appellate courts, and a Supreme Court) requires time, knowledgeof the system, and financial resources. The poor and marginalized tend to pursue claims in other more accessible forums, including District Revenue Department offices and, in isolated cases, “People’s Courts” (established by the Maoists). The Local Self GovernanceAct, 1999, gave the village development committees (VDCs) the power to handle 13 different types of disputes, including some land-related matters such as boundary issues and encroachment. The extent to which VDC courts are operating is unknown (Alden Wiley et al., 2008).
3. Land fragmentation, common land, and real estate land grabbing
There is massive land fragmentation caused by prevailing land inheritance practices and private land use for housing, and more recently, land plotting in the urban and semi-urban areas. Recently, Nepal’s land-sale market has been active in both rural and urban areas, but the bulk of sales transactions are in urban land. Land developers are often selling land without verification of boundaries, instead relying on inaccurate documents, including maps. The unregulated practices are leading to sprawling, unplanned urban development, land disputes, and insecure tenure (Acharya, 2009).
There is no national database on the land grabbing and real estate activities that affect access to public land, agricultural production, andproductivity.Someanecdotalcasessuggestthat land grabbing occurs at a massive scale.
The leasing of land for agricultural purpose is another phenomenon. In the national estimate, 30% of the rural population rents agricultural land. Almost all rural land is rented under sharecropping agreements rather than for monetary payments (GON, 2004; Alden Wiley et al., 2008).
4. Displacement
Floods, landslides, and other natural hazards displace large farming populations from their farm lands. Most of these are poor indigenous people and Dalits who are forced to reside in marginal lands.
More than 70,000 people were displaced during the 10-year conflict (1996–2006)
between the Government of Nepal (GON) and the Unified Communist Party of Nepal (Maoists). Internally displaced persons (IDPs) — children and women — are particularly vulnerable to trafficking, sexual exploitation, and child labor (IDMC, 2010).The thousands of IDPs unwilling or unable to return to their homes joined the migration of rural residents in search of employment in urban areas, causing rapid urbanization and the “mushrooming” of informal settlements hurriedly built on government and public land in urban and peri-urban areas.
In the 1990s, approximately 100,000 Bhutanese of Nepali origin either fled or were forcibly expelled from Bhutan. The refugees have, for close to twenty years, lived in seven camps located in southeastern Nepal. The camps are entirely dependent on the support of the international community and their long-term presence has caused tensions with host communities because natural resources are overexploited (Laenkholm, 2007; UNHCR, 2009).
D. Outcome indicators
Five indicators are taken into account: • changeinlandholding;• landregime;• rural-urbanmobility;• foodsecurity;and• changeincroppingpattern
There are, however, no national data to establish the changing trends.
1. Change in landholding
There is significant change in the landholding in the 1980s because of the internal migration, as previously mentioned.
2. Change in land regime - (no data)
3. Rural-urban employment mobility
There is huge rural-urban mobility across the country. In search of employment opportunities, better education, and health facilities, many rural families leave their villages fortowncenters.Similarly,outboundmigrantsin search of employment opportunities are growing in number.
4. Food security
The recent increase (2005-2008) in international food prices and the diversion of resources to produce non-food crops has increased the concern on food security. The present food crisis is stalking the small-scale farms and rural areas of the world, where 70% of the world’s hungry live and work. Even though prices have gone down compared to 2008, the prices of cereals are still more than 63% of what they were in 2005.
Higher food prices are caused by several factors: low agricultural productivity in the world; high population growth rate in most food-insecure countries; problems with water availability and land tenure uncertainty; more frequent occurences of floods and drought; and low investment in agriculture, which remained about 4% of the total investment in most developing countries.
ANGOC
Another phenomenon associated with rising food prices and decline in food production is the global hunt for land in developing countries, or “land grab” by the Gulf countries, China and Japan, for example. The Food and Agriculture Organization (FAO) estimates that “land grabbed” areas could be about 74 million ha. In most cases of “land grab”, productivity has increased almost four times, but the local population is deprived of their livelihood opportunities. In the future, this is going to be a major food security issue.
5. Arrangement for cropping - (no data)
Monitoring the various arrangements for cropping (sharecropping, leasehold, family farm, and company farm) would provide good indicators of outcomes of land reform at the local level. However there are limited national data on the changes in the land ownership. Various case studies and local evidence suggest that there are decreasing trends of sharecropping due to urban and foreign migration and increased leasehold for commercial farming.
E.Impactindicators
Poverty reduction and livelihood standard; and agricultural production and productivity are the two impact indicators of land reform. However, there has not been much improvement in this component.
1. Poverty reduction and livelihood standard
The study of Small Area Estimation (SAE)carriedoutbyCBS,WFPandtheWorldBankindicates that 37% of the rural population is living below the poverty line of 7,696 Rs (or $ 101) per year, compared to 13% in urban areas,
and 31.9% in overall areas. The estimated 2010 poverty rate in Nepal was 25%, and most of it was considered to be reduced because of increased access to remittances (National Planning Commission, 2004).
Food insecurity in the surplus areas of the Terai and Lower Hills is foremost an issue of food access. Although the incidence of poverty in these areas is generally lower than in the Hills and Mountains of the Far and Mid-West, the concentration of poverty (as measured by the number of poor people per square kilometer) is very high.
Due to high poverty levels, people have limited purchasing power to buy food in the markets. Vulnerable communities such as Dalits, adivasis, Janajatis2 and kamaiyas3 often struggle to access sufficient food. The result is that very high wasting levels above emergency levels characterize the Terai. Unfortunately, no disaggregated data are currently available that provide insight about the food security situation of marginalized communities in the Terai. Other important factors contributing to food insecurity and malnutrition include limited nutritional knowledge, inappropriate hygiene and caring practices, and the gender division within the household, which places women in a disadvantaged position.
The rural poverty rate is almost twice as high as the urban poverty rate, and ranges from 28% in the eastern hill/mountain region to 72% in mid-western and far western hill/mountain regions.
Within the rural population, poverty rates are highest among landless and near-landless 2 Ethnic and indigenous nationalities in Nepal3 A bonded labor system widely prevalent in the five district in the Mid and Far Western development region of Nepal
people of different caste and ethnic groups: 58% among agriculture wage laborers and 50% among agriculture dependent smallholders.
2. Agriculture production and productivity
The primary impact of land reform is increased agricultural production and productivity. Although it is not the only factor to improve production and productivity, ownership and access to productive land resource is a precondition.
The trends in production and productivity of land resources have not been satisfactory in the last two decades. The trends in crop production, total agricultural production and the share of the agriculture sector in the budget are some indicative examples of production and productivity.
Data Gaps
There are various data and information gaps in the various components of land reform. There is an urgent need to update the data/information so that the policies and practices can be monitored and the gaps in these areas tracked.
ConclusionsandRecommendations
The development of CSO monitoringindicators identified the information and data gaps in various components of land reform policies and implementations. Mainly, these gaps relate to policy compliance. Accordingly, the study recommendations to government bodies,donorsandCSOsare:
Government
• Form independent land monitoringcommittee to act with a clear Terms of Reference (TOR).
• Ensure the access and validity ofinformation thru a publicly accessible database.
• Ensure that the land reform policyframework includes all the stakeholders who can assist with the periodic review of indicators, collection of recommendations and release of the same.
• Ensure that the Land ReformCommission is an inclusive body, involving the landless.
• Makeeffectiveuseoftheinvestmentofbilateral agencies.
CSOs
• Form a common platform of allCSOs working in land reform issues,particularly on the development of CSOsmonitoringmechanism.
• Generateanduserelevantinformationand data to inform land reform advocacy campaign.
• Coordinate with other stakeholdersfor policy development and implementation.
Donors
• Provide funding support to thedevelopment of the land reform monitoring system, CSO capacitybuilding, and further research activities.
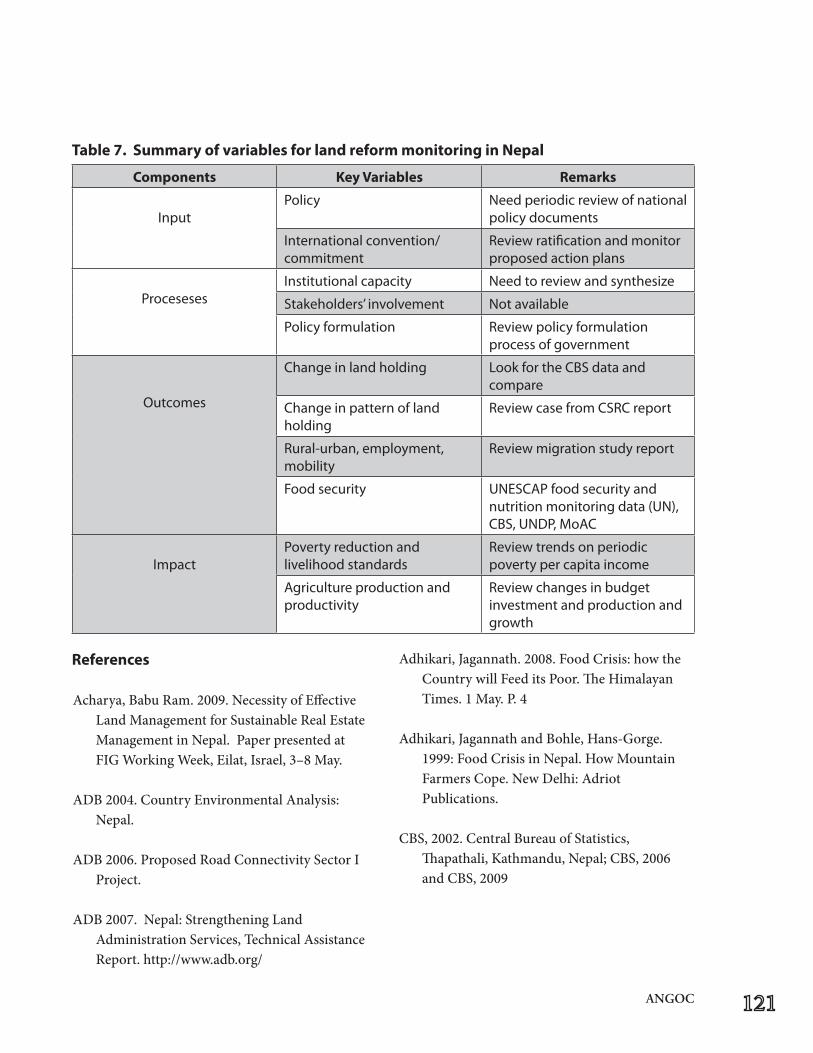
ANGOC
References
Acharya, Babu Ram. 2009. Necessity of Effective LandManagementforSustainableRealEstate Management in Nepal. Paper presented at FIG Working Week, Eilat, Israel, 3–8 May.
ADB 2004. Country Environmental Analysis: Nepal.
ADB2006.ProposedRoadConnectivitySectorI Project.
ADB2007.Nepal:StrengtheningLand AdministrationServices,TechnicalAssistance Report. http://www.adb.org/
Adhikari, Jagannath. 2008. Food Crisis: how the Country will Feed its Poor. The Himalayan Times. 1 May. P. 4
Adhikari, Jagannath and Bohle, Hans-Gorge. 1999: Food Crisis in Nepal. How Mountain Farmers Cope. New Delhi: Adriot Publications.
CBS,2002.CentralBureauofStatistics, Thapathali,Kathmandu,Nepal;CBS,2006 andCBS,2009
Components Key Variables Remarks
InputPolicy Need periodic review of national
policy documents
International convention/ commitment
Review ratification and monitor proposed action plans
ProcesesesInstitutional capacity Need to review and synthesize
Stakeholders’involvement Not available
Policy formulation Review policy formulation process of government
Outcomes
Change in land holding LookfortheCBSdataandcompare
Change in pattern of land holding
ReviewcasefromCSRCreport
Rural-urban, employment, mobility
Review migration study report
Food security UNESCAPfoodsecurityandnutrition monitoring data (UN), CBS,UNDP,MoAC
ImpactPoverty reduction and livelihood standards
Review trends on periodic poverty per capita income
Agriculture production and productivity
Review changes in budget investment and production and growth
Table7.SummaryofvariablesforlandreformmonitoringinNepal
Chapagain,DevendraP.2001.StatusReview and Dialogue: Land and Agriculture. In Nepal:NationalStrategyforSustainable Development, World Conservation Union (IUCN). http://www.nssd.net/pdf/nep03.pdf (accessed 24 June 2010).
CSRC,2005andCSRC,2009
Dr. Liz Alden Wily, Dr. Devendra Chapagain, and Dr.ShivaSharma(April2009),“LandReform in Nepal: Where is it coming from and where is it going?”
Elisabeth Wickeri and Anil Kalhan 210. Land Rights Issues in International Human Rights Law
FAO 1999. Aquastat: Nepal. http://www.fao.org/nr/water/aquastat/countries/nepal/index.stm.
GON 2004 National Planning Commission.
NationalSampleCensusofAgriculture (NSCA).http://www.cbs.gov.np/Agriculture/ Agriculture%20Census2001/Nepal/default. htm
GON 2004. National Planning Commission.
NationalSampleCensusofAgriculture(NSCA).‘ http://www.cbs.gov.
GON Interim Constitution 2007a. Interim Constitution of Nepal 2063. http:// www.worldstatesmen.org/Nepal_Interim_ Constitution2007
GON Interim Plan 2007b.Land Reform and Management. Three-Year Interim Plan. Kathmandu.
GON Peace Agreement 2006. Government of Nepal and Communist Party of Nepal. 2006. Comprehensive Peace Agreement. 21November. http://www. satp.org/satporgtp/countries/ nepal/document/papers/peaceagreement.htm
International Displacement Monitoring Centre (IDMC). 2010. Nepal: Failed implementation of IDP policy leaves many unassisted. http://www.internaldisplacement. org/8025708F004BE3B1/(httpInfoFiles)/ FFF5958EB13C0AF kantipur April, 14, 2010
Karkee, Madhab. 2008. Nepal Economic Growth Assessment, Agriculture. Report submitted toUSAID.http://pdf.usaid.gov/pdf_docs/ PNADN016.pdf
Laenkholm, Christer. 2007. Resettlement for Bhutanese Refugees. Forced Migration Review, 29:59
Mathema,AshnaS.1999.HousingandLand Markets in Kathmandu, Nepal. Department of UrbanStudiesandPlanning,MIT.
Mathema,AshnaS.1999.HousingandLand Markets in Kathmandu, Nepal. Department of UrbanStudiesandPlanning.
Parajuli, Bhubaneswari. 2007. Access to Land in Nepal: Low Income Housing Development. In ShelterfortheUrbanPoor Paudyal, Dev Raj. 2006. Pro-Poor Land ManagementSystem:AStudyConsidering Dynamic Aspect of Land Tenure in Nepal.
Pokharel,JibaRaj.2006.APolicyStudyonUrban Housing in Nepal. Policy Paper No. 26, Economic Policy Network.
ANGOC
Regmi, Mahesh. 1976. Landownership in Nepal. Berkeley: University of California Press.
Savada,AndreaMatles,ed.1991.Nepal:A CountryStudy.Washington:Government Printing Office for Library of Congress. http:// countrystudies.us/nepal.Sharma,K.C. 2001 Crop Diversification in Nepal. In Crop Diversification in Asia Pacific Region (FAO RAP Publication 2001/03) eds. Minas K. Papademetriou and Franck J. Dent, pp. 81- 94. Bangkok: FAO.
Silpakar,Sandesh.2008.ImplicationsofLand TenureonFoodSufficiencyinDang District, Nepal. A thesis submitted at College ofDevelopmentStudies,Purbanchal University.
UNDP. 2004.
World Bank. 2009. World Development Indicators.
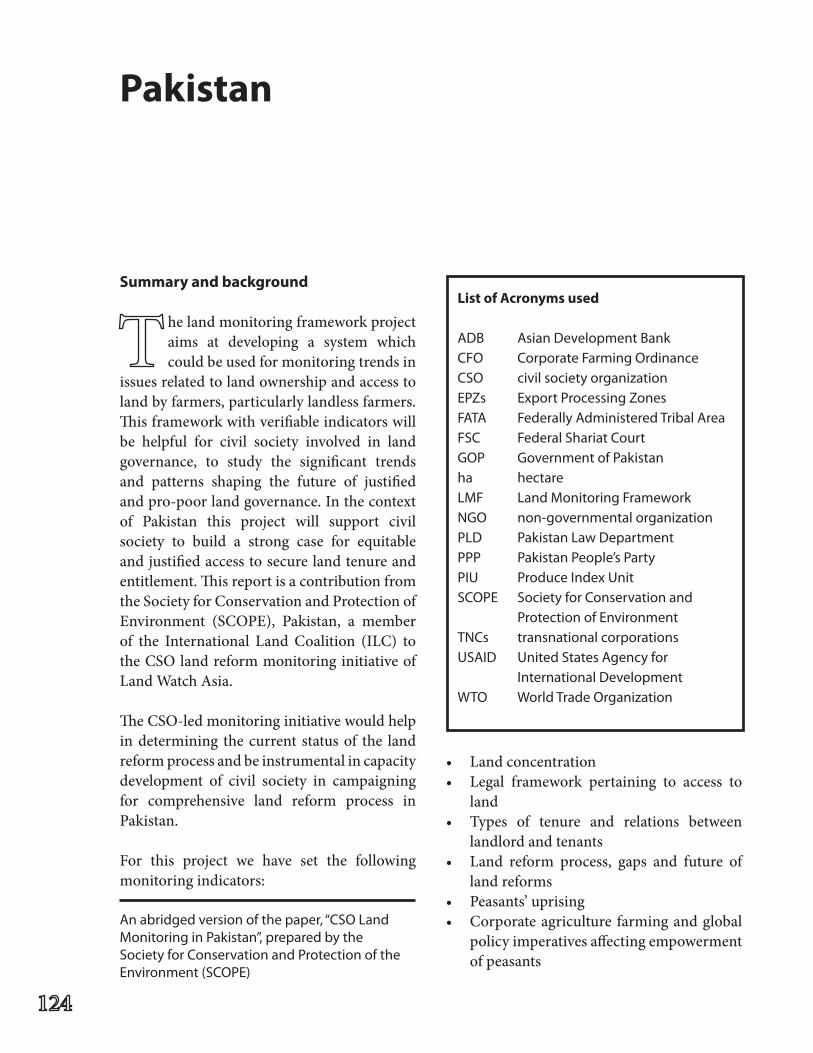
Summary and background
he land monitoring framework project aims at developing a system which could be used for monitoring trends in
issues related to land ownership and access to land by farmers, particularly landless farmers. This framework with verifiable indicators will be helpful for civil society involved in land governance, to study the significant trends and patterns shaping the future of justified and pro-poor land governance. In the context of Pakistan this project will support civil society to build a strong case for equitable and justified access to secure land tenure and entitlement. This report is a contribution from theSocietyforConservationandProtectionofEnvironment (SCOPE), Pakistan, a memberof the International Land Coalition (ILC) to theCSOlandreformmonitoringinitiativeofLand Watch Asia.
TheCSO-ledmonitoringinitiativewouldhelpin determining the current status of the land reform process and be instrumental in capacity development of civil society in campaigning for comprehensive land reform process in Pakistan.
For this project we have set the following monitoring indicators:
• Landconcentration• Legal framework pertaining to access to
land• Types of tenure and relations between
landlord and tenants• Land reform process, gaps and future of
land reforms• Peasants’uprising• Corporateagriculture farmingandglobal
policy imperatives affecting empowerment of peasants
Pakistan
List of Acronyms used
ADB Asian Development BankCFO Corporate Farming OrdinanceCSO civilsocietyorganizationEPZs Export Processing ZonesFATA Federally Administered Tribal AreaFSC FederalShariatCourtGOP Government of Pakistanha hectareLMF Land Monitoring FrameworkNGO non-governmental organizationPLD Pakistan Law DepartmentPPP Pakistan People’s PartyPIU Produce Index UnitSCOPE SocietyforConservationand Protection of EnvironmentTNCs transnational corporationsUSAID UnitedStatesAgencyfor International DevelopmentWTO World Trade Organization
Anabridgedversionofthepaper,“CSOLandMonitoring in Pakistan”, prepared by the SocietyforConservationandProtectionoftheEnvironment(SCOPE)
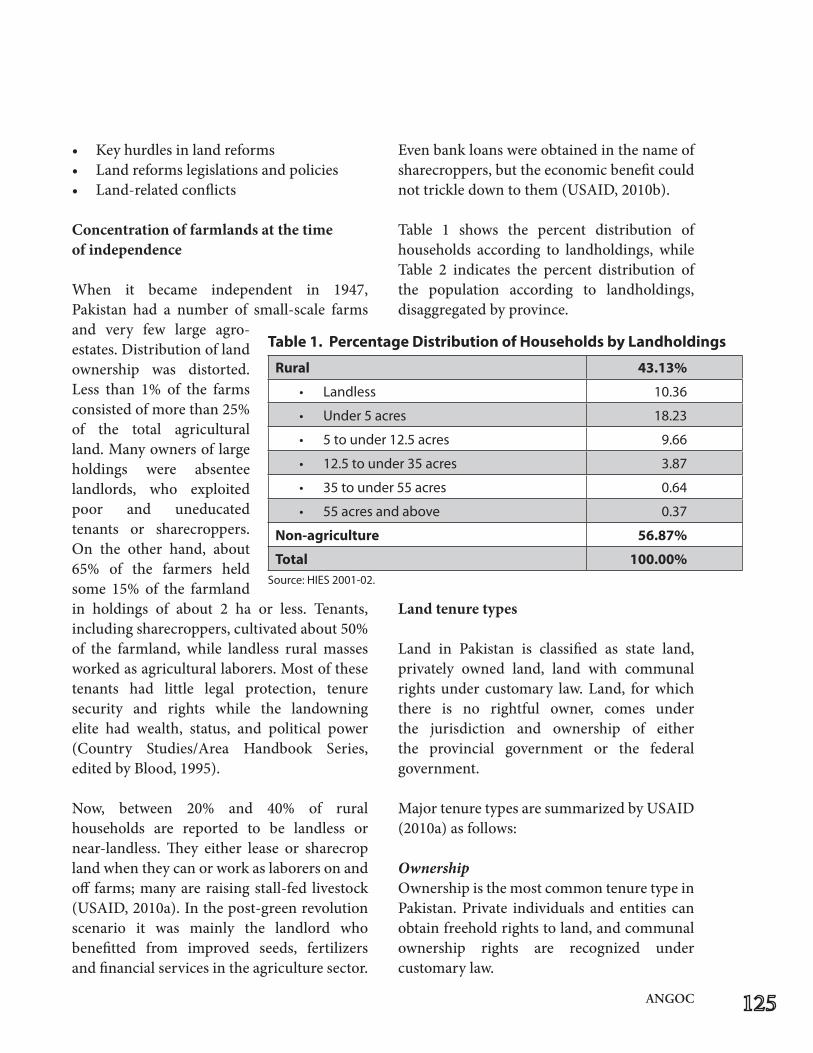
ANGOC
• Keyhurdlesinlandreforms• Landreformslegislationsandpolicies• Land-relatedconflicts
Concentration of farmlands at the time of independence
When it became independent in 1947, Pakistan had a number of small-scale farms and very few large agro-estates. Distribution of land ownership was distorted. Less than 1% of the farms consisted of more than 25% of the total agricultural land. Many owners of large holdings were absentee landlords, who exploited poor and uneducated tenants or sharecroppers. On the other hand, about 65% of the farmers held some 15% of the farmland in holdings of about 2 ha or less. Tenants, including sharecroppers, cultivated about 50% of the farmland, while landless rural masses worked as agricultural laborers. Most of these tenants had little legal protection, tenure security and rights while the landowning elite had wealth, status, and political power (Country Studies/Area Handbook Series,edited by Blood, 1995).
Now, between 20% and 40% of rural households are reported to be landless or near-landless. They either lease or sharecrop land when they can or work as laborers on and off farms; many are raising stall-fed livestock (USAID,2010a).Inthepost-greenrevolutionscenario it was mainly the landlord who benefitted from improved seeds, fertilizers and financial services in the agriculture sector.
Even bank loans were obtained in the name of sharecroppers, but the economic benefit could nottrickledowntothem(USAID,2010b).
Table 1 shows the percent distribution of households according to landholdings, while Table 2 indicates the percent distribution of the population according to landholdings, disaggregated by province.
Land tenure types
Land in Pakistan is classified as state land, privately owned land, land with communal rights under customary law. Land, for which there is no rightful owner, comes under the jurisdiction and ownership of either the provincial government or the federal government.
MajortenuretypesaresummarizedbyUSAID(2010a) as follows:
Ownership Ownership is the most common tenure type in Pakistan. Private individuals and entities can obtain freehold rights to land, and communal ownership rights are recognized under customary law.
Rural 43.13%
• Landless 10.36
• Under5acres 18.23
• 5tounder12.5acres 9.66
• 12.5tounder35acres 3.87
• 35tounder55acres 0.64
• 55acresandabove 0.37
Non-agriculture 56.87%
Total 100.00%
Table1.PercentageDistributionofHouseholdsbyLandholdings
Source:HIES2001-02.
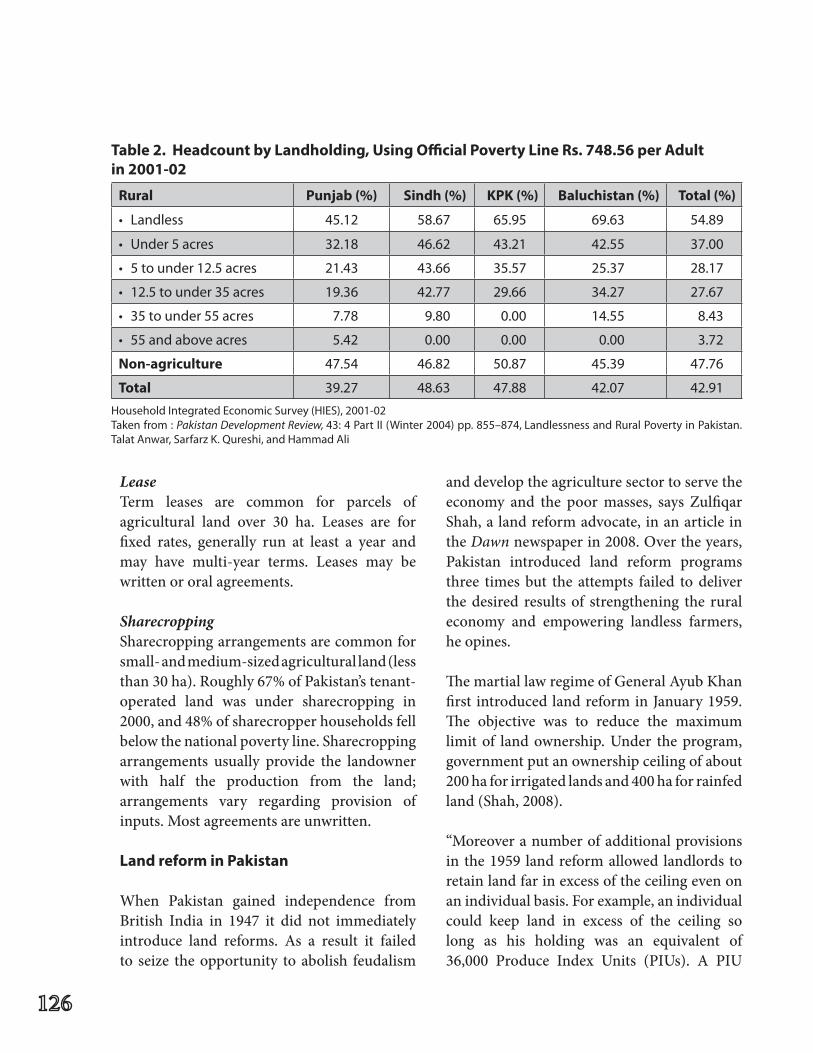
Lease Term leases are common for parcels of agricultural land over 30 ha. Leases are for fixed rates, generally run at least a year and may have multi-year terms. Leases may be written or oral agreements.
Sharecropping Sharecroppingarrangementsarecommonforsmall- and medium-sized agricultural land (less than 30 ha). Roughly 67% of Pakistan’s tenant-operated land was under sharecropping in 2000, and 48% of sharecropper households fell belowthenationalpovertyline.Sharecroppingarrangements usually provide the landowner with half the production from the land; arrangements vary regarding provision of inputs. Most agreements are unwritten.
LandreforminPakistan
When Pakistan gained independence from British India in 1947 it did not immediately introduce land reforms. As a result it failed to seize the opportunity to abolish feudalism
and develop the agriculture sector to serve the economy and the poor masses, says Zulfiqar Shah,alandreformadvocate,inanarticleinthe Dawn newspaper in 2008. Over the years, Pakistan introduced land reform programs three times but the attempts failed to deliver the desired results of strengthening the rural economy and empowering landless farmers, he opines.
The martial law regime of General Ayub Khan first introduced land reform in January 1959. The objective was to reduce the maximum limit of land ownership. Under the program, government put an ownership ceiling of about 200 ha for irrigated lands and 400 ha for rainfed land(Shah,2008).
“Moreover a number of additional provisions in the 1959 land reform allowed landlords to retain land far in excess of the ceiling even on an individual basis. For example, an individual could keep land in excess of the ceiling so long as his holding was an equivalent of 36,000 Produce Index Units (PIUs). A PIU
Rural Punjab(%) Sindh(%) KPK(%) Baluchistan(%) Total(%)
• Landless 45.12 58.67 65.95 69.63 54.89
• Under5acres 32.18 46.62 43.21 42.55 37.00
• 5tounder12.5acres 21.43 43.66 35.57 25.37 28.17
• 12.5tounder35acres 19.36 42.77 29.66 34.27 27.67
• 35tounder55acres 7.78 9.80 0.00 14.55 8.43
• 55andaboveacres 5.42 0.00 0.00 0.00 3.72
Non-agriculture 47.54 46.82 50.87 45.39 47.76
Total 39.27 48.63 47.88 42.07 42.91
Table2.HeadcountbyLandholding,UsingOfficialPovertyLine Rs.748.56perAdultin2001-02
HouseholdIntegratedEconomicSurvey(HIES),2001-02Taken from : Pakistan Development Review,43:4PartII(Winter2004)pp.855–874,LandlessnessandRuralPovertyinPakistan.TalatAnwar,SarfarzK.Qureshi,andHammadAli
ANGOC
was estimated as a measure of the gross value of output per acre of land by type of soil and was therefore seen as a measure of land productivity. The lacuna in this provision was that the PIUs were based on pre-Partition revenue settlements” (Hussain, 1982).
Cash compensations were paid to the owners for land taken in these reforms. However the landed class defied these reforms using tactics such as transferring land titles to family members to avoid ownership limits, in turn, watering down the impact of the reforms. As a result, less than 1 million ha of land was recovered from landlords. The government sold more than 250,000 ha to about 50,000 tenants or sharecroppers. But in the end, the reforms failed to achieve government’s target of lessening the power of the landed elite (Shah, 2008). The next wave of land reform came in March 1972 and was enforced in 1973 during the term of Z.A. Bhutto, head of center left-oriented political party the Pakistan People’s Party, Shah says.The land ownership ceilingwas further lowered to nearly 5 ha of irrigated land and about 12 ha of non-irrigated land, he says, adding exceptions of additional 20% land to those who owned tractors and tube wells. He notes that the owners of the confiscated land were not offered any compensation nor beneficiaries charged for distributed land. Citing official statistics, he points out that by 1977 only about 520,000 ha had been surrendered and nearly 285,000 ha redistributed among 71,000 farmers. The Bhutto government introduced the third round of reforms with the Land Reform Act of 1977 which further reduced ceilings on private ownership of farmland to about 4 ha of irrigated land and about 8 ha of non-irrigated.
The reform also called for taxes on agricultural income.Smallfarmersowning10haorfewerwereexempted(Shah,2008).
But the military regime of Zia ul-Haq, who took over from Bhutto, did not implement these reforms. Governments in the 1980s and early 1990s avoided any significant attempt at strict implementation of the land reform measures, because they got much of their support from the landed aristocracy (Shah, 2008).
The overall impact of land reform attempts in Pakistan
Agrarian reforms in Pakistan have never been able to transform the rural society into aprogressive agrarian economy, Shah (2008)says. The reforms attempted to limit the land ownership to certain ceiling on individual basis, but not on family basis, therefore the huge family holdings remained unaffected as landowners transferred or gifted surplus lands to their family members, he notes. He says that during the military’s rule, feudal landlords supported the junta to protect their interests and the military government obliged to safeguard their interests. Even after three waves of land reform programs, 3,529 zamindars (landlords) still controlled 513,114 holdings of more than 100 acres in irrigated areas and 332,273 holdings exceeding 100 acres in un-irrigated areas. On the other hand, 794,774 khatedars (tenants) have 5,464,771 landholdings of less than 12 acres in irrigated areas. In un-irrigated areas, 144,098 are reported to have 1,628,826 holdings of less than24acres(Shah,2008).
Land reforms play an important role in reducing rural poverty and empowering poor and landless farmers, Shah asserts. “InPakistan, the power of landed aristocracy has acted as a barrier to social and economic progress of the rural society.” He stresses that genuine and effective land reform can bring real positive change in the rural economy and bring small and landless farmers into mainstream development process. Without land titles they cannot enjoy benefits of capital intensive farming technology and financial and credit instruments to boost agriculture, he adds.
Shahthusproposes for the landceilingtobefixed at 50 acres for irrigated land and 100 acres for non-irrigated. About 8 acres of agriculture land should be allotted to the landless agriculture workers and peasants’ families, he also urges. He insists that the agriculture land occupied by or allotted to military forms and government departments be revoked and distributed among the landless peasants.
While land reform legislation is needed, all laws and regulations regarding land developed under the colonial era should be abolished, Shahunderscores.Healsocalls for the setupof a judicial commission on land utilization to curb the rising commercialization of land.
The legal framework governing land rights
Since 97% of the population in Pakistan isMuslim, most of its civil law has been adapted to reflect the Islamic character of the country. The 1973 Constitution provides that every citizen shall have the right to acquire, hold, and dispose of property.
USAID(2010a)saysthestatutorylawrelatedtoland rights is old, fragmented, and incomplete. More than two dozen laws govern a variety of land matters at national and provincial levels, it notes. There are provincial revenue legislations which provide for landholding categories, record-keeping, land transactions, surveys, among others, the agency explains. Meanwhile, the property rights of the tribal population of the Federally Administered Tribal Areas are under a separate legal framework, the majority of which consists of customary law, USAIDadds.
Pakistan has a strong customary law governing land rights. Provinces and tribes have different customary laws enforced by tribunals known as jirgas. Customary law governing land issues ranges from marital property rights to principles governing boundaries. Particularly in the tribal (semi-autonomous) areas, people regulate their own affairs in accordance with customary law, and the government functions through local tribal intermediaries or political agents. Tribes recognize individual land ownership, by a joint or extended family, and collective landownershipbya tribe(USAID,2010a).
The law of inheritance in Pakistan is governed by the Muslim personal law, which assigns women a differential status. The general principle of the Muslim personal law with regard to allocation of shares in both Hanafi and Shia law is that the women sharers receive half the share of a male share.
ANGOC
Provincial Tenancy Acts
Pakistan is a federation of four provincial units - Punjab, Sindh,Khyber Pukhtunkhwah andBalochistan - and four federally administered territories. The laws dealing with relations between landlord and tenants come under provincial tenancy acts. The Punjab Tenancy Act 1887 was the first piece of legislation enacted by the British Empire, providing security to tenants called occupancy tenants, says civil society group Roots for Equity in a paper titled “Agrarian Reform Research in Pakistan.” In 1950, the tenancy act was amended to abolish payments of levies and pre-requisites to the landlord by the tenant. The Tenancy Act of Sindh was also enactedthe same year. In 1952, the Punjab Tenancy Act was again amended to provide fixed-term tenure of one to three years to sharecroppers, Roots for Equity notes.
These tenancy acts though were not implemented in their true spirit. In some parts of the country, begari or forced labor continues to be practiced, Roots for Equity asserts. Poor peasants or hari don’t receive their legal share of the produce. In many instances, sharecroppers are forced by the landlords to work as seasonal agriculture laborers on a daily wages basis for some crops, further denying the rights of the peasants. The group points out: “In general, sharecroppers have no awareness of their tenancy rights. No written legal document is ever signed between the landlord and the hari. In actual practice, the landlord can terminate the services of the sharecroppers at will, giving the term ‘tenant-at-will’ its very real connotation. In short, the tenancy acts have never had any real political clout due to the continuing intense control of the feudal landlords in the politics of Pakistan.”
RecentlytheSindhHighCourtissuedarulingproposing certain amendments in the SindhTenancy Act, to reform the age-old relationship between the haris (sharecroppers) and the landlords. The case reflected the traditional conflict between tillers of the soil and owners of the land, the landlords (zamindars or waderas), who are generally accused of using coercive means for perpetuating these stranglehold over the impoverished and illiterate haris. The judgment assumed great importance in view of the discovery of private jails and recovery of some of the people who were kept in chains. It emerged from the proceedings that the problem in most cases stemmed from the non-payment of loans these haris or their ancestors had taken from the zamindar.
Rights to land and gender differences
Under statutory, religious, and customary law, Pakistani women have a legal right to own land. Citing other publications, USAID(2010a) says more professional women are increasingly buying house plots in urban areas in their own names, a practice rarely seen in rural areas in most regions, despite provisions in customary and Islamic law. Still, men,who are presumed to control land and other family assets, continue to dominate in social, economic and political spheres in the tribal areas, the agency also notes.
Neither customary nor Islamic law in Pakistan recognizes community property rights, but various provisions are made for the support of women, including agreements regarding payments and repayments of dowry, dower, mehar, and maintenance. In some regions, dower paid by the groom’s family is substantial and often takes the form of land or a house that
the husband’s family is expected to build and put in the bride’s name. However, the bride will seldom exercise any control over the property inhername(USAID,2010a).
The same is true in the case of widows, mothers anddaughters,USAIDfurthernotes.Ingeneral,there is little acceptance under customary and religious law for women’s ability to control and manage land. Under customary law the senior male of the family holds the family land in his name, it states.
Land disputes and conflicts
Land disputes in rural and urban Pakistan are prevalent. Disputes about land ownership and tenure are particularly difficult to resolve due to poor record maintenance and political influence of landowners. Landholders have criticized the revenue court system, which is designed to provide a specialized, local, rapid resolution of disputes, for being time-consuming, complex, and open to corruption. As such, cases may take years to resolve (USAID,2010a).
Land disputes are the most common form of dispute filed with the formal court system, perhaps in part because filing a case may stay pending revenue court proceeding. In Pakistan’scountryprofile,USAIDsaysthatlowpay, poor training and a large volume of cases hobble the judiciary. Between 50% and 75% of cases brought before lower-level civil courts and the high courts are land-related disputes. The agency estimates that over a million land cases are pending in courts nationwide.
Land disputes arise because of inaccurate or fraudulent land records, erroneous boundary descriptions that create overlapping claims,
and multiple registrations to the same land by differentparties,USAIDdetails in thepaper.It states that credible evidence of land rights is often nearly impossible to obtain. As such, land cases can take between four and 10 years to resolve, with the party in possession of the land delaying adjudication in order to prolong the period of beneficial use, it further notes.
In Pakistan’s Tribal Area, where inhabitants do nothaveaccesstotheHighCourtandSupremeCourt except for constitutional claims and challenges, land disputes are handled by the traditional jirga, a tribal assembly of elders and learnedmen.InPunjabandSindhProvinces,local leaders and elected panchayat (local governance body) members often hear and resolve land disputes. In most areas, women are not permitted to participate in the jirga and resolutions reached often perpetuate existing biases against women’s land ownership and control(USAID,2010a).
Land disputes
As the formal judicial system is known as being corrupt and for serving the interests of the wealthy and powerful only, rural people reportedly prefer to settle land disputes through informal compromises (Business Anti-Corruption Portal [2009] Pakistan Country Profile: Land Administration).
The panchayat is meant to be used as a secondary institution in order to circumvent the costs and long delays in the courts. Particularly in family and land disputes, the panchayat is being utilized as a primary institution. Normally, it is only if the panchayat cannot settle the dispute that the case will be taken to a formal court (Business Anti-Corruption Portal [2009] Pakistan Country Profile: Judicial System).
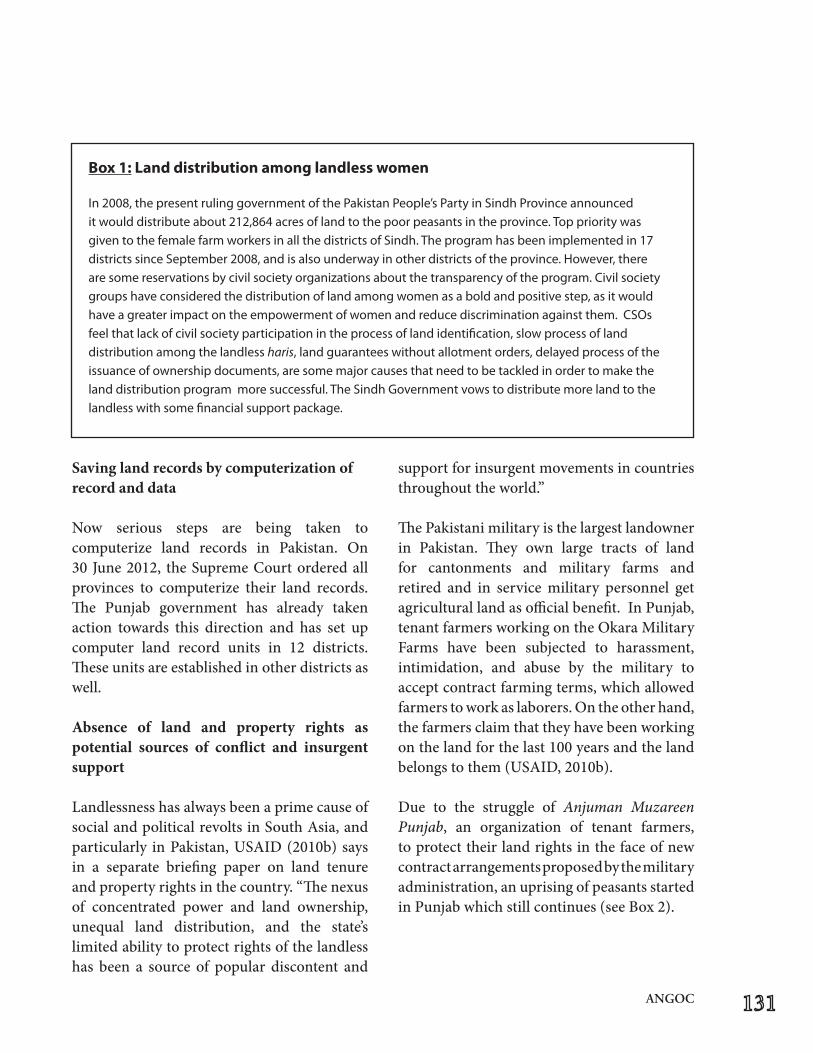
ANGOC
Saving land records by computerization of record and data
Now serious steps are being taken to computerize land records in Pakistan. On 30June2012, theSupremeCourtorderedallprovinces to computerize their land records. The Punjab government has already taken action towards this direction and has set up computer land record units in 12 districts. These units are established in other districts as well.
Absence of land and property rights as potential sources of conflict and insurgent support
Landlessness has always been a prime cause of socialandpoliticalrevoltsinSouthAsia,andparticularly inPakistan,USAID(2010b)saysin a separate briefing paper on land tenure and property rights in the country. “The nexus of concentrated power and land ownership, unequal land distribution, and the state’s limited ability to protect rights of the landless has been a source of popular discontent and
support for insurgent movements in countries throughout the world.”
The Pakistani military is the largest landowner in Pakistan. They own large tracts of land for cantonments and military farms and retired and in service military personnel get agricultural land as official benefit. In Punjab, tenant farmers working on the Okara Military Farms have been subjected to harassment, intimidation, and abuse by the military to accept contract farming terms, which allowed farmers to work as laborers. On the other hand, the farmers claim that they have been working on the land for the last 100 years and the land belongstothem(USAID,2010b).
Due to the struggle of Anjuman Muzareen Punjab, an organization of tenant farmers, to protect their land rights in the face of new contract arrangements proposed by the military administration, an uprising of peasants started in Punjab which still continues (see Box 2).
Box1:Landdistributionamonglandlesswomen
In2008,thepresentrulinggovernmentofthePakistanPeople’sPartyinSindhProvinceannounceditwoulddistributeabout212,864acresoflandtothepoorpeasantsintheprovince.TopprioritywasgiventothefemalefarmworkersinallthedistrictsofSindh.Theprogramhasbeenimplementedin17districtssinceSeptember2008,andisalsounderwayinotherdistrictsoftheprovince.However,thereare some reservations by civil society organizations about the transparency of the program. Civil society groups have considered the distribution of land among women as a bold and positive step, as it would haveagreaterimpactontheempowermentofwomenandreducediscriminationagainstthem.CSOsfeel that lack of civil society participation in the process of land identification, slow process of land distribution among the landless haris, land guarantees without allotment orders, delayed process of the issuance of ownership documents, are some major causes that need to be tackled in order to make the landdistributionprogrammoresuccessful.TheSindhGovernmentvowstodistributemorelandtothelandless with some financial support package.
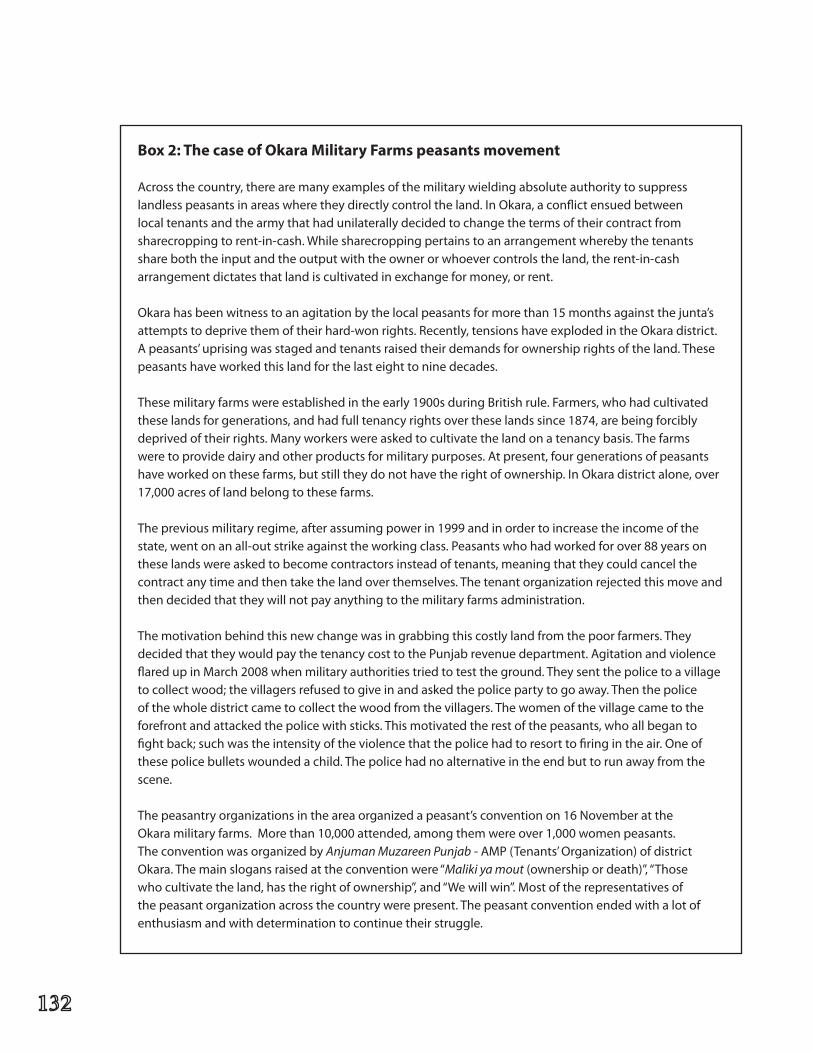
Box2:ThecaseofOkaraMilitaryFarmspeasantsmovement
Across the country, there are many examples of the military wielding absolute authority to suppress landlesspeasantsinareaswheretheydirectlycontroltheland.InOkara,aconflictensuedbetweenlocal tenants and the army that had unilaterally decided to change the terms of their contract from sharecropping to rent-in-cash. While sharecropping pertains to an arrangement whereby the tenants share both the input and the output with the owner or whoever controls the land, the rent-in-cash arrangement dictates that land is cultivated in exchange for money, or rent.
Okara has been witness to an agitation by the local peasants for more than 15 months against the junta’s attempts to deprive them of their hard-won rights. Recently, tensions have exploded in the Okara district. A peasants’ uprising was staged and tenants raised their demands for ownership rights of the land. These peasants have worked this land for the last eight to nine decades.
These military farms were established in the early 1900s during British rule. Farmers, who had cultivated theselandsforgenerations,andhadfulltenancyrightsovertheselandssince1874,arebeingforciblydeprived of their rights. Many workers were asked to cultivate the land on a tenancy basis. The farms were to provide dairy and other products for military purposes. At present, four generations of peasants have worked on these farms, but still they do not have the right of ownership. In Okara district alone, over 17,000acresoflandbelongtothesefarms.
The previous military regime, after assuming power in 1999 and in order to increase the income of the state,wentonanall-outstrikeagainsttheworkingclass.Peasantswhohadworkedforover88yearsonthese lands were asked to become contractors instead of tenants, meaning that they could cancel the contract any time and then take the land over themselves. The tenant organization rejected this move and then decided that they will not pay anything to the military farms administration.
The motivation behind this new change was in grabbing this costly land from the poor farmers. They decided that they would pay the tenancy cost to the Punjab revenue department. Agitation and violence flaredupinMarch2008whenmilitaryauthoritiestriedtotesttheground.Theysentthepolicetoavillageto collect wood; the villagers refused to give in and asked the police party to go away. Then the police of the whole district came to collect the wood from the villagers. The women of the village came to the forefront and attacked the police with sticks. This motivated the rest of the peasants, who all began to fight back; such was the intensity of the violence that the police had to resort to firing in the air. One of these police bullets wounded a child. The police had no alternative in the end but to run away from the scene.
Thepeasantryorganizationsintheareaorganizedapeasant’sconventionon16NovemberattheOkara military farms. More than 10,000 attended, among them were over 1,000 women peasants. The convention was organized by Anjuman Muzareen Punjab - AMP (Tenants’ Organization) of district Okara. The main slogans raised at the convention were “Maliki ya mout (ownership or death)”, “Those who cultivate the land, has the right of ownership”, and “We will win”. Most of the representatives of the peasant organization across the country were present. The peasant convention ended with a lot of enthusiasm and with determination to continue their struggle.
ANGOC
Key land issues and government interventions
While the World Bank and other donor institutions have identified the role that unequal land distribution plays in perpetuating rural poverty, there is no current call for comprehensive large-scale land reforms in the country (USAID, 2010a). It is a fact thatmost members of Parliament come from large landowning families and are part of this status quo. Feudal landlords dominate in politics due to their wealth and influence and are able to get tickets in elections from major political parties. And when a junta toppled the elected government, these feudal landlords gave their weight to the military regime in order to safeguard their interests.
Similarly the religious cadre also becomespart of this status quo nexus, according to Pakistan’s history. The political governments, on the other hand, are weak and vulnerable to challenge the status quo. They close their eyes and turn away from the question of redistributing lands among rural poor. During the current political discourse and upcoming election debates, none of the major political party, with the exception of Muttahida Quami Movement, which has submitted a land reform bill in the national assembly, has announced outright pro-poor land reforms.
USAID(2010a)saysthereisevidenceofsomeland redistribution efforts at the provincial levelinPunjabandSindh.Aprojectinitiatedin the Sindh Province in 2008 targeted todistribute 91,000 ha of cultivable land to landless and poor peasants, with a focus on including women beneficiaries. As of late 2009, the province had distributed 17,400
ha of land among 4,200 beneficiaries, with each beneficiary receiving between 1.6 and 10 ha. About 70% of the beneficiaries are women.USAID says though that the projecthad faced some difficulties due to challenges from local elites and difficulty by some women of obtaining documents of their rights and defending their rights against male relatives.
The $51-million Punjab Land Records ManagementandInformationSystemsProjectis another project launched to advance land reform in Pakistan. Backed by the World Bank, the project aimed to improve the land records service delivery of the province. The project also aimed to contribute to long-lasting tenure security and more efficient operation of land markets by upgrading the land records management system. The project includes revising current business processes and associated legislation and regulations, establishing service centers where land records will be maintained and available to the public in digital form, and establishing linkages between the land records system and the system for registrationofdeeds (USAID,2010a).
CorporateFarming
Roots for Equity says while no clear market-based land reform schemes have been introduced as yet in the country, it is clear such schemes are on the government’s agenda. It recalls that in 2001, the military regime of General Pervez Musharraf passed the Corporate Farming Ordinance (CFO), which allowed listed corporations to lease land for a period of 99 years. The government also allowed transnational companies (TNCs) to take lease of unlimited land with a minimum ceiling of
1,500 acres, which is against the 1977 Land Reform Act, the group opines. The TNCs have also been promised 100% equity, numerous tax incentives as well as full repatriation of profits, according to the group.
The peasants are going to be the most affected by the government’s corporate farming policy as their hopes of getting state lands will be further diminished. This corporate farming policy will rather suit large landholders, as they tend to lease their lands to the corporate sector on long-term lease basis on lucrative terms, this way they will not only get rid of their tenants but will also get a legal safeguard against land redistribution in case of future land reforms.
Apart from CFO, Pakistan has taken other measures to meet the requirements of the neoliberal policies under the World Trade Organization (WTO) and other agreements, Roots for Equity says. The seed sector has already been privatized and measures are in place to promote agriculture export processing zones in various parts of the country, including the Sindh and Punjab provinces. Insurancecompanies are now marketing agriculture insurance schemes, which are not in the reach of small and marginal farmers and sharecroppers, because they don’t possess land titles required to tap financial credit and insurance schemes, the group notes.
Peasants and small farmers are not likely to receive any direct benefits from ventures like the Agricultural Research Endowment Fund, being funded by the United StatesDepartment of Agriculture. The government has already offered state land to set up the agriculture export processing zones. There are linkages of the feudal elites with TNCs such as
Monsanto. There are widespread rumors that the feudal landlords are interested in going into joint ventures with agri-based TNCs for the development of mass-production zones for seed cultivation. “None of these trade liberalization agendas augurs well for the poor peasantry in Pakistan, as these would in essence be profit-oriented ventures between the feudal elites of Pakistan and the corporate sectors in theUS and other imperialist nations,” Rootsfor Equity asserts.
It is quite evident that the current (or even future) government is not interested in land reforms anymore. In 2003, the then Prime Minister, Mir Zafarullah Jamali categorically stated that the question of land reform does notarise.(Ahmed,2003).Similarly,amemberof the ruling party said during an informal conversation that they did not believe that land reform was a successful strategy in alleviating poverty. Roots for Equity opines the feudal elites are now openly opposing further land reforms in the country.
Furtherhurdleontheroadtolandreforms
In debates about land reform, a landmark verdict by the Shariat Benchof the SupremeCourt of Pakistan is often cited to as the main obstacle in the implementation of land reforms in the country. The Qazalbash Waqf vs.ChiefLandCommissioner (PLD1990SC99) judgment is one of the most important and influential court judgments ever passed by the superior court of Pakistan, and is described by Paklawyer.com in detail. The case involved the expropriation of land of Qazalbash Waqf, a religious charitable trust with more than a thousand acres of irrigated land near Lahore. But the land was appropriated for land reform during the rule of Zulfiqar Ali Bhutto in the
ANGOC
late 1960s and early 1970s during the third wave of land reforms. Bhutto enacted the Martial Law Regulation, which provided for land to be taken from the rich and distributed among the poor. The Land Reform Act 1977 (Act II of 1977) further lowered the maximum limit of land ownership and provided cash compensation to those who surrendered land. The amount paid though was nowhere near the market price.
Many who had lost their lands, including the Qazalbash Waqf, had approached the courts to seek relief. But for many years, there was no relief available, as the land reform legislation was protected by the Constitution under various articles that prohibited judicial review and counter-legislation in this area (Paklawyer.com).
When Bhutto was removed from office by General Zia’s martial law government, the “Islamization” of the laws of Pakistan began. Zia set up Shariat benches in the High Court of each province that were tasked to examine and decide whether any law or provision of law was against the injunctions of the Islamic law. After some time, provincial Shariat benches of four provincial high courts were consolidated in the form of one Federal Shariat Court (FSC).QazalbashWaqfapproachedtheFSCin1979.By1989,theFSCdeclaredlandreformsun-Islamic and the land reform legislations passed during the time of Bhutto null and void (Paklawyer.com).
Recently, Workers Party Pakistan, with some politicians and trade unionists, have filed a petition in theSupremeCourtofPakistantoreview the verdict.
Conclusion
The CSO-led land reforms monitoringinitiative could prove to be effective to monitor land-related issues in Pakistan. A model based on monitoring indicators and benchmarks should be developed with the participation of all stakeholders and implemented to strengthen land right movements. The land reform campaign in Pakistan should progress by strengthening peasant movements, empowering them with knowledge, advocacy and research skills. There should be a dialogue involving all stakeholders and political cadres to defend the land rights of the poor peasantry to save them from the onslaught of market-led land reforms, in which the poor peasants find themselves as the ultimate losers.
References
Ahmed,S.(2003).Nolandreformsanymore!Daily Dawn. 20 March, 2003. Retrieved from: http://archives.dawn.com/2003/03/20/op.htm.
Blood, Peter, ed. (1995). Agriculture. Pakistan: A Country Study. Washington, D.C.: Federal Research Division, Library of Congress. Available online at: http://countrystudies.us/pakistan/49.htm.
Business Anti-Corruption Portal. Pakistan Country Profile.
Hussain, A. (1982)., Pakistan: Land Reforms Reconsidered., Retrieved from: http://www.akmalhussain.net/Publish%20Work/SouthAsia/PakistanLandReformsReconsidered.pdf
Paklawyer.com. Comments on judgement of superior court. Comment: Qazalbash Waqf V.ChiefLandCommissioner(PLD1990SC99). Retrieved from: http://paklawyerblog.blogspot.com/2012/06/comments-on-judgment-of-superior-court.html
Pakistan Defence. (2010). Land reform bill landed in national assembly. Pakistan Defence forum. Retrieved from: http://www.defence.pk/forums/national-political-issues/76310-land-reform-bill-landed-national-assembly.html
Roots for Equity. (2005). Agrarian Reform Research in Pakistan. APRN Coordinated Research Conference on Agrarian Reform. 17-18 October 2005. Talisay, Negros, Philippines. Asia-Pacific Research Network. Retrieved from: http://aprnet.org/downloads/books/agrarianreform/agref-roots.pdf.
Shah,Z.(2008).QuestionsonLandReformsin Pakistan. Daily Dawn. 2 February 2008. Retrieved from: http://archives.dawn.com/weekly/encounter/20080202/encounter3.htm
SustainableDevelopmentPolicyInstitute.
Summary.LandRightsforMuslimWomen:Review of Law and Policy. Retrieved from: http://www.sdpi.org/research_programme/Files/wlr_summary-law_and_Policy_final%202.pdf
UnitedStatesAgencyforInternationalDevelopment.(2010a).USAIDCountryProfile: Pakistan. Property Rights & Resource Governance.September2010.LandTenureand Property Rights Portal. Retrieved from: http://www.usaidlandtenure.net/sites/default/files/country-profiles/full-reports/USAID_Land_Tenure_Pakistan_Profile_0.pdf
UnitedStatesAgencyforInternationalDevelopment. (2010b). Failure to address LTPR grievances may foster support for theTaliban.USAIDIssueBrief:Pakistan.Land tenure and property rights in Pakistan. Property rights and resource governance briefing paper 4. January 2010. Retrieved from: http://usaidlandtenure.net/sites/default/files/USAID_Land_Tenure_Pakistan_Issue_Brief_1.pdf
ANGOC
Philippines
Summary
he Philippines has developed and pilot-tested a number of monitoring indicators based on the Land Country
Monitoring Framework. The indicators focus on three asset reform beneficiaries: the agrarian reform beneficiaries, fishing communities, and indigenous peoples (IPs). The critical issues that keep these sectors in a poverty bind are grouped into three: i) the lack of tenurial security and threats to it, ii) the insufficient provision for support services, and iii) low participation of civil society in resource management councils.
Around these three issues or themes, seven monitoring indicators were developed to monitor activities at the national and local levels. For this initial report, however, only data at the national level ware available. Monitoring and data gathering for the regional, provincial, and municipal levels are works in progress.
The monitoring indicators are:
• Distribution of tenurial instruments(CLOA, local ordinance on municipal waters delineation, CADT);
List of Acronyms used
ADB Asian Development BankADSDPP AncestralDomainSustainable Development and Protection PlanANGOC Asian NGO Coalition for Agrarian Reform and Rural DevelopmentARBs agrarian reform beneficiariesARCs agrarian reform communitiesBFAR BureauofFisheriesandAquatic ResourcesCADC Certificate of Ancestral Domain ClaimCADT Certificate of Ancestral Domain TitleCARP Comprehensive Agrarian Reform ProgramCLOA Certificate of Land Ownership AwardCSOs civilsocietyorganizationsDA Department of AgricultureDAR Department of Agrarian ReformDENR Department of Environment and Natural ResourcesFARMCs FisheriesandAquaticResource Management CouncilsFPIC free, prior and informed consentFLA Fishpond Lease AgreementILC International Land CoalitionIPs indigenous peoplesIPRA Indigenous Peoples Rights ActLAD Landacquisitionand distributionLGU local government unitMOA Memorandum of AgreementNAMRIA National Mapping and Resource Information AuthorityNCIP National Commission on Indigenous PeoplesNCSB NationalStatisticalCoordination BoardPARRC Philippine Agrarian Reform Research CouncilPhilDHRRA Philippine Partnership for the Development of Human Resources in Rural Areas
Anabridgedversionofthepaper,“SystematicAccess to Land Monitoring in the Philippines”, prepared by the Philippine Partnership for the Development of Human Resources in Rural Areas (PhilDHRRA).
• Numberofbeneficiaries;• Numberofcasesofoverlappingclaims;• Presence of resource use conflicts in
extractive activities; • Participationofcivilsocietyorganizations
(CSOs)inresourcemanagementcouncils;• Supportservicesprovidedtobeneficiaries;
and• Link between access to land assets and
poverty incidence.
Data are summarized in the succeeding pages. The following observations were made based on the findings and analyses:
• Thecontinuingdelays(‘backlogs’)blockthe issuance of tenurial instruments for many farmers, fishers and indigenous peoples.
• Threats to tenurial security likewisepersist across sectors, aggravated by weak monitoring mechanisms or processes within the implementing agencies, unclear guidelines, and overlapping policies.
• Support services provided by thegovernment need to be strengthened.
• Data gathering processes pose aserious challenge to implementation, monitoring, and evaluation. These are official data where the government does not generate them substantially. Recourses are alternative sources of data,suchasstudiesbyCSOs.
• Consequently, capacity buildingamongCSOsbecomesapressingneedfor gathering and managing data to be used for land monitoring.
The recommendations highlight the urgency to act on the identified issues of tenurial security, lack of support services for beneficiaries, and
the weakness of committed participation and effective management of services involving local governments and civil society. There are policy and program recommendations, as follows:
o The distribution of tenurial instruments must be expedited to meet the goals for tenurial security. Clear implementing guidelines on tenurial security processes and harmonizing policies on land and water use are needed.
o Threats to security of tenure can be addressed by strengthening the monitoring and regulating mechanisms to ensure that the gains on asset reform are not reversed (national and local). Laws regulating extractive activities should be implemented strictly, with enforcement of penalties, sanctions, and disincentives to violators.
o Supportservicesforbeneficiariesentailthe improvement of their productivity through investment promotions in infrastructure, credit, and social capital. As programs and projects are planned and implemented, the focus on delivery of outputs should be tied with the achievement of long-term outcomes (poverty alleviation, security of tenure, economically sustainable beneficiaries, accessibility of basic services, etc.). To ensure that scarce resources are distributed optimally, an efficient mechanism in program development should target beneficiaries. CSOsmust be enjoined through increasing partnerships for their capabilities and expertise in delivering support services.
o Promote transparency, accountability, andparticipationofCSOsintheasset
ANGOC
reform process (planning, budgeting, implementation, monitoring and evaluation). With government agencies and local government units (LGUs), established forms of cooperation and coordination must be nurtured and sustained.
Context: status of land reform
The Philippines has reported on a number of gains made in agrarian reform and other land issues. In 2009, a major hurdle was overcome with the approval of the extension of the Comprehensive Agrarian Reform Program (CARPER) up to June 2014. The additional funding of Php150 billion as well as other program provisions would greatly accelerate ongoing efforts in asset reform.
This report focuses on progress in the key areas of land acquisition and distribution, security of tenure, and provision of support services for three critically impoverished sectors of the country—farmers, fishing communities, and indigenous peoples. After decades of implementing reforms, there is much to be done to improve their situation. More than 600,000 agrarian reform beneficiaries are still awaiting the distribution of almost 1 million ha of land. Fishers residing in 94% of coastal municipalities are not protected by established local ordinances in delineating their waters. Indigenous peoples are still waiting to be granted titles to about 55% of ancestral domains.
Without clear ownership of their lands, these sectors continue to become victims of land grabbing, illegal encroachment of commercial
fishers, overlapping land claims by those in extractive activities, and agrarian disputes and conflicts in resource use, resulting in human rights violations. Without strong support services from concerned government bodies and CSOs, these sectors have limitedcapabilities to benefit from the infrastructure support, marketing assistance, alternative livelihoods, and basic social services programs.
ConceptualFramework
In principle, asset reform redistributes resource endowments to designated marginalized sectors. This is undertaken through a process that awards a tenurial instrument to target beneficiaries, providing them ownership and security of tenure over the asset. In the context of indigenous peoples, it is the recognition of their rights over ancestral domain.
To implement asset reform effectively, enabling policies, sufficient budget, and a capable bureaucracy are imperative. Access to land and security of tenure will contribute to poverty reduction through increased income. On the other hand, failures or shortcomings in asset reform will result in landlessness and conflict among target sectors, making them more vulnerable to increased poverty.
The monitoring indicators below are arranged by theme, as presented in the previous table (See Table 1).The same indicatorsmay alsobe classified based on the level in which monitoring is possible or the location of available data (from the national, regional, and local levels). The determining factor is the availability of data at various levels.
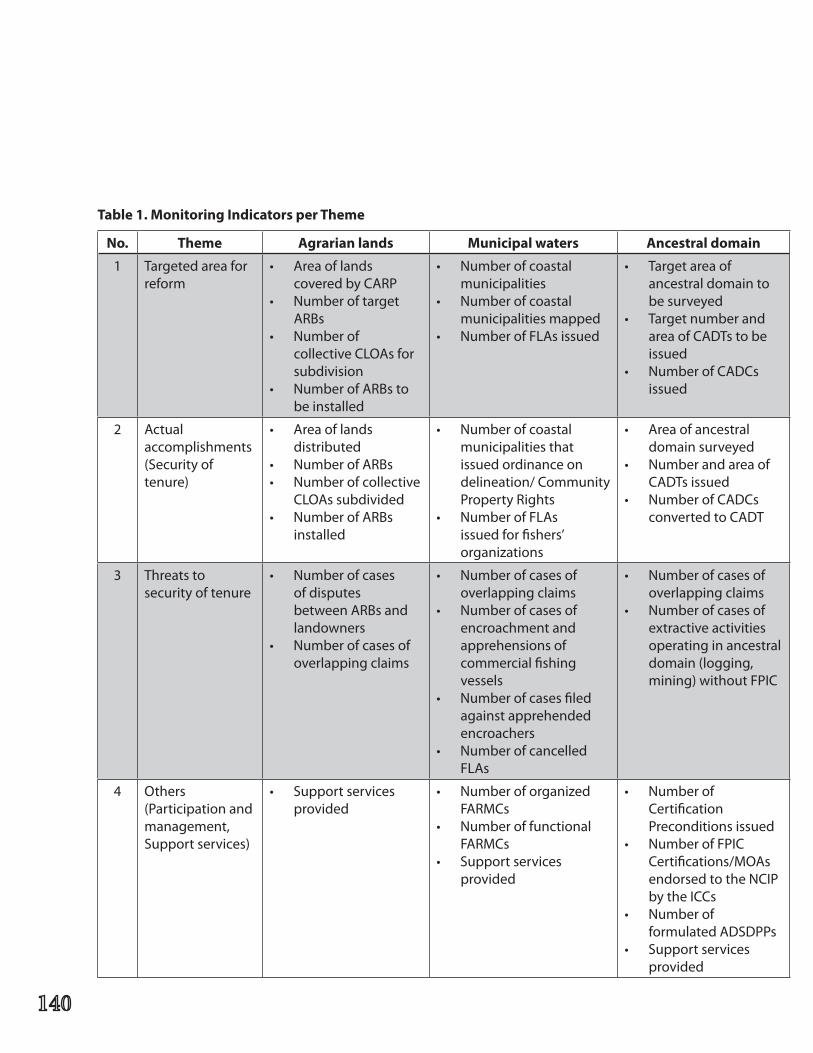
No. Theme Agrarian lands Municipalwaters Ancestral domain
1 Targeted area for reform
• Areaoflandscovered by CARP
• NumberoftargetARBs
• Numberofcollective CLOAs for subdivision
• NumberofARBstobe installed
• Numberofcoastalmunicipalities
• Numberofcoastalmunicipalities mapped
• NumberofFLAsissued
• Targetareaofancestral domain to be surveyed
• Targetnumberandarea of CADTs to be issued
• NumberofCADCsissued
2 Actual accomplishments(Securityoftenure)
• Areaoflandsdistributed
• NumberofARBs• Numberofcollective
CLOAs subdivided• NumberofARBs
installed
• Numberofcoastalmunicipalities that issued ordinance on delineation/ Community Property Rights
• NumberofFLAsissued for fishers’ organizations
• Areaofancestraldomain surveyed
• NumberandareaofCADTs issued
• NumberofCADCsconverted to CADT
3 Threats to security of tenure
• Numberofcasesof disputes between ARBs and landowners
• Numberofcasesofoverlapping claims
• Numberofcasesofoverlapping claims
• Numberofcasesofencroachment and apprehensions of commercial fishing vessels
• Numberofcasesfiledagainst apprehended encroachers
• NumberofcancelledFLAs
• Numberofcasesofoverlapping claims
• Numberofcasesofextractive activities operating in ancestral domain (logging, mining) without FPIC
4 Others (Participation and management, Supportservices)
• Supportservicesprovided
• NumberoforganizedFARMCs
• NumberoffunctionalFARMCs
• Supportservicesprovided
• NumberofCertification Preconditions issued
• NumberofFPICCertifications/MOAs endorsed to the NCIP by the ICCs
• NumberofformulatedADSDPPs
• Supportservicesprovided
Table1.MonitoringIndicatorsperTheme
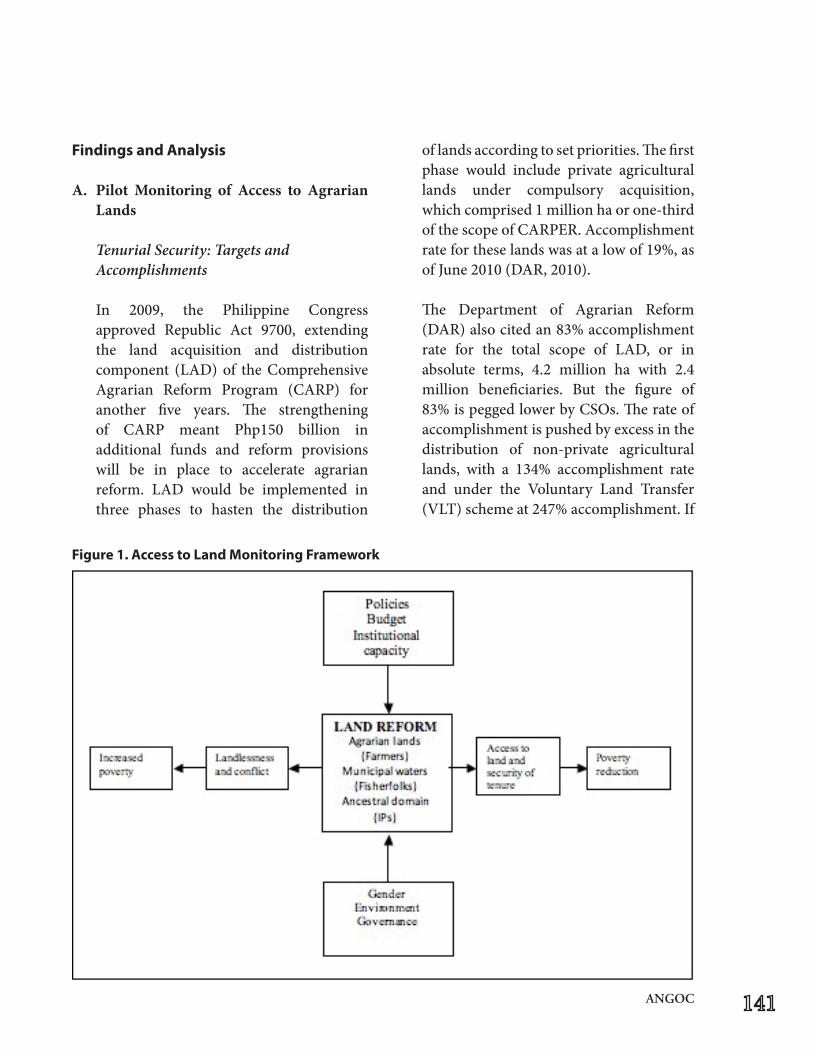
ANGOC
Findings and Analysis
A. Pilot Monitoring of Access to Agrarian Lands
Tenurial Security: Targets and Accomplishments
In 2009, the Philippine Congress approved Republic Act 9700, extending the land acquisition and distribution component (LAD) of the Comprehensive Agrarian Reform Program (CARP) for another five years. The strengthening of CARP meant Php150 billion in additional funds and reform provisions will be in place to accelerate agrarian reform. LAD would be implemented in three phases to hasten the distribution
of lands according to set priorities. The first phase would include private agricultural lands under compulsory acquisition, which comprised 1 million ha or one-third of the scope of CARPER. Accomplishment rate for these lands was at a low of 19%, as of June 2010 (DAR, 2010).
The Department of Agrarian Reform (DAR) also cited an 83% accomplishment rate for the total scope of LAD, or in absolute terms, 4.2 million ha with 2.4 million beneficiaries. But the figure of 83%ispeggedlowerbyCSOs.Therateofaccomplishment is pushed by excess in the distribution of non-private agricultural lands, with a 134% accomplishment rate and under the Voluntary Land Transfer (VLT) scheme at 247% accomplishment. If
Figure1.AccesstoLandMonitoringFramework
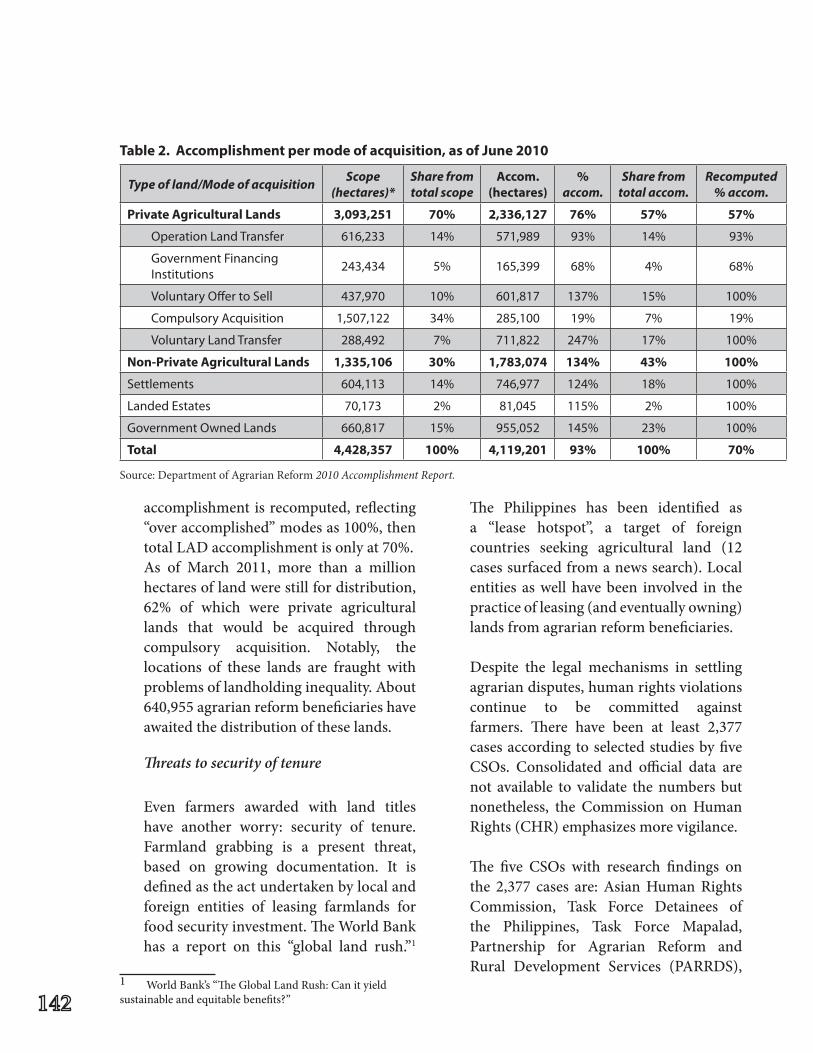
accomplishment is recomputed, reflecting “over accomplished” modes as 100%, then total LAD accomplishment is only at 70%.As of March 2011, more than a million hectares of land were still for distribution, 62% of which were private agricultural lands that would be acquired through compulsory acquisition. Notably, the locations of these lands are fraught with problems of landholding inequality. About 640,955 agrarian reform beneficiaries have awaited the distribution of these lands.
Threats to security of tenure
Even farmers awarded with land titles have another worry: security of tenure. Farmland grabbing is a present threat, based on growing documentation. It is defined as the act undertaken by local and foreign entities of leasing farmlands for food security investment. The World Bank has a report on this “global land rush.”1
1 World Bank’s “The Global Land Rush: Can it yield sustainable and equitable benefits?”
The Philippines has been identified as a “lease hotspot”, a target of foreign countries seeking agricultural land (12 cases surfaced from a news search). Local entities as well have been involved in the practice of leasing (and eventually owning) lands from agrarian reform beneficiaries.
Despite the legal mechanisms in settling agrarian disputes, human rights violations continue to be committed against farmers. There have been at least 2,377 cases according to selected studies by five CSOs. Consolidated and official data arenot available to validate the numbers but nonetheless, the Commission on Human Rights (CHR) emphasizes more vigilance.
The five CSOs with research findings onthe 2,377 cases are: Asian Human Rights Commission, Task Force Detainees of the Philippines, Task Force Mapalad, Partnership for Agrarian Reform and Rural Development Services (PARRDS),
Table2.Accomplishmentpermodeofacquisition,asofJune2010
Type of land/Mode of acquisition Scope(hectares)*
Share from total scope
Accom.(hectares)
%accom.
Share fromtotal accom.
Recomputed% accom.
PrivateAgriculturalLands 3,093,251 70% 2,336,127 76% 57% 57%
Operation Land Transfer 616,233 14% 571,989 93% 14% 93%
Government Financing Institutions
243,434 5% 165,399 68% 4% 68%
VoluntaryOffertoSell 437,970 10% 601,817 137% 15% 100%
CompulsoryAcquisition 1,507,122 34% 285,100 19% 7% 19%
Voluntary Land Transfer 288,492 7% 711,822 247% 17% 100%
Non-PrivateAgriculturalLands 1,335,106 30% 1,783,074 134% 43% 100%
Settlements 604,113 14% 746,977 124% 18% 100%
Landed Estates 70,173 2% 81,045 115% 2% 100%
Government Owned Lands 660,817 15% 955,052 145% 23% 100%
Total 4,428,357 100% 4,119,201 93% 100% 70%
Source: Department of Agrarian Reform 2010 Accomplishment Report.
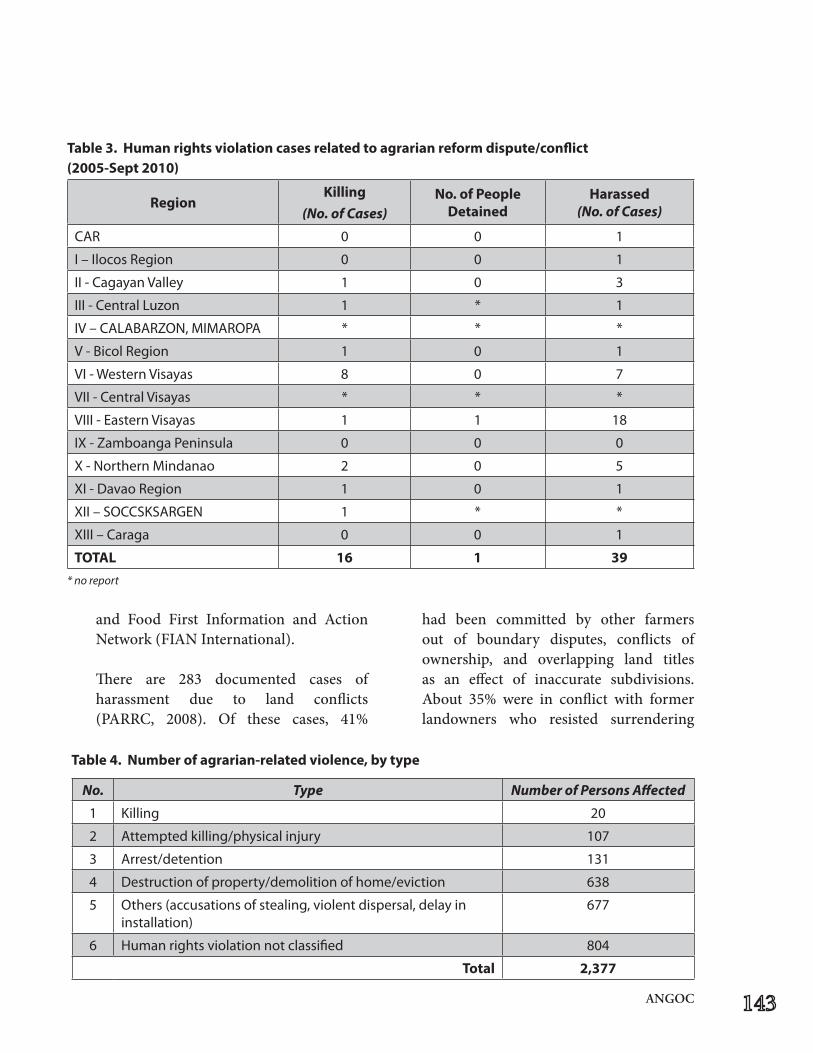
ANGOC
and Food First Information and Action Network (FIAN International).
There are 283 documented cases of harassment due to land conflicts (PARRC, 2008). Of these cases, 41%
had been committed by other farmers out of boundary disputes, conflicts of ownership, and overlapping land titles as an effect of inaccurate subdivisions. About 35% were in conflict with former landowners who resisted surrendering
Table3.Humanrightsviolationcasesrelatedtoagrarianreformdispute/conflict(2005-Sept2010)
RegionKilling
(No. of Cases)No.ofPeople
DetainedHarassed
(No. of Cases)
CAR 0 0 1
I–IlocosRegion 0 0 1
II - Cagayan Valley 1 0 3
III - Central Luzon 1 * 1
IV–CALABARZON,MIMAROPA * * *
V - Bicol Region 1 0 1
VI - Western Visayas 8 0 7
VII - Central Visayas * * *
VIII - Eastern Visayas 1 1 18
IX - Zamboanga Peninsula 0 0 0
X - Northern Mindanao 2 0 5
XI - Davao Region 1 0 1
XII–SOCCSKSARGEN 1 * *
XIII–Caraga 0 0 1
TOTAL 16 1 39* no report
No. Type Number of Persons Affected
1 Killing 20
2 Attempted killing/physical injury 107
3 Arrest/detention 131
4 Destruction of property/demolition of home/eviction 638
5 Others (accusations of stealing, violent dispersal, delay in installation)
677
6 Human rights violation not classified 804
Total 2,377
Table4.Numberofagrarian-relatedviolence,bytype
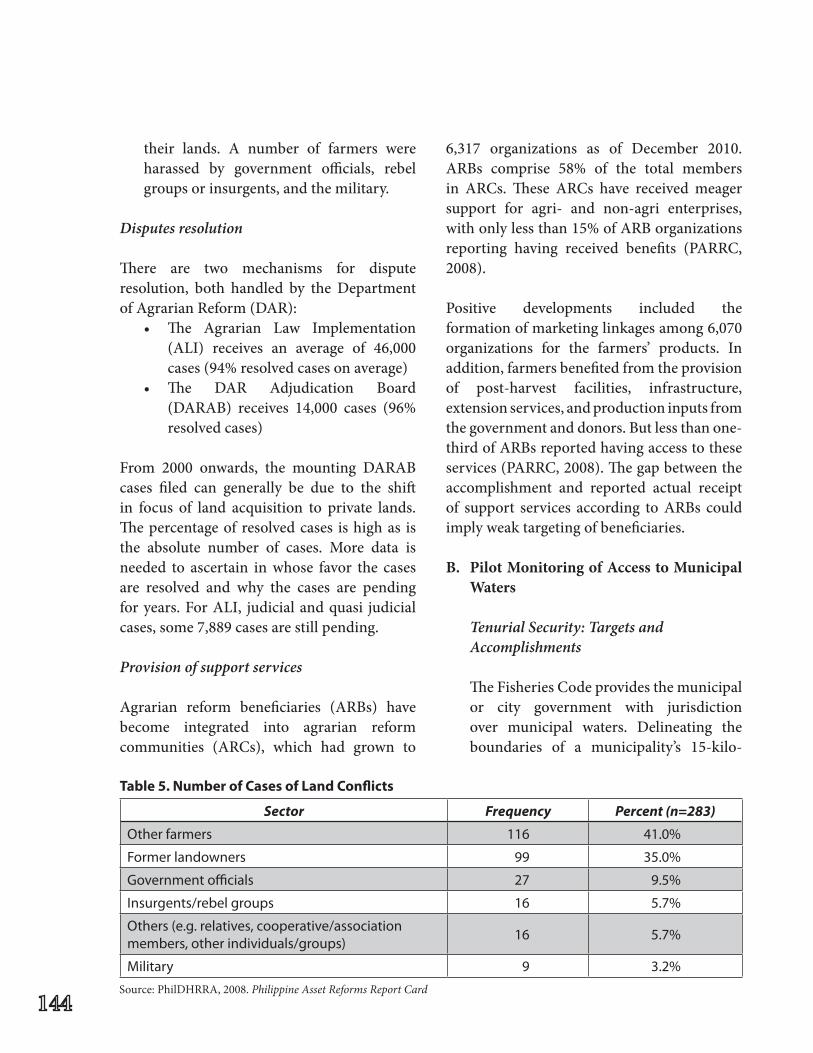
their lands. A number of farmers were harassed by government officials, rebel groups or insurgents, and the military.
Disputes resolution
There are two mechanisms for dispute resolution, both handled by the Department of Agrarian Reform (DAR):
• The Agrarian Law Implementation(ALI) receives an average of 46,000 cases (94% resolved cases on average)
• The DAR Adjudication Board(DARAB) receives 14,000 cases (96% resolved cases)
From 2000 onwards, the mounting DARAB cases filed can generally be due to the shift in focus of land acquisition to private lands. The percentage of resolved cases is high as is the absolute number of cases. More data is needed to ascertain in whose favor the cases are resolved and why the cases are pending for years. For ALI, judicial and quasi judicial cases, some 7,889 cases are still pending.
Provision of support services
Agrarian reform beneficiaries (ARBs) have become integrated into agrarian reform communities (ARCs), which had grown to
6,317 organizations as of December 2010. ARBs comprise 58% of the total members in ARCs. These ARCs have received meager support for agri- and non-agri enterprises, with only less than 15% of ARB organizations reporting having received benefits (PARRC, 2008).
Positive developments included the formation of marketing linkages among 6,070 organizations for the farmers’ products. In addition, farmers benefited from the provision of post-harvest facilities, infrastructure, extension services, and production inputs from the government and donors. But less than one-third of ARBs reported having access to these services (PARRC, 2008). The gap between the accomplishment and reported actual receipt of support services according to ARBs could imply weak targeting of beneficiaries.
B. Pilot Monitoring of Access to Municipal Waters
Tenurial Security: Targets and Accomplishments
The Fisheries Code provides the municipal or city government with jurisdiction over municipal waters. Delineating the boundaries of a municipality’s 15-kilo-
Sector Frequency Percent (n=283)
Other farmers 116 41.0%
Former landowners 99 35.0%
Government officials 27 9.5%
Insurgents/rebel groups 16 5.7%
Others (e.g. relatives, cooperative/association members, other individuals/groups)
16 5.7%
Military 9 3.2%
Table5.NumberofCasesofLandConflicts
Source: PhilDHRRA, 2008. Philippine Asset Reforms Report Card
ANGOC
meter municipal waters is a prerequisite for the sustainable management of fishery resources, fishery law enforcement, and granting the preferential rights of municipal fishers within the 15-kilometer zone (Section18).Fournationalagenciesand Local Government Units (LGUs) assist the implementation of activities for delineation, according to their respective expertise.
As of January 2011, 920 coastal municipalities and cities had been identi-fied and mapped with technical descrip-tions, all of which were furnished to the LGUs for review and proper action. Only one-third of the LGUs eventually certified the technical descriptions or maps, while 69% of the LGUs requested revisions. Only 6% or 55 LGUs have issued local ordinances delineating their municipal waters.
The Fisheries Code likewise provides for the issuance of fishpond lease agreements (FLAs) for public lands that may be declared available for development on a commercial scale. Preference will be given to qualified fishers’ cooperatives and small and medium enterprises(SMEs).Reforestationactivitieswere also mandated for riverbanks, bays, streams, and the shore area fronting the dike of the fishpond. About 4,522 FLAs were issued from 1973 until 2010, covering almost 60,000 ha (BFAR, 2011). However, only a single FLA was issued to a fishing organization.
By law, unproductive fishpond developments should be sanctioned with cancellations of their FLA. As of 2010, 11% of total FLA scope (or 6,389 ha) had
been cancelled; however, only 36% of the cancelled FLAs (or 1,443 ha) was reverted back to DENR for reforestation.
Threats to Security of Tenure
The majority of the country’s fishers (almost 85%) are municipal fishing peoples who contribute 46% of total fish catch using non-motorized bancas (small fishing boats made of wood). But these 1.3 million municipal fishers are given access rights to only 12% of Philippine waters. In an effort to protect their access area, 81 municipalities rejected issuing permits to commercial fishers. However, a considerable number of commercial fishers are not dissuaded by withheld permits, strict guidelines, and even outright prohibitions. 53.1% of the municipalities reported the ongoing conduct of operations among commercial fishers. About 56.8% of respondents claimed that commercial fishers encroached on their municipal waters, and were apprehended by the concerned LGU (PARRC, 2008).
Poaching or fishing by foreign entities in Philippine waters also threatens the security of tenure of fishing communities. Section87oftheFisheriesCodeprohibitsthese practices but they have persisted. As of 2010, 30 shipping vessels were apprehended (BFAR, 2011); unfortunately, only 18 of them (60%) were levied with administrative/criminal cases.
Support Services Provision
According to BFAR, municipal fisheries production has increased over time from
profitable activities, mainly aquaculture, the biggest contributor in recent years. In 2009, the fisheries sector reached a 2.4% increase in production compared to its 2008 performance. Per subsector, municipal fisheries contribute 26% of total production or 1.347 million metric tons.
In addition, some of the accomplishments cited in the 2009 Annual Report are found in Table 6. The report highlights outputs and not outcomes, for instance, increase in the income of small fisherfolk. There was also no mention of provision of fishers’ settlements (as mandated in the Fisheries Code) and basic services, such as health and education services.
Reports from another government agency, the National Statistical CoordinationBoard (NCSB), confirm that fishingpeoples remain among the very poor in the country. Poverty incidence is highest among the fisheries sector at almost 50%, or almost half a million poor fisherfolk. Their entrapment in poverty is guaranteed by the absence of alternate livelihood and access to basic services (PARRC, 2008). Only one-fourth of the total respondents in this study (26.1%) had access to only one of all the support services provided by government (i.e. post-harvest facilities, infrastructure, and extension services).
In terms of management, the Fisheries Code mandates the establishment of the Fisheries and Aquatic Resources Management Council (FARMC) at the national level and in all municipalities/citieswithmunicipalwaters (Section69).The FARMC is a recommendatory body composed of representatives from the
government, fishing communities, and NGOs. FARMCs have been organized in 99% of coastal municipalities and cities (BFAR, 2009). In addition, 17 FARMCs were provided assistance on organizing/re-organizing while 1,995 of them have been strengthened. A FARMC monitoring and evaluation system was also developed.
C. Pilot monitoring of access to ancestral domain
Tenurial security: targets and accomplishments
The ancestral land areas of indigenous peoples amount to an estimate of 7.7 million ha, according to the National Commission on Indigenous Peoples (NCIP). As of 2010, the NCIP’s Ancestral Domain Office reported 286 applications for the Certificate of Ancestral Domain Title (CADT), of which 156 had already been approved. The approved area represents only 55% of total ancestral domain.
The Indigenous Peoples Rights Act or IPRA outlines the procedures for the identification, delineation, and recognition of ancestral domains. The application process for a Certificate of Ancestral Domain Title (CADT) is long and rigorous. For direct applicants, the average processing time from application to approval of CADTs is 3.4 years (PARRC, 2008). The actual awarding of CADTs takes another 6.35 months on average. Holders of CADC who were in the process of converting to CADTs, had already been waiting an average of 4.45 years for their titles to be issued and awarded. For both processes, there seems to be no clear
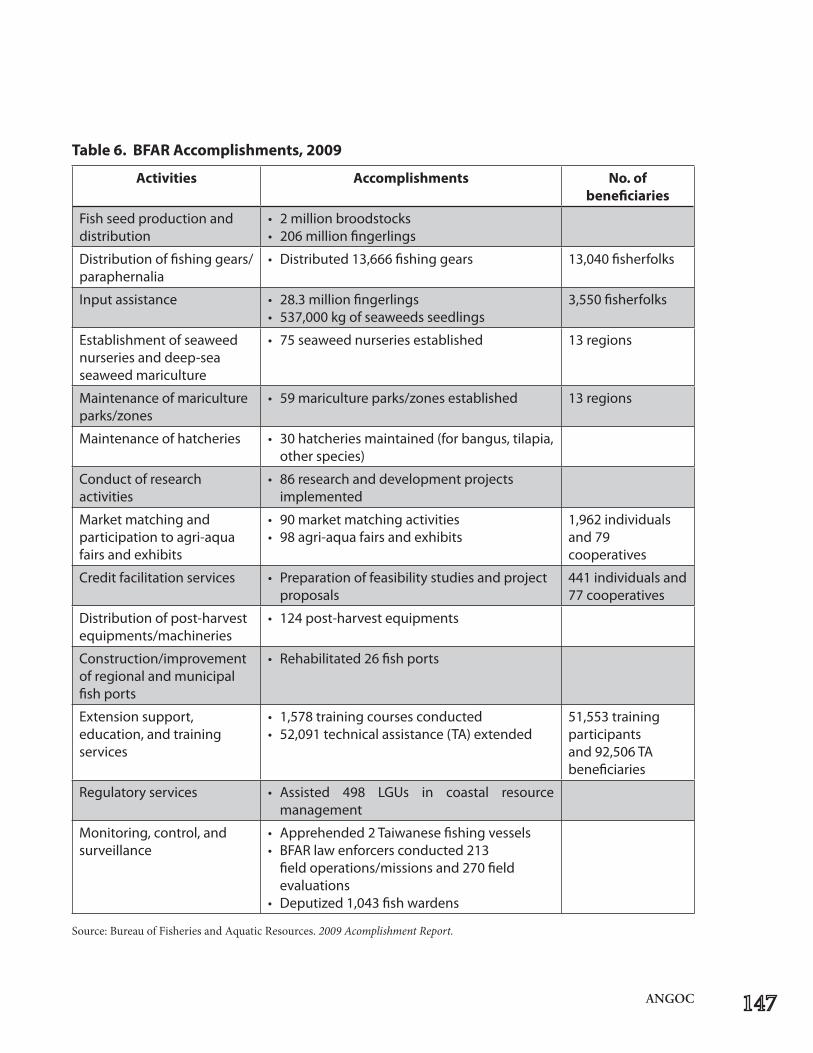
ANGOC
Activities Accomplishments No. of beneficiaries
Fish seed production and distribution
• 2millionbroodstocks• 206millionfingerlings
Distribution of fishing gears/ paraphernalia
• Distributed13,666fishinggears 13,040fisherfolks
Input assistance • 28.3millionfingerlings• 537,000kgofseaweedsseedlings
3,550 fisherfolks
Establishment of seaweed nurseries and deep-sea seaweed mariculture
• 75seaweednurseriesestablished 13 regions
Maintenance of mariculture parks/zones
• 59maricultureparks/zonesestablished 13 regions
Maintenance of hatcheries • 30hatcheriesmaintained(forbangus,tilapia,other species)
Conduct of research activities
• 86researchanddevelopmentprojectsimplemented
Market matching and participationtoagri-aquafairs and exhibits
• 90marketmatchingactivities• 98agri-aquafairsandexhibits
1,962individualsand79cooperatives
Credit facilitation services • Preparationoffeasibilitystudiesandprojectproposals
441individualsand77cooperatives
Distribution of post-harvest equipments/machineries
• 124post-harvestequipments
Construction/improvement of regional and municipal fish ports
• Rehabilitated26fishports
Extension support, education, and training services
• 1,578trainingcoursesconducted• 52,091technicalassistance(TA)extended
51,553 training participants and92,506TAbeneficiaries
Regulatory services • Assisted 498 LGUs in coastal resourcemanagement
Monitoring, control, and surveillance
• Apprehended2Taiwanesefishingvessels• BFARlawenforcersconducted213
fieldoperations/missionsand270fieldevaluations
• Deputized1,043fishwardens
Table6.BFARAccomplishments,2009
Source: Bureau of Fisheries and Aquatic Resources. 2009 Acomplishment Report.
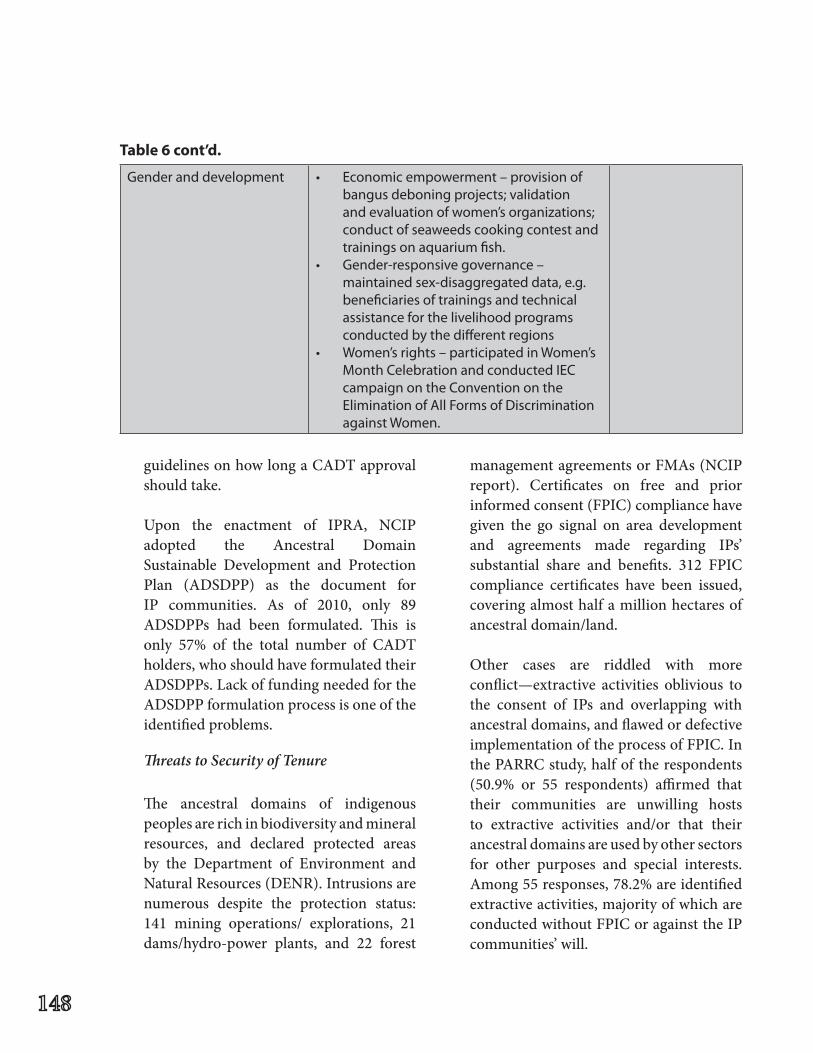
Gender and development • Economicempowerment–provisionofbangus deboning projects; validation and evaluation of women’s organizations; conduct of seaweeds cooking contest and trainingsonaquariumfish.
• Gender-responsivegovernance–maintained sex-disaggregated data, e.g. beneficiaries of trainings and technical assistance for the livelihood programs conducted by the different regions
• Women’srights–participatedinWomen’sMonth Celebration and conducted IEC campaign on the Convention on the Elimination of All Forms of Discrimination against Women.
Table6cont’d.
guidelines on how long a CADT approval should take.
Upon the enactment of IPRA, NCIP adopted the Ancestral Domain Sustainable Development and ProtectionPlan (ADSDPP) as the document forIP communities. As of 2010, only 89 ADSDPPs had been formulated. This isonly 57% of the total number of CADT holders, who should have formulated their ADSDPPs.LackoffundingneededfortheADSDPPformulationprocessisoneoftheidentified problems.
Threats to Security of Tenure
The ancestral domains of indigenous peoples are rich in biodiversity and mineral resources, and declared protected areas by the Department of Environment and Natural Resources (DENR). Intrusions are numerous despite the protection status: 141 mining operations/ explorations, 21 dams/hydro-power plants, and 22 forest
management agreements or FMAs (NCIP report). Certificates on free and prior informed consent (FPIC) compliance have given the go signal on area development and agreements made regarding IPs’ substantial share and benefits. 312 FPIC compliance certificates have been issued, covering almost half a million hectares of ancestral domain/land.
Other cases are riddled with more conflict—extractive activities oblivious to the consent of IPs and overlapping with ancestral domains, and flawed or defective implementation of the process of FPIC. In the PARRC study, half of the respondents (50.9% or 55 respondents) affirmed that their communities are unwilling hosts to extractive activities and/or that their ancestral domains are used by other sectors for other purposes and special interests. Among 55 responses, 78.2% are identified extractive activities, majority of which are conducted without FPIC or against the IP communities’ will.
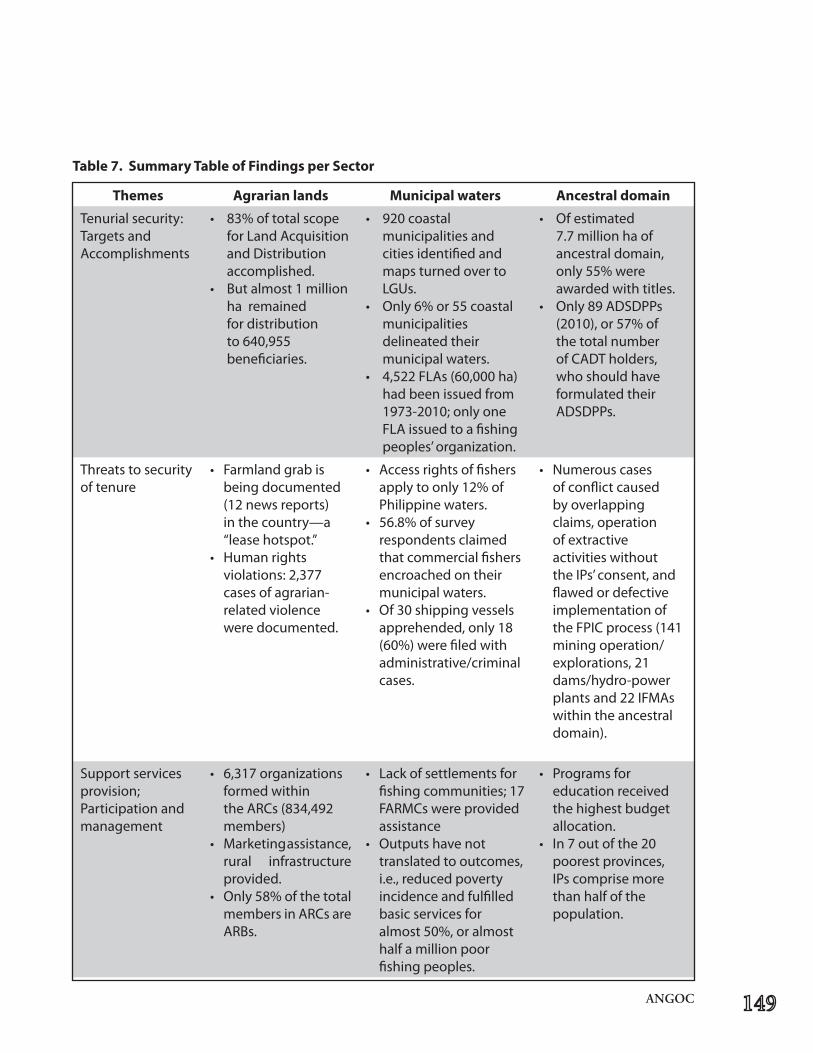
ANGOC
Themes Agrarian lands Municipalwaters Ancestral domain
Tenurial security: Targets and Accomplishments
• 83%oftotalscopeforLandAcquisitionand Distribution accomplished.
• Butalmost1millionha remained for distribution to640,955beneficiaries.
• 920coastalmunicipalities and cities identified and maps turned over to LGUs.
• Only6%or55coastalmunicipalities delineated their municipal waters.
• 4,522FLAs(60,000ha)had been issued from 1973-2010;onlyoneFLA issued to a fishing peoples’ organization.
• Ofestimated7.7millionhaofancestral domain, only 55% were awarded with titles.
• Only89ADSDPPs(2010),or57%ofthe total number of CADT holders, who should have formulated their ADSDPPs.
Threats to security of tenure
• Farmlandgrabisbeing documented (12 news reports) in the country—a “lease hotspot.”
• Humanrightsviolations:2,377cases of agrarian-related violence were documented.
• Accessrightsoffishersapply to only 12% of Philippine waters.
• 56.8%ofsurveyrespondents claimed that commercial fishers encroached on their municipal waters.
• Of30shippingvesselsapprehended,only18(60%)werefiledwithadministrative/criminal cases.
• Numerouscasesofconflictcausedby overlapping claims, operation of extractive activities without the IPs’ consent, and flawedordefectiveimplementation of theFPICprocess(141mining operation/explorations, 21 dams/hydro-power plants and 22 IFMAs within the ancestral domain).
Supportservicesprovision; Participation and management
• 6,317organizationsformed within theARCs(834,492members)
• Marketingassistance,rural infrastructure provided.
• Only58%ofthetotalmembers in ARCs are ARBs.
• Lackofsettlementsforfishingcommunities;17FARMCs were provided assistance
• Outputshavenottranslated to outcomes, i.e., reduced poverty incidence and fulfilled basic services for almost 50%, or almost half a million poor fishing peoples.
• Programsforeducation received the highest budget allocation.
• In7outofthe20poorest provinces, IPs comprise more than half of the population.
Table7.SummaryTableofFindingsperSector
Support Services Provision
Development services for IPs as provided by the NCIP include: 1) social and cultural support services, 2) leadership capability and skills training services, 3) assistance for ADSDPP implementation,and 4) Certification Precondition for FBI and Certificate of Compliance for FPIC. Health projects, educational assistance, livelihood projects, and basic services are included under the first package of services, however, detailed performance indicators are lacking with regard to the specific services delivered (for instance, infrastructure, potable water system, medicine and maternal health care, etc.).
The NCIP provided a budget performance report for programs on education, culture, and health implemented in 2010. Education received the highest budget allocation.
Almost three-fourths (74.1%) of the respondents covered by the PARRC study have access to support services involving infrastructure and extension services most of which are provided by government (92.5%). However, worsening circumstances and living conditions among IPs belie the accomplishments of supposed support distributions. An increase in poverty incidence in IP regions had been reported by ADB (2002). Insufficient supply of food and potable water, alternative livelihood, and lack of medical and educational assistance are among the most urgent problems (Chauhan, 2005; ADB, 2002). In a later study (2006), it was found that IPs remained highly disadvantaged—among the top 20 poorest provinces in the country, 7 had populations comprised in the majority by IPs (more than 50%).
Based on the findings and analyses, several observations were made:
• The continuing delays (“backlogs”) block the issuance of tenurial
instruments for many farmers, fishing peoples, and indigenous peoples.
• Threats to tenurial security likewisepersist across sectors, aggravated by weak monitoring mechanisms or processes within the implementing agencies, unclear guidelines, and overlapping policies.
• Support services provided bygovernment need to be strengthened and strategically distributed for efficient targeting of beneficiaries.
• Finally,datagatheringprocessesposeaserious challenge for implementation, monitoring, and evaluation. Official data are difficult to come by, with the government not generating needed data.CSOstudiesenter thepictureasalternative data sources. Therefore, CSOsarepressedtobuildcapacityforgathering and managing data critical for land monitoring.
Recommendations
The identified issues of tenurial security, lack of support services for beneficiaries, and the lack of committed participation and effective management of services involving local governments and civil society demand urgent address. The following are policy and program recommendations:
o To meet the goals for tenurial security, the distribution of tenurial instruments must be expedited. Clear implementing guidelines on tenurial
ANGOC
security processes are needed, as well as harmonized policies on land and water use.
o Threats to security of tenure can be addressed by strengthening the monitoring and regulating mechanisms to ensure that the gains on asset reform are not reversed (national and local). Laws regulating extractive activities need to be strictly implemented, ensuring that penalties and sanctions for violators are served.
o Supportservicesforbeneficiariesentailthe improvement of their productivity through investment promotions in infrastructure, credit, and social capital. As programs and projects are planned and implemented, the focus on delivery of outputs should be tied with the achievement of long-term outcomes (poverty alleviation, security of tenure, economically sustainable beneficiaries, accessibility of basic services, etc.). Likewise, in program development, an efficient mechanism or process for targeting of beneficiaries should be developed to ensure that scarce resources benefit more people. GiventhecapabilitiesCSOstodelivervarious support services, increasing partnerships with them should be pursued.
o Promote transparency, accountability, andparticipationofCSOsintheassetreform process (planning, budgeting, implementation, monitoring, and evaluation). With government agencies and LGUs, there should be established forms of cooperation and coordination.
References
AsianNGOCoalition.SecuringtheRighttoLand:A CSOOverviewtoLandinAsia.2009.
Balisacan, A. Agrarian Reform and Poverty Reduction inthePhilippines.SoutheastAsianRegional CenterforGraduateStudyandResearchin Agriculture(SEARCA).PolicyDialogueon Agrarian Reform Issues in Rural Development and Poverty Alleviation, Traders Hotel, Manila. 2007.
Ballesteros, M. The Cost of Redistributive Land Reform in the Philippines: Assessment of PD 27 and RA 6657 (CARL). Philippine Institute for DevelopmentStudiesDiscussionPaperSeriesNo. 2010-09. 2010.
Bending,T.MonitoringSecureAccesstoLand: Progress and Prospects. Land Monitoring Handbook. International Land Coalition. 2010.
Department of Budget and Management. Book of Outputs of Departments/Agencies: Organizational Performance Indicators Framework of DAR, BFAR and NCIP. 2011
Braun, J. and Dick, R. “Land Grabbing” by Foreign Investors in Developing Countries: Risks and Opportunities. International Food Policy Research Institute Policy Brief 13. 2009.
Bureau of Fisheries and Aquatic Resources. Annual Report. 2009.
Daniel,S.,etal.(Mis)investmentinAgriculture:The Role of the International Finance Corporation in Global Land Grabs. The Oakland Institute. 2010.
Daniel,S.,etal.TheGreatLandGrab:RushforWorld’s FarmlandThreatensFoodSecurityforthePoor. The Oakland Institute. 2009.
Dela Cruz, J. The New Conquistadores And One Very Willing Colony: A Discussion on Global Land Grabbing and the Philippine Experience. Peoples Campaign for Agrarian Reform (AR Now!).2010.
Department of Agrarian Reform. Accomplishment Report. 2010.
Department of Agrarian Reform. Rules and Procedures of DARAB and ALI. Bureau of Agrarian Reform Information and Education (BARIE) and Communications Development Division (CDD). 2008.
International Fact-Finding Mission on Agrarian Reform Related Violations of Human Rights in the Philippines. Running amok: Landlord lawlessness and Impunity in the Philippines. 2006.
Jha,P.,etal.LandReformExperiences:SomeLessons from Across the Globe. Ekta Parishad, India. 2007.
Laksa, K. and El-Mikawy, N. Reflections on Land TenureSecurityIndicators.DiscussionPaper11. UNDP Oslo Governance Centre. 2009.
Land Watch Asia. Philippine Country Paper. 2008.
Leonen, M. CARP Institutional Assessment in a Post- 2008TransitionScenario:Reformsforthe AgrarianJusticeSystem.PhilippineInstitutefor DevelopmentStudiesDiscussionPaperSeriesNo. 2008-10.2008.
National Commission on Indigenous Peoples. Annual Report. 2009.
National Commission on Indigenous Peoples. Indigenous Peoples Masterplan (IPMAP). 2011
NationalStatisticsOffice.CensusofAgricultureand Fisheries. 2002.
Pangandaman, N. Philippine Agrarian Reform: PartnershipsforSocialJustice,RuralGrowth,and SustainableDevelopment.Countrypaper presented in the International Conference on Agrarian Reform and Rural Development, Brazil. 2006.
Philippine Alliance of Human Rights Advocates (PAHRA), et al. Land, Life and Justice: The Challenge of Agrarian Reform in the Philippines. An NGO Report on Agrarian Reform and Human RightsSituation.2006.
Philippine Human Rights Information Center (PhilRights). Philippine NGO Network Report on the Implementation of the International Covenant onEconomic,Social,andCulturalRights (ICESCR).2008.
Philippine Partnership for the Development of Human Resources in Rural Areas. Philippine Asset Reform Report Card (PARRC). 2008.
Task Force Mapalad. Cases of Agrarian Related Violence in TFM Landholdings. 2006.
Virola,R.2009OfficialPovertyStatistics.Presentation fortheNationalStatisticalCoordinationBoard. February 2011.
World Bank. Land Reform, Rural Development, and Poverty Reduction in the Philippines: Revisiting the Agenda. 2009.
World Organization Against Torture. Preventing Torture and other Cruel, Inhuman and Degrading Treatment in the Philippines by Acting on their Economic,SocialandCulturalRootCauses:An alternative report to the Committee Against Torture. 2009.
ANGOC
CSOLandReformMonitoringAUser’sGuideforLandRightsAdvocates*
This user’s guide is considered a work-in-progress. It is a modest contribution of ANGOCandLandWatchAsiatoenhancethecapacitiesofCSOstomonitorlandpolicies and programs and advocate for land rights. We hope that as land reform monitoringforCSOsexpands,enhancementswillbemadetothisinitialguide.PreparedbyCatherineLiamzonandreviewedbyNathanielDonE.Marquez.
IntroducingtheCSOLandMonitoringInitiative
GettingStarted
Indicators for Monitoring
Getting Organized
Additional Resources
AnnexA:SuggestedOutlineforCountryLand Reform Monitoring Report
Annex B: Presenting your Results
Annex C: Land Reform Development Report/Index
References
Contents
155
158
170
191
201
208
210
215
221
ANGOC
ithout effective monitoring, advocacy efforts are impaired. Civil society organisations have learned from experience that to secure land rights for the rural poor, they must back their
advocacy with solid, accurate and up-to-date data gathered from monitoring activities,inordertoinfluencepolicies.Storiesfromthefieldenablepeopleto deepen their understanding of the plight of the landless; when these are supplemented with numbers, they speak strongly and convincingly about the urgency of land reform in Asia.
ManyCSOsworkcloselywithpeopleatthegrassrootslevel.Theyhavefirst-hand knowledge and experience, not to mention a deep understanding of people’sissuesandwhatreallygoesoninthecountryside.CSOshaveoftenhelped the rural and landless poor find their voice amidst global trends andcommercialpressures.Still,manyofthemadmitlackingthenecessarydocumentation and research to inform their advocacy.CSOs themselvesacknowledge the need to strengthen their capacities in undertaking research, including monitoring.
But to organize all the monitoring data and to ensure that monitoring becomes continuous (rather than a one-off activity that ceases once the report has been written up and printed) and a regular part of advocacy – is anareathatcouldbefurtherimproved.Thefactremains:CSOscanbringsomuch value into land reform monitoring. Looking at things that tend to be glossedoverbygovernmentsandmultilateralinstitutions,CSOsshowwhat need to be monitored. They highlight these often neglected yet salient and urgent features, for instance landlessness, land disputes and evictions. In the process,CSOsprovideandpushforalternativeperspectivesandindicatorson land rights.
In this context, ANGOC and the Land Watch Asia network have launched a CSO Land ReformMonitoring Initiative.The first fruit this initiativehas borne is a framework to guide Land Watch Asia partners in particular andCSOsingeneral,astheyassumetheresponsibilityofmonitoringlandreforms in several Asian countries. This framework zooms in on land tenure andaccesstolandandprovidesasystematicwayforCSOstoembarkon
Introducing the CSO LandReformMonitoringInitiative
monitoring, including collaborating in the process with other stakeholders such as the academe, research institutions, and media. It ultimately focuses on outcomes or results, but also examines the inputs and processes that go into land reform monitoring. Many questions persist: Has the promise of agrarian reform and access to land been delivered? Is land reform moving in the right direction? Do farmers enjoy more secure land tenure now than before?ThisCSOmonitoringinitiativestrivestoanswersuchquestions,toeventually bear more fruit in the form of land reform development reports for various countries.
OverviewoftheUser’sGuide Before you begin
This user’s guide in your hands was crafted to guide civil society organizations as they embark on the uniquely challenging task of monitoring land reforms intheirrespectivecountries.Simplyput,thisguideisawaythroughwhichwe can ensure a credible Land Reform Development Report – which ultimately depends on the quality of our data gathering. A common framework and a common methodology, when ably used by all focal points, should help us look at the same aspects on land reform and subject these to a thorough analysis. The conclusions we draw should inform our individual and collective (as an Asian regional network) land advocacies and actions for change.
This user’s guide seeks to explain the context of the monitoring initiative, providing the conceptual framework, rationale, scope, limitations, assumptions, and glossary. This includes the establishment of definitions to be consistently used in monitoring. Also, it provides information on methodology, including possible data sources and references, as well as available tools and approaches.
Experiences and lessons from documenting the piloting process of the monitoring framework in Bangladesh, Indonesia and the Philippines have substantively contributed to the user’s guide. Various individuals and groups have also enriched this guide, through consultations, regional workshops and peer reviews: the collective knowledge of the Land Watch Asia network; ourexpertsDr.AbulBarkatandDr.LaksmiSavitri;DeanRoelRavanera;Dr. Hans Meliczek; Dr. Marideth Bravo; Antonio Quizon; Annalisa Mauro; Dr. Praveen Jha; and lastly, members and partners of ANGOC and of ILC.
ANGOC
The lay of the land This user’s guide is divided into four main sections. The first chapter, Getting Started, gives a simple introduction to the monitoring framework, about the scope, indicators, andmechanisms formonitoring.CSOsare sure toencounter challenges to monitoring; a short discussion is given here on how to address these.
The second section on Indicators for Monitoring constitutes the heart of this guidebook. We have tried to deconstruct jargon or highly technical information on the indicators, into simpler and easier terms. Likewise, we suggest here a range of tools for data gathering, adding some tips and comments to help you along the way.
Getting Organized explains the administrative tasks involved in monitoring, particularly the establishment of a national monitoring team guided by and supported by, respectively, a steering committee and a secretariat to ensure the smooth flow of monitoring. Essentially, we offer suggestions in going about writing up the report. It also contains the proposed outline for writing the report and tips on presenting your results.
Given the importance of other initiatives, we devote the last section to Additional Resources to enhance and complement your research.
A list of References occupies the last section, to acknowledge the sources we drew from in preparing this guide. Those who would like to learn more about the topics covered can start here.
Whywearehere:ASummaryoftheCSOLandReformMonitoringFramework
s most Asian governments have legislations or existing programs on land and agrarian reforms, poverty and a highly skewed land ownership pattern within and across countries continue to mar
the region. At the same time, new developments negatively affect the terrain of land ownership and tenure such as increasing and intensifying competition for land requires brought by investments on land, whether from governments and the corporate sector within or external to Asia.
ItisthusimportantforCSOstoconstantlyengagenationalgovernmentsinpolicy discussions and monitoring developments in land tenure and access to land. By articulating the concerns and providing evidence-based data onthesituationoffarmersandothervulnerablegroups,CSOsinformandinfluence policy. At the end of the day, any reform should lead to improved quality of life of the small food producers.
For some countries, essential land reform programs are non-existent, thereby raising the question: How can you monitor land reform if it hasn’t been implemented yet? The policies may be in place, but they remain unimplemented. Our choice of indicators – as will be discussed in more detail in the next section – can still be monitored though no official land reform program may be really existent (as opposed to nominal existence) at this time.
In addition, though we recognize that “land reform” may only connote land distribution, while “agrarian reform” is broader to include fisheries and forestry, support services, and structural change in the access and ownership of land, in this monitoring initiative, we use “land” reform and “agrarian reform” indistinctly.
Finally, we have chosen to focus monitoring efforts on land tenure and access to land. The framework assumes that by strengthening land tenure and access, we will achieve food security and reduce poverty. Landlessness, in contrast, leads to conflicts and violence. We recognize how critical
Getting StartedThis section tells you what you need to know the CSO Land Reform Monitoring framework. It provides the monitoring roadmap, establishing the context, scope, indicators, and mechanisms for monitoring. At the end, we point out the various challenges CSOs face, and suggest ways to hurdle these and find motivation to pursue monitoring.
ANGOC
land is to the livelihoods of farmers, indigenous peoples, and women, and other land-based sectors. Land tenure security involves various rights and entitlements.
To understand more about the context of land reform monitoring, kindly refer to the CSO Land Reform Monitoring Framework in the first part of this publication.
Scope Civil society concerns tend to be broad that monitoring entails extensive processes. Land reformmonitoring is no exception.However, CSOs areusually challenged with limited resources and unsuitable mechanisms for monitoring. We thus define and target the scope and identify appropriate waysforCSOstoundertakemonitoringmorestrategically. CSOmonitoringencompassesotherland-relatedissues,aswellasbroadersocial issues like food security, poverty, governance and the environment. These are the issues that deserve our urgent attention, and will figure in the results and analyses of the monitoring initiative. But in a nutshell, the focus is on tracking the implementation status of agrarian reform programs.
Atwhatleveldowemonitor?Focus on the national level Land Watch Asia members work at the community, national and regional levels; some are also engaged at the global level. There are members who have already undertaken and even institutionalized land monitoring activities as part of their advocacy work.
Underlying this Asian CSO land reform monitoring initiative is theconviction that monitoring matters most at the national level. Monitoring has to be relevant to national processes and adaptable to national contexts.
Though India’s case may be slightly different, given its enormous size and its federal system, with agrarian reforms legislated and implemented at the state level, there are processes for which it is necessary to look at the central government.
The reality in Asia is that contexts vary from country to country. They have different histories, land policies, tenure systems, land administration systems,andexperiencesrelatingtoagrarianreform.Aswell,CSOcapacitiesand their relationships with governments and other institutions, all differ across countries. In terms of data, availability and accessibility diverge from country to country.
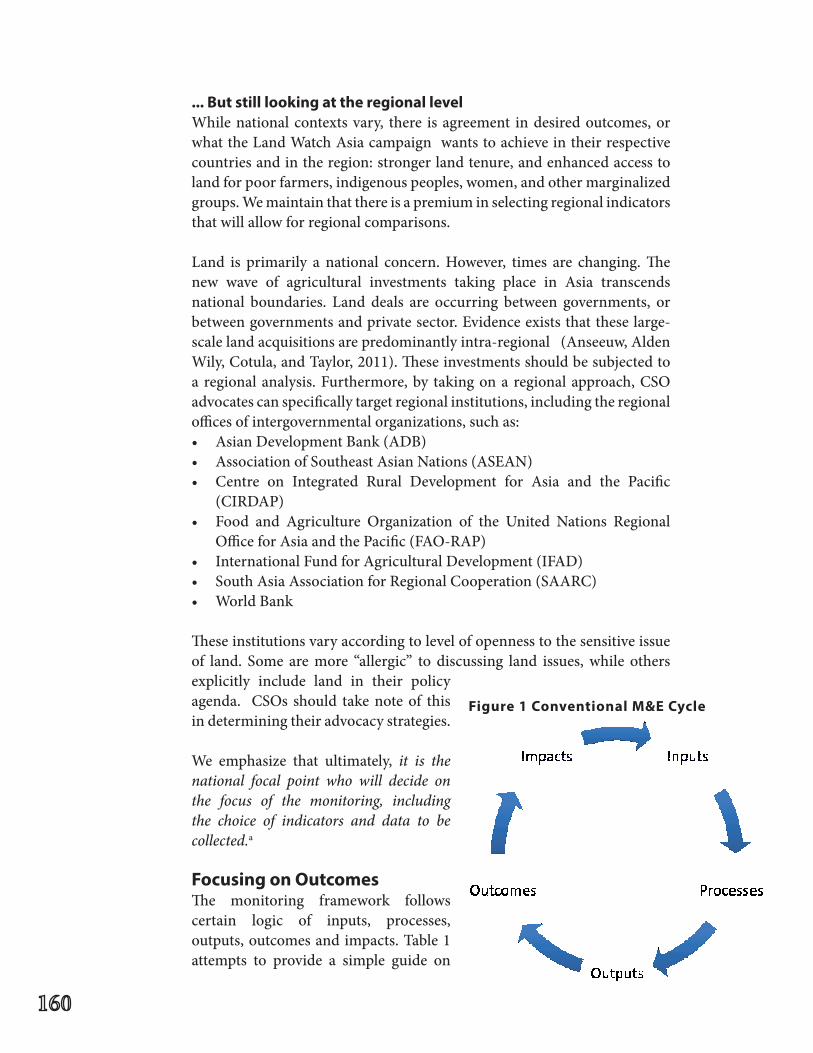
... But still looking at the regional levelWhile national contexts vary, there is agreement in desired outcomes, or what the Land Watch Asia campaign wants to achieve in their respective countries and in the region: stronger land tenure, and enhanced access to land for poor farmers, indigenous peoples, women, and other marginalized groups. We maintain that there is a premium in selecting regional indicators that will allow for regional comparisons.
Land is primarily a national concern. However, times are changing. The new wave of agricultural investments taking place in Asia transcends national boundaries. Land deals are occurring between governments, or between governments and private sector. Evidence exists that these large-scale land acquisitions are predominantly intra-regional (Anseeuw, Alden Wily, Cotula, and Taylor, 2011). These investments should be subjected to aregionalanalysis.Furthermore,by takingonaregionalapproach,CSOadvocates can specifically target regional institutions, including the regional offices of intergovernmental organizations, such as: • AsianDevelopmentBank(ADB)• AssociationofSoutheastAsianNations(ASEAN)• Centre on Integrated Rural Development for Asia and the Pacific
(CIRDAP) • Food and Agriculture Organization of the United Nations Regional
Office for Asia and the Pacific (FAO-RAP) • InternationalFundforAgriculturalDevelopment(IFAD)• SouthAsiaAssociationforRegionalCooperation(SAARC)• WorldBank
These institutions vary according to level of openness to the sensitive issue of land. Some aremore “allergic” to discussing land issues,while othersexplicitly include land in their policy agenda. CSOs should takenoteof thisin determining their advocacy strategies.
We emphasize that ultimately, it is the national focal point who will decide on the focus of the monitoring, including the choice of indicators and data to be collected.a
Focusing on Outcomes The monitoring framework follows certain logic of inputs, processes, outputs, outcomes and impacts. Table 1 attempts to provide a simple guide on
Figure1ConventionalM&ECycle
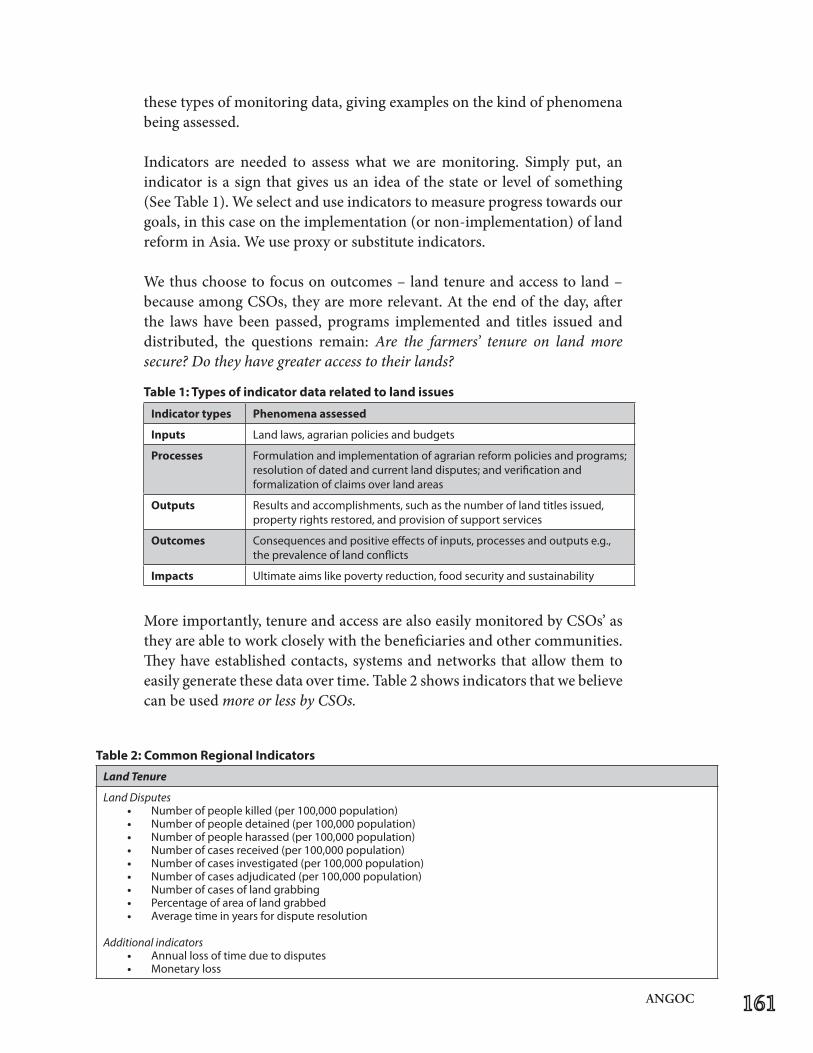
ANGOC
these types of monitoring data, giving examples on the kind of phenomena being assessed.
Indicators are needed to assess whatwe aremonitoring. Simply put, anindicator is a sign that gives us an idea of the state or level of something (SeeTable1).Weselectanduseindicatorstomeasureprogresstowardsourgoals, in this case on the implementation (or non-implementation) of land reform in Asia. We use proxy or substitute indicators.
We thus choose to focus on outcomes – land tenure and access to land – becauseamongCSOs,theyaremorerelevant.Attheendoftheday,afterthe laws have been passed, programs implemented and titles issued and distributed, the questions remain: Are the farmers’ tenure on land more secure? Do they have greater access to their lands?
Moreimportantly,tenureandaccessarealsoeasilymonitoredbyCSOs’asthey are able to work closely with the beneficiaries and other communities. They have established contacts, systems and networks that allow them to easily generate these data over time. Table 2 shows indicators that we believe can be used more or less by CSOs.
Indicator types Phenomenaassessed
Inputs Land laws, agrarian policies and budgets
Processes Formulation and implementation of agrarian reform policies and programs; resolution of dated and current land disputes; and verification and formalization of claims over land areas
Outputs Results and accomplishments, such as the number of land titles issued, property rights restored, and provision of support services
Outcomes Consequencesandpositiveeffectsofinputs,processesandoutputse.g.,theprevalenceoflandconflicts
Impacts Ultimate aims like poverty reduction, food security and sustainability
Table1:Typesofindicatordatarelatedtolandissues
Land Tenure
Land Disputes • Number of people killed (per 100,000 population)• Number of people detained (per 100,000 population)• Number of people harassed (per 100,000 population)• Number of cases received (per 100,000 population)• Number of cases investigated (per 100,000 population)• Number of cases adjudicated (per 100,000 population)• Number of cases of land grabbing• Percentage of area of land grabbed • Average time in years for dispute resolution
Additional indicators • Annual loss of time due to disputes• Monetary loss
Table2:CommonRegionalIndicators
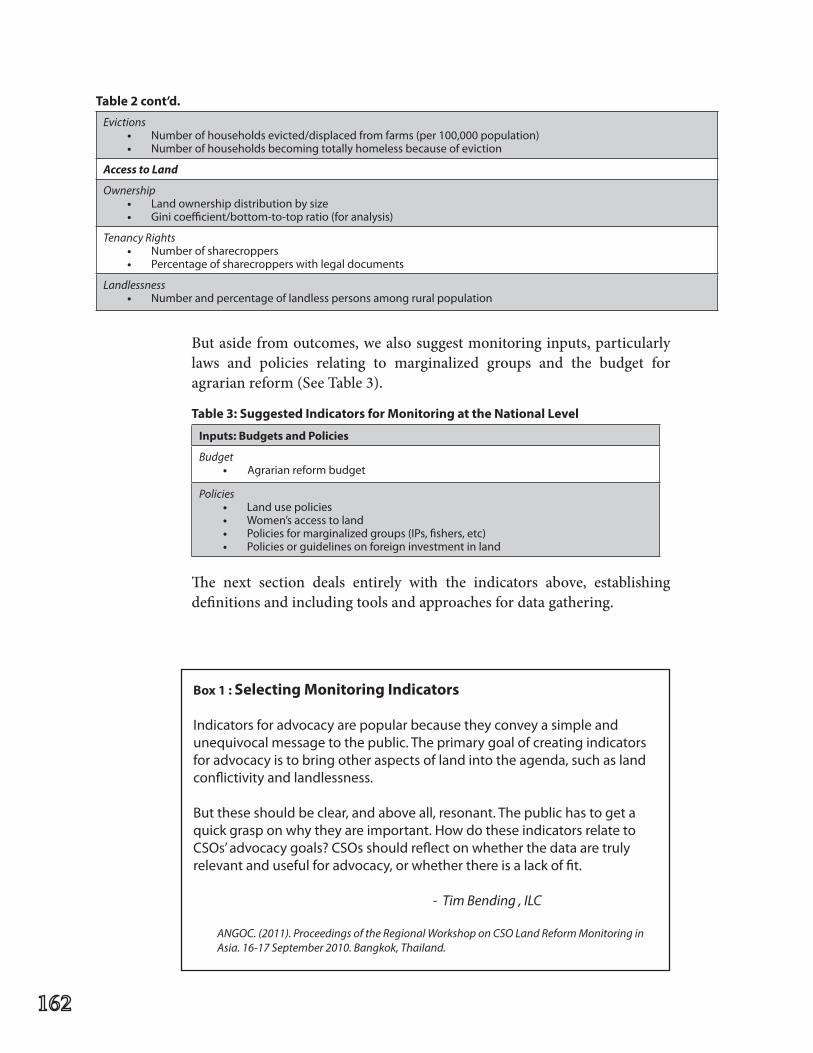
But aside from outcomes, we also suggest monitoring inputs, particularly laws and policies relating to marginalized groups and the budget for agrarianreform(SeeTable3).
The next section deals entirely with the indicators above, establishing definitions and including tools and approaches for data gathering.
Inputs:BudgetsandPolicies
Budget• Agrarian reform budget
Policies• Land use policies • Women’s access to land • Policies for marginalized groups (IPs, fishers, etc)• Policies or guidelines on foreign investment in land
Table3:SuggestedIndicatorsforMonitoringattheNationalLevel
Box1:Selecting Monitoring Indicators
Indicators for advocacy are popular because they convey a simple and unequivocalmessagetothepublic.Theprimarygoalofcreatingindicatorsfor advocacy is to bring other aspects of land into the agenda, such as land conflictivityandlandlessness.
But these should be clear, and above all, resonant. The public has to get a quickgrasponwhytheyareimportant.HowdotheseindicatorsrelatetoCSOs’advocacygoals?CSOsshouldreflectonwhetherthedataaretrulyrelevant and useful for advocacy, or whether there is a lack of fit.
- Tim Bending , ILC
ANGOC. (2011). Proceedings of the Regional Workshop on CSO Land Reform Monitoring in Asia. 16-17 September 2010. Bangkok, Thailand.
Evictions • Number of households evicted/displaced from farms (per 100,000 population) • Number of households becoming totally homeless because of eviction
Access to Land
Ownership • Land ownership distribution by size • Gini coefficient/bottom-to-top ratio (for analysis)
Tenancy Rights • Number of sharecroppers • Percentage of sharecroppers with legal documents
Landlessness• Number and percentage of landless persons among rural population
Table2cont’d.
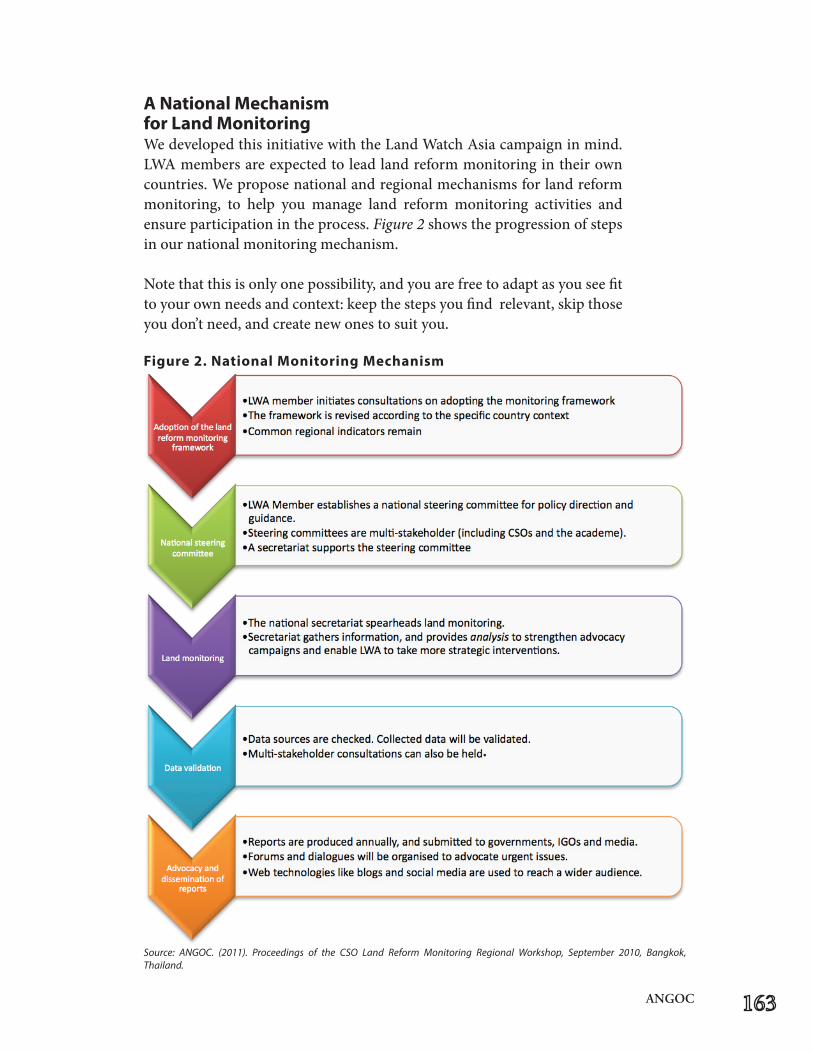
ANGOC
A National Mechanism for Land Monitoring We developed this initiative with the Land Watch Asia campaign in mind. LWA members are expected to lead land reform monitoring in their own countries. We propose national and regional mechanisms for land reform monitoring, to help you manage land reform monitoring activities and ensure participation in the process. Figure 2 shows the progression of steps in our national monitoring mechanism.
Note that this is only one possibility, and you are free to adapt as you see fit to your own needs and context: keep the steps you find relevant, skip those you don’t need, and create new ones to suit you.
Figure 2. National Monitoring Mechanism
Source: ANGOC. (2011). Proceedings of the CSO Land Reform Monitoring Regional Workshop, September 2010, Bangkok, Thailand.
.
AdoptionoftheMonitoringFrameworkInitiate a consultation process to adopt the monitoring framework. You may revise the framework according to your needs. But as much as possible, please try to be faithful to the agreed common regional indicators.
EstablishingaNationalSteeringCommitteeandaSecretariatMembers will establish their respective national steering committees to provide policy direction and guidance. Steering committees should bemulti-stakeholder and include CSOs and academe; government couldbe considered depending on the political dynamics in your country. A secretariat responsible for seeing day-to-day management also backstops the steering committee.
The section on Getting Organized elaborates on considerations for setting up a steering committee as well as a secretariat.
ConductofLandReformMonitoringThe national secretariat under the guidance of the steering committee will proceed with land reform monitoring.
Data ValidationCollected information will be validated and triangulated; data sources are to be cross-checked.
AdvocacyandDisseminationofReportsReports will be produced annually, and be shared with government, intergovernmental organizations and media. Forums and dialogues will be convened to discuss urgent issues and advocate policies and programs.
Dissemination strategies should include blogs and other information technology platforms, so that the reports can reach a wider audience.
StraightfromthePilots:anApproachtoLandReformMonitoringThe following table (Table 4) was proposed during our regional workshop onCSOlandreformmonitoringinBangkoklastSeptember2010,andisrooted in the experiences of the countries that have piloted the monitoring framework. Note that it is a slightly adjusted and expanded version of the proposed national mechanism for monitoring, but remains the same in essentials. The details and the timeframe will prove handy as you begin monitoring.
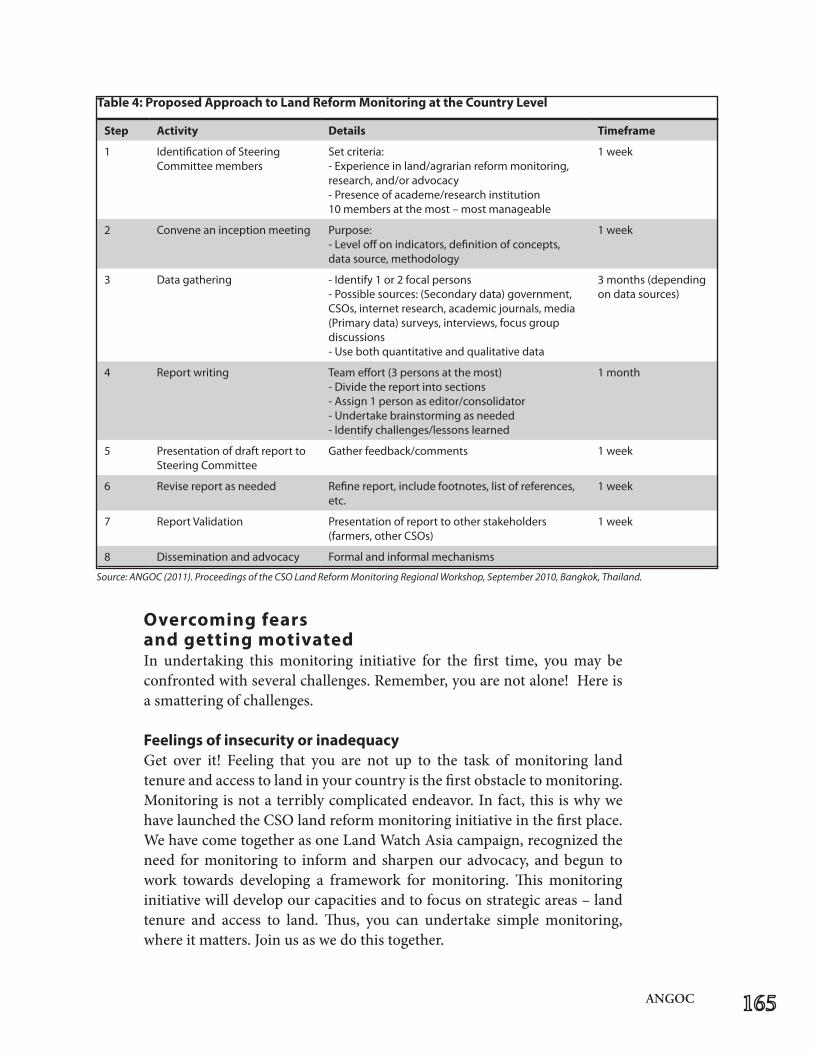
ANGOC
Overcoming fears and getting motivated In undertaking this monitoring initiative for the first time, you may be confrontedwithseveralchallenges.Remember,youarenotalone!Hereisa smattering of challenges.
FeelingsofinsecurityorinadequacyGet over it! Feeling that you are not up to the task ofmonitoring landtenure and access to land in your country is the first obstacle to monitoring. Monitoring is not a terribly complicated endeavor. In fact, this is why we havelaunchedtheCSOlandreformmonitoringinitiativeinthefirstplace.We have come together as one Land Watch Asia campaign, recognized the need for monitoring to inform and sharpen our advocacy, and begun to work towards developing a framework for monitoring. This monitoring initiative will develop our capacities and to focus on strategic areas – land tenure and access to land. Thus, you can undertake simple monitoring, where it matters. Join us as we do this together.
Step Activity Details Timeframe
1 IdentificationofSteeringCommittee members
Setcriteria:- Experience in land/agrarian reform monitoring, research, and/or advocacy- Presence of academe/research institution 10membersatthemost–mostmanageable
1 week
2 Convene an inception meeting Purpose:- Level off on indicators, definition of concepts, data source, methodology
1 week
3 Data gathering - Identify 1 or 2 focal persons-Possiblesources:(Secondarydata)government,CSOs,internetresearch,academicjournals,media(Primary data) surveys, interviews, focus group discussions -Usebothquantitativeandqualitativedata
3 months (depending on data sources)
4 Report writing Team effort (3 persons at the most)- Divide the report into sections- Assign 1 person as editor/consolidator- Undertake brainstorming as needed- Identify challenges/lessons learned
1 month
5 Presentation of draft report to SteeringCommittee
Gather feedback/comments 1 week
6 Revise report as needed Refine report, include footnotes, list of references, etc.
1 week
7 Report Validation Presentation of report to other stakeholders (farmers,otherCSOs)
1 week
8 Dissemination and advocacy Formal and informal mechanisms
Table4:ProposedApproachtoLandReformMonitoringattheCountryLevel
Source: ANGOC (2011). Proceedings of the CSO Land Reform Monitoring Regional Workshop, September 2010, Bangkok, Thailand.
Overreliance on experts An offshoot of this feeling of insecurity or inadequacy is heavy reliance on experts and consultants. We find that heavy dependence on experts can be disempowering. These experts are often too busy, stalling monitoring. Somefeelthattheycannotfunctionwithoutexpertsorconsultantstakingcharge of monitoring. What then should be the role of experts? In the absence of capable staff, it seems pragmatic to hire an expert to “get the job done.” But remember, we are monitoring with a purpose. The goal of the initiative is to build capacities and strengthen our advocacy, not to come up with impressive glossy reports per se.
We recommend working together with experts, in a complementation of expertise. Experts should facilitate learning in your organization and empower you – not emasculate you – to improve on your capacities. Monitoring should not be left to one person alone sitting on a desk writing the report; it is best done in teams.
Fear of “evidence-based advocacy” Don’tbeafraid!“Evidence-basedadvocacy”ismuchsimplerthanitsounds!It means supporting our claims and conclusions by hard facts that have undergone some rigor, using a generally acceptable methodology. For example, interviewing only ten people in a village of two thousand is not enough to make generalizations. If we survey, we have to have the appropriate sampling method that we can justify. We should not make sweeping claims about rural poverty or landlessness, using vague words like “much.” It is more convincing to be specific. Rather than say, “In the Philippines, many land-related cases are still pending,” it is more helpful to our advocacy to say, “In the Philippines, for agrarian law implementation judicial and quasi-judicial cases, there are 7,889 cases still pending, as of June 2009.”
This is certainly nottoundervalueCSOstrengths.Becauseweworkontheground, close to the communities, we have the advantage of being able to deeply understand field realities. Our strengths have been the qualitative data we produce, and the perspectives we bring into the debates. We provide case studies and rich narratives that allow others to see things through our perspectives. We would do well to continue doing this. At the same time, we need to go beyond the anecdotes and try to supplement our narratives with quantitative data, which is what many of our policy makers are looking for.
FailingtoseethewoodforthetreesSometimes,wemightgettrappedinacomplianceculture.Wesimplywantto tick all the boxes and find whatever data can conveniently fit into the given
ANGOC
indicators – even if the data are poor and insignificant, and the indicators are meaningless in your country context. Also, these indicators are largely for farmers and agrarian lands – you will find that they are not very useful in the context of fishers, indigenous peoples, and in other tenure systems. These would require their own set of indicators.
Indicators only indicate. If the data are simply unavailable, inaccessible, or irrelevant, do not gather data for data’s sake. Your goals for monitoring should be clear. The indicators we have given are only suggestions based on what we as a network think are important in monitoring land reforms. We are providing the general direction for the Land Watch Asia campaign’s monitoring; these indicators are not set in stone. At the end of the day, decisions should be made at the country level. Indicators should be appropriate.
Yes, we might have found the data but what are the realities behind the data?AsCSOs,weaddvaluebytryingtogobeyondthefigures.Weanalyzethe data, knowing that figures might be misleading, or are wrong.
WorkingwithothersWorking together is easier said than done. There are many benefits, especially if some organizations have data that are useful to us. Working withotherCSOs,ortheacademe,orevenwithgovernmentcanprovetobea significant learning exercise.
Working with CSOsHowever,sometimesthereis“turfing”amongCSOs–wheregroupsmarktheir territory, and are not willing to share data, even if they share the same advocacy.Insomeinstances,CSOsdonotshareforfearthattheywillnotbedulycredited for theirdata.By involvingotherCSOsmoreactively–whether in the steering committee or consultative processes like roundtable discussions – we may be able to get their participation, and they may increase their ownership or stake in the process.
Government data are accessible Some governments are unwilling to share information or even listen toCSOswhomtheysuspectwillcriticizethem.Landisanespeciallysensitiveissue. Other NGOs have found that having a “champion” in government –helpseasedatacollection.Still, forothers,workingwithgovernmentisstill not possible, and we must find either other data sources, or partner with groups that can access data.
Being too ambitious Sometimeswemaywanttoimproveonthedatasetbywishingtoundertakeprimary data gathering ourselves. We would like to conduct surveys on the ground, in all the villages and districts and communes. However, the persistentrealityfacedbyCSOsisoneofresourceconstraints.Wenormallydo not have the luxury of time. Comprehensive data gathering is normally done on a project basis, and is therefore difficult to sustain (nonetheless it allows for good baseline data). Setyourlimitsbeforeyoubegin;consultwithyoursteeringcommitteetosee whether your plans for monitoring are practicable.
Data Complexities
If data are available... ... it may be difficult to gather and may require many resources in terms of time, money and energy. ... it simply might be too poor in quality or terribly outdated. ... it may be incredible – not believable. Take stock of the credibility of your data. What good is it to cite data that overstate government’s performance in land reform implementation? ...it may be patchy, only available for certain parts of the country. ...it may be difficult to compile. What picture does the data paint?
Data difficulties are to be expected, but there are some ways to address or overcome them. Triangulation is a significant step in validating information. Get alternative sources.
Take note that there are also opportunities presenting themselves for land monitoring. For instance, the increasing attention on land grabbing placed by media can assist us in mining more data.
Scarcity of institutions directly advocating land rights Whom do we talk with? There seem to be only a few – if at all – institutions that are directly engaged in land rights advocacy. If you seem to be alone in your country doing this, now is the time to explore other contacts. Try proactively looking for potential partners within the academe, for instance. Oryoucanalsogoseekpartnerswithintheregion–manyCSOs,especiallywithin the Land Watch Asia network, are ready to offer their support.
Sustaining the Monitoring InitiativeWe can keep this running if it is simple enough, does not demand too many resources, and is institutionalized within normal organizational activities within the Land Watch Asia campaign. National networks know which partners are responsible for monitoring which areas or themes.
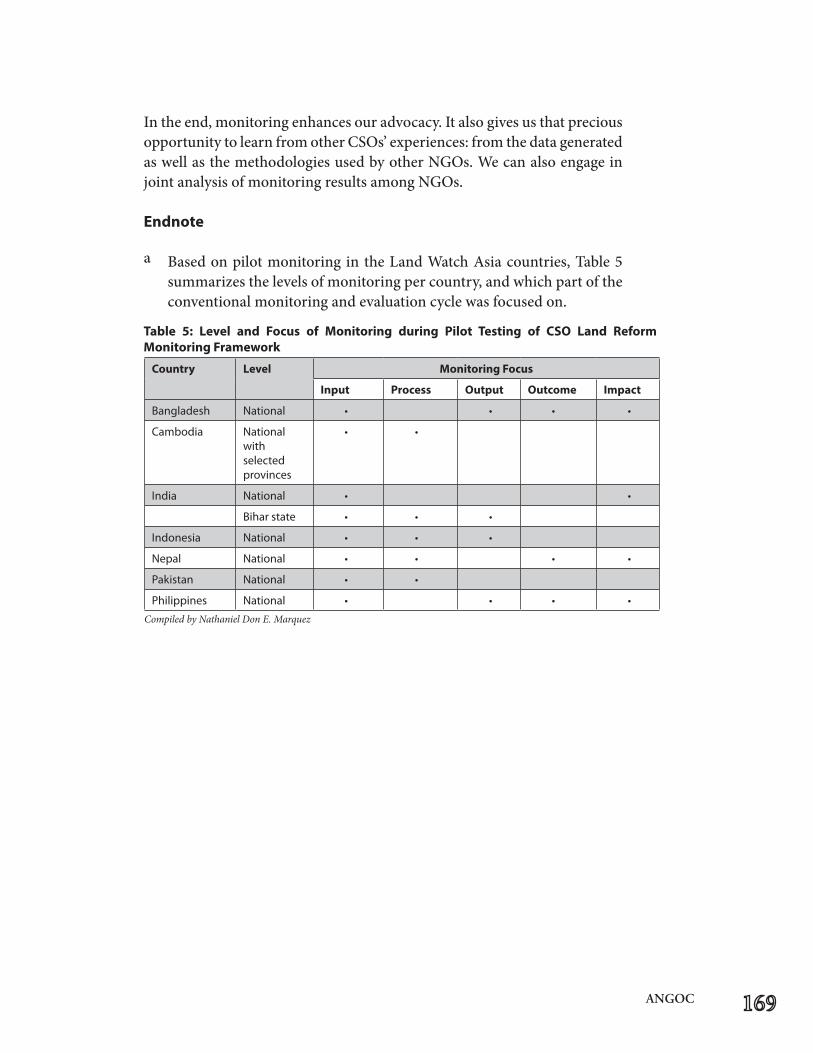
ANGOC
In the end, monitoring enhances our advocacy. It also gives us that precious opportunitytolearnfromotherCSOs’experiences:fromthedatageneratedas well as the methodologies used by other NGOs. We can also engage in joint analysis of monitoring results among NGOs.
Endnote
a Based on pilot monitoring in the Land Watch Asia countries, Table 5 summarizes the levels of monitoring per country, and which part of the conventional monitoring and evaluation cycle was focused on.
Country Level Monitoring Focus
Input Process Output Outcome Impact
Bangladesh National • • • •
Cambodia National with selected provinces
• •
India National • •
Bihar state • • •
Indonesia National • • •
Nepal National • • • •
Pakistan National • •
Philippines National • • • •
Table 5: Level and Focus of Monitoring during Pilot Testing of CSO Land ReformMonitoringFramework
Compiled by Nathaniel Don E. Marquez
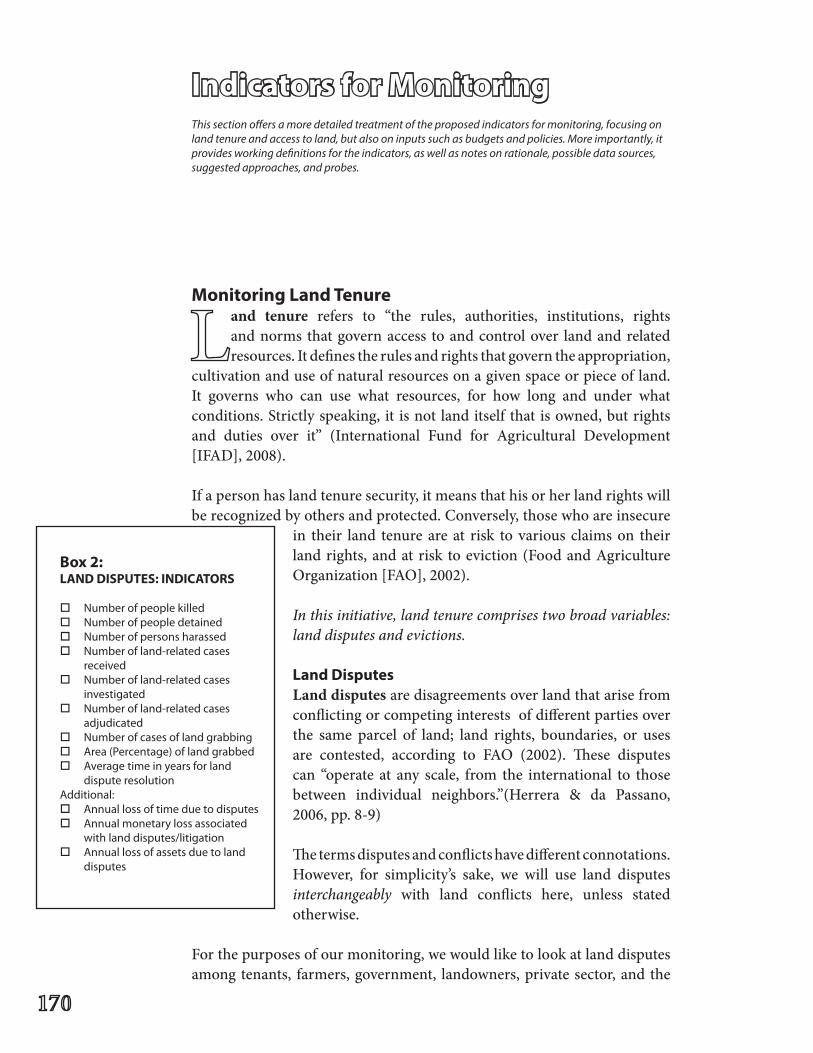
MonitoringLandTenureand tenure refers to “the rules, authorities, institutions, rights and norms that govern access to and control over land and related resources. It defines the rules and rights that govern the appropriation,
cultivation and use of natural resources on a given space or piece of land. It governs who can use what resources, for how long and under what conditions.Strictlyspeaking,it isnotlanditselfthatisowned,butrightsand duties over it” (International Fund for Agricultural Development [IFAD], 2008).
If a person has land tenure security, it means that his or her land rights will be recognized by others and protected. Conversely, those who are insecure
in their land tenure are at risk to various claims on their land rights, and at risk to eviction (Food and Agriculture Organization [FAO], 2002).
In this initiative, land tenure comprises two broad variables: land disputes and evictions.
Land DisputesLand disputes are disagreements over land that arise from conflicting or competing interests of different parties over the same parcel of land; land rights, boundaries, or uses are contested, according to FAO (2002). These disputes can “operate at any scale, from the international to those between individual neighbors.”(Herrera & da Passano, 2006, pp. 8-9)
The terms disputes and conflicts have different connotations. However, for simplicity’s sake, we will use land disputes interchangeably with land conflicts here, unless stated otherwise.
For the purposes of our monitoring, we would like to look at land disputes among tenants, farmers, government, landowners, private sector, and the
Indicators for MonitoringThis section offers a more detailed treatment of the proposed indicators for monitoring, focusing on land tenure and access to land, but also on inputs such as budgets and policies. More importantly, it provides working definitions for the indicators, as well as notes on rationale, possible data sources, suggested approaches, and probes.
Box 2:LANDDISPUTES:INDICATORS
o Number of people killed o Number of people detainedo Number of persons harassed o Number of land-related cases
received o Number of land-related cases investigatedo Number of land-related cases adjudicated o Number of cases of land grabbingo Area (Percentage) of land grabbed o Average time in years for land dispute resolutionAdditional:o Annual loss of time due to disputeso Annual monetary loss associated
with land disputes/litigationo Annual loss of assets due to land
disputes
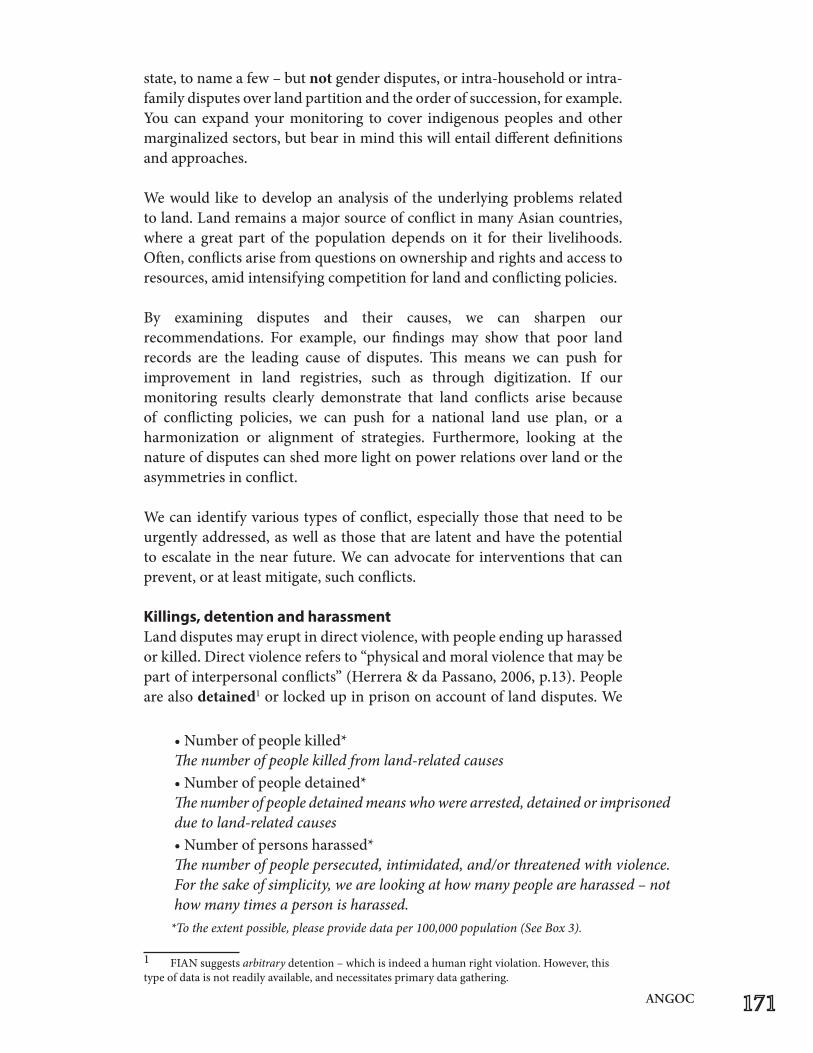
ANGOC
state, to name a few – but not gender disputes, or intra-household or intra-family disputes over land partition and the order of succession, for example. You can expand your monitoring to cover indigenous peoples and other marginalized sectors, but bear in mind this will entail different definitions and approaches.
We would like to develop an analysis of the underlying problems related to land. Land remains a major source of conflict in many Asian countries, where a great part of the population depends on it for their livelihoods. Often, conflicts arise from questions on ownership and rights and access to resources, amid intensifying competition for land and conflicting policies.
By examining disputes and their causes, we can sharpen our recommendations. For example, our findings may show that poor land records are the leading cause of disputes. This means we can push for improvement in land registries, such as through digitization. If our monitoring results clearly demonstrate that land conflicts arise because of conflicting policies, we can push for a national land use plan, or a harmonization or alignment of strategies. Furthermore, looking at the nature of disputes can shed more light on power relations over land or the asymmetries in conflict.
We can identify various types of conflict, especially those that need to be urgently addressed, as well as those that are latent and have the potential to escalate in the near future. We can advocate for interventions that can prevent, or at least mitigate, such conflicts.
Killings, detention and harassmentLand disputes may erupt in direct violence, with people ending up harassed or killed. Direct violence refers to “physical and moral violence that may be part of interpersonal conflicts” (Herrera & da Passano, 2006, p.13). People are also detained1 or locked up in prison on account of land disputes. We
1 FIAN suggests arbitrary detention – which is indeed a human right violation. However, this type of data is not readily available, and necessitates primary data gathering.
•Numberofpeoplekilled*The number of people killed from land-related causes •Numberofpeopledetained*The number of people detained means who were arrested, detained or imprisoned due to land-related causes •Numberofpersonsharassed*The number of people persecuted, intimidated, and/or threatened with violence. For the sake of simplicity, we are looking at how many people are harassed – not how many times a person is harassed.
*To the extent possible, please provide data per 100,000 population (See Box 3).
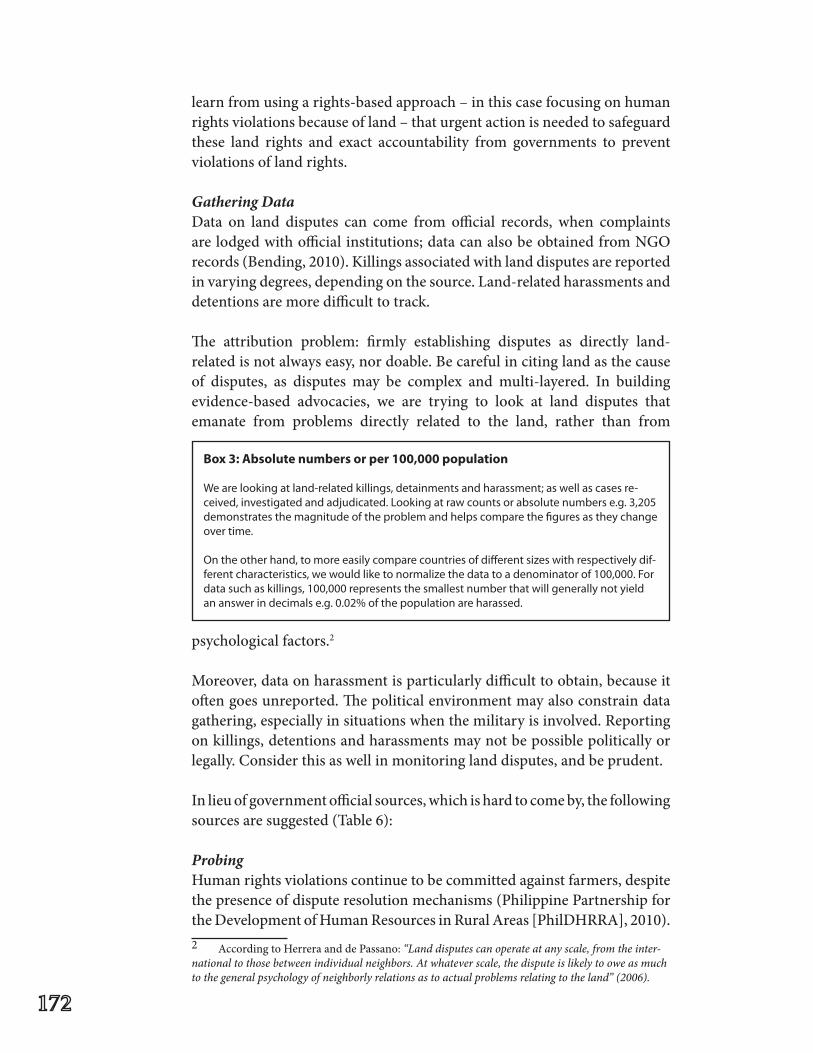
learn from using a rights-based approach – in this case focusing on human rights violations because of land – that urgent action is needed to safeguard these land rights and exact accountability from governments to prevent violations of land rights.
Gathering DataData on land disputes can come from official records, when complaints are lodged with official institutions; data can also be obtained from NGO records (Bending, 2010). Killings associated with land disputes are reported in varying degrees, depending on the source. Land-related harassments and detentions are more difficult to track.
The attribution problem: firmly establishing disputes as directly land-related is not always easy, nor doable. Be careful in citing land as the cause of disputes, as disputes may be complex and multi-layered. In building evidence-based advocacies, we are trying to look at land disputes that emanate from problems directly related to the land, rather than from
psychological factors.2
Moreover, data on harassment is particularly difficult to obtain, because it often goes unreported. The political environment may also constrain data gathering, especially in situations when the military is involved. Reporting on killings, detentions and harassments may not be possible politically or legally. Consider this as well in monitoring land disputes, and be prudent.
In lieu of government official sources, which is hard to come by, the following sources are suggested (Table 6):
Probing Human rights violations continue to be committed against farmers, despite the presence of dispute resolution mechanisms (Philippine Partnership for the Development of Human Resources in Rural Areas [PhilDHRRA], 2010). 2 According to Herrera and de Passano: “Land disputes can operate at any scale, from the inter-national to those between individual neighbors. At whatever scale, the dispute is likely to owe as much to the general psychology of neighborly relations as to actual problems relating to the land” (2006).
Box3:Absolutenumbersorper100,000population
We are looking at land-related killings, detainments and harassment; as well as cases re-ceived, investigated and adjudicated. Looking at raw counts or absolute numbers e.g. 3,205 demonstrates the magnitude of the problem and helps compare the figures as they change over time.
On the other hand, to more easily compare countries of different sizes with respectively dif-ferent characteristics, we would like to normalize the data to a denominator of 100,000. For data such as killings, 100,000 represents the smallest number that will generally not yield an answer in decimals e.g. 0.02% of the population are harassed.
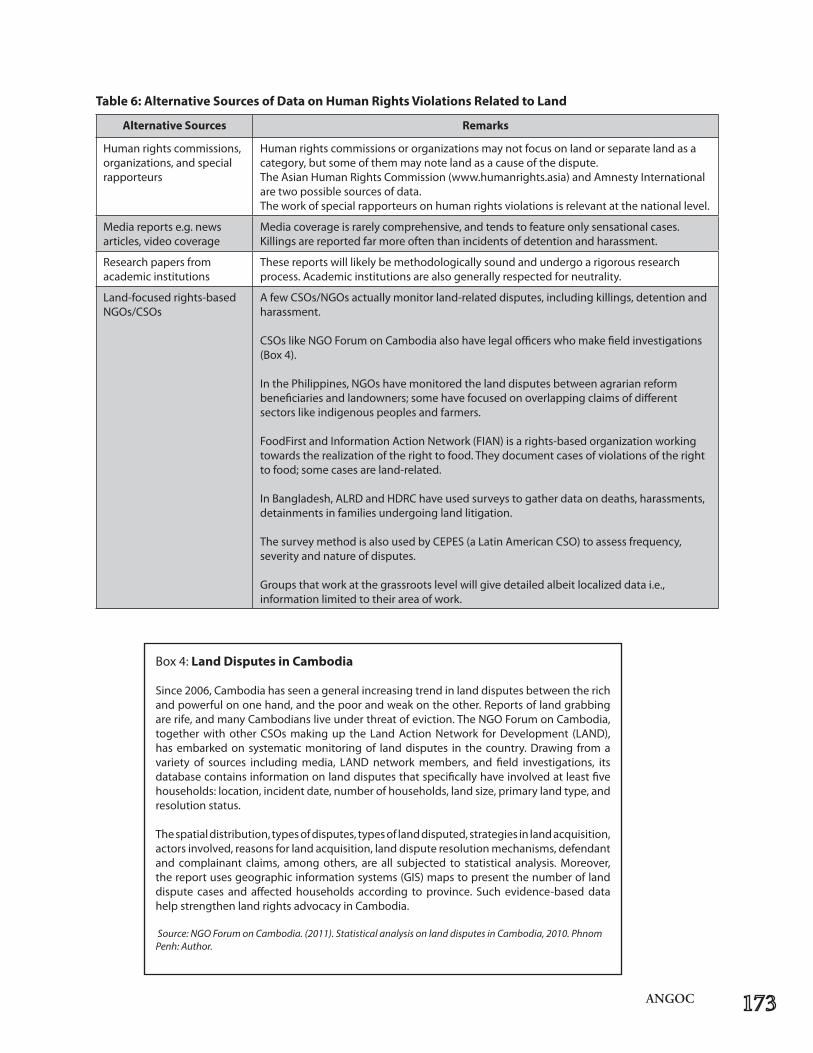
ANGOC
Alternative Sources Remarks
Human rights commissions, organizations, and special rapporteurs
Human rights commissions or organizations may not focus on land or separate land as a category, but some of them may note land as a cause of the dispute. The Asian Human Rights Commission (www.humanrights.asia) and Amnesty International are two possible sources of data. The work of special rapporteurs on human rights violations is relevant at the national level.
Media reports e.g. news articles, video coverage
Media coverage is rarely comprehensive, and tends to feature only sensational cases. Killingsarereportedfarmoreoftenthanincidentsofdetentionandharassment.
Research papers from academic institutions
These reports will likely be methodologically sound and undergo a rigorous research process. Academic institutions are also generally respected for neutrality.
Land-focused rights-based NGOs/CSOs
AfewCSOs/NGOsactuallymonitorland-relateddisputes,includingkillings,detentionandharassment.
CSOslikeNGOForumonCambodiaalsohavelegalofficerswhomakefieldinvestigations(Box4). In the Philippines, NGOs have monitored the land disputes between agrarian reform beneficiaries and landowners; some have focused on overlapping claims of different sectors like indigenous peoples and farmers. FoodFirst and Information Action Network (FIAN) is a rights-based organization working towards the realization of the right to food. They document cases of violations of the right to food; some cases are land-related. In Bangladesh, ALRD and HDRC have used surveys to gather data on deaths, harassments, detainments in families undergoing land litigation. ThesurveymethodisalsousedbyCEPES(aLatinAmericanCSO)toassessfrequency,severity and nature of disputes.
Groups that work at the grassroots level will give detailed albeit localized data i.e., information limited to their area of work.
Table6:AlternativeSourcesofDataonHumanRightsViolationsRelatedtoLand
Box4:Land Disputes in Cambodia
Since2006,Cambodiahasseenageneralincreasingtrendinlanddisputesbetweentherichand powerful on one hand, and the poor and weak on the other. Reports of land grabbing are rife, and many Cambodians live under threat of eviction. The NGO Forum on Cambodia, togetherwithotherCSOsmakingup theLandActionNetwork forDevelopment (LAND),has embarked on systematic monitoring of land disputes in the country. Drawing from a variety of sources including media, LAND network members, and field investigations, its database contains information on land disputes that specifically have involved at least five households: location, incident date, number of households, land size, primary land type, and resolution status.
Thespatialdistribution,typesofdisputes,typesoflanddisputed,strategiesinlandacquisition,actorsinvolved,reasonsforlandacquisition,landdisputeresolutionmechanisms,defendantand complainant claims, among others, are all subjected to statistical analysis. Moreover, thereportusesgeographicinformationsystems(GIS)mapstopresentthenumberoflanddispute cases and affectedhouseholds according toprovince. Suchevidence-baseddatahelp strengthen land rights advocacy in Cambodia.
Source: NGO Forum on Cambodia. (2011). Statistical analysis on land disputes in Cambodia, 2010. Phnom Penh: Author.
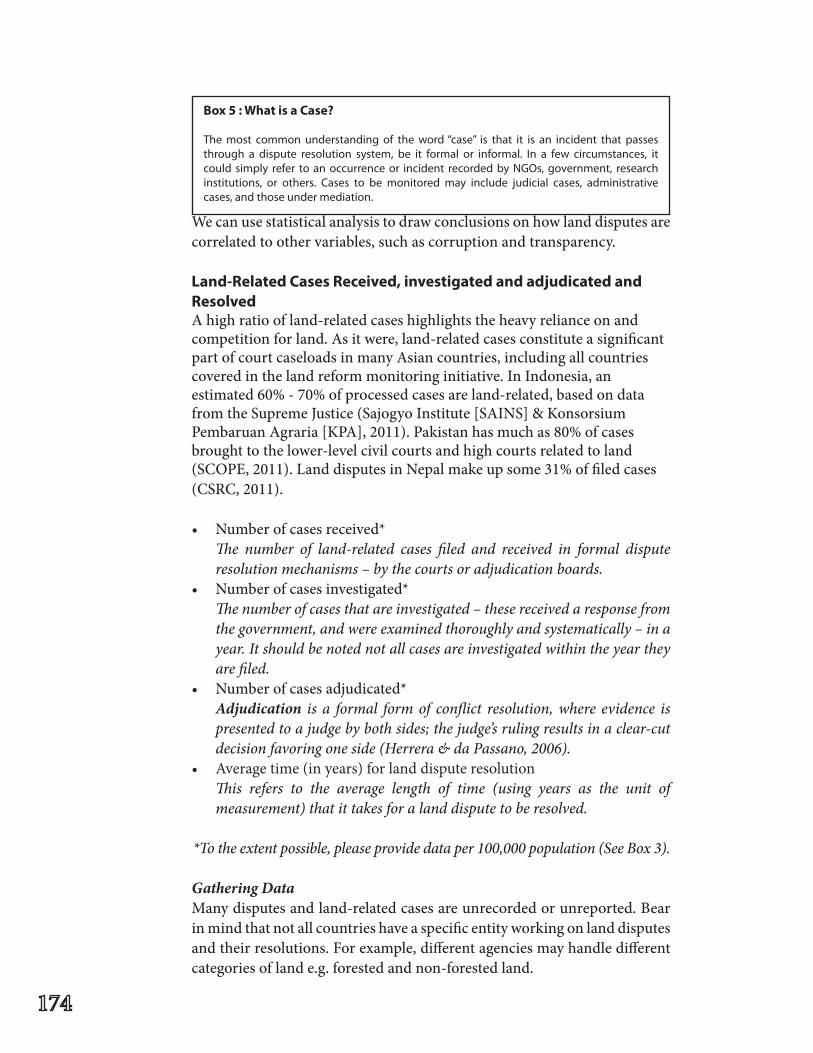
We can use statistical analysis to draw conclusions on how land disputes are correlated to other variables, such as corruption and transparency.
Land-RelatedCasesReceived,investigatedandadjudicatedandResolved A high ratio of land-related cases highlights the heavy reliance on and competition for land. As it were, land-related cases constitute a significant part of court caseloads in many Asian countries, including all countries covered in the land reform monitoring initiative. In Indonesia, an estimated 60% - 70% of processed cases are land-related, based on data fromtheSupremeJustice(SajogyoInstitute[SAINS]&KonsorsiumPembaruan Agraria [KPA], 2011). Pakistan has much as 80% of cases brought to the lower-level civil courts and high courts related to land (SCOPE,2011).LanddisputesinNepalmakeupsome31%offiledcases(CSRC,2011).
• Numberofcasesreceived* The number of land-related cases filed and received in formal dispute
resolution mechanisms – by the courts or adjudication boards. • Numberofcasesinvestigated* The number of cases that are investigated – these received a response from
the government, and were examined thoroughly and systematically – in a year. It should be noted not all cases are investigated within the year they are filed.
• Numberofcasesadjudicated*Adjudication is a formal form of conflict resolution, where evidence is presented to a judge by both sides; the judge’s ruling results in a clear-cut decision favoring one side (Herrera & da Passano, 2006).
• Averagetime(inyears)forlanddisputeresolution This refers to the average length of time (using years as the unit of
measurement) that it takes for a land dispute to be resolved.
*To the extent possible, please provide data per 100,000 population (See Box 3).
Gathering DataMany disputes and land-related cases are unrecorded or unreported. Bear in mind that not all countries have a specific entity working on land disputes and their resolutions. For example, different agencies may handle different categories of land e.g. forested and non-forested land.
Box5:WhatisaCase?
The most common understanding of the word “case” is that it is an incident that passes through a dispute resolution system, be it formal or informal. In a few circumstances, it could simply refer to an occurrence or incident recorded by NGOs, government, research institutions, or others. Cases to be monitored may include judicial cases, administrative cases, and those under mediation.
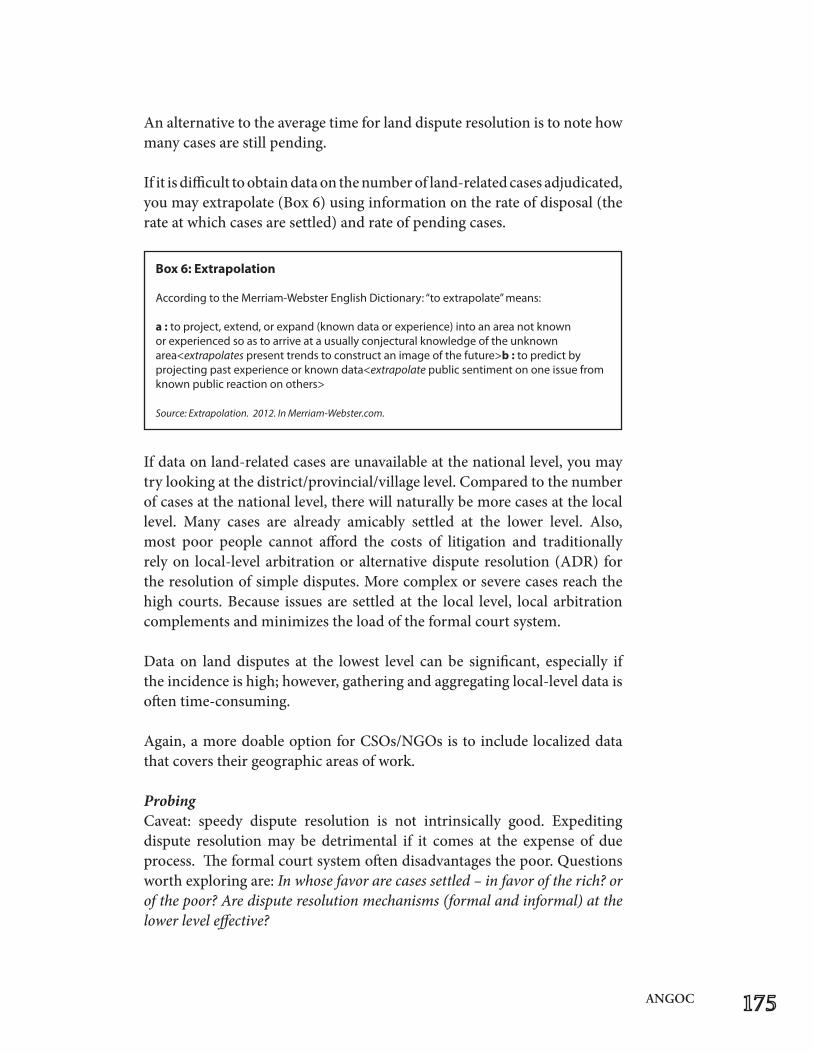
ANGOC
Box6:Extrapolation
According to the Merriam-Webster English Dictionary: “to extrapolate” means:
a : to project, extend, or expand (known data or experience) into an area not known or experienced so as to arrive at a usually conjectural knowledge of the unknown area<extrapolates present trends to construct an image of the future>b : to predict by projecting past experience or known data<extrapolate public sentiment on one issue from known public reaction on others> Source: Extrapolation. 2012. In Merriam-Webster.com.
An alternative to the average time for land dispute resolution is to note how many cases are still pending.
If it is difficult to obtain data on the number of land-related cases adjudicated, you may extrapolate (Box 6) using information on the rate of disposal (the rate at which cases are settled) and rate of pending cases.
If data on land-related cases are unavailable at the national level, you may try looking at the district/provincial/village level. Compared to the number of cases at the national level, there will naturally be more cases at the local level. Many cases are already amicably settled at the lower level. Also, most poor people cannot afford the costs of litigation and traditionally rely on local-level arbitration or alternative dispute resolution (ADR) for the resolution of simple disputes. More complex or severe cases reach the high courts. Because issues are settled at the local level, local arbitration complements and minimizes the load of the formal court system.
Data on land disputes at the lowest level can be significant, especially if the incidence is high; however, gathering and aggregating local-level data is often time-consuming.
Again,amoredoableoptionforCSOs/NGOsistoincludelocalizeddatathat covers their geographic areas of work.
Probing Caveat: speedy dispute resolution is not intrinsically good. Expediting dispute resolution may be detrimental if it comes at the expense of due process. The formal court system often disadvantages the poor. Questions worth exploring are: In whose favor are cases settled – in favor of the rich? or of the poor? Are dispute resolution mechanisms (formal and informal) at the lower level effective?
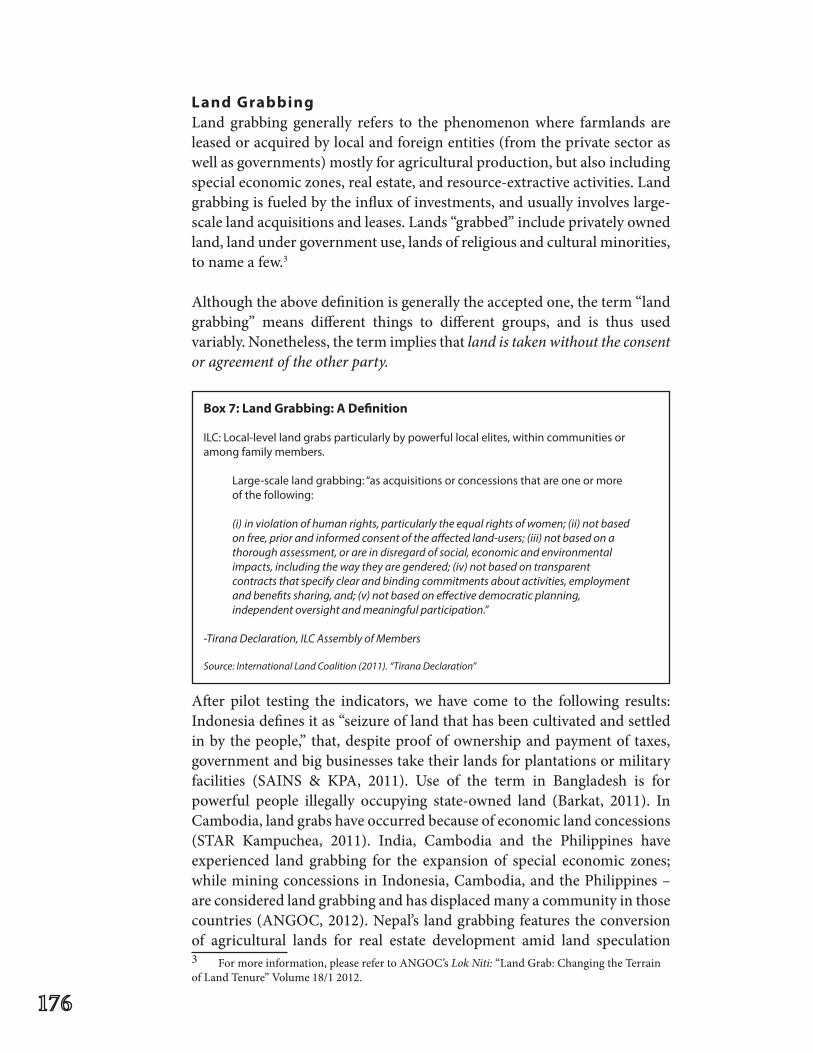
Land GrabbingLand grabbing generally refers to the phenomenon where farmlands are leased or acquired by local and foreign entities (from the private sector as well as governments) mostly for agricultural production, but also including special economic zones, real estate, and resource-extractive activities. Land grabbing is fueled by the influx of investments, and usually involves large-scale land acquisitions and leases. Lands “grabbed” include privately owned land, land under government use, lands of religious and cultural minorities, to name a few.3
Although the above definition is generally the accepted one, the term “land grabbing” means different things to different groups, and is thus used variably. Nonetheless, the term implies that land is taken without the consent or agreement of the other party.
After pilot testing the indicators, we have come to the following results: Indonesia defines it as “seizure of land that has been cultivated and settled in by the people,” that, despite proof of ownership and payment of taxes, government and big businesses take their lands for plantations or military facilities (SAINS & KPA, 2011). Use of the term in Bangladesh is forpowerful people illegally occupying state-owned land (Barkat, 2011). In Cambodia, land grabs have occurred because of economic land concessions (STAR Kampuchea, 2011). India, Cambodia and the Philippines haveexperienced land grabbing for the expansion of special economic zones; while mining concessions in Indonesia, Cambodia, and the Philippines – are considered land grabbing and has displaced many a community in those countries (ANGOC, 2012). Nepal’s land grabbing features the conversion of agricultural lands for real estate development amid land speculation 3 For more information, please refer to ANGOC’s Lok Niti: “Land Grab: Changing the Terrain of Land Tenure” Volume 18/1 2012.
Box7:LandGrabbing:ADefinition
ILC: Local-level land grabs particularly by powerful local elites, within communities or among family members.
Large-scalelandgrabbing:“asacquisitionsorconcessionsthatareoneormoreof the following: (i) in violation of human rights, particularly the equal rights of women; (ii) not based on free, prior and informed consent of the affected land-users; (iii) not based on a thorough assessment, or are in disregard of social, economic and environmental impacts, including the way they are gendered; (iv) not based on transparent contracts that specify clear and binding commitments about activities, employment and benefits sharing, and; (v) not based on effective democratic planning, independent oversight and meaningful participation.”
-Tirana Declaration, ILC Assembly of Members
Source: International Land Coalition (2011). “Tirana Declaration”
ANGOC
(CSRC,2012).Pakistanreferstolandgrabbinginthecontextofclaimingland ownership through legal or extra-legal means, while dispossesing its trueowners(SCOPE,2011).Becauseitispossiblethatacountrymayhaverelatively few cases of land grabbing, but which concern vast swathes of land, we will also consider the percentage of area of land grabbed, to the extent possible.
The International Land Coalition also puts forward its own definition of landgrabbing.(SeeBox7).
• Numberoflandgrabbingcases The number of documented cases of land grabbing• Percentageofland-grabbedarea Area of land grabbed, as a percentage of total land. This can be easily
calculated by dividing the total area of land grabbed by the total area of cultivable agricultural land.
% area of land grabbed = area of land grabbed total area of cultivated land
Gathering DataFirst things first: in undertaking monitoring, you should labor to explain specifically how you use the term land grabbing in your country.
Consolidated data on land grabbing and its magnitude are difficult to obtain, often patchy, primarily because of the lack of transparency on the part of governments and the private sector. Much is hearsay or anecdotal evidence. Media reports have been a popular source of data in the course of piloting. In most countries, there are no authoritative sources in the countries as regards how much land has actually been acquired or leased.
Ideally, you will have data per case on: location and size of land grabbed, source of investment (e.g. which foreign government or multinational corporation), amount of investment, year of reported incident, and data source. Table 7 (on the following page) is a suggestion on how you can present your data.
Table 8 (see page 179) shows a few sources of land grabbing data, with a few tentative comments on what to expect.
Box8:WhatisaCase?
When dealing with land grabbing specifically, we refer to documented incidents of land grabbing, rather than technical cases or lawsuits that are filed in court.
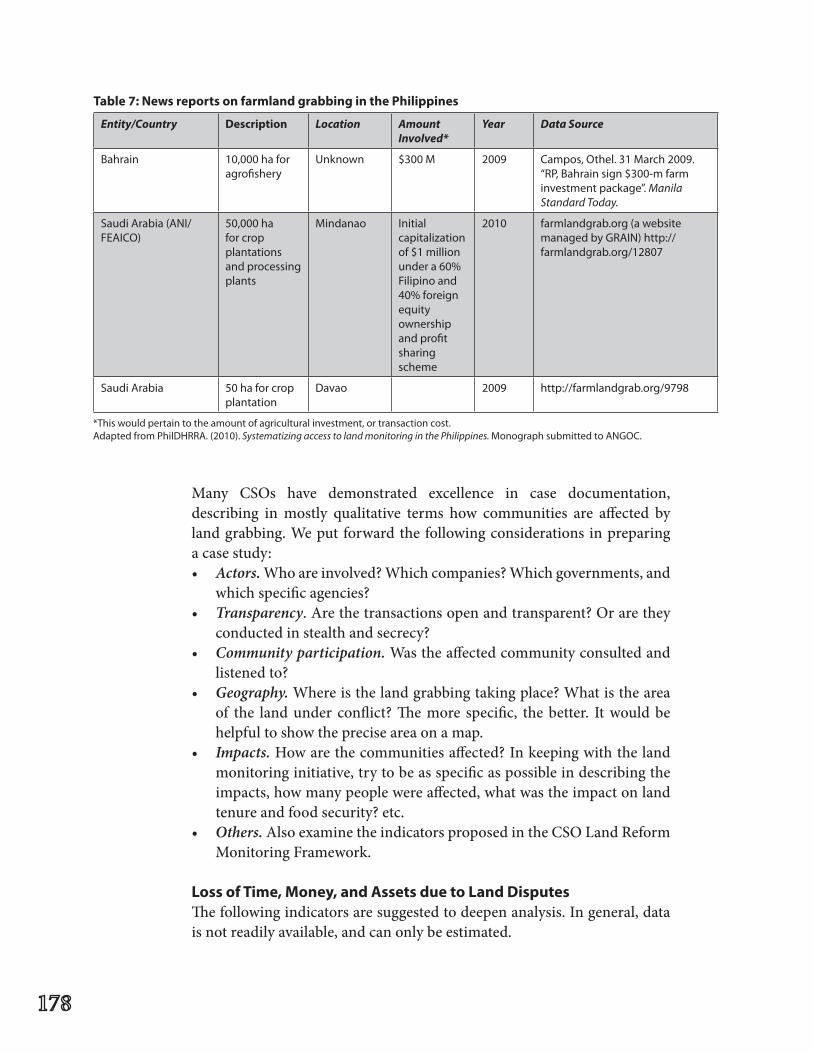
Many CSOs have demonstrated excellence in case documentation,describing in mostly qualitative terms how communities are affected by land grabbing. We put forward the following considerations in preparing a case study: • Actors. Who are involved? Which companies? Which governments, and
which specific agencies? • Transparency. Are the transactions open and transparent? Or are they
conducted in stealth and secrecy? • Community participation. Was the affected community consulted and
listened to? • Geography. Where is the land grabbing taking place? What is the area
of the land under conflict? The more specific, the better. It would be helpful to show the precise area on a map.
• Impacts. How are the communities affected? In keeping with the land monitoring initiative, try to be as specific as possible in describing the impacts, how many people were affected, what was the impact on land tenure and food security? etc.
• Others.AlsoexaminetheindicatorsproposedintheCSOLandReformMonitoring Framework.
LossofTime,Money,andAssetsduetoLandDisputesThe following indicators are suggested to deepen analysis. In general, data is not readily available, and can only be estimated.
Entity/Country Description Location Amount Involved*
Year Data Source
Bahrain 10,000 ha for agrofishery
Unknown $300 M 2009 Campos, Othel. 31 March 2009. “RP, Bahrain sign $300-m farm investment package”. Manila Standard Today.
SaudiArabia(ANI/FEAICO)
50,000 ha for crop plantations and processing plants
Mindanao Initial capitalization of $1 million undera60%Filipino and 40%foreignequityownership and profit sharing scheme
2010 farmlandgrab.org (a website managed by GRAIN) http://farmlandgrab.org/12807
SaudiArabia 50 ha for crop plantation
Davao 2009 http://farmlandgrab.org/9798
Table7:NewsreportsonfarmlandgrabbinginthePhilippines
*This would pertain to the amount of agricultural investment, or transaction cost. Adapted from PhilDHRRA. (2010). Systematizing access to land monitoring in the Philippines. Monograph submitted to ANGOC.
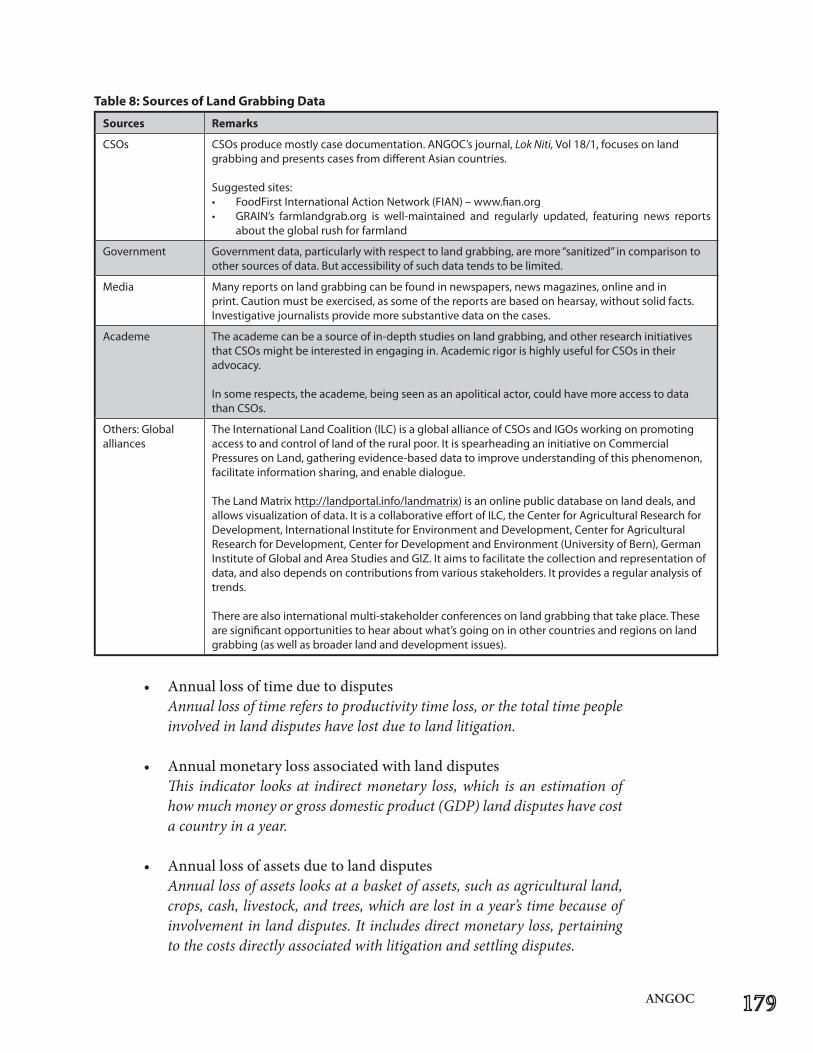
ANGOC
• Annuallossoftimeduetodisputes Annual loss of time refers to productivity time loss, or the total time people
involved in land disputes have lost due to land litigation.
• Annualmonetarylossassociatedwithlanddisputes This indicator looks at indirect monetary loss, which is an estimation of
how much money or gross domestic product (GDP) land disputes have cost a country in a year.
• Annuallossofassetsduetolanddisputes Annual loss of assets looks at a basket of assets, such as agricultural land,
crops, cash, livestock, and trees, which are lost in a year’s time because of involvement in land disputes. It includes direct monetary loss, pertaining to the costs directly associated with litigation and settling disputes.
Sources Remarks
CSOs CSOsproducemostlycasedocumentation.ANGOC’sjournal,Lok Niti,Vol18/1,focusesonlandgrabbing and presents cases from different Asian countries.
Suggestedsites:• FoodFirstInternationalActionNetwork(FIAN)–www.fian.org• GRAIN’s farmlandgrab.org is well-maintained and regularly updated, featuring news reports
about the global rush for farmland
Government Government data, particularly with respect to land grabbing, are more “sanitized” in comparison to other sources of data. But accessibility of such data tends to be limited.
Media Many reports on land grabbing can be found in newspapers, news magazines, online and in print. Caution must be exercised, as some of the reports are based on hearsay, without solid facts. Investigative journalists provide more substantive data on the cases.
Academe The academe can be a source of in-depth studies on land grabbing, and other research initiatives thatCSOsmightbeinterestedinengagingin.AcademicrigorishighlyusefulforCSOsintheiradvocacy.
In some respects, the academe, being seen as an apolitical actor, could have more access to data thanCSOs.
Others: Global alliances
TheInternationalLandCoalition(ILC)isaglobalallianceofCSOsandIGOsworkingonpromotingaccess to and control of land of the rural poor. It is spearheading an initiative on Commercial Pressures on Land, gathering evidence-based data to improve understanding of this phenomenon, facilitate information sharing, and enable dialogue.
The Land Matrix http://landportal.info/landmatrix) is an online public database on land deals, and allows visualization of data. It is a collaborative effort of ILC, the Center for Agricultural Research for Development, International Institute for Environment and Development, Center for Agricultural Research for Development, Center for Development and Environment (University of Bern), German InstituteofGlobalandAreaStudiesandGIZ.Itaimstofacilitatethecollectionandrepresentationofdata, and also depends on contributions from various stakeholders. It provides a regular analysis of trends.
There are also international multi-stakeholder conferences on land grabbing that take place. These are significant opportunities to hear about what’s going on in other countries and regions on land grabbing (as well as broader land and development issues).
Table8:SourcesofLandGrabbingData
Gathering DataA simple and inexpensive method has been proposed4 to determine annual loss of time and annual loss of money due to land disputes, assuming the number of disputes is known. Note that these indicators can only be estimated.
Annual loss of time can be extrapolated based on: the annual number of land-related pending cases; the average number of persons involved in each case – as plaintiff, defendant, family members and witnesses; and average loss of hours per year per person involved. Annual loss of time should be converted into hours as the unit of measurement.
The best illustration of extrapolation for this indicator comes from pilot testing the monitoring indicators, specifically from the experience in Bangladesh:
“Extrapolation can be done based on annual number of land-related pending cases (2.5 million cases), number of persons involved in each cases (as plaintiff, defendant, their family members, and witnesses; 45 persons per case), and average loss of hours per year per person involved (15 hours per year per person) – shows that the annual loss of time due to land disputes amounts to 1,687 million hours (or equivalent to 211 million work days)” (ALRD, 2011). On the other hand, annual monetary loss can be calculated by multiplying the annual loss of time due to land disputes (see previous paragraph) by using per capita GDP per hour (dividing by 365 days in a year and the number of work hours per day.) This will then be multiplied by the annual number of disputes to yield annual indirect monetary loss.
For example, the annual loss of time has been computed as 100 million hours. We can derive the annual money lost due to land disputes: we multiply the hours of lost time (in this case, 100 million hours) by the average hourly rate. We base this rate on the per capita GDP. If the gross domestic product per capita (per person) is $1,200/year: i) we divide this figure by 365 days (for one calendar year). The worth of a person’s work is $3.29 per day. ii) When we divide by an assumption of 8 working hours per day, we obtain a result of $0.41/hour. iii) We multiply $0.41/hour by the annual loss of time, 100 million hours. The result is $41 million estimated as the annual monetary loss. The indicator on annual loss of time calls attention to the fact that time – particularly the time of the poor who are involved in land litigation – is a critical resource. Annual monetary loss indicates the indirect loss to GDP, implying the impact of land disputes on the national economy, on wasting productive hours in land litigation, among others.
4 Dr. Abul Barkat has done extensive research on the political economy of land litigation in Bangladesh, using a range of useful indicators.
ANGOC
You can find updated economic statistics, including on GDP per capita by looking at government economic reports, as well as from statistics from international financial institutions (IFIs) like the Asian Development Bank and the World Bank. Data for this are often available online. GDP remains a term that policy makers can easily understand. When an amount is calculated for to express the annual loss to the country’s economy in terms of GDP, it can be a powerful advocacy tool for land access. The indicator on annual loss of asset looks at the direct burden experienced by those involved in land disputes. It is broader in the sense that it reflects the total value of assets – not just land and money – lost. People’s standard of living decline when they are involved in land disputes.
If you are more interested in the effects of land disputes in terms of opportunity costs, on the absence of data on loss of asset, you can also look at other indicators such as: fees for medical treatment after experiencing violence; the school dropout rate of children; or the children’s inability to take the national test as a result of land disputes.5
This indicator is important because it recognizes that high costs associated with litigation often drive poor people to landlessness and poverty – even if the verdict is in their favor.6
Probing All the aforementioned indicators on land disputes should serve as springboard for analysis on major causes of disputes as well as the nature or type of disputes.
• Are the disputes over boundaries or overlapping landtitles? Are the conflicts with former landowners? Are the land disputes between grantees of economic land concessions and affected peoples?
• Who perpetrates the human rights violations: government, military,rebel groups, paramilitary, or private landowners? If the data is available, you can enumerate the categories of land disputes and the number of incidents per category, and present this information in a graph or chart.
• Wherearelanddisputestakingplace?Isthereaspecialreasonforthis?• Whatistheextentofcorruptioninlanddisputes?
EvictionsA forced eviction is the “permanent or temporary removal against the will of individuals, families, and/or communities from the homes
5 This was a suggestion from the Indonesia country monitoring report. 6 In Bangladesh, it has been found that litigation affects both parties in the same way – lead-ing to economic loss, though this will be in varying degrees. For more information, please refer to Political economy of land litigation.
Box9:EVICTIONS:INDICATORS
o Number of households evicted/ displaced from farmso Number of households becom-
ing totally homeless of eviction
and/or land which they occupy, without the provision of, and access to, appropriate forms of legal or other protection” (UN Committee on Economic,SocialandCulturalRights,1997).
A displacement is the forced movement of people away from their land, for various reasons: induced by development, natural disasters or conflict. For the purposes of land reform monitoring, we will only look at development-forced displacement and resettlement7 (DFDR), which is displacement in the name of development. Activities for development include large-scale infrastructure (e.g. dams), economic development projects, mining, and plantations.
This is applied to communities or groups of people, rather than individuals. Sincewearemonitoringlandtenure,wewillnot cover displacements due to natural hazards (e.g. floods, tsunamis, and desertification), armed conflict, generalized violence and civil strife. Internally displaced persons (IDPs) and environmental refugees are thus excluded from this list.
Evictions and displacements are similar concepts. They both have connotations of violence and coercion. Displacement is used interchangeably with “forced migration”; for the purposes of this monitoring initiative, we will use “displacement” – again, excluding natural disasters- or conflict-induced displacements – interchangeably with “evictions”.
• Numberofhouseholdsevicted/displacedfromfarms* This refers to the number of households that are either evicted or
displaced from their farms in a year. • Numberofhouseholdsbecomingtotallyhomelessofeviction This indicator looks at how many evicted or displaced households are
unable to find options for resettlement and are rendered completely homeless.
• Totheextentpossible,pleaseprovidedataper100,000population.
Gathering DataHuman rights groups such as Amnesty International provide some data on evictions.
OtherCSOsfocusonlandgrabbingandrecordthenumberofpeopleandcommunities evicted or displaced, and describe how this is done (see section on land grabbing).
7 Formerly called “development-induced displacement”
ANGOC
Monitoring Access to LandAccess to land is the “ability to use land and other natural resources, to control the resources and to transfer the rights to the land and take advantage of other opportunities” (IFAD, 2008).
Access to land indicators will investigate the distribution or concentration of land ownership and landlessness.
LandOwnershipandLandlessnessThe patterns of land ownership in Asia are known to be skewed or uneven, with many landowners owning small parcels of land, while a handful of big landowners in possession of vast swathes of land. There is also a proportion of landless rural people. In monitoring land ownership and landlessness, we are specifically looking at rural/agricultural lands.
Land Ownership Distribution by Size • Landownershipdistributionbysize Refers to the distribution of land ownership grouped according to the size
of the plots of land. It shows the patterns of land distribution; in the case of many Southeast and South Asian countries, the concentration of land in the hands of a few.
Landlessness • Numberoflandlessruralpersons This refers to the absolute number of landless people in rural areas.
• Percentageoflandlessruralpersonsamongruralpopulation This refers to the number of landless rural persons expressed as a percentage
of rural population.
Landlessness is defined as the “state of those agricultural workers not owning or renting land and without access to permanent employment” (FAO, 2003).
“Landlessness” literally means the absolute lack of land, but not all countries stick to this usage. In Bangladesh, for instance, landless households are technically those owning between 0 and 49 decimals (a decimal being a hundredth of an acre or 40.46 square meters) (Barkat, 2011). Indonesia’s landlessownlessthan0.2ha(SAINS&KPA,2011).Somecountriesmakethe distinction between “landless” – or those with absolutely no land – and the “land poor” – where parcels are so small that they cannot support householdneeds.InCambodia,the“land-poor”ownlessthan0.5ha(STARKampuchea,2011);inNepal,lessthan0.1ha(CSRC,2012).Pakistanhascategories for the “landless” and “nearly landless” (SCOPE, 2011). The
Box10LANDOWNERSHIPANDLANDLESSNESS:INDICATORS
o Land ownership distribution by sizeo Number of landless rural personso Percentage of landless rural personso Gini coefficient
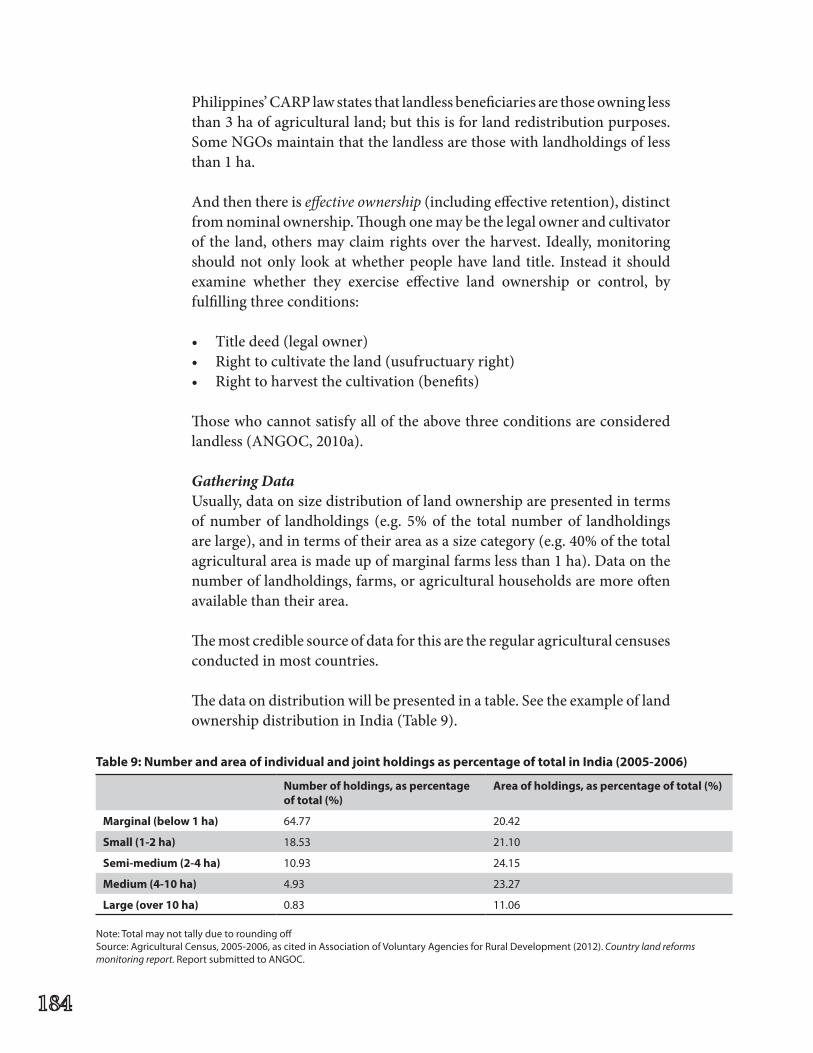
Philippines’ CARP law states that landless beneficiaries are those owning less than 3 ha of agricultural land; but this is for land redistribution purposes. SomeNGOsmaintainthatthelandlessarethosewithlandholdingsoflessthan 1 ha.
And then there is effective ownership (including effective retention), distinct from nominal ownership. Though one may be the legal owner and cultivator of the land, others may claim rights over the harvest. Ideally, monitoring should not only look at whether people have land title. Instead it should examine whether they exercise effective land ownership or control, by fulfilling three conditions:
• Titledeed(legalowner)• Righttocultivatetheland(usufructuaryright)• Righttoharvestthecultivation(benefits)
Those who cannot satisfy all of the above three conditions are considered landless (ANGOC, 2010a).
Gathering DataUsually, data on size distribution of land ownership are presented in terms of number of landholdings (e.g. 5% of the total number of landholdings are large), and in terms of their area as a size category (e.g. 40% of the total agricultural area is made up of marginal farms less than 1 ha). Data on the number of landholdings, farms, or agricultural households are more often available than their area.
The most credible source of data for this are the regular agricultural censuses conducted in most countries.
Thedataondistributionwillbepresentedinatable.Seetheexampleoflandownership distribution in India (Table 9).
Number of holdings, as percentage oftotal(%)
Areaofholdings,aspercentageoftotal(%)
Marginal(below1ha) 64.77 20.42
Small(1-2ha) 18.53 21.10
Semi-medium(2-4ha) 10.93 24.15
Medium(4-10ha) 4.93 23.27
Large(over10ha) 0.83 11.06
Note: Total may not tally due to rounding off Source:AgriculturalCensus,2005-2006,ascitedinAssociationofVoluntaryAgenciesforRuralDevelopment(2012). Country land reforms monitoring report. Report submitted to ANGOC.
Table9:NumberandareaofindividualandjointholdingsaspercentageoftotalinIndia(2005-2006)
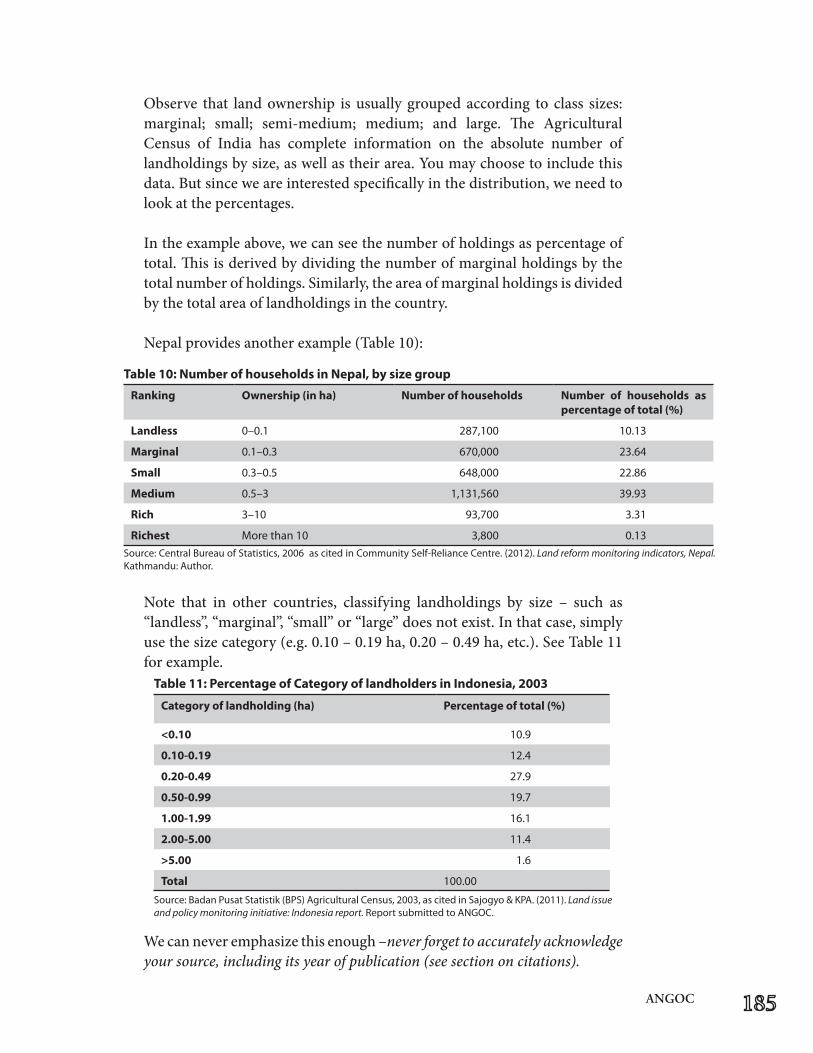
ANGOC
Observe that land ownership is usually grouped according to class sizes: marginal; small; semi-medium; medium; and large. The Agricultural Census of India has complete information on the absolute number of landholdings by size, as well as their area. You may choose to include this data. But since we are interested specifically in the distribution, we need to look at the percentages.
In the example above, we can see the number of holdings as percentage of total. This is derived by dividing the number of marginal holdings by the totalnumberofholdings.Similarly,theareaofmarginalholdingsisdividedby the total area of landholdings in the country.
Nepal provides another example (Table 10):
Note that in other countries, classifying landholdings by size – such as “landless”, “marginal”, “small” or “large” does not exist. In that case, simply usethesizecategory(e.g.0.10–0.19ha,0.20–0.49ha,etc.).SeeTable11for example.
We can never emphasize this enough –never forget to accurately acknowledge your source, including its year of publication (see section on citations).
Ranking Ownership(inha) Number of households Number of households as percentageoftotal(%)
Landless 0–0.1 287,100 10.13
Marginal 0.1–0.3 670,000 23.64
Small 0.3–0.5 648,000 22.86
Medium 0.5–3 1,131,560 39.93
Rich 3–10 93,700 3.31
Richest More than 10 3,800 0.13
Table10:Number of households in Nepal, by size group
Source:CentralBureauofStatistics,2006ascitedinCommunitySelf-RelianceCentre.(2012). Land reform monitoring indicators, Nepal. Kathmandu:Author.
Categoryoflandholding(ha) Percentageoftotal(%)
<0.10 10.9
0.10-0.19 12.4
0.20-0.49 27.9
0.50-0.99 19.7
1.00-1.99 16.1
2.00-5.00 11.4
>5.00 1.6
Total 100.00
Table11:PercentageofCategoryoflandholdersinIndonesia,2003
Source:BadanPusatStatistik(BPS)AgriculturalCensus,2003,ascitedinSajogyo&KPA.(2011). Land issue and policy monitoring initiative: Indonesia report. Report submitted to ANGOC.
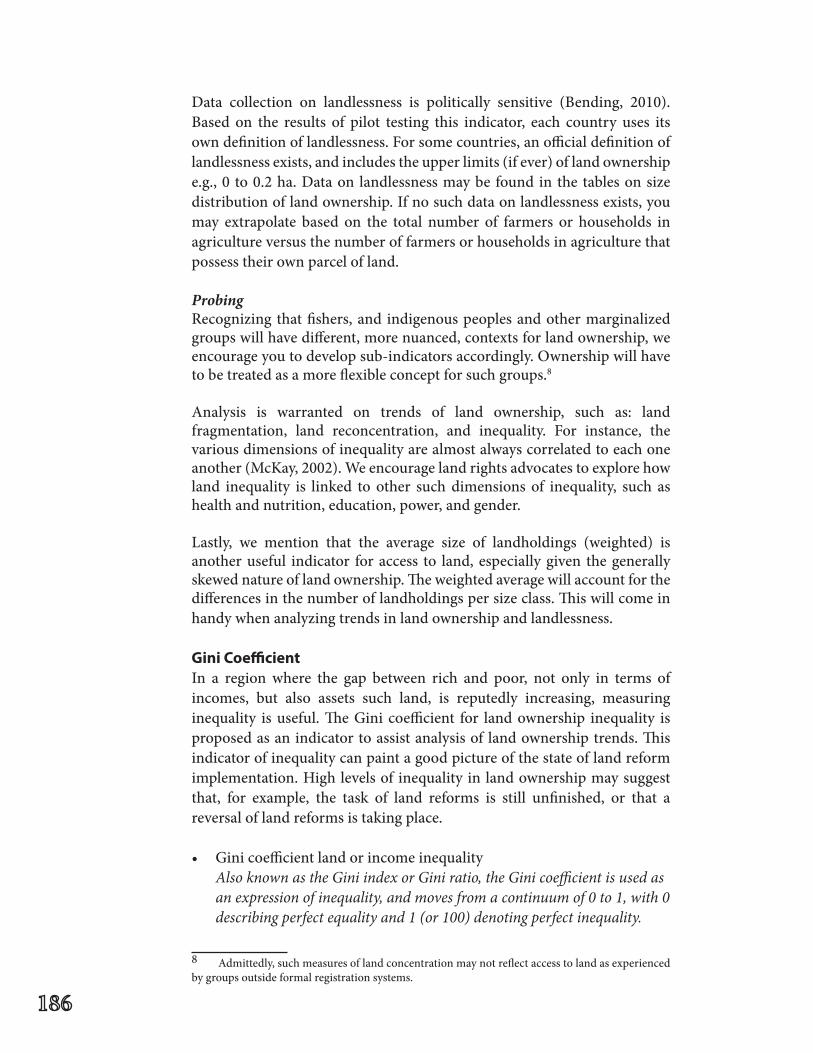
Data collection on landlessness is politically sensitive (Bending, 2010). Based on the results of pilot testing this indicator, each country uses its own definition of landlessness. For some countries, an official definition of landlessness exists, and includes the upper limits (if ever) of land ownership e.g., 0 to 0.2 ha. Data on landlessness may be found in the tables on size distribution of land ownership. If no such data on landlessness exists, you may extrapolate based on the total number of farmers or households in agriculture versus the number of farmers or households in agriculture that possess their own parcel of land.
ProbingRecognizing that fishers, and indigenous peoples and other marginalized groups will have different, more nuanced, contexts for land ownership, we encourage you to develop sub-indicators accordingly. Ownership will have to be treated as a more flexible concept for such groups.8
Analysis is warranted on trends of land ownership, such as: land fragmentation, land reconcentration, and inequality. For instance, the various dimensions of inequality are almost always correlated to each one another (McKay, 2002). We encourage land rights advocates to explore how land inequality is linked to other such dimensions of inequality, such as health and nutrition, education, power, and gender.
Lastly, we mention that the average size of landholdings (weighted) is another useful indicator for access to land, especially given the generally skewed nature of land ownership. The weighted average will account for the differences in the number of landholdings per size class. This will come in handy when analyzing trends in land ownership and landlessness.
GiniCoefficientIn a region where the gap between rich and poor, not only in terms of incomes, but also assets such land, is reputedly increasing, measuring inequality is useful. The Gini coefficient for land ownership inequality is proposed as an indicator to assist analysis of land ownership trends. This indicator of inequality can paint a good picture of the state of land reform implementation. High levels of inequality in land ownership may suggest that, for example, the task of land reforms is still unfinished, or that a reversal of land reforms is taking place. • Ginicoefficientlandorincomeinequality Also known as the Gini index or Gini ratio, the Gini coefficient is used as
an expression of inequality, and moves from a continuum of 0 to 1, with 0 describing perfect equality and 1 (or 100) denoting perfect inequality.
8 Admittedly, such measures of land concentration may not reflect access to land as experienced by groups outside formal registration systems.
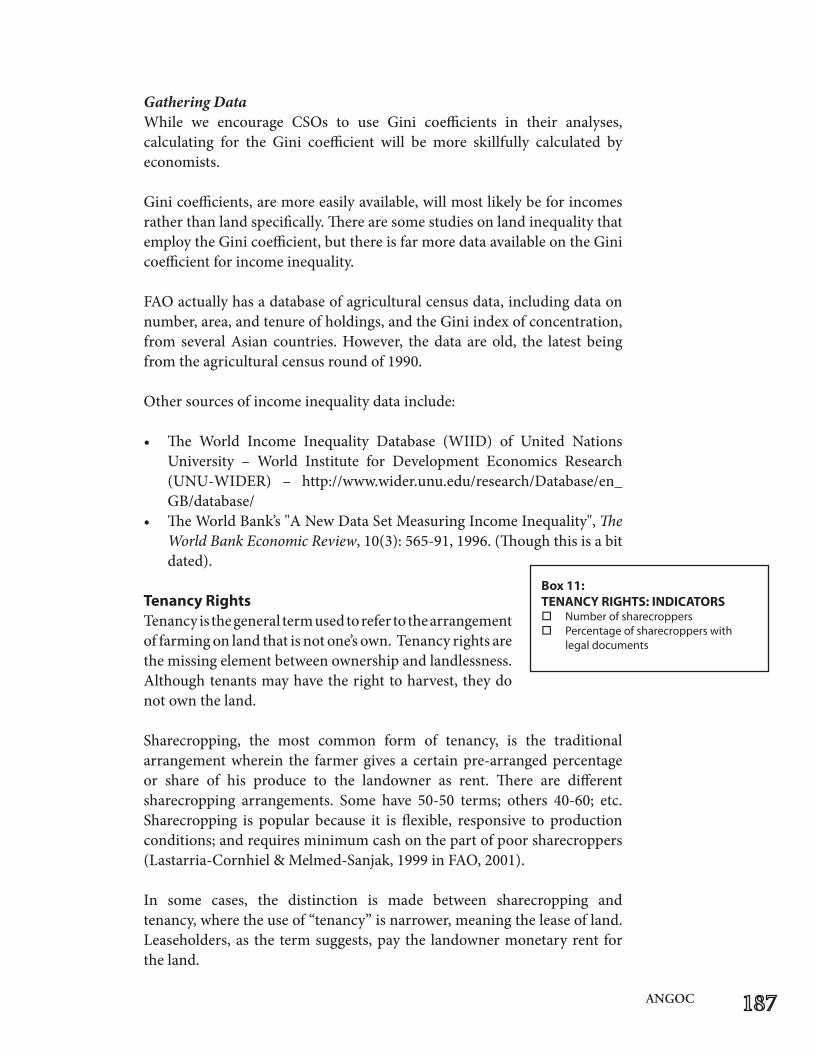
ANGOC
Gathering DataWhile we encourage CSOs to use Gini coefficients in their analyses,calculating for the Gini coefficient will be more skillfully calculated by economists.
Gini coefficients, are more easily available, will most likely be for incomes rather than land specifically. There are some studies on land inequality that employ the Gini coefficient, but there is far more data available on the Gini coefficient for income inequality.
FAO actually has a database of agricultural census data, including data on number, area, and tenure of holdings, and the Gini index of concentration, from several Asian countries. However, the data are old, the latest being from the agricultural census round of 1990.
Other sources of income inequality data include:
• The World Income Inequality Database (WIID) of United NationsUniversity – World Institute for Development Economics Research (UNU-WIDER) – http://www.wider.unu.edu/research/Database/en_GB/database/
• TheWorldBank’s"ANewDataSetMeasuringIncomeInequality",The World Bank Economic Review, 10(3): 565-91, 1996. (Though this is a bit dated).
TenancyRights Tenancy is the general term used to refer to the arrangement of farming on land that is not one’s own. Tenancy rights are the missing element between ownership and landlessness. Although tenants may have the right to harvest, they do not own the land.
Sharecropping, the most common form of tenancy, is the traditionalarrangement wherein the farmer gives a certain pre-arranged percentage or share of his produce to the landowner as rent. There are different sharecropping arrangements. Some have 50-50 terms; others 40-60; etc.Sharecropping is popular because it is flexible, responsive to productionconditions; and requires minimum cash on the part of poor sharecroppers (Lastarria-Cornhiel&Melmed-Sanjak,1999inFAO,2001).
In some cases, the distinction is made between sharecropping and tenancy, where the use of “tenancy” is narrower, meaning the lease of land. Leaseholders, as the term suggests, pay the landowner monetary rent for the land.
Box11:TENANCYRIGHTS:INDICATORSo Number of sharecropperso Percentage of sharecroppers with
legal documents
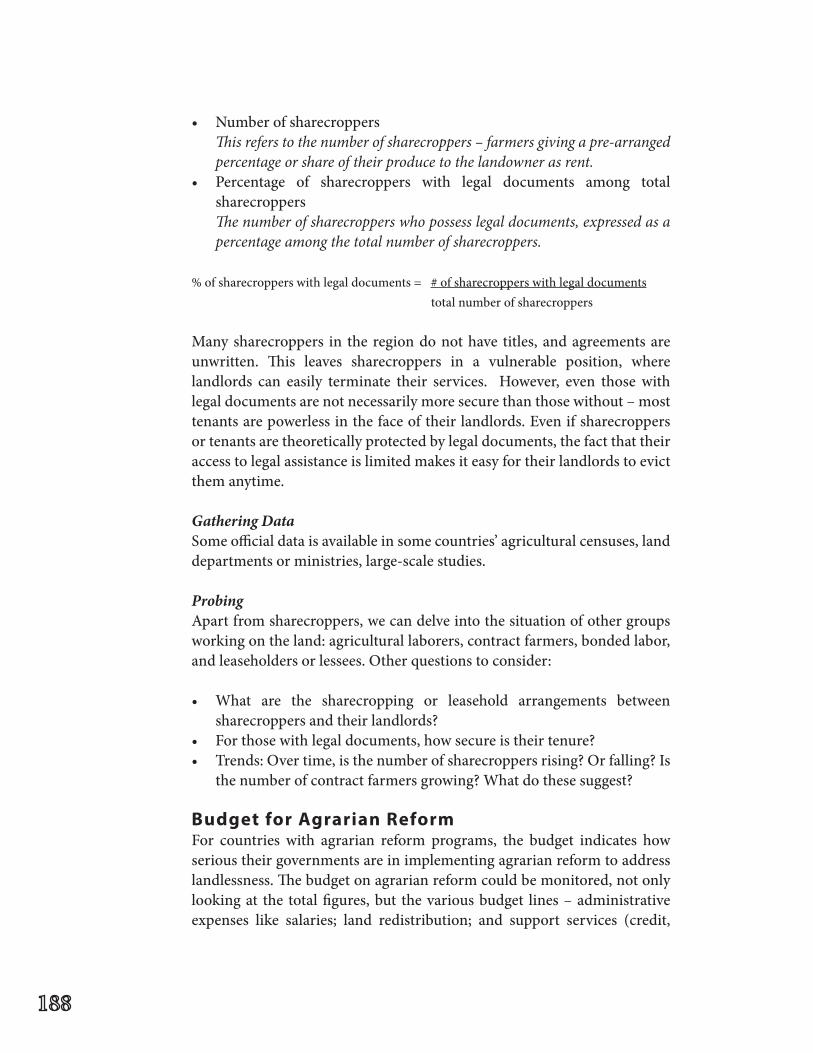
• Numberofsharecroppers This refers to the number of sharecroppers – farmers giving a pre-arranged
percentage or share of their produce to the landowner as rent. • Percentage of sharecroppers with legal documents among total
sharecroppers The number of sharecroppers who possess legal documents, expressed as a
percentage among the total number of sharecroppers.
% of sharecroppers with legal documents = # of sharecroppers with legal documents total number of sharecroppers Many sharecroppers in the region do not have titles, and agreements are unwritten. This leaves sharecroppers in a vulnerable position, where landlords can easily terminate their services. However, even those with legal documents are not necessarily more secure than those without – most tenants are powerless in the face of their landlords. Even if sharecroppers or tenants are theoretically protected by legal documents, the fact that their access to legal assistance is limited makes it easy for their landlords to evict them anytime.
Gathering DataSomeofficialdataisavailableinsomecountries’agriculturalcensuses,landdepartments or ministries, large-scale studies.
Probing Apart from sharecroppers, we can delve into the situation of other groups working on the land: agricultural laborers, contract farmers, bonded labor, and leaseholders or lessees. Other questions to consider:
• What are the sharecropping or leasehold arrangements betweensharecroppers and their landlords?
• Forthosewithlegaldocuments,howsecureistheirtenure?• Trends:Overtime,isthenumberofsharecroppersrising?Orfalling?Is
the number of contract farmers growing? What do these suggest?
BudgetforAgrarianReformFor countries with agrarian reform programs, the budget indicates how serious their governments are in implementing agrarian reform to address landlessness. The budget on agrarian reform could be monitored, not only looking at the total figures, but the various budget lines – administrative expenses like salaries; land redistribution; and support services (credit,
ANGOC
infrastructure, roads), to name some. Laws and policies should be matched with corresponding financial allocations in the budget; otherwise they cannot be implemented.
Gathering DataSometimesdataonagrarianreformbudgetsarenotavailableatall.Somecountries do not have a budget line specifically on “land reform”. In the absence of agrarian reform budgets, alternative or proxy indicators on government’s prioritization of enhancing access to land can include:
• Allocationforotherland-relatedprogramssuchaslanduse• Agriculturebudget It has been suggested that the research and development budget for
agriculture can stand in as an indicator for land reform. Oftentimes, this data is easier to access.
• Officialdevelopmentassistanceinagricultureandagrarianreform This looks at support provided from both multilateral and donor agencies
for agrarian reform and agriculture. These international agencies usually share information about program and project costs. IFIs do not only provide aid in the form of grants, but also loans.
Probing Budget monitoring is a recommended direction for land rights advocates. AhandfulofCSOshaveundertakeninitiativesonbudgetmonitoring.Inthe Philippines, PhilDHRRA has examined the budget of the Department of Agrarian Reform, and published its results accordingly. The Center for Agrarian Reform and Rural Development (CARRD) has also monitored the budget specifically on the delivery of agrarian justice.
PoliciesonWomen,IndigenousPeoplesandotherMarginalized Groups
Because land ownership and access to land of the rural poor also depend on who you are, there are laws and policies that seek to uphold the land rights of marginalized groups, including women, indigenous peoples, and fishers.
ReviewingPolicies The gamut of legal and policy frameworks includes national constitutions, laws, and policies. Monitoring donor policies can also be reviewed. But it’s not enough to enumerate the different laws, policies and programs in place (or in process). Analyze the laws and make assessments.
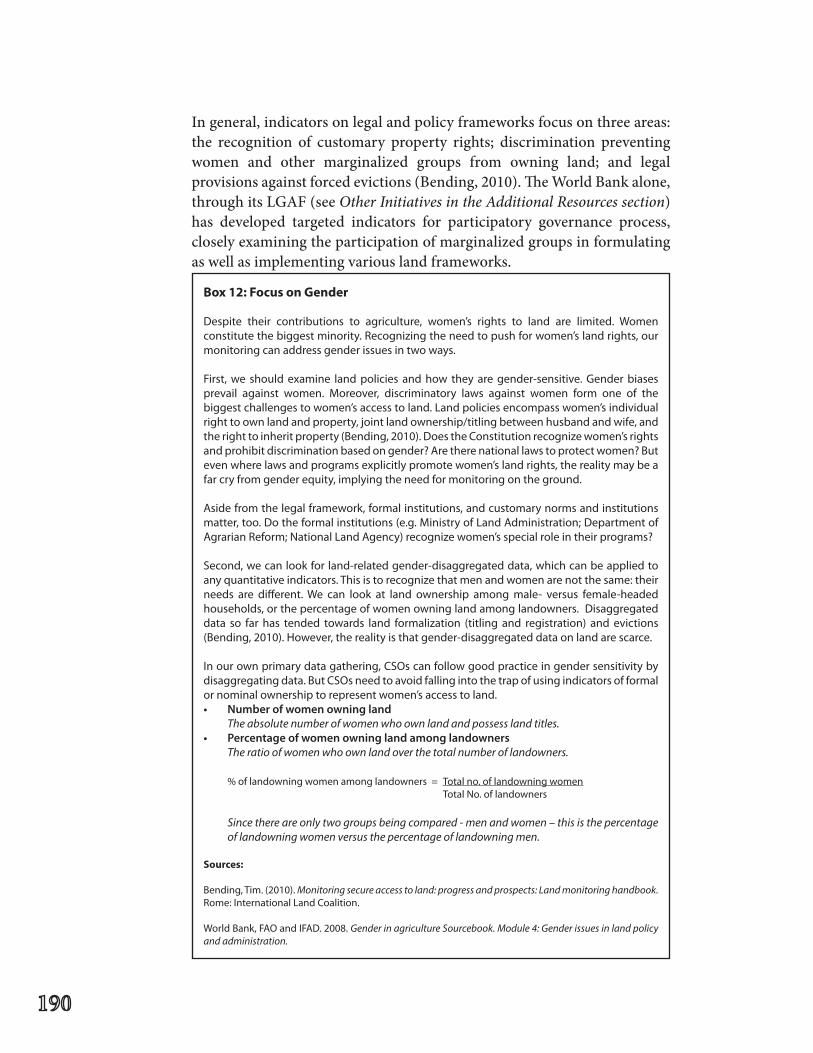
In general, indicators on legal and policy frameworks focus on three areas: the recognition of customary property rights; discrimination preventing women and other marginalized groups from owning land; and legal provisions against forced evictions (Bending, 2010). The World Bank alone, through its LGAF (see Other Initiatives in the Additional Resources section) has developed targeted indicators for participatory governance process, closely examining the participation of marginalized groups in formulating as well as implementing various land frameworks.
Box12:FocusonGender
Despite their contributions to agriculture, women’s rights to land are limited. Women constitute the biggest minority. Recognizing the need to push for women’s land rights, our monitoring can address gender issues in two ways.
First, we should examine land policies and how they are gender-sensitive. Gender biases prevail against women. Moreover, discriminatory laws against women form one of the biggest challenges to women’s access to land. Land policies encompass women’s individual right to own land and property, joint land ownership/titling between husband and wife, and the right to inherit property (Bending, 2010). Does the Constitution recognize women’s rights andprohibitdiscriminationbasedongender?Aretherenationallawstoprotectwomen?Buteven where laws and programs explicitly promote women’s land rights, the reality may be a farcryfromgenderequity,implyingtheneedformonitoringontheground.
Aside from the legal framework, formal institutions, and customary norms and institutions matter, too. Do the formal institutions (e.g. Ministry of Land Administration; Department of AgrarianReform;NationalLandAgency)recognizewomen’sspecialroleintheirprograms?
Second,wecanlookforland-relatedgender-disaggregateddata,whichcanbeappliedtoanyquantitativeindicators.Thisistorecognizethatmenandwomenarenotthesame:theirneeds are different. We can look at land ownership among male- versus female-headed households, or the percentage of women owning land among landowners. Disaggregated data so far has tended towards land formalization (titling and registration) and evictions (Bending, 2010). However, the reality is that gender-disaggregated data on land are scarce.
Inourownprimarydatagathering,CSOscanfollowgoodpracticeingendersensitivitybydisaggregatingdata.ButCSOsneedtoavoidfallingintothetrapofusingindicatorsofformalor nominal ownership to represent women’s access to land. • Numberofwomenowningland The absolute number of women who own land and possess land titles. • Percentageofwomenowninglandamonglandowners The ratio of women who own land over the total number of landowners.
% of landowning women among landowners = Total no. of landowning women Total No. of landowners
Since there are only two groups being compared - men and women – this is the percentage of landowning women versus the percentage of landowning men.
Sources:
Bending, Tim. (2010). Monitoring secure access to land: progress and prospects: Land monitoring handbook. Rome: International Land Coalition.
WorldBank,FAOandIFAD.2008.Gender in agriculture Sourcebook. Module 4: Gender issues in land policy and administration.
ANGOC
Getting OrganizedThis section outlines the steps needed to undertake monitoring, offering practical suggestions to enhance effectiveness and efficiency in monitoring.
etting organized takes time. In particular, building a team, convening a steering committee and creating partnerships require detailed attention. Do not underestimate the time and effort needed
(FAO, 2005).
Organizational Setup Each country is responsible for forming its own national monitoring team. Try to involve as wide a geographical area as possible. To allow for multiple perspectives, do include NGOs, farmer organisations, indigenous peoples, and the academe.
FirstThingsFirst:SecretariatA secretariat will be the focal point for monitoring. This can be the national focal point, or the national office with a point person on top of monitoring activities. Further, a secretariat responsible for seeing day-to-day management backstops the steering committee. Of course, the secretariat staff could already be the existing staffing arrangements of the host organization/convener of the steering committee.
We find that in Asia, “face to face” communication is generally preferred. Nonetheless, we welcome the use of technology – but we emphasise that this can be done when roles are clear.
EstablishasteeringcommitteeA steering committee (SC) is integral to the success of the monitoringinitiative.YourSCwillprovidedirection,bringotherperspectives,providegreater access to information, facilitate dissemination, and ensure support.
Composition. Your steering committee should comprise representatives from the following sectors: • NGOs• Farmers’organizations/indigenouspeople’sorganizations• Researchinstitutions/Academe
Pilots have emphasized the need to engage research institutions and the academe, to ensure that the proposed monitoring framework follows sound methodologies and academic rigor, which may provide more credibility.
You may also choose to include media, political activists, peasant leaders, women representatives, IP, and farmer activists. Regarding government participation, please see Box 13.
Criteria.NeverunderestimatetheimportanceofyourSteeringCommittee.You should carefully select them. We recommend they have solid experience in land reform monitoring, research and advocacy.
Size. For manageability, your steering committee should not exceed ten members. Choose quality over quantity. If you keep to a smaller size, each member will have more time to articulate comments during the meetings.
Do I need a Steering Committee?There are many good reasons for having a Steering Committee. Itworks for most organizations. However, it is not always necessary. For example, in the case of the Association for Land Reform and Rural Development (ALRD) in Bangladesh, they have prominent academics working on land issues in their Board of Directors. A SteeringCommitteewouldmerelyduplicate a mechanism that they alreadyhave,inwhichcasetheSCis unnecessary.
Focal points should discuss among their national partners whether a SteeringCommitteewillworkforthem.
Nonetheless–therearedifferentmodalitiesyoucantryiftheSCmechanismdoesn’t work for you.
Convening the Steering CommitteeYou must organize a steering committee inception meeting – or that meeting when you level off on indicators, definition of concepts, data
Box13: Do I include government? TheRoleofGovernments
In asking whether they should include governmentinmonitoring–ortheextentofCSOsfearco-option.
Contexts vary from country to country. It is ultimately up to you, whether including agovernmentrepresentativeinyourSCisstrategic, or otherwise.
In the Philippines, for instance, government representatives can be “champions” for advocacy (this may vary according to the government administration in power). Other countries arenotasfortunate–theirgovernmentsare antagonistic, and monitoring is done precisely to call attention to their failings and misdeeds.
It may be appropriate that governments are considered as sources of information, rather than members of the steering committee.
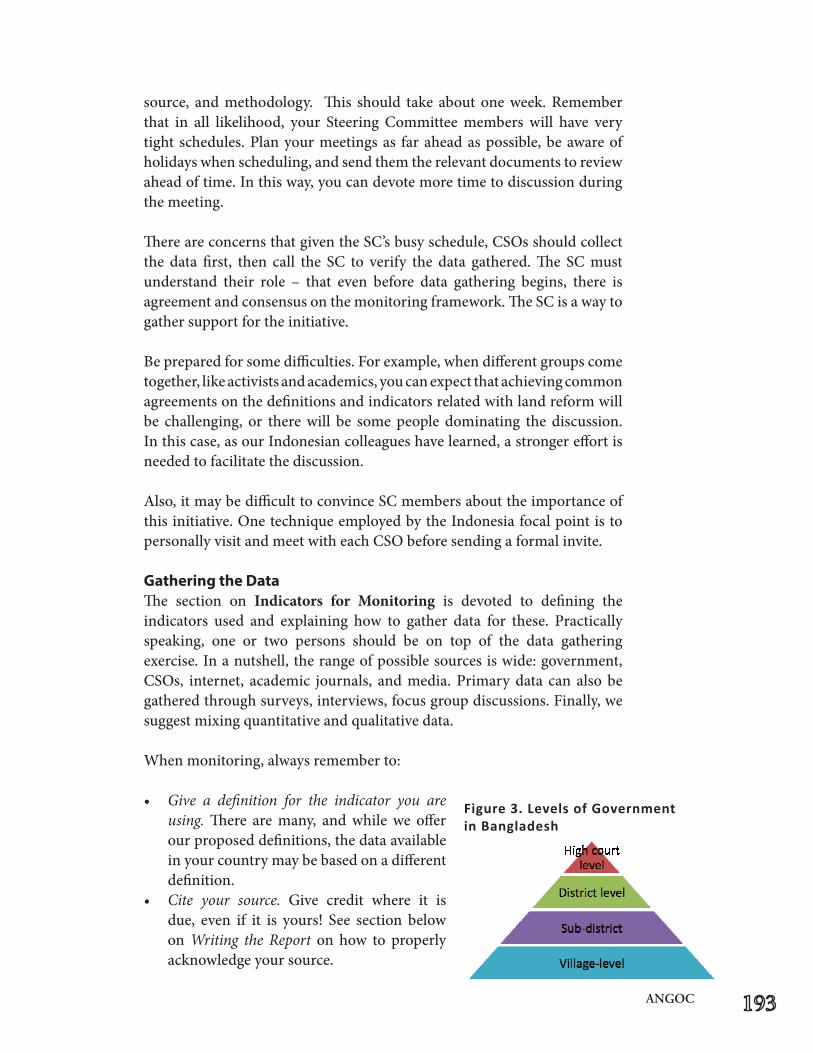
ANGOC
source, and methodology. This should take about one week. Remember that in all likelihood, your SteeringCommitteememberswill have verytight schedules. Plan your meetings as far ahead as possible, be aware of holidays when scheduling, and send them the relevant documents to review ahead of time. In this way, you can devote more time to discussion during the meeting.
ThereareconcernsthatgiventheSC’sbusyschedule,CSOsshouldcollectthe data first, then call the SC to verify the data gathered.The SCmustunderstand their role – that even before data gathering begins, there is agreementandconsensusonthemonitoringframework.TheSCisawaytogather support for the initiative.
Be prepared for some difficulties. For example, when different groups come together, like activists and academics, you can expect that achieving common agreements on the definitions and indicators related with land reform will be challenging, or there will be some people dominating the discussion. In this case, as our Indonesian colleagues have learned, a stronger effort is needed to facilitate the discussion.
Also,itmaybedifficulttoconvinceSCmembersabouttheimportanceofthis initiative. One technique employed by the Indonesia focal point is to personallyvisitandmeetwitheachCSObeforesendingaformalinvite.
Gathering the DataThe section on Indicators for Monitoring is devoted to defining the indicators used and explaining how to gather data for these. Practically speaking, one or two persons should be on top of the data gathering exercise. In a nutshell, the range of possible sources is wide: government, CSOs, internet, academic journals, andmedia.Primarydata can alsobegathered through surveys, interviews, focus group discussions. Finally, we suggest mixing quantitative and qualitative data.
When monitoring, always remember to:
• Give a definition for the indicator you are using. There are many, and while we offer our proposed definitions, the data available in your country may be based on a different definition.
• Cite your source. Give credit where it is due, even if it is yours! See section belowon Writing the Report on how to properly acknowledge your source.
Figure 3. Levels of Government in Bangladesh
• Cite the reference year for the data. It is always important to know when the data was produced, especially since we are tracking changes in land tenure and access to land.
• Indicate scale/level of data availability. The level of data matters. Data availability varies and depends on the specific indicator being asked for. For example, for the indicator on number of land dispute cases received, the data may be easily available (as government official judicial level data) at the high court level or at the district level. Below the district level, data may not be available or easily accessible – but the number will be very high. There will be more cases as you go down the pyramid (see Figure 3), down to the village level.
• Assess your data source. Monitoring is more than a data gathering exercise.Donotbelieveeverythingyouread!Youhavetoanalyzethequality of data gathered. Do you have reservations or concerns about the data provided – such as on the methodology used? Then you must state them.
• Explain the methodology used. The methodology you use will determine the kind of results you yield, so it is important to explain how you derived the data.
WritingUptheReport What’sinit?Before you begin, check Annex A, which contains the suggested outline forthereport.Startwithanoverviewofthereport,oranintroductionorcontext. It will set the tone for the report. Write concisely. If you mean to provide readers with an understanding of agrarian reform in your country, then it shouldn’t be a ten page history of agrarian reform. Explaining the CSO monitoring initiative in your country should not be a treatise onmonitoring. And so forth and so on.
The conceptual framework should present the indicators you have selected, explain the rationale, process, and scope and limitations. Your audience should be able to clearly understand the framework that you used for monitoring.
The meat of your report should be in the section on findings and analysis. Here, you describe the situation and make an assessment of land reform in your country, and try to tease out the trends, and make connections between variables and indicators – their causes, effects, implications.
Cambodia found that land disputes tend to concentrate in provinces with abundant lands, which are experiencing economic growth. In the Philippines, by closely looking at the data, PhilDHRRA discovered that over-releases from the agrarian reform budget were made during election years.
ANGOC
Then you draw the conclusions and recommendations. The most important findings should be discussed in this section. Recommendations are mostly for policy.1 Reflect on lessons. Identify specific recommendations to address the situation. Refrain from mere motherhood or generic statements. Be imaginative in exploring alternative solutions to problems.
The country reports in this publication are abridged, but they can be used as models on which to base your own writing.
Don’t forget the other important parts before and after the heart of your report:
• Table of Contents. The TOC is fundamental, yet too often neglected by CSOs.Learninghowtomakeiseasilydoneonmostwordprocessors.
• Glossary. If you have more than three technical terms, terms that are foreign or specific to your country, e.g., haruwa, lakh, begari, adat, and khas, please define them in a glossary.
• List of Abbreviations.SincenotonlyNGOs,butgovernmentsaswell,are fond of using abbreviations, please prepare a list of one.
• Executive Summary. This should not exceed one page, and should contain only highlights of the report. It should be written in such a way that it engages the reader’s attention.
• References/Bibliography.This is very important. See section onThe Art of Citation (next page).
• Annexes. Any supplementary material (not integral to the monitoring effort but important all the same) should be included as an annex.
HowGoesit?Who writes the report? It was suggested that writing is a team effort, involving a maximum of three persons, with one person holding editorial or consolidating responsibilities. The team should undertake brainstorming as needed. In other cases, writing is largely a one-person job; but the writer should also consult with colleagues and the secretariat, among others for feedback.
How much time does it take to write the report? One month to write the report is recommended, but this may vary.
TheArtofCitationOneareawhereCSOsneedimprovementisinthematterofcitations.This1 ItisimportanttogiverecommendationsontheprocessofCSOmonitoringlandreform,sincethis initiative is still very much in progress and will appreciate feedback. Recommendations on the process can be on the indicators selected, the mechanisms proposed, or anything you feel can provide input. Kindly share these process recommendations with ANGOC and the Land Watch Asia network, whether formally (i.e., process documentation notes) or informally.
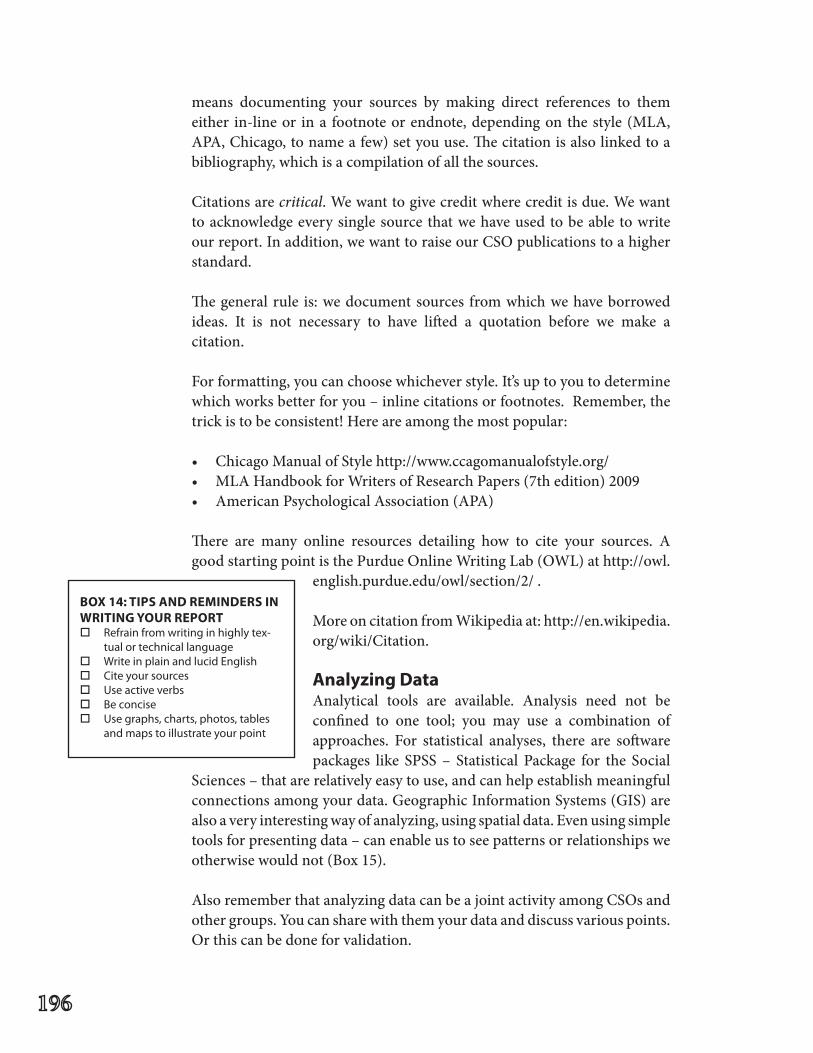
means documenting your sources by making direct references to them either in-line or in a footnote or endnote, depending on the style (MLA, APA, Chicago, to name a few) set you use. The citation is also linked to a bibliography, which is a compilation of all the sources.
Citations are critical. We want to give credit where credit is due. We want to acknowledge every single source that we have used to be able to write ourreport.Inaddition,wewanttoraiseourCSOpublicationstoahigherstandard.
The general rule is: we document sources from which we have borrowed ideas. It is not necessary to have lifted a quotation before we make a citation.
For formatting, you can choose whichever style. It’s up to you to determine which works better for you – inline citations or footnotes. Remember, the trickistobeconsistent!Hereareamongthemostpopular:
• ChicagoManualofStylehttp://www.ccagomanualofstyle.org/• MLAHandbookforWritersofResearchPapers(7thedition)2009• AmericanPsychologicalAssociation(APA)
There are many online resources detailing how to cite your sources. A good starting point is the Purdue Online Writing Lab (OWL) at http://owl.
english.purdue.edu/owl/section/2/ .
More on citation from Wikipedia at: http://en.wikipedia.org/wiki/Citation.
Analyzing Data Analytical tools are available. Analysis need not be confined to one tool; you may use a combination of approaches. For statistical analyses, there are software packages like SPSS – Statistical Package for the Social
Sciences–thatarerelativelyeasytouse,andcanhelpestablishmeaningfulconnectionsamongyourdata.GeographicInformationSystems(GIS)arealso a very interesting way of analyzing, using spatial data. Even using simple tools for presenting data – can enable us to see patterns or relationships we otherwise would not (Box 15).
AlsorememberthatanalyzingdatacanbeajointactivityamongCSOsandother groups. You can share with them your data and discuss various points. Or this can be done for validation.
BOx14:TIPSANDREMINDERSINWRITINGYOURREPORTo Refrain from writing in highly tex-
tual or technical language o Write in plain and lucid English o Cite your sourceso Use active verbso Be conciseo Use graphs, charts, photos, tables
and maps to illustrate your point
ANGOC
Box15: UsingGeographic InformationSystems(GIS)for monitoring
Usinggeographicinformationsystems(GIS)toproducemapscanbea highly effective and powerful way of presenting data gathered from monitoring. Because we are dealing with land, much of the information will be tied to a location (i.e. geographical or spatial), which can be displayedonamap.Bysimplylookingatthemaps,onecanquicklyseehow the various indicators on access to land and land tenure are spatially distributedinacountryorregion.GISallowsustocombinedifferentlayersofdata–featuresorthemesandoverlaythese.GISismorethanmap-making, serving as an analytical tool, to explore the relationships between differentthemes.UsingGISmapsmakescomparisonofindicatorsovertime easier. For example, we can see a layer on secure land rights overlaid with another layer on environmental degradation.
GISmapsenhancethepresentationofmonitoringdataandarethereforea powerful advocacy and communication tool. It can complement the datagathered–anddemonstraterelationships,suchasthecorrelationbetween landlessness and poverty. For example, in areas where landlessness is high, poverty incidence is also high; and it can also show where landlessness is concentrated. As another example, places where cases of land grabbing are reported could be the same places where there is a high incidence of land disputes and evictions. This is especially possibleattheregionallevel,usingthecommonindicators–tocompareand contrast between countries.
To illustrate, Open Development Cambodia has a map online (http://www.opendevelopmentcambodia.net/maps/) that is overlaid with several themes (economic land concessions, special economic zones, mining concessions,andproposedhydropowersites).Youcanselectwhichthemes you would like to see.
Inadditiontoanalysis,GIScanbeusedtogeneratemapstopresentresultsof findings (see sub-section on Presenting Results).
AconcernwithGISisthatitistechnicalandpotentiallyexpensive,butthisisnotnecessarilytrue.ManyGIStoolsarealreadyfreeandavailable.Additionally,mappingcanbeparticipatory–asCSOexperienceshavedemonstrated–andthereforeempowering.Thisallowsmonitoringtobesustainable. On balance, it needs sufficient investments in staff capacity developmenttoundertakeGIS.
Validation and Learning
PresentingtheDraftReport:ObtainingFeedbackandValidatingResultsAfter the report has been written, the draft should be subjected to review by all your stakeholders –steering committee and partner organisations, government, and the academe. Feedback should be documented properly, as these should be incorporated into your final report. You can validate your report once or twice, depending on the resources at your behest.
Triangulation. We are limited in terms of resources. We cannot conduct large-scale monitoring initiatives, and we are also unsure of the quality of the data we have obtained. Therefore we need to triangulate our data: “use [...] a variety of sources, methods or field team members to cross check and validate data and information to limit biases” (IFAD, n.d.). Where several data sets exist, you can use this as a means to validate and compare and contrast the results. For example, government data may be overestimates of performance, while there may be independent data from research or academic institutions.
Presentation to steering committee. Out of courtesy to your steering committee, we encourage you gather feedback from them before you consult with key partners.
Consultation with key partners. Organize a face-to-face consultation with various stakeholders to discuss and comment on the draft report. “Physical” meetings (as opposed to virtual meetings) imply the need for more resources, but this is a sure way to get feedback immediately. Hence, link with existing campaigns so that validation workshops/forums can be organizedback-to-backwiththecampaignactivities.Atanyrate,theCSOmonitoring initiative should complement the Land Watch Asia campaign.
InNepal,forinstance,CSRCconductedahalf-dayworkshopwithalliancemembers, government representatives, NGO partners to share the report and discuss the monitoring mechanism, prior to preparing the final report.
Alternatively, an electronic forum or bulletin board is a cheap (it costs virtually nothing if you know how to set it up) and highly effective way of soliciting feedback from various groups, especially those in geographically disparate areas. However, this mechanism requires a certain level of technical literacy - not only on your part, but also for those you expect to participate. It also assumes that your target audiences have access to the internet.
ANGOC
Learning. Monitoring is an ongoing learning act. Learning is a vital component in the knowledge management loop. We must reflect on our experiences – talking together, thinking about what went right and how we can move forward (i.e., appreciative inquiry). These lessons should be shared and documented – so that others may learn, and we ourselves can improve on process – in terms of data gathering, analysis, and presentation – and inform our action.
RevisingtheReportNowthatyou’vegatheredfeedback,youcanproceedwithrevisingthereport!This may entail gathering additional or verifying data, but just minimally. This is also the time you should edit, edit, and edit. Polish the writing, check for spelling and grammatical errors, ensure that your language is clear and unequivocal,andvoila!
DisseminatingResultsFinally, your report is finalized. It’s time to share the results of months of monitoring land reform with various audiences, employing a range of strategies.
We want the report to be made available in various forms, depending on the audience. But before you begin, you need to understand which is most suitable to your target audience. For example, policy makers are reputed to be busy, for which you will need to provide condensed versions of your report– in the formofpamphlets, perhaps.When reachingout toCSOpartners, constituents, and IGOs, you can use newsletters and books.
We encourage you to share the results with a host of organizations – from human rights organizations to government ministries and agencies, IGOs, CSOs,policymakers,theacademe,andthemedia.Youcanorganizeforumsor dialogues involving these stakeholders to present and discuss the report at the country level; this way you promote multi-sectoral dialogue while promoting your own research and advocacy.
ReachingouttothePublicToooftenCSOsdon’tknowhowtoraiseconsciousnessamong“ordinary”citizens. Especially in this day and age, these citizens are empowered to take a stand and respond to the issues they believe in. Mass media can be maximized to highlight land issues.
Radio and print media are the traditional means of allowing the general public to learn more about our advocacy issues. They remain strong, especially in rural areas, but gaining in popularity are the web 2.0 technologies such as
Facebook, Twitter, and blogs. Post the report – and other related content on land reform – on your websites.
ANGOC’s publication Ideas in Action for Land Rights Advocacy (www.angoc.org) has two helpful articles. “How to use mass media for advocacy” discusses traditional media, and provides tips for taking advantage of traditional media. “Enter new media” explains the emergence of new media or social media in advocacy, and gives examples of how these web tools have been used to enhance advocacy campaigns.
Other knowledge sharing tools are also available on the internet. We recommend looking for IFAD-ENRAP, and their publications on knowledge sharing.
ANGOC
AdditionalResourcesThis section is dedicated to a few resources that can lend you a hand as you go about monitoring. Draw inspiration from Land Watch initiatives in Asia and beyond, international instruments in support of land rights, and other initiatives at the global level to complement your own monitoring.
Land Watch Initiatives
he Land Watch Asia network has a wealth of experiences in land rights advocacy, some of which have entailed extensive monitoring. Further reading and exploring is highly encouraged of land
advocates. By no means is the list below comprehensive, but it should serve as inspiring.
• KPAcompiles an extensivedatabaseon agrarian land conflicts.Dataare available for most provinces, and are classified according to the administrative era and the nature of the conflicts.
• STARKampuchea andNGO Forum on Cambodia form part of theLand Action Network for Development (LAND). The NGO Forum on Cambodia regularly monitors land disputes in the country, providing a statistical analysis.
• Dr.Barkat,whositsontheboardofALRD,hasconductednumerousstudies on land. He has notably researched on the political economy of land litigation, khas land distribution, and the Vested Property Act.
• PhilDHRRA has considerable experience in convening intersectoraldialogues, as well as in monitoring asset reform. Its member, the Center for Agrarian Reform and Rural Development, has done budget monitoring particularly in regard to agrarian justice delivery.
• AVARDhasinitiativesinpushingforlegislationsonfoodsecurityandaccess to land, and cooperates with the Bihar Land Reforms Commission on implementing its recommendations and monitoring this.
• SCOPE in Pakistan has expertise in understanding the effects ofdesertification on land, as well as organizing the National Peasants Coalition of Pakistan.
• CSRChasorganized theNationalLandRightsForumthatallows forgrassroots monitoring. It also has many publications that depict the land rights situation in Nepal, including a journal, Land First.
Other Land Watch initiatives in Latin America and Africa (ANGOC, 2011) include:
• Peruvian “Law in Action” Land Watch and National Dialogue, ischanging the national legislative framework in response to agribusiness policies.
• TheBolivianLandObservatoryandNationalDialogueisarticulatingindigenousrightswithintheStateandsupportingnationalprocessestorespond to many challenges related to land rights.
• The Central America Observatory on land policies and peasantagriculture monitors the impact of free trade agreements on changing land use and access to land for small scale agriculture.
• AfricanCSOsareworkingondevelopingscorecardformonitoringtheAfrica Land Framework and Guidelines of the African Union.
Other InitiativesThe initiatives briefly discussed here are opportunities for complementation at the regional and global levels.1 Groups are already involved in land monitoring or issues associated with land, like corruption and human rights. Through cooperation and strategic complementation of efforts, your work can be more effective and lead to synergy for change. Take note of course, of the differences in our perspectives.
TransparencyInternational
Corruption Perceptions IndexTransparency International (TI) regularly produces the Corruption Perceptions Index (CPI), which ranks countries according to perceived levels of corruptions. This is a popular tool that TI claims is credited for putting corruption back on the international policy agenda. TI uses perceptions because corruption is difficult to measure and is normally hidden from the public. Perceptions- through different assessments and independent business opinion surveys – are accepted as a way of estimating corruption.
It is useful to correlate the results of the CPI with the findings from our land reform monitoring initiative. This will allow us to tease out relationships and form interesting correlations.
Global Corruption BarometerTogether with FAO, TI has included questions on land sector corruption in surveys for its Global Corruption Barometer in 2009.
WorldBank’sLandGovernanceAssessmentFrameworkThe Land Governance Assessment Framework (LGAF) is being led by the World Bank. The LGAF has more than 80 indicators, falling into 21 index groups and 5 thematic areas: legal and institutional framework; land
1 The sources for this section are taken from the mentioned organizations’ websites.
ANGOC
use planning and taxation; management of state land; public provision of land information; and dispute resolution and conflict management. In terms of methodology, it has relied primarily on experts.
The LGAF has thus far been piloted in 5 countries, including Indonesia. When the LGAF is finally implemented globally, it will provide baseline data for countries, especially on land administration issues. The various Land Watch Asia countries can work on specific areas, such as dispute resolution. Your country can be profiled or sub-setted, based on specific context and needs.
IFAD’sPerformance-BasedAllocationSystem(PBAS) IFAD determines funding allocations based on both a country’s need, as well as its performance, in terms of past loan borrowings, through its Performance-Based Allocation System (PBAS). Three sub-elementsare used to assess country performance: broad policy framework; rural development policy; and portfolio performance. IFAD emphasizes rural sector performance, using 12 main indicators, including access to land. Four sub-indicators fall under access to land, namely: access to land for the rural poor; land tenure; formal land markets; and regulation for land management and use of common property resources at the community level.
MonitoringtheseindicatorsgenerallytakesplaceinSeptemberandOctobereach year. IFAD is working to make the process more participatory. Through LWA’sCSOlandreformmonitoringinitiative,youcansharewithIFADdatathatwillcomplementit. CSOscanalsogivefeedbackonIFAD’sscoring.
UN-HABITAT’SGlobalUrbanObservatoryThe UN-HABITAT’s Global Urban Observatory (GUO) covers legal issues, dispute resolution, eviction processes, and land affordability. However, as its name implies, monitoring focuses on urban areas.
Learn More A more detailed list is provided and reviewed by Tim Bending in Land Monitoring Handbook, Monitoring Secure Access to Land: Progress and Prospects, published by the International Land Coalition (2010).
National Inputs At the national level, a range of documents helpful to monitoring are available. They can be planning documents – for example, national economic developmentplans,orPovertyReductionStrategyPapers(PRSPs).Theseoffer opportunity to influence public policy, mobilize communities and other stakeholders, and gain official recognition and support from government
besides (ANGOC, 2006). Laws and policies were touched on in the section on Indicators and Methodologies.
Critically examine these documents, particularly on how they treat the issue of land.
International Instruments International instruments represent an important opportunity forCSOs.By monitoring the implementation of the provisions of international conventions, CSOs can exact accountability from their governments. Iftheir government has acceded to or ratified a convention, the convention becomes law, which the government must therefore enforce.
Critiques argue that international instruments, even those that are binding, are not useful. “International law has no teeth.” As always, implementation of international law is a challenge. It is difficult to take governments to task for not implementing, or even violating provisions of an international treaty. Nonetheless, international conventions can be monitored and used for advocacy – to engage governments and international organizations in policy discussions.
We have selected a few land-related international instruments on human rights mechanisms that can provide advocacy entry points:
• United Nations Convention to Combat Desertification (UNCCD). Desertification and drought are leading to the loss of land and biodi-versity and decline in agricultural productivity throughout the region. Governments that have ratified the UNCCD are required to submit a National Action Programme, detailing the measures they will take to mitigate the impacts of drought and desertification.
• Articles 13-19 of ILO Convention No. 169 (1989) on Indigenous and Tribal Peoples in Independent Countries. Article 14 recognizes indig-enous peoples’ rights over traditional lands- and moreover, the state’s obligation to safeguard these rights. ILO Convention No. 107 (1957) promotes IPs’ right of ownership over the lands which they traditionally occupy. No. 107 was criticized as integrationist, patronizing, and back-wards in thinking. With the adoption of the more progressive Conven-tion No. 169, No. 107 was revised.
• Voluntary Guidelines. Despite their non-binding nature, Voluntary Guidelines (VGs) are still valuable tools. “Voluntary guidelines set
ANGOC
out principles and internationally accepted standards for responsible practices.TheyprovideaframeworkthatStatescanusewhendevelopingtheir own strategies, policies, legislation and programmes. They allow government authorities, the private sector, civil society and citizens to judge whether their proposed actions and the actions of others constitute acceptable practices” (FAO, n.d.).
o The Right to Adequate Food has been affirmed in various international human rights instruments. But it is monitoring
compliance with FAO’s Voluntary Guidelines to Support theProgressive Realization of the Right to Adequate Food in the
ContextofNationalFoodSecuritythatCSOswillfindmoreuseful.o Guideline 8B of the VG, under Access to Resources and Assets, is
on land. It affirms the need for states to promote secure land tenure, through legal and policy mechanisms that advance land reform, in a manner “consistent with their international human rights obligations and in accordance with the rule of law.” It also mentions women, poor and disadvantaged sectors of society, and indigenous communities.
o The Voluntary Guidelines on Responsible Governance of Tenure of Land, Fisheries, and Forests, prepared by FAO, has been approved bytheCommitteeonWorldFoodSecurity(CFS) inMarch2012.These Guidelines recognize the role of land tenure governance in protecting the rights of the rural poor to land and other natural resources, outlining principles and good practices for governments to adhere to.
• International Covenant on Economic, Social and Cultural Rights(ICESCR) and the International Covenant on Civil and PoliticalRights (ICCPR). These two UN treaties are part of the International Bill ofHumanRights.TheICESCRpushesforthefulfillmentofeconomic,social, and cultural rights – including health, education, labor, housing, and an adequate standard of living. The ICCPR seeks to protect property rights.Statesareobligedtoprotectitspeoplefromforcedevictions.
• Convention to Eliminate All Forms of Discrimination Against
Women (CEDAW). Article 14 recognizes indigenous peoples’ rights over traditional lands. CEDAW is a legally binding agreement, and is the only human rights treaty that deals with rural women.
Table 12 is a simple guide to selected countries in Asia, and whether they have “participated” in key international conventions related to land.
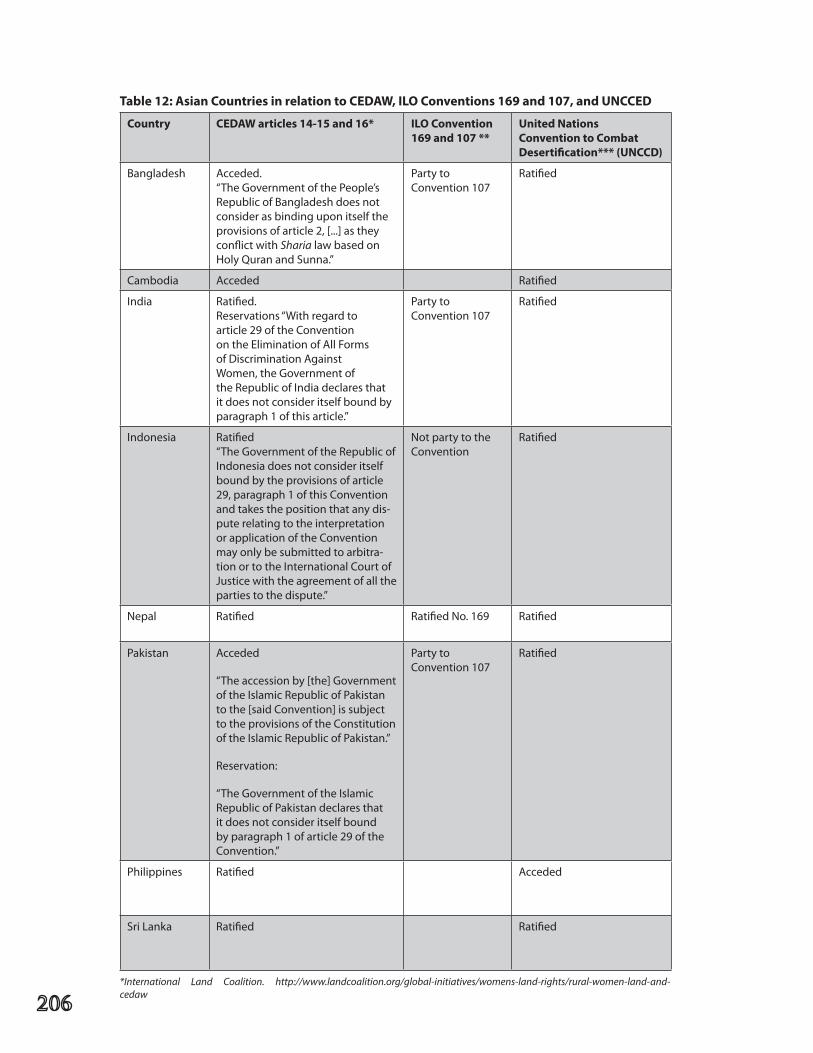
*International Land Coalition. http://www.landcoalition.org/global-initiatives/womens-land-rights/rural-women-land-and-cedaw
Country CEDAWarticles14-15and16* ILO Convention 169and107**
United Nations Convention to Combat Desertification***(UNCCD)
Bangladesh Acceded. “The Government of the People’s Republic of Bangladesh does not consider as binding upon itself the provisions of article 2, [...] as they conflictwithSharia law based on HolyQuranandSunna.”
Party to Convention107
Ratified
Cambodia Acceded Ratified
India Ratified. Reservations “With regard to article 29 of the Convention on the Elimination of All Forms of Discrimination Against Women, the Government of the Republic of India declares that it does not consider itself bound by paragraph 1 of this article.”
Party to Convention107
Ratified
Indonesia Ratified“The Government of the Republic of Indonesia does not consider itself bound by the provisions of article 29, paragraph 1 of this Convention and takes the position that any dis-pute relating to the interpretation or application of the Convention may only be submitted to arbitra-tion or to the International Court of Justicewiththeagreementofalltheparties to the dispute.”
Not party to the Convention
Ratified
Nepal Ratified RatifiedNo.169 Ratified
Pakistan Acceded
“The accession by [the] Government of the Islamic Republic of Pakistan to the [said Convention] is subject to the provisions of the Constitution of the Islamic Republic of Pakistan.”
Reservation:
“The Government of the Islamic Republic of Pakistan declares that it does not consider itself bound by paragraph 1 of article 29 of the Convention.”
Party to Convention107
Ratified
Philippines Ratified Acceded
SriLanka Ratified Ratified
Table12:AsianCountriesinrelationtoCEDAW,ILOConventions169and107,andUNCCED
ANGOC
Learn More International instruments cover such a large block of information. There is a plethora of international treaties, agreements, declarations and guidelines that tackle land rights. We suggest the following reading list on certain international instruments:
• ILC, Oxfam Novib, SOMO, WTI, Katja Gehne, Simone Heri,Elisabeth Bürgi-Bonanomi, Albert ten Kate, Sanne van der Waal.2011. International Instruments influencing the rights of people facing investments in agricultural land. ILC: Rome.
• UnitedNationsTreatyCollection.http://treaties.un.org/• InternationalLabourOrganization.“ConventionNo.107”.http://www.
ilo.org/indigenous/Conventions/no107/lang--en/index.htm • InternationalLabourOrganization.“ConventionNo.169”.http://www.
ilo.org/indigenous/Conventions/no169/lang--en/index.htm• Birgitte Feiring, Programme to Promote ILO Convention No. 169
- International Labour Standards Department. 2009. Indigenous and Tribal Peoples’ Rights in Practice: A Guide to ILO Convention No. 169.
• AusefullistofdefinitionofUNTreatytermscanbefoundin:http://treaties.un.org/pages/Overview.aspx?path=overview/glossary/page1_en.xml
• FIANhaspreparedamanualonusingtheVoluntaryGuidelinesontheRight to Food: http://www.fian.org/resources/documents/others/how-to-use-the-voluntary-guidelines-on-the-right-to-food/pdf
• FAO.2006.The Right to Food in Practice: Implementation at the National Level.
• OfficeoftheHighCommissionerforHumanRights.BasicPrinciplesand Guidelines on Development-Based Evictions and Displacement. Annex1ofthereportoftheSpecialRapporteuronadequatehousingas a component of the right to an adequate standard of living. http://www2.ohchr.org/english/issues/housing/docs/guidelines_en.pdf
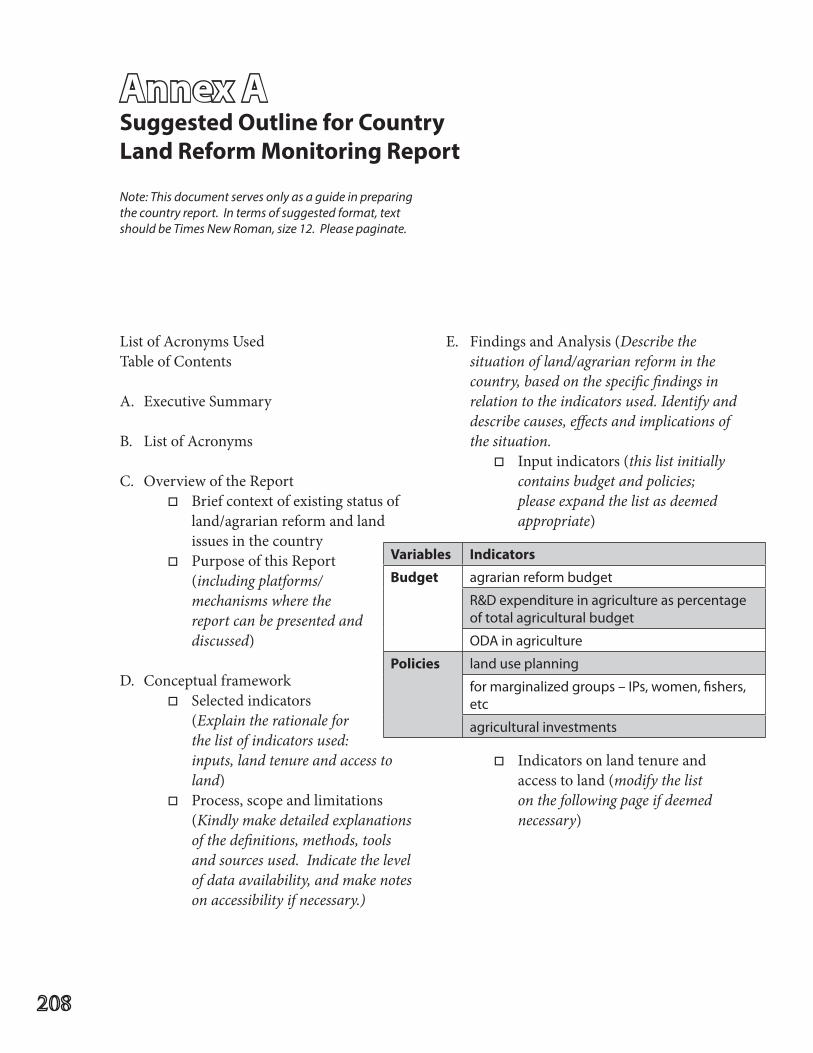
ListofAcronymsUsedTable of Contents
A. ExecutiveSummary
B. ListofAcronyms
C. OverviewoftheReporto Brief context of existing status of
land/agrarian reform and land issuesinthecountry
o Purpose of this Report (including platforms/mechanisms where the report can be presented and discussed)
D. Conceptualframeworko Selected indicators
(Explain the rationale for the list of indicators used: inputs, land tenure and access to land)
o Process, scope and limitations (Kindly make detailed explanations of the definitions, methods, tools and sources used. Indicate the level of data availability, and make notes on accessibility if necessary.)
Annex ASuggested Outline for CountryLandReformMonitoringReport
E. FindingsandAnalysis(Describe the situation of land/agrarian reform in the country, based on the specific findings in relation to the indicators used. Identify and describe causes, effects and implications of the situation.
o Input indicators (this list initially contains budget and policies; please expand the list as deemed appropriate)
o Indicators on land tenure and access to land (modify the list on the following page if deemed necessary)
Note: This document serves only as a guide in preparing the country report. In terms of suggested format, text should be Times New Roman, size 12. Please paginate.
Variables Indicators
Budget agrarian reform budget
R&D expenditure in agriculture as percentage of total agricultural budget
ODA in agriculture
Policies land use planning
formarginalizedgroups–IPs,women,fishers,etc
agricultural investments
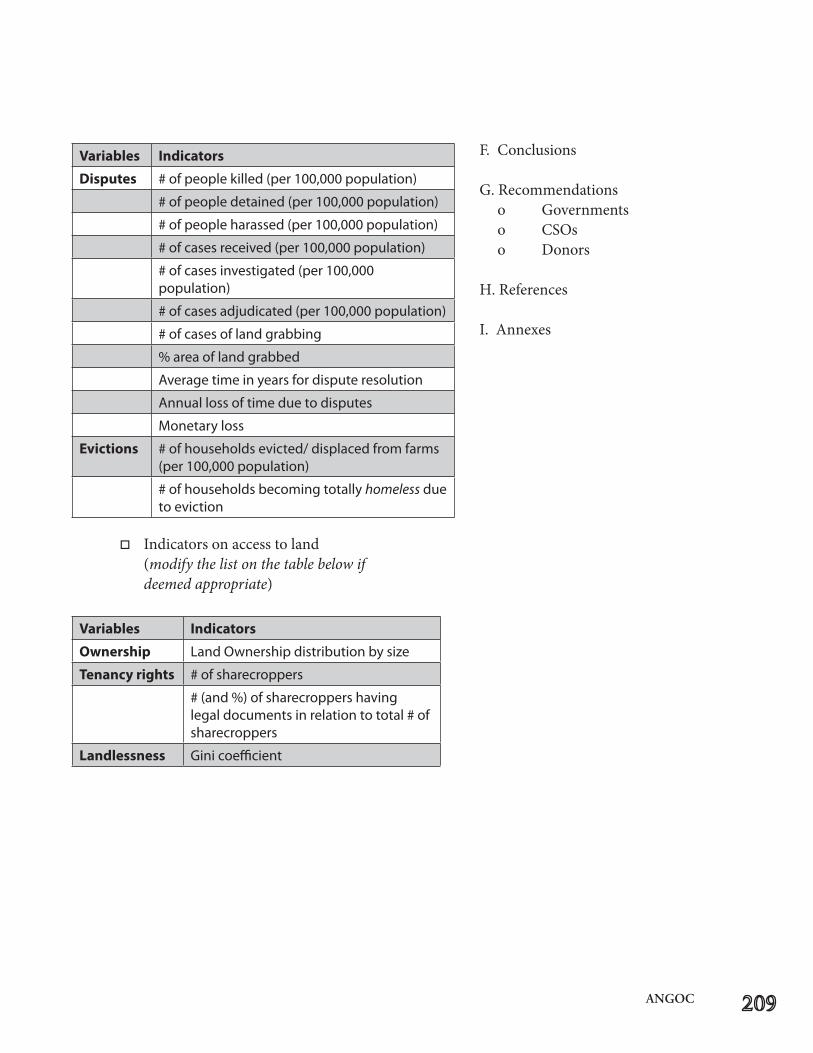
ANGOC
o Indicators on access to land (modify the list on the table below if deemed appropriate)
Variables Indicators
Disputes # of people killed (per 100,000 population)
# of people detained (per 100,000 population)
# of people harassed (per 100,000 population)
# of cases received (per 100,000 population)
# of cases investigated (per 100,000 population)
# of cases adjudicated (per 100,000 population)
# of cases of land grabbing
% area of land grabbed
Average time in years for dispute resolution
Annual loss of time due to disputes
Monetary loss
Evictions # of households evicted/ displaced from farms (per 100,000 population)
# of households becoming totally homeless due to eviction
Variables Indicators
Ownership Land Ownership distribution by size
Tenancyrights # of sharecroppers
# (and %) of sharecroppers having legal documents in relation to total # of sharecroppers
Landlessness Gini coefficient
F. Conclusions G. Recommendations
o Governmentso CSOso Donors
H. References
I. Annexes
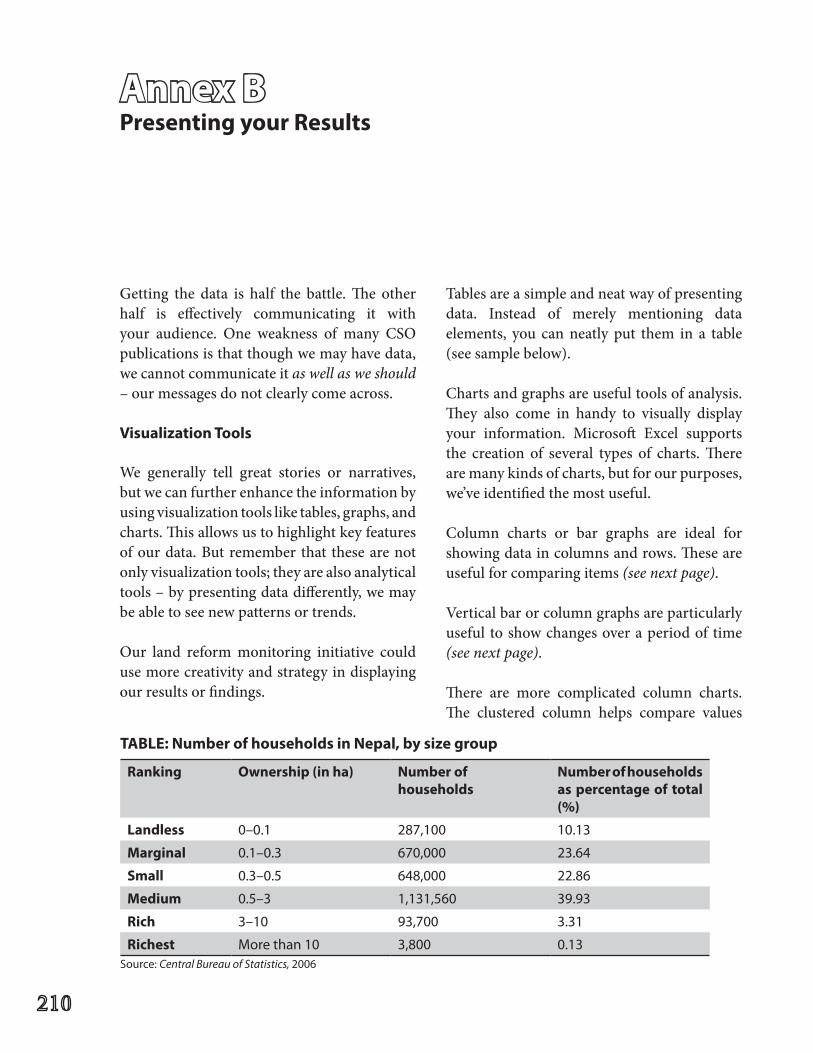
Annex BPresentingyourResults
Getting the data is half the battle. The other half is effectively communicating it with your audience. One weakness of many CSOpublications is that though we may have data, we cannot communicate it as well as we should – our messages do not clearly come across.
VisualizationTools
We generally tell great stories or narratives, but we can further enhance the information by using visualization tools like tables, graphs, and charts. This allows us to highlight key features of our data. But remember that these are not only visualization tools; they are also analytical tools – by presenting data differently, we may be able to see new patterns or trends.
Our land reform monitoring initiative could use more creativity and strategy in displaying our results or findings.
Tables are a simple and neat way of presenting data. Instead of merely mentioning data elements, you can neatly put them in a table (see sample below).
Charts and graphs are useful tools of analysis. They also come in handy to visually display your information. Microsoft Excel supports the creation of several types of charts. There are many kinds of charts, but for our purposes, we’ve identified the most useful.
Column charts or bar graphs are ideal for showing data in columns and rows. These are useful for comparing items (see next page).
Vertical bar or column graphs are particularly useful to show changes over a period of time (see next page).
There are more complicated column charts. The clustered column helps compare values
Ranking Ownership(inha) Number of households
Number of households as percentage of total (%)
Landless 0–0.1 287,100 10.13
Marginal 0.1–0.3 670,000 23.64
Small 0.3–0.5 648,000 22.86
Medium 0.5–3 1,131,560 39.93
Rich 3–10 93,700 3.31
Richest More than 10 3,800 0.13
TABLE:NumberofhouseholdsinNepal,bysizegroup
Source:Central Bureau of Statistics, 2006
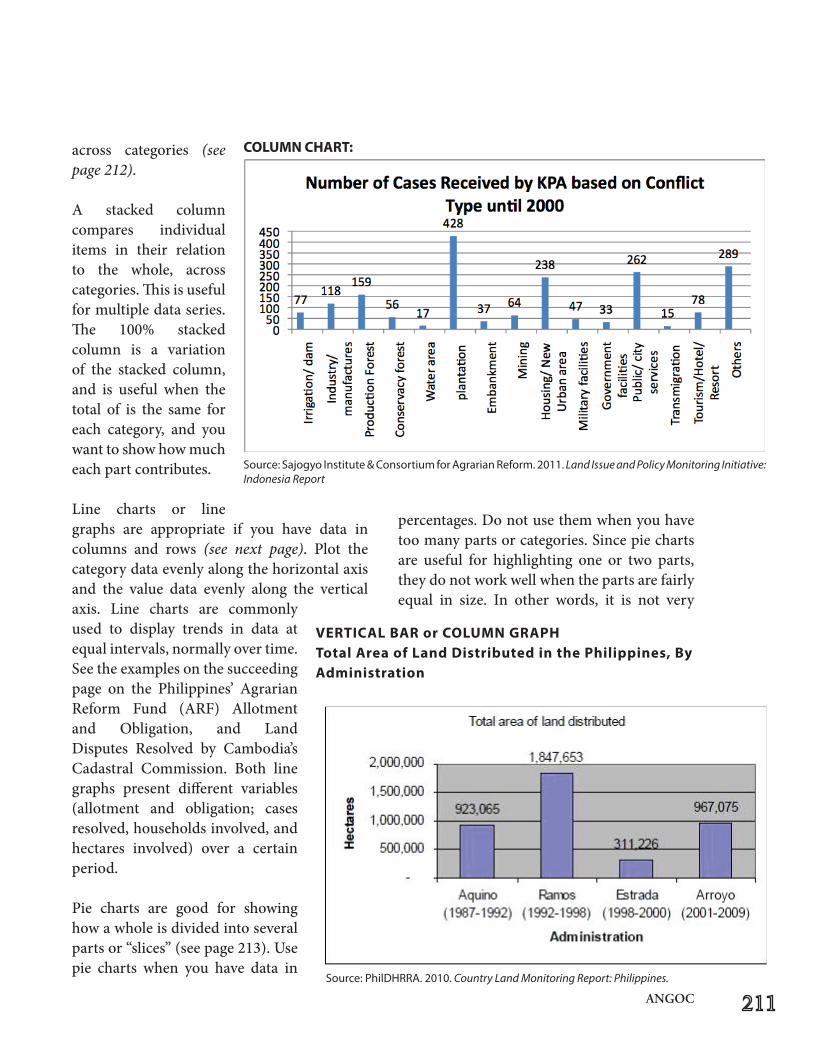
ANGOC
across categories (see page 212).
A stacked column compares individual items in their relation to the whole, across categories. This is useful for multiple data series. The 100% stacked column is a variation of the stacked column, and is useful when the total of is the same for each category, and you want to show how much each part contributes.
Line charts or line graphs are appropriate if you have data in columns and rows (see next page). Plot the category data evenly along the horizontal axis and the value data evenly along the vertical axis. Line charts are commonly used to display trends in data at equal intervals, normally over time. Seetheexamplesonthesucceedingpage on the Philippines’ Agrarian Reform Fund (ARF) Allotment and Obligation, and Land Disputes Resolved by Cambodia’s Cadastral Commission. Both line graphs present different variables (allotment and obligation; cases resolved, households involved, and hectares involved) over a certain period.
Pie charts are good for showing how a whole is divided into several parts or “slices” (see page 213). Use pie charts when you have data in
percentages. Do not use them when you have toomanypartsorcategories.Sincepiechartsare useful for highlighting one or two parts, they do not work well when the parts are fairly equal in size. In other words, it is not very
Source:SajogyoInstitute&ConsortiumforAgrarianReform.2011. Land Issue and Policy Monitoring Initiative: Indonesia Report
COLUMNCHART:
Source:PhilDHRRA.2010. Country Land Monitoring Report: Philippines.
VERTICALBARorCOLUMNGRAPHTotalAreaofLandDistributedinthePhilippines,ByAdministration
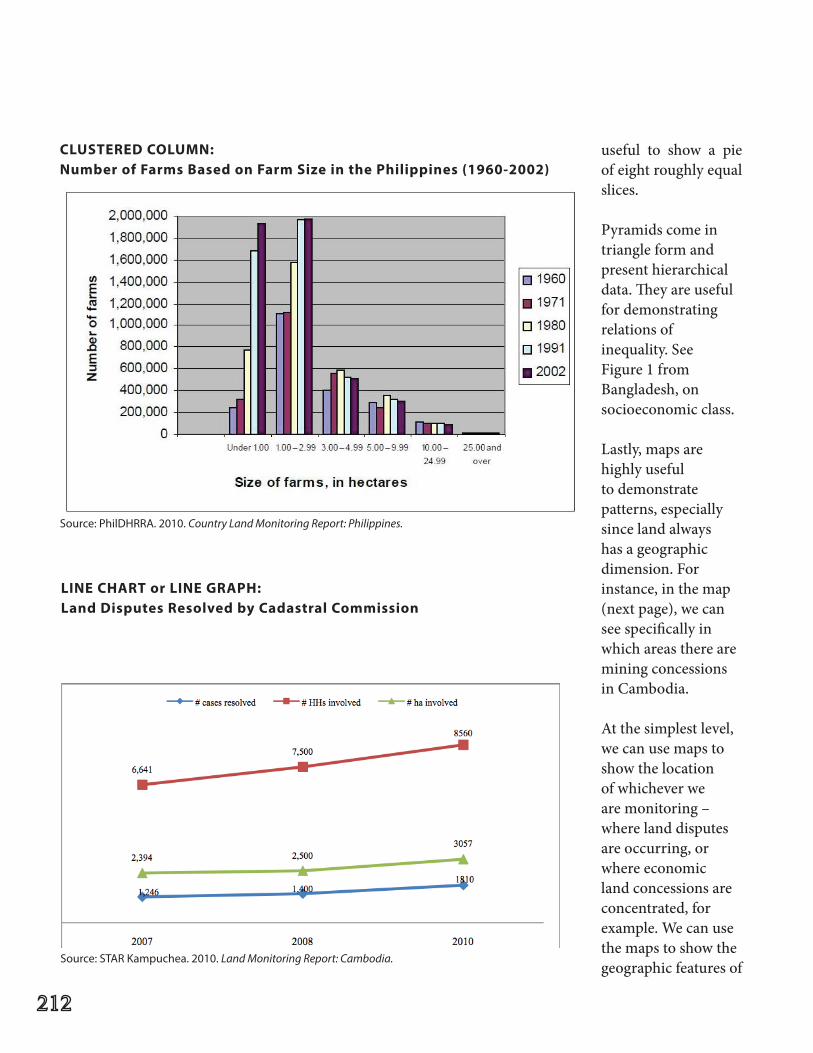
useful to show a pie of eight roughly equal slices.
Pyramids come in triangle form and present hierarchical data. They are useful for demonstrating relations of inequality.SeeFigure 1 from Bangladesh, on socioeconomic class.
Lastly, maps are highly useful to demonstrate patterns, especially since land always has a geographic dimension. For instance, in the map (next page), we can see specifically in which areas there are mining concessions in Cambodia.
At the simplest level, we can use maps to show the location of whichever we are monitoring – where land disputes are occurring, or where economic land concessions are concentrated, for example. We can use the maps to show the geographic features of
CLUSTEREDCOLUMN:NumberofFarmsBasedonFarmSizeinthePhilippines(1960-2002)
Source:PhilDHRRA.2010.Country Land Monitoring Report: Philippines.
LINECHARTorLINEGRAPH:LandDisputesResolvedbyCadastralCommission
Source:STARKampuchea.2010.Land Monitoring Report: Cambodia.
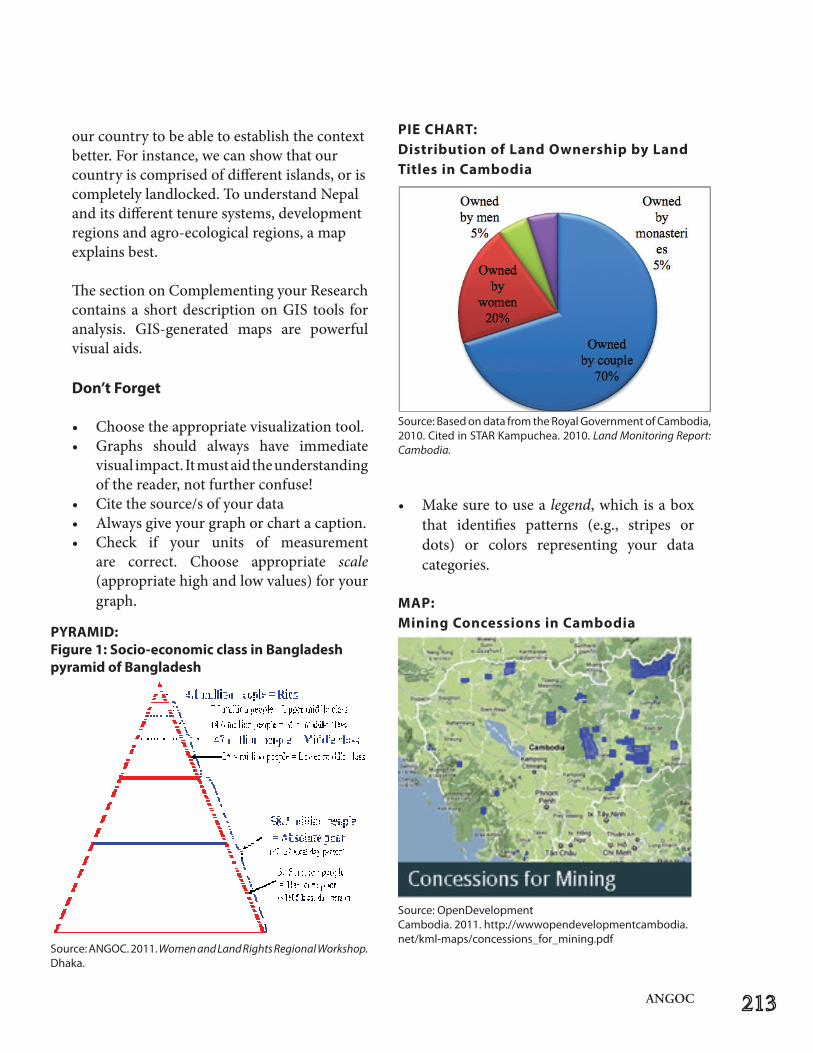
ANGOC
our country to be able to establish the context better. For instance, we can show that our country is comprised of different islands, or is completely landlocked. To understand Nepal and its different tenure systems, development regions and agro-ecological regions, a map explains best. The section on Complementing your Research containsa shortdescriptiononGIS tools foranalysis. GIS-generated maps are powerfulvisual aids.
Don’tForget
• Choosetheappropriatevisualizationtool.• Graphs should always have immediate
visual impact. It must aid the understanding ofthereader,notfurtherconfuse!
• Citethesource/sofyourdata• Alwaysgiveyourgraphorchartacaption.• Check if your units of measurement
are correct. Choose appropriate scale (appropriate high and low values) for your graph.
PIECHART:DistributionofLandOwnershipbyLandTitlesinCambodia
Source:BasedondatafromtheRoyalGovernmentofCambodia,2010.CitedinSTARKampuchea.2010.Land Monitoring Report: Cambodia.
• Makesuretousea legend, which is a box that identifies patterns (e.g., stripes or dots) or colors representing your data categories.
PYRAMID:Figure1:Socio-economicclassinBangladeshpyramid of Bangladesh
Source:ANGOC.2011. Women and Land Rights Regional Workshop. Dhaka.
MAP:Mining Concessions in Cambodia
Source:OpenDevelopmentCambodia. 2011. http://wwwopendevelopmentcambodia.net/kml-maps/concessions_for_mining.pdf
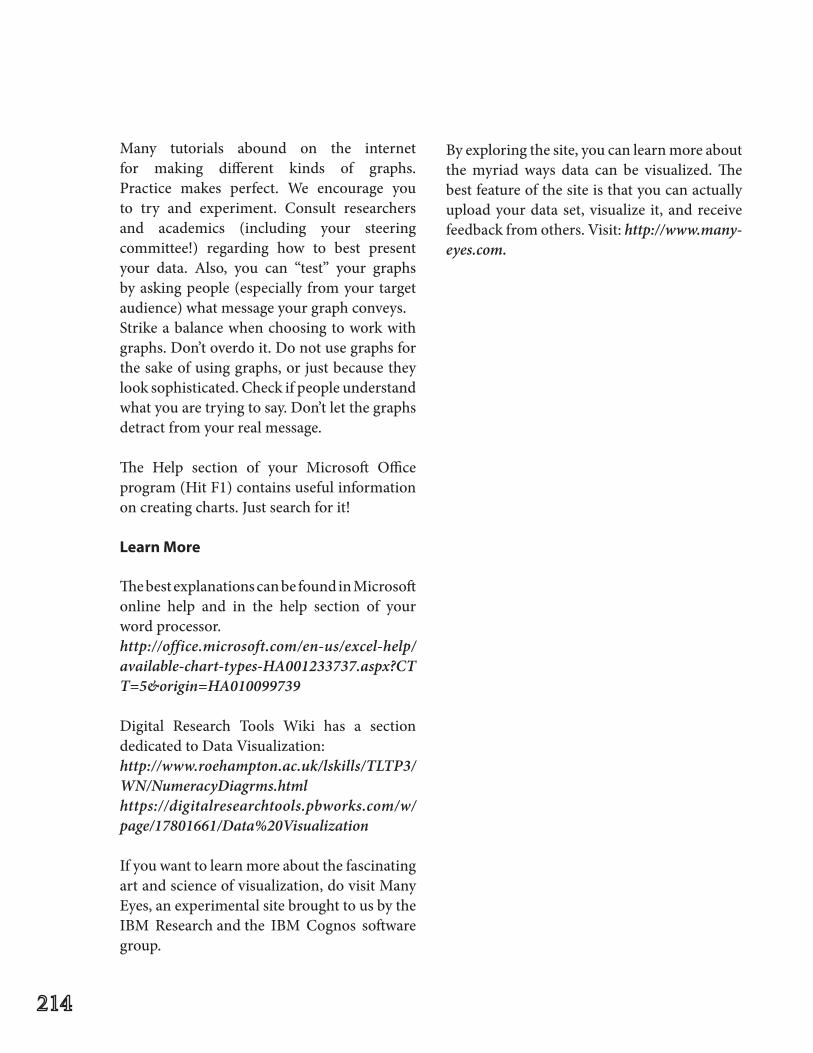
Many tutorials abound on the internet for making different kinds of graphs. Practice makes perfect. We encourage you to try and experiment. Consult researchers and academics (including your steering committee!) regarding how to best presentyour data. Also, you can “test” your graphs by asking people (especially from your target audience) what message your graph conveys. Strikeabalancewhenchoosingtoworkwithgraphs. Don’t overdo it. Do not use graphs for the sake of using graphs, or just because they look sophisticated. Check if people understand what you are trying to say. Don’t let the graphs detract from your real message.
The Help section of your Microsoft Office program (Hit F1) contains useful information oncreatingcharts.Justsearchforit!
Learn More
The best explanations can be found in Microsoft online help and in the help section of your word processor. http://office.microsoft.com/en-us/excel-help/available-chart-types-HA001233737.aspx?CTT=5&origin=HA010099739
Digital Research Tools Wiki has a section dedicated to Data Visualization: http://www.roehampton.ac.uk/lskills/TLTP3/WN/NumeracyDiagrms.htmlhttps://digitalresearchtools.pbworks.com/w/page/17801661/Data%20Visualization
If you want to learn more about the fascinating art and science of visualization, do visit Many Eyes, an experimental site brought to us by the IBM Research and the IBM Cognos software group.
By exploring the site, you can learn more about the myriad ways data can be visualized. The best feature of the site is that you can actually upload your data set, visualize it, and receive feedback from others. Visit: http://www.many-eyes.com.
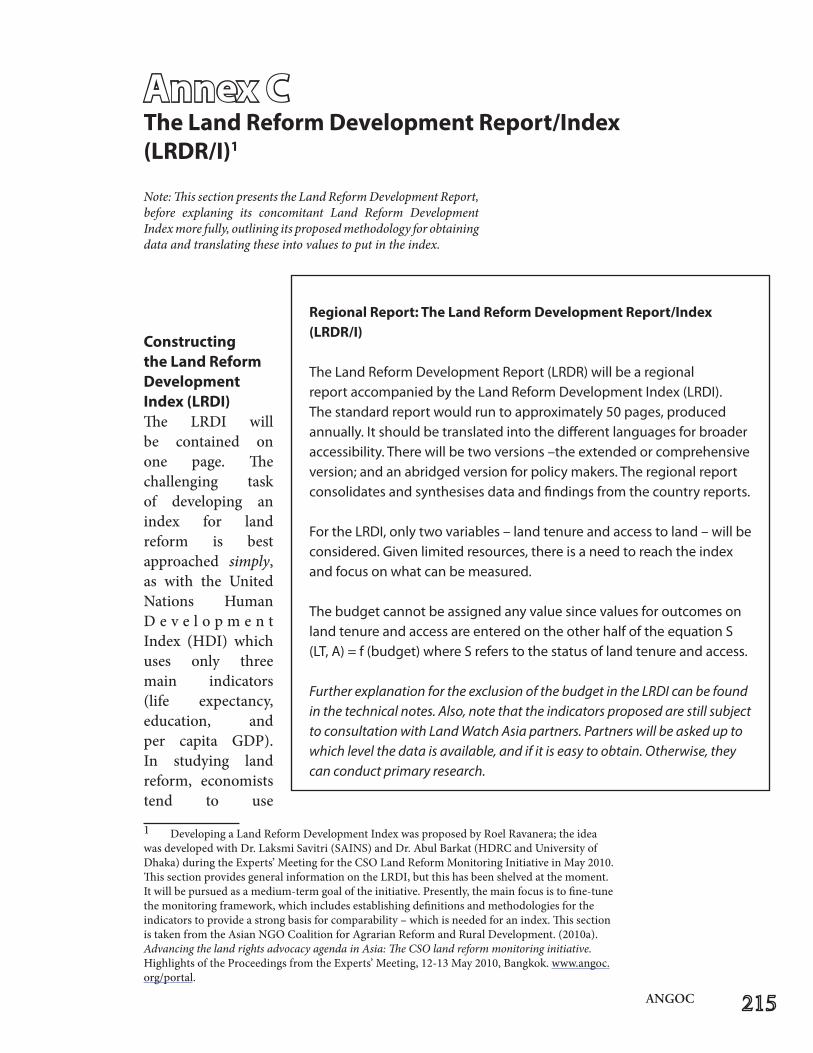
ANGOC
Annex CTheLandReformDevelopmentReport/Index(LRDR/I)1
1 Developing a Land Reform Development Index was proposed by Roel Ravanera; the idea wasdevelopedwithDr.LaksmiSavitri(SAINS)andDr.AbulBarkat(HDRCandUniversityofDhaka)duringtheExperts’MeetingfortheCSOLandReformMonitoringInitiativeinMay2010.This section provides general information on the LRDI, but this has been shelved at the moment. It will be pursued as a medium-term goal of the initiative. Presently, the main focus is to fine-tune the monitoring framework, which includes establishing definitions and methodologies for the indicators to provide a strong basis for comparability – which is needed for an index. This section is taken from the Asian NGO Coalition for Agrarian Reform and Rural Development. (2010a). Advancing the land rights advocacy agenda in Asia: The CSO land reform monitoring initiative. Highlights of the Proceedings from the Experts’ Meeting, 12-13 May 2010, Bangkok. www.angoc.org/portal.
Constructing theLandReformDevelopment Index(LRDI)The LRDI will be contained on one page. The challenging task of developing an index for land reform is best approached simply, as with the United Nations Human D e v e l o p m e n t Index (HDI) which uses only three main indicators (life expectancy, education, and per capita GDP). In studying land reform, economists tend to use
Note: This section presents the Land Reform Development Report, before explaning its concomitant Land Reform Development Index more fully, outlining its proposed methodology for obtaining data and translating these into values to put in the index.
RegionalReport:TheLandReformDevelopmentReport/Index(LRDR/I)
The Land Reform Development Report (LRDR) will be a regional report accompanied by the Land Reform Development Index (LRDI). The standard report would run to approximately 50 pages, produced annually. It should be translated into the different languages for broader accessibility.Therewillbetwoversions–theextendedorcomprehensiveversion; and an abridged version for policy makers. The regional report consolidates and synthesises data and findings from the country reports.
FortheLRDI,onlytwovariables–landtenureandaccesstoland–willbeconsidered. Given limited resources, there is a need to reach the index and focus on what can be measured.
The budget cannot be assigned any value since values for outcomes on landtenureandaccessareenteredontheotherhalfoftheequationS(LT,A)=f(budget)whereSreferstothestatusoflandtenureandaccess.
Further explanation for the exclusion of the budget in the LRDI can be found in the technical notes. Also, note that the indicators proposed are still subject to consultation with Land Watch Asia partners. Partners will be asked up to which level the data is available, and if it is easy to obtain. Otherwise, they can conduct primary research.
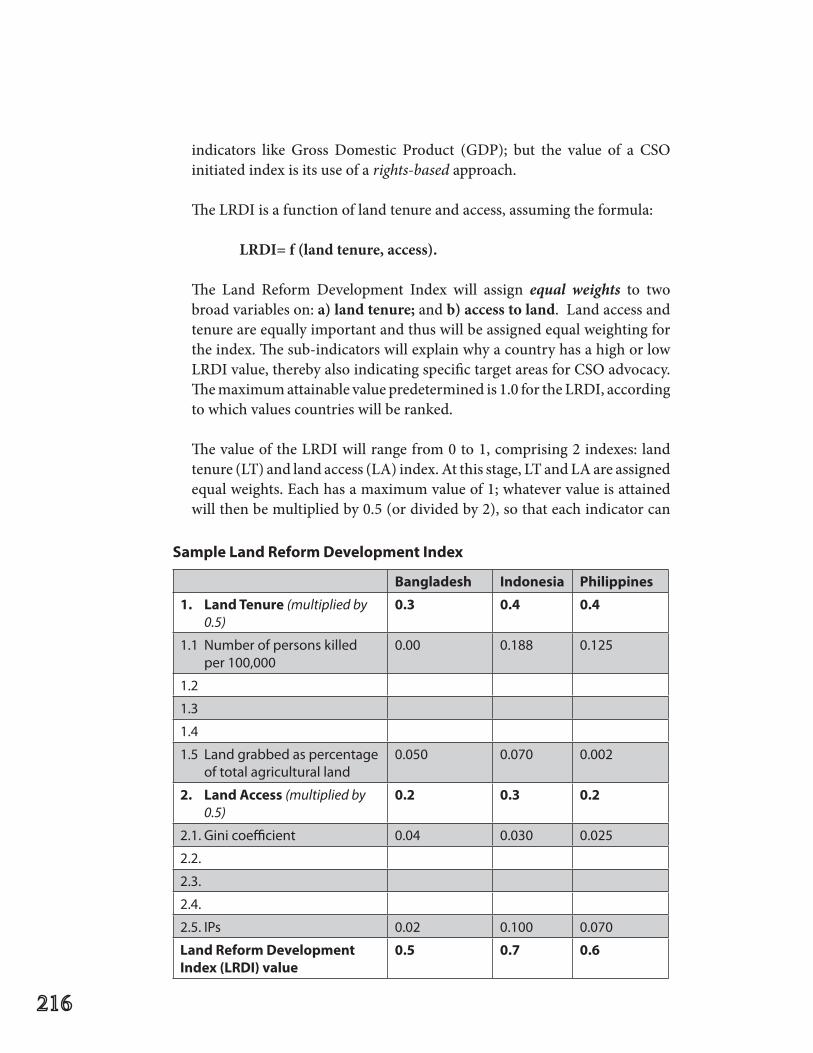
Bangladesh Indonesia Philippines
1. LandTenure(multiplied by 0.5)
0.3 0.4 0.4
1.1 Number of persons killed per 100,000
0.00 0.188 0.125
1.2
1.3
1.4
1.5 Land grabbed as percentage of total agricultural land
0.050 0.070 0.002
2. Land Access (multiplied by 0.5)
0.2 0.3 0.2
2.1. Gini coefficient 0.04 0.030 0.025
2.2.
2.3.
2.4.
2.5. IPs 0.02 0.100 0.070
LandReformDevelopmentIndex(LRDI)value
0.5 0.7 0.6
SampleLandReformDevelopmentIndex
indicators like Gross Domestic Product (GDP); but the value of a CSOinitiated index is its use of a rights-based approach.
The LRDI is a function of land tenure and access, assuming the formula:
LRDI=f(landtenure,access).
The Land Reform Development Index will assign equal weights to two broad variables on: a) land tenure; and b) access to land. Land access and tenure are equally important and thus will be assigned equal weighting for the index. The sub-indicators will explain why a country has a high or low LRDIvalue,therebyalsoindicatingspecifictargetareasforCSOadvocacy.The maximum attainable value predetermined is 1.0 for the LRDI, according to which values countries will be ranked.
The value of the LRDI will range from 0 to 1, comprising 2 indexes: land tenure (LT) and land access (LA) index. At this stage, LT and LA are assigned equal weights. Each has a maximum value of 1; whatever value is attained will then be multiplied by 0.5 (or divided by 2), so that each indicator can
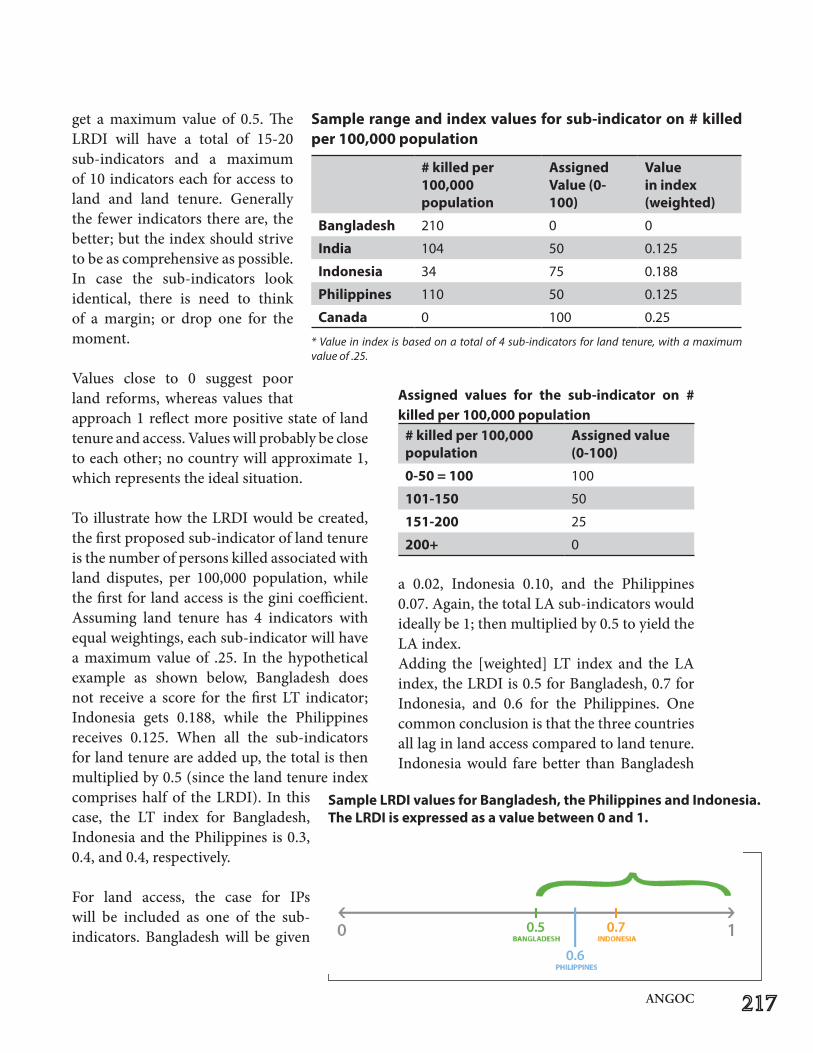
ANGOC
Sample range and index values for sub-indicator on # killed per100,000population
# killed per 100,000population
Assigned Value(0-100)
Value in index (weighted)
Bangladesh 210 0 0
India 104 50 0.125
Indonesia 34 75 0.188
Philippines 110 50 0.125
Canada 0 100 0.25
* Value in index is based on a total of 4 sub-indicators for land tenure, with a maximum value of .25.
Assigned values for the sub-indicator on # killedper100,000population#killedper100,000population
Assigned value (0-100)
0-50=100 100
101-150 50
151-200 25
200+ 0
get a maximum value of 0.5. The LRDI will have a total of 15-20 sub-indicators and a maximum of 10 indicators each for access to land and land tenure. Generally the fewer indicators there are, the better; but the index should strive to be as comprehensive as possible. In case the sub-indicators look identical, there is need to think of a margin; or drop one for the moment.
Values close to 0 suggest poor land reforms, whereas values that approach 1 reflect more positive state of land tenure and access. Values will probably be close to each other; no country will approximate 1, which represents the ideal situation. To illustrate how the LRDI would be created, the first proposed sub-indicator of land tenure is the number of persons killed associated with land disputes, per 100,000 population, while the first for land access is the gini coefficient. Assuming land tenure has 4 indicators with equal weightings, each sub-indicator will have a maximum value of .25. In the hypothetical example as shown below, Bangladesh does not receive a score for the first LT indicator; Indonesia gets 0.188, while the Philippines receives 0.125. When all the sub-indicators for land tenure are added up, the total is then multiplied by 0.5 (since the land tenure index comprises half of the LRDI). In this case, the LT index for Bangladesh, Indonesia and the Philippines is 0.3, 0.4, and 0.4, respectively.
For land access, the case for IPs will be included as one of the sub-indicators. Bangladesh will be given
a 0.02, Indonesia 0.10, and the Philippines 0.07. Again, the total LA sub-indicators would ideally be 1; then multiplied by 0.5 to yield the LA index. Adding the [weighted] LT index and the LA index, the LRDI is 0.5 for Bangladesh, 0.7 for Indonesia, and 0.6 for the Philippines. One common conclusion is that the three countries all lag in land access compared to land tenure. Indonesia would fare better than Bangladesh
SampleLRDIvaluesforBangladesh,thePhilippinesandIndonesia.TheLRDIisexpressedasavaluebetween0and1.
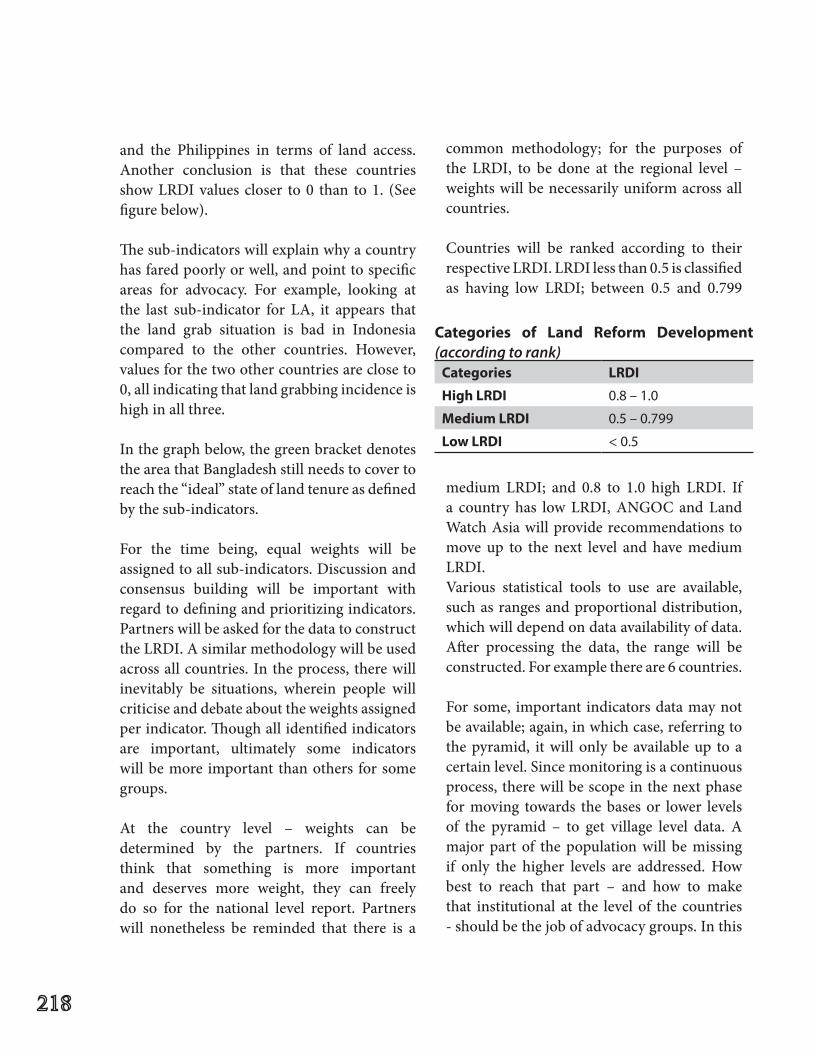
and the Philippines in terms of land access. Another conclusion is that these countries showLRDIvaluescloser to0 than to1. (Seefigure below).
The sub-indicators will explain why a country has fared poorly or well, and point to specific areas for advocacy. For example, looking at the last sub-indicator for LA, it appears that the land grab situation is bad in Indonesia compared to the other countries. However, values for the two other countries are close to 0, all indicating that land grabbing incidence is high in all three.
In the graph below, the green bracket denotes the area that Bangladesh still needs to cover to reach the “ideal” state of land tenure as defined by the sub-indicators.
For the time being, equal weights will be assigned to all sub-indicators. Discussion and consensus building will be important with regard to defining and prioritizing indicators. Partners will be asked for the data to construct the LRDI. A similar methodology will be used across all countries. In the process, there will inevitably be situations, wherein people will criticise and debate about the weights assigned per indicator. Though all identified indicators are important, ultimately some indicators will be more important than others for some groups.
At the country level – weights can be determined by the partners. If countries think that something is more important and deserves more weight, they can freely do so for the national level report. Partners will nonetheless be reminded that there is a
common methodology; for the purposes of the LRDI, to be done at the regional level – weights will be necessarily uniform across all countries.
Countries will be ranked according to their respective LRDI. LRDI less than 0.5 is classified as having low LRDI; between 0.5 and 0.799
medium LRDI; and 0.8 to 1.0 high LRDI. If a country has low LRDI, ANGOC and Land Watch Asia will provide recommendations to move up to the next level and have medium LRDI. Various statistical tools to use are available, such as ranges and proportional distribution, which will depend on data availability of data. After processing the data, the range will be constructed. For example there are 6 countries.
For some, important indicators data may not be available; again, in which case, referring to the pyramid, it will only be available up to a certainlevel.Sincemonitoringisacontinuousprocess, there will be scope in the next phase for moving towards the bases or lower levels of the pyramid – to get village level data. A major part of the population will be missing if only the higher levels are addressed. How best to reach that part – and how to make that institutional at the level of the countries - should be the job of advocacy groups. In this
Categories LRDI
HighLRDI 0.8–1.0
MediumLRDI 0.5–0.799
LowLRDI < 0.5
Categories of Land Reform Development(according to rank)
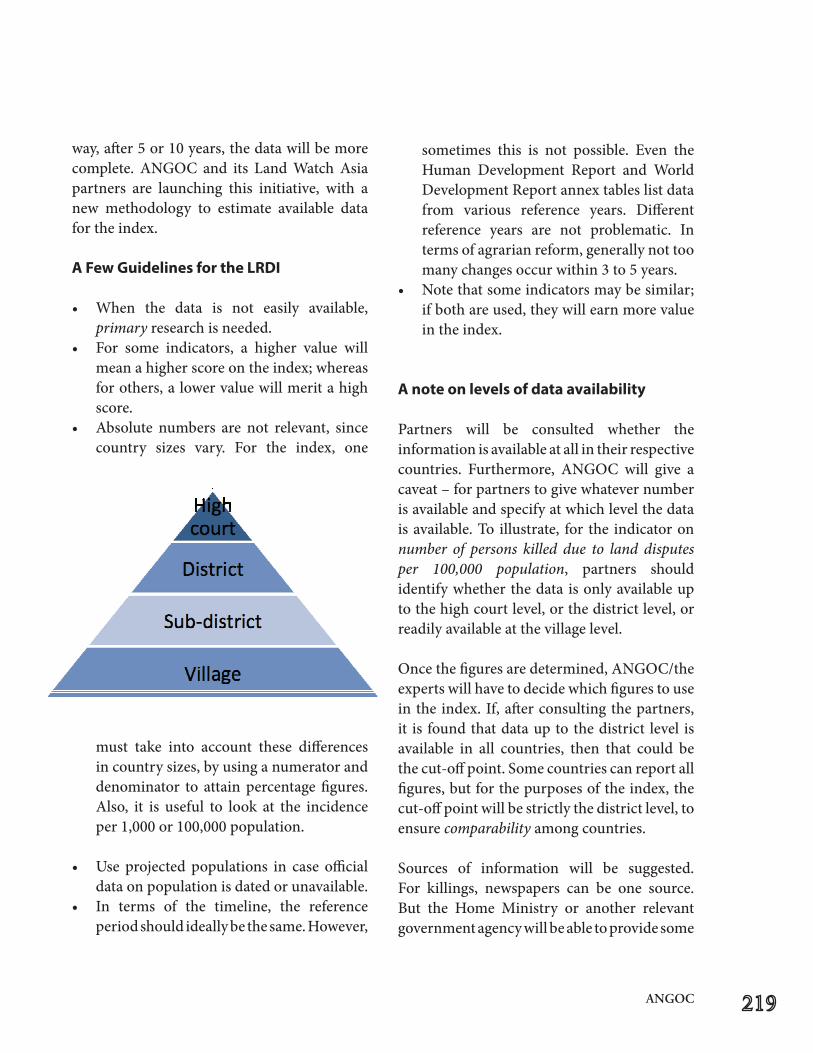
ANGOC
way, after 5 or 10 years, the data will be more complete. ANGOC and its Land Watch Asia partners are launching this initiative, with a new methodology to estimate available data for the index.
AFewGuidelinesfortheLRDI
• When the data is not easily available,primary research is needed.
• For some indicators, a higher value willmean a higher score on the index; whereas for others, a lower value will merit a high score.
• Absolute numbers are not relevant, sincecountry sizes vary. For the index, one
must take into account these differences in country sizes, by using a numerator and denominator to attain percentage figures. Also, it is useful to look at the incidence per 1,000 or 100,000 population.
• Use projected populations in case officialdata on population is dated or unavailable.
• In terms of the timeline, the referenceperiod should ideally be the same. However,
sometimes this is not possible. Even the Human Development Report and World Development Report annex tables list data from various reference years. Different reference years are not problematic. In terms of agrarian reform, generally not too many changes occur within 3 to 5 years.
• Notethatsomeindicatorsmaybesimilar;if both are used, they will earn more value in the index.
A note on levels of data availability
Partners will be consulted whether the information is available at all in their respective countries. Furthermore, ANGOC will give a caveat – for partners to give whatever number is available and specify at which level the data is available. To illustrate, for the indicator on number of persons killed due to land disputes per 100,000 population, partners should identify whether the data is only available up to the high court level, or the district level, or readily available at the village level.
Once the figures are determined, ANGOC/the experts will have to decide which figures to use in the index. If, after consulting the partners, it is found that data up to the district level is available in all countries, then that could be thecut-offpoint.Somecountriescanreportallfigures, but for the purposes of the index, the cut-off point will be strictly the district level, to ensure comparability among countries.
Sources of information will be suggested.For killings, newspapers can be one source. But the Home Ministry or another relevant government agency will be able to provide some
figures regarding the number of persons killed. More important than the number of persons killed per se are those killings specifically associated with land disputes. The figure of persons killed given by the Home Ministry may be understated. But there are heuristic methods about this. One case in point – asking 5 retired inspectors general of the police the probable percentage of reality. One IGP would say 20%, the other 25%, still the other 30%, and so on and so forth. One gets the average figure of killing, which is 25% of reality, multiplied by which will yield a close picture of reality. One should sit with knowledgeable people – done through partners – to understand what could be the percentage of killings associated with land dispute. For instance, 5-10% of that killing is associated with land dispute.
The other way at arriving at the figures is to look at what is being reported, by compiling newspaper sources. Groups should not only look at national dailies, but also local journals. One will get a different figure, which should be extrapolated and compared with the other set. The results will be very close – with a 10% margin of error, which is acceptable.
Endnote
Learning from the HDI
Technical notes (explaining how the figures were derived) should be annexed for the LRDI, as is done for the HDI. Comparing HDI and LRDI can add value to the initiative. There must be a high positive correlation for developing countries. If HDI is high, LRDI will also be high. The HDR is issued annually. As part of the strategy, Land Watch can perhaps share its LRDI with UNDP, or even organize a joint launch.
ANGOC
References
Anseeuw, W., L. Alden Wily, L. Cotula, and M. Taylor. (2011). Land rights and the rush for land: Findings of the global commercial pressures on land research project. Rome: International Land Coalition.
Asian NGO Coalition for Agrarian Reform and Rural Development. (2012). Land grab: Changing the Terrain of Land Tenure. Lok Niti: Journal of the Asian NGO Coalition. Volume 18/1 2012.
Asian NGO Coalition for Agrarian Reform and Rural Development.(2011).CSOLandReformMonitoringin Asia. Proceedings of the Regional Workshop. 16-17 September2010.Bangkok.www.angoc.org/portal
Asian NGO Coalition for Agrarian Reform and Rural Development. (2010a). Advancing the land rights advocacy agenda in Asia: The CSO land reform monitoring initiative. Highlights of the Proceedings from the Experts’ Meeting, 12-13 May 2010, Bangkok. www.angoc.org/portal
Asian NGO Coalition for Agrarian Reform and Rural Development. (2010b). Ideas in action for land rights advocacy. Quezon City: Author.
Asian NGO Coalition for Agrarian Reform and Rural Development. (2006). CSO/NGO engagement in poverty reduction strategies in Asia: A discussion of key issues and challenges. Manila: Author.
Asian NGO Coalition for Agrarian Reform and Rural Development. (1997). Sustainable agriculture in Asia. Manual on field documentation. Resource book series. Quezon City: Author.
Association of Voluntary Agencies for Rural Development (2012). Country land reforms monitoring report. Report submitted to ANGOC.
Barkat, A. (2011). Land reform monitoring report: Bangladesh. Report submitted to ALRD and ANGOC. Bending, Tim. (2010). Monitoring Secure Access to Land: Progress and Prospects. Land Monitoring Handbook. Rome: International Land Coalition.
CommitteeonEconomic,SocialandCulturalRights,general comment No. 7 (1997) on the right to adequate housing: forced evictions (E/1998/22,annex IV).
CommunitySelf-RelianceCentre.(2012).Land reform monitoring indicators, Nepal. Kathmandu: Author.
Extrapolation. 2012. In Merriam-Webster.com. Retrieved May 1, 2012, from http://www.merriam-webster.com/dictionary/extrapolation
Food and Agriculture Organization. (2005). Participatory Policy Development for Sustainable Agriculture and Rural Development: Guidelines for the Sustainable Agriculture and Rural Development – Farming Systems Evolution Project. Rome: Author.
Food and Agriculture Organization. (2003). Syrian agriculture at the crossroads. FAO Agricultural Policy and Economic Development Series Number 8: Rome: Author
Food and Agriculture Organization. (2002). Land tenure and rural development. Land tenure studies. Rome: Author.
Food and Agriculture Organization. (2001). Good Practice Guidelines for Agricultural Leasing Arrangements. Rome: Author.
Food and Agriculture Organization. About the Voluntary Guidelines on the Governance of Tenure.www.fao.org Herrera, A. & da Passano, M. (2006). Land tenure alternative conflict management. Rome: Land Tenure Service,RuralDevelopmentDivision,FoodandAgriculture Organization.
International Fund for Agricultural Development. (2008). Improving access to land and tenure security. Rome: Author.
International Fund for Agricultural Development. A Guide for Project M&E: Managing for Impact in Rural Development.
International Land Coalition. (2011). “Tirana Declaration”. www.landcoalition.org
International Land Coalition, International Fund for Agricultural Development, and Food and Agriculture Organization. (2004). Rural women’s access to land and property in selected countries: Progress towards achieving the aims of articles 14, 15 and 16 of the Convention on the Elimination of All Forms of Discrimination against Women. Rome: Authors. McKay, A. (2002, March). Defining and measuring inequality. Inequality briefing. Briefing Paper No. 1 (1 of 3). London: Overseas Development Institute.
NGO Forum on Cambodia. (2011). Statistical Analysis on Land Disputes in Cambodia, 2010. Phnom Penh: NGO Forum on Cambodia.
Philippine Partnership for the Development of Human Resources in Rural Areas. (2010). Systematizing Access to Land Monitoring in the Philippines. Monograph submitted to ANGOC.
SajoygyoInstitute&KonsorsiumPembaruanAgraria[Consortium for Agrarian Reform]. (2011). Land issue and policy monitoring initiative: Indonesia report. Report submitted to ANGOC.
SocietyforConservationandProtectionofEnvironment. (2011). CSO land monitoring in Pakistan. Report submitted to ANGOC.
STARKampuchea.(2011).Land monitoring report: Cambodia. Report submitted to ANGOC.
Wickeri, E., & Kalhan, A. Land Rights Issues in International Human Rights Law. Institute for Human Rights and Business. http://www.ihrb.org/pdf/Land_Rights_Issues_in_International_HRL.pdf.
World Bank, FAO and IFAD. 2008. Gender in Agriculture Sourcebook. Module 4: Gender Issues in Land Policy and Administration.


