Embed Size (px)
Citation preview

Environment and Natural Resources Research; Vol. 3, No. 2; 2013 ISSN 1927-0488 E-ISSN 1927-0496
Published by Canadian Center of Science and Education
87
Land Use and Land-Cover Change at “W” Biosphere Reserve and Its Surroundings Areas in Benin Republic (West Africa)
Laurent Gbenato Houessou1, Oscar Teka1, Ismaïla Toko Imorou1,2, Anne Mette Lykke3 & Brice Sinsin1 1 Laboratory of Applied Ecology, Faculty of Agronomic Sciences, University of Abomey-Calavi, Cotonou, Benin 2 Department of Geography, Faculty of Letter, Arts and Human Sciences, University of Abomey-Calavi, Cotonou, Benin 3 Department of Bioscience, Aarhus University, Vejlsøvej 25, DK-8600 Silkeborg, Denmark
Correspondence: Laurent Gbenato Houessou, Laboratory of Applied Ecology, Faculty of Agronomic Sciences, University of Abomey-Calavi, Cotonou, Benin. Tel: 229-9648-5593. E-mail: [email protected]
Received: January 28, 2013 Accepted: March 3, 2013 Online Published: March 10, 2013
doi:10.5539/enrr.v3n2p87 URL: http://dx.doi.org/10.5539/enrr.v3n2p87
Abstract
Biosphere Reserves stand as the worldwide strategy of biological conservation. However, the current global land use change involves extensive loss of vegetation cover around the reserves and increase their vulnerability and their ecological isolation. The overall objective of this study was to assess the trends of land covers change in- and outside the “W” Biosphere Reserve (WBR) in Benin as well as the driving forces of land cover change in order to provide tools for its sustainable management. For this purpose, two serial times of maps from Landsat images TM 1995 and ETM+ 2006 were used to assess the rates and trends of the different land cover units from 1995 to 2006. Socioeconomic surveys based on structured interviews were conducted with 240 households in 8 villages around the reserve. Land clearing, tree logging, settlement and grazing were frequently quoted by the households as main driver forces inducing land cover change around WBR. Probability transition matrices of land cover displayed high probabilities (>0.6) in the southern part of WBR and moderate probabilities (0.3 to 0.5) in the northern part of WBR for woodland and savanna vegetation to be changed into cropland outside the reserve showing the persistence of vegetation degradation around WBR in the coming years. Our study revealed the urgent necessity of the development of conservation action planning to stop the agricultural frontline progression toward the reserve.
Keywords: deforestation rate, land use and land cover change, probability transition matrices, temporal maps, W National Park
1. Introduction
In addition to biodiversity decline and climate change, land cover/land use change is considered as an important factor contributing to the current global change (Turner, 2002; Meyfroidt & Lambin, 2003; Verburg & Veldkamp, 2005; Lepers et al., 2005). Land cover results from a complex process and can be considered as the biophysical state of the earth’s surface and immediate sub-surface (Turner et al., 1995), while land use refers to the conversion or transformation of the land cover into the desired human purposes which are associated with that cover, e.g. cropping, conservation, or settlement (Meyer & Turner, 1994).
The issue of land-cover/land use change has taken place since human beings shifted from goods harvesting in wild into the production of its own goods to satisfy its daily requirements (Turner et al., 1990). Since then, natural vegetation was progressively converted into agriculture land for crop production, animal grazing and other land use types (Turner et al., 1990). Due to the rapid increasing of the population demography during the two last centuries and subsequent land requirement for farming and urbanization, important amount of forest was converted into anthropogenic area (Turner et al., 1990; Ouedraogo et al., 2010). The rhythm of degradation of primary ecosystems and declined of associated biodiversity was alarming during the two last centuries (Goudie, 2006). Recently, FAO (2010) estimated the worldwide forest cover lost for about 13 million hectares per year during the last decade 2000-2010 with a persistent high decreasing rate in sub-saharan Africa. Most primary ecosystems are thereof been fragmented and large habitats are partitioned into smaller (Fahrig, 2003).
Sequel to habitat lost and land cover conversion in degraded ecosystem, protected areas were established all over

www.ccsenet.org/enrr Environment and Natural Resources Research Vol. 3, No. 2; 2013
88
the world to serve as representative land of biodiversity preservation for current and future generation (Pimm et al., 2001; UNEP, 2003; IUCN, 2005). They were thought to be an effective strategy to prevent habitat destruction and ensure ecosystems protection within their borders (Bruner, Gullison, Rice, & da Fonseca, 2001; Clerici et al., 2007). However, due to lack of land, protected areas were reported to be more or less eroded by surrounding forest dwellers through agricultural use, cattle herding and human settlements (Defries, Hansen, Turner, Reid & Liu, 2007; Clerici et al., 2007; Flamenco-Sandovala, Ramos, & Masera, 2007). Wittemyer, Elsen, Bean, Burton and Brashares (2008) observed an accelerated human population growth in Africa and Latin America around protected areas and claimed that protected areas represent an attractive pole for human settlement by providing access to increasingly scarce ecosystem services (e.g., NTFPs, bushmeat) and jobs deriving from the protected areas management. The rapid increase in trends of the agricultural frontline from the communal to the borders of protected areas is a great concern since this increase protected areas vulnerability through their ecological isolation (DeFries, Hansen, Newton, & Hansen, 2005; Struhsaker, Struhsaker, & Siex, 2005).
In Benin, previous studies have assessed the land cover change and demonstrated its impact on natural habitats conversion into degraded habitats. For instance Oloukoi, Mama and Agbo (2006) showed in the central part of the country a land cover regression of about 59.4% from 1978 to 1998 and highlighted a high rate of savannah, galleries forest, woodland conversion into cropland. Similar trends were also observed in the region of Wari-Maro (Orekan, 2007). From the latest study which was focused on the period ranging from 1991 to 2000, the author concluded that the region is under high vegetation cover loss with an annual deforestation rate of 8%. However, no specific study has tackled so far the land cover/land use change around the biosphere reserve in Benin although this remain a great concern to sustainably design conservation strategies for protected area management (Clerici et al., 2007, Flamenco-Sandoval et al., 2007). Therefore, this study was carried out as a case study of land cover/land use change around a protected area at “W” Biosphere Reserve located in the uppermost northeast Benin. Since land use intensity differs around the reserve according to different cropping systems, two study sites with different land use intensity were selected to assess the land cover/land use change around the protected area. Specifically our study aims (i) to assess the perception of land use/land cover change by local residents around the reserve and (ii) to quantify land cover/land use change at the out-and inside of the reserve.
2. Method
2.1 Study Area
The study was conducted in Benin at the “W” National Park actually named “W” Biosphere Reserve since 2002 (WBR) (11º 26’-12º 26’ N; 2º17’- 3º 05’ E, Figure 1). It is part of the transboundary Biosphere Reserve over Benin, Niger and Burkina Faso. The WBR in Benin covers 563,280 ha representing 56% of the transboundary Biosphere’s total area. As most Biosphere Reserves, WBR core area i.e. the protected area is separate from the communal lands (agro-system) by a buffer zone of 5 km width around the protected area. The WBR belongs to the regional centre of sudanian endemism (White, 1983). Two zones were sampled for land use and land cover change analysis: the first zone in the northern part (1105.4 km²) and the second zone in the southern (850.9 km²).
The cropping system in the southern part is based on cash crop production (mainly cotton) while the northern part of the WBR is based on food crop (Table 1).

www.ccsen
Table 1. C
Charact
Loca
Rain
Temper
Climat
Actvegeta
peri
Vegeta
Soils t
Main egro
Cropsyst
Figure 1.
et.org/enrr
Characteristics
teristics
ation B
nfall
rature
te type
ive ation iod
ation W
types Tro
c
ethnic up
ping em
Map of the stu
En
of the sampled
Banikoara distr
180
Woodland, vario
opical ferruginocrystalline rock
brow
Mainly basedsorghum
udy area showlan
nvironment and N
d zones
Zone 1
rict (10º 94-11º
900-1100 m
18- 35 ºC
Sudanian
0 days (May to
ous type of savfallows
ous soil with ck, mineral and wn soils and cl
Bariba and P
d on cotton cropm, corn, yam,
Livestock rai
wing the clippend use and lan
Natural Resourc
89
º 68N & 1º99-
mm
C
n
October)
vannah, gallery
concretions andpoorly evolve
layed soils
Peulh
p and secondaand cassava.
ising
d areas in the nd cover (LUCC
ces Research
2º90E) K
y forest, sa
d on pure ed soil, c
ary on
M
northern and inC) analysis
Zo
Karimama distr& 2º 28
600-9
17 -
Sudano
150 days (June
Woodland, vavannah, galler
Ferruginouconcretions on
rock and c
Dendi, Peulh,Haoussa
Mainly based onand corn, y
Livestoc
Fishing reprimportan
n the southern
Vol. 3, No. 2;
ne 2
rict (11º 4-12º 48-3º 28E)
00 mm
39 ºC
-sahelian
e to September
various type of ry forest, fallo
us type with pure crystallin
clayed soils
Gourmantchéa, Djerma
n sorghum, milam, cassava,
ck raising.
resent also an nt activity
of the reserve
2013
4N
r)
fows
ne
é,
llet,
e for

www.ccsenet.org/enrr Environment and Natural Resources Research Vol. 3, No. 2; 2013
90
2.2 Data Collection
Two types of data were collected:
2.2.1 Socio-Economic Data
A survey based on structured interviews was conducted in the southern part of the reserve in the villages of Sampéto, Kandérou, Nipouni and Founougo (district of Banikoara) and in the northern part of the reserve in the villages of Karimama, Kofonou, Karigui and Monsey (district of Karimama). The interviews were realized from March to June 2008 and from February to April 2009. A total of 240 household were randomly selected in the targeted villages i.e. 30 per villages. Apart from socio-demographic characteristics of the household (age of the household chief, household size, household active population size, household chief education level, ethnic group, gender, etc.), interviewees were asked the main following questions:
- Are you aware of land cover change in your village during the last ten years (1= yes, 0= no)?
- Do you clear woody vegetation during the last five year for agriculture purpose (1=yes, 0=no)?
- Do the soil fertility decrease or increase during the last five years (3= increase; 2= stable; 1= decrease)?
- What are the driving forces of land cover change?
2.2.2 Cartographic Data: Land Use/Land Cover Map Acquisition
The land use/land cover maps for the WBR and its surrounding areas were acquired at the “Centre National de Télédetection (CENATEL)”. For this purpose, two serial times of maps i.e. land use/land cover maps from Landsat images TM 1995 and ETM+ 2006 were used. In ArcGIS 9.3 software, we clipped the acquired maps at the southern part of the reserve and at the northern part of the reserve. The clipped areas were selected in order to have part of the reserve in the clipped section and one other part outside the reserve (Figure 1). In the clipped maps we grouped the cover types: settlement, farm and fallow as farmland in order to avoid misinterpretation of data analysis since these three covers type appear sometimes indistinct.
2.3 Data Analysis
2.3.1 Interview Data Analysis
We estimated the level of awareness of land use/land cover change as the percentage of household giving the answers yes out of the total number of surveyed households. Frequency citation of perceived driving forces which induce land cover change was estimated as:
FC = 100 X N/L with confidence interval (α =0.05) = 1.96 X 100 [FC(1-FC)/L]1/2 (1)
where N is the number of households who quoted a given factor as inducing land cover change and L the total number of household. Chi-sq test was used to test whether there was association between household perception of factors inducing land cover change and age category of the household chief, main activities, ethnic group, level of education, and geographic location.
We used a logit instead of the probit model to assess the factors which significantly influenced the decision of household to clear land during the last five years since the logit model is more interpretable (Long, 1997; Hurlin, 2003). The model is defined as follow:
(2)
(3)
Where the function F follows a standard logistic distribution and is expressed as:
(4)
Finally
Where β0 is the constant and β1, β2, … βk are the coefficients of the independent variables X1i, X2i, …, Xki, and (pi/1-pi) is the odds. The model predicts the logit of the dependent variable (decision to clear land) based on the independent variables. The logit is the napierian logarithm of the ratio of the probability pi (realization of the event) and 1-pi (non-realization of the event).

www.ccsenet.org/enrr Environment and Natural Resources Research Vol. 3, No. 2; 2013
91
To implement the model, the investigated independent variables were: household population size (i.e. total number of persons in the household), household active population size (i.e. total number of persons with age ranging from 15 to 55 years old), age of the household chief, ethnic group, level of education, household main activities and, perceived soil fertility level. The following codification was used (Table 2).
Table 2. Description of the independent variables
Variables Codes Nature Explanation and modalities
Ethnic group ETHNIE Nominal1= Bariba; 2= Gourmantché; 3= Dendi; 4 = Haoussa,
5=Djerma; 6=Others
Household population size HOUPOP Continue Numerical Value
Household active population size
ACTPOP Continue Numerical Value
Age of the Household chief AGE Ordinal 1= <30; 2 = 30-60; 3 = >60
Level of education EDUCAT Ordinal 1 = Illiterate; 2 = Primary school; 3 = Secondary school
Household main activities ACTIVIT Nominal 1= Agriculture; 2 = Breeding; 3 = Fishing
Perceived soil fertility FERTIL Ordinal 3= Increase; 2= Stable; 1 = Decrease
The significance of the coefficient of the logistic regression was appreciated based on the chi-sq likelihood and Wald statistics. The global logit-model significance was assessed with 2-log likelihood and the level of fitness.
2.3.2 Analysis and Quantification of Land Cover Change
The deforestation rate (r) was assessed inside and outside of the reserve both at the northern part and the southern part of this reserve based on formula proposed by Puyravaud (2003) as follow:
(5)
Where 'r' is the deforestation rate (% of vegetation cover lost/year); A1 and A2 represent the undegraded lands cover classes respectively for the periods 1995 and 2006. The undegraded land covers classes are represented here by Woodland, Gallery forest, Tree and Shrub savannah and t2-t1 is the interval in years during which change in land cover is being assessed.
3.2.3 Land Cover Conversion Matrix
Based on the information of land-cover classes from the two observed periods, cross-tabular comparison using the algorithm Intersect available in ArcGIS 9.3 were used to assess the differences in extent of each class and the conversion that took place between the two periods. Transition matrices were elaborated for the periods 1995 to 2006 with respect to the subset areas. We determined the transition matrix separately for inside and outside the protected area both in the northern part and southern part. Each matrix represents either the persistence area of each land cover category during the period 1995 to 2006, or the area which was converted to another land-cover category during the same period.
In addition to transition matrix, we determined the transition probability matrices. Values in the cells of the transition probability matrices represented the probabilities of conversion or persistence of each land use into another one. Probabilities values were computed following Oloukoui et al. (2006). The probability of one cell belonging to class Ci during the initial year (1995) to be converted into class Cj during the final year (2006) was calculated as:
Pi-j = ACi-Cj/Ai(1995) (6)
where ACi-Cj was the area of the land cover class Ci to Cj from the year 1995 to 2006 and Ai(1995) was the total area of the land cover class Ci in the year 1995.

www.ccsen
3. Results
3.1 Local C
More thanduring the93.4%]) ansouthern aland cover(chi-sq =0the househ=0.013). O
3.2 Comm
Overall, 82(95% CI: [settlement significantbetween ththat land cchange in northern p
Fig
3.3 Factor
The logit NagelkerkOmnibus; agriculture(Table 3). of higher pwas positipopulationnorthern pmaturity (household primary cr
et.org/enrr
Communities’ A
n 80.4% (95% e last ten yearnd 73.3% (95%and the northerr change awar.259; P =0.879hold chief sign
Old chief opine
unities’ Percep
2.5% (95% CI[18.9-29.7%])
and grazing t difference wahe southern anclearing (Fc =3the southern part of the reser
gure 2. Factors
rs Determining
model estimatke =0.66) with
Chi-sq =41.28e land was signThe coefficienprobability of ive. This wouln size increasepart of the resei.e. able to ge lands with theropland hold b
En
Awareness Lev
CI: [75.37-85r preceding th% CI: [65.4-81rn part of the reness with re9), and ethnic gnificantly affeced for land cov
ption of Drivin
I: [77.6-87.3%of the househby livestock
as observed bend northern pa36.3%) and trepart of the reserve.
s perceived by
g Land Clearin
tion was globaa good predic
8; P <0.001). Tnificantly influnt was negativland clearing. ld indicate thaed. As revealederve, when theet married, abem or have to by the househ
nvironment and N
vel of Land Co
.42%]) of the he surveyed pe1.2%]) of the hreserve. Regar
espect to the mgroup (chi-sq=cted its opinio
ver change whi
ng Forces Indu
%]); 36.3% (95%old consideredas factors in
etween househart of the reseree logging (Fc erve while land
respondents a
ng by Househo
ally significanction (R² =63.3The householdsuenced by the
ve with the soilRegarding, th
at decision of d by our invee agriculturallyout 20 years find new field
hold for the ne
Natural Resourc
92
overs Change
respondents weriod i.e. fromhousehold opinrdless the regimain activities=6.726; P =0.1on about the laile young chief
ucing Land Co
% CI: [30.1-42d respectively nducing land hold frequencyrve (chi-sq =54
=18.1%) wered clearing (48
s driving force
olds around WB
nt (2log-likelih30%). The coes’ decision to chousehold act
l fertility sugghe household sland clearing stigation, tradiy active childrold), the chief
ds to be clearedew independen
ces Research
were aware of m 1998-2008. ned for changeion of the reses (chi-sq=2.99451) of the houand cover chanf were not ofte
ver Change
2.3%]); 27.4%land clearing fcover change
y citation of fac4.26; P <0.00)e mostly quote.4%) and lives
e of land cover
BR
hood =53.27; Rfficients were clear vegetatiotive population
gesting that decsize and main aincreases wheitionally in theren (mainly bofs of the housd for them. Thnt farmers (ma
conversion of About 87.5%
e in land cover erve, no differe4; P =0.084), sehold chief. Hnge awarenessen aware of lan
% (95% CI: [21for crop produe in their villctors inducing ). It was notewed as factors instock grazing (
r change aroun
R² of Cox & also globally
on i.e. to conven size and perccline in soil feactive populaten the househoe southern paroys) in the household have tohis results into:ature children
Vol. 3, No. 2;
f land cover ch% (95% CI: [8
respectively ience were founlevel of educ
However the as (chi-sq =8.63nd cover chang
1.8-33.0%]); 24uction, tree logage (Figure 2land cover ch
worthy to undenducing land c(Fc =26.6%) in
nd the WBR
Snell =0.50; Rsignificant (Te
ert forest coverceived soil fer
ertility is condution, the coeffiold size and art as well as inusehold reach o share part o: (i) partition oof the househ
2013
hange 1.6 -
in the nd in ation ge of 38; P ge.
4.3% ging, 2). A hange erline cover n the
R² of est of r into rtility ucive icient active n the their
of the of the hold)

www.ccsenet.org/enrr Environment and Natural Resources Research Vol. 3, No. 2; 2013
93
and/or (ii) acquisition of new land for clearing by the new independent farmers.
Table 3. Factors determining land clearing decision by the household
Variables Coefficient Wald χ² test P-value
Household population size 0.012 0.005 0.943
Household active population size 1.16 6.92 0.009
Household chief Age 0.009 0.065 0.799
Ethnic group -0.149 0.026 0.872
Level of education 0.094 0.005 0.945
Household main activities 0.505 0.2 0.655
Soil fertility -0.325 5.263 0.017
Constant 4.638 7.311 0.007
Estimated statistics:
R² = 63.3%
Omnibus Test of significant coefficients: Chi-sq = 41.282; p < 0.001
Test of Hosmer & Lemeshow: Chi-sq = 23.655; dF = 7; p = 0.001;
-2Log-likelihood = 53.277; R² of Cox & Snell = 0.50; R² of Nagelkerke = 0.66.
Global percentage of prediction = 63.3%.
3.4 Land Covers Change Dynamics in and outside the WBR from 1995 to 2006
Land cover maps (Figure 3) showed that in 1995 tree and shrub savannah (28.20%) followed by degraded savannah (27.31%) were the most dominant land cover types in the subset region at the unprotected area in the south of the reserve (Table 4). In 2006, in the same area, farmland became the most dominant land cover type with 87.10% of the area at the expense of degraded savannah and tree and shrub savannah. In the inner of the reserve in 1995 (south), land covers maps displayed a high proportion of tree and shrub savannah (54.15%) and of woodland (30.35%). Till the year 2006, in that part of the reserve, tree and shrub savannah (56.40%) and woodland (33.94%) remained the most dominant land cover types.
As far as the northern part of the reserve was concerned, during the year 1995, farmland displayed high proportion (44.59%) in the subset region of the unprotected area. In 2006, the situation was almost similar with high proportion of farmland (63.96%) comparatively to the others land covers types. In the inner of the reserve at the northern part, tree and shrub savannah was the most dominant land cover types with 96.75% in proportion, the situation did not sensibly change in 2006 where tree and shrub savannah still remain the most abundant land cover type (97.03%).
Table 4. Proportion of each land cover in percentage in 1995 and 2006
Land cover types Unprotected area (South)
Protected area (South)
Unprotected area (North)
Protected area (North)
1995 2006 1995 2006 1995 2006 1995 2006
Farmland 22.52 87.10 1.65 5.30 44.59 63.96 0.02 0.11
Woodland 21.65 0.12 30.35 33.94 3.01 1.01 2.24 2.46
Gallery forest 0.32 0.33 3.15 4.16 4.66 5.46 0.27 0.30
Degraded Savannah 27.31 3.40 10.70 0.21 11.88 17.05 0.72 0.1
Tree+Shrub savannah 28.20 9.05 54.15 56.40 32.96 11.07 96.75 97.03
Opened grassland - - - - 2.8 1.45 - -

www.ccsenet.org/enrr Environment and Natural Resources Research Vol. 3, No. 2; 2013
94
Figure 3. Land use/Land cover covers maps change from 1995 to 2006 in the south and north of WBR
Legend
a- South of WBR in 1995, b- South of WBR in 2006.
c- North of WBR in 1995, d- North of WBR in 2006.

www.ccsenet.org/enrr Environment and Natural Resources Research Vol. 3, No. 2; 2013
95
Figure 4. Land covers dynamics from 1995 to 2006 at WBR and surrounding areas
Legend: F =Farmland; WL =Woodland; GF =Gallery Forest; TSS =Tree and Shrub Savannah, OG =Opened Grassland; DeS =Degraded Savannah
a = Land cover change in the South of WBR in the unprotected area from 1995 to 2006.
b = Land cover change in the South of WBR in the protected area from 1995 to 2006.
c = Land cover change in the North of WBR in the unprotected area from 1995 to 2006.
d = Land cover change in the North of WBR in the protected area from 1995 to 2006.
Figure 4 displayed the land cover types dynamic from 1995 to 2006. We observed that in the south of the WBR and in the unprotected area, gallery forest was almost stable (0.01%) farmland increased for 64.6% while woodland, degraded savannah and tree/shrub savannah decreased in area respectively for -21.5%; -23.9%; and -19.1% showing the conversion of land cover from woody vegetation to anthropogenic vegetation (Figure 4a). Meanwhile, in the north of WBR in the unprotected area, the same situation (i.e. conversion of forest cover to anthropogenic vegetation) was observed (Figure 4c). However, the rate of conversion into anthropogenic vegetation appeared as lower in the north. Farmland increased for about 64.6% in the south while in the north the farmland increased for 19.4%.
The land cover dynamic in the protected area both in the southern part and northern part of the reserve showed an increase in the extension of tree/shrub savannah, woodland, gallery forest and farmland. Woodland, gallery forest, tree/shrub savannah and farmland increased respectively for 3.6%, 1.0%, 2.2% and 3.6% in the southern of the reserve and for 0.2%, 0.03%, 0.3% and 0.1% in the northern of the reserve (Figure 4b and Figure 4d).
3.5 Deforestation Rate
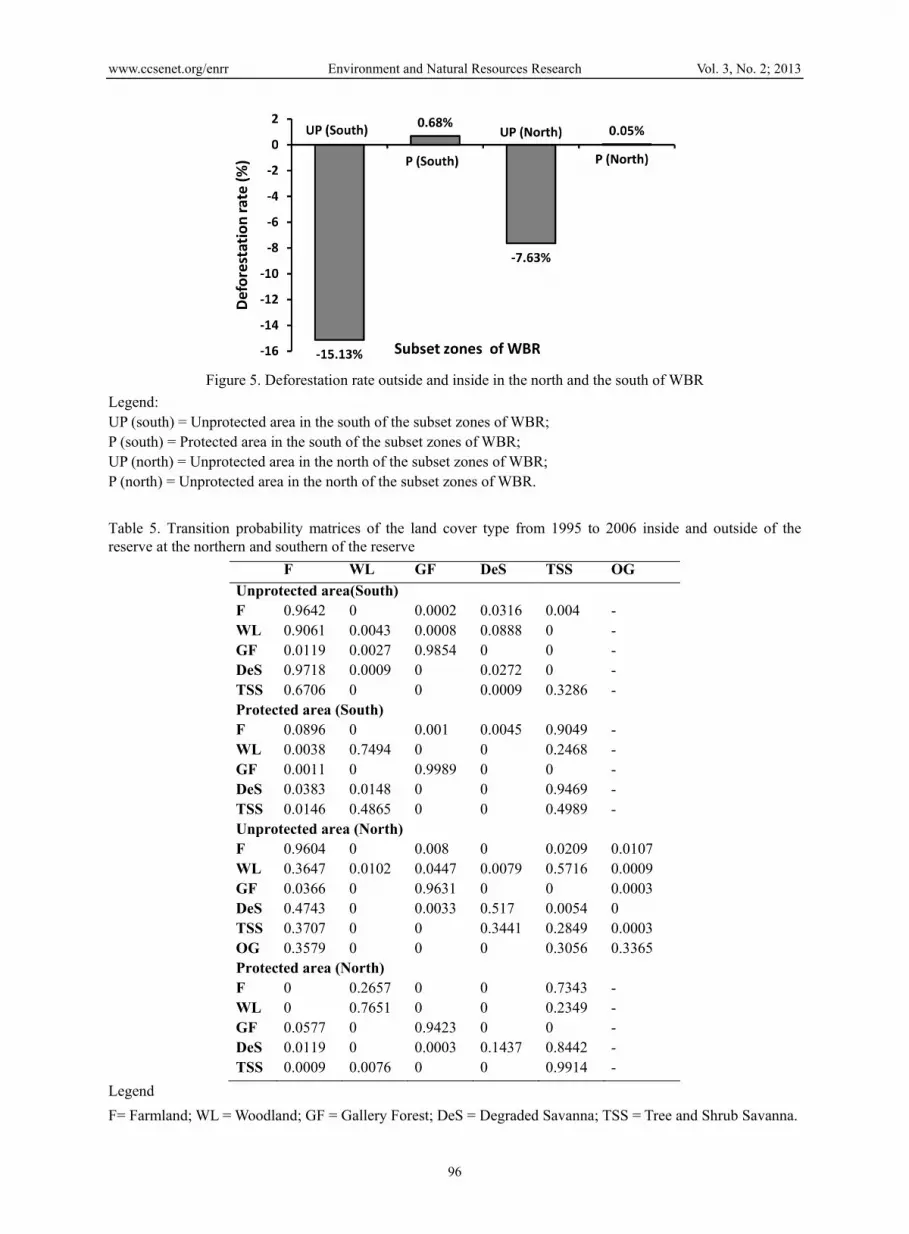
The deforestation rate was higher (about 15.13%) outside the reserve at the unprotected area in the south part of the reserve comparatively to the northern part of the reserve where the deforestation rate was about 7.63% (Figure 5). In contrast, it is noteworthy to remark a slight increase in vegetation cover inside the reserve in the south as well as in the north part.
www.ccsenet.org/enrr Environment and Natural Resources Research Vol. 3, No. 2; 2013
96
Figure 5. Deforestation rate outside and inside in the north and the south of WBR
Legend: UP (south) = Unprotected area in the south of the subset zones of WBR; P (south) = Protected area in the south of the subset zones of WBR; UP (north) = Unprotected area in the north of the subset zones of WBR; P (north) = Unprotected area in the north of the subset zones of WBR.
Table 5. Transition probability matrices of the land cover type from 1995 to 2006 inside and outside of the reserve at the northern and southern of the reserve
F WL GF DeS TSS OG
Unprotected area(South)F 0.9642 0 0.0002 0.0316 0.004 -WL 0.9061 0.0043 0.0008 0.0888 0 -GF 0.0119 0.0027 0.9854 0 0 -DeS 0.9718 0.0009 0 0.0272 0 -TSS 0.6706 0 0 0.0009 0.3286 -Protected area (South)F 0.0896 0 0.001 0.0045 0.9049 -WL 0.0038 0.7494 0 0 0.2468 -GF 0.0011 0 0.9989 0 0 -DeS 0.0383 0.0148 0 0 0.9469 -TSS 0.0146 0.4865 0 0 0.4989 -Unprotected area (North)F 0.9604 0 0.008 0 0.0209 0.0107 WL 0.3647 0.0102 0.0447 0.0079 0.5716 0.0009 GF 0.0366 0 0.9631 0 0 0.0003 DeS 0.4743 0 0.0033 0.517 0.0054 0TSS 0.3707 0 0 0.3441 0.2849 0.0003 OG 0.3579 0 0 0 0.3056 0.3365 Protected area (North)F 0 0.2657 0 0 0.7343 -WL 0 0.7651 0 0 0.2349 -GF 0.0577 0 0.9423 0 0 -DeS 0.0119 0 0.0003 0.1437 0.8442 -TSS 0.0009 0.0076 0 0 0.9914 -
Legend
F= Farmland; WL = Woodland; GF = Gallery Forest; DeS = Degraded Savanna; TSS = Tree and Shrub Savanna.

www.ccsenet.org/enrr Environment and Natural Resources Research Vol. 3, No. 2; 2013
97
4. Discussion
4.1 Community Perception of Land Cover/Land Use Change
The study reported that the land cover change was largely perceived by local population around the reserve. This highlights the evidence of land conversion and land use change around the protected areas as showed previously by DeFries et al. (2007). Among socio-demographic factors which could likely influence population perception of land cover change, only respondent age has been found as significant. In fact, the perception of land use/land cover change required long time experience which elder persons dispose. This might explain the significant difference obtained with respect to the age which appears as significant factor for land use/land cover change (LUCC) perception (Lykke, Fog & Madsen, 1999).
4.2 Land Use/Land Cover Change Dynamic
Regarding the perceived driving forces causing land cover change, 80% of the respondents opined land clearing for crop production. From our results it can be concluded that agriculture is the main driving force for land cover change in the region. This result is consistent with previous studies (Lambin, Geist, & Lepers, 2003; Wood, Tappan, & Hadj, 2004) which concluded that agriculture remains the principal factor inducing land cover change in sub-Saharan Africa. However the perceived driving forces could vary from a region to another. For instance, Arouna, Toko, Djogbénou and Sinsin (2011) found that charcoal production represented the main activity leading to land cover change in the centre of Benin while Lykke (2000) reported frequent intensive fires and declining rainfall as factors inducing vegetation change in a semi-arid region of Sine Saloum in Senegal.
The household active population size affected significantly the household decision to clear new land for agriculture. Indeed, the internal growth of the household population involves more persons to be supported by the household; so that more revenue and food production are required. As response to this requirement, farmers often decide to clear new field in order to overcome their household charge increasing. This is in accordance with the findings of Orekan (2007) and Ouedraogo et al. (2010) who concluded in their study at a strong correlation between the population growth and land degradation.
In addition to the active population size, soil fertility depletion affected significantly the household decision for land clearing in the region. This could be explained by the traditional cropping system consisting of slash and burn cultivation. After land clearing, farmers exploited the arable land for a period and when the soil fertility is decreasing, they moved to another place to clear. However, due to the rapid population growth and the increasing demand of land for agriculture purpose, most farmers complained nowadays that they have to stay for a long period in the same land since they cannot go over the limit of the reserve. While considering the growth of the household and the limit imposed by the reserve, it can be deduced in a near future that the problem of cropping land will be a great issue in the region as many farmers yet complained for land scarcity for clearing.
With respect to land cover dynamics, our findings showed the conversion of land cover from forest cover to anthropogenic vegetation made of farmland (fallow, field and agglomeration) in the communal land around the reserve both in the north and south. However, the land cover degradation during the study period appeared more much important in the south than in the north. As it was estimated the deforestation rate in the south was nearly twice of that observed in the north (15.13% in the south vs 7.63% in the north). This could be explained by the type of crops produced in the two regions. In the south part of the reserve, cash crop (mainly cotton) is the most cultivated while, food crops (sorghum and maize) are the most practiced in the north. Cotton crop represents the top cash crops in Benin country and the government encourages it production by providing to the farmers technical support such as fertilizers, pesticides and tractors to improve their capacity. This national agricultural policy results in the increasing of cropland in the expense of forest cover as it was in the south of the reserve. Therefore incentive policies for improving crop production may result in the forest cover degradation as previously showed by Gray (2005) and Ouedraogo et al. (2010). The driving forces of land cover and land use change can be globally mapped in two groups (Figure 6). Direct factors such as socio-economic activities, population growth and natural ecological factors related to the ecosystem and the indirect factors related to the policy decision at local, national and regional level. Some policies decisions such as economic incentives price of a given crop could influence indirectly the pressure on land cover. This is the specific case of cotton crop in communal lands around the “W” biosphere reserve in Benin. Moreover, institutional factors, such as land tenure and legislation, can contribute in land use/land cover change (Reid et al., 2000). Hence, we concluded that factors inducing land cover change are as well of at local, national and international level.

www.ccsen
4.3 Land U
As showefarmland wconversiondynamic rbiodiversitdiversity tmuch of cconverted
4.4 Accura
In savannatime serieset al., 201and relevainterpretatstudy, in calthough aincrease inpixels duriyear couldhigh deforturn, highClerici et control thimprovem
5. Conclus
This studyResults shreserve theto stabilizeand soil fetheir field the land cindicator
et.org/enrr
Use and Land
d by the tranwere higher on of the originremain similarty outside the to improve theconcern in the into farmland
acy of Cover M
ah vegetation, s imagery data0). Indeed, soant field data ion. In the sam
contrast to ouranthropogenic nside the resering satellite im
d help to fix threstation rate alights the impal. (2007). Pa
he progressionent of soil fert
sion
y provides knowhowed a rapid e deforestatione the agricultuertility improvin the intentio
clearing for agfor the “W”
En
Figu
Cover Transiti
sition matrix, outside the resnal vegetation r as it was obreserve and ineir livelihood south than inwere higher in
Maps
the satellite ima during the same pixels are on the period
me time, farmr expectation,
pressure is hrve. A possibl
mage processinhis issue. Unfoand rapid land cportant pressurark managers sn of agricultutility based on
wledge of landdegradation o
n rate is lower. ural frontline pvement could hon to increase tgriculture purp
biosphere res
nvironment and N
ure 6. Driving f
ion Matrices
the probabiliserve. Thus, fuoutside the re
bserved betwencrease anthro
(Vodouhê, Con the north sinn the south tha
mages data proame or consecu
sometimes md where the sa
mland seemed tgallery forests
high outside thle argumentating and analysiortunetaley, succover conversire and the ecshould therefo
ure frontline tsustainable ag
d cover/land usof land cover o
This highlighprogression tohelp increasingtheir productiopose. It appearserve conserv
Natural Resourc
98
forces to land c
ities of the diuture scenario
eserve into anten 1995 and
opogenic pressuoulibaly, Greence the probaban in the north.
ocessing and inutive year to a
misinterpreted datellite imagesto slightly incrs were almost his reserve. Inion must be lis. Time series ch data are lacion into anthro
cological isolaore implement towards the rgroforestry pra
se change in aoutside the reshts the necessitoward the parkg crop producton. As shown irs then that povation. Tempo
ces Research
cover change
fferent land cos of land covthropogenic ve2006. This siures on the re
ene, & Sinsin,bilities of the .
nterpretation iaccurately estadue to the abses have been trease inside thstable from 1
n the same timinked to the msatellite imag
cking in our coopogenic vegettion of the reconservation
reserve. This ctises.
nd around the serve during oty to define besk. Practices sutivity so that thin this study acopulation growral maps ana
cover units to ver change wilegetation if thetuation may iserve since hu, 2009). The sdifferent land
s often limitedablish land covence of time staken to well he reserve for 1995 to 2006 ome, farmland misinterpretatioges data analysontext. Nonethtation around t
eserve as demstrategies outmight be pos
“W” biospherur study periost managemen
uch as agricultuhe farmers doctive populatiowth could be valysis allowed
Vol. 3, No. 2;
be convertedll result in a re land use chanvolve the lo
uman being relsituation woulcover unit’s t
d by the absenver maps (Rueseries imagerycontrol each that period. Inoutside the resseemed to sligon of the diffsis during the heless, data shothe reserve. Th
monstrated earltside the reservssible through
re reserve in Bod while withinnt practices in oural intensificn’t need to ex
on growth resuviewed as pre
d detecting ch
2013
d into rapid anges ss of ly on ld be to be
ce of lland
y data pixel
n this serve ghtly
ferent same owed his in ly by ve to h the
enin. n the order ation
xpand ults in ssure
hange

www.ccsenet.org/enrr Environment and Natural Resources Research Vol. 3, No. 2; 2013
99
occurring in land cover during the period 1995 and 2006. However, future scenarios based on annualized transition matrices appear as more precise for understanding LUCC change dynamics, and will enable to assess the land cover change in long period. Therefore further studies based on the simulation of land cover change in and around the reserve are required.
Acknowledgments
This research was funded by the SUN project (Sustainable Use of Natural vegetation in West Africa) (EU FP6 INCO-dev 031685). We are grateful to Belarmain Fandohan for comments and corrections provided on the early version on this manuscript. We thank Oloukoï Joseph for sharing ideas with us during the course of this manuscript writing.
References
Arouna, O., Toko, I., Djogbénou, C. P., & Sinsin, B. (2011). Comparative analysis of local populations’ perceptions of socioconomic determinants of vegetation degradation in sudano-guinean area in Benin (West Africa). International Journal of Biodiversity and Conservation, 3, 327-337.
Bruner, A. G., Gullison, R. E., Rice, R. E., & da Fonseca, G. A. B. (2001). Effectiveness of Parks in Protecting Tropical Biodiversity. Science, 291, 125-128. http://dx.doi.org/10.1126/science.291.5501.125
Clerici, N., Bodini, A., Eva, H., Gregoire, J. M., Dulieu, D., & Paolini, C. (2007). Increased isolation of two Biosphere Reserves and surrounding protected areas (WAP ecological complex, West Africa). Journal for Nature Conservation, 15, 26-40. http://dx.doi.org/10.1016/j.jnc.2006.08.003
DeFries, R., Hansen, A., Newton, A. C., & Hansen, M. C. (2005). Increasing isolation of protected areas in tropical forests over the past twenty years. Ecological Application, 15, 19-26. http://dx.doi.org/10.1890/03-5258.
Defries, R., Hansen, A., Turner, B. L., Reid, R., & Liu, J. (2007). Land use change around protected areas: management to balance human needs and ecological function. Ecological Application, 17, 1031-1038. http://dx.doi.org/10.1890/05-1111.
Fahrig, L. (2003). Effects of habitat fragmentation on biodiversity. Annual Review of Ecology, Evolution, and Systematics, 34, 487-515. http://dx.doi.org/10.1146/annurev.ecolsys.34.011802.132419
FAO. (2010). Global Forest Resources Assessment 2010: Final Report. FAO FORESTRY PAPER 163. Rome.
Flamenco-Sandovala, A., Ramos, M. M., & Masera, O. R. (2007). Assessing implications of land-use and land-cover change dynamics for conservation of a highly diverse tropical rain forest. Biological Conservation, 138, 131-145. http://dx.doi.org/10.1016/j.biocon.2007.04.022.
Goudie, S. A. (2006). The human impact on the natural environment: 6th edition. Blackwell Publishing, USA.
Gray, L. C. (2005). What kind of intensification? Agricultural practice, soil fertility and socioeconomic differentiation in rural Burkina Faso. The Geographical Journal, 171, 70-82. http://dx.doi.org/10.1111/j.1475-4959.2005.00150.x
Hurlin, C. (2003). Econométrie des Variables Qualitatives Polycopié de Cours. Chap. 1. Retrieved from http://frederik.ducrozet.free.fr/econometrics/qualitatives/Qualitatif_Chapitre1.pdf
IUCN. (2005). Benefits beyond boundaries. Proceedings of the Vth IUCN world parks congress. The World Conservation Union, Durban.
Lambin, E. F., Geist, H. J., & Lepers, E. (2003). Dynamics of land-use and land-cover change in tropical regions. Annual Review of Environment and Resources, 28, 205-241. http://dx.doi.org/10.1146/annurev.energy.28.050302.105459
Lepers, E., Lambin, E. F., Janetos, A. C., Defries, R., Achard, F., Ramankutty, N., & Scholes, R. J. (2005). A Synthesis of Information on Rapid Land-cover Change for the Period 1981-2000. BioScience, 55, 115-124. http://dx.doi.org/10.1641/0006-3568(2005)055[0115:ASOIOR]2.0.CO;2
Long, J. S. (1997). Regression models for categorical and limited variable dependent variables. Advances quantitative techniques in the social sciences, Vol. 7. SAGE Publications, Inc. London-NewDelhi.
Lykke, A. M. (2000). Local perceptions of vegetation change and priorities for conservation of woodysavanna vegetation in Senegal. Journal of Environmental Management, 59, 107-120. http://dx.doi.org/10.1006/jema.2000.0336
Lykke, A. M., Fog, B., & Madsen, J. E. (1999). Woody vegetation changes in the Sahel of Burkina Faso assessed

www.ccsenet.org/enrr Environment and Natural Resources Research Vol. 3, No. 2; 2013
100
by means of local knowledge, aerial photos, and botanical investigations. Danish Journal of Geography, Special Issue 2, 57-68.
Meyer, W. B., & Turner II, B. L. (1994). Change in Land use and Land cover: Global perspective Driving force. Cambrige University Press.
Meyfroidt, P., & Lambin, E. F. (2003). Global Forest Transition: Prospects for an End to Deforestation. Annual Review of Environment and Resources, 28, 205-241. http://dx.doi.org/10.1146/annurev-environ-090710-143732
Oloukoi, J., Mama, V. J., & Agbo, F. B. (2006). Modélisation de la dynamique de l’occupation des terres dans le département des collines au Bénin. Télédétection, 6, 305-323.
Orekan, V. O. A. (2007). Implementation of the local land-use and land-cover change model CLUE-s for Central Benin by using socio-economic and remote sensing data. PhD Dissertation. University of Bonn.
Ouedraogo, I., Tigabu, M., Savadogo, P., Compaore, H., Oden, P. C., & Ouadba, J. M. (2010). Land cover change and its relation with population dynamics in Burkina faso, West Africa. Land Degradation & Development, 21, 453-462. http://dx.doi.org/10.1002/ldr.981
Pimm, S. L., Ayres, M., Balmford, A., Branch, G., Brandon, K., Brooks, … Wilcove, D. (2001). Can we defy Nature’s end? Science, 233, 2207-2208. http://dx.doi.org/10.1126/science.1061626
Puyravaud, J. P. (2003). Standardizing the calculation of the annual of deforestation. Forest Ecology and Management, 177, 593-596. http://dx.doi.org/10.1016/S0378-1127(02)00335-3.
Reid, R. S., Kruska, R. L., Muthui, N., Taye, A., Wotton, S., Wilson, C. J., & Mulatu, W. (2000). Land-use and land-cover dynamics in response to changes in climatic, biological and socio-political forces: The case of southwestern Ethiopia. Landscape Ecology, 15, 339-355. http://dx.doi.org/10.1023/A:1008177712995
Ruelland, D., Levavasseur, F., & Tribotté, A. (2010). Patterns and dynamics of land-cover changes since the 1960s over three experimental areas in Mali. International Journal of Applied Earth Observation and Geoinformation, 12S, S11-S17. http://dx.doi.org/10.1016/j.jag.2009.10.006
Struhsaker, T. T., Struhsaker, P. J., & Siex, K. S. (2005). Conserving Africa’s rain forests: Problems in protected areas and possible solutions. Biological Conservation, 123, 45-54. http://dx.doi.org/10.1016/j.biocon.2004.10.007.
Turner II, B. L. (2002). Toward integrated land-change science: Advances in 1.5 decades of sustained international research on land-use and land-cover change. In W. Steffen, J. Jäger, D. J. Carson & C. Bradhsaw, (Eds.), Challenges of a Changing Earth (pp. 21-26). Berlin: Springer. http://dx.doi.org/10.1007/978-3-642-19016-2_3
Turner II, B. L., Clark, W. C., Kates, R. W., Richards, J. F., Mathews, J. T., & Meyer, W. B. (1990). The Earth As Transformed by Human Action: Global and Regional Changes in the Biosphere Over the Past 300 Years. UK: Cambridge University Press.
Turner II, B. L., Skole, D., Sanderson, S., Fischer, G., Fresco, L., & Leemans, R. (1995). Land-Use and Land-Cover Change; Science/Research Plan. IGBP Report no. 35; HDP Report No. 7.
UNEP. (2003). World database on protected areas. IUCN-WCPA/UNEP-WCMC, Washington DC. Available at http://www.unep-wcmc.org/wdpa/(Assessed on June 2012).
Verburg, P. H., & Veldkamp, A. (2005). Introduction to the Special Issue on Spatial modeling to explore land use dynamics. International Journal of Geographical Information Science, 19, 99-102. http://dx.doi.org/10.1080/13658810410001713362
Vodouhê, F. G., Coulibaly, O., Greene, C., & Sinsin, B. (2009). Estimating the Local Value of Non-Timber Forest Products to Pendjari Biosphere Reserve Dwellers in Benin. Economic Botany, 63, 397-412. http://dx.doi.org/10.1007/s12231-009-9102-7
White, F. (1983). Vegetation of Africa: a descriptive memoir to accompany the UNESCO AETFAT UNSO vegetation map of Africa. UNESCO, Paris.
Wittemyer, G., Elsen, P., Bean, W. T., Burton, A. C. O., & Brashares, J. S. (2008). Accelerated Human Population Growth at Protected Area Edges. Science, 321, 123-126. http://dx.doi.org/10.1126/science.1158900
Wood, E. C., Tappan, G. G., & Hadj, A. (2004). Understanding the drivers of agricultural land use change in
www.ccsenet.org/enrr Environment and Natural Resources Research Vol. 3, No. 2; 2013
101
south-central Senegal. Journal of Arid Environments, 59, 565-582. http://dx.doi.org/10.1016/j.jaridenv.2004.03.022.
Appendix 1. Land cover unit matrix of transition from 1995 to 2006 inside and outside the reserve at the northern and southern part of the reserve
F WL GF DeS TSS OG Area 1995
Unprotected area(South)
F 10353.98 0 2.48 339.42 42.53 - 10738.41
WL 9353.52 43.97 8.2 917.12 0 - 10322.82
GF 1.79 0.41 148.08 0 0 - 150.28
DeS 12652.82 12.12 0 354.63 0 - 13019.58
TSS 9015.18 0 0 11.53 4416.95 - 13443.67
Area 2006 41377.29 56.5 158.76 1622.7 4459.48 47674.73
Protected area (South)
F 177.84 0 1.9 8.98 1795.7 - 1984.41
WL 43.08 8509.91 0 0 2802.33 - 11355.32
GF 1.28 0 1176.74 0 0 - 1178.02
DeS 100.97 39.14 0.12 0 2498.26 - 2638.49
TSS 294.92 9856.53 0 0 10108.23 - 20259.68
Area 2006 618.09 18405.58 1178.76 8.98 17204.52 37415.93
Unprotected area (North)
F 23875.53 0 198.1 0 520.64 265.26 24859.53
WL 196.49 5.51 24.11 4.25 308.02 0.46 538.84
GF 106.54 0 2804.4 0 0 0.8 2911.74
DeS 3006.74 0 21.07 3277.34 34.44 0 6339.59
TSS 6381.32 0 0 5923.48 4904.07 5.22 17214.09
OG 536.37 0 0 0 458.01 504.28 1498.66
Area 2006 34102.99 5.51 3047.68 9205.07 6225.18 776.02 53362.45
Protected area (North)
F 0 3.78 0 0 10.45 - 14.24
WL 0 978.12 0 0 300.24 - 1278.35
GF 8.84 0 144.26 0 0 - 153.09
DeS 4.88 0 0.11 59.12 347.34 - 411.46
TSS 51.6 422.39 0 0 54861.27 - 55335.27
Area 2006 65.32 1404.29 144.37 59.12 55519.3 57192.4
Legend: F=Farmland; WL =Woodland; GF =Gallery Forest; DeS =Degraded Savannah; TSS =Tree and Shrub Savannah.


![Taxonomic study of Odonata [Insecta] in Kolkata and surroundings, West Bengal, India](https://img.pdfslide.net/doc/110x75/631b015b80cc3e944005a0ee/taxonomic-study-of-odonata-insecta-in-kolkata-and-surroundings-west-bengal-india.jpg)


