Embed Size (px)
Citation preview
U.S. International Trade CommissionPublication 4378 February 2013
Washington, DC 20436
Certain Large Residential Washers from Korea and Mexico
Investigation Nos. 701-TA-488 and 731-TA-1199-1200 (Final)
U.S. International Trade Commission
COMMISSIONERS
Irving A. Williamson, Chairman Daniel R. Pearson Shara L. Aranoff Dean A. Pinkert
David S. Johanson Meredith M. Broadbent
Robert B. Koopman
Staff assigned
Address all communications to Secretary to the Commission
United States International Trade Commission Washington, DC 20436
Director, Office of Operations
Edward Petronzio, Investigator Mihir Torsekar, Industry Analyst
John Benedetto, Economist Yasnanhia Cabral, Research Analyst
Justin Jee, Accountant Steven Hudgens, Statistician Karl von Schriltz, Attorney
James McClure, Supervisory Investigator Special assistance from
Zachary Russo, Investigations Intern
U.S. International Trade CommissionWashington, DC 20436
www.usitc.gov
Publication 4378 February 2013
Certain Large Residential Washers from Korea and Mexico
Investigation Nos. 701-TA-488 and 731-TA-1199-1200 (Final)

i
CONTENTS Page Determinations .................................................................................................................................... 1 Views of the Commission .................................................................................................................... 3 Part I: Introduction .......................................................................................................................... I-1
Background ...................................................................................................................................... I-1 Statutory criteria and organization of report .................................................................................... I-1
Statutory criteria ......................................................................................................................... I-1 Organization of the report .......................................................................................................... I-2
Market summary .............................................................................................................................. I-2 Summary data .................................................................................................................................. I-3 Previous investigations .................................................................................................................... I-4 Nature and extent of subsidies and sales at LTFV ........................................................................... I-4 The product ...................................................................................................................................... I-6
Commerce’s scope ...................................................................................................................... I-6 Tariff treatment ........................................................................................................................... I-7
The product ...................................................................................................................................... I-7 Physical characteristics and uses ................................................................................................ I-7 Manufacturing processes ............................................................................................................ I-11 Product features .......................................................................................................................... I-12
Domestic like product issues ........................................................................................................... I-16 Part II: Conditions of competition in the U.S. market .................................................................. II-1
U.S. market characteristics .............................................................................................................. II-1 Channels of distribution ................................................................................................................... II-2 Geographic markets ......................................................................................................................... II-3 Supply and demand considerations .................................................................................................. II-3
U.S. supply ................................................................................................................................. II-3 U.S. demand ............................................................................................................................... II-6
Substitutability issues ...................................................................................................................... II-12 Lead times .................................................................................................................................. II-13
Comparison of U.S. produced and imported LRWs ................................................................... II-17 Elasticity estimates .......................................................................................................................... II-21
Part III: U.S. producers’ production, shipments, and employment ............................................ III-1
U.S. producers ................................................................................................................................. III-1 U.S. capacity, production, and capacity utilization ......................................................................... III-2 U.S. producers’ U.S. shipments and exports ................................................................................... III-3
Front-load and top-load LRWs ................................................................................................... III-3 U.S. producers’ imports ................................................................................................................... III-6 U.S. producers’ inventories ............................................................................................................. III-6 U.S. employment, wages, and productivity ..................................................................................... III-6
ii
CONTENTS Page Part IV: U.S. imports, apparent consumption, and market shares ............................................. IV-1
U.S. importers .................................................................................................................................. IV-1 U.S. imports ..................................................................................................................................... IV-1 Negligibility ..................................................................................................................................... IV-4 Cumulation considerations .............................................................................................................. IV-4 Apparent U.S. consumption and U.S. market shares ....................................................................... IV-5 Ratio of imports to U.S. production ................................................................................................. IV-6
Part V: Pricing and related information ........................................................................................ V-1
Factors affecting prices .................................................................................................................... V-1 Raw material costs ...................................................................................................................... V-1 U.S. inland transportation costs .................................................................................................. V-3
Pricing practices ............................................................................................................................... V-3 Pricing methods .......................................................................................................................... V-3 Price data ......................................................................................................................................... V-18 Price comparisons ....................................................................................................................... V-44 Additional Pricing Information ........................................................................................................ V-46 Lost sales and lost revenues ............................................................................................................. V-47
Part VI: Financial experience and condition of U.S. producers ................................................... VI-1
Background ...................................................................................................................................... VI-1 Operations on large residential washers .......................................................................................... VI-1 Capital expenditures and research and development expenses ........................................................ VI-12 Assets and return on investment ...................................................................................................... VI-13 Capital and investment .................................................................................................................... VI-14
Part VII: Threat considerations and information on nonsubject countries ................................ VII-1
The industry in the Korea ................................................................................................................ VII-2 The industry in the Mexico .............................................................................................................. VII-5 U.S. inventories of imported merchandise ....................................................................................... VII-8 U.S. importers’ current orders ........................................................................................................ VII-8 Antidumping investigations in third-country markets ..................................................................... VII-8 Global market .................................................................................................................................. VII-8 Information on nonsubject sources .................................................................................................. VII-11
Appendixes A. Federal Register notices ............................................................................................................... A-1 B. List of Hearing Witness ................................................................................................................ B-1 C. Summary data ............................................................................................................................... C-1 D. U.S. producers’, U.S. importers’, and U.S. purchasers’ comments regarding the comparability of certain washers .................................................................................................. D-1 E. Summaries of marketing studies ................................................................................................... E-1 F. Selected firms’ discount data for 2009 and 2010 .......................................................................... F-1 G. Additional pricing data .................................................................................................................. G-1 Note.—Information that would reveal confidential operations of individual concerns many not be published and therefore have been deleted. Such deletions are indicated by asterisks.
1
UNITED STATES INTERNATIONAL TRADE COMMISSION Investigation Nos. 701-TA-488 and 731-TA-1199-1200 (Final) LARGE RESIDENTIAL WASHERS FROM KOREA AND MEXICO DETERMINATIONS
On the basis of the record1 developed in the subject investigations, the United States International Trade Commission (Commission) determines, pursuant to sections 705(b) and 735(b) of the Tariff Act of 1930 (19 U.S.C. ' ' 1671d(b) and 1673d(b)) (the Act), that an industry in the United States is materially injured by reason of imports from Korea of large residential washers that the U.S. Department of Commerce (Commerce) has determined are subsidized by the Government of Korea and sold in the United States at less than fair value (LTFV). The Commission further determines that an industry in the United States is materially injured by reason of imports from Mexico of large residential washers that the Commerce has determined are sold in the United States at LTFV. The products subject to these investigations are provided for in subheading 8450.20.00 of the Harmonized Tariff Schedule of the United States, and imported under statistical reporting number 8450.20.0090. Products subject to these investigations may also be imported under HTS subheadings 8450.11.00, 8450.90.20 or 8450.90.60.
BACKGROUND
The Commission instituted these investigations effective December 30, 2011, following receipt of a petition filed with the Commission and Commerce by Whirlpool Corporation, Benton Harbor, MI. The final phase of the investigations was scheduled by the Commission following notification of a preliminary determination by Commerce that imports of large residential washers from Korea were subsidized within the meaning of section 703(b) of the Act (19 U.S.C. ' 1671b(b)) and that imports of large residential washers from Korea and Mexico were sold at LTFV within the meaning of 733(b) of the Act (19 U.S.C. ' 1673b(b)). Notice of the scheduling of the final phase of the Commission=s investigations and of a public hearing to be held in connection therewith was given by posting copies of the notice in the Office of the Secretary, U.S. International Trade Commission, Washington, DC, and by publishing the notice in the Federal Register on August 24, 2012 (77 FR 51569). The hearing was held in Washington, DC, on December 11, 2012, and all persons who requested the opportunity were permitted to appear in person or by counsel.
1 The record is defined in sec. 207.2(f) of the Commission=s Rules of Practice and Procedure (19 CFR ' 207.2(f)).

VIEWS OF THE COMMISSION
Based on the record in the final phase of these investigations, we find that an industry in theUnited States is materially injured by reason of imports of large residential washers (“LRWs”) fromKorea found to have been subsidized by the Government of Korea and sold in the United States at lessthan fair value (“LTFV”) and imports of LRWs from Mexico found to have been sold in the United Statesat LTFV.
I. BACKGROUND
The petitions in these investigations were filed on December 30, 2011 by Whirlpool Corporation(“Whirlpool”), which accounts for the vast majority of domestic production of LRWs.1 General ElectricCompany (“GE”), a domestic producer and importer of subject merchandise, filed posthearing commentsin support of the petitions. Respondents that participated in the hearing and filed briefs in these finalinvestigations include LG Electronics U.S.A., Inc. and LG Electronics, Inc., respectively an importer andproducer of subject merchandise from Korea (collectively, “LG”); Samsung Electronics America, Inc. andSamsung Electronics Co., Ltd., respectively an importer and producer of subject merchandise fromKorea; and Samsung Electronics Mexico, S.A. de C.V., a producer of subject merchandise from Mexico(collectively, “Samsung”); and Electrolux Home Products, Inc., an importer of subject merchandise fromMexico and, until 2011, a domestic producer, and Electrolux Home Products Corp., N.V., a producer ofsubject merchandise from Mexico (collectively, “Electrolux”). Home Depot, Inc., a major purchaser ofdomestically produced LRWs and subject merchandise, also participated in the hearing and filed briefsopposing imposition of duties.2
The Commission received U.S. producers’ questionnaire responses from six U.S. producersaccounting for virtually all U.S. production of LRWs during the period of investigation.3 It receivedimporters’ questionnaire responses from nine firms accounting for virtually all subject imports fromKorea and Mexico.4 It received foreign producers’ responses from three Korean producers believed toaccount for all or virtually all Korean exports of LRWs to the United States.5 It also received foreignproducers’ questionnaire responses from three Mexican producers believed to account for all or virtuallyall Mexican exports of LRWs to the United States.6
1 Confidential Staff Report (“CR”)/Public Staff Report (“PR”) at III-1. 2 In addition, AVB/Brandsource, MEGA Group USA (“MEGA”), Nationwide Marketing Group (“Nationwide”),and NATM Buying Corporation (“NATM”), which are non-party “buyers’ groups,” submitted written statementscontaining factual information. Smaller, regional retailers often purchase LRWs through buyers’ groups. CR at II-5;PR at II-3. 3 CR/PR at Table III-1. A seventh domestic producer, Fisher & Paykel, produced only out-of-scope top-loadresidential washers with capacity of less than 3.7 cubic feet until the end of 2009, when it closed its U.S. plant andmoved production to Thailand. CR/PR at III-1 n.1. Other domestic producers of out-of-scope residential washersincluded Alliance, Electrolux, GE, and Whirlpool. See id. 4 CR/PR at IV-1. 5 CR/PR at VII-2. 6 CR at VII-11; PR at VII-5.
3
II. DOMESTIC LIKE PRODUCT
A. In General
In determining whether an industry in the United States is materially injured or threatened withmaterial injury by reason of imports of subject merchandise, the Commission first defines the “domesticlike product” and the “industry.”7 Section 771(4)(A) of the Tariff Act of 1930, as amended (“the TariffAct”), defines the relevant domestic industry as the “producers as a whole of a domestic like product, orthose producers whose collective output of a domestic like product constitutes a major proportion of thetotal domestic production of the product.”8 In turn, the Tariff Act defines “domestic like product” as “aproduct which is like, or in the absence of like, most similar in characteristics and uses with, the articlesubject to an investigation.”9
The decision regarding the appropriate domestic like product in an investigation is a factualdetermination, and the Commission has applied the statutory standard of “like” or “most similar incharacteristics and uses” on a case-by-case basis.10 No single factor is dispositive, and the Commissionmay consider other factors it deems relevant based on the facts of a particular investigation.11 TheCommission looks for clear dividing lines among possible like products and disregards minor variations.12 Although the Commission must accept Commerce’s determination as to the scope of the importedmerchandise that is subsidized or sold at less than fair value,13 the Commission determines what domesticproduct is like the imported articles Commerce has identified.14
7 19 U.S.C. § 1677(4)(A). 8 19 U.S.C. § 1677(4)(A). 9 19 U.S.C. § 1677(10). 10 See, e.g., Cleo Inc. v. United States, 501 F.3d 1291, 1299 (Fed. Cir. 2007); NEC Corp. v. Department ofCommerce, 36 F. Supp. 2d 380, 383 (Ct. Int’l Trade 1998); Nippon Steel Corp. v. United States, 19 CIT 450, 455(1995); Torrington Co. v. United States, 747 F. Supp. 744, 749 n.3 (Ct. Int’l Trade 1990), aff’d, 938 F.2d 1278 (Fed.Cir. 1991) (“every like product determination ‘must be made on the particular record at issue’ and the ‘unique factsof each case’”). The Commission generally considers a number of factors, including the following: (1) physicalcharacteristics and uses; (2) interchangeability; (3) channels of distribution; (4) customer and producer perceptionsof the products; (5) common manufacturing facilities, production processes, and production employees; and, whereappropriate, (6) price. See Nippon, 19 CIT at 455 n.4; Timken Co. v. United States, 913 F. Supp. 580, 584 (Ct. Int’lTrade 1996). 11 See, e.g., S. Rep. No. 96-249 at 90-91 (1979). 12 Nippon, 19 CIT at 455; Torrington, 747 F. Supp. at 748-49; see also S. Rep. No. 96-249 at 90-91 (1979)(Congress has indicated that the like product standard should not be interpreted in “such a narrow fashion as topermit minor differences in physical characteristics or uses to lead to the conclusion that the product and article arenot ‘like’ each other, nor should the definition of ‘like product’ be interpreted in such a fashion as to preventconsideration of an industry adversely affected by the imports under consideration.”). 13 See, e.g., USEC, Inc. v. United States, 34 Fed. Appx. 725, 730 (Fed. Cir. 2002) (“The ITC may not modify theclass or kind of imported merchandise examined by Commerce.”); Algoma Steel Corp. v. United States, 688 F.Supp. 639, 644 (Ct. Int’l Trade 1988), aff’d, 865 F.3d 240 (Fed. Cir.), cert. denied, 492 U.S. 919 (1989). 14 Hosiden Corp. v. Advanced Display Mfrs., 85 F.3d 1561, 1568 (Fed. Cir. 1996) (the Commission may find asingle like product corresponding to several different classes or kinds defined by Commerce); Cleo, 501 F.3d at 1298n.1 (“Commerce’s {scope} finding does not control the Commission’s {like product} determination.”); Torrington,747 F. Supp. at 748-52 (affirming the Commission’s determination defining six like products in investigations inwhich Commerce found five classes or kinds).
4
B. Product Description
The scope of these investigations has changed since the preliminary phase. Pursuant to a requestWhirlpool filed on May 17, 2012, Commerce amended the scope of these investigations on August 6,2012 to exclude “automatic clothes washing machines with a vertical axis and a rated capacity of lessthan 3.7 cubic feet, as certified to the U.S. Department of Energy . . . .”15 Accordingly, Commerce’sdefinition of the scope of these investigations is now as follows:16
For purposes of these investigations, the term “large residential washers” denotes allautomatic clothes washing machines, regardless of the orientation of the rotational axis,except as noted below, with a cabinet width (measured from its widest point) of at least24.5 inches (62.23 cm) and no more than 32.0 inches (81.28 cm).
Also covered are certain subassemblies used in large residential washers, namely: (1) Allassembled cabinets designed for use in large residential washers which incorporate, at aminimum: (a) At least three of the six cabinet surfaces; and (b) a bracket; (2) allassembled tubs designed for use in large residential washers which incorporate, at aminimum: (a) a tub; and (b) a seal; (3) all assembled baskets designed for use in largeresidential washers which incorporate, at a minimum: (a) A side wrapper; (b) a base; and(c) a drive hub; and (4) any combination of the foregoing subassemblies.
Excluded from the scope are stacked washer-dryers and commercial washers. The term“stacked washer-dryers” denotes distinct washing and drying machines that are built on aunitary frame and share a common console that controls both the washer and the dryer. The term “commercial washer” denotes an automatic clothes washing machine designedfor the “pay per use” market meeting either of the following two definitions:
(1)(a) It contains payment system electronics; (b) it is configured with an externallymounted steel frame at least six inches high that is designed to house a coin/tokenoperated payment system (whether or not the actual coin/token operated payment systemis installed at the time of importation); (c) it contains a push button user interface with amaximum of six manually selectable wash cycle settings, with no ability of the end userto otherwise modify water temperature, water level, or spin speed for a selected washcycle setting; and (d) the console containing the user interface is made of steel and isassembled with security fasteners; or
(2)(a) It contains payment system electronics; (b) the payment system electronics areenabled (whether or not the payment acceptance device has been installed at the time ofimportation) such that, in normal operation, the unit cannot begin a wash cycle withoutfirst receiving a signal from a bona fide payment acceptance device such as an electroniccredit card reader; (c) it contains a push button user interface with a maximum of sixmanually selectable wash cycle settings, with no ability of the end user to otherwisemodify water temperature, water level, or spin speed for a selected wash cycle setting;and (d) the console containing the user interface is made of steel and is assembled withsecurity fasteners.
15 CR at I-7 n.12; PR at I-6 n.12. 16 Large Residential Washers from the Republic of Korea: Amendment to the Scope of the Countervailing DutyInvestigation, 77 Fed. Reg. 46715 (Aug. 6, 2012) (footnotes omitted).
5
Also excluded from the scope are automatic clothes washing machines with a verticalaxis and a rated capacity of less than 3.7 cubic feet, as certified to the U.S. Department ofEnergy pursuant to 10 CFR § 429.12 and 10 CFR § 429.20, and in accordance with thetest procedures established in 10 CFR Part 430.
The products subject to these investigations are currently classifiable under subheading8450.20.0090 of the Harmonized Tariff System of the United States (HTSUS). Productssubject to these investigations may also enter under HTSUS subheadings 8450.11.0040,8450.11.0080, 8450.90.2000, and 8450.90.6000. Although the HTSUS subheadings areprovided for convenience and customs purposes, the written description of themerchandise subject to this scope is dispositive.
LRWs are automatic clothes washing appliances capable of cleansing fabrics using water anddetergent in conjunction with wash, rinse, and spin cycles typically programmed into the unit.17 They areproduced in either top-load or front-load configurations.18 Top-load LRWs possess drums that spin on avertical axis and are loaded with soiled clothing through a door on the top of the unit.19 Front-load LRWspossess drums that spin on a horizontal or tilted axis and are loaded with soiled clothing through a door inthe front of the unit.20 All LRWs are typically purchased by households for use in single familydwellings.21
Residential washers (“washers”) can be categorized as conventional top-load (“CTL”), high-efficiency top-load (“HETL”), and high-efficiency front-load (“HEFL”).22 CTL washers are characterizedby their use of a pole-shaped agitator inside the drum, which cleans clothes by swirling them throughdetergent and water.23 Due to the interior volume occupied by the agitator, CTL washers generally offerless capacity than other types of washers, and thus most domestically produced CTL washers fall outsidethe merchandise described by the amended scope.24 CTL washers can qualify for Energy Starcertification under U.S. Department of Energy Guidelines but require the consumption of too much waterand energy to qualify as Tier 3 high-efficiency (“HE”) machines under the guidelines promulgated by theConsortium for Energy Efficiency (“CEE”).25
HETL washers load from the top like CTL washers but qualify as Tier 3 HE machines under CEEguidelines because they use less water and energy.26 They use less water by washing clothes with animpeller rather than an agitator. The impeller lifts and drops clothes into a smaller quantity of water andspecially formulated HE detergent.27 They reduce energy consumption by spinning clothes at high speed,thereby extracting more water and leaving clothes in need of less time in a dryer.28
17 CR at I-9; PR at I-7. 18 CR at I-9; PR at I-8. 19 CR at I-11; PR at I-9. 20 CR at I-9; PR at I-8. 21 CR/PR at I-7. 22 CR at I-9; PR at I-8. 23 CR at I-12; PR at I-10. 24 CR at I-12; PR at I-10. 25 CR at I-12-13; PR at I-10. 26 CR at I-11; PR at I-9. 27 CR at I-11 & n.31; PR at I-9 & n.31. 28 CR at I-10, 11 n.31; PR at I-8, 9 n.31.
6
HEFL washers qualify as Tier 3 HE machines like HETL washers but load from the front.29 Theyuse less water by lifting clothes with a baffle as the drum spins on a horizontal or tilted axis and droppingthem into a smaller quantity of water and HE detergent.30 Like HETL washers, they reduce energyconsumption by spinning clothes at high speeds that extract more water and reduce drying time.31 HEFLwashers typically clean clothes better and more efficiently than HETL washers but have been reported tobe susceptible to mold and odor problems.32
In the preliminary phase of the investigations, the scope included all CTL, HETL, and HEFLwashers that satisfied the technical specifications of the scope definition.33 The amended scope in thefinal phase of the investigations excludes most CTL washers because of their smaller capacities andHETL washers that have capacities of less than 3.7 cubic feet. Petitioner contends that it requested theamended scope in order to focus the investigations on subject import competition, which in their viewconsisted of all HEFL washers and HETL washers with capacities of 3.7 cubic feet or greater.34 Subjectforeign producers did not export significant quantities of CTL washers or smaller-capacity HETL washersto the United States during the period of investigation.35 For purposes of this opinion, we use the term“LRWs” in reference to washers described by the amended scope definition (i.e., all HEFL washers andthose top-load washers with capacities of 3.7 cubic feet or greater) and the term “washers” in reference toboth the HEFL and top-load washers described by the amended scope and the smaller-capacity top-loadwashers that were excluded by the scope amendment.
C. Arguments of the Parties
Petitioner argues that the Commission should define a single domestic like product that iscoextensive with the amended scope of the investigations, encompassing all LRWs but excluding top-load washers with a capacity of less than 3.7 cubic feet.36
Respondents argue that the Commission should expand the domestic like product definitionbeyond the amended scope to include top-load washers with a capacity of less than 3.7 cubic feet,consistent with the domestic like product definition in the preliminary phase of the investigations.37 Assupport, they contend that top-load washers with a capacity of less than 3.7 cubic feet are similar toLRWs in terms of the Commission’s six like product factors.38 In particular, they maintain that top-loadwashers with a capacity of less than 3.7 cubic feet are used interchangeably with LRWs, citing testimonyand survey data indicating that consumers seeking washers simultaneously shop for CTL, HETL, andHEFL washers.39
29 CR at I-9, 16; PR at I-8, 13. 30 CR at I-10; PR at I-8. 31 CR at I-10; PR at I-8. 32 CR at I-10; PR at I-8. 33 See Large Residential Washers from Korean and Mexico, Inv. Nos. 701-TA-488 and 7431-TA-1199-1200(Preliminary), USITC Pub. 4306 (Feb. 2012) at 4-6. 34 Hearing Tr. at 50 (Levy). 35 See CR/PR at Tables C-4-5. 36 See Petitioner’s Prehearing Brief at 20-28. 37 See Samsung’s Prehearing Brief at 8-9; LG’s Prehearing Brief at 3-5. 38 See Samsung’s Prehearing Brief at 8-9; LG’s Prehearing Brief at 3-5. 39 Samsung’s Prehearing Brief at 16-17, Exhibit 1; see also LG’s Prehearing Brief.
7
D. Like Product Analysis
In the preliminary phase of the investigations, the Commission defined a single domestic likeproduct coextensive with the scope of the investigations, which at that time included top-load washerswith a capacity of less than 3.7 cubic feet. Rejecting respondents’ argument that the Commission shoulddefine three separate domestic like products corresponding to CTL, HETL, and HEFL washers, theCommission concluded that “the preponderance of similarities over differences among CTL, HETL, andHEFL washers supports the definition of a single domestic like product that is coextensive with the scopeof the investigations.”40
There is no new information on the record of the final phase of the investigations that wouldwarrant reconsideration of our previous finding that there is no clear dividing line separating CTL, HETL,and HEFL washers within the amended scope. The scope definition has changed since the preliminaryphase, however, because Commerce amended it to exclude top-load washers with a capacity of less than3.7 cubic feet. We therefore consider the relevance of the amended scope to our definition of thedomestic like product.
The Commission must accept Commerce’s determination as to the scope of the importedmerchandise subsidized or sold at LTFV,41 but the Commission may, where appropriate, include domesticarticles in the domestic like product in addition to those described in the scope.42 In past investigations,the Commission has based its like product determination on a six factor test that compared domesticallyproduced products within the scope to those outside the scope.43
As explained below, we find no evidence of a clear dividing line separating top-load washerswith a capacity of less than 3.7 cubic feet from LRWs described by the amended scope. Accordingly, wedefine the domestic like product to encompass both LRWs described by the amended scope and top-loadwashers with a capacity of less than 3.7 cubic feet, which is consistent with the domestic like productdefinition in the preliminary phase of the investigations.
40 Large Residential Washers from Korea and Mexico, USITC Pub. 4306 at 9. 41 See USEC, Inc. v. United States, Slip. Op. 01-1421 (Fed. Cir. Apr. 25, 2005) at 9 (“The ITC may not modifythe class or kind of imported merchandise examined by Commerce.”). 42 See, e.g., Pure Magnesium from China and Israel, Invs. Nos. 701-TA-403 and 731-TA-895-96 (Final), USITCPub. 3467 (Nov. 2001) at 8, n.34; Torrington Co. v. United States, 747 F.Supp. 744, 748-49 (Ct. Int’l Trade 1990),aff’d, 938 F.2d 1278 (Fed. Cir. 1991) (holding that the Commission is not legally required to limit the domestic likeproduct to the product advocated by the Petitioner, co-extensive with the scope); Nippon Steel Corp. v. UnitedStates, 19 CIT 450, 455 (1995); see also S. Rep. No. 96-249 at 90-91 (1979) (Congress has indicated that the likeproduct standard should not be interpreted in “such a narrow fashion as to permit minor differences in physicalcharacteristics or uses to lead to the conclusion that the product and article are not ‘like’ each other, nor should thedefinition of ‘like product’ be interpreted in such a fashion as to prevent consideration of an industry adverselyaffected by the imports under consideration.”). 43 See Superalloy Degassed Chromium, USITC Pub. 3768 at 7; Aluminum Plate from South Africa, USITC Pub3734 at 7; Ironing Tables and Certain Parts Thereof from China, Inv. No. 731-TA-1047 (Final), USITC Pub. 3711 at6-7 (Jul. 2004); Certain Wax/Resin Thermal Transfer Ribbons from France and Japan, Invs. Nos. 731-TA-1039-1040 (Final), USITC Pub. 3683 at 8 (Apr. 2004).
8
Physical characteristics and uses
Top-load washers with a capacity of less than 3.7 cubic feet and LRWs possess similar physicalcharacteristics and uses, particularly with respect to top-load LRWs described by the scope. Domesticallyproduced CTL and HETL washers come with capacities above and below 3.7 cubic feet and all share thesame basic physical characteristics regardless of capacity, including wash, rinse, and spin cycles; acabinet width of at least 24.5 inches and no more than 32.0 inches; a metal drum or basket into whichlaundry is loaded; a plastic tub that holds water; a motor; a pump; and a user interface and control unit.44 HEFL washers, all of which are within the amended scope, were domestically produced during the periodof investigation in capacities of above and below 3.7 cubic feet.45 All washers, regardless of capacity, areused to wash clothes. Most responding producers, importers, and purchasers reported that top-loadwashers with a capacity of less than 3.7 cubic feet are similar to LRWs in terms of physical characteristicsand uses.46
Interchangeability
Top-load washers with a capacity of less than 3.7 cubic feet are generally interchangeable withLRWs described by the scope. The record continues to support the Commission’s finding in thepreliminary phase investigations that a substantial proportion of consumers cross-shop CTL, HEFL, andHETL washers. Studies submitted by Whirlpool, as well as conference testimony by Samsung andWhirlpool officials, indicate that consumers cross-shop CTL washers, which generally possess a capacityof less than 3.7 cubic feet, with HETL and HEFL washers.47 HEFL LRWs can possess a capacity of lessthan 3.7 cubic feet, and would therefore be interchangeable with top-load washers with a capacity of lessthan 3.7 cubic feet in terms of this attribute.48 Petitioner concedes that Whirlpool’s HETL washers with acapacity of 3.6 cubic feet compete with subject imported HETL washers with a capacity of 3.7 cubic feet,suggesting a degree of interchangeability between top-load washers with capacities above and below 3.7cubic feet.49 Most responding producers, importers, and purchasers reported that top-load washers with acapacity of less than 3.7 cubic feet are interchangeable with LRWs.50
44 See CR at I-9; PR at I-6. 45 See CR/PR at Tables III-5, V-8. 46 See CR at I-24-25; PR at I-19-20. 47 See Laundry Switching Behavior Revised, March 2012, attached to Domestic Producers’ QuestionnaireResponse of Whirlpool; Petitioner’s Postconference Brief at Exhibit 4; Conference Tr. at 54 (Bitzer) (“Consumersswitch from top to front, and they switch from front to top . . . .”), 69 (Bitzer) (“What we’ve also seen over {the}past couple of years is initially there was a move from conventional top into front loaders and now we see a little bitof a move back from front loaders to . . . top load.”), 127 (Dexter) (“[A]bout 25 to 30 percent of consumers arewilling to consider both HE front load and top-load models at the same time . . . .”), 246 (Connelly) (“When welooked at the final record, it became clear to us that the extent of cross-shopping was significant.”). One Whirlpoolstudy indicates that ***. See Petitioner’s Postconference Brief at Exhibit 4. A second Whirlpool study indicatesthat ***. See Domestic Producers’ Questionnaire Response of Whirlpool, Attachment. 48 See Domestic Producers’ Questionnaire Response of Whirlpool, Exhibit 1. 49 Petitioner’s Responses to Commissioner Questions at II-16. 50 See CR at I-24-25; PR at I-20.
9
Common manufacturing facilities, production processes, and production employees
Whirlpool produces all washers, including top-load washers with a capacity of less than 3.7 cubicfeet, in the same factory in Clyde, Ohio.51 Petitioner highlights the fact that Whirlpool produces top-loadwashers with a capacity of less than 3.7 cubic feet using a separate platform, separate workers on aseparate assembly line, and with tubs and drums produced on smaller presses, as compared to LRWsdescribed by the scope.52 Nevertheless, all washers share certain production facilities and processes,including the press room, test labs, plastic forming shop, paint shops, and materials receiving, inventory,and distribution areas.53 Although half of Whirlpool’s workers specialize in the assembly of CTL, HETL,or HEFL washers, respectively,54 Petitioner nevertheless argues that there is no clear dividing lineseparating CTL, HETL, and HEFL washers within the scope in terms of production workers.55 Mostresponding producers, importers, and purchasers reported that top-load washers with a capacity of lessthan 3.7 cubic feet are similar to LRWs in terms of manufacturing facilities, production processes, andproduction employees.56
Channels of distribution
Almost all washers are shipped primarily to retailers for delivery to consumers.57
Customer and producer perceptions
In the preliminary phase of the investigations, Petitioner argued that all types of washers,including top-load washers with a capacity of less than 3.7 cubic feet, are perceived by customers andproducers as existing on a continuum, with consumers selecting among different types of washers basedupon “total value.”58 Respondents agree that top-load washers exist on “a continuum of sizes.”59 Whirlpool’s own websites classify Maytag washers (a brand owned by Whirlpool) ranging from 3.1 to4.0 cubic feet in capacity and Whirlpool washers ranging from 3.6 to 4.2 cubic feet in capacity as “large”capacity washers, suggesting that Whirlpool and its customers do not perceive a clear dividing linebetween washers above and below 3.7 cubic feet in capacity.60 Indeed, Petitioner argues that customersperceive Whirlpool’s HETL washers with a capacity of 3.6 cubic feet as interchangeable with subjectimported HETL washers with a capacity of 3.7 cubic feet.61 Most responding producers, importers, and
51 CR at I-13 & n.40; PR at I-11 n.40. Whirlpool accounted for *** percent of reported domestic production in2011. CR/PR at Table C-6; Domestic Producers’ Questionnaire Response of Whirlpool at Questions II-8 and V-1. 52 Petitioner’s Responses to Commissioner Questions at II-17. 53 CR at I-13; PR at I-11. 54 Petitioner’s Postconference Brief at 9. 55 See Petitioner’s Prehearing Brief at 23-25. 56 See CR at I-26; PR at I-20. All six responding domestic producers reported that top-load washers with acapacity of less than 3.7 cubic feet were similar to LRWs in terms of this factor. Id. 57 CR at II-3; PR at II-2; CR/PR at Table II-1. 58 See Petitioner’s Postconference Brief at 10; Conference Tr. at 52 (Levy). 59 Samsung’s Prehearing Brief at 16-17; see also LG’s Prehearing Brief at 5, 7-9. 60 Samsung’s Prehearing Brief at 15-16. 61 Petitioner’s Responses to Commissioner Questions at II-16.
10
purchasers reported that top-load washers with a capacity of less than 3.7 cubic feet are similar to LRWsin terms of customer and producer perceptions.62
Price
Most responding producers, importers, and purchasers reported that top-load washers with acapacity of less than 3.7 cubic feet are generally less expensive than LRWs,63 although the recordindicates that prices overlap to some degree.64
Conclusion
The record indicates a preponderance of similarities between top-load washers with a capacity ofless than 3.7 cubic feet and LRWs described by the amended scope. Top-load washers with a capacity ofless than 3.7 cubic feet and LRWs are generally interchangeable and similar in terms of their physicalcharacteristics and uses; manufacturing facilities, processes, and employees; channels of distribution; andcustomer and producer perceptions. They generally differ from LRWs in terms of price, and even withrespect to this factor there is overlap. Given the absence of any clear dividing line separatingdomestically produced top-load washers with a capacity less than 3.7 cubic feet from those with largercapacity, we define the domestic like product to include both LRWs as described by the scope definition,and top-load washers with a capacity of less than 3.7 cubic feet (collectively, “washers”).
III. DOMESTIC INDUSTRY
The domestic industry is defined as the domestic “producers as a whole of a domestic likeproduct, or those producers whose collective output of a domestic like product constitutes a majorproportion of the total domestic production of the product.”65 In defining the domestic industry, theCommission’s general practice has been to include in the industry producers of all domestic production ofthe like product, whether toll-produced, captively consumed, or sold in the domestic merchant market. Based on our definition of the domestic like product, we define the domestic industry as all domesticproducers of washers during the period of investigation, including Alliance, Bosch, Electrolux, Fisher &Paykel, GE, Staber, and Whirlpool.66
A. Related Parties
We must determine whether any producer of the domestic like product should be excluded fromthe domestic industry pursuant to section 19 U.S.C. § 1677(4)(B). Subsection 1677(4)(B) allows theCommission, if appropriate circumstances exist, to exclude from the domestic industry producers that arerelated to an exporter or importer of subject merchandise or which are themselves importers.67 Exclusion
62 See CR at I-26; PR at I-20. 63 See CR at I-27; PR at I-20. 64 See Petitioner’s Conference Exhibit 4; Petitioner’s Responses to Staff Questions at III-1-2. 65 19 U.S.C. § 1677(4)(A). 66 CR/PR at Table III-1 & n.1. 67 19 U.S.C. § 1677(4)(B). The primary factors the Commission has examined in deciding whether appropriatecircumstances exist to exclude a related party include the following: (1) the percentage of domestic productionattributable to the importing producer; (2) the reason the U.S. producer has decided to import the product subject toinvestigation, i.e., whether the firm benefits from the LTFV sales or subsidies or whether the firm must import in
11
of such a producer is within the Commission’s discretion based upon the facts presented in eachinvestigation.
Electrolux, ***, and Whirlpool qualify as related parties. Electrolux qualifies as a related partybecause it imported subject merchandise from Mexico during the period of investigation and is related toa subject foreign producer in Mexico, Electrolux Home Products Corp., N.V.68 ***69 Whirlpool qualifiesas a related party because it imported subject merchandise from *** Mexico during the period ofinvestigation and is related to Whirlpool Overseas Manufacturing Sarl, a Mexican producer of subjectmerchandise.70
Petitioner argues that circumstances do not warrant the exclusion of any related party.71 Respondents argue that circumstances warrant the exclusion of Electrolux as a related party becauseElectrolux’s primary interest during the period of investigation was importation and not domesticproduction.72
Based on the following analysis, we find that appropriate circumstances do not exist forexcluding Electrolux, ***, or Whirlpool from the domestic industry as a related party.
1. Electrolux
Electrolux began the period of investigation as the third largest domestic producer of washers(including top-load washers with a capacity of less than 3.7 cubic feet), accounting for *** percent ofdomestic industry production in 2009, and the second largest domestic producer of LRWs (described bythe amended scope) after Whirlpool, accounting for *** percent of domestic industry production thatsame year.73 Having made the decision to shift all washer production to Mexico in 2008, however,Electrolux’s ratio of subject imports to domestic production of washers increased from *** percent in2009 to *** percent in 2010 and *** percent in 2011 before Electrolux ceased domestic production inApril 2011.74 Thus, Electrolux shifted from being a significant domestic producer in 2009 to exclusivelyan importer of subject merchandise in January-June 2012. Electrolux *** the petition.75
That Electrolux’s current interest is not in domestic production is an insufficient basis by itself towarrant its exclusion as a related party in these investigations. There is no evidence that Electrolux’sdomestic production activities benefitted from its subject imports or were otherwise shielded from subjectimport competition during the period of investigation.76 77 Electrolux’s operating losses as a share of net
order to enable it to continue production and compete in the U.S. market, and (3) the position of the related producervis-a-vis the rest of the industry, i.e., whether inclusion or exclusion of the related party will skew the data for therest of the industry. See, e.g., Torrington Co. v. United States, 790 F. Supp. 1161 (Ct. Int’l Trade 1992), aff’dwithout opinion, 991 F.2d 809 (Fed. Cir. 1993). 68 CR at III-2 n.3; PR at III-1 n.3. 69 CR at III-12; PR at III-6; CR/PR at Table III-11. 70 CR at III-2 n.3, III-12; PR at III-1 n.3, III-6; CR/PR at Table III-11. 71 See Petitioner’s Prehearing Brief at 32-35. 72 See Electrolux’s Prehearing Brief at 16-18; Samsung’s Prehearing Brief at 23-24; LG’s Prehearing Brief at 16. 73 CR/PR at Tables III-2, III-11, C-6. 74 CR/PR at III-2, Tables III-11, C-6; Domestic Producers’ Questionnaire Response of Electrolux at Question V-1; Hearing Tr. at 224 (Chambers). 75 CR/PR at Table III-1. 76 See Certain Tissue Paper from China, Inv. No. 731-TA-1070B (Final), USITC Pub. 3758 (Mar. 2005) at 11-12(“[E]xclusion may not be warranted simply because a large producer (that was also a related party) has shifted tobecome a substantial importer of such merchandise during the period of investigation. A significant factor iswhether the firm's domestic production operations significantly benefitted financially from its relationship to subject
12
sales increased, from *** percent in 2009 to *** percent in 2010, *** percent in 2011, and *** percent inJanuary-June 2012.78 These increasing losses coincided with a steady increase in Electrolux’s ratio ofsubject imports to domestic production of washers, thus belying Electrolux’s claim that its domesticoperations benefitted from subject imports.79 80 Electrolux does not claim that its domestically producedLRWs were shielded from subject import competition,81 and the record indicates that there was asignificant volume of subject imports of LRWs similar to those produced domestically by Electrolux.82
Exclusion of Electrolux from the domestic industry would have a significant effect on domesticindustry data and trends, particularly with respect to employment and capacity. As previously stated,whether exclusion of a domestic producer’s data would skew domestic industry data is a factor theCommission has considered in its related party analysis. Electrolux’s U.S. production facility employed*** production related workers and possessed a capacity of *** units in 2009.83 Excluding Electroluxwould thus have the effect of masking declines in domestic capacity and employment that have occurredsince 2009. For all of these reasons, we find that circumstances do not support the exclusion of *** fromthe domestic industry as a related party.84
imports or from its import activities. Such benefits create the sort of data distorting effect that the exercise ofdiscretion to exclude under the related party provision seeks to overcome.”) 77 Consistent with his practice, Commissioner Pinkert does not rely upon the related parties’ financialperformance as a factor in determining whether there are appropriate circumstances to exclude them from thedomestic industry, as there has been no showing of a link between their profitability on U.S. operations andimportation. 78 CR/PR at Table VI-2; Domestic Producers’ Questionnaire Response of Electrolux at Question V-1. Electrolux’s losses on domestic LRW production increased from *** percent in 2009 to *** percent in 2010, ***percent in 2011, and *** percent in January-June 2012. CR/PR at Table VI-2. 79 See Electrolux’s Prehearing Brief at 17. 80 Consistent with her practice in past investigations and reviews, Commissioner Aranoff does not rely onindividual-company operating income margins, which reflect a domestic producer’s financial operations related toproduction of the domestic like product, in assessing whether a related party has benefitted from importation ofsubject merchandise. Rather, she determines whether to exclude a related party based principally on its ratio ofsubject imports to domestic production and whether its primary interests lie in domestic production or importation. In these investigations, she finds to exclude Electrolux from the domestic industry would skew the Commission’sdata, particularly for the early part of the period of investigation when Electrolux’s primary interest was in domesticproduction. 81 Electrolux claims that Whirlpool’s sales of CTL washers adversely impacted its domestic operations but doesnot directly address competition for its domestically produced HEFL washers. See Hearing Tr. at 224 (Chambers). 82 A majority of Electrolux’s domestic production during the period of investigation consisted of a single HEFLwasher model with a capacity of 3.2 cubic feet. Electrolux’s Prehearing Brief at 17. A majority of subject importedHEFL washers during the period of investigation were in the capacity range of 3.2 to 3.7 cubic feet. CR/PR atTables IV-3-4. 83 See Domestic Producers’ Questionnaire Response of Electrolux at Questions II-9, V-1. 84 Commissioner Pinkert concurs in the Commission’s determination to include Electrolux in the domesticindustry and finds that, although it is unclear whether the subject imports were a factor in Electrolux’s decision tomove its U.S. production to Mexico, record evidence suggests that they may well have played a role in thatdecision. In this regard, he relies in part on the significant volume of subject imports that were similar to thoseproduced in the United States by Electrolux and the fact that it would have made commercial sense for Electrolux’sdecision to have been influenced by the low prices of the subject imports. See CR/PR at Tables V-8, 11. He notesalso that excluding Electrolux from the domestic industry would have a significant impact on overall industry data. Given these circumstances, he determines that inclusion of Electrolux in the industry is warranted based on therecord evidence.
13
2. ***
*** primary interest was in domestic production rather than the importation of subjectmerchandise during the period of investigation.85 Its ratio of subject imports to domestic production ofwashers ranged from *** to *** percent during the 2009-2011 period, and was *** percent in January-June 2012.86
With respect to LRWs, *** imported a small amount of subject merchandise from Korea in 2011(*** units), but ***.87 In January-June 2012, *** and imported only *** units of LRWs from Korea.88
There is no evidence that *** domestic operations benefitted from subject imports. With respectto production of washers, *** operating income as a share of net sales was *** percent in 2009, a loss of*** percent in 2010, a positive *** percent in 2011, and a positive *** percent in January-June 2012.89 Although *** domestic operations benefitted financially from its importation of subject merchandise,which amounted to only *** units during that period.90
Finally, because *** accounted for *** percent of total domestic production of washers in 2011,its exclusion from the domestic industry would *** on the domestic industry’s trade and financial data.91 Additionally, *** supports the petition.92 For all of these reasons, we find that circumstances do notsupport the exclusion of *** from the domestic industry as a related party.
3. Whirlpool
Whirlpool’s primary interest was clearly in domestic production, with a ratio of subject imports todomestic production of washers declining from *** percent in 2009 to *** percent in 2010 and ***percent in 2011.93 The ratio was *** percent in January-June 2012, up from *** percent in January-June2011.94
There also is no evidence that Whirlpool’s domestic washer operations benefitted financiallyfrom its importation of subject merchandise, given its poor and declining financial performance duringthe period of investigation.95 Because Whirlpool was the *** domestic producer in 2011, accounting for*** percent of total domestic production of washers that year, its exclusion from the domestic industrywould *** on the domestic industry’s trade and financial data.96 Finally, Whirlpool is the petitioner. Forall of these reasons, we find that circumstances do not support the exclusion of Whirlpool from thedomestic industry as a related party.
Accordingly, we define the domestic industry to include all domestic producers of washers.
85 CR/PR at Table III-5. 86 CR/PR at Table III-11; Domestic Producers’ Questionnaire Response of *** at Question V-1. 87 CR at III-12; PR at III-6; CR/PR at Table III-11. 88 CR/PR at Table III-11. 89 CR/PR at Table VI-2; Domestic Producers’ Questionnaire of *** at Question V-1. 90 See CR/PR at Tables III-11, VI-2. 91 See CR/PR at Tables VI-2, C-6; Domestic Producers’ Questionnaire Response of *** at Question V-1. 92 CR/PR at III-1. 93 CR/PR at Table III-11; Domestic Producers’ Questionnaire Response of Whirlpool at Question V-1. 94 CR/PR at Table III-11; Domestic Producers’ Questionnaire Response of Whirlpool at Question V-1. 95 See CR/PR at Table VI-2; Domestic Producers’ Questionnaire of Whirlpool at Question V-1. 96 CR/PR at Table III-1.
14
IV. CUMULATION97
A. Background
For purposes of evaluating the volume and price effects for a determination of material injury byreason of the subject imports, section 771(7)(G)(i) of the Tariff Act requires the Commission to cumulatesubject imports from all countries as to which petitions were filed and/or investigations self-initiated byCommerce on the same day, if such imports compete with each other and with domestic like products inthe U.S. market.98 In assessing whether subject imports compete with each other and with the domesticlike product, the Commission has generally considered four factors:
(1) the degree of fungibility between the subject imports from different countries andbetween imports and the domestic like product, including consideration of specificcustomer requirements and other quality related questions;
(2) the presence of sales or offers to sell in the same geographic markets of subjectimports from different countries and the domestic like product;
(3) the existence of common or similar channels of distribution for subject importsfrom different countries and the domestic like product; and
(4) whether the subject imports are simultaneously present in the market.99
Although no single factor is necessarily determinative, and the list of factors is not exclusive,these factors are intended to provide the Commission with a framework for determining whether thesubject imports compete with each other and with the domestic like product.100 Only a “reasonableoverlap” of competition is required.101
The statutory threshold for cumulation is satisfied in these investigations because Petitioner filedthe antidumping duty petitions with respect to both countries and the countervailing duty petition with
97 Negligibility under 19 U.S.C. § 1677(24) is not an issue in these investigations. Based on official Commercestatistics, subject imports from Korea accounted for 54.4 percent of all imports of LRWs and subject imports fromMexico accounted for 37.8 percent of such imports during the most recent 12-month period preceding the filing ofthe petition for which data are available. CR at IV-9; PR at IV-4. 98 19 U.S.C. § 1677(7)(G)(i). 99 See Certain Cast-Iron Pipe Fittings from Brazil, the Republic of Korea, and Taiwan, Inv. Nos. 731-TA-278-280(Final), USITC Pub. 1845 (May 1986), aff'd, Fundicao Tupy, S.A. v. United States, 678 F. Supp. 898 (Ct. Int'lTrade), aff'd, 859 F.2d 915 (Fed. Cir. 1988). 100 Wieland Werke, AG v. United States, 718 F. Supp. 50 (Ct. Int'l Trade 1989). 101 The Uruguay Round Agreements Act, Statement of Administrative Action, H.R. Doc. No. 103-316, Vol. 1 at848 (1994) (“SAA”) expressly states that “the new section will not affect current Commission practice under whichthe statutory requirement is satisfied if there is a reasonable overlap of competition.” SAA at 848 (citing FundicaoTupy, S.A. v. United States, 678 F. Supp. 898, 902 (Ct. Int'l Trade 1988)), aff’d, 859 F.2d 915 (Fed. Cir. 1988). SeeGoss Graphic Sys., Inc. v. United States, 33 F. Supp. 2d 1082,1087 (Ct. Int’l Trade 1998) (“cumulation does notrequire two products to be highly fungible”); Wieland Werke, AG, 718 F. Supp. at 52 (“Completely overlappingmarkets are not required.”).
15
respect to Korea on the same day, December 30, 2011.102 No party argues that cumulation isinappropriate in the final phase of these investigations.103
B. Analysis
Based on the record of the final phase of these investigations, we find a reasonable overlap ofcompetition between subject imports from Korea and Mexico and between subject imports from eachsource and the domestic like product. First, the record indicates that there is a moderately high degree ofsubstitutability between subject imports from Korea and Mexico, and subject imports from each sourceand domestically produced LRWs.104 Most responding domestic producers reported that subject importsfrom Korea and Mexico are “always” used interchangeably with each other and with domesticallyproduced LRWs, while responding importers reported that subject imports from Korea and Mexico are“always” or “sometimes” used interchangeably with each other and with domestically produced LRWs.105 All but one responding purchaser reported that subject imports from Korea and Mexico are “always” or“frequently” used interchangeably with each other and with domestically produced LRWs.106 A majorityof responding purchasers reported that U.S., Korean, and Mexican LRWs are comparable in terms of 21enumerated factors, such as “delivery terms,” “fit, feel, and finish,” and “product range,” with a fewexceptions.107
Second, the record indicates that LRWs from all sources served a nationwide market during theperiod of investigation.108
Third, subject imports from Korea and Mexico and the domestic like product shared the samegeneral channels of distribution. During the period of investigation, the vast majority of domesticallyproduced and subject imported LRWs were sold to appliance retailers.109
Finally, LRWs from all sources were simultaneously present in the U.S. market, given thatsubject imports from Korea and Mexico entered the United States in every month of the period ofinvestigation.110
102 None of the statutory exceptions to cumulation is applicable. 103 See Petitioner’s Prehearing Brief at 30-31; Samsung’s Prehearing Brief at 24. 104 CR at II-20; PR at II-12. We recognize that questionnaire respondents were asked to compare domesticallyproduced LRWs, excluding top-load washers with a capacity of less than 3.7 cubic feet, with subject importedLRWs from Korea and Mexico, whereas we have defined the domestic like product to include top-load washers witha capacity of less than 3.7 cubic feet. We nevertheless find that the moderate to high degree of substitutabilitybetween domestically produced LRWs and subject imported LRWs is sufficient for us to find a reasonable overlapof competition between subject imports and the domestic like product for purposes of cumulation. LRWs accountedfor *** percent of the domestic industry’s U.S. shipments in 2011, CR/PR at Tables C-1 and C-6, and the domesticindustry’s sales of top-load washers with a capacity of less than 3.7 cubic feet were not insulated from subject importcompetition, as discussed below. In addition, we found a moderately high degree of substitutability between subjectimports and domestically produced LRWs in the preliminary phase of the investigations, when the scope includedtop-load washers with a capacity of less than 3.7 cubic feet. Preliminary Views, USITC Pub. 4306 at 13. 105 CR/PR at Table II-7. 106 CR/PR at Table II-7. One responding purchaser reported that subject imports from Korea are “sometimes”used interchangeably with subject imports from Mexico. Id. 107 See CR/PR at Table II-6. 108 CR at II-5-6, IV-9; PR at II-3, IV-4. 109 CR at II-3; PR at II-2; CR/PR at Table II-1. 110 CR at IV-9; PR at IV-4.
16
Based on these factors, we conclude that there is a reasonable overlap of competition between andamong subject imports and the domestic like product and, therefore, cumulate subject imports from Koreaand Mexico for our analysis of whether there is material injury by reason of subject imports.
V. CONDITIONS OF COMPETITION AND THE BUSINESS CYCLE
The following conditions of competition inform our analysis of whether there is material injuryby reason of subject imports.
A. Demand Conditions
Apparent U.S. consumption of washers increased from *** units in 2009 to *** units in 2010, butdeclined to *** units in 2011, a level *** percent lower than in 2009.111 Apparent U.S. consumption ofwashers was *** units in January-June 2012, down *** percent from *** units in January-June 2011.112 Demand for washers is not highly correlated with general economic conditions or conditions in thehousing market because a substantial proportion of washer purchases are made to replace washers that areat or close to the end of their functional lives.113 In addition, washers have few, if any, substitutes.114 Increased demand for washers in 2010 was reportedly attributable in large part to the federalgovernment’s “Cash for Appliances” program that year.115
Each type of washer discussed above – CTL, HETL, and HEFL – exhibited distinct demandtrends during the period of investigation. Apparent U.S. consumption of CTL washers declined ***during the period, from *** units in 2009 to *** units in 2010 and *** units in 2011, a level *** percentlower than in 2009.116 Apparent U.S. consumption of CTL washers was *** units in both January-June2011 and January-June 2012.117 Responding producers, importers, and purchasers attributed decliningCTL washer demand to competition from high-efficiency washers, and HETL washers in particular, and aconsumer preference for larger capacity washers, among other factors.118
Apparent U.S. consumption of HETL washers increased throughout the period of investigation,from *** units in 2009 to *** units in 2010 and *** units in 2011, a level *** percent higher than in2009.119 Apparent U.S. consumption of HETL washers was *** units in January-June 2012, up ***percent from *** units in January-June 2011.120 Responding producers, importers, and purchasersattributed increased demand for HETL washers to increasingly competitive prices for HETL washersrelative to CTL washers, and increased consumer interest in energy-efficient washers in the top-loadconfiguration with which they are comfortable, among other factors.121
111 CR/PR at Table C-6. 112 CR/PR at Table IV-3. 113 CR at II-10; PR at II-6; Hearing Tr. at 91-92 (Fettig). 114 CR at II-12; PR at II-7. The principal substitute for LRWs is smaller washers, such as CTL washers, which weinclude in our domestic like product definition, and other washers, such as stacked washers. CR at II-12; PR at II-7. 115 CR at II-15; PR at II-9; Hearing Tr. at 125 (Fettig). 116 CR/PR at Table C-4. 117 CR/PR at Table C-4. 118 CR at II-17-18; PR at II-11; see also Hearing Tr. at 126 (Tubman); Conference Tr. at 23-24, 68-69 (Bitzer). 119 CR/PR at Table C-9. 120 CR/PR at Table C-9. 121 CR at II-18; PR at II-11.
17
Apparent U.S. consumption of HEFL washers increased from *** units in 2009 to *** units in2010 but declined to *** units in 2011, a level *** percent lower than in 2009.122 Apparent U.S.consumption of HEFL washers was *** percent lower in January-June 2012, at *** units, than inJanuary-June 2011, at *** units.123 Responding domestic producers, importers, and purchasers attributeddeclining HEFL washer demand to a shift in consumer preferences towards HETL washers, the addedexpense of purchasing a pedestal with front-load models due to ergonomic considerations, and thereputation of HEFL washers as suffering from mold and vibration problems, among other factors.124 Nevertheless, the *** decline in HEFL washer demand between 2009 and 2011 was accounted for bydecreasing U.S. shipments of HEFL washers with a capacity greater than or equal to 3.2 cubic feet butless than 3.7 cubic feet, as demand for larger HEFL washers *** during the period.125
The differing demand trends of CTL washers, HETL washers, and HEFL washers reflect thesubstantial degree of competition between the three types of washers, with demand for HETL washersincreasing at the direct expense of CTL washers and HEFL washers. We defined a single domestic likeproduct consisting of all washers based on our conclusion that the three types of washers areinterchangeable, sold through the same channels of distribution, and perceived as similar by customersand producers, among other similarities. Retailers offer consumers a full range of washers at differentprices to appeal to a variety of consumers,126 and generally display and advertise the three types ofwashers side by side.127 Given this, it is unsurprising that consumers consider each of the three types ofwashers, or “cross-shop,” to a significant degree.128
Competition in the U.S. market occurs at two levels of trade -- sales by domestic producers andimporters to retailer/distributors and sales by retailers to consumers. Domestic producers and importersmade nearly all their U.S. shipments to retailer/distributors, which include large retailers and “buyers’groups” such as Nationwide and NATM, which purchase washers on behalf of smaller, often regionalretailers.129 Five large appliance retailers -- Best Buy, HH Gregg, Home Depot, Lowe’s, and Sears --together account for 65 to 70 percent of washer sales in the U.S. market, with buyers’ groups accountingfor most of the balance.130 Consistent with our practice of examining prices for the first arms-lengthtransactions in the U.S. market, we have focused our analysis of competition and pricing in the U.S.
122 CR/PR at Table C-2. 123 CR/PR at Table C-2. 124 CR at II-19-20; PR at II-12. Newer HEFL washer models possess features designed to prevent mold. See CRat I-10 n.25; PR at I-8 n.25; Hearing Tr. at 67, 69 (Schmidt), 219 (Herring). 125 CR/PR at Tables III-5, IV-3, IV-4, and IV-5. Apparent U.S. consumption of HEFL washers with a capacity of3.7 cubic feet or greater was *** percent lower in January-June 2012 as compared to January-June 2011. 126 CR at II-1, 28; PR at II-1, 16-17; see also Hearing Tr. at 37 (Abdelnour); AVB/Brandsource’s Comments at 4-5; MEGA’s Comments at 4; Home Depot Trip Notes, Aspen Hill, MD, Nov. 16, 2012. 127 CR at II-1, 28; PR at II-1, 16-17; Hearing Tr. at 37 (Abdelnour); Samsung’s Prehearing Brief at 15, Exhibit 2;LG’s Prehearing Brief at Exhibit 2; AVB/Brandsource’s Comments at 4-5; MEGA’s Comments at 4. 128 See section II.D, above. 129 CR at II-3-5; PR at II-3; CR/PR at Table II-1. 130 CR/PR at II-1.
18
washer market on sales by domestic producers and importers to retailer/distributors.131 Nevertheless, wealso recognize that retail consumer preferences influence retailers’ purchasing decisions.132
B. Supply Conditions
There are currently four known U.S. producers of washers – Alliance, GE, Staber, and Whirlpool -- with Whirlpool alone accounting for *** percent of reported domestic production in 2011.133 Threeadditional domestic producers, Bosch, Electrolux, and Fisher & Paykel, shuttered their U.S. washerproduction facilities during the period of investigation.134 Bosch ceased U.S. production in May 2011,Electrolux in April 2011, and Fisher & Paykel in late 2009.135 Bosch reports that it closed its U.S. plant***.136 The domestic industry’s share of apparent U.S. consumption declined from *** percent in 2009to *** percent in 2010 but increased to *** percent in 2011, a level *** percentage points lower than in2009.137 The domestic industry’s share of apparent U.S. consumption was *** percent in January-June2012, up from *** percent in January-June 2011.138
Not all domestic producers produced all types of washers at their U.S. facilities during the periodof investigation. ***.139 ***.140 ***.141 ***.142 ***.143 ***.144 Finally, Whirlpool produced CTL and HETLwashers throughout the period, and commenced production of HEFL washers in the fourth quarter of2010, shifting production of HEFL washers for the U.S. market from Germany and Mexico to the UnitedStates.145
Most subject imports from Korea were imported by LG and Samsung during the period ofinvestigation. These firms respectively accounted for *** percent and *** percent of such imports in
131 See Bottom Mount Combination Refrigerator-Freezers from Korea and Mexico, Inv. Nos. 701-TA-477 and731-TA-1180-1181 (Final), USITC Pub. 4318 (May 2012) at 16; Sodium Hexametaphosphate from China, Inv. No.731-TA-1110 (Final), USITC Pub. 3984 (March 2008) at 13 n.91; Kosher Chicken from Canada, Inv. No. 731-TA-1062 (Preliminary), USITC Pub. 1062 (January 2004) at 15 n.120. 132 See CR at II-24, 28 PR at II-15, 17; CR/PR at Table II-3; Hearing Tr. at 240-41 (Baird). 133 CR/PR at Table C-6; Domestic Producers’ Questionnaire Response of Whirlpool at Questions II-8 and V-1. 134 CR/PR at Table III-2. 135 CR/PR at III-1 n.1, 2. 136 CR at VI-14; PR at VI-4; Hearing Tr. at 47 (Bosshard) (“Unfortunately, BSH was forced to close its front-loadproduction plant in May 2011 as a result of competition from low-priced washers, including in particular importsfrom LG and Samsung.”). 137 CR./PR at Table C-6. 138 CR./PR at Table C-6. 139 CR/PR at III-1 n.1, Figure III-3. 140 CR/PR at Figure III-3. 141 CR/PR at Figure III-3; Domestic Producers’ Questionnaire of Electrolux at question V-2. 142 CR/PR at III-1 n.1. 143 CR/PR at III-2, Figure III-4; Domestic Producers’ Questionnaire of GE at questions II-10, V-2, and V-3. 144 CR/PR at Figure III-4. 145 CR/PR at Figure III-4; CR at III-2-3; PR at III-2; Domestic Producers’ Questionnaire of Whirlpool at QuestionV-2 and V-3. Whirlpool’s domestically produced HEFL washers are built on its Alpha platform and are thereforeknown as Alpha HEFL washers. Hearing Tr. at 28 (Fettig).
19
2011.146 HEFL washers were imported from Korea throughout the period of investigation, but HETLwasher imports from Korea began only in May 2010 with LG’s entry into the market.147 Samsung enteredthe HETL washer market in May 2011.148
Subject imports from Mexico were imported by Electrolux, Samsung, and Whirlpool, whichaccounted for *** percent, *** percent, and *** percent of such imports, respectively, in 2011.149 ***.150 ***.151 ***.152
Cumulated subject imports as a share of apparent U.S. consumption increased from *** percentin 2009 to *** percent in 2010 but declined to *** percent in 2011, a level still *** percentage pointshigher than in 2009.153 Cumulated subject imports as a share of apparent U.S. consumption were ***percent in January-June 2012, down from *** percent in January-June 2011.154
Nonsubject imports as a share of apparent U.S. consumption declined throughout the period ofinvestigation, from *** percent in 2009 to *** percent in 2010 and *** percent in 2011.155 Nonsubjectimports as a share of apparent U.S. consumption were *** percent in January-June 2012, down from ***percent in January-June 2011.156 The largest sources of nonsubject imports were reportedly China, theCzech Republic, and Germany.157 A large proportion of nonsubject imports consisted of HEFL washersimported from Germany by Whirlpool, which closed its German LRW facility and ceased such importseffective July 2012 pursuant to its decision to supply the U.S. market with domestically produced HEFLwashers.158
C. Market Dynamics
As noted above, most washers are sold by domestic producers and importers to the five largestretailers – Best Buy, HH Gregg, Home Depot, Lowe’s, and Sears.159 With the exception of ***,addressed below, most retailers purchase washers through direct negotiations with suppliers.160 Typicalnegotiations involve a supplier suggesting a minimum advertised price (“MAP”) for each washer model
146 CR/PR at Table IV-1. 147 CR at IV-5; PR at IV-3; Samsung’s Prehearing Brief at 25 (LG entered the HEFL washer market in 2003 andSamsung in 2006). 148 CR at IV-5; PR at IV-3. 149 CR/PR at Table IV-1. 150 CR at III-12; PR at III-6; CR/PR at Table III-11. 151 CR at III-3 n.8, III-12; PR at III-2 n.8, III-6; CR/PR at Table III-11. 152 CR at VII-12; PR at VII-6. 153 CR/PR at Table C-6. 154 CR/PR at Table C-6. 155 CR/PR at Table C-6. 156 CR/PR at Table C-6. 157 CR at VII-22; PR at VII-11; CR/PR at Table VII-13. 158 CR at III-3 n.8; PR at III-2 n.8; CR/PR at Table III-11. 159 CR/PR at II-1. An additional 25 to 30 percent of LRW sales are made to “buyers’ groups,” which do notpurchase LRWs directly but negotiate prices on behalf of groups of smaller retailers. Id. 160 Fifteen responding purchasers reported that their purchases involved negotiations with suppliers, while sixreported that they did not. CR at V-4; PR at V-3.
20
offered.161 Suppliers then negotiate a profit margin for the retailer, consisting of the difference betweenthe MAPs and the retailer’s acquisition cost.162 Suppliers encourage retailers to price their washers at orabove MAPs by conditioning advertising funds on the maintenance of such prices.163 During specialpromotions, a supplier may reduce the MAPs on particular models and provide additional promotionalsupport to preserve the retailer’s profit margin.164 Responding domestic producers and all but oneresponding importer reported using the same MAPs for the same LRW models sold to differentretailers.165
Among the 15 responding purchasers that reported engaging in negotiations with their suppliers,one purchaser described meeting competitors’ prices, or “meet comp,” as standard in the industry, whileother responding purchasers stated that prices are compared without explicitly stating competitors’ pricesto suppliers.166 For example, ***.167 Retailers decide which models to purchase based on features, brand,margins, profitability, quality, and retail prices during negotiations.168 Most responding purchasers alsoreported that they allocate limited floor space at their retail establishments to different types of LRWs atdifferent prices on the basis of consumer demand and the relative profitability of individual units.169
Discounting is prevalent in the LRW market, particularly during promotional events coincidingwith holidays such as Presidents’ Day, Memorial Day, Independence Day, Labor Day, Columbus Day,and “Black Friday” (the day after Thanksgiving).170 ***, ***, ***, and *** reported an increase inpromotional activity around holidays during the period of investigation.171 All responding purchasers butone reported that at least half of their LRW sales in 2011 were made at promotional prices, with mostresponding purchasers reporting that over 75 percent or over 90 percent of their sales were made atpromotional prices.172 Twelve responding purchasers reported that the volume of LRW sales made at
161 CR at V-7; PR at V-5. 162 CR at V-7; PR at V-5. 163 CR at V-7; PR at V-5. 164 CR at V-7; PR at V-5. Most responding purchasers reported negotiating support levels with suppliers whenplanning for major holiday promotions. CR at V-14; PR at V-8. 165 CR at V-8; PR at V-6. 166 CR at V-4; PR at V-3. 167 Petitioner’s Prehearing Brief at Exhibit 4. 168 CR at V-4; PR at V-3. 169 CR at II-27-28; PR at II-16-17; Hearing Tr. at 31, 37-38 (Fettig), 45, 120-21 (Bilas). Sixteen of 21 respondingpurchasers reported allocating floor space. CR at II-27-28; PR at II-16-17. Thirteen of these responding purchasersreported that relative LRW pricing from different suppliers affected their floor space allocation decisions, due to theimportance of price and profitability. Id. Ten of 19 responding purchasers reported that they had denied orthreatened to deny a floor spot to a particular LRW model because the supplier’s proposed price was too high. CR atII-29; PR at II-17. Fifteen responding purchasers factored expected profits into their decisions about which modelsand which suppliers would be allocated floor space. Id. LRW models placed on the floor of a retailer’sestablishments sell better than LRW models that are not. Hearing Tr. at 45, 121 (Bilas). 170 CR at II-9; PR at II-6. 171 CR at II-9, 14; PR at II-6, 8. 172 CR at V-14; PR at V-8. *** were among the responding purchasers reporting that over 90 percent of their2011 LRW sales were made at promotional prices. Id. *** reported that Black Friday now accounts for 17 percentof its annual LRW sales volume. CR at II-14 n.22; PR at II-8 n.22.
21
promotional prices increased during the period of investigation, while seven responding purchasersreported that the volume remained the same.173
Discounts on washers offered by suppliers to retailers can be characterized as direct or indirect. Direct discounts are discounts, incentives, rebates, and other adjustments tied to the specific productbeing sold.174 Specific types of direct discounts used by domestic producers and importers includequantity discounts, annual total volume discounts, sales incentives, promotional discounts, and otherdiscounts.175 Responding domestic producers and importers reported providing a wide variety of directdiscounts.176
Indirect discounts are not tied to specific products and consist of allocated discounts, incentives,allowances, rebated ties to some broad performance measure or volume discounts based on multipleproducts, including different white goods and electronic products.177 Responding domestic producers andimporters reported providing indirect discounts based on factors such as sales volume, marketing, andemployee training.178 They also reported negotiating for more floor space, more “end-cap” space, or otherpromotional considerations, in return for indirect discounts.179
Although all responding producers and importers engaged in discounting,180 respondingpurchasers reported that LG and Samsung offered larger discounts than GE or Whirlpool. Specifically,responding purchasers reported that discounts as a share of their purchases of all washers during the2010-11 period ranged from *** percent to *** percent on purchases from *** and *** percent to ***percent on purchases from ***, as compared to *** percent to *** percent on purchases from *** and*** percent to *** percent on purchases from ***.181
***182***183***184***185***186***187***.188
173 CR at V-14; PR at V-8. No responding purchaser reported that the volume of washer sales made atpromotional prices declined. 174 CR at V-9; PR at V-6. 175 CR at V-10; PR at V-6-7. 176 CR at V-10; PR at V-6. 177 CR at V-9; PR at V-6-7. 178 CR at V-10; PR at V-7. 179 CR at V-11; PR at V-7. 180 See CR at V-10; PR at V-6; CR/PR at Tables V-3-5; see also Samsung’s Prehearing Brief at 41-42, Exhibit 2;Hearing Tr. at 208 (Dexter); Samsung’s Hearing Exhibits 3-4; Samsung’s Posthearing Brief at 13-15. 181 CR/PR at Table V-5. 182 CR at II-5 & n.9, V-5; PR at II-3 & n.9, V-4; Hearing Tr. at 39-40 (Abdelnour), 190-91 (Tubman); Petitioner’sPosthearing Brief at Exhibits 7, 19. 183 CR at V-5; PR at V-4. 184 CR at V-61; PR at V-15; *** December 21, 2012 Letter, at 2. 185 CR at V-61-62; PR at V-15; *** December 21, 2012 Letter, at 2. 186 *** December 21, 2012 Letter, at 2. 187 *** December 21, 2012 Letter, at 2. 188 CR/PR at Table V-21.
22
D. Substitutability
As detailed in section IV.B above, we have found that there is a moderately high degree ofsubstitutability between subject imports and domestically produced LRWs.189 Most responding domesticproducers reported that subject imports from Korea and Mexico are “always” used interchangeably witheach other and with domestically produced LRWs, while responding importers reported that subjectimports from Korea and Mexico are “always” or “sometimes” used interchangeably with each other andwith domestically produced LRWs.190 All responding purchasers reported that subject imports fromKorea and Mexico are “always” or “frequently” used interchangeably with each other and withdomestically produced LRWs, with one exception.191
We further find that price is an important factor in the LRW market, although non-price factorsare also important.192 Responding purchasers ranked price more than any other factor as among the topthree factors that influence their purchasing decisions, with 11 responding purchasers ranking priceamong their top three factors.193 Among 22 listed purchase factors, 17 responding purchasers cited“margin opportunity” (i.e., the difference between acquisition cost and retail sales price) as “veryimportant” to their purchasing decisions and second only to availability, which 18 responding purchaserscited as “very important.”194 Fifteen responding purchasers cited “price” as very important, behind only“availability,” “margin opportunity,” and “fit, feel, and finish.”195 When asked whether differences otherthan price are ever significant to purchasers in choosing between LRWs produced in Korea, Mexico, and
189 CR at II-20; PR at II-12. We recognize that questionnaire respondents were asked to compare domesticallyproduced LRWs, excluding top-load washers with a capacity of less than 3.7 cubic feet, with subject importedLRWs from Korea and Mexico, whereas we have defined the domestic like product to include top-load washers witha capacity of less than 3.7 cubic feet. Nevertheless, we find that comparisons between subject imports anddomestically produced LRWs are probative of the substitutability of subject imports and the domestic like productfor the reasons discussed in section IV.B, above. In addition, we found a moderately high degree of substitutabilitybetween subject imports and the domestic like product in the preliminary phase of the investigations, based oninformation reported by responding domestic producers and importers asked to compare domestically producedLRWs including top-load washers with a capacity of less than 3.7 cubic feet with subject imports. See LargeResidential Washers from Korea and Mexico, USITC Pub. 4306 at 13, 21. 190 CR/PR at Table II-7. 191 CR/PR at Table II-7. One responding purchaser reported that subject imports from Korea and “sometimes”used interchangeably with subject imports from Mexico. Id. 192 We are unpersuaded by Samsung’s argument that price is frequently not the most important factor forconsumers. See Samsung’s Prehearing Brief at 34-35, 51. The level of trade relevant to our injury analysis is salesby domestic producers and importers to distributors and retailers, not sales by retailers to consumers. Moreover,much of the evidence cited by Samsung indicates that despite the importance of other factors, price remains a veryimportant factor to consumers in the market for a washer. This evidence includes 1) a study concluding that 25percent of consumers are “penny pinchers” motivated by price alone; 2) a study commissioned by Whirlpoolindicating that 79 percent of consumers identified price as important, with 48.9 percent identifying price as amongthe top two factors; 3) a study commissioned by GE showing that price ranked among the top four consumerconsiderations; 4) a Market Research Society (“MRS”) study (MRS is a market research organization) concludingthat consumers will comparison shop at numerous retailers in search of the right combination of features and price;and 5) a J.D. Power Study concluding that 27 percent of consumers viewed price as the main reason for purchasing aparticular washer, 41 percent viewed price as the main reason for not purchasing a particular washer, and 44 percentagreed that the most important consideration in selecting a washer is “value for money.” See Samsung’s PrehearingBrief at 35-37, 51-55, Exhibits 19-20, 25. 193 CR/PR at Table II-3. 194 CR/PR at Table II-4. 195 CR/PR at Table II-4. Sixteen responding purchasers cited “fit, finish, and feel” as “very important.” Id.
23
the United States, most responding producers responded “never” and most responding purchasersresponded “sometimes” or “never,” although most responding importers responded “always.”196 Important non-price factors cited by questionnaire respondents include capacity, features, style, quality,transportation, after-sale support, warranty, performance, and reliability ratings.197
Domestic producer and importer pricing practices and the prevalence of discounting constitutefurther evidence that price is an important factor in the LRW market. As discussed above, negotiationsbetween domestic producers and importers, on the one hand, and retailers, on the other, for the supply ofLRWs focus on MAPs and profit margins, expressed as the difference between MAPs and acquisitioncosts, and competitors’ prices often factor into such negotiations.198 Moreover, retailers consider relativeprofit margins when allocating limited retail floor space to LRW models from different suppliers.199 Allresponding domestic producers and importers engaged in discounting and a substantial and growingproportion of LRW sales were made at promotional prices during the period of investigation.200 Discussing the importance of holiday promotions at the hearing, Bob Baird of Home Depot stated “thelower the price, probably the more you sell.”201
Although non-price factors are also important, the record indicates that subject imports anddomestically produced LRWs are comparable with respect to such factors.202 A majority of responding
196 CR/PR at Table II-9. When asked how often their firm purchased LRWs offered at the lowest price, 3responding purchasers reported “always,” 3 responded “usually,” and 15 responded “sometimes.” CR at II-24; PR atII-15. 197 CR at II-34-35; PR at II-21. 198 CR at V-4, 7; PR at V-3, 5. 199 CR at II-28; PR at II-16-17; Hearing Tr. at 45 (Bilas). 200 See CR at V-14; PR at V-8; CR/PR at Tables V-4-5. 201 Hearing Tr. at 332 (Baird). 202 We are unpersuaded by respondents’ arguments that subject import competition was attenuated by non-pricefactors. Samsung argues that subject import competition was attenuated by the complexity of consumer purchasingdecisions, which are influenced by non-price factors. See Samsung’s Prehearing Brief at 51-56. LG claims that thealleged superiority of subject imports in terms of non-price factors served to attenuate subject import competition,citing a report prepared by a noted designer attributing LG’s success to superior design and innovation, among otherthings. LG’s Prehearing Brief at 23-28, Exhibits 10-11; Responses to Commissioner Questions, Exhibit 5 at 10-15. Both respondents cite J.D. Power’s customer satisfaction rankings, which ranked LG and Samsung higher than GE,Whirlpool, and Maytag. See Samsung’s Prehearing Brief at 55, Exhibit 20; LG’s Prehearing Brief at 25; CR/PR atE-6, 8-9.
Contrary to respondents’ arguments, much of the evidence Samsung relies upon indicates that price is animportant factor to consumers on the market for a new LRW, as addressed above. Moreover, the level of traderelevant to our injury analysis is sales by domestic producers and importers to retailers and distributors, andresponding purchasers have reported that price is an important factor to them. See, e.g., CR/PR at Tables II-3-4, 9. The record as a whole, including information provided by responding purchasers, also indicates that most purchasersview subject imports as interchangeable with domestically produced LRWs and comparable to domesticallyproduced LRWs in terms of non-price factors. See, e.g., CR/PR at Tables II-6-7. Nor does the record indicate anysignificant difference between subject imports and domestically produced LRWs in terms of innovation, as discussedbelow.
We recognize that ***. Domestically produced LRWs were often ranked highly by Consumer Reports,which compares specific washer models. In any event, broad measures of “customer satisfaction” with particularbrands does not detract from the record evidence collected from responding purchasers, indicating that subjectimports are interchangeable with and comparable to domestically produced LRWs.
We also note that the record evidence concerning the importance of design and “fit, feel, and finish” topurchasers is mixed. Although most responding purchasers rated “design/styling” and “fit, feel, and finish” as “veryimportant” purchase factors, only 2 of 20 responding purchasers ranked “fit, feel, and finish” as among the top three
24
purchasers reported that U.S., Korean, and Mexican LRWs are comparable in terms of 21 enumeratedfactors, such as “delivery terms,” “fit, feel, and finish,” and “product range,” with a few exceptions.203 Consumer Reports consistently ranked domestically produced LRWs among the ten best HETL washersand HEFL washer models during the 2009-2011 period, often ahead of subject imported LRWs.204 Withrespect to HEFL washers, Consumer Reports ranked several Bosch and Electrolux models among the tenbest in 2009 and 2010, and gave Whirlpool’s Alpha HEFL washers the top five rankings in 2011.205 Inaddition, Bob Baird of Home Depot reiterated his position from the hearing for the Bottom MountCombination Refrigerator-Freezers from Korea and Mexico (“Refrigerators”) investigations that the fit,feel, and finish of Whirlpool’s domestically produced LRWs is equivalent to what LG and Samsung offer,notwithstanding Home Depot’s opposition to imposition of duties.206
LG, Samsung, and Whirlpool each claimed to be innovation leaders in the LRW market, and eachcompany has introduced important innovations.207 For example, Whirlpool introduced the first HETLwasher in 2001 and the first large capacity HETL washer in 2008, as well as features such as laundry“apps” and an optimized detergent dispenser.208 LG emphasized its innovative styling and features suchas cold wash and advanced diagnostics, as well as its focus on “fit, feel, and finish.”209 Samsung claimedto have led the industry in vibration reduction technology.210 When asked to name “innovation leaders”in the LRW market, defined as a firm that initiated technological or quality improvements that mattered tothe purchaser and/or its customers, 14 responding purchasers named LG, 10 named Whirlpool, 10 namedSamsung, 3 named Electrolux, and 1 named GE.211 Most responding purchasers reported thatdomestically produced LRWs were comparable to subject imports in terms of “innovative features.”212
factors considered in purchasing decisions. CR/PR at Tables II-3-4. Because consumers do not generally displayLRWs in public areas of their homes, they may place less emphasis on aesthetics when selecting an LRW than whenselecting an appliance displayed more prominently in the home, such as a refrigerator. See Hearing Tr. at 44 (Bilas),93 (Fettig), 241 (Baird); see also Petitioner’s Posthearing Brief at Exhibit 22. According to Bob Baird of HomeDepot, color is no longer as important a feature as it was a few years ago. CR at I-18 n.72; PR at I-14 n.72.
Finally, we attach no weight to consumer ratings and reviews posted on the internet, which both sides havecited to support their arguments concerning non-price factors. See, e.g., LG’s Hearing Exhibit 5; Petitioner’sResponses to Commissioner Questions at II-45 n.170. The motivation behind such consumer reviews cannot beknown and individual reviews, whether positive or negative, are not evidence of broad differences in non-pricefactors such as quality or functionality. Nor is there any evidence on the record concerning the extent to whichconsumer reviews posted on the internet influence retailer and distributor purchasing decisions, if at all. 203 See CR/PR at Table II-6. 204 Petitioner’s Hearing Exhibit 1; Petitioner’s Posthearing Brief at Exhibit 21; see also Domestic Producers’Questionnaire Response of Whirlpool at Attachment 11A. 205 Petitioner’s Hearing Exhibit 1; Petitioner’s Posthearing Brief at Exhibit 21. 206 Hearing Tr. at 263; see also id. at 43 (Bilas) (“Everyone here has great products. I would agree withWhirlpool that they make outstanding washers with competitive features and wash performance and design. I wouldalso add, however, that so do LG, Samsung, Electrolux, GE and, by the way, so did Bosch.”); Refrigerators, Inv.Nos. 701-TA-477 and 731-TA-1180-1181 (Final), USITC Pub. 4318 (May 2012) at 22 n.163. 207 See LG’s Prehearing Brief at 25-28; Petitioner’s Prehearing Brief at 44; Petitioner’s Posthearing Brief at 7;Petitioner’s Hearing Exhibits 10-13; Hearing Tr. at 159-60 (Schmidt), 198-203 (Herring), 217 (Brindle). 208 CR at II-9; PR at II-6; Hearing Tr. at 154-55, 159 (Schmidt). 209 See LG’s Prehearing Brief at 26-28; Hearing Tr. at 198-203 (Herring). 210 Hearing Tr. at 217 (Brindle). 211 CR at II-2; PR at II-1. 212 CR/PR at Table II-6. A minority of responding purchasers, 7 of 16, reported that domestically producedLRWs were inferior to subject imports from Korea in terms of “innovative features.” Id.
25
Thus, the record indicates that subject imports and domestically produced LRWs are comparable withrespect to innovation.
We find that domestically produced top-load washers with a capacity of less than 3.7 cubic feetwere not shielded from subject import competition to a significant degree, although there were no subjectimports of top-load washers with a capacity of less than 3.7 cubic feet. We defined a single domestic likeproduct consisting of all washers based on our conclusion that no clear dividing line exists between top-load washers with a capacity of less than 3.7 cubic feet and LRWs in terms of physical characteristics anduses, interchangeability, channels of distribution, and customer and producer perceptions, among otherfactors. All parties agree that Whirlpool’s HETL washers with a capacity of 3.6 cubic feet compete withsubject imported LRWs.213 Moreover, consumers cross-shop CTL washers, which generally possess acapacity of less than 3.7 cubic feet, with HETL washers and HEFL washers.214
The record also indicates that the prices of subject imported LRWs affect sales of domesticallyproduced CTL washers. *** reported that HETL washers captured market share from CTL washers asthey expanded into lower price points.215 At the hearing, Jeff Fettig, Whirlpool’s Chairman and CEO,stated that “this extraordinary discounting by LG and Samsung . . . impacts us across the entire washerline” because “prices get compressed all the way down the line . . . .”216 Explaining how “pricecompression” works, Bob Baird of Home Depot stated that when a larger capacity, more fully featuredwasher model is discounted to the same price as a smaller-capacity, less fully featured model, “peoplewill buy the one with the most features” and “if you don’t reduce that price and keep the gap somewhatsimilar, you won’t sell any of” the less featured model.217 Consistent with these statements, 20 of 20responding purchasers reported that the availability of a highly featured LRW at a low price affects thesales of less highly featured LRWs.218
VI. MATERIAL INJURY BY REASON OF SUBJECT IMPORTS
A. Legal Standard
In the final phase of antidumping and countervailing duty investigations, the Commissiondetermines whether an industry in the United States is materially injured or threatened with material injury by reason of the imports under investigation.219 In making this determination, the Commissionmust consider the volume of subject imports, their effect on prices for the domestic like product, and theirimpact on domestic producers of the domestic like product, but only in the context of U.S. productionoperations.220 The statute defines “material injury” as “harm which is not inconsequential, immaterial, or
213 See Petitioner’s Responses to Commissioner Questions at II-16; Hearing Tr. at 210 (Dexter). 214 See section II.D, above. 215 CR at II-18; PR at II-11; see also Samsung Postconference Brief at 1, 20. ***” CR at VI-15; PR at VI-5. 216 Hearing Tr. at 42; see also id. at 118 (Bilas) (“If you deal in the premium products in the higher end of the lineand the price is coming down, that compression affects the entire line, really, from top to bottom . . . .“). 217 Hearing Tr. at 255-56 (Baird). 218 CR at V-13; PR at V-8. 219 19 U.S.C. §§ 1671d(b), 1673d(b). 220 19 U.S.C. § 1677(7)(B)( i). The Commission “may consider such other economic factors as are relevant to thedetermination” but shall “identify each {such} factor ... and explain in full its relevance to the determination.” 19 U.S.C. § 1677(7)(B).
26
unimportant.”221 In assessing whether the domestic industry is materially injured by reason of subjectimports, we consider all relevant economic factors that bear on the state of the industry in the UnitedStates.222 No single factor is dispositive, and all relevant factors are considered “within the context of thebusiness cycle and conditions of competition that are distinctive to the affected industry.”223
Although the statute requires the Commission to determine whether the domestic industry is“materially injured or threatened with material injury by reason of” unfairly traded imports,224 it does notdefine the phrase “by reason of,” indicating that this aspect of the injury analysis is left to theCommission’s reasonable exercise of its discretion.225 In identifying a causal link, if any, between subjectimports and material injury to the domestic industry, the Commission examines the facts of record thatrelate to the significance of the volume and price effects of the subject imports and any impact of thoseimports on the condition of the domestic industry. This evaluation under the “by reason of” standardmust ensure that subject imports are more than a minimal or tangential cause of injury and that there is asufficient causal, not merely a temporal, nexus between subject imports and material injury.226
In many investigations, there are other economic factors at work, some or all of which may alsobe having adverse effects on the domestic industry. Such economic factors might include nonsubjectimports; changes in technology, demand, or consumer tastes; competition among domestic producers; ormanagement decisions by domestic producers. The legislative history explains that the Commission mustexamine factors other than subject imports to ensure that it is not attributing injury from other factors tothe subject imports, thereby inflating an otherwise tangential cause of injury into one that satisfies thestatutory material injury threshold.227 In performing its examination, however, the Commission need not
221 19 U.S.C. § 1677(7)(A). 222 19 U.S.C. § 1677(7)(C)(iii). 223 19 U.S.C. § 1677(7)(C)(iii). 224 19 U.S.C. §§ 1671d(a), 1673d(a). 225 Angus Chemical Co. v. United States, 140 F.3d 1478, 1484-85 (Fed. Cir. 1998) (“{T}he statute does not‘compel the commissioners’ to employ {a particular methodology}.”), aff’d, 944 F. Supp. 943, 951 (Ct. Int’l Trade1996). 226 The Federal Circuit, in addressing the causation standard of the statute, observed that “{a}s long as its effectsare not merely incidental, tangential, or trivial, the foreign product sold at less than fair value meets the causationrequirement.” Nippon Steel Corp. v. USITC, 345 F.3d 1379, 1384 (Fed. Cir. 2003). This was further ratified inMittal Steel Point Lisas Ltd. v. United States, 542 F.3d 867, 873 (Fed. Cir. 2008), where the Federal Circuit, quotingGerald Metals, Inc. v. United States, 132 F.3d 716, 722 (Fed. Cir. 1997), stated that “this court requires evidence inthe record ‘to show that the harm occurred “by reason of” the LTFV imports, not by reason of a minimal ortangential contribution to material harm caused by LTFV goods.’” See also Nippon Steel Corp. v. United States,458 F.3d 1345, 1357 (Fed. Cir. 2006); Taiwan Semiconductor Industry Ass’n v. USITC, 266 F.3d 1339, 1345 (Fed.Cir. 2001). 227 SAA at 851-52 (“{T}he Commission must examine other factors to ensure that it is not attributing injury fromother sources to the subject imports.”); S. Rep. 96-249 at 75 (1979) (the Commission “will consider informationwhich indicates that harm is caused by factors other than less-than-fair-value imports.”); H.R. Rep. 96-317 at 47(1979) (“in examining the overall injury being experienced by a domestic industry, the ITC will take into accountevidence presented to it which demonstrates that the harm attributed by the petitioner to the subsidized or dumpedimports is attributable to such other factors;” those factors include “the volume and prices of nonsubsidized importsor imports sold at fair value, contraction in demand or changes in patterns of consumption, trade restrictive practicesof and competition between the foreign and domestic producers, developments in technology and the exportperformance and productivity of the domestic industry”); accord Mittal Steel, 542 F.3d at 877.
27
isolate the injury caused by other factors from injury caused by unfairly traded imports.228 Nor does the“by reason of” standard require that unfairly traded imports be the “principal” cause of injury orcontemplate that injury from unfairly traded imports be weighed against other factors, such as nonsubjectimports, which may be contributing to overall injury to an industry.229 It is clear that the existence ofinjury caused by other factors does not compel a negative determination.230
Assessment of whether material injury to the domestic industry is “by reason of” subject imports“does not require the Commission to address the causation issue in any particular way” as long as “theinjury to the domestic industry can reasonably be attributed to the subject imports” and the Commission“ensure{s} that it is not attributing injury from other sources to the subject imports.”231 232 Indeed, theFederal Circuit has examined and affirmed various Commission methodologies and has disavowed “rigidadherence to a specific formula.”233
228 SAA at 851-52 (“{T}he Commission need not isolate the injury caused by other factors from injury caused byunfair imports.”); Taiwan Semiconductor Industry Ass’n v. USITC, 266 F.3d at 1345 (“{T}he Commission need notisolate the injury caused by other factors from injury caused by unfair imports ... . Rather, the Commission mustexamine other factors to ensure that it is not attributing injury from other sources to the subject imports.” (emphasisin original)); Asociacion de Productores de Salmon y Trucha de Chile AG v. United States, 180 F. Supp. 2d 1360,1375 (Ct. Int’l Trade 2002) (“{t}he Commission is not required to isolate the effects of subject imports from otherfactors contributing to injury” or make “bright-line distinctions” between the effects of subject imports and othercauses.); see also Softwood Lumber from Canada, Invs. Nos. 701-TA-414 and 731-TA-928 (Remand), USITC Pub.3658 at 100-01 (Dec. 2003) (Commission recognized that “{i}f an alleged other factor is found not to have orthreaten to have injurious effects to the domestic industry, i.e., it is not an ‘other causal factor,’ then there is nothingto further examine regarding attribution to injury”), citing Gerald Metals, Inc. v. United States, 132 F.3d 716, 722(Fed. Cir. 1997) (the statute “does not suggest that an importer of LTFV goods can escape countervailing duties byfinding some tangential or minor cause unrelated to the LTFV goods that contributed to the harmful effects ondomestic market prices.”). 229 S. Rep. 96-249 at 74-75; H.R. Rep. 96-317 at 47. 230 See Nippon Steel Corp., 345 F.3d at 1381 (“an affirmative material-injury determination under the statuterequires no more than a substantial-factor showing. That is, the ‘dumping’ need not be the sole or principal cause ofinjury.”). 231 Mittal Steel, 542 F.3d at 877-78; see also id. at 873 (“While the Commission may not enter an affirmativedetermination unless it finds that a domestic industry is materially injured ‘by reason of’ subject imports, theCommission is not required to follow a single methodology for making that determination ... {and has} broaddiscretion with respect to its choice of methodology.”) citing United States Steel Group v. United States, 96 F.3d1352, 1362 (Fed. Cir. 1996) and S. Rep. 96-249 at 75. 232 Commissioner Pinkert does not join this paragraph or the following three paragraphs. He points out that theFederal Circuit, in Bratsk, 444 F.3d 1369, and Mittal Steel, held that the Commission is required, in certaincircumstances when considering present material injury, to undertake a particular kind of analysis of nonsubjectimports, albeit without reliance upon presumptions or rigid fomulas. Mittal Steel explains as follows:
What Bratsk held is that “where commodity products are at issue and fairly traded, price-competitive,nonsubject imports are in the market,” the Commission would not fulfill its obligation to consider animportant aspect of the problem if it failed to consider whether nonsubject or non-LTFV imports wouldhave replaced LTFV subject imports during the period of investigation without a continuing benefit to thedomestic industry. 444 F.3d at 1369. Under those circumstances, Bratsk requires the Commission toconsider whether replacement of the LTFV subject imports might have occurred during the period ofinvestigation, and it requires the Commission to provide an explanation of its conclusion with respect tothat factor.
542 F.3d at 878. 233 Nucor Corp. v. United States, 414 F.3d 1331, 1336, 1341 (Fed. Cir. 2005); see also Mittal Steel, 542 F.3d at879 (“Bratsk did not read into the antidumping statute a Procrustean formula for determining whether a domesticinjury was ‘by reason’ of subject imports.”).
28
The Federal Circuit’s decisions in Gerald Metals, Bratsk, and Mittal Steel all involved caseswhere the relevant “other factor” was the presence in the market of significant volumes of price-competitive nonsubject imports. The Commission interpreted the Federal Circuit’s guidance in Bratsk asrequiring it to apply a particular additional methodology following its finding of material injury in casesinvolving commodity products and a significant market presence of price-competitive nonsubjectimports.234 The additional “replacement/benefit” test looked at whether nonsubject imports might havereplaced subject imports without any benefit to the U.S. industry. The Commission applied that specificadditional test in subsequent cases, including the Carbon and Certain Alloy Steel Wire Rod from Trinidadand Tobago determination that underlies the Mittal Steel litigation.
Mittal Steel clarifies that the Commission’s interpretation of Bratsk was too rigid and makes clearthat the Federal Circuit does not require the Commission to apply an additional test nor any one specificmethodology; instead, the court requires the Commission to have “evidence in the record” to “show thatthe harm occurred ‘by reason of’ the LTFV imports,” and requires that the Commission not attributeinjury from nonsubject imports or other factors to subject imports.235 Accordingly, we do not considerourselves required to apply the replacement/benefit test that was included in Commission opinionssubsequent to Bratsk.
The progression of Gerald Metals, Bratsk, and Mittal Steel clarifies that, in cases involvingcommodity products where price-competitive nonsubject imports are a significant factor in the U.S.market, the Court will require the Commission to give full consideration, with adequate explanation, tonon-attribution issues when it performs its causation analysis.236
The question of whether the material injury threshold for subject imports is satisfiednotwithstanding any injury from other factors is factual, subject to review under the substantial evidencestandard.237 Congress has delegated this factual finding to the Commission because of the agency’sinstitutional expertise in resolving injury issues.238
B. Volume of Subject Imports
Section 771(7)(C)(i) of the Tariff Act provides that the “Commission shall consider whether thevolume of imports of the merchandise, or any increase in that volume, either in absolute terms or relativeto production or consumption in the United States, is significant.”239
We find that the volume and increase in volume of cumulated subject imports from Korea andMexico are significant, both absolutely and relative to apparent U.S. consumption and production, over
234 Mittal Steel, 542 F.3d at 875-79. 235 Mittal Steel, 542 F.3d at 873 (quoting from Gerald Metals, 132 F.3d at 722), 875-79 & n.2 (recognizing theCommission’s alternative interpretation of Bratsk as a reminder to conduct a non-attribution analysis). 236 To that end, after the Federal Circuit issued its decision in Bratsk, the Commission began to present publishedinformation or send out information requests in final phase investigations to producers in nonsubject countries thataccounted for substantial shares of U.S. imports of subject merchandise (if, in fact, there were large nonsubjectimport suppliers). In order to provide a more complete record for the Commission’s causation analysis, theserequests typically seek information on capacity, production, and shipments of the product under investigation in themajor source countries that export to the United States. The Commission plans to continue utilizing published orrequested information in final phase investigations in which there are substantial levels of nonsubject imports. 237 We provide in our respective discussions of volume, price effects, and impact a full analysis of other factorsalleged to have caused any material injury experienced by the domestic industry. 238 Mittal Steel, 542 F.3d at 873; Nippon Steel Corp., 458 F.3d at 1350, citing U.S. Steel Group, 96 F.3d at 1357;S. Rep. 96-249 at 75 (“The determination of the ITC with respect to causation is ... complex and difficult, and is amatter for the judgment of the ITC.”). 239 19 U.S.C. § 1677(7)(C)(i).
29
the period of investigation. In our analysis, we have relied principally on data from 2009 to 2011 becausethe interim 2012 data were affected by the filing of the petition.240 Cumulated subject imports increasedfrom *** units in 2009 to *** units in 2010 before declining to *** units in 2011, a level *** percent
240 In a final phase investigation, the statute requires the Commission to consider whether changes in volume,price effects, or impact are related to the pendency of the investigation. 19 U.S.C. § 1677(7)(I). If the Commissiondetermines that such changes are related to the pendency of the investigation, it has the discretion under the statute toreduce the weight accorded to such information but is not required to do so. Id.
In the final phase of these investigations, Petitioner argues that the Commission should discount post-petition data because the domestic industry’s improved performance in January-June 2012 relative to January-June2011 resulted from the filing of the petition. Petitioner’s Prehearing Brief at 4-5, 81. Respondents argue that thedomestic industry’s improved performance in January-June 2012 relative to January-June 2011 was not due to thepetition, citing a Whirlpool conference call with investors in the third quarter of 2012 in which investors were toldthat the petition had “zero” benefit to Whirlpool in that quarter. Samsung’s Responses to Commissioner Questionsat A-68; LG’s Responses to Commissioner Questions, Exhibit 4 at 4. As further support, they argue that the priceincreases realized in January-June 2012 were announced prior to the petition, and claim that Whirlpool’s U.S.shipments of HE LRWs were lower in January-June 2012 than in January-June 2011. Samsung’s Responses toCommissioner Questions at A-69-70; LG’s Responses to Commissioner Questions, Exhibit 4 at 4-5.
We find that the filing of the petition on December 30, 2011 contributed significantly to the domesticindustry’s improved performance in the January-June 2012 post-petition period and therefore exercise our discretionto discount the weight we accord to data from the period. In particular, the filing of the petition contributed toWhirlpool’s realization of a price increase across its washer line in January 2012. Hearing Tr. at 41 (Fettig). Thefact that LG, Samsung, and Whirlpool announced price increases prior to the petition’s filing does not alter ouranalysis because the benefit of the increases only accrued to the domestic industry upon the realization of the priceincreases in January 2012, after the petition’s filing.
In addition, the volume of subject imports from Korea was significantly lower in January-June 2012 relativeto January-June 2011. Specifically, subject imports from Korea were *** units in January-June 2012, down ***percent from *** units in January-June 2011. CR/PR at Table IV-2. Reduced imports by LG and Samsungaccounted for this development. Due to the preceding changes in subject imports from Korea, cumulated subjectimport U.S. shipments were *** percent lower in January-June 2012 than in January-June 2011. Id. at Table IV-15.
We recognize that a Whirlpool official described the benefit of the petition as “zero” during a conferencecall with investors. LG Posthearing Brief at 13. However, the official was addressing the benefit of both theWashers and Bottom Mount Refrigerator petitions in the third quarter of 2012, which is outside the post-petitionJanuary-June 2012 period relevant to our analysis here. Moreover, the Commission issued negative determinationsin the Bottom Mount Refrigerator investigations in May 2012. USITC Pub. 4318 at 1. The Whirlpool official mayalso have been referring to Whirlpool’s second attempted price increase on washers effective July 2012, whichfailed. See Hearing Tr. at 350 (Levy). Thus, the conference call does not undermine our conclusion that the filing ofthe petition benefitted the domestic industry’s performance during the January-June 2012 period.
We also recognize that the domestic industry’s improved performance in January-June 2012 was due in partto ***. See CR/PR at III-2, Table VI-2. *** would have benefitted from the price increases realized in January2012, as well as the lower volume and higher unit value of cumulated subject imports, no less than other domesticproducers. The record does not support respondents’ argument that ***, was shielded from subject importcompetition. Samsung’s Responses to Commissioner Questions at A-70; LG’s Responses to CommissionerQuestions, Exhibit 4 at 4-5. There is no question that GE’s HETL washers compete directly with subject imports. See Hearing Tr. at 237 (Baird). Nor would *** CTL washers have been insulated from subject import competitionto a significant degree, for the reasons supporting our definition of a domestic like product including top-loadwashers with a capacity of less than 3.7 cubic feet, including cross-shopping between washer types, and our findingthat the prices of larger, more fully featured models affect the sales and prices of smaller, less fully featured models. Indeed, ***. See *** Posthearing Comments at 4; *** Final Comments at 7. Furthermore, the capacity and energyefficiency of GE’s new CTL washers is closer to that of a HETL washer than a traditional CTL washer. See HomeDepot’s Prehearing Brief at 7 (comparing the annual operating cost of a CTL washer, at $50, with the annualoperating cost of a new GE CTL washer, at $24, and a GE HETL washer, at $19).
30
higher than in 2009.241 U.S. shipments of cumulated subject imports increased from *** units in 2009 to*** units in 2010 before declining to *** units in 2011, a level *** percent higher than in 2009.242
U.S. shipments of subject imports as a share of apparent U.S. consumption increased from ***percent in 2009 to *** percent in 2010 before declining to *** percent in 2011, a level *** percentagepoints higher than in 2009.243 The ratio of subject imports to domestic industry production increased from*** percent in 2009 to *** percent in 2010 before declining to *** percent in 2011, a level ***percentage points higher than in 2009.244 Thus, we find the increase in subject import volume to besignificant both in absolute terms and relative to apparent U.S. consumption and domestic industryproduction.245
While we base our finding with regard to volume on the market for all washers, we find furthersupport for our finding that subject import volume was significant in subject import volume trends withinthe HETL and HEFL washer segments. Although we have found that subject import competition affectedall segments of the domestic industry, we recognize that subject imports, comprised of HETL and HEFLwashers, compete most directly with domestically produced HETL washers and HEFL washers. At thehearing, Whirlpool’s Chairman and CEO emphasized the importance of LRWs to Whirlpool’s washersbusiness, stating “that’s where most manufacturers would typically make more profit” and “the viabilityof the overall washer business depends heavily on our ability to have healthy margins from the mid to
241 CR/PR at Table IV-2. Cumulated subject imports were *** units in January-June 2012, down *** percentfrom *** units in January-June 2011. Id. 242 CR/PR at Table IV-15. U.S. shipments of cumulated subject imports were *** units in January-June 2012,down *** percent from *** units in January-June 2011. Id. 243 CR/PR at Table IV-15. U.S. shipments of subject imports accounted for *** percent of apparent U.S.consumption in January-June 2012, down from *** percent in January-June 2011. Id. 244 Compare CR/PR at Table C-6 with id. at Table IV-2. The ratio of subject imports to domestic industryproduction was *** percent in January-June 2012, as in January-June 2011. Id. 245 We are unpersuaded by LG’s argument that the increase in subject import volume was not significant becausethe domestic industry’s loss of *** percentage points of market share between 2009 and 2011 is entirely explainedby Electrolux’s closure of its U.S. production facility, which was not due to subject import competition in its view. LG’s Prehearing Brief at 44. We recognize that Electrolux reports that it decided to close its U.S. production facilityin 2008 for reasons other than subject import competition. Hearing Tr. at 224 (Chambers). Nevertheless, we havefound that circumstances do not warrant the exclusion of Electrolux from the domestic industry as a related partybecause Electrolux’s U.S. operations were not shielded from subject import competition during the period ofinvestigation. Accordingly, the domestic industry’s loss of market share to subject imports was no less significantbecause the loss was sustained by Electrolux.
We are equally unpersuaded by LG’s argument that the increase in subject import volume was notsignificant because the increase occurred primarily at the expense of nonsubject imports. LG’s Prehearing Brief at45. We recognize that between 2009 and 2011, the *** percentage point gain in subject import market sharecoincided with a *** percentage point loss in nonsubject import market share and a *** percentage point loss indomestic industry market share. CR/PR at Table C-6. Yet, Whirlpool accounted for *** percent of the decline innonsubject import volume between 2009 and 2011, as it shifted production of HEFL washer for sale in the U.S.market from Germany and Mexico to the United States. See CR at III-2-3, VII-23 & n.35; PR at III-2, VII-12 &n.35; CR/PR at Tables III-11, IV-2. Thus, a significant portion of nonsubject import market share that subjectimports captured in 2011 is share that would otherwise have gone to Whirlpool’s domestically produced HEFLwashers, as Whirlpool sought to supplant its nonsubject imports of HEFL washers from Germany with domesticallyproduced HEFL washers. See CR/PR at Table III-1.
Finally, we note that we are to consider the significance of subject import volume “either in absolute termsor relative to production or consumption in the United States.” 19 U.S.C. § 1677(7)(C)(i). Respondents do notdispute that the increase in subject import volume was significant in absolute terms.
31
high end of the line in order to mix up, to earn margins, to reinvest in the business.”246 During the periodof investigation, subject imports significantly increased their penetration of the HETL and HEFL washersegments of the U.S. washer market at the direct expense of the domestic industry.
The HETL washer segment was of increasing importance to the domestic industry during theperiod of investigation as the segment drew demand away from CTL washers. Apparent U.S.consumption of HETL washers increased by *** units, or *** percent, between 2009 and 2011, whileapparent U.S. consumption of CTL washers declined by *** units, or *** percent, during the sameperiod.247 Consequently, HETL washers as a share of the domestic industry’s U.S. shipments increasedfrom *** percent in 2009 to *** percent in 2010 and *** percent in 2011, while CTL washers as a shareof the domestic industry’s U.S. shipments declined from *** percent in 2009 to *** percent in 2010 andto *** percent in 2011.248
Yet, the domestic industry’s ability to compensate for declining sales of CTL washers withincreased sales of HETL washers was compromised by subject imports, as they rapidly increased theirpenetration of the HETL washer market during the period of investigation. U.S. shipments of subjectimported HETL washers increased from *** in 2009 to *** units in 2010 and *** units in 2011,representing a *** percent increase over the level in 2010.249 As a share of apparent U.S. consumption ofHETL washers, U.S. shipments of subject imported HETL washers increased from *** in 2009 to ***percent in 2010 and *** percent in 2011.250 Subject imports increased their share of the U.S. HETLwasher market by *** percentage points between 2009 and 2011 at the direct expense of the domesticindustry, whose share of apparent U.S. consumption of HETL washers declined from *** percent in 2009to *** percent in 2010 and *** percent in 2011.251
Subject imports also significantly increased their penetration of the HEFL washer market duringthe period of investigation, at the expense of the domestic industry. Apparent U.S. consumptionincreased from *** units in 2009 to *** units in 2010 before declining to *** units in 2011, a level ***
246 Hearing Tr. at 33-34 (Fettig). 247 CR/PR at Tables C-4, 6, 9. Apparent U.S. consumption of HETL washers was *** units in January-June2012, up from *** units in January-June 2011, while apparent U.S. consumption of CTL washers was *** units inJanuary-June 2012, down from *** units in January-June 2011. Id. 248 CR/PR at Tables C-4, 6, 9. HETL washers accounted for *** percent of the domestic industry’s U.S.shipments in January-June 2012, up from *** percent in January-June 2011. Id. at Tables C-6, 9. CTL washersaccounted for *** percent of the domestic industry’s U.S. shipments in January-June 2012, up from *** percent inJanuary-June 2011. Id. at Tables C-4, 6. 249 CR/PR at Table C-3. Subject import U.S. shipments of HETL washers were *** units in January-June 2012,up from *** units in January-June 2011. Id. 250 CR/PR at Tables C-3, C-9. Subject import U.S. shipments of HETL washers as a share of apparent U.S.consumption of HETL washers was *** percent in January-June 2012, up from *** percent in January-June 2011. Id. 251 CR/PR at Table C-9. The domestic industry’s share of apparent U.S. consumption of HETL washers was ***percent in January-June 2012, down from *** percent in January-June 2011. Id. ***. See CR/PR at Table C-5. Wealso note that these data include *** in January-June 2012, which competed with subject imported HETL washersfor the reasons discussed in section VI.B, above.
We are unpersuaded by respondents’ argument that the domestic industry’s increased U.S. shipments ofHETL washers during the period of investigation mitigated the significance of increased subject imports of HETLwashers. See Samsung’s Prehearing Brief at 48-49; CR/PR at Table C-9. The domestic industry lost *** percentagepoints of market share to subject imports between 2009 and 2011 with respect to HETL washers. See CR/PR atTables C-3, C-9. As discussed below, the subject imports depressed and suppressed U.S. prices, which affecteddomestic producers’ pricing and profits throughout the entire washers market such that increased shipments in onesegment did not mitigate the industry’s injury.
32
percent lower than in 2009.252 U.S. shipments of subject imported HEFL washers, however, were only*** percent lower in 2011 as compared to 2009, having increased from *** units in 2009 to *** units in2010 before declining to *** units in 2011.253 Accordingly, subject imports as a share of U.S. HEFLwasher consumption increased from *** percent in 2009 to *** percent in 2010 before declining to ***percent, a level *** percentage points higher than in 2009.254 At the same time, the domestic industry’sU.S. shipments of HEFL washers as a share of apparent U.S. consumption of HEFL washers declinedfrom *** percent in 2009 to *** percent in 2010 before increasing to *** percent in 2011, a level ***percentage points lower than in 2009.255
While the domestic industry lost only *** percentage points in market share, we find theincreased subject import penetration of the HEFL washer segment to be significant for two reasons. First,we find that the significant increase in subject import volume and market share between 2009 and 2010meaningfully contributed to Bosch’s decision to close its U.S. HEFL washer production facility in May2011.256
252 CR/PR at Table C-2. Apparent U.S. consumption was *** units in January-June 2012, down from *** units inJanuary-June 2011. Id. 253 CR/PR at Table C-2. U.S. shipments of subject imported HEFL washers were *** units in January-June2012, down from *** units in January-June 2011. Id. 254 CR/PR at Table C-2. Subject imports as a share of apparent U.S. HEFL washer consumption were *** percentin January-June 2012, up from *** percent in January-June 2011. Id. 255 CR/PR at Table C-2. The domestic industry’s U.S. shipments of HEFL washers as a share of apparent U.S.consumption of HEFL washers was *** percent in January-June 2012, down from *** percent in January-June 2011. Id. 256 See Hearing Tr. at 47-48 (Bosshard) (“BSH was forced to close its front-load production plant in May 2011 asa result of competition from low-priced washers, including in particular imports from LG and Samsung”). Boschmade the decision to close its U.S. factory in 2010 and the closure was completed in May 2011. Id. As furtherconfirmation that subject imports contributed to Bosch’s exit from the U.S. market, the Department of Laborcertification of Bosch’s U.S. workers for trade adjustment assistance (“TAA”) states that the statutory criteria forTAA were satisfied in part because “imports of articles like or directly competitive with laundry washers and dryersby BSH Appliances New Bern have increased,” based on “a survey of the subject firm’s major customers regardingtheir purchases of laundry washers and dryers during the relevant period” that “revealed increased customer”imports. Petitioner’s Posthearing Brief at Exhibit 7. The certification also states that “the increased imports oflaundry washers and dryers by the customer of BSH Appliances New Bern contributed importantly to the workergroup separations and sales/production declines at BSH Appliances New Bern.“ Id. Contemporaneous with Bosch’sclosure of its U.S. facility, an official of Bosch’s parent company BSH stated that Bosch’s U.S. factory was closed“[d]ue to the extremely aggressive competition, which led to a steep fall in prices . . . .” Petitioner’s PosthearingBrief at Exhibit 9.
We are unpersuaded by respondents’ argument that Bosch closed its U.S. factory for reasons other thansubject import competition, including allegedly uncompetitive products and production inefficiencies. SeeSamsung’s Prehearing Brief at 68-69; LG’s Prehearing Brief at 75-76. Consumer Reports ranked Bosch’s HEFLwashers as among the ten best HEFL washers models reviewed in several rankings published in 2009. SeePetitioner’s Posthearing Brief at Exhibit 21. ***.” Petitioner’s Posthearing Brief at Exhibit 10; see also Hearing Tr.at 43 (Bilas), 132 (Bosshard), 133-34 (Schmidt), 243 (Baird). The alleged inefficiency of Bosch’s domesticoperations was exacerbated by subject import competition, and there is no evidence that Bosch’s domestic operationswere intrinsically unviable. See Hearing Tr. at 47 (Bosshard) (“Without question, the North Carolina productionfacility was one of the most modern, lean and cost-effective washer production platforms in the world. The plantwas right-sized to operate according to the highest manufacturing efficiency standards, and any suggestion to thecontrary is without foundation.”).
We are equally unpersuaded by respondents’ argument that the Commission cannot attribute the closure ofBosch’s U.S. factory to subject imports because Bosch’s domestically produced HEFL washers also competed with***. See LG’s Prehearing Brief at 75-76. The record shows that Bosch faced more intense competition from subject
33
Second, the elevated market share of subject imported HEFL washers in 2011 contributed toWhirlpool’s inability to capitalize on its domestically produced HEFL washers, which were introduced in2010.257 Whirlpool invested $100 million to shift production of HEFL washers for the U.S. market fromits facilities in Germany and Mexico to its washer facility in Clyde, Ohio.258 As discussed below, we findthat *** resulted from subject import competition.
We conclude that the volume of cumulated subject imports and the increase in that volume aresignificant both in absolute terms and relative to consumption and production in the United States.
C. Price Effects of the Subject Imports
Section 771(7)(C)(ii) of the Tariff Act provides that, in evaluating the price effects of subjectimports,
the Commission shall consider whether – (I) there has been significant price undersellingby the imported merchandise as compared with the price of domestic like products of theUnited States, and (II) the effect of imports of such merchandise otherwise depressesprices to a significant degree or prevents price increases, which otherwise would haveoccurred, to a significant degree.259
As addressed in section V.D above, the record indicates that there is a moderately high degree ofsubstitutability in demand between subject imports and the domestic like product and that price is animportant consideration in purchasing decisions.
Two domestic producers and five importers of subject merchandise from Korea and Mexicoprovided usable quarterly net U.S. f.o.b. selling price data for 11 LRW products, although not all firmsreported pricing for all products for all quarters.260 The Commission collected pricing data net of bothdirect and indirect discounts.261 Reported pricing data accounted for approximately *** percent of U.S.producers’ U.S. shipments of washers, *** percent of U.S. shipments of subject imports from Korea, and*** percent of U.S. shipments of subject imports from Mexico in 2011.262
We reject respondents’ argument that the Commission should disregard Whirlpool’s reportedpricing and discount data because of alleged discrepancies in these data.263 Respondents conveyed their
imports from Korea. See CR/PR at Tables ***; Hearing Tr. at 47-48 (Bosshard). 257 CR at III-2-3; PR at III-2. 258 CR at III-2-3; PR at III-2. 259 19 U.S.C. § 1677(7)(C)(ii). 260 CR at V-21; PR at V-11. 261 CR at V-21; PR at V-11. 262 CR at V-21; PR at V-11; CR/PR at Tables IV-15, C-6. 263 Samsung’s Prehearing Brief at 59; LG’s Prehearing Brief, Exhibit 8; LG’s Posthearing Brief at 4; Electrolux’sPosthearing Brief at 1-3. We also reject respondents’ claim that Whirlpool misreported sales of ***. Respondentsdo not dispute that Whirlpool reported pricing data for *** with respect to sales of *** models that were certified bythe DOE as possessing a capacity of *** cubic feet or more, and advertised as such, at the time the sales were made. See Samsung’s Prehearing Brief at 66. The DOE certified capacity of these models fell below *** cubic feet only inApril 2011, when the DOE changed its methodology for calculating capacity. Petitioner’s Responses toCommissioner Questions at II-38; LG’s Prehearing Brief at Exhibit 8. We rely on pricing data reported on the basisof capacity as certified by the DOE and advertised at the time sales were made because that is the capacity thatwould have influenced purchasing decisions.
For the same reason, we reject respondents’ claim that Bosch misreported sales of ***. See Samsung’sPrehearing Brief at 68; Electrolux’s Prehearing Brief at 43. The record shows that Bosch reported its pricing data in
34
specific concerns with Whirlpool’s pricing and discount data to Commission staff on November 20, 2012,and these concerns were a focus of the verification of Whirlpool’s domestic producers’ questionnaireresponse conducted on November 27-29, 2012.264 As indicated in the verification report, Whirlpool’sreported “[f]inancial, trade, and pricing data were verified and reconciled.”265 In particular, the reportstates that “[s]ales quantities and values, including direct and indirect discounts for all products selected,agreed and reconciled with the SAP database.”266 Furthermore, the pattern of underselling exhibited bythe pricing data is consistent with other evidence, including responding purchaser comparisons of subjectimports and the domestic like product with respect to “direct discounts offered” and “price.”267 Wetherefore find Whirlpool’s reported pricing and discount data credible and reliable.268
Between 2009 and 2011, subject imports undersold domestically produced LRWs in *** of ***quarterly comparisons, or *** percent of the time, at margins ranging from *** to *** percent and
accordance with the rated capacity of its LRWs at the time the sales were made, based on descriptions of its productsfrom the DOE. CR at V-21 n.37; PR at V-11 n.37. In this regard, we note that until recently, HEFL washer capacitywas rated according to the European IEC standard, which resulted in higher capacity ratings than would have beenthe case under the DOE standard. See Home Depot’s Prehearing Brief at 5. 264 See Telephone Notes of John Benedetto, November 21, 2012. 265 Verification Report at 2. 266 Verification Report at 7. Whirlpool uses a computerized accounting and planning system, System Analysisand Program Development (“SAP”), which integrates financial and accounting records, purchasing and billing,including sales data, production operations, and planning. Id. at 3. Petitioner has explained the sources of thevarious discrepancies identified by respondents, including a programming error that caused the FOB values reportedin the preliminary phase to be understated by the amount of direct discounts. See Petitioner’s Responses toCommissioner Questions at II-30-37. The verification report states that “[c]ertain discount data were revised tocorrect some errors and total value of direct and indirect discounts data were updates and submitted during and afterthe verification.” Verification Report at 7. 267 See CR/PR at Tables II-6, V-5; see also CR at V-62-63; PR at V-15. Comparing the domestic like product tosubject imports from Korea, 6 of 16 responding purchasers reported the domestic like product inferior with respect to“direct discounts offered” and 4 of 10 responding purchasers reported the domestic like product inferior with respectto “price” (i.e., higher priced). Id. at Table II-6. Only one responding purchaser reported domestically producedLRWs superior in terms of “price” and none reported that they were superior in terms of “direct discounts offered.” Id. Comparing the domestic like product to subject imports from Mexico, 5 of 15 responding purchasers reportedthe domestic like product inferior with respect to “direct discounts offered” and 6 of 14 responding purchasersreported the domestic like product inferior with respect to “price.” Id. None reported that domestically producedLRWs were superior in terms of either factor. Id. 268 See Hearing Tr. at 23 (Fettig) (“Whirlpool has not manipulated data in any of this investigation.”). We rejectLG’s invitation for the Commission to analyze subject import price effects using trade data or data concerning retailprices from Stevenson/Traqline. See LG’s Prehearing Brief at 55; LG’s Posthearing Brief at 4, Exhibit 14. We donot rely on average unit value data for purposes of our pricing analysis because these data are influencedsignificantly by changes in product mix, even within washer segments. See CR/PR at Table V-17. By contrast, ourpricing data covers a significant proportion of U.S. shipments of both subject imports and the domestic like product,CR at V-21; PR at V-11, and permit apples-to-apples price comparisons based on specifically defined LRW models. CR at V-19; PR at V-9-10. We do not rely on retail pricing data because the level of trade relevant to our analysis issales by domestic producers and importers to retailers and distributors, not sales by retailers to consumers. Moreover, the coverage and inclusivity of the retail price data provided by LG are unclear.
35
averaging *** percent.269 Subject imports oversold the domestic like product in *** quarterlycomparisons.270 We find subject import underselling to be significant.271
We find that pervasive subject import underselling depressed domestic like product prices to asignificant degree. Domestic producer sales prices for products 3, 4, 5, 6, 7, and 8 declined between thefirst and last quarters for which data were collected over the 2009-2011 period.272 These six products
269 CR/PR at Tables V-6-16, 18. Including the first two quarters of 2012, subject imports undersold domesticallyproduced LRWs in 99 of 110 quarterly comparisons. Id. at Table V-18. 270 CR/PR at Tables V-6-16, 18. Including the first two quarters of 2012, subject imports oversold domesticallyproduced LRWs in 11 of 110 quarterly comparisons. Id. at Table V-18. 271 We are unpersuaded by respondents’ argument that subject import underselling could not have been significantwith respect to products *** because ***. See Samsung’s Prehearing Brief at 67; LG’s Prehearing Brief at 60-61,64. In the 19 quarterly comparisons in which subject imports from Mexico undersold the domestic like product withrespect to products ***, subject imports from Korea also undersold the domestic like product. See CR/PR at TablesV-8, 11. In *** of those quarterly comparisons, the volume of subject imports from Korea that undersold thedomestic like product was *** to *** times larger (on average, *** times larger) than the volume of subject importsfrom Mexico that undersold the domestic like product. See id.
We are also unpersuaded by LG’s argument that subject import underselling with respect to product ***should be discounted as reflecting ***, which LG contends are always lower than branded sale prices. LG’sPrehearing Brief at 64-65. The Commission did not distinguish pricing data on OEM sales from pricing data onbranded sales in the Refrigerators investigations, notwithstanding significant sales by Sears under its Kenmorebrand, see USITC Pub. 4318 at 15, 33-35, and no party requested that we do so here in comments on the draftquestionnaires. See Respondents’ Joint Comments on the Draft Questionnaires. In any event, excluding product*** would not alter our conclusion that subject import underselling is significant, however, because subject importsundersold the domestic like product in *** of *** quarterly comparisons with respect to other products during the2009-11 period. CR/PR at Tables V-6-16. We find further evidence that subject imports adversely affecteddomestic like product prices in ***, as discussed below. 272 CR/PR at Tables V-8-13. We are unpersuaded by respondents’ argument that these price declines largelyreflected the influence of life cycle pricing, as domestically produced LRWs near the end of their life cycles werediscounted. See Samsung’s Prehearing Brief at 62-65; LG’s Prehearing Brief at 53. In the preliminary phase ofthese investigations, the Commission sought to control for life cycle pricing by requesting that domestic producersand importers report pricing data with respect to A products, covering all sales, and B products, covering only thehighest-selling SKU in each quarter. See USITC Pub. 4306 at 25. The B product data would have controlled forlife-cycle pricing because, under that theory, the highest-selling models should be at the height of their life cycleswhile lower-selling models would include models being discounted at the end of their life cycles. WhenCommission staff circulated the draft questionnaire to the parties for comment in the final phase, it specifically askedthe parties whether the questionnaires should continue to request pricing data on B products or else eliminate the Bpricing product tables and instead collect data on additional pricing products. In joint comments, respondents urgedthe Commission staff “to eliminate the ‘B’ pricing product tables” because “the ‘B’ product data . . . did not yieldpreliminary phase results that were appreciably different from the results obtained from the ‘A’ product data.” Respondents’ Joint Comments on the Draft Questionnaires, at 2-3. We find respondents’ life cycle argument at oddswith their comments on the draft questionnaires, as well as the similarity in the pricing data collected for A and Bproducts in the preliminary phase of the investigations. See Preliminary Views, Confidential Staff Report at TablesV-16, 18. Moreover, because our pricing data are weight averaged by volume, LRW models sold in higher volumeswould influence average quarterly sales prices more than LRW models sold in lower volumes.
Respondents’ life cycle argument also conflicts with other record evidence. Unlike consumer electronics,the cost of producing major appliances with a specific set of features does not decline over a short period of time dueto technological advancement or other productivity enhancing factors. See Refrigerators, USITC Pub. 4318 at E-3;Hearing Tr. at 107-8 (Fettig). Because raw material prices accounted for nearly *** percent of the domesticindustry’s cost of goods sold during the 2009-11 period, and such costs increased significantly during that time, CRat V-1-2; PR at V-1-2; CR/PR at Figure V-1, producers would have had little flexibility to reduce washer pricesduring the period on anything other than a temporary, promotional basis, contrary to respondents’ argument that
36
accounted for *** percent of the sales volume reported by domestic producers for all pricing productsduring the period.273 We also find it significant that domestic producer sales prices declined with respectto all HETL washers for which data were collected, including products 4, 5, 7, and 8, notwithstanding the*** percent increase in apparent U.S. consumption of HETL washers between 2009 and 2011.274 Although reported domestic sales prices increased with respect to products 1, 9, 10, and 11, we note thatthese products *** and ***, as discussed below.275
We also find that pervasive subject import underselling suppressed domestic like product priceincreases that otherwise would have occurred to a significant degree. Raw materials accounted forbetween *** and *** percent of the domestic industry’s total cost of goods sold during the 2009-11period, and the cost of most inputs, including cold-rolled steel and stainless steel sheet, rose by 30 percentor more over that time.276 Nevertheless, from 2009 to 2011, the domestic industry was unable to passincreased raw material costs on through higher prices.277 Instead, the industry’s ratio of cost of goods
prices decline steadily over a model’s life cycle. Nor is there evidence that producers and importers would need toreduce prices on particular washer models over time due to styling or aesthetic considerations, particularly givenevidence that consumers place less of an emphasis on style and aesthetics when purchasing washers than whenpurchasing other appliances displayed more prominently in the home, such as refrigerators. See section V.D above;compare Refrigerators, USITC Pub. 4318 at 16-17. Moreover, respondents’ purported evidence of life cycle pricing,consisting of the retail price trends of specific washer models selected by respondents, is inconclusive. See LG’sPrehearing Brief at 53-55, Exhibit 24; Hearing Tr. at 231-32 (Klett). The level of trade relevant to our pricinganalysis is sales by domestic producers and importers to distributors and retailers, not sales by retailers to consumers,and there is no evidence that the retail price data selected by respondents are representative of domestic producer andimporter pricing practices generally. Nor is there evidence that the price trends cited by respondents are the result oflife cycle pricing rather than other factors, such as subject import competition. Other pricing data on the record areinconsistent with respondents’ life cycle argument. See Petitioner’s Responses to Commissioner Questions at II-82-83, Exhibit 24. 273 CR/PR at Tables V-6-16. 274 CR/PR at Table C-9. Contrary to respondents’ argument, the decline in domestic producer prices on sales ofproduct 4 coincided with subject import competition. LG’s Prehearing Brief at 61; see also Samsung’s PrehearingBrief at 63. Domestic producer prices on sales of product 4 increased irregularly between the first quarter of 2009and the first quarter of 2010 but began to decline when subject import sales of product 5, defined to encompassHETL washers with a larger capacity and more features than product 4, commenced in the second quarter of 2010 ata price similar to that of domestically produced product 4. Compare CR/PR at Table V-9 with id. at Table V-10. Domestic producer prices on sales of product 4 declined still further after subject import sales of product 4commenced in the second quarter of 2011, at substantial underselling margins. See CR/PR at Table V-9. Domesticproducer prices on sales of product 5 and 7 exhibited a similar trend, with prices increasing irregularly until theintroduction of competing subject imported products, after which domestic producer prices declined irregularly inthe face of subject import underselling. See CR/PR at Tables V-10, 12. 275 CR/PR at Tables V-6, 14-16. 276 CR at V-1-2; PR at V-1; CR/PR at Figure V-1. 277 CR/PR at Table C-6. We reject Samsung’s argument that there could be no significant price suppressionbecause the domestic industry’s increasing ratio of cost of goods sold to net sales resulted from increased rawmaterial costs. Samsung’s Prehearing Brief at 75. Our analysis of price suppression focuses on whether the effect ofsubject imports is to prevent price increases, which otherwise would have occurred, to a significant degree, as whenan industry is unable to raise prices to cover the cost of goods sold. See 19 U.S.C. § 1677(C)(ii); Nippon Steel Corp.v. United States, 458 F. 3d 1345, 1354 n.4 (Fed. Cir. 2006). Thus, the relevant question for purposes of our analysisis whether subject import competition prevented the industry from raising prices to cover increased costs, not thesource of the increased costs.
37
sold to net sales increased both while demand was improving in 2010 and while demand was declining in2011,278 increasing from *** percent in 2009 to *** percent in 2010 and *** percent in 2011.279 280
While our findings with regard to price suppression are based primarily on an analysis of theentire market for all washers, we find further support for our finding that subject imports suppressed theprices of domestically produced LRWs to a significant degree in the following analysis of the HETLwasher and HEFL washer segments, in which subject import competition was most intense. Despite the*** percent increase in apparent U.S. consumption of HETL washers between 2009 and 2011, thedomestic industry’s ratio of cost of goods sold to net sales with respect to HETL washers increased from*** percent in 2009 to *** percent in 2010 before declining to *** percent in 2011, a level ***percentage points higher than in 2009.281 This decreasing trend was driven primarily by a cost-pricesqueeze in the portion of the domestic industry that competes directly with subject imports, i.e., theportion producing HETL washers with a capacity of 3.7 cubic feet or greater. The ratio of cost of goodssold to net sales for that portion of the domestic industry increased from *** percent in 2009 to ***percent in 2011, even as apparent U.S. consumption of HETL washers increased *** percent during theperiod.282
With respect to HEFL washers, the domestic industry’s ratio of cost of goods sold to net salesincreased from *** percent in 2009 to *** percent in 2010 before declining to *** percent in 2011, alevel *** percentage points higher than in 2009.283 Between 2009 and 2010, the industry’s ratio of cost ofgoods sold to net sales increased *** percentage points notwithstanding a *** percent increase inapparent U.S. consumption of HEFL washers, as subject imports undersold domestically produced HEFLwashers pervasively and captured *** percentage points of market share from the domestic industry.284
The domestic industry’s ratio of cost of goods sold to net sales with respect to HEFL washersremained elevated at *** percent in 2011 because ***. For example, ***.285 Pervasive subject importunderselling prevented *** from increasing its prices sufficiently to cover costs during 2011.286 Demandtrends cannot explain Whirlpool’s inability to price its Alpha HEFL washers so as to cover its costsbecause apparent U.S. consumption of HEFL washers with a capacity of over 3.7 cubic feet, which
278 CR/PR at Table C-6. We note that apparent U.S. consumption of washers in 2011, though down from 2010,was similar to that in 2009. Id. 279 CR/PR at Table C-6. The industry’s ratio of cost of goods sold to net sales was *** percent in January-June2012, down from *** percent in January-June 2011. Id. 280 Commissioner Pinkert’s finding of significant price suppression is further supported by the relatively lowelasticity of demand for LRWs, most of which are sold for replacement purposes. CR at II-36; PR at II-21-22. 281 CR/PR at Table C-9. The domestic industry’s ratio of cost of goods sold to net sales with respect to HETLwashers was *** percent in January-June 2012, up from *** percent in January-June 2011. Id. 282 CR/PR at Table C-3. By contrast, the domestic industry’s ratio of cost of goods to net sales with respect toHETL washers with a capacity of less than 3.7 cubic feet declined from *** percent in 2009 to *** percent in 2011. Id. at Table C-5. The domestic industry’s ratio of cost of goods sold to net sales with respect to HETL washers was*** percent in January-June 2012, up from *** percent in January-June 2011. Id. at Table C-3. 283 CR/PR at Table C-2. The industry’s ratio of cost of goods sold to net sales with respect to HEFL washers was*** percent in January-June 2012, down from *** percent in January-June 2011. Id. 284 CR/PR at Table C-2. 285 Petitioner’s Prehearing Brief at 59-60, Attachments 2, 4-B-C, M. 286 See CR/PR at Tables V-6, 14-16. Domestic producer sales data reported for products 1, 9, 10, and 11 ***. CR at V-19, 21; PR at V-9-11. Subject imports undersold domestically produced LRWs with respect to theseproducts in *** of *** quarterly comparisons through the end of 2011. Id.
38
encompass Whirlpool’s 4.2 cubic foot HEFL washers, *** between 2009 and 2011, from *** units in2009 to *** units in 2011.287
We find additional evidence that low-priced subject import competition adversely impactedprices for the domestic like product in the significant number and magnitude of confirmed lost sales andrevenue allegations made by Whirlpool.288 Responding to lost sales and revenue allegations raised in thefinal phase of these investigations, responding purchasers confirmed lost revenue allegations totaling$*** and lost sales allegations totaling $***.289
In the preliminary phase of the investigations, ***.290 ***.291 ***.292 ***293***.294 ***.295 Whirlpool estimates that the loss of these contracts resulted in lost revenue of approximately $***, $***,and $*** over the lives of the respective contracts.296 These confirmed lost sales allegations providefurther support for our finding that the subject imports had significant adverse effects on prices for thedomestic like product.
D. Impact of the Subject Imports297
Section 771(7)(C)(iii) of the Tariff Act provides that the Commission, in examining the impact ofthe subject imports on the domestic industry, “shall evaluate all relevant economic factors which have abearing on the state of the industry.”298 These factors include output, sales, inventories, capacityutilization, market share, employment, wages, productivity, profits, cash flow, return on investment,ability to raise capital, research and development, and factors affecting domestic prices. No single factor
287 CR/PR at Tables III-5, IV-3-5. 288 See CR/PR at Tables V-19-21. We place no weight on lost revenue allegations concerning Whirlpool’sunsuccessful attempt to raise washer prices in July 2012. CR at V-48; PR at V-15. Whirlpool’s price increaseannouncement in April 2012 was unusual in that it closely followed the price increases Whirlpool realized in January2012. Home Depot’s Posthearing Brief at 1-2. For this reason, we cannot conclude that Whirlpool’s inability torealize its second price increase announcement was due to subject import competition. 289 CR/PR at Tables V-19-20. 290 CR/PR at Table V-21. 291 CR at V-62; PR at V-15; CR/PR at Table V-21; *** December 21, 2012 Letter. 292 CR at V-62; PR at V-15. 293 See LG’s Responses to Commissioner Questions, Exhibit 3 at 12-15; LG’s Final Comments at 1-4. 294 CR at V-61-62; PR at V-15. 295 See Petitioner’s Prehearing Brief at Attachment 4-E. 296 CR/PR at Table V-21. While *** disputed the magnitude of the lost sales alleged by Whirlpool on thegrounds that it could not predict how well Whirlpool’s models would have sold at retail, we find that these lost saleswere quite large by industry standards even if *** ultimately might have purchased less than the projected volumes. 297 In its final determinations, Commerce calculated weight-average dumping margins of 9.29 to 82.41 percent forLRWs from Korea and 36.52 to 72.41 percent for LRWs from Mexico. See Notice of Final Determinations of Salesat Less Than Fair Value: Large Residential Washers from the Republic of Korea, 77 Fed. Reg. 75,988 (Dec. 26,2012); Notice of Final Determinations of Sales at Less Than Fair Value: Large Residential Washers from Mexico,77 Fed. Reg. 76,288 (Dec. 27, 2012). 298 19 U.S.C. § 1677(7)(C)(iii); see also SAA at 851 and 885 (“In material injury determinations, the Commissionconsiders, in addition to imports, other factors that may be contributing to overall injury. While these factors, insome cases, may account for the injury to the domestic industry, they also may demonstrate that an industry is facingdifficulties from a variety of sources and is vulnerable to dumped or subsidized imports.”).
39
is dispositive and all relevant factors are considered “within the context of the business cycle andconditions of competition that are distinctive to the affected industry.”299
The domestic industry’s performance deteriorated between 2009 and 2011 according to mostmeasures.300 Electrolux, Bosch, and Fisher & Paykel shuttered their U.S. washer production facilitiesduring the period of investigation,301 and the record shows that ***.302
Domestic industry capacity increased between 2009 and 2011 due to Whirlpool’s decision to shiftproduction of HEFL washers from Germany and Mexico to the United States beginning in 2010 andBosch’s and Electrolux’s maintenance of domestic production facilities into 2011, when both wereclosed,303 but the domestic industry’s production and capacity utilization declined.304 The industry’scapacity increased from *** units in 2009 to *** units in 2010, but declined to *** units in 2011, a level*** percent higher than in 2009.305 The industry’s production increased from *** units in 2009 to ***units in 2010 but declined to *** units in 2011, a level *** percent lower than in 2009.306 The industry’scapacity utilization declined from *** percent in 2009 to *** percent in 2010 and *** percent in 2011, alevel *** percentage points lower than 2009.307
Domestic industry employment was much lower in 2011 than in 2009, reflecting layoffs byBosch and Electrolux in 2011.308 Specifically, the domestic industry’s average number of production andrelated workers (“PRWs”) increased from *** PRWs in 2009 to *** PRWs in 2010 but declined to ***PRWs in 2011, a level *** percent lower than 2009.309 Hours worked and wages paid fluctuated over theperiod.310
Although apparent U.S. consumption increased *** percent between 2009 and 2010 and was only*** percent lower in 2011 as compared to 2009, the domestic industry’s U.S. shipments declinedthroughout the period, as the industry lost market share to subject imports. The industry’s U.S. shipmentsdeclined *** percent over the period, from *** units in 2009 to *** units in 2010 and *** units in2011.311 The industry’s U.S. shipments as a share of apparent U.S. consumption declined from ***
299 19 U.S.C. § 1677(7)(C)(iii); see also SAA at 851, 885; Live Cattle from Canada and Mexico, Invs. Nos. 701-TA-386, 731-TA-812-813 (Preliminary), USITC Pub. 3155 at 25 n.148 (Feb. 1999). 300 See, CR/PR at Table C-6. 301 CR at III-1 n.1, III-2; PR at III-1 n.1, III-2. 302 See section VI.B, above. 303 CR at III-2-3; PR at III-1-2. 304 CR/PR at Table C-6. 305 CR/PR at Table C-6. The industry’s capacity was *** units in January-June 2012, down from *** in January-June 2011, reflecting the closure of Bosch’s and Electrolux’s domestic production facilities. Id. 306 CR/PR at Table C-6. The industry’s production was flat at around *** units over the interim periods. Id. 307 CR/PR at Table C-6. The industry’s rate of capacity utilization was *** percent in January-June 2012, upfrom *** percent in January-June 2011. Id. 308 CR at III-14; PR at III-6. 309 CR/PR at Table C-6. The industry’s average number of PRWs was *** in January-June 2012, down from ***in January-June 2011. Id. 310 CR/PR at Table C-6. The industry’s hours worked increased from *** hours in 2009 to *** hours in 2010 butdeclined to *** hours in 2011. Id. The industry’s wages paid increased from $*** in 2009 to $*** in 2010 butdeclined to $*** in 2011. Id. The industry’s hours worked were *** in January-June 2012, down from *** inJanuary-June 2011. Id. Its wages paid were $*** in January-June 2012, compared to $*** in January-June 2011. Id. 311 CR/PR at Table C-6. The industry’s U.S. shipments were *** units in January-June 2012, down from ***units in January-June 2011. Id.
40
percent in 2009 to *** percent in 2010 but increased to *** percent in 2011, a level *** percentage pointslower than 2009.312
The domestic industry’s end-of-period inventory increased from *** units in 2009 to *** units in2010 but declined to *** units in 2011, a level *** percent higher than in 2009.313 The industry’s end-of-period inventory as a share of total shipments increased from *** percent in 2009 to *** percent in 2010but declined to *** percent in 2011, a level *** percentage points higher than in 2009.314
Although the domestic industry’s net sales value increased *** between 2009 and 2011, theindustry’s cost of goods sold increased to a much greater extent, resulting in increasing operating lossesduring the period.315 The industry’s net sales value increased from $*** in 2009 to $*** in 2010 and2011, ending the period *** percent higher than in 2009.316 The industry’s operating loss increased from$*** in 2009, equivalent to *** percent of net sales, to $*** in 2010, equivalent to *** percent of netsales, and $*** in 2011, equivalent to *** percent of net sales.317
We recognize that the domestic industry’s capital and research and development expendituresremained substantial during the 2009-11 period.318 Nevertheless, much of the increase in domesticindustry capital expenditures during the period reflects Whirlpool’s investment to move HEFL washerproduction from Germany and Mexico to the United States, and this investment has generated substantial
312 CR/PR at Table C-6. The industry’s U.S. shipments as a share of apparent U.S. consumption was *** percentin January-June 2012, up from *** percent in January-June 2011. Id. 313 CR/PR at Table C-6. The industry’s end-of-period inventory was *** units in January-June 2012, down from*** units in January-June 2011. Id. 314 CR/PR at Table C-6. The industry’s end-of-period inventory as a share of total shipments was *** percent inJanuary-June 2012, down from *** percent in January-June 2011. Id. 315 See CR/PR at Table C-6. The industry’s cost of goods sold increased from $*** in 2009 to $*** in 2010 and$*** in 2011, a level *** percent higher than in 2009. They were flat at around $*** over the interim periods. Id. The industry’s sales, general, and administrative expenses were flat at around $*** during the 2009-11 period andwere $*** in January-June 2012, down from $*** in January-June 2011. Id. 316 CR/PR at Table C-6. The industry’s net sales value was flat at $*** over the interim periods. Id. Theindustry’s increased net sales value resulted in part from the declining proportion of lower value CTL washers as ashare of domestic industry shipments during the period. CTL washers as a share of the domestic industry’s U.S.shipments declined from *** percent in 2009 to *** percent in 2010 and *** percent in 2011. CR/PR at Tables C-4,6. They were *** percent of shipments in January-June 2012, up from *** percent in January-June 2011. Id. Thus,we find that the industry’s increased net sales value, and unit sales value, between 2009 and 2011 does not conflictwith our finding that subject imports depressed domestic like product prices to a significant degree. 317 CR/PR at Table C-6. The industry’s operating income was positive $*** in January-June 2012, equivalent to*** percent of net sales, compared to a loss of $*** in January-June 2011, equivalent to *** percent of net sales. Id.
The domestic industry’s return on assets, on which data are limited to LRW operations, improved from anegative *** percent in 2009 to a negative *** percent in 2010 but declined to a negative *** percent in 2011. CR/PR at Table VI-7. 318 The domestic industry’s capital expenditures increased from $*** in 2009 to $*** in 2010 but declined to$*** in 2011, a level *** percent higher than in 2009. CR/PR at Table C-6. The industry’s capital expenditureswere $*** in January-June 2012, up from $*** in January-June 2011. Id.
Domestic industry R&D expenses, on which data are limited to LRW operations, declined from $*** in2009 to $*** in 2010 but increased to $*** in 2011. CR/PR at Table VI-5. The industry’s R&D expenditures onLRWs were $*** in January-June 2012, up from $*** in January-June 2011. Id.
41
financial losses for Whirlpool.319 The increase also reflects GE’s investment in a new U.S. facility toproduce HETL and CTL LRWs, and ***.320
We find that there is a causal nexus between subject imports and the weak and deterioratingcondition of the domestic industry during the 2009-11 period.321 322 Subject import volume increasedsignificantly in absolute terms and as a share of apparent U.S. consumption and domestic industryproduction, capturing *** percentage points of market share from the domestic industry during theperiod. Subject import underselling was significant, and low-priced subject import competition depressedand suppressed domestic like product prices to a significant degree. In addition, low-priced subjectimport competition resulted in a significant volume and value of lost sales to the domestic industry.
We reject respondents’ argument that subject import competition was significantly attenuatedbecause a large proportion of domestic industry production consisted of CTL washers, of which therewere no subject imports.323 The proportion of the domestic industry’s U.S. shipments that competed
319 CR at III-2-3, VI-12; PR at III-2, VI-4. 320 CR at III-2, VI-12, 15; PR at III-2, VI-4-5; see also GE’s Posthearing Comments at 3-4. 321 We do not agree with respondents’ argument that Whirlpool’s deferred Energy Efficient Appliance FederalTax Credits were the equivalent of cash and offset negative operating income margins. See Samsung’s PrehearingBrief at 107-11; Samsung’s Responses to Commissioner Questions at A-28; LG’s Responses to CommissionerQuestions at A-28-32. Whirlpool could not use the tax credits it earned on washers because it suffered net lossesduring the period of investigation, and therefore moved the credits to its deferred asset account. Hearing Tr. at 65(Fettig); CR at VI-5 n.4, VI-12 & n.11; PR at VI-2 n.4, VI-3 & n.11. Even if the credits could have been used, theywould only be applied to the industry’s net income after taxes and would not affect the operating income level datathat we typically rely on when performing our injury and causation analysis. CR at VI-12 n.11; PR at VI-3 n.11. Moreover, the record does not contain evidence that tax credits influenced the domestic industry’s pricing orinvestment decisions. See Hearing Tr. at 64-65, 81-82 (Fettig), 84-85 (Tubman), 257 (Chambers) (when asked byCommissioner Pearson whether tax credits had “some influence investment decisions, on production or marketingdecisions,” Mr. Chambers responded “[n]ot that I’m aware of”), 257-58 (Hawrenko). 322 Commissioners Pearson and Broadbent note that in the Commission’s determination in Refrigerators, itrejected Samsung’s argument that the Energy Efficient Appliance Federal tax credits were the equivalent of cash andshould be considered an offset to the industry’s operating income margins. USITC Pub. 4318, at 40 n.303. Incoming to this conclusion, the Commission noted that Whirlpool had not been able to avail itself of any tax benefitfrom those credits during the period of investigation and that, from an accounting standpoint, reduced income taxeswould not directly affect the industry’s operating income. Id. As noted above, Samsung has raised similararguments in the current investigations, and we continue to find that the tax credits in question are not the equivalentof cash and should not be treated as though they directly augment the domestic industry’s operating income.Nevertheless, having received the benefit of briefing on this question in this investigation, we recognize that theaccumulated tax credits earned on the production of eligible washers (26 U.S.C. § 45M(c)), do constitute a tangibleasset carried on Whirlpool’s corporate balance sheet which has a positive economic value to Whirlpool. In a futureinvestigation presenting different factual circumstances, it is conceivable that tax credits or other incentives mighthave a bearing on our analysis and that it would be appropriate to consider them a “relevant economic factor” forpurposes of our injury and causation analysis. 19 U.S.C. § 1677(7)(C)(iii). 323 See LG’s Prehearing Brief at 73; LG’s Posthearing Brief at 12; Samsung’s Prehearing Brief at 45, 91-97. Wealso reject respondents’ argument that the substantial proportion of domestic industry shipments that are exportedserved to attenuate subject import competition to a significant degree. See LG’s Prehearing Brief at 41-42;Electrolux’s Prehearing Brief at 23-24. The domestic industry’s exports as a share of total shipments, althoughsubstantial, fluctuated at around *** percent during the 2009-11 period, increasing from *** percent in 2009 to ***percent in 2010 but declining to *** percent in 2011. CR/PR at Table C-6. They were *** percent in January-June2012, compared to *** percent in January-June 2011. Id. Thus, the vast majority of the domestic industry’s netshipments consisted of U.S. shipments. Moreover, the average unit value of the industry’s exports increasedbetween 2009 and 2011, as did the proportion of exports comprised of higher value LRWs, which should have madea positive contribution to the industry’s financial performance, all else being equal. Compare id. at Table C-6 with
42
directly with subject imports increased significantly between 2009 and 2011 as CTL washers declined asa share of the industry’s U.S. shipments from *** percent in 2009 to *** percent in 2011.324 Theindustry’s shift away from the CTL washer segment, in which demand declined due to a shift in consumerpreferences in favor of HE washers, should have enabled the industry to improve its financialperformance during the 2009-11 period, particularly given the shift in demand toward HETL washers.325
Instead, the industry suffered a significant decline in the profitability of its HETL washer andHEFL washer sales during the period due to subject import competition.326 With respect to the HETLwasher segment, the industry’s operating income as a share of net sales declined from *** percent in 2009to *** percent in 2010 and *** percent in 2011.327 With respect to the HEFL washer segment, theindustry’s operating loss as a share of net sales increased from *** percent in 2009 to *** percent in 2010before improving to *** percent in 2011, a level *** percentage points higher than in 2009.328 Thus, the
id. at Table III-3 (the industry’s exports of LRWs as a share of commercial shipments of LRWs ranged from *** to*** percent during the period of investigation).
We are equally unpersuaded by respondents’ argument that subject import competition was attenuated bydifferences in capacity and color as between subject imports and the domestic like product. See LG’s PrehearingBrief at 42; Samsung’s Prehearing Brief at 45-46; Electrolux’s Prehearing Brief at 36-37. U.S. commercialshipments of subject imports and domestically produced LRWs overlapped significantly in terms of capacity andcolor. Compare CR/PR at Tables III-5, 7, 8, 10 with id. at Tables IV-5, 7, 11, 14. Furthermore, we have found thatthe domestic industry’s sales of CTL washers are not insulated from subject import competition. See sections II.Dand IV.D above. Thus, the fact that domestically produced CTL washers typically possess a capacity of less than 3.7cubic feet, and seldom come with a color finish, would not have significantly attenuated subject import competition. 324 CR/PR at Tables C-4, 6. CTL washers as a share of the industry’s U.S. shipments were *** percent inJanuary-June 2012, up from *** percent in January-June 2011. Id. 325 See CR/PR at Table C-9. 326 We reject respondents’ claim that Whirlpool misallocated its costs on the basis of sales value to make its salesof HETL and HEFL washers appear less profitable. See LG’s Prehearing Brief at 57, 72; Samsung’s PrehearingBrief at 101-2; Electrolux’s Prehearing Brief at 48-9. Whirlpool’s cost allocations were verified and were not basedon sales value. See Verification Report at 3, 5. 327 CR/PR at Table C-9. The industry’s operating income as a share of net sales was *** percent in January-June2012, down from *** percent in January-June 2011. Id. 328 CR/PR at Table C-2. The industry’s operating loss as a share of net sales was *** percent in January-June2012, down from *** percent of net sales in January-June 2011. Id.
We are unpersuaded by Samsung’s argument that Whirlpool’s financial losses on sales of Alpha HEFLwashers were not a function of subject import competition. See Samsung’s Prehearing Brief at 100; Samsung’sPosthearing Brief at 3-5. Contrary to Samsung’s claim that these losses resulted from Whirlpool’s failure toanticipate a significant decline in HEFL washer demand, apparent U.S. consumption of HEFL washers with acapacity of over 3.7 cubic feet, which encompass Whirlpool’s 4.2 cubic foot HEFL washers, *** between 2009 and2011, from *** units in 2009 to *** units in 2011. CR/PR at Tables III-5, IV-3-5. Samsung’s claim thatWhirlpool’s losses were caused by its investment in more HEFL washer capacity than warranted by market demandis belied by evidence that Whirlpool’s additional production capacity for HEFL washers, at *** units, was similar toits projected sales volume of *** units. See Verification report at 4; Hearing Tr. at 31 (Fettig) (“We had 500,000units of capacity for Alpha.”); Petitioner’s Prehearing Brief at 9. Whirlpool reported a higher capacity figure in itsquestionnaire response based upon a theoretical model, consistent with the questionnaire instructions, whereby itproduced either HEFL washers or HETL washers but not both. See Petitioner’s Final Comments at 3. Finally, wereject Samsung’s argument that the start-up costs associated with Whirlpool’s new HEFL washer productionoperations should be disregarded. Samsung’s Prehearing Brief at 100. In response to a Commissioner questionconcerning the expected duration of financial losses during the start-up phase of a new product, Whirlpool’sChairman and CEO responded that “[i]t wouldn't be unusual for two or three or four months, but not years.” Hearing Tr. at 173-74. We also note that Whirlpool’s reported data concerning its LRW operations were verified. Verification Report at 5.
43
industry’s declining financial performance during the 2009-11 period was driven in large part by itsdeclining financial performance on sales of HETL washers and HEFL washers, which competed directlywith subject imports.329
We also find that subject imports had a significant adverse impact on the domestic industry’ssales of CTL washers, notwithstanding the absence of subject imported CTL washers. We have foundthat the U.S. washer market comprises a continuum of washer products, with substantial cross-shoppingbetween different segments.330 Moreover, the record shows that lower prices on larger, more fullyfeatured washers, such as HETL and HEFL washers, adversely affect the sales volumes and prices ofsmaller, less fully featured washers, such as CTL washers.331 Given these market dynamics, the pervasivesubject import underselling that we have found, which depressed and suppressed domestic like productprices to a significant degree, adversely impacted the domestic industry’s sales of CTL washers in twoways. First, low-priced subject import competition reduced demand for domestically produced CTLwashers, as lower prices on HETL washers and HEFL washers induced consumers who might otherwise
We also reject Samsung’s view that Whirlpool’s failure to submit its business plan for its investment inAlpha HEFL washer precludes our analysis of the impact of subject imports on domestically produced HEFLwashers. See Samsung’s Posthearing Brief at 4-5. Even absent a copy of Whirlpool’s business plan, the recordcontains ample information concerning the assumptions behind the investment and the performance of Whirlpool’sHEFL washer operations. See, e.g., Petitioner’s Responses to Commissioner Questions at II-62-65; Hearing Tr. at30-32, 174-75 (Fettig); Domestic Producers’ Questionnaire Response of Whirlpool at Questions II-9, III-13-14;Petitioner’s Prehearing Brief at 9. The record also contains ample trade and pricing data relevant to our analysis ofcompetition in the U.S. HEFL washer market. See, e.g., CR/PR at Tables V-6, 8, 11, 14-16, C-2. While theCommission strongly encourages parties to submit requested business plans, the absence of Whirlpool’s businessplan for its investment in domestically produced HEFL washers does not undermine our analysis in this instance. 329 Whirlpool’s Chairman and CEO emphasized the importance of LRWs to Whirlpool’s washers business, stating“that’s where most manufacturers would typically make more profit” and “the viability of the overall washerbusiness depends heavily on our ability to have healthy margins from the mid to high end of the line in order to mixup, to earn margins, to reinvest in the business.” Hearing Tr. at 33-34 (Fettig). In 2011, the industry’s operating losson net sales of LRWs, at $***, accounted for *** percent of its operating loss of $*** on sales of all washers. CR/PR at Tables C-1, 6. 330 See section II.D., above. 331 See section V.D., above. We are unpersuaded by respondents’ argument that the Commission’s rejection ofWhirlpool’s so-called “feature dumping” argument in Refrigerators precludes a finding that subject imports affectedthe prices of domestically produced CTL washers. Samsung’s Posthearing Brief at 15; LG’s Posthearing Brief at 8;LG’s Responses to Commissioner Questions, Exhibit 1 at 2-3. As an initial matter, we are not bound by our analysisin Refrigerators because each investigation is sui generis, as based upon a unique factual record. See Nucor Corp. v.United States, 414 F.3d 1331, 1340 (Fed. Cir. 2005).
We also reject respondents’ view that Petitioner has reprised its “feature dumping” argument from theRefrigerators investigations here. In Refrigerators, Whirlpool invited the Commission to deviate from its normalunderselling methodology by considering whether the prices on more fully featured subject import models capturedthe value of the additional features offered by those models over competing domestically produced models. USITCPub. 4318 at 31. Declining Whirlpool’s invitation, the Commission explained that Whirlpool’s proposed analysiswas unnecessary because its pricing product data were based on detailed product definitions that permitted apples-to-apples comparisons in terms of features. Id. at 32. The Commission also rejected Whirlpool’s proposed analysis asunworkable because the monetary value of different feature combinations is inherently subjective. Id. at 32. Inthese investigations, Whirlpool does not advocate an alternative pricing analysis, as in Refrigerators, but argues thatlow-priced subject imports of LRWs (all HEFL washers and HETL washers with a capacity equal to or greater than3.7 cubic feet) compressed prices on domestic industry sales of HETL and CTL washers with a capacity of less than3.7 cubic feet. See Whirlpool’s Posthearing Brief at 10-11. Thus, the Commission’s rejection of Whirlpool’s“feature dumping” argument in Refrigerators is not relevant to our analysis in these investigations.
44
have purchased a CTL washer to purchase an HETL washer or HEFL washer instead.332 Second, low-priced subject import competition forced domestic producers to reduce prices on domestically producedCTL washers, or forego price increases that would otherwise have occurred, as lower prices on HETLwasher and HEFL washers compressed the prices of smaller, less fully featured models on the continuumof washer products.333
We have considered whether there are other factors that may have had an adverse impact on thedomestic industry during the period of investigation to ensure that we are not attributing injury from suchother factors to the subject imports. Macroeconomic trends cannot explain the domestic industry’s weakperformance during the period of investigation because macroeconomic conditions have limited influenceon washer demand, and apparent U.S. consumption increased between 2009 and 2010 before returning to2009 levels in 2011.334 Indeed, the domestic industry’s performance declined notwithstanding a shift indemand toward HETL washers and HEFL washers with a capacity of 3.7 cubic feet or greater, such asWhirlpool’s Alpha HEFL washers.
Nonsubject imports had a declining presence in the U.S. market during the period of investigationand declined as a share of apparent U.S. consumption from *** percent in 2009 to *** percent in 2010and *** percent in 2011.335 In addition, most nonsubject imports during the period consisted ofWhirlpool’s imports of HEFL washers from Germany, which reportedly ceased in July 2012 pursuant toWhirlpool’s decision to shift HEFL washer production to the United States.336 337
332 See CR at II-18, V-13; PR at II-11, V-8. 333 See Hearing Tr. at 42 (Fettig), 118 (Bilas), 255-56 (Baird). The industry’s ratio of cost of goods sold to netsales with respect to CTL washers increased from *** percent in 2009 to *** percent in 2010 and *** percent in2011. CR/PR at Table C-4. The ratio was *** percent in January-June 2012, down from *** percent in January-June 2011. Id.
We reject respondents’ argument that the same logic Petitioner used to suggest that subject importsadversely affected the prices of domestically produced CTL washers could also be used to suggest that lower priceson domestically produced top-load washers with a capacity of less than 3.7 cubic feet might have dragged downsubject import prices. See Hearing Tr. at 249-50 (Klett). Contrary to respondents’ theory, the domestic industrywould have had every economic incentive to raise prices on CTL washers, not cut them, as the industry experienceda worsening cost-price squeeze on sales of CTL washers during the 2009-11 period. See CR/PR at Table C-4. Therecord also shows that subject import sales of product 4, defined as HETL washers with a capacity greater than orequal to 3.7 cubic feet but less than 4.2 cubic feet, CR at V-19; PR at V-10, were generally lower than Whirlpool’ssales prices on comparable HETL washers with a capacity of 3.6 cubic feet. See Petitioner’s Responses to StaffQuestions at III-1-2. By contrast, we have found that subject imports pervasively undersold the domestic likeproduct during the period, depressing and suppressing domestic like product prices to a significant degree. Seesection VI.D, above. Thus, the record supports our finding that subject import underselling adversely affected theprices of domestically produced CTL washers, and not the other way around.
We also reject LG’s argument that subject imports could not have adversely affected the prices ofdomestically produced CTL washers because an examination of the average unit value of domestic industry andsubject import U.S. shipments, by segment, reveals that the average unit value of smaller washers is almost alwayslower than the average unit value of larger washers. See LG’s Prehearing Brief at 82-88. The record shows thatlarger, more fully featured washers do not have to be priced lower than smaller, less fully featured washer models toadversely affect the sales and prices of smaller, less fully featured washer models. See section V.D., above. 334 CR/PR at Table C-6. 335 CR/PR at Table IV-3. Nonsubject imports as a share of apparent U.S. consumption were *** percent inJanuary-June 2012, down from *** percent in January-June 2011. Id. 336 CR at III-3 n.8, VII-23; PR at III-2 n.8, VII-6. 337 Commissioner Pinkert finds that large residential washers do not comprise a commodity product for purposesof the analysis required by the Federal Circuit in Bratsk and Mittal Steel and that a counterfactualreplacement/benefit analysis is therefore not warranted. He notes in this regard that (1) the categories of washers
45
In sum, we find that between 2009 and 2011, the significant increase in subject import volumeand market share at the domestic industry’s expense, coupled with significant subject import undersellingthat depressed and suppressed domestic like product prices to a significant degree, adversely impacted thedomestic industry, leading to significant declines in most indicators of domestic industry performance. Therefore, we conclude that subject imports had a significant adverse impact on the domestic industry.
CONCLUSION
For the foregoing reasons, and based on the record in the final phase of these investigations, wedetermine that an industry in the United States is materially injured by reason of subject imports fromKorea found to have been subsidized and sold at LTFV and by reason of subject imports from Mexicofound to have been sold at LTFV.
(HEFL, HETL, and CTL) are distinguished by major differences in product features and (2) there is substantialfeature differentiation even within each of those categories.
46
I-1
PART I: INTRODUCTION
BACKGROUND
These investigations result from a petition filed on December 30, 2011, by Whirlpool Corporation (“Whirlpool”), Benton Harbor, MI, alleging that an industry in the United States is materially injured and threatened with material injury by reason of imports from Korea and Mexico of large residential washers (“LRWs”) that are sold in the United States at less-than-fair-value (“LTFV”) and subsidized by the Government of Korea. The following tabulation provides information relating to the background of these investigations:1
Effective date Action December 30, 2011 Petition filed with Commerce and the Commission; institution of Commission
investigations. January 26, 2012 Initiation of antidumping duty investigations by Commerce. January 27, 2012 Initiation of countervailing duty investigation on Korea by Commerce. February 17, 2012 Commission’s preliminary determinations. June 5, 2012 Commerce’s preliminary countervailing duty determination. August 3, 2012 Commerce’s preliminary antidumping duty determinations; Commission’s
scheduling of its final phase investigations (77 FR 51569). December 11, 2012 Commission’s hearing. December 26, 2012 Commerce’s final determinations regarding Korea (77 FR 75975). December 27, 2012 Commerce’s final determination regarding Mexico (77 FR 76288). January 23, 2013 Commission’s vote. February 8, 2013 Commission’s views transmitted to Commerce.
App. B contains a list of witnesses that appeared at the hearing.
STATUTORY CRITERIA AND ORGANIZATION OF THE REPORT
Statutory Criteria
Section 771(7)(B) of the Tariff Act of 1930 (the “Act”) (19 U.S.C. § 1677(7)(B)) provides that in
making its determinations of injury to an industry in the United States, the Commission--
shall consider (I) the volume of imports of the subject merchandise, (II) the effect of imports of that merchandise on prices in the United States for domestic like products, and (III) the impact of imports of such merchandise on domestic producers of domestic like products, but only in the context of production operations within the United States; and. . . may consider such other economic factors as are relevant to the determination regarding whether there is material injury by reason of imports.
1 Federal Register notices cited in this tabulation are presented in app. A of this report.
I-2
Section 771(7)(C) of the Act (19 U.S.C. § 1677(7)(C)) further provides that—
In evaluating the volume of imports of merchandise, the Commission shall consider whether the volume of imports of the merchandise, or any increase in that volume, either in absolute terms or relative to production or consumption in the United States is significant. . . . In evaluating the effect of imports of such merchandise on prices, the Commission shall consider whether. . .(I) there has been significant price underselling by the imported merchandise as compared with the price of domestic like products of the United States, and (II) the effect of imports of such merchandise otherwise depresses prices to a significant degree or prevents price increases, which otherwise would have occurred, to a significant degree. . . . In examining the impact required to be considered under subparagraph (B)(i)(III), the Commission shall evaluate (within the context of the business cycle and conditions of competition that are distinctive to the affected industry) all relevant economic factors which have a bearing on the state of the industry in the United States, including, but not limited to . . . (I) actual and potential decline in output, sales, market share, profits, productivity, return on investments, and utilization of capacity, (II) factors affecting domestic prices, (III) actual and potential negative effects on cash flow, inventories, employment, wages, growth, ability to raise capital, and investment, (IV) actual and potential negative effects on the existing development and production efforts of the domestic industry, including efforts to develop a derivative or more advanced version of the domestic like product, and (V) in {an antidumping investigation}, the magnitude of the margin of dumping.
Organization of Report
Information on the subject merchandise, margins of dumping and subsidies, and domestic like product is presented in Part I. Information on conditions of competition and other relevant economic factors is presented in Part II. Part III presents information on the condition of the U.S. industry, including data on capacity, production, shipments, inventories, and employment. The volume and pricing of imports of the subject merchandise are presented in Part IV and Part V, respectively. Part VI presents information on the financial experience of U.S. producers. The statutory requirements and information obtained for use in the Commission’s consideration of the question of threat of material injury are presented in Part VII.
MARKET SUMMARY
For the purposes of these final phase investigations, LRWs are comprised of front-load residential washers (regardless of capacity) and top-load residential washers with a Department of Energy (“DOE”) rated capacity of greater than or equal to 3.7 cubic feet with a cabinet width of at least 24.5 inches and no more than 32.0 inches. Conversely, LRWs, as amended by Commerce, excludes top-load residential washers with a DOE rated capacity of less than 3.7 cubic feet.2
2 Large Residential Washers From the Republic of Korea: Amendment to the Scope of the Countervailing Duty Investigation, 77 FR 46715, August 6, 2012.
I-3
The U.S. market for LRWs totaled *** units, valued at approximately $*** in 2011. The Commission received U.S. producer questionnaires from seven firms: Alliance Laundry Systems, LLC (“Alliance”), BSH Home Appliances (“BSH”), Electrolux Home Products, Inc. (“Electrolux”), Fisher & Paykel Appliances, Inc. (“Fisher & Paykel”),3 General Electric Co. (“GE”), Staber Industries, Inc. (“Staber”), and Whirlpool. Currently, four firms produce LRWs in the United States, (1) Alliance; (2) GE; (3) Staber; and (4) Whirlpool.4 During the period for which data were collected, Whirlpool accounted for the vast majority of U.S. production of LRWs and in 2011 accounted for *** percent of total reported U.S. production.5 At least *** firms have reported importing LRWs from subject sources since 2009. Two firms, Samsung Electronics America, Inc. (“Samsung”) and LG Electronics USA, Inc. (“LG”), accounted for the vast majority of reported subject imports from Korea, while Whirlpool, Electrolux, and Samsung accounted for the vast majority of subject imports from Mexico in 2011.
U.S. producers’ U.S. shipments of LRWs totaled *** units valued at $*** in 2011, and accounted for *** percent of apparent U.S. consumption, by quantity, and *** percent, by value. U.S. shipments of imports from Korea totaled *** units valued at $*** million in 2011, and accounted for *** percent of apparent U.S. consumption, by quantity, and *** percent, by value. U.S. shipments of imports from Mexico totaled *** units valued at $***, and accounted for *** percent of apparent U.S. consumption, by quantity, and *** percent, by value. U.S. shipments of imports from all other sources combined totaled *** units valued at $***, accounting for *** percent of apparent U.S. consumption, by quantity, and *** percent, by value.
SUMMARY DATA
Appendix C presents a summary of data collected in these investigations.6 U.S. industry data are based on questionnaire responses from six U.S. producers that accounted for virtually all of U.S. production of LRWs during the period of investigation (see Part III of this report).7 Data for U.S. imports from Korea, Mexico, and nonsubject countries are based on questionnaire responses from U.S. importers
3 Fisher & Paykel only reported production of out-of-scope top-load residential washers less than 3.7 cubic feet
capacity, which it produced at its Clyde, OH facility until October 2009, when it transferred production to its facility in Amata City, Thailand. Petition, exh. 5.
4 Two firms, BSH and Electrolux, produced LRWs during the period of investigation; however, these firms ceased production of LRWs in the U.S. during the period for which data were collected. BSH, which produced front-load LRWs, ceased production at its New Bern, NC facility in late 2010. Hearing transcript, p. 47 (Bosshard). Electrolux, which produced front-load LRWs and out-of-scope top-load residential washers less than 3.7 cubic feet capacity, ceased production at its Webster City, IA facility in early 2011 and transferred all laundry production to its facility in Juarez, Mexico. Hearing transcript, p. 224 (Chambers). GE began producing top-load LRWs in 2012 and plans to sell front-load LRWs in 2013. GE’s posthearing brief, p. 2.
5 Whirlpool produces front-load and top-load LRWs and out-of-scope top-load residential washers less than 3.7 cubic feet capacity in the United States for sale under the Whirlpool, Maytag, Roper, Estate, Admiral, Amana, and Crosley brands, and also supplies LRWs to OEM customers for resale under their own brands. Petition, p. 10.
6 Table C-1 presents data concerning the U.S. market for all in-scope LRWs; table C-2 presents data concerning the U.S. market for in-scope front-load LRWs; table C-3 presents data concerning the U.S. market for in-scope top-load LRWs. Table C-4 present data concerning the U.S. market for conventional out-of-scope top-load residential washers less than 3.7 cubic feet capacity and table C-5 presents data concerning the U.S. market for high efficiency out-of-scope top-load residential washers less than 3.7 cubic feet capacity. C-6 presents data concerning all in-scope and out-of-scope residential washers and table C-7 presents data concerning all in-scope and out-of-scope residential washers (excluding Electrolux from the domestic industry). Table C-8 presents data concerning in-scope LRWs and high efficiency top load residential washers (excluding Electrolux from the domestic industry). Table C-9 presents data for in-scope top-load LRWs and high efficiency out-of-scope top-load residential washers.
7 The Commission received U.S producer questionnaires from seven firms (Alliance, BSH, Electrolux, Fisher & Paykel, GE, Staber, and Whirlpool); however, Fisher & Paykel only reported production of out-of-scope top-load residential washers less than 3.7 cubic feet capacity.
I-4
(see Part IV of this report). Information on the industries that produce LRWs in Korea and Mexico is based on questionnaire responses from three foreign producers and exporters from Korea, from three foreign producers and exporters from Mexico, and publicly available data (see Part VII of this report).8 Data from other sources are referenced and footnoted where appropriate.
PREVIOUS INVESTIGATIONS
There have been no previous antidumping or countervailing duty investigations on LRWs.
NATURE AND EXTENT OF SUBSIDIES AND SALES AT LTFV
Subsidies
On December 26, 2012, Commerce published a notice in the Federal Register of it final determination of countervailing subsidies for producers and exporters of LRWs from Korea.9 Commerce identified the following government programs to be countervailable:
KDB and IBK Short-Term Discounted Loans for Export Receivables Income Tax Programs
o Research, Supply, or Workforce Development Investment Tax Deductions for “New Growth Engines” under RSTA Article 10(1)(1)
o Research, Supply, or Workforce Development Expense Tax Deductions for “Core Technologies” under RSTA Article 10(1)(2)
o Tax Reduction for Research and Manpower Development: RSTA 10(1)(3) o RSTA Article 25(2) Tax Deductions for Investments in Energy Economizing
Facilities o RSTA Article 26 Tax Deduction for Facilities Investment
Gwangju Metropolitan City Production Facilities Subsidies: Tax Reductions/Exemptions under Article 276 of the Local Tax Act
Grant Programs o GOK Subsidies for “Green Technology R&D” and its Commercialization o GOK 21st Century Frontier R&D Program / Information Display R&D Center
Program o Support for SME “Green Partnerships” o Grants Discovered at Verification
8 The Commission also received a questionnaire response from a fourth firm, Mabe S.A. de C.V. (“Mabe”), a
Mexican producer of out-of-scope top-load residential washers less than 3.7 cubic feet capacity, which reported ***. Mabe’s data are not included in this staff report.
9 Large Residential Washers From the Republic of Korea: Final Affirmative Countervailing Duty Determination, 77 FR 75975, December 26, 2012.
I-5
The tabulation below presents Commerce’s findings of subsidization:
Country/Producer Countervailable subsidy margin (percent ad valorem) Korea: Daewoo 72.30 LG 0.01 Samsung 1.85 All others 1.85Source: Large Residential Washers From the Republic of Korea: Final Affirmative Countervailing Duty Determination, 77 FR 75975, December 26, 2012.
Sales at LTFV
On December 26, 2012, Commerce published a notice in the Federal Register of its final determination of sales at LTFV with respect to imports of LRWs from Korea.10 The tabulation below presents Commerce’s dumping margins:
Country/Producer Dumping margin (percent ad valorem)
Korea: Daewoo 82.41 LG 13.02 Samsung 9.29 All others 11.86Source: Notice of Final Determination of Sales at Less Than Fair Value: Large Residential Washers From the Republic of Korea, 77 FR 75988, December 26, 2012.
On December 27, 2012, Commerce published a notice in the Federal Register of its final
determination of sales at LTFV with respect to imports of LRWs from Mexico.11 The tabulation below presents Commerce’s dumping margins:
Country/Producer Dumping margin (percent ad valorem)
Mexico: Electrolux 36.52 Samsung 72.41 Whirlpool 72.41 All others 36.52Note: Whirlpool did not contest the less-than-fair-value investigation conducted by Commerce because it will no longer import LRWs from Mexico. Commerce therefore assigned Whirlpool the same antidumping margin assigned to Samsung, which also declined to participate. Whirlpool’s posthearing brief, Answers to Commission Questions, p. II-57. Source: Notice of Final Determination of Sales at Less Than Fair Value: Large Residential Washers from Mexico, 77 FR 76288, December 27, 2012.
10 Notice of Final Determination of Sales at Less Than Fair Value: Large Residential Washers From the
Republic of Korea, 77 FR 75988, December 26, 2012. 11 Notice of Final Determination of Sales at Less Than Fair Value: Large Residential Washers from Mexico, 77
FR 77 FR 76288, December 27, 2012.
I-6
THE PRODUCT
Commerce’s Scope
Commerce has defined the scope of these investigations as follows:12
For purposes of these investigations, the term “large residential washers” denotes all automatic clothes washing machines, regardless of the orientation of the rotational axis, except as noted below, with a cabinet width (measured from its widest point) of at least 24.5 inches (62.23 cm) and no more than 32.0 inches (81.28 cm).
Also covered are certain subassemblies used in large residential washers, namely: (1) all assembled cabinets designed for use in large residential washers which incorporate, at a minimum: (a) at least three of the six cabinet surfaces; and (b) a bracket; (2) all assembled tubs designed for use in large residential washers which incorporate, at a minimum: (a) a tub; and (b) a seal; (3) all assembled baskets designed for use in large residential washers which incorporate, at a minimum: (a) a side wrapper; (b) a base; and (c) a drive hub; and (4) any combination of the foregoing subassemblies.
Excluded from the scope are stacked washer-dryers and commercial washers. The term "stacked washer-dryers" denotes distinct washing and drying machines that are built on a unitary frame and share a common console that controls both the washer and the dryer. The term "commercial washer" denotes an automatic clothes washing machine designed for the "pay per use" market meeting either of the following two definitions:
(1) (a) it contains payment system electronics; (b) it is configured with an externally mounted steel frame at least six inches high that is designed to house a coin/token operated payment system (whether or not the actual coin/token operated payment system is installed at the time of importation); (c) it contains a push button user interface with a maximum of six manually selectable wash cycle settings, with no ability of the end user to otherwise modify water temperature, water level, or spin speed for a selected wash cycle setting; and (d) the console containing the user interface is made of steel and is assembled with security fasteners; or
(2) (a) it contains payment system electronics; (b) the payment system electronics are enabled (whether or not the payment acceptance device has been installed at the time of importation) such that, in normal operation, the unit cannot begin a wash cycle without first receiving a signal from a bonafide payment acceptance device such as an electronic credit card reader; (c) it contains a push button user interface with a maximum of six manually selectable wash cycle
12 The original scope of these investigations included certain washers with a Department of Energy (“DOE”)
rated capacity less than 3.70 cubic feet. On May 17, 2012, petitioner requested that Commerce narrow the scope of the investigations to exclude these products. See Petitioner’s Request to Exclude from Scope Certain Top-Load Washers. On August 6, 2012, Commerce published a notice in the Federal Register amending the scope of these investigations to exclude “automatic clothes washing machines with a vertical axis and a rated capacity of less than 3.7 cubic feet, as certified to the U.S. Department of Energy pursuant to 10 CFR § 429.12 and 10 CFR § 429.20, and in accordance with the test procedures established in 10 CFR Part 430.” Large Residential Washers From the Republic of Korea: Amendment to the Scope of the Countervailing Duty Investigation, 77 FR 46715, August 6, 2012.
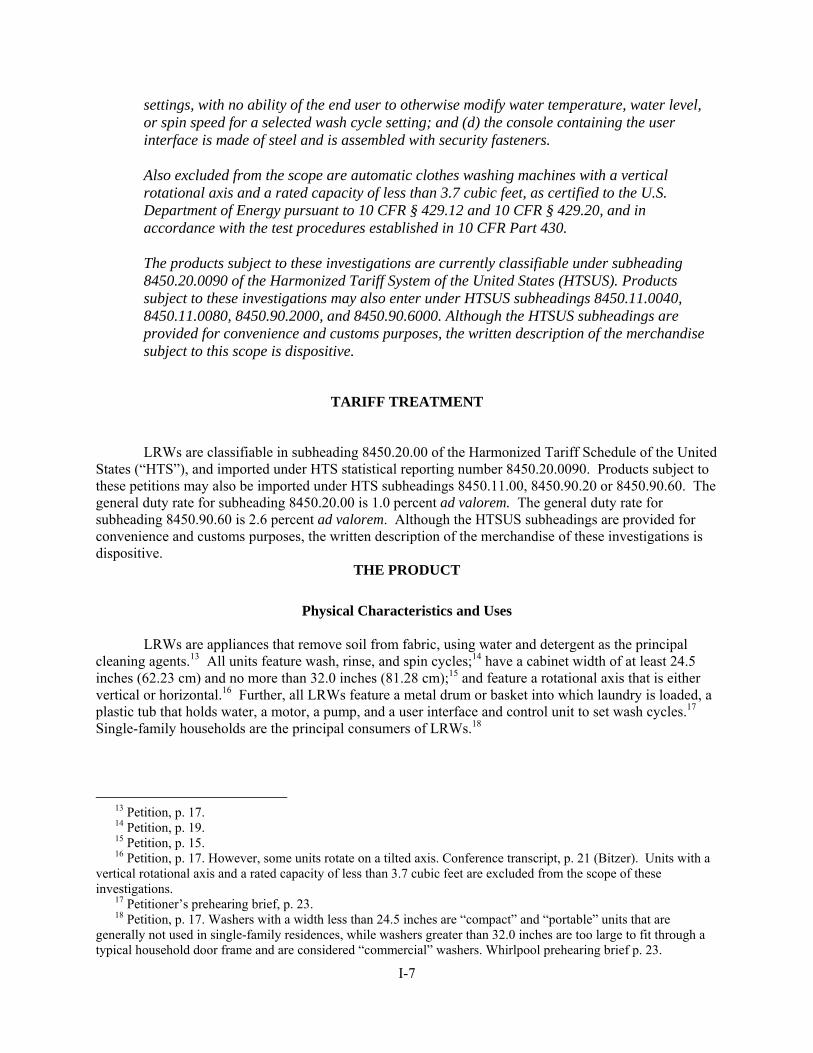
I-7
settings, with no ability of the end user to otherwise modify water temperature, water level, or spin speed for a selected wash cycle setting; and (d) the console containing the user interface is made of steel and is assembled with security fasteners.
Also excluded from the scope are automatic clothes washing machines with a vertical rotational axis and a rated capacity of less than 3.7 cubic feet, as certified to the U.S. Department of Energy pursuant to 10 CFR § 429.12 and 10 CFR § 429.20, and in accordance with the test procedures established in 10 CFR Part 430.
The products subject to these investigations are currently classifiable under subheading 8450.20.0090 of the Harmonized Tariff System of the United States (HTSUS). Products subject to these investigations may also enter under HTSUS subheadings 8450.11.0040, 8450.11.0080, 8450.90.2000, and 8450.90.6000. Although the HTSUS subheadings are provided for convenience and customs purposes, the written description of the merchandise subject to this scope is dispositive.
TARIFF TREATMENT
LRWs are classifiable in subheading 8450.20.00 of the Harmonized Tariff Schedule of the United States (“HTS”), and imported under HTS statistical reporting number 8450.20.0090. Products subject to these petitions may also be imported under HTS subheadings 8450.11.00, 8450.90.20 or 8450.90.60. The general duty rate for subheading 8450.20.00 is 1.0 percent ad valorem. The general duty rate for subheading 8450.90.60 is 2.6 percent ad valorem. Although the HTSUS subheadings are provided for convenience and customs purposes, the written description of the merchandise of these investigations is dispositive.
THE PRODUCT
Physical Characteristics and Uses
LRWs are appliances that remove soil from fabric, using water and detergent as the principal cleaning agents.13 All units feature wash, rinse, and spin cycles;14 have a cabinet width of at least 24.5 inches (62.23 cm) and no more than 32.0 inches (81.28 cm);15 and feature a rotational axis that is either vertical or horizontal.16 Further, all LRWs feature a metal drum or basket into which laundry is loaded, a plastic tub that holds water, a motor, a pump, and a user interface and control unit to set wash cycles.17 Single-family households are the principal consumers of LRWs.18
13 Petition, p. 17. 14 Petition, p. 19. 15 Petition, p. 15. 16 Petition, p. 17. However, some units rotate on a tilted axis. Conference transcript, p. 21 (Bitzer). Units with a
vertical rotational axis and a rated capacity of less than 3.7 cubic feet are excluded from the scope of these investigations.
17 Petitioner’s prehearing brief, p. 23. 18 Petition, p. 17. Washers with a width less than 24.5 inches are “compact” and “portable” units that are
generally not used in single-family residences, while washers greater than 32.0 inches are too large to fit through a typical household door frame and are considered “commercial” washers. Whirlpool prehearing brief p. 23.
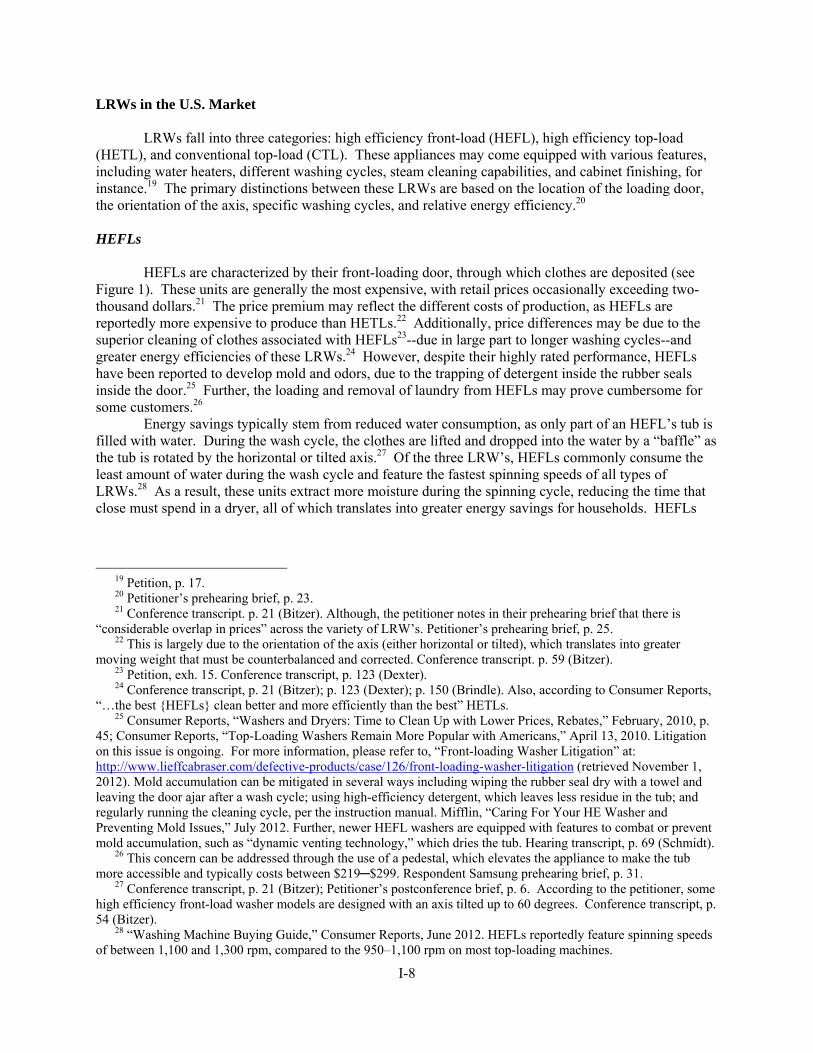
I-8
LRWs in the U.S. Market LRWs fall into three categories: high efficiency front-load (HEFL), high efficiency top-load (HETL), and conventional top-load (CTL). These appliances may come equipped with various features, including water heaters, different washing cycles, steam cleaning capabilities, and cabinet finishing, for instance.19 The primary distinctions between these LRWs are based on the location of the loading door, the orientation of the axis, specific washing cycles, and relative energy efficiency.20 HEFLs HEFLs are characterized by their front-loading door, through which clothes are deposited (see Figure 1). These units are generally the most expensive, with retail prices occasionally exceeding two-thousand dollars.21 The price premium may reflect the different costs of production, as HEFLs are reportedly more expensive to produce than HETLs.22 Additionally, price differences may be due to the superior cleaning of clothes associated with HEFLs23--due in large part to longer washing cycles--and greater energy efficiencies of these LRWs.24 However, despite their highly rated performance, HEFLs have been reported to develop mold and odors, due to the trapping of detergent inside the rubber seals inside the door.25 Further, the loading and removal of laundry from HEFLs may prove cumbersome for some customers.26
Energy savings typically stem from reduced water consumption, as only part of an HEFL’s tub is filled with water. During the wash cycle, the clothes are lifted and dropped into the water by a “baffle” as the tub is rotated by the horizontal or tilted axis.27 Of the three LRW’s, HEFLs commonly consume the least amount of water during the wash cycle and feature the fastest spinning speeds of all types of LRWs.28 As a result, these units extract more moisture during the spinning cycle, reducing the time that close must spend in a dryer, all of which translates into greater energy savings for households. HEFLs
19 Petition, p. 17. 20 Petitioner’s prehearing brief, p. 23. 21 Conference transcript. p. 21 (Bitzer). Although, the petitioner notes in their prehearing brief that there is
“considerable overlap in prices” across the variety of LRW’s. Petitioner’s prehearing brief, p. 25. 22 This is largely due to the orientation of the axis (either horizontal or tilted), which translates into greater
moving weight that must be counterbalanced and corrected. Conference transcript. p. 59 (Bitzer). 23 Petition, exh. 15. Conference transcript, p. 123 (Dexter). 24 Conference transcript, p. 21 (Bitzer); p. 123 (Dexter); p. 150 (Brindle). Also, according to Consumer Reports,
“…the best {HEFLs} clean better and more efficiently than the best” HETLs. 25 Consumer Reports, “Washers and Dryers: Time to Clean Up with Lower Prices, Rebates,” February, 2010, p.
45; Consumer Reports, “Top-Loading Washers Remain More Popular with Americans,” April 13, 2010. Litigation on this issue is ongoing. For more information, please refer to, “Front-loading Washer Litigation” at: http://www.lieffcabraser.com/defective-products/case/126/front-loading-washer-litigation (retrieved November 1, 2012). Mold accumulation can be mitigated in several ways including wiping the rubber seal dry with a towel and leaving the door ajar after a wash cycle; using high-efficiency detergent, which leaves less residue in the tub; and regularly running the cleaning cycle, per the instruction manual. Mifflin, “Caring For Your HE Washer and Preventing Mold Issues,” July 2012. Further, newer HEFL washers are equipped with features to combat or prevent mold accumulation, such as “dynamic venting technology,” which dries the tub. Hearing transcript, p. 69 (Schmidt).
26 This concern can be addressed through the use of a pedestal, which elevates the appliance to make the tub more accessible and typically costs between $219─$299. Respondent Samsung prehearing brief, p. 31.
27 Conference transcript, p. 21 (Bitzer); Petitioner’s postconference brief, p. 6. According to the petitioner, some high efficiency front-load washer models are designed with an axis tilted up to 60 degrees. Conference transcript, p. 54 (Bitzer).
28 “Washing Machine Buying Guide,” Consumer Reports, June 2012. HEFLs reportedly feature spinning speeds of between 1,100 and 1,300 rpm, compared to the 950–1,100 rpm on most top-loading machines.
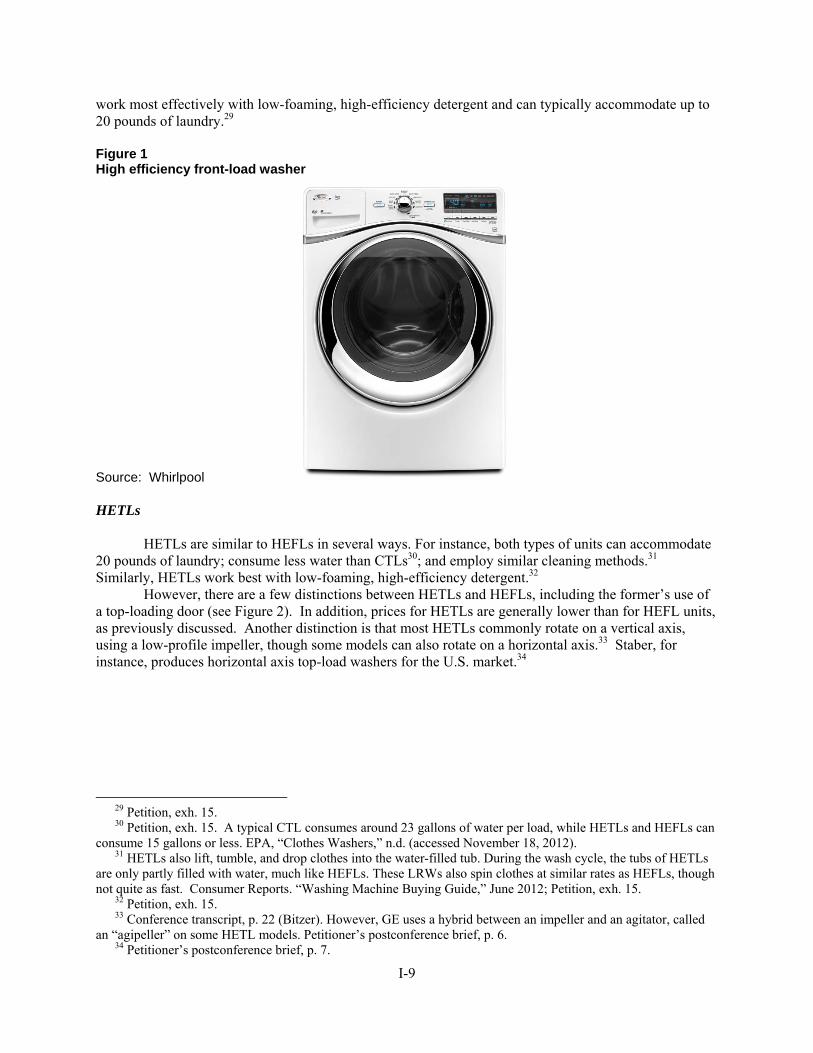
I-9
work most effectively with low-foaming, high-efficiency detergent and can typically accommodate up to 20 pounds of laundry.29 Figure 1 High efficiency front-load washer
Source: Whirlpool HETLs HETLs are similar to HEFLs in several ways. For instance, both types of units can accommodate 20 pounds of laundry; consume less water than CTLs30; and employ similar cleaning methods.31 Similarly, HETLs work best with low-foaming, high-efficiency detergent.32
However, there are a few distinctions between HETLs and HEFLs, including the former’s use of a top-loading door (see Figure 2). In addition, prices for HETLs are generally lower than for HEFL units, as previously discussed. Another distinction is that most HETLs commonly rotate on a vertical axis, using a low-profile impeller, though some models can also rotate on a horizontal axis.33 Staber, for instance, produces horizontal axis top-load washers for the U.S. market.34
29 Petition, exh. 15. 30 Petition, exh. 15. A typical CTL consumes around 23 gallons of water per load, while HETLs and HEFLs can
consume 15 gallons or less. EPA, “Clothes Washers,” n.d. (accessed November 18, 2012). 31 HETLs also lift, tumble, and drop clothes into the water-filled tub. During the wash cycle, the tubs of HETLs
are only partly filled with water, much like HEFLs. These LRWs also spin clothes at similar rates as HEFLs, though not quite as fast. Consumer Reports. “Washing Machine Buying Guide,” June 2012; Petition, exh. 15.
32 Petition, exh. 15. 33 Conference transcript, p. 22 (Bitzer). However, GE uses a hybrid between an impeller and an agitator, called
an “agipeller” on some HETL models. Petitioner’s postconference brief, p. 6. 34 Petitioner’s postconference brief, p. 7.
I-10
Figure 2 High efficiency top-load washer
Source: Whirlpool CTLs Like HETLs, CTLs feature a top-loading door through which laundry is deposited (see Figure 3). However, CTLs differ from high efficiency LRWs, in several ways. In particular, CTLs most commonly clean clothes through the use of an agitator, a device that projects upward from the bottom of the tub and rotates garments throughout the washing cycle.35 CTLs also tend to have smaller capacity than comparable high efficiency washers, because the agitator occupies space in the washing tub.36 Further, loading CTLs with laundry in the middle of a cycle is typically easier than in machines without an agitator, such as high efficiency washers.37 Moreover, CTLs tend to treat fabrics more harshly than high efficiency washers, because the agitator often twists and tangles clothes with great force.38 CTLs also consume more water and energy than high efficiency LRWs. Because CTLs also generally spin clothes more slowly during the spin cycle than high efficiency LRWs, clothes washed in CTLs require more time in the dryer, thus consuming more energy.39
35 Petition, exh. 15. 36 Conference transcript, p. 122 (Dexter). 37 Petition, exh. 15. 38 Respondent Samsung prehearing brief, p. 24. 39 Conference transcript, p. 123 (Dexter).
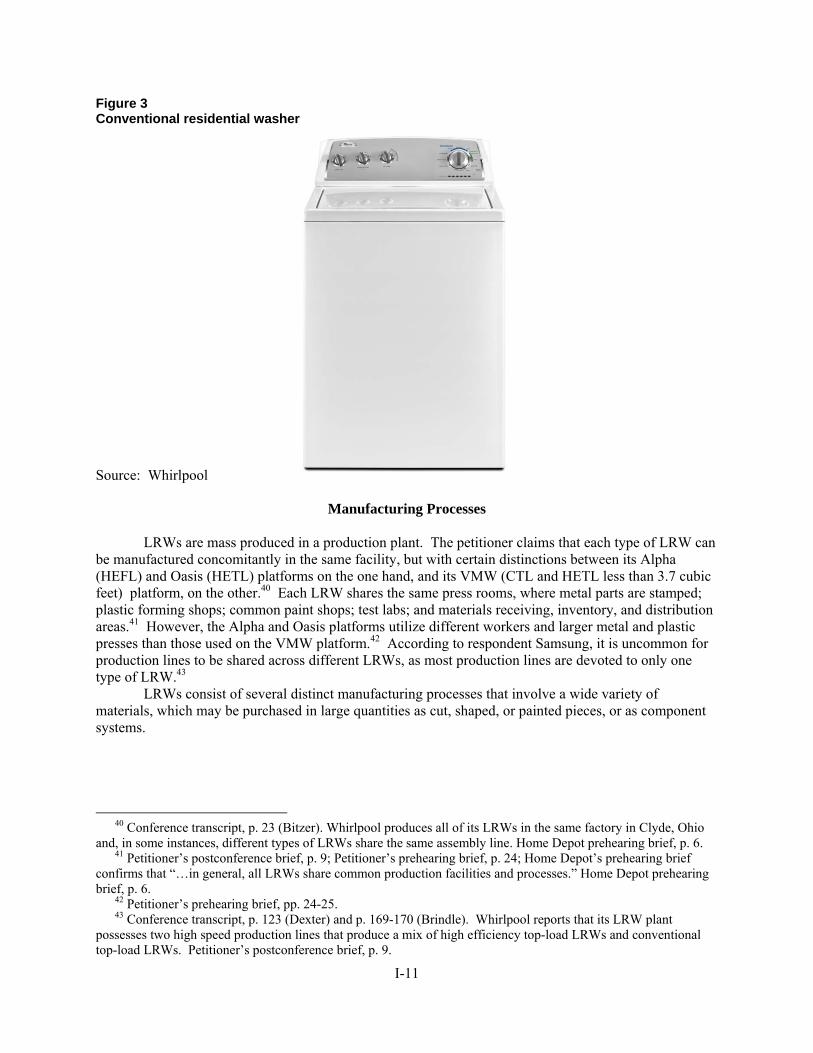
I-11
Figure 3 Conventional residential washer
Source: Whirlpool
Manufacturing Processes
LRWs are mass produced in a production plant. The petitioner claims that each type of LRW can be manufactured concomitantly in the same facility, but with certain distinctions between its Alpha (HEFL) and Oasis (HETL) platforms on the one hand, and its VMW (CTL and HETL less than 3.7 cubic feet) platform, on the other.40 Each LRW shares the same press rooms, where metal parts are stamped; plastic forming shops; common paint shops; test labs; and materials receiving, inventory, and distribution areas.41 However, the Alpha and Oasis platforms utilize different workers and larger metal and plastic presses than those used on the VMW platform.42 According to respondent Samsung, it is uncommon for production lines to be shared across different LRWs, as most production lines are devoted to only one type of LRW.43
LRWs consist of several distinct manufacturing processes that involve a wide variety of materials, which may be purchased in large quantities as cut, shaped, or painted pieces, or as component systems.
40 Conference transcript, p. 23 (Bitzer). Whirlpool produces all of its LRWs in the same factory in Clyde, Ohio
and, in some instances, different types of LRWs share the same assembly line. Home Depot prehearing brief, p. 6. 41 Petitioner’s postconference brief, p. 9; Petitioner’s prehearing brief, p. 24; Home Depot’s prehearing brief
confirms that “…in general, all LRWs share common production facilities and processes.” Home Depot prehearing brief, p. 6.
42 Petitioner’s prehearing brief, pp. 24-25. 43 Conference transcript, p. 123 (Dexter) and p. 169-170 (Brindle). Whirlpool reports that its LRW plant
possesses two high speed production lines that produce a mix of high efficiency top-load LRWs and conventional top-load LRWs. Petitioner’s postconference brief, p. 9.
I-12
LRWs are manufactured through nine separate modules or sub-assemblies.44 The components for each module originate within six areas in the petitioner’s production plant, including: materials receiving, cabinet assembly, fabrication support, plastics forming, machining, and final assembly.
First, the material department receives all purchased raw materials, including pre-stamped metal blanks, injection molded parts, electrical subassemblies, printed literature and labels, and packaging materials. Then, the material department will maintain inventories and deliver material to the appropriate fabrication department or directly to the assembly line.45
During the cabinet assembly stage, the exterior metal shell of the washer is created, including the top, lid, and door. Raw metal blanks, which are formed from steel coils, are then stamped and assembled. Some components are often pre-fabricated in the fabrication support department before being delivered to the cabinet assemblers. Cabinets and lids are then fabricated and processed through the paint department. Completed, painted cabinets and lids are then delivered to the final assembly lines. Washer doors are typically purchased as an assembly, managed by the materials team, and delivered to the assembly line to be attached to the cabinet.46
Next, the fabrication support department processes raw materials such as steel bar stock and coil sheet steel. Purchased steel bar stock is formed and machined into components of the wash systems and drive. Sheet steel is blanked to the appropriate size, stamped, and formed using custom dies designed by the petitioner. The formed parts are cleaned and painted as necessary. Such fabricated steel components are used in the cabinet, drive and the wash unit assembly.47
The plastics forming department processes raw plastic pellets or granules primarily into the plastic tubs used for the wash unit modules. The granules are melted and then injected into plastic molding equipment. The equipment uses molds to obtain the required geometry. Once the tubs are created through this process, they are delivered to the final assembly departments.48
The final assembly consists of integrating the purchased parts and the self-produced subassemblies on an assembly line. All components are presented to the assembly line, which include the cabinet, wash unit, drive, control systems, interior and exterior features, literature, labels, and packaging. All these components are assembled in a defined order to construct the finished washer. The final product undergoes one hundred percent testing and inspection and is visually inspected for fit and finish.49
The finished and inspected product is then transferred to the packaging area where labels are applied, literature is included, and the washer is packaged. Before the unit is automatically shrink-wrapped or packaged in a corrugated box, an external protective packaging is applied manually to the unit. The packaged unit is then shipped to a distribution center.50
Product Features
Product features have become increasingly prevalent in the LRW marketplace, and are seen by
many manufacturers as a vehicle for maintaining competitiveness.51 These features can include energy efficiency, capacity, appearance (color, cabinet finishing, decorative elements, etc), and new innovations
44 The petitioner lists nine of these modules: the cabinet assembly; the drive system, which includes motors,
gears, and shafts, and is commonly purchased from specialty manufacturers; the wash system, which joins the fabricated steel basket (drum) and the plastic tub together; the control system; the exterior features; the interior features; literature; labels; and packaging. Petition, p. 20-21.
45 Petition, p. 21. 46 Petition, p. 21. 47 Petition, p. 21. 48 Petition, p. 22. 49 Petition, p. 22-23. 50 Petition, p. 23. 51 J.D. Power and Associates. “Appliance Brands Respond to Challenging Market,” July 18, 2012.
I-13
such as noise reduction and steam cleaning.52 Petitioner stated that all three types of LRWs can come equipped with a broad variety of features and that different LRW types can often contain the same feature.53 Energy efficiency
Energy efficiency standards for LRWs are promulgated by three entities: the Consortium for Energy Efficiency (CEE),54 the U.S. Environmental Protection Agency (EPA), and the U.S. Department of Energy (DOE). The CEE, working in conjunction with local utility companies and other stakeholders, establishes standards for identifying energy efficient LRWs based largely on the energy utilization and water consumption of the washer. 55 More specifically, the CEE calculates the modified energy factor (MEF), which represents the number of cubic feet of laundry that can be washed with one kilowatt-hour of electricity and the water factor (WF)—the gallons of water needed to wash each cubic foot of laundry.56 Based on the relative MEF and WF measures, the CEE categorizes LRWs into three tiers of energy efficiency, with the third tier reserved for the most energy efficient washers.57 Currently, all domestically produced front-load LRWs qualify as tier three,58 while CTLs are ineligible for this classification.59
The EPA and the DOE assign the ENERGY STAR classification to LRWs, which is equivalent to the CEE tier one rating.60 Only front and top-load LRWs with capacities greater than or equal to 1.6 cubic feet may be considered for the ENERGY STAR.61 In general, the EPA and DOE revise ENERGY STAR standards based on several factors, including changes to the Federal minimum efficiency standards, technological advances which generate greater energy efficiencies, and product availability.62 Additionally, the EPA may revise these standards when the market share for ENERGY STAR rated
52 Petition, p. 17. The basic features (i.e., capacity, energy efficiency, heat, steam, color) are comparable across
LRW’s. MEGA Group USA, written statement, December 4, 2012, p. 4. 53 Conference transcript, p. 90 (Greenwald). 54 The CEE is a nonprofit agency that encourages greater adoption of energy-efficient products and services
through the development of various initiatives. According to the CEE web site, members include utility companies, environmental groups, research organizations, and state energy offices in the United States and Canada. The agency also solicits input from manufacturers and both the U.S. Department of Energy and the Environmental Protection Agency. CEE Web site, “About CEE.” (date accessed November 19, 2012).
55 Conference transcript, p. 55 (Levy). 56 A higher MEF and a lower WF suggests more energy efficient LRW. CEE, “CEE Super Efficient Home
Appliances Initiative.” (date accessed November 19, 2012). The EPA alternatively calls these measurements the “minimum Modified Energy Factor” and the “maximum Water Factor.” EPA Web site, “Clothes Washers Key Product Criteria.” (date accessed November 19, 2012).
57 Conference transcript, pp. 62-63 (Tubman). There is also a minimum Federal standard, which has an MEF:WF ratio that is slightly lower than the tier one classification. CEE, “CEE Super Efficient Home Appliances Initiative,” n.d. (accessed November 19, 2012).
58 Petitioner’s postconference brief, p. 5. However, changes to these standards could disqualify some front-load washers that are currently considered tier three, “high efficiency” units. The most recent change for the CEE’s WF/MEF thresholds occurred in January, 2011. Nationwide Marketing Group, written statement, December 4, 2012, p. 15.
59 Conference transcript, p. 61 (Bitzer). 60 CEE, “CEE Super Efficient Home Appliances Initiative.” n.d. (accessed November 19, 2012). Specifically, the
MEF:WF ratio is 2:6. 61 As previously stated, CTLs do not qualify for the CEE tier three designation, however, some models may
qualify for an ENERGY STAR label. 62 EPA, “How a Product Earns the ENERGY STAR Label,” n.d. (accessed November 18, 2012).
I-14
LRWs reach or exceed 50 percent for a particular category of LRW.63 The most recent change to the ENERGY STAR eligibility changed during the POI, effective January 1, 2011.64
Energy efficiency, utility rebates, sales tax exemptions, and other credits on certain energy-efficient LRWs can influence the LRW purchasing decisions of some consumers. 65 66 Energy rebate programs are generally administered by local utility companies.67
Capacity
Capacity refers to the amount of clothes an LRW can wash per load. Capacity is believed to be among the top three leading features for consumers,68 especially for large households.69 According to the petitioner, capacity ranges for different types of LRWs differ. CTLs feature the lowest capacity and range from 2.5-3.9 cubic feet, while the capacity of HEFL and HETL washers range from 3.3-4.3 cubic feet and 3.5-5.0 cubic feet of capacity, respectively.70 The DOE requires manufacturers to certify and declare the capacity of their LRWs at the time of sale.71 Appearance
The appearance of LRWs can vary greatly depending on what appeals to the market. Color, cabinet finish, and decorative elements are examples of LRW features that can differ. Respondent LG emphasized the innovations it has developed around appearance, citing its introduction of various colors into the market, including black units in 2004, “midnight blue,” and “cherry red” units in 2006.72 Respondent LG noted that aesthetics have become increasingly important for consumers who have
63 EPA, “How a Product Earns the ENERGY STAR Label,” n.d. (accessed November 18, 2012). 64 Nationwide Marketing Group, written statement, December 4, 2012, p. 15. 65 According to a survey, preferences for washing machine efficiency levels were nearly evenly divided, with 51
percent of respondents expressing no preference, while the remaining 49 percent expressed a preference for efficiency. Among consumers for whom energy efficiency was important, 81 percent expressed a preference for Energy Star (CEE Tier 1) rated machines. Smith-Dahmer Associates, LLC, “Consumer Survey of Large Residential Washers: July 2011–June 2012,” August 2012.
66 Conference transcript, p. 91 (Tubman); EPA, “Special Offers and Rebates,” n.d. (accessed November 18, 2012).
67 There is considerable variation with respect to how local utilities administer these programs, with the majority of states allowing ENERGY STAR rated LRWs to receive “high efficiency” rebates, for instance. Conversely, other states will only provide these rebates for CEE tier three LRWs. Nationwide Marketing Group, prehearing statement, December 4, 2012, p. 15. Also, according to the petitioner, there is some disagreement among industry participants regarding the standards that define “high efficiency.” Petitioner prehearing brief, p. 29.
68 Hearing transcript, p. 72 (Levy). Survey data revealed that 74 percent of respondents listed capacity as the leading feature of an LRW. Smith-Dahmer Associates, LLC, “Consumer Survey of Large Residential Washers: July 2011–June 2012,” August 2012. Respondent, Samsung, also reported that capacity was one of the top three purchasing factors for consumers. Conference transcript, p. 126 (Dexter).
69 Conference transcript, p. 91 (Tubman). 70 Exhibit 4 of Petitioner’s conference exhibits; Petitioner’s postconference brief, p. 7; Home Depot’s prehearing
briefs, pp. 5, 10 71 Hearing transcript, p. 72 (Levy). U.S. DOE capacity ratings are based on measurements taken from the
“…bottom of the upper ring of the tub.” Therefore, based on the construction of the tub, the functional capacity of the tub can vary. For instance, in their prehearing brief, Home Depot suggested that a washer with a capacity rating of 3.6 cubic feet could have greater usable capacity than that of another machine with a capacity of 3.7 cubic feet. Home Depot prehearing brief, p. 5.
72 Conference transcript, p. 135 (Herring). According to Bob Baird of Home Depot, color is no longer as important a feature as it was a few years ago. Home Depot trip notes, Aspen Hill, MD, November 16, 2012, p. 3. Petitioner stated that the majority of washers are bought in white and that color was less significant for consumers, given that washers are mostly placed in laundry rooms, basements, or utility closets. Hearing transcript, p. 44 (Bilas). Also see the discussion on appearance in Parts II, III, and IV of the staff report.
I-15
laundry rooms in visible, well-trafficked areas of the house. Respondent LG also noted the innovations it has made in other appearance features of its LRWs, mentioning specifically electronic controls, digital displays, door construction design, and smart diagnosis, which enables users to remotely diagnose problems with their washer through their smart phone. 73 The petitioner notes that although many of these additional features improve the aesthetics of the washer, they are mostly secondary physical characteristics.74 Conversely, respondent Samsung suggests that general appearance and use of innovative features significantly influences purchasing decisions.75 Introduction of new and improved features
Creating new features and improving on existing ones is an important component of maintaining competitiveness in the LRW market. Petitioner considers product development a major factor of competition in the industry and invests substantially in product innovation.76 As noted during the hearing, Whirlpool introduced the first high efficiency top-load platform to the market in 2001 and has pioneered this product configuration for more than a decade.77 Further, the petitioner stated that it has “over one thousand engineers” in the United States devoted to washer technology development, mainly focused on the basics of LRW improvement, including lowering energy and water consumption.78
Respondent LG claimed leadership in bringing innovation to the LRW market and identified several product innovations that have revolutionized LRWs. These features include direct drive technology in 2003 which, according to LG, made its washers operate quieter and was later introduced by Whirlpool in 2010.79 LG also noted its introduction of steam to the washer platform in 2006 as well as an allergy friendly cycle in 2007.80 Further, respondent Samsung cites vibration reduction technology as a major innovation that it introduced on its LRWs.81 Petitioner argues that many of the innovations claimed by LG and Samsung were first introduced by Whirlpool.82
While noting the importance of introducing new features in its products and devoting resources to innovation, the petitioner also emphasized that most product features and new technologies can be
73 Conference transcript, p. 136 (Herring). Hearing transcript, p. 199 (Herring). 74 Petitioner’s prehearing brief, p. 23; Hearing transcript p. 58 (Levy). Further, in their postconference brief, the
petitioner stated that price is the most significant point of competition in the LRW market, as retailers primarily base flooring decisions on price and related factors. Petitioner’s postconference brief, pp. 4-5.
75 Respondent Samsung prehearing brief, p. 31. In their prehearing brief, Home Depot suggested that respondents LG and Samsung have competed in the LRW market by providing high-quality products with “superior innovation and better aesthetics.” Further, the brief suggests that high-end consumers are less price sensitive, are willing to pay a price premium for various features, and are driven by “fit, feel, and finish.” Home Depot Prehearing Brief, p. 1-2, and 6. Respondent LG claimed that consumers generally select their washers because of the innovative features. Hearing transcript, p. 203 (Herring).
76 Conference transcript, p. 93-94 (Schmidt). 77 Whirlpool had 100 percent of HETL LRW segment of the market in 2009. LG entered the top-load LRW
segment in May 2010 and was followed by Samsung in May 2011. Hearing transcript, pp. 159-160 (Schmidt). Samsung’s prehearing brief, p. 24.
78 Conference transcript, p. 94 (Bitzer). 79 Respondent Samsung prehearing brief, p. 35; Hearing transcript, p. 199 (Herring). However, in the hearing,
the petitioner stated that Fisher and Paykel were the original innovators of this technology. The petitioner also stated that all LRW manufacturers now use this technology in their platforms. Hearing transcript, p. 160 (Schmidt).
80 Conference transcript, pp. 134-135 (Herring). During the hearing, the petitioner claimed to have first introduced this feature. Hearing transcript, p. 159 (Schmidt).
81 Conference transcript, p. 125 (Dexter). 82 Petitioner’s hearing exh. 11.
I-16
replicated by other producers in different ways.83 For example, the petitioner claims to have developed alternatives to Samsung’s vibration reduction technology that produces similar benefits.84
Respondents LG and Samsung acknowledged that it is common for newly-introduced technologies to be replicated by competitors soon thereafter.85 They claim to have responded to this phenomenon by maintaining leadership in the development and marketing of new product features.86
DOMESTIC LIKE PRODUCT ISSUES
In the preliminary phase of these investigations, the petitioner argued that the Commission should find one domestic like product that is co-extensive with the scope of the investigations then defined by Commerce because in its view, LRWs are comprised of a continuum of similar products, with no clear dividing lines.87 Respondent Samsung argued that there were three domestic like products: CTLs with agitators; HEFLs, which do not have agitators; and HETLs, which also do not have agitators.88 89 The Commission collected data regarding these three market segments and requested that questionnaire recipients comment on the factors that the Commission generally considers when defining the domestic like product.90
In the preliminary phase of these investigations, the Commission stated: “Based on the evidence on the record of the preliminary phase of these investigations, we find that, on balance, the preponderance of similarities over differences among CTL, HETL, and HEFL LRWs supports the definition of a single domestic like product that is coextensive with the scope of the investigations. All three types of LRWs overlap significantly in terms of their physical characteristics and uses; manufacturing facilities, processes, and employees; and channels of distribution. HETL and HEFL LRWs also overlap significantly in terms of interchangeability and customer and producer perceptions. Price is the factor that might suggest three domestic like products, but even with respect to price there is some overlap. For these reasons, we define a single domestic like product encompassing all LRWs within the scope of the
83 Conference transcript, p. 100 (Bitzer). 84 Conference transcript, p. 100 (Bitzer). During the hearing, the petitioner suggested that respondent Samsung
may not have been the “pioneers” of this technology and that Whirlpool has used it for years. Hearing transcript, p. 163 (Schmidt).
85 In their prehearing brief, respondent Samsung suggests that the petitioner “mimicked” the high end designs” of the respondents, including the direct drive motors, vibration reduction technologies, and large drum capacities, which the respondents allege are among the most “important technologies.” Respondent Samsung prehearing brief, p. 26.
86 Conference transcript, pp. 184-185 (Dexter and Herring). 87 Petitioner’s postconference brief, p. 4. Conference transcript, pp. 50-51 (Levy). As noted earlier, the original
scope of these investigations included top-load residential washers with a rated capacity of less than 3.7 cubic feet. 88 Respondent Samsung’s postconference brief, p. 2. 89 In the preliminary phase of these investigations, respondent LG discussed differences between conventional
LRWs, high efficiency top-load LRWs, and high efficiency front-load LRWs rather than address Commission’s traditional six-factors for the like product analysis and asserted that “however the Commission defines the ‘like product’ in this proceeding, it needs to understand that there are three categories of large residential washers and that there are significant different conditions of competition among these three categories.” Respondent LG cited differences between the categories including: the presence (or absence) of an agitator; differences in the manner in which clothing is loaded; and differences pertaining to wash cycles, features, capacity, efficiency, and price. Respondent LG’s postconference brief, pp. 3-4.
90 The Commission’s decision regarding the appropriate domestic products that are “like” the subject imported products is based on a number of factors including: (1) physical characteristics and uses; (2) common manufacturing facilities, production processes, and production employees; (3) interchangeability; (4) customer and producer perceptions; (5) channels of distribution; and (6) price.
I-17
investigations for purposes of the preliminary phase of the investigations. We intend to further examine the like product issue in any final phase of the investigations.”91
Effective July 27, 2012, Commerce amended the scope of its investigations to exclude “top-load washing machines with a vertical rotational axis and a rated capacity of less than 3.70 cubic feet.”92 In these final phase investigations, the Commission collected data concerning CTL, HETL, and HEFL LRWs. 93 In addition to LRWs, the Commission collected data concerning top-load residential washers with a vertical rotational axis and a rated capacity of less than 3.70 cubic feet (“smaller TL residential washers”), which have been excluded from Commerce’s scope.94 In these final phase investigations, the petitioner argues that the Commission should find one domestic like product coterminous with Commerce’s amended scope.95 Respondents Electrolux, Home Depot, LG, and Samsung argue that the Commission should find a single like product comprising LRWs as originally defined in the petition (including top load washers under 3.7 cubic feet in capacity).96
In its questionnaires, the Commission requested that questionnaire respondents comment on the factors that the Commission generally considers when defining the domestic like product, as summarized below.97
High Efficiency Top-load (“HETL”) vs. High Efficiency Front-load (“HEFL”) LRWs
Physical Characteristics and End Uses
Of the six responding U.S. producers, three reported that HETL LRWs have the same physical characteristics and end uses as HEFL LRWs.98 Of the eight responding U.S. importers, four reported that HETL LRWs have the same physical characteristics and end uses as HEFL LRWs 99 Of the 20 responding purchasers, 11 reported that HETL LRWs have the same physical characteristics and end uses as HEFL LRWs.
91 Large Residential Washers from Korea and Mexico, Inv. Nos. 701-TA-488 and 731-TA-1199-1200
(Preliminary), USITC Publication 4306, February 2012, p. 9. 92 Large Residential Washers From the Republic of Korea: Amendment to the Scope of the Countervailing Duty
Investigation, 77 FR 46715, August 6, 2012. 93 These data are reported in Appendix C. Table C-1 presents trade and financial data for all LRWs; table C-2
presents trade and financial data for front-load LRWs; and table C-3 presents trade and financial data for top-load LRWs.
94 Table C-4 present data concerning the U.S. market for conventional out-of-scope top-load residential washers less than 3.7 cubic feet capacity, which includes data from U.S. producers *** and U.S. importers ***. Table C-5 presents data concerning the U.S. market for high efficiency out-of-scope top-load residential washers less than 3.7 cubic feet capacity, which includes U.S. producers *** and U.S. importers ***.
95 Petitioner argues that there is no need to expand the domestic like product beyond Commerce’s scope or subdivide it into multiple like products. Petitioner maintains; however, that “even if the Commission were to return to the domestic like product definition adopted in the preliminary phase, the conclusion on this record should be the same.” Petitioner’s prehearing brief, p. 22. Hearing transcript, pp. 50-51 (Levy).
96 Respondents argue that the 3.7 cubic feet capacity mark does not establish a discernible boundary recognized by market participants nor does not distinguish two segments of the LRWs based on the six factors used by the Commission in its domestic like product analysis. Electrolux prehearing brief, p. 5; Home Depot prehearing brief, p. 4; LG prehearing brief, p. 15-16; and Samsung prehearing brief, p. 15.
97 These comments are presented in full in app. D. 98 ***. 99 ***.
I-18
Common Manufacturing Facilities, Production Processes, and Production Employees
Of the six responding producers, five reported that HETL LRWs share common manufacturing facilities, production processes, and production employees as HEFL LRWs.100 Of the seven responding importers, four reported that HETL LRWs share common manufacturing facilities, production processes, and production employees as HEFL LRWs.101 Of the seven responding purchasers, six reported that HETL LRWs share common manufacturing facilities, production processes, and production employees as HEFL LRWs. Interchangeability
Of the six responding producers, five reported that HETL LRWs are interchangeable with HEFL LRWs.102 Of the eight responding importers, six reported that HETL LRWs are interchangeable with HEFL LRWs.103 Of the 20 responding purchasers, 18 reported that HETL LRWs are interchangeable with HEFL LRWs. Customer and Producer Perceptions Of the six responding U.S. producers, four reported that HETL were perceived by customers and producers as similar products as HEFL LRWs.104 Of the eight responding U.S. importers, five reported that HETL were perceived by customers as similar products as HEFL LRWs.105 Of the 20 responding U.S. purchasers, 17 reported that HETL were not perceived by customers and producers as similar products to HEFL LRWs. Channels of Distribution Of the six responding U.S. producers, all six reported that HETL and HEFL LRWs share similar channels of distribution. Of the eight responding U.S. importers, all eight reported that HETL and HEFL LRWs share similar channels of distribution. Of the 20 responding U.S. purchasers, all reported that HETL and HEFL LRWs share similar channels of distribution. Price Of the six responding U.S. producers, three reported that there are generally no differences in price between HETL and HEFL LRWs and three reported that HEFL are generally more expensive than HETL LRWs.106 Of the eight responding U.S. importers, six reported HEFL are generally more expensive than HETL LRWs.107 Of the 19 responding U.S. purchasers, 5 reported that there are generally no differences in price between HETL and HEFL LRWs, and 14 reported that HEFL LRWs are generally more expensive than HETL LRWs.
100 ***. 101 ***. 102 ***. 103 ***. 104 ***. 105 ***. 106 ***. 107 ***.
I-19
Conventional Top-load Residential Washers (“CTL”) vs. High Efficiency (“HE”) LRWs Physical Characteristics and End Uses
Of the six responding producers, three reported that CTLs have the same physical characteristics as HE LRWs.108 Of the eight responding U.S. importers, four reported that CTLs have the same physical characteristics as HE LRWs.109 Of the 18 responding purchasers, 14 reported that CTL have the same physical characteristics and end uses as HE LRWs. Common Manufacturing Facilities, Production Processes, and Production Employees
Of the six responding producers, all six reported that CTLs share common manufacturing facilities, production processes, and production employees as HE LRWs. Of the eight responding importers, all eight reported that CTLs share common manufacturing facilities, production processes, and production employees as HE LRWs. Of the nine responding purchasers, seven reported that CTL share common manufacturing facilities, production processes, and production employees as HE LRWs. Interchangeability
Of the six responding producers, all six reported that CTLs are interchangeable with HE LRWs. Of the eight responding importers, six reported that CTLs are interchangeable with HE LRWs.110 Of the 20 responding purchasers, 16 reported that CTL are interchangeable with HE LRWs. Customer and Producer Perceptions
Of the six responding U.S. producers, three reported that CTLs were perceived by customers and producers as similar products as HE LRWs.111 Of the eight responding U.S. importers, five reported that CTLs were not perceived by customers and producers as similar products as HE LRWs.112 Of the 20 responding U.S. purchasers, 13 reported that CTL were not perceived by customers and producers as similar products to HE LRWs.
Channels of Distribution
Of the six responding U.S. producers, all six reported that CTLs and HE LRWs share similar channels of distribution. Of the eight responding U.S. importers, all eight reported that CTLs and HE LRWs share similar channels of distribution. Of the 19 responding U.S. purchasers, all reported that CTL and HE LRWs share similar channels of distribution.
Price
Of the six responding U.S. producers, all six reported that HE LRWs are more expensive than CTLs. Of the seven responding U.S. importers, all seven reported that HE LRWs are more expensive than CTLs. Of the 20 responding U.S. purchasers, 19 reported that HE LRWs are generally more expensive than CTL.
108 ***. ***. 109 ***. 110 ***. 111 ***. 112 ***.
I-20
Top-load Residential Washers with rated DOE capacity of less than 3.70 cubic feet (“Smaller TL Residential Washers”) vs. Large Residential Washers (“LRWs”)
Physical Characteristics and Uses
Of the six responding U.S. producers, three reported that smaller TL residential washers did not have the same physical characteristics as LRWs.113 Of the seven responding U.S. importers, five reported that smaller TL residential washers have the same physical characteristics as LRWs.114 Of the 18 responding purchasers, 14 reported that smaller TL residential washers have the same physical characteristics and end uses as LRWs. Common Manufacturing Facilities, Production Processes, and Production Employees
Of the six responding producers, all six reported that smaller TL residential washers share common manufacturing facilities, production processes, and production employees as LRWs. Of the six responding importers, all six reported that smaller TL residential washers share common manufacturing facilities, production processes, and production employees as LRWs. Of the nine responding purchasers, all reported that smaller TL residential washers share common manufacturing facilities, production processes, and production employees as LRWs. Interchangeability
Of the six responding producers, all six reported that smaller TL residential washers are interchangeable with LRWs. Of the seven responding importers, six reported that smaller TL residential washers are interchangeable with LRWs.115 Of the 19 responding purchasers, 17 reported that smaller TL residential washers are interchangeable with LRWs. Customer and Producer Perceptions
Of the six responding U.S. producers, three reported that smaller TL washers were perceived by customers and producers as similar products as LRWs.116 Of the eight responding U.S. importers, six reported that smaller TL residential washers were perceived by customers and producers as similar.117 Of the 19 responding U.S. purchasers, 14 reported that smaller TL residential washers were not perceived by customers and producers as similar products to LRWs.
Channels of Distribution
Of the six responding U.S. producers, all six reported that smaller TL Washers and LRWs share similar channels of distribution. Of the eight responding U.S. importers, seven reported that smaller TL residential washers and LRWs share similar channels of distribution.118 Of the 19 responding U.S. purchasers, all reported that smaller TL residential washers and LRWs share similar channels of distribution.
113 ***. ***. ***. 114 ***. 115 ***. 116 ***. 117 ***. 118 ***.
II-1
PART II: CONDITIONS OF COMPETITION IN THE U.S. MARKET
U.S. MARKET CHARACTERISTICS
Five large national retailers (Best Buy, Home Depot, HH Gregg, Lowe’s, and Sears) account for 65 to 70 percent of sales of LRWs in the United States.1 There are also a few smaller national retailers and several regional chains, such as Bray and Scarff, PC Richards, and Menards. Additionally, approximately 25-30 percent of the market consists of sales to “buyers’ groups” that do not purchase LRWs directly, but negotiate prices for groups of smaller retailers.2 Domestic producers and importers alike market their LRWs through these national, regional, and local retailers. These retailers tend to market a variety of LRWs, including conventional machines and high efficiency front and top loaders.3 In-store sales continue to dominate online purchases; however, many consumers research prices, quality, and features online before going to the store, reducing the number of stores shopped from past years, and online sales are growing.4
Innovation leaders
Many market participants alleged that innovation plays a major role in the LRW market. Producers and importers5 were asked to identify product features that their firms had added since January 1, 2009. Most producers and importers described innovations to their products during this period, and the larger producers and importers provided extensive lists of innovations. *** cited its non-agitator wash system at minimum advertised prices (see Part V) of ***. *** cited its *** with a ***. *** described *** as the historical leader in the LRW market and added that both U.S. producers and subject importers sold products with the latest innovations most relevant to sales (such as LCD displays and vibration reduction technology). However, it also provided a long list of its own recent innovations, including ***.6 *** also provided long lists of their innovations since 2008, including larger capacity, wave force, and cold wash (***),7 larger capacity, fast wash, and vibration control (***), and power foam, speed spray, and Wi-Fi smart control (***). *** reported introducing a “smart detergent” dispenser.
Purchasers were asked to identify suppliers that they considered innovation leaders in the LRW market since January 1, 2009. An innovation leader was defined as a firm that initiated technological or quality improvements that mattered to the purchaser and/or its customers. Most purchasers named at least two innovation leaders. LG was named by 14 purchasers, Whirlpool by 10, Samsung by 10, Electrolux by 3, and GE by 1. Purchasers described LG as leading in both style and features, including color, size, smart diagnosis, vibration control, allergen cycle, and general creativity. Whirlpool was described as leading in
1 Petitioner’s postconference brief, p. 19. LG alleged that U.S. LRW producers have historically had a large
share of the U.S. homebuilder market, which has shrunk since 2007. Hearing transcript, p. 319 (Riddle). 2 See staff telephone conversation with ***. Based on the ***. Buyers’ groups often sponsor biannual
“buyers’ fairs” in which its members buy using pricing programs offered by participating manufacturers. See, for example, written statements of AVVB/BrandSource and Mega, December 4, 2012.
3 Conference transcript, p. 68 (Bitzer). 4 Petitioner states that customers prefer to see LRWs before making a purchase and that online sales account for
about 7.8 percent of appliance sales, in general, and that the figure is perhaps lower for LRWs. Conference transcript, pp. 88-89 (Bitzer and Tubman), and hearing transcript, pp. 125 and 146-47 (Bilas). However, Home Depot stated that 16 percent of its washer sales are online, while acknowledging that its online share of the washer market is higher than its in-store share. Hearing transcript, pp. 302-03 (Baird).
5 *** submitted producers' and importers' questionnaires. For purposes of this chapter, and unless otherwise noted, ***.
6 ***. 7 *** also provided a timeline of LRW innovations, showing *** with more LRW innovations in the 2000s than
***. See also prehearing brief of LG, pp. 27-28.
II-2
high efficiency top-load LRWs with low water consumption, and also for general features and finish. Samsung was described as leading in features such as LCD display, wi-fi connectivity, vibration reduction technology, finish, and features. Electrolux was described as leading in large capacity front-load LRWs, steam technology, and its reversible door feature.
*** were among purchasers describing only Korean and/or Mexican producers as innovation leaders, while *** were among those describing only Whirlpool as an innovation leader. *** were among the purchasers describing both Whirlpool and subject producers as innovation leaders.
Among additional purchaser comments, ***, while naming four firms as innovators, also described many innovations as copies of other firms’ technologies with new names. It described Whirlpool’s Cabrio top-load LRW as based on a design from Fisher & Paykel, but nonetheless with tweaks that made it a “stepping stone.” *** described most innovations since 2009 as being refinements of previous innovations.
Market studies
Producers and importers were asked to supply any market research or other surveys that they had
indicating the reasons why consumers purchase U.S.-produced or subject LRWs. Those studies are summarized in appendix E. As with innovation, both Whirlpool and subject importers described their brands as leading in desirability among consumers.8
CHANNELS OF DISTRIBUTION
Sales to distributors, such as large retailers, are the dominant channel of distribution (table II-1).
Over 98 percent of U.S.-produced LRWs and LRWs imported from both Korea and Mexico were sold to distributors (including retailers), as compared to end users or final consumers. The share of nonsubject import shipments sold to distributors was also very high, though slightly less than that of LRWs from domestic and subject sources.
Table II-1 LRWs: U.S. producers and U.S. importers’ U.S. shipments of subject product, by channel of distribution, January 2009–June 2012
* * * * * * *
8 For example, see hearing transcript, pp. 25 (Fettig), 200 (Herring), and 207 (Dexter).
II-3
U.S. Purchasers
The Commission received purchasers’ questionnaires from 21 purchasers, including *** as well as ***. ***. Seventeen purchasers were retailers, three were distributors (i.e., distributing to retailers), and one was a *** firm. Retailers sold mostly to individual consumers, but a few retailers reported sales to multiresident facilities (institutions and new home builders) as well. Thirteen purchasers reported that they did not compete for sales with their suppliers, but six did, citing sales to the institutional market, suppliers’ online sales to consumers, and some attempts by larger suppliers to sell directly to consumers. *** reported purchasing LRWs for resale under *** own brand, ***.9 As described above, the LRW market is divided between five large national retailers and a large group of smaller, often regional retailers, some of which buy through “buyers’ groups.” However, while regional retailers are smaller than the national retailers, Whirlpool described some regional retailers as selling a larger volume of LRWs per store than national retailers, making them a potentially important market.10 Buyers’ group NATM added that its members often sell a more premium LRW product, and prefer to see higher margins that it stated are threatened by subject import pricing.11 Buyers’ group Nationwide also alleged that Samsung sells its product to independent retailers through a “select” group of distributors, including Almo.12 Nineteen responding purchasers expressed marketing/pricing knowledge of U.S.-produced LRWs, 11 did so for Korean and Mexican LRWs, and 5 did so for nonsubject countries, including Germany, China, and Sweden.13
GEOGRAPHIC MARKETS Producers and importers sell to a national market. All responding U.S. producers (***) reported
selling LRWs to ***. Similarly, *** reported selling LRWs imported from Korea to ***. *** reported selling LRWs imported from Mexico to all regions in the contiguous United States. *** reported selling LRWs imported from nonsubject countries to all regions of the contiguous United States.
SUPPLY AND DEMAND CONSIDERATIONS
U.S. Supply Domestic Production
Based on available information, U.S. producers of LRWs have the ability to respond to changes in
demand with large changes in the quantity of shipments of U.S.-produced LRWs to the U.S. market. The main contributing factors to the large degree of responsiveness of supply are substantial unused capacity combined with some export shipments and inventories.
9 ***. 10 Hearing transcript, p. 39 (Abdelnour). 11 Hearing transcript, p. 143 (Bilas). Similarly, buyers’ group AVB/BrandSource stated that “aggressive”
discounts by national retail chains place pressure on the margins of its members, which are unable to use the same high-volume sales strategy used by large national retailers. Written statement of AVB/BrandSource, December 4, 2012.
12 Written statement, Nationwide Marketing Group, December 4, 2012, p. 2. Samsung stated that it has “very little” experience with buying groups or small, independent dealers. Posthearing brief of Samsung, p. A-87.
13 ***.
II-4
Industry capacity
Domestic industry capacity utilization was at a low level throughout the period examined. Total U.S. capacity decreased by nearly 30 percent over 2009-11, reflecting the closing of ***, even as *** opened substantial new capacity.
*** reported that they had not refused, declined, or been unable to supply LRWs since January 1, 2009. However, *** indicated that in the second quarter of 2010, due to increased consumer demand for LRWs after the implementation of the “Cash for Appliances” tax credit, there was a surge in orders *** resulting in ***. However, *** indicated that the backlog was resolved by the end of the second quarter of 2010. *** also indicated some difficulties in supplying customers, due to ***. Alternative markets
U.S. producers exported approximately *** percent of their total shipments over 2009-11, although
exports as a share of total shipments fell to under *** percent in the first half of 2012. Production alternatives
U.S. producers reported that ***, are often produced at the same plant. However, *** described production shifting to other products as difficult and/or not routine. Inventory levels
U.S. producers’ inventories remained in a narrow range between approximately *** percent of U.S.
production over 2010 through January-June 2012, up from less than *** percent in 2009.
Subject Imports from Korea
Based on available information, Korean producers have the ability to respond to changes in demand with moderate-to-large changes in the quantity of shipments of LRWs to the U.S. market. The main contributing factors to the moderate-to-large degree of responsiveness of supply are the existence of substantial alternate markets, constrained by low inventories and moderately high capacity utilization. Industry capacity Korean producers had moderately high capacity utilization over 2010 through January-June 2012, and capacity fell approximately *** percent over 2009 to 2011. *** stated that they had not been unable to supply LRWs to customers since January 1, 2009. *** stated that in 2011, it had difficulty meeting demand and ***. Alternative markets Exports to the U.S. market represented over *** percent of Korean producers’ shipments in 2009 through 2011, but have dropped somewhat since then and are forecast to drop to just over *** percent of Korean producer’s shipments in 2013. Korean producers’ other shipments were split roughly equally between Korea and non-U.S., non-Korean markets in the first half of 2012.
II-5
Production alternatives *** described shifting between LRWs and other products as difficult due both to production issues and the planning and market forecasting that such a shift would entail. Inventory levels Korean inventories were always less than *** percent of production during the period examined. Subject Imports from Mexico
Based on available information, Mexican producers have the ability to respond to changes in
demand with large changes in the quantity of shipments of LRWs to the U.S. market. The main contributing factors to the high degree of responsiveness of supply are the existence of unused capacity and alternate markets. Industry capacity Mexican capacity utilization remained under *** percent over the period examined. Over the same period, Mexican capacity rose approximately *** percent. *** stated that *** occasionally have been unable to supply LRWs since January 1, 2009. This inability has occurred when sales have exceeded forecasts. Alternative markets The U.S. market accounted for over *** percent of Mexican shipments over the period examined. Mexican shipments to home market customers declined as a share of Mexican shipments over the same period, while exports to non-U.S., non-Mexican markets grew at a faster rate than exports to the U.S. market. Production alternatives *** stated that it could shift production of LRWs to and from small top-load washers and laundry centers. However, *** stated that they could not shift their washer production among products. Inventory levels Mexican inventories ranged between *** percent of production over 2009-2011, and was lower in January-June 2012 than in January-June 2011. Nonsubject Imports Imports of LRWs from nonsubject countries declined as a share of U.S. apparent consumption from 2009 through 2011, and were lower in January-June 2012 than in January-June 2011. Product Changes Large LRW suppliers described a variety of changes in the LRW market since 2009, including increased promotional activity and a shift in consumer preferences from front-load washers to top-load washers. *** stated that there had been no significant changes in the product range, mix or marketing of
II-6
LWRs since January 1, 2009. However, *** stated that there had been. *** described retailers as exerting increased leverage over LRW suppliers, demanding greater margins to compete with the margins afforded by subject imports (see Part V). It stated that subject imports pushed “costly” LRW features, such as larger capacities, steam, color, and LCD display, down to lower price points. *** also cited an increased prevalence of promotional activity around holidays, with *** naming holidays including Presidents’ Day, Memorial Day, Independence Day, Labor Day, Columbus Day, and “Black Friday” (the day after Thanksgiving). Importers *** stated that there had been no significant changes in the product range, mix or marketing of LRWs, but four other importers described numerous changes. *** described Whirlpool as introducing large-capacity, high-efficiency, top-load LRWs in 2008, thereby creating a new class of products in the U.S. market. It further alleged that Whirlpool's pricing of its new products created downward pressure on all LRWs, and especially comparable front-load LRWs. It added that top-load capacities claimed by Whirlpool exceeded actual rated capacities, resulting in further downward price pressure on front-load washers. *** indicated that top-load LRWs had gained market share at the expense of front-load LRWs in 2011 and 2012, and attributed this change to increased product offerings in the top-load market, higher margins for top-load LRWs as new players entered the market with products with multiple innovative features; and lingering negative consumer perceptions based on reported problems with front-load models from the early 2000s (e.g., vibration, and odor/mildew from door gaskets). *** also noted the increased market share of top-load LRWs, although it attributed the increase to a decrease in the share of conventional washers. On the other hand, *** stated that it had switched to only selling ***, although it plans to reintroduce *** in the second half of 2012.
U.S. Demand
Based on available information, LRW demand is likely to exhibit small-to-moderate changes in responses to changes in price. While a large percentage of LRW purchases are to replace existing units that have reached, or are close to, the end of their product life, there is a smaller segment of the market consisting of discretionary purchases. The principal substitute for LRWs is smaller conventional washers, demand for which may have some effect on LRW demand. Apparent Consumption
Apparent U.S. consumption of LRWs rose somewhat between 2009 and 2010 before falling to
slightly below 2009 levels in 2011 and remaining flat during the interim period. End Uses
All responding U.S. producers and importers reported that LRWs are used in homes by final
consumers to wash clothes and other household items. *** added that some LRWs may be used in multi-family apartment buildings. *** added that different organizations, such as military barracks, could have small laundry facilities on their premises. Demand Characteristics A large share of demand for LRWs is based on replacing LRWs that no longer function, and is therefore not necessarily highly correlated with general economic conditions or conditions in the housing market. Nonetheless, some portion of LRW demand is connected to wider economic conditions,14 and such conditions were sometimes cited by market participants as influencing LRW demand.
14 The November 2012 Blue Chip consensus forecast is for 2013 GDP growth to be *** percent, in the same
II-7
*** stated in its preliminary-phase questionnaire response that overall economic conditions affect sales of LRWs, but that most sales of LRWs are to replace aging or broken equipment or to upgrade. Therefore, LRWs are less sensitive to trends in the housing market because housing starts are small relative to replacement needs in existing homes. Home Depot described the “fashion” of LRWs as important to higher-end purchasers, while generally unimportant to purchasers of lower-priced washers. As an example, it described half of its sales of LG LRWs priced at over $1,000 as being color LRWs.15
Purchasers generally estimated that a large percentage of LRW consumer purchases are made to replace LRWs that are no longer functioning. Seven estimated that more than 75 percent of consumer purchases were replacement purchases, and eleven estimated that 50 to 75 percent were. Only two *** purchasers estimated that less than 50 percent (but still more than 25 percent) of LRW purchases were replacement purchases.
Purchasers described consumers as making decisions about washer capacity based on the size of their family (with larger laundry needs more easily handled by larger capacity washers), the price of the extra capacity, and other features and design attributes of the washers.16 Purchasers cited similar factors as influencing consumers’ decision to purchase a particular type of washer (e.g., top-load, front-load, or conventional). Some purchasers described conventional washer consumers as consumers on a budget, while front- and top-load consumers were more concerned with saving money on energy and water. Twelve purchasers described consumers as sometimes willing to switch between front-load and top-load LRWs based on the relative pricing of the two options, seven stated that consumers were frequently willing to do so, and one stated that consumers were always willing to do so. Seventeen purchasers described consumers as frequently shopping for LRWs with a set budget in mind, while one purchaser described consumers as always doing so. An additional two purchasers described consumers as sometimes doing so. More information on consumer preferences can be found in appendix E. Substitute Products
The principal substitute for large residential washers is smaller conventional washers and other
small washers (e.g., stacked washers). However, consumer preferences can restrain such substitution. Among U.S. producers, *** reported that LRWs have no substitutes. Similarly, four responding U.S. importers reported that LRWs have no substitutes. However, ***17 listed small residential washers (of capacity less than 3.7 cubic feet) as substitutes. *** also alleged that pricing for subject imports of LRWs had lowered prices for small residential washers. *** listed laundry centers (stacked washers and dryers) as a substitute.
Eight U.S. purchasers reported no substitutes for LRWs, but nine did, citing smaller washers and stacked washers. Four purchasers stated that changes in the prices of substitutes had not affected the prices of LRWs, but six stated that they had. In further comments, *** described falling prices for LRWs compressing all washer prices while *** described rising prices for other washers increasing substitution away from other washers to LRWs. *** indicated that “aggressive” promotional pricing for high-efficiency top-load washers had affected the prices of LRWs. However, *** stated that consumers of small washers are often space-constrained, and so cannot buy larger washers, and *** described
range as 2010 to 2012 annual GDP growth, and for housing starts to be ***, a level not approached since 2008. See Blue Chip Economic Indicators, Vol. 37, No. 11 November 10, 2012.
15 Hearing transcript, pp. 242-43 (Baird). 16 Purchasers were also asked to provide the volume and value of top-load washers that they sold in 2011, by
capacity (under 3.7 cubic foot and 3.7 cubic foot and above). Twelve purchasers reported purchasing more top-load washers under 3.7 cubic feet capacity than over 3.7 cubic feet capacity, but two (***) reported purchasing more of the larger size.
17 *** also provided retailer price listings showing small conventional washers offered at the same price points as LRWs, and a Whirlpool webpage describing a 3.6 cu. ft. washer as “large.”
II-8
Whirlpool’s prices as fairly stable recently. *** described washers of all size ranges as functionally the same, with the only difference being customer preference. It described washers with 3.6 versus 3.7 cubic feet of capacity as entirely interchangeable. Business Cycles Larger producers and importers generally described the LRW business cycles as consisting of important promotional periods (centered around particular holidays) in which large volumes of sales occur.18 They also tended to cite decreased sales since the onset of the 2007-09 recession. Smaller producers and importers were less likely to report business cycles distinctive to the LRW market. Among producers and importers, *** stated that the LRW market is not subject to distinctive business cycles. However, producers *** stated that it was. *** described LRW demand as having fallen during the recession in 2009, with *** describing demand as having remained poor since then. *** noted that the LRW market is subject to heavy promotional periods centered around holidays. Whirlpool attributed the size of the promotions in these periods to the influence of subject imports, describing past promotions as involving much smaller discounts than current promotions.19 However, subject importers described Whirlpool as one of the most aggressive LRW discounters.20 Additionally, importers *** stated that the LRW market is subject to distinctive business cycles. *** described generally higher sales in the second and third quarters of most years, coinciding somewhat with buying groups’ shows held in February and August by the three largest buyers’ groups: Nationwide, Mega, and AVB. It added that these groups represent about 30 percent of the U.S. market. *** described demand for LRWs as coming from three sources: nondiscretionary demand (i.e., the washer in a home breaks and needs replacement), home construction, and discretionary demand. It indicated that nondiscretionary demand and construction comprise about 90 percent of U.S. demand, but that discretionary demand is growing and is an important market for *** relative to ***.21 It stated that LRW demand is year-round and does not have a seasonal cycle, although in recent years there have been increased purchases around the times of large promotional activity, e.g., Black Friday.22 *** also noted the increased sales at promotional periods, but added that 2009-2011 saw decreased demand due to the slow economy. Among purchasers, 12 stated that the LRW market is not subject to distinct market cycles, and eight stated that it was. *** indicated that LRW demand was similar to that of many other products, i.e., driven by the times that consumers have to shop and by general economic conditions. *** added that unfavorable economic conditions had led to less replacement of LRWs before the end of their useful life. However, four purchasers described increased sales around holiday promotional periods. Two others reported that LRW demand was mostly replacement, and thus, according to ***, fairly consistent year-round. *** added that there is some uptick in replacement demand in Fall and Winter, when consumers begin washing bulkier clothing. Producers *** and importers *** stated that there had not been any changes in the business cycle or conditions of competition for LRWs since January 1, 2009. However, producers *** stated that there had been, citing changes from increased subject imports. *** described past promotional discounts as typically 10-15 percent until Samsung drove discounts to 35 percent in June 2011. *** stated that subject
18 Whirlpool stated that the products chosen for promotional periods depend on negotiations between the
supplier and the retailer. Hearing transcript, p. 138 (Abdelnour). It added that some large retailers now approach suppliers with proposals for particular promotions, proposals in which the supplier is asked for large volumes of particular LRW products at particular prices. Hearing transcript, p. 141 (Abdelnour).
19 Hearing transcript, p. 99 (Fettig). 20 Hearing transcript, p. 208 (Dexter). 21 ***. 22 In an answer to a different question, *** described Black Friday as now accounting for 17 percent of its annual
LRW sales volume.
II-9
imports sought market share through price decreases, especially with the introduction of high-efficiency top-load LRWs in 2010 (for LG) and 2011 (for Samsung). Importer *** described recent distressed economic conditions as changing the LRW market into more of a promotional market. *** similarly indicated that difficult economic conditions had reduced demand associated with new home construction and discretionary replacement. *** stated that energy efficiency had become as important as capacity in consumers’ purchasing decisions, and added that Whirlpool’s ability to receive tax credits for its Ohio production of energy efficient LRWs had allowed Whirlpool to reduce LRW market prices. Among purchasers, seven indicated that there had been changes in the business cycle for LRWs since January 1, 2009, and five indicated that there had not. Among those describing a change, *** described decreased demand due to the depressed U.S. housing market. *** described increased promotional activity around holidays, and *** added that such activity has increased to the point where during those periods, it needs to sell product at close to its cost. *** stated that there was increasing promotional pricing outside of holidays as well. *** described product features driving sales. Demand Trends Market participants disagreed somewhat over the effect of the recession on U.S. LRW demand. Whirlpool described 2009 demand as weak due to the recession, and added that the apparent rise in demand after 2009 was in part due to the 2010 “Cash for Appliances” Federal program, which granted rebates on purchases of energy efficient appliances in 2010.23 However, once that program had expired, demand remained weak.24 LG described U.S. new home completions as a good indicator of demand for LRWs not sold for replacement purposes, and noted that January-October 2012 new home completions were higher than such completions for January-October 2011. It added that many real estate-related indicators are forecast to rise in 2013. 25 Market participants generally described demand for small conventional washers and front-load LRWs as flat or declining, while demand for top-load, high-efficiency, LRWs grew. Table II-2 summarizes producers’, importers’, and purchasers’ descriptions of how demand for different types of washers, both within and outside the United States, have changed since January 1, 2009. Purchasers were also asked to forecast future demand, and most saw the current identified trends continuing. U.S. market participants often had no knowledge of non-U.S. markets or described them as stable.
23 Posthearing brief of Whirlpool, p. II-58. 24 Hearing transcript, pp. 125-26 (Fettig). 25 Prehearing brief of LG, pp. 29 and 34.
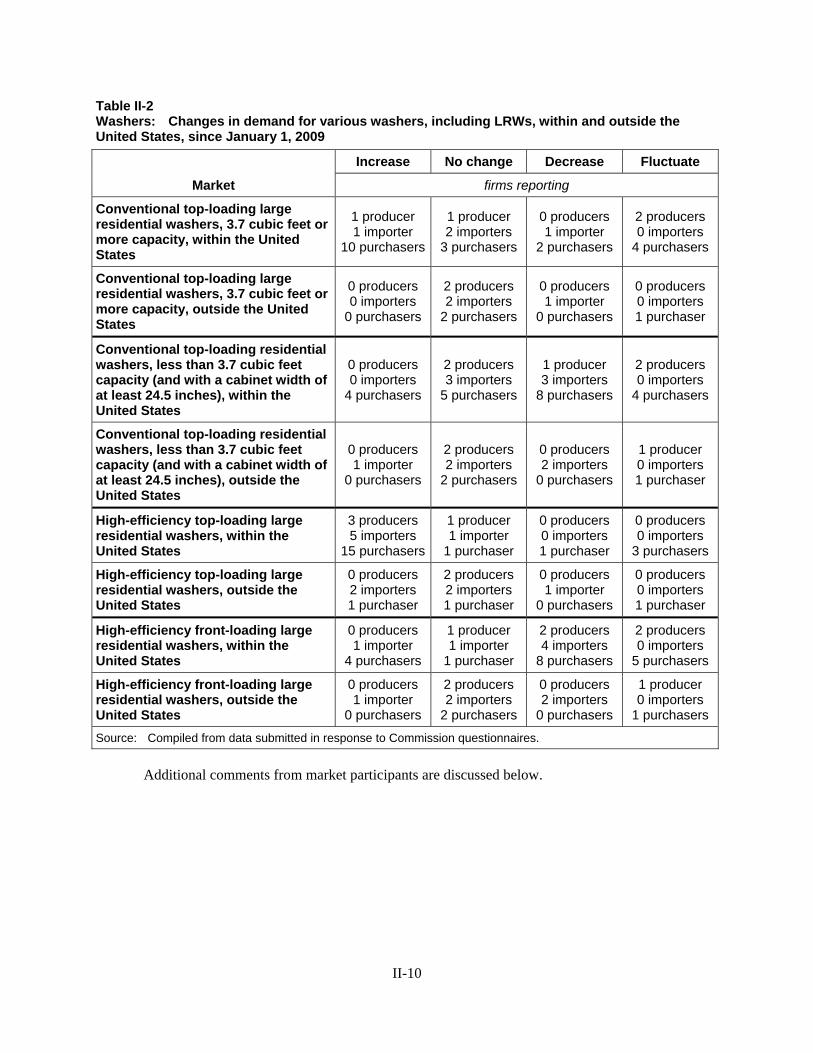
II-10
Table II-2 Washers: Changes in demand for various washers, including LRWs, within and outside the United States, since January 1, 2009
Additional comments from market participants are discussed below.
Market
Increase No change Decrease Fluctuate
firms reporting
Conventional top-loading large residential washers, 3.7 cubic feet or more capacity, within the United States
1 producer 1 importer
10 purchasers
1 producer 2 importers
3 purchasers
0 producers 1 importer
2 purchasers
2 producers 0 importers
4 purchasers
Conventional top-loading large residential washers, 3.7 cubic feet or more capacity, outside the United States
0 producers 0 importers
0 purchasers
2 producers 2 importers
2 purchasers
0 producers 1 importer
0 purchasers
0 producers 0 importers 1 purchaser
Conventional top-loading residential washers, less than 3.7 cubic feet capacity (and with a cabinet width of at least 24.5 inches), within the United States
0 producers 0 importers
4 purchasers
2 producers 3 importers
5 purchasers
1 producer 3 importers
8 purchasers
2 producers 0 importers
4 purchasers
Conventional top-loading residential washers, less than 3.7 cubic feet capacity (and with a cabinet width of at least 24.5 inches), outside the United States
0 producers 1 importer
0 purchasers
2 producers 2 importers
2 purchasers
0 producers 2 importers
0 purchasers
1 producer 0 importers 1 purchaser
High-efficiency top-loading large residential washers, within the United States
3 producers 5 importers
15 purchasers
1 producer 1 importer
1 purchaser
0 producers 0 importers 1 purchaser
0 producers 0 importers
3 purchasers
High-efficiency top-loading large residential washers, outside the United States
0 producers 2 importers 1 purchaser
2 producers 2 importers 1 purchaser
0 producers 1 importer
0 purchasers
0 producers 0 importers 1 purchaser
High-efficiency front-loading large residential washers, within the United States
0 producers 1 importer
4 purchasers
1 producer 1 importer
1 purchaser
2 producers 4 importers
8 purchasers
2 producers 0 importers
5 purchasers
High-efficiency front-loading large residential washers, outside the United States
0 producers 1 importer
0 purchasers
2 producers 2 importers
2 purchasers
0 producers 2 importers
0 purchasers
1 producer 0 importers
1 purchasers
Source: Compiled from data submitted in response to Commission questionnaires.
II-11
Conventional top-loading large residential washers with 3.7 cubic feet or more capacity Among factors cited for demand changes in conventional top loading LRWs with 3.7 cubic feet or more capacity, *** cited *** of this product. Importers generally expressed a lack of familiarity with the market for this product, describing it as a small segment of the market (***) or likely to be phased out of production by 2015 due to U.S. Department of Energy efficiency requirements (***). However, *** stated that the market share for this product seemed to be increasing. *** also stated that in the rest of the world, front-load washers are generally more popular due to their generally superior energy efficiency. Purchasers’ comments ranged widely, but supported the ideas that new regulations would crimp demand for this product, while others noted that consumers have a preference for larger washers that allow fewer loads to wash the same amount of clothes. Purchasers also described their expectations of the demand trends for this type of LRW. Nine purchasers expected increased demand, five expected decreased demand, and five expected stable or fluctuating demand. Additionally, *** stated that demand would increase if prices fell. Those expecting increased demand cited increased efficiency (and may have been referring to high-efficiency top-loads) and consumer preference for larger washers. Those expecting a decrease in demand cited competition from high-efficiency LRWs and government regulations as restraining future demand for conventional LRWs. Conventional top-loading residential washers with less than 3.7 cubic feet capacity
Among factors cited for demand changes in conventional top loading residential washers with less
than 3.7 cubic feet capacity, *** stated that falling prices for high-efficiency washers had lowered demand for smaller conventional washers. *** cited ***. *** stated that it had already phased out its products, and added that these products would likely be phased out of production by 2015 due to U.S. Department of Energy efficiency requirements. *** described high-efficiency top-load LRWs as replacing top-load conventional washers since their introduction in 2008. *** agreed on this substitution, but described it as occurring in 2011 rather than earlier. However, *** described some increased demand for conventional top-load washers as the price of high-efficiency top-load LRWs had increased over the last 12 months. *** estimated that demand for conventional top-load washers was increasing in emerging markets, and *** stated that demand was decreasing in Canada. Purchasers mentioned many of the same trends as producers and importers (e.g., regulations, long-term demand declines) as affecting demand.
Purchasers also described their expectations of the demand trends for this type of washer. Five purchasers expected increased demand, nine expected decreased demand, and six expected stable demand. *** stated there is no functional difference between this type of washers and larger conventional LRWs. Those expecting decreased demand cited competition from high efficiency LRWs and consumer desire for larger washers. Those expecting increased demand cited the tight budgets of many consumers, as this type of washer is usually the least expensive. High-efficiency top-loading large residential washers
Among factors cited for demand changes in high-efficiency top-loading large residential washers,
*** described increased demand due to an increased presence of allegedly lower-priced subject imports. Among importers, *** attributed increased demand to the availability of new models and features, while *** cited improved energy efficiency of this type of LRW. *** described the expansion of this product to lower price points as having allowed it to take market share from conventional top-load washers, while the improved features and energy efficiency allowed it to take market share from front-load LRWs. *** stated that the improved efficiency and lower prices of high-efficiency top-loading LRWs had led to increased demand, as had some consumer dissatisfaction with front-loading LRWs. *** stated that ***, domestic producers have been increasing market share for this product. Purchasers cited many of the same factors for increased demand for these LRWs, particularly emphasizing that consumer interest in the energy
II-12
efficiency of these LRWs fit with their comfort using a top-load washer (as opposed to a front-load). Purchasers also listed the increased number of models, improved features, and improved aesthetics of high-efficiency top-load LRWs as reasons for their popularity with consumers.
Globally, *** described demand increasing in Canada, and *** described demand as increasing in global markets, such as Latin America, where top-loading washers remain the dominant type of washer. *** stated that demand was decreasing due to the global economic downturn.
Purchasers also described their expectations of the demand trends for this type of LRW. Nineteen purchasers expected increased demand while only one expected decreased demand. The purchasers anticipating increased demand described these LRWs as a better value for consumers, as energy efficient during a time of rising energy costs, and/or as taking market share from front-load LRWs. Several purchasers expected consumer preference for this type of LRW to rise as consumer familiarity with the product increases. ***, however, anticipated a decrease in demand due to on-line complaints about these LRWs’ performance. High-efficiency front-loading large residential washers
Among factors cited for demand changes in high-efficiency front-loading large residential washers,
*** described low-priced subject imports of top-load LRWs as driving down demand for front-load LRWs. Similarly, *** added that top-load LRWs had taken retailer floor space from front-load LRWs, and driven the retail share of front-load models available for less than $525 to 30 percent of the front-load LRW market. *** also stated that while the preliminary phase staff report cited problems with mold affecting front-load LRW demand, such complaints have been few and date to the 1990s. Among importers, *** described demand for high-efficiency front-loading LRWs decreasing as consumers switched to high-efficiency top-loading LRWs, especially those with higher efficiency and larger capacities. *** attributed decreased demand for front-loading LRWs to distressed credit markets and the housing market downturn. *** stated that current demand for high-efficiency front-load LRWs was trending down, but that there were potential long-term growth prospects. *** described increased demand as coming from higher energy efficiency. Purchasers listed many of the same issues in describing why demand for front-load high-efficiency LRWs had decreased or fluctuated. Purchasers named the need for a pedestal in a front-load washer, more available features on high-efficiency top-load LRWs, increased prices, and reputational issues with mold and vibration.
Globally, *** indicated that demand had decreased due to decreased Canadian demand (***) and due to the global recession (***). However, *** described this type of washer as popular in Europe, and expected continued demand there.
Purchasers also described their expectations of the demand trends for this type of LRW. Two purchasers expected increased demand, 14 expected decreased demand, and four expected stable or fluctuating demand. One purchaser characterized here as expecting increased demand, however, stated that the segment would not grow as quickly as high-efficiency top-load LRWs would. Those expecting a decrease in demand for front-load high efficiency LRWs cited consumer dissatisfaction with performance issues (including mold, odor, and vibration), consumer preference for top-load washers generally, and a switch underway toward high-efficiency top-load LRWs and away from front-load LRWs.
SUBSTITUTABILITY ISSUES
The degree of substitution between domestic and imported LRWs depends upon such factors as
relative prices, quality, features offered, and “the fit, feel, and finish” of the machine. Based on available data, staff believes that consumers substitute between the domestic product and similar products imported from Korea and Mexico to a moderately high degree. A majority of purchasers usually found U.S., Korean, and Mexican product to be comparable in most purchasing factors.
II-13
Lead Times
*** mostly sold LRWs out of inventory, *** usually sold LRWs produced to order. Inventory sales had lead times usually under a week, while sales produced to order had lead times of several weeks. U.S. producer *** reported that *** percent of its sales are from inventory and *** percent are produced to order. For the produced-to-order sales, *** reported average lead times of *** weeks, but did not indicate a lead time for sales from inventory. U.S. producer *** reported that *** percent of its sales are from inventory and *** percent are produced to order; lead times were *** days for the inventory sales and *** days for produced-to-order sales. *** reported that *** percent of its U.S. sales of Korean LRWs are from its U.S. inventory and that lead times for these sales are *** days. ***’s produced-to-order sales have lead times of *** weeks. *** reported that *** percent of its U.S. sales of Korean LRWs are from its U.S. inventory, with lead times of *** days and that *** percent are produced to order with lead times of *** weeks. *** reported that *** percent of its U.S. sales of Mexican LRWs are from its U.S. inventory, with lead times of *** days and that *** percent are produced to order with lead times of *** days. *** reported that *** percent of its U.S. sales of *** LRWs are from its U.S. inventory and that lead times for these sales are *** days. *** produced-to-order sales have lead times of *** weeks. Factors Affecting Purchasing Decisions The most often cited top three factors firms consider in their purchasing decisions for LRWs were consumer demand, brand, and price/value, as shown in table II-3. Table II-3 LRWs: Ranking of factors used in purchasing decisions as reported by U.S. purchasers
* * * * * * *
In additional comments, *** stated that LG and Samsung have typically invested more in training and recognition programs for *** sale associates, including putting product in sales associates’ homes. *** also emphasized that design, quality, innovation, and minimal need for repair are important factors. *** indicated that the market for a purchaser looking for a $300 washer is very different than that for a purchaser who is seeking a $900 washer. In the former, price will play a larger role, and in the latter, *** will play a larger role.26 Importance of purchase factors Purchasers were asked to rate the importance of 21 factors in their purchasing decisions (table II-4). The most important factors were availability, margin opportunity (i.e., potential profitability), and “fit, finish, and feel.” Price, quality meeting industry standards, and design/styling were also important factors.
26 In written statements, buyers’ groups generally described major U.S. and subject import brands of LRWs as
comparable on quality and thus competing on price. See written statements of AVB/BrandSource, Nationwide, and NATM, December 4, 2012.
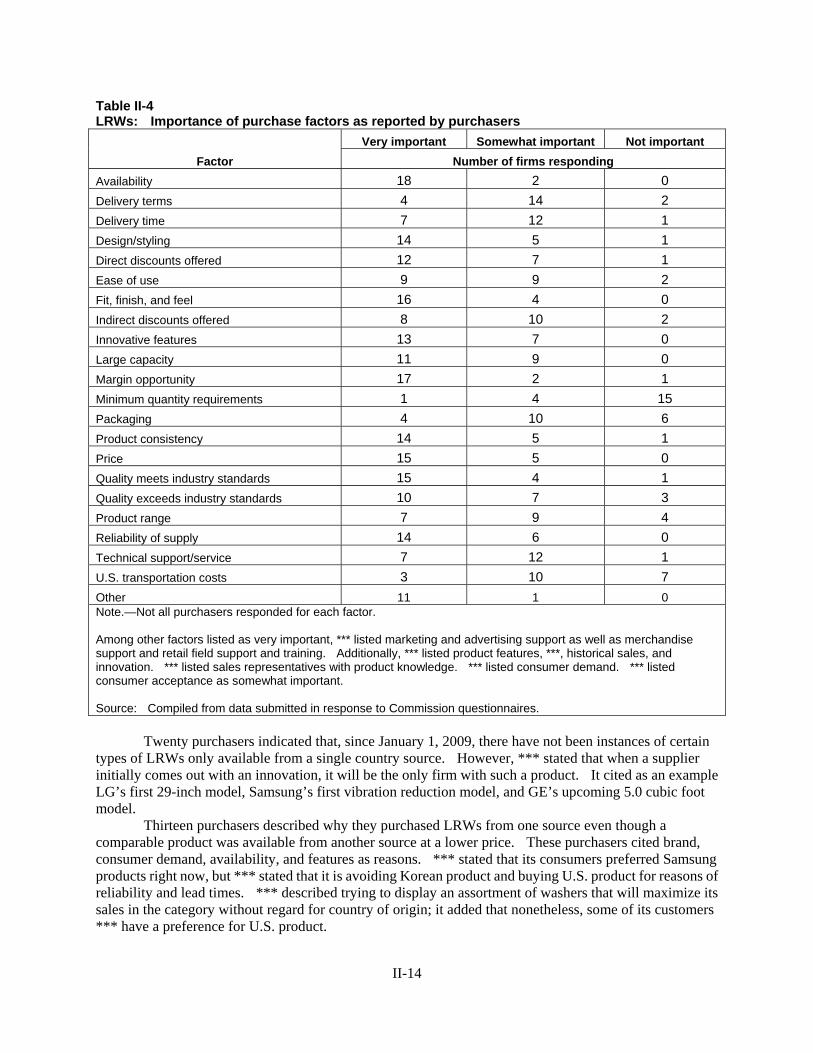
II-14
Table II-4 LRWs: Importance of purchase factors as reported by purchasers
Factor Very important Somewhat important Not important
Number of firms responding Availability 18 2 0 Delivery terms 4 14 2 Delivery time 7 12 1 Design/styling 14 5 1 Direct discounts offered 12 7 1 Ease of use 9 9 2 Fit, finish, and feel 16 4 0 Indirect discounts offered 8 10 2 Innovative features 13 7 0 Large capacity 11 9 0 Margin opportunity 17 2 1 Minimum quantity requirements 1 4 15 Packaging 4 10 6 Product consistency 14 5 1 Price 15 5 0 Quality meets industry standards 15 4 1 Quality exceeds industry standards 10 7 3 Product range 7 9 4 Reliability of supply 14 6 0 Technical support/service 7 12 1 U.S. transportation costs 3 10 7 Other 11 1 0 Note.—Not all purchasers responded for each factor. Among other factors listed as very important, *** listed marketing and advertising support as well as merchandise support and retail field support and training. Additionally, *** listed product features, ***, historical sales, and innovation. *** listed sales representatives with product knowledge. *** listed consumer demand. *** listed consumer acceptance as somewhat important. Source: Compiled from data submitted in response to Commission questionnaires. Twenty purchasers indicated that, since January 1, 2009, there have not been instances of certain types of LRWs only available from a single country source. However, *** stated that when a supplier initially comes out with an innovation, it will be the only firm with such a product. It cited as an example LG’s first 29-inch model, Samsung’s first vibration reduction model, and GE’s upcoming 5.0 cubic foot model. Thirteen purchasers described why they purchased LRWs from one source even though a comparable product was available from another source at a lower price. These purchasers cited brand, consumer demand, availability, and features as reasons. *** stated that its consumers preferred Samsung products right now, but *** stated that it is avoiding Korean product and buying U.S. product for reasons of reliability and lead times. *** described trying to display an assortment of washers that will maximize its sales in the category without regard for country of origin; it added that nonetheless, some of its customers *** have a preference for U.S. product.
II-15
When asked how often their firm purchased LRWs offered at the lowest price, three purchasers answered “always,” three purchasers answered “usually,” and 15 purchasers answered “sometimes.” Importance of producer and country of origin As shown in the tabulation below, many purchasers make decisions based on producer, while the purchasers’ customers (consumers) are less likely to make decisions based on producer. Neither purchasers nor their customers usually make decisions based on the country of origin of the LRWs they purchase. Purchasers / Customer Decision Always Usually Sometimes Never Purchaser makes decision based on producer 5 4 4 2 Purchaser’s customer makes decision based on producer 0 9 6 1 Purchaser makes decision based on country 0 2 6 8 Purchaser’s customer makes decisions based on country 0 2 12 1 Purchasers cited supplier relationships, customer brand loyalty, quality and price as reasons to make decisions based on producer. *** described consumers as familiar with and trusting of LG’s and Samsung’s brands. *** indicated that it would rather buy Korean product than Chinese product. Purchasers saw brand, reputation, price/feature value, innovation, quality, national advertising campaigns, and price as key reasons why consumers would make a purchasing decision based on producer. Neither purchasers nor consumers usually make decisions based on the country of origin of LRWs. Purchasers stated that their reasons for preferring product from a particular country reflect their customers’ preferences or their own familiarity with suppliers. Several purchasers described some of their customers preferring U.S.-produced product, but noted that many customers are not aware of country of origin, are not willing to pay much more for U.S. origin, or represent only a small portion of all customers. Thirteen purchasers stated that neither they nor their customers ever specifically ordered LRWs from one country in particular over other sources of supply. Seven stated that they did, with five of those explaining that some of their customers have a preference for U.S.-made product. However, some of those added that even for those customers, brand and financial considerations may be more important. Twelve purchasers reported that purchasing U.S.-produced product was not an important factor in their purchasing decisions. *** reported that domestic product was required by law for sale to Federal or state buyers. Five (including ***) reported that it was required by some of their customers, with *** indicating that about 20 percent of its customers had such preferences. *** indicated that some customers would prefer to purchase domestic LRWs, but other issues (such as quality, features, reliability, and price) also play an important role for those customers. *** indicated that among LRW vendors, only Samsung had sales representatives that could explain why their product was better than that of competitors. Changes in purchasing patterns Purchasers were asked about changes in their purchasing patterns from different sources27 since January 1, 2009, as summarized in table II-5.
27 ***.
II-16
Table II-5 LRWs: Changes in purchase patterns from various company sources
* * * * * * *
Purchasers increasing their purchases from Whirlpool cited increased consumer demand and increased available supply as reasons. Those describing decreasing purchases from the United States cited U.S. producers moving production offshore and decreasing consumer demand. A majority of responding purchasers reported increased purchases from Korea, citing increased purchases from LG and Samsung, although *** decreased its purchases due to service issues. Purchasers that purchased more from Mexico often stated that they had done so due to their U.S. or Korean-based suppliers moving some production to Mexico or to lower prices available on Mexican product, including from Electrolux. Purchasers indicating that they purchased less from Germany cited the shutdown of German production by producers such as Whirlpool and Miele. Purchasers describing increased or fluctuating purchases from other countries cited suppliers moving production to other countries and/or growth in imports from China. Six purchasers reported that they had not changed suppliers since January 1, 2009. Fifteen reported that they had. Eight of these purchasers reported adding Samsung and/or LG, whereas none reported dropping those suppliers. Several purchasers reported that Bosch and Miele had discontinued LRW sales, and one added that it had dropped GE. *** stated that it had stopped purchasing ***. Three other purchasers indicated that they had increased their purchases of GE and/or Whirlpool LRWs, with two of those also purchasing more Electrolux LRWs. Fourteen purchasers were not aware of any new suppliers in the LRW market since January 1, 2009. Seven purchasers were, mostly naming Haier and Daewoo. *** indicated that it had encountered more Chinese producers attempting to enter the LRW market through trade shows or through producing for other firms’ brands. Purchasers were asked if they had solicited or requested a proposal for a product line review over 2009-2011. Two purchasers *** indicated that they had. *** described a review in March 2012 for ***. *** reported that they had a *** and an *** in February 2012. For the latter, it described accepting bids based on ***. Supplier certification Nineteen responding purchasers do not require that the LRWs they purchase be certified, while two (***) did. *** described its qualification process as extensive, and *** described its process as based on price, quality, timely availability, and the availability of parts. No supplier failed to certify at ***, but *** failed to certify at *** due to ***. Floor space Many retailers allocate floor space in their stores to particular LRW models. Whirlpool described competition by LRW suppliers for floor space in large retail stores as intense, and based on retailers’ assessment of which products offered the best margins (retail price less retailer cost). Whirlpool added that whenever it raises the price on one LRW, retailers may take it to a “line review” in which Whirlpool must rebid for the entire floor space.28 NATM and Whirlpool stated that the competition among suppliers to secure floor space is the most important level of competition, and that competition among consumers only comes after such flooring has occurred.29 However, Home Depot stated that the difference in its
28 Hearing transcript, pp. 37-38, (Abdelnour). 29 Hearing transcript, pp. 45 and 121 (Bilas), and 120-21 (Abdelnour).
II-17
margins between higher-priced LRWs and lower-priced washers are not usually large, so that it aims to floor models that will generate large sales volumes rather than flooring based predominantly on margin.30 Most retailers floors are staffed by salespeople who work on sales-based commission, although Home Depot has a non-commission, although perhaps smaller than other retailers, floor.31 Whirlpool described supplier competition at commission-floored retailers as particularly intense because salespeople are steered (through commissions) to sell the highest-margin (for the retailer) LRWs.32 Home Depot, however, stated that in the modern LRW market, neither retailers nor consumers can successfully steer consumers toward particular products.33 Commission questionnaires asked purchasers about the role floor space plays in their purchases of LRWs. Sixteen purchasers indicated that they allocated floor space to different types of LRWs at different prices, while five indicated that they did not. Of those that did, most cited consumer demand and the profitability of individual units as reasons for flooring. Several noted flooring models to provide variety and showcase lower priced or high-featured models. Those that did not had large showrooms where space was not an issue, carried a limited number of models, or had no retail showroom. Thirteen purchasers indicated that relative LRW pricing from different suppliers affected their floor space allocation decisions, but eight stated that it did not. Those that indicated that relative LRW pricing did affect their flooring decisions cited the importance of price and profitability. Some of those that did not indicated that non-price factors, including store size and ability to sell the product, played a larger role in flooring decisions. Nine purchasers indicated that they had not denied, nor threatened to deny, a floor spot to a particular LRW model because the supplier’s proposed price was too high, while ten indicated that they had done so. Several had done so because they believed that proposed prices would not result in sufficient sales. *** stated that it had done so with Whirlpool, and *** stated that it had done so with GE’s product produced in Kentucky. *** described doing so because ***. Fifteen purchasers factored expected profits into their decisions about which models and which suppliers will be allocated floor space, while six did not. Several purchasers described profitability as a key factor in flooring decisions. However, *** stated that margins were roughly similar across suppliers. Regarding specific brands, *** stated that it floors more LG and Samsung products due to consumer demand, *** stated that it floors more LG, Samsung, and Whirlpool products due to consumer demand, and *** stated that it floors more Electrolux products due to higher profitability.
Comparison of U.S.-Produced and Imported LRWs As can be seen in table II-6, a majority of purchasers reported that U.S., Korean, Mexican, and nonsubject-country LRWs were comparable with respect to the 21 factors listed in table II-4. However, a majority of responding purchasers found that U.S. LRWs were superior to Korean product with respect to availability and reliability of supply, as well as superior to Korean and Mexican LRWs with respect to delivery time. Half of responding purchasers reported that U.S. LRWs were inferior to Korean LRWs in terms of margin opportunity, while 5 of 15 responding purchasers reported that U.S. LRWs were inferior to Mexican LRWs in terms of this factor. While a minority of responding purchasers, some purchasers reported that U.S. LRWs were inferior to Korean and Mexican LRWs with respect to price and direct discounts, as well as in “fit, finish, and feel,” innovative features, and design/styling (for Korean LRWs).
30 Hearing transcript, pp. 240-41 (Baird). Separately, both Whirlpool and Home Depot discussed the industry custom of retailers negotiating for suppliers to provide funding for retailers to mark down the prices of floor models when clearing floor spots for new models. Hearing transcript, pp. 173 (Abdelnour) and 264 (Baird). 31 Hearing transcript, p. 122 (Bilas). 32 Hearing transcript, p. 123 (Abdelnour). 33 Hearing transcript, p. 240 (Baird).
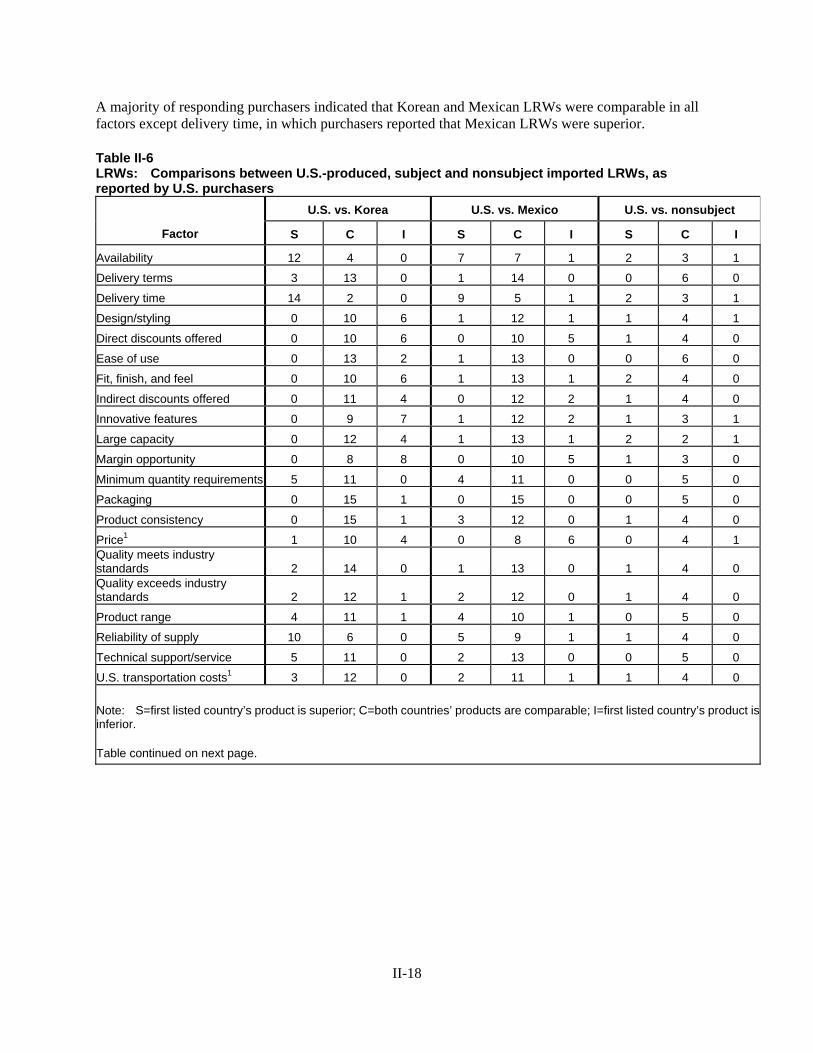
II-18
A majority of responding purchasers indicated that Korean and Mexican LRWs were comparable in all factors except delivery time, in which purchasers reported that Mexican LRWs were superior. Table II-6 LRWs: Comparisons between U.S.-produced, subject and nonsubject imported LRWs, as reported by U.S. purchasers
Factor
U.S. vs. Korea U.S. vs. Mexico U.S. vs. nonsubject
S C I S C I S C I
Availability 12 4 0 7 7 1 2 3 1
Delivery terms 3 13 0 1 14 0 0 6 0
Delivery time 14 2 0 9 5 1 2 3 1
Design/styling 0 10 6 1 12 1 1 4 1
Direct discounts offered 0 10 6 0 10 5 1 4 0
Ease of use 0 13 2 1 13 0 0 6 0
Fit, finish, and feel 0 10 6 1 13 1 2 4 0
Indirect discounts offered 0 11 4 0 12 2 1 4 0
Innovative features 0 9 7 1 12 2 1 3 1
Large capacity 0 12 4 1 13 1 2 2 1
Margin opportunity 0 8 8 0 10 5 1 3 0
Minimum quantity requirements 5 11 0 4 11 0 0 5 0
Packaging 0 15 1 0 15 0 0 5 0
Product consistency 0 15 1 3 12 0 1 4 0
Price1 1 10 4 0 8 6 0 4 1 Quality meets industry standards 2 14 0 1 13 0 1 4 0 Quality exceeds industry standards 2 12 1 2 12 0 1 4 0
Product range 4 11 1 4 10 1 0 5 0
Reliability of supply 10 6 0 5 9 1 1 4 0
Technical support/service 5 11 0 2 13 0 0 5 0
U.S. transportation costs1 3 12 0 2 11 1 1 4 0
Note: S=first listed country’s product is superior; C=both countries’ products are comparable; I=first listed country’s product isinferior. Table continued on next page.
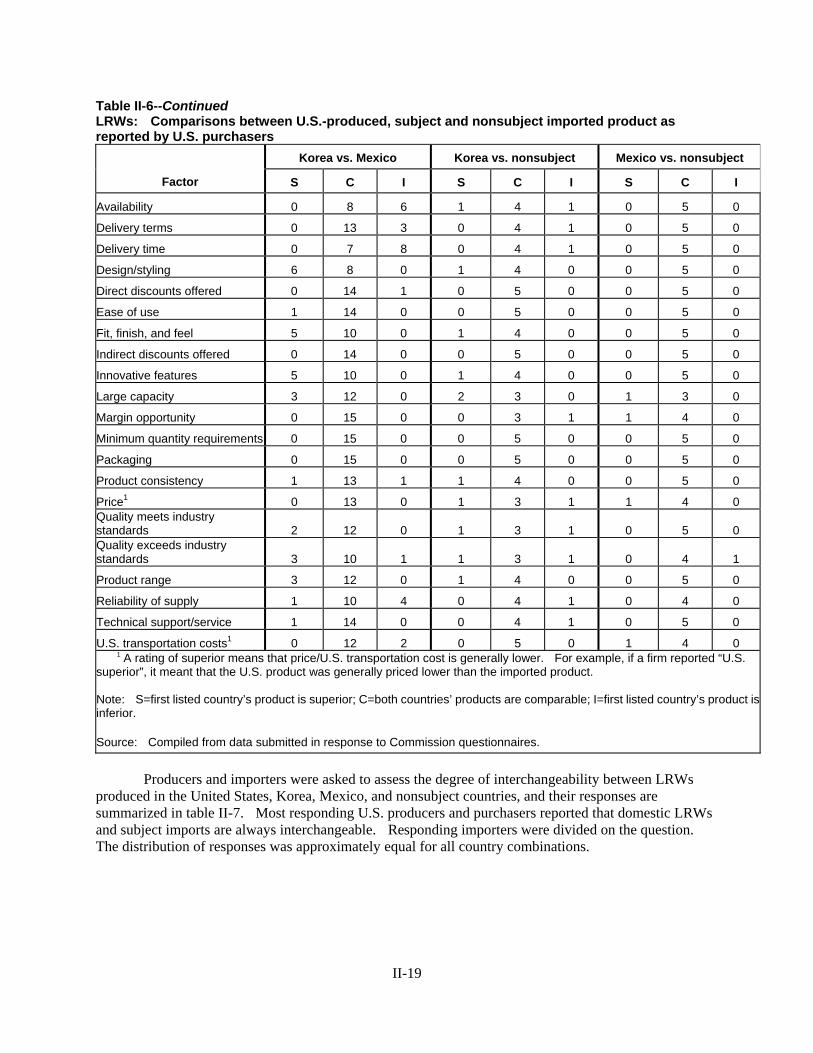
II-19
Table II-6--Continued LRWs: Comparisons between U.S.-produced, subject and nonsubject imported product as reported by U.S. purchasers
Factor
Korea vs. Mexico Korea vs. nonsubject Mexico vs. nonsubject
S C I S C I S C I
Availability 0 8 6 1 4 1 0 5 0
Delivery terms 0 13 3 0 4 1 0 5 0
Delivery time 0 7 8 0 4 1 0 5 0
Design/styling 6 8 0 1 4 0 0 5 0
Direct discounts offered 0 14 1 0 5 0 0 5 0
Ease of use 1 14 0 0 5 0 0 5 0
Fit, finish, and feel 5 10 0 1 4 0 0 5 0
Indirect discounts offered 0 14 0 0 5 0 0 5 0
Innovative features 5 10 0 1 4 0 0 5 0
Large capacity 3 12 0 2 3 0 1 3 0
Margin opportunity 0 15 0 0 3 1 1 4 0
Minimum quantity requirements 0 15 0 0 5 0 0 5 0
Packaging 0 15 0 0 5 0 0 5 0
Product consistency 1 13 1 1 4 0 0 5 0
Price1 0 13 0 1 3 1 1 4 0 Quality meets industry standards 2 12 0 1 3 1 0 5 0 Quality exceeds industry standards 3 10 1 1 3 1 0 4 1
Product range 3 12 0 1 4 0 0 5 0
Reliability of supply 1 10 4 0 4 1 0 4 0
Technical support/service 1 14 0 0 4 1 0 5 0
U.S. transportation costs1 0 12 2 0 5 0 1 4 0 1 A rating of superior means that price/U.S. transportation cost is generally lower. For example, if a firm reported “U.S. superior”, it meant that the U.S. product was generally priced lower than the imported product. Note: S=first listed country’s product is superior; C=both countries’ products are comparable; I=first listed country’s product isinferior. Source: Compiled from data submitted in response to Commission questionnaires. Producers and importers were asked to assess the degree of interchangeability between LRWs produced in the United States, Korea, Mexico, and nonsubject countries, and their responses are summarized in table II-7. Most responding U.S. producers and purchasers reported that domestic LRWs and subject imports are always interchangeable. Responding importers were divided on the question. The distribution of responses was approximately equal for all country combinations.
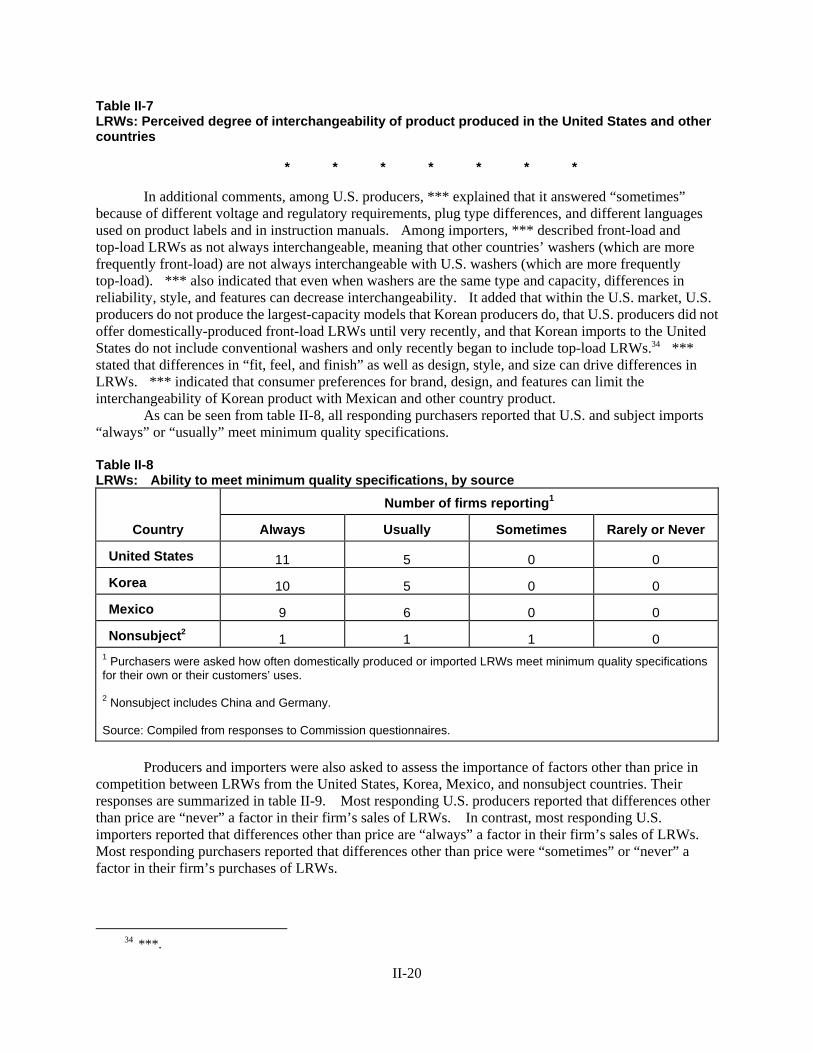
II-20
Table II-7 LRWs: Perceived degree of interchangeability of product produced in the United States and other countries
* * * * * * *
In additional comments, among U.S. producers, *** explained that it answered “sometimes” because of different voltage and regulatory requirements, plug type differences, and different languages used on product labels and in instruction manuals. Among importers, *** described front-load and top-load LRWs as not always interchangeable, meaning that other countries’ washers (which are more frequently front-load) are not always interchangeable with U.S. washers (which are more frequently top-load). *** also indicated that even when washers are the same type and capacity, differences in reliability, style, and features can decrease interchangeability. It added that within the U.S. market, U.S. producers do not produce the largest-capacity models that Korean producers do, that U.S. producers did not offer domestically-produced front-load LRWs until very recently, and that Korean imports to the United States do not include conventional washers and only recently began to include top-load LRWs.34 *** stated that differences in “fit, feel, and finish” as well as design, style, and size can drive differences in LRWs. *** indicated that consumer preferences for brand, design, and features can limit the interchangeability of Korean product with Mexican and other country product. As can be seen from table II-8, all responding purchasers reported that U.S. and subject imports “always” or “usually” meet minimum quality specifications. Table II-8 LRWs: Ability to meet minimum quality specifications, by source
Country
Number of firms reporting1
Always Usually Sometimes Rarely or Never
United States 11 5 0 0
Korea 10 5 0 0
Mexico 9 6 0 0
Nonsubject2 1 1 1 0 1 Purchasers were asked how often domestically produced or imported LRWs meet minimum quality specifications for their own or their customers’ uses. 2 Nonsubject includes China and Germany. Source: Compiled from responses to Commission questionnaires.
Producers and importers were also asked to assess the importance of factors other than price in competition between LRWs from the United States, Korea, Mexico, and nonsubject countries. Their responses are summarized in table II-9. Most responding U.S. producers reported that differences other than price are “never” a factor in their firm’s sales of LRWs. In contrast, most responding U.S. importers reported that differences other than price are “always” a factor in their firm’s sales of LRWs. Most responding purchasers reported that differences other than price were “sometimes” or “never” a factor in their firm’s purchases of LRWs.
34 ***.
II-21
Table II-9 LRWs: Differences other than price between products from different sources
* * * * * * *
In further comments, *** stated that product features and other factors (e.g., availability, quality) are assessed in light of price, and cited ***) frequent statement that ***. *** stated that quality, availability, transportation network, product range and technical support can affect price, and cited as an example ***. Among importers, *** stated that factors other than price play an important role in consumers’ decisions, and cited design, technology, style, appearance, quality, size, and “fit and finish,” in addition to availability and customer service. *** stated that consumers look primarily at LRWs’ washability performance, capacity, look and feel, and brand. *** also listed numerous non-price factors that differentiate LRWs from different countries, including capacity, features, reliability ratings, style, colors, and warranty. *** added that it had been rated number one in LRW customer satisfaction by ***. *** added that it does not participate in the U.S. washer market segments most dominated by price-conscious consumers, i.e., the small conventional washer sold to young families and other lower-income consumers. Purchasers cited quality, availability, transportation, customer demand, brand, and after-sale support as important non-price factors, without specifying which firms (if any) generally perform better on those factors. More specifically, *** indicated that home delivery is a major incentive for it to sell Whirlpool’s products. *** stated that Korean suppliers have a reputation for an inability to provide replacement parts quickly. *** described U.S. and Korean LRW quality as comparable, and added that it does not yet know if new plants in Mexico will also produce comparable quality product.
ELASTICITY ESTIMATES This section discusses elasticity estimates. Parties were encouraged to comment on these estimates in their prehearing and/or posthearing briefs.35
U.S. Supply Elasticity36
The domestic supply elasticity for LRWs measures the sensitivity of the quantity supplied by U.S. producers to changes in the U.S. market price of LRWs. The elasticity of domestic supply depends on several factors including the level of excess capacity, the ease with which producers can alter capacity, producers’ ability to shift to production of other products, the existence of inventories, and the availability of alternate markets for U.S.-produced LRWs. Analysis of these factors earlier indicates that the U.S. industry is likely to be able to increase or decrease shipments to the U.S. market; an estimate in the range of 4 to 8 is suggested.
U.S. Demand Elasticity
The U.S. demand elasticity for LRWs measures the sensitivity of the overall quantity demanded to
a change in the U.S. market price of LRWs. This estimate depends on factors discussed earlier such as the availability of substitute products. In the prehearing report, staff estimated that the U.S. demand elasticity for LRWs falls in the range of -0.3 to -0.8. LG objected to this range as not reflecting the higher demand elasticity of LRWs not sold only for replacement purposes.37 Staff is revising its range to -0.3 to -1.0 to
35 In its questionnaire, ***. 36 A supply function is not defined in the case of a non-competitive market.
37 Prehearing brief of LG, exhibit 9.
II-22
cover these objections, while noting that the large percentage of LRWs sold for replacement purposes likely does restrain demand elasticity.
Substitution Elasticity
The substitution elasticity measures the responsiveness of the relative U.S. consumption levels of the subject imports and the domestic like products to changes in their relative prices. This reflects how easily purchasers switch from the U.S. product to the subject products (or vice versa) when prices change. The elasticity of substitution depends upon the extent of product differentiation between the domestic and imported products. Product differentiation, in turn, depends upon such factors as quality (e.g., chemistry, appearance, etc.) and conditions of sale (availability, sales terms/discounts/promotions, etc.). In the prehearing report, staff estimated that the substitution elasticity for LRWs falls in the range of 3 to 6. LG objected that this range did not reflect alleged differences between LRWs discussed in the marketing studies submitted in these investigations. It added that under a wider scope that included smaller, conventional washers, the substitution elasticity would be lower due to the lack of subject imports of smaller, conventional washers.38 Staff acknowledges that a wider scope would change the substitution elasticity; otherwise, it is maintaining its estimate, which is based on analysis of all data submitted in the investigation, including purchaser responses summarized in this chapter.
38 Prehearing brief of LG, exhibit 9.
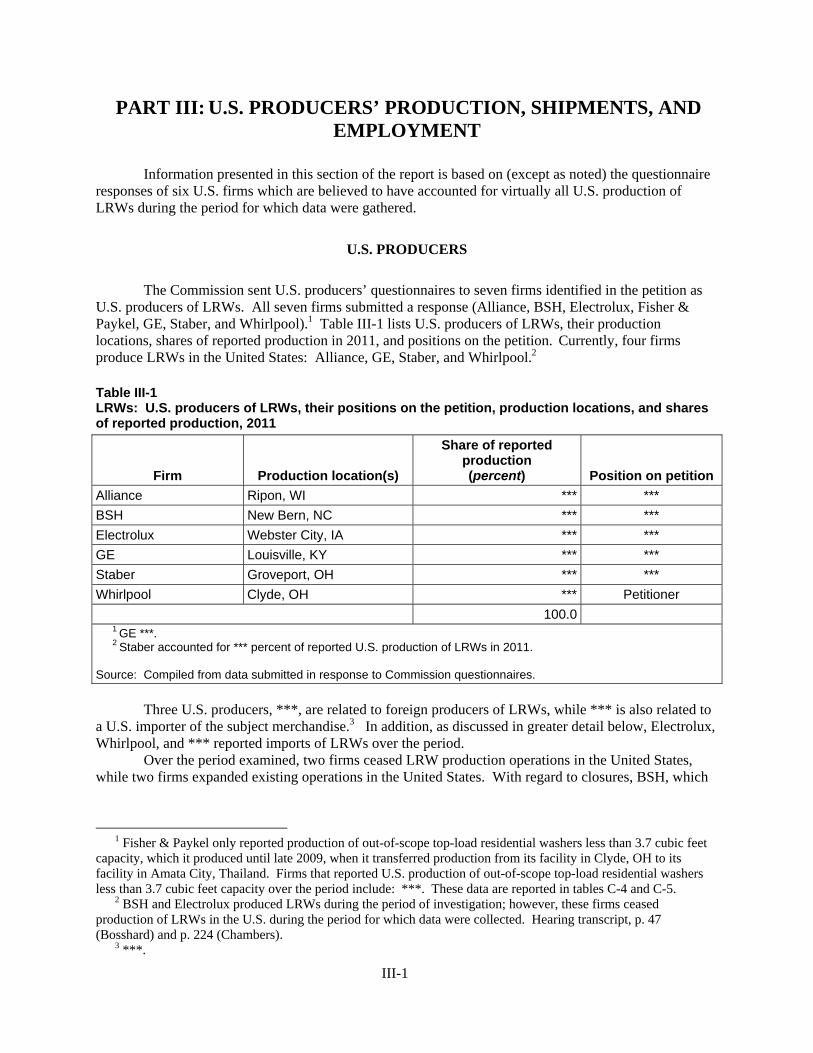
III-1
PART III: U.S. PRODUCERS’ PRODUCTION, SHIPMENTS, AND EMPLOYMENT
Information presented in this section of the report is based on (except as noted) the questionnaire responses of six U.S. firms which are believed to have accounted for virtually all U.S. production of LRWs during the period for which data were gathered.
U.S. PRODUCERS
The Commission sent U.S. producers’ questionnaires to seven firms identified in the petition as U.S. producers of LRWs. All seven firms submitted a response (Alliance, BSH, Electrolux, Fisher & Paykel, GE, Staber, and Whirlpool).1 Table III-1 lists U.S. producers of LRWs, their production locations, shares of reported production in 2011, and positions on the petition. Currently, four firms produce LRWs in the United States: Alliance, GE, Staber, and Whirlpool.2 Table III-1 LRWs: U.S. producers of LRWs, their positions on the petition, production locations, and shares of reported production, 2011
Firm Production location(s)
Share of reported production (percent) Position on petition
Alliance Ripon, WI *** *** BSH New Bern, NC *** *** Electrolux Webster City, IA *** *** GE Louisville, KY *** *** Staber Groveport, OH *** *** Whirlpool Clyde, OH *** Petitioner 100.0 1 GE ***. 2 Staber accounted for *** percent of reported U.S. production of LRWs in 2011. Source: Compiled from data submitted in response to Commission questionnaires.
Three U.S. producers, ***, are related to foreign producers of LRWs, while *** is also related to
a U.S. importer of the subject merchandise.3 In addition, as discussed in greater detail below, Electrolux, Whirlpool, and *** reported imports of LRWs over the period.
Over the period examined, two firms ceased LRW production operations in the United States, while two firms expanded existing operations in the United States. With regard to closures, BSH, which
1 Fisher & Paykel only reported production of out-of-scope top-load residential washers less than 3.7 cubic feet
capacity, which it produced until late 2009, when it transferred production from its facility in Clyde, OH to its facility in Amata City, Thailand. Firms that reported U.S. production of out-of-scope top-load residential washers less than 3.7 cubic feet capacity over the period include: ***. These data are reported in tables C-4 and C-5.
2 BSH and Electrolux produced LRWs during the period of investigation; however, these firms ceased production of LRWs in the U.S. during the period for which data were collected. Hearing transcript, p. 47 (Bosshard) and p. 224 (Chambers).
3 ***.
III-2
produced front-load LRWs, closed its New Bern, NC facility in May 2011.4 Electrolux, which produced front-load LRWs and out-of-scope top-load residential washers less than 3.7 cubic feet capacity, closed its facility in Webster City, IA in April 2011.5 Electrolux currently produces front load LRWs and out-of-scope top-load residential washers less than 3.7 cubic feet capacity at its facility in Juarez, Mexico.6
With regard to expansions, GE initiated a $150 million investment at its Louisville, KY facility to produce top-load and front-load LRWs in 2010. Prior to 2012, when GE began producing top-load LRWs, the Louisville, KY facility had engaged solely in the production of out-of-scope top-load residential washers less than 3.7 cubic feet capacity. GE plans to sell front-load LRWs in 2013. 7 In 2010, Whirlpool began production of front-load LRWs in the United States after investing $100 million to expand its existing facility in Clyde, OH. Prior to 2010, Whirlpool supplied front-load LRWs to the U.S. market from Whirlpool’s facilities in Germany and Mexico.8 In 2010, Whirlpool announced it would close its Benton Harbor, MI machining plant that had been used to supply machined and plated parts to its Clyde, OH facility. Machining operations have now been consolidated into Whirlpool’s Clyde, OH facility.9
U.S. CAPACITY, PRODUCTION, AND CAPACITY UTILIZATION
Data on U.S. producers’ capacity, production, and capacity utilization are presented in table III-2. Despite increases in production capacity reported by ***, overall U.S. production capacity decreased by *** percent between 2009 and 2011 and was *** percent lower in interim 2012 than interim 2011 as a result of ***. Production decreased by *** percent between 2009 and 2011, but was *** percent higher in interim 2012 than interim 2011 due to ***. Table III-2 LRWs: U.S. producers’ production, capacity, and capacity utilization, 2009-11, January-June 2011, and January-June 2012
* * * * * * *
4 Hearing transcript, p. 47 (Bosshard). “BSH Closing Production Line, Cutting 100 Jobs,” January 21, 2011.
http://www.newbernsj.com/common/printer/view.php?db=nbsj&id=94213, retrieved January 27, 2012. 5 “Electrolux Plant in Iowa Shuts Down, Moves to Mexico,” April 6, 2011,
http://www.raymondvillechroniclenews.com/news/2011-04-06/News/Electrolux_plant_in_Iowa_shuts_down_moves_to_Mexic.html, retrieved January 27, 2012.
6 Hearing transcript, pp. 221-22 (Chambers). Electrolux’s 3.4 cf (out-of-scope top-load residential washer) is produced on the same line as its front-load LRWs. Electrolux intends to sell the 3.4 cf top load residential washer in Latin America, Mexico, Canada, and the United States. Electrolux’s posthearing brief, Responses to Commissioner and Staff Questions, pp. 8-9.
7 “Governor Beshear, Mayor Abramson Announce GE to Bring a Second New Production Line to Louisville's Appliance Park,” December 14, 2009, http://www.thinkkentucky.com/newsarchive/ArchivePage.aspx?x=12142009_GE.html, retrieved December 20, 2012; GE’s posthearing brief, p. 2.
8 Imports of front-load LRWs from Whirlpool’s facilities in Germany and Mexico were to cease effective July 2012. According to Whirlpool, the future of its Mexican production facilities is still under review. The portion of the facility that previously produced LRWs for the U.S. is idle, and another portion of the facility is now focused entirely on production of washers for the Mexican market and non-U.S. export markets. Whirlpool’s posthearing brief, Answers to Commission Questions, p. II-57; Hearing transcript, pp. 60-62 (Fettig). Whirlpool’s facilities in Germany are to be retooled by another company to produce solar cells. Conference transcript, pp. 27 (Bitzer).
9 “Whirlpool Closes Benton Harbor Machining,” June 1, 2010. http://www.appliancemagazine.com/news_print.php?article=1401014&zone=0&first=1, retrieved January 27, 2012.
III-3
*** producers of LRWs reported producing other products using the same manufacturing equipment and/or production employees that were used to produce LRWs. Other products produced using the same manufacturing equipment and/or production employees include ***.
U.S. PRODUCERS’ U.S. SHIPMENTS AND EXPORTS
U.S. producers’ U.S. shipments and exports are presented table III-3.
Table III-3 LRWs: U.S. producers’ U.S. shipments, export shipments, and total shipments, 2009-11, January-June 2011, and January-June 2012
* * * * * * * *** reported internal consumption or related transfers.10 *** U.S. producers of LRWs, ***,
reported export shipments. Export shipments accounted for *** percent of total U.S. shipments in 2011, with Canada and Mexico identified as the major export markets. U.S. producers were asked to explain the similarities and differences in the models their firms exported and models that were sold in the United States since January 1, 2009. ***. ***. ***. ***. ***.
U.S. producers were also asked whether the mix of models their firms exported changed since January 1, 2009. ***. ***. ***.
FRONT-LOAD AND TOP-LOAD LRWS
U.S. producers were asked to report trade and financial data concerning front-load and top LRWs separately.11 Table III-4 presents U.S. producers’ U.S. commercial shipments of front-load and top-load LRWs. As detailed in table III-4, top-load LRWs accounted for the majority of U.S. commercial shipments during the period, accounting for between *** and *** percent, by quantity, of total U.S producers’ U.S. commercial shipments. Table III-4 LRWs: U.S. producers’ U.S. commercial shipments, by model type, 2009-11, January-June 2011, and January-June 2012
* * * * * * *
Figure III-1 depicts U.S. producers’ U.S. commercial shipments (in units) of front-load and top-load LRWs and figure III-2 depicts average unit values of front-load and top-load LRWs over the period. Figure III-1 LRWs: U.S. producers’ U.S. commercial shipments, by model type, 2009-11, January-June 2011, and January-June 2012
* * * * * * *
10 ***. ***. ***, November 8, 2012. 11 Table C-2 contains full trade and financial data concerning the U.S. market for front-load LRWs and table C-3
contains full trade and financial data concerning the U.S. market for top-load LRWs.
III-4
Figure III-2 LRWs: U.S. producers’ average unit values, by model type, 2009-11, January-June 2011, and January-June 2012
* * * * * * * Front-load LRWs
Figure III-3 identifies the U.S. firms that produced front-load LRWs between January 2009 and June 2012. As noted earlier, Whirlpool began producing front-load LRWs in the United States in 2010, while BSH and Electrolux each ceased its front-load LRW operations in 2011. GE plans to begin sales of its domestically-produced front-load LRWs in 2013.12 Figure III-3 Front-load LRWs: U.S. Production, by firm, 2009-11, January-June 2012
* * * * * * *
U.S. producers were asked to report their U.S. commercial shipments of front-load LRWs by capacity. These results are presented in table III-5.13 As detailed below, front-load LRWs with smaller capacities accounted for *** of U.S. commercial shipments in 2009, but *** in interim 2012, while front-load LRWs with capacities of at least 4.2 cubic feet but less than 4.5 cubic feet accounted for *** percent of U.S. commercial shipments in 2009, but *** percent of U.S. shipments in interim 2012. This trend is explained by the closures of Electrolux and BSH in 2011, both of which focused on smaller capacity front load LRWs and the launch of Whirlpool’s Alpha line in 2010, which has a 4.3 cubic foot capacity.14 Table III-5 Front-load LRWs: U.S. commercial shipments, by capacity, 2009-11, January-June 2011, and January-June 2012
* * * * * * * U.S. producers were asked to report their firm’s largest DOE rated capacity front-load LRW that
they produced in commercial quantities in 2011. The results are presented in table III-6. As noted at the hearing, Whirlpool’s largest front load washer, its Alpha line, has a 4.3 cubic foot capacity.15 Table III-6 Front-load LRWs: Largest DOE rated capacity, 2011
* * * * * * *
The Commission requested that firms report the number of front-load LRWs their firms sold with
a color finish and with a white finish in 2011. As detailed in table III-7, *** percent of the total U.S. commercial shipments of U.S. produced front-load LRWs had a color finish in 2011. Table III-7 Front-load LRWs: U.S. producers’ U.S. commercial shipments, by finish, 2011
* * * * * * *
12 GE posthearing brief, p. 3. 13 Data do not reconcile with front-load LRW tables in other sections of this report because U.S. firms also
produced front-load LRWs of less than 3.2 cubic feet in capacity. 14 Hearing transcript, p. 63 (Levy), p. 145 (Tubman). 15 Hearing transcript, p. 63 (Levy).
III-5
Top-load LRWs
Figure III-4 identifies the U.S. firms that produced top-load LRWs between January 2009 and June 2012, and, where applicable, when the firm began production of top-load LRWs in the United States. Whirlpool introduced the first ever high efficiency top-load platform in 2001.16 GE entered this segment in 2012.17
Figure III-4 Top-load LRWs: U.S. Production, by firm, 2009-11, January-June 2012
* * * * * * *
U.S. producers were asked to report their U.S. commercial shipments (in units) of top-load LRWs
by capacity. These results are presented in table III-8. Table III-8 Top-load LRWs: U.S. commercial shipments, by capacity, 2009-11, January-June 2011, and January-June 2012
* * * * * * *
U.S. producers were asked to report their firm’s largest DOE rated capacity top-load LRW that they produced in commercial quantities in 2011. The results are presented in table III-9. Whirlpool’s largest top load washer, its Oasis line, has a 4.6 cubic foot capacity.18 Table III-9 Top-load LRWs: Largest DOE rated capacity, 2011
* * * * * * *
The Commission requested that firms report the number of top-load LRWs their firms sold with a color finish and with a white finish in 2011. These data are presented in table III-10. As detailed in table III-10, *** percent of the total U.S. commercial shipments of U.S. produced top-load LRWs had a color finish in 2011. Table III-10 Top-load LRWs: U.S. producers’ U.S. commercial shipments, by finish, 2011
* * * * * * * U.S. producers were asked to describe the paint process that they used to apply color finishes to
their units.19 ***.
16 Whirlpool had 100 percent of this segment of the market in 2009. LG entered the top-load LRW segment in
May 2010 and was followed by Samsung in May 2011. Hearing transcript, pp. 159-160 (Schmidt). Samsung’s prehearing brief, p. 24.
17 “Governor Beshear, Mayor Abramson Announce GE to Bring a Second New Production Line to Louisville's Appliance Park,” December 14, 2009, http://www.thinkkentucky.com/newsarchive/ArchivePage.aspx?x=12142009_GE.html, retrieved December 20, 2012; GE’s posthearing brief, p. 2.
18 Hearing transcript, p. 84 (Levy). GE’s Louisville, KY facility currently produces top-load LRWs with capacities up to 5.0 cubic feet. Home Depot’s prehearing brief, p. 10.
19 According to testimony at the hearing, Whirlpool has offered washers in colors since the 1960s. Hearing transcript, p. 199 (Schmidt).
III-6
U.S. PRODUCERS’ IMPORTS
Three U.S. producers of LRWs, ***, and Whirlpool reported U.S. imports from Korea and/or Mexico during the period of investigation.20 Table III-11 presents data for ***, and Whirlpool concerning each firm’s reported U.S. imports, U.S. production, and the ratio of each firm’s U.S. reported imports to each firm’s U.S. reported production.21
***. ***. Whirlpool’s U.S. imports from Mexico consisted of front-load LRWs produced by its affiliate Whirlpool Mexico; and its nonsubject imports from Germany consisted of front-load LRWs produced by its affiliate, Whirlpool Germany.22 Table III-11 LRWs: U.S. producers’ imports, 2009-11, January-June 2011, and January-June 2012
* * * * * * *
U.S. PRODUCERS’ INVENTORIES
Data on end-of-period inventories of LRWs for the period of investigation are presented in table III-12. Table III-12 LRWs: U.S. producers' end-of-period inventories, 2009-11, January-June 2011, and January-June 2012
* * * * * * *
U.S. EMPLOYMENT, WAGES, AND PRODUCTIVITY
Data provided by U.S. producers on the number of production and related workers (“PRWs”) engaged in the production of LRWs, the total hours worked by such workers, wages paid to such PRWs, productivity, and unit labor costs during the period of investigation are presented in table III-13. As detailed below, PRWs, hours worked, and wages paid decreased between 2009 and 2011 due to ***. Each of these indicia were higher in interim 2012 than interim 2011 due to ***. Table III-13 LRWs: Average number of production and related workers, hours worked, wages paid to such employees, hourly wages, productivity, and unit labor costs, 2009-11, January-June 2011, and January-June 2012
* * * * * * *
20 ***. No U.S. producers reported purchases of LRWs during the period. 21 Petitioner argues that appropriate circumstances do not exist to exclude Electrolux from the domestic industry.
Petitioner’s posthearing brief, Answers to Commission Questions, p. II-50. Respondent Electrolux argues that its primary interest during the period was as an importer of subject merchandise and the Commission should exclude it from the domestic industry as a related party. Electrolux, prehearing brief, p. 16. Samsung also argues that Electrolux should be excluded from the domestic industry as a related party for the reasons provided in Electrolux’s prehearing brief. Samsung’s prehearing brief, p. 23.
22 Whirlpool’s posthearing brief, Answers to Commission Questions, p. II-57.
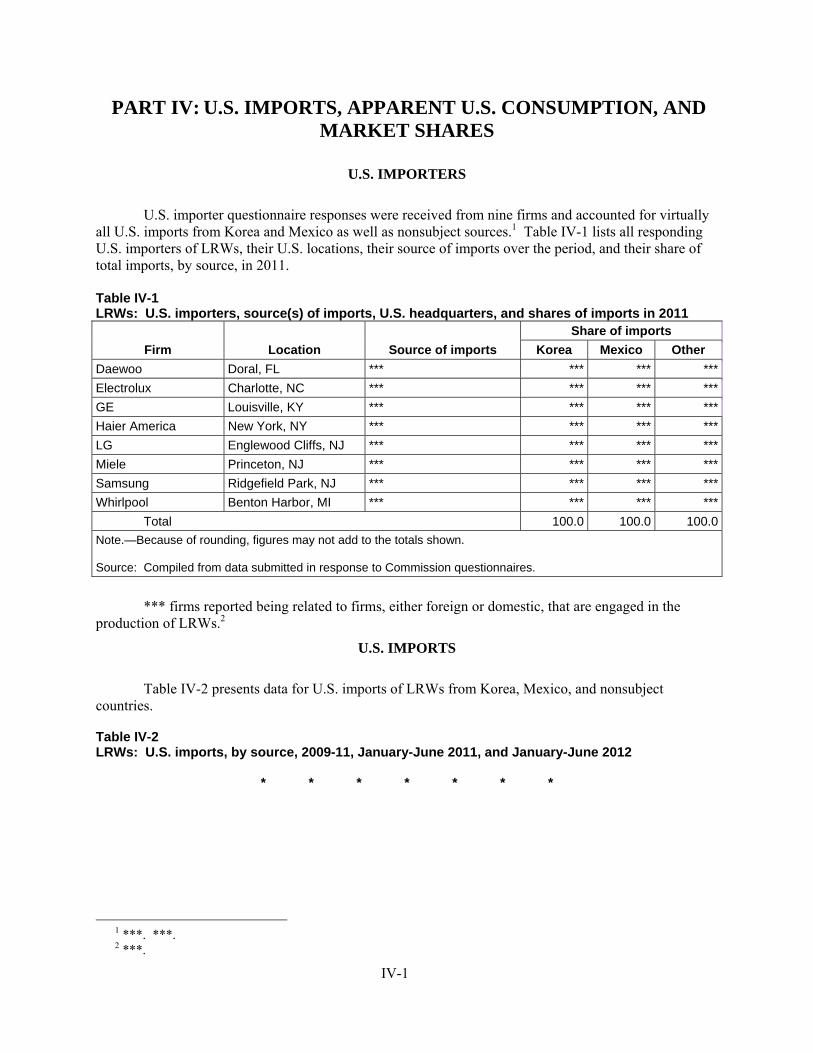
IV-1
PART IV: U.S. IMPORTS, APPARENT U.S. CONSUMPTION, AND MARKET SHARES
U.S. IMPORTERS
U.S. importer questionnaire responses were received from nine firms and accounted for virtually all U.S. imports from Korea and Mexico as well as nonsubject sources.1 Table IV-1 lists all responding U.S. importers of LRWs, their U.S. locations, their source of imports over the period, and their share of total imports, by source, in 2011.
Table IV-1 LRWs: U.S. importers, source(s) of imports, U.S. headquarters, and shares of imports in 2011
Firm Location Source of imports Share of imports
Korea Mexico Other Daewoo Doral, FL *** *** *** ***Electrolux Charlotte, NC *** *** *** ***GE Louisville, KY *** *** *** ***Haier America New York, NY *** *** *** ***LG Englewood Cliffs, NJ *** *** *** ***Miele Princeton, NJ *** *** *** ***Samsung Ridgefield Park, NJ *** *** *** ***Whirlpool Benton Harbor, MI *** *** *** *** Total 100.0 100.0 100.0Note.—Because of rounding, figures may not add to the totals shown. Source: Compiled from data submitted in response to Commission questionnaires.
*** firms reported being related to firms, either foreign or domestic, that are engaged in the production of LRWs.2
U.S. IMPORTS
Table IV-2 presents data for U.S. imports of LRWs from Korea, Mexico, and nonsubject countries. Table IV-2 LRWs: U.S. imports, by source, 2009-11, January-June 2011, and January-June 2012
* * * * * * *
1 ***. ***. 2 ***.
IV-2
Front-load LRWs
U.S. importers were asked to report their U.S. imports of front-load LRWs separately.3 Figure IV-1 depicts U.S. shipments of imports (units) of front load LRWs, by source over the period. Figure IV-1 Front-load LRWs: U.S. shipments of imports by source, 2009-11, January-June 2011, and January-June 2012
* * * * * * *
U.S. importers were asked to report their U.S. commercial shipments (in units) of front-load LRWs by capacity. These results are presented in tables IV-3 (Korea); IV-4 (Mexico); and IV-5 (all other sources combined.4 Table IV-3 Front-load LRWs: U.S. commercial shipments of U.S. imports from Korea, by capacity, 2009-11, January-June 2011, and January-June 2012
* * * * * * * Table IV-4 Front-load LRWs: U.S. commercial shipments of U.S. imports from Mexico, by capacity, 2009-11, January-June 2011, and January-June 2012
* * * * * * * Table IV-5 Front-load LRWs: U.S. commercial shipments of U.S. imports from all other sources combined, by capacity, 2009-11, January-June 2011, and January-June 2012
* * * * * * *
U.S. importers were asked to report their firm’s largest DOE rated capacity (cubic feet) front-load LRW that they imported in commercial quantities in 2011. The results are presented in table IV-6. Table IV-6 Front-load LRWs: Largest DOE rated capacity, 2011
* * * * * * *
The Commission requested that firms report the number of front-load LRWs their firms sold with
a color finish and with a white finish in 2011. As detailed in table IV-7, *** percent of the total U.S. commercial shipments of subject imports of front-load LRWs in 2011 had a color finish.
3 Table C-2 contains full trade and financial data concerning the U.S. market for front-load LRWs. Firms
reporting imports of front-load LRWs include: ***. 4 Data in tables IV-3, IV-4, and IV-5 do not reconcile with U.S. commercial shipment data concerning front-load
LRWs presented in other sections of this report because firms may have imported front-load LRWs of less than 3.2 cubic feet in capacity.
IV-3
Table IV-7 Front-load LRWs: U.S. commercial shipments of subject imports, by finish, 2011
* * * * * * * Top-load LRWs
U.S. importers were asked to report their U.S. imports of top-load LRWs separately.5 Figure IV-2 identifies the firms that reported imports of top-load LRWs between January 2009 and June 2012. LG entered top load LRW segment in May 2010 and was followed by Samsung in May 2011.6 Figure IV-3 depicts import quantities (units), by source over the same period. There were no U.S. imports of top-load LRWs from Mexico during the period.7 Figure IV-2 Top-load LRWs: Imports by source, 2009-11, January-June 2012
* * * * * * * Figure IV-3 Top-load LRWs: U.S. shipments of imports by source, 2009-11, January-June 2011, and January-June 2012
* * * * * * *
U.S. importers were asked to report their U.S. commercial shipments (in units) of top-load LRWs by capacity. These results are presented in tables IV-11 (Korea) and IV-12 (all other sources). Table IV-11 Top-load LRWs: U.S. commercial shipments of U.S. imports from Korea, by capacity, 2009-11, January-June 2011, and January-June 2012
* * * * * * * Table IV-12 Top-load LRWs: U.S. commercial shipments of U.S. imports from all other sources, by capacity, 2009-11, January-June 2011, and January-June 2012
* * * * * * *
U.S. importers were asked to report their firm’s largest DOE rated capacity (cubic feet) top-load
LRW that they imported in commercial quantities in 2011.8 The results are presented in table IV-13:
5 Table C-3 contains full trade and financial data concerning the U.S. market for top-load LRWs. Firms
reporting imports of top-load LRWs include: ***. 6 Samsung’s prehearing brief, p. 24. 7 Electrolux posthearing brief, p. 13. 8 Samsung’s currently offers top-load LRWs with a capacity of up to 4.8 cubic feet and has a model with a 5.0
cubic feet capacity coming in March 2013. Home Depot’s prehearing brief, p. 10.
IV-4
Table IV-13 Top-load LRWs: Largest DOE rated capacity, 2011
* * * * * * *
The Commission requested that firms report the number of top-load LRWs their firms sold with
a color finish and with a white finish in 2011. As detailed in table IV-14, *** percent of the total U.S. commercial shipments of subject imports of top-load LRWs in 2011 had a color finish. Table IV-14 Top-load LRWs: U.S. commercial shipments of subject imports, by finish, 2011
* * * * * * *
U.S. importers were asked to describe the paint process that they used to apply color finishes to their units.9 Daewoo reported ***. Electrolux reported ***. Whirlpool reported that ***. GE reported ***. LG reported ***. Miele reported that it uses ***. Samsung reported that ***.
NEGLIGIBILITY
The Tariff Act of 1930 provides for the termination of an investigation if imports of the subject product from a country are less than 3 percent of total imports, or, if there is more than one such country, their combined share is less than or equal to 7 percent of total imports, during the most recent 12 months for which data are available preceding the filing of the petition.10 The shares (in percent) of the total quantity of U.S. imports from Korea and Mexico for the period of December 2010 through November 2011 using official Commerce statistics were 54.4 percent and 37.8 percent, respectively, and 92.2 percent cumulatively, well above the 3 and 7 percent negligibility thresholds.
CUMULATION CONSIDERATIONS
In assessing whether imports compete with each other and with the domestic like product, the Commission has generally considered four factors: (1) fungibility, (2) presence of sales or offers to sell in the same geographical market, (3) common or similar channels of distribution, and (4) simultaneous presence in the market.
Issues concerning fungibility and channels of distribution are addressed in Part II of this report. With regard to geographical markets, official Commerce statistics show that the vast majority of U.S. imports from Korea entered the United States through cities on the Western seaboard (primarily through Los Angeles, CA), while virtually all U.S. imports from Mexico entered the United States through El Paso, TX and Laredo, TX. Imports from Korea and Mexico were present in every month of the period for which data were collected.11 Both U.S. producers and U.S. importers reported distributing LRWs geographically throughout the United States.12
9 As noted at the hearing, LG launched its first black front-load LRW washer in 2004 and its wild cherry red
color front load LRW in 2006. According to testimony from an LG representative, prior to 2004, color accounted for 14 percent of the front-load LRW segment and has since increased to 34 percent. Hearing transcript, pp. 229-230 (Herring).
10 19 U.S.C. § 1677(24)(A)(ii). 11 Official Commerce statistics for HTS 8450.20.0090. 12 Responses to U.S. producer’s questionnaires, question IV-10; responses to U.S. importer’s questionnaires,
question III-10.
IV-5
In these final phase investigations, petitioner argues because subject imports compete with one another and with the domestic like product, the Commission’s cumulation criteria are satisfied.13 Samsung does not oppose the cumulation of subject imports from Korea and Mexico.14 Electrolux argues that regardless of whether imports from Korea and Mexico are analyzed on a cumulated or non-cumulated basis, subject imports of LRWs do not materially injure the domestic industry; however, Electrolux argues that imports Mexico should be decumulated from Korea in the Commission’s threat analysis.15
APPARENT U.S. CONSUMPTION AND U.S. MARKET SHARES
Data on apparent U.S. consumption of LRWs and U.S. market shares are presented in table IV-15 and figure IV-4. Apparent U.S. consumption increased between 2009 and 2010 by *** by quantity, which may be due to the “2010 Cash for Appliances Stimulus Rebate Program,” which granted rebates on purchases of energy efficient appliances in 2010.16 Between 2010 and 2011, apparent U.S. consumption decreased by *** percent. In 2011, apparent U.S. consumption was *** percent lower than in 2009. Between 2009 and 2011, U.S. producers’ U.S. shipments, by quantity, decreased by ***, while U.S. shipments of imports from subject sources increased by *** percent over the same period. U.S. producers’ U.S. shipments were *** percent higher in interim 2012 than in interim 2011, while U.S. shipments of imports from subject sources were *** percent lower in interim 2012 than in interim 2011. Between 2009 and 2011, U.S. producers’ U.S. market share, by quantity, decreased by *** percentage points, while subject sources’ market share increased by *** percentage points over the same period. U.S. producers’ U.S. market share, by quantity, was *** percentage points higher in interim 2012 than in interim 2011, while subject sources’ market share was *** percent lower in interim 2012 than interim 2011. Table IV-15 LRWs: Apparent U.S. consumption and U.S. market shares, 2009-11, January-June 2011, and January-June 2012
* * * * * * *
Figures IV-5 and IV-6 depict U.S. shipments of imports, by source, and U.S. producers’ U.S. shipments of front-load and top-load LRWs, respectively. Figure IV-4 Front Load LRWs: U.S. shipments of imports, by source, and U.S. producers’ U.S. shipments, in units, 2009-2011, January-June 2011, and January-June 2012
* * * * * * * Figure IV-5 Top Load LRWs: U.S. shipments of imports, by source, and U.S. producers’ U.S. shipments, in units, 2009-2011, January-June 2011, and January-June 2012
* * * * * * *
13 Petitioner’s prehearing brief, p. 32. Petitioner’s posthearing brief, Answers to Commission Questions, p. II-
94. 14 Samsung’s prehearing brief, p. 24. 15 In its prehearing brief, Electrolux agrees with and incorporates by reference the cumulated threat analysis set
forth in the prehearing briefs of LG and Samsung. Electrolux’s prehearing brief, p. 49. 16 Hearing transcript, p. 125 (Fettig).
IV-6
U.S. importers were asked to explain the similarities and differences in the models their firms exported and models that were sold in the United States since January 1, 2009. Daewoo reported ***. Electrolux reported ***. GE reported ***. LG reported ***. Miele reported that ***. Whirlpool reported that ***.
U.S. importers were also asked whether the mix of models their firms exported changed since January 1, 2009. *** reported no. Electrolux reported ***. LG ***. Samsung ***. Whirlpool reported ***.
RATIO OF IMPORTS TO U.S. PRODUCTION
Table IV-16 presents data on the ratio of U.S imports to U.S. production.
Table IV-16 LRWs: Ratio of U.S. imports to U.S. production, 2009-11, January-June 2011, and January-June 2012
* * * * * * *
V-1
PART V: PRICING AND RELATED INFORMATION
FACTORS AFFECTING PRICES
Raw Material Costs
Raw materials accounted for between *** and *** percent of U.S. producers’ costs of goods sold during 2009-11, and thus are an important consideration in the price of LRWs. While these percentages did not vary widely (see Part VI), producers and importers provided evidence of rising raw material costs since January 1, 2009.
*** listed some of the principal raw materials used in manufacturing LRWs. It stated that copper is used for wiring and electric motors, aluminum is used for bracings, polypropylene is used for consoles, carbon steel is used for cabinet bodies, stainless steel is used for drums, and rubber is used for bellows. It provided data showing that prices for copper, aluminum, polypropylene, crude oil, carbon steel, stainless steel, and synthetic rubber had all risen from the first quarter of 2009 to the second quarter of 2012. Most inputs had risen by more than 30 percent, although some inputs showed stable or slightly declining prices after mid-2010. *** reported similar raw materials for their LRWs, and *** described plastic resins and steel sheet as the principal raw materials. Producers ***, as well as importers ***, reported that there had been price increases in most raw materials.
Whirlpool stated that it buys raw materials from global markets, and is aware of world prices for these materials.1 It also offered an analysis that alleged that Korean and Mexican raw material prices were somewhat higher than U.S. raw material prices.2 LG stated that ***.3
The prices of two raw materials, cold-rolled steel and stainless steel sheet, rose by approximately 30 percent from January 2009 to December 2011 (figure V-1) before falling somewhat in 2012, while the prices of two other raw materials, aluminum and copper, rose by 129 and 45 percent, respectively, over January 2009 to June 2012.
1 Hearing transcript, p. 62 (Fettig). 2 Posthearing brief of Whirlpool, p. II-78. 3 Posthearing brief of LG, p. 19 (responses to Commissioner Aranoff).
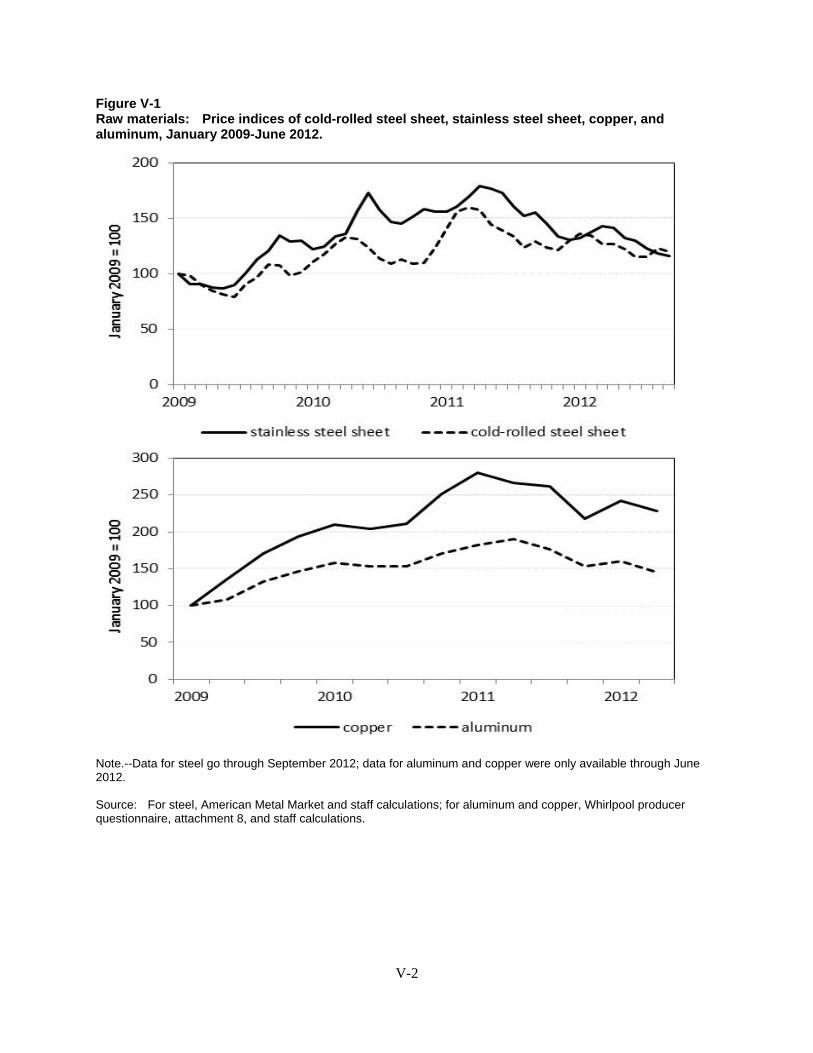
V-2
Figure V-1 Raw materials: Price indices of cold-rolled steel sheet, stainless steel sheet, copper, and aluminum, January 2009-June 2012. Note.--Data for steel go through September 2012; data for aluminum and copper were only available through June 2012. Source: For steel, American Metal Market and staff calculations; for aluminum and copper, Whirlpool producer questionnaire, attachment 8, and staff calculations.
V-3
U.S. Inland Transportation Costs Among U.S. producers, U.S. inland transportation costs ranged from *** percent. *** arrange
transportation for *** customers. *** shipped most of *** sales between 100 and 1,000 miles of *** production facilities, with most of the balance of *** sales shipped over 1,000 miles from *** production facilities.
Among importers, U.S. inland transportation costs ranged from *** percent.4 *** arrange transportation for *** customers. Importers reported a wide variety of shipping distances. *** shipped a majority of *** product more than 1,000 miles from *** U.S. point of shipment, with the *** shipped between 100 and 1,000 miles, and the majority of *** remainder shipped less than 100 miles. *** shipped a majority of *** Korean product between 100 and 1,000 miles of *** U.S. point of shipment, with a majority of *** remainder shipped more than 1,000 miles, and a majority of *** remainder shipped less than 100 miles.5
PRICING PRACTICES
Pricing Methods
Price negotiations Generally, purchasers reported weekly or even daily purchases of LRWs, with purchases from a given supplier often varying based on price.
Twelve purchasers reported purchasing weekly, with five purchasing daily and three purchasing biweekly to monthly. *** stated that purchasing frequency varies by vendor. Nineteen purchasers reported no significant changes to their purchasing patterns since January 1, 2009. Two purchasers reported changes, with *** reporting switching to LG in *** and *** reporting that consumers now wait until promotional sales periods to purchase. Most purchasers reported contacting three to five vendors when purchasing.
Fifteen purchasers reported that their purchases of LRWs involved negotiations between suppliers and purchasers, while six reported that they did not. Among those reporting negotiations, purchasers reported mixed answers to whether they routinely quoted competing prices during negotiations. *** described meeting competitors’ prices (or “meet-comp”) as standard in the industry, while other purchasers stated that prices are compared without explicitly stating competitors’ prices to suppliers. *** stated that pricing is kept confidential. Purchasers reported considering features, brand, margins, profitability, quality, and retail prices during negotiations.
Eighteen purchasers reported that they tend to vary their purchases from a given supplier based on price, while two stated that they did not. Purchasers described shifting purchases based on customer demand at holiday promotions, as well as opportunities or incentives from the supplier. Price determination and contracts
In their questionnaire responses, producers and importers reported a wide variety of methods for pricing, usually with a different combination for each individual producer or importer. Among producers, *** reported using transaction-by-transaction negotiations, contracts, set price lists, and profit margins off of minimum advertised prices (“MAPs”- see below).6 Among importers, *** reported using
4 *** reported shipping from *** point of importation, *** reported shipping from *** storage facility, and ***
reported shipping from both. See also ***. 5 ***. 6 ***.
V-4
transaction-by-transaction negotiations and contracts, and *** reported using profit margins off of MAPs.7 *** elaborated that prices before discounts are established in a number of different ways, but generally not through set price lists.
Companies reported different shares of sales sold on the spot market versus on a contract basis. *** reported that *** percent of *** sales were spot sales. *** reported that *** percent of *** sales were under short-term contracts while *** percent were under long-term contracts.8 *** reported that all of its sales of *** were through contracts, *** percent of which were long-term and *** percent were short-term (a year or less). *** reported that *** percent of its sales of *** product were through long-term contracts and *** percent through short-term contracts. *** reported that *** percent of its sales were through short-term contracts, with the remaining *** percent being spot sales (with a similar pattern for LRWs from Mexico and Korea).9 For ***, short-term contracts were generally one year, fixed price for *** (with renegotiation for ***), and did not have meet or release provisions.10 Additionally, *** indicated that ***. Features and Pricing
Features may add to the cost and retail price of a washer, although parties disagreed as to whether
these additions could be quantified. Parties offered especially different opinions on color. Buyers’ group NATM stated that color adds $50 to the cost of an LRW, but that subject imports sometimes offer color for free.11 However, Samsung described features such as color, knobs, and capacity as driving an alleged consumer preference for Samsung LRWs.12
Producers and importers were asked how much selected features added to the price at which they sold their LRWs to retailers in 2011. Purchasers were asked how much the same features added to the price consumers pay for LRWs at retail. All responses are summarized in tables V-1 and V-2 . *** provided few answers.13 U.S. producers, other importers, and purchasers generally described the indicated features as adding between $25 to $100 to the price of an LRW, although purchasers estimated that an LCD screen can add more than $100 to the retail price of an LRW.
Table V-1 LRWs: Value of features as reported by producers and importers
* * * * * * * Source: Compiled from data submitted in response from Commission questionnaires.
7 ***. 8 ***. 9 ***. 10 *** did not indicate whether its contracts had meet-or-release provisions. 11 NATM added that most LRWs from all sources do not have color. Hearing transcript, pp. 44 and 102 (Bilas). 12 Hearing transcript, p. 215 (Brindle). 13 ***. Samsung also stated that producers do not set LRW prices by summing up the cost of features, and
added that many features have ***. Prehearing brief of Samsung, p. 81. In its posthearing brief, LG stated that color commands a ***. Posthearing brief of LG, ex. 4, p. 9 (responses to Commissioner Pinkert). Similarly, Samsung stated that it charges *** more per washer for color. Posthearing brief of Samsung, p. A-80.
V-5
Table V-2 LRWs: Value of features as reported by purchasers
* * * * * * * Source: Compiled from data submitted in response from Commission questionnaires. Product Life Cycle Pricing At the hearing and in their briefs, parties disagreed about whether LRWs are subject to product life cycle pricing, i.e., whether prices on particular LRW products were subject to steep declines as the products were replaced by new products in the market. Whirlpool stated that there is no normal product life cycle in LRWs because raw materials constitute a large proportion of production costs, and that new generations of LRWs do not result in declining costs and prices as occurs in consumer electronics. It also described the price declines in some newly-introduced LRW products as too severe and too fast to be the result of life cycle pricing.14 However, respondents described product life cycles as important in LRW pricing, and pointed to retail price data on specific products, as well as data for Commission pricing product 4, as evidence that model prices decline over their life cycles.15 Minimum Advertised Prices In the LRW market, pricing negotiations with retailers often consists of suppliers suggesting a minimum advertised price (MAP) for retail sale. At retail prices at or above the MAP, the supplier will support the retailer with advertising funds. The supplier then negotiates a profit margin for the retailer, consisting of the difference between the MAP and the retailer’s acquisition cost. During promotional periods, the supplier may reduce the MAP and provide additional promotional support to preserve the retailer’s profit margin.16 Producers, importers, and purchasers were asked what factors determine the specific MAP levels set by their firms. Producers ***, as well as five importers (including ***), stated that MAP prices were influenced by prices on competing LRWs with similar features. *** described setting MAP levels with model-specific sales volumes targets. *** added that retailers place a high value on the margin they can earn off their sales, and use floor spots as leverage to increase their margins by pushing suppliers to provide those margins or lose floor spots. *** described MAP prices as also being based on consumers’ perceived value for features. Most producers and importers indicated that their MAP pricing takes into account the pricing of their competitors’ product offerings for both similarly-featured and more heavily-featured LRWs. Three producers and four importers stated that it did, but *** stated that it did not. Large producers and importers offered a product line spanning a range of MAPs. Among producers, *** reported that it offered LRWs with MAPs ranging from $*** to $***, with the variation based on capacity, basket type, controls, and cycles. *** submitted a “representative set” of MAPs for its fourth quarter 2011 models, including U.S.-produced front-load LRWs ranging from *** with prices varying by ***, as well as top-load LRWs ranging from ***, varying by ***. The attachment also showed some ***, with MAPs ranging from ***. Among importers, *** stated that it offers LRWs across the entire range of the product, with prices that reflect the competitive landscape. *** stated that its minimum MAP was $*** and its maximum MAP was $***, and described such a range as putting *** models at the upper end of the range of prices for all
14 Hearing transcript, p. 107 (Fettig), and posthearing brief of Whirlpool, pp. II-81-83. 15 Hearing transcript, pp. 231-32, 293 (Klett), prehearing brief of LG, p. 55, prehearing brief of Electrolux, p. 44
and exhibit P-A, and posthearing brief of Samsung, p. A-25. 16 Email from Jack Levy, counsel for Whirlpool, to staff, November 8, 2012.
V-6
residential washers. *** described its front-load washers as having capacities ranging from *** to *** cubic feet with MAPs ranging from $*** to $***, and its top-load washers as having capacities ranging from *** to *** cubic feet with MAPs ranging from $*** to $***. *** also described its product range as not covering the entire range of MAPs for LRWs as its range excludes the LRW lower price range of $*** to $***. It added that it charges the highest invoice price possible to achieve flooring for a substantial number of SKUs at retailers.17 Producers *** and five importers always used the same MAP for the same LRW model sold to different retailers. On the other hand, *** sometimes used different MAPs in such situations.
Sales Terms The most typical payment terms for both U.S. producers and importers were net 30 days, although
*** reported that terms can vary by customer. *** and most importers of both Mexican and Korean products typically quote prices on a delivered basis, while *** reported quoting prices on an f.o.b. warehouse basis. Direct and Indirect Discounts
Discounts on prices of LRWs fall into two categories: direct discounts (i.e., discounts, incentives,
rebates, and other adjustments that are tied to the specific product being sold) and indirect discounts that are not tied to a specific product (i.e., allocated discounts, incentives, allowances, rebates tied to some broad performance measure or volume discounts based on multiple products, including different white goods and electronic products).18
Additionally, buyers groups were asked if LRW suppliers provided discounts directly to buyers’ groups or only to their members. NATM answered that no LRW suppliers provide discounts directly to it, but rather to NATM’s members.19 ***.20 *** did not respond.21 Direct discounts
Producers and importers reported a wide variety of direct discount policies. Three producers (including ***) and two importers (including ***) indicated that they use quantity discounts, annual total volume discounts, sales incentives, and promotional discounts.22 *** reported also using cooperative advertising, co-marketing funds, sales person incentives, and inventory financing. *** indicated that it
17 Importers *** stated that their firms did not sell a product line-up across a range of MAPs. 18 Producers and importers described a wide variety of total discounts. *** stated that it provides discounts
both as “sell-in” (to the retailer at time of sale from *** to the retailer) and “sell-through” (at the time of the retailer’s sale to the consumer). *** also indicated that they used both of these methods of providing discounts. *** elaborated that its “sell-in” discounts are more prevalent to smaller retailers and “sell-through” discounts more prevalent with larger retailers. ***. *** reported using a variety of discounts including retail sales promotions, quantity discounts, annual total volume discounts, sales incentives, promotional discounts, cooperative advertising, and inventory financing. *** stated that it also provides a variety of discounts, including annual rebates for meeting annual sales targets on combined purchases of consumer electronics and appliances. It also stated that *** was a heavy user of indirect discounts, to the exclusion of other sellers.
19 Email from John Donohue for NATM, December 20, 2012. 20 ***. 21 In its posthearing brief, Samsung included a list of promotions and discounts from Brandsource. Samsung
posthearing brief at p. A-58 and exhibit 24. Whirlpool stated that ***. 22 *** indicated that it also provides ***. Among other importers, *** reported using quantity discounts,
annual total volume discounts, and promotional discounts, but not sales incentives. *** reported only using annual total volume discounts.
V-7
provides direct discounts on an ad hoc basis to compete with subject imports. *** stated that it only used promotional discounts, but added that it ***.23
Further information on the importance of discounts to purchasers is available in table II-4 of Part II, Conditions of Competition in the U.S. Market. Indirect discounts
In order to help understand what role indirect discounts play in the pricing of LRWs, Commission questionnaires asked producers and importers several questions about the nature of their indirect discounts.
Producers *** and importers *** described using a variety of different indirect discounts for different products and customers. *** indicated that it has *** discount programs for different customers and products. Among all sellers, indirect discount types were based on factors such as sales volume, marketing, and employee training.
Producers and importers generally reported that indirect discounts play an important role in their price negotiations with customers. *** described both direct and indirect discounts as important, with different customers valuing each type. *** stated that indirect discounts are important because they contribute to the margin that retailers demand in exchange for floor spots. *** reported that indirect discounts are not important because ***. *** stated that the importance of indirect discounts varies by retailer, and *** added that it sometimes needed to add larger direct discounts to compete with indirect discounts offered by Whirlpool. *** indicated that retailers consider their gross margin, making indirect discounts important, and *** added that indirect discounts are often used to finance marketing and sales activities, especially for independent retailers. ***, however, described indirect discounts as more important to large retailers than small retailers.
Producers and importers were asked whether, during their own internal deliberations on setting prices to retailers, indirect discounts are applied to individual SKUs or at a broader product level. *** stated that they were applied at the SKU level, but *** stated that they were not, and instead applied across a broader base of products. Five importers indicated that indirect discounts are considered at a broader level than individual SKUs, with *** indicating that indirect discounts in laundry are typically applied to a group of products in the same channel of distribution.
Producers and importers were likely to report negotiating for more floor space, more end-cap space,24 or other promotional considerations in exchange for indirect discounts. *** stated that it sometimes provides allowances to retailers for promotional displays or to maintain floor space, but rarely pays for end-cap space. It alleged that LG pays for end-cap space, and there is some advantage to end-cap space, although such an advantage was difficult to quantify.25 *** stated that it offers display discounts to its customers in exchange for minimum floor space requirements. It added that *** were not frequently promoted until *** when Samsung entered the market for these products. It described LG’s and Samsung’s display discounts at retailers like Lowe’s, Home Depot, Sears and Best Buy as “aggressive” and sometimes keeping *** product off of store floors. Among importers, *** indicated that they did negotiate discounts in exchange for particular floor space, but *** stated that floor space is not directly linked to
23 Additionally, Home Depot described some types of discounts as having a more direct impact on sales than
other types of support. As an example, it stated that retail sales allowances (margin support for retailers when discounting MAPs) typically have a larger impact on sales than co-op advertising support. It added that Whirlpool has used retail sales allowances more “aggressively” than LG has. Posthearing brief of Home Depot, p. 4.
24 End-cap space is the space at the end of a retailer's aisle, and is considered a desirable location to have product placed. See Bottom Mount Combination Refrigerator-Freezers from Korea and Mexico, Inv. Nos. 701-TA-477 and 731-TA-1180-1181 (Final), USITC Pub. 4318 (May 2012), p. V-7.
25 At the hearing, LG indicated that it was not aware of any customers charging for end-cap space. Hearing transcript, pp. 306, 311 (Herring).
V-8
discount decisions. At the hearing, Home Depot denied selling end-cap space and stated that it was not aware of other retailers doing so for laundry products.26 Promotional Discounts
Purchasers were asked to describe the types of promotional activity, discounts, rebates, and
allowances supported by their LRW suppliers by indicating the degree (none, low, medium, high) to which each type of activity has been used by each supplier to support retail sales at their firms from January 1, 2009 to the present. Their answers are summarized in table V-3. Purchaser characterizations of suppliers’ promotional activity were roughly equal across suppliers, although purchasers were somewhat more likely to report LG and Samsung as having a higher level of national promotions than Whirlpool, GE, and Electrolux. Table V-3 LRWs: Purchasers’ descriptions of suppliers’ discounts, allowances, and rebates
* * * * * * * In additional comments, *** described LG as having promotions to promote particular products. *** indicated that Electrolux had raised their SPIFFs (bonuses to salespeople for sales), increased mail-in rebates, and lowered retail prices while Whirlpool had lowered SPIFFs, continued with some rebates, and maintained their price levels. *** stated that the increased consumer awareness of LG’s and Samsung’s other consumer electronics products (such as smart-phones) had increased demand for LRWs from these firms. *** described Whirlpool as having “slow” promotional activity in 2009, but having since increased its level. Purchasers indicated that the availability of a highly-featured LRW at a low price affects the sales of less-highly-featured LRWs. (Twenty indicated that it would, and none indicated that it would not.) In further comments, *** described the question as “slightly loaded” and commented that there was sufficient demand for all products. However, most other producers stated that consumers will choose more highly-featured LRWs offered at similar prices to LRWs with fewer features, or that lower prices on highly-featured LRWs can compress prices for LRWs with fewer features. *** added that consumers usually will not pay more for color as an additional charge, but that when color is offered as a promotion, sales increase “dramatically.” Purchasers were asked to describe trends in the volume of LRWs sold each year at promotional prices. Twelve described promotional price volume as increasing, and seven described it as remaining the same. Purchasers were also asked what percentage of their 2011 LRW sales were made at promotional prices. All responding purchasers but *** answered at least 50 percent, with most answering more than 75 percent or even 90 percent. *** stated that if it did not offer most of its LRW product at promotional prices, its competitors would “beat me like no tomorrow.” *** were among the firms estimating that approximately 90 percent of their 2011 LRW sales were made at promotional prices. Most purchasers negotiated support levels with suppliers when planning for major holiday promotions. Three (***) purchasers stated that they did not negotiate support levels, but 15 other purchasers stated they did. Of those 15, one stated that it signaled one supplier of relative support levels from other suppliers, but 11 stated that they did not.27 Sixteen purchasers indicated that the price that they were willing to pay from any one particular supplier was influenced by the prices and/or features offered by competing suppliers, but four said that it was not. In further comments, *** stated that while price is an important factor, there are many other important factors as well, such as training, support, and innovation. On innovation, *** described LG and
26 Hearing transcript, pp. 305-06 (Baird). 27 The others did not answer the second half of the question.
V-9
Samsung as industry leaders, naming in particular their LRWs that ***. In other comments, *** described an expectation that suppliers would offer competitively-priced products. *** reported that LRW capacity was also taken into account. *** stated that products with more features generally oversell products with fewer.
To understand the nature and size of discounts in the LRW industry, Commission questionnaires requested data on discounts from producers, importers, and purchasers. Tables V-4 to V-5 summarize these discount data, and how those discounts are applied to Commission pricing products. Table V-4 summarizes 2011 producer and importer data on direct and indirect discounts for LRWs, the pricing products for LRWs, all other washers and dryers, and other goods sold by producers and importers. (Data for 2009 and 2010 are summarized in appendix F). ***.28 Table V-5 shows purchasers’ reported discounts received on all appliances, washers, and LRWs, for 2010 and 2011. Table V-4 LRWs: Total quantity and value sold, direct and indirect discounts by selected firms, 2011
* * * * * * * Source: Compiled from data submitted in response from Commission questionnaires. Table V-5 LRWs: Purchasers’ reported discounts as a percent of all purchases, by supplier
* * * * * * * Source: Compiled from data submitted in response from Commission questionnaires.
PRICE DATA The Commission requested U.S. producers and importers to provide quarterly data for the total
quantity and net f.o.b. value of LRWs shipped to unrelated U.S. customers. Data were requested from January 2009 through June 2012, and specifications for all SKUs that fell under each product were also requested. Pricing data for the following products were requested.29 Product 1.--Front loading, CEE Tier 2 or 3 rated washer; rated DOE capacity greater than or equal to
4.2 cubic feet; steam cycle(s) included; water heater included; LCD display; any non-white finish.
Product 2.--Front loading, CEE Tier 2 or 3 rated washer; rated DOE capacity greater than 3.7
cubic feet, but less than 4.2 cubic feet; steam cycle(s) included, water heater included; no LCD display; white finish.
Product 3.--Front loading, CEE Tier 2 or 3 rated washer; rated DOE capacity of
greater than or equal to 3.2 cubic feet but less than 3.7 cubic feet; steam cycle(s) not included; water heater included; white finish.
28 Email from ***. 29 In the preliminary phase, pricing products were requested both for all LRWs that fit product descriptions and
for the highest-selling SKU in each quarter. In this final phase, parties commenting on the questionnaires generally stated that this method of requesting pricing data was not as useful as asking for pricing data on a wider variety of products.
V-10
Product 4.--Top loading, CEE Tier 2 or 3 rated washer; rated DOE capacity of greater than or equal to 3.7 cubic feet but less than 4.2 cubic feet; steam cycle(s) not included; water heater not included; lid includes glass material; white finish.
Product 5.--Top loading, CEE Tier 2 or 3 rated washer; rated DOE capacity of greater than or equal to 4.2
cubic feet; steam cycle(s) not included; water heater included; lid includes glass material; any non-white finish.
Product 6.--Front loading, CEE Tier 2 or 3 rated washer; rated DOE capacity of greater than or equal to 3.2
cubic feet but less than 3.7 cubic feet; steam cycle(s) not included; water heater included; any non-white finish.
Product 7.--Top loading, CEE Tier 2 or 3 rated washer; rated DOE capacity of greater than or equal to 4.2
cubic feet; steam cycle(s) not included; water heater not included; solid metal lid; white finish.
Product 8.--Top loading, CEE Tier 2 or 3 rated washer; rated DOE capacity of greater than or equal to 4.2
cubic feet; steam cycle(s) not included; water heater not included; lid includes glass material; white finish.
Product 9.--Front loading, CEE Tier 2 or 3 rated washer; rated DOE capacity greater than or equal to
4.2 cubic feet; steam cycle(s) not included; no LCD display; water heater included; any non-white finish.
Product 10.--Front loading, CEE Tier 2 or 3 rated washer; rated DOE capacity greater than or equal to
4.2 cubic feet; steam cycle(s) included; water heater included; no LCD display; white finish. Product 11.--Front loading, CEE Tier 2 or 3 rated washer; rated DOE capacity equal to or greater than 4.2
cubic feet; steam cycle(s) not included; water heater included; no LCD display; white finish. Products 1, 3, 4, and 5 are the same as products of the same numbers from the preliminary phase.
Product 2 from the preliminary phase was replaced with the product 2 described above, as suggested by respondents. Products 6 through 11 are products new to this phase of the investigations, as suggested by various parties.30 The “high efficiency” language used in the preliminary phase descriptions of the products has been replaced by the “CEE Tier 2 or 3 rated washer” language used here.31
Parties submitted detailed methodologies for how they calculated their final prices net of all discounts; nonetheless, disagreements remained over whether all firms had submitted data
30 Specifically, Whirlpool, GE, and Staber suggested products 1, 3, 4, 5, 6, 7, 9, 10, and 11. Respondents
suggested products 1, 2, 4, 5, 8, and 11. Bosch and Fischer & Paykel suggested products 3, 6, and 7. 31 *** stated that, for purposes of pricing data, “high efficiency” and “CEE Tier 2 or 3 rated washer” were
similar. See respondents’ comments on questionnaires and ***.
V-11
correctly.32 33 34 35 At the hearing, LG and Samsung alleged that its LRWs sell for higher prices to consumers than Whirlpool’s LRWs do, and expressed “puzzlement” at pricing data that showed higher prices for Whirlpool LRWs.36
*** provided U.S. producer pricing data of ***. *** provided U.S. producer pricing data for ***.37 *** provided Korean pricing data for products *** and for U.S. imports from Mexico for ***. *** provided data on imports of *** from ***. *** provided pricing data on imports from Korea for ***. *** provided pricing data on imports of *** from Korea. *** provided pricing data on imports of *** from Mexico.
Data reported by these firms accounted for approximately *** percent of U.S. producers’ 2011 shipments of LRWs, *** percent of U.S. shipments of 2011 subject imports from Korea, and *** percent of 2011 subject imports from Mexico.
Pricing data are presented in tables V-6 to V-16 and in figure V-2. The Commission also collected data on firms’ pricing data at the levels of invoice value and value net of direct (but not indirect) discounts only. Commission staff have determined that while pricing data from producers and importers are comparable net of all (i.e., direct and indirect) discounts, there may be discrepancies in whether particular discounts are counted at the invoice, direct, or indirect levels. Thus, while the Commission collected data on pricing data on an invoice basis and net of direct discounts only, and staff presented these data in the prehearing report, these data are no longer presented in this final report. Additionally, data in appendix G show the changes to the pricing data in part V if *** that *** recorded as products *** were instead counted as product *** data or dropped (for some SKUs within its product *** data) when those SKUs would have been classified differently after April 2011.38 39
Table V-6 LRWs: Weighted-average f.o.b. prices and quantities of domestic and imported product 11 and margins of underselling/(overselling), by quarters, January 2009-June 2012
* * * * * * * Table V-7 LRWs: Weighted-average f.o.b. prices and quantities of domestic and imported product 21 and margins of underselling/(overselling), by quarters, January 2009-June 2012
* * * * * * * Table V-8 LRWs: Weighted-average f.o.b. prices and quantities of domestic and imported product 31 and margins of underselling/(overselling), by quarters, January 2009-June 2012
* * * * * * *
32 ***. 33 ***. Additionally, ***. 34 ***. ***. See also appendix G. 35 ***. ***. ***. 36 Hearing transcript, p. 286 (Herring, Dexter, and Ellis). 37 ***. ***. 38 See ***. 39 In its posthearing brief, Whirlpool also provided pricing data for its shipments of two out-of-scope washer
products. Posthearing brief of Whirlpool, p. III-1.
V-12
Table V-9 LRWs: Weighted-average f.o.b. prices and quantities of domestic and imported product 41 and margins of underselling/(overselling), by quarters, January 2009-June 2012
* * * * * * * Table V-10 LRWs: Weighted-average f.o.b. prices and quantities of domestic and imported product 51 and margins of underselling/(overselling), by quarters, January 2009-June 2012
* * * * * * * Table V-11 LRWs: Weighted-average f.o.b. prices and quantities of domestic and imported product 61 and margins of underselling/(overselling), by quarters, January 2009-June 2012
* * * * * * * Table V-12 LRWs: Weighted-average f.o.b. prices and quantities of domestic and imported product 71 and margins of underselling/(overselling), by quarters, January 2009-June 2012
* * * * * * * Table V-13 LRWs: Weighted-average f.o.b. prices and quantities of domestic and imported product 81 and margins of underselling/(overselling), by quarters, January 2009-June 2012
* * * * * * * Table V-14 LRWs: Weighted-average f.o.b. prices and quantities of domestic and imported product 91 and margins of underselling/(overselling), by quarters, January 2009-June 2012
* * * * * * * Table V-15 LRWs: Weighted-average f.o.b. prices and quantities of domestic and imported product 101 and margins of underselling/(overselling), by quarters, January 2009-June 2012
* * * * * * * Table V-16 LRWs: Weighted-average f.o.b. prices and quantities of domestic and imported product 111 and margins of underselling/(overselling), by quarters, January 2009-June 2012
* * * * * * * Figure V-2 LRWs: Weighted-average prices and quantities of domestic and imported products 1-11, by quarters, January 2009-June 2012
* * * * * * * Source: Tables V-6 to V-16.
V-13
Price Trends
Table V-17 summarizes price trends in the pricing products, by country and by product. Few clear
trends emerge in the data, as some pricing products rise, and others fall, both by large and small magnitudes.
Price Comparisons As shown in table V-18, Korean and Mexican LRWs undersold U.S. LRWs in 99 quarterly
comparisons and oversold U.S. LRWs in 11 quarterly comparisons. Summary data in this table are subject to decisions about the best way to classify pricing data for certain LRWs, as discussed above.
Table V-17 LRWs: Summary of weighted-average f.o.b. prices for products 1-11 from the United States, Mexico, and Korea
* * * * * * *
Table V-18 LRWs: Instances of underselling/overselling and the range and average of margins, January 2009-June 2012
* * * * * * *
ADDITIONAL PRICING INFORMATION Price leaders Purchasers were asked to name any firms that they considered price leaders in the LRW market since January 1, 2009. Five purchasers named both suppliers of U.S.-produced and subject import LRWs, without specifying whether one leader led prices up while others led prices down. Two more purchasers stated that Whirlpool or GE and Whirlpool led prices up while Electrolux led prices down. An additional two purchasers (***) stated that Whirlpool led prices up while LG and Samsung led prices down. *** stated that LG and Samsung were price leaders through frequent use of promotional prices. However, *** described Whirlpool as the “low price leader.” Three additional purchasers described Whirlpool as a price leader, one more described Electrolux as the price leader, and one more described Electrolux, LG, and Samsung as price leaders. Two final purchasers described big box retailers as the price leaders, stating that they set price levels followed by other retailers. Ten purchasers reported that all or most major LRW suppliers had attempted to raise LRW prices since January 1, 2009. Three indicated that Whirlpool, GE, and/or Electrolux had; two more indicated that only Whirlpool and/or GE had. One indicated only that LG and Samsung had. Eight purchasers stated that no LRW supplier attempts to increase prices since January 1, 2009 had failed, but 11 stated that some such attempts had failed. Of those that reported price increases, purchasers cited four instances of Whirlpool failing to secure an attempted price increase and two instances of Electrolux failing to secure an attempted price increase. Additionally, *** indicated that when Whirlpool price increases lead to decreased demand, Whirlpool may offer customer rebates. At the hearing, Whirlpool described attempting to raise prices in December 2011 and again in July 2012, with its July 2012 attempt withdrawn due to retailers threatening the loss of floor space in response.40
40 Hearing transcript, p. 41 (Abdelnour).
V-14
LG described its own price rise in 2012 as announced in November 2011, before the filing of the petition in these investigations.41 Also at the hearing, Electrolux described Whirlpool’s 2006 acquisition of Maytag as allowing Whirlpool to use its then-“dominant” share of the U.S. market to squeeze then-U.S. producer Electrolux on price.42 Pricing Dynamics Whirlpool stated that lower subject import prices on higher-priced LRW models could push down prices on lower-priced LRW models.43 It added that being able to raise prices in 2012 on higher-priced LRW models allowed it to raise prices on lower-priced LRW models as well.44 Home Depot also described pricing of higher-featured LRWs at lower prices as reducing prices of less-featured LRWs, but provided an example of an alleged Whirlpool discount as driving such a price reduction.45 LOST SALES AND LOST REVENUES
Final Phase
In the final phase, *** submitted 3 new lost sales and 142 new lost revenues for the period since the
preliminary phase. (The allegations for this final phase were in a slightly different format than those for the preliminary phase, which are summarized below.) These final-phase allegations are presented in tables V-19 (for lost revenues) and V-20 (for lost sales) and summarized below.46 Final-phase lost revenue allegations totaled $23.1 million, with a wide disparity between the amounts for each named firm. Final-phase lost sales allegations totaled $15.1 million. Some of these lost revenue allegations concern an attempt by Whirlpool to raise prices twice in 2012, after an initial price increase did not restore profitability.47 LG alleged that Whirlpool’s inability to push through the second of two 2012 price increases was due to broader trends affecting the overall appliance industry.48 Table V-19 Large Residential Washers: U.S. producers’ final phase lost revenues allegations
* * * * * * * ***
***. ***
*** ***
***.
41 Hearing transcript, p. 204 (Herring). 42 Hearing transcript, pp. 223-24 (Chambers). 43 Hearing transcript, p. 33 (Fettig). Some buyers’ groups also described such “price compression.” See, for
example, written statement of buying group Mega, December 4, 2012. 44 Hearing transcript, p. 148 (Tubman). 45 Hearing transcript, pp. 254-55 (Baird). 46 LG responded to these allegations on pp. 94-98 of its prehearing brief, and Samsung responded on pp. 71-73
of its prehearing brief. 47 Hearing transcript, p. 41 (Abdelnour). 48 Posthearing brief of LG, p. 22 (response to Commissioner Aranoff).
V-15
Table V-20 Large Residential Washers: U.S. producers’ lost sales allegations
* * * * * * * ***
***. *** ***49
***.50 ***.51 ***.52 ***.53 54 Additionally, ***.55
Preliminary Phase
In the preliminary phase of these investigations, the Commission requested U.S. producers of
LRWs to report any instances of lost sales or revenues they experienced due to competition from imports of LRWs from Korea and Mexico since January 1, 2008.
Petitioners made nine allegations of lost sales in the petition. ***. ***.56 Table V-21 LRWs: U.S. producers’ lost sales allegations with responses from purchasers
* * * * * * *
Source: Compiled from data submitted in response to Commission inquires. In the preliminary phase, petitioners made five allegations of lost revenues based on LG and Samsung lowering prices on competing machines. Retailers’ responses were mixed: many, but not all, details of the alleged price changes were confirmed, but at times retailers only had knowledge of a single company’s product or stated that the machines cited in the allegation did not compete with each other (table V-22). Table V-22 LRWs: U.S. producers’ lost revenue allegations with responses from purchasers
* * * * * * * Source: Compiled from data submitted in response to Commission inquires.
49 See staff conversations with ***, November 1, 2012 and November 30, 2012, as well as email from ***,
December 21, 2012. Also see staff interview with ***, ***, and posthearing brief of Whirlpool, ***. 50 ***. 51 ***. 52 ***. 53 See emails from ***. Percentages are staff calculations based on ***. ***. ***. 54 ***. 55 See emails from ***. 56 These preliminary phase allegations were in a somewhat different format from traditional Commission lost
sales and lost revenues allegations, and thus the format of table V-21 is somewhat different than tables V-19 and V-20.

PART VI: FINANCIAL CONDITION OF U.S. PRODUCERS
BACKGROUND
Six producers,1 provided usable financial data on their LRWs operations. These firms accountedfor the vast majority of the domestic industry’s production/sales volume during the period examined. Alliance, Electrolux, Staber, and Whirlpool reported financial data for the entire period examined whileBSH reported for 2009-2011 and GE reported for January-June 2012 only. *** reported small amounts ofinternal consumption2 (approximately *** percent of combined net sales value of 2011) in every period. *** reported transfers to related firms (approximately *** percent of combined net sales value of 2011). The unit sales value of ***.3
OPERATIONS ON LARGE RESIDENTIAL WASHERS
Aggregate income-and-loss data for the U.S. producers are presented in table VI-1. Tosummarize, the domestic industry experienced operating losses throughout the period, due mainly to theincreased average unit total costs which were consistently higher than the average unit sales value overthe period. Most of the deterioration occurred between 2010 and 2011, despite the somewhat increasedaverage unit sales value during the same period. Between 2009 and 2011, an increase in the per-unit salesvalue ($*** per unit) as well as an increase in unit total costs ($*** per unit), i.e., cost of goods sold(“COGS”) and selling, general, and administrative (“SG&A”) expenses, combined resulted in asubstantially increased operating loss in 2011 (by $*** per unit). As a result, the industry’s operatingloss margin increased from *** percent in 2009 to *** percent in 2011.
During the interim period of January-June 2012 , the average per-unit net sales value decreased(by $*** per unit), while the average per-unit total cost also decreased (by $*** per unit) compared withJanuary-June 2011, resulting in a much lower per-unit operating loss (a decrease of $*** per unit) inJanuary-June 2012. The decrease in per-unit total costs in January-June 2012 was mainly attributable tothe decrease of per-unit cost of raw materials, factory overhead, and SG&A expenses, especially ***.
Table VI-1LRWs: Results of operations of U.S. producers, fiscal years 2009-11, January-June 2011, andJanuary-June 2012
* * * * * * *
Selected company-by-company data are presented in table VI-2. Total net sales (quantities andvalues), per-unit values (sales, COGS, SG&A, and operating income), operating income, and the ratio ofoperating income (loss) to net sales are presented in this table on a firm-by-firm basis. Both *** reporteddecreased sales quantities and values between 2009 and 2011 and in interim 2012 compared with interim2011 because ***. *** sales quantities and values increased between 2009 and 2011, but both quantity
1 All producers (except *** have their fiscal years end on December 31. However, ***. 2 The internal consumption reported by ***. E-mail from ***, November 8, 2012 3 Commission staff conducted a verification of Whirlpool’s questionnaire response on November 27-29, 2012. There was no major issues or revisions that resulted from the verification (refer to the verification report issued onDecember 3, 2012) .
VI-1
and value decreased in interim 2012 compared with interim 2011.4 The unit sales values, unit COGS andunit SG&A of *** are much higher compared to those of *** due primarily to product mix. Further, thesales quantities and values of *** are much smaller to compared to sales volume and values of ***. Dueto differences in product mix, it is not advisable to compare the unit values of each of the six producers. While ***.
While the per-unit cost of raw materials increased substantially between 2010 and 2011, dueprimarily to the increase of ***,5 the other producers’ per-unit material costs actually decreased (except aminor increase of ***) during the same period. Per-unit conversion costs (direct labor and factoryoverhead combined) increased moderately during the same period, as well as per-unit SG&A expenses.6 ***.7 ***.8 *** reported operating losses for all periods while ***.
Table VI-2LRWs: Results of operations of U.S. producers, by firm, fiscal years 2009-11, January-June 2011,and January-June 2012
* * * * * * *
Selected aggregate per-unit cost data of the producers on their operations, i.e., COGS and SG&Aexpenses, are presented in table VI-3. Overall per-unit COGS and total cost (which includes SG&Aexpenses) increased from 2009 to 2011. However, they decreased in interim 2012 compared with interim2011 because ***. However, *** in interim 2012 as explained previously.9 The ratio of total COGS tonet sales increased between 2010 and 2011, but was lower in interim 2012 than in interim 2011.
Table VI-3LRWs: Average unit costs of U.S. producers, fiscal years 2009-11, January-June 2011, andJanuary-June 2012
* * * * * * *
4 Based on Whirlpool’s Form 10-K submitted to the Securities and Exchange Commission (SEC) for twelvemonths ended December 31, 2011, Whirlpool has four geographical regions which consist of North America, LatinAmerica, EMEA (Europe, Middle East and Africa), and Asia. Whirlpool’s principal products (four businesssegments) are laundry appliances, refrigerators and freezers, cooking appliances, and others which includedishwashers, mixers, and other portable household appliances. Whirlpool’s laundry appliances segment representedapproximately 30 percent of its entire operations, in terms of net sales value for 2011. Whirlpool’s consolidatedoperating income for 2011 was $792 million while its net loss before income taxes was $28 million. Whirlpool’s netloss before income taxes for 2011 on its U.S. operations only was $240 million while its net income before incometaxes on its overseas operation was $212 million (therefore, its consolidated net loss before income taxes for 2011was $28 million). 5 ***. E-mail from ***, October 24, 2012. ***. E-mail from ***, January 26, 2012. 6 Whirlpool’s reported SG&A as a percentage of net sales for 2011 was approximately *** percent while SG&Apercentage of North America Region was 6.9 percent and SG&A percentage on the consolidated basis was 8.7percent for the same year (based on Whirlpool’s Form 10-K submitted to the Securities and Exchange Commission(SEC) for twelve months ended December 31, 2011). Whirlpool treats ***. E-mail from ***, October 24, 2012. 7 ***. E-mail from ***, November 2, 2012. 8 ***. 9 E-mail from ***, October 24, 2012.
VI-2
The variance analysis showing the effects of prices and volume on the producers’ sales of LRWs,and of costs and volume on their total cost, is shown in table VI-4.10 The analysis indicates that theincrease in operating loss between 2009 and 2011 was the result of per-unit costs and expenses increasingfaster than per-unit sales prices. The summary at the bottom of the table illustrates that from 2009 to2011 the negative effect of increased costs and expenses more than offset the positive effect of increasedprices. The variance analysis indicates that the increase in operating loss of $*** resulted from thecombined positive effects of increased price ($***) and decreased sales volume ($***), after increasedcosts/expenses ($***). Comparing interim 2012 to interim 2011, the variance analysis indicates that thesubstantial decrease in operating loss of $*** resulted from the negative effects of decreased prices($***) and the negative effect of volume ($*** combined with the positive effect of decreasedcosts/expenses ($***).
Table VI-4LRWs: Variance analysis of operations of U.S. producers, fiscal years 2009-11,January-June 2011, and January-June 2012
* * * * * * *Only two domestic producers, ***, reported Energy Efficient Appliance Federal Tax Credits for
LRWs, amounting to ***. ***.11
CAPITAL EXPENDITURES AND RESEARCH AND DEVELOPMENT EXPENSES
The responding firms’ aggregate data on capital expenditures and research and development(“R&D”) expenses are presented in table VI-5. While all U.S. producers except ***, reported capitalexpenditures, the majority were spent by *** during the period for which data were collected. Capitalexpenditures increased substantially between 2009 and 2011, and R&D expenses increased from 2010 to2011 and between the two interim periods. Data for capital expenditures on a firm-by-firm basis areshown in table VI-6.
10 The Commission’s variance analysis is calculated in three parts: sales variance, COGS variance, and SG&Aexpenses variance. Each part consists of a price variance (in the case of the sales variance) or a cost variance (in thecase of the COGS and SG&A variances) and a volume variance. The sales or cost variance is calculated as thechange in unit price/cost times the new volume, while the volume variance is calculated as the change in volumetimes the old unit price/cost. Summarized at the bottom of the respective tables, the price variance is from sales, thecost/expense variance is the sum of those items from COGS and SG&A, respectively, and the net volume variance isthe sum of the price, COGS, and SG&A volume variance. All things being equal, a stable overall product mixgenerally enhances the utility of the Commission’s variance analysis.
11 In its questionnaire response submitted on October 17, 2012, ***, respectively. As these credits were notutilized, they were moved to the deferred asset account, consistent with generally accepted accounting principles(“GAAP”). Other firms also explained that these credits were not reported because they were applied as a reductionto income taxes and below net income items. These credits do not require firms to restate any operations results,such as operating income and net income before income taxes. The energy efficient appliance Federal tax creditswere recently extended through the end of 2013 in the “fiscal cliff” deal Congress just passed, known as “TheAmerican Taxpayer Relief Act of 2012". See “Fiscal Cliff Bill also extends tax credits for renewable energy, energyefficiency, and alternative fuel vehicles”, January 7, 2013,http://www.mondaq.com/unitedstates/x/214938/Renewables/Fiscal+Cliff+Bill+Also+Extends+Tax+Credits+For+Renewable+Energy+Energy+Efficiency+And+Alternative+Fuel+Vehicles, retrieved January 8, 2013.
VI-3
Table VI-5LRWs: Capital expenditures and R&D expenses by U.S. producers, fiscal years 2009-11, January-June 2011, and January-June 2012
* * * * * * *
Table VI-6LRWs: Capital expenditures by U.S. producers, by firms, fiscal years 2009-11,January-June 2011, and January-June 2012
* * * * * * *
ASSETS AND RETURN ON ASSETS
U.S. producers were requested to provide data on their assets used in the production and sales ofLRWs during the period for which data were collected to assess their return on assets (“ROA”). The totalnet asset assets increased substantially from 2009 to 2010.12 At the same time, the return on the assetsremained negative during the same period as operating losses decreased in 2010 and substantiallyincreased in 2011. The trend of ROA over the period generally tracked the trend of the operating incomemargin shown in table VI-1.
Table VI-7LRWs: Value of assets and return on assets of U.S. producers, fiscal years 2009-11
* * * * * * *
CAPITAL AND INVESTMENT
The Commission requested U.S. producers to describe any actual negative or potential effects ontheir return on investment, or their growth, investment, ability to raise capital, existing development andproduction efforts, or the scale of capital investments as a result of imports of LRWs from Korea andMexico. Their responses were as follows:
Actual Negative Effects
Alliance.–***
BSH.–***
Electrolux.–***
GE.–***
Staber.–***
Whirlpool.–***
12 While other firms’ net assets either decreased or remained relatively at the same level (except ***), ***. E-mails from ***, January 18 and October 24, 2012. ***. E-mail from ***, October 26, 2012.
VI-4
Anticipated Negative Effects
Alliance.–***
BSH.–***
Electrolux.–***
GE.–***
Staber.–***
Whirlpool.–***
VI-5

VII-1
PART VII: THREAT CONSIDERATIONS AND INFORMATION ON NONSUBJECT COUNTRIES
Section 771(7)(F)(i) of the Act (19 U.S.C. § 1677(7)(F)(i)) provides that--
In determining whether an industry in the United States is threatened with material injury by reason of imports (or sales for importation) of the subject merchandise, the Commission shall consider, among other relevant economic factors1--
(I) if a countervailable subsidy is involved, such information as may be presented to it by the administering authority as to the nature of the subsidy (particularly as to whether the countervailable subsidy is a subsidy described in Article 3 or 6.1 of the Subsidies Agreement), and whether imports of the subject merchandise are likely to increase,
(II) any existing unused production capacity or imminent, substantial increase in production capacity in the exporting country indicating the likelihood of substantially increased imports of the subject merchandise into the United States, taking into account the availability of other export markets to absorb any additional exports,
(III) a significant rate of increase of the volume or market penetration of imports of the subject merchandise indicating the likelihood of substantially increased imports,
(IV) whether imports of the subject merchandise are entering at prices that are likely to have a significant depressing or suppressing effect on domestic prices, and are likely to increase demand for further imports,
(V) inventories of the subject merchandise,
(VI) the potential for product-shifting if production facilities in the foreign country, which can be used to produce the subject merchandise, are currently being used to produce other products,
(VII) in any investigation under this title which involves imports of both a raw agricultural product (within the meaning of paragraph (4)(E)(iv)) and any product processed from such raw agricultural product, the likelihood that there will be increased imports, by reason of product shifting, if there is an affirmative determination by the Commission under section 705(b)(1) or 735(b)(1) with respect to either the raw agricultural product or the processed agricultural product (but not both),
1 Section 771(7)(F)(ii) of the Act (19 U.S.C. § 1677(7)(F)(ii)) provides that “The Commission shall consider
{these factors} . . . as a whole in making a determination of whether further dumped or subsidized imports are imminent and whether material injury by reason of imports would occur unless an order is issued or a suspension agreement is accepted under this title. The presence or absence of any factor which the Commission is required to consider . . . shall not necessarily give decisive guidance with respect to the determination. Such a determination may not be made on the basis of mere conjecture or supposition.”
VII-2
(VIII) the actual and potential negative effects on the existing development and production efforts of the domestic industry, including efforts to develop a derivative or more advanced version of the domestic like product, and
(IX) any other demonstrable adverse trends that indicate the probability that there is likely to be material injury by reason of imports (or sale for importation) of the subject merchandise (whether or not it is actually being imported at the time).2
Information on the volume and pricing of imports of the subject merchandise is presented in Parts IV and V; and information on the effects of imports of the subject merchandise on U.S. producers’ existing development and production efforts is presented in Part VI. Information on inventories of the subject merchandise; foreign producers’ operations, including the potential for “product-shifting;” any other threat indicators, if applicable; and any dumping in third-country markets, follows. Also presented in this section of the report is information obtained for consideration by the Commission on nonsubject countries and the global market.
THE INDUSTRY IN KOREA
In these final phase investigations, the Commission received questionnaire responses from three producers of LRWs in Korea: Daewoo Electronics (“Daewoo Korea”),3 LG Electronics, Inc. (“LG Korea”), 4 and Samsung Electronics Co., Ltd. (“Samsung Korea”).5 These firms are believed to account for virtually all, if not all, of exports to the U.S. from Korea.6 Table VII-1 presents the individual firms’ 2011 production capacity, production, and export data.
2 Section 771(7)(F)(iii) of the Act (19 U.S.C. § 1677(7)(F)(iii)) further provides that, in antidumping
investigations, “. . . the Commission shall consider whether dumping in the markets of foreign countries (as evidenced by dumping findings or antidumping remedies in other WTO member markets against the same class or kind of merchandise manufactured or exported by the same party as under investigation) suggests a threat of material injury to the domestic industry.”
3 Daewoo is affiliated with Daewoo Electronics America, Inc., (“Daewoo America”), a U.S. importer of the subject product. Daewoo reported ***.
4 LG Korea is affiliated with LG Electronics USA Inc., a U.S. importer of the subject product; Nanjing LG-Panda Appliances Co., Ltd, a producer of LRWs in China; LG Electronics Russia, LLC, a producer of LRWs in Russia; LG Electronics India Pvt. Ltd, a producer of LRWs in India; LG Electronics Thailand Co., Ltd., a producer of LRWs in Thailand; LG Electronics Vietnam Co., Ltd., a producer of LRWs in Vietnam; LG Electronics Almaty Kazakhstan, a producer of LRWs in Kazakhstan; LG Electronics de Sao Paulo Ltd., a producer of LRWs in Brazil; LG Electronics Wroclaw Sp. z.o.o., a producer of LRWs in Poland. LG Korea estimated that it accounted for *** percent of total production of LRWs in Korea and *** percent of total exports to the United States of LRWs from Korea in 2011.
5 Samsung Korea is affiliated with Samsung America, a U.S. importer of the subject product; Thai-Samsung Electronics Co., Ltd., a producer of LRWs in Thailand; and Samsung Electronics Mexico S.A. de C.V., a producer of LRWs in Mexico. Samsung Korea reported ***.
6 Conference transcript, p. 67 (Greenwald).
VII-3
Table VII-1 LRWs: Korea’s reported production capacity, production, and U.S. exports, by firm, 2011
Producer Capacity (units)
Production (units)
Share of reported 2011 production in
Korea (percent)
Exports to the U.S. (units)
Share of reported 2011
total shipments
exported to the U.S. (percent)
Daewoo Korea *** *** *** *** ***LG Korea *** *** *** *** ***Samsung Korea *** *** *** *** ***Total *** *** 100.0 *** ***Source: Compiled from data submitted in Commission questionnaire responses. Daewoo Korea
In 2011, *** percent of Daewoo Korea’s total shipments of LRWs were exported to the United States, *** percent of its total shipments were to its home market, and *** percent of its total shipments were to export markets other than the United States, which include ***. Between 2009 and 2011, Daewoo Korea’s production increased by *** percent and its exports to the United States decreased by *** percent over the same period. Daewoo Korea reported that it shipped to *** U.S. importers of LRWs in 2011, ***.
LG Korea
In 2011, *** percent of LG Korea’s total shipments of LRWs were exported to the United States, *** percent of its total shipments were to its home market, and *** percent of its total shipments were to export markets other than the United States, which include ***. LG Korea’s exports to the United States increased by *** percent from 2009 to 2011. Between 2009 and 2011, LG Korea’s production increased by *** percent. LG Korea reported that it shipped to *** U.S. importers of LRWs in 2011, ***. Samsung Korea
In 2011, *** percent of Samsung Korea’s total shipments of LRWs were exported to the United States, *** percent of its total shipments were to its home market, and *** percent of its total shipments were to export markets other than the United States, which include ***. Between 2009 and 2011, its production decreased by *** percent while its exports to the United States decreased by *** percent over the same period. In ***, Samsung set up a new production line for front-load LRWs in Mexico. In anticipation of this shift, Samsung reduced its Korean front-load capacity by *** percent between 2009 and 2011. ***. 7 Samsung Korea reported that it shipped to *** U.S. importer of LRWs in 2011, ***.
Table VII-3 presents cumulative data for reported capacity, production, and shipments of LRWs for all reporting producers in Korea.8 As detailed in table VII-3, overall capacity decreased by *** between 2009 and 2011. Exports to the United States increased by *** percent between 2009 and 2011, but were *** percent lower in interim 2012 than interim 2011.9
7 Samsung’s posthearing brief, Responses to Commissioners’ and Staff Questions, pp. A-21-22. 8 Daewoo, LG Korea and Samsung Korea reported ***. 9 Exports to the United States accounted for at least *** percent of total shipments over the period for which data
were collected.
VII-4
Table VII-3 LRWs: Data for capacity, production, shipments, and inventories of producers in Korea, 2009-11, January-June 2011, January-June 2012, and projected 2012-13
* * * * * * *
*** producers of LRWs in Korea reported the ability to switch production between LRWs and
other products in response to a relative change in the price of LRWs vis-a-vis the price of other products, using the same equipment and/or labor. The firms’ responses are presented below:
* * * * * * *
Front-load LRWs in Korea
Figure VII-1 identifies the firms from Korea that reported exports to the United States of front-load LRWs between January 2009 and June 2012. As detailed in figure VII-1, *** exported front-load LRWs to the United States throughout the period. Based on the responses of the three producers of LRWs in Korea, *** accounted for the majority of Korea’s reported front-load LRW exports to the United States, accounting for *** percent of these exports in 2011. Figure VII-1 Front-load LRWs: Korea’s reported exports to the U.S., by firm, 2009-11, and January-June 2012
* * * * * * *
Table VII-4 present cumulative data for reported capacity, production, and shipments of front-load LRWs in Korea. As detailed in table VII-4, between 2009 and 2011, capacity for front-load LRWs in Korea decreased by ***, while production of front-load LRWs decreased by *** percent over the same period. Exports of front-load LRWs from Korea to the United States decreased by *** percent between 2009 and 2011.10 These declines are largely attributable to Samsung, which set up a new production line for front-load LRWs in Mexico in ***. In anticipation of this shift, Samsung reduced its Korean front-load LRW capacity by *** percent between 2009 and 2011 and its production of front-load LRWs in Korea decreased by *** over the same period. ***. Samsung currently produces conventional top-load LRWs at its Mexican facility for the Mexican and Latin American market. It does not plan to export these washers to the United States.11 Table VII-4 Front-load LRWs: Data for capacity, production, shipments, and inventories of producers in Korea, 2009-11, January-June 2011, January-June 2012, and projected 2012-13
* * * * * * *
10 Exports to the United States accounted for at least *** percent of total shipments over the period for which
data were collected. 11 Samsung’s posthearing brief, Responses’ to Commissioners’ and Staff Questions, pp. A-21-22.
VII-5
Top-load LRWs in Korea
As illustrated in figures VII-2 and VII-3, exports of top-load LRWs from Korea to the United States began in ***. Figure VII-2 Top-load LRWs: Korea’s reported exports to the U.S., by firm, 2009-11, January-June 2012
* * * * * * * Figure VII-3 Top-load LRWs: Korea’s reported exports to the U.S., by firm, 2009-11, January-June 2012
* * * * * * *
Table VII-5 presents cumulative data for reported capacity, production, and shipments of top-load LRWs in Korea.
Table VII-5 Top-load LRWs: Data for capacity, production, shipments, and inventories of producers in Korea, 2009-11, January-June 2011, January-June 2012, and projected 2012-13
* * * * * * *
THE INDUSTRY IN MEXICO
The Commission received questionnaire responses from three producers of LRWs in Mexico:12 Electrolux Home Products de Mexico, S.A. de C.V. (“Electrolux Mexico”); 13 Samsung Electronics Mexico S.A. de C.V. (“Samsung Mexico”); 14 and Whirlpool Mexico, S.A. de C.V. (“Whirlpool Mexico”).15 These firms are believed to account for the vast majority, if not all, of exports to the U.S. from Mexico.16 Table VII-6 shows 2011 capacity, production, and export shipment data for the individual firms.
12 The Commission also received a questionnaire response from Controladora Mabe S.A. de C.V. (“Mabe”);
however, Mabe reported that it only produces out-of-scope top-load residential washers with DOE rated capacity of less than or equal to 3.7 cubic feet.
13 Electrolux Mexico is affiliated with Electrolux Home Products, Inc., a U.S. importer of subject product. Electrolux was also a U.S. producer of LRWs until early 2011 when it shifted its production of LRWs to its facilities in Mexico. Petition, p. 12. Electrolux Mexico reported ***.
14 Samsung Mexico is affiliated with Samsung America, a U.S. importer of the subject product; Thai-Samsung Electronics Co., Ltd, a producer of LRWs in Thailand; and Samsung Korea, a producer of LRWs in Korea. Samsung Mexico reported ***.
15 Whirlpool Mexico is affiliated with Whirlpool, a U.S. producer and U.S. importer of subject product and Whirlpool Bauknecht Hausgeräte GmbH, a producer of LRWs in Germany. Whirlpool Mexico estimated that it accounted for *** percent of total production of LRWs in Mexico and *** percent of total exports to the United States of LRWs from Mexico in 2010.
16 Conference transcript, p. 67 (Greenwald).
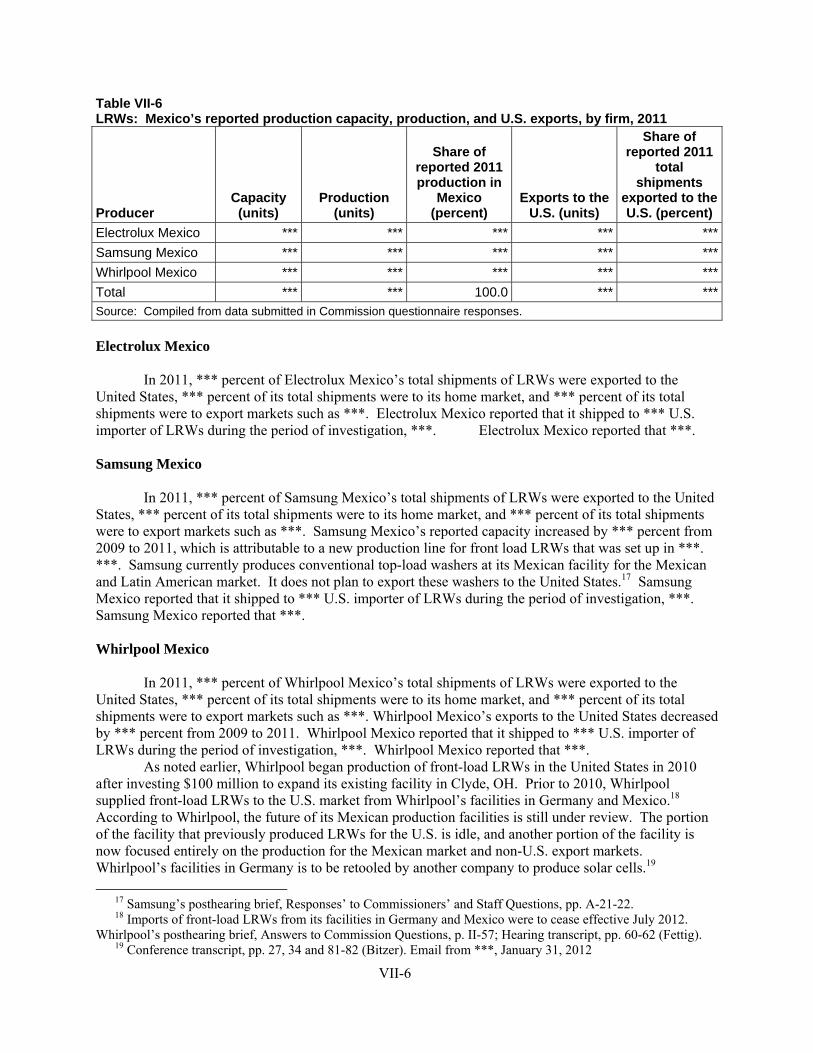
VII-6
Table VII-6 LRWs: Mexico’s reported production capacity, production, and U.S. exports, by firm, 2011
Producer Capacity (units)
Production (units)
Share of reported 2011 production in
Mexico (percent)
Exports to the U.S. (units)
Share of reported 2011
total shipments
exported to the U.S. (percent)
Electrolux Mexico *** *** *** *** ***Samsung Mexico *** *** *** *** ***Whirlpool Mexico *** *** *** *** ***Total *** *** 100.0 *** ***Source: Compiled from data submitted in Commission questionnaire responses. Electrolux Mexico
In 2011, *** percent of Electrolux Mexico’s total shipments of LRWs were exported to the United States, *** percent of its total shipments were to its home market, and *** percent of its total shipments were to export markets such as ***. Electrolux Mexico reported that it shipped to *** U.S. importer of LRWs during the period of investigation, ***. Electrolux Mexico reported that ***.
Samsung Mexico
In 2011, *** percent of Samsung Mexico’s total shipments of LRWs were exported to the United States, *** percent of its total shipments were to its home market, and *** percent of its total shipments were to export markets such as ***. Samsung Mexico’s reported capacity increased by *** percent from 2009 to 2011, which is attributable to a new production line for front load LRWs that was set up in ***. ***. Samsung currently produces conventional top-load washers at its Mexican facility for the Mexican and Latin American market. It does not plan to export these washers to the United States.17 Samsung Mexico reported that it shipped to *** U.S. importer of LRWs during the period of investigation, ***. Samsung Mexico reported that ***.
Whirlpool Mexico
In 2011, *** percent of Whirlpool Mexico’s total shipments of LRWs were exported to the United States, *** percent of its total shipments were to its home market, and *** percent of its total shipments were to export markets such as ***. Whirlpool Mexico’s exports to the United States decreased by *** percent from 2009 to 2011. Whirlpool Mexico reported that it shipped to *** U.S. importer of LRWs during the period of investigation, ***. Whirlpool Mexico reported that ***.
As noted earlier, Whirlpool began production of front-load LRWs in the United States in 2010 after investing $100 million to expand its existing facility in Clyde, OH. Prior to 2010, Whirlpool supplied front-load LRWs to the U.S. market from Whirlpool’s facilities in Germany and Mexico.18 According to Whirlpool, the future of its Mexican production facilities is still under review. The portion of the facility that previously produced LRWs for the U.S. is idle, and another portion of the facility is now focused entirely on the production for the Mexican market and non-U.S. export markets. Whirlpool’s facilities in Germany is to be retooled by another company to produce solar cells.19
17 Samsung’s posthearing brief, Responses’ to Commissioners’ and Staff Questions, pp. A-21-22. 18 Imports of front-load LRWs from its facilities in Germany and Mexico were to cease effective July 2012.
Whirlpool’s posthearing brief, Answers to Commission Questions, p. II-57; Hearing transcript, pp. 60-62 (Fettig). 19 Conference transcript, pp. 27, 34 and 81-82 (Bitzer). Email from ***, January 31, 2012
VII-7
*** reported the ability to switch production between LRWs and other products in response to a relative change in the price of LRWs vis-a-vis the price of other products, using the same equipment and/or labor.20
Table VII-7 presents cumulative data for reported capacity, production, and shipments of LRWs for all reporting producers in Mexico. As detailed in table VII-7, capacity increased by *** between 2009 and 2011, while production increased by *** percent over the same period. Capacity utilization never exceeded *** percent between January 2009 and June 2012. Exports to the United States increased by *** percent between 2009 and 2011 and were *** percent higher in interim 2012 than interim 2011.21
Table VII-7 LRWs: Data for capacity, production, shipments, and inventories of producers in Mexico, 2009-11, January-June 2011, January-June 2012, and projected 2012-13
* * * * * * * Front-load LRWs in Mexico
Figure VII-5 identifies the firms from Mexico that reported exports to the United States of front-load LRWs between January 2009 and June 2012. Figure VII-6 depicts the quantity (units) of these exports over the same period. ***.22 Electrolux is the only remaining Mexican firm supplying the U.S. market with front-load LRWs.23 Figure VII-5 Front-load LRWs: Mexico’s reported exports to the U.S., by firm, 2009-11, January-June 2012
* * * * * * * Figure VII-6 Front-load LRWs: Mexico’s reported exports to the U.S., by firm, 2009-2011, January-June 2012
* * * * * * *
Table VII-8 presents cumulative data for reported capacity, production, and shipments of front-load LRWs for all reporting producers in Mexico. Table VII-8 Front-load LRWs: Data for capacity, production, shipments, and inventories of producers in Mexico, 2009-11, January-June 2011, January-June 2012, and projected 2012-13
* * * * * * *
20 ***. 21 Exports to the United States accounted for at least *** percent of total shipments over the period for which
data were collected. 22 Samsung’s posthearing brief, Responses’ to Commissioners’ and Staff Questions, pp. A-21-22. 23 Electrolux’s posthearing brief, p. 13.
VII-8
Top-load LRWs in Mexico
***.24 Table VII-9 presents cumulative data for reported capacity, production, and shipments of top-load LRWs in Mexico. Table VII-9 Top-load LRWs: Data for capacity, production, shipments, and inventories of producers in Mexico, 2009-11, January-June 2011, January-June 2012, and projected 2012-13
* * * * * * *
U.S. INVENTORIES OF IMPORTED MERCHANDISE
Table VII-10 presents data on U.S. importers’ reported inventories of LRWs.
Table VII-10 LWRs: U.S. importers’ inventories, 2009-11, January-June 2011, and January-June 2012
* * * * * * *
U.S. IMPORTERS’ CURRENT ORDERS
The Commission requested U.S. importers to indicate whether they imported or arranged for the importation of LRWs after June 30, 2012. *** stated that they had imported or arranged for importation of approximately *** units valued at $*** from Korea since June 30, 2012.25 *** stated they had imported or arranged for importation of approximately *** units valued at $*** from Mexico since June 30, 2012.26
ANTIDUMPING DUTY ORDERS IN THIRD-COUNTRY MARKETS
In September 2003, Australia’s Customs Service completed antidumping investigations on Korean washing machines and imposed antidumping duties on washing machines exported by Samsung Korea and Daewoo. In September 2004, Australia’s Custom Service expanded those orders to cover exports of LG Korea as well. The measures were revoked in July 2008, pursuant to a finding that no Australian industry was producing like goods.27
GLOBAL MARKET
Tables VII-11 and VII-12 present Global Trade Atlas data concerning the export of washer
machines, by destination, from Korea and Mexico, respectively, from 2009-11.28 As detailed in these tables, the United States was the top market for exports from Korea and Mexico between 2009 and 2011.
24 ***. 25 ***. 26 ***. 27 Petition, pp. 14-15. 28 This HS category includes “household or laundry type washing machines, exceeding a dry linen capacity of 10
kilograms.” According to the petitioner, although this category does not fit the scope perfectly, it should serve as a benchmark for the Commission’s questionnaire data. Petitioner’s postconference brief, Answers to Commission Questions, p. 2.
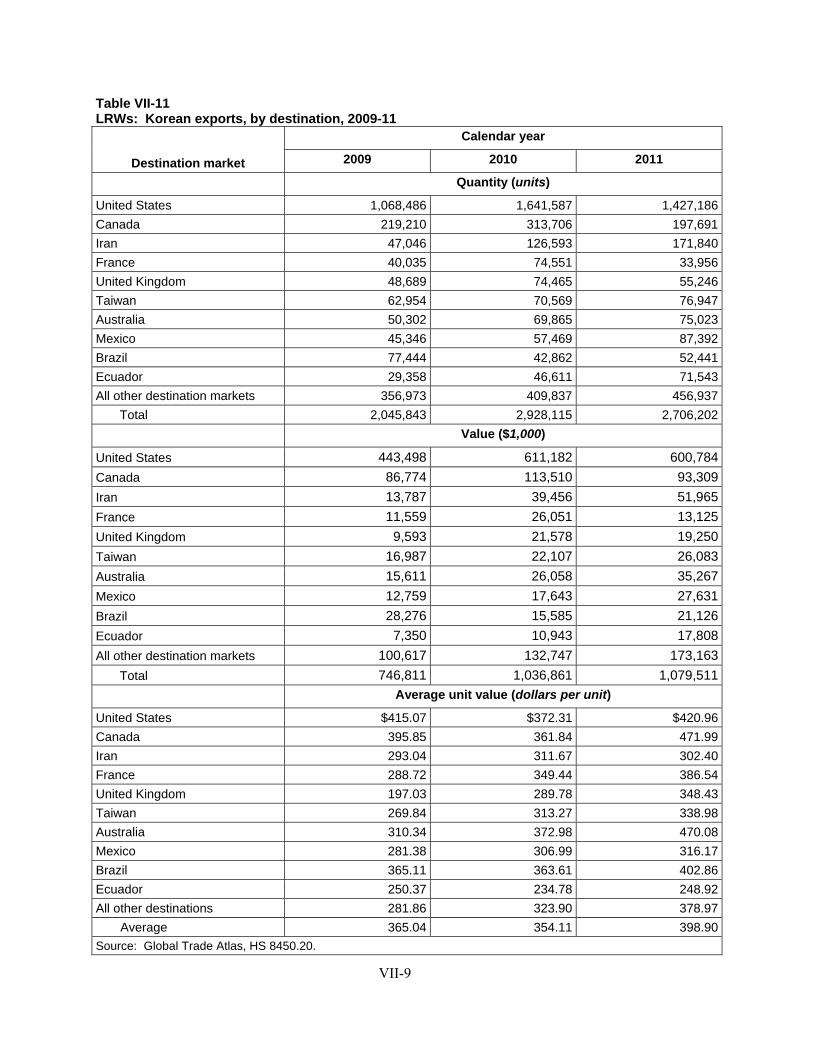
VII-9
Table VII-11 LRWs: Korean exports, by destination, 2009-11
Destination market
Calendar year
2009 2010 2011
Quantity (units)
United States 1,068,486 1,641,587 1,427,186Canada 219,210 313,706 197,691Iran 47,046 126,593 171,840France 40,035 74,551 33,956United Kingdom 48,689 74,465 55,246Taiwan 62,954 70,569 76,947Australia 50,302 69,865 75,023Mexico 45,346 57,469 87,392Brazil 77,444 42,862 52,441Ecuador 29,358 46,611 71,543All other destination markets 356,973 409,837 456,937
Total 2,045,843 2,928,115 2,706,202
Value ($1,000)
United States 443,498 611,182 600,784Canada 86,774 113,510 93,309Iran 13,787 39,456 51,965France 11,559 26,051 13,125United Kingdom 9,593 21,578 19,250Taiwan 16,987 22,107 26,083Australia 15,611 26,058 35,267Mexico 12,759 17,643 27,631Brazil 28,276 15,585 21,126Ecuador 7,350 10,943 17,808All other destination markets 100,617 132,747 173,163
Total 746,811 1,036,861 1,079,511
Average unit value (dollars per unit)
United States $415.07 $372.31 $420.96Canada 395.85 361.84 471.99Iran 293.04 311.67 302.40France 288.72 349.44 386.54United Kingdom 197.03 289.78 348.43Taiwan 269.84 313.27 338.98Australia 310.34 372.98 470.08Mexico 281.38 306.99 316.17Brazil 365.11 363.61 402.86Ecuador 250.37 234.78 248.92All other destinations 281.86 323.90 378.97 Average 365.04 354.11 398.90Source: Global Trade Atlas, HS 8450.20.
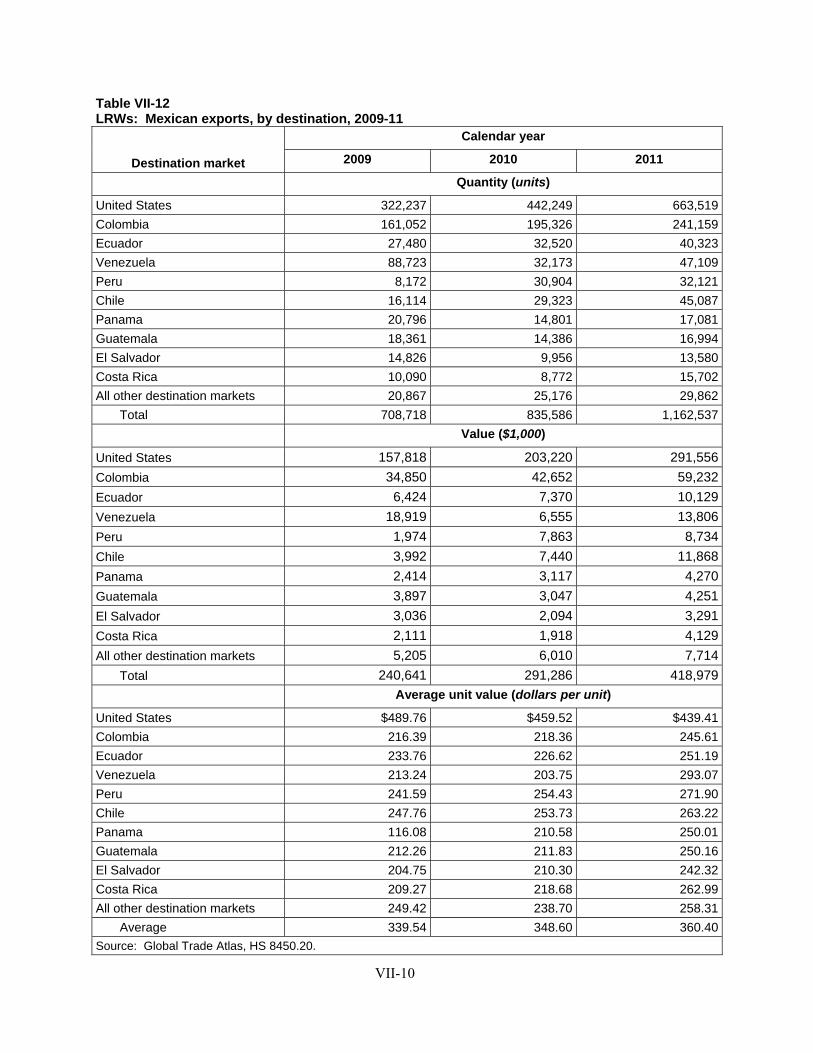
VII-10
Table VII-12 LRWs: Mexican exports, by destination, 2009-11
Destination market
Calendar year
2009 2010 2011
Quantity (units)
United States 322,237 442,249 663,519Colombia 161,052 195,326 241,159Ecuador 27,480 32,520 40,323Venezuela 88,723 32,173 47,109Peru 8,172 30,904 32,121Chile 16,114 29,323 45,087Panama 20,796 14,801 17,081Guatemala 18,361 14,386 16,994El Salvador 14,826 9,956 13,580Costa Rica 10,090 8,772 15,702All other destination markets 20,867 25,176 29,862
Total 708,718 835,586 1,162,537
Value ($1,000)
United States 157,818 203,220 291,556Colombia 34,850 42,652 59,232Ecuador 6,424 7,370 10,129Venezuela 18,919 6,555 13,806Peru 1,974 7,863 8,734Chile 3,992 7,440 11,868Panama 2,414 3,117 4,270Guatemala 3,897 3,047 4,251El Salvador 3,036 2,094 3,291Costa Rica 2,111 1,918 4,129All other destination markets 5,205 6,010 7,714
Total 240,641 291,286 418,979
Average unit value (dollars per unit)
United States $489.76 $459.52 $439.41Colombia 216.39 218.36 245.61Ecuador 233.76 226.62 251.19Venezuela 213.24 203.75 293.07Peru 241.59 254.43 271.90Chile 247.76 253.73 263.22Panama 116.08 210.58 250.01Guatemala 212.26 211.83 250.16El Salvador 204.75 210.30 242.32Costa Rica 209.27 218.68 262.99All other destination markets 249.42 238.70 258.31
Average 339.54 348.60 360.40Source: Global Trade Atlas, HS 8450.20.
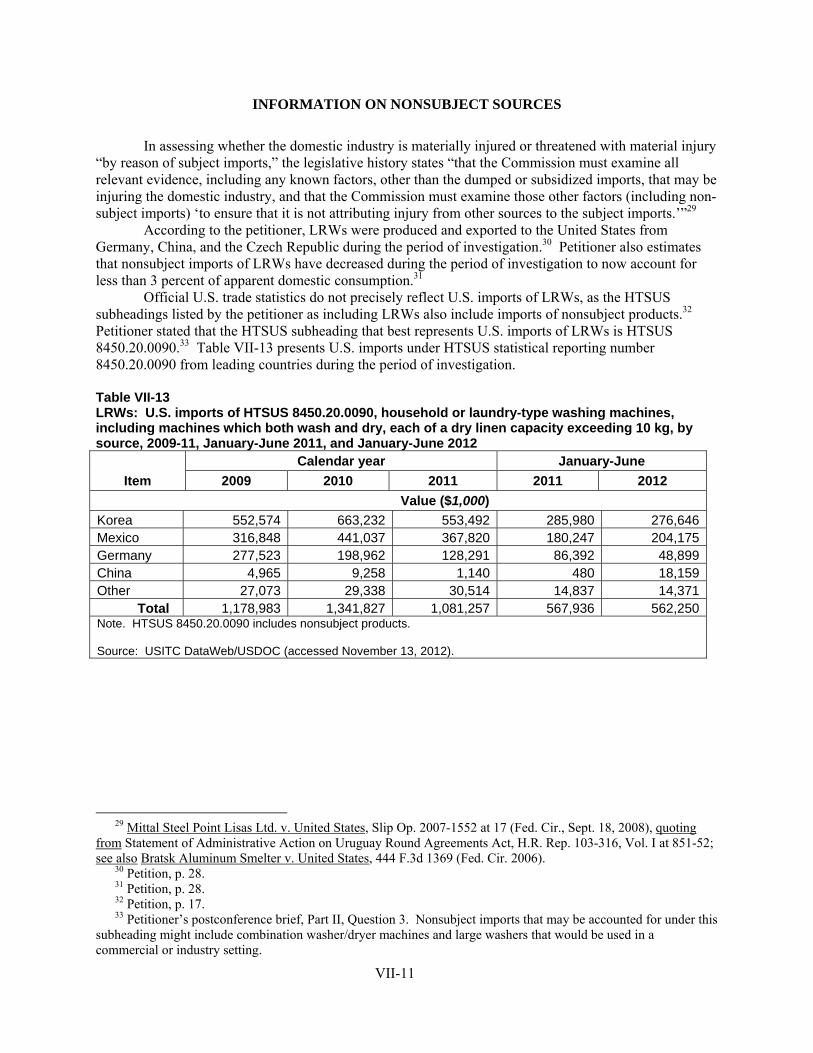
VII-11
INFORMATION ON NONSUBJECT SOURCES
In assessing whether the domestic industry is materially injured or threatened with material injury “by reason of subject imports,” the legislative history states “that the Commission must examine all relevant evidence, including any known factors, other than the dumped or subsidized imports, that may be injuring the domestic industry, and that the Commission must examine those other factors (including non-subject imports) ‘to ensure that it is not attributing injury from other sources to the subject imports.’”29
According to the petitioner, LRWs were produced and exported to the United States from Germany, China, and the Czech Republic during the period of investigation.30 Petitioner also estimates that nonsubject imports of LRWs have decreased during the period of investigation to now account for less than 3 percent of apparent domestic consumption.31
Official U.S. trade statistics do not precisely reflect U.S. imports of LRWs, as the HTSUS subheadings listed by the petitioner as including LRWs also include imports of nonsubject products.32 Petitioner stated that the HTSUS subheading that best represents U.S. imports of LRWs is HTSUS 8450.20.0090.33 Table VII-13 presents U.S. imports under HTSUS statistical reporting number 8450.20.0090 from leading countries during the period of investigation.
Table VII-13 LRWs: U.S. imports of HTSUS 8450.20.0090, household or laundry-type washing machines, including machines which both wash and dry, each of a dry linen capacity exceeding 10 kg, by source, 2009-11, January-June 2011, and January-June 2012
Item Calendar year January-June
2009 2010 2011 2011 2012 Value ($1,000)
Korea 552,574 663,232 553,492 285,980 276,646Mexico 316,848 441,037 367,820 180,247 204,175Germany 277,523 198,962 128,291 86,392 48,899China 4,965 9,258 1,140 480 18,159Other 27,073 29,338 30,514 14,837 14,371 Total 1,178,983 1,341,827 1,081,257 567,936 562,250Note. HTSUS 8450.20.0090 includes nonsubject products. Source: USITC DataWeb/USDOC (accessed November 13, 2012).
29 Mittal Steel Point Lisas Ltd. v. United States, Slip Op. 2007-1552 at 17 (Fed. Cir., Sept. 18, 2008), quoting
from Statement of Administrative Action on Uruguay Round Agreements Act, H.R. Rep. 103-316, Vol. I at 851-52; see also Bratsk Aluminum Smelter v. United States, 444 F.3d 1369 (Fed. Cir. 2006).
30 Petition, p. 28. 31 Petition, p. 28. 32 Petition, p. 17. 33 Petitioner’s postconference brief, Part II, Question 3. Nonsubject imports that may be accounted for under this
subheading might include combination washer/dryer machines and large washers that would be used in a commercial or industry setting.
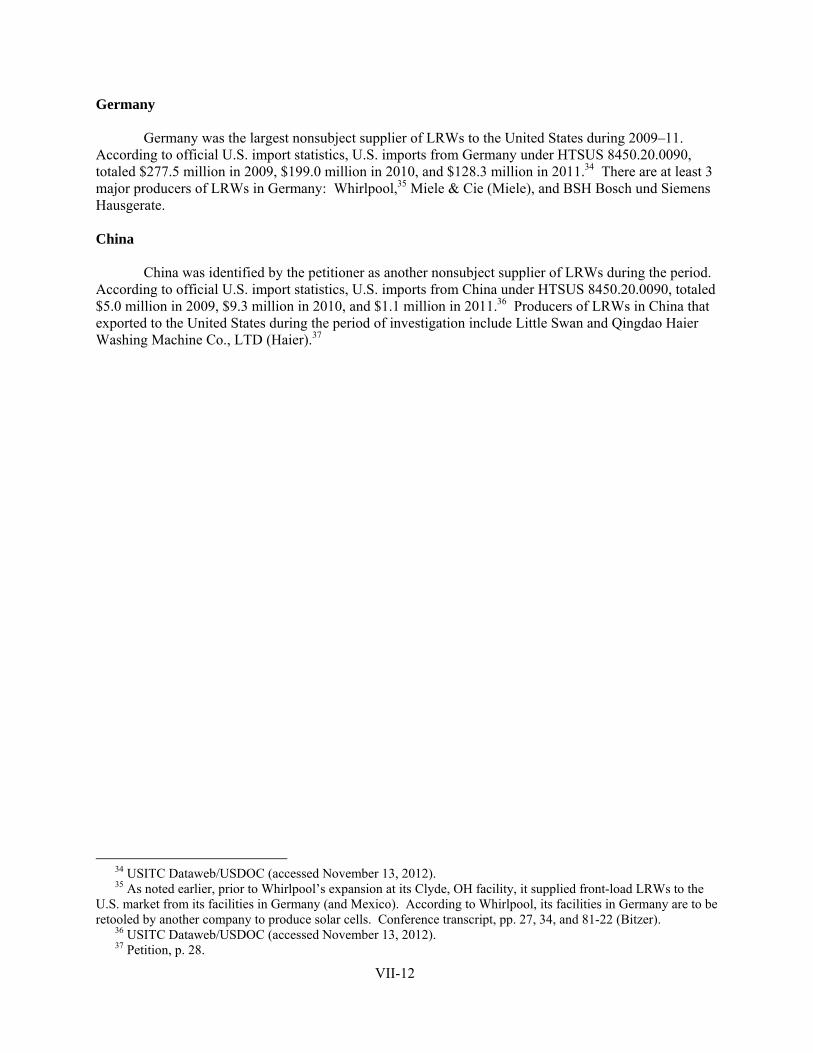
VII-12
Germany
Germany was the largest nonsubject supplier of LRWs to the United States during 2009–11. According to official U.S. import statistics, U.S. imports from Germany under HTSUS 8450.20.0090, totaled $277.5 million in 2009, $199.0 million in 2010, and $128.3 million in 2011.34 There are at least 3 major producers of LRWs in Germany: Whirlpool,35 Miele & Cie (Miele), and BSH Bosch und Siemens Hausgerate.
China
China was identified by the petitioner as another nonsubject supplier of LRWs during the period. According to official U.S. import statistics, U.S. imports from China under HTSUS 8450.20.0090, totaled $5.0 million in 2009, $9.3 million in 2010, and $1.1 million in 2011.36 Producers of LRWs in China that exported to the United States during the period of investigation include Little Swan and Qingdao Haier Washing Machine Co., LTD (Haier).37
34 USITC Dataweb/USDOC (accessed November 13, 2012). 35 As noted earlier, prior to Whirlpool’s expansion at its Clyde, OH facility, it supplied front-load LRWs to the
U.S. market from its facilities in Germany (and Mexico). According to Whirlpool, its facilities in Germany are to be retooled by another company to produce solar cells. Conference transcript, pp. 27, 34, and 81-22 (Bitzer).
36 USITC Dataweb/USDOC (accessed November 13, 2012). 37 Petition, p. 28.
APPENDIX A
FEDERAL REGISTER NOTICES
A-1

A-3
Notices in the Federal Register
Large Residential Washers From Korea and Mexico: Scheduling of the final phase of countervailing duty and antidumping investigations, 77 FR 51569, August 24, 2012. http://www.gpo.gov/fdsys/pkg/FR-2012-08-24/pdf/2012-20836.pdf Large Residential Washers From the Republic of Korea: Final Affirmative Countervailing Duty Determination, 77 FR 75975, December 26, 2012. http://www.gpo.gov/fdsys/pkg/FR-2012-12-26/pdf/2012-31078.pdf Notice of Final Determination of Sales at Less Than Fair Value: Large Residential Washers from Mexico, 77 FR 77 FR 76288, December 27, 2012. http://www.gpo.gov/fdsys/pkg/FR-2012-12-27/pdf/2012-31077.pdf Notice of Final Determination of Sales at Less Than Fair Value: Large Residential Washers From the Republic of Korea, 77 FR 75988, December 26, 2012. http://www.gpo.gov/fdsys/pkg/FR-2012-12-26/pdf/2012-31104.pdf Large Residential Washers From Korea and Mexico; Revised Schedule for the Subject Investigations, 77 FR 765, January 4, 2013. http://www.gpo.gov/fdsys/pkg/FR-2013-01-04/pdf/2012-31703.pdf

APPENDIX B
LIST OF HEARING WITNESSES
B-1

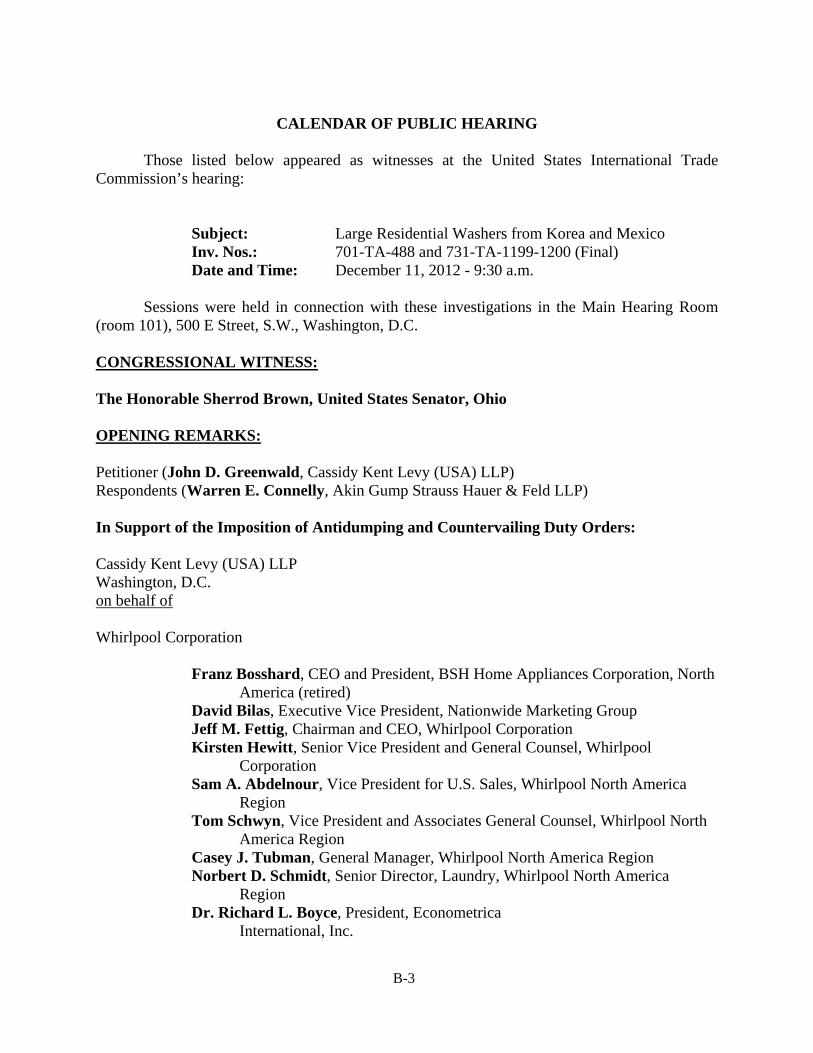
B-3
CALENDAR OF PUBLIC HEARING Those listed below appeared as witnesses at the United States International Trade Commission’s hearing: Subject: Large Residential Washers from Korea and Mexico Inv. Nos.: 701-TA-488 and 731-TA-1199-1200 (Final) Date and Time: December 11, 2012 - 9:30 a.m. Sessions were held in connection with these investigations in the Main Hearing Room (room 101), 500 E Street, S.W., Washington, D.C. CONGRESSIONAL WITNESS: The Honorable Sherrod Brown, United States Senator, Ohio OPENING REMARKS: Petitioner (John D. Greenwald, Cassidy Kent Levy (USA) LLP) Respondents (Warren E. Connelly, Akin Gump Strauss Hauer & Feld LLP) In Support of the Imposition of Antidumping and Countervailing Duty Orders: Cassidy Kent Levy (USA) LLP Washington, D.C. on behalf of Whirlpool Corporation Franz Bosshard, CEO and President, BSH Home Appliances Corporation, North
America (retired) David Bilas, Executive Vice President, Nationwide Marketing Group
Jeff M. Fettig, Chairman and CEO, Whirlpool Corporation Kirsten Hewitt, Senior Vice President and General Counsel, Whirlpool
Corporation Sam A. Abdelnour, Vice President for U.S. Sales, Whirlpool North America
Region Tom Schwyn, Vice President and Associates General Counsel, Whirlpool North
America Region Casey J. Tubman, General Manager, Whirlpool North America Region Norbert D. Schmidt, Senior Director, Laundry, Whirlpool North America
Region Dr. Richard L. Boyce, President, Econometrica International, Inc.
B-4
John D. Greenwald ) Jack A. Levy ) – OF COUNSEL James Cannon ) In Opposition to the Imposition of Antidumping and Countervailing Duty Orders: Akin Gump Strauss Hauer & Feld LLP Washington, D.C. on behalf of Samsung Electronics, Co., Ltd. (“SEC”) Samsung Electronics Mexico S.A. de C.V. (“SEM”) Samsung Electronics America, Inc. (“SEA”) Kevin Dexter, Senior Vice President, Home Appliances, SEA Dean Brindle, Director, Laundry Products, SEA Kurt Jovais, Vice President of Marketing, Home Appliances, SEA Soon Choi, Business Manager, Laundry Marketing, SEA Daniel Witte, Assistant Manager, Laundry Marketing, SEA Daniel W. Klett, Principal, Capital Trade, Inc. Warren E. Connelly ) ) – OF COUNSEL Jarrod M. Goldfeder ) Morris, Manning & Martin, LLP Washington, D.C. on behalf of Electrolux Home Products, Corp., N.V. Electrolux Home Products, Inc. Mark D. Chambers, Senior Vice President Sales, Electrolux Major Appliances
North America George Hawranko, Senior Associate General Counsel, Electrolux North
America, Inc. John J. Burke, Attorney, Baker Hostetler
Donald B. Cameron ) Julie C. Mendoza ) – OF COUNSEL R. Will Planert )
B-5
Sidley Austin LLP Washington, D.C. on behalf of LG Electronics, Inc. LG Electronics USA, Inc. John R. Herring, Vice President of Sales, Home Appliances, National Accounts,
LG Electronics USA, Inc. John Riddle, Vice President of Sales, Home Appliances, Regional Accounts, LG
Electronics USA, Inc. Sung Han (Andrew) Kim, Product Manager for Laundry, LG Electronics USA,
Inc. Daniel W. Klett, Principal, Capital Trade, Inc. Neil R. Ellis ) Brenda A. Jacobs ) – OF COUNSEL Jill Caiazzo ) Jochum Shore & Trossevin, PC Washington, D.C. on behalf of The Home Depot, Inc. Robert Baird, Merchandising Vice President, Appliances & Kitchens, The Home
Depot, Inc. Marguerite Trossevin ) ) – OF COUNSEL James J. Jochum ) REBUTTAL/CLOSING REMARKS: Petitioners (John D. Greenwald and Jack A. Levy, Cassidy Kent Levy (USA) LLP) Respondents (Warren E. Connelly, Akin Gump Strauss Hauer & Feld LLP;
Donald B. Cameron, Morris, Manning & Martin, LLP; and Neil R. Ellis, Sidley Austin LLP)


C-1
APPENDIX C
SUMMARY DATA

C-3
Table C-1 LRWs: Summary data concerning the U.S. market, 2009-11, January-June 2011, and January-June 2012
* * * * * * *
Table C-2 Front-load LRWs: Summary data concerning the U.S. market, 2009-11, January-June 2011, and January-June 2012
* * * * * * *
Table C-3 Top-load LRWs: Summary data concerning the U.S. market, 2009-11, January-June 2011, and January-June 2012
* * * * * * *
Table C-4 Conventional top-load residential washers (less than 3.7 cubic feet in capacity): Summary data concerning the U.S. market, 2009-11, January-June 2011, and January-June 2012
* * * * * * *
Table C-5 High-efficiency top-load residential washers (less than 3.7 cubic feet in capacity): Summary data concerning the U.S. market, 2009-11, January-June 2011, and January-June 2012
* * * * * * *
Table C-6 LRWs (including TLs less than 3.7 cubic feet): Summary data concerning the U.S. market, 2009-11, January-June 2011, and January-June 2012
* * * * * * *
Table C-7 LRWs (including TLs less than 3.7 cubic feet): Summary data concerning the U.S. market (excluding Electrolux from domestic industry), 2009-11, January-June 2011, and January-June 2012
* * * * * * *
Table C-8 All LRWs except for conventional top-load residential washers less than 3.7 cubic feet: Summary data concerning the U.S. market (excluding Electrolux from domestic industry), 2009-11, January- June 2011, and January-June 2012
* * * * * * *
Table C-9 HE Top load LRWs (including TLs less than 3.7 cubic feet): Summary data concerning the U.S. market (excluding Electrolux from domestic industry), 2009-11, January-June 2011, and January- June 2012
* * * * * * *

D-1
APPENDIX D
U.S. PRODUCERS’, U.S. IMPORTERS’, AND U.S. PURCHASERS’ COMMENTS REGARDING THE COMPARIBILITY OF CERTAIN WASHERS

D-3
U.S. PRODUCERS’ COMMENTS COMPARABILITY OF HIGH EFFICIENCY TOP LOAD (“HETL”) AND HIGH EFFICIENCY
FRONT LOAD (“HEFL”) LARGE RESIDENTIAL WASHERS (“LRWS”).
The Commission asked U.S. producers whether HETL and HEFL LRWs have the same physical characteristics and end uses, and to describe any differences.
* * * * * * *
The Commission asked U.S. producers whether or not HETL and HEFL LRWs are interchangeable, and to describe what makes the two products interchangeable or not interchangeable.
* * * * * * * The Commission asked U.S. producers whether or not the manufacturing facilities, processes, and employees used to produce HETL are similar to those to produce HEFL LRWs, and to describe any differences.
* * * * * * *
The Commission asked U.S. producers whether or not HETL and HEFL LRWs share the same channels of distribution, and to describe any similarities or differences.
* * * * * * *
The Commission asked U.S. producers whether or not customers and producers perceive HETL and HEFL LRWs to be similar products, and to describe any differences/similarities.
* * * * * * *
The Commission asked U.S. producers whether there are generally differences in price between HETL and HEFL LRWs, and which more was more highly priced.
* * * * * * *
COMPARABILITY OF CONVENTIONAL TOP LOAD (“CTL”) RESIDENTIAL WASHERS AND HIGH EFFICIENCY (“HE”) LRWs. The Commission asked U.S. producers whether or not CTL WASHERS and HE LRWs have the same physical characteristics and end uses, and to describe any similarities or differences.
* * * * * * *
D-4
The Commission asked U.S. producers whether or not CTL and HE LRWs are interchangeable, and to describe what makes the two products interchangeable or not interchangeable.
* * * * * * *
The Commission asked U.S. producers whether or not the manufacturing facilities, processes, and employees used to produce CTL are similar to those to produce HE LRWs, and to describe any differences.
* * * * * * *
The Commission asked U.S. producers whether or not CTL and HE LRWs share the same channels of distribution, and to describe any similarities or differences.
* * * * * * *
The Commission asked U.S. producers whether or not customers and producers perceive CTL and HE LRWs to be similar products, and to describe any differences/similarities.
* * * * * * *
The Commission asked U.S. producers whether there are generally differences in price between CTL and HE LRWs, and which more was more highly priced.
* * * * * * *
COMPARABILITY OF TOP LOAD RESIDENTIAL WASHERS WITH DOE RATED CAPACITY < 3.7 CU FT (“Smaller TL residential washers”) AND LARGE RESIDENTIAL WASHERS (“LRWs”). The Commission asked U.S. producers whether or not Smaller TL residential washers and LRWs have the same physical characteristics and end uses, and to describe any similarities or differences.
* * * * * * *
The Commission asked U.S. producers whether or not Smaller TL residential washers and LRWs are interchangeable, and to describe what makes the two products interchangeable or not interchangeable.
* * * * * * *
The Commission asked U.S. producers whether or not the manufacturing facilities, processes, and employees used to produce Smaller TL residential washers are similar to those to produce LRWs, and to describe any differences.
* * * * * * *
D-5
The Commission asked U.S. producers whether or not Smaller TL residential washers and LRWs share the same channels of distribution, and to describe any similarities or differences.
* * * * * * *
The Commission asked U.S. producers whether or not customers and producers perceive Smaller TL residential washers and LRWs to be similar products, and to describe any differences/similarities.
* * * * * * *
The Commission asked U.S. producers whether there are generally differences in price between Smaller TL residential washers and LRWs, and which more was more highly priced.
* * * * * * *
U.S. IMPORTERS’ COMMENTS
COMPARABILITY OF HIGH EFFICIENCY TOP LOAD (“HETL”) AND HIGH EFFICIENCY FRONT LOAD (“HEFL”) LARGE RESIDENTIAL WASHERS (“LRWS”). The Commission asked U.S. importers whether HETL and HEFL LRWs have the same physical characteristics and end uses, and to describe any differences.
* * * * * * *
The Commission asked U.S. importers whether or not HETL and HEFL LRWs are interchangeable, and to describe what makes the two products interchangeable or not interchangeable.
* * * * * * *
The Commission asked U.S. importers whether or not the manufacturing facilities, processes, and employees used to produce HETL are similar to those to produce HEFL LRWs, and to describe any differences.
* * * * * * *
The Commission asked U.S. importers whether or not HETL and HEFL LRWs share the same channels of distribution, and to describe any similarities or differences.
* * * * * * *
D-6
The Commission asked U.S. importers whether or not customers and producers perceive HETL and HEFL LRWs to be similar products, and to describe any differences/similarities.
* * * * * * *
The Commission asked U.S. importers whether there are generally differences in price between HETL and HEFL LRWs, and which more was more highly priced.
* * * * * * *
COMPARABILITY OF CONVENTIONAL TOP LOAD (“CTL”) RESIDENTIAL WASHERS AND HIGH EFFICIENCY (“HE”) LRWs. The Commission asked U.S. importers whether or not CTL WASHERS and HE LRWs have the same physical characteristics and end uses, and to describe any similarities or differences.
* * * * * * *
The Commission asked U.S. importers whether or not CTL and HE LRWs are interchangeable, and to describe what makes the two products interchangeable or not interchangeable.
* * * * * * *
The Commission asked U.S. importers whether or not the manufacturing facilities, processes, and employees used to produce CTL are similar to those to produce HE LRWs, and to describe any differences.
* * * * * * *
The Commission asked U.S. importers whether or not CTL and HE LRWs share the same channels of distribution, and to describe any similarities or differences.
* * * * * * *
The Commission asked U.S. importers whether or not customers and producers perceive CTL and HE LRWs to be similar products, and to describe any differences/similarities.
* * * * * * *
The Commission asked U.S. importers whether there are generally differences in price between CTL and HE LRWs, and which more was more highly priced.
* * * * * * *
D-7
COMPARABILITY OF TOP LOAD RESIDENTIAL WASHERS WITH DOE RATED CAPACITY < 3.7 CU FT (“Smaller TL residential washers”) AND LARGE RESIDENTIAL WASHERS (“LRWs”). The Commission asked U.S. importers whether or not Smaller TL residential washers and LRWs have the same physical characteristics and end uses, and to describe any similarities or differences.
* * * * * * *
The Commission asked U.S. importers whether or not Smaller TL residential washers and LRWs are interchangeable, and to describe what makes the two products interchangeable or not interchangeable.
* * * * * * *
The Commission asked U.S. importers whether or not the manufacturing facilities, processes, and employees used to produce Smaller TL residential washers are similar to those to produce LRWs, and to describe any differences.
* * * * * * *
The Commission asked U.S. importers whether or not Smaller TL residential washers and LRWs share the same channels of distribution, and to describe any similarities or differences.
* * * * * * *
The Commission asked U.S. importers whether or not customers and producers perceive Smaller TL residential washers and LRWs to be similar products, and to describe any differences/similarities.
* * * * * * *
The Commission asked U.S. importers whether there are generally differences in price between Smaller TL residential washers and LRWs, and which more was more highly priced.
* * * * * * *
D-8
U.S. PURCHASERS’ COMMENTS COMPARABILITY OF HIGH EFFICIENCY TOP LOAD (“HETL”) AND HIGH
EFFICIENCY FRONT LOAD (“HEFL”) LARGE RESIDENTIAL WASHERS (“LRWS”).
The Commission asked U.S. purchasers whether HETL and HEFL LRWs have the same physical characteristics and end uses, and to describe any differences.
* * * * * * *
The Commission asked U.S. purchasers whether or not HETL and HEFL LRWs are interchangeable, and to describe what makes the two products interchangeable or not interchangeable.
* * * * * * *
The Commission asked U.S. purchasers whether or not the manufacturing facilities, processes, and employees used to produce HETL are similar to those to produce HEFL LRWs, and to describe any differences.
* * * * * * *
The Commission asked U.S. purchasers whether or not HETL and HEFL LRWs share the same channels of distribution, and to describe any similarities or differences.
* * * * * * *
The Commission asked U.S. purchasers whether or not customers and producers perceive HETL and HEFL LRWs to be similar products, and to describe any differences/similarities.
* * * * * * *
The Commission asked U.S. purchasers whether there are generally differences in price between HETL and HEFL LRWs, and which more was more highly priced.
* * * * * * *
D-9
COMPARABILITY OF CONVENTIONAL TOP LOAD (“CTL”) RESIDENTIAL WASHERS AND HIGH EFFICIENCY (“HE”) LRWs. The Commission asked U.S. purchasers whether or not CTL WASHERS and HE LRWs have the same physical characteristics and end uses, and to describe any similarities or differences.
* * * * * * *
The Commission asked U.S. purchasers whether or not CTL and HE LRWs are interchangeable, and to describe what makes the two products interchangeable or not interchangeable.
* * * * * * *
The Commission asked U.S. purchasers whether or not the manufacturing facilities, processes, and employees used to produce CTL are similar to those to produce HE LRWs, and to describe any differences.
* * * * * * *
The Commission asked U.S. purchasers whether or not CTL and HE LRWs share the same channels of distribution, and to describe any similarities or differences.
* * * * * * *
The Commission asked U.S. purchasers whether or not customers and producers perceive CTL and HE LRWs to be similar products, and to describe any differences/similarities.
* * * * * * *
The Commission asked U.S. purchasers whether there are generally differences in price between CTL and HE LRWs, and which more was more highly priced.
* * * * * * *
COMPARABILITY OF TOP LOAD RESIDENTIAL WASHERS WITH DOE RATED CAPACITY < 3.7 CU FT (“Smaller TL residential washers”) AND LARGE RESIDENTIAL WASHERS (“LRWs”). The Commission asked U.S. purchasers whether or not Smaller TL residential washers and LRWs have the same physical characteristics and end uses, and to describe any similarities or differences.
* * * * * * *
D-10
The Commission asked U.S. purchasers whether or not Smaller TL residential washers and LRWs are interchangeable, and to describe what makes the two products interchangeable or not interchangeable.
* * * * * * *
The Commission asked U.S. purchasers whether or not the manufacturing facilities, processes, and employees used to produce Smaller TL residential washers are similar to those to produce LRWs, and to describe any differences.
* * * * * * *
The Commission asked U.S. purchasers whether or not Smaller TL residential washers and LRWs share the same channels of distribution, and to describe any similarities or differences.
* * * * * * *
The Commission asked U.S. purchasers whether or not customers and producers perceive Smaller TL residential washers and LRWs to be similar products, and to describe any differences/similarities.
* * * * * * *
The Commission asked U.S. purchasers whether there are generally differences in price between Smaller TL residential washers and LRWs, and which more was more highly priced.
* * * * * * *

E-1
APPENDIX E
SUMMARIES OF MARKETING STUDIES

E-3
Marketing Studies
Producers, importers, and purchasers were asked to supply any market research or other surveys that indicate the reasons why consumers purchase U.S.-produced or subject LRWs, and the sensitivity of consumer purchase decisions to price and changes in price. Supplied studies are summarized below.
* * * * * * *

F-1
APPENDIX F
SELECTED FIRMS’ DISCOUNT DATA FOR 2009 AND 2010

F-3
Table F-1 LRWs: Total quantity and value sold, direct and indirect discounts by selected firms, 2009
* * * * * * *
Table F-2 LRWs: Total quantity and value sold, direct and indirect discounts by selected firms, 2010
* * * * * * *

G-1
APPENDIX G
ADDITIONAL PRICING DATA

G-3
Table G-1 LRWs: Weighted-average f.o.b. prices net of direct and indirect discounts and quantities of domestic and imported product 41 and margins of underselling/(overselling), adjusting submitted *** data to categorize products by unchanged capacity standards, by quarters, January 2009-June 2012
* * * * * * *
Table G-2 LRWs: Weighted-average f.o.b. prices net of direct and indirect discounts and quantities of domestic and imported product 51 and margins of underselling/(overselling), adjusting submitted *** data to categorize products by unchanged capacity standards, by quarters, January 2009-June 2012
* * * * * * *
Table G-3 LRWs: Weighted-average f.o.b. prices net of direct and indirect discounts and quantities of domestic and imported product 71 and margins of underselling/(overselling), adjusting submitted *** data to categorize products by unchanged capacity standards, by quarters, January 2009-June 2012
* * * * * * *
Table G-4 LRWs: Weighted-average f.o.b. prices net of direct and indirect discounts and quantities of domestic and imported product 81 and margins of underselling/(overselling), adjusting submitted *** data to categorize products by unchanged capacity standards, by quarters, January 2009-June 2012
* * * * * * *
Table G-5 LRWs: Changes to table V-17 (Summary of weighted-average f.o.b. prices for products 1-11 from the United States, Mexico, and Korea) with use of unchanging capacity standard price data (from tables G-1 to G-4)
* * * * * * *
Table G-6 LRWs: Changes to table V-18 (Instances of underselling/overselling and the range and average of margins, January 2009-June 2012) with use of unchanging capacity standard price data (from tables G-1 to G-4)
* * * * * * * Figure G-1 LRWs: Weighted-average prices and quantities of domestic and imported products 4, 5, 7, and 8, with use of unchanging capacity standard price data, by quarters, January 2009-June 2012
* * * * * * *