Embed Size (px)
Citation preview
604 Twin Research and Human Genetics Volume 10 Number 4 pp. 604–625
Arequirement for performing robust genetic andstatistical analyses on twins is correctly
assigned zygosities. In order to increase the powerto detect small risk factors of disease, zygositytesting should also be amenable for high throughputscreening. In this study we validate and implementthe use of a panel of 50 single nucleotide polymor-phisms (SNPs) for reliable high throughput zygositytesting and compare it to a panel of 16 short tandemrepeats (STRs). We genotyped both genomic(gDNA) and whole genome amplified DNA (WGADNA), ending up with 47 SNP and 11 STR markersfulfilling our quality criteria. Out of 99 studied twinpairs, 2 were assigned a different zygosity usingSNP and STR data as compared to self reportedzygosity in a questionnaire. We also performed asensitivity analysis based on simulated data wherewe evaluated the effects of genotyping error, shiftsin allele frequencies and missing data on the qualita-tive zygosity assignments. The frequency of falsepositives was less than 0.01 when assuming a 1%genotyping error, a decrease of 10% of theobserved minor allele frequency compared to theactual values and up to 10 missing markers. TheSNP markers were also successfully genotyped onboth gDNA and WGA DNA from whole blood, salivaand filter paper. In conclusion, we validate a robustpanel of 47 highly multiplexed SNPs that providereliable and high quality data on a range of differentDNA templates.
By making use of the genetic variation present in thehuman genome it is possible to obtain unique geneticfingerprints that can discriminate between individuals(Jeffreys et al., 1985). This also offers the most robustmethod for estimating the zygosity of a twin pair(Jackson et al., 2001; Ooki et al., 2004; Reed et al.,2005). In order to obtain a reliable genetic fingerprintit is important to consider issues relating to the qualityand quantity of the DNA samples available, as well asthe choice of genetic markers. First, the most common
way of obtaining a unique genetic fingerprint is togenotype a set of highly polymorphic short tandemrepeats (STRs). However, because of their relativelylarge amplicon sizes compared to both singlenucleotide polymorphisms (SNPs) and mini-STRs, theyare prone to amplification failure and allelic imbalancedue to degraded DNA (Dixon et al., 2005; Petkovski etal., 2005; Utsuno & Minaguchi 2004). Second, the useof whole genome amplification (WGA), where thegenome is amplified in order to increase the life-spanand usage of individual DNA samples, has raised con-cerns relating to biased amplification of one allele overthe other depending on the template amount and WGAmethod (Dean et al., 2002; Lovmar et al., 2003). Thisproblem is also more pronounced when using STRsover SNPs for subsequent genotyping (Bergen et al.,2005). Third, zygosity testing should optimally beamenable for high-throughput and cost-efficientscreening, in order to avoid low-powered studies andsupport the ever expanding twin registries and collabo-ration efforts (Hirschhorn et al., 2002; Ioannidis et al.,2001; Ioannidis et al., 2003; Lohmueller et al., 2003;Peltonen 2003).
In this study we set out to evaluate and improve analready published set of 41 SNP markers (Petkovski etal., 2005) ,and to validate the modified protocol forzygosity testing on genomic (gDNA), as well as WGADNA ,using the REPLI-g kit (Dean et al., 2002;Hosono et al., 2003) on DNA extracted from wholeblood and saliva. We show the utility of a highly multi-plexed SNP panel for high-throughput zygosity testingand general fingerprinting, and compare it to a panelof STRs. We also consider the use of different DNAtemplates and WGA in the context of genetic finger-printing and further evaluate the robustness of theSNP panel through simulation studies.
Large-Scale Zygosity Testing Using Single Nucleotide Polymorphisms
Ulf Hannelius,1 Loreana Gherman,3 Ville-Veikko Mäkelä,2 Astrid Lindstedt,2 Marco Zucchelli,1
Camilla Lagerberg,3 Gunnel Tybring,3 Juha Kere,1,2,4 and Cecilia M Lindgren5
1 Department of Biosciences and Nutrition, Karolinska Institutet, Huddinge, Sweden2 Clinical Research Centre, Karolinska University Hospital, Stockholm, Sweden3 Department of Medical Epidemiology and Biostatistics, Karolinska Institutet, Stockholm, Sweden4 Department of Medical Genetics, University of Helsinki, Helsinki, Finland5 Wellcome Trust Centre for Human Genetics, Oxford University, Oxford, United Kingdom
Received 12 April, 2007; accepted 23 May, 2007.
Address for correspondence: Ulf Hannelius, Department ofBiosciences and Nutrition, Karolinska Institutet, Hälsovägen 7–9,14157 Huddinge, Sweden E-mail: [email protected]
605Twin Research and Human Genetics August 2007
Zygosity Testing Using SNPs
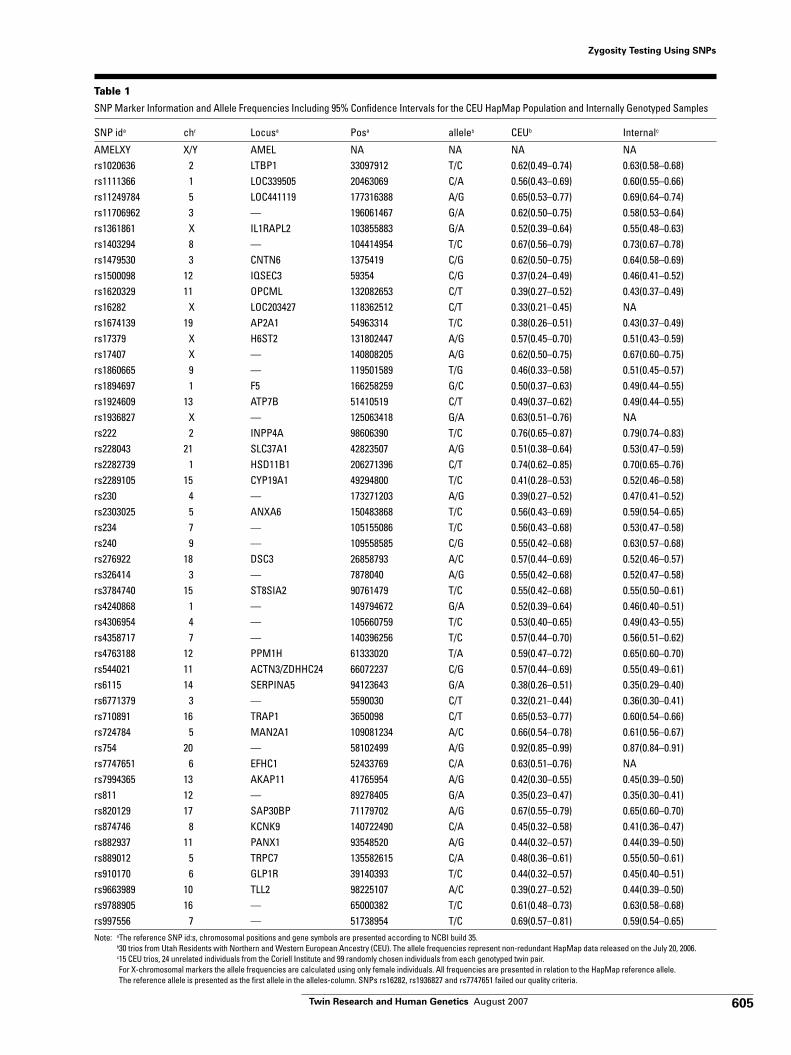
Table 1
SNP Marker Information and Allele Frequencies Including 95% Confidence Intervals for the CEU HapMap Population and Internally Genotyped Samples
SNP ida chr Locusa Posa alleles CEUb Internalc
AMELXY X/Y AMEL NA NA NA NArs1020636 2 LTBP1 33097912 T/C 0.62(0.49–0.74) 0.63(0.58–0.68)rs1111366 1 LOC339505 20463069 C/A 0.56(0.43–0.69) 0.60(0.55–0.66)rs11249784 5 LOC441119 177316388 A/G 0.65(0.53–0.77) 0.69(0.64–0.74)rs11706962 3 — 196061467 G/A 0.62(0.50–0.75) 0.58(0.53–0.64)rs1361861 X IL1RAPL2 103855883 G/A 0.52(0.39–0.64) 0.55(0.48–0.63)rs1403294 8 — 104414954 T/C 0.67(0.56–0.79) 0.73(0.67–0.78)rs1479530 3 CNTN6 1375419 C/G 0.62(0.50–0.75) 0.64(0.58–0.69)rs1500098 12 IQSEC3 59354 C/G 0.37(0.24–0.49) 0.46(0.41–0.52)rs1620329 11 OPCML 132082653 C/T 0.39(0.27–0.52) 0.43(0.37–0.49)rs16282 X LOC203427 118362512 C/T 0.33(0.21–0.45) NArs1674139 19 AP2A1 54963314 T/C 0.38(0.26–0.51) 0.43(0.37–0.49)rs17379 X H6ST2 131802447 A/G 0.57(0.45–0.70) 0.51(0.43–0.59)rs17407 X — 140808205 A/G 0.62(0.50–0.75) 0.67(0.60–0.75)rs1860665 9 — 119501589 T/G 0.46(0.33–0.58) 0.51(0.45–0.57)rs1894697 1 F5 166258259 G/C 0.50(0.37–0.63) 0.49(0.44–0.55)rs1924609 13 ATP7B 51410519 C/T 0.49(0.37–0.62) 0.49(0.44–0.55)rs1936827 X — 125063418 G/A 0.63(0.51–0.76) NArs222 2 INPP4A 98606390 T/C 0.76(0.65–0.87) 0.79(0.74–0.83)rs228043 21 SLC37A1 42823507 A/G 0.51(0.38–0.64) 0.53(0.47–0.59)rs2282739 1 HSD11B1 206271396 C/T 0.74(0.62–0.85) 0.70(0.65–0.76)rs2289105 15 CYP19A1 49294800 T/C 0.41(0.28–0.53) 0.52(0.46–0.58)rs230 4 — 173271203 A/G 0.39(0.27–0.52) 0.47(0.41–0.52)rs2303025 5 ANXA6 150483868 T/C 0.56(0.43–0.69) 0.59(0.54–0.65)rs234 7 — 105155086 T/C 0.56(0.43–0.68) 0.53(0.47–0.58)rs240 9 — 109558585 C/G 0.55(0.42–0.68) 0.63(0.57–0.68)rs276922 18 DSC3 26858793 A/C 0.57(0.44–0.69) 0.52(0.46–0.57)rs326414 3 — 7878040 A/G 0.55(0.42–0.68) 0.52(0.47–0.58)rs3784740 15 ST8SIA2 90761479 T/C 0.55(0.42–0.68) 0.55(0.50–0.61)rs4240868 1 — 149794672 G/A 0.52(0.39–0.64) 0.46(0.40–0.51)rs4306954 4 — 105660759 T/C 0.53(0.40–0.65) 0.49(0.43–0.55)rs4358717 7 — 140396256 T/C 0.57(0.44–0.70) 0.56(0.51–0.62)rs4763188 12 PPM1H 61333020 T/A 0.59(0.47–0.72) 0.65(0.60–0.70)rs544021 11 ACTN3/ZDHHC24 66072237 C/G 0.57(0.44–0.69) 0.55(0.49–0.61)rs6115 14 SERPINA5 94123643 G/A 0.38(0.26–0.51) 0.35(0.29–0.40)rs6771379 3 — 5590030 C/T 0.32(0.21–0.44) 0.36(0.30–0.41)rs710891 16 TRAP1 3650098 C/T 0.65(0.53–0.77) 0.60(0.54–0.66)rs724784 5 MAN2A1 109081234 A/C 0.66(0.54–0.78) 0.61(0.56–0.67)rs754 20 — 58102499 A/G 0.92(0.85–0.99) 0.87(0.84–0.91)rs7747651 6 EFHC1 52433769 C/A 0.63(0.51–0.76) NArs7994365 13 AKAP11 41765954 A/G 0.42(0.30–0.55) 0.45(0.39–0.50)rs811 12 — 89278405 G/A 0.35(0.23–0.47) 0.35(0.30–0.41)rs820129 17 SAP30BP 71179702 A/G 0.67(0.55–0.79) 0.65(0.60–0.70)rs874746 8 KCNK9 140722490 C/A 0.45(0.32–0.58) 0.41(0.36–0.47)rs882937 11 PANX1 93548520 A/G 0.44(0.32–0.57) 0.44(0.39–0.50)rs889012 5 TRPC7 135582615 C/A 0.48(0.36–0.61) 0.55(0.50–0.61)rs910170 6 GLP1R 39140393 T/C 0.44(0.32–0.57) 0.45(0.40–0.51)rs9663989 10 TLL2 98225107 A/C 0.39(0.27–0.52) 0.44(0.39–0.50)rs9788905 16 — 65000382 T/C 0.61(0.48–0.73) 0.63(0.58–0.68)rs997556 7 — 51738954 T/C 0.69(0.57–0.81) 0.59(0.54–0.65)Note: aThe reference SNP id:s, chromosomal positions and gene symbols are presented according to NCBI build 35.
b30 trios from Utah Residents with Northern and Western European Ancestry (CEU). The allele frequencies represent non-redundant HapMap data released on the July 20, 2006.c15 CEU trios, 24 unrelated individuals from the Coriell Institute and 99 randomly chosen individuals from each genotyped twin pair.For X-chromosomal markers the allele frequencies are calculated using only female individuals. All frequencies are presented in relation to the HapMap reference allele. The reference allele is presented as the first allele in the alleles-column. SNPs rs16282, rs1936827 and rs7747651 failed our quality criteria.
606 Twin Research and Human Genetics August 2007
Ulf Hannelius et al.
Materials and MethodsSamples
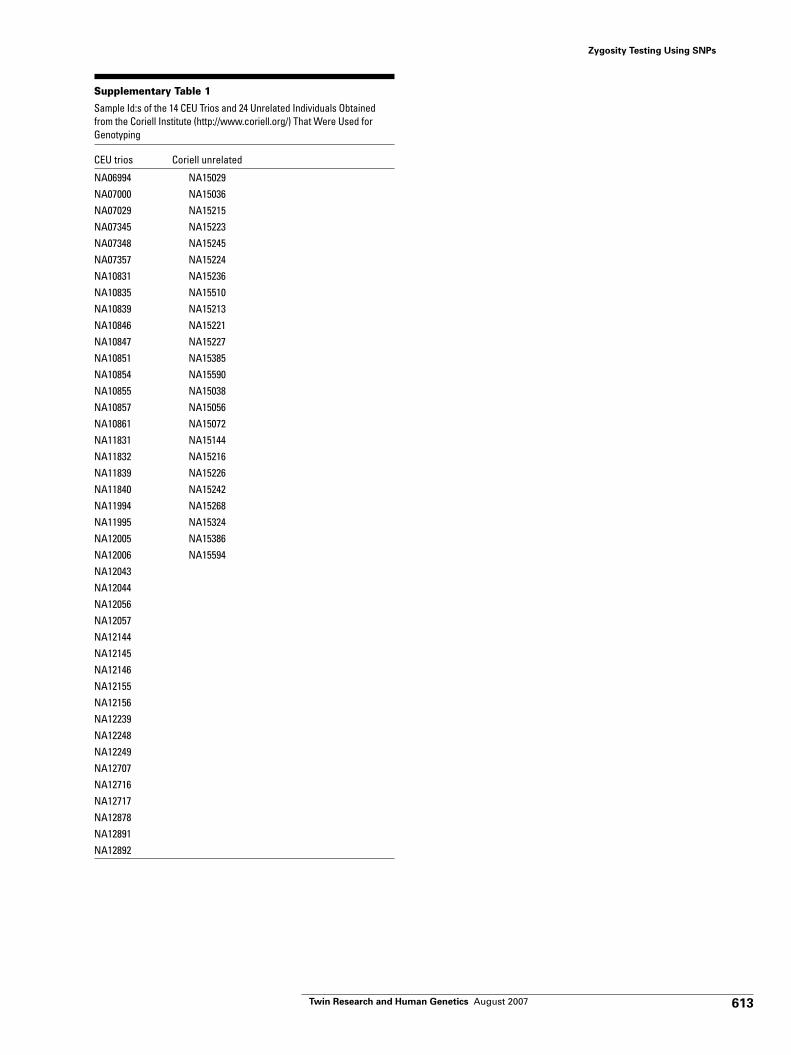
The study was approved by the regional ethicalreview board at Karolinska Institutet. gDNA from 14trios and 24 unrelated individuals from UtahResidents with Northern and Western EuropeanAncestry was obtained from the Coriell Institute(Appendix A, Supplementary Table 1,). Additionally,gDNA from 198 twin samples was obtained from theSwedish Twin Registry (Lichtenstein et al., 2002) andgDNA from 11 randomly chosen unrelated donorswas collected in the form of whole blood, saliva andas blood spots on filter paper. For details concerningDNA extraction and quantification see Appendix A,Supplementary Methods.
Whole Genome Amplification
10 ng DNA was used for all WGA reactions. TheDNA from the 14 trios and 24 unrelated Coriellsamples were amplified using the REPLI-g Mini kit,while the DNA from the 11 unrelated donors wereamplified using the REPLI-g Midi kit. Both reactionswere performed according to manufacturer’s proto-col. Amplification of the DNA extracted from filterpaper was performed according to the February 2005supplementary protocol for filter paper samples.
Genotyping — Design of SNP Panel
The 41 SNPs as described by Petkovski et al.(Petkovski et al., 2005) were used as a starting pointfor the design of the SNP panel. All non-HapMapSNPs (Phase I) were excluded, and SNPs genotypedby HapMap with minor allele frequencies greaterthan 20%, and genotypes distributed according toHWE in trios from Utah Residents with Northernand Western European Ancestry (CEU), were added,until a panel of 50 markers with no inter-marker LD,including the sex specific AMELXY marker, was
obtained (Table 1). SNPHunter (Wang et al., 2005)and RepeatMasker version open-3.1.5(http://www.repeatmasker.org/) were used for detect-ing nearby SNPs and repeats in the flankingsequences, and Sequenom’s Assay Design 3.4 soft-ware was used for designing multiplexes for theiPLEX chemistry.
Genotyping — SNP Method
The PCR and subsequent downstream processingwas performed according to the manufacturer’s stan-dard protocol (Sequenom), and the genotypes wereanalyzed by an Autoflex MassARRAY mass spec-trometer (Bruker Daltonics, Billerica, MA, USA). Thedata were analyzed independently by two personsusing the SpectroTyper software (Sequenom Inc.).For details regarding genotyping and primersequences see Appendix A, Supplementary Methods.
Genotyping — Design of STR Panel
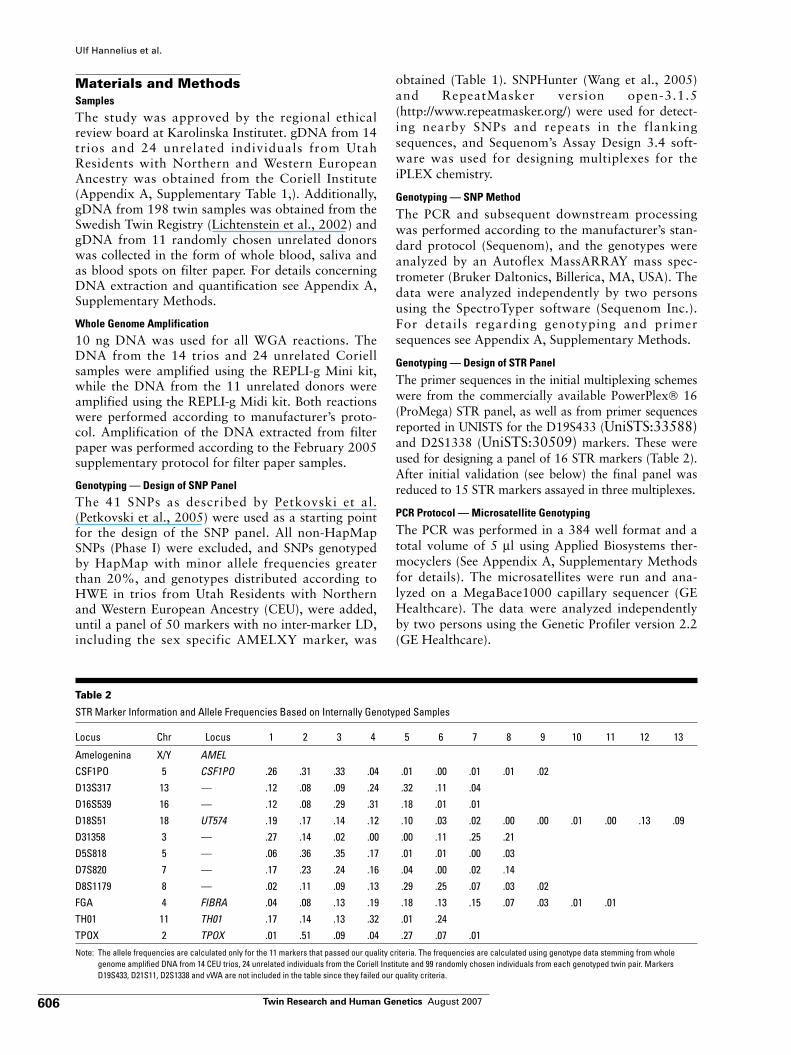
The primer sequences in the initial multiplexing schemeswere from the commercially available PowerPlex® 16(ProMega) STR panel, as well as from primer sequencesreported in UNISTS for the D19S433 (UniSTS:33588)and D2S1338 (UniSTS:30509) markers. These wereused for designing a panel of 16 STR markers (Table 2).After initial validation (see below) the final panel wasreduced to 15 STR markers assayed in three multiplexes.
PCR Protocol — Microsatellite Genotyping
The PCR was performed in a 384 well format and atotal volume of 5 µl using Applied Biosystems ther-mocyclers (See Appendix A, Supplementary Methodsfor details). The microsatellites were run and ana-lyzed on a MegaBace1000 capillary sequencer (GEHealthcare). The data were analyzed independentlyby two persons using the Genetic Profiler version 2.2(GE Healthcare).
Table 2
STR Marker Information and Allele Frequencies Based on Internally Genotyped Samples
Locus Chr Locus 1 2 3 4 5 6 7 8 9 10 11 12 13
Amelogenina X/Y AMELCSF1PO 5 CSF1PO .26 .31 .33 .04 .01 .00 .01 .01 .02D13S317 13 — .12 .08 .09 .24 .32 .11 .04D16S539 16 — .12 .08 .29 .31 .18 .01 .01D18S51 18 UT574 .19 .17 .14 .12 .10 .03 .02 .00 .00 .01 .00 .13 .09D31358 3 — .27 .14 .02 .00 .00 .11 .25 .21D5S818 5 — .06 .36 .35 .17 .01 .01 .00 .03D7S820 7 — .17 .23 .24 .16 .04 .00 .02 .14D8S1179 8 — .02 .11 .09 .13 .29 .25 .07 .03 .02FGA 4 FIBRA .04 .08 .13 .19 .18 .13 .15 .07 .03 .01 .01TH01 11 TH01 .17 .14 .13 .32 .01 .24TPOX 2 TPOX .01 .51 .09 .04 .27 .07 .01
Note: The allele frequencies are calculated only for the 11 markers that passed our quality criteria. The frequencies are calculated using genotype data stemming from wholegenome amplified DNA from 14 CEU trios, 24 unrelated individuals from the Coriell Institute and 99 randomly chosen individuals from each genotyped twin pair. MarkersD19S433, D21S11, D2S1338 and vWA are not included in the table since they failed our quality criteria.
607Twin Research and Human Genetics August 2007
Zygosity Testing Using SNPs
Characterization of Markers and Analysis of Genotyping Data
An in-memory data visualization tool (Qlikview,Qliktech Sweden) was used to build an in-house appli-cation around nonredundant allele frequency data(Data release #21) from the HapMap project (2003)as well as gene and reference SNP information fromNCBI build 35 (www.ncbi.nlm.nih.gov). The applica-tion was used for characterizing the initial 41 SNPsbased on their ref-SNP ID as well as for identifyingadditional SNPs based on their allele frequencies andchromosomal locations. Calculations for genotypingsuccess rates, concordance as well as data conversionswere done in Qlikview version 7.5 (Qliktech) by incor-porating genotype data from the Sequenom databaseand genotype reports from Genetic Profiler version 2.2.Initial checks for Mendelian inconsistencies as well asHardy Weinberg and linkage disequilibrium calcula-tions were done in Haploview version 3.2 (Barrett etal., 2005). Hardy Weinberg p values reported herewere calculated using the exact test implemented inPowerMarker version 3.25 (Guo & Thompson 1992;Liu & Muse 2005). The unadjusted α-level for HWEcalculations was 0.05, and in order to account formultiple testing we used Bonferroni adjusted α-levels.We failed markers that had success rates below 80%or that were out of HWE when considering adjustedα-levels. STR allele frequencies were calculated usingPowerMarker version 3.2 and SNP allele frequencies,including 95% confidence intervals, were calculatedin Qlikview.
Zygosity Testing
The likelihood of zygosity for the genotyped twinsamples were calculated based on observed genotypesusing ECLIPSE version 1.1, incorporating a prior geno-typing error rate of 1% according to error model 0(Sieberts et al., 2002).
Simulation Studies
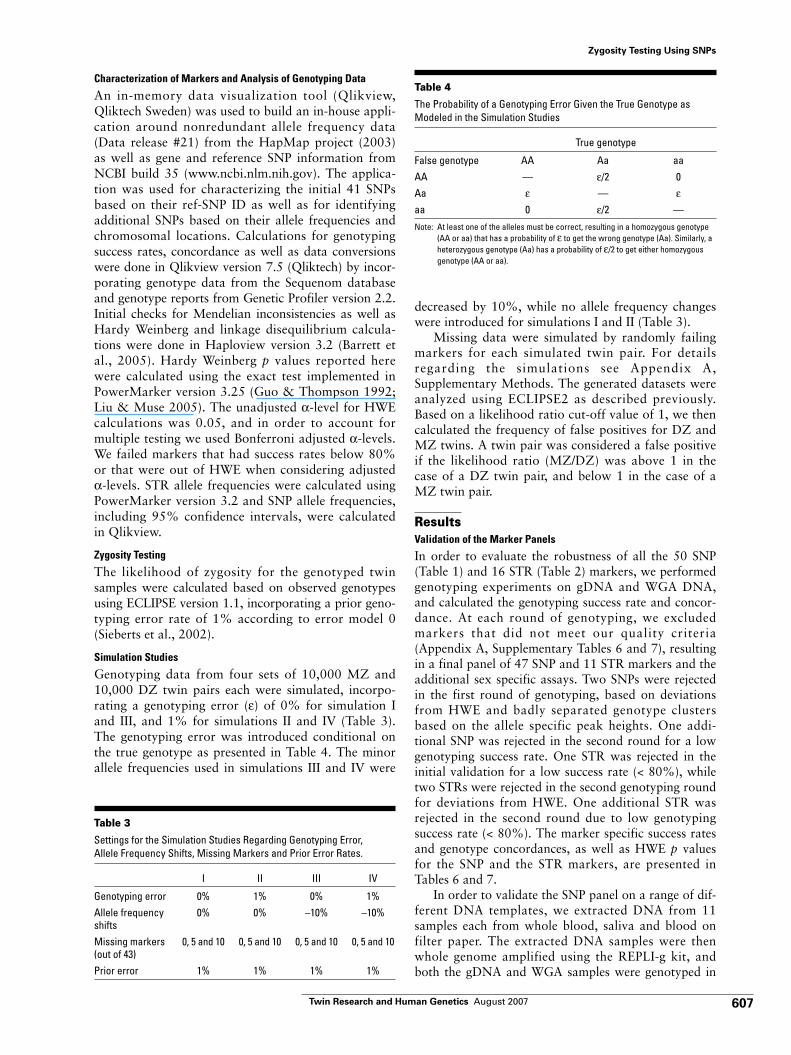
Genotyping data from four sets of 10,000 MZ and10,000 DZ twin pairs each were simulated, incorpo-rating a genotyping error (ε) of 0% for simulation Iand III, and 1% for simulations II and IV (Table 3).The genotyping error was introduced conditional onthe true genotype as presented in Table 4. The minorallele frequencies used in simulations III and IV were
decreased by 10%, while no allele frequency changeswere introduced for simulations I and II (Table 3).
Missing data were simulated by randomly failingmarkers for each simulated twin pair. For detailsregarding the simulations see Appendix A,Supplementary Methods. The generated datasets wereanalyzed using ECLIPSE2 as described previously.Based on a likelihood ratio cut-off value of 1, we thencalculated the frequency of false positives for DZ andMZ twins. A twin pair was considered a false positiveif the likelihood ratio (MZ/DZ) was above 1 in thecase of a DZ twin pair, and below 1 in the case of aMZ twin pair.
ResultsValidation of the Marker Panels
In order to evaluate the robustness of all the 50 SNP(Table 1) and 16 STR (Table 2) markers, we performedgenotyping experiments on gDNA and WGA DNA,and calculated the genotyping success rate and concor-dance. At each round of genotyping, we excludedmarkers that did not meet our quality criteria(Appendix A, Supplementary Tables 6 and 7), resultingin a final panel of 47 SNP and 11 STR markers and theadditional sex specific assays. Two SNPs were rejectedin the first round of genotyping, based on deviationsfrom HWE and badly separated genotype clustersbased on the allele specific peak heights. One addi-tional SNP was rejected in the second round for a lowgenotyping success rate. One STR was rejected in theinitial validation for a low success rate (< 80%), whiletwo STRs were rejected in the second genotyping roundfor deviations from HWE. One additional STR wasrejected in the second round due to low genotypingsuccess rate (< 80%). The marker specific success ratesand genotype concordances, as well as HWE p valuesfor the SNP and the STR markers, are presented inTables 6 and 7.
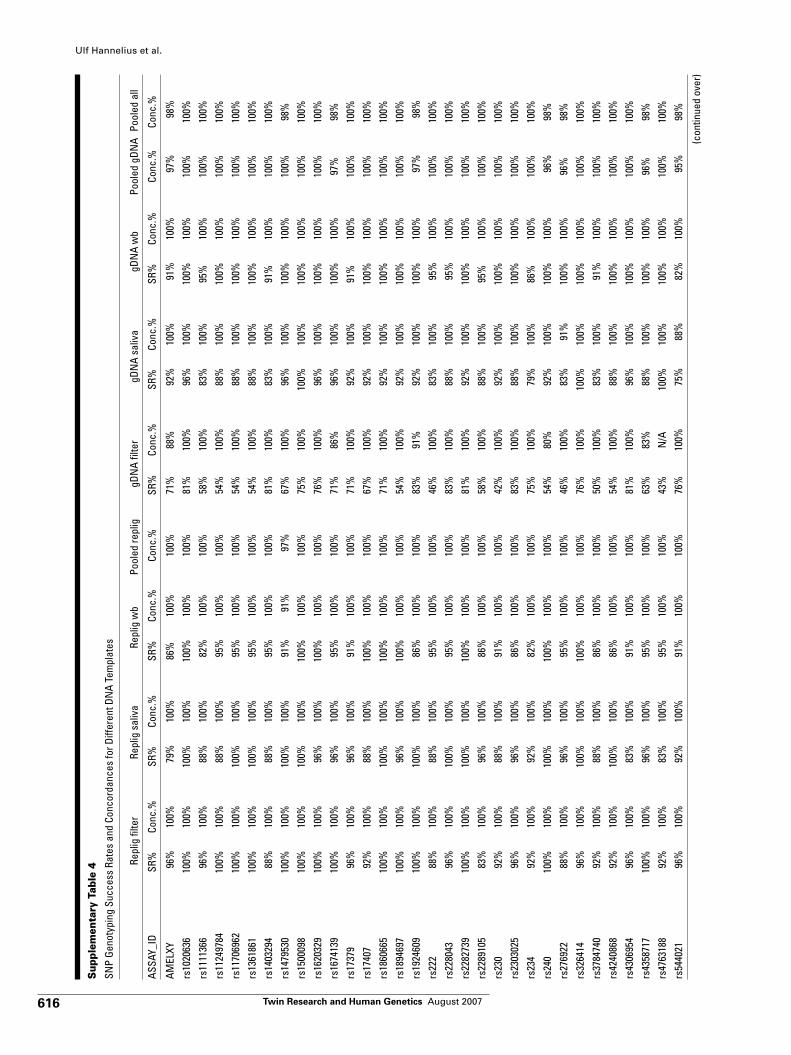
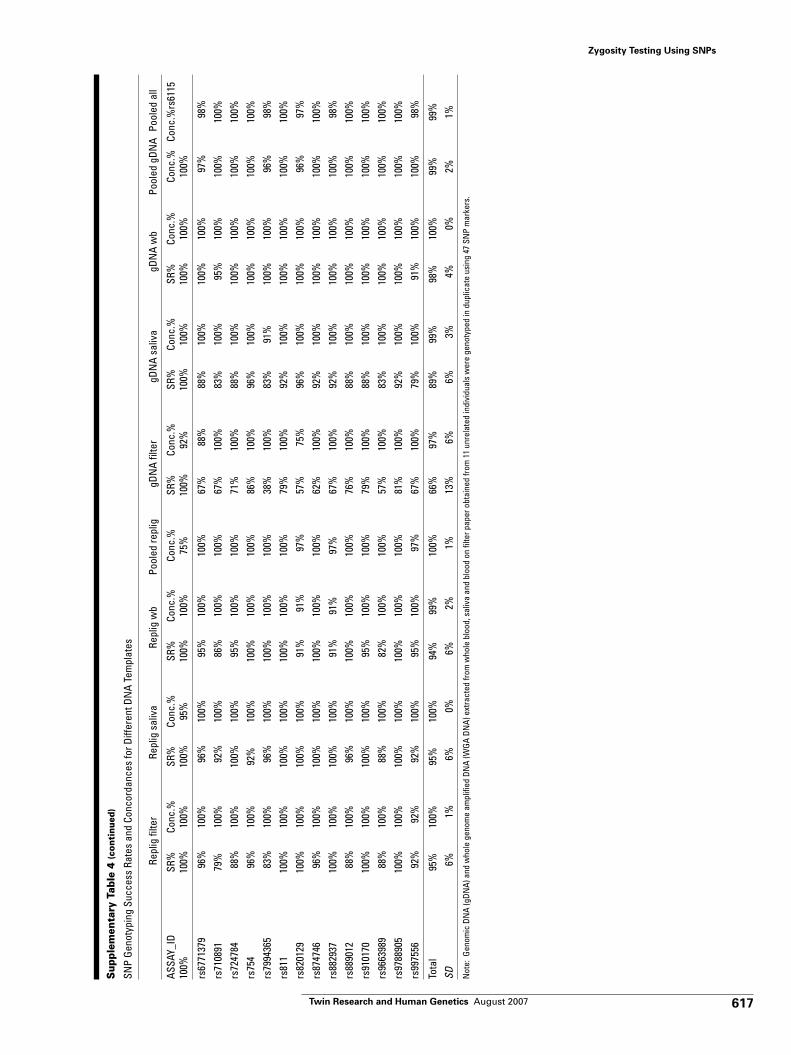
In order to validate the SNP panel on a range of dif-ferent DNA templates, we extracted DNA from 11samples each from whole blood, saliva and blood onfilter paper. The extracted DNA samples were thenwhole genome amplified using the REPLI-g kit, andboth the gDNA and WGA samples were genotyped in
Table 3
Settings for the Simulation Studies Regarding Genotyping Error, Allele Frequency Shifts, Missing Markers and Prior Error Rates.
I II III IV
Genotyping error 0% 1% 0% 1%Allele frequency 0% 0% –10% –10%shiftsMissing markers 0, 5 and 10 0, 5 and 10 0, 5 and 10 0, 5 and 10(out of 43)Prior error 1% 1% 1% 1%
Table 4
The Probability of a Genotyping Error Given the True Genotype asModeled in the Simulation Studies
True genotype
False genotype AA Aa aaAA — ε/2 0Aa ε — εaa 0 ε/2 —
Note: At least one of the alleles must be correct, resulting in a homozygous genotype(AA or aa) that has a probability of ε to get the wrong genotype (Aa). Similarly, aheterozygous genotype (Aa) has a probability of ε/2 to get either homozygousgenotype (AA or aa).
608 Twin Research and Human Genetics August 2007
Ulf Hannelius et al.
duplicates for the 47 SNP markers. The overall geno-type concordance was 99% (SD 2%) for the gDNAsamples and 100% (SD 1%) for the WGA DNAsamples (Appendix A, Supplementary Table 4). ThegDNA extracted from filter paper resulted in the lowestgenotyping success rate (66%, SD 13%) while the restof the success rates ranged between 89% and 99%.
Zygosity Testing
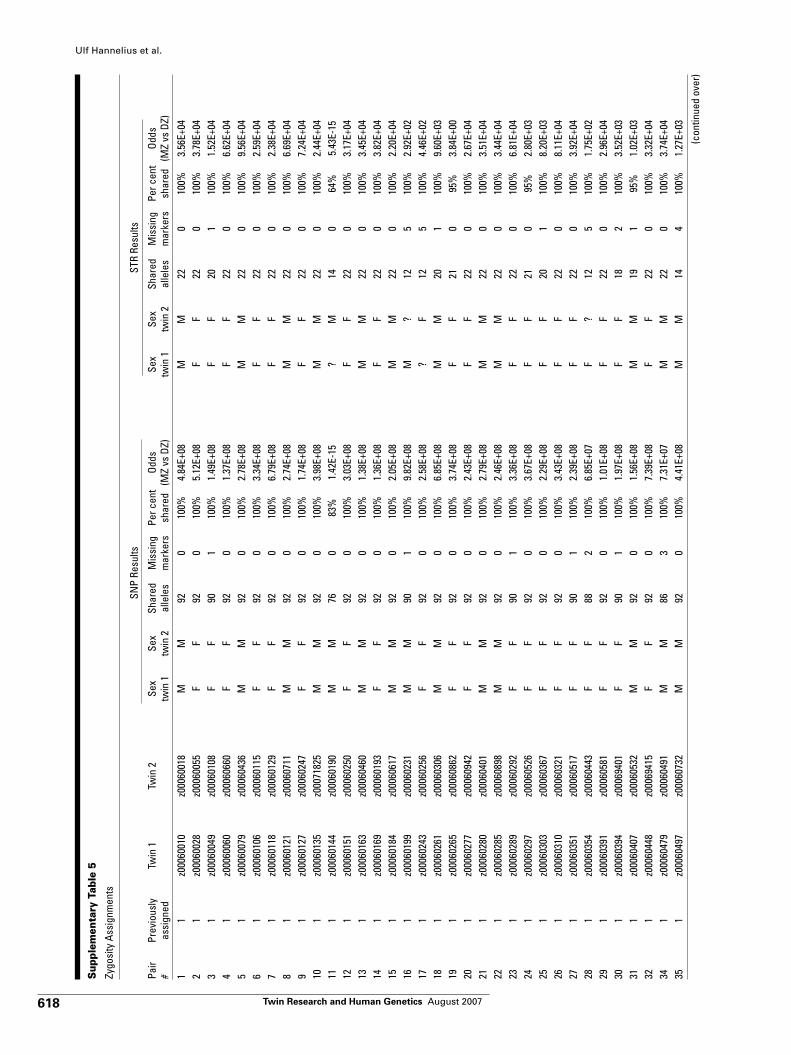
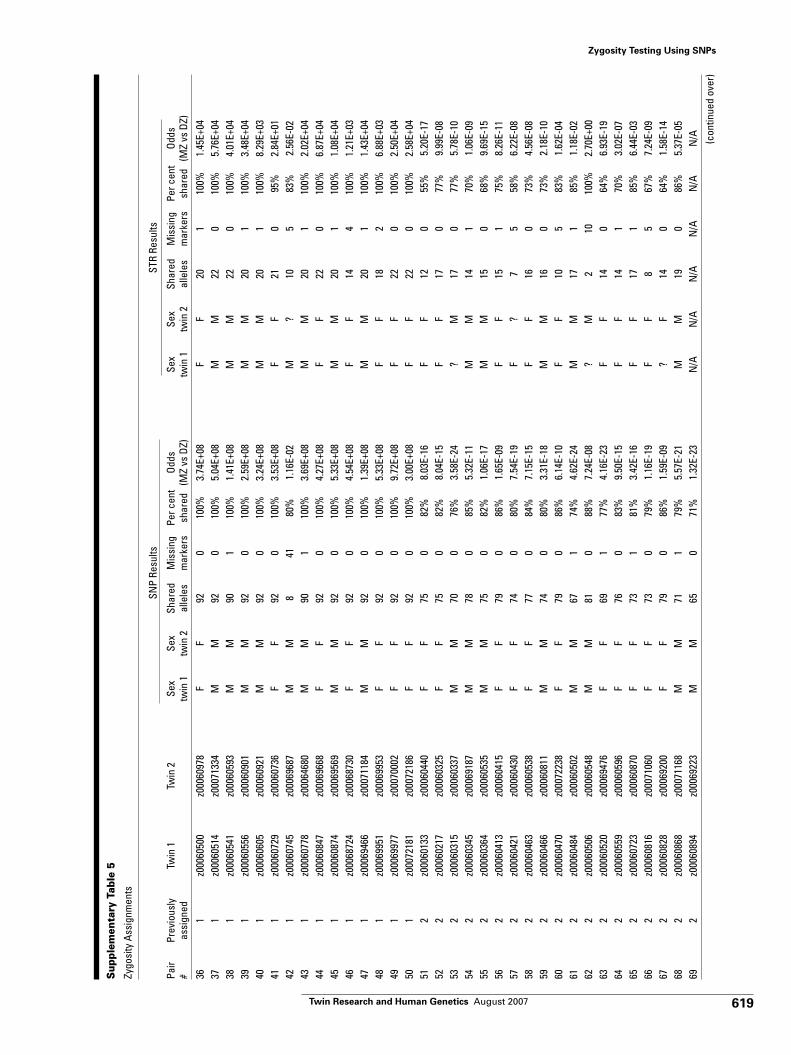
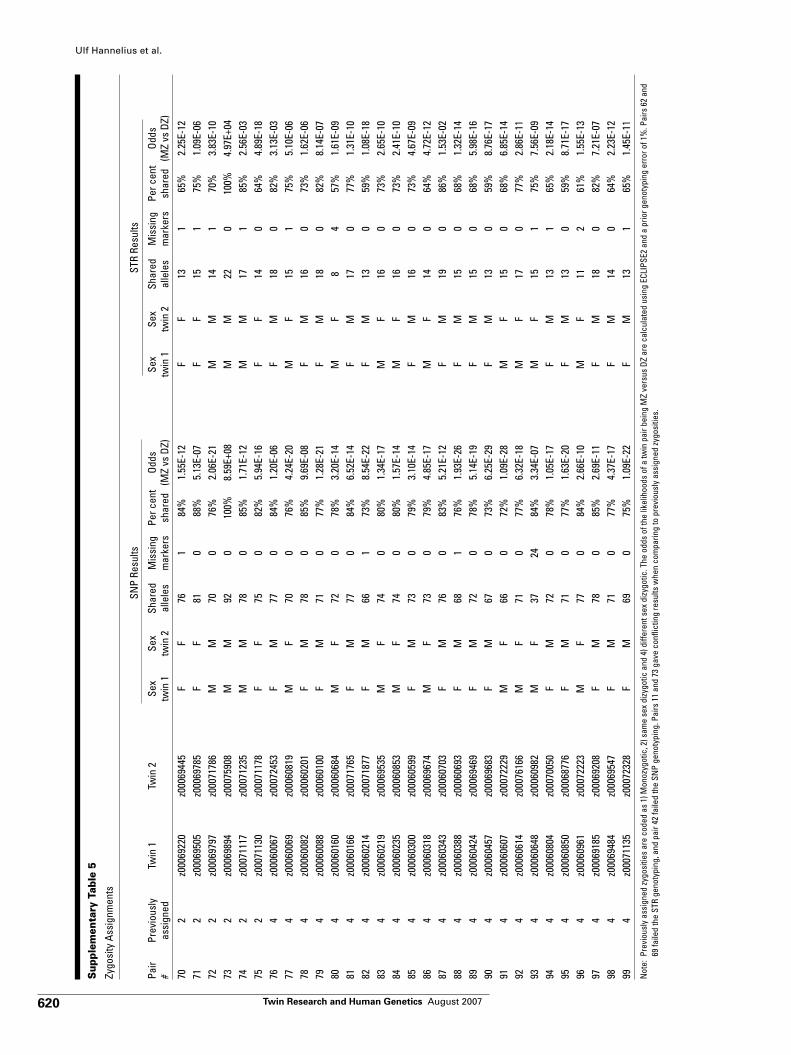
Next we set out to determine the zygosity of the geno-typed twin samples. In order to keep the genotypingand the quality control unbiased, the zygosity of thepairs and the gender of the individuals were unknownto the persons performing the experiments. Afterdecoding the sample codes, we calculated the allelesharing and the odds of the likelihood ratios of a pairbeing monozygotic versus dizygotic for all the pairs,and compared our results with the information pro-vided by the Swedish Twin Registry. We incorporateda prior genotyping error rate of 1% into the ECLIPSEcalculations in order to account for incorrect geno-types, as well as possible somatic mutations. One pairfailed the genotyping for the SNP panel and two pairsfor the STR panel. Two pairs (numbers 11 and 73)gave conflicting results regarding zygosity when com-paring both the SNP and STR panels to the previouslyassigned zygosity. Here, one of the pairs (number 11)was DZ according to the questionnaire, and MZaccording to the marker panels, whereas the other pair(number 73) was DZ according to the questionnaire,and MZ according to the marker panels. The genderspecific assay in the SNP panel confirmed the sex ofall twin pairs, while the corresponding assay in theSTR panel failed to generate successful genotypes fornine of the individuals (Appendix A, SupplementaryTable 5). Details regarding success rates and likeli-hood ratios of zygosity are presented in Appendix A,Supplementary Table 5.
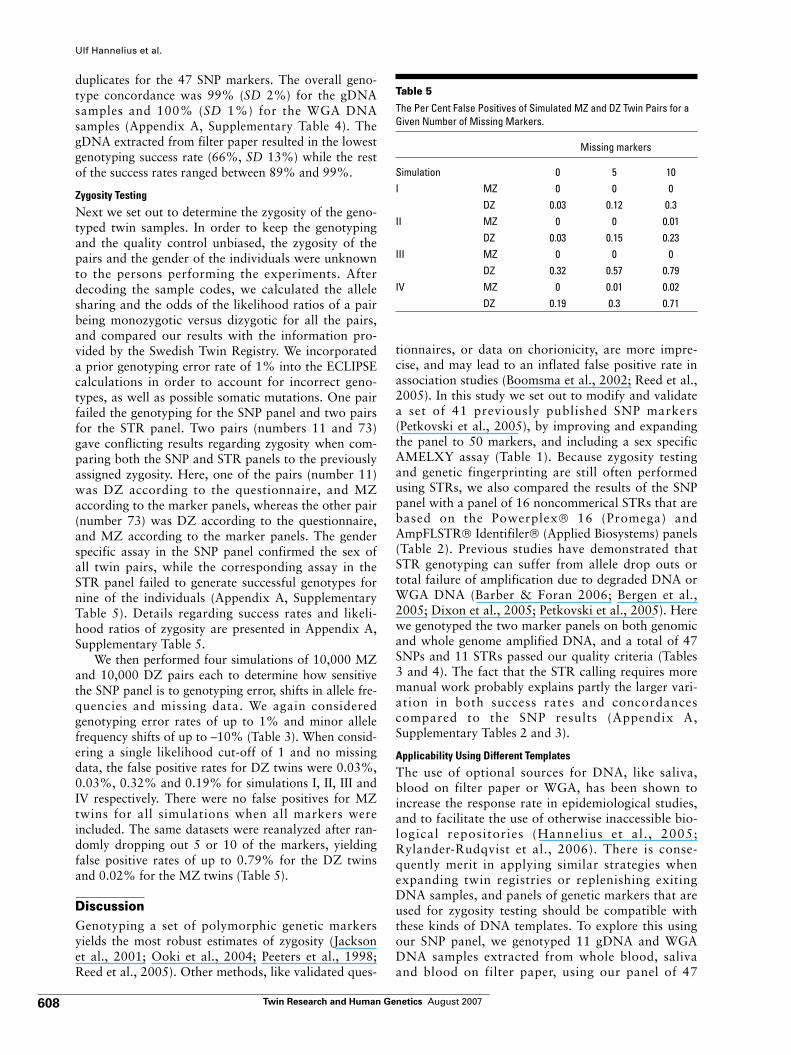
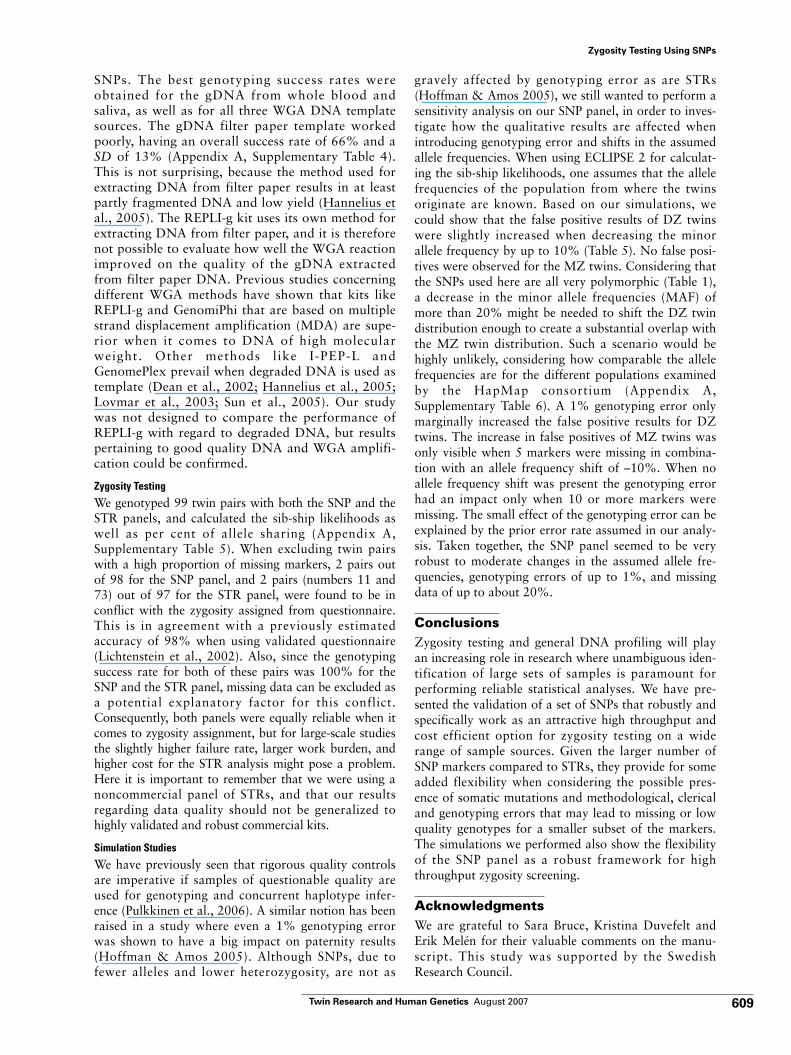
We then performed four simulations of 10,000 MZand 10,000 DZ pairs each to determine how sensitivethe SNP panel is to genotyping error, shifts in allele fre-quencies and missing data. We again consideredgenotyping error rates of up to 1% and minor allelefrequency shifts of up to –10% (Table 3). When consid-ering a single likelihood cut-off of 1 and no missingdata, the false positive rates for DZ twins were 0.03%,0.03%, 0.32% and 0.19% for simulations I, II, III andIV respectively. There were no false positives for MZtwins for all simulations when all markers wereincluded. The same datasets were reanalyzed after ran-domly dropping out 5 or 10 of the markers, yieldingfalse positive rates of up to 0.79% for the DZ twinsand 0.02% for the MZ twins (Table 5).
DiscussionGenotyping a set of polymorphic genetic markersyields the most robust estimates of zygosity (Jacksonet al., 2001; Ooki et al., 2004; Peeters et al., 1998;Reed et al., 2005). Other methods, like validated ques-
tionnaires, or data on chorionicity, are more impre-cise, and may lead to an inflated false positive rate inassociation studies (Boomsma et al., 2002; Reed et al.,2005). In this study we set out to modify and validatea set of 41 previously published SNP markers(Petkovski et al., 2005), by improving and expandingthe panel to 50 markers, and including a sex specificAMELXY assay (Table 1). Because zygosity testingand genetic fingerprinting are still often performedusing STRs, we also compared the results of the SNPpanel with a panel of 16 noncommerical STRs that arebased on the Powerplex® 16 (Promega) andAmpFLSTR® Identifiler® (Applied Biosystems) panels(Table 2). Previous studies have demonstrated thatSTR genotyping can suffer from allele drop outs ortotal failure of amplification due to degraded DNA orWGA DNA (Barber & Foran 2006; Bergen et al.,2005; Dixon et al., 2005; Petkovski et al., 2005). Herewe genotyped the two marker panels on both genomicand whole genome amplified DNA, and a total of 47SNPs and 11 STRs passed our quality criteria (Tables3 and 4). The fact that the STR calling requires moremanual work probably explains partly the larger vari-ation in both success rates and concordancescompared to the SNP results (Appendix A,Supplementary Tables 2 and 3).
Applicability Using Different Templates
The use of optional sources for DNA, like saliva,blood on filter paper or WGA, has been shown toincrease the response rate in epidemiological studies,and to facilitate the use of otherwise inaccessible bio-logical repositories (Hannelius et al., 2005;Rylander-Rudqvist et al., 2006). There is conse-quently merit in applying similar strategies whenexpanding twin registries or replenishing exitingDNA samples, and panels of genetic markers that areused for zygosity testing should be compatible withthese kinds of DNA templates. To explore this usingour SNP panel, we genotyped 11 gDNA and WGADNA samples extracted from whole blood, salivaand blood on filter paper, using our panel of 47
Table 5
The Per Cent False Positives of Simulated MZ and DZ Twin Pairs for aGiven Number of Missing Markers.
Missing markers
Simulation 0 5 10I MZ 0 0 0
DZ 0.03 0.12 0.3II MZ 0 0 0.01
DZ 0.03 0.15 0.23III MZ 0 0 0
DZ 0.32 0.57 0.79IV MZ 0 0.01 0.02
DZ 0.19 0.3 0.71
609Twin Research and Human Genetics August 2007
Zygosity Testing Using SNPs
SNPs. The best genotyping success rates wereobtained for the gDNA from whole blood andsaliva, as well as for all three WGA DNA templatesources. The gDNA filter paper template workedpoorly, having an overall success rate of 66% and aSD of 13% (Appendix A, Supplementary Table 4).This is not surprising, because the method used forextracting DNA from filter paper results in at leastpartly fragmented DNA and low yield (Hannelius etal., 2005). The REPLI-g kit uses its own method forextracting DNA from filter paper, and it is thereforenot possible to evaluate how well the WGA reactionimproved on the quality of the gDNA extractedfrom filter paper DNA. Previous studies concerningdifferent WGA methods have shown that kits likeREPLI-g and GenomiPhi that are based on multiplestrand displacement amplification (MDA) are supe-rior when it comes to DNA of high molecularweight. Other methods like I-PEP-L andGenomePlex prevail when degraded DNA is used astemplate (Dean et al., 2002; Hannelius et al., 2005;Lovmar et al., 2003; Sun et al., 2005). Our studywas not designed to compare the performance ofREPLI-g with regard to degraded DNA, but resultspertaining to good quality DNA and WGA amplifi-cation could be confirmed.
Zygosity Testing
We genotyped 99 twin pairs with both the SNP and theSTR panels, and calculated the sib-ship likelihoods aswell as per cent of allele sharing (Appendix A,Supplementary Table 5). When excluding twin pairswith a high proportion of missing markers, 2 pairs outof 98 for the SNP panel, and 2 pairs (numbers 11 and73) out of 97 for the STR panel, were found to be inconflict with the zygosity assigned from questionnaire.This is in agreement with a previously estimatedaccuracy of 98% when using validated questionnaire(Lichtenstein et al., 2002). Also, since the genotypingsuccess rate for both of these pairs was 100% for theSNP and the STR panel, missing data can be excluded asa potential explanatory factor for this conflict.Consequently, both panels were equally reliable when itcomes to zygosity assignment, but for large-scale studiesthe slightly higher failure rate, larger work burden, andhigher cost for the STR analysis might pose a problem.Here it is important to remember that we were using anoncommercial panel of STRs, and that our resultsregarding data quality should not be generalized tohighly validated and robust commercial kits.
Simulation Studies
We have previously seen that rigorous quality controlsare imperative if samples of questionable quality areused for genotyping and concurrent haplotype infer-ence (Pulkkinen et al., 2006). A similar notion has beenraised in a study where even a 1% genotyping errorwas shown to have a big impact on paternity results(Hoffman & Amos 2005). Although SNPs, due tofewer alleles and lower heterozygosity, are not as
gravely affected by genotyping error as are STRs(Hoffman & Amos 2005), we still wanted to perform asensitivity analysis on our SNP panel, in order to inves-tigate how the qualitative results are affected whenintroducing genotyping error and shifts in the assumedallele frequencies. When using ECLIPSE 2 for calculat-ing the sib-ship likelihoods, one assumes that the allelefrequencies of the population from where the twinsoriginate are known. Based on our simulations, wecould show that the false positive results of DZ twinswere slightly increased when decreasing the minorallele frequency by up to 10% (Table 5). No false posi-tives were observed for the MZ twins. Considering thatthe SNPs used here are all very polymorphic (Table 1),a decrease in the minor allele frequencies (MAF) ofmore than 20% might be needed to shift the DZ twindistribution enough to create a substantial overlap withthe MZ twin distribution. Such a scenario would behighly unlikely, considering how comparable the allelefrequencies are for the different populations examinedby the HapMap consortium (Appendix A,Supplementary Table 6). A 1% genotyping error onlymarginally increased the false positive results for DZtwins. The increase in false positives of MZ twins wasonly visible when 5 markers were missing in combina-tion with an allele frequency shift of –10%. When noallele frequency shift was present the genotyping errorhad an impact only when 10 or more markers weremissing. The small effect of the genotyping error can beexplained by the prior error rate assumed in our analy-sis. Taken together, the SNP panel seemed to be veryrobust to moderate changes in the assumed allele fre-quencies, genotyping errors of up to 1%, and missingdata of up to about 20%.
ConclusionsZygosity testing and general DNA profiling will playan increasing role in research where unambiguous iden-tification of large sets of samples is paramount forperforming reliable statistical analyses. We have pre-sented the validation of a set of SNPs that robustly andspecifically work as an attractive high throughput andcost efficient option for zygosity testing on a widerange of sample sources. Given the larger number ofSNP markers compared to STRs, they provide for someadded flexibility when considering the possible pres-ence of somatic mutations and methodological, clericaland genotyping errors that may lead to missing or lowquality genotypes for a smaller subset of the markers.The simulations we performed also show the flexibilityof the SNP panel as a robust framework for highthroughput zygosity screening.
AcknowledgmentsWe are grateful to Sara Bruce, Kristina Duvefelt andErik Melén for their valuable comments on the manu-script. This study was supported by the SwedishResearch Council.
610 Twin Research and Human Genetics August 2007
Ulf Hannelius et al.
ReferencesBarber, A. L., & Foran, D. R. (2006). The utility of whole
genome amplification for typing compromised foren-sic samples. Journal of Forensic Science, 51,1344–1349.
Barrett, J. C., Fry, B., Maller, J., & Daly, M. J. (2005).Haploview: Analysis and visualization of LD and hap-lotype maps. Bioinformatics, 21, 263–265.
Bergen, A. W., Qi, Y., Haque, K. A., Welch, R. A., &Chanock, S. J. (2005). Effects of DNA mass on multi-ple displacement whole genome amplification andgenotyping performance. BMC Biotechnology, 5, 24.
Boomsma, D., Busjahn, A., & Peltonen, L. (2002).Classical twin studies and beyond. Nature Review.Genetics, 3, 872–882.
Dean, F. B., Hosono, S., Fang, L., Wu, X., Faruqi, A. F.,Bray-Ward, P., Sun, Z., Zong, Q., Du, Y., Du, J.,Driscoll, M., Song, W., Kingsmore, S. F., Egholm, M.,& Lasken, R. S. (2002). Comprehensive humangenome amplification using multiple displacementamplification. Proceedings of the National Academyof Sciences of the United States of America, 99,5261–5266.
Dixon, L. A., Dobbins, A. E., Pulker, H. K., Butler, J. M.,Vallone, P. M., Coble, M. D., Parson, W., Berger, B.,Grubwieser, P., Mogensen, H. S., Morling, N., Nielsen,K., Sanchez, J. J., Petkovski, E., Carracedo, A.,Sanchez-Diz, P., Ramos-Luis, E., Brion, M., Irwin, J. A.,Just, R. S., Loreille, O., Parsons, T. J., Syndercombe-Court, D., Schmitter, H., Stradmann-Bellinghausen, B.,Bender, K., & Gill, P. (2005). Analysis of artificiallydegraded DNA using STRs and SNPs-results of a col-laborative European (EDNAP) exercise. ForensicScience International, 164, 33–44.
Guo, S. W., & Thompson, E. A. (1992). Performing theexact test of Hardy-Weinberg proportion for multiplealleles. Biometrics, 48, 361–372.
Hannelius, U., Lindgren, C. M., Melen, E., Malmberg, A.,von Dobeln, U., & Kere, J. (2005). Phenylketonuriascreening registry as a resource for population geneticstudies. Journal of Medical Genetics, 42, e60.
Hirschhorn, J. N., Lohmueller, K., Byrne, E., &Hirschhorn, K. (2002). A comprehensive review ofgenetic association studies. Genetics in Medicine, 4,45–61.
Hoffman, J. I., & Amos, W. (2005). Microsatellite geno-typing errors: Detection approaches, common sourcesand consequences for paternal exclusion. MolecularEcology, 14, 599–612.
Hosono, S., Faruqi, A. F., Dean, F. B., Du, Y., Sun, Z.,Wu, X., Du, J., Kingsmore, S. F., Egholm, M., &Lasken, R. S. (2003). Unbiased whole-genome amplifi-cation directly from clinical samples. GenomeResearch, 13, 954–964.
Ioannidis, J. P., Ntzani, E. E., Trikalinos, T. A., &Contopoulos-Ioannidis, D. G. (2001). Replication
validity of genetic association studies. NatureGenetics, 29, 306–309.
Ioannidis, J. P., Trikalinos, T. A., Ntzani, E. E., &Contopoulos-Ioannidis, D. G. (2003). Genetic associa-tions in large versus small studies: An empiricalassessment. Lancet, 361, 567–571.
Jackson, R. W., Snieder, H., Davis, H., & Treiber, F. A.(2001). Determination of twin zygosity: a comparisonof DNA with various questionnaire indices. TwinResearch, 4, 12–18.
Jeffreys, A. J., Wilson, V., & Thein, S. L. (1985).Individual-specific ‘fingerprints’ of human DNA.Nature, 316, 76–9.
Lichtenstein, P., De Faire, U., Floderus, B., Svartengren,M., Svedberg, P., & Pedersen, N. L. (2002). TheSwedish Twin Registry: A unique resource for clinical,epidemiological and genetic studies. Journal ofInternal Medicine, 252, 184–205.
Liu, K., & Muse, S. V. (2005). PowerMarker: An inte-grated analysis environment for genetic markeranalysis. Bioinformatics, 21, 2128–2129.
Lohmueller, K. E., Pearce, C. L., Pike, M., Lander, E. S.,& Hirschhorn, J. N. (2003). Meta-analysis of geneticassociation studies supports a contribution ofcommon variants to susceptibility to common disease.Nature Genetics, 33, 177–182.
Lovmar, L., Fredriksson, M., Liljedahl, U., Sigurdsson, S.,& Syvanen, A. C. (2003). Quantitative evaluation byminisequencing and microarrays reveals accurate mul-tiplexed SNP genotyping of whole genome amplifiedDNA. Nucleic Acids Research, 31, e129.
Ooki, S., Yokoyama, Y., & Asaka, A. (2004). Zygositymisclassification of twins at birth in Japan. TwinResearch, 7, 228–232.
Peeters, H., Van Gestel, S., Vlietinck, R., Derom, C., &Derom, R. (1998). Validation of a telephone zygosityquestionnaire in twins of known zygosity. BehaviourGenetics, 28, 159–163.
Peltonen, L. (2003). GenomEUtwin: A strategy to identifygenetic influences on health and disease. TwinResearch, 6, 354–360.
Petkovski, E., Keyser-Tracqui, C., Hienne, R., & Ludes,B. (2005). SNPs and MALDI-TOF MS: tools for DNAtyping in forensic paternity testing and anthropology.Journal of Forensic Science, 50, 535–541.
Pulkkinen, V., Haataja, R., Hannelius, U., Helve, O.,Pitkanen, O. M., Karikoski, R., Rehn, M., Marttila,R., Lindgren, C. M., Hastbacka, J., Andersson, S.,Kere, J., Hallman, M., & Laitinen, T. (2006). Gprotein-coupled receptor for asthma susceptibilityassociates with respiratory distress syndrome. Annalsof Medicine, 38, 357–366.
Reed, T., Plassman, B. L., Tanner, C. M., Dick, D. M.,Rinehart, S. A., & Nichols, W. C. (2005). Verificationof self-report of zygosity determined via DNA testingin a subset of the NAS-NRC twin registry 40 years
611Twin Research and Human Genetics August 2007
Zygosity Testing Using SNPs
later. Twin Research and Human Genetics, 8,362–367.
Rylander-Rudqvist, T., Hakansson, N., Tybring, G., &Wolk, A. (2006). Quality and quantity of saliva DNAobtained from the self-administrated oragene method:A pilot study on the cohort of swedish men. CancerEpidemiology, Biomarkers and Prevention, 15,1742–1745.
Sieberts, S. K., Wijsman, E. M., & Thompson, E. A.(2002). Relationship inference from trios of individu-als, in the presence of typing error. American Journalof Human Genetics, 70, 170–80.
Sun, G., Kaushal, R., Pal, P., Wolujewicz, M., Smelser, D.,Cheng, H., Lu, M., Chakraborty, R., Jin, L., & Deka,
R. (2005). Whole-genome amplification: Relative effi-ciencies of the current methods. Legal Medicine(Tokyo), 7, 279–286.
The International HapMap Project. (2003). Nature, 426,789–796
Utsuno, H., & Minaguchi, K. (2004). Influence of tem-plate DNA degradation on the genotyping of SNPsand STR polymorphisms from forensic materials byPCR. The Bulletin of Tokyo Dental College, 45,33–46.
Wang, L., Liu, S., Niu, T., & Xu, X. (2005). SNPHunter:A bioinformatic software for single nucleotide poly-morphism data acquisition and management. BMCBioinformatics, 6, 60.
Appendix A
Supplementary Methods and Tables
Microsatellite Genotyping
The PCR was performed in a 384 well format and a total volume of 5 µl. The PCR mix consisted of 0.2 µMforward and reverse primer (Metabion), 0.2 mM dNTP (Roche), 2.5 mM MgCl2 (Qiagen) and 0.2 UQiagen Hotstart Taq in 1 × PCR buffer was added to 2 ng dried down DNA. The reactions were first opti-mized in singleplex by running a gradient PCR with 15 minutes of denaturation at 95ºC, followed by 40cycles of 94ºC for 30 seconds, 55–65ºC for 15 seconds, and 72ºC for 30 seconds. A final elongation step of72ºC for 5 minutes ended the program. Next, the primers were run in four multiplexes on 2.5 ng of drieddown DNA (Supplementary Table 7) using a touch down PCR temperature profile in order to remedy someunspecific amplification observed after the singleplex run. The temperature profile started with 15 minutesof denaturation at 95ºC, followed by 13 cycles of 94ºC for 30 seconds, 72ºC (–1ºC/ cycle) for 15 seconds,and 72ºC for 30 seconds. The final 27 cycles were run using a temperature profile of 92ºC for 30 seconds,60ºC for 15 seconds, and 72ºC for 30 seconds. A final elongation step of 72ºC for 5 minutes ended theprogram. Subsequent PCR:s were run using the same touch down program and the same concentrations ofreagents. The DNA template amount was increased to a minimum of 10 ng when genotyping the wholegenome amplified samples as well as the twin samples. The final multiplexing scheme is depicted inSupplementary Table 8.
A Beckman Multimek pipetting robot was used for pipetting WGA DNA and gDNA from the twinsamples. PCR reagents as well as the gDNA were pipetted using a Hamilton mph96 pipetting station. Thereactions for the different markers and the same samples were pooled into 96 well plates for downstreamapplications using a Beckman Multimek pipetting robot. All primer sequences are available inSupplementary Table 4.Salt was removed according to manufacturers recommendation by spinning 20 µl of the pooled samplesthrough a Sephadex plate (GE Healthcare).
SNP Genotyping
The PCR was run in a 384 well format using BiometraT100 and Applied Biosystems 9700 thermocyclers. 4µl of PCR mix containing 0.5 µM PCR primer 1 and 2 accordingly (MetaBion Gmbh, Martinsried,Germany), 0.5 mM dNTP (Roche Diagnostics), 3.5 mM MgCl2 (Qiagen Gmbh, Germany) and 0.5UQiagen Hotstart Taq for the high-plex pools (> 10-plex), and 0.25 U for the low-plex pool in 1.25 × PCRbuffer (Qiagen), was added to a minimum of 7.5 ng (1 µl) of DNA. All PCR reactions used the same tem-perature profile, with 15 minutes of denaturation at 95ºC, followed by 45 cycles of 94ºC for 30 seconds,60ºC for 15 seconds, and 72ºC for 15 seconds. A final elongation step of 72ºC for 5 minutes ended theprogram. The PCR was set up using a Hamilton mph96 (Hamilton Company, Reno, NV, USA) pipettingstation for pipetting of mix, and a Beckman Multimek pipetting robot for dispensing DNA template. Allprimer sequences are available in Supplementary Table 9.
Unincorporated deoxynucleotides were dephosphorylted and single base extension was performedaccording to the Sequenom iPLEX protocol. Salt was removed by using an ion exchange resin (Sequenom),after which approximately 10 nl of the samples were spotted onto Maldimatrix containing SpectroCHIPS,
612 Twin Research and Human Genetics August 2007
Ulf Hannelius et al.
and analyzed by an Autoflex MassARRAY mass spectrometer (Bruker Daltonics, Billerica, MA, USA). Datawere analyzed independently by two persons using the SpectroTyper software (Sequenom Inc.).
DNA extraction
10 ml whole blood was collected in EDTA tubes and DNA extraction was performed on an Autopure LSinstrument using Puregene chemistries (Gentra Systems, Inc., Mpl., MN) and the protocol for 5–10 mlwhole blood. Two ml saliva was collected using Oragene DNA self-collection kit (DNA Genotek, Canada),and the samples were heated for 1h at 50ºC. DNA extraction was performed on the Autopure LS instru-ment using Puregene chemistries and the protocol for 1 ml cell lysate (J. Dols et. al.). For the filter papers, afew drops of blood were applied onto FTA classic card (Whatman International Ltd.) and the blood spotswere left to dry for 1 hour. Genomic DNA for genotyping was extracted using a combination of saponinand chelex-100 (Hannelius et al. 2005), while genomic DNA for REPLI-g amplification was extractedaccording to the REPLI-g supplementary protocol from February 2005.
DNA Quantification
The DNA from the trios, unrelated Coriell individuals, samples from twins, and the Repli-g amplified DNAfrom trios and unrelated individuals were quantified using the PicoGreen (Molecular Probes Inc., Eugene,Oregon, USA) assay. The 11 DNA samples from whole blood and saliva, as well as the samples from filterpaper used for the WGA reaction, were quantified by both optical density (OD) and PicoGreen. The DNAextracted from filter paper using saponin and chelex-100 was quantified by OliGreen. All correspondingwhole genome amplified reactions were quantified by the PicoGreen assay.
The OD quantification was performed in an automated format using Tecan Robot Freedom evo (TecanNordic) and GENios spectrophotometer (Tecan Nordic). The OliGreen and PicoGreen assays (MolecularProbes Inc., Eugene, Oregon) were performed according to manufacturer’s protocol, using untreated blackmicrotiter well plates (NUNC A/S, Roskilde, Denmark), and fluorescence was measured on a FluoStarOptima (BMG LABTECH GmbH, Germany).
Simulations
The parental genotypes were generated based on allele frequencies and an assumption of HWE. The firsttwin was consequently generated by assuming a 50% chance of getting either one of two alleles for eachmarker from the parents. In case of monozygotic twins, a copy of the first twin was then produced, while incase of dizygotic twins, another individual was generated based on the same rules as for the first twin. Afterhaving generated a genotype for a specific marker and a specific twin, the genotyping error was introduced,giving each marker and each individual an equal chance of acquiring an error. Missing data were simulatedby randomly excluding one marker at a time for all individuals in a simulation set.
613Twin Research and Human Genetics August 2007
Zygosity Testing Using SNPs
Supplementary Table 1
Sample Id:s of the 14 CEU Trios and 24 Unrelated Individuals Obtainedfrom the Coriell Institute (http://www.coriell.org/) That Were Used forGenotyping
CEU trios Coriell unrelated
NA06994 NA15029 NA07000 NA15036 NA07029 NA15215 NA07345 NA15223 NA07348 NA15245 NA07357 NA15224 NA10831 NA15236 NA10835 NA15510 NA10839 NA15213 NA10846 NA15221 NA10847 NA15227 NA10851 NA15385NA10854 NA15590 NA10855 NA15038 NA10857 NA15056 NA10861 NA15072 NA11831 NA15144 NA11832 NA15216 NA11839 NA15226 NA11840 NA15242 NA11994 NA15268 NA11995 NA15324 NA12005 NA15386 NA12006 NA15594 NA12043NA12044NA12056NA12057NA12144NA12145NA12146NA12155NA12156NA12239NA12248NA12249NA12707NA12716NA12717NA12878NA12891NA12892
614 Twin Research and Human Genetics August 2007
Ulf Hannelius et al.
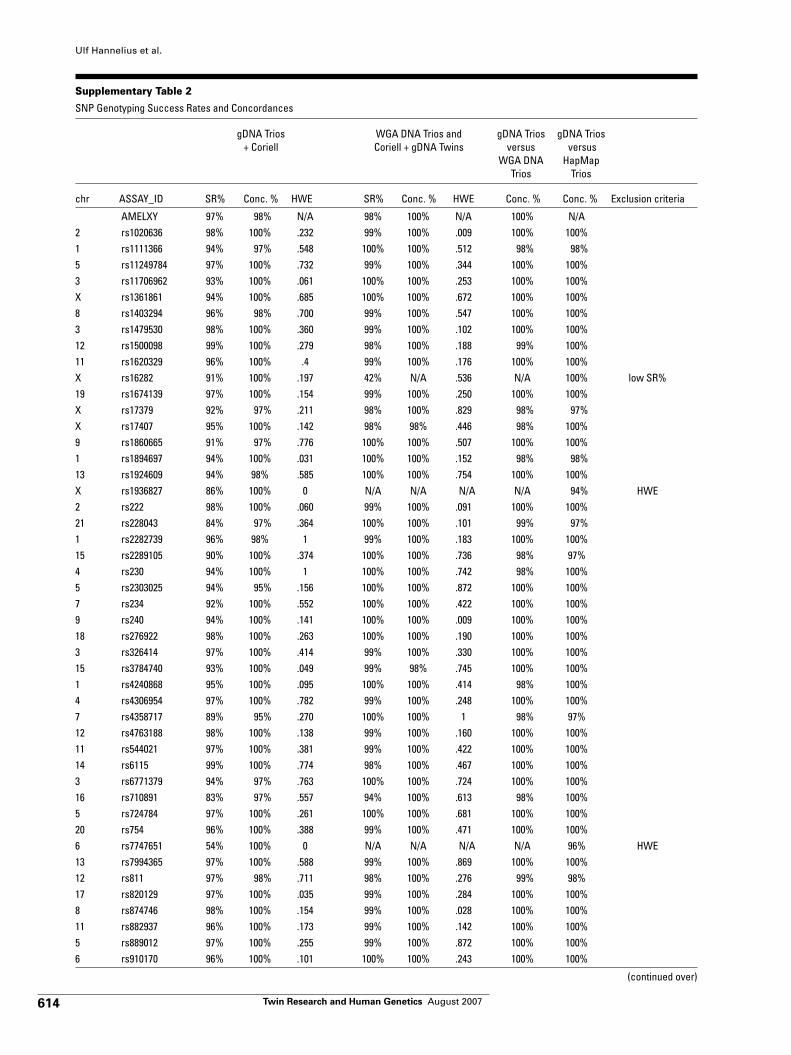
Supplementary Table 2
SNP Genotyping Success Rates and Concordances
gDNA Trios WGA DNA Trios and gDNA Trios gDNA Trios+ Coriell Coriell + gDNA Twins versus versus
WGA DNA HapMap Trios Trios
chr ASSAY_ID SR% Conc. % HWE SR% Conc. % HWE Conc. % Conc. % Exclusion criteria
AMELXY 97% 98% N/A 98% 100% N/A 100% N/A2 rs1020636 98% 100% .232 99% 100% .009 100% 100%1 rs1111366 94% 97% .548 100% 100% .512 98% 98%5 rs11249784 97% 100% .732 99% 100% .344 100% 100%3 rs11706962 93% 100% .061 100% 100% .253 100% 100%X rs1361861 94% 100% .685 100% 100% .672 100% 100%8 rs1403294 96% 98% .700 99% 100% .547 100% 100%3 rs1479530 98% 100% .360 99% 100% .102 100% 100%12 rs1500098 99% 100% .279 98% 100% .188 99% 100%11 rs1620329 96% 100% .4 99% 100% .176 100% 100%X rs16282 91% 100% .197 42% N/A .536 N/A 100% low SR%19 rs1674139 97% 100% .154 99% 100% .250 100% 100%X rs17379 92% 97% .211 98% 100% .829 98% 97%X rs17407 95% 100% .142 98% 98% .446 98% 100%9 rs1860665 91% 97% .776 100% 100% .507 100% 100%1 rs1894697 94% 100% .031 100% 100% .152 98% 98%13 rs1924609 94% 98% .585 100% 100% .754 100% 100%X rs1936827 86% 100% 0 N/A N/A N/A N/A 94% HWE2 rs222 98% 100% .060 99% 100% .091 100% 100%21 rs228043 84% 97% .364 100% 100% .101 99% 97%1 rs2282739 96% 98% 1 99% 100% .183 100% 100%15 rs2289105 90% 100% .374 100% 100% .736 98% 97%4 rs230 94% 100% 1 100% 100% .742 98% 100%5 rs2303025 94% 95% .156 100% 100% .872 100% 100%7 rs234 92% 100% .552 100% 100% .422 100% 100%9 rs240 94% 100% .141 100% 100% .009 100% 100%18 rs276922 98% 100% .263 100% 100% .190 100% 100%3 rs326414 97% 100% .414 99% 100% .330 100% 100%15 rs3784740 93% 100% .049 99% 98% .745 100% 100%1 rs4240868 95% 100% .095 100% 100% .414 98% 100%4 rs4306954 97% 100% .782 99% 100% .248 100% 100%7 rs4358717 89% 95% .270 100% 100% 1 98% 97%12 rs4763188 98% 100% .138 99% 100% .160 100% 100%11 rs544021 97% 100% .381 99% 100% .422 100% 100%14 rs6115 99% 100% .774 98% 100% .467 100% 100%3 rs6771379 94% 97% .763 100% 100% .724 100% 100%16 rs710891 83% 97% .557 94% 100% .613 98% 100%5 rs724784 97% 100% .261 100% 100% .681 100% 100%20 rs754 96% 100% .388 99% 100% .471 100% 100%6 rs7747651 54% 100% 0 N/A N/A N/A N/A 96% HWE13 rs7994365 97% 100% .588 99% 100% .869 100% 100%12 rs811 97% 98% .711 98% 100% .276 99% 98%17 rs820129 97% 100% .035 99% 100% .284 100% 100%8 rs874746 98% 100% .154 99% 100% .028 100% 100%11 rs882937 96% 100% .173 99% 100% .142 100% 100%5 rs889012 97% 100% .255 99% 100% .872 100% 100%6 rs910170 96% 100% .101 100% 100% .243 100% 100%
(continued over)
615Twin Research and Human Genetics August 2007
Zygosity Testing Using SNPs
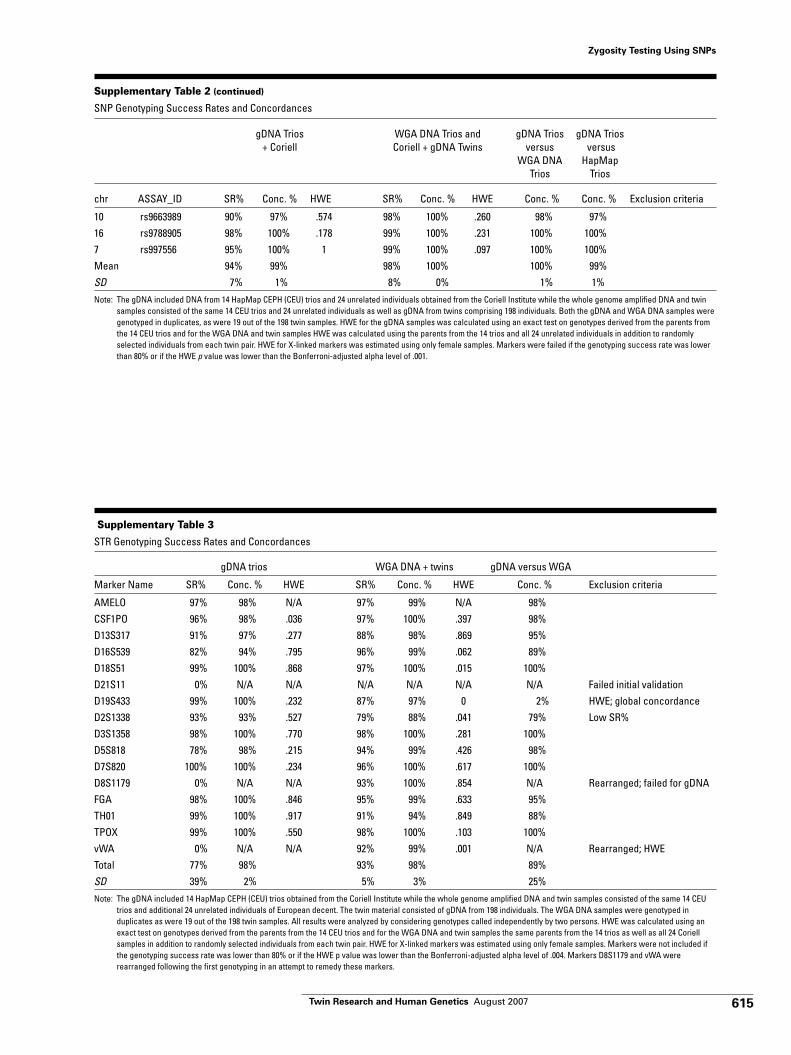
Supplementary Table 2 (continued)
SNP Genotyping Success Rates and Concordances
gDNA Trios WGA DNA Trios and gDNA Trios gDNA Trios+ Coriell Coriell + gDNA Twins versus versus
WGA DNA HapMap Trios Trios
chr ASSAY_ID SR% Conc. % HWE SR% Conc. % HWE Conc. % Conc. % Exclusion criteria
10 rs9663989 90% 97% .574 98% 100% .260 98% 97%16 rs9788905 98% 100% .178 99% 100% .231 100% 100%7 rs997556 95% 100% 1 99% 100% .097 100% 100%Mean 94% 99% 98% 100% 100% 99%SD 7% 1% 8% 0% 1% 1%
Note: The gDNA included DNA from 14 HapMap CEPH (CEU) trios and 24 unrelated individuals obtained from the Coriell Institute while the whole genome amplified DNA and twinsamples consisted of the same 14 CEU trios and 24 unrelated individuals as well as gDNA from twins comprising 198 individuals. Both the gDNA and WGA DNA samples weregenotyped in duplicates, as were 19 out of the 198 twin samples. HWE for the gDNA samples was calculated using an exact test on genotypes derived from the parents fromthe 14 CEU trios and for the WGA DNA and twin samples HWE was calculated using the parents from the 14 trios and all 24 unrelated individuals in addition to randomlyselected individuals from each twin pair. HWE for X-linked markers was estimated using only female samples. Markers were failed if the genotyping success rate was lowerthan 80% or if the HWE p value was lower than the Bonferroni-adjusted alpha level of .001.
Supplementary Table 3
STR Genotyping Success Rates and Concordances
gDNA trios WGA DNA + twins gDNA versus WGA
Marker Name SR% Conc. % HWE SR% Conc. % HWE Conc. % Exclusion criteria
AMELO 97% 98% N/A 97% 99% N/A 98%CSF1PO 96% 98% .036 97% 100% .397 98%D13S317 91% 97% .277 88% 98% .869 95%D16S539 82% 94% .795 96% 99% .062 89%D18S51 99% 100% .868 97% 100% .015 100%D21S11 0% N/A N/A N/A N/A N/A N/A Failed initial validationD19S433 99% 100% .232 87% 97% 0 2% HWE; global concordanceD2S1338 93% 93% .527 79% 88% .041 79% Low SR%D3S1358 98% 100% .770 98% 100% .281 100%D5S818 78% 98% .215 94% 99% .426 98%D7S820 100% 100% .234 96% 100% .617 100%D8S1179 0% N/A N/A 93% 100% .854 N/A Rearranged; failed for gDNAFGA 98% 100% .846 95% 99% .633 95%TH01 99% 100% .917 91% 94% .849 88%TPOX 99% 100% .550 98% 100% .103 100%vWA 0% N/A N/A 92% 99% .001 N/A Rearranged; HWETotal 77% 98% 93% 98% 89%SD 39% 2% 5% 3% 25%
Note: The gDNA included 14 HapMap CEPH (CEU) trios obtained from the Coriell Institute while the whole genome amplified DNA and twin samples consisted of the same 14 CEUtrios and additional 24 unrelated individuals of European decent. The twin material consisted of gDNA from 198 individuals. The WGA DNA samples were genotyped in duplicates as were 19 out of the 198 twin samples. All results were analyzed by considering genotypes called independently by two persons. HWE was calculated using anexact test on genotypes derived from the parents from the 14 CEU trios and for the WGA DNA and twin samples the same parents from the 14 trios as well as all 24 Coriellsamples in addition to randomly selected individuals from each twin pair. HWE for X-linked markers was estimated using only female samples. Markers were not included ifthe genotyping success rate was lower than 80% or if the HWE p value was lower than the Bonferroni-adjusted alpha level of .004. Markers D8S1179 and vWA wererearranged following the first genotyping in an attempt to remedy these markers.
616 Twin Research and Human Genetics August 2007
Ulf Hannelius et al.
Sup
plem
enta
ry T
able
4
SNP
Geno
typi
ng S
ucce
ss R
ates
and
Con
cord
ance
s fo
r Diff
eren
t DN
A Te
mpl
ates
Repl
ig fi
lter
Repl
ig s
aliv
aRe
plig
wb
Pool
ed re
plig
gDN
A fil
ter
gDN
A sa
liva
gDN
A w
bPo
oled
gDN
APo
oled
all
ASSA
Y_ID
SR%
Conc
.%SR
%Co
nc.%
SR%
Conc
.%Co
nc.%
SR%
Conc
.%SR
%Co
nc.%
SR%
Conc
.%Co
nc.%
Conc
.%
AMEL
XY96
%10
0%79
%10
0%86
%10
0%10
0%71
%88
%92
%10
0%91
%10
0%97
%98
%rs
1020
636
100%
100%
100%
100%
100%
100%
100%
81%
100%
96%
100%
100%
100%
100%
100%
rs11
1136
696
%10
0%88
%10
0%82
%10
0%10
0%58
%10
0%83
%10
0%95
%10
0%10
0%10
0%rs
1124
9784
100%
100%
88%
100%
95%
100%
100%
54%
100%
88%
100%
100%
100%
100%
100%
rs11
7069
6210
0%10
0%10
0%10
0%95
%10
0%10
0%54
%10
0%88
%10
0%10
0%10
0%10
0%10
0%rs
1361
861
100%
100%
100%
100%
95%
100%
100%
54%
100%
88%
100%
100%
100%
100%
100%
rs14
0329
488
%10
0%88
%10
0%95
%10
0%10
0%81
%10
0%83
%10
0%91
%10
0%10
0%10
0%rs
1479
530
100%
100%
100%
100%
91%
91%
97%
67%
100%
96%
100%
100%
100%
100%
98%
rs15
0009
810
0%10
0%10
0%10
0%10
0%10
0%10
0%75
%10
0%10
0%10
0%10
0%10
0%10
0%10
0%rs
1620
329
100%
100%
96%
100%
100%
100%
100%
76%
100%
96%
100%
100%
100%
100%
100%
rs16
7413
910
0%10
0%96
%10
0%95
%10
0%10
0%71
%86
%96
%10
0%10
0%10
0%97
%98
%rs
1737
996
%10
0%96
%10
0%91
%10
0%10
0%71
%10
0%92
%10
0%91
%10
0%10
0%10
0%rs
1740
792
%10
0%88
%10
0%10
0%10
0%10
0%67
%10
0%92
%10
0%10
0%10
0%10
0%10
0%rs
1860
665
100%
100%
100%
100%
100%
100%
100%
71%
100%
92%
100%
100%
100%
100%
100%
rs18
9469
710
0%10
0%96
%10
0%10
0%10
0%10
0%54
%10
0%92
%10
0%10
0%10
0%10
0%10
0%rs
1924
609
100%
100%
100%
100%
86%
100%
100%
83%
91%
92%
100%
100%
100%
97%
98%
rs22
288
%10
0%88
%10
0%95
%10
0%10
0%46
%10
0%83
%10
0%95
%10
0%10
0%10
0%rs
2280
4396
%10
0%10
0%10
0%95
%10
0%10
0%83
%10
0%88
%10
0%95
%10
0%10
0%10
0%rs
2282
739
100%
100%
100%
100%
100%
100%
100%
81%
100%
92%
100%
100%
100%
100%
100%
rs22
8910
583
%10
0%96
%10
0%86
%10
0%10
0%58
%10
0%88
%10
0%95
%10
0%10
0%10
0%rs
230
92%
100%
88%
100%
91%
100%
100%
42%
100%
92%
100%
100%
100%
100%
100%
rs23
0302
596
%10
0%96
%10
0%86
%10
0%10
0%83
%10
0%88
%10
0%10
0%10
0%10
0%10
0%rs
234
92%
100%
92%
100%
82%
100%
100%
75%
100%
79%
100%
86%
100%
100%
100%
rs24
010
0%10
0%10
0%10
0%10
0%10
0%10
0%54
%80
%92
%10
0%10
0%10
0%96
%98
%rs
2769
2288
%10
0%96
%10
0%95
%10
0%10
0%46
%10
0%83
%91
%10
0%10
0%96
%98
%rs
3264
1496
%10
0%10
0%10
0%10
0%10
0%10
0%76
%10
0%10
0%10
0%10
0%10
0%10
0%10
0%rs
3784
740
92%
100%
88%
100%
86%
100%
100%
50%
100%
83%
100%
91%
100%
100%
100%
rs42
4086
892
%10
0%10
0%10
0%86
%10
0%10
0%54
%10
0%88
%10
0%10
0%10
0%10
0%10
0%rs
4306
954
96%
100%
83%
100%
91%
100%
100%
81%
100%
96%
100%
100%
100%
100%
100%
rs43
5871
710
0%10
0%96
%10
0%95
%10
0%10
0%63
%83
%88
%10
0%10
0%10
0%96
%98
%rs
4763
188
92%
100%
83%
100%
95%
100%
100%
43%
N/A
100%
100%
100%
100%
100%
100%
rs54
4021
96%
100%
92%
100%
91%
100%
100%
76%
100%
75%
88%
82%
100%
95%
98%
(con
tinue
d ov
er)
617Twin Research and Human Genetics August 2007
Zygosity Testing Using SNPs
Sup
plem
enta
ry T
able
4 (c
onti
nued
)
SNP
Geno
typi
ng S
ucce
ss R
ates
and
Con
cord
ance
s fo
r Diff
eren
t DN
A Te
mpl
ates
Repl
ig fi
lter
Repl
ig s
aliv
aRe
plig
wb
Pool
ed re
plig
gDN
A fil
ter
gDN
A sa
liva
gDN
A w
bPo
oled
gDN
APo
oled
all
ASSA
Y_ID
SR%
Conc
.%SR
%Co
nc.%
SR%
Conc
.%Co
nc.%
SR%
Conc
.%SR
%Co
nc.%
SR%
Conc
.%Co
nc.%
Conc
.%rs
6115
100%
100%
100%
100%
95%
100%
100%
75%
100%
92%
100%
100%
100%
100%
100%
rs67
7137
996
%10
0%96
%10
0%95
%10
0%10
0%67
%88
%88
%10
0%10
0%10
0%97
%98
%rs
7108
9179
%10
0%92
%10
0%86
%10
0%10
0%67
%10
0%83
%10
0%95
%10
0%10
0%10
0%rs
7247
8488
%10
0%10
0%10
0%95
%10
0%10
0%71
%10
0%88
%10
0%10
0%10
0%10
0%10
0%rs
754
96%
100%
92%
100%
100%
100%
100%
86%
100%
96%
100%
100%
100%
100%
100%
rs79
9436
583
%10
0%96
%10
0%10
0%10
0%10
0%38
%10
0%83
%91
%10
0%10
0%96
%98
%rs
811
100%
100%
100%
100%
100%
100%
100%
79%
100%
92%
100%
100%
100%
100%
100%
rs82
0129
100%
100%
100%
100%
91%
91%
97%
57%
75%
96%
100%
100%
100%
96%
97%
rs87
4746
96%
100%
100%
100%
100%
100%
100%
62%
100%
92%
100%
100%
100%
100%
100%
rs88
2937
100%
100%
100%
100%
91%
91%
97%
67%
100%
92%
100%
100%
100%
100%
98%
rs88
9012
88%
100%
96%
100%
100%
100%
100%
76%
100%
88%
100%
100%
100%
100%
100%
rs91
0170
100%
100%
100%
100%
95%
100%
100%
79%
100%
88%
100%
100%
100%
100%
100%
rs96
6398
988
%10
0%88
%10
0%82
%10
0%10
0%57
%10
0%83
%10
0%10
0%10
0%10
0%10
0%rs
9788
905
100%
100%
100%
100%
100%
100%
100%
81%
100%
92%
100%
100%
100%
100%
100%
rs99
7556
92%
92%
92%
100%
95%
100%
97%
67%
100%
79%
100%
91%
100%
100%
98%
Tota
l95
%10
0%95
%10
0%94
%99
%10
0%66
%97
%89
%99
%98
%10
0%99
%99
%SD
6%1%
6%0%
6%2%
1%13
%6%
6%3%
4%0%
2%1%
Not
e:Ge
nom
ic D
NA
(gDN
A) a
nd w
hole
gen
ome
ampl
ified
DN
A (W
GA D
NA)
ext
ract
ed fr
om w
hole
blo
od, s
aliv
a an
d bl
ood
on fi
lter p
aper
obt
aine
d fro
m 1
1 un
rela
ted
indi
vidu
als
wer
e ge
noty
ped
in d
uplic
ate
usin
g 47
SN
P m
arke
rs.
618 Twin Research and Human Genetics August 2007
Ulf Hannelius et al.
Sup
plem
enta
ry T
able
5
Zygo
sity
Ass
ignm
ents
SNP
Resu
ltsST
R Re
sults
Pair
Prev
ious
ly
Twin
1Tw
in 2
Sex
Sex
Shar
ed
Mis
sing
Pe
r cen
t Od
dsSe
x Se
x Sh
ared
M
issi
ng
Per c
ent
Odds
#
assi
gned
twin
1tw
in 2
alle
les
mar
kers
shar
ed(M
Z vs
DZ)
twin
1tw
in 2
alle
les
mar
kers
shar
ed(M
Z vs
DZ)
11
z000
6001
0z0
0060
018
MM
920
100%
4.84
E+08
MM
220
100%
3.56
E+04
21
z000
6002
8z0
0060
055
FF
920
100%
5.12
E+08
FF
220
100%
3.78
E+04
31
z000
6004
9z0
0060
108
FF
901
100%
1.49
E+08
FF
201
100%
1.52
E+04
41
z000
6006
0z0
0060
660
FF
920
100%
1.37
E+08
FF
220
100%
6.62
E+04
51
z000
6007
9z0
0060
436
MM
920
100%
2.78
E+08
MM
220
100%
9.56
E+04
61
z000
6010
6z0
0060
115
FF
920
100%
3.34
E+08
FF
220
100%
2.59
E+04
71
z000
6011
8z0
0060
129
FF
920
100%
6.79
E+08
FF
220
100%
2.38
E+04
81
z000
6012
1z0
0060
711
MM
920
100%
2.74
E+08
MM
220
100%
6.69
E+04
91
z000
6012
7z0
0060
247
FF
920
100%
1.74
E+08
FF
220
100%
7.24
E+04
101
z000
6013
5z0
0071
825
MM
920
100%
3.98
E+08
MM
220
100%
2.44
E+04
111
z000
6014
4z0
0060
190
MM
760
83%
1.42
E-15
?M
140
64%
5.43
E-15
121
z000
6015
1z0
0060
250
FF
920
100%
3.03
E+08
FF
220
100%
3.17
E+04
131
z000
6016
3z0
0060
460
MM
920
100%
1.38
E+08
MM
220
100%
3.45
E+04
141
z000
6016
9z0
0060
193
FF
920
100%
1.36
E+08
FF
220
100%
3.82
E+04
151
z000
6018
4z0
0060
617
MM
920
100%
2.05
E+08
MM
220
100%
2.20
E+04
161
z000
6019
9z0
0060
231
MM
901
100%
9.82
E+08
M?
125
100%
2.92
E+02
171
z000
6024
3z0
0060
256
FF
920
100%
2.58
E+08
?F
125
100%
4.46
E+02
181
z000
6026
1z0
0060
306
MM
920
100%
6.85
E+08
MM
201
100%
9.60
E+03
191
z000
6026
5z0
0060
862
FF
920
100%
3.74
E+08
FF
210
95%
3.84
E+00
201
z000
6027
7z0
0060
942
FF
920
100%
2.43
E+08
FF
220
100%
2.67
E+04
211
z000
6028
0z0
0060
401
MM
920
100%
2.79
E+08
MM
220
100%
3.51
E+04
221
z000
6028
5z0
0060
898
MM
920
100%
2.46
E+08
MM
220
100%
3.44
E+04
231
z000
6028
9z0
0060
292
FF
901
100%
3.36
E+08
FF
220
100%
6.81
E+04
241
z000
6029
7z0
0060
526
FF
920
100%
3.67
E+08
FF
210
95%
2.80
E+03
251
z000
6030
3z0
0060
367
FF
920
100%
2.29
E+08
FF
201
100%
8.20
E+03
261
z000
6031
0z0
0060
321
FF
920
100%
3.43
E+08
FF
220
100%
8.11
E+04
271
z000
6035
1z0
0060
517
FF
901
100%
2.39
E+08
FF
220
100%
3.92
E+04
281
z000
6035
4z0
0060
443
FF
882
100%
6.85
E+07
F?
125
100%
1.75
E+02
291
z000
6039
1z0
0060
581
FF
920
100%
1.01
E+08
FF
220
100%
2.96
E+04
301
z000
6039
4z0
0069
401
FF
901
100%
1.97
E+08
FF
182
100%
3.52
E+03
311
z000
6040
7z0
0060
532
MM
920
100%
1.56
E+08
MM
191
95%
1.02
E+03
321
z000
6044
8z0
0069
415
FF
920
100%
7.39
E+08
FF
220
100%
3.32
E+04
341
z000
6047
9z0
0060
491
MM
863
100%
7.31
E+07
MM
220
100%
3.74
E+04
351
z000
6049
7z0
0060
732
MM
920
100%
4.41
E+08
MM
144
100%
1.27
E+03
(con
tinue
d ov
er)
619Twin Research and Human Genetics August 2007
Zygosity Testing Using SNPs
Sup
plem
enta
ry T
able
5
Zygo
sity
Ass
ignm
ents
SNP
Resu
ltsST
R Re
sults
Pair
Prev
ious
ly
Twin
1Tw
in 2
Sex
Sex
Shar
ed
Mis
sing
Pe
r cen
t Od
dsSe
x Se
x Sh
ared
M
issi
ng
Per c
ent
Odds
#
assi
gned
twin
1tw
in 2
alle
les
mar
kers
shar
ed(M
Z vs
DZ)
twin
1tw
in 2
alle
les
mar
kers
shar
ed(M
Z vs
DZ)
361
z000
6050
0z0
0060
978
FF
920
100%
3.74
E+08
FF
201
100%
1.45
E+04
371
z000
6051
4z0
0071
334
MM
920
100%
5.04
E+08
MM
220
100%
5.76
E+04
381
z000
6054
1z0
0060
593
MM
901
100%
1.41
E+08
MM
220
100%
4.01
E+04
391
z000
6055
6z0
0060
901
MM
920
100%
2.59
E+08
MM
201
100%
3.48
E+04
401
z000
6060
5z0
0060
921
MM
920
100%
3.24
E+08
MM
201
100%
8.29
E+03
411
z000
6072
9z0
0060
736
FF
920
100%
3.53
E+08
FF
210
95%
2.84
E+01
421
z000
6074
5z0
0069
687
MM
841
80%
1.16
E-02
M?
105
83%
2.56
E-02
431
z000
6077
8z0
0064
680
MM
901
100%
3.69
E+08
MM
201
100%
2.02
E+04
441
z000
6084
7z0
0069
668
FF
920
100%
4.27
E+08
FF
220
100%
6.87
E+04
451
z000
6087
4z0
0069
569
MM
920
100%
5.33
E+08
MM
201
100%
1.08
E+04
461
z000
6872
4z0
0068
730
FF
920
100%
4.54
E+08
FF
144
100%
1.21
E+03
471
z000
6946
6z0
0071
184
MM
920
100%
1.39
E+08
MM
201
100%
1.43
E+04
481
z000
6995
1z0
0069
953
FF
920
100%
5.33
E+08
FF
182
100%
6.88
E+03
491
z000
6997
7z0
0070
002
FF
920
100%
9.72
E+08
FF
220
100%
2.50
E+04
501
z000
7218
1z0
0072
186
FF
920
100%
3.00
E+08
FF
220
100%
2.58
E+04
512
z000
6013
3z0
0060
440
FF
750
82%
8.03
E-16
FF
120
55%
5.20
E-17
522
z000
6021
7z0
0060
325
FF
750
82%
8.04
E-15
FF
170
77%
9.99
E-08
532
z000
6031
5z0
0060
337
MM
700
76%
3.58
E-24
?M
170
77%
5.78
E-10
542
z000
6034
5z0
0069
187
MM
780
85%
5.32
E-11
MM
141
70%
1.06
E-09
552
z000
6036
4z0
0060
535
MM
750
82%
1.06
E-17
MM
150
68%
9.69
E-15
562
z000
6041
3z0
0060
415
FF
790
86%
1.65
E-09
FF
151
75%
8.26
E-11
572
z000
6042
1z0
0060
430
FF
740
80%
7.54
E-19
F?
75
58%
6.22
E-08
582
z000
6046
3z0
0060
538
FF
770
84%
7.15
E-15
FF
160
73%
4.56
E-08
592
z000
6046
6z0
0060
811
MM
740
80%
3.31
E-18
MM
160
73%
2.18
E-10
602
z000
6047
0z0
0072
238
FF
790
86%
6.14
E-10
FF
105
83%
1.62
E-04
612
z000
6048
4z0
0060
502
MM
671
74%
4.62
E-24
MM
171
85%
1.18
E-02
622
z000
6050
6z0
0060
548
MM
810
88%
7.24
E-08
?M
210
100%
2.70
E+00
632
z000
6052
0z0
0069
476
FF
691
77%
4.16
E-23
FF
140
64%
6.93
E-19
642
z000
6055
9z0
0060
596
FF
760
83%
9.50
E-15
FF
141
70%
3.02
E-07
652
z000
6072
3z0
0060
870
FF
731
81%
3.42
E-16
FF
171
85%
6.44
E-03
662
z000
6081
6z0
0071
060
FF
730
79%
1.16
E-19
FF
85
67%
7.24
E-09
672
z000
6082
8z0
0069
200
FF
790
86%
1.59
E-09
?F
140
64%
1.58
E-14
682
z000
6086
8z0
0071
168
MM
711
79%
5.57
E-21
MM
190
86%
5.37
E-05
692
z000
6089
4z0
0069
223
MM
650
71%
1.32
E-23
N/A
N/A
N/A
N/A
N/A
N/A (con
tinue
d ov
er)
620 Twin Research and Human Genetics August 2007
Ulf Hannelius et al.
Sup
plem
enta
ry T
able
5
Zygo
sity
Ass
ignm
ents
SNP
Resu
ltsST
R Re
sults
Pair
Prev
ious
ly
Twin
1Tw
in 2
Sex
Sex
Shar
ed
Mis
sing
Pe
r cen
t Od
dsSe
x Se
x Sh
ared
M
issi
ng
Per c
ent
Odds
#
assi
gned
twin
1tw
in 2
alle
les
mar
kers
shar
ed(M
Z vs
DZ)
twin
1tw
in 2
alle
les
mar
kers
shar
ed(M
Z vs
DZ)
702
z000
6922
0z0
0069
445
FF
761
84%
1.55
E-12
FF
131
65%
2.25
E-12
712
z000
6950
5z0
0069
785
FF
810
88%
5.13
E-07
FF
151
75%
1.09
E-06
722
z000
6979
7z0
0071
786
MM
700
76%
2.06
E-21
MM
141
70%
3.83
E-10
732
z000
6989
4z0
0075
908
MM
920
100%
8.59
E+08
MM
220
100%
4.97
E+04
742
z000
7111
7z0
0071
235
MM
780
85%
1.71
E-12
MM
171
85%
2.56
E-03
752
z000
7113
0z0
0071
178
FF
750
82%
5.94
E-16
FF
140
64%
4.89
E-18
764
z000
6006
7z0
0072
453
FM
770
84%
1.20
E-06
FM
180
82%
3.13
E-03
774
z000
6006
9z0
0060
819
MF
700
76%
4.24
E-20
MF
151
75%
5.10
E-06
784
z000
6008
2z0
0060
201
FM
780
85%
9.69
E-08
FM
160
73%
1.62
E-06
794
z000
6008
8z0
0060
100
FM
710
77%
1.28
E-21
FM
180
82%
8.14
E-07
804
z000
6016
0z0
0060
684
MF
720
78%
3.20
E-14
MF
84
57%
1.61
E-09
814
z000
6016
6z0
0071
765
FM
770
84%
6.52
E-14
FM
170
77%
1.31
E-10
824
z000
6021
4z0
0071
877
FM
661
73%
8.54
E-22
FM
130
59%
1.08
E-18
834
z000
6021
9z0
0069
535
MF
740
80%
1.34
E-17
MF
160
73%
2.65
E-10
844
z000
6023
5z0
0060
853
MF
740
80%
1.57
E-14
MF
160
73%
2.41
E-10
854
z000
6030
0z0
0060
599
FM
730
79%
3.10
E-14
FM
160
73%
4.67
E-09
864
z000
6031
8z0
0069
674
MF
730
79%
4.85
E-17
MF
140
64%
4.72
E-12
874
z000
6034
3z0
0060
703
FM
760
83%
5.21
E-12
FM
190
86%
1.53
E-02
884
z000
6038
8z0
0060
693
FM
681
76%
1.93
E-26
FM
150
68%
1.32
E-14
894
z000
6042
4z0
0069
469
FM
720
78%
5.14
E-19
FM
150
68%
5.98
E-16
904
z000
6045
7z0
0069
683
FM
670
73%
6.25
E-29
FM
130
59%
8.76
E-17
914
z000
6060
7z0
0072
229
MF
660
72%
1.09
E-28
MF
150
68%
6.85
E-14
924
z000
6061
4z0
0076
166
MF
710
77%
6.32
E-18
MF
170
77%
2.86
E-11
934
z000
6064
8z0
0060
982
MF
3724
84%
3.34
E-07
MF
151
75%
7.56
E-09
944
z000
6080
4z0
0070
050
FM
720
78%
1.05
E-17
FM
131
65%
2.18
E-14
954
z000
6085
0z0
0068
776
FM
710
77%
1.63
E-20
FM
130
59%
8.71
E-17
964
z000
6096
1z0
0072
223
MF
770
84%
2.66
E-10
MF
112
61%
1.55
E-13
974
z000
6918
5z0
0069
208
FM
780
85%
2.69
E-11
FM
180
82%
7.21
E-07
984
z000
6948
4z0
0069
547
FM
710
77%
4.37
E-17
FM
140
64%
2.23
E-12
994
z000
7113
5z0
0072
328
FM
690
75%
1.09
E-22
FM
131
65%
1.45
E-11
Not
e:Pr
evio
usly
ass
igne
d zy
gosi
ties
are
code
d as
1) M
onoz
ygot
ic, 2
) sam
e se
x di
zygo
tic a
nd 4
) diff
eren
t sex
dizy
gotic
. The
odd
s of
the
likel
ihoo
ds o
f a tw
in p
air b
eing
MZ
vers
us D
Z ar
e ca
lcul
ated
usi
ng E
CLIP
SE2
and
a pr
ior g
enot
ypin
g er
ror o
f 1%
. Pai
rs 6
2 an
d69
faile
d th
e ST
R ge
noty
ping
, and
pai
r 42
faile
d th
e SN
P ge
noty
ping
. Pai
rs 1
1 an
d 73
gav
e co
nflic
ting
resu
lts w
hen
com
parin
g to
pre
viou
sly
assi
gned
zygo
sitie
s.
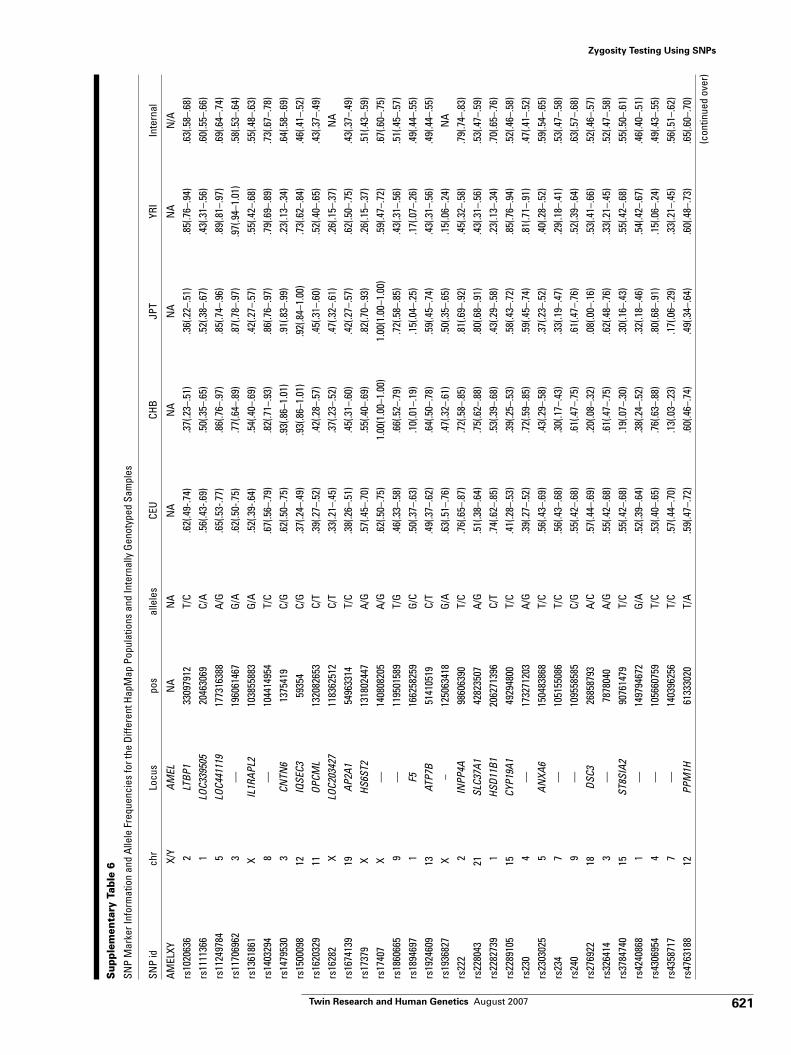
621Twin Research and Human Genetics August 2007
Zygosity Testing Using SNPs
Sup
plem
enta
ry T
able
6
SNP
Mar
ker I
nfor
mat
ion
and
Alle
le F
requ
enci
es fo
r the
Diff
eren
t Hap
Map
Pop
ulat
ions
and
Inte
rnal
ly G
enot
yped
Sam
ples
SNP
idch
rLo
cus
pos
alle
les
CEU
CHB
JPT
YRI
Inte
rnal
AMEL
XYX/
YAM
ELN
AN
AN
AN
AN
AN
AN
/Ars
1020
636
2LT
BP1
3309
7912
T/C
.62(
.49-
.74)
.37(
.23–
.51)
.36(
.22–
.51)
.85(
.76–
.94)
.63(
.58–
.68)
rs11
1136
61
LOC3
3950
520
4630
69C/
A.5
6(.4
3-.6
9).5
0(.3
5–.6
5).5
2(.3
8–.6
7).4
3(.3
1–.5
6).6
0(.5
5–.6
6)rs
1124
9784
5LO
C441
119
1773
1638
8A/
G.6
5(.5
3-.7
7).8
6(.7
6–.9
7).8
5(.7
4–.9
6).8
9(.8
1–.9
7).6
9(.6
4–.7
4)rs
1170
6962
3—
1960
6146
7G/
A.6
2(.5
0-.7
5).7
7(.6
4–.8
9).8
7(.7
8–.9
7).9
7(.9
4–1.
01)
.58(
.53–
.64)
rs13
6186
1X
IL1R
APL2
1038
5588
3G/
A.5
2(.3
9-.6
4).5
4(.4
0–.6
9).4
2(.2
7–.5
7).5
5(.4
2–.6
8).5
5(.4
8–.6
3)rs
1403
294
8—
1044
1495
4T/
C.6
7(.5
6–.7
9).8
2(.7
1–.9
3).8
6(.7
6–.9
7).7
9(.6
9–.8
9).7
3(.6
7–.7
8)rs
1479
530
3CN
TN6
1375
419
C/G
.62(
.50–
.75)
.93(
.86–
1.01
).9
1(.8
3–.9
9).2
3(.1
3–.3
4).6
4(.5
8–.6
9)rs
1500
098
12IQ
SEC3
5935
4C/
G.3
7(.2
4–.4
9).9
3(.8
6–1.
01)
.92(
.84–
1.00
).7
3(.6
2–.8
4).4
6(.4
1–.5
2)rs
1620
329
11OP
CML
1320
8265
3C/
T.3
9(.2
7–.5
2).4
2(.2
8–.5
7).4
5(.3
1–.6
0).5
2(.4
0–.6
5).4
3(.3
7–.4
9)rs
1628
2X
LOC2
0342
711
8362
512
C/T
.33(
.21–
.45)
.37(
.23–
.52)
.47(
.32–
.61)
.26(
.15–
.37)
NA
rs16
7413
919
AP2A
154
9633
14T/
C.3
8(.2
6–.5
1).4
5(.3
1–.6
0).4
2(.2
7–.5
7).6
2(.5
0–.7
5).4
3(.3
7–.4
9)rs
1737
9X
HS6S
T213
1802
447
A/G
.57(
.45–
.70)
.55(
.40–
.69)
.82(
.70–
.93)
.26(
.15–
.37)
.51(
.43–
.59)
rs17
407
X—
1408
0820
5A/
G.6
2(.5
0–.7
5)1.
00(1
.00–
1.00
)1.
00(1
.00–
1.00
).5
9(.4
7–.7
2).6
7(.6
0–.7
5)rs
1860
665
9—
1195
0158
9T/
G.4
6(.3
3–.5
8).6
6(.5
2–.7
9).7
2(.5
8–.8
5).4
3(.3
1–.5
6).5
1(.4
5–.5
7)rs
1894
697
1F5
1662
5825
9G/
C.5
0(.3
7–.6
3).1
0(.0
1–.1
9).1
5(.0
4–.2
5).1
7(.0
7–.2
6).4
9(.4
4–.5
5)rs
1924
609
13AT
P7B
5141
0519
C/T
.49(
.37–
.62)
.64(
.50–
.78)
.59(
.45–
.74)
.43(
.31–
.56)
.49(
.44–
.55)
rs19
3682
7X
–12
5063
418
G/A
.63(
.51–
.76)
.47(
.32–
.61)
.50(
.35–
.65)
.15(
.06–
.24)
NA
rs22
22
INPP
4A98
6063
90T/
C.7
6(.6
5–.8
7).7
2(.5
8–.8
5).8
1(.6
9–.9
2).4
5(.3
2–.5
8).7
9(.7
4–.8
3)rs
2280
4321
SLC3
7A1
4282
3507
A/G
.51(
.38–
.64)
.75(
.62–
.88)
.80(
.68–
.91)
.43(
.31–
.56)
.53(
.47–
.59)
rs22
8273
91
HSD1
1B1
2062
7139
6C/
T.7
4(.6
2–.8
5).5
3(.3
9–.6
8).4
3(.2
9–.5
8).2
3(.1
3–.3
4).7
0(.6
5–.7
6)rs
2289
105
15CY
P19A
149
2948
00T/
C.4
1(.2
8–.5
3).3
9(.2
5–.5
3).5
8(.4
3–.7
2).8
5(.7
6–.9
4).5
2(.4
6–.5
8)rs
230
4—
1732
7120
3A/
G.3
9(.2
7–.5
2).7
2(.5
9–.8
5).5
9(.4
5–.7
4).8
1(.7
1–.9
1).4
7(.4
1–.5
2)rs
2303
025
5AN
XA6
1504
8386
8T/
C.5
6(.4
3–.6
9).4
3(.2
9–.5
8).3
7(.2
3–.5
2).4
0(.2
8–.5
2).5
9(.5
4–.6
5)rs
234
7—
1051
5508
6T/
C.5
6(.4
3–.6
8).3
0(.1
7–.4
3).3
3(.1
9–.4
7).2
9(.1
8–.4
1).5
3(.4
7–.5
8)rs
240
9—
1095
5858
5C/
G.5
5(.4
2–.6
8).6
1(.4
7–.7
5).6
1(.4
7–.7
6).5
2(.3
9–.6
4).6
3(.5
7–.6
8)rs
2769
2218
DSC3
2685
8793
A/C
.57(
.44–
.69)
.20(
.08–
.32)
.08(
.00–
.16)
.53(
.41–
.66)
.52(
.46–
.57)
rs32
6414
3—
7878
040
A/G
.55(
.42–
.68)
.61(
.47–
.75)
.62(
.48–
.76)
.33(
.21–
.45)
.52(
.47–
.58)
rs37
8474
015
ST8S
IA2
9076
1479
T/C
.55(
.42–
.68)
.19(
.07–
.30)
.30(
.16–
.43)
.55(
.42–
.68)
.55(
.50–
.61)
rs42
4086
81
—14
9794
672
G/A
.52(
.39–
.64)
.38(
.24–
.52)
.32(
.18–
.46)
.54(
.42–
.67)
.46(
.40–
.51)
rs43
0695
44
—10
5660
759
T/C
.53(
.40–
.65)
.76(
.63–
.88)
.80(
.68–
.91)
.15(
.06–
.24)
.49(
.43–
.55)
rs43
5871
77
—14
0396
256
T/C
.57(
.44–
.70)
.13(
.03–
.23)
.17(
.06–
.29)
.33(
.21–
.45)
.56(
.51–
.62)
rs47
6318
812
PPM
1H61
3330
20T/
A.5
9(.4
7–.7
2).6
0(.4
6–.7
4).4
9(.3
4–.6
4).6
0(.4
8–.7
3).6
5(.6
0–.7
0)
(con
tinue
d ov
er)
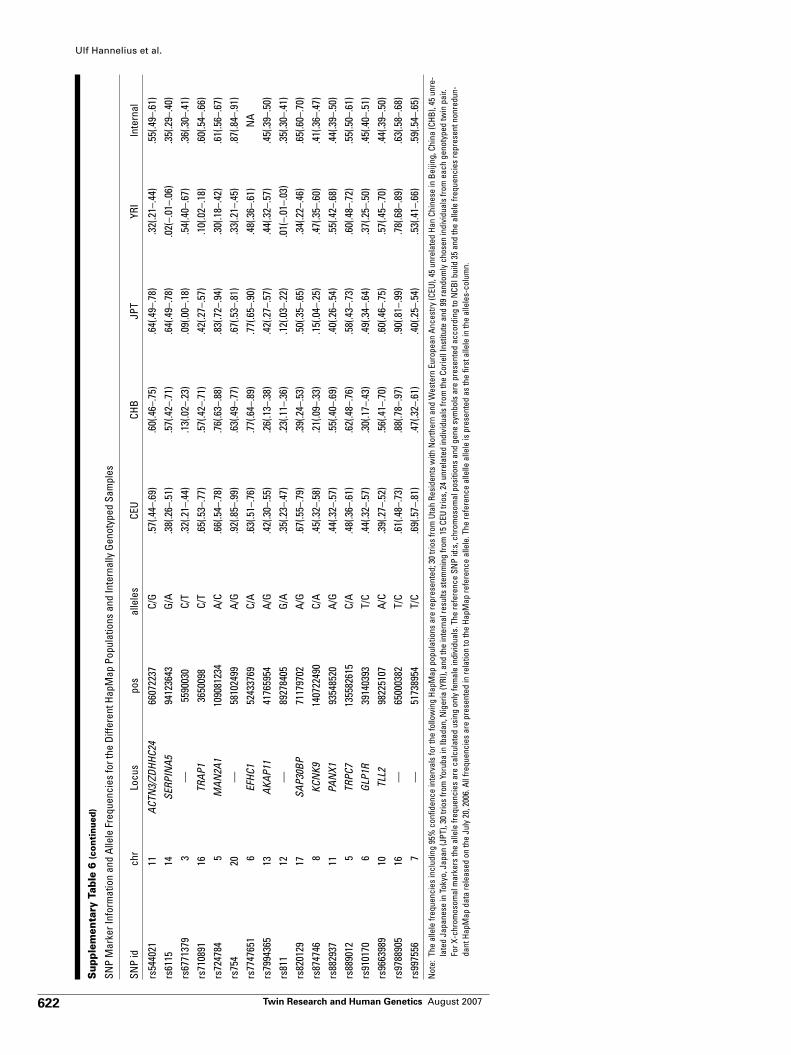
622 Twin Research and Human Genetics August 2007
Ulf Hannelius et al.
Sup
plem
enta
ry T
able
6 (c
onti
nued
)
SNP
Mar
ker I
nfor
mat
ion
and
Alle
le F
requ
enci
es fo
r the
Diff
eren
t Hap
Map
Pop
ulat
ions
and
Inte
rnal
ly G
enot
yped
Sam
ples
SNP
idch
rLo
cus
pos
alle
les
CEU
CHB
JPT
YRI
Inte
rnal
rs54
4021
11AC
TN3/
ZDHH
C24
6607
2237
C/G
.57(
.44–
.69)
.60(
.46–
.75)
.64(
.49–
.78)
.32(
.21–
.44)
.55(
.49–
.61)
rs61
1514
SERP
INA5
9412
3643
G/A
.38(
.26–
.51)
.57(
.42–
.71)
.64(
.49–
.78)
.02(
–.01
–.06
).3
5(.2
9–.4
0)rs
6771
379
3—
5590
030
C/T
.32(
.21–
.44)
.13(
.02–
.23)
.09(
.00–
.18)
.54(
.40–
.67)
.36(
.30–
.41)
rs71
0891
16TR
AP1
3650
098
C/T
.65(
.53–
.77)
.57(
.42–
.71)
.42(
.27–
.57)
.10(
.02–
.18)
.60(
.54–
.66)
rs72
4784
5M
AN2A
110
9081
234
A/C
.66(
.54–
.78)
.76(
.63–
.88)
.83(
.72–
.94)
.30(
.18–
.42)
.61(
.56–
.67)
rs75
420
—58
1024
99A/
G.9
2(.8
5–.9
9).6
3(.4
9–.7
7).6
7(.5
3–.8
1).3
3(.2
1–.4
5).8
7(.8
4–.9
1)rs
7747
651
6EF
HC1
5243
3769
C/A
.63(
.51–
.76)
.77(
.64–
.89)
.77(
.65–
.90)
.48(
.36–
.61)
NA
rs79
9436
513
AKAP
1141
7659
54A/
G.4
2(.3
0–.5
5).2
6(.1
3–.3
8).4
2(.2
7–.5
7).4
4(.3
2–.5
7).4
5(.3
9–.5
0)rs
811
12—
8927
8405
G/A
.35(
.23–
.47)
.23(
.11–
.36)
.12(
.03–
.22)
.01(
–.01
–.03
).3
5(.3
0–.4
1)rs
8201
2917
SAP3
0BP
7117
9702
A/G
.67(
.55–
.79)
.39(
.24–
.53)
.50(
.35–
.65)
.34(
.22–
.46)
.65(
.60–
.70)
rs87
4746
8KC
NK9
1407
2249
0C/
A.4
5(.3
2–.5
8).2
1(.0
9–.3
3).1
5(.0
4–.2
5).4
7(.3
5–.6
0).4
1(.3
6–.4
7)rs
8829
3711
PAN
X193
5485
20A/
G.4
4(.3
2–.5
7).5
5(.4
0–.6
9).4
0(.2
6–.5
4).5
5(.4
2–.6
8).4
4(.3
9–.5
0)rs
8890
125
TRPC
713
5582
615
C/A
.48(
.36–
.61)
.62(
.48–
.76)
.58(
.43–
.73)
.60(
.48–
.72)
.55(
.50–
.61)
rs91
0170
6GL
P1R
3914
0393
T/C
.44(
.32–
.57)
.30(
.17–
.43)
.49(
.34–
.64)
.37(
.25–
.50)
.45(
.40–
.51)
rs96
6398
910
TLL2
9822
5107
A/C
.39(
.27–
.52)
.56(
.41–
.70)
.60(
.46–
.75)
.57(
.45–
.70)
.44(
.39–
.50)
rs97
8890
516
—65
0003
82T/
C.6
1(.4
8–.7
3).8
8(.7
8–.9
7).9
0(.8
1–.9
9).7
8(.6
8–.8
9).6
3(.5
8–.6
8)rs
9975
567
—51
7389
54T/
C.6
9(.5
7–.8
1).4
7(.3
2–.6
1).4
0(.2
5–.5
4).5
3(.4
1–.6
6).5
9(.5
4–.6
5)
Not
e:Th
e al
lele
freq
uenc
ies
incl
udin
g 95
% c
onfid
ence
inte
rval
s fo
r the
follo
win
g Ha
pMap
pop
ulat
ions
are
repr
esen
ted;
30
trios
from
Uta
h Re
side
nts
with
Nor
ther
n an
d W
este
rn E
urop
ean
Ance
stry
(CEU
), 45
unr
elat
ed H
an C
hine
se in
Bei
jing,
Chi
na (C
HB),
45 u
nre-
late
d Ja
pane
se in
Tok
yo, J
apan
(JPT
), 30
trio
s fro
m Y
orub
a in
Ibad
an, N
iger
ia (Y
RI),
and
the
inte
rnal
resu
lts s
tem
min
g fro
m 1
5 CE
U tri
os, 2
4 un
rela
ted
indi
vidu
als
from
the
Corie
ll In
stitu
te a
nd 9
9 ra
ndom
ly c
hose
n in
divi
dual
s fro
m e
ach
geno
type
d tw
in p
air.
For X
-chr
omos
omal
mar
kers
the
alle
le fr
eque
ncie
s ar
e ca
lcul
ated
usi
ng o
nly
fem
ale
indi
vidu
als.
The
refe
renc
e SN
P id
:s, c
hrom
osom
al p
ositi
ons
and
gene
sym
bols
are
pre
sent
ed a
ccor
ding
to N
CBI b
uild
35
and
the
alle
le fr
eque
ncie
s re
pres
ent n
onre
dun-
dant
Hap
Map
dat
a re
leas
ed o
n th
e Ju
ly 2
0, 2
006.
All
frequ
enci
es a
re p
rese
nted
in re
latio
n to
the
HapM
ap re
fere
nce
alle
le. T
he re
fere
nce
alle
lle a
llele
is p
rese
nted
as
the
first
alle
le in
the
alle
les-
colu
mn.
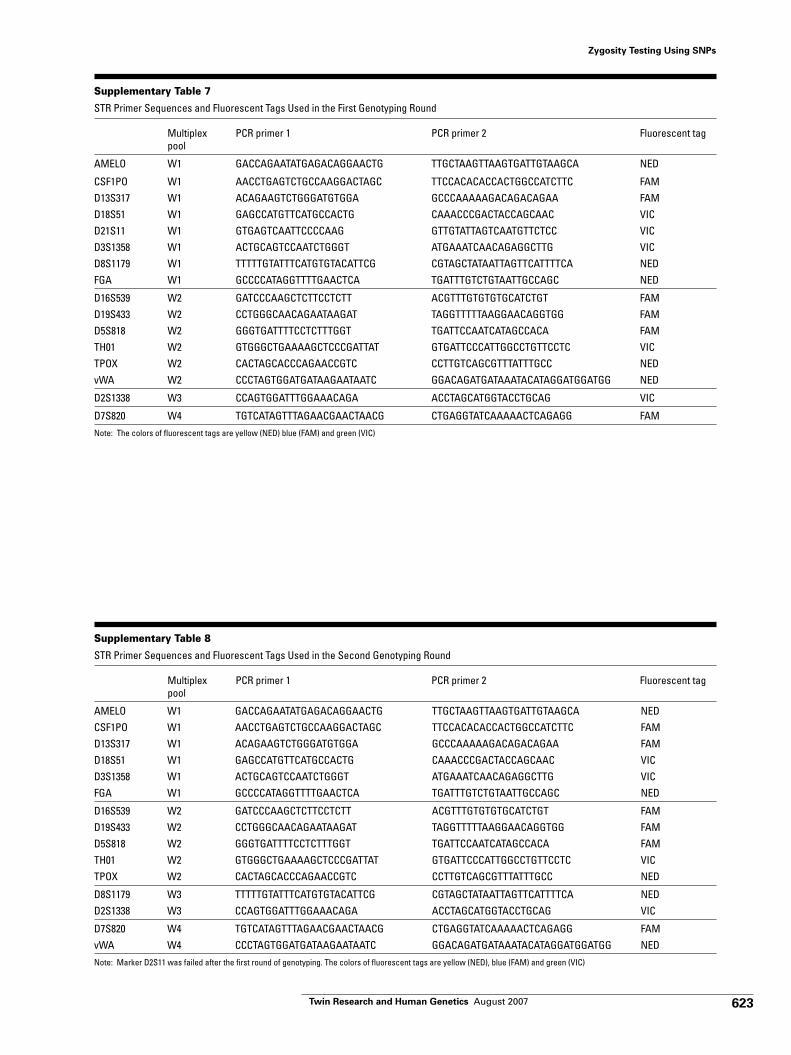
623Twin Research and Human Genetics August 2007
Zygosity Testing Using SNPs
Supplementary Table 7
STR Primer Sequences and Fluorescent Tags Used in the First Genotyping Round
Multiplex PCR primer 1 PCR primer 2 Fluorescent tagpool
AMELO W1 GACCAGAATATGAGACAGGAACTG TTGCTAAGTTAAGTGATTGTAAGCA NED
CSF1PO W1 AACCTGAGTCTGCCAAGGACTAGC TTCCACACACCACTGGCCATCTTC FAMD13S317 W1 ACAGAAGTCTGGGATGTGGA GCCCAAAAAGACAGACAGAA FAMD18S51 W1 GAGCCATGTTCATGCCACTG CAAACCCGACTACCAGCAAC VICD21S11 W1 GTGAGTCAATTCCCCAAG GTTGTATTAGTCAATGTTCTCC VICD3S1358 W1 ACTGCAGTCCAATCTGGGT ATGAAATCAACAGAGGCTTG VICD8S1179 W1 TTTTTGTATTTCATGTGTACATTCG CGTAGCTATAATTAGTTCATTTTCA NEDFGA W1 GCCCCATAGGTTTTGAACTCA TGATTTGTCTGTAATTGCCAGC NED
D16S539 W2 GATCCCAAGCTCTTCCTCTT ACGTTTGTGTGTGCATCTGT FAMD19S433 W2 CCTGGGCAACAGAATAAGAT TAGGTTTTTAAGGAACAGGTGG FAMD5S818 W2 GGGTGATTTTCCTCTTTGGT TGATTCCAATCATAGCCACA FAMTH01 W2 GTGGGCTGAAAAGCTCCCGATTAT GTGATTCCCATTGGCCTGTTCCTC VICTPOX W2 CACTAGCACCCAGAACCGTC CCTTGTCAGCGTTTATTTGCC NEDvWA W2 CCCTAGTGGATGATAAGAATAATC GGACAGATGATAAATACATAGGATGGATGG NED
D2S1338 W3 CCAGTGGATTTGGAAACAGA ACCTAGCATGGTACCTGCAG VIC
D7S820 W4 TGTCATAGTTTAGAACGAACTAACG CTGAGGTATCAAAAACTCAGAGG FAM
Note: The colors of fluorescent tags are yellow (NED) blue (FAM) and green (VIC)
Supplementary Table 8
STR Primer Sequences and Fluorescent Tags Used in the Second Genotyping Round
Multiplex PCR primer 1 PCR primer 2 Fluorescent tagpool
AMELO W1 GACCAGAATATGAGACAGGAACTG TTGCTAAGTTAAGTGATTGTAAGCA NEDCSF1PO W1 AACCTGAGTCTGCCAAGGACTAGC TTCCACACACCACTGGCCATCTTC FAMD13S317 W1 ACAGAAGTCTGGGATGTGGA GCCCAAAAAGACAGACAGAA FAMD18S51 W1 GAGCCATGTTCATGCCACTG CAAACCCGACTACCAGCAAC VICD3S1358 W1 ACTGCAGTCCAATCTGGGT ATGAAATCAACAGAGGCTTG VICFGA W1 GCCCCATAGGTTTTGAACTCA TGATTTGTCTGTAATTGCCAGC NED
D16S539 W2 GATCCCAAGCTCTTCCTCTT ACGTTTGTGTGTGCATCTGT FAMD19S433 W2 CCTGGGCAACAGAATAAGAT TAGGTTTTTAAGGAACAGGTGG FAMD5S818 W2 GGGTGATTTTCCTCTTTGGT TGATTCCAATCATAGCCACA FAMTH01 W2 GTGGGCTGAAAAGCTCCCGATTAT GTGATTCCCATTGGCCTGTTCCTC VICTPOX W2 CACTAGCACCCAGAACCGTC CCTTGTCAGCGTTTATTTGCC NED
D8S1179 W3 TTTTTGTATTTCATGTGTACATTCG CGTAGCTATAATTAGTTCATTTTCA NEDD2S1338 W3 CCAGTGGATTTGGAAACAGA ACCTAGCATGGTACCTGCAG VIC
D7S820 W4 TGTCATAGTTTAGAACGAACTAACG CTGAGGTATCAAAAACTCAGAGG FAMvWA W4 CCCTAGTGGATGATAAGAATAATC GGACAGATGATAAATACATAGGATGGATGG NED
Note: Marker D2S11 was failed after the first round of genotyping. The colors of fluorescent tags are yellow (NED), blue (FAM) and green (VIC)
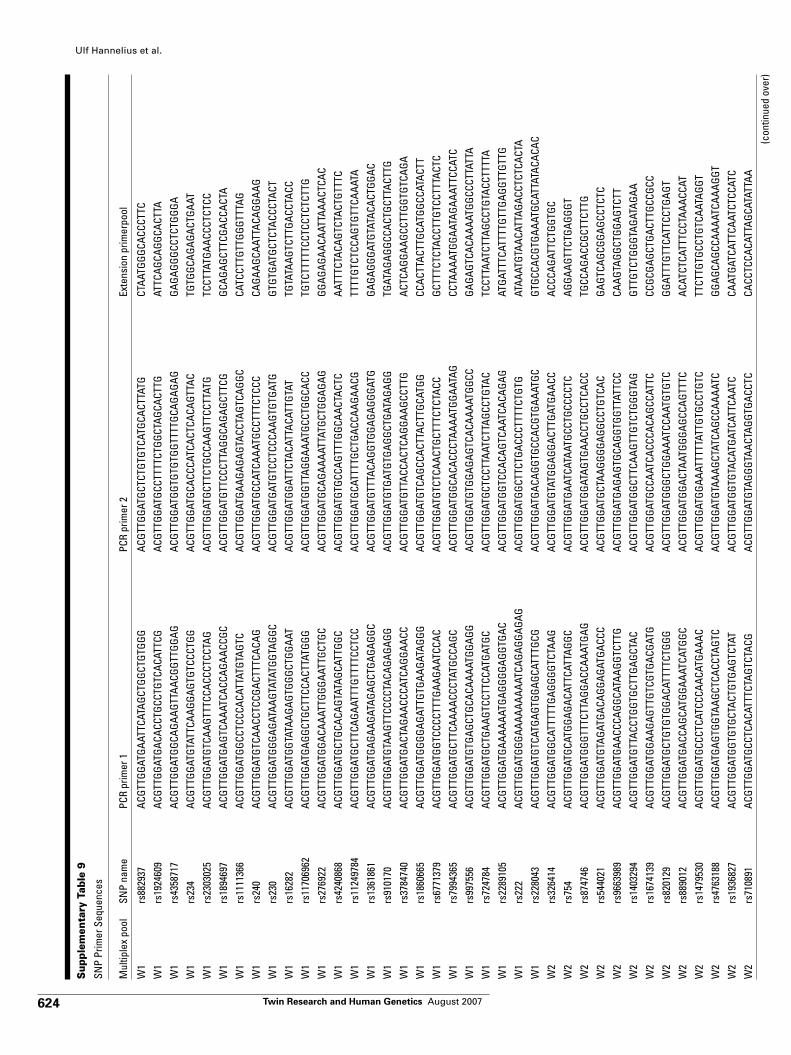
624 Twin Research and Human Genetics August 2007
Ulf Hannelius et al.
Sup
plem
enta
ry T
able
9
SNP
Prim
er S
eque
nces
Mul
tiple
x po
olSN
P na
me
PCR
prim
er 1
PCR
prim
er 2
Exte
nsio
n pr
imer
pool
W1
rs88
2937
ACGT
TGGA
TGAA
TTCA
TAGC
TGGC
TGTG
GGAC
GTTG
GATG
CTCT
GTGT
CATG
CACT
TATG
CTAA
TGGG
CACC
CTTC
W1
rs19
2460
9AC
GTTG
GATG
ACAC
CTGC
CTGT
CACA
TTCG
ACGT
TGGA
TGCC
TTTT
CTGG
CTAG
CACT
TGAT
TCAG
CAGG
CACT
TAW
1rs
4358
717
ACGT
TGGA
TGGC
AGAA
GTTA
ACGG
TTGG
AGAC
GTTG
GATG
GTGT
GTGG
TTTT
GCAG
AGAG
GAGA
GGGC
CTCT
GGGA
W1
rs23
4AC
GTTG
GATG
TATT
CAAG
GAGT
GTCC
CTGG
ACGT
TGGA
TGCA
CCCA
TCAC
TCAC
AGTT
ACTG
TGGC
AGAG
ACTG
AAT
W1
rs23
0302
5AC
GTTG
GATG
TCAA
GTTT
CCAC
CCTC
CTAG
ACGT
TGGA
TGCT
TCTG
CCAA
GTTC
CTTA
TGTC
CTTA
TGAA
CCCT
CTCC
W1
rs18
9469
7AC
GTTG
GATG
AGTC
AAAT
CACC
AGAA
CCGC
ACGT
TGGA
TGTT
CCCT
TAGG
CAGA
GCTT
CGGC
AGAG
CTTC
GACC
ACTA
W1
rs11
1136
6AC
GTTG
GATG
GCCT
CCCA
CATT
ATGT
AGTC
ACGT
TGGA
TGAA
GAGA
GTAC
CTAG
TCAG
GCCA
TCCT
TGTT
GGGT
TTAG
W1
rs24
0AC
GTTG
GATG
TCAA
CCTC
CGAC
TTTC
ACAG
ACGT
TGGA
TGCC
ATCA
AATG
CCTT
TCTC
CCCA
GAAG
CAAT
TACA
GGAA
GW
1rs
230
ACGT
TGGA
TGGG
AGAT
AAGT
ATAT
GGTA
GGC
ACGT
TGGA
TGAT
GTCC
TCCC
AAGT
GTGA
TGGT
GTGA
TGCT
CTAC
CCTA
CTW
1rs
1628
2AC
GTTG
GATG
GTAT
AAGA
GTGG
GCTG
GAAT
ACGT
TGGA
TGGA
TTCT
ACAT
TACA
TTGT
ATTG
TATA
AGTC
TTGA
CCTA
CCW
1rs
1170
6962
ACGT
TGGA
TGAG
GCTG
CTTC
CACT
TATG
GGAC
GTTG
GATG
GTTA
GGAA
ATGC
CTGG
CACC
TGTC
TTTT
TCCT
CCTC
TCTT
GW
1rs
2769
22AC
GTTG
GATG
GACA
AATT
GGGA
ATTG
CTGC
ACGT
TGGA
TGCA
GAAA
ATTA
TGCT
GGAG
AGGG
AGAG
AACA
ATTA
AACT
CAC
W1
rs42
4086
8AC
GTTG
GATG
CTGC
ACAG
TATA
GCAT
TGGC
ACGT
TGGA
TGTG
CCAG
TTTG
GCAA
CTAC
TCAA
TTTC
TACA
GTCT
ACTG
TTTC
W1
rs11
2497
84AC
GTTG
GATG
CTTC
AGAA
TTTG
TTTT
CCTC
CAC
GTTG
GATG
CATT
TTGC
TGAC
CAAG
AACG
TTTT
GTCT
CCAG
TGTT
CAAA
TAW
1rs
1361
861
ACGT
TGGA
TGAG
AAGA
TAGA
GCTG
AGAG
GCAC
GTTG
GATG
TTTA
CAGG
TGGA
GAGG
GATG
GAGA
GGGA
TGTA
TACA
CTGG
ACW
1rs
9101
70AC
GTTG
GATG
TAAG
TTCC
CCTA
CAGA
GAGG
ACGT
TGGA
TGTG
ATGT
GAGG
CTGA
TAGA
GGTG
ATAG
AGGC
CACT
GCTT
ACTT
GW
1rs
3784
740
ACGT
TGGA
TGAC
TAGA
ACCC
ATCA
GGAA
CCAC
GTTG
GATG
TTAC
CACT
CAGG
AAGC
CTTG
ACTC
AGGA
AGCC
TTGG
TGTC
AGA
W1
rs18
6066
5AC
GTTG
GATG
GGGA
GATT
GTGA
AGAT
AGGG
ACGT
TGGA
TGTC
AGCC
ACTT
ACTT
GCAT
GGCC
ACTT
ACTT
GCAT
GGCC
ATAC
TTW
1rs
6771
379
ACGT
TGGA
TGGT
CCCC
TTTG
AAGA
ATCC
ACAC
GTTG
GATG
TCTC
AACT
GCTT
TCTC
TACC
GCTT
TCTC
TACC
TTGT
CCTT
TACT
CW
1rs
7994
365
ACGT
TGGA
TGCT
TCAA
AACC
CTAT
GCCA
GCAC
GTTG
GATG
GCAC
ACCC
TAAA
ATGG
AATA
GCC
TAAA
ATGG
AATA
GAAA
TTCC
ATC
W1
rs99
7556
ACGT
TGGA
TGTG
AGCT
GCAC
AAAA
TGGA
GGAC
GTTG
GATG
TGGA
GAGT
CACA
AAAT
GGCC
GAGA
GTCA
CAAA
ATGG
CCCT
TATT
AW
1rs
7247
84AC
GTTG
GATG
CTGA
AGTC
CTTC
CATG
ATGC
ACGT
TGGA
TGCT
CCTT
AATC
TTAG
CCTG
TAC
TCCT
TAAT
CTTA
GCCT
GTAC
CTTT
TAW
1rs
2289
105
ACGT
TGGA
TGAA
AAAA
TGAG
GGGA
GGTG
ACAC
GTTG
GATG
GTCC
ACAG
TCAA
TCAC
AGAG
ATGA
TTTC
ATTT
TGTT
GAGG
TTGT
TGW
1rs
222
ACGT
TGGA
TGGG
AAAA
AAAA
ATCA
GAGG
AGAG
ACGT
TGGA
TGGC
TTCT
GACC
CTTT
TCTG
TGAT
AAAT
GTAA
CATT
AGAC
CTCT
CACT
AW
1rs
2280
43AC
GTTG
GATG
TCAT
GAGT
GGAG
CATT
TGCG
ACGT
TGGA
TGAC
AGGT
GCCA
CGTG
AAAT
GCGT
GCCA
CGTG
AAAT
GCAT
TATA
CACA
CW
2rs
3264
14AC
GTTG
GATG
GCAT
TTTT
GAGG
GGTC
TAAG
ACGT
TGGA
TGTA
TGGA
GGAC
TTGA
TGAA
CCAC
CCAG
ATTC
TGGT
GCW
2rs
754
ACGT
TGGA
TGCA
TGGA
GACA
TTCA
TTAG
GCAC
GTTG
GATG
AATC
ATAA
TGCC
TGCC
CCTC
AGGA
AGTT
CTGA
GGGT
W2
rs87
4746
ACGT
TGGA
TGGG
TTTC
TTAG
GACC
AAAT
GAG
ACGT
TGGA
TGGA
TAGT
GAAC
CTGC
CTCA
CCTG
CCAG
ACCG
CTTC
TTG
W2
rs54
4021
ACGT
TGGA
TGTA
GATG
ACAG
GAGA
TGAC
CCAC
GTTG
GATG
CTAA
GGGG
AGGC
CTGT
CAC
GAGT
CAGC
GGAG
CCTC
TCW
2rs
9663
989
ACGT
TGGA
TGAA
CCCA
GGCA
TAAG
GTCT
TGAC
GTTG
GATG
AGAG
TGCA
GGTG
GTTA
TTCC
CAAG
TAGG
CTGG
AGTC
TTW
2rs
1403
294
ACGT
TGGA
TGTT
ACCT
GGTG
CTTG
AGCT
ACAC
GTTG
GATG
GCTT
CAAG
TTGT
CTGG
GTAG
GTTG
TCTG
GGTA
GATA
GAA
W2
rs16
7413
9AC
GTTG
GATG
GAAG
AGTT
GTCG
TGAC
GATG
ACGT
TGGA
TGCC
AATC
ACCC
ACAG
CCAT
TCCC
GCGA
GCTG
ACTT
GCCG
CCW
2rs
8201
29AC
GTTG
GATG
CTGT
GTGG
ACAT
TTTC
TGGG
ACGT
TGGA
TGGG
CTGG
AAAT
CCAA
TGTG
TCGG
ATTT
GTTC
ATTC
CTGA
GTW
2rs
8890
12AC
GTTG
GATG
ACCA
GCAT
GGAA
ATCA
TGGC
ACGT
TGGA
TGGA
CTAA
TGGG
AGCC
AGTT
TCAC
ATCT
CATT
TCCT
AAAC
CAT
W2
rs14
7953
0AC
GTTG
GATG
CCCT
CATC
CCAA
CATG
AAAC
ACGT
TGGA
TGGA
AATT
TTTA
TTGT
GCCT
GTC
TTCT
TGTG
CCTG
TCAA
TAGG
TW
2rs
4763
188
ACGT
TGGA
TGAG
TGGT
AAGC
TCAC
CTAG
TCAC
GTTG
GATG
TAAA
GCTA
TCAG
CCAA
AATC
GGAG
CAGC
CAAA
ATCA
AAGG
TW
2rs
1936
827
ACGT
TGGA
TGGT
GTGC
TACT
GTGA
GTCT
ATAC
GTTG
GATG
GTGT
ACAT
GATC
ATTC
AATC
CAAT
GATC
ATTC
AATC
TCCA
TCW
2rs
7108
91AC
GTTG
GATG
CCTC
ACAT
TTCT
AGTC
TACG
ACGT
TGGA
TGTA
GGGT
AACT
AGGT
GACC
TCCA
CCTC
CACA
TTAG
CATA
TTAA
(con
tinue
d ov
er)
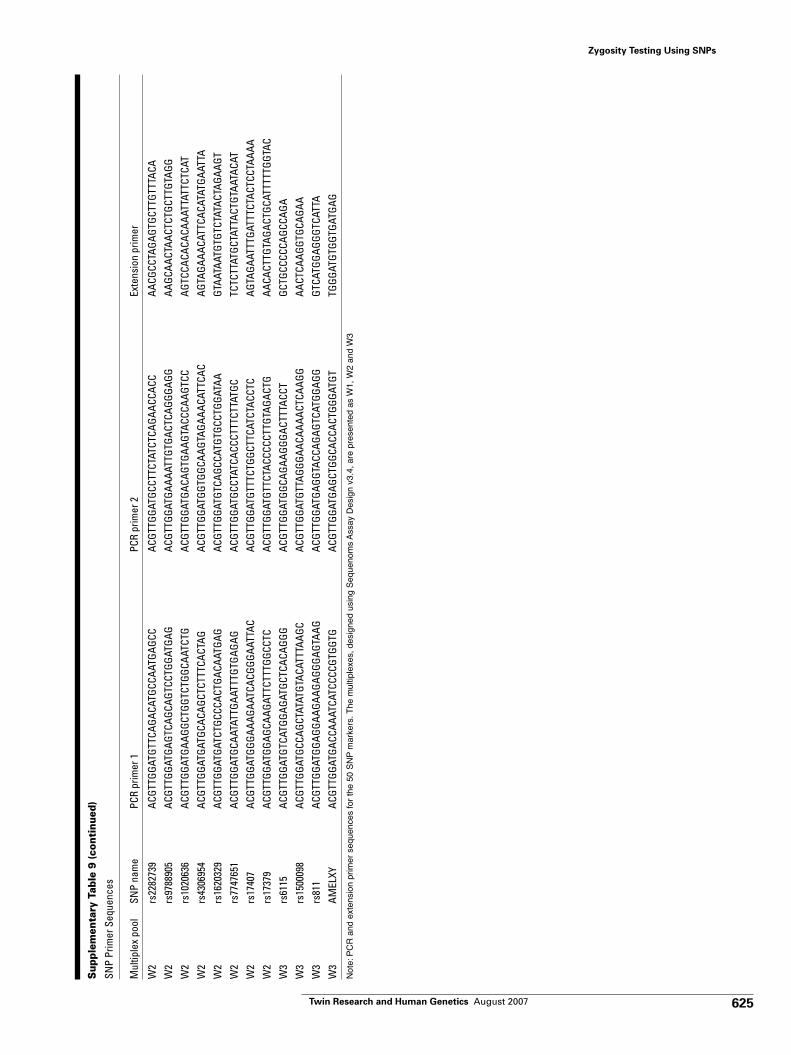
625Twin Research and Human Genetics August 2007
Zygosity Testing Using SNPs
Sup
plem
enta
ry T
able
9 (c
onti
nued
)
SNP
Prim
er S
eque
nces
Mul
tiple
x po
olSN
P na
me
PCR
prim
er 1
PCR
prim
er 2
Exte
nsio
n pr
imer
W2
rs22
8273
9AC
GTTG
GATG
TTCA
GACA
TGCC
AATG
AGCC
ACGT
TGGA
TGCC
TTCT
ATCT
CAGA
ACCA
CCAA
CGCC
TAGA
GTGC
TTGT
TTAC
AW
2rs
9788
905
ACGT
TGGA
TGAG
TCAG
CAGT
CCTG
GATG
AGAC
GTTG
GATG
AAAA
TTGT
GACT
CAGG
GAGG
AAGC
AACT
AACT
CTGC
TTGT
AGG
W2
rs10
2063
6AC
GTTG
GATG
AAGG
CTGG
TCTG
GCAA
TCTG
ACGT
TGGA
TGAC
AGTG
AAGT
ACCC
AAGT
CCAG
TCCA
CACA
CAAA
TTAT
TCTC
ATW
2rs
4306
954
ACGT
TGGA
TGAT
GCAC
AGCT
CTTT
CACT
AGAC
GTTG
GATG
GTGG
CAAG
TAGA
AACA
TTCA
CAG
TAGA
AACA
TTCA
CATA
TGAA
TTA
W2
rs16
2032
9AC
GTTG
GATG
ATCT
GCCC
ACTG
ACAA
TGAG
ACGT
TGGA
TGTC
AGCC
ATGT
GCCT
GGAT
AAGT
AATA
ATGT
GTCT
ATAC
TAGA
AGT
W2
rs77
4765
1AC
GTTG
GATG
CAAT
ATTG
AATT
TGTG
AGAG
ACGT
TGGA
TGCC
TATC
ACCC
TTTC
TTAT
GCTC
TCTT
ATGC
TATT
ACTG
TAAT
ACAT
W2
rs17
407
ACGT
TGGA
TGGG
AAAG
AATC
ACGG
GAAT
TAC
ACGT
TGGA
TGTT
TCTG
GCTT
CATC
TACC
TCAG
TAGA
ATTT
GATT
TCTA
CTCC
TAAA
AW
2rs
1737
9AC
GTTG
GATG
GAGC
AAGA
TTCT
TTGG
CCTC
ACGT
TGGA
TGTT
CTAC
CCCC
TTGT
AGAC
TGAA
CACT
TGTA
GACT
GCAT
TTTT
GGTA
CW
3rs
6115
ACGT
TGGA
TGTC
ATGG
AGAT
GCTC
ACAG
GGAC
GTTG
GATG
GCAG
AAGG
GACT
TTAC
CTGC
TGCC
CCCA
GCCA
GAW
3rs
1500
098
ACGT
TGGA
TGCC
AGCT
ATAT
GTAC
ATTT
AAGC
ACGT
TGGA
TGTT
AGGG
AACA
AAAC
TCAA
GGAA
CTCA
AGGT
GCAG
AAW
3rs
811
ACGT
TGGA
TGGA
GGAA
GAAG
AGGG
AGTA
AGAC
GTTG
GATG
AGGT
ACCA
GAGT
CATG
GAGG
GTCA
TGGA
GGGT
CATT
AW
3AM
ELXY
ACGT
TGGA
TGAC
CAAA
TCAT
CCCC
GTGG
TGAC
GTTG
GATG
AGCT
GGCA
CCAC
TGGG
ATGT
TGGG
ATGT
GGTG
ATGA
G
Not
e:P
CR
and
ext
ensi
on p
rimer
seq
uenc
es fo
r th
e 50
SN
Pm
arke
rs. T
he m
ultip
lexe
s, d
esig
ned
usin
g S
eque
nom
s A
ssay
Des
ign
v3.4
, are
pre
sent
ed a
s W
1, W
2 an
d W
3
![Association between single nucleotide polymorphisms (SNPs) and milk production traits in Italian Brown cattle [2013]](https://img.pdfslide.net/doc/110x75/63469867665db1bb56059c4e/association-between-single-nucleotide-polymorphisms-snps-and-milk-production-traits.jpg)


