Embed Size (px)
Citation preview

Climate Dynamics (1999) 15 :227—240 ( Springer-Verlag 1999
P. E. Tarasov · O. Peyron · J. Guiot · S. BrewerV. S. Volkova · L. G. Bezusko · N. I. DorofeyukE. V. Kvavadze · I. M. Osipova · N. K. Panova
Last Glacial Maximum climate of the former Soviet Union and Mongoliareconstructed from pollen and plant macrofossil data
Received: 11 May 1998 / Accepted: 25 September 1998
Abstract An improved concept of the best analoguesmethod was used to reconstruct the Last Glacial Max-imum (LGM) climate from a set of botanical recordsfrom the former Soviet Union and Mongolia. Terres-trial pollen and macrofossil taxa were grouped intobroad classes — plant functional types (PFTs), definedby the ecological and climatic parameters used in theBIOME1 model. PFT scores were then calibrated interms of modern climate using 1245 surface pollenspectra from Eurasia and North America. In contrastto individual taxa, which exhibit great variability andmay not be present in the palaeoassemblages, even insuitable climates, PFTs are more characteristic of the
P. E. Tarasov ( )Department of Geography, Moscow State University,Vorob’evy Gory, 119899 Moscow, RussiaE-mail: [email protected]
O. Peyron1,2 · J. Guiot1 · S. Brewer1
1 IMEP, CNRS UMR 6100, Faculte de St-Jerome, case 451,13397 Marseille Cedex 20, France2 CEREGE, B.P. 80, 13545 Aix-en-Provence Cedex 4, France
V. S. VolkovaInstitute of Geology, Russian Academy of Sciences(Siberian Branch), Universitetskii 3, Novosibirsk 630090, Russia
L. G. BezuskoInstitute of Botany, National Academy of Sciences of Ukraine,Tereshchenkovskaya 2, Kiev 252601, Ukraine
N. I. DorofeyukInstitute of Evolution and Ecology, Russian Academy of Sciences,Piatnitskaya 47, Stroenie 3, Moscow 109017, Russia
E. V. KvavadzeInstitute of Palaeobiology, Georgian Academy of Sciences,Potomaja 4, Tbilisi 380004, Georgia
I. M. OsipovaCentral Geological Laboratory, Zvenigorodskoe Shosse 9,Moscow 309252, Russia
N. K. PanovaForest Institute, Russian Academy of Sciences (Ural Branch),Bilimbaevskaya 32 A, Ekaterinburg 620134, Russia
vegetation types. The modified method thus allowsclimate reconstruction at time intervals with partialdirect analogues of modern vegetation (e.g. the LGM).At 18 kBP, mean temperatures were 20—29 °C colderthan today in winter and 5—11 °C colder in summer inEuropean Russia and Ukraine. Sites from westernGeorgia show negative, but moderate temperatureanomalies compared to today: 8—11 °C in January and5—7 °C in July. LGM winters were 7—15 °C colder andsummers were 1—7 °C colder in Siberia and Mongolia.Annual precipitation sums were 50—750 mm lower thantoday across northern Eurasia, suggesting a weakeningof the Atlantic and Pacific influences. Reconstructeddrought index shows much drier LGM conditions innorthern and mid-latitude Russia, but similar to orslightly wetter than today around the Black Sea and inMongolia, suggesting compensation of precipitationlosses by lower-than-present evaporation.
1 Introduction
Recently, continental-scale quantitative climate recon-structions from biological records have been used toevaluate the results of global circulation model (GCM)simulations (COHMAP Members 1988; Wright et al.1993) and are thus helpful in finding the appropriatephysical mechanisms of past climate changes. The LastGlacial Maximum (LGM: 18$2 kBP) is one of thekey time slices used by the modelling community tovalidate their models and is the focus of several projectsdealing with data-model comparisons (e.g. Palaeocli-mate Modelling Intercomparison Project: Joussaumeand Taylor 1995; and BIOME6000 Project: Prenticeand Webb 1998).
The number of publications presenting results ofLGM climate modelling has increased over the last fewyears (Ramstein and Joussaume 1995; Broccoli andMarciniak 1996; Felzer et al. 1996; 1998; Hewitt and

Mitchel 1997; Pollard and Thompson 1997;Ganopolski et al. 1998). These have shown results thatvary in terms of driving forces and magnitude ofsimulated changes. Until now, however, there havebeen only a few attempts at quantitative reconstruc-tions of the LGM climate of the former Soviet Union(FSU) and Mongolia, using limited and poorly datedsets of biological records (Peterson et al. 1979; Frenzelet al. 1992).
Biomes reconstructed from recently compiled LGMpollen and macrofossil records from northern Eurasia(Tarasov et al. 1998c) differ substantially from themodern vegetation at most of the studied sites, imply-ing a major climate change since this time period. Wehave attempted to quantify the 18 kBP climate, usingthis most recent data set, in order (1) to fill the existinggap in the palaeclimate reconstructions, and (2) tocontribute to the evaluation of climate models for thislarge region of the Earth.
Known LGM environments (e.g. extended continen-tal ice sheets in Eurasia and North America; sea levelabout 100—130 m lower than today; and atmosphericCO
2half that of the current level) gave rise to vegeta-
tion with no direct modern analogues, as reported inthe previous continental-scale syntheses of the LGMrecords from northern Eurasia (Grichuk 1984; Peter-son et al. 1979; Frenzel et al. 1992). This has limited thereliability of LGM climate reconstructions by the mod-ern analogues method (Guiot 1990; Guiot et al. 1989;1993a). This problem may now be solved by the use ofan alternative method (Peyron et al. 1998), which hasbeen successfully applied to LGM pollen data fromsouthern Europe and the Near East. This method isbased on climatic calibration of the plant functionaltypes (PFTs, the broad classes of plants selected bytheir ecology, leaf morphology and bioclimatic toler-ance: Prentice et al. 1992), instead of using individualtaxa as in the traditionally used best modern analoguestechnique. The advantages of this are that: (1) thenumber of PFTs is relatively small compared to thenumber of individual pollen taxa, and thus, the PFTshave a better-defined climatic response (Prentice et al.1992); and (2) the concept of PFT decreases the risk ofa lack of direct modern analogues in the palaeovegeta-tion, as the number of variables is smaller and of largersignificance (Peyron et al. 1998).
A traditional method of presenting the results ofpalaeovegetation or palaeoclimate reconstructions isby drawing hand-contoured or interpolated maps ofthe values derived from geological records at individualsites (e.g. Grichuk 1984; Gerasimov and Velichko 1982;Frenzel et al. 1992). In the present study, however, thereconstructed climate characteristics are mapped atdiscrete points as advised by Broccoli and Marciniak(1996), in order (1) to avoid speculations and subjectivedrawing of the reconstructed contours, especially in theregions where data are sparse, and (2) to simplify thedata comparison with model outputs.
2 Data
2.1 Modern climate data
Before calibrating PFTs, the present-day climate parameters need tobe estimated at the sites with modern and fossil pollen data. This hasbeen done by using the global climate data set of Leemans andCramer (1991), based on more than 9000 climatic stations aroundthe world. The climatic variables used in this study are those used inthe BIOME1 model (Prentice et al. 1992): mean coldest-month tem-perature (¹
c), mean warmest-month temperature (¹
w), annual sum
of growing degree days above 5 °C (GDD5) and drought index,expressed as the ratio of actual to equilibrium evapotranspiration(a); and those commonly used in the model simulations of LGMclimate: annual temperature (¹
ann) and precipitation (P
ann). These six
variables were estimated by a weighted distance interpolationmethod, after a reduction of all stations to sea-level (Guiot 1990). Allcalculations were processed with the PPPBASE software (Guiot andGoeury 1996).
Pollen assemblages inherently reflect those aspects of climate thatinfluence vegetation (Cheddadi et al. 1997). Thus modern pollendata should be more closely related to bioclimatic variables (e.g. ¹
c,
¹w, GDD5 and a) than to conventional variables such as P
annthat
have only an indirect influence on vegetation in the temperateregions (Guiot et al. 1993b). Assuming, therefore, that it is difficult toreconstruct precipitation pattern from pollen alone, Cheddadi et al.(1997) developed a special technique using the best modern analoguemethod constrained with lake-level data, to reconstruct palaeocli-mates across Europe for 6 kBP. However, the existing data base oflake-level record from the FSU and Mongolia (Tarasov et al. 1996)contains only one site with LGM record, not enough to apply theconstrained technique in our study. The reconstruction of P
annhas
still been made, as it facilitates the interpretation of a, an increase ofwhich may be caused by a decrease in temperatures and/or anincrease in precipitation.
2.2 Selection of modern pollen data
Several modern surface pollen data sets from Europe, northern Asiaand North America have been used for the quantitative reconstruc-tion of climate (Huntley and Prentice 1988; 1993; Guiot et al. 1993b;Cheddadi et al. 1997; Peyron et al. 1998) and vegetation (Prenticeet al. 1996; Tarasov et al. 1998a; 1998b). From those data sets, wefirst assembled 1946 pollen spectra. In a first step, 91 surface pollenspectra from mountainous areas of northern Eurasia and north-western North America, regions with few climatic stations, wereexcluded because of inaccurate calculation of the modern climate.A cross-comparison was carried out for the rest of the sites, betweenmodern pollen-derived biomes, reconstructed as in Tarasov et al.(1998b), and biomes estimated from modern climate data (as inPrentice et al. 1992). This test lead to the exclusion of additional 610spectra, where the match between modern vegetation and climate atthe sampling sites was not exact. Among these 203 modern pollenspectra came from mountainous regions (elevation above 1000 m),another 104 spectra were located in coastal areas of the Siberian andAmerican Arctic and the rest are situated in the most populatedregions of southern Europe (e.g. Spain, Italy, Greece, Bulgaria,Turkey) and the central and southern parts of the FSU. The distri-bution of the rejected spectra suggests that the most probablereasons for such disagreement are (1) strong human impact on themodern vegetation (e.g. deforestation, irrigation, planting of the newspecies in the most populated regions of Europe) and (2) incorrectestimation of the modern climate in the mountain and coastal arcticareas. We kept, however, 1245 surface pollen spectra (64% of thetotal amount) which had a good agreement between modern vegeta-tion and climate (Fig. 1). This is more than double the number usedby Peyron et al. (1998) to reconstruct the LGM climate in the
228 Tarasov et al.: Last Glacial Maximum climate of the former Soviet Union and Mongolia

Fig. 1 Distribution of 1245 sites with modern surface pollen data used to calculate climate variables
Mediterranean region and the spatial coverage of pollen sites (Fig. 1)is rather good. In the final data-set (Fig. 1), 508 spectra came fromwestern Europe and the Near East (Peyron et al. 1998; Tarasov et al.1998b), 93 spectra used by Cheddadi et al. (1997) from NorthAmerica and 644 spectra from the FSU and Mongolia (Tarasovet al. 1998a).
2.3 LGM pollen and plant macrofossil data
The 18$2 kBP data set used recently to reconstruct LGM vegeta-tion of northern Eurasia, includes 39 pollen and 2 plant macrofossilspectra (Tarasov et al. 1998c). For each site with an 18 kBP record,a check was made of the agreement between the actual biomederived from the vegetation map of Eurasia (Gerasimov 1964) andthe biome reconstructed from modern climate. This control allowsestimates of the anomalies between the past and modern climatevariables to be made with greater precision. Using these criteria, weselected 32 records from the Tarasov et al. (1998c) data set for thepresent study. These include 23 spectra from Russia, four fromGeorgia, two from Ukraine and three from Mongolia. Only tworecords are from sites situated above 1000 m of altitude, and theothers are from the plains (Table 1). Most of the records consist ofprimary counts, however, four well-dated records, digitized from thepublished diagrams, were used to improve the resolution of thereconstruction. Tarasov et al. (1998c) have found that individualpollen assemblages from northern Eurasia attributed to LGM inter-
val usually contain 10 to 15 terrestrial taxa. This low taxonomicdiversity suggests that digitized taxa abundances may be used for18 kBP with a high level of confidence.
In the study area, only a few dated records cover the maximumphase of last glaciation. These include nine records with radiocarbondates spanning the interval between 16 kBP and 20 kBP, and sevenrecords with radiocarbon dates within 2000 y of that interval(Table 1). The other 16 records are poorly dated. For these, ageswere established by pollen and stratigraphic correlation with datedsites situated nearby. At each site, we selected the pollen or macro-fossil sample closest to the 18 kBP time slice in the profile, ratherthan interpolating between pollen spectra. The same method wasused to select data from the FSU and Mongolia for the 6kBP biomereconstruction (Tarasov et al. 1998a). At all selected sites the varia-bility of the pollen spectra attributed to the LGM interval was low.Where the data was present, attempts were made to reconstructbiomes from the second and third pollen samples closest to 18 kBPin the pollen diagram. The results obtained were similar to thosefrom the first closest assemblage.
3 Methods
3.1 Background
The basis of our method of climate reconstruction lies in the biomereconstruction method developed by Prentice et al. (1996) to assign
Tarasov et al.: Last Glacial Maximum climate of the former Soviet Union and Mongolia 229

Table 1 Summary of sites with pollen and macrofossil data at 18$2 kBP. Source of data is indicated by: pc, for new compiled primarypollen data; pd, for digitized pollen data; mc, for primary macrofossil data; md, for digitized plant macrofossil data
Site name/ Latitude Longitude Altitude Source Boundary 14C dates Referencecountry code °N °E m a.s.l.
Apiancha/G 42.97 41.25 450 pc 17 300$500 (GIN-2565) Tsereteli et al. 1982Kobuleti/G 41.90 41.77 1.5 pc Correlation Kvavadze and
Dzheiranashvili 1987Manavi/G 41.70 45.45 400 pd 20 580$680 (TB-18) Tumadzhanov and
Gogichaishvili 1969Sukhumi/G 42.92 40.93 2.7 pc Correlation Kvavadze et al. 1984Anetovka II/U 47.65 31.10 100 pc 18 040$150 (LE-2424) Arap et al. 1990Korman/U 48.92 27.17 100 pc 18 000$400 (GIN-719) Pashkevich 1977Alymka/R 59.04 68.89 50 mc 16 770$160 (SOAN-985) Krivonogov 1988Ayakli-Melkoe/R 69.25 89.00 125 pc 19 900$500 (GIN-311)
10 700$200 (GIN-300) Kind 1974Chulym/R 57.75 84.00 75 pc 21 800$450 (SOAN-550) Volkova 1970Demyanskoe/R 59.67 69.75 65 pc 46 450$450 (SOAN-2043) Bakhareva 1983Fabrika 1 Maya/R 56.37 37.19 128 pc 12 400$160 (LU-374)
21 140$590 (LU-348) Semenenko et al. 1981Igarskaya Ob/R 66.50 65.75 42 pc 29 500$520 (SOAN-974) Lazukov and Sokolova
1959Isha/R 52.16 87.06 400 pd 20 240$740 (LG-59)
15 850$680 (LG-36) Zubakov 1972Kolpashevo/R 58.25 83.00 62 pc 25 000$1300 (SOAN-38)
10 650$90 (SOAN-323) Bukreeva and Poleshchuk1970
Krasnyi Yar/R 55.00 83.00 105 pc 23 860$320 (SOAN-332) Bukreeva 1966Krivosheino/R 57.50 84.00 100 pc 38 545$900 (SOAN-342) Levina 1979Malaya Kheta/R 69.00 84.75 50 pc 35 500$900 (GIN-258)
6800$200 (GIN-25) Kind 1974Mega/R 65.00 65.75 45 pc 21 900$500 (SOAN-324)
10 650$900 (SOAN-323) Lazukov and Sokolova1959
Nadymskaya Ob/R 66.33 70.75 45 pc Correlation Kind 1974Prizhim/R 55.17 57.58 350 pc 17 070$1017 (IEMEZH-700)
21 085$630 (IERZH-37) Smirnov et al. 1990Puchka/R 59.70 39.33 125 md 21 410$150 (LU-18B) Chebotareva and
Makarycheva 1974Sakhta/R 56.92 39.58 137 pc Correlation Pisareva 1971Serpievskaya/R 55.10 57.67 350 pc 16 585$598 (IEMEZH-722) Smirnov et al. 1990Skorodum/R 57.83 71.13 57 pc Correlation Volkova and Nikolaeva
1982Skv-469/R 57.25 68.17 75 pc Correlation Volkova 1970Tugiyany/R 64.75 66.00 47 pc 26 270$270 (SOAN-964) Levina 1979Veselo-Voznesenskoe/R 47.17 38.35 38 pc 15 690$330 (MGU-IOAN-58) Markov 1976Voronovo/R 56.00 84.00 62 pc Correlation Bukreeva and Poleshchuk
1970Zagvozdino/R 57.92 71.02 60 pc 44 620$1110 (SOAN-1894) Bakhareva 1983Hoton/M 48.67 88.30 2083 pc 9070$150 (TA-1419) Tarasov et al. 1998cKerulen/M 47.52 111.27 900 pd 19 500$340 (Vib.6) Golubeva 1976Tsagan-Mort-Nur/M 51.21 99.45 1539 pc 18 050$200 (TA-1437 A) Tarasov et al. 1998c
pollen spectra to biomes, after grouping the pollen taxa into PFTs.This method has been successfully applied to the modern and 6 kBPpollen and macrofossil data from Europe (Prentice et al. 1996),China (Yu et al. 1998) and the FSU and Mongolia (Tarasov et al.1998a; 1998b). The main steps of the biome reconstruction methodare described in Prentice et al. (1996) and in Tarasov et al. (1998a,1998b). Peyron et al. (1998) have demonstrated that the PFT conceptprovides an excellent way for the quantitative climate reconstructionfrom the fossil pollen records. Here we apply their method to thedata from northern Eurasia.
3.2 Taxa to PFT assignment and calculation of PFT scores
Table 2 lists all taxa from surface and 18 kBP data sets used in thepresent study together with the appropriate PFTs. Some taxa can bepresent in two or more basic PFTs, thus creating a technical prob-lem for the calculation of the PFT scores used in climate calibration.To overcome this, Peyron et al. (1998) have suggested the creationof a virtual PFT, defined as a group of the PFTs to which anambiguous taxon belongs, according to the known biogeography
230 Tarasov et al.: Last Glacial Maximum climate of the former Soviet Union and Mongolia

Table 2 Table of basic andvirtual plant functional types(PFTs) showing the pollen taxaassigned to each type. VirtualPFTs are shown in the codecolumn with a slash between thebasic PFTs. Ctc is the code ofcool-temperate conifer PFT
Basic PFT Code Pollen taxa included
Cool grass/shrub cgs Hippophae, PolygonaceaeWarm grass/shrub wgs Armeria, Boraginaceae, Brassicaceae,
Crassulaceae, Echium, Euphorbiaceae, Fabaceae,Lamiaceae, Rosmarinus, Scrophulariaceae,¹hymus, Zizyphus
Steppe forb/shrub sf Allium, Apiaceae, Asteraceae (Asteroideae),Asteraceae (Cichorioideae), Campanulaceae,Cannabis, Caryophyllaceae, Centaurea,Dipsacaceae, Filipendula, Galium, Helianthemum,Plantago undif., Plantago lanceolata,Plumbaginaceae, Ranunculaceae, Rosaceae,Rubiaceae
Warm desert forb/shrub wdf Ephedra fragilis, Tamaricaceae, ZygophyllaceaeDesert forb/shrub df Ephedra undif., Ephedra distachya, Salsola,
Nitrariasf/df Artemisia, Chenopodiaceae
Grass g PoaceaeHeath h Ericales, Calluna, RhododendronSedge s CyperaceaeArctic-alpine dwarf shrub/herb
aa Alnus fruticosa-type, Betula nana-type, Draba,Dryas, Gentianaceae, Saxifraga, Saxifragaceae
Arctic-boreal dwarf shrub ab Rubus chamaemorusBoreal evergreen conifer bec PiceaBoreal summergreen bs Betula (Albae), ¸arixCool-boreal conifer cbc Pinus (Haploxylon)
bec/ctc AbiesTemperate conifer ctc
1Cedrus, ¹axus
Eurythermic conifer ec Juniperus, Pinus (Diploxylon)Boreal-temperate shrub bts Cornus, ¸onicera, Sambucus, Sorbus, »iburnumTemperate summergreen ts Acer, Euonimus, Fraxinus excelsior-type, Quercus
(deciduous)aa/bs Betula undif.aa/bs/ts Alnus undif., Salixbs/ts Alnus glutinosa-type, A. incana-type, Populus
Cool-temperate summergreen ts1
Carpinus, Corylus, Fagus, Frangula, ¹ilia, ºlmusWarm-temperate summergreen ts
2Castanea, Fraxinus ornus-type, Juglans, Myrica,Ostrya, Platanus, Pterocarya, Rhamnus, »itis, Zel-kova
Warm-temperate broad-leavedevergreen wte Arbutus, Quercus (evergreen)
ts/wte Quercus undifCool-temperate broad-leavedevergreen wte
1Buxus, Hedera, Ilex
Warm-temperate sclerophyllshrub/tree wte
2Acacia, Cistus, Pistacia, Rhus, Olea, Myrtus, Phil-lyrea, Ceratonia, Mercurialis
and ecology of the plant species. Once a biome has been assigned to thepollen spectra, the virtual PFTs can be attributed to the basic PFTwhich is in agreement with the biome (Peyron et al. 1998). On the basisof the taxa-PFT matrix (Table 2), a score is calculated for each PFT ineach pollen or macrofossil assemblage, as the sum of the square roots ofthe percentage (above 0.5%) of each taxa present in the PFT. ObtainedPFT scores are then used to calculate biome scores and reconstructvegetation (Prentice et al. 1996) and climate (Peyron et al. 1998).
The distinction among warm/cool/cold non-arboreal PFTs isdifficult to make from the non-arboreal taxa involved. Many herba-ceous taxa have either a large climatic range or a low pollenproductivity, or like C
3and C
4grasses, cannot be distinguished by
pollen analysis. Tarasov et al. (1998b) proposed a method usingarboreal taxa as additional criteria to assign herbaceous taxa to theappropriate PFTs and thus to distinguish warm steppe and desertfrom their cool varieties with higher degree of confidence. Thismethod requires the reasonable assumption that to a first order thetemperature requrements of the herbaceous taxa can be indicated by
the associated tree taxa. For example, the modern data show thatarboreal pollen of boreal deciduous and arctic-alpine taxa (e.g.¸arix, Betula) are abundant when ¹
wis below 22 °C and the pollen
abundances of warm-temperate broad-leaved evergreen (e.g. ever-green Quercus) or warm temperate sclerophyll shrub PFT (e.g. Olea,Pistacia) are significant when ¹
wis above 22 °C (Tarasov et al.
1998b). It considers the arboreal PFT as follows:1. If boreal forest PFTs (bec, cbc, bs) and/or arctic-alpine (aa) dwarf
shrubs are present in the spectrum, the eventual wgs and sf PFTsare reclassified into cgs PFT and the df and wdf PFTs are definedas a cool desert variety;
2. If warm forest PFTs (wte, wte2) are present, the eventual cgs and
sf PFTs are reassigned to wgs PFT and the eventual df PFT isdefined as a warm desert variety;
3. If temperate forest PFTs (ctc1, ts, ts
1, ts
2, wte, wte
1, wte
2) are
present, the taxa listed in aa PFT are reassigned to cgs PFT.The PFT scores in each modern and LGM assemblage are modifiedaccordingly.
Tarasov et al.: Last Glacial Maximum climate of the former Soviet Union and Mongolia 231

Table 3 Northern Eurasianbiomes and their characteristicplant functional types (PFTs).Abbreviations for PFTs as inTable 2
Biome Sum of PFT
Tundra aa#aa/bs#aa/bs/ts#ab#g#s#hCold deciduous forest aa/bs#aa/bs/ts#bs/ts#bs#cbc#ec#ab#
hTaiga aa/bs#aa/bs/ts#bs/ts#bs#cbc#bec#bec/
ctc#bts#ec#ab#hCold mixed forest aa/bs#aa/bs/ts#bs/ts#bs#ec#bec/ctc#
ctc1#bts#ts
1#ab#h
Cool conifer forest aa/bs#aa/bs/ts#bs/ts#bs#bec#bec/ctc#ec#bts#ts
1#ab#h
Temperate deciduous forest aa/bs#aa/bs/ts#bs/ts#bs#bec/ctc#ctc1#
ec#bts# ts#ts/wte#wte1#ts
1#ts
2#h
Cool mixed forest aa/bs#aa/bs/ts#bs/ts#bs#cbc#bec#bec/ctc#ec#bts#ts#ts/wte#ts
1#h
Warm mixed forest aa/bs/ts#bs/ts#ec#ts/wte#bts#ts#ts1#
ts2#wte#wte
1#h
Xerophytic wood/scrub ts/wte#wte#wte2#ec#g
Cool desert df#sf/dfHot desert df#sf/df#wdfCool steppe cgs#sf/df#sf#gWarm steppe wgs#sf/df#sf#g
3.3 PFT to biome assignment and biome reconstruction
Northern Eurasian biomes with their associated PFTs are listed inTable 3. In order to relate a given pollen or macrofossil assemblageto the appropriate biome, the scores of each biome from Table 3 arecalculated, using a summation of the square roots of its character-istic PFTs. Ultimately, the biome with highest score or the onedefined by a smaller number of taxa (when several biomes have thesame score) is chosen (Prentice et al. 1996). The scores of virtualPFTs mentioned already (Table 2) are reassigned according to thebiome finally selected. Peyron et al. (1998) demonstrated that thePFT re-assignment has no influence on the biome assignment, butprovides a better calibration of the PFTs derived from the assembledmodern pollen spectra.
3.4 Calibration of PFTs
The PFT scores derived from the modern pollen data set calculatedfor each of 1245 surface spectra were then calibrated against themodern climatic variables. An artificial neural network (ANN)method, described in Peyron et al. (1998), is used to estimate therelationships between the PFT scores of modern pollen spectra andthe climatic parameters estimated at the modern pollen sites. TheANN is a very flexible nonlinear method, consisting of a numberinterconnected processors called neurodes (Guiot et al. 1996). Ac-cording to the terminology of the ANN method a signal comingfrom input variables (here, PFT scores of modern pollen spectra)passes through these neurodes to reach the output variables (here,climatic variables estimated at the modern pollen sites). The inter-connections are defined by coefficients which are adjusted to fit bestthe output variables (Peyron et al. 1998). Before applying the resultsof the calibration to fossil spectra, the accuracy of the calibrationwas tested by performing reconstructions of the climate of eachmodern surface spectra. The statistical correlation between actualand reconstructed climate variables at the sampling sites providesa strong test of the method. All the correlations are statisticallysignificant (Table 4), but P
annhas a lower correlation (0.70) than the
other variables ('0.90).Box plots showing the results of the reconstructed modern climate
against the actual climate estimates are given in Fig. 2. The boxesrepresent the 5—95% confidence range of the corresponding observa-tions, for each class of reconstructed climate. These error bars make
Table 4 Correlation between modern pollen-inferred and observedvalues of climatic variables at the modern surface pollen samplingsites
Variable Correlation (r)
¹c
0.94¹
w0.93
¹ann
0.96GDD5 0.95a 0.90Pann
0.70
it possible to define the 90%-confidence level of the estimatedpalaeoclimatic variables. For example, if the reconstructed P
annis
280 mm (e.g. it lies within class 200—300 mm), the correspondingmodern P
annclass is 120—480 mm. The lower and upper error bars
for the reconstructed Pann
anomaly (18 kBP minus modern), there-fore, range from —160 to #200 mm of the reconstructed anomalyvalue.
3.5 Climate reconstruction and coherency analysis
PFT scores were obtained for the fossil data set by the same methodas for the modern pollen assemblages. The results of the PFT-climate calibration obtained for the modern data set (Sect. 3.4) werethen applied to the calculated scores to reconstruct the LGM cli-mate. We compared reconstructed absolute values of six climaticvariables (Table 5) with the estimated modern climate at each site inorder to define climatic anomalies (Table 6). The error ranges for ourreconstructed anomalies of LGM climate (Table 6), are large, espe-cially for ¹
c, and the initial impression is that the quality of fit is low.
In order to check this impression, a site by site comparison wasmade, between LGM biomes derived from biological records (by themethod described above) and biomes calculated by applying BI-OME1 model (Prentice et al. 1992) to the reconstructed climatevalues. Both sets of biomes are presented in Table 5. At 15 sites, theclimate- and pollen-based biomes are identical. At the other sites,very similar biomes (e.g. tundra-cool steppe or cool conifer forest-cool mixed forest) have been reconstructed and for these, only
232 Tarasov et al.: Last Glacial Maximum climate of the former Soviet Union and Mongolia

Fig. 2 Box plots of the estimated modern climate variables againstclimate reconstructed from PFT scores. The boxes represent the5—95% confidence interval of the modern estimates, and allow
confidence intervals to be used in the reconstruction of palaeocli-matic variables
Tarasov et al.: Last Glacial Maximum climate of the former Soviet Union and Mongolia 233

Table 5 LGM biomes derived from pollen and macrofossil data, and from reconstructed absolute values of climatic characteristics. (TUND,tundra; TAIG, taiga; CLDE, cold deciduous forest; COCO, cool conifer forest; COMX, cool mixed forest; COST, cool steppe)
Site name LGM biome derived from Absolute values of LGM climate
Pollen Climate ¹c, °C ¹
w, °C ¹
ann, °C GDD5, a, % P
ann, mm
°C day
Apiancha COMX COMX !8 17 4 1370 95 747Kobuleti COMX COMX !7 18 5 1451 93 640Manavi COST COST !8 20 6 2174 50 277Sukhumi COCO COMX !4 19 7 1857 87 666Anetovka II COST COST !28 14 !7 679 54 193Korman COST COST !29 14 !8 566 57 193Alymka TUND TAIG !28 13 !8 442 83 310Ayakli-Melkoe COST COST !29 14 !7 610 55 191Chulym TUND COST !30 13 !8 515 59 192Demyanskoe COST TUND !32 11 !10 229 86 297Fabrika 1 Maya COST TUND !32 12 !10 245 82 264Igarskaya Ob TUND TUND !31 12 !9 287 85 299Isha COST CLDE !29 13 !7 514 72 254Kolpashevo TUND TUND !32 11 !10 231 82 265Krasnyi Yar COST TUND !31 11 !10 245 88 311Krivosheino COST COST !29 14 !7 598 56 191Malaya Kheta COST CLDE !30 13 !8 444 68 227Mega COST CLDE !29 13 !8 513 66 232Nadymskaya Ob COST CLDE !30 13 !9 428 69 228Prizhim COST COST !27 15 !6 751 57 215Puchka TUND COST !27 15 !6 787 52 197Sakhta COST CLDE !31 12 !9 370 70 224Serpievskaya COST COST !25 15 !5 825 58 227Skorodum TUND COST !29 14 !7 589 56 191Skv-469 TAIG TUND !32 11 !10 225 84 274Tugiyany TUND TUND !32 11 !10 223 83 271Veselo-Voznesenskoe TAIG TAIG !26 13 !6 507 88 367Voronovo COST COST !29 14 !8 565 59 199Zagvozdino COST TUND !33 11 !11 202 84 267Hoton COST CLDE !30 13 !8 467 67 223Kerulen COST TUND !31 12 !10 307 76 248Tsagan-Mort-Nur TAIG TAIG !28 13 !7 501 76 279
a small change of reconstructed climate value is sufficient to givethe correct biome. For example, at the site of Chulym in Siberia,pollen-based reconstruction suggests tundra, and steppe was recon-structed from the mean values of LGM climate. In the biomemodel the boundary between continental tundra and cool steppe isGDD5"500 °C day. In our reconstruction this value is 515 °C day,thus at Chulym, different biomes were assigned by the two methodsby a margin of 15 °C day. The results of this test would suggest thatthe confidence level of reconstructed mean values of LGM climaticvariables is sufficiently high.
4 Results
The calculation of PFT and biome scores, carried outin the present study, shows a distribution of biomessimilar to that obtained by Tarasov et al. (1998c), usingthe standard method of biome reconstruction of Pren-tice et al. (1996). An improvment here was the ability todefine the steppe as cool steppe (Table 5). Tundra andcool steppe, evidenced by presence of arctic-alpine andboreal elements in the pollen assemblages, are charac-teristic features of the LGM landscape in the northern
mid-latitudes between 20 °E and 120 °E, where forestsdominated by boreal and temperate deciduous treesgrow today. At 18 kBP these types of forests werereconstructed at only a limited number of sites closeto the eastern coast of the Black Sea.
The remarkable change in the vegetation indicatesa LGM climate fundamentally different from that oftoday. Reconstructed anomalies of the six climatic vari-ables (Table 6) from the present climate have been usedto map patterns of the LGM climate (Fig. 3a—f ). Themap of pollen- and macrofossil-derived LGM biomeshas been placed on the same figure (Fig. 3g), in order toshow how the LGM vegetation relates to the climateanomalies. The most important results from Fig. 3 andTable 6 may be summarised as follows:1. At all sites in the FSU and Mongolia, the 18 kBP
climate was colder than present, both in winter (Fig.3a) and in summer (Fig. 3b), and consequentlythroughout the year (Fig. 3c). A reduced sum ofGDD5 in this period, (Fig. 3d) may reflect colderthan present 18 ka summers and/or a shorter veg-etation period. The reconstructed temperature
234 Tarasov et al.: Last Glacial Maximum climate of the former Soviet Union and Mongolia
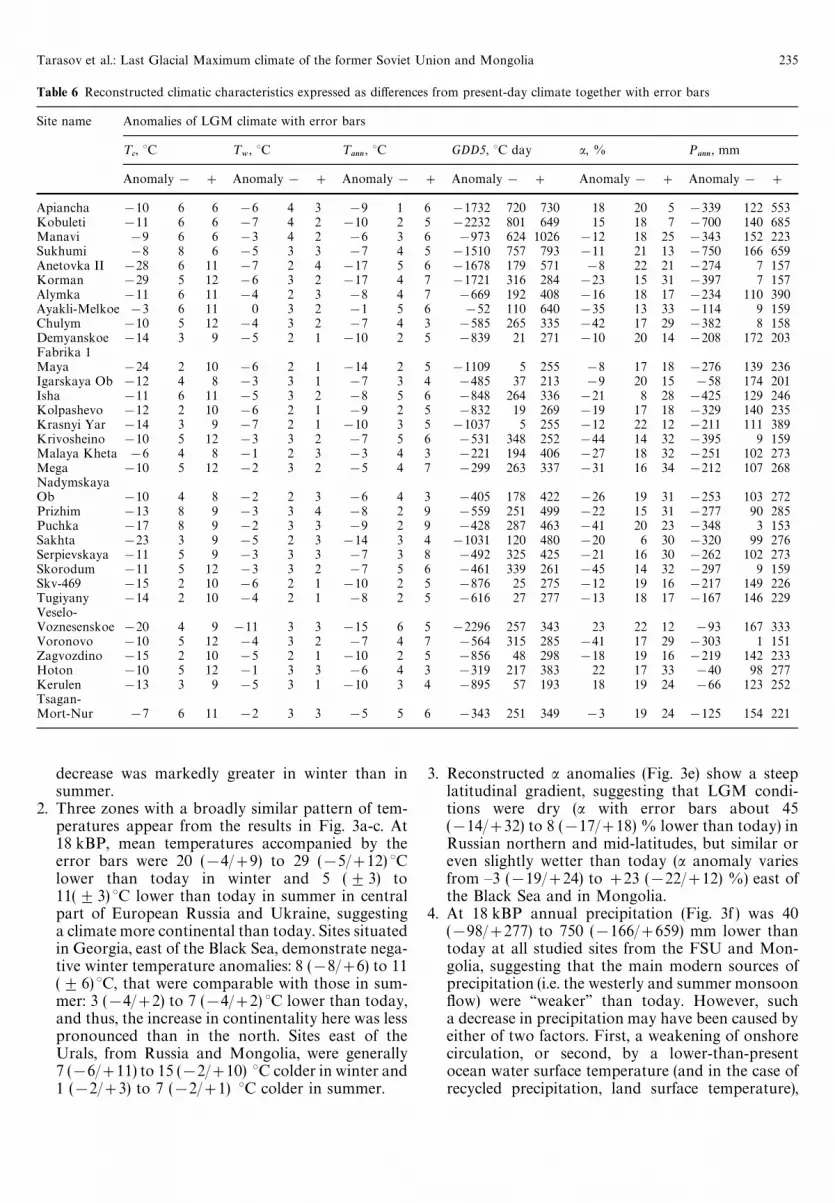
Table 6 Reconstructed climatic characteristics expressed as differences from present-day climate together with error bars
Site name Anomalies of LGM climate with error bars
¹c, °C ¹
w, °C ¹
ann, °C GDD5, °C day a, % P
ann, mm
Anomaly! # Anomaly! # Anomaly! # Anomaly! # Anomaly! # Anomaly! #
Apiancha !10 6 6 !6 4 3 !9 1 6 !1732 720 730 18 20 5 !339 122 553Kobuleti !11 6 6 !7 4 2 !10 2 5 !2232 801 649 15 18 7 !700 140 685Manavi !9 6 6 !3 4 2 !6 3 6 !973 624 1026 !12 18 25 !343 152 223Sukhumi !8 8 6 !5 3 3 !7 4 5 !1510 757 793 !11 21 13 !750 166 659Anetovka II !28 6 11 !7 2 4 !17 5 6 !1678 179 571 !8 22 21 !274 7 157Korman !29 5 12 !6 3 2 !17 4 7 !1721 316 284 !23 15 31 !397 7 157Alymka !11 6 11 !4 2 3 !8 4 7 !669 192 408 !16 18 17 !234 110 390Ayakli-Melkoe !3 6 11 0 3 2 !1 5 6 !52 110 640 !35 13 33 !114 9 159Chulym !10 5 12 !4 3 2 !7 4 3 !585 265 335 !42 17 29 !382 8 158Demyanskoe !14 3 9 !5 2 1 !10 2 5 !839 21 271 !10 20 14 !208 172 203Fabrika 1Maya !24 2 10 !6 2 1 !14 2 5 !1109 5 255 !8 17 18 !276 139 236Igarskaya Ob !12 4 8 !3 3 1 !7 3 4 !485 37 213 !9 20 15 !58 174 201Isha !11 6 11 !5 3 2 !8 5 6 !848 264 336 !21 8 28 !425 129 246Kolpashevo !12 2 10 !6 2 1 !9 2 5 !832 19 269 !19 17 18 !329 140 235Krasnyi Yar !14 3 9 !7 2 1 !10 3 5 !1037 5 255 !12 22 12 !211 111 389Krivosheino !10 5 12 !3 3 2 !7 5 6 !531 348 252 !44 14 32 !395 9 159Malaya Kheta !6 4 8 !1 2 3 !3 4 3 !221 194 406 !27 18 32 !251 102 273Mega !10 5 12 !2 3 2 !5 4 7 !299 263 337 !31 16 34 !212 107 268NadymskayaOb !10 4 8 !2 2 3 !6 4 3 !405 178 422 !26 19 31 !253 103 272Prizhim !13 8 9 !3 3 4 !8 2 9 !559 251 499 !22 15 31 !277 90 285Puchka !17 8 9 !2 3 3 !9 2 9 !428 287 463 !41 20 23 !348 3 153Sakhta !23 3 9 !5 2 3 !14 3 4 !1031 120 480 !20 6 30 !320 99 276Serpievskaya !11 5 9 !3 3 3 !7 3 8 !492 325 425 !21 16 30 !262 102 273Skorodum !11 5 12 !3 3 2 !7 5 6 !461 339 261 !45 14 32 !297 9 159Skv-469 !15 2 10 !6 2 1 !10 2 5 !876 25 275 !12 19 16 !217 149 226Tugiyany !14 2 10 !4 2 1 !8 2 5 !616 27 277 !13 18 17 !167 146 229Veselo-Voznesenskoe !20 4 9 !11 3 3 !15 6 5 !2296 257 343 23 22 12 !93 167 333Voronovo !10 5 12 !4 3 2 !7 4 7 !564 315 285 !41 17 29 !303 1 151Zagvozdino !15 2 10 !5 2 1 !10 2 5 !856 48 298 !18 19 16 !219 142 233Hoton !10 5 12 !1 3 3 !6 4 3 !319 217 383 22 17 33 !40 98 277Kerulen !13 3 9 !5 3 1 !10 3 4 !895 57 193 18 19 24 !66 123 252Tsagan-Mort-Nur !7 6 11 !2 3 3 !5 5 6 !343 251 349 !3 19 24 !125 154 221
decrease was markedly greater in winter than insummer.
2. Three zones with a broadly similar pattern of tem-peratures appear from the results in Fig. 3a-c. At18 kBP, mean temperatures accompanied by theerror bars were 20 (!4/#9) to 29 (!5/#12) °Clower than today in winter and 5 ($3) to11($3) °C lower than today in summer in centralpart of European Russia and Ukraine, suggestinga climate more continental than today. Sites situatedin Georgia, east of the Black Sea, demonstrate nega-tive winter temperature anomalies: 8 (!8/#6) to 11($6) °C, that were comparable with those in sum-mer: 3 (!4/#2) to 7 (!4/#2) °C lower than today,and thus, the increase in continentality here was lesspronounced than in the north. Sites east of theUrals, from Russia and Mongolia, were generally7 (!6/#11) to 15 (!2/#10) °C colder in winter and1 (!2/#3) to 7 (!2/#1) °C colder in summer.
3. Reconstructed a anomalies (Fig. 3e) show a steeplatitudinal gradient, suggesting that LGM condi-tions were dry (a with error bars about 45(!14/#32) to 8 (!17/#18) % lower than today) inRussian northern and mid-latitudes, but similar oreven slightly wetter than today (a anomaly variesfrom —3 (!19/#24) to#23 (!22/#12) %) east ofthe Black Sea and in Mongolia.
4. At 18 kBP annual precipitation (Fig. 3f ) was 40(!98/#277) to 750 (!166/#659) mm lower thantoday at all studied sites from the FSU and Mon-golia, suggesting that the main modern sources ofprecipitation (i.e. the westerly and summer monsoonflow) were ‘‘weaker’’ than today. However, sucha decrease in precipitation may have been caused byeither of two factors. First, a weakening of onshorecirculation, or second, by a lower-than-presentocean water surface temperature (and in the case ofrecycled precipitation, land surface temperature),
Tarasov et al.: Last Glacial Maximum climate of the former Soviet Union and Mongolia 235

Fig. 3 Reconstructed LGM climate anomalies expressed as 18 kBP minus modern values and pollen- and plant macrofossil-derived biomesat 18 kBP
reducing the transport of water vapor into the conti-nents. The apparent discrepancy between a majordecrease (even with the large error bars taken intoaccount) in precipitation and the positive a
anomalies in the southern mid-latitudes (e.g. Geor-gia and Mongolia) is interesting. It suggests that forthe regional water balance, the change of input (here,decreased precipitation) was less important than
236 Tarasov et al.: Last Glacial Maximum climate of the former Soviet Union and Mongolia

change in output (here, decreased evaporation dueto lower-than-present temperatures), with the conse-quence that a was at a higher level than today.
5 Discussion
A few continental-scale reconstructions of the LGMclimate based on the palaeoecological data have pro-vided quantitative results for the FSU and Mongolia.Peterson et al. (1979) compiled a synthesis of the avail-able geological records across the globe. Their mapsshowed a mean temperature of the coldest month some18 °C lower than today in the central part of EuropeanRussia, consistent with our interpretation. A pollen-based, non-statistical climate reconstruction from theVeselo-Voznesenskoe site, used in the present study,was presented by Markov (1976). This suggested that atthe LGM, ¹
annwas 20 °C less than today and P
annwas
375 mm. These values correspond to our results.Frenzel et al. (1992) presented reconstructions of
mean February and August temperatures and meanannual temperature and precipitation based on varioussources of geological information. A visual comparisonwith our results shows great similarity in the not onlythe reconstructed temperatures and precipitation, butalso in the latitudinal gradient of temperatures in theEuropean part of the continent. Some differences existbetween the two reconstructions, but in the absence ofan explanation of the method of interpretation in theFrenzel et al. (1992), or information about the sites usedin their study, it is impossible to analyse the reasons forthe observed discrepancies.
The comparison of our results with the publishedoutput of the GCM simulations of the full-glacialclimate is more complex. The global coupled ocean-atmosphere model CLIMBER-2 (Ganopolski et al.1998) has produced summer and winter temperatureanomalies similar to our reconstructions, notably, thesimulation of markedly colder summer (6 to 15 °Clower than today) in the Mediterranean and the BlackSea regions. The model also suggests that the LGMsummer precipitation values were much lower thantoday across northern Eurasia, as a result of a south-ward shift in the storm track over the Atlantic anda strongly reduced Asian summer monsoon. The simu-lation shows no difference from the present precipita-tion values in winter time in the broad band from theMediterranean Basin through central Siberia and tonorthern Mongolia. Also, the model produced muchcolder conditions in northern Siberia.
COHMAP climate-model experiments (Kutzbachet al. 1993) demonstrated LGM July temperatureanomalies that were greater in European Russia butsimilar to our reconstruction in Asia. In contrast, theJanuary temperature anomalies simulated by CO-HMAP were similar in European Russia, but larger in
Asia. Tests by Kutzbach et al. (1993) with less NorthAtlantic sea ice (15 ° latitude farther north), show betteragreement with our data in terms of mean Januarytemperature. The model was also tested with a reduc-tion of 20% in the height of the ice sheets over NorthAmerica. The simulated January and July temperaturesfrom this test show much better agreement with thedata from our reconstruction, in particular, it is able tosimulate the maximum differences from present-dayJuly temperature in southwestern Europe and gener-ally greater temperature anomalies in Europe thanAsia.
Pollard and Thompson (1997), using a GCM GEN-ESIS version 2.0a with ice sheets prescribed from bothPeltier (1994) and CLIMAP (1981) reconstructions,simulated LGM mean winter temperatures over a largepart of northern Eurasia up to 6 °C colder than today,therefore warmer than indicated by our reconstruction.However, the simulated pattern of mean summer tem-peratures parallel our results, showing very small dif-ferences from the present in northern Asia and muchlarger anomalies in Europe.
Crowley and Baum (1997), using the same GENESISGCM, tried to estimate the effect of vegetation changeon an ice-age climate simulation. Their results are in-deed interesting and demonstrate that the turnoverfrom boreal conifer forest to tundra vegetation causesmean annual cooling of 4—12 °C or more in Europeand Siberia, suggesting that the vegetation cover itselfis important boundary condition of the LGM. Thesimulated annual precipitation was lower than todayacross the whole of Eurasia.
An overestimated size of the Eurasian ice sheet usedas one of the boundary conditions in the GCM simula-tions may be responsible for the mentioned disagree-ment with results coming from the biological records.The need to modify the position of the glacial marginmapped by CLIMAP has been already suggested bypalaeorecords from Eurasia and North America (Peter-son et al. 1979). Sensitivity experiments to sea-surfacetemperatures, sea-ice extent and ice-sheet reconstruc-tions for the LGM climate performed with LMDversion 4 AGCM demonstrated that a change of theice-sheet topography (e.g. CLIMAP 1981 or Peltier1994 data sets) may cause large variations in seasonaland regional temperature distribution (Ramstein andJoussaume 1995).
Reconstructed temperature and precipitation pat-terns in the FSU and Mongolia are consistent withqualitative climatic interpretation of LGM biome dis-tribution made by Tarasov et al. (1998c). In their study,the reconstructed patterns of biome and climate areexplained by large scale changes in the atmosphericcirculation suggested by the GCMs and lake-level data(Harrison et al. 1996). These are the development ofanticyclonic circulation over Europe caused by theextended Scandinavian ice sheet (Harrison et al. 1992)and the southward shift of the westerly jet caused by
Tarasov et al.: Last Glacial Maximum climate of the former Soviet Union and Mongolia 237

the Laurentide ice sheet (COHMAP Members 1988).The continental ice sheet, which extended from Scandi-navia and the Kola Peninsula in Northern Russia as fareast as the Polar Ural (Velichko et al. 1997), produceda strong, cold and dry northeasterly flow acrossEurope, implying a climate much colder than present,and with decreased annual precipitation in Ukraine,European Russia and Georgia. Much colder than pres-ent winters over northern Eurasia are consistent withthe simulated strengthening of the winter high pressureover the northern Eurasia mid-latitudes (Kutzbachet al. 1993). Currently, anomalously cold winters inEurope and western Siberia are associated with thestrengthened Asian High, producing colder anticyc-lonic weather over a large area of the continent, andwith a weakened westerly flow (Martyn 1992). Today,the westerlies and associated storms are a main sourceof precipitation across Europe and Siberia. The south-ward shift of westerly storm tracks should, therefore,contribute to the lower than present precipitationvalues at LGM. A strongly reduced summer monsoonwas one of the main causes of decreased LGM precipi-tation in eastern Asia, as suggested by the climatecimulations (Kutzbach et al. 1993), and by thepalaeoecological data from China (Winkler and Wang1993). Reduced temperatures and decreased evapor-ation losses resulted in a climate similar to, or slightlywetter than today in the southern mid-latitudes (e.g. inGeorgia and in Mongolia). There is no available lake-level data from the FSU and Mongolia to provide anindependent information on the water balance of thisarea at 18 kBP (Harrison et al. 1996). However, lakerecords from Europe (Harrison et al. 1996) demonstratethat LGM conditions were wetter than those today inthe Mediterranean zone and drier than today close tothe Scandinavian ice sheet. The latitudinal gradient inthe moisture conditions reconstructed from lake-leveldata is similar to that seen in our pollen-based recon-struction.
6 Summary and conclusion
The LGM climate reconstruction derived from pollenand macrofossil records of the FSU and Mongolia,confirms again the ability of the new transfer functionexploiting the PFT concept of the biome reconstruc-tion method to provide spatially coherent results forperiods with environments fundamentally differentfrom modern. Whilst the results do not differ greatlyfrom previous quantitative reconstructions derived fromgeological records, they are obtained with an objectivemethod applied to a better-dated data set in a morerobust and comprehensive way. For the future, more dataare needed to fill gaps in vegetation and climate recon-struction over northern Eurasia.
A comparison of our results and the output of severalGCM simulations clearly demonstrates that the models
can predict both the magnitude and the spatial patternof the reconstructed climatic parameters. No onemodel, however, is able to accurately simulate all theclimate variables. The GCM results discussed here,were each based on different boundary conditions forthe LGM, and variations in these boundary conditions(e.g. different height or extension of the continental andsea ice) can show large-scale changes in the GCMoutput (Kutzbach et al. 1993; Felzer et al. 1996). Therecent PMIP experiments performed using 18 GCMswith the same boundary conditions, will therefore pro-vide a better opportunity to evaluate the ability of eachmodel to simulate the LGM climate reconstructedfrom geological records.
Acknowledgements PT thanks Delegation aux Relations Internatio-nales et a la Cooperation (Ministere de l’Education Nationale, del’Enseignement Superieur, et de la Recherche) for the financial sup-port. The present work is a contribution to the IGBP/PAGESsponsored PMIP project and has been funded by EEC contractENV4-CT95-0075. We thank the EPD (Arles, France), from wherepart of the LGM records are available. We also would like to thankT. Webb III and anonymous reviewer whose suggestions and criticalcomments were used to improve this paper.
References
Arap RY, Stanko VN, Starkin VN (1990) Prirodnaya sreda i razvitiekhoziaistva pozdnepalioliticheskogo cheloveka v basseine rekiYuzhnyi Bug. In: Chetvertichnyi: metody issledovaniya, stratig-rafiya i ekologiya. Abstr VII Symp the USSR, Tallinn, pp 31—32(in Russian)
Bakhareva VA (1983) Palinologicheskaya kharakteristika otlozheniivtorykh nadpoimennykh terras nizov’ev Irtysha. In: Oledeneniyai paleoklimaty Sibiri v pleistotsene, Novosibirsk Institute Geol-ogy and Geophysics Press, pp 78—88 (in Russian)
Broccoli AJ, Marciniak EP (1996) Comparing simulated glacialclimate and paleodata: a reexamination. Paleoceanography11(1) : 3—11
Bukreeva GF (1966) Sopostavlenie chetvertichnykh otlozheniiv raione sela Voronovo na reke Obi po dannym sporovo-pyl’tsevogo analiza. In: Palinologiya i stratigrafiya chetvertich-nykh otlozhenii basseinov rek Obi i Eniseya, Nauka, Moscow,pp 7—9 (in Russian)
Bukreeva GF, Poleshchuk VP (1970) Sporovo-pyl’tsevaya kharak-teristika osnovnykh razrezov pozdnepliotsenovykh i chetvertich-nykh otlozhenii. In: Istoriya razvitiya rastitel’nosti vnelednikovoizony Zapadno-Sibirskoi nizmennosti v pozdnepliotsenovoe ichetvertichnoe vremya, Nauka, Moscow, pp 128—163 (in Rus-sian)
Chebotareva NS, Makarycheva IA (1974) Poslednee oledenenie Ev-ropy i ego geokhronologiya. Nauka, Moscow, 215 pp (in Russian)
Cheddadi R, Yu G, Guiot J, Harrison SP, Prentice IC (1997) Theclimate of Europe 6000 years ago. Clim Dyn 13 : 1—9
CLIMAP (Climate: Long-Range Investigation, Mapping and Pre-diction Project) Members (1981) Seasonal reconstructions of theEarth’s surface at the last glacial maximum. Map Chart Series,MC-36. American Geological Society, Boulder, Colorado, USA
COHMAP Members (1988) Climatic changes of the last 18,000years: observations and model simulations. Science241 : 1043—1052
Crowley TJ, Baum SK (1997) Effect of vegetation on an ice-ageclimate model simulation. J Geophysi Res 102(D14) :16 463—16 480
238 Tarasov et al.: Last Glacial Maximum climate of the former Soviet Union and Mongolia

Felzer B, Oglesby RJ, Webb III T, Hyman DE (1996) Sensitivity ofa general circulation model to changes in Northern Hemisphereice sheets. J Geophys Res Atmos 101 : 19 077—19 092
Felzer B, Webb III T, Oglesby RJ (1998) The impact of ice sheets,CO
2, and orbital insolation on late Quaternary climates: sensi-
tivity experiments with a general circulation model. Quat Sci Rev(in press)
Frenzel B, Pecsi M, Velichko AA (1992) Atlas of paleoclimates andpaleoenvironments of the Northern Hemisphere. Gustav Fischer,Stuttgart, 153 pp
Ganopolski A, Ramstorf S, Petoukhov V, Claussen M (1998) Simu-lation of modern and glacial climates with a coupled globalmodel of intermediate complexity. Nature 391 : 351—356
Gerasimov IP (ed) (1964) Fiziko-Geograficheskii Atlas Mira, USSRAcademy of Sciences press, Moscow, 298 pp
Gerasimov IP, Velichko AA (1982) Paleogeografiya Evropy za pos-lednie sto tysyach let. Atlas-Monografiya. Nauka, Moscow, 156pp (in Russian)
Golubeva LV (1976) Rastitel’nost’ Severo-Vostochnoi Mongoliiv pleistotsene i golotsene. In: Lavrenko EM, Rachkovskaya EI(eds) Struktura i dinamika osnovnykh ekosistem MNR, Nauka,Leningrad, pp 59—71 (in Russian)
Grichuk VP (1984) Late Pleistocene vegetation history. In: VelichkoAA (ed) Late Quaternary environments of the Soviet Union, ppUniversity of Minnesota Press, Minneapolis, pp 155—179
Guiot J (1990) Methodology of palaeoclimatic reconstruction frompollen in France. Palaeogeog Palaeoclim Palaeoecol 80 : 49—69
Guiot J, Goeury C (1996) PPPBASE, a software for statisticalanalysis of paleoecological and paleoclimatological data. Dendro-chronologia 14 : 295—300
Guiot J, Pons A, de Beaulieu JL, Reille M (1989) A 140 000 yearclimatic reconstruction from two European records. Nature338 : 309—313
Guiot J, de Beaulieu JL, Cheddadi R, David F, Ponel P, ReilleM (1993a) The climate in Western Europe during the last Gla-cial/Interglacial cycle derived from pollen and insect remains.Palaeogeog Palaeoclim Palaeoecol 103 : 73—94
Guiot J, Harrison SP, Prentice IC (1993b) Reconstruction of Holo-cene precipitation patterns in Europe using pollen and lake-leveldata. Quat Res 40 : 139—149
Guiot J, Cheddadi R, Prentice IC, Jolly D (1996) A method of biomeand land surface mapping from pollen data: application to Euro-pe 6000 years ago. Palaeoclimates 1 : 311—324
Harrison SP, Prentice IC, Bartlein PJ (1992) Influence of insolationand glaciation on atmospheric circulation in the North Atlanticsector: implications of general circulation model experimentsfor the late Quaternary climatology of Europe. Quat Sci Rev11 : 283—300
Harrison SP, Yu G, Tarasov PE (1996) Late Quaternary lake-levelrecord from northern Eurasia. Quat Res 45 : 138—159
Hewitt CD, Mitchell JFB (1997) Radiative forcing and responce ofa GCM to ice age boundary conditions: cloud feedback andclimate sensitivity. Clim Dyn 13 : 821—824
Huntley B, Prentice IC (1988) July temperatures in Europe frompollen data, 6000 years before present. Science 241 : 687—690
Huntley B, Prentice IC (1993) Holocene Vegetation and Climates ofEurope. In: Wright HE, Kutzbach JE, Webb III T, RuddimanWF, Street-Perrott FA, Bartlein PJ (eds) Global climates sincethe Last Glacial Maximum. University of Minnesota Press, Min-neapolis, pp 136—168
Joussaume S, Taylor D (1995) Status of the palaeoclimate modellingintercomparison project (PMIP). In: Proc First Int AMIP SciConf. World Meteorology Organisation, Geneva, pp 425—430
Kind NV (1974) Geokhronologiya pozdnego antropogena poizotopnym dannym. Nauka, Moscow, 255 pp (in Russian)
Krivonogov SK (1988) Stratigrafiya i paleogeografiya NizhnegoPriirtysh’ya v epokhu poslednrego oledeneniya po kar-pologicheskim dannym. Nauka, Novosibirsk, 231 pp (in Russian)
Kutzbach JE, Guetter PJ, Behling PJ, Selin R (1993) Simulatedclimatic changes: results of the COHMAP climate-model experi-
ments. In: Wright HE, Kutzbach JE, Webb III T, Ruddiman WF,Street-Perrott FA, Bartlein PJ (eds) Global climates since theLast Glacial Maximum. University of Minnesota Press, Min-neapolis, pp 24—93
Kvavadze EV, Dzheiranashvili VG (1987) Palynologicheskayakharakteristika verkhnepleistotsenovykh i golotsenovykh otloz-henii Kobuleti. Soobshcheniya Akademii Nauk Gruzinskoi SSR127(1) : 189—192 (in Russian)
Kvavadze EV, Aslanishvili PL, Dzheiranashvili VG (1984) Palin-ologicheskaya kharakteristika verkhnepleistotsenovykh i golot-senovykh otlozhenii Sukhumi. Soobshcheniya Akademii NaukGruzinskoi SSR 115(3) : 657—660 (in Russian)
Lazukov GI, Sokolova NS (1959) Nekotorye voprosy paleogeografiii stratigrafii chetvertichnykh otlozhenii nizov’ev Obi. In: Led-nikovyi period Evropeiskoi chasti SSSR i Sibiri. Moscow Uni-versity press, pp 343—360 (in Russian)
Leemans R, Cramer W (1991) The IIASA climate database for meanmonthly values of temperature, precipitation and cloudiness ona global terrestrial grid. RR-91—18. International Institute ofApplied Systems Analysis, Laxenburg
Levina TP (1979) Palinologicheskaya kharakteristika otlozheniipozdnechetvertichnoi lednikovoi epokhi v doline Srednei Obi.In: Volkova VS (ed) Stratigrafiya i palinologiya mezozoyai kainozoya Sibiri. Nauka, Novosibirsk, pp 74—98
Markov KK (ed) (1976) Razrez noveishikh otlozhenii Severo-Vostochnogo Priazovya. Moscow University press, 158 pp (inRussian)
Martyn D (1992) Climates of the World. Developments in atmo-spheric sciences 18. Elsevier, Amsterdam, 435 pp
Pashkevich GA (1977) Palinologicheskoe issledovanie razrezastoyanki Korman IV. In: Mnogosloinaya paleoliticheskayastoyanka Korman IV. Nauka, Moscow, pp 105—111 (in Russian)
Peltier WR (1994) Ice age paleotopography. Science 265 : 195—201Peterson GM, Webb III T, Kutzbach JE, van der Hammen T,
Wijmstra TA, Street FA (1979) The continental record of envir-onmental conditions at 18,000 B.P.: an initial evaluation. QuatRes 12 : 47—82
Peyron O, Guiot J, Cheddadi R, Tarasov PE, Reille M, de BeaulieuJ-L, Bottema S, Andrieu V (1998) Climatic reconstruction inEurope from pollen data, 18 000 years before present. Quat Res49 : 183—196
Pisareva VV (1971) Sporovo-pyl’tsevye spektry neogenovykh i chet-vertichnykh otlozhenii severa tsentral’nykh raionov Russkoiplatformy i ikh stratigraficheskoe znachenie. Unpubl Cand SciDiss, Department of Geology, Moscow State University, Mos-cow, 212 pp (in Russian)
Pollard D, Thompson SL (1997) Climate and ice-sheet mass balanceat the Last Glacial Maximum from the GENESIS version 2Global Climate Model. Quat Sci Rev 16 : 841—863
Prentice IC, Webb III T (1998) BIOME 6000: global paleovegeta-tion maps and testing global biome models. J Biogeogr (inpress)
Prentice IC, Cramer W, Harrison SP, Leemans R, Monserud RA,Solomon AM (1992) A global biome model based on plantphysiology and dominance, soil properties and climate. J Bio-geogr 19 : 117—134
Prentice IC, Guiot J, Huntley B, Jolly D, Cheddadi R (1996) Recon-structing biomes from palaeoecological data: a general methodand its application to European pollen data at 0 and 6 ka. ClimDyn 12 : 185—194
Ramstein G, Joussaume S (1995) Sensetivity experiments to seasurface temperatures, sea-ice extent and ice-sheet reconstruction,for the Last Glacial Maximum. Ann Glaciol 21 : 343—347
Semenenko LT, Aleshinskaya ZV, Arslanov KA, Valueva MN,Krasnovskaya FI (1981) Opornyi razrez verkhnego pleistotsenau fabriki ‘Pervoe Maya’ Dmitrovskogo raiona Moskovskoi ob-lasti (otlozheniya drevnego Tatishchevskogo ozera). In: Novyedannye po stratigrafii i paleogeografii verhnego pliotsena i pleis-totsena Tsentral’nykh raionov SSSR. Nauka, Moscow, pp121—135 (in Russian)
Tarasov et al.: Last Glacial Maximum climate of the former Soviet Union and Mongolia 239

Smirnov NG, Bol’shakov VN, Kosintsev PA, Panova NK, Ko-robeinikov YI, Ol’shvang VN, Erokhin NG, Bykova GV (1990)Istoricheskaya ekologiya zhivotnykh gor Yuzhnogo Urala.Sverdlovsk Institute of Plant and Animal Ecology Press, 244 pp(in Russian)
Tarasov PE, Pushenko MY, Harrison SP, Saarse L, Andreev AA,Aleshinskaya ZV, Davydova NN, Dorofeyuk NI, Efremov YV,Elina GA, Elovicheva YK, Filimonova LV, Gunova VS,Khomutova VI, Kvavadze EV, Neustrueva IY, Pisareva VV,Sevastyanov DV, Shelekhova TS, Subetto DA, Uspenskaya ON,Zernitskaya VP (1996) Lake Status Records from the FormerSoviet Union and Mongolia: Documentation of the SecondVersion of the Data Base. NOAA Paleoclimatology PublicationsSeries Rep 5. Boulder, 224 pp
Tarasov PE, Webb III T, Andreev AA, Afanas’eva NB, Berezina NA,Bezusko LG, Blyakharchuk TA, Bolikhovskaya NS, CheddadiR, Chernavskaya MM, Chernova GM, Dorofeyuk NI, DirksenVG, Elina GA, Filimonova LV, Glebov FZ, Guiot J, Gunova VS,Harrison SP, Jolly D, Khomutova VI, Kvavadze EV, OsipovaIM, Panova NK, Prentice IC, Saarse L, Sevastyanov DV, Vol-kova VS, Zernitskaya VP (1998a) Present-day and mid-Holocenebiomes reconstructed from pollen and plant macrofossil datafrom the former Soviet Union and Mongolia. J Biogeogr 25(in press)
Tarasov PE, Cheddadi R, Guiot J, Bottema S, Peyron O, BelmonteJ, Ruiz-Sanchez V, Saadi, FA, Brewer S (1998b) A method todetermine warm and cool steppe biomes from pollen data; ap-plication to the Mediterranean and Kazakhstan Regions. J QuatSci 13 : 335—344
Tarasov PE, Volkova VS, Webb III T, Guiot J, Andreev AA,Bezusko LG, Bezusko TV, Bykova GV, Dorofeyuk NI, KvavadzeEV, Osipova IM, Panova NK, Sevastyanov DV (1998c) LastGlacial Maximum Biomes reconstructed from pollen and
plant macrofossil data from northern Eurasia. J Biogeogr (inpress)
Tsereteli LD, Klopotovskaya NB, Kurenkova EL (1982) Mnogos-loinaya arheologicheskaya stoyanka Apiancha (Abkhazia). In:Chetvertichnaya sistema Gruzii. Metsniereba, Tbilisi, pp198—212 (in Russian)
Tumadzhanov II, Gogichaishvili LK (1969) Osnovnye cherty pos-lekhvalynskoi istorii lesnoi rastitel’nosti Iorskoi nizmennosti(Vostochnaya Gruziya). In: Neishtadt MI (ed) Golotsen. Nauka,Moscow, pp 183—194 (in Russian)
Velichko AA, Kononov YM, Faustova MA (1997) The last glaciationof Earth: size and volume of ice-sheets. Quat Int 41/42 : 43—51
Volkova VS (1970) Istoriya razvitiya rastitel’nosti vnelednikovoizony Zapadnoi Sibiri v pozdnepliotsenovoe i chetvertichnoevremya. Moscow, Nauka, 127 pp (in Russian)
Volkova VS, Nikolaeva IV (1982) Palinologicheskaya kharakteris-tika otlozhenii vtoroi terrasy Ishimskogo Priirtyshya. In: Prob-lemy stratigrafiii i paleogeografii pleistotsena Sibiri. Nauka,Novosibirsk, pp 123—155 (in Russian)
Winkler MG, Wang PK (1993) The Late-Quaternary Vegetationand Climate of China. In: Wright HE, Kutzbach JE, Webb III T,Ruddiman WF, Street-Perrott FA, Bartlein PJ (eds), Globalclimates since the Last Glacial Maximum. University of Min-nesota Press, Minneapolis, pp 265—293
Wright HE, Kutzbach JE, Webb III T, Ruddiman WF, Street-Perrott FA, Bartlein PJ (eds) (1993) Global climates since theLast Glacial Maximum. University of Minnesota Press, Min-neapolis, 569 pp
Yu G, Prentice IC, Harrison SP, Sun X. (1998) Pollen-basedbiome reconstructions for China at 0 ka and 6 ka. J Biogeogr (inpress)
Zubakov VA (1972) Noveishie otlozheniya Zapadno-Sibirskoi niz-mennosti. Nedra, Leningrad, 311 pp (in Russian)
240 Tarasov et al.: Last Glacial Maximum climate of the former Soviet Union and Mongolia