Embed Size (px)
Citation preview
Last millennium palaeoenvironmental changes from a Baltic bog (Poland) inferredfrom stable isotopes, pollen, plant macrofossils and testate amoebae
Published in Palaeogeography, Palaeoclimatology, Palaeoecology 265, issues 1-2, 93-106, 2008which should be used for any reference to this work
1
M. Lamentowicz a,⁎, A. Cedro h, M. Gałka a, T. Goslar b,c, G. Miotk-Szpiganowicz d,E.A.D. Mitchell e,f, J. Pawlyta g
a Department of Biogeography and Palaeoecology, Adam Mickiewicz University (Faculty of Geosciences), Dzięgielowa 27, 61-680 Poznań, Polandb Faculty of Physics, Adam Mickiewicz University, Umultowska 85, 61-614 Poznań, Polandc Poznań Radiocarbon Laboratory, Foundation of the Adam Mickiewicz University, Rubież 46, 61-612 Poznań, Polandd Polish Geological Institute, Branch of Marine Geology, ul. Kościerska 5, 80-328 Gdańsk, Polande Swiss Federal Research Institute WSL, Ecosystem Boundaries Research Unit, Wetlands Research Group, Station 2, CH-1015 Lausanne, Switzerlandf École Polytechnique Fédérale de Lausanne (EPFL), Laboratory of Ecological Systems (ECOS), Station 2, CH-1015 Lausanne, Switzerlandg Department of Radioisotopes Institute of Physics, Silesian University of Technology, Krzywoustego 2, 44-100 Gliwice, Polandh University of Szczecin Laboratory of Climatology and Marine Meteorology, Institute of Marine Science Faculty of Natural Science, University of Szczecin, Wąska 13, 71-415 Szczecin, Poland
A B S T R A C T
Keywords:illennium
bog locapollen,ium patermineltic bogast with(–200
cators. Tlimitedroxies iay theremire vith the
imbricatum) in the UK. This study illustrates the valassess the magnitude of anthropogenic land-usetestate amoebae and stable isotope data from the sthe record and most strongly for the latter part of
⁎ Corresponding author.E-mail address: [email protected] (M. Lamentow
ing region for palaeoclimatic studies because of the mixede fact that the dominance of one or the other of these twounlike many more intensively studied regions of Europe,
The Baltic coast of Northern Poland is an interestoceanic and continental climatic influences and th
human impact in the regionwas rather limrecord from Stążki mire, an ombrotrophic
influences might have changed over time. Also,ited until the 19th century. We prese
stable isotopes (δ13C) of Sphagnum stems,were to: 1) reconstruct the last millenn2) identify the major wet–dry shifts, 3) deimpact, 4) assess the resilience of the Bapalaeo-moisture signal from the Baltic coinferred at AD 1100–1500 and 1650–1900record shows little evidence of human indiof themire. In the 20th century additionalrecovering. From 1500 AD onwards all poccurred during the Little Ice Age and mSphagnum fuscum dominated the pristineAD 1900. This pattern is comparable w
Surface moisture Multi-proxy study Testate amoebae Stable isotopes
nt a 1200-year high-resolutionted 35 km from the Baltic Sea coast. Using testate amoebae,plant macrofossils and dendroecological analyses, our aimslaeoenvironment in the study site and its surroundings,if those events correlate with climate change and humanecosystem following human impact, and 5) compare therecords from more oceanic regions. Two dry periods are
5). The first dry shift is probably climate-driven as pollenhe second dry shift can be related to local peat exploitationdrainage took place and since ca. AD 1950 themire has beenndicate wetter condition. The beginning of this wet shiftfore be a climatic signal. The macrofossil data show thategetation but then declined and finally disappeared at ca.timing of extinction of Sphagnum austinii (=Sphagnum
ue of high-resolutionmulti-proxy studies of peat archives tochanges. This study presents the first direct comparison ofame core. The twoproxies correlate significantly throughoutthe record when most of the variability was recorded.
, , , ,
Ombrotrophic peatland Palaeoclimate Last m, ,1. Introduction
The reconstruction of environmental changes over the lastmillennium has recently become a priority in palaeoenvironmentalresearch (Jones and Mann, 2004). Because such studies require a hightime resolution (at least decadal and ideally annual) records such astree rings or laminated sediments are generally used. However, hightemporal resolution can be achieved from well dated peat coresanalysed at short intervals (0.5–1 cm) (Schoning et al., 2005; van derLinden and van Geel, 2006; Väliranta et al., 2007).
icz).
Ombrotrophic peatlands (or raised bogs) are usually considered asvaluable repository of high-quality climatic signals because their solesource of water is from precipitation (Behre et al., 2005; Blaauw et al.,2004; Blundell and Barber, 2005; Hall and Mauquoy, 2005) andsurface moisture therefore depends only on the balance betweeninputs from precipitation and losses from evaporation and runoff(Charman, 2002). Surface moisture affects communities of livingorganisms, which are preserved in the peat. Among these, the testateamoebae (protists) are now regularly used to infer changes in surfacemoisture (or water table depth) and this signal is in turn interpreted interms of climate changes (Charman, 2002).
An additional challenge related to the use of peatlands forpaleoclimatical studies is that the climatic signal is often difficult to
2
read because of the increasing frequency and amplitude of direct (e.g.peat extraction and drainage) and/or indirect (e.g. land-use changesaround the mires) human impact (Rydin and Jeglum, 2006). Indeed,palaeoecological studies covering the last 100–1000 years typicallyfocus not only on climatic changes but also on the history ofanthropogenic influence (Buttler et al., 1996). The challenge istherefore to separate these two types of signals (Kalis et al., 2003;Tarasov et al., 2005). Studies based on a combination of biotic (e.g.:pollen, testate amoebae, tree rings, and plant macrofossils) and abioticproxies (e.g. stable isotopes) are generally considered to provide morereliable palaeoenvironmental information (Barber and Langdon,2007). In addition to providing palaeoclimatic information, palaeoe-cological studies of peatlands can contribute to improving manage-ment and restoration of peatlands (Lavoie et al., 2001). Knowledgeabout recent changes e.g. in palaeohydrology helps in understandingthe present state of peatland as well as their dynamics in relation tonatural or anthropogenic changes (Scheffer et al., 2001).
With the current interest for climate change of the last millenniumand human impact across Europe (Esper et al., 2005), the descriptionof changes along climatic gradients is needed if we want to sort outglobal vs. local patterns. For example, it has been suggested that in acontinental climatic context temperature may be more importantthan precipitation in controlling water table changes at the surface ofpeatlands (Schoning et al., 2005). The climatic context shouldtherefore be taken in to account in the interpretation of water tablerecords and palaeomoisture signals from different climatic regionsshould be compared. However, most studies reconstructing pastsurface moisture from ombrotrophic bogs were done in oceanic orsuboceanic regions (Warner and Charman, 1994; Buttler et al., 1996;Charman, 1999; Charman and Blundell, 2007; Booth, 2007; Mitchellet al., in press). By contrast, there are fewer multi-proxy studies ofpeatlands in more continental regions such as Poland, be it for the lastmillennium or longer periods of the Holocene (Tobolski, 1987; Żurek,1993; Żurek and Pazdur, 1999; Skrzypek and Jędrysek, 2000; Żureket al., 2002; Andreev et al., 2003; Charman et al., 2004; Lamentowicz,2004; Booth et al., 2006).
Regions such as Northern Poland located at the limit betweencontinental and oceanic climatic influences could yield very valuableinformation. Polish Baltic raised bogs are located on the fringe of thesouthern range of lowland raised bogs in Europe (Herbichowa, 1998).Truly ombrotrophic raised bogs are very rare in Poland and are locatedmainly in NW part of the country along the Baltic shore (approx.40 km from the coast). Further south and east the surface of Sphagnummires becomes flat and their vegetation is more influenced by groundwater (Tobolski, 2003). Although ombrotrophic bogs are in theorywell suited for palaeoecological reconstruction, most of the Baltic bogsin Poland have been drained and some of them are still beingexploited (Jasnowski et al., 1968; Herbichowa, 1997; Pawlaczyk et al.,2005). It is nearly impossible to find a completely undisturbed site forstudies of the last millennium. Because of artificial lowering of thewater table the palaeoecological record was often lost especially in thecentral parts of the domed peatlands. The peat archive is disturbedmainly for the last 100–200 years of peat accumulation. Furthermore,because of changes in the catchments and surroundings of peatlands,microclimatic conditions were changed. For these reasons the climaticsignal may be indistinct at least for the last 100 years.
The general aim of this study was to test if a range of proxies(testate amoebae, pollen, plant macrofossils, tree rings and stableisotopes from Sphagnum) could allow inferring a climatic signal from apeat monolith despite the considerable anthropogenic impact on thePomeranian landscape since the Early Medieval Period. Our morespecific aims were to: 1) reconstruct the last millennium palaeoenvir-onment in a Baltic raised bog and its surroundings, 2) identify themajor wet–dry shifts, 3) determine if those events correlate withclimate change and human impact, 4) assess the resilience of theBaltic bog ecosystem following human impact, and 5) compare the
palaeomoisture signal from the Baltic coast with records from moreoceanic regions. This study is the first high-resolution palaeoenviron-mental multi-proxy investigation focusing specifically on the lastthousand years undertaken in Poland. There are few studies describ-ing human impact in Pomerania over the last millennium and littleHolocene palaeohydrological data from peatlands of the region(Skrzypek and Jędrysek, 2000; Żurek et al., 2002; Skrzypek andJędrysek, 2004).
2. Methods
2.1. Study site and coring
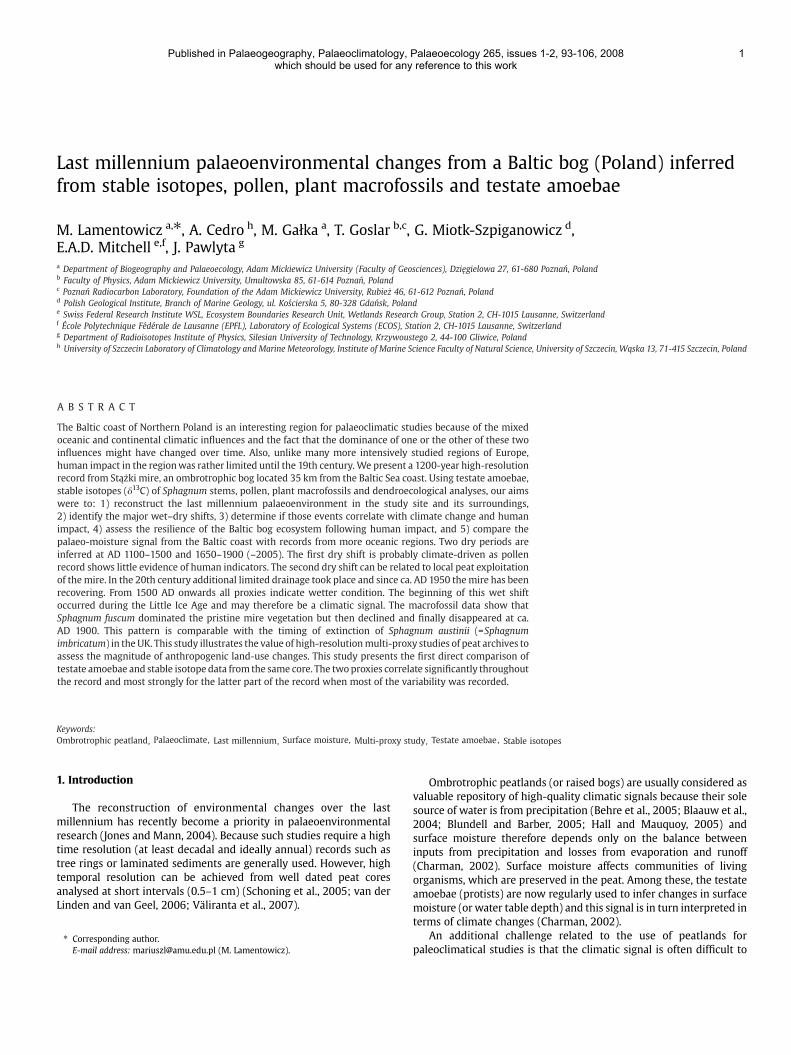
The study site is a Baltic bog — Stążki (N 54 25′ 27.7″; E 18 05′00.2″) located in northern Poland ca 35 km from the Baltic sea coast, inthe Kaszuby Lakeland, near the highest point (214.6 masl) of amorainic plateau. The morainic plateau is delimited at the south andwest by the Łeba river and at the east by the Dębica river. The north-western ribbon depression is filled with waters of the Miłoszewskieand Lewinko lakes. The water from these lakes flows into theMłynówka stream. This morainic plateau is slightly undulating andthere are many closed-basin depressions filled by Sphagnum mires.Because of uncontrolled peat exploitation many of these have beendestroyed and were transformed into meadows or heathlands(Szafrański, 1961).
According to the regional climate classification of Gumiński (1948),the studied area is located in the IV Pomeranian climatic division(Kondracki, 1998). The average annual temperature is +7.7 °C and ave-rages for January and July are respectively −1.2 °C and +16.8 °C. Thegrowing period lasts ca 200 days. The average annual sum ofprecipitation for Lębork is 690 mm, ranging from 422 mm in dryyears (year 1964) to 956 mm in very wet years (year 1998). Februaryand March are the driest months (36 mm) and July the wettest(86 mm). The duration of snow cover is up to 75 days, however,depending on the position of the polar front, the duration and timingis very variable.
Stążki mire has a domed profile with a complex microtopographyof hummocks and hollows, typical for raised bogs. The elevationdifferences between the margin and the highest point in the mireare no more than 1 m but it is very likely that the mire sunk afterexploitation and drainage. Based on the vegetation, Stążki is one ofthe best-preserved Baltic bog on the moraine. However theperipheral lagg no longer exists and boundaries between the mireand adjacent fields are very sharp. The base of the deposit iscomposed of gyttja indicating a limnogenic origin of this bog. Fromthe west a mineral peninsula encroaches into the mire. In the 19thcentury ditches were dug along the slope of the dome to drain thepeatland. The southern part of the mire is destroyed to a largedegree, but north of the mineral peninsula the peatland stillpossesses the characteristics of a raised bog. Around ca. 1960 thepeatland was locally exploited at the southern fringe (someexploitation ponds remain) (Szafrański, 1961), but recently (2004–2006) no peat digging was observed.
The present vegetation of the mire is dominated by Sphagnumfallax, Eriophorum vaginatum and Calluna vulgaris. The exploited partsof the peatland are covered by pine (Pinus sylvestris) forest thatbecomes sparser in the best-preserved and moister central part. Wesampled two one-meter peat monoliths with a Wardenaar sampler(Wardenaar, 1987). The first short core (SM1) was taken from the lessdrained bog part located 40 m from the mire edge. The second core(SM2) used in this study was taken from the central part of thepeatland situated near the forested part that is also the highest pointof themire (Fig. 1.). The Troels–Smithmethodwas used to describe thepeat in the field. The above-mentioned features and our preliminaryexamination of cores SM1 and SM2 show that Stążki mire can beconsidered to be a representative site (and starting point) for
Table 1Results of dating of SM2 monolith: A — lead dating; B — radiocarbon dating
Sample Depth Age 210Pb S.D.
N [mm] [yr] [yr]
A
1 30 52 50 16 43 80 34 44 100 45 65 140 90 106 150 105 107 160 120 15
Sample Depth Age 14C Material
B
1 Poz-15776 13.5 115±30 BP Sphagnum stems2 Poz-15777 20 365±30 BP Sphagnum stems3 Poz-15778 29.2 310±30 BP Sphagnum stems4 Poz-15779 37 290±30 BP Sphagnum stems5 Poz-15780 44.5 1025±30 BP Sphagnum stems6 Poz-15781 60.5 1100±30 BP Sphagnum stems7 Poz-15782 70.5 1090±30 BP Sphagnum stems8 Poz-15784 89.5 1165±30 BP Sphagnum stems9 Poz-15785 100.5 1245±35 BP Sphagnum stems
Fig. 1. Setting of the study site. Figure description: 1— contour lines; 2— village; 3— ditchand stream; forest; 4 — forest, 5 — Stążki mire; 6 — coring site.
3
palaeoclimatological research in northern Poland. The core SM2 wasdivided into 1 cm slices that were then split for detailed analyses.
2.2. Dating and age–depth model
Several Sphagnum stems from nine one-centimetre thick sampleswere selected for radiocarbon dating (avoiding Ericaeae, and Carexrootlets, and other contamination) as these were shown to yield veryprecise dates (Nilsson et al., 2001; Turetsky et al., 2004). Samples weredated at the AMS facility in Poznań Radiocarbon Laboratory (Goslaret al., 2004) (Table 1B). Seven peat samples were taken from the upper16 cm of the core for Pb-210 dating. 210Pb was radiochemicallyextracted from samples (Flynn, 1968) and its radioactivity wasmeasured. The CRSmodel was used for 210Pb age calculation (Appleby,2001). Lead dating was realized in the Institute of Geological Sciencesof Polish Academy of Sciences inWarsaw (Table 1A). Those dates werealso used for construction of the chronology.
The model of peat accumulation is based on calibrated 14C and210Pb dates. Calibrated 14C dates were projected on the age–depthscale with the method described by Goslar et al. (2005). Forconstruction of age–depth model, we used an algorithm, which
maximized the product of probabilities of calendar (calibrated 14C aswell as 210Pb) dates (a), minimized the curvature of the age–depth line(b) and (c) minimized deviations of relative changes of the slope of theage–depth line from those suggested by independent indications (inthis particular case: by 210Pb data). As these three goals can beconflicting, the quantitative measures of “a”, “b” and “c” wereweighted appropriately. The same algorithm has already been appliedfor age–depth modelling of the Saariselka peat profile (Räsänen et al.,2007). As the 210Pb dates of seven samples in Stążki are notindependent of one another, the 210Pb data in measure “a” wererepresented by one date only, while the whole 210Pb chronology wasused for defining the shape of the age–depth line in its upper part(measure “c”).
Because of the existence of a distinct period of very low peataccumulation around 400 mm depth, the age–depth lines werecalculated in two sections separately. In the lower section, onlymeasures “a” (probabilities of calibrated 14C dates) and “b” (curvature)were taken in calculations. In the upper section, two different versionsof the age–depth line were calculated. In the simplified version(dotted line in Fig. 2), 210Pb dates were ignored, while the extendedversion (solid line) incorporated information derived from 210Pb, asdescribed above. As the difference between both versions is small, infurther discussion in this paper we use solely the extended age–depthmodel.
2.3. Stable isotopes
The carbon isotopic composition of Sphagnum macrofossils wasstudied as an independent proxy of past moisture changes in peatland(Price et al., 1997; Ménot-Combes and Burns, 2001; Ménot-Combeset al., 2004; Loader et al., 2007) and the results were compared to thetestate amoeba-inferred moisture. For the analysis we selected 30Sphagnum (mainly S. fuscum) stems per sample. Sphagnum stemsproved to be appropriate for those studies (Loader et al., 2007).Samples were taken at each centimetre of the peat monolith. Stemswere then washed in distilled water. For each sample about 0.7 mg ofstems were was collected. δ13C was measured in the bulk organicmatter of the stems. The samples were combusted in the Costech ECS4010 elemental analyser. The resulting gases were separated by gaschromatography and carbon dioxide was transferred to the Thermo-Electron Delta Plus XP mass spectrometer for δ13C measurement. The
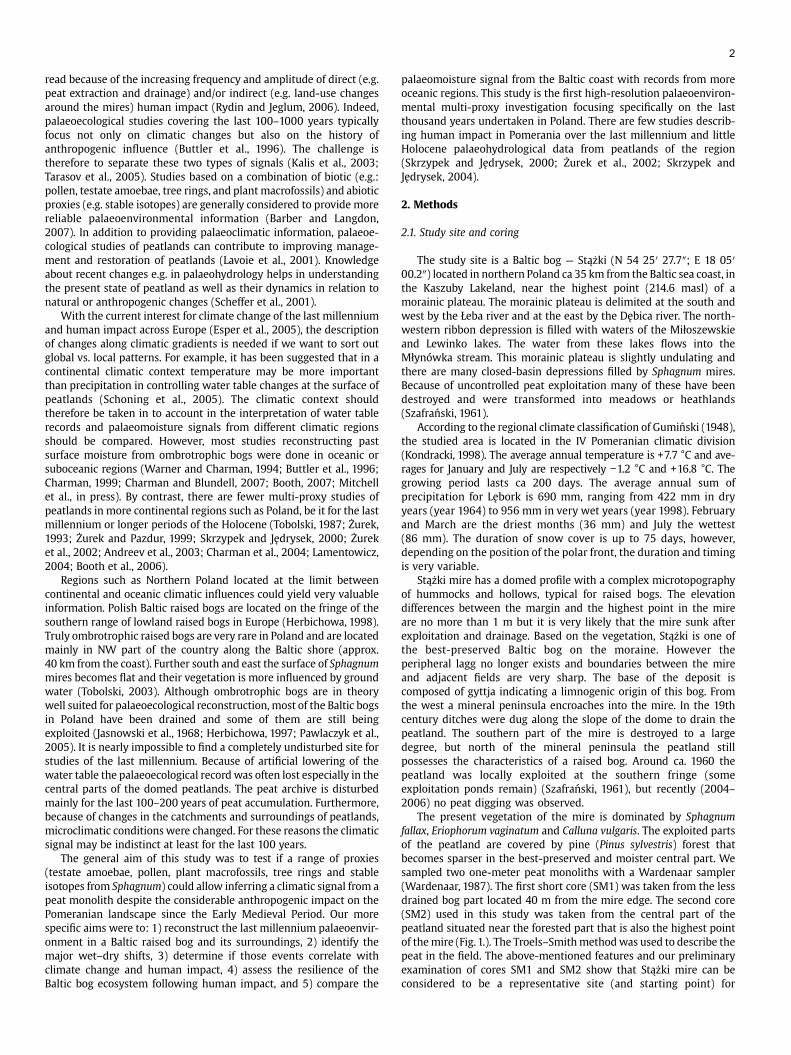
Fig. 2. Chronology of the peat profile in Stążki. The silhouettes show probability distributions of calendar dates, obtained by calibration of individual 14C ages. On the graph, 210Pbdates are represented by one silhouette only, while the full set of 210Pb dates was used as a framework for shape of the ultimate age–depth curve in the computer algorithm.
Table 2Lithological description of monolith SM2 from Stążki mire
Depth(cm)
Troels–Smith system Description
0–4 Tb4 (Sphag.) Not decomposed Sphagnum peat4–6 Th2, Tb1, Sh1 (Sphag.)
(Erioph.)Slightly decomposed Sphagnum-herbaceouspeat with Eriophorum
6–9 Tb4 (Sphag.) Not decomposed Sphagnum peat9–20 Tb1, Sh3 Very decomposed Sphagnum peat20–30 Tb3, Sh1 (Sphag.) Moderately decomposed Sphagnum peat30–40 Tb2, Sh2 (Sphag.) Moderately decomposed Sphagnum peat40–47 Th3,Tb1, Sh+ Moderately decomposed Eriophorum peat47–56 Tb3, Sh1 Slightly decomposed Sphagnum peat56–100 Tb4, Sh1 (Sphag.) Slightly decomposed Sphagnum peat
4
δ13C values are expressed in ‰ VPDB with an uncertainty equal orbetter than 0.2‰.
2.4. Testate amoebae, pollen, and plant macrofossils
Core SM2 was divided into 1 cm slices that were then split for thedifferent analyses. Subfossil testate amoebae were extracted from4 cm3 samples at 1 cm depth intervals following the sieving and back-sieving procedure described by Hendon and Charman (1997). Testateamoebae were identified and counted to a total of 150 individuals, at200–400× magnification. Water table depth was inferred from atransfer function from Northern Poland (an expanded version of themodel presented by Lamentowicz and Mitchell (2005a).
Samples for pollen analysis were taken every 5 cm. Pollen samplesof 2 cm3 in volume were treated with 10% KOH and then acetolysed(Berglund and Ralska-Jasiewiczowa,1986; Faegri and Iversen,1989). Intotal 500 pollen grains of trees and shrubs (AP) were counted in eachsample but in samples where the frequency was very low all pollengrains from two slides 22×22 mm were identified and counted.Percentage calculation was based on the sum of pollen grains of treesand upland herbs (AP+NAP). Pollen of Ericaceae, Calluna vulgaris,Vaccinium and Andromeda were excluded from the pollen sum. Thepercentage pollen diagram was produced with TILIA GRAPH (Grimm,1992).
Plant macrofossils were analysed at 1 cm intervals. The materialwas rinsed on 0.25 and 0.5 mm mesh size sieves. The remainingmaterial was identified under the stereoscopic microscope at amagnification of 10–100×. One slide from each sample was examinedunder the microscope at 200–400× magnification to determine thepeat composition. Macrofossils were identified with the use ofavailable guides (Katz et al., 1965; Grosse-Brauckmann, 1972, 1974;Katz et al., 1977; Tobolski, 2000). Sphagnum was identified to thesection level.
2.5. Tree-ring analysis
Cores from 23 Scots pines (Pinus sylvestris) scattered on the centralpart of the mire were sampled with a Pressler increment borer, 1.3 mabove the ground level. For every cored sample, measurements of thewidth of annual rings were made with 0.01 mm accuracy. Matching ofindividual dendrograms with calendar years and construction of thechronology were made following the classical methods of dendro-chronological dating (Zielski and Krąpiec, 2004). The chronology wassubjected to indexation, eliminating long-term trends (e.g. age trend),and accentuating the year-to-year variability in widths of the annualtree rings using the Arstan software (Holmes, 1983, 1994).
2.6. Diagrams preparation and numerical analyses
Percentage diagrams of plant macrofossils, pollen and testateamoebae were plotted using Tilia Graph (Grimm, 1992) and C2(Juggins, 2003). The estimated percentage composition of particularmacrofossils (e.g. Sphagnum and other mosses) was presented using a
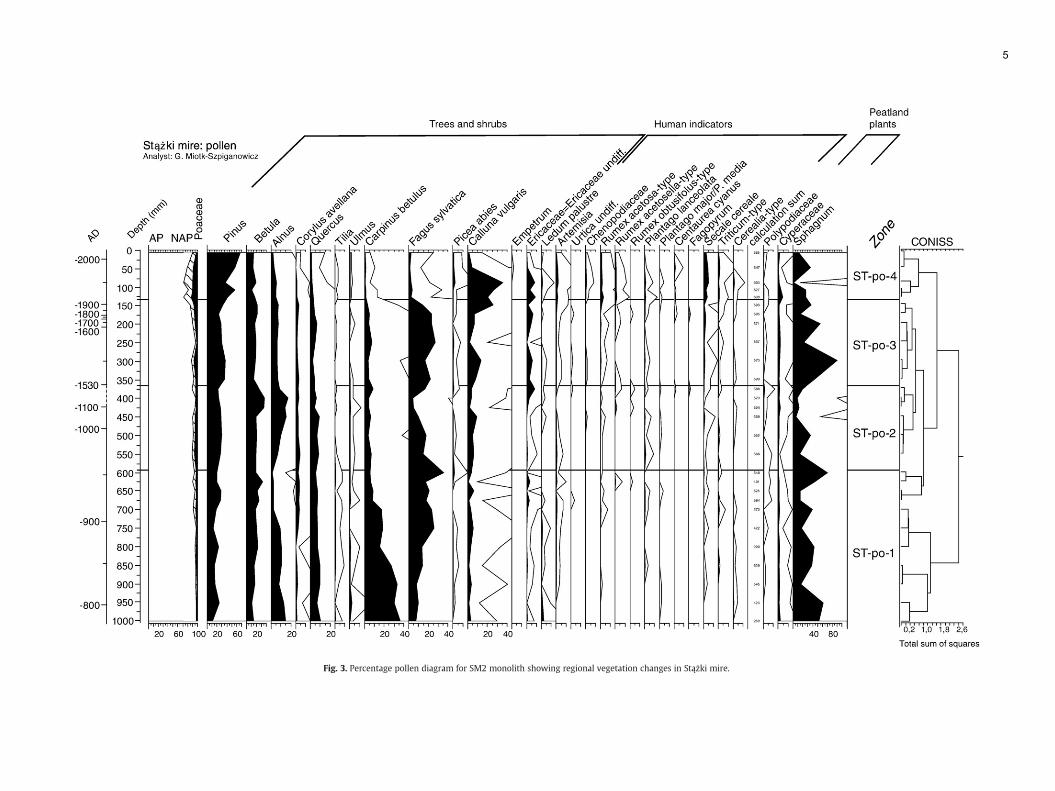
Fig. 3. Percentage pollen diagram for SM2 monolith showing regional vegetation changes in Stążki mire.
5
6
five-degree scale. Countable remains (e.g. Andromeda polifolia seeds)were presented in absolute numbers. Testate amoeba and pollendiagrams are based on percentage data. We performed stratigraphi-cally constrained cluster analyses (method of incremental sum ofsquares) on all three data sets independently for quantitativedefinition of stratigraphic zones using CONISS (Grimm, 1987). Foreach diagram biostratigraphic zones represent a compromise betweennumerical (CONISS) and subjective approaches. Each assemblage zonewas described in detail, but the summarised mire history is based onphases determined subjectively on the peat accumulation model andthe main indicators of change. These phases are, however, in generalagreement with results of zonation of particular proxies.
The water table was inferred from testate amoebae using atraining set consisting of 123 surface samples taken mainly fromnatural, not drained Sphagnum mires in Pomerania and westernPoland (N Poland) (Lamentowicz and Mitchell, 2005b; Lamentowiczet al., in press). Performance of four models was tested: partial leastsquares (PLS), weighted averaging (WA), tolerance down-weightedaveraging (WAtol) and weighted averaging partial least squares (WA-PLS), using the software C2 (Juggins, 2003). The RMSEP (Root MeanSquare Error of Prediction) was calculated using the Jacknife crossvalidation procedure (Crowley, 1992). For depth to the water table(DWT), the model with the lowest RMSEP was provided by theWAtol, with a maximum prediction bias of 8.9 cm and a root mean
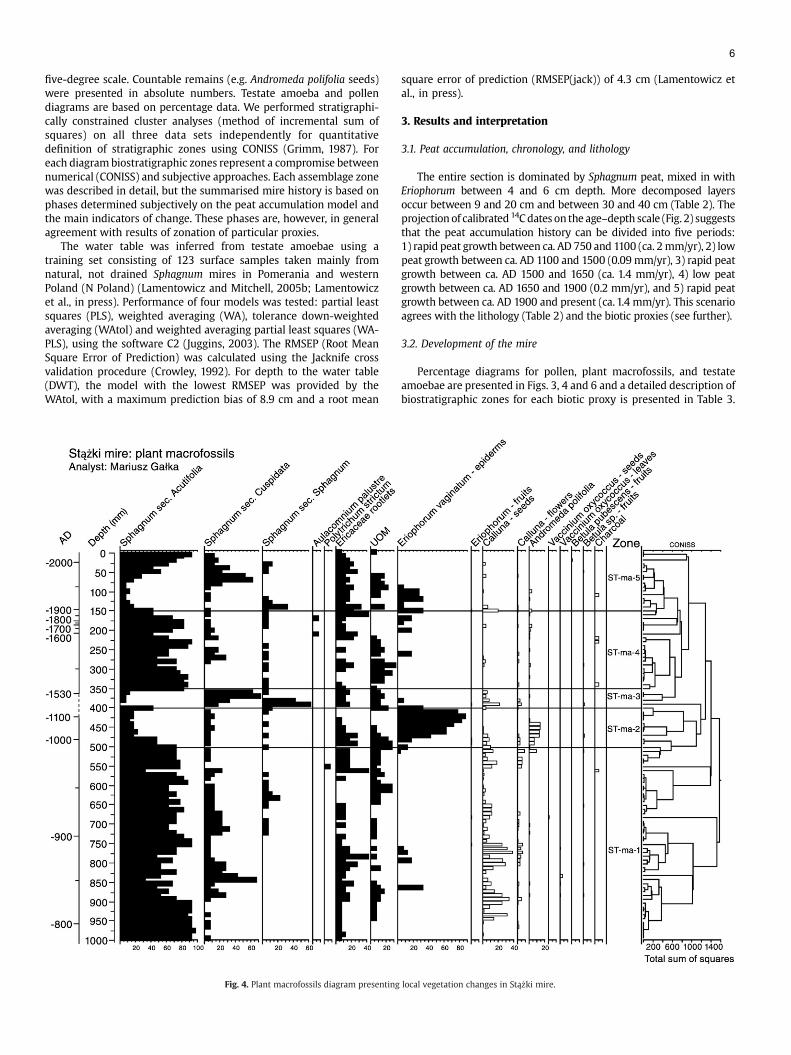
Fig. 4. Plant macrofossils diagram presenting
square error of prediction (RMSEP(jack)) of 4.3 cm (Lamentowicz etal., in press).
3. Results and interpretation
3.1. Peat accumulation, chronology, and lithology
The entire section is dominated by Sphagnum peat, mixed in withEriophorum between 4 and 6 cm depth. More decomposed layersoccur between 9 and 20 cm and between 30 and 40 cm (Table 2). Theprojection of calibrated 14C dates on the age–depth scale (Fig. 2) suggeststhat the peat accumulation history can be divided into five periods:1) rapid peat growth between ca. AD 750 and 1100 (ca. 2mm/yr), 2) lowpeat growth between ca. AD 1100 and 1500 (0.09 mm/yr), 3) rapid peatgrowth between ca. AD 1500 and 1650 (ca. 1.4 mm/yr), 4) low peatgrowth between ca. AD 1650 and 1900 (0.2 mm/yr), and 5) rapid peatgrowth between ca. AD 1900 and present (ca. 1.4 mm/yr). This scenarioagrees with the lithology (Table 2) and the biotic proxies (see further).
3.2. Development of the mire
Percentage diagrams for pollen, plant macrofossils, and testateamoebae are presented in Figs. 3, 4 and 6 and a detailed description ofbiostratigraphic zones for each biotic proxy is presented in Table 3.
local vegetation changes in Stążki mire.
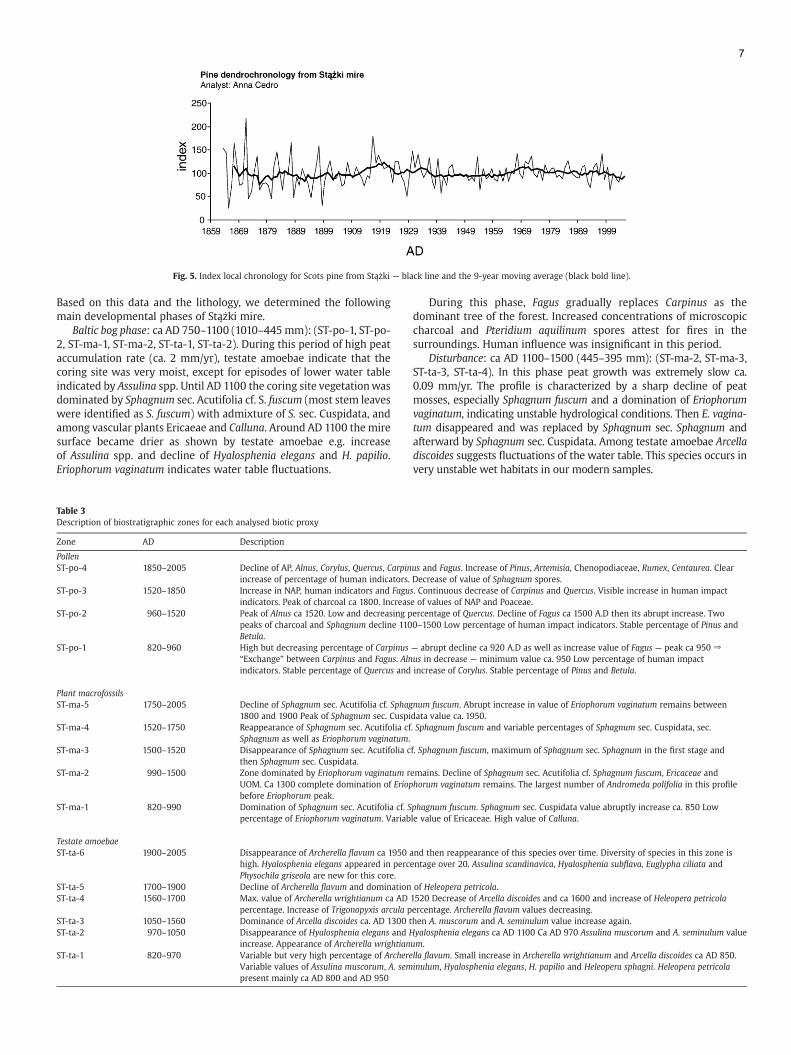
Fig. 5. Index local chronology for Scots pine from Stążki — black line and the 9-year moving average (black bold line).
7
Based on this data and the lithology, we determined the followingmain developmental phases of Stążki mire.
Baltic bog phase: ca AD 750–1100 (1010–445mm): (ST-po-1, ST-po-2, ST-ma-1, ST-ma-2, ST-ta-1, ST-ta-2). During this period of high peataccumulation rate (ca. 2 mm/yr), testate amoebae indicate that thecoring site was very moist, except for episodes of lower water tableindicated by Assulina spp. Until AD 1100 the coring site vegetationwasdominated by Sphagnum sec. Acutifolia cf. S. fuscum (most stem leaveswere identified as S. fuscum) with admixture of S. sec. Cuspidata, andamong vascular plants Ericaeae and Calluna. Around AD 1100 the miresurface became drier as shown by testate amoebae e.g. increaseof Assulina spp. and decline of Hyalosphenia elegans and H. papilio.Eriophorum vaginatum indicates water table fluctuations.
Table 3Description of biostratigraphic zones for each analysed biotic proxy
Zone AD Description
PollenST-po-4 1850–2005 Decline of AP, Alnus, Corylus, Quercus, Carpin
increase of percentage of human indicators.ST-po-3 1520–1850 Increase in NAP, human indicators and Fagu
indicators. Peak of charcoal ca 1800. IncreasST-po-2 960–1520 Peak of Alnus ca 1520. Low and decreasing p
peaks of charcoal and Sphagnum decline 110Betula.
ST-po-1 820–960 High but decreasing percentage of Carpinus“Exchange” between Carpinus and Fagus. Alnindicators. Stable percentage of Quercus and
Plant macrofossilsST-ma-5 1750–2005 Decline of Sphagnum sec. Acutifolia cf. Sphag
1800 and 1900 Peak of Sphagnum sec. CuspiST-ma-4 1520–1750 Reappearance of Sphagnum sec. Acutifolia cf
Sphagnum as well as Eriophorum vaginatum.ST-ma-3 1500–1520 Disappearance of Sphagnum sec. Acutifolia c
then Sphagnum sec. Cuspidata.ST-ma-2 990–1500 Zone dominated by Eriophorum vaginatum r
UOM. Ca 1300 complete domination of Eriopbefore Eriophorum peak.
ST-ma-1 820–990 Domination of Sphagnum sec. Acutifolia cf. Spercentage of Eriophorum vaginatum. Variab
Testate amoebaeST-ta-6 1900–2005 Disappearance of Archerella flavum ca 1950 a
high. Hyalosphenia elegans appeared in percPhysochila griseola are new for this core.
ST-ta-5 1700–1900 Decline of Archerella flavum and dominationST-ta-4 1560–1700 Max. value of Archerella wrightianum ca AD
percentage. Increase of Trigonopyxis arcula pST-ta-3 1050–1560 Dominance of Arcella discoides ca. AD 1300 tST-ta-2 970–1050 Disappearance of Hyalosphenia elegans and H
increase. Appearance of Archerella wrightianST-ta-1 820–970 Variable but very high percentage of Archere
Variable values of Assulina muscorum, A. sempresent mainly ca AD 800 and AD 950
During this phase, Fagus gradually replaces Carpinus as thedominant tree of the forest. Increased concentrations of microscopiccharcoal and Pteridium aquilinum spores attest for fires in thesurroundings. Human influence was insignificant in this period.
Disturbance: ca AD 1100–1500 (445–395 mm): (ST-ma-2, ST-ma-3,ST-ta-3, ST-ta-4). In this phase peat growth was extremely slow ca.0.09 mm/yr. The profile is characterized by a sharp decline of peatmosses, especially Sphagnum fuscum and a domination of Eriophorumvaginatum, indicating unstable hydrological conditions. Then E. vagina-tum disappeared and was replaced by Sphagnum sec. Sphagnum andafterward by Sphagnum sec. Cuspidata. Among testate amoebae Arcelladiscoides suggests fluctuations of the water table. This species occurs invery unstable wet habitats in our modern samples.
us and Fagus. Increase of Pinus, Artemisia, Chenopodiaceae, Rumex, Centaurea. ClearDecrease of value of Sphagnum spores.s. Continuous decrease of Carpinus and Quercus. Visible increase in human impacte of values of NAP and Poaceae.ercentage of Quercus. Decline of Fagus ca 1500 A.D then its abrupt increase. Two0–1500 Low percentage of human impact indicators. Stable percentage of Pinus and
— abrupt decline ca 920 A.D as well as increase value of Fagus — peak ca 950 ⇒us in decrease — minimum value ca. 950 Low percentage of human impactincrease of Corylus. Stable percentage of Pinus and Betula.
num fuscum. Abrupt increase in value of Eriophorum vaginatum remains betweendata value ca. 1950.. Sphagnum fuscum and variable percentages of Sphagnum sec. Cuspidata, sec.
f. Sphagnum fuscum, maximum of Sphagnum sec. Sphagnum in the first stage and
emains. Decline of Sphagnum sec. Acutifolia cf. Sphagnum fuscum, Ericaceae andhorum vaginatum remains. The largest number of Andromeda polifolia in this profile
phagnum fuscum. Sphagnum sec. Cuspidata value abruptly increase ca. 850 Lowle value of Ericaceae. High value of Calluna.
nd then reappearance of this species over time. Diversity of species in this zone isentage over 20. Assulina scandinavica, Hyalosphenia subflava, Euglypha ciliata and
of Heleopera petricola.1520 Decrease of Arcella discoides and ca 1600 and increase of Heleopera petricolaercentage. Archerella flavum values decreasing.hen A. muscorum and A. seminulum value increase again.yalosphenia elegans ca AD 1100 Ca AD 970 Assulina muscorum and A. seminulum value
um.lla flavum. Small increase in Archerella wrightianum and Arcella discoides ca AD 850.inulum, Hyalosphenia elegans, H. papilio and Heleopera sphagni. Heleopera petricola
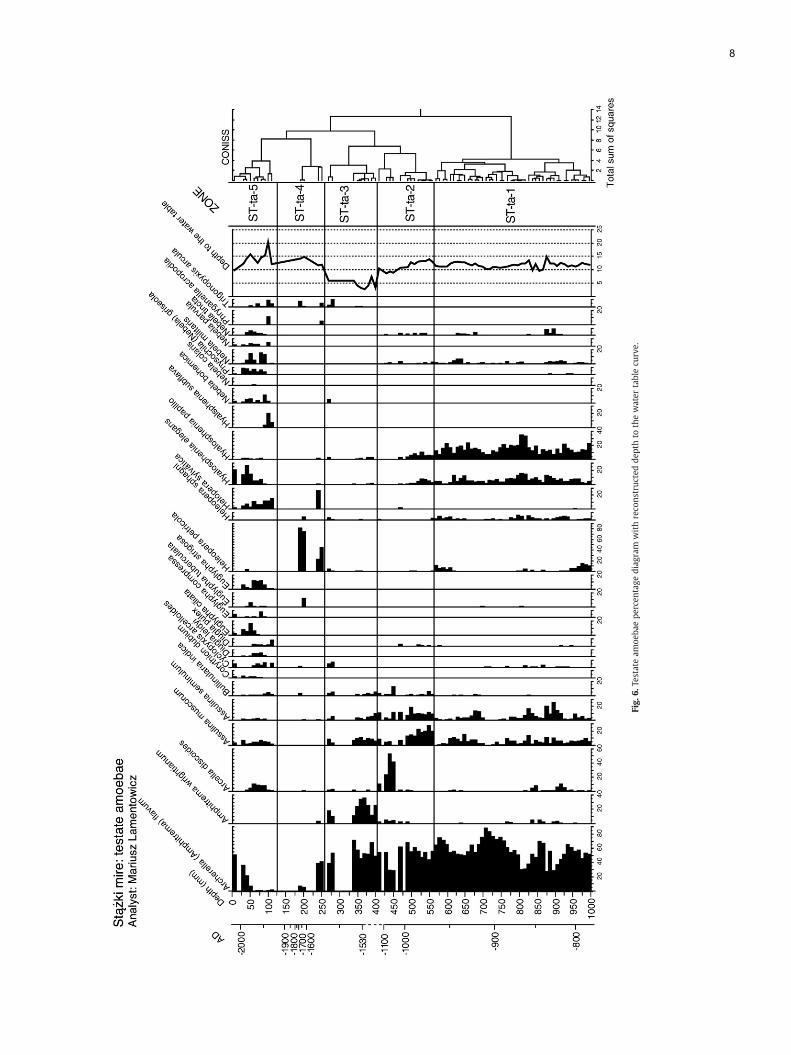
Fig.
6.Te
stateam
oeba
epe
rcen
tage
diag
ram
withreco
nstruc
tedde
pthto
thewater
tablecu
rve.
8
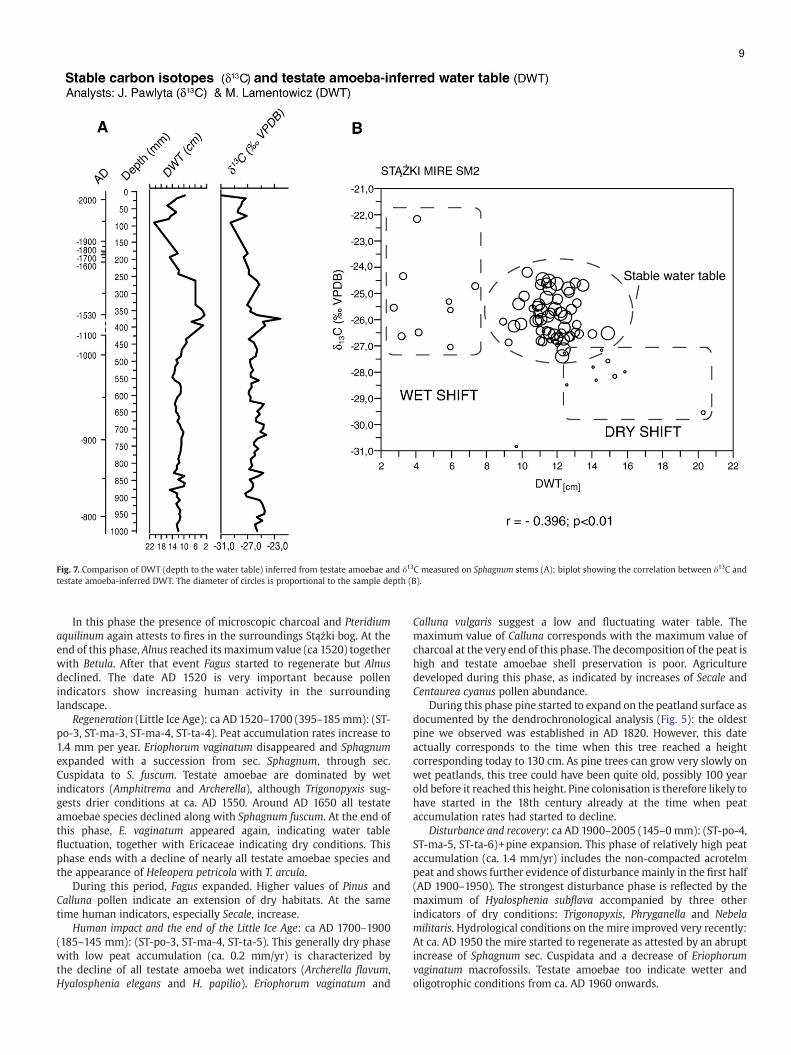
Fig. 7. Comparison of DWT (depth to the water table) inferred from testate amoebae and δ13C measured on Sphagnum stems (A); biplot showing the correlation between δ13C andtestate amoeba-inferred DWT. The diameter of circles is proportional to the sample depth (B).
9
In this phase the presence of microscopic charcoal and Pteridiumaquilinum again attests to fires in the surroundings Stążki bog. At theend of this phase, Alnus reached its maximumvalue (ca 1520) togetherwith Betula. After that event Fagus started to regenerate but Alnusdeclined. The date AD 1520 is very important because pollenindicators show increasing human activity in the surroundinglandscape.
Regeneration (Little Ice Age): ca AD 1520–1700 (395–185mm): (ST-po-3, ST-ma-3, ST-ma-4, ST-ta-4). Peat accumulation rates increase to1.4 mm per year. Eriophorum vaginatum disappeared and Sphagnumexpanded with a succession from sec. Sphagnum, through sec.Cuspidata to S. fuscum. Testate amoebae are dominated by wetindicators (Amphitrema and Archerella), although Trigonopyxis sug-gests drier conditions at ca. AD 1550. Around AD 1650 all testateamoebae species declined along with Sphagnum fuscum. At the end ofthis phase, E. vaginatum appeared again, indicating water tablefluctuation, together with Ericaceae indicating dry conditions. Thisphase ends with a decline of nearly all testate amoebae species andthe appearance of Heleopera petricola with T. arcula.
During this period, Fagus expanded. Higher values of Pinus andCalluna pollen indicate an extension of dry habitats. At the sametime human indicators, especially Secale, increase.
Human impact and the end of the Little Ice Age: ca AD 1700–1900(185–145 mm): (ST-po-3, ST-ma-4, ST-ta-5). This generally dry phasewith low peat accumulation (ca. 0.2 mm/yr) is characterized bythe decline of all testate amoeba wet indicators (Archerella flavum,Hyalosphenia elegans and H. papilio). Eriophorum vaginatum and
Calluna vulgaris suggest a low and fluctuating water table. Themaximum value of Calluna corresponds with the maximum value ofcharcoal at the very end of this phase. The decomposition of the peat ishigh and testate amoebae shell preservation is poor. Agriculturedeveloped during this phase, as indicated by increases of Secale andCentaurea cyanus pollen abundance.
During this phase pine started to expand on the peatland surface asdocumented by the dendrochronological analysis (Fig. 5): the oldestpine we observed was established in AD 1820. However, this dateactually corresponds to the time when this tree reached a heightcorresponding today to 130 cm. As pine trees can grow very slowly onwet peatlands, this tree could have been quite old, possibly 100 yearold before it reached this height. Pine colonisation is therefore likely tohave started in the 18th century already at the time when peataccumulation rates had started to decline.
Disturbance and recovery: ca AD 1900–2005 (145–0 mm): (ST-po-4,ST-ma-5, ST-ta-6)+pine expansion. This phase of relatively high peataccumulation (ca. 1.4 mm/yr) includes the non-compacted acrotelmpeat and shows further evidence of disturbance mainly in the first half(AD 1900–1950). The strongest disturbance phase is reflected by themaximum of Hyalosphenia subflava accompanied by three otherindicators of dry conditions: Trigonopyxis, Phryganella and Nebelamilitaris. Hydrological conditions on the mire improved very recently:At ca. AD 1950 the mire started to regenerate as attested by an abruptincrease of Sphagnum sec. Cuspidata and a decrease of Eriophorumvaginatum macrofossils. Testate amoebae too indicate wetter andoligotrophic conditions from ca. AD 1960 onwards.
10
Single trees of Pinus sylvestris occurred on the peatland surfacein the first half of the 19th century as an effect of peat exploitationand initial drainage. But the main expansion of pine took place inthe last decade of the 19th century in response to more extensivedrainage and peat exploitation. The years 1910–1920 and 1929–1937 are characterised characterized by wider tree rings due to theexistence of many young trees with strong growth dynamics(Fig. 5). After this period the width of tree rings becomes narrower,suggesting more stable hydrological conditions until the beginningof 1970' when the growth trend again becomes stronger suggestingdrier conditions. In the last 30 years however, a trend towardsnarrower tree rings indicates wetter conditions probably mainlydue to the ditches being overgrown and gradually filled in by newSphagnum growth.
Deforestation in the catchment took place at ca. AD 1900 asreflected by the decline of Fagus and other deciduous trees in thepollen record. By contrast Pinus, Calluna and human indicators pollenincrease. Since AD 1950 the forest has started to regenerate with Pinussylvestris as the main component.
3.3. Palaeohydrology of the mire: stable isotopes vs. testate amoebae
In this studywe used two independent proxies for paleohydrology:δ13C from Sphagnum and water table depth inferred from testateamoebae (Fig. 6). A first observation of the two curves (Fig. 7A)suggests that the two data sets show corresponding fluctuations:1) fluctuations around AD 850, 2) a wet shift with a dry–wet swing atca. AD 1500–1550, and 3) a decreasing water table until ca. 1970followed by an abrupt wet shift. The direct comparison of the depth tothe water table and δ13C values (Fig. 7B) confirms this relationship.Even though the correlation coefficient for the whole sequence is notvery high (−0.396), it is statistically significant (pb0.01). Thiscorrelation is not significant for the period AD 780–1000 when therange of variation in both data sets is low (r=−0.176, pN0.05), but thecorrelation is stronger and more significant in the later period AD1000–2005 when the variability of both DWT and δ13C values washigh (r=0.68, pb0.01). The cluster of circles in the centre of thediagram represents stable hydrological conditions between AD 750and 1000 (testate amoeba-inferred DWT: mean=11 cm, S.D.=1.1) thatare quite typical for the ‘living’ peat accumulating Baltic bogs. Theremaining scattered circles (with the exception of the bottom circle —
one sample from the mire surface) show wet or dry shifts in thehistory of the mire.
4. Discussion
4.1. Development of the mire and major events: human impact vs.climate changes
Baltic raised bogs are located at the southern limit of the range oflowland raisedmires in Europe and the bog vegetation is influenced byboth oceanic and continental climatic influences therefore Baltic bogsshould be especially valuable for climate reconstruction. From 2500 BPhuman impact is considered to have been themost important factor ofchange in the vegetation cover in Poland (Ralska-Jasiewiczowa andLatałowa, 1996). However, by contrast, pollen data show that humanimpact on the bogwasmoderate until AD1800. In Pomerania extensiveland-use changes took place in the last 200 years with massivedeforestation, drainage and exploitation of the raised bogs.
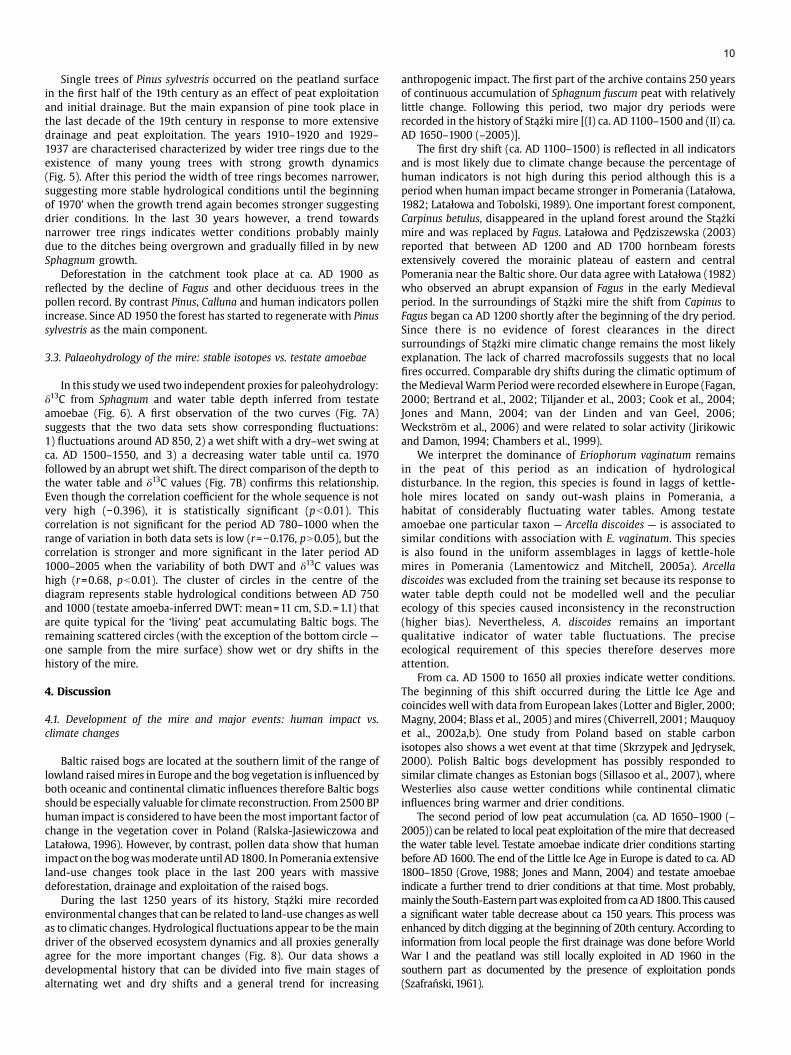
During the last 1250 years of its history, Stążki mire recordedenvironmental changes that can be related to land-use changes aswellas to climatic changes. Hydrological fluctuations appear to be themaindriver of the observed ecosystem dynamics and all proxies generallyagree for the more important changes (Fig. 8). Our data shows adevelopmental history that can be divided into five main stages ofalternating wet and dry shifts and a general trend for increasing
anthropogenic impact. The first part of the archive contains 250 yearsof continuous accumulation of Sphagnum fuscum peat with relativelylittle change. Following this period, two major dry periods wererecorded in the history of Stążki mire [(I) ca. AD 1100–1500 and (II) ca.AD 1650–1900 (–2005)].
The first dry shift (ca. AD 1100–1500) is reflected in all indicatorsand is most likely due to climate change because the percentage ofhuman indicators is not high during this period although this is aperiod when human impact became stronger in Pomerania (Latałowa,1982; Latałowa and Tobolski, 1989). One important forest component,Carpinus betulus, disappeared in the upland forest around the Stążkimire and was replaced by Fagus. Latałowa and Pędziszewska (2003)reported that between AD 1200 and AD 1700 hornbeam forestsextensively covered the morainic plateau of eastern and centralPomerania near the Baltic shore. Our data agree with Latałowa (1982)who observed an abrupt expansion of Fagus in the early Medievalperiod. In the surroundings of Stążki mire the shift from Capinus toFagus began ca AD 1200 shortly after the beginning of the dry period.Since there is no evidence of forest clearances in the directsurroundings of Stążki mire climatic change remains the most likelyexplanation. The lack of charred macrofossils suggests that no localfires occurred. Comparable dry shifts during the climatic optimum oftheMedievalWarm Periodwere recorded elsewhere in Europe (Fagan,2000; Bertrand et al., 2002; Tiljander et al., 2003; Cook et al., 2004;Jones and Mann, 2004; van der Linden and van Geel, 2006;Weckström et al., 2006) and were related to solar activity (Jirikowicand Damon, 1994; Chambers et al., 1999).
We interpret the dominance of Eriophorum vaginatum remainsin the peat of this period as an indication of hydrologicaldisturbance. In the region, this species is found in laggs of kettle-hole mires located on sandy out-wash plains in Pomerania, ahabitat of considerably fluctuating water tables. Among testateamoebae one particular taxon — Arcella discoides — is associated tosimilar conditions with association with E. vaginatum. This speciesis also found in the uniform assemblages in laggs of kettle-holemires in Pomerania (Lamentowicz and Mitchell, 2005a). Arcelladiscoides was excluded from the training set because its response towater table depth could not be modelled well and the peculiarecology of this species caused inconsistency in the reconstruction(higher bias). Nevertheless, A. discoides remains an importantqualitative indicator of water table fluctuations. The preciseecological requirement of this species therefore deserves moreattention.
From ca. AD 1500 to 1650 all proxies indicate wetter conditions.The beginning of this shift occurred during the Little Ice Age andcoincides well with data from European lakes (Lotter and Bigler, 2000;Magny, 2004; Blass et al., 2005) and mires (Chiverrell, 2001; Mauquoyet al., 2002a,b). One study from Poland based on stable carbonisotopes also shows a wet event at that time (Skrzypek and Jędrysek,2000). Polish Baltic bogs development has possibly responded tosimilar climate changes as Estonian bogs (Sillasoo et al., 2007), whereWesterlies also cause wetter conditions while continental climaticinfluences bring warmer and drier conditions.
The second period of low peat accumulation (ca. AD 1650–1900 (–2005)) can be related to local peat exploitation of themire that decreasedthe water table level. Testate amoebae indicate drier conditions startingbefore AD 1600. The end of the Little Ice Age in Europe is dated to ca. AD1800–1850 (Grove, 1988; Jones and Mann, 2004) and testate amoebaeindicate a further trend to drier conditions at that time. Most probably,mainly the South-Easternpartwas exploited fromcaAD1800. This causeda significant water table decrease about ca 150 years. This process wasenhanced by ditch digging at the beginning of 20th century. According toinformation from local people the first drainage was done before WorldWar I and the peatland was still locally exploited in AD 1960 in thesouthern part as documented by the presence of exploitation ponds(Szafrański, 1961).
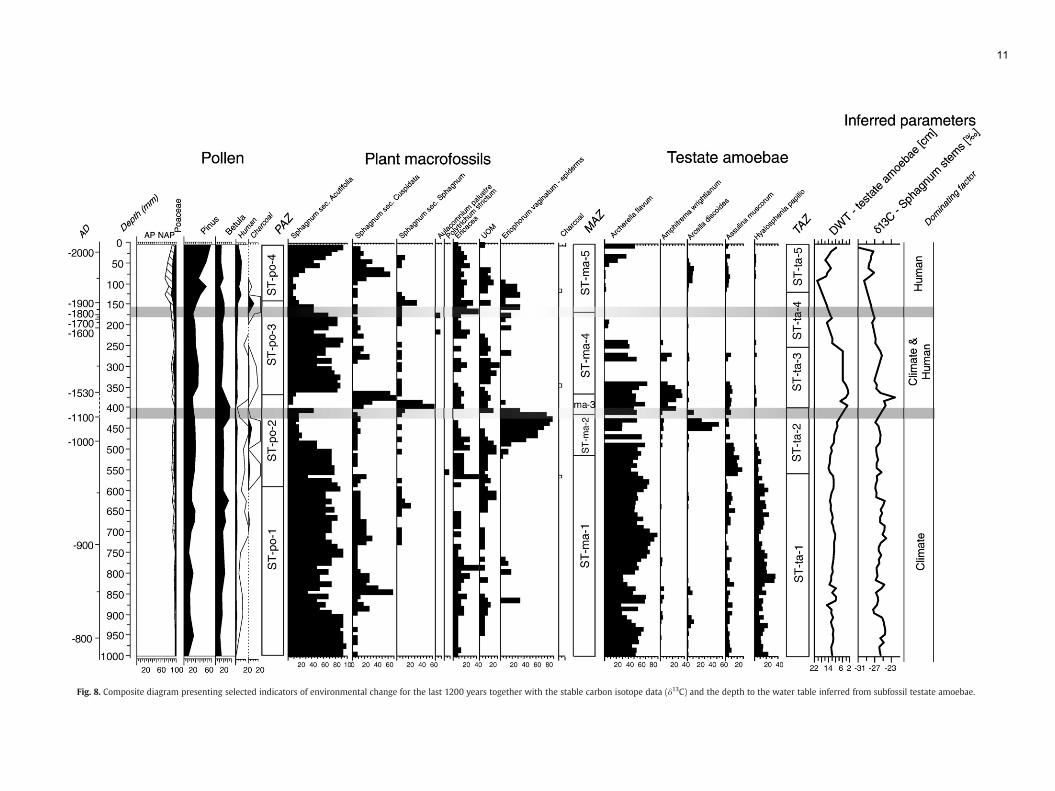
Fig. 8. Composite diagram presenting selected indicators of environmental change for the last 1200 years together with the stable carbon isotope data (δ13C) and the depth to the water table inferred from subfossil testate amoebae.
11
12
Dendrochronological analysis of pine trees growing on the miresurface (Fig. 5) further showed that the current pine population on themire became established by ca AD 1820. But taking into account thelikely very slow tree growth to the height of 130 cm (+10–15 cmcorresponding to peat accumulation since this date), pine colonisationmight have started in the 18th or possibly even 17th century. Pineexpansion therefore seems to be directly related with substantialanthropogenic decrease of the water table as was also observed inraised bogs of the Swiss Jura Mountains (Frelechoux et al., 2000a,b).Because the dynamics of pine growth is strongly influenced bydrainage, we cannot draw palaeoclimatic conclusions from the treerings.
The overlying non-compacted part of the acrotelm (accumulatedsince ca AD 1950) recorded the abandonment of exploitation andfilling up of ditches reflected in the record of Arcella discoides and laterArcherella flavum and by Sphagnum sec. Cuspidata. Currently the miresurface is covered with Calluna vulgaris and scattered pines indicatingrelatively dry conditions, but the declining growth rate of pine treesindicates that conditions are getting wetter in not disturbed part ofthe the bog.
Two of our broader goals were to determine if Pomeranianpeatlands can be used to infer recent climatic history and if so fromwhich point in time human impact caused the peatlands to becomeunsuitable for palaeoclimatic reconstruct. Our data show 1) thatbefore AD 1800 both human and climatic signals were recorded and2) that the effects of local peat exploitation and drainage dominate thepalaeoecological signal from ca AD 1800 onwards. Similarly, a recentdendroecological study (Cedro and Lamentowicz, in press) revealedthat there is no link between tree ring widths and climatic factorssince the establishment of pine on the surface of the bog. Anotherstudy on a kettle-hole mire in southern Pomerania showed that thisapparently pristine small mire surrounded by forests was alsodisturbed by human activities (Lamentowicz, 2005; Lamentowiczet al., 2007). Consequently, there are two main limitations topalaeoclimatic reconstruction associated with palaeoecological stu-dies of peatlands in northern Poland: 1) artificial water table decreasecaused by peat digging and drainage in ombrotrophic Baltic bogs, and2) land-use changes (e.g. deforestation, afforestation and agriculture)in the catchment area of peatlands. As we continue to study additionalsites we hope to disentangle the effects of human impact and climaticchange in the mire.
4.2. Disappearance of Sphagnum fuscum in Pomerania, an analogue tothe disappearance of S. austinii (S. imbricatum) in Britain?
Sphagnum fuscum declined in Stążki mire twice at ca AD 1000 andca AD 1800. The first decline, which took place during a dry phase thatwe interpret as climate-driven, is synchronous with the extinction ofSphagnum austinii in the UK between cal. AD 1030–1400, which wasinterpreted as due to inter-specific competition between Sphagnumspecies during the ‘Early Medieval Warm Period’ and the ‘Little IceAge’ (Mauquoy and Barber, 1999). Sphagnum fuscum has not recoveredafter the second decline at ca. AD 1800 in agreement with other datafrom Poland (Jasnowski, 1962). The most likely cause for this decline isa lowering of the water table due to direct human impact (e.g. localpeat cutting, drainage). Around 1950, S. fuscumwas replaced by otherSphagnum species (e.g. S. capillifolum) of Acutifolia section thattolerate well low water table.
Although peat exploitation was still taking place in the southernfringe of themire around ca.1960 (Szafrański, 1961), this may not havehad a very significant impact at the coring site. It therefore remainspossible that climate change was an additional cause for thisdisappearance. If climate change indeed played a role, it would havedriven to extinction a species that had already became rare due todirect impact on mire. A positive feedback mechanism involving pinetrees might also have been involved: It is also likely that drier
conditions on the bog were in part amplified by evapotranspirationfrom the increasing cover of pine trees on the bog, as was observed inpeatlands in the Jura Mountains (Mitchell et al., 2001; Freléchouxet al., 2003). Another study of a Baltic bog (Słowińskie Błoto) located100 km east from Stążki showed a similar dry shift and associatedS. fuscum extinction (Lamentowicz et al., in preparation). However,Herbichowa (1998) observed that this species had already declinedalready 500 years ago and is now extinct in Pomeranian Baltic bogs,suggesting an earlier significant human impact in this area. Interest-ingly, this event again parallels the extinction of Sphagnum austinii(Sull. ex Aust.) (=Sphagnum imbricatum Hornsch. ex Russow ssp.austinii (Sull.) Flatberg) across Wales that was dated to ca 1840(Hughes et al., 2007).
4.3. Palaeohydrology of the mire: stable isotopes vs. testate amoebae
This study is the first to compare δ13C values from Sphagnum andwater table depth inferred from testate amoebae. Because the leaves ofSphagnum mosses do not contain stomata the isotopic discriminationof carbon is mainly controlled by the thickness of thewater film on theleaves. The stable carbon isotope data obtained from Sphagnum stemsis therefore a proxy for moisture changes at the surface. Higher/lessnegative values of δ13C indicate higher availability of water forpeatmosses (Rice and Giles, 1996; Ménot-Combes et al., 2004; Loaderet al., 2007) and hence higher precipitation (or at least a more positivebalance between precipitation and evaporation). As testate amoebaealso reflect surfacewetness these two indicators should yield the samesignal. This is indeed the case and especially for the period of greatestfluctuations in both data sest (Fig. 7A and B). The similarity in thepatterns of both proxies provides an independent confirmation for thevalue of each of them. Nevertheless, the correlation is not perfect andthis can be due to 1) the imperfect DWT reconstruction from testateamoebae and/or 2) the imperfect relationship between DWT and δ13Cof Sphagnum, and/or 3) the fact that the thickness of the water film ismore directly related to surface moisture than to water table depth.
Acknowledgements
The studywasfinancedwith a grant of the PolishMinistry of Scienceand Higher Education for the project Climatic changes in Pomerania(N Poland) in the last millennium based on multiproxy high-resolutionstudies (No. 2P04G03228) (Principal Investigator — M. Lamentowicz).Financial support is also acknowledged from Swiss NSF (project no.205321-109709/1 to E. Mitchell). This work was carried out incollaborationwith the EU-funded ProjectMILLENNIUM (017008). Stableisotopes analyses were supported by EC through Marie Curie ActionsToK grant “ATIS”MTKD-CT-2005-029642.We thank Kazimierz Tobolskifor the fruitful discussions, Milena Obremska for pollen diagramconstruction, Łukasz Lamentowicz for help in the field and duringsample preparation, and Bas vanGeel and an anonymous reviewer fromuseful comments on the manuscript.
References
Andreev, A.A., Tarasov, P.E., Siegert, C., Ebel, T., Klimanov, V.A., Melles, M., Bobrov, A.A.,Dereviagin, A.Y., Lubinski, D.J., Hubberten, H.-W., 2003. Late Pleistocene andHolocene vegetation and climate on the northern Taymyr Peninsula, Arctic Russia.Boreas 32, 484–505.
Appleby, P.G., 2001. Chronostratigraphic techniques in recent sediments. In: Last, W.M.,Smol, J.P. (Eds.), Tracking Environmental Changes Using Lake Sediments. KluwerAcademic Publishers, Dordrecht, pp. 171–203.
Barber, K.E., Langdon, P.G., 2007. What drives the peat-based palaeoclimate record? Acritical test using multi-proxy climate records from northern Britain. QuaternaryScience Reviews 26, 3318–3327.
Behre, K.-E., Hölzer, A., Lemdahl, G., 2005. Botanical macro-remains and insects fromthe Eemian and Weichselian site of Oerel (northwest Germany) and their evidencefor the history of climate. Vegetation History and Archaeobotany 14, 31–53.
Berglund, B.E., Ralska-Jasiewiczowa, M., 1986. Pollen analysis and pollen diagrams. In:Berglund, B.E. (Ed.), Handbook of Holocene Paleoecology and Paleohydrology.Wiley & Sons Ltd., Chichester-Toronto, pp. 455–484.
13
Bertrand, C., Loutre, M.-F., Crucifix,M., Berger, A., 2002. Climate of the last millennium: asensitivity study. Tellus A 54, 221–244.
Blaauw, M., van Geel, B., van der Plicht, J., 2004. Solar forcing of climatic change duringthe mid-Holocene: indications from raised bogs in The Netherlands. The Holocene14, 35–44.
Blass, A., Anselmetti, F.S., Grosjean, M., Sturm, M., 2005. The last 1300 years ofenvironmental history recorded in the sediments of Lake Sils (Engadine, Switzer-land). Eclogae geol. Helv. 98, 319–332.
Blundell, A., Barber, K., 2005. A 2800-year palaeoclimatic record from Tore Hill Moss,Strathspey, Scotland: the need for a multi-proxy approach to peat-based climatereconstructions. Quaternary Science Reviews 24, 1261–1277.
Booth, R.K., 2007. Testate amoebae as proxies for mean annual water-table depth inSphagnum-dominated peatlands of North America. Journal of Quaternary Science23, 43–57.
Booth, R.K., Notaro, M., Jackson, S.T., Kutzbach, J.E., 2006. Widespread drought episodesin the western Great Lakes region during the past 2000 years: geographic extentand potential mechanisms. Earth and Planetary Science Letters 242, 415–427.
Buttler, A., Warner, B.G., Grosvernier, P., Yvan, M., 1996. Vertical patterns of testateamoebae (Protozoa: Rhizopoda) and peat-forming vegetation on cutover bogs inthe Jura, Switzerland. New Phytologist 134, 371–382.
Cedro, A. and Lamentowicz, M., in press. Last hundred years dendroecology of Scots pinePinus sylvestris L. on a raised bog in northern Poland: human impact andhydrological changes. Baltic Forestry.
Chambers, F.M., Ogle, M.I., Blackford, J.J., 1999. Palaeoenvironmental evidence for solarforcing of Holocene climate: linkages to solar science. Progress in PhysicalGeography 23, 181–204.
Charman, D.J., 1999. Testate amoebae and the fossil record: issues in biodiversity.Journal of Biogeography 26, 89–96.
Charman, D.J., 2002. Peatlands and Environmental Change. John Wiley & Sons,Chichester.
Charman, D., Blundell, A., 2007. A new European testate amoebae transfer function forpalaeohydrological reconstruction on ombrotrophic peatlands. Journal of Quatern-ary Science 22, 209–221.
Charman, D.J., Brown, A.D., Hendon, D., Karofeld, E., 2004. Testing the relationshipbetween Holocene peatland palaeoclimate reconstructions and instrumental dataat two European sites. Quaternary Science Reviews 23, 137–143.
Chiverrell, R.C., 2001. A proxy record of late Holocene climate change from May Moss,northeast England. Journal of Quarternary Science 16, 9–29.
Cook, E.R., Esper, J., D'Arrigo, R.D., 2004. Extra-tropical Northern Hemisphere landtemperature variability over the past 1000 years. Quaternary Science Reviews 23,2063–2074.
Crowley, P.H., 1992. Resampling methods for data analysis in computation-intensiveecology and evolution. Annual Review of Ecology and Systematics 23, 405–447.
Esper, J., Wilson, R.J.S., Frank, D.C., Moberg, A., Wanner, H., Luterbacher, J., 2005. Climate:past ranges and future changes. Quaternary Science Reviews 24, 2164–2166.
Faegri, K., Iversen, J., 1989. Texbook of Pollen Analysis. John Wiley & Sons, Ltd.Fagan, B., 2000. The Little Ice Age. Basic Books, New York.Flynn, W.W., 1968. The determination of low-levels of polonium-210 in environmental
materials. Analytica Chemica Acta 43, 221–227.Frelechoux, F., Buttler, A., Gillet, F., 2000a. Dynamics of bog-pine-dominated mires in
the Jura Mountains, Switzerland: a tentative scheme based on synusial phytoso-ciology. Folia Geobotanica 35, 273–288.
Freléchoux, F., Buttler, A., Schweingruber, F.H., Gobat, J., 2000b. Stand structure, invasionand growth dynamic of bog pine (Pinus uncinata var. rotundata) in relation to peatcutting and drainage in the Jura Mountains, Switzerland. Canadian Journal of ForestResearch 30, 1114–1126.
Freléchoux, F., Buttler, A., Gillet, F., Gobat, J.M., Schweingruber, F.H., 2003. Successionfrom bog pine (Pinus uncinata var. rotundata) to Norway spruce (Picea abies) standsin relation to anthropic factors in Les Saignolis bog, Jura Mountains, Switzerland.Annals of Forest Science 60, 347–356.
Goslar, T., Czernik, J., Goslar, E., 2004. Low-energy 14C AMS in Poznań RadiocarbonLaboratory. Nuclear Instruments and Methods B, 5–11.
Goslar, T., Engstrom, D.R., Van der Knaap, W.O., 2005. Comparison of AMS 14C and 210Pbdates of a modern peat profile. 10th International Conference on Accelerator MassSpectrometry. Berkley, California, 38 pp.
Grimm, E.C., 1987. CONISS: a fortran 77 program for stratigraphically constrained clusteranalysis by the method of incremental sum of squares. Computers & Geosciences13, 13–35.
Grimm, E.C., 1992. TILIA/TILIA Graph. Version 1.2. Illinois State Museum. Springfield,Illinois.
Grosse-Brauckmann, G., 1972. Über pflanzliche Makrofossilien mitteleuropäischerTorfe. I. Gewebereste krautiger Pflanzen und ihre Merkmale. Telma 2, 19–55.
Grosse-Brauckmann, G., 1974. Über pflanzliche Makrofossilien mitteleuropäischerTorfe. II. Weitere Reste (Früchte und Samen, Moose u. a.) und ihre Bestimmungs-möglichkeiten. Telma 4, 51–117.
Grove, J.M., 1988. The Little Ice Age. Routledge.Gumiński, R., 1948. Próba wydzielenia dzielnic rolniczo-klimatycznych w Polsce.
Przegląd Meteorologiczno-Hydrologicznych, 1.Hall, V.A., Mauquoy, D., 2005. Tephra-dated climate- and human-impact studies during
the last 1500 years from a raised bog in central Ireland. The Holocene 15,1086–1093.
Hendon, D., Charman, D.J., 1997. The preparation of testate amoebae (Protozoa:Rhizopoda) samples from peat. The Holocene 7, 199–205.
Herbichowa, M., 1997. Rozwój, współczesna roślinność oraz problemy ochrony torfowiskbałtyckich. In: Fałtynowicz, W., Latałowa, M., Szmeja, J. (Eds.), Dynamika i ochronaroślinności Pomorza. Bogucki Wydawnictwo Naukowe, Gdańsk-Poznań, pp. 125–134.
Herbichowa, M.,1998. Ekologiczne studium rozwoju torfowiskwysokichwłaściwych naprzykładzie wybranych obiektów z środkowej części Pobrzeża Bałtyckiego.Wydawnictwo Uniwersytetu Gdańskiego, Gdańsk.
Holmes, R.J., 1983. Computer-assisted quality control in tree-ring dating and measure-ment. Tree-Ring Bull. 43, 69–78.
Holmes, R.J., 1994. Dendrochronology Program Library. Users Manual. University ofArizona, Tucson.
Hughes, P.D.M., Lomas-Clarke, S.H., Schulz, J., Jones, P., 2007. The declining quality oflate-Holocene ombrotrophic communities and the loss of Sphagnum austinii (Sull.ex Aust.) on raised bogs in Wales. The Holocene 17, 613–625.
Jasnowski, M., 1962. Budowa i roślinność torfowisk Pomorza Szczecińskiego. Szczec.Tow. Przyj. Nauk, Wydz. Nauk Rol-Przyr., 10, 1–339.
Jasnowski, M., Jasnowska, J., Markowski, S., 1968. Ginące torfowiska wysokie iprzejściowe w pasie nadbałtyckim Polski. Ochrona Przyrody 33, 69–124.
Jirikowic, J.L., Damon, P.E., 1994. The medieval solar activity maximum. Climatic Change26, 309–316.
Jones, P.D., Mann, M.E., 2004. Climate over past millennia. Rev. Geophys. 42 pp.Juggins, S., 2003. C2 User Guide. Software for Ecological and Palaeoecological Data
Analysis and Visualisation. University of Newcastle, Newcastle upon Tyne, UK.Kalis, A.J., Merkt, J., Wunderlich, J., 2003. Environmental changes during the Holocene
climatic optimum in central Europe— human impact and natural causes. QuaternaryScience Reviews 22, 33–79.
Katz, N.J., Katz, S.V. and Kipiani, M.G., 1965. Atlas opredelitel' plodov i semyanvstretchayushchikhsya v chetvertinnykh otuocheniyakh SSSR. Izd. Nauka, Moskva.
Katz, N.J., Katz, S.V., Skobiejeva, E.I., 1977. Atlas rastitielnych ostatkov v torfach. Nedra,Moskva.
Kondracki, J., 1998. Regional Geography of Poland (in Polish). PWN, Warszawa.Lamentowicz, M., 2004. Origin and development of natural and seminatural peatlands
in Tuchola Forest Inspectorate. Department of Biogeography and Palaeoecology.PhD thesis. Adam Mickiewicz University (in Polish), Poznań.
Lamentowicz, M., 2005. Origin and development of natural and seminatural peatlandsin Tuchola Forest Inspectorate (in Polish). Prace Zakładu Biogeografii i PaleoekologiiUAM Poznań, vol. 5. Bogucki Wydawnictwo Naukowe, Poznań.
Lamentowicz, M., Mitchell, E.A.D., 2005a. The ecology of testate amoebae (Protists) inSphagnum in north-western Poland in relation to peatland ecology. MicrobialEcology 50, 48–63.
Lamentowicz, M., Mitchell, E.A.D., 2005b. Testate Amoebae (Protists) as Palaeoenviron-mental Indicators in Peatlands. Special Papers, vol. 16. Polish Geological Institute.
Lamentowicz, M., Tobolski, K., Mitchell, E.A.D., 2007. Palaeoecological evidence foranthropogenic acidification of a kettle-hole peatland in northern Poland. TheHolocene 17, 1185–1196.
Lamentowicz, M., Obremska, M., Mitchell, E.A.D., in press. Autogenic succession, land-use change, and climatic influences on the Holocene development of a kettle holemire in Northern Poland (Northern Poland). Review of Palaeobotany & Palynology.doi:10.1016/j.revpalbo.2008.01.009 printed online.
Lamentowicz, M., Milecka, K., Gałka, M., Cedro, A., Pawlyta, J., Piotrowska, N.,Lamentowicz, Ł. and van der Knaap, W.O., in preparation. Climatic change andhuman disturbance in Pomerania (N Poland) since AD 800: a multi-proxy highresolution study from ombrotrophic mire.
Latałowa, M.,1982. Major aspects of the vegetational history in the eastern Baltic coastalzone of Poland. Acta Palaeobotanica 22, 47–63.
Latałowa, M., Tobolski, K., 1989. Type region P-u: Baltic shore. Acta Palaeobotanica 29.Latałowa, M., Pędziszewska, A., 2003. Zbiorowiska leśne z udziałem grabu (Carpinus
betulus)i buka (Fagus sylvatica) na Wysoczyźnie Gdańskiej w późnym Holoce-nie. Wstępne wyniki badań. In: Gołębiewski, R. (Ed.), Ewolucja pojezierzy ipobrzeży południowobałtyckich. Fundacja Rozwoju Uniwesytetu Gdańskiego,Gdańsk, pp. 95–100.
Lavoie, C., Zimmermann, C., Pellerin, S., 2001. Peatland restoration in southern Quebec(Canada): a paleoecological perspective. Ecoscience 8, 247–258.
Loader, N.J., McCarroll, D., Knaap, W.O.v.d., Robertson, I., Gagen, M., 2007. Characterizingcarbon isotopic variability in Sphagnum. The Holocene 17, 403–410.
Lotter, A.F., Bigler, C., 2000. Do diatoms in the Swiss Alps reflect the length of ice-cover?Aquatic Sciences 62, 125–141.
Magny, M., 2004. Holocene climate variability as reflectedby mid-European lake-levelfluctuations andits probable impact on prehistoric human settlements. QuaternaryInternational 113, 65–79.
Mauquoy, D., Barber, K.E., 1999. Evidence for climatic deteriorations associated with thedecline of Sphagnum imbricatum Hornsch. ex Russ. in six ombrotrophic mires fromnorthern England and the Scottish Borders. The Holocene 9, 423–437.
Mauquoy, D., Engelkes, T., Groot, M.H.M., Markesteijn, F., Oudejans, M.G., van der Plicht,J., Van Geel, B., 2002a. High-resolution records of late-Holocene climate change andcarbon accumulation in north-west European ombrotrophic peat bogs. Palaeogeo-graphy, Palaeoclimatology, Palaeoecology 186, 275–310.
Mauquoy, D., van Geel, B., Blaauw, M., van der Plicht, J., 2002b. Evidence from northwestEuropean bogs shows ‘Little Ice Age’ climatic changes driven by variations in solaractivity. The Holocene 12, 1–6.
Ménot-Combes, G., Burns, S.J., 2001. Carbon isotopes in ombrogenic peat bog plants asclimatic indicators: calibration from an altitudinal transect in Switzerland. OrganicGeochemistry 32, 233–245.
Ménot-Combes, G., Combes, P.-P., Burns, Stephen J., 2004. Climatic information fromδ13C in plants by combining statistical and mechanistic approaches. The Holocene14, 931–939.
Mitchell, E.A.D., van der Knaap,W.O., Leeuwen, J.F.N., Buttler, A.,Warner, B.G., Gobat, J.M.,2001. The palaeoecological history of the Praz-Rodet bog (Swiss Jura) based onpollen, plant macrofossils and testate amoebae (Protozoa). The Holocene 11,65–80.
14
Mitchell, E., Charman, D., Warner, B., in press. Testate amoebae analysis in ecologicaland paleoecological studies of wetlands: past, present and future. Biodiversity andConservation. doi:10.1007/s10531-007-9221-3.
Nilsson, M., Klarqvist, M., Bohlin, E., Possnert, G., 2001. Variation in 14C age ofmacrofossils and different fractions of minute peat samples dated by AMS. TheHolocene 11, 579–586.
Pawlaczyk, P., Herbichowa, M., Stańko, R., 2005. Ochrona torfowisk bałtyckich.Wydawnictwo Klubu Przyrodników, Świebodzin.
Price, G.D., McKenzie, J.E., Pilcher, J.R., Hoper, S.T., 1997. Carbon-isotope variation inSphagnum from hummock-hollow complexes: implications for Holocene climatereconstruction. The Holocene 7, 229–233.
Ralska-Jasiewiczowa, M., Latałowa, M., 1996. Poland. In: Berglund, B.E., Birks, H.J.B.,Ralska-Jasiewiczowa, M., WrightJr. Jr., H.E. (Eds.), Palaeoecological events duringthe last 15000 years: regional syntheses of palaeoecological studies of lakes andmires in Europe. John Wiley, Chichester, pp. 403–472.
Räsänen, S., Froyd, C., Goslar, T., 2007. The impact of tourism and reindeer herding onforest vegetation at Saariselka, Finnish Lapland: a pollen anałytical study of a highresolution peat profile. The Holocene 17, 447–456.
Rice, S.K., Giles, L., 1996. The influence of water content and leaf anatomy on carbonisotope discrimination and photosynthesis in Sphagnum. Plant, Cell & Environment19, 118–124.
Rydin, H., Jeglum, J., 2006. The Biology of Peatlands. Oxford University Press.Scheffer, M., Carpenter, S., Foley, J.A., Folke, C., Walkerk, B., 2001. Catastrophic shifts in
ecosystems. Nature 413, 591–596.Schoning, K., Charman, D.J., Wastegård, S., 2005. Reconstructed water tables from two
ombrotrophic mires in eastern central Sweden compared with instrumentalmeteorological data. The Holocene 15, 111–118.
Sillasoo, Ü., Mauquoy, D., Blundell, A., Charman, D., Blaauw, M., Daniell, J.R.G., Toms, P.,Newberry, J., Chambers, F.M., Karofeld, E., 2007. Peat multi-proxy data fromMännikjärve bog as indicators of late Holocene climate changes in Estonia. Boreas36, 20–37.
Skrzypek, G., Jędrysek, M.O., 2000. Climatic variation in the last millennium in Poland:δ13C peat profiles. In: Obrębska-Starkel, B. (Ed.), Reconstructions of climate and ismodelling. Institute of Geography of the Jagiellonian University, Cracov, pp.131–136.
Skrzypek, G., Jędrysek, M.-O., 2004. 13C/12C Ratio in Peat Cores: Record of Past Climates.Szafrański, F., 1961. Polodowcowa historia lasów obszaru na północ od Wysoczyzny
Staniszewskiej. Badania Fizjograficzne nad Polską Zachodni 8, 91–131.
Tarasov, P.E., Brovkin, V., Wagner, M., 2005. What drives the climate: man or nature?PAGES News 13, 24–25.
Tiljander, M., Saarnisto, M., Ojala, A.E.K., Saarinen, T., 2003. A 3000-year palaeoenvir-onmental record from annually laminated sediment of Lake Korttajarvi, centralFinland. Boreas 26, 566–577.
Tobolski, K., 1987. Holocene vegetational development based on the Kluki Reference Sitein the Gardno-Łeba Plain. Acta Paleobotanica 27, 179–222.
Tobolski, K., 2000. Przewodnik do oznaczania torfów i osadów jeziornych. PWN,Warszawa.
Tobolski, K., 2003. Torfowiska, na przykładzie Ziemi Świeckiej. Towarzystwo PrzyjaciółDolnej Wisły, Świecie.
Turetsky, M.R., Manning, S.W., Wieder, R.K., 2004. Dating recent peat deposits.Wetlands 24, 324–356.
Väliranta, M., Korhola, A., Seppä, H., Tuittila, E.-S., Sarmaja-Korjonen, K., Laine, J., Alm, J.,2007. High-resolution reconstruction of wetness dynamics in a southern borealraised bog, Finland, during the late Holocene: a quantitative approach. TheHolocene 17, 1093–1107.
van der Linden, M., van Geel, B., 2006. Late Holocene climate change and human impactrecorded in a south Swedish ombrotrophic peat bog. Palaeogeography, Palaeocli-matology, Palaeoecology 240, 649–667.
Wardenaar, E.C.P., 1987. A new hand tool for cutting peat profiles. Canadian Journal ofBotany 65, 1772–1773.
Warner, B.G., Charman, D.J., 1994. Holocene changes on a peatland in northwesternOntario based on fossil testate amoebae (Protozoa) analysis. Boreas 23, 270–279.
Weckström, J., Korhola, A., Erästö, P., Holmström, L., 2006. Temperature patterns overthe past eight centuries in Northern Fennoscandia inferred from sedimentarydiatoms. Quaternary Research 66, 78–86.
Zielski, A., Krąpiec, M., 2004. Dendrochronologia. PWN, Warszawa.Żurek, S., 1993. Zmiany paleohydrologiczne w mokradłach. Przegląd Geograficzny 64,
75–95.Żurek, S., Pazdur, A., 1999. Zapis zmian paleohydrologicznych w rozwoju torfowisk
Polski. W: Geochronologia górnego czwartorzędu Polski. In: Pazdur, A. (Ed.),Geochronologia górnego czwartorzędu Polski, Gliwice, pp. 215–228.
Żurek, S., Michczyńska, D., Pazdur, A., 2002. Time record of palaeohydrological changesin the development of mires during the late glacial and holocene, north Podlasielowland and Holy Cross mts. Geochronometria 21, 109–118.


