Embed Size (px)
Citation preview

eology 69 (2007) 165–178www.elsevier.com/locate/ijcoalgeo
International Journal of Coal G
Lateral variation in geochemistry, petrology, and palynology in theElswick coal bed, Pike County, Kentucky
James C. Hower a,⁎, Leslie F. Ruppert b, Cortland F. Eble c
a University of Kentucky Center for Applied Energy Research, 2540 Research Park Drive, Lexington, KY 40511, USAb U.S. Geological Survey, Reston, VA, USA
c Kentucky Geological Survey, Lexington, KY 40506, USA
Received 21 March 2006; accepted 25 April 2006Available online 3 July 2006
Abstract
The Middle Pennsylvanian/Langsettian (Westphalian A) Elswick coal bed, correlative to the Upper Banner of Virginia, is a rareexample of a mined high-sulfur (>2%) coal in Eastern Kentucky, a region known for low-sulfur coals. To characterize lateralvariation in the geochemistry, petrography, and palynology of the Elswick coal bed, three sites were sampled along a southeast–northwest transect within a single mine. At the southeastern site, the lower 101 cm of the 116-cm thick coal is dull, generallydominated by durain and dull clarain. While all benches at this site fit within the previously-defined “mixed palynoflora —moderate/low vitrinite group,” suggesting a stressed environment of deposition, the palynology of the benches of the dull intervalshow greater diversity than might be expected just from the petrology. Lithology is generally similar between the sites, but each sitehas some differences in the petrology. Overall, the coal bed shows significant lateral variation in properties at the mine scale, someof which can be attributed to the gain or loss of upper and lower lithologies, either through an actual physical merging or throughthe change in character of lithotypes.
Sulfur content varies between the three sites examined for this study. Site 3, located in the northwestern portion of the study areais characterized by a strikingly high sulfur zone (7.45%) in the middle of the coal bed, a feature missing at the other sites. Pyrite andmarcasite, in a mid-seam lithotype at the northwestern site (site 3), show signs of overgrowths, indicating multiple generations ofsulfide emplacement. The high-sulfur site 3 lithologies all have massive overgrowths of euhedral and framboidal pyrite, fracture-and cleat-fill pyrite, and sulfide emplacement in fusinite lumens. Sulfur is high throughout the mine area, but variations are evidentin the extent of secondary growth of sulfides.© 2006 Elsevier B.V. All rights reserved.
Keywords: Kentucky; Coal; Petrology; Geochemistry; Palynology
1. Introduction
Most of the coal mined in eastern Kentucky are lowin sulfur (<1.5%), however, there are some examples of
⁎ Corresponding author. Tel.: +1 859 257 0261; fax: +1 859 2570360.
E-mail address: [email protected] (J.C. Hower).
0166-5162/$ - see front matter © 2006 Elsevier B.V. All rights reserved.doi:10.1016/j.coal.2006.04.007
higher sulfur content coals (>1.5%) that are mined(Hower and Pollock, 1989; Hower et al., 1994a, 1996).One example of a high sulfur coal bed that was minedfrom the early part of the 20th century until 1948,resuming from 1981 until 1991, is the MiddlePennsylvanian/Langsettian (Westphalian A) Elswickcoal bed. The Elswick coal bed, correlative to theUpper Banner of Virginia, was mined at one location in
166 J.C. Hower et al. / International Journal of Coal Geology 69 (2007) 165–178
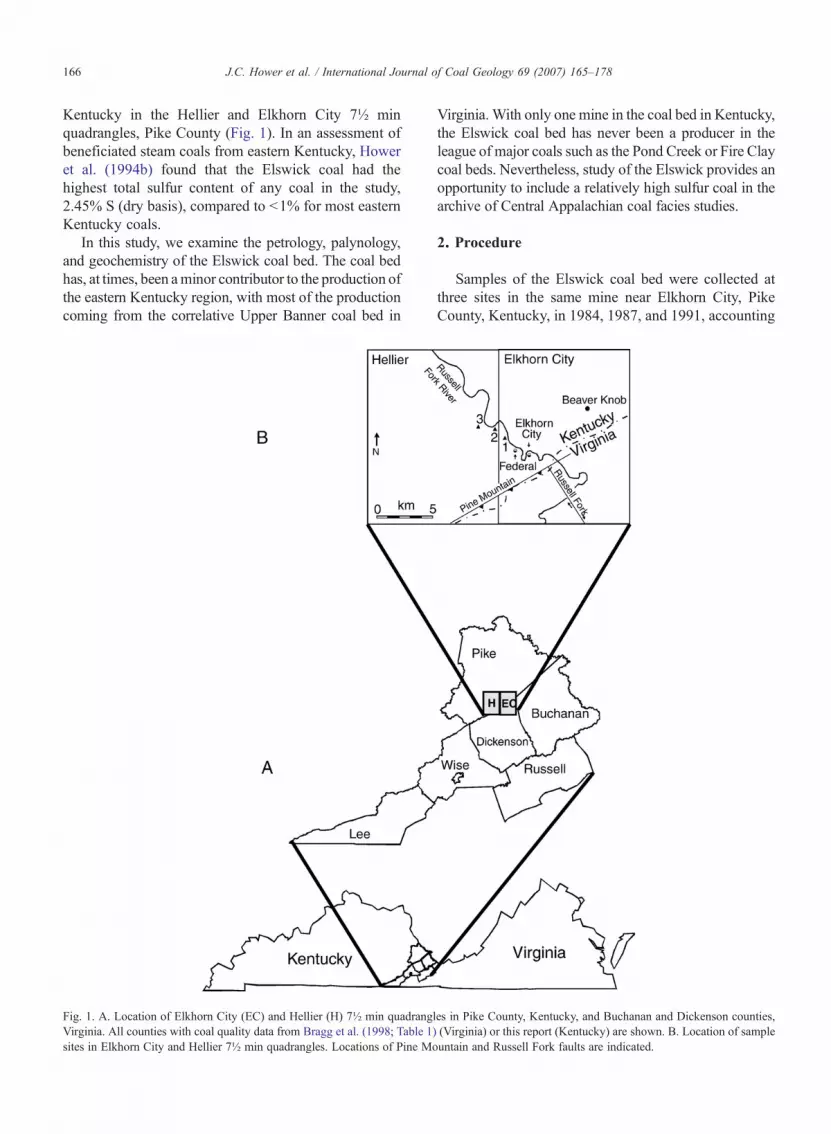
Kentucky in the Hellier and Elkhorn City 7½ minquadrangles, Pike County (Fig. 1). In an assessment ofbeneficiated steam coals from eastern Kentucky, Howeret al. (1994b) found that the Elswick coal had thehighest total sulfur content of any coal in the study,2.45% S (dry basis), compared to <1% for most easternKentucky coals.
In this study, we examine the petrology, palynology,and geochemistry of the Elswick coal bed. The coal bedhas, at times, been aminor contributor to the production ofthe eastern Kentucky region, with most of the productioncoming from the correlative Upper Banner coal bed in
Fig. 1. A. Location of Elkhorn City (EC) and Hellier (H) 7½ min quadrangVirginia. All counties with coal quality data from Bragg et al. (1998; Table 1sites in Elkhorn City and Hellier 7½ min quadrangles. Locations of Pine Mo
Virginia. With only one mine in the coal bed in Kentucky,the Elswick coal bed has never been a producer in theleague of major coals such as the Pond Creek or Fire Claycoal beds. Nevertheless, study of the Elswick provides anopportunity to include a relatively high sulfur coal in thearchive of Central Appalachian coal facies studies.
2. Procedure
Samples of the Elswick coal bed were collected atthree sites in the same mine near Elkhorn City, PikeCounty, Kentucky, in 1984, 1987, and 1991, accounting
les in Pike County, Kentucky, and Buchanan and Dickenson counties,) (Virginia) or this report (Kentucky) are shown. B. Location of sampleuntain and Russell Fork faults are indicated.

Table 1Sulfur forms and average major oxides content for the Upper Banner coal bed, a correlative of the Elswick coal in Virginia (data from Bragg et al.,1998)
Whole coal, dry basis Ash basis
County As. det. moist. Ash S S(sulf) S(py) S(org) SiO2 Al2O3 CaO MgO MnO Na2O K2O Fe2O3 TiO2 P2O5 SO3
Dickenson Avg. 1.91 10.24 0.80 0.03 0.25 0.52 46.68 27.68 2.22 1.27 0.03 0.51 2.35 9.61 1.06 0.17 3.10S.D. 2.03 6.11 0.40 0.04 0.44 0.11 7.65 3.06 1.77 0.54 0.03 0.26 0.81 7.80 0.58 0.29 3.20
Lee Avg. 0.85 5.89 2.25 0.01 1.25 0.99 28.00 20.00 4.45 0.87 0.03 0.40 0.82 31.00 1.14 0.83 2.60S.D. 0.28 0.69 1.31 0.00 0.79 0.52 12.73 4.24 2.76 0.01 0.02 0.04 0.54 8.49 0.51 1.09 0.57
Russell Avg. 0.50 7.05 0.55 0.02 0.11 0.43 46.00 27.75 2.35 2.09 0.04 1.51 1.37 7.93 0.69 0.25 3.46S.D. 0.87 3.19 0.17 0.01 0.07 0.11 5.35 4.99 1.28 1.98 0.02 1.88 0.73 2.00 0.90 0.30 2.56
Wise Avg. 0.05 4.46 0.52 0.02 0.06 0.47 38.00 26.50 4.20 1.55 0.02 1.45 1.55 11.20 1.04 0.06 9.65S.D. 0.07 0.23 0.02 0.00 0.04 0.03 9.90 9.19 2.97 0.64 0.01 0.64 0.49 2.55 0.09 0.03 7.57
Sulfur forms are reported on a whole coal, dry basis and major oxides are on an ash basis. Major oxide values are in percent. Means and standarddeviations for Dickenson County are based on 19 samples, Lee County two samples, Russell County four samples, and Wise County two samples.Abbreviations: S = sulfur; (sulf) = sulfate; (py) = pyritic; (org) = organic; as. det. moist. = as-determined moisture.
167J.C. Hower et al. / International Journal of Coal Geology 69 (2007) 165–178
for the geographic spread in the sites. In all cases,representative channel and lithotype samples wereobtained from a freshly-cleaned coal face near theworking face of the mine. Coal description followed
Table 2Minor and trace element content for the Upper Banner coal bed, a correlativ
Dickenson Lee Russell Wise
Avg. S.D. Avg. S.D. Avg. S.D. Avg. S.D.
As 9.8 15 24 15 3.6 0.43 2.7 0.42 MnAu 0.59 0.50 dl – dl – dl – MoB 11 9.2 28 9.2 13 6.1 13 7.6 NbBa 123 75 102 82 64 22 168 116 dlBe 2.2 1.2 0.6 0.04 1.5 0.8 1.6 1.3 NiBi 0.94 0.76 0.90 0.28 0.31 0.53 0.93 0.67 OsBr 6.7 7.3 3.0 0.71 1.30 2.6 2.7 0.4 PCe 22 11 14 5.7 20 14 11 4.9 PbCl 186 184 165 21 dl – 80 113 PrCo 6.5 2.8 2.0 0.14 3.1 1.7 8.3 5.3 RbCr 12 9.1 10 2.1 6.6 3.6 6.2 0.07 ReCs 0.84 0.88 dl – dl – dl – SbCu 18 6.5 12 3.7 13 3.8 10 3.3 ScDy 1.3 1.2 2.0 1.6 0.45 0.77 1.4 1.0 SeEr 0.71 0.59 0.69 0.73 dl – 1 0.46 SmF 127 122 105 21 40 17 31 4.9 SnGa 5.1 2.8 2.7 0.21 2.7 2.1 2.7 0.14 SrGd 1.2 0.90 1.7 0.70 dl 0.50 0.90 0.40 TaGe 0.72 0.94 1.4 0.00 dl – 2.0 2.3 TeHf 0.84 0.83 dl – dl – 0.36 0.16 ThHg 0.07 0.06 0.05 0.001 0.05 0.01 0.06 0.07 UHo dl – 0.63 0.52 dl – dl – VIr 0.90 0.76 0.62 0.07 dl – 0.71 0.37 WLa 11 6.0 8.5 3.5 8.1 3.6 4.9 2.0 YLi 22 19 6.8 1.2 21 26 6.8 1.1 YbLu dl – dl – 0.05 0.06 0.09 0.05 Zn
Zr
Minor, and trace elements on a dry, ash basis and are in parts per million. Abspl. = sample; dl = below detection limit.
lithotype nomenclature adapted from the Stopes–Heerlen terminology (Hower et al., 1990).
Major oxides were determined on a Phillips AXS X-Ray fluorescence unit at the Center for Applied Energy
e of the Elswick coal in Virginia (data from Bragg et al., 1998)
Dickenson Lee Russell Wise
Avg. S.D. Avg. S.D. Avg. S.D. Avg. S.D.
22 15 14 10 20 6.8 8.2 4.01.4 0.61 4.6 4.2 0.95 0 1.4 1.13.0 2.3 1.5 0 3.4 3.3 1.1 0.8110 5.5 9.3 3.9 7.8 4.2 7.1 7.011 4.8 6.2 0 8.1 7.4 7.4 0.491.2 1.1 0.62 0 dl – 0.66 0.00769 117 228 300 58 49 12 3.710 6.5 2.3 1.5 8.7 8.5 2.9 3.14.1 3.8 6.0 3.0 1.0 1.6 3.3 1.820 16 5.3 1.8 3.3 6.5 25 230.63 0.49 dl – dl – dl –0.76 0.34 dl – dl – 0.58 03.0 1.7 2.0 0.28 1.6 0.74 1.5 03.7 1.5 3.0 – 3.2 0.82 1.9 0.851.7 1.1 1.0 0.38 dl – 1.1 0.600.91 1.0 dl – dl – 0.52 0.68112 58 92 8 86 26 150 14dl – dl – 80 160 dl –dl – dl – 4 7 dl –4.8 3.2 1.8 0.07 3.4 5.2 1.4 0.952.3 1.7 dl – 1.7 1.7 0.77 0.7516 9.3 9.9 0.21 8.0 3.4 7.7 4.70.9 0.70 1.4 1.3 1.9 3.4 0.59 0.277.4 3.2 4.6 1.2 6.0 2.7 5.7 3.51.0 0.47 dl – 0.64 0.29 0.52 0.248.1 4.9 7.5 5.0 4.1 0.99 3.5 0.2122 23 11 2.5 22 13 10 4.3
breviations: Co. = Counties; avg. = average; S.D. = standard deviation;

168 J.C. Hower et al. / International Journal of Coal Geology 69 (2007) 165–178
Research (CAER) following procedures outlined byHower and Bland (1989). Minor and trace elementswere analyzed by inductively-coupled emission-plasmamass spectroscopy (ICP-MS) at the U.S. GeologicalSurvey laboratories in Denver following proceduresoutlined by Bullock et al. (2002). Proximate, ultimate,and sulfur forms analyses of the coal were conducted atthe CAER following ASTM standard procedures.
Petrographic studies were conducted on polishedepoxy-bound particulate pellets using Leitz micro-scopes, with reflected-light, oil-immersion techniqueswith final magnification of 400–625×, at the CAER.
3. Results and discussion
3.1. Geologic setting
The Elswick coal bed, as noted above, is correlativewith the Upper Banner coal bed of Virginia and is alsoknown as the Federal coal bed in Kentucky. Eble (1996,2002) noted that the Upper Banner has a MiddlePennsylvanian/Langsettian (Westphalian A) age. Thecoal bed is part of the Grundy Formation (after Chesnut,1996; informal name not recognized by the U.S.Geological Survey) and is overlain by the marineDave Branch shale and correlative units. In the three
Fig. 2. Generalized megascopic petrology for the Elswick coal bed at the 3 samcollection. Key: Gray — durain and dull clarain; Tick marks on right side o
Elswick coal bed sites that we examined from theHellier and Elkhorn City 7½ min geologic quadrangles(Fig. 1), roof rock is silty shale (site 1); very-finegrained, silty sandstone (site 2); and siltstone (site 3). Onboth geologic quadrangles in our study area, mappersnoted the coal to have a silty shale roof (Alvord, 1971;Alvord and Miller, 1972).
County averages of forms of sulfur (whole coal, drybasis) and major oxides (ash basis) are shown on Table 1and minor and trace elements (whole coal, dry basis) areshown on Table 2 for the correlative Upper Banner coalbed in Virginia (compiled from data in Bragg et al.,1998). With the exception of one sample from LeeCounty with 3.17% S, the Upper Banner coal bed inVirginia is generally a low-to medium-sulfur coal(county averages ranging from 0.52–2.25% S). TheElswick coal bed in Kentucky, discussed below, is arelatively high-sulfur coal, in contrast to the correlativeUpper Banner coal bed (Alvord and Miller, 1972)sampled in Virginia.
3.2. Thickness and structural trends
The Federal mine portal (near Federal, Pike County,Kentucky) is about 3-km northwest of the intersection ofthe southwest–northeast striking Alleghanian Pine
ple sites. Lithotype thickness measured at the mine site during samplef columns indicate breaks between benches.

169J.C. Hower et al. / International Journal of Coal Geology 69 (2007) 165–178
Mountain thrust fault and the right-lateral Russell Forkfault (Fig. 1). The Russell Fork fault has its northwesttermination at the Pine Mountain fault. The PineMountain thrust fault terminates about 8 km to thenortheast of the Russell Fork fault. The regionalnorthwestward dip of the strata takes the Elswick coalbed below river level 0.8-km northwest of Federal.
Alvord and Miller (1972) noted that the Elswick coalbed shows little persistence in thickness across theHellier and Elkhorn City quadrangles (Fig. 1). In ourstudy area, the Elswick coal bed thins to the northwest
Table 3Ash yield, forms of sulfur, and major oxides [% on ash (Table 3) and whole
Whole coal, dry basis Dr
Site Spl. Bench Thickness (cm) Ash S(sulf) S(py) S(org) M
1 3446 1/4 (top) 14.3 4.86 3.2 2.0 1.2 0.73447 2/4 34.0 7.72 1.6 0.71 0.90 0.43448 3/4 36.9 3.60 1.4 0.56 0.86 0.63449 4/4 30.8 8.72 1.3 0.68 0.65 0.9
2 3792 1/8 (top) 24.4 6.29 2.1 0.57 1.5 1.33793 2/8 13.7 6.91 2.5 0.94 1.6 0.63794 3/8 2.7 21.09 1.4 0.34 1.0 0.03795 4/8 21.6 5.56 1.9 0.23 1.7 0.63796 5/8 12.8 5.63 1.6 0.12 1.4 0.53797 6/8 23.8 2.74 1.6 0.15 1.4 1.23798 7/8 8.2 8.90 1.5 0.32 1.2 1.03799 8/8 2.4 7.72 2.4 0.89 1.49 1.2
3 31,012 1/6 (top) 16.0 8.58 1.9 0.90 1.0 0.031,013 2/6 19.0 4.23 1.2 0.16 1.0 0.331,014 3/6 9.5 6.45 3.4 2.1 1.3 0.131,015 4/6 14.0 9.28 7.5 5.3 2.2 0.031,016 5/6 22.5 6.72 3.8 2.4 1.3 0.231,017 6/6 21.0 4.78 2.3 1.1 1.1 0.4
Whole coal, dry basis
Site Spl. Bench Thickness (cm) Ash Mg Na
1 3446 1/4 (top) 14.3 4.86 0.021 0.013447 2/4 34.0 7.72 0.022 0.013448 3/4 36.9 3.60 0.014 0.003449 4/4 30.8 8.72 0.052 0.00
2 3792 1/8 (top) 24.4 6.29 0.050 0.003793 2/8 13.7 6.91 0.027 0.023794 3/8 2.7 21.09 0.011 0.093795 4/8 21.6 5.56 0.020 0.073796 5/8 12.8 5.63 0.017 0.053797 6/8 23.8 2.74 0.020 0.033798 7/8 8.2 8.90 0.054 0.063799 8/8 2.4 7.72 0.054 0.01
3 31,012 1/6 (top) 16.0 8.58 0.005 0.0331,013 2/6 19.0 4.23 0.008 0.0531,014 3/6 9.5 6.45 0.005 0.0331,015 4/6 14.0 9.28 0.000 0.0231,016 5/6 22.5 6.72 0.011 0.0131,017 6/6 21.0 4.78 0.012 0.00
Abbreviations: cm=centimeters; (t)= total; (py)=pyritic; (org)=organic.
from site 1 to site 3, as seen on the lithologic cross-section of the sites (Fig. 2). The thickness variation forthe mine was determined from a limited number ofthickness measurements on the 1 :2400 mine map (in theCAER files) of the entire Federal mine. Coal is thickestin the southeastern portion of the mine, exceeding114 cm in an elongate southeast–northwest trendbetween our sites 1 and 2. Thickness falls to 74 cmabout 400-m east of site 2. Mining was stopped at thatpoint, in part due to the decreased coal thickness, butalso due to safety concerns owing to the proximity of the
coal basis (Table 3)] content for Elswick coal bed in Kentucky
y, ash basis
gO Na2O Fe2O3 TiO2 SiO2 CaO K2O P2O5 Al2O3 SO3
2 0.39 50.6 0.43 21.6 2.1 1.4 0.08 18.9 3.18 0.17 13.9 2.62 54.9 0.86 0.73 0.31 24.7 1.13 0.33 21.2 1.36 42.3 1.6 0.64 0.10 28.4 1.68 0.01 12.3 1.84 53.2 0.40 2.5 0.07 28.4 0.60
0.00 42.5 0.59 32.0 1.6 2.6 0.05 17.2 1.76 0.54 20.5 2.09 44.7 1.7 1.1 0.12 25.1 1.29 0.61 2.7 3.63 73.3 0.41 0.49 0.09 18.2 0.170 1.8 6.4 2.40 49.9 1.9 0.80 0.12 34.7 1.30 1.3 3.9 2.14 53.4 1.7 0.74 0.12 34.3 1.1
1.8 8.5 1.20 43.4 4.2 0.86 0.07 34.5 3.50.93 7.0 1.98 53.3 1.4 2.0 0.05 31.0 0.590.31 18.0 1.47 43.6 1.9 2.1 0.05 29.0 0.73
9 0.55 15.7 2.59 57.3 1.3 0.11 0.22 20.0 0.540 1.7 7.7 1.72 49.2 2.1 0.31 0.14 34.4 1.14 0.76 46.8 1.28 29.1 1.7 0.14 0.06 17.0 1.10 0.35 78.4 0.29 11.1 1.1 0.11 0.03 5.92 0.836 0.38 50.6 1.51 27.8 1.5 0.92 0.07 14.8 0.813 0.13 35.6 1.01 37.6 2.4 1.7 0.07 23.5 1.1
Fe Ti Si Ca K P Al
4 1.72 0.013 0.49 0.073 0.055 0.0017 0.490 0.75 0.121 1.98 0.047 0.047 0.0105 1.019 0.53 0.029 0.71 0.042 0.019 0.0016 0.541 0.75 0.096 2.17 0.025 0.177 0.0027 1.310 1.87 0.022 0.94 0.071 0.137 0.0014 0.578 0.99 0.087 1.44 0.084 0.061 0.0036 0.926 0.40 0.459 7.22 0.062 0.086 0.0083 2.033 0.25 0.080 1.30 0.076 0.037 0.0029 1.024 0.15 0.072 1.41 0.069 0.035 0.0030 1.026 0.16 0.020 0.55 0.081 0.020 0.0008 0.501 0.44 0.106 2.22 0.090 0.144 0.0019 1.468 0.97 0.068 1.57 0.102 0.132 0.0017 1.195 0.94 0.133 2.30 0.081 0.008 0.0082 0.914 0.23 0.044 0.97 0.064 0.011 0.0026 0.776 2.11 0.049 0.88 0.077 0.007 0.0017 0.584 5.09 0.016 0.48 0.076 0.008 0.0012 0.299 2.38 0.061 0.87 0.072 0.051 0.0021 0.535 1.19 0.029 0.84 0.083 0.067 0.0015 0.59

Table 4Minor and trace element (parts per million on ash and whole coal basis) content for Elswick coal bed in Kentucky
Spl. Bench USGSNo.
Ash(dry)
Be Co Cr Cu Li Mn Ni Sc Sr Th V Y Zn B Ba Zr
Dry, ash basis3446 1/4
(top)E-003841 4.86 30 82 120 270 59 420 110 25 1600 17 270 120 380 180 760 55
3447 2/4 E-003842 7.72 9 36 170 250 230 89 64 35 1600 45 210 56 40 95 500 4603448 3/4 E-003843 3.6 17 65 130 580 170 68 130 26 1400 22 170 74 100 120 500 2503449 4/4 E-003844 8.72 110 110 160 270 270 60 230 38 530 31 250 130 210 65 400 2903792 1/8
(top)E-003845 6.29 26 43 110 260 120 330 93 23 1000 20 290 77 230 190 750 100
3793 2/8 E-003846 6.91 13 38 170 260 190 150 91 41 1100 40 250 78 70 120 400 3703794 3/8 21.093795 4/8 E-003847 5.56 22 53 200 450 310 110 97 45 1100 39 340 99 63 210 340 3703796 5/8 E-003848 5.63 14 39 160 580 300 90 79 40 1000 40 220 79 88 130 360 3503797 6/8 E-003849 2.74 87 89 160 840 180 240 160 31 2200 25 230 140 170 250 690 2403798 7/8 E-003850 8.9 99 55 150 280 240 110 73 35 740 36 200 140 91 91 350 2603799 8/8 E-003851 7.72 150 120 190 320 230 140 190 71 1100 33 380 420 230 74 510 23031012 1/6
(top)E-003852 8.58 16 30 150 240 210 140 60 31 1900 42 190 60 42 72 1000 450
31013 2/6 E-003853 4.23 10 53 180 450 310 89 120 37 2800 31 250 77 54 340 1500 33031014 3/6 E-003854 6.45 6 26 140 310 140 96 60 19 1600 22 130 43 68 120 700 21031015 4/6 E-003855 9.28 7 36 140 210 69 59 52 21 1100 24 130 46 96 nd nd nd31016 5/6 E-003856 6.72 <2 10 48 42 10 24 23 <4 480 <8 18 7 47 93 620 23031017 6/6 E-003857 4.78 76 88 150 340 84 85 150 42 1800 21 280 220 180 95 870 180
Whole coal3446 1/4
(top)E-003841 4.86 1.5 4.0 5.8 13.1 2.9 20.4 5.3 1.2 77.8 0.8 13.1 5.8 18.5 8.7 36.9 2.7
3447 2/4 E-003842 7.72 0.7 2.8 13.1 19.3 17.8 6.9 4.9 2.7 123.5 3.5 16.2 4.3 3.1 7.3 38.6 35.53448 3/4 E-003843 3.6 0.6 2.3 4.7 20.9 6.1 2.4 4.7 0.9 50.4 0.8 6.1 2.7 3.6 4.3 18.0 9.03449 4/4 E-003844 8.72 9.6 9.6 14.0 23.5 23.5 5.2 20.1 3.3 46.2 2.7 21.8 11.3 18.3 5.7 34.9 25.33792 1/8
(top)E-003845 6.29 1.6 2.7 6.9 16.4 7.5 20.8 5.8 1.4 62.9 1.3 18.2 4.8 14.5 12.0 47.2 6.3
170J.C
.How
eret
al./International
Journalof
Coal
Geology
69(2007)
165–178

3793 2/8 E-003846 6.91 0.9 2.6 11.7 18.0 13.1 10.4 6.3 2.8 76.0 2.8 17.3 5.4 4.8 8.3 27.6 25.63794 3/8 21.093795 4/8 E-003847 5.56 1.2 2.9 11.1 25.0 17.2 6.1 5.4 2.5 61.2 2.2 18.9 5.5 3.5 11.7 18.9 20.63796 5/8 E-003848 5.63 0.8 2.2 9.0 32.7 16.9 5.1 4.4 2.3 56.3 2.3 12.4 4.4 5.0 7.3 20.3 19.73797 6/8 E-003849 2.74 2.4 2.4 4.4 23.0 4.9 6.6 4.4 0.8 60.3 0.7 6.3 3.8 4.7 6.9 18.9 6.63798 7/8 E-003850 8.9 8.8 4.9 13.4 24.9 21.4 9.8 6.5 3.1 65.9 3.2 17.8 12.5 8.1 8.1 31.2 23.1379 8/8 E-003851 7.72 11.6 9.3 14.7 24.7 17.8 10.8 14.7 5.5 84.9 2.5 29.3 32.4 17.8 5.7 39.4 17.831012 1/6
(top)E-003852 8.58 1.4 2.6 12.9 20.6 18.0 12.0 5.1 2.7 163.0 3.6 16.3 5.1 3.6 6.2 85.8 38.6
31013 2/6 E-003853 4.23 0.4 2.2 7.6 19.0 13.1 3.8 5.1 1.6 118.4 1.3 10.6 3.3 2.3 14.4 63.5 14.031014 3/6 E-003854 6.45 0.4 1.7 9.0 20.0 9.0 6.2 3.9 1.2 103.2 1.4 8.4 2.8 4.4 7.7 45.2 13.531015 4/6 E-003855 9.28 0.6 3.3 13.0 19.5 6.4 5.5 4.8 1.9 102.1 2.2 12.1 4.3 8.9 nd nd nd31016 5/6 E-003856 6.72 <0.02 0.7 3.2 2.8 0.7 1.6 1.5 <.006 32.3 <0.01 1.2 0.5 3.2 6.2 41.7 15.531017 6/6 E-003857 4.78 3.6 4.2 7.2 16.3 4.0 4.1 7.2 2.0 86.0 1.0 13.4 10.5 8.6 4.5 41.6 8.6
spl. bench USGS No. ash (dry) Ag As Au Bi Cd Cs Ga Ge Mo Nb Pb Rb Sb Sn Tl U
Dry, ash basis3446 1/4
(top)E-003841 4.86 <2 220 <10 <2 2 6.7 68 88 58 10 44 77 9.9 <10 4 20
3447 2/4 E-003842 7.72 2 52 <10 <2 <0.8 2 44 6.1 13 63 72 36 4.3 10 4 123448 3/4 E-003843 3.6 <2 440 <10 <2 1 2 41 9.3 18 30 79 30 3 <10 16 6.83449 4/4 E-003844 8.72 2 61 <10 <2 2 12 79 230 6.4 44 83 120 13 10 4.2 9.43792 1/8
(top)E-003845 6.29 <2 190 <10 <2 1 16 60 52 59 10 40 150 12 <10 7.2 27
3793 2/8 E-003846 6.91 2 75 <10 <2 1 5.6 51 8.3 40 55 85 65 5.5 20 6.7 193794 3/8 21.093795 4/8 E-003847 5.56 3 30 <10 2 1 3 76 29 20 69 120 40 3 20 2 153796 5/8 E-003848 5.63 2 20 <10 <2 2 2 32 17 12 54 91 37 <1 10 <0.1 9.53797 6/8 E-003849 2.74 2 49 <10 <2 2 5.9 77 42 29 30 110 50 4 10 4 7.63798 7/8 E-003850 8.9 2 20 <10 <2 0.9 15 75 22 10 48 81 110 <1 10 <0.1 9.53799 8/8 E-003851 7.72 3 40 <10 <2 3 14 180 700 28 55 100 110 13 30 4 1331012 1/6
(top)E-003852 8.58 2 270 <10 <2 <0.8 0.4 58 150 7.2 61 58 4.6 3 20 9.5 10
31013 2/6 E-003853 4.23 2 40 <10 <2 1 1 81 22 16 50 90 15 5.3 20 2 1031014 3/6 E-003854 6.45 <2 97 <10 <2 0.8 0.4 29 5.1 14 30 45 5.7 <1 20 6.7 4.931015 4/6 E-003855 9.28 4 940 <10 <2 1 13 66 13 120 70 110 110 4 42 21 1331016 5/6 E-003856 6.72 <2 380 <10 <2 <0.8 <0.4 9.3 <2 30 <8 10 2 <1 <10 6 <0.8
(continued on next page)
171J.C
.How
eret
al./International
Journalof
Coal
Geology
69(2007)
165–178

Table 4 (continued)
spl. bench USGS No. ash (dry) Ag As Au Bi Cd Cs Ga Ge Mo Nb Pb Rb Sb Sn Tl U
Dry, ash basis31017 6/6 E-003857 4.78 <2 900 <10 <2 2 8.5 89 270 25 30 78 91 34 10 12 15
Whole coal3446 1/4
(top)E-003841 4.86 <0.004 10.7 <0.02 <0.004 0.10 0.33 3.3 4.2768 2.819 0.486 2.138 3.7422 0.020 <0.02 0.19 0.972
3447 2/4 E-003842 7.72 0.003 4.01 <0.01 <0.003 <0.001 0.15 3.4 0.47092 1.004 4.9 5.558 2.7792 0.013 0.772 0.31 0.92643448 3/4 E-003843 3.6 <0.006 15.8 <0.03 <0.006 0.002 0.072 1.48 0.3348 0.648 1.08 2.844 1.08 0.028 <0.03 0.58 0.24483449 4/4 E-003844 8.72 0.002 5.32 <0.01 <0.002 0.2 1.05 6.89 20.056 0.558 3.8 7.238 10.464 1.1 0.87 0.37 0.8197
3792 1/8(top)
E-003845 6.29 <0.003 12 <0.02 <0.003 0.06 1.006 3.77 3.2708 3.711 0.6 2.516 9.435 0.8 <0.02 0.45 1.6983
3793 2/8 E-003846 6.91 0.003 5.18 <0.01 <0.003 0.07 0.39 3.52 0.57353 2.764 3.801 5.874 4.4915 0.008 1.4 0.46 1.33794 3/8 21.093795 4/8 E-003847 5.56 0.005 1.67 <0.02 0.11 0.06 0.17 4.23 1.6124 1.112 3.8 6.672 2.224 0.020 1.1 0.11 0.8343796 5/8 E-003848 5.63 0.004 1.13 <0.02 <0.004 0.1 0.11 1.8 0.9571 0.676 3.04 5.123 2.0831 <0.002 0.563 0 0.53493797 6/8 E-003849 2.74 0.007 1.34 <0.04 0.007 0.06 0.16 2.11 1.1508 0.795 0.822 3.014 1.37 0.1 0.274 0.11 0.20823798 7/8 E-003850 8.9 0.002 1.78 <0.01 <0.002 0.08 1.3 6.68 1.958 0.89 4.3 7.209 9.79 <0.001 0.89 0 0.84553799 8/8 E-003851 7.72 0.004 3.09 <0.01 <0.003 0.2 1.1 13.9 54.04 2.162 4.2 7.72 8.492 1.004 2.3 0.31 1.003631012 1/6
(top)E-003852 8.58 0.002 23.2 <0.01 <0.002 <0.0009 0.03 4.98 12.87 0.618 5.2 4.976 0.0054 0.0012 1.7 0.82 0.858
31013 2/6 E-003853 4.23 0.005 1.69 <0.02 <0.005 0.04 0.04 3.43 0.9306 0.677 2.1 3.807 0.6345 0.013 0.846 0.08 0.42331014 3/6 E-003854 6.45 <.003 6.26 <0.02 <0.003 0.05 0.03 1.87 0.32895 0.903 1.9 2.903 0.0088 <0.002 1.3 0.43 0.316131015 4/6 E-003855 9.28 0.004 87.2 <0.01 <0.002 0.09 1.2 6.12 1.2064 11.14 6.496 10.21 10.208 0.4 3.898 1.9 1.231016 5/6 E-003856 6.72 <0.003 25.5 <0.01 <0.003 <0.001 <0.001 0.62 <.003 2.016 <0.01 0.672 0.003 <0.001 <0.01 0.40 <0.00131017 6/6 E-003857 4.78 <0.003 43 <0.02 <0.004 0.1 0.41 4.25 12.906 1.195 1.4 3.728 4.3498 1.6 0.02 0.57 0.717
Abbreviations: no.=sample number, dl=detection limit, nd=not determined.
172J.C
.How
eret
al./International
Journalof
Coal
Geology
69(2007)
165–178

173J.C. Hower et al. / International Journal of Coal Geology 69 (2007) 165–178
overlying Russell Fork River. Coal thickness betweensites 2 and 3 varies between 90 and 107 cm (see Table 3for bench thicknesses).
3.3. Petrology, geochemistry, and palynology
The three sample sites will be discussed along thesoutheast–northwest transect (Fig. 2). Major oxides inthe ash, along with ash yield (dry basis) and sulfurforms (whole coal, dry basis), are shown on Table 3.Minor and trace elements are shown on Table 4.Maceral content and vitrinite maximum reflectance areshown on Table 5. Palynology at site 1 is shown onTable 6. The coal rank at all three sites is highvolatile A bituminous, with individual lithotypereflectances falling in the medium volatile bituminousrank range.
3.3.1. Site 1: samples 3446–3449The 116-cm thick coal at site 1 (Fig. 2) was divided
into four bench samples, with divisions between thebenches made approximately along lines differentiatinglithologic differences. A prominent durain withinsample 3447 was sampled individually in this section.The lowermost 101 cm is dull, dominated by thick
Table 5Maceral content and vitrinite maximum reflectance for the Elswick coal bed
Thickness
Site Sample Bench (cm) Ash (dry) ST (dr
1 3446 1/4 (top) 14.33 4.86 3.173447 2/4 33.99 7.72 1.603448 3/4 36.88 3.60 1.423449 4/4 30.78 8.72 1.333450 Durain (part of 3447) a 3.96 16.10 0.763452 Durain (correlative) a 6.14 13.21 0.613454 Durain (correlative) a 4.57 15.58 1.43
2 3792 1/8 (top) 24.38 6.29 2.103793 2/8 13.72 6.91 2.513794 3/8 2.74 21.09 1.373795 4/8 21.64 5.56 1.893796 5/8 12.80 5.63 1.563797 6/8 23.77 2.74 1.583798 7/8 8.23 8.90 1.523799 8/8 2.44 7.72 2.38
3 31,012 1/6 (top) 16.00 8.58 1.9131,013 2/6 19.00 4.23 1.1831,014 3/6 9.50 6.45 3.4331,015 4/6 14.00 9.28 7.4531,016 5/6 22.50 6.72 3.7931,017 6/6 21.00 4.78 2.27
Abbreviations: cm = centimeters; S = sulfur; Vit = vitrinite; Fus = fusinite; Sfcutinite; Res = resinite; Rmax = vitrinite maximum reflectance.a Durains are correlatives to sample 3450, but part of different channels.⁎ Reflectance measurement on whole coal, not individual benches.
durain and dull clarain lithologies (Fig. 2), with 57–66%vitrinite and 19–28% fusinite+semifusinite (Table 5).The durain within sample 3447 has a steel-graymegascopic appearance, with a low amount of vitriniteand over 40% fusinite+semifusinite. The coal bed iscapped by a high-sulfur (3.17%), 14.3-cm thick, high-vitrinite bright clarain (sample 3446).
Eble et al. (1994) delineated four general palynology/petrology groupings of Westphalian Central Appala-chian coals, as follows:
(1) Lycospora–vitrinite dominant group—high, gen-erally in excess of 80%, percentages of arboreouslycopsid spores; similar percentages of vitrinite;and low to moderate ash yields (generally <10%).The assemblage formed in water-covered areas,favoring both the lycopod reproductive mechan-isms and the prevention of oxidation of the peatsurface.
(2) Mixed palynoflora–vitrinite dominant group—high vitrinite and low ash, as above, but with amore diverse floral assemblage. The assemblageformed in areas where the mire was watersaturated, with a flora which developed inresponse to ecological stresses such as changes
in Kentucky
y) Vit Fus Sfus Mic Mac Ex Res Rmax
84.4 6.3 2.6 5.0 0.0 1.3 0.5 0.9657.1 13.0 14.6 7.0 0.0 5.0 3.3 1.0060.4 13.8 11.0 7.2 0.1 5.6 2.0 1.0565.9 12.0 6.8 7.3 0.0 6.5 1.5 1.0621.9 13.8 29.5 5.6 0.0 21.4 7.8 1.0516.9 35.9 13.7 5.0 1.3 25.5 1.7 1.1226.3 14.2 34.2 8.6 0.0 11.6 5.1 1.0465.2 7.0 15.0 6.9 0.2 3.6 1.8 0.9964.2 6.1 19.1 5.5 0.2 2.8 2.1 0.9723.8 6.8 49.2 6.2 0.0 11.1 2.9 1.0771.7 6.2 11.1 6.0 0.2 3.6 1.2 1.0041.2 7.6 29.4 8.3 0.9 8.7 3.9 1.0366.3 10.0 11.3 8.6 0.2 2.5 1.1 1.0055.5 9.1 17.4 10.3 0.0 3.6 4.2 0.9888.4 3.1 3.6 3.6 0.1 0.7 0.5 0.9040.2 10.0 21.9 4.3 0.0 23.4 0.2 0.95 ⁎
61.6 11.1 12.9 5.2 0.2 8.6 0.441.6 12.4 25.5 4.8 0.1 15.5 0.067.4 10.3 12.0 4.1 0.1 6.0 0.062.0 11.5 12.8 5.6 0.1 8.0 0.092.3 0.6 2.0 1.3 0.0 3.2 0.6
us = semifusinite; Mic = micrinite; Mac = macrinite; Ex = sporinite and

Table 6Palynomorph content of Elswick coal benches at site 1
Bench 4/4 3/4 2/4 1/4 (top)Sample number 3449 3448 3447 3446Lycospora pellucida 15.2 13.6 1.6 0.863.2L. pusilla 63.2 39.2 3.2 40.8L. granulata 6 6.4 20.8L. orbicula 0.8L. micropapillata 5.6L. rotunda 0.4L. rugosa 3.2Crassispora kosankei 0.8 0.8 0.8Total lycopsid Trees 85.6 60.8 13.6 63.2Densosporites sphaerotriangularis 0.8 23.2 34.4 16.8D. tenui 0.4 1.6 14.4 4.8D. annulatus 2.4D. triangularis 1.6 0.8Cristatisporites indignabundus 0.8 0.8 4Endosporites globiformis 0.8Total small lycopsids 2 27.2 56 22.4Punctatisporites minutus 1.2 2.4 1.6Spinosporites exiguusTotal tree ferns 1.2 0 2.4 1.6Schulzospora rara 1.6Total pteridosperms 0 0 0 1.6Granulatisporites parvus 2 4.8 2.4G. granulatus 0.4 1.6 1.6 4.8G. piroformis 4 0.8G. adnatoides 0.8 1.6G. verrucosus 0.4Lophotriletes microsaetosus 1.2 0.8 3.2L. gibbosus 0.4Acanthotriletes triquetrus 3.2Deltoidaspora subadnatoides 1.2 1.6Microreticulatisporites concavus 0.8Savitrisporites nux 1.2Camptotriletes bucculentus 0.4Raistrickia macra 0.8Verrucosisporites donarii 0.4Total small ferns 8.4 11.2 16 4.8Calamospora breviradiata 5.6Laevigatosporites minor 1.2 2.4 1.6Reticulatisporites muricatusTotal calamites 1.2 0 8 1.6Florinites florini 1.2 1.6Total cordaites 1.2 0 0 1.6Triquitrites tribullatus 0.4Stenozonotriletes lycosporoides 2.4 0.8Ahrensisporites guerickei 1.6Tantillus triquetrus 0.8Planisporites granifer 1.6Spelaeotriletes arenaceous 0.8Total unknown affinity 0.4 0.8 4 3.2Total counts 200 200 200 200
174 J.C. Hower et al. / International Journal of Coal Geology 69 (2007) 165–178
in nutrient availability, changes in acidity, or otherfactors.
(3) Mixed palynoflora—moderate/low vitrinite group—palynologically similar to group 2 but with alower percentage of vitrinite concomitant with
higher liptinite and inertinite contents. As above,the group has a low to moderate ash yield. Thehigher inertinite levels and the relative lack ofLycospora suggest that the mire was subject toperiodic drying.
(4) Mixed palynoflora—high ash yield group—diverse palynomorph assemblage and a variable,generally low vitrinite content together with ahigher mineral content than the above groups. Thelatter suggests that the mire was subject toperiodic inundation by sediment-rich waters.
Despite the petrographic similarities among the lowerthree benches, the palynology (Table 6) tells a muchdifferent story. The durain-dominated sample 3447 has astrikingly low percentage of Lycopsid tree spores, withsmall Lycopsid and small fern spores present at higherconcentrations than other benches, and falls in group 3of Eble et al. (1994), the “mixed palynoflora—moderate/low vitrinite” group. Sample 3448 also fitsin group 3, although the palynoflora is not nearly asdepleted in Lycopsid tree spores. The basal bench,sample 3449, does not clearly fit in any of the Eble et al.(1994) groups. The vitrinite content, while higher thanthe two immediately overlying benches, is only 65%(Table 5). This bench is dominated by Lycosporapellucida and L. pusilla. Why does this bench fail to fitinto one of the established groups by Eble et al. (1994)?The bench is clearly thicker than would be desired in asampling scheme designed to optimize paleoecologicdifferences between lithotypes. Perhaps, in a benchdominated by a mix of bright to dull clarain lithotypes,the internal variation between spore-rich lithologies andspore-poor lithologies may be significant, reflectingsubstantial ecologic changes at a scale too fine topractically sample. The uppermost bench, sample 3446,clearly fits in group 2 by Eble et al. (1994), the “mixedpalynoflora — vitrinite dominant group,” reflecting astressed environment, but without the degradationevident in the underlying durain.
Geochemical parameters for site 1 are listed in Tables2 and 3. At site 1, TiO2 is highest in sample 3447 (Fig.2). The durain portion of bench 3447, sample 3450, wasnot analyzed geochemically as an independent samplebecause insufficient sample remained after otheranalyses. However, previous investigations of thegeochemistry of eastern Kentucky coals (Hower andBland, 1989; Hower and Pollock, 1989; Hower et al.,1991; Hatton et al., 1992; Hower et al., 1994c,d, 1996)have shown that TiO2, often in association with elevatedZr concentrations, tends to be highest in durains and inbasal lithotypes. Zr is slightly elevated above the level of
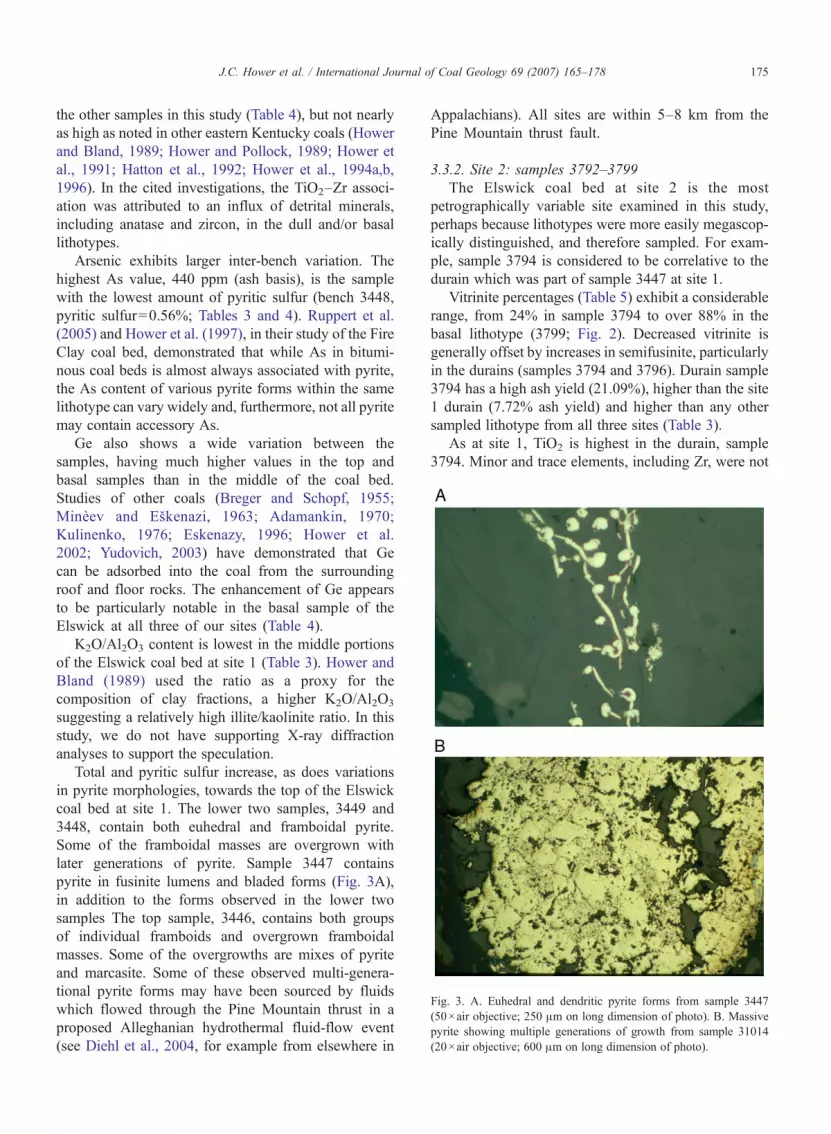
Fig. 3. A. Euhedral and dendritic pyrite forms from sample 3447(50×air objective; 250 μm on long dimension of photo). B. Massivepyrite showing multiple generations of growth from sample 31014(20×air objective; 600 μm on long dimension of photo).
175J.C. Hower et al. / International Journal of Coal Geology 69 (2007) 165–178
the other samples in this study (Table 4), but not nearlyas high as noted in other eastern Kentucky coals (Howerand Bland, 1989; Hower and Pollock, 1989; Hower etal., 1991; Hatton et al., 1992; Hower et al., 1994a,b,1996). In the cited investigations, the TiO2–Zr associ-ation was attributed to an influx of detrital minerals,including anatase and zircon, in the dull and/or basallithotypes.
Arsenic exhibits larger inter-bench variation. Thehighest As value, 440 ppm (ash basis), is the samplewith the lowest amount of pyritic sulfur (bench 3448,pyritic sulfur=0.56%; Tables 3 and 4). Ruppert et al.(2005) and Hower et al. (1997), in their study of the FireClay coal bed, demonstrated that while As in bitumi-nous coal beds is almost always associated with pyrite,the As content of various pyrite forms within the samelithotype can vary widely and, furthermore, not all pyritemay contain accessory As.
Ge also shows a wide variation between thesamples, having much higher values in the top andbasal samples than in the middle of the coal bed.Studies of other coals (Breger and Schopf, 1955;Minèev and Eškenazi, 1963; Adamankin, 1970;Kulinenko, 1976; Eskenazy, 1996; Hower et al.2002; Yudovich, 2003) have demonstrated that Gecan be adsorbed into the coal from the surroundingroof and floor rocks. The enhancement of Ge appearsto be particularly notable in the basal sample of theElswick at all three of our sites (Table 4).
K2O/Al2O3 content is lowest in the middle portionsof the Elswick coal bed at site 1 (Table 3). Hower andBland (1989) used the ratio as a proxy for thecomposition of clay fractions, a higher K2O/Al2O3
suggesting a relatively high illite/kaolinite ratio. In thisstudy, we do not have supporting X-ray diffractionanalyses to support the speculation.
Total and pyritic sulfur increase, as does variationsin pyrite morphologies, towards the top of the Elswickcoal bed at site 1. The lower two samples, 3449 and3448, contain both euhedral and framboidal pyrite.Some of the framboidal masses are overgrown withlater generations of pyrite. Sample 3447 containspyrite in fusinite lumens and bladed forms (Fig. 3A),in addition to the forms observed in the lower twosamples The top sample, 3446, contains both groupsof individual framboids and overgrown framboidalmasses. Some of the overgrowths are mixes of pyriteand marcasite. Some of these observed multi-genera-tional pyrite forms may have been sourced by fluidswhich flowed through the Pine Mountain thrust in aproposed Alleghanian hydrothermal fluid-flow event(see Diehl et al., 2004, for example from elsewhere in
Appalachians). All sites are within 5–8 km from thePine Mountain thrust fault.
3.3.2. Site 2: samples 3792–3799The Elswick coal bed at site 2 is the most
petrographically variable site examined in this study,perhaps because lithotypes were more easily megascop-ically distinguished, and therefore sampled. For exam-ple, sample 3794 is considered to be correlative to thedurain which was part of sample 3447 at site 1.
Vitrinite percentages (Table 5) exhibit a considerablerange, from 24% in sample 3794 to over 88% in thebasal lithotype (3799; Fig. 2). Decreased vitrinite isgenerally offset by increases in semifusinite, particularlyin the durains (samples 3794 and 3796). Durain sample3794 has a high ash yield (21.09%), higher than the site1 durain (7.72% ash yield) and higher than any othersampled lithotype from all three sites (Table 3).
As at site 1, TiO2 is highest in the durain, sample3794. Minor and trace elements, including Zr, were not
176 J.C. Hower et al. / International Journal of Coal Geology 69 (2007) 165–178
analyzed by the ICP-MS due to insufficient sample. Zr,via X-ray fluorescence analyzed at the CAER, has aconcentration of 1440 ppm (ash basis) in sample 3794compared to concentrations in the low 102-ppm rangefor the other lithotypes. The high TiO2–Zr correlationwith dull lithotypes, particularly durains, occurs in allthree sample sites.
K2O/Al2O3 shows a similar trend as at site 1,decreasing in the middle lithotypes (Table 3). Rubidium(Table 4), which can substitute for K in the illitestructure, increases along with the K2O/Al2O3 ratio.
Ge is enriched at 700 ppm (ash basis) in the basallithotype (a 2.4-cm bright clarain; sample 3799) at site 2(Table 4). This is the highest concentration of anylithotype in this study, but considerably lower thanvalues found elsewhere, such as in the basal anduppermost benches of the Amos coal bed in WesternKentucky (Hower et al., 2002).
The highest sulfur contents (Table 3) at site 2 are inthe thin, high-vitrinite basal lithotype (sample 3799) andat the top of the coal bed (samples 3792 and 3793). Nolithotype is exceptionally high in pyritic sulfur, at leastcompared to the levels seen at the other two samplesites. Overall, dominant pyrite morphologies areframboidal and euhedral forms, some overgrown bylater generations of sulfides.
3.3.3. Site 3: samples 31012–31017Lithotype boundaries at site 3 proved to be more
gradational than at site 2, frustrating efforts to reproducethe relatively pure lithotype samples obtained at site 2.However, certain aspects of site 3 are quite distinct fromthe previous sites.
The basal lithotype has the highest vitrinite content,exceeding 90% (Table 5). The durain sampled at the firsttwo sites probably corresponds to the durain in sample31012 (Fig. 2), with 40% vitrinite, 22% semifusinite,and 23% liptinite content (Table 5). As noted, theboundaries between the durain and surrounding lithol-ogies are gradational.
TiO2, and to a lesser extent Zr, increase towards thetop of the coal bed, the position of the upper durain(sample 31012) (Tables 3 and 4). Contrary to the trendobserved at the previous sites, K2O/Al2O3 and Rbdecrease upwards. Similar to site 1, Ge concentrationspeak in the basal and top lithotypes.
The most obvious distinction between site 3 and theother sites, particularly site 2, is the high levels of pyriticsulfur (Table 3) in the middle portion of the coal bed(samples 31014–31016). The 5.25% pyritic sulfur ofsample 31015 is the highest level of any of the Elswicksamples and is among the highest for an economic coal
in eastern Kentucky. The high pyrite samples all havemassive multi-generational overgrowths of framboidaland euhedral morphologies, along with fracture-andcleat-fill and fusain lumen-fill Fe-sulfides in the higherpyrite samples. An example of a massive form, withsome evidence of multiple generations of growth, isshown on Fig. 3B.
Arsenic is high in the high-pyritic sulfur lithotypes(Table 4). A good correlation between pyritic sulfur andAs concentration is lacking, perhaps because As contentis relatively low, 97 ppm (ash basis) in the 2.13% Spysample 31014 versus 900 ppm (ash basis) in the1.11% Spy basal lithotype. We know from other coalsthat As can have a heterogenous distribution in the Fesulfides (Ruppert et al., 2005). Similarly, while Pb ishighest in the 5.25% Spy sample 31015, it reachessimilar levels in samples with much lower amounts ofpyritic sulfur (Tables 3 and 4). Indeed, studies of othercoals, including the Manchester coal from EasternKentucky, have demonstrated that not all of the Pb isassociated with sulfides: some of it can occur inclaustahalite, a Pb selenide (Hower and Robertson,2003).
3.4. Lateral variation
Despite some overall similarities between the threeElswick coal bed sample sites, such as the persistentdurain in the upper third of the coal bed, petrographicand geochemical differences between the sites illustratethe lateral variation of the Elswick coal bed. The bright,high-sulfur lithology at the top of site 1 (sample 3446)appears to be missing at sites 2 and 3. Similarly, thebright, high-vitrinite, high-sulfur lithology at the base ofsites 2 and 3 (samples 3799 and 31017; Table 3) ismissing at site 1. Such a gain and loss of lithotypes iscommon in Central Appalachian coals (Greb et al.,2002; Staub, 2002). Megascopically, site 1 wasdominated by dull lithologies and the thickness of dulllithotypes diminished to the northwest.
The basal portions at site 3 are much higher in totaland pyritic sulfur (Table 3) than at the other sites.Arsenic (Table 4), in particular, also is high in theselithotypes. Other chalcophile elements, however, do notappear to be particularly enriched in the higher sulfurlithotypes at any of the three study sites. Overall, thevariation in sulfide morphologies and the variation inminor element chemistry may be related to the influx ofthermal fluids in the Alleghanian orogeny. This has beendocumented elsewhere in the Appalachians (Goldhaberet al., 2003; Diehl et al., 2004), but evidence has beenmore elusive in eastern Kentucky.

177J.C. Hower et al. / International Journal of Coal Geology 69 (2007) 165–178
4. Summary
The Middle Pennsylvanian/Langsettian Elswick coalbed, correlative to the Upper Banner of Virginia,provides a rare case of a mined high-sulfur coal inEastern Kentucky, a region known for low-sulfur coals.The coal was mined in southwestern Pike County,Kentucky, at various times throughout the 20th century.
The Elswick coal bed shows significant vertical andlateral variation in petrology and geochemistry. The coalis marked by high-vitrinite lithologies at the base of twoof three study sites. The basal and top lithotypesgenerally are high in Ge, a trend noted in other coals,possibly related to post-depositional influences fromroof and floor rocks. An inertinite-rich, TiO2–Zr durainpersists through all of the sites.
At site 1, the lower 101 cm of the 116-cm thick coalis dull, dominated by durain and dull clarain litholo-gies. The palynology of the benches of the dull intervalshows greater diversity than might be expected justfrom the petrology. All benches fit within the “mixedpalynoflora — moderate/low vitrinite group,” by Ebleet al. (1994) suggesting a stressed environment ofdeposition. The Lycopsid components, however, ex-hibit considerable variation between benches of thesequence. The top bench, although high vitrinite, alsoreflects a stressed environment based on the compo-nents and diversity of the palynomorph assemblage. Asan important caveat to the palynologic analysis, it wasnoted that sampling intervals, particularly in zones ofmixed bright (vitrinite-rich) and dull (sporinite-rich)lithologies, may be too thick to properly reflect theecologic diversity.
The total sulfur content varies between the sites but ishigh at all sites compared tomany easternKentucky coals.Site 3 is marked by a strikingly high sulfur zone in themiddle of the coal bed, a feature missing at the other twosites. Pyrite and marcasite show signs of overgrowths,indicating multiple generations of sulfide emplacement,possibly related to migrating hydrothermal fluids gener-ated during the Paleozoic Allegheny Orogeny (Goldhaberet al., 2003; Diehl et al., 2004). The high-sulfur site 3lithologies all have massive overgrowths of euhedral andframboidal pyrite, fracture-and cleat-fill pyrite, and sulfideemplacement in fusain lumens.
In summary, the Elswick coal bed in southeasternPike County, Kentucky, shows significant lateralvariation in properties at the mine scale. Somevariation is due to the gain or loss of upper andlower lithologies, either through an actual physicalmerging or through the change in character oflithotypes. Geochemical variation is most evident in
the marked increase in pyrite in the middle of the coalbed at site 3. Sulfur is high throughout the mine area,but certain lithotypes, such as sampled at site 3, appearto have experienced more intensive secondary enrich-ment of pyrite than other locations.
References
Adamankin, L.A., 1970. Relationship between ash and germaniumcontent of coal and its genetic significance. Doklady AkademiiNauk SSSR 192, 1353–1355.
Alvord, D.C., 1971. Geologic map of the Hellier quadrangle,Kentucky–Virginia, and part of the Clintwood quadrangle, PikeCounty, Kentucky. U.S. Geological Survey Geologic QuadrangleMap GQ-950, 1:24,000.
Alvord, D.C., Miller, R.C., 1972. Geologic map of the Elkhorn Cityquadrangle, Kentucky–Virginia, and part of the Harman quadran-gle, Pike County, Kentucky. U.S. Geological Survey GeologicQuadrangle Map GQ-951, 1:24,000.
Bragg, L.J., Oman, J.K., Tewalt, S.J., Oman, C.L., Rega, N.H.,Washington, P.M., Finkelman, R.B., 1998. U.S. Geological SurveyCoal Quality (COALQUAL) Database: Version 2.0. U.S. Geolog-ical Survey Open-file Report 97-134, cd-rom.
Bullock Jr., J.H., Cathcart, J.D, Betterton, W.J., 2002, Analyticalmethods utilized by the United States Geological Survey for theanalysis of coal and coal combustion by-products. U.S. GeologicalSurvey Open File Report 2003-389, 15 p.
Breger, I.A., Schopf, J.M., 1955. Germanium and uranium in coalifiedwood from upper Devonian black shale. Geochimica et Cosmo-chimica Acta 7, 287–293.
Chesnut, D.R., 1996. Geologic framework for the coal-bearing rocksof the Central Appalachian Basin. International Journal of CoalGeology 31, 55–66.
Diehl, S.F., Goldhaber, M.B., Hatch, J.R., 2004. Modes of occurrenceof mercury and other trace elements in coals from the warrior field,BlackWarrior Basin, Northwestern Alabama. International Journalof Coal Geology 59, 193–208.
Eble, C.F., Hower, J.C., Andrews Jr., W.M., 1994. Paleoecology ofthe Fire Clay coal bed in a portion of the Eastern Kentucky coalfield. Palaeogeography, Palaeoclimatology, Palaeoecology 106,287–305.
Eble, C.F., 1996. Lower and lower Middle Pennsylvanian coalpalynofloras, southwestern Virginia. International Journal of CoalGeology 31, 67–113.
Eble, C.F., 2002. Palynology of late Middle Pennsylvanian coal bedsin the Appalachian Basin. International Journal of Coal Geology50, 73–88.
Eskenazy, G., 1996. Factors controlling the accumulation of traceelements in coal. Annulaire de L’Universite de Sofia “St. KlimentOhridski” Faculte de Geologie et Geographie: Livre 1 - Geologie,vol. 89, pp. 219–236.
Goldhaber, M.B., Lee, R.C., Hatch, J.R., Pashin, J.C., Treworgy, J.,2003. Role of large scale fluid-flow in subsurface arsenicenrichment, in Arsenic in ground water. In: Welch, A.H.,Stollenwerk, K.G. (Eds.), Kluwer Academic Publishers, Boston,MA, pp. 127–164.
Greb, S.F., Eble, C.F., Hower, J.C., Andrews, W.M., 2002. Multiple-bench architecture and interpretations of original mire phases:examples from the Middle Pennsylvanian of the CentralAppalachian Basin, USA. International Journal of Coal Geology49, 147–175.

178 J.C. Hower et al. / International Journal of Coal Geology 69 (2007) 165–178
Hatton, A.R., Hower, J.C., Helfrich, C.T., Pollock, J.D., Wild, G.D.,1992. Lithologic succession in the Path Fork coal bed (BreathittFormation, Middle Pennsylvanian), southeastern Kentucky. Or-ganic Geochemistry 18, 301–311.
Hower, J.C., Bland, A.E., 1989. Geochemistry of the Pond Creek CoalBed, Eastern Kentucky coal field. International Journal of CoalGeology 11, 205–226.
Hower, J.C., Pollock, J.D., 1989. Petrology of the River Gem CoalBed, Whitley County, Kentucky. International Journal of CoalGeology 11, 227–245.
Hower, J.C., Robertson, J.D., 2003. Clausthalite in coal. InternationalJournal of Coal Geology 53, 219–225.
Hower, J.C., Esterle, J.S., Wild, G.D., Pollock, J.D., 1990.Perspectives on coal lithotype analysis. Journal of Coal Quality9, 48–52.
Hower, J.C., Rimmer, S.M., Bland, A.E., 1991. Geochemistry of theBlue Gem coal bed, Knox County, Kentucky. International Journalof Coal Geology 18, 211–231.
Hower, J.C., Andrews Jr., W.M., Wild, G.D., Dulong, C.F., Salter, F.T.,1994a. Coal quality trends for the Fire Clay coal bed, southeasternKentucky. Journal of Coal Quality 13, 13–26.
Hower, J.C., Hiett, J.K., Wild, G.D., Eble, C.F., 1994b. Coal resources,production, and quality in the Eastern Kentucky coalfield:perspectives on the future of steam coal production. NonrenewableResources 3, 216–236.
Hower, J.C., Graham, U.M., Eble, C.F., 1994c. High-sulfur coals in theEastern Kentucky coal field. In: Schultz, A.P., Rader, E.K. (Eds.),Studies in Eastern Energy and the Environment: Virginia Divisionof Mineral Resources, Publication, vol. 132, pp. 1–6.
Hower, J.C, Eble, C.F., Rathbone, R.F., 1994d. Petrology andpalynology of the No. 5 Block coal bed, northeastern Kentucky.International Journal of Coal Geology 25, 171–193.
Hower, J.C., Robertson, J.D., Wong, A.S., Eble, C.F., Ruppert, L.F.,1997. Arsenic and lead concentrations in the Pond Creek and FireClay coal beds, Eastern Kentucky. Applied Geochemistry 12,281–289.
Hower, J.C., Ruppert, L.F., Eble, C.F., Graham, U.M., 1996.Geochemical and palynologic indicators of the paleoecology ofthe River Gem coal bed, Whitley County, Kentucky. InternationalJournal of Coal Geology 31, 135–149.
Hower, J.C., Ruppert, L.F., Williams, D.A., 2002. Geochemistry of theAmos coal bed: low-sulfur coal from the Western Kentuckycoalfield. International Journal of Coal Geology 53, 27–42.
Kulinenko, O.R., 1976. Relationship between germanium content andseam thickness in Paleozoic coal basins of Ukraine. InternationalGeology Review 19, 1187–1182.
Minèev, D., Eškenazi, G., 1963. Germanium in den Gagatkohlen desBezirks Pleven. Comptes Rendus de l'Académie Bulgare desSciences 16 (5), 537–540.
Ruppert, L.F., Hower, J.C., Eble, C.F., 2005. Arsenic-bearing pyriteand marcasite in the Fire Clay coal bed, Middle PennsylvanianBreathitt Formation, eastern Kentucky. International Journal ofCoal Geology 63, 27–35.
Staub, J.R., 2002. Marine flooding events and coal bed sequencearchitecture in southern West Virginia. International Journal ofCoal Geology 49, 123–145.
Yudovich, Y., 2003. Notes on the marginal enrichment of Germaniumin coal beds. International Journal of Coal Geology 56, 223–232.


