Embed Size (px)
Citation preview
Animal Learning & Behavior1995.23 (2).164-176
Learned variability
PATRICIA D. STOKESColumbia University, New York, New York
Potential contributors to sustained levels of variability in the topography of the rat's barpress wereinvestigated in two experiments. Behavior was classified into discretely defined components, andchanges in components and their sequential organization were analyzed. Experiment 1 showed thattopographic variability in the rat is modulated by shifts in reinforcement schedules. Variability decreased between either dipper training or extinction and continuous reinforcement (CRF), and increased between CRF and extinction. Once the press was acquired, variability did not change if theschedule (CRF) did not change. Experiment 2 showed that, regardless of subsequent changes intopographic requirements, rats initially shaped to press under more stringent criteria sustainedhigher levels of variability during CRF, but not during extinction, than rats shaped with less stringentcriteria. The results suggest that subjects learn not only what to do during reinforcement but alsohow differently or variably to do it.
Some individuals are consistently more variable intheir behavior than others. One guinea pig either brushesor taps a latch prior to opening it; another always opensit in the same way (Muenzinger, Koerner, & Irey, 1929).One child uses three different strategies to do simple addition; another employs six strategies to solve the sameproblems (Seigler, 1994; Seigler & Jenkins, 1989). Theartists Matisse and Motherwell produced images usingpaint or pen or colored cut papers. Less creative individuals rarely, if ever, change or combine mediums. Why?Could these kinds ofpersistent variability differences reflect learning?
We know a great deal about how changes in variabilityfollow changes in reinforcement schedules or responserequirements, but little about consistency. Variabilitytends to decline during continuous reinforcement (CRF)(Antonitis, 1951; Guthrie & Horton, 1946; Lachter &Corey, 1982; Notterman, 1959; Schwartz, 1982a, 1982b;Vogel & Annau, 1973) and to increase relative to CRFduring either extinction or intermittent schedules (Eckerman & Lanson, 1969; Tatham, Wanchisen, & Hineline,1993; but see Herrnstein, 1961). Variability increases
This paper is based on a doctoral dissertation submitted to the Graduate School of Arts and Sciences of Columbia University in partial fulfillment of the requirements for the PhD. It was presented at the meeting of the Eastern Psychological Association in Boston, 1992. Theauthor wishes to thank Peter Balsam, her advisor, for making this workpossible; James Deich, Robin Garfinkel, Salvatore Pitruzzello, andJoseph Schwartz for their statistical assistance; Christina Kozma, AmyLazev,Anat Reschke, Octavia Wong, and Jordanna Zanger for runningand coding the experiments. Also greatly appreciated are AllenNeuringer's detailed comments on an earlier version of this manuscript. Address correspondence to the author at Department ofPsychology, Barnard College, Columbia University, New York, NY10027.
-Accepted by previous editor, Vincent M. LoLordo
when a response criterion specifies doing somethingnew (Holman, Goetz, & Baer, 1977; Pyror, Haag, &O'Reilley, 1969) or doing something differently (Blough,1966; Bryant & Church, 1974; Christenson, Guilford, &Wilson, 1957; Joyce & Chase, 1990; Maltzman, 1960;Morris, 1987; Neuringer, 1986,1991, 1993; Royce, 1898;Schoenfeld, Harris, & Farmer, 1966; Wong, 1977). Thegreater the difference from prior responding required,the higher the variability (Machado, 1989, 1992; Page &Neuringer, 1985).
A promising area in which to begin investigating whysome individuals are consistently more variable thanothers is reinforcement history, specifically, the initialconditions under which learning takes place. Responserate (Alleman & Zeiler, 1974; Bickel, Higgins, Kirby, &Johnson, 1988; Weiner, 1964, 1969), persistence (Eisenberger, 1992; Seligman & Maier, 1967) and topography(Midgley, Lea, & Kirby, 1989; Muenzinger et al., 1929;Stokes & Balsam, 1991) are all influenced by initial conditions. For example, Stokes and Balsam showed that preselected approximations reinforced early in shaping remain in rats' repertoires even when they are no longerrequired by the reinforcement contingency. Eisenberger(1992) has demonstrated that, compared with trainingon easy problems, training on difficult problems resultsin persistence on impossible ones.
Given that initial conditions influence what we do aswell as how long we continue to do it, the main questionasked by the present set of experiments was: Can initialconditions determine how differently we continue to dosomething?
To evaluate the viability of using a previously developed multicomponent observational methodology (Stokes& Balsam, 1991) in assessing variability in responseform, the effects ofschedule changes on variation in discretely defined response components and sequences ofcomponents were examined in Experiment 1. Because
Copyright 1995 Psychonomic Society, Inc. 164
most prior work had measured variability along similaror identical response dimensions (e.g., force), Experiment 1 extended the study of response variability totopographically as well as functionally dissimilar behaviors. The question of consistent degree or level ofvariability was explicitly examined in Experiment 2,which asked if initial conditions continued to affect variability when conditions changed.
EXPERIMENT 1Effects of Reinforcement Schedules
Todetermine how well a component organization analysis captured changes in operant variability predicted onthe basis of earlier studies, Experiment 1 incorporated thesequence of schedule changes used by Antonitis (1951)-CRF, extinction, CRF-with the addition of a secondextinction session following reacquisition ofthe operantresponse. On the basis of Antonitis's results, variabilitywas predicted to decline when the CRF requirement wasimposed or reinstated, to further decline during continued CRF, and to increase in extinction.
MethodSubjects
The subjects were 4 experimentally naive male Sprague-Dawleyalbino rats, approximately 12 weeks old at the start of the experiment. They were housed individually with food continuouslyavailable in their home cages. After baseline observation, each had6 h of free access to water, followed by 48 h of water deprivationprior to experimental sessions.
ApparatusThe apparatus consisted of one Lehigh Valley Electronics con
ditioning chamber (23 em long, 20.3 em wide, and 19.5 em high),with clear Plexiglas sides (0.6 em) and tops (0.3 cm wide) andaluminum front and rear walls. The grid floor was made of stainless steel rods, 0.4 ern in diameter, spaced 1.1 em center to center,and located 4 em above the base. The chamber contained a recess(7.5 x 5.5 x I ern) in which a dipper presented 0.016 ml ofwater.The recess was centered on the intelligence panel 1.5 cm above thebase. A metal lever (2.5 x 1.8 x 0.7 em) with rounded sides wasmounted 2.5 em above the base and 2.8 em to the right of the dipper recess. The lever protruded from a hole (1.5 x 3.2 ern). Aminimum force of 0.05 N was needed to close the microswitch.Centered 2.5 em above the bar was an unlit light (1.8 em diam),which protruded 1.25 cm into the chamber. Equipment was housedin a room, approximately 1.5 x 3 m, illuminated by two 100-Wbulbs directed away from the experimental chamber. A MinoltaChroma-Meter CL-IOO held I in. from the end of the bar at barheight produced a surface illumination of 14.8 Ix. A videocamerarecorded each subject's behavior. The camera was positioned atapproximately bar height, perpendicular to the Plexiglas wall andat the same height as the bar. The camera was approximately I mfrom the wall; the size ofthe field was adjusted so that the interiorof the chamber filled the picture frame. A microcomputer controlled reinforcer delivery and recorded leverpresses.
ProcedureBaseline. Nondeprived subjects were placed in the experimen
tal chamber for 30 min without reinforcer delivery.Deprived. The subjects were 48 h water-deprived prior to being
placed in the chamber for 30 min, again without reinforcer delivery.
VARIABILITY 165
Dippertraining. A variable-time 3D-sec (VT-30) schedule wasused to dipper-train all subjects. This session lasted until 100 reinforcers had been delivered. By the end of training, all subjectsreliably and promptly drank from the dipper.
ShapinglCRF. One week after dipper training, each rat washand-shaped to press the bar by a different experimenter. All experimenters had had experience in shaping rats. Shaping sessionslasted until at least 100 reinforcers had been earned for pressing.
Extinction. One week after shaping, deprived subjects wereplaced in the experimental chambers for 30 min, during whichpresses were not followed by reinforcer delivery.
Reacquisition/CRF. Beginning 2 days after extinction, five additional 3D-minsessions were conducted in which all presses werereinforced (CRF).
Second extinction. Forty-eight hours after the final CRF session, the rats were placed in the chamber for a 3D-min session during which presses were not followed by reinforcer delivery.
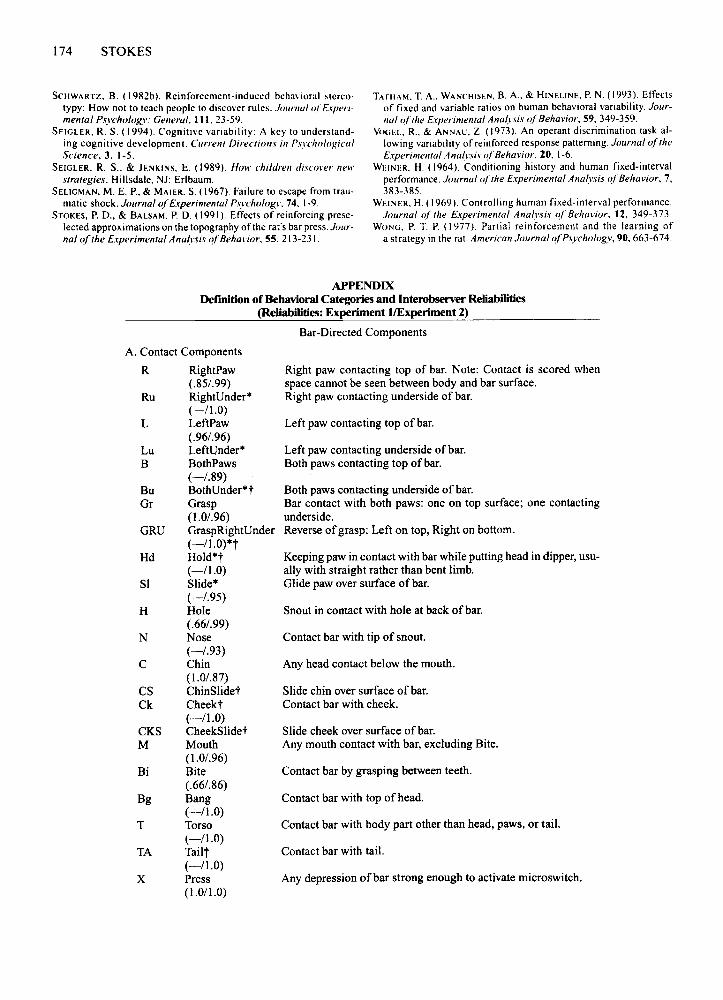
Observations. All sessions were videotaped. Each subject's behavior was sequentially coded by one of 4 independent observersinto 47 discrete topographically defined categories as described inthe appendix. Twenty percent of analyzed press sequences were selected randomly for code checking by a second observer. One observer was the experimenter. The others were Barnard undergraduates unfamiliar with the predictions being tested. Observeragreement (calculated by dividing total agreements by total agreements plus total disagreements) averaged .87. Reliabilities for individual categories are shown in the appendix.
MeasurementsResponse sequences for each subject were analyzed according
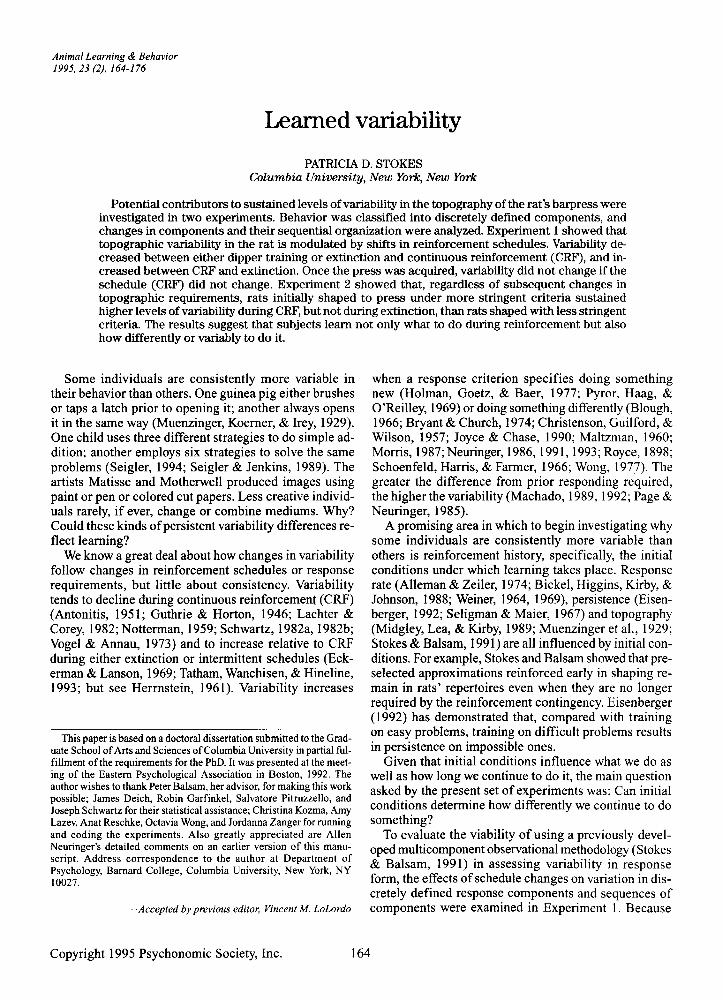
to transition probabilities from each component to each othercomponent. These probabilities represent the forward flow of behavior: the probability of a response (Rn) conditional on the response preceding it (Rn- , ) . Figure 1 shows a simplified exampleof this kind of analysis. The top panel shows forward transitionprobabilities (multiplied by 100 to give percentages) during10 consecutive sequences of a hypothetical rat. In every sequence,the same four components appear in the same order. The probability of each component is .25; the probability of each transition,1.0.
The bottom figure shows forward transition probabilities for another subject who also emits the same components in each sequence, but not in the same order. Each component is followed notby one other component, but by all other components. The probability of each component is still .25, but now transition or sequential probabilities are less than 1.0.
To characterize variability, uncertainty measures, derived frominformation statistics (Attneave, 1959; Brown, 1975; Garner,1962; Miller & Frick, 1949), were used. With component uncertainties, we are asking: how likely is it that our subject is engagingin a particular component regardless of the order in which thecomponents occur? If all components are equally likely, uncertainty is maximal. Since our hypothetical subjects did four thingsequally often, component uncertainties were maximal (2) for both.Departures from equal probabilities among possible outcomes reduce uncertainty. If any component becomes more likely than others, uncertainty is lower. For example, if in each of 10 sequencesI subject put its head under the bar twice instead of once, "Under"would be more likely than "Dipper," "Over," or "Left," and component uncertainty would drop from 2 to 1.92.
With sequential uncertainties, we are asking: if the rat is engaging in component X, how likely is it to then engage in componentY? Maximal sequential uncertainty for four components is 6; thisis based on 16 pairs occurring equally often. If some pairs occurmore often than others, uncertainty declines. For our first subject,sequential uncertainty was 0: knowing what it had just done, wewere never uncertain about what it would do next. Sequential un-
166 STOKES
Figure I. The top and bottom panels show conditional probabilities for 20 reinforced sequences of two hypothetical rats with identical component uncertainties, but different sequential uncertainties.Arrowheads point in the direction of the transition between components. Numbers on arrow shafts represent conditional probabilitiesofeach behavior (R n) foUowing each other behavior (Rn-I) times 100.
certainty for the second subject was higher (1.8954): we werenever completely certain what its next response would be. Noticethat equal component uncertainties do not imply equal sequentialuncertainties.
The formula
n
VCR) =- I,P(Rn)log2 P(Rn )
n=1
-where VCR) is the uncertainty in the set of current responses,P(Rn ) , the probability that a given response occurred, N, the totalnumber of components, and n, the individual components that gointo N-was used to calculate component uncertainty.The formula
V(RIR-I) = V(R,R-I) - V(R-I)
-where V(RIR - I) is the uncertainty in the set of current responses (R), given the uncertainty in the set of immediately priorresponses (R-I), and V(R,R-I) is the uncertainty in the joint distribution of current and immediately preceding responses-wasused to calculate sequential uncertainty.
The above formulas give us absolute or actual uncertainties. Analternative formulation is based on the ratio of the absolute to themaximum uncertainty, and is given by the formula
relative V = absolute U/maximum V,
where absolute and maximum Us are calculated using the formulas given above. The problem with relative uncertainties in the current set of experiments is finding an appropriate maximum. If themaxima in all phases were equal to everything the species does, wewould merely be dividing by a constant. Ifthe maxima were basedon everything an individual does in each phase ofthe experiments,between-phase comparisons would be misleading. This is becausemanipulations that affect the probabilities ofwhatever happens ina phase also affect N in that phase. To the extent that this occurs,we would not see the effects of between-phase manipulations.Given that our goal is assessing changes in variability as a resultof phase manipulations, the relative measure is inappropriate.Therefore, actual uncertainties were used.
Responding during CRF was analyzed in blocks of 20 reinforced press sequences. Dipper training and extinction were analyzed as complete sessions. Percentage transformations or reseal-
ing ofabsolute frequencies allowed comparisons between the CRFblocks and the dipper and extinction sessions.
Results
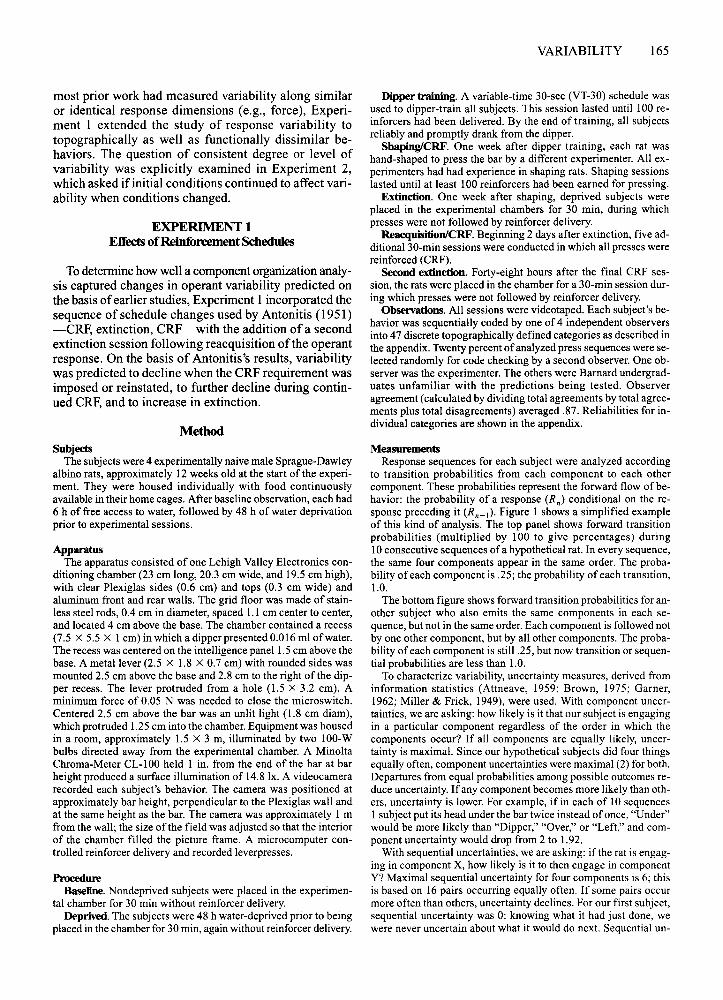
The top and bottom panels of Figure 2 present meancomponent (What is the probability of "Left?") and sequential (What is the probability of "left" being followed by "Under"?') uncertainties. respectively. for allsubjects during dipper training. the 20 reinforcer blockswhen subjects acquired the press (AcqPress: on average.the 41st to 60th reinforcers). at the end of acquisition(EndAcq: on average. the 131st to 150th reinforcers). atthe start (StartReAcq: first 20 reinforcers) and end ofreacquisition (EndReac: 80 I st to 820th reinforcers). andduring both extinction sessions (Ext I. Ext2).
Does variability change when schedules change? Tosee if variability shifted when the response requirementwas imposed. behavior during dipper training was contrasted with that in the 20-reinforcer block (AcqPress),in which the subjects first earned all reinforcers by press-
5 Exper ment 1Component Uncertainties
:0- 4'i r-- .---ii r-- .--- .--- .--- r--1: 3•..c~
2c••~ .
0 .. • go P- .. .. N• • ~ )C • • -.. • • • .... .. .. III ! a: IIIis .. c .... III .. C.. • III
C ;;
10 U(R) • U(RlR-1) I3
Sequential Uncertainties
:0-
'i 2ii1:•..c~
c••:::I0
~ • .. P- .. .. N• .. )C • •.. • c • • .... .. .. III a: II: IIIis .. c .... III 1: c.. • III
C iii
Figure 2. Top panel: Mean component uncertainties. Bottompanel: Mean sequential uncertainties during dipper training (Dipper), when subjects acquired the press (AcqPress), at the end of acquisition (EndAacq), atthe start and end of reacquisition (StartReac,EndReac), and during both extinction sessions (Extt, Ext2) of Experiment I. AU blocks during acquisition and reacquisition include20 reinforced press sequences.
Table IResults of Stepwise Regression Analyses Predicting
Component and Sequential Uncertainties in Experiment I
R2 OverallBin Variable b Increment R2
AcqPress MeanU(R) 1.008* 1.000 1.000MeanU(RJR-I) 1.153* .988 .988
EndAcq MeanU(R) 1.037* .992 .992MeanU(RJR-I) 1.085* .989 .989
StartReac MeanU(R) .981* .997 .997MeanU(RJR-I) .893* .982 .982
EndReac MeanU(R) .974* .989 .989MeanU(RJR-I) .869* .980 .980
Note-MeanU(R) = baseline component uncertainties; MeanU(RJR-I)= baseline sequential uncertainties. *p < .01.
ing. Within-subject t tests showed no shifts in component uncertainty. However, sequential uncertainty declined significantly [t(3) = 5.883, P < .01]. Sequential[t(3) = 4.246, p < .05], but not component, uncertaintyalso declined between the first extinction and the first 20reinforcers in reacquisition, when the response requirement was reimposed.
Since subjects were switched from acquisition to extinction and again from reacquisition to extinction, twoway repeated measures analyses of variance (ANOVAs)with condition (CRF or extinction) and repetition (firstor second time the switch occurred) as factors were usedto compare CRF and extinction. Component [F(I,3) =11.565, p < .05] and sequential uncertainties [F(l,3) =400.466, p < .01] increased between the CRF and extinction phases.
Does variability change when a schedule does notchange? The four CRF blocks shown in Figure 2 werecompared. One-way repeated measures analyses ofvariance (ANOVAs) with block as a factor revealed no differences in either component or sequential uncertainties.
Is there a relationship between reinforcer rate andvariability? To see if there was a relationship betweenreinforcer rates and uncertainties at the individual level,Pearson correlations between component uncertainty,sequential uncertainty, and reinforcement rate were run.There was no significant relationship between either uncertainty measure and reinforcer rate for any subjectduring CRE
To analyze the effects of reinforcer rate on meangroup uncertainties while statistically controlling for individual differences, stepwise regressions were run. Reinforcer rate (per block) and mean component or sequential uncertainty (over the four CRF blocks for eachsubject) were entered into a regression equation predicting uncertainty in each block. In the stepwise procedure,the independent variable that accounts for the largestproportion ofthe total variance in the dependent variableis entered first. Other variables, if significant, are thenentered in order of their decreasing increments to thetotal variance. In the four CRF bins analyzed, only baseline uncertainties were significant; reinforcer rate wasnever entered into the regression equation. For compo-
VARIABILITY 167
nents, baseline uncertainties accounted for a mean .995of total variance; for sequences, they accounted for amean .985. Results ofthe regression analysis are shownin Table 1.
DiscussionExperiment 1 replicated the main result reported in
earlier studies (e.g., Antonitis, 1951) on the effects ofreinforcement schedules: responding was more variableduring extinction than during CRE Contrary to previousfindings (Antonitis, 1951; Notterman, 1959; Vogel &Annau, 1973), variability did not decline during exposure to CRE
This difference may be due to when variability wasmeasured. Since the main goal of the current study wasto examine consistently maintained levels of variability,responding during CRF was measured after the presswas acquired. Antonitis's (1951) analysis is typical of mostearlier studies. He measured variation in the locus ofresponding between the first (1st to 25th reinforcer) session, when subjects had not yet acquired the operant response and the fifth (176th to 225th reinforcer) conditioning session, rather than comparing Sessions 2through 5, when it appears to have been stable (p. 277).
Variability could have remained constant during CRFbecause reinforcer rate was relatively stable. This wasnot the case, however: rates varied from 2 to 14 reinforcers per minute during CRF.
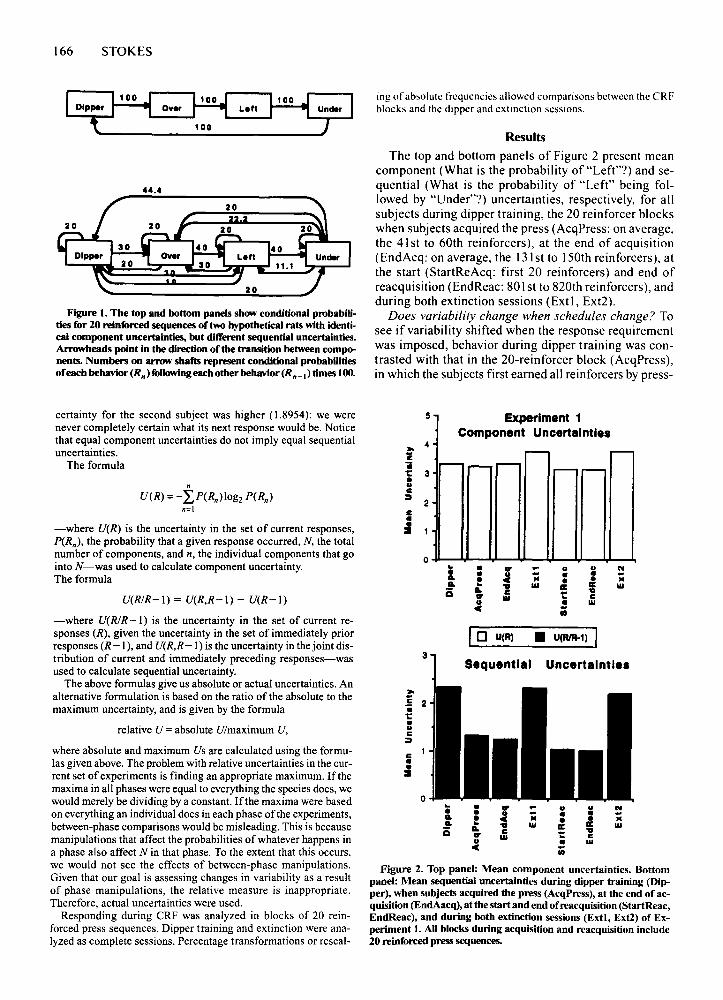
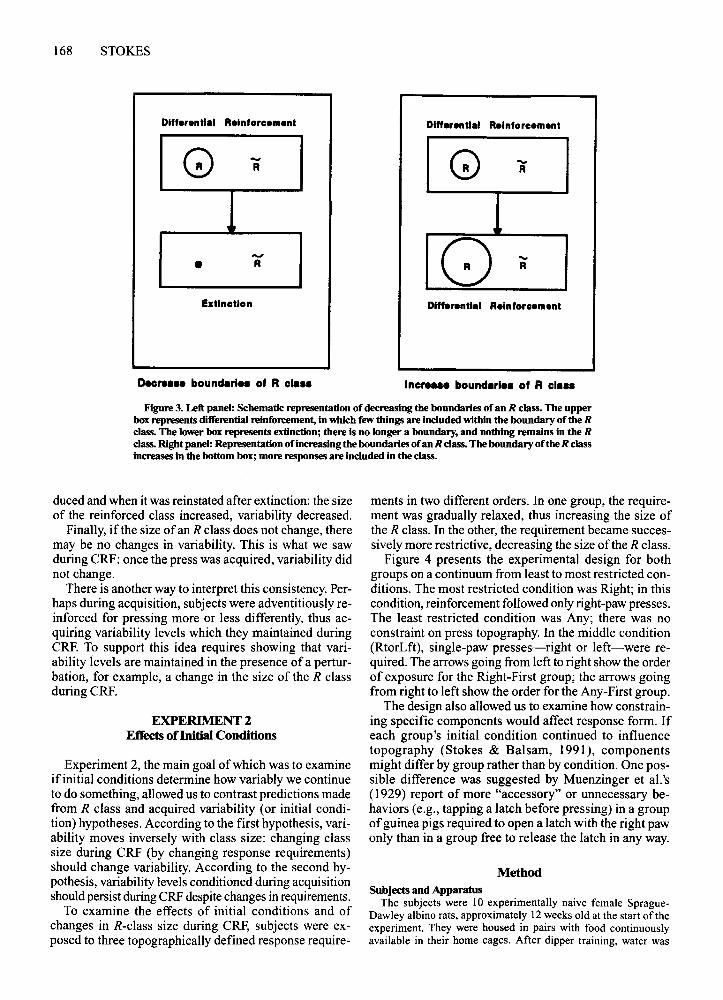
Another reason why variability did not shift duringCRF may be that response class size remained constant.This idea is derived from Schoenfeld and Farmer (1970),who pointed out that all behavior can be divided into twoclasses, a reinforced, or R, class, and a nonreinforced, orR class. Figure 3 illustrates this framework. The upperbox in the left-hand panel represents differential reinforcement. The R class consists of just those responseswhich meet the response criteria as defined by the experimenter. The figure shows a small R class-all members of which are inside the boundary of the reinforcement requirement-and a larger R class, in which noresponse is reinforceable under the current contingency.The lower box represents extinction: there is no longer aboundary. In this view, extinction can be thought of asa change in the boundaries of the R class rather than achange in the frequency of reinforcement. Specifically,the boundary of the R class becomes so small that thereis nothing left in it. In the current study, decreasing thesize of the R class from some members (all of whichwere reinforceable) to no members (no response was reinforceable) increased variability.
What happens if we go from a smaller to a larger Rclass? The right-hand panel of Figure 3 illustrates thiskind of change. The top box again represents differentialreinforcement of a small R class. It could also be drawnto represent an R class of 0, either extinction or dippertraining. The bottom box represents an increase in thesize of the R class. Again, variability changes in the direction opposite to that of the change in class size. Thisoccurred both when the response requirement was intro-
168 STOKES
Differential Reinforcement
G --R
...,• R
Elltlnctlon
Deere... bound.,i•• of R cia..
Differential Reinforcement
G ....R
0 -RDifferential Reinforcement
Incre••• bound.,i•• of Rei...
Figure 3. Left panel: Schematic representation of decreasing the boundaries of an R class. The upperbox represents differential reinforcement, in which few things are included within the boundary of the Rclass. The lower box represents extinction; there is no longer a boundary, and nothing remains in the Rclass. Right panel: Representation of increasing the boundaries of an R class. The boundary of the R classincreases in the bottom box; more responses are included in the class.
duced and when it was reinstated after extinction: the sizeof the reinforced class increased, variability decreased.
Finally, if the size ofan R class does not change, theremay be no changes in variability. This is what we sawduring CRF: once the press was acquired, variability didnot change.
There is another way to interpret this consistency. Perhaps during acquisition, subjects were adventitiously reinforced for pressing more or less differently, thus acquiring variability levels which they maintained duringCRF. To support this idea requires showing that variability levels are maintained in the presence ofa perturbation, for example, a change in the size of the R classduringCRF.
EXPERIMENT 2Effects oflnitial Conditions
Experiment 2, the main goal ofwhich was to examineif initial conditions determine how variably we continueto do something, allowed us to contrast predictions madefrom R class and acquired variability (or initial condition) hypotheses. According to the first hypothesis, variability moves inversely with class size: changing classsize during CRF (by changing response requirements)should change variability. According to the second hypothesis, variability levels conditioned during acquisitionshouldpersist during CRF despitechanges in requirements.
To examine the effects of initial conditions and ofchanges in R-class size during CRF, subjects were exposed to three topographically defined response require-
ments in two different orders. In one group, the requirement was gradually relaxed, thus increasing the size ofthe R class. In the other, the requirement became successively more restrictive, decreasing the size of the R class.
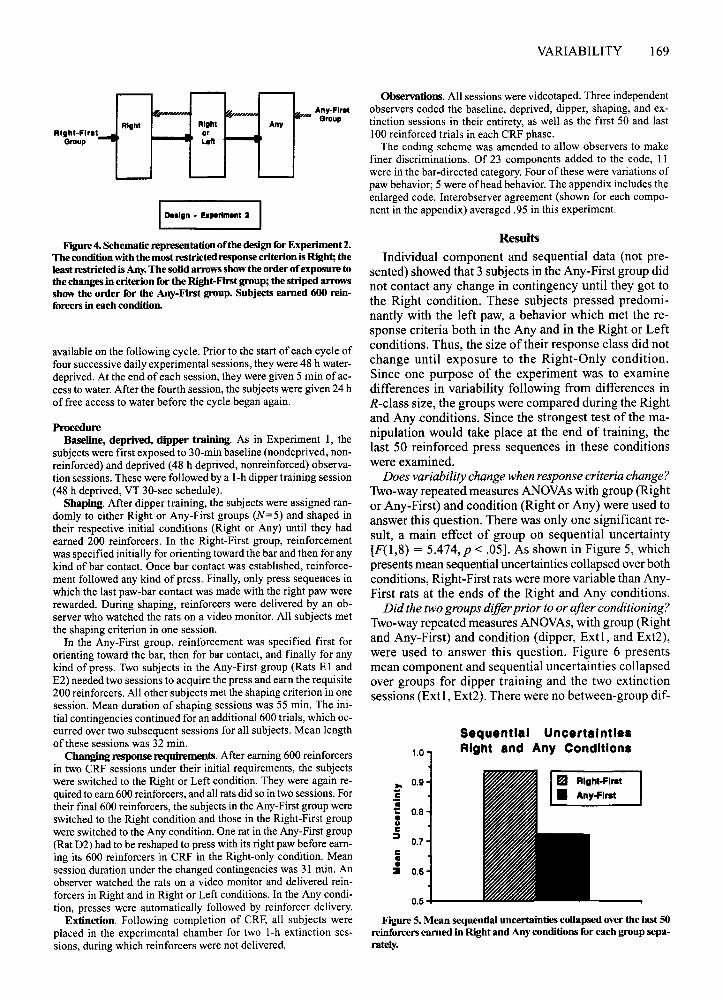
Figure 4 presents the experimental design for bothgroups on a continuum from least to most restricted conditions. The most restricted condition was Right; in thiscondition, reinforcement followed only right-paw presses.The least restricted condition was Any; there was noconstraint on press topography. In the middle condition(RtorLft), single-paw presses-right or left-were required. The arrows going from left to right show the orderof exposure for the Right-First group; the arrows goingfrom right to left show the order for the Any-First group.
The design also allowed us to examine how constraining specific components would affect response form. Ifeach group's initial condition continued to influencetopography (Stokes & Balsam, 1991), componentsmight differ by group rather than by condition. One possible difference was suggested by Muenzinger et al.'s(1929) report of more "accessory" or unnecessary behaviors (e.g., tapping a latch before pressing) in a groupofguinea pigs required to open a latch with the right pawonly than in a group free to release the latch in any way.
MethodSubjects and Apparatus
The subjects were 10 experimentally naive female SpragueDawley albino rats, approximately 12 weeks old at the start oftheexperiment. They were housed in pairs with food continuouslyavailable in their home cages. After dipper training, water was
VARIABILITY 169
Right-FiratGroup
IOHlgn • expertmltllt 2 I
Any
Any.FI,.tvn Group
Observations. All sessions were videotaped. Three independentobservers coded the baseline, deprived, dipper, shaping, and extinction sessions in their entirety, as well as the first 50 and last100 reinforced trials in each CRF phase.
The coding scheme was amended to allow observers to makefiner discriminations. Of 23 components added to the code, IIwere in the bar-directed category. Four of these were variations ofpaw behavior; 5 were of head behavior. The appendix includes theenlarged code. Interobserver agreement (shown for each component in the appendix) averaged .95 in this experiment.
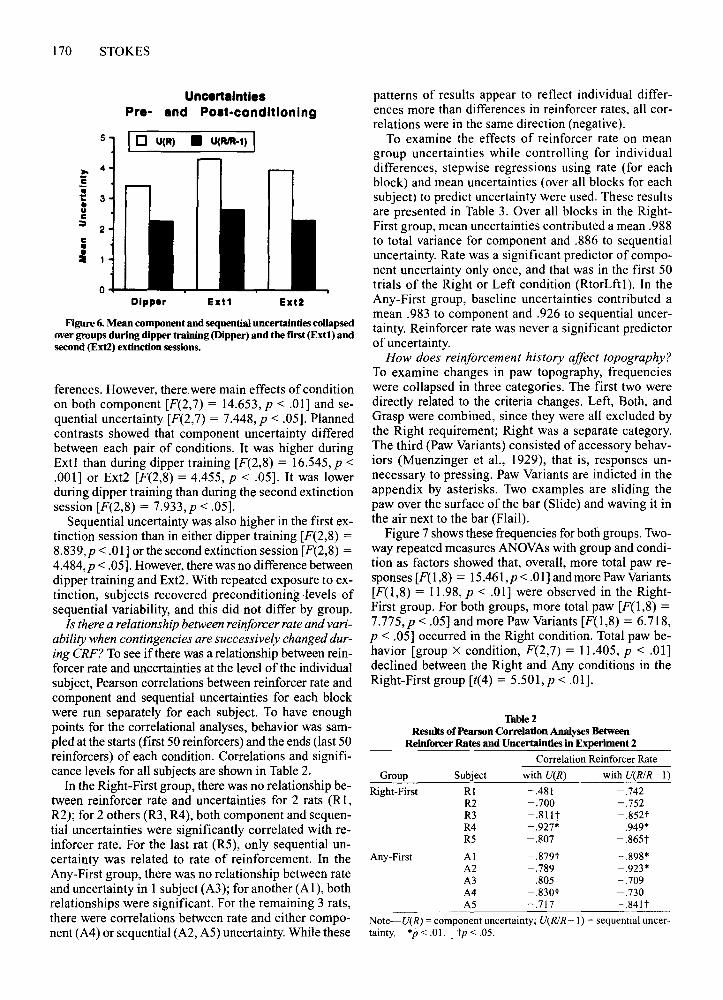
Figure 5. Mean sequential uncertainties coUapsedover the last 50reinforcers earned in Right and Any conditions for each group separately.
Results
Individual component and sequential data (not presented) showed that 3 subjects in the Any-First group didnot contact any change in contingency until they got tothe Right condition. These subjects pressed predominantly with the left paw, a behavior which met the response criteria both in the Any and in the Right or Leftconditions. Thus, the size of their response class did notchange until exposure to the Right-Only condition.Since one purpose of the experiment was to examinedifferences in variability following from differences inR-class size, the groups were compared during the Rightand Any conditions. Since the strongest test of the manipulation would take place at the end of training, thelast 50 reinforced press sequences in these conditionswere examined.
Does variability change when response criteria change?Two-wayrepeated measures ANOVAswith group (Rightor Any-First) and condition (Right or Any) were used toanswer this question. There was only one significant result, a main effect of group on sequential uncertainty[F(I,8) = 5.474,p < .05]. As shown in Figure 5, whichpresents mean sequential uncertainties collapsed over bothconditions, Right-First rats were more variable than AnyFirst rats at the ends of the Right and Any conditions.
Did the two groups differprior to or after conditioning?Two-wayrepeated measures ANOVAs,with group (Rightand Any-First) and condition (dipper, Extl, and Ext2),were used to answer this question. Figure 6 presentsmean component and sequential uncertainties collapsedover groups for dipper training and the two extinctionsessions (Extl, Ext2). There were no between-group dif-
0.5 -4------
m Right-Firat
• Any-Flrat
Sequential UncertaintiesRIght and Any Conditions1.0
c••::I 0.6
>0 0.9C
~ 0.8::c= 0.7
ProcedureBaseline, deprived. dipper training. As in Experiment I, the
subjects were first exposed to 30-min baseline (nondeprived, nonreinforced) and deprived (48 h deprived, nonreinforced) observation sessions. These were followed by a l-h dipper training session(48 h deprived, VT 30-sec schedule).
Shaping. After dipper training, the subjects were assigned randomly to either Right or Any-First groups (N=5) and shaped intheir respective initial conditions (Right or Any) until they hadearned 200 reinforcers. In the Right-First group, reinforcementwas specified initially for orienting toward the bar and then for anykind of bar contact. Once bar contact was established, reinforcement followed any kind of press. Finally, only press sequences inwhich the last paw-bar contact was made with the right paw wererewarded. During shaping, reinforcers were delivered by an observer who watched the rats on a video monitor. All subjects metthe shaping criterion in one session.
In the Any-First group, reinforcement was specified first fororienting toward the bar, then for bar contact, and finally for anykind of press. Two subjects in the Any-First group (Rats EI andE2) needed two sessions to acquire the press and earn the requisite200 reinforcers. All other subjects met the shaping criterion in onesession. Mean duration of shaping sessions was 55 min. The initial contingencies continued for an additional 600 trials, which occurred over two subsequent sessions for all subjects. Mean lengthof these sessions was 32 min.
Changing response requirements. After earning 600 reinforcersin two CRF sessions under their initial requirements, the subjectswere switched to the Right or Left condition. They were again required to earn 600 reinforcers, and all rats did so in two sessions. Fortheir final 600 reinforcers, the subjects in the Any-First group wereswitched to the Right condition and those in the Right-First groupwere switched to the Any condition. One rat in the Any-First group(Rat D2) had to be reshaped to press with its right paw before earning its 600 reinforcers in CRF in the Right-only condition. Meansession duration under the changed contingencies was 31 min. Anobserver watched the rats on a video monitor and delivered reinforcers in Right and in Right or Left conditions. In the Any condition, presses were automatically followed by reinforcer delivery.
Extinction. Following completion of CRF, all subjects wereplaced in the experimental chamber for two I-h extinction sessions, during which reinforcers were not delivered.
available on the following cycle. Prior to the start of each cycle offour successive daily experimental sessions, they were 48 h waterdeprived. At the end of each session, they were given 5 min ofaccess to water. After the fourth session, the subjects were given 24 hof free access to water before the cycle began again.
Figure 4. Schematic representation of the designfor Experiment 2.The conditionwith the most restricted responsecriterion is Right; theleast restricted isAny.The solid arrows showthe order ofexposure tothe changes in criterion for the Right-First group; the striped arrowsshow the order for the Any-First group. Subjects earned 600 reinforcers in each condition.
170 STOKES
Figure 6. Mean component and sequential uncertainties coUapsedover groups during dipper training (Dipper) and the flrst (Ext!) andsecond (Extl) extinction sessions.
ferences. However, there were main effects of conditionon both component [F(2,7) = 14.653, p < .01] and sequential uncertainty [F(2,7) = 7.448,p < .05]. Plannedcontrasts showed that component uncertainty differedbetween each pair of conditions. It was higher duringExtl than during dipper training [F(2,8) = 16.545, P <.001] or Ext2 [F(2,8) = 4.455, P < .05]. It was lowerduring dipper training than during the second extinctionsession [F(2,8) = 7.933,p < .05].
Sequential uncertainty was also higher in the first extinction session than in either dipper training [F(2,8) =8.839,p < .01] or the second extinction session [F(2,8) =4.484, p < .05]. However, there was no difference betweendipper training and Ext2. With repeated exposure to extinction, subjects recovered preconditioning -levels ofsequential variability, and this did not differ by group.
Is there a relationship between reinforcer rate and variability when contingencies are successively changed during CRF? To see ifthere was a relationship between reinforcer rate and uncertainties at the level of the individualsubject, Pearson correlations between reinforcer rate andcomponent and sequential uncertainties for each blockwere run separately for each subject. To have enoughpoints for the correlational analyses, behavior was sampled at the starts (first 50 reinforcers) and the ends (last 50reinforcers) of each condition. Correlations and significance levels for all subjects are shown in Table 2.
In the Right-First group, there was no relationship between reinforcer rate and uncertainties for 2 rats (R 1,R2); for 2 others (R3, R4), both component and sequential uncertainties were significantly correlated with reinforcer rate. For the last rat (R5), only sequential uncertainty was related to rate of reinforcement. In theAny-First group, there was no relationship between rateand uncertainty in 1 subject (A3); for another (AI), bothrelationships were significant. For the remaining 3 rats,there were correlations between rate and either component (A4) or sequential (A2, AS) uncertainty. While these
UncertaintiesPre- and Post-conditioning
I0 U(R) • U(RJR·1) I
Correlation Reinforcer Rate
RI -.481 -.742R2 -.700 -.752R3 -.8IIt -.852tR4 - .927* - .949*R5 - .807 - .865t
Al -.879t -.898*A2 -.789 -.923*A3 - .805 - .709A4 - .830t -.730AS - .717 - .841t
Subject with U(R) with U(R/R-I)
Right-First
Any-First
Group
Table 2Results of Pearson Correlation Analyses Between
Reinforcer Rates and Uncertainties in Experiment 2
patterns of results appear to reflect individual differences more than differences in reinforcer rates, all correlations were in the same direction (negative).
To examine the effects of reinforcer rate on meangroup uncertainties while controlling for individualdifferences, stepwise regressions using rate (for eachblock) and mean uncertainties (over all blocks for eachsubject) to predict uncertainty were used. These resultsare presented in Table 3. Over all blocks in the RightFirst group, mean uncertainties contributed a mean .988to total variance for component and .886 to sequentialuncertainty. Rate was a significant predictor of component uncertainty only once, and that was in the first 50trials of the Right or Left condition (RtorLft 1). In theAny-First group, baseline uncertainties contributed amean .983 to component and .926 to sequential uncertainty. Reinforcer rate was never a significant predictorof uncertainty.
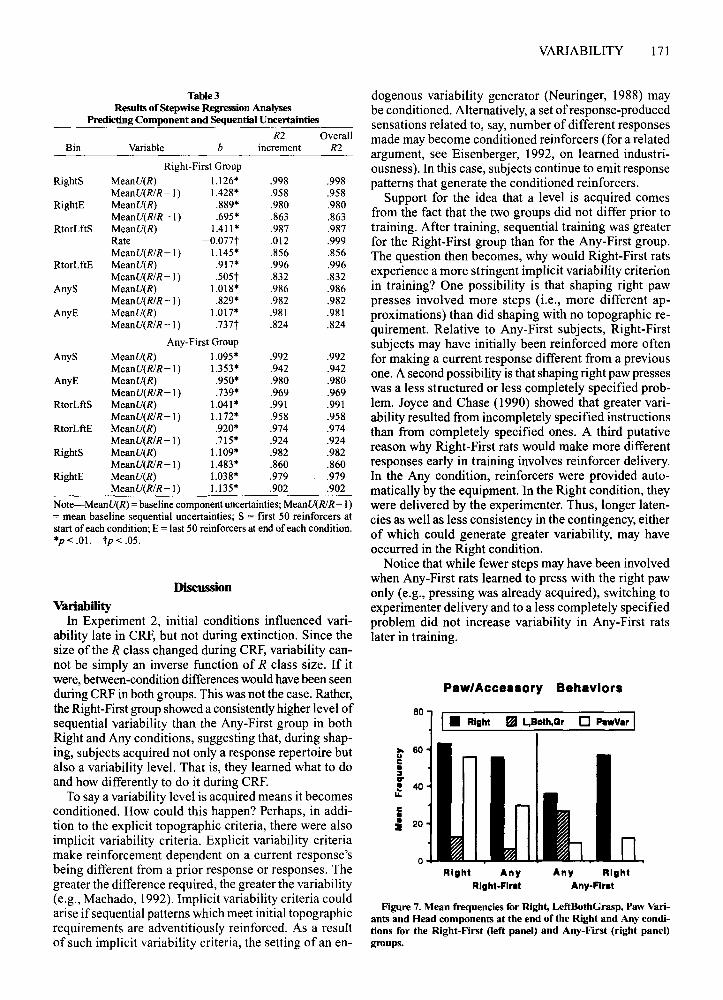
How does reinforcement history affect topography?To examine changes in paw topography, frequencieswere collapsed in three categories. The first two weredirectly related to the criteria changes. Left, Both, andGrasp were combined, since they were all excluded bythe Right requirement; Right was a separate category.The third (Paw Variants) consisted of accessory behaviors (Muenzinger et aI., 1929), that is, responses unnecessary to pressing. Paw Variants are indicted in theappendix by asterisks. Two examples are sliding thepaw over the surface of the bar (Slide) and waving it inthe air next to the bar (Flail).
Figure 7 shows these frequencies for both groups. Twoway repeated measures ANOVAs with group and condition as factors showed that, overall, more total paw responses [F(l,8) = 15.461,p< .01] and more Paw Variants[F(I,8) = 11.98, p < .01] were observed in the RightFirst group. For both groups, more total paw [F(l,8) =7.775,p < .05] and more Paw Variants [F(l,8) = 6.718,p < .05] occurred in the Right condition. Total paw behavior [group X condition, F(2,7) = 11.405, p < .01]declined between the Right and Any conditions in theRight-First group [t(4) = 5.501,p < .01].
Note-U(R) = component uncertainty; U(R/R-I) = sequential uncertainty. *p < .01. _tp < .05.
Ext2Ext1Dlpp.,
5
o
:0. 4CIi1: 3:c~ 2c••a
VARIABILITY 171
Figure 7. Mean frequencies for Right, LeftBothGrasp, Paw Variants and Head components at the end of the Right and Any conditions for the Right-First (left panel) and Any-First (right panel)groups.
dogenous variability generator (Neuringer, 1988) maybe conditioned. Alternatively, a set ofresponse-producedsensations related to, say,number of different responsesmade may become conditioned reinforcers (for a relatedargument, see Eisenberger, 1992, on learned industriousness). In this case, subjects continue to emit responsepatterns that generate the conditioned reinforcers.
Support for the idea that a level is acquired comesfrom the fact that the two groups did not differ prior totraining. After training, sequential training was greaterfor the Right-First group than for the Any-First group.The question then becomes, why would Right-First ratsexperience a more stringent implicit variability criterionin training? One possibility is that shaping right pawpresses involved more steps (i.e., more different approximations) than did shaping with no topographic requirement. Relative to Any-First subjects, Right-Firstsubjects may have initially been reinforced more oftenfor making a current response different from a previousone. A second possibility is that shaping right paw presseswas a less structured or less completely specified problem. Joyce and Chase (1990) showed that greater variability resulted from incompletely specified instructionsthan from completely specified ones. A third putativereason why Right-First rats would make more differentresponses early in training involves reinforcer delivery.In the Any condition, reinforcers were provided automatically by the equipment. In the Right condition, theywere delivered by the experimenter. Thus, longer latencies as well as less consistency in the contingency, eitherof which could generate greater variability, may haveoccurred in the Right condition.
Notice that while fewer steps may have been involvedwhen Any-First rats learned to press with the right pawonly (e.g., pressing was already acquired), switching toexperimenter delivery and to a less completely specifiedproblem did not increase variability in Any-First ratslater in training.
Paw/Accellory Behaviorl
Any RightAny-Flr.t
Right AnyRight-Flr.t
I• RIght II L,Both,Gr 0 PIIwV.r I
o
80
lo. 60uc•:III:r! 4014.
J 20
Right-First Group
RightS MeanU(R) 1.126* .998 .998MeanU(RIR-I) 1.428* .958 .958
RightE MeanU(R) .889* .980 .980MeanU(RIR-I) .695* .863 .863
RtorLftS MeanU(R) 1.411* .987 .987Rate -o.ont .012 .999MeanU(RIR-I) 1.145* .856 .856
RtorLftE MeanU(R) .917* .996 .996MeanU(RIR-I) .505t .832 .832
AnyS MeanU(R) 1.018* .986 .986MeanU(RIR-I) .829* .982 .982
AnyE MeanU(R) 1.017* .981 .981MeanU(RIR-I) .737t .824 .824
Any-First Group
AnyS MeanU(R) 1.095* .992 .992MeanU(RIR-I) 1.353* .942 .942
AnyE MeanU(R) .950* .980 .980MeanU(RIR-I) .739* .969 .969
RtorLftS MeanU(R) 1.041* .991 .991MeanU(RIR-l) 1.172* .958 .958
RtorLftE MeanU(R) .920* .974 .974MeanU(RIR-I) .715* .924 .924
RightS MeanU(R) 1.109* .982 .982MeanU(RIR-I) 1.483* .860 .860
RightE MeanU(R) 1.038* .979 .979MeanU(RIR-I) 1.135· .902 .902
Note-MeanU(R) =baseline component uncertainties; MeanU(RIR- I)= mean baseline sequential uncertainties; S = first 50 reinforcers atstart of each condition; E = last 50 reinforcers at end of each condition.*p < .01. tp < .05.
Discussion
R2 OverallBin Variable b increment R2
Table 3Results of Stepwise Regression Analyses
Predicting Component and Sequential Uncertainties
VariabilityIn Experiment 2, initial conditions influenced vari
ability late in CRF, but not during extinction. Since thesize of the R class changed during CRF, variability cannot be simply an inverse function of R class size. If itwere,between-condition differences would have been seenduring CRF in both groups. This was not the case. Rather,the Right-First group showed a consistentlyhigher level ofsequential variability than the Any-First group in bothRight and Any conditions, suggesting that, during shaping, subjects acquired not only a response repertoire butalso a variability level. That is, they learned what to doand how differently to do it during CRE
To say a variability level is acquired means it becomesconditioned. How could this happen? Perhaps, in addition to the explicit topographic criteria, there were alsoimplicit variability criteria. Explicit variability criteriamake reinforcement dependent on a current response'sbeing different from a prior response or responses. Thegreater the difference required, the greater the variability(e.g., Machado, 1992). Implicit variability criteria couldarise if sequential patterns which meet initial topographicrequirements are adventitiously reinforced. As a resultof such implicit variability criteria, the setting of an en-
172 STOKES
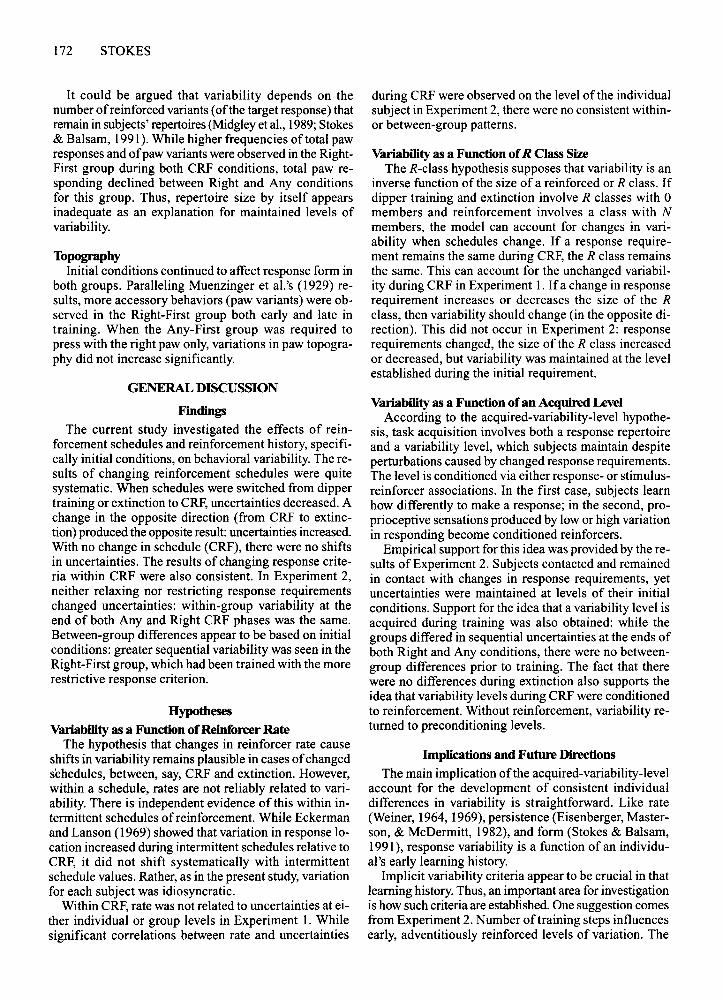
It could be argued that variability depends on thenumber ofreinforced variants (ofthe target response) thatremain in subjects' repertoires (Midgley et aI., 1989; Stokes& Balsam, 1991). While higher frequencies of total pawresponses and ofpaw variants were observed in the RightFirst group during both CRF conditions, total paw responding declined between Right and Any conditionsfor this group. Thus, repertoire size by itself appearsinadequate as an explanation for maintained levels ofvariability.
TopographyInitial conditions continued to affect response form in
both groups. Paralleling Muenzinger et al.'s (1929) results, more accessory behaviors (paw variants) were observed in the Right-First group both early and late intraining. When the Any-First group was required topress with the right paw only, variations in paw topography did not increase significantly.
GENERAL DISCUSSION
Findings
The current study investigated the effects of reinforcement schedules and reinforcement history, specifically initial conditions, on behavioral variability. The results of changing reinforcement schedules were quitesystematic. When schedules were switched from dippertraining or extinction to CRF, uncertainties decreased. Achange in the opposite direction (from CRF to extinction) produced the opposite result: uncertainties increased.With no change in schedule (CRF), there were no shiftsin uncertainties. The results of changing response criteria within CRF were also consistent. In Experiment 2,neither relaxing nor restricting response requirementschanged uncertainties: within-group variability at theend of both Any and Right CRF phases was the same.Between-group differences appear to be based on initialconditions: greater sequential variability was seen in theRight-First group, which had been trained with the morerestrictive response criterion.
Hypotheses
Variability as a Function ofReinforcer RateThe hypothesis that changes in reinforcer rate cause
shifts in variability remains plausible in cases ofchangedschedules, between, say, CRF and extinction. However,within a schedule, rates are not reliably related to variability. There is independent evidence of this within intermittent schedules ofreinforcement. While Eckermanand Lanson (1969) showed that variation in response location increased during intermittent schedules relative toCRF, it did not shift systematically with intermittentschedule values. Rather, as in the present study, variationfor each subject was idiosyncratic.
Within CRF, rate was not related to uncertainties at either individual or group levels in Experiment 1. Whilesignificant correlations between rate and uncertainties
during CRF were observed on the level of the individualsubject in Experiment 2, there were no consistent withinor between-group patterns.
Variability as a Function ofR Class SizeThe R-class hypothesis supposes that variability is an
inverse function of the size of a reinforced or R class. Ifdipper training and extinction involve R classes with 0members and reinforcement involves a class with Nmembers, the model can account for changes in variability when schedules change. If a response requirement remains the same during CRF, the R class remainsthe same. This can account for the unchanged variability during CRF in Experiment 1. If a change in responserequirement increases or decreases the size of the Rclass, then variability should change (in the opposite direction). This did not occur in Experiment 2: responserequirements changed, the size of the R class increasedor decreased, but variability was maintained at the levelestablished during the initial requirement.
Variability as a Function ofan Acquired LevelAccording to the acquired-variability-level hypothe
sis, task acquisition involves both a response repertoireand a variability level, which subjects maintain despiteperturbations caused by changed response requirements.The level is conditioned via either response- or stimulusreinforcer associations. In the first case, subjects learnhow differently to make a response; in the second, proprioceptive sensations produced by low or high variationin responding become conditioned reinforcers.
Empirical support for this idea was provided by the results of Experiment 2. Subjects contacted and remainedin contact with changes in response requirements, yetuncertainties were maintained at levels of their initialconditions. Support for the idea that a variability level isacquired during training was also obtained: while thegroups differed in sequential uncertainties at the ends ofboth Right and Any conditions, there were no betweengroup differences prior to training. The fact that therewere no differences during extinction also supports theidea that variability levels during CRF were conditionedto reinforcement. Without reinforcement, variability returned to preconditioning levels.
Implications and Future Directions
The main implication ofthe acquired-variability-levelaccount for the development of consistent individualdifferences in variability is straightforward. Like rate(Weiner, 1964, 1969), persistence (Eisenberger, Masterson, & McDermitt, 1982), and form (Stokes & Balsam,1991), response variability is a function of an individuai's early learning history.
Implicit variability criteria appear to be crucial in thatlearning history. Thus, an important area for investigationis how such criteria are established. One suggestion comesfrom Experiment 2. Number oftraining steps influencesearly, adventitiously reinforced levels of variation. The
more steps, the more variation. A second suggestioncomes from Joyce and Chase's (1990) comparison ofcompletely and incompletely specified instructions. Incomplete instructions generate greater initial levels ofvariability than do complete instructions. If steps andspecificity interact, prediction is more difficult. For example, if instructions are completely specified, numberof steps may not matter.
Finally, questions about step size and criterion specificity need to be investigated with human subjects. Understanding how implicit variability criteria are embedded in training has practical importance foreducation. In many problem-solving areas, includingarithmetic (Carpenter & Moser, 1982; Fuson, 1982;Seigler, 1994) and causal attribution (Kuhn & Phelps,1982; Schauble, 1990), the range or number of strategies used by individuals does not diminish when moreefficient strategies are learned. Rather, the distributionshifts. The current work indicates that these kinds ofindividual differences are-to a large extent-learned,and suggests ways to study what in the learning determines the level.
REFERENCES
ALLEMAN, H. D., & ZEILER, M. D. (1974). Patterning with fixed-timeschedules of response-independent reinforcement. Journal of theExperimental Analysis ofBehavior, 22, 135-141.
ANTONITIS, 1. J. (1951). Response variability in the white rat duringconditioning, extinction and reconditioning. Journal ofExperimental Psychology, 42, 273-281.
ATTNEAVE, E (1959). Applications of information theory to psychology: A summary ofbasic concepts. New York: Holt, Rinehart & Winston.
BICKEL, W. K., HIGGINS, S. T.,KIRBY, K., & JOHNSON, L. M. (1988). Aninverse relationship between baseline fixed-interval response rateand the effects ofa tandem response requirement. Journal ofthe Experimental Analysis ofBehavior, SO, 211-218.
BLOUGH, D. S. (1966). The reinforcement of least-frequent interresponse times. Journal ofthe Experimental Analysis ofBehavior, 9,581-591.
BROWN, M. B. (1975). The asymptotic standard errors ofsome estimatesof uncertainty in the two-way contingency table. Psychometrika,40,291-296.
BRYANT, D., & CHURCH, R. M. (1974). The determinants of randomchoice. Animal Learning & Behavior, 2, 245-248.
CARPENTER, T. P., & MOSER, J. M. (1982). The development of addition and subtraction problem-solving skills. In T.P. Carpenter, 1. M.Moser, & T.A. Romberg (Eds.), Addition and subtraction: A cognitive perspective (pp. 9-24). Hillsdale, NJ: Erlbaum.
CHRISTENSEN, P. R., GUILFORD, J. P., & WILSON, R. C. (1957). Relations of creative responses to working time and instructions. Journal ofExperimental Psychology, 53, 82-88.
EcKERMAN, D. A., & LANSON, R. N. (1969). Variability ofresponse location for pigeons responding under continuous reinforcement, intermittent reinforcement, and extinction. Journal ofthe Experimental Analysis ofBehavior, 12, 73-80.
EISENBERGER, R. (1992). Learned industriousness. Psychological Review, 99, 248-267.
EISENBERGER, R., MASTERSON, E A., & McDERMITT, M. (1982). Effects of task variety on generalized effort. Journal ofEducationalPsychology, 74,499-505.
FUSON, K. C. (1982). An analysis of the counting-on solution procedure in addition. In T. P. Carpenter, 1. M. Moser, & T. A. Romberg
VARIABILITY 173
(Eds.), Addition and subtraction: A cognitive perspective (pp. 6781). Hillsdale, NJ: Erlbaum.
GARNER, W. R. (1962). Uncertainty and structure as psychologicalconcepts. New York: Wiley.
GUTHRIE, E. R., & HORTON, G. P. (1946). Cats in a puzzle box. NewYork: Rinehart.
HERRNSTEIN, R. J. (1961). Stereotypy and intermittent reinforcement.Science, 133, 2067-2069.
HOLMAN, J., GOETZ, E., & BAER, D. M. (1977). The training of creativity as an operant and an examination of its generalization characteristics. In B. C. Etzel, 1.M. LeBlanc, & D. M. Baer (Eds.), Newdevelopments in behavioral research: Theory, method and application (pp. 441-471). New York: Wiley.
JOYCE, J. H., & CHASE, P. N. (1990). Effects of response variability onthe sensitivity of rule-governed behavior. Journal of the Experimental Analysis ofBehavior, 54, 251-262.
KUHN, D., & PHELPS, E. (1982). The development of problem-solvingstrategies. In H. W. Reese (Ed.), Advances in child development andbehavior (Vol. 17, pp. 2-44). New York: Academic Press.
LACHTER, G. D., & COREY, 1. R. (1982). Variability of the duration ofan operant. Behavior Analysis Letters, 2, 97-102.
MACHADO, A. (1989). Operant conditioning of variability using a percentile reinforcement schedule. Journal ofthe Experimental Analysis ofBehavior, 52, 155-166.
MACHADO, A. (1992). Behavioral variability and frequency-dependentselection. Journal ofthe Experimental Analysis ofBehavior, 58, 241263.
MALTZMAN, I. (1960). On the training oforiginality. Psychological Review, 67, 229-242.
MIDGLEY, M., LEA,S. E. G., & KIRBY, R. M. (1989). Algorithmic shaping and misbehavior in the acquisition oftoken deposit by rats. Journal ofthe Experimental Analysis ofBehavior, 52, 27-40.
MILLER, G. A., & FRICK, E C. (1949). Statistical behavioristics and sequences of responses. Psychological Review, 56, 31 1-324.
MORRIS, C. J. (1987). The operant conditioning of response variability: Free-operant versus discrete-response procedures. Journal ofthe Experimental Analysis ofBehavior, 47, 273-277.
MUENZINGER, K. E, KOERNER, L., & IREY, E. (1929). Variability of anhabitual movement in guinea pigs. Journal of Comparative Psychology, 9, 425-436.
NEURINGER, A. (1986). Can people behave 'randomly'? The roleof feedback. Journal ofExperimental Psychology: General, lIS, 6275.
NEURINGER, A. (1991). Operant variability and repetition as functionsof interresponse time. Journal ofExperimental Psychology: General, 115, 429-452.
NEURINGER, A. (1993). Reinforced variation and selection. AnimalLearning & Behavior, 21, 83-91.
NOTTERMAN, 1. M. (1959). Force emission during bar pressing. Journal ofExperimental Psychology, 58, 341-347.
PAGE, S., & NEURINGER, A. (1985). Variability is an operant. Journal ofExperimental Psychology: Animal Behavior Processes, 11,429-452.
PvROR, E. W., HAAG, R., & O'REILLY, J. (1969). The creative porpoise:Training for novel behavior. Journal ofthe Experimental Analysis ofBehavior, 12, 653-661.
ROYCE, J. (1898). The psychology ofinvention. Psychological Review,5, 113-144.
SCHAUBLE, L. (1990). Belief revision in children: The role of priorknowledge and strategies for generating evidence. Journal of Experimental Child Psychology, 49,31-57.
ScHOENFELD, W. N., & FARMER, J. (1970). Reinforcement schedulesand the "behavior stream." In W. N. Schoenfeld (Ed.), The theory ofreinforcementschedules (pp. 215-245). New York: Appleton-CenturyCrofts.
SCHOENFELD, W. N., HARRIS, A. H., & FARMER, J. (1966). Conditioning response variability. Psychological Reports, 19, 551-557.
SCHWARTZ, B. (1982a). Failure to produce response variability with reinforcement. Journal ofthe Experimental Analysis ofBehavior, 37,171-181.
174 STOKES
SCHWARTZ. B. (1982b). Reinforcement-induced behavioral stereotypy: How not to teach people to discover rules. Journal ot Expertmental Psychology: General. I I t. 23-59.
SEIGLER. R. S. (1994). Cognitive variability: A key to understanding cognitive development. Current Directions in PsvchologicalScience. 3. 1-5.
SEIGLER. R. S.• & JENKINS. E. (1989). HOII' children discover nell"strategies. Hillsdale. NJ: Erlbaum.
SELIGMAN. M. E. P.. & MAIER. S. (1967). Failure to escape from traumatic shock. Journal ofExperimental Psychologv, 74. 1-9.
STOKES. P. D.• & BALSAM. P. D. (1991). Effects of reinforcing preselected approximations on the topography of the rat's bar press. Journal ofthe Experimental Analvsis ofBehavior, 55. 213-231.
TATHAM. T. A.. WANCHISEN. B. A.• & HINELINE. P. N. ( 1993). Effectsof fixed and variable ratios on human behavioral variability. Journal otthe Experimental Analysis ofBehavior, 59, 349-359.
V'K;E!.. R.. & ANNAU, Z. (1973). An operant discrimination task allowing variability of reinforced response patterning. Journal oftheExperimental Analvsis ofBehavior. 20. 1-6.
WEINER. H. (1964). Conditioning history and human fixed-intervalperformance. Journal ofthe Experimental Analysis ofBehavior, 7,383-385.
WEINER. H. (1969). Controlling human fixed-interval performance.Journal of the Experimental Analvsis 0( Behavior, 12, 349-373.
WONG. P. T. P. (1977). Partial reinforcement and the learning ofa strategy in the rat. American Journal ofPsychology, 90, 663-674.
APPENDIXDef'mition of Behavioral Categories and Interobserver Reliabilities
(Reliabilities: Experiment l/Experiment 2)
Bar-Directed Components
T
L
C
H
Left paw contacting top of bar.
Both paws contacting underside of bar.Bar contact with both paws: one on top surface; one contactingunderside.Reverse ofgrasp: Left on top, Right on bottom.
Left paw contacting underside of bar.Both paws contacting top of bar.
Keeping paw in contact with bar while putting head in dipper, usually with straight rather than bent limb.Glide paw over surface of bar.
Right paw contacting top of bar. Note: Contact is scored whenspace cannot be seen between body and bar surface.RighI paw contacting underside of bar.
Snout in contact with hole at back of bar.
Contact bar with tip of snout.
Any head contact below the mouth.
Slide chin over surface of bar.Contact bar with cheek.
Slide cheek over surface of bar.Any mouth contact with bar, excluding Bite.
Contact bar by grasping between teeth.
Contact bar with top ofhead.
Contact bar with body part other than head, paws, or tail.
Contact bar with tail.
Any depression ofbar strong enough to activate microswitch.
Ru
LuB
Hd
BuGr
GRU
SI
N
CSCk
Bi
Bg
CKSM
x
TA
A. Contact Components
R RightPaw(.85/.99)RightUnder*(-/1.0)LeftPaw(.96/.96)LeftUnder*BothPaws(-/.89)BothUnder*tGrasp(1.01.96)GraspRightUnder(-/1.0)*tHold*t(-/1.0)Slide*(-/.95)Hole(.66/.99)Nose(-/.93)Chin(1.0/.87)ChinSlidetCheek'](-/1.0)CheekSlidetMouth(1.0/.96)Bite(.66/.86)Bang(-/1.0)Torso(-/l.0)Tailt(-/1.0)Press(1.0/1.0)
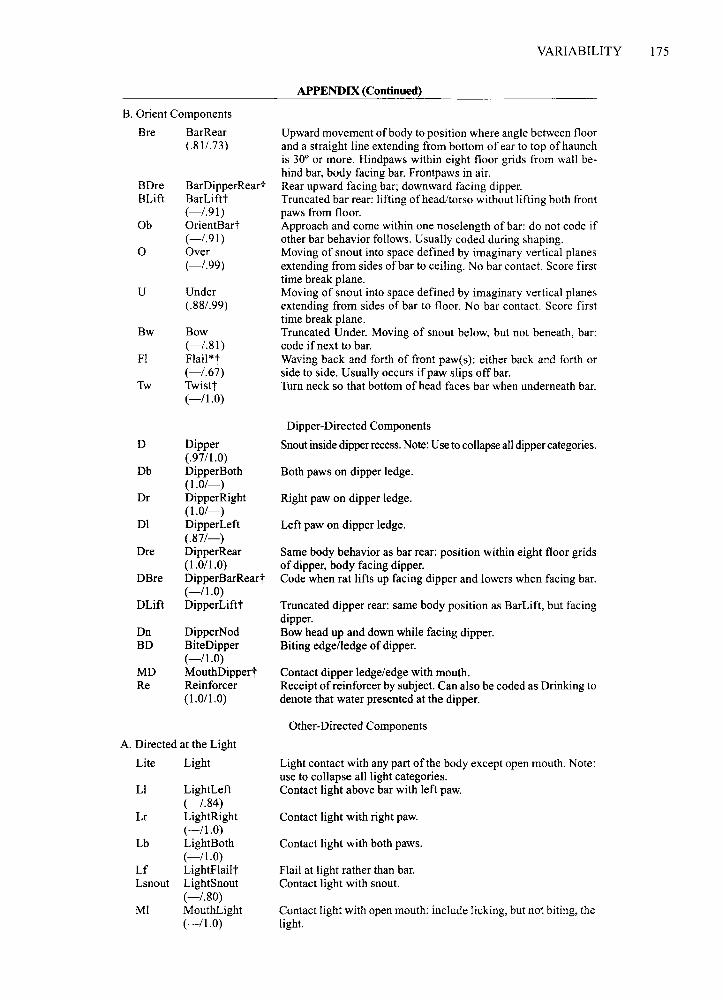
B. Orient Components
Bre BarRear(.81/.73)
BDre BarDipperReartBLift BarLiftt
(-/.91)Ob OrientBart
(-/.91)0 Over
(-/.99)
U Under(.88/.99)
Bw Bow(-/.81)
FI Flail*t(-/.67)
Tw Twist](-/1.0)
VARIABILITY 175
APPENDIX (Continued)
Upward movement of body to position where angle between floorand a straight line extending from bottom of ear to top of haunchis 30° or more. Hindpaws within eight floor grids from wall behind bar, body facing bar. Frontpaws in air.Rear upward facing bar; downward facing dipper.Truncated bar rear: lifting of head/torso without lifting both frontpaws from floor.Approach and come within one noselength of bar: do not code ifother bar behavior follows. Usually coded during shaping.Moving of snout into space defined by imaginary vertical planesextending from sides of bar to ceiling. No bar contact. Score firsttime break plane.Moving of snout into space defined by imaginary vertical planesextending from sides of bar to floor. No bar contact. Score firsttime break plane.Truncated Under. Moving of snout below, but not beneath, bar:code if next to bar.Waving back and forth of front paw(s): either back and forth orside to side. Usually occurs ifpaw slips offbar.Turn neck so that bottom of head faces bar when underneath bar.
D
Db
Dr
Dl
Dre
DBre
DLift
DnBD
MDRe
Dipper(.97/1.0)DipperBoth(1.0/-)DipperRight(1.0/-)DipperLeft(.87/-)DipperRear(1.0/1.0)DipperBarReart(-/1.0)Dipperl.iftt
DipperNodBiteDipper(-/1.0)MouthDippertReinforcer(1.0/1.0)
Dipper-Directed Components
Snoutinside dipper recess.Note: Use to collapseall dippercategories.
Both paws on dipper ledge.
Right paw on dipper ledge.
Left paw on dipper ledge.
Same body behavior as bar rear: position within eight floor gridsof dipper, body facing dipper.Code when rat lifts up facing dipper and lowers when facing bar.
Truncated dipper rear: same body position as BarLift, but facingdipper.Bow head up and down while facing dipper.Biting edge/ledge of dipper.
Contact dipper ledge/edge with mouth.Receipt ofreinforcer by subject. Can also be coded as Drinking todenote that water presented at the dipper.
Other-Directed Components
A. Directed at the Light
Lite Light
Ll LightLeft(-/.84)
Lr LightRight(-/1.0)
Lb LightBoth(-/1.0)
Lf LightFlail tLsnout LightSnout
(-/.80)MI MouthLight
(-/1.0)
Light contact with any part of the body except open mouth. Note:use to collapse all light categories.Contact light above bar with left paw.
Contact light with right paw.
Contact light with both paws.
Flail at light rather than bar.Contact light with snout.
Contact light with open mouth: include licking, but not biting, thelight.
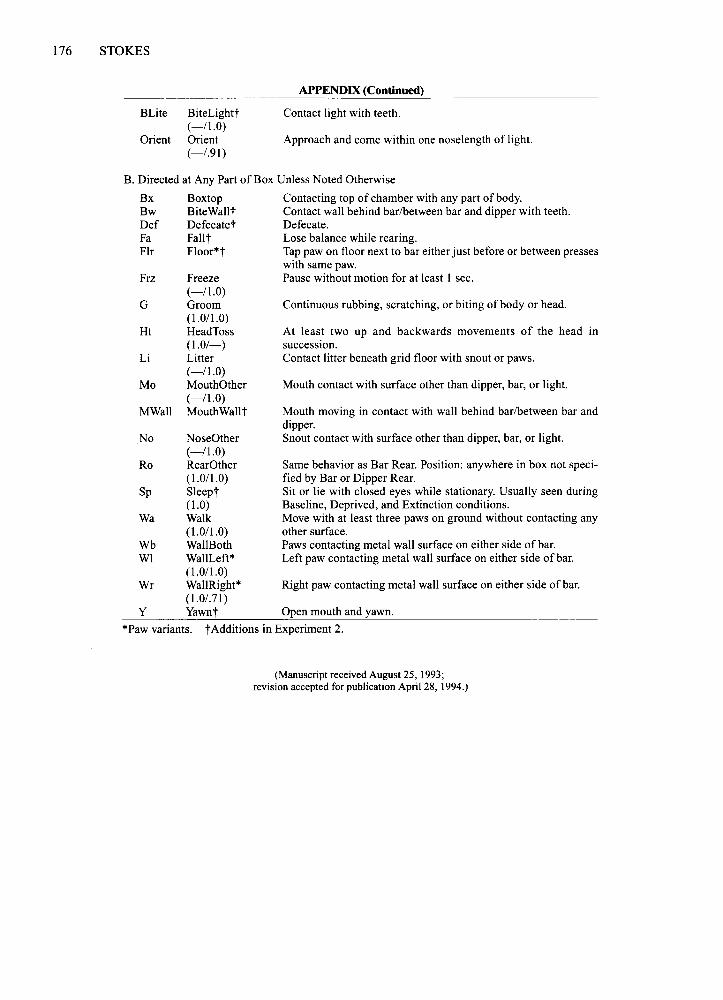
176 STOKES
APPENDIX (Continued)
BLite BiteLightt(-/1.0)
Orient Orient(-/.91)
Contact light with teeth.
Approach and come within one noselength of light.
Continuous rubbing, scratching, or biting of body or head.
Mouth contact with surface other than dipper, bar, or light.
At least two up and backwards movements of the head III
succession.Contact litter beneath grid floor with snout or paws.
Mouth moving in contact with wall behind barlbetween bar anddipper.Snout contact with surface other than dipper, bar, or light.
Right paw contacting metal wall surface on either side of bar.
Same behavior as Bar Rear. Position: anywhere in box not specified by Bar or Dipper Rear.Sit or lie with closed eyes while stationary. Usually seen duringBaseline, Deprived, and Extinction conditions.Move with at least three paws on ground without contacting anyother surface.Paws contacting metal wall surface on either side of bar.Left paw contacting metal wall surface on either side of bar.
Freeze(-/1.0)Groom(1.0/1.0)HeadToss(1.0/-)Litter(-/1.0)MouthOther(-/1.0)MouthWallt
Frz
Ht
Ro
MWall
Li
Mo
G
No
Wa
WbWI
Sp
NoseOther(-/1.0)RearOther(1.0/1.0)Sleep](1.0)Walk(1.0/1.0)WallBothWallLeft*(1.0/1.0)WallRight*(1.0/.71)
Y Yawn] Open mouth and yawn.
Wr
B. Directed at Any Part of Box Unless Noted Otherwise
Bx Boxtop Contacting top of chamber with any part of body.Bw BiteWallt Contact wall behind barlbetween bar and dipper with teeth.Def Defecate] Defecate.Fa Fall[ Lose balance while rearing.Fir Floor*t Tap paw on floor next to bar either just before or between presses
with same paw.Pause without motion for at least I sec.
*Paw variants. t Additions in Experiment 2.
(Manuscript received August 25, 1993;revision accepted for publication April 28, 1994.)


