Embed Size (px)
Citation preview
Dissolved organic nitrogen in the global surface ocean:Distribution and fate
Robert T. Letscher,1,2 Dennis A. Hansell,1 Craig A. Carlson,3 Rick Lumpkin,4 andAngela N. Knapp1
Received 16 July 2012; revised 13 November 2012; accepted 27 November 2012; published 26 February 2013.
[1] The allochthonous supply of dissolved organic nitrogen (DON) from gyre margins intothe interior of the ocean’s oligotrophic subtropical gyres potentially provides an importantsource of new N to gyre surface waters, thus sustaining export production. This processrequires that a fraction of the transported DON be available to euphotic zonephotoautotroph communities via mineralization. In this study, we investigated thebiological and physical controls on the distribution and fate of DON within global oceansurface waters. Inputs of nitrate to the euphotic zone at upwelling zones fuel netaccumulation of a DON pool that appears to resist rapid microbial remineralization,allowing subsequent advective transport into the subtropical gyres. Zonal gradients inDON concentrations across these gyres imply a DON sink in the surface layer. Assessmentof the physical dynamics of gyre circulation and winter mixing revealed a pathway forDON removal from the mixed layer via vertical transport to the deep euphotic zone, whichestablishes the observed zonal gradients. Incubation experiments from the Florida Straitsindicated surface-accumulated DON was largely resistant (over a few months) to utilizationby the extant surface bacterioplankton community. In contrast, this same material wasremineralized three times more rapidly when exposed to upper mesopelagicbacterioplankton. These results suggest the primary fate of surface DON to be removal viavertical mixing and subsequent mineralization below the mixed layer, implying a limitedrole for direct DON support of gyre export production from the surface layer. DON maycontribute to export production at the eastern edges of the subtropical gyres, but only afterits mineralization within the deep euphotic zone.
Citation: Letscher, R. T., D. A. Hansell, C. A. Carlson, R. Lumpkin, and A. N. Knapp (2013), Dissolved organic nitrogenin the global surface ocean: Distribution and fate, Global Biogeochem. Cycles, 27, 141–153, doi:10.1029/2012GB004449.
1. Introduction
[2] Over much of the surface global ocean (upper 200m),most of the standing stock of fixed nitrogen (N) is in theform of dissolved organic nitrogen (DON) [Bronk, 2002;Aluwihare and Meador, 2008]. Accumulation of N withinthis pool results from a decoupling of DON production andconsumption processes primarily carried out by autotrophicplankton and heterotrophic bacterioplankton, respectively.This biologically recalcitrant material can accumulate viadirect production [McCarthy et al., 2004] or diagenetic
alteration of the molecular structure [Amon and Benner,1996]. However, if a portion of the euphotic zone (<100m)bulk DON pool eventually becomes bioavailable to theresident microbial community, then the remineralized Ncan represent a potential source of new N to support primaryand export production in oligotrophic systems.[3] Prior efforts to quantify the sustenance of upper ocean
productivity by DON have focused on the Atlantic Oceanwhere the greatest density of DON observations exists anda clear east-to-west gradient in DON concentration hasbeen observed (>5 mmol kg-1 in the east to ~4.5 mmol kg-1
in the west) [Mahaffey et al., 2004; Roussenov et al., 2006;Charria et al., 2008; Torres-Valdés et al., 2009]. Thesestudies have considered the allochthonous input of semila-bile DON (lifetime of months to years), generated at theproductive gyre margins, to the subtropical gyre interiorand its potential role as an organic nutrient for enhancingexport production there. In order for allochthonous DON tobe a quantitatively important source of new N, a substantialfraction of the advected DON must become bioavailable tothe photoautotrophic community within the euphotic zone.Mechanisms that make DON bioavailable to photoautotrophsinclude direct assimilation [Bronk et al., 2007], extracellular
1Rosenstiel School of Marine and Atmospheric Science, University ofMiami, Miami, Florida, USA.
2Now at Earth System Science, University of California, Irvine, California,USA.
3Ecology, Evolution, and Marine Biology, University of California,Santa Barbara, California, USA.
4Atlantic Oceanographic and Meteorological Laboratory, NOAA,Miami, Florida, USA.
Corresponding author: Robert T. Letscher, Earth System Science,University of California, Irvine, California, USA. ([email protected])
©2012. American Geophysical Union. All Rights Reserved.0886-6236/13/2012GB004449
141
GLOBAL BIOGEOCHEMICAL CYCLES, VOL. 27, 141–153, doi:10.1029/2012GB004449, 2013
hydrolysis [Palenik and Morel, 1991], heterotrophic reminera-lization to inorganic N with subsequent uptake [Bronk, 2002],and photo-oxidation to NH4
+ [Bushaw et al., 1996]. Consider-ing these euphotic zone sinks for DON, the annual advectiveflux of bioavailable DON to the North Atlantic subtropical gyreranges from ~0.01 to 0.08molNm-2 yr-1 [Mahaffey et al., 2004;Roussenov et al., 2006; Charria et al., 2008; Torres-Valdéset al., 2009], similar in magnitude to rates of advectivesupply of inorganic nutrients [i.e., nitrate (NO3
- ) [Williamsand Follows, 1998] and N2-fixation [Gruber and Sarmiento,1997; Hansell et al., 2004]. If these rates are accurate, theprocess supplies a significant amount of the N needed toexplain geochemical estimates of export production in thatsystem [Jenkins and Wallace, 1992].[4] An alternative fate for surface ocean DON is vertical
transport (by mixing and/or subduction, hereafter referred toas overturning circulation) to depth (>100m), with subsequentmineralization by mesopelagic heterotrophic bacterioplankton.Abell et al. [2000] reported that DON remineralization alongsubsurface isopycnals, initially ventilated by subduction,explained ~20% of oxygen demand in the upper mesopelagic(100 to 300m). In a study of the biological controls ondissolved organic carbon (DOC) utilization at the Bermuda At-lantic Time-series Study (BATS) site, Carlson et al. [2004]found that the surface accumulated, semilabile DOC poolwas recalcitrant to the surface bacterioplankton community,but available to the bacterioplankton community within the up-per mesopelagic zone (~250m depth). Other studies at theBATS site have found euphotic zone DON to be recalcitrantto microbial utilization throughout the year [Hansell and Carl-son, 2001; Knapp et al., 2005], suggesting that DON mineral-ization is largely restricted to the mesopelagic zone.[5] The upper layer (<200m) of the eastern sectors of sub-
tropical gyres is highly modified by vertical mixing en routeto the gyre interior, being sites of subtropicalmodewater forma-tion [Siedler et al., 1987; Hautala and Roemmich, 1998]. Thephysical dynamics of gyre circulation (including vertical mix-ing), coupledwith preferential utilization of DONby subsurfacebacterioplankton, serves as an additional mechanism for estab-lishing the observed east–west gradients in DON. Assumingthis alternative model is valid, the allochthonous DON supplywould not directly contribute to export production from theeuphotic zone. Thus, quantifying the importance of theseDON loss pathways is relevant for understanding sources ofnew N supporting export production in oligotrophic gyres.[6] In this study we present the global surface ocean
distribution of DON and characterize the spatial gradients.Three mechanisms are proposed to describe DON distributionand its sinks: (1) Net DON production in highly productiveupwelling systems, (2) net DON removal via mineralizationin support of export production from the surface euphoticzone, and (3) DON mineralization upon overturning circula-tion of the water column. Here we employ seawater incubationexperiments to test the relative importance of mechanisms IIversus III. Insights from these experiments are combined withan assessment of the physical dynamics of subtropical gyrecirculation aided by use of a statistical model of the wind-driven Ekman layer, derived from drifting buoy observationsto determine the primary driver of the observed upper oceanDON gradients. We conclude with an assessment of the roleof allochthonous DON supply in the biogeochemistry ofoligotrophic ocean gyres.
2. Methods
2.1. Field Collected Data Sets
[7] We employed observations of DON and other hydro-graphic variables collected on numerous oceanographiccruises as part of the U.S. Global Ocean Carbon and RepeatHydrography program [http://ushydro.ucsd.edu/]. Observationsof DOC and DON were made on full water column CTDcasts at ~60 nautical mile resolution. Sample analyses wereperformed by the Hansell and Carlson labs at the Universityof Miami and University of California, Santa Barbara,respectively. Data were downloaded from CDIAC [http://cdiac.ornl.gov/oceans/RepeatSections/]. Additional observationsof DON were from World Ocean Circulation Experiment(WOCE) lines I08N in 1995, A05 in 1998, U.S. Joint GlobalOcean Flux Study (JGOFS) Arabian Sea Process Cruise #2 in1995, and the NOAA North American Carbon Program(NACP) west coast cruise from 2010. The majority of theoceanographic cruise data was collected during the localsummer and autumn seasons and thus captures environmentalconditions during times of stratification of the surface ocean.Spring sampling was limited to line I08N in the Indian Oceanand line P16N in the Pacific Ocean.
2.2. Incubation Experiments
[8] Incubation experiments were carried out over thecourse of several months in the laboratory using field-collected seawater from the Florida Straits at 27º N 79.5ºW on March 10, 2011 (hereafter, Exp-March) and 27º N79.9º W on December 7, 2011 (hereafter, Exp-Dec). Thesurface waters at this location are stratified year-round andannual mean sea surface chlorophyll a concentrations arelow (<0.1mgm-3) [http://disc.sci.gsfc.nasa.gov/giovanni/]with the deep chlorophyll maximum (DCM) found at ~80 to90m, providing an oligotrophic environment analogous tothe adjacent North Atlantic subtropical gyre. The experimentalobjective was to quantify the remineralization potential of thesurface DON pool given exposure to distinct bacterioplanktoncommunities (surface versus upper mesopelagic). Filtered(0.2mm) surface (10m) seawater was mixed with whole water(unfiltered) inocula from either of 10m or 180m depth (Exp-March); or 10m and 130mdepth (Exp-Dec) to test the availabilityof surface DON to removal by surface versus upper mesopelagicbacterioplankton communities. The dilution culture techniqueclosely follows that used byCarlson et al. [2004], which allowsthe bacterioplankton to be released from grazer pressure,stimulating bacterial growth and substrate utilization.[9] Seawater was collected from Niskin bottles attached to
a CTD (Conductivity, Temperature, Depth) rosette andstored in acid-cleaned 10-liter polycarbonate carboys in thedark at in situ temperatures until incubation initiation onshore (within 12 hours). Eight liters of 10m seawater weregravity filtered through an acid-cleaned Acropak 1000 Supormembrane 0.8/0.2-mm cartridge filter into incubation carboys.The 0.2-mm filtrate was inoculated with 2L of whole water(hereafter, inoculum), which contained the resident microbialcommunities found within either the euphotic or uppermesopelagic zones. For Exp-March, two 10-L carboysreceived the 10m surface water inoculum (hereafter, surface-surface) and 2 carboys received an inoculum from 180mdepth (hereafter, surface-meso). During Exp-Dec, 3 carboysreceived a 10m surface water inoculum (surface-surface),
LETSCHER ET AL.: DISSOLVED ORGANIC NITROGEN IN THE GLOBAL SURFACE OCEAN
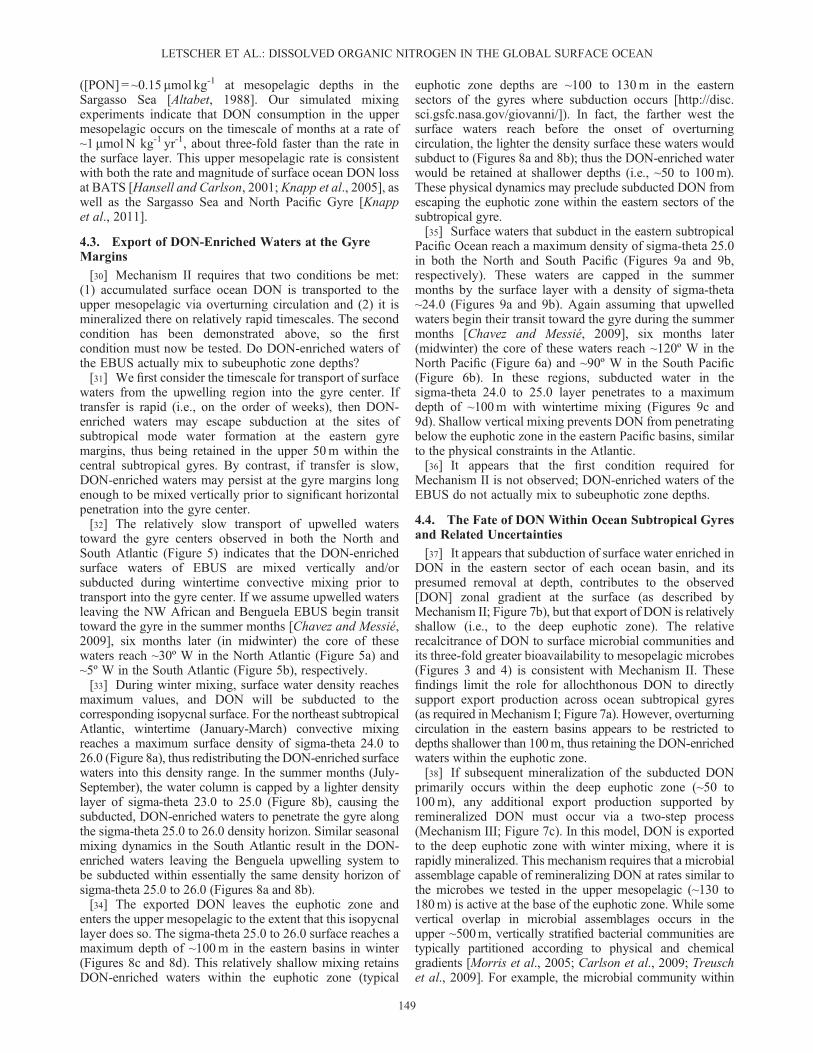
142
whereas 3 carboys received an inoculum from 130m depth(surface-meso). The sampling depth of the mesopelagicbacterioplankton community water targeted the top of thenitracline, where [NO3
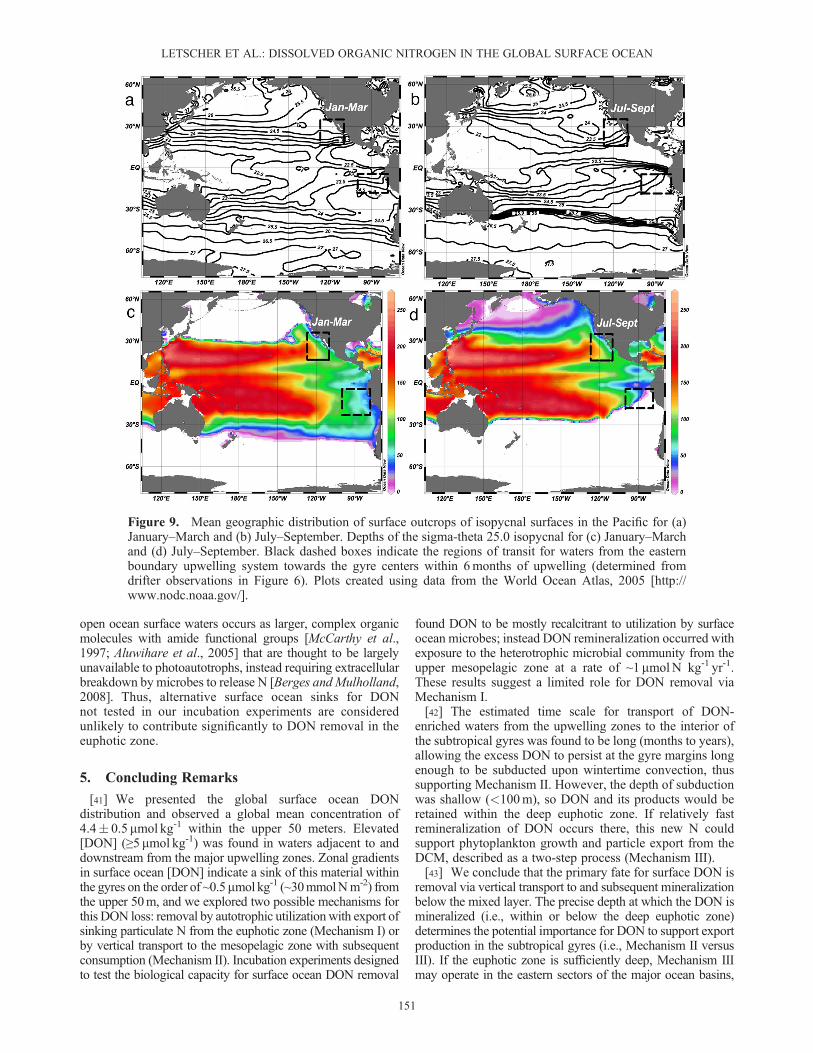
- ] = ~1mmol kg-1 (hereafter referred toas the nitracline) [Cullen and Eppley, 1981] and where organicN remineralization is known to occur [Ward et al., 1989]. Theincubation carboys were well mixed and stored in the dark atroom temperature (21 º C), slightly above the in situ tempera-ture for each inoculum (Exp-March = 19.5 º C; Exp-Dec = 17 ºC). Subsamples of incubation water were collected at >10time points over the course of 90 days (Exp-March) or180 days (Exp-Dec) to monitor for changes in the concentra-tion of DON as well as the products of DON remineralization,i.e., ammonium (NH4
+) and NO3- .
2.3. Sample Collection and Analysis
2.3.1. Sampling[10] Samples from the oceanographic cruises were
filtered for the removal of particulate organic matter(POM) using precombusted Whatman GF/F filters(nominal pore size 0.7 mm) held in acid-cleaned poly-carbonate filter holders. Filter holders were connectedin line with the CTD-Niskin bottle using acid-cleanedsilicon tubing. Seawater was collected into acid-cleanedand preconditioned (with seawater) 60 mL HDPE bottlesand immediately frozen upright at -20 º C. Inocula for theincubation experiments were collected unfiltered to mini-mize contamination and to include the resident bacterio-plankton population.2.3.2. DOC and TDN concentration[11] DOC and total dissolved nitrogen (TDN) were
analyzed by high temperature combustion (HTC) using aShimadzu (Durham, NC) TOC-VCSH system coupled witha Shimadzu Total N analyzer [Dickson et al., 2007]. The Noxidation product nitric oxide (NO) is quantified by reac-tion with ozone and detection of the resulting chemilumi-nescence. Standardization was achieved using potassiumnitrate for TDN and potassium hydrogen phthalate forDOC. Deep seawater and low carbon (C) reference watersas provided by the Hansell CRM Program [Hansell,2005] were measured every sixth analysis to assess day-to-day and instrument-to-instrument variability. The preci-sion for TDN analyses is ~0.5 mmol kg-1 or a CV of 5% to10%. The precision for DOC analyses is ~1 mmol kg-1or aCV of 2% to 3%. TDN measurements for WOCE linesA05 + I08N and U.S. JGOFS Arabian Sea Process Cruise#2 were performed by the UV-oxidation method [Walsh,1989]. Measurements of TDN along WOCE line P18 usingthe UV method [Hansell and Waterhouse, 1997] weretypically ~10% higher than those from the more recentCLIVAR occupation of the line using the HTC method(both cruises were analyzed by Hansell laboratory, Universityof Miami).2.3.3. NO3
- +NO2- concentration
[12] Nutrient analyses for the cruise transects were carriedout at sea by standard colorimetric methods; these data weretaken from the CDIAC and JGOFS websites [http://www1.whoi.edu/]. For samples collected during the incubations,water was collected in duplicate at each time point andstored frozen at -20 º C until subsequent analysis. The sumof [NO3
- + nitrite (NO2- )] (hereafter, [NO3
- ]) was measured
by reduction to NO using a solution containing heated,acidic V (III), followed by chemiluminescent detection of NO[Braman and Hendrix, 1989]. Standardization was achievedusing potassium nitrate. Samples were analyzed in a configura-tion yielding a limit of detection of 0.03mmol kg-1 with aprecision of� 0.025mmol kg-1 when [NO3
- ] <0.1mmol kg-1
or a limit of detection of 0.1mmol kg-1 with a precision of0.05mmol kg-1 when [NO3
- ] >0.1mmol kg-1.2.3.4. NH4
+concentration[13] The concentration of NH4
+ in incubation samples wasperformed on duplicate samples collected at each time pointand measured the same day using a fluorescence techniquewith orthophthaldialdehyde (OPA) [Holmes et al., 1999].Samples reacted for two hours at room temperature with anOPA-containing solution, with subsequent measurement offluorescence at an excitation/emission of 350 nm/410-600 nm(Turner Designs Model 7200–000). Standardization wasachieved using ammonium chloride. The limit of detectionwas 0.025mmol kg-1 with a precision of� 0.01mmol kg-1.2.3.5. DON concentration[14] The concentration of DON ([DON]) was calculated
by subtracting the sum of dissolved inorganic nitrogen([DIN] = [NO3
- +NO2- ] + [NH4
+]) from the measured [TDN];[DON] = [TDN] – [DIN]. Propagation of error yields aprecision on [DON] measurements of� 0.5 mmol kg-1 or acoefficient of variation (CV) of ~10%. Measurements of[NH4
+] were not performed on the global surface ocean [DON]dataset, as open ocean [NH4
+] are typically <0.1mmol kg-1
[Lipschultz, 2001].2.3.6. Bacterioplankton cell C[15] Samples for the enumeration of cell abundance were
collected at each time point of the incubation experimentsand fixed with particle-free 25% glutaraldehyde (Exp-March)or 10% formalin (Exp-Dec) to a final concentration of 1.0%and stored at 4 ºC until preparation. Cells were filtered ontoIrgalan black-stained 0.2-mm polycarbonate filters; sampleswere stained with 40–60-diamidino-2-phenylidole (DAPI)[Porter and Feig, 1980] and enumerated with a Nikon EclipseE400 epifluorescence microscope (1000x). The slope of theregression of cell abundance from the initial time point untilthe end of the log-phase growth was used to assess whethercell production was significant (P <0.05). Bacterioplanktoncell C was calculated from cell abundance using a Cconversion factor typical for oceanic bacterial assemblagesof 12.4 fg C cell-1 [Fukuda et al., 1998].
2.4. Statistical Model of Simulated Upper OceanTracer Advection
[16] In assessing the timescale of upwelled waters to reachthe central gyres, we employed a statistical model of upperocean tracer advection for waters circulating in the wind-driven Ekman layer (upper 50m). The simulation is basedupon probability distribution functions derived from thetrajectories of more than 15,000 satellite-tracked driftingbuoys of the Global Drifter Program drogued at 15 meters[Niiler, 2001], which reveal the combination of geostrophicand Ekman flow. For each simulation, a tracer is released ata point and integrated forward at one half of one degreeresolution for 730 days at 5-day time steps following thedescription in Maximenko et al. [2012] and Lumpkin et al.[2012]. The initial release locations were chosen to be thesurface waters located at the most equatorward extent of
LETSCHER ET AL.: DISSOLVED ORGANIC NITROGEN IN THE GLOBAL SURFACE OCEAN
143
each of the four largest eastern boundary upwelling systems(EBUS), i.e., the northwest African, Benguela, Peru, andwestern North American upwelling systems.
3. Results
3.1. Surface Ocean DON Distributions
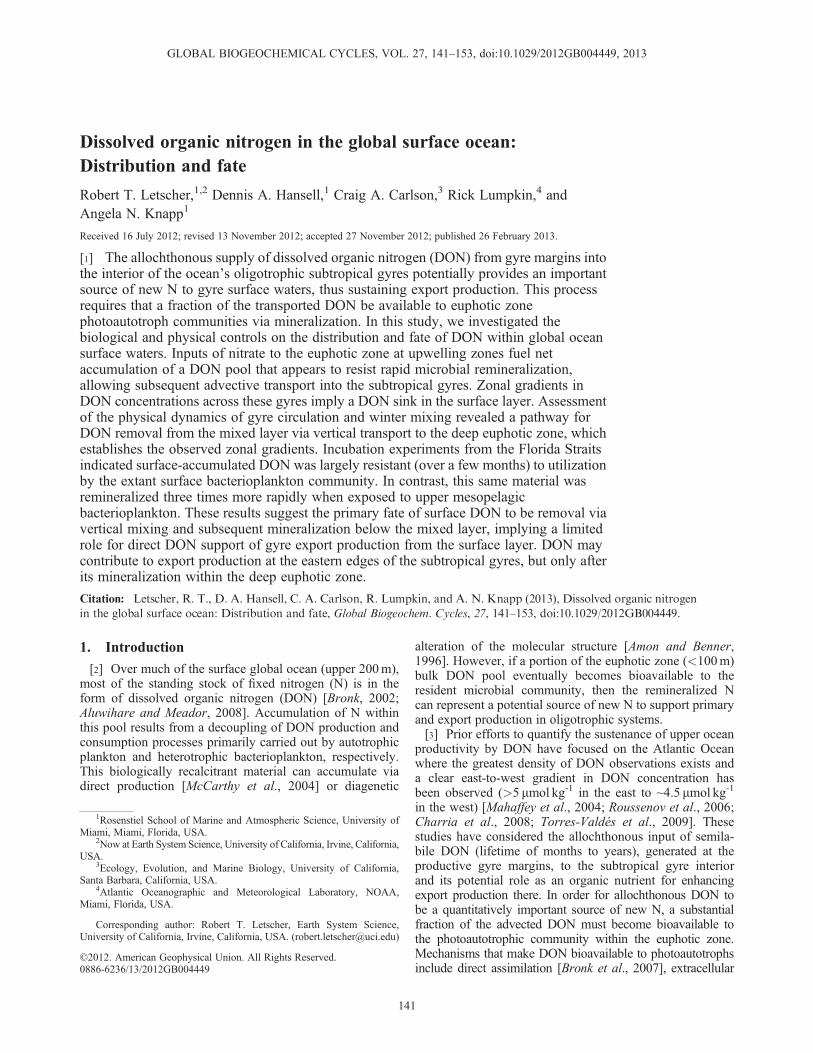
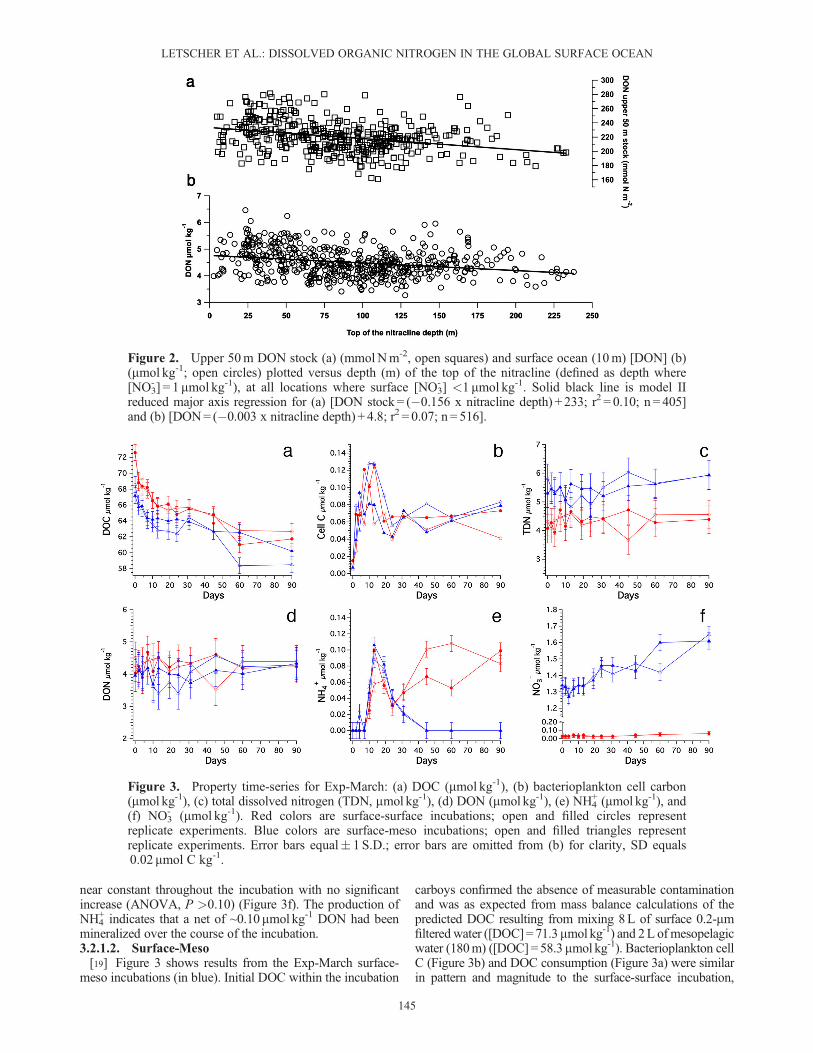
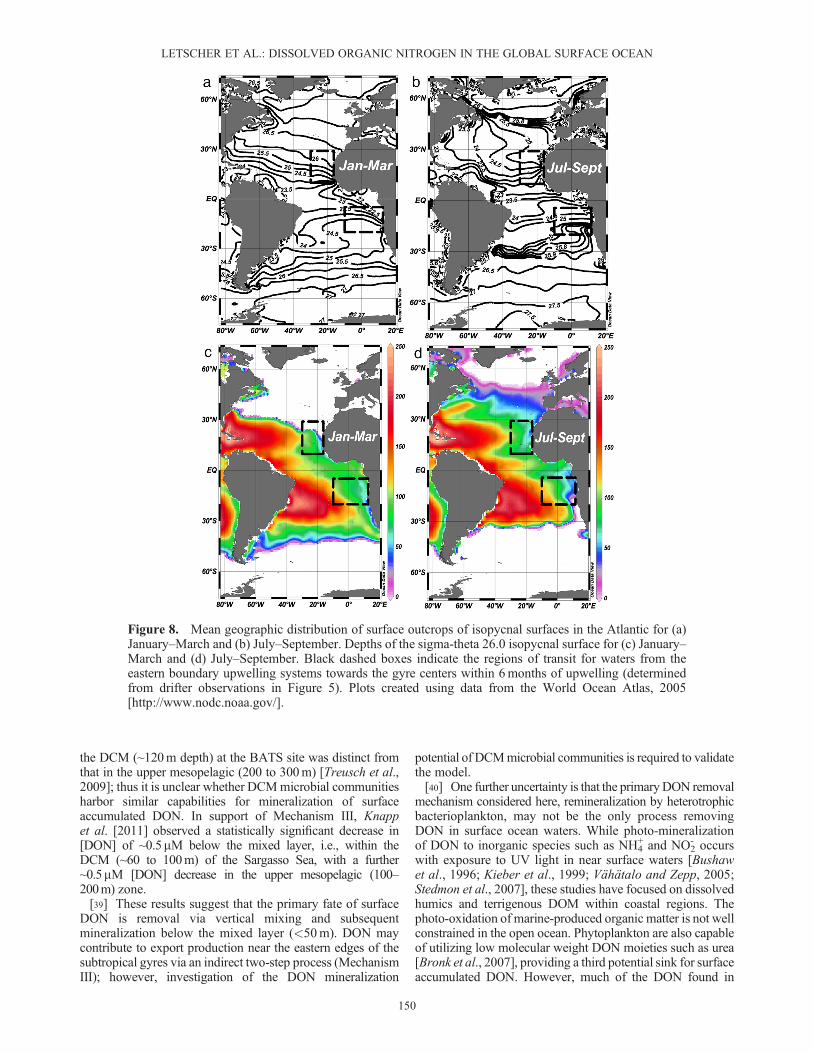
[17] The surface ocean (10m) distribution of DON ispresented in Figure 1. Values ranged from 2 to 7 mmol kg-1
(with a mean for all observations of 4.4� 0.5 mmol kg-1);however, 75% of all observations fell within the narrowrange of 3.8 to 4.8 mmol kg-1 (indicated by the green colorsin Figure 1). Regions exhibiting [DON] ≥5mmol kg-1 werecommonly adjacent to or immediately downstream fromeastern boundary and equatorial upwelling zones (as wellas the monsoon-driven upwelling system of the ArabianSea), indicating a source of DON within these systems.Lower DON poleward and westward of these upwellingsystems is assumed to reflect a sink for DON within theocean’s subtropical gyres. Concentrations of DON werehighly variable within the Southern Ocean due, at least in part,to the large analytical uncertainty in samples containingelevated [NO3
- ] [Hansell, 1993]. In general, calculation ofDON resulted in a CV >25% at [NO3
- ] >6mmol kg-1. Wheresurface [NO3
- ] was<1mmol kg-1, DON at 10m plotted againstthe depth of the top of the nitracline demonstrates an inverserelationship (Figure 2b). The y-axis intercept approaches4.8mmol kg-1 and corresponds to locations with very shallownitraclines, whereas DON is ~4.3mmol kg-1 where thenitracline is deepest over the subtropical gyres. A plot of thestock of DON in the upper 50m versus the depth of the topof the nitracline (Figure 2a) exhibits a similar gradient from~230mmolN m-2 at locations with shallow nitraclines,decreasing to ~200mmolN m-2 at locations with deepnitraclines over the subtropical gyres.
3.2. Incubation Experiments
3.2.1. Exp-March
3.2.1.1. Surface-Surface[18] Results for the surface-surface incubations from Exp-
March are shown in Figure 3 (red). Both DOC andbacterioplankton cell C were monitored to assure (1) nomeasurable DOM contamination in our experimental setupand (2) active bacterioplankton growth during the incubations.There was no evidence of contamination by extraneousorganic matter; initial DOC within the surface-surface incuba-tion carboys was consistent with mass balance calculations ofthe DOC resulting from the mixing of surface whole water([DOC]= 77.7mmol kg-1) and surface 0.2-mm filtered water([DOC]= 71.3mmol kg-1) (data not shown). Bacterioplanktongrowth was observed, reaching stationary phase after four toseven days and resulting in a ~ ten-fold accumulation ofcell carbon (Figure 3b). Bacterioplankton growth wassupported by a measured consumption of DOC (Figure 3a),showing an average of replicate incubations (� 1 S.D.),ΔDOC=10.4� 0.7mmol kg-1 over the 90-day incubation.TDN averaged (� 1S.D.) 4.4� 0.3mmol kg-1 and remainedconstant within analytical uncertainty throughout the incuba-tion (Figure 3c), indicating conservation of mass for N withinthe incubation water. Changes in DON were not observedwithin the ~0.5mmol kg-1 analytical uncertainty, with thetime-course concentration averaging 4.3� 0.5mmol kg-1
(Figure 3d). This large uncertainty precludes detection ofsmall changes within the DON pool by measurements of[DON] alone. However, by measuring the products of DONremineralization, NH4
+ and NO3- , which have orders of
magnitude lower analytical uncertainty, rates of net DONremineralization can be derived. [NH4
+] increased to a maxi-mum of ~0.1mmol kg-1 after two weeks, then cycledbetween ~0.04 and 0.10mmol kg-1 over the remainder of theincubation (Figure 3e). [NO3
- ] was low (≤0.06mmol kg-1) and
Figure 1. Distribution of [DON] (mmol kg-1; colored dots) at 10m in the global ocean. Isolines indicateannual mean surface ocean (10m) [NO3
- ] (mmol kg-1), using gridded data of the World Ocean Atlas, 2005[http://www.nodc.noaa.gov/]. Atlantic Ocean lines: A13.5 = ~0º E, A16 = ~25º W, A20 = ~52º W,A22 = 66º W, A05 = 24.5º N; Pacific Ocean lines: P18 = ~103º W, P16 = ~150º W, NOAA NACP westcoast = ~120ºW, P02 = ~30º N; Indian Ocean lines: I08S-I09N =~95º E, I08N= ~80º E, I06S = ~30º E,SR03 = ~145º E, I05 = ~34º S, JGOFS Arabian Sea Process Cruise #2 = ~15º N 65º E. Plotting done withOcean Data View [Schlitzer, 2012].
LETSCHER ET AL.: DISSOLVED ORGANIC NITROGEN IN THE GLOBAL SURFACE OCEAN
144
near constant throughout the incubation with no significantincrease (ANOVA, P >0.10) (Figure 3f). The production ofNH4
+ indicates that a net of ~0.10mmol kg-1 DON had beenmineralized over the course of the incubation.3.2.1.2. Surface-Meso[19] Figure 3 shows results from the Exp-March surface-
meso incubations (in blue). Initial DOC within the incubation
carboys confirmed the absence of measurable contaminationand was as expected from mass balance calculations of thepredicted DOC resulting from mixing 8L of surface 0.2-mmfiltered water ([DOC]=71.3mmol kg-1) and 2L of mesopelagicwater (180m) ([DOC]=58.3mmol kg-1). Bacterioplankton cellC (Figure 3b) and DOC consumption (Figure 3a) were similarin pattern and magnitude to the surface-surface incubation,
Figure 2. Upper 50m DON stock (a) (mmolNm-2, open squares) and surface ocean (10m) [DON] (b)(mmol kg-1; open circles) plotted versus depth (m) of the top of the nitracline (defined as depth where[NO3
- ] = 1mmol kg-1), at all locations where surface [NO3- ] <1 mmol kg-1. Solid black line is model II
reduced major axis regression for (a) [DON stock= (�0.156 x nitracline depth) + 233; r2 = 0.10; n = 405]and (b) [DON= (�0.003 x nitracline depth) + 4.8; r2 = 0.07; n = 516].
Figure 3. Property time-series for Exp-March: (a) DOC (mmol kg-1), (b) bacterioplankton cell carbon(mmol kg-1), (c) total dissolved nitrogen (TDN, mmol kg-1), (d) DON (mmol kg-1), (e) NH4
+ (mmol kg-1), and(f) NO3
- (mmol kg-1). Red colors are surface-surface incubations; open and filled circles representreplicate experiments. Blue colors are surface-meso incubations; open and filled triangles representreplicate experiments. Error bars equal� 1 S.D.; error bars are omitted from (b) for clarity, SD equals0.02mmol C kg-1.
LETSCHER ET AL.: DISSOLVED ORGANIC NITROGEN IN THE GLOBAL SURFACE OCEAN
145
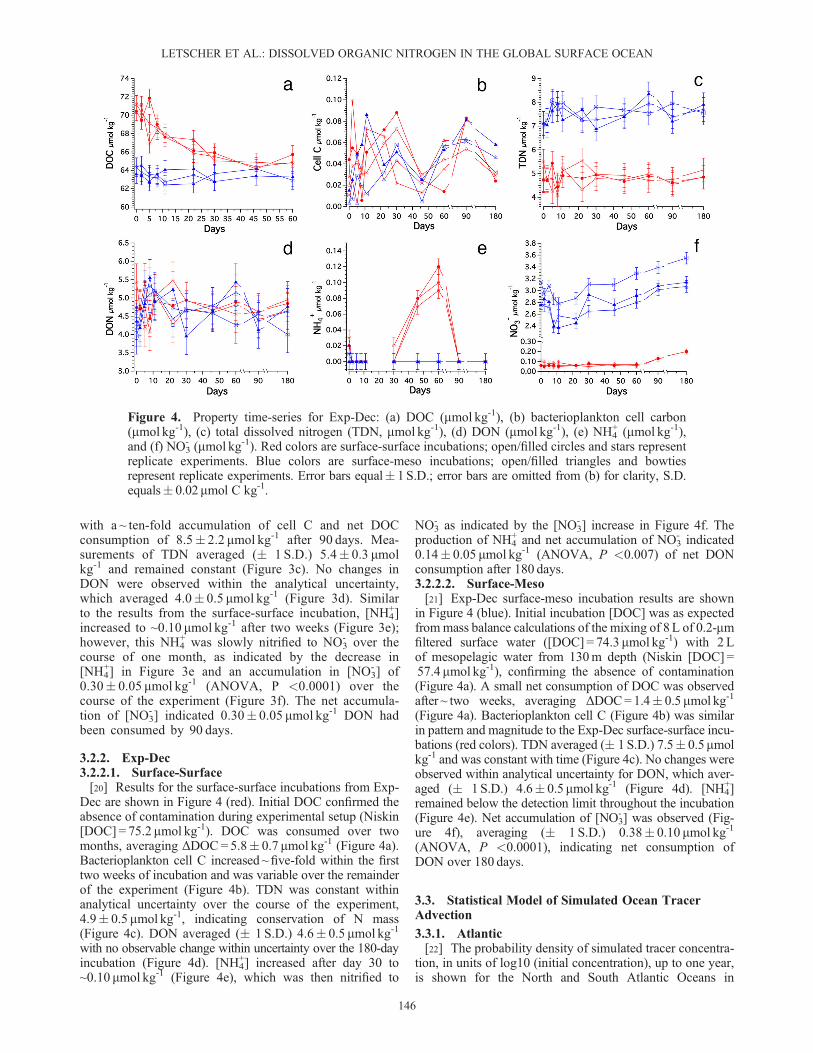
with a ~ ten-fold accumulation of cell C and net DOCconsumption of 8.5� 2.2 mmol kg-1 after 90 days. Mea-surements of TDN averaged (� 1 S.D.) 5.4� 0.3 mmolkg-1 and remained constant (Figure 3c). No changes inDON were observed within the analytical uncertainty,which averaged 4.0� 0.5 mmol kg-1 (Figure 3d). Similarto the results from the surface-surface incubation, [NH4
+]increased to ~0.10 mmol kg-1 after two weeks (Figure 3e);however, this NH4
+ was slowly nitrified to NO3- over the
course of one month, as indicated by the decrease in[NH4
+] in Figure 3e and an accumulation in [NO3- ] of
0.30� 0.05 mmol kg-1 (ANOVA, P <0.0001) over thecourse of the experiment (Figure 3f). The net accumula-tion of [NO3
- ] indicated 0.30� 0.05 mmol kg-1 DON hadbeen consumed by 90 days.
3.2.2. Exp-Dec3.2.2.1. Surface-Surface[20] Results for the surface-surface incubations from Exp-
Dec are shown in Figure 4 (red). Initial DOC confirmed theabsence of contamination during experimental setup (Niskin[DOC] = 75.2 mmol kg-1). DOC was consumed over twomonths, averaging ΔDOC= 5.8� 0.7 mmol kg-1 (Figure 4a).Bacterioplankton cell C increased ~five-fold within the firsttwo weeks of incubation and was variable over the remainderof the experiment (Figure 4b). TDN was constant withinanalytical uncertainty over the course of the experiment,4.9� 0.5 mmol kg-1, indicating conservation of N mass(Figure 4c). DON averaged (� 1 S.D.) 4.6� 0.5 mmol kg-1
with no observable change within uncertainty over the 180-dayincubation (Figure 4d). [NH4
+] increased after day 30 to~0.10 mmol kg-1 (Figure 4e), which was then nitrified to
NO3- as indicated by the [NO3
- ] increase in Figure 4f. Theproduction of NH4
+ and net accumulation of NO3- indicated
0.14� 0.05 mmol kg-1 (ANOVA, P <0.007) of net DONconsumption after 180 days.3.2.2.2. Surface-Meso[21] Exp-Dec surface-meso incubation results are shown
in Figure 4 (blue). Initial incubation [DOC] was as expectedfrommass balance calculations of the mixing of 8L of 0.2-mmfiltered surface water ([DOC] = 74.3 mmol kg-1) with 2 Lof mesopelagic water from 130m depth (Niskin [DOC] =57.4 mmol kg-1), confirming the absence of contamination(Figure 4a). A small net consumption of DOC was observedafter ~ two weeks, averaging ΔDOC=1.4� 0.5mmol kg-1
(Figure 4a). Bacterioplankton cell C (Figure 4b) was similarin pattern and magnitude to the Exp-Dec surface-surface incu-bations (red colors). TDN averaged (� 1 S.D.) 7.5� 0.5mmolkg-1 and was constant with time (Figure 4c). No changes wereobserved within analytical uncertainty for DON, which aver-aged (� 1S.D.) 4.6� 0.5mmol kg-1 (Figure 4d). [NH4
+]remained below the detection limit throughout the incubation(Figure 4e). Net accumulation of [NO3
- ] was observed (Fig-ure 4f), averaging (� 1 S.D.) 0.38� 0.10 mmol kg-1
(ANOVA, P <0.0001), indicating net consumption ofDON over 180 days.
3.3. Statistical Model of Simulated Ocean TracerAdvection
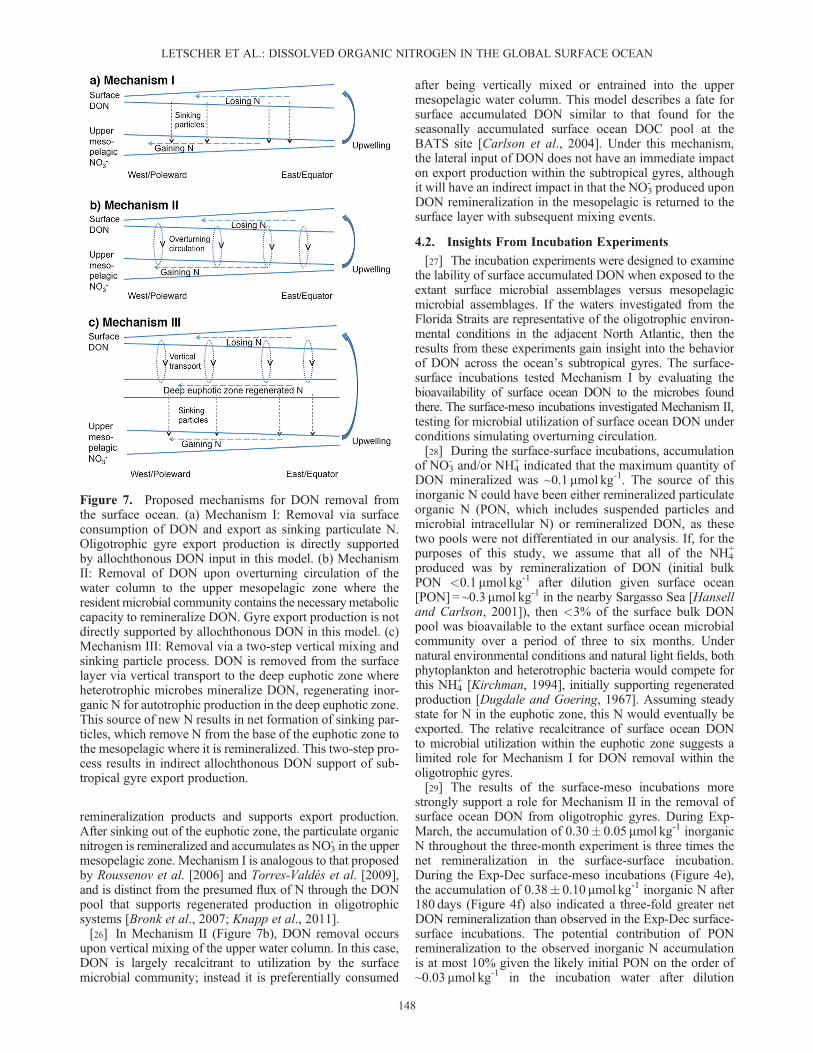
3.3.1. Atlantic[22] The probability density of simulated tracer concentra-
tion, in units of log10 (initial concentration), up to one year,is shown for the North and South Atlantic Oceans in
Figure 4. Property time-series for Exp-Dec: (a) DOC (mmol kg-1), (b) bacterioplankton cell carbon(mmol kg-1), (c) total dissolved nitrogen (TDN, mmol kg-1), (d) DON (mmol kg-1), (e) NH4
+ (mmol kg-1),and (f) NO3
- (mmol kg-1). Red colors are surface-surface incubations; open/filled circles and stars representreplicate experiments. Blue colors are surface-meso incubations; open/filled triangles and bowtiesrepresent replicate experiments. Error bars equal� 1S.D.; error bars are omitted from (b) for clarity, S.D.equals� 0.02mmol C kg-1.
LETSCHER ET AL.: DISSOLVED ORGANIC NITROGEN IN THE GLOBAL SURFACE OCEAN
146
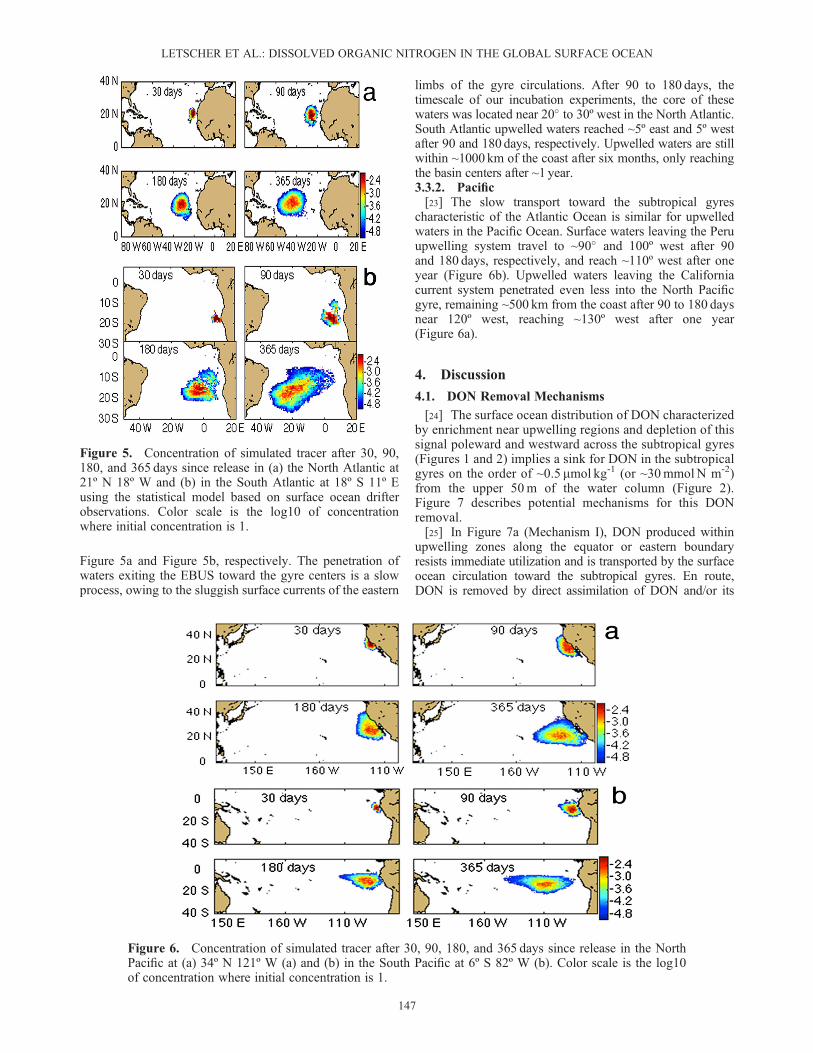
Figure 5a and Figure 5b, respectively. The penetration ofwaters exiting the EBUS toward the gyre centers is a slowprocess, owing to the sluggish surface currents of the eastern
limbs of the gyre circulations. After 90 to 180 days, thetimescale of our incubation experiments, the core of thesewaters was located near 20� to 30º west in the North Atlantic.South Atlantic upwelled waters reached ~5º east and 5º westafter 90 and 180 days, respectively. Upwelled waters are stillwithin ~1000 km of the coast after six months, only reachingthe basin centers after ~1 year.3.3.2. Pacific[23] The slow transport toward the subtropical gyres
characteristic of the Atlantic Ocean is similar for upwelledwaters in the Pacific Ocean. Surface waters leaving the Peruupwelling system travel to ~90� and 100º west after 90and 180 days, respectively, and reach ~110º west after oneyear (Figure 6b). Upwelled waters leaving the Californiacurrent system penetrated even less into the North Pacificgyre, remaining ~500 km from the coast after 90 to 180 daysnear 120º west, reaching ~130º west after one year(Figure 6a).
4. Discussion
4.1. DON Removal Mechanisms
[24] The surface ocean distribution of DON characterizedby enrichment near upwelling regions and depletion of thissignal poleward and westward across the subtropical gyres(Figures 1 and 2) implies a sink for DON in the subtropicalgyres on the order of ~0.5 mmol kg-1 (or ~30mmolN m-2)from the upper 50m of the water column (Figure 2).Figure 7 describes potential mechanisms for this DONremoval.[25] In Figure 7a (Mechanism I), DON produced within
upwelling zones along the equator or eastern boundaryresists immediate utilization and is transported by the surfaceocean circulation toward the subtropical gyres. En route,DON is removed by direct assimilation of DON and/or its
Figure 5. Concentration of simulated tracer after 30, 90,180, and 365 days since release in (a) the North Atlantic at21º N 18º W and (b) in the South Atlantic at 18º S 11º Eusing the statistical model based on surface ocean drifterobservations. Color scale is the log10 of concentrationwhere initial concentration is 1.
Figure 6. Concentration of simulated tracer after 30, 90, 180, and 365 days since release in the NorthPacific at (a) 34º N 121º W (a) and (b) in the South Pacific at 6º S 82º W (b). Color scale is the log10of concentration where initial concentration is 1.
LETSCHER ET AL.: DISSOLVED ORGANIC NITROGEN IN THE GLOBAL SURFACE OCEAN
147
remineralization products and supports export production.After sinking out of the euphotic zone, the particulate organicnitrogen is remineralized and accumulates as NO3
- in the uppermesopelagic zone. Mechanism I is analogous to that proposedby Roussenov et al. [2006] and Torres-Valdés et al. [2009],and is distinct from the presumed flux of N through the DONpool that supports regenerated production in oligotrophicsystems [Bronk et al., 2007; Knapp et al., 2011].[26] In Mechanism II (Figure 7b), DON removal occurs
upon vertical mixing of the upper water column. In this case,DON is largely recalcitrant to utilization by the surfacemicrobial community; instead it is preferentially consumed
after being vertically mixed or entrained into the uppermesopelagic water column. This model describes a fate forsurface accumulated DON similar to that found for theseasonally accumulated surface ocean DOC pool at theBATS site [Carlson et al., 2004]. Under this mechanism,the lateral input of DON does not have an immediate impacton export production within the subtropical gyres, althoughit will have an indirect impact in that the NO3
- produced uponDON remineralization in the mesopelagic is returned to thesurface layer with subsequent mixing events.
4.2. Insights From Incubation Experiments
[27] The incubation experiments were designed to examinethe lability of surface accumulated DON when exposed to theextant surface microbial assemblages versus mesopelagicmicrobial assemblages. If the waters investigated from theFlorida Straits are representative of the oligotrophic environ-mental conditions in the adjacent North Atlantic, then theresults from these experiments gain insight into the behaviorof DON across the ocean’s subtropical gyres. The surface-surface incubations tested Mechanism I by evaluating thebioavailability of surface ocean DON to the microbes foundthere. The surface-meso incubations investigated Mechanism II,testing for microbial utilization of surface ocean DON underconditions simulating overturning circulation.[28] During the surface-surface incubations, accumulation
of NO3- and/or NH4
+ indicated that the maximum quantity ofDON mineralized was ~0.1 mmol kg-1. The source of thisinorganic N could have been either remineralized particulateorganic N (PON, which includes suspended particles andmicrobial intracellular N) or remineralized DON, as thesetwo pools were not differentiated in our analysis. If, for thepurposes of this study, we assume that all of the NH4
+
produced was by remineralization of DON (initial bulkPON <0.1 mmol kg-1 after dilution given surface ocean[PON] = ~0.3 mmol kg-1 in the nearby Sargasso Sea [Hanselland Carlson, 2001]), then <3% of the surface bulk DONpool was bioavailable to the extant surface ocean microbialcommunity over a period of three to six months. Undernatural environmental conditions and natural light fields, bothphytoplankton and heterotrophic bacteria would compete forthis NH4
+ [Kirchman, 1994], initially supporting regeneratedproduction [Dugdale and Goering, 1967]. Assuming steadystate for N in the euphotic zone, this N would eventually beexported. The relative recalcitrance of surface ocean DONto microbial utilization within the euphotic zone suggests alimited role for Mechanism I for DON removal within theoligotrophic gyres.[29] The results of the surface-meso incubations more
strongly support a role for Mechanism II in the removal ofsurface ocean DON from oligotrophic gyres. During Exp-March, the accumulation of 0.30� 0.05 mmol kg-1 inorganicN throughout the three-month experiment is three times thenet remineralization in the surface-surface incubation.During the Exp-Dec surface-meso incubations (Figure 4e),the accumulation of 0.38� 0.10 mmol kg-1 inorganic N after180 days (Figure 4f) also indicated a three-fold greater netDON remineralization than observed in the Exp-Dec surface-surface incubations. The potential contribution of PONremineralization to the observed inorganic N accumulationis at most 10% given the likely initial PON on the order of~0.03 mmol kg-1 in the incubation water after dilution
Figure 7. Proposed mechanisms for DON removal fromthe surface ocean. (a) Mechanism I: Removal via surfaceconsumption of DON and export as sinking particulate N.Oligotrophic gyre export production is directly supportedby allochthonous DON input in this model. (b) MechanismII: Removal of DON upon overturning circulation of thewater column to the upper mesopelagic zone where theresident microbial community contains the necessarymetaboliccapacity to remineralize DON. Gyre export production is notdirectly supported by allochthonous DON in this model. (c)Mechanism III: Removal via a two-step vertical mixing andsinking particle process. DON is removed from the surfacelayer via vertical transport to the deep euphotic zone whereheterotrophic microbes mineralize DON, regenerating inor-ganic N for autotrophic production in the deep euphotic zone.This source of new N results in net formation of sinking par-ticles, which remove N from the base of the euphotic zone tothe mesopelagic where it is remineralized. This two-step pro-cess results in indirect allochthonous DON support of sub-tropical gyre export production.
LETSCHER ET AL.: DISSOLVED ORGANIC NITROGEN IN THE GLOBAL SURFACE OCEAN
148
([PON] = ~0.15 mmol kg-1 at mesopelagic depths in theSargasso Sea [Altabet, 1988]. Our simulated mixingexperiments indicate that DON consumption in the uppermesopelagic occurs on the timescale of months at a rate of~1 mmolN kg-1 yr-1, about three-fold faster than the rate inthe surface layer. This upper mesopelagic rate is consistentwith both the rate and magnitude of surface ocean DON lossat BATS [Hansell and Carlson, 2001; Knapp et al., 2005], aswell as the Sargasso Sea and North Pacific Gyre [Knappet al., 2011].
4.3. Export of DON-Enriched Waters at the GyreMargins
[30] Mechanism II requires that two conditions be met:(1) accumulated surface ocean DON is transported to theupper mesopelagic via overturning circulation and (2) it ismineralized there on relatively rapid timescales. The secondcondition has been demonstrated above, so the firstcondition must now be tested. Do DON-enriched waters ofthe EBUS actually mix to subeuphotic zone depths?[31] We first consider the timescale for transport of surface
waters from the upwelling region into the gyre center. Iftransfer is rapid (i.e., on the order of weeks), then DON-enriched waters may escape subduction at the sites ofsubtropical mode water formation at the eastern gyremargins, thus being retained in the upper 50m within thecentral subtropical gyres. By contrast, if transfer is slow,DON-enriched waters may persist at the gyre margins longenough to be mixed vertically prior to significant horizontalpenetration into the gyre center.[32] The relatively slow transport of upwelled waters
toward the gyre centers observed in both the North andSouth Atlantic (Figure 5) indicates that the DON-enrichedsurface waters of EBUS are mixed vertically and/orsubducted during wintertime convective mixing prior totransport into the gyre center. If we assume upwelled watersleaving the NW African and Benguela EBUS begin transittoward the gyre in the summer months [Chavez and Messié,2009], six months later (in midwinter) the core of thesewaters reach ~30º W in the North Atlantic (Figure 5a) and~5º W in the South Atlantic (Figure 5b), respectively.[33] During winter mixing, surface water density reaches
maximum values, and DON will be subducted to thecorresponding isopycnal surface. For the northeast subtropicalAtlantic, wintertime (January-March) convective mixingreaches a maximum surface density of sigma-theta 24.0 to26.0 (Figure 8a), thus redistributing the DON-enriched surfacewaters into this density range. In the summer months (July-September), the water column is capped by a lighter densitylayer of sigma-theta 23.0 to 25.0 (Figure 8b), causing thesubducted, DON-enriched waters to penetrate the gyre alongthe sigma-theta 25.0 to 26.0 density horizon. Similar seasonalmixing dynamics in the South Atlantic result in the DON-enriched waters leaving the Benguela upwelling system tobe subducted within essentially the same density horizon ofsigma-theta 25.0 to 26.0 (Figures 8a and 8b).[34] The exported DON leaves the euphotic zone and
enters the upper mesopelagic to the extent that this isopycnallayer does so. The sigma-theta 25.0 to 26.0 surface reaches amaximum depth of ~100m in the eastern basins in winter(Figures 8c and 8d). This relatively shallow mixing retainsDON-enriched waters within the euphotic zone (typical
euphotic zone depths are ~100 to 130m in the easternsectors of the gyres where subduction occurs [http://disc.sci.gsfc.nasa.gov/giovanni/]). In fact, the farther west thesurface waters reach before the onset of overturningcirculation, the lighter the density surface these waters wouldsubduct to (Figures 8a and 8b); thus the DON-enriched waterwould be retained at shallower depths (i.e., ~50 to 100m).These physical dynamics may preclude subducted DON fromescaping the euphotic zone within the eastern sectors of thesubtropical gyre.[35] Surface waters that subduct in the eastern subtropical
Pacific Ocean reach a maximum density of sigma-theta 25.0in both the North and South Pacific (Figures 9a and 9b,respectively). These waters are capped in the summermonths by the surface layer with a density of sigma-theta~24.0 (Figures 9a and 9b). Again assuming that upwelledwaters begin their transit toward the gyre during the summermonths [Chavez and Messié, 2009], six months later(midwinter) the core of these waters reach ~120º W in theNorth Pacific (Figure 6a) and ~90º W in the South Pacific(Figure 6b). In these regions, subducted water in thesigma-theta 24.0 to 25.0 layer penetrates to a maximumdepth of ~100m with wintertime mixing (Figures 9c and9d). Shallow vertical mixing prevents DON from penetratingbelow the euphotic zone in the eastern Pacific basins, similarto the physical constraints in the Atlantic.[36] It appears that the first condition required for
Mechanism II is not observed; DON-enriched waters of theEBUS do not actually mix to subeuphotic zone depths.
4.4. The Fate of DON Within Ocean Subtropical Gyresand Related Uncertainties
[37] It appears that subduction of surface water enriched inDON in the eastern sector of each ocean basin, and itspresumed removal at depth, contributes to the observed[DON] zonal gradient at the surface (as described byMechanism II; Figure 7b), but that export of DON is relativelyshallow (i.e., to the deep euphotic zone). The relativerecalcitrance of DON to surface microbial communities andits three-fold greater bioavailability to mesopelagic microbes(Figures 3 and 4) is consistent with Mechanism II. Thesefindings limit the role for allochthonous DON to directlysupport export production across ocean subtropical gyres(as required in Mechanism I; Figure 7a). However, overturningcirculation in the eastern basins appears to be restricted todepths shallower than 100m, thus retaining the DON-enrichedwaters within the euphotic zone.[38] If subsequent mineralization of the subducted DON
primarily occurs within the deep euphotic zone (~50 to100m), any additional export production supported byremineralized DON must occur via a two-step process(Mechanism III; Figure 7c). In this model, DON is exportedto the deep euphotic zone with winter mixing, where it israpidly mineralized. This mechanism requires that a microbialassemblage capable of remineralizing DON at rates similar tothe microbes we tested in the upper mesopelagic (~130 to180m) is active at the base of the euphotic zone. While somevertical overlap in microbial assemblages occurs in theupper ~500m, vertically stratified bacterial communities aretypically partitioned according to physical and chemicalgradients [Morris et al., 2005; Carlson et al., 2009; Treuschet al., 2009]. For example, the microbial community within
LETSCHER ET AL.: DISSOLVED ORGANIC NITROGEN IN THE GLOBAL SURFACE OCEAN
149
the DCM (~120m depth) at the BATS site was distinct fromthat in the upper mesopelagic (200 to 300m) [Treusch et al.,2009]; thus it is unclear whether DCMmicrobial communitiesharbor similar capabilities for mineralization of surfaceaccumulated DON. In support of Mechanism III, Knappet al. [2011] observed a statistically significant decrease in[DON] of ~0.5mM below the mixed layer, i.e., within theDCM (~60 to 100m) of the Sargasso Sea, with a further~0.5mM [DON] decrease in the upper mesopelagic (100–200m) zone.[39] These results suggest that the primary fate of surface
DON is removal via vertical mixing and subsequentmineralization below the mixed layer (<50m). DON maycontribute to export production near the eastern edges of thesubtropical gyres via an indirect two-step process (MechanismIII); however, investigation of the DON mineralization
potential of DCMmicrobial communities is required to validatethe model.[40] One further uncertainty is that the primaryDON removal
mechanism considered here, remineralization by heterotrophicbacterioplankton, may not be the only process removingDON in surface ocean waters. While photo-mineralizationof DON to inorganic species such as NH4
+ and NO2- occurs
with exposure to UV light in near surface waters [Bushawet al., 1996; Kieber et al., 1999; Vähätalo and Zepp, 2005;Stedmon et al., 2007], these studies have focused on dissolvedhumics and terrigenous DOM within coastal regions. Thephoto-oxidation of marine-produced organic matter is not wellconstrained in the open ocean. Phytoplankton are also capableof utilizing low molecular weight DON moieties such as urea[Bronk et al., 2007], providing a third potential sink for surfaceaccumulated DON. However, much of the DON found in
Figure 8. Mean geographic distribution of surface outcrops of isopycnal surfaces in the Atlantic for (a)January–March and (b) July–September. Depths of the sigma-theta 26.0 isopycnal surface for (c) January–March and (d) July–September. Black dashed boxes indicate the regions of transit for waters from theeastern boundary upwelling systems towards the gyre centers within 6months of upwelling (determinedfrom drifter observations in Figure 5). Plots created using data from the World Ocean Atlas, 2005[http://www.nodc.noaa.gov/].
LETSCHER ET AL.: DISSOLVED ORGANIC NITROGEN IN THE GLOBAL SURFACE OCEAN
150
open ocean surface waters occurs as larger, complex organicmolecules with amide functional groups [McCarthy et al.,1997; Aluwihare et al., 2005] that are thought to be largelyunavailable to photoautotrophs, instead requiring extracellularbreakdown by microbes to release N [Berges and Mulholland,2008]. Thus, alternative surface ocean sinks for DONnot tested in our incubation experiments are consideredunlikely to contribute significantly to DON removal in theeuphotic zone.
5. Concluding Remarks
[41] We presented the global surface ocean DONdistribution and observed a global mean concentration of4.4� 0.5 mmol kg-1 within the upper 50 meters. Elevated[DON] (≥5 mmol kg-1) was found in waters adjacent to anddownstream from the major upwelling zones. Zonal gradientsin surface ocean [DON] indicate a sink of this material withinthe gyres on the order of ~0.5mmol kg-1 (~30mmolNm-2) fromthe upper 50m, and we explored two possible mechanisms forthis DON loss: removal by autotrophic utilizationwith export ofsinking particulate N from the euphotic zone (Mechanism I) orby vertical transport to the mesopelagic zone with subsequentconsumption (Mechanism II). Incubation experiments designedto test the biological capacity for surface ocean DON removal
found DON to be mostly recalcitrant to utilization by surfaceocean microbes; instead DON remineralization occurred withexposure to the heterotrophic microbial community from theupper mesopelagic zone at a rate of ~1mmolN kg-1 yr-1.These results suggest a limited role for DON removal viaMechanism I.[42] The estimated time scale for transport of DON-
enriched waters from the upwelling zones to the interior ofthe subtropical gyres was found to be long (months to years),allowing the excess DON to persist at the gyre margins longenough to be subducted upon wintertime convection, thussupporting Mechanism II. However, the depth of subductionwas shallow (<100m), so DON and its products would beretained within the deep euphotic zone. If relatively fastremineralization of DON occurs there, this new N couldsupport phytoplankton growth and particle export from theDCM, described as a two-step process (Mechanism III).[43] We conclude that the primary fate for surface DON is
removal via vertical transport to and subsequent mineralizationbelow the mixed layer. The precise depth at which the DON ismineralized (i.e., within or below the deep euphotic zone)determines the potential importance for DON to support exportproduction in the subtropical gyres (i.e., Mechanism II versusIII). If the euphotic zone is sufficiently deep, Mechanism IIImay operate in the eastern sectors of the major ocean basins,
Figure 9. Mean geographic distribution of surface outcrops of isopycnal surfaces in the Pacific for (a)January–March and (b) July–September. Depths of the sigma-theta 25.0 isopycnal for (c) January–Marchand (d) July–September. Black dashed boxes indicate the regions of transit for waters from the easternboundary upwelling system towards the gyre centers within 6months of upwelling (determined fromdrifter observations in Figure 6). Plots created using data from the World Ocean Atlas, 2005 [http://www.nodc.noaa.gov/].
LETSCHER ET AL.: DISSOLVED ORGANIC NITROGEN IN THE GLOBAL SURFACE OCEAN
151
thus providing indirect support of export production aftermineralization of DON to NO3
- within the deep euphotic zone.We found little support for a direct role for allochthonous DONto sustain export production from the mixed layer in the interiorof oligotrophic gyres (Mechanism I). Future work shouldexplicitly test Mechanism III by investigating the DONmineralization potential of DCM microbial assemblages.Additionally, quantification of the photo-oxidative DON sinkin the open ocean is necessary.
[44] Acknowledgments. The authors received support for this workfrom the National Science Foundation: grant NSF OCE-0752972 to DAHand CAC for the U.S. Global Ocean Carbon and Repeat HydrographyProgram; and grant NSF OCE-0933076 to ANK. RL acknowledges supportfrom NOAA’s Climate Program Office and the Atlantic Oceanographic andMeteorological Laboratory. We wish to thank all the P.I.’s, crew, andscientists involved with US Global Ocean Carbon and Repeat Hydrographyprogram; their tireless efforts have made this study possible. Wenhao Chenand Charles Farmer (RSMAS) and Elisa Halewood and Maverick Carey(UCSB) are thanked for DOC and TDN analyses. Dr. Chris Sinigalliano(NOAA/AOML) is thanked for help and use of his equipment for DAPIcounts.
ReferencesAbell, J., S. Emerson, and P. Renaud (2000), Distributions of TOP, TONand TOC in the North Pacific subtropical gyre: Implications for nutrientsupply in the surface ocean and remineralization in the upper thermocline,J. Mar. Res., 58(2), 203–222.
Altabet, M. A. (1988), Variations in nitrogen isotopic composition be-tween sinking and suspended particles: implications for nitrogen cy-cling and particle transformation in the open ocean, Deep Sea Res.,35(4), 535–554.
Aluwihare, L. I., and T. Meador (2008), Chemical composition of marinedissolved organic nitrogen, in Nitrogen in Marine Environment, 2nded., edited by D. G. Capone et al., pp. 1–50, Academic Press, Burlington,MA, doi:10.1016/B978-0-12-372522-6.00003-7.
Aluwihare, L. I., D. J. Repeta, S. Pantoja, and C. G. Johnson (2005), Twochemically distinct pools of organic nitrogen accumulate in the ocean,Science, 308(5724), 1007–1010, doi:10.1126/science.1108925.
Amon, R. M. W., and R. Benner (1996), Bacterial utilization of differentsize classes of dissolved organic matter, Limnol. Oceanogr., 41(1),41–51.
Berges, J. A., and M. R. Mulholland. (2008), Enzymes and nitrogen cycling,in Nitrogen in Marine Environment, 2nd ed., edited by D. G. Caponeet al., pp. 1385–1444, Academic Press, Burlington, MA, doi:10.1016/B978-0-12-372522-6.00032-3.
Braman, R. S., and S. A. Hendrix (1989), Nanogram nitrite and nitratedetermination in environmental and biological materials by vanadium(III)reduction with chemiluminescence detection, Anal. Chem., 61(24),2715–2718.
Bronk, D. A. (2002), Dynamics of DON, in Biogeochemistry of Marine Dis-solvedOrganicMatter, 1st ed., edited byD. A. Hansell and C. A. Carlson, pp.153–247, Academic Press, San Diego, CA, doi:10.1016/B978-012323841-2/50007-5.
Bronk, D. A., J. H. See, P. Bradley, and L. Killberg (2007), DON as asource of bioavailable nitrogen for phytoplankton, Biogeosciences, 4(3),283–296, doi:10.5194/bg-4-283-2007.
Bushaw, K. L., R. G. Zepp, M. A. Tarr, D. Schulz-Jander, R. A. Bourbonniere,R. E. Hodson, W. L. Miller, D. A. Bronk, and M. A. Moran (1996),Photochemical release of biologically available nitrogen from aquaticdissolved organic matter, Nature, 381(6581), 404–407.
Carlson, C. A., R. Morris, R. Parsons, A. H. Treusch, S. J. Giovannoni, andK. Vergin (2009), Seasonal dynamics of SAR11 populations in theeuphotic and mesopelagic zones of the northwestern Sargasso Sea, ISMEJ., 3(3), 283–295, doi:10.1038/ismej.2008.117.
Carlson, C. A., S. J. Giovannoni, D. A. Hansell, S. J. Goldberg, R. Parsons,and K. Vergin (2004), Interactions among dissolved organic carbon,microbial processes, and community structure in the mesopelagic zone ofthe northwestern Sargasso Sea, Limnol. Oceanogr., 49(4 I), 1073–1083,doi:10.4319/lo.2004.49.4.1073.
Charria, G., I. Dadou, J. Llido, M. Drévillon, and V. Garçon (2008),Importance of dissolved organic nitrogen in the north Atlantic Ocean insustaining primary production: A 3-D modelling approach, Biogeosciences,5(5), 1437–1455, doi:10.5194/bg-5-1437-2008.
Chavez, F. P., and M. Messié (2009), A comparison of Eastern BoundaryUpwelling Ecosystems, Prog. Oceanogr., 83(1–4), 80–96, doi:10.1016/j.pocean.2009.07.032.
Cullen, J. J., and R. W. Eppley (1981), Chlorophyll maximum layers of thesouthern California Bight and possible mechanisms of their formation andmaintenance, Oceanol. Acta, 4, 23–32.
Dugdale, R. C., and J. J. Goering (1967), Uptake of new and regeneratedforms of nitrogen in primary productivity, Limnol. Oceanogr., 12(2),196–206.
Dickson, A.G., C.L. Sabine, and J.R. Christian (Eds.) (2007) Guide to bestpractices for ocean CO2 measurements, PICES Special Publication 3, 191.
Fukuda, R., H. Ogawa, T. Nagata, and I. Koike (1998), Direct determinationof carbon and nitrogen contents of natural bacterial assemblages inmarine environments, Appl. Environ. Microb., 64(9), 3352–3358.
Gruber, N., and J. L. Sarmiento (1997), Global patterns of marine nitrogenfixation and denitrification, Global. Biogeochem. Cy., 11(2), 235–266.
Hansell, D. A. (1993), Results and observations from the measurement ofDOC and DON in seawater using a high-temperature catalytic oxidationtechnique, Mar. Chem., 41(1–3), 195–202.
Hansell, D.A. (2005), Dissolved organic carbon reference material program,EOS Transactions AGU, 86(35), 318, doi:10.1029/2005EO350003.
Hansell, D. A., and C. A. Carlson (2001), Biogeochemistry of total organiccarbon and nitrogen in the Sargasso Sea: Control by convective overturn,Deep Sea Res. Pt. II, 48(8–9), 1649–1667.
Hansell, D. A., and T. Y. Waterhouse (1997), Controls on the distributionsof organic carbon and nitrogen in the eastern Pacific Ocean, Deep SeaRes. Part I: Oceanogr. Res. Pap., 44(5), 843–757.
Hansell, D. A., N. R. Bates, and D. B. Olson (2004), Excess nitrate andnitrogen fixation in the North Atlantic Ocean, Mar. Chem., 84(3–4),243–265, doi:10.1016/j.marchem.2003.08.004.
Hautala, S. L., and D. H. Roemmich (1998), Subtropical mode water inthe Northeast Pacific Basin, J. Geophys. Res. C: Oceans, 103(3336),13055–13066.
Holmes, R. M., A. Aminot, R. Kérouel, B. A. Hooker, and B. J. Peterson(1999), A simple and precise method for measuring ammonium in marineand freshwater ecosystems, Can. J. Fish. Aquat. Sci., 56(10), 1801–1808.
Jenkins, W. J., and D. W. R. Wallace (1992), Tracer based inferences of newprimary production in the sea, in Primary Productivity and BiogeochemicalCycles in the Sea, issue 37, edited by P. G. Falkowski and A. D.Woodhead,pp. 299–314, Springer, New York.
Kieber, R. J., A. Li, and P. J. Seaton (1999), Production of nitrite from thephotodegradation of dissolved organic matter in natural waters, Envir.Sci. Tech., 33(7), 993–998.
Kirchman, D. L. (1994), The uptake of inorganic nutrients by heterotrophicbacteria, Microb. Ecol., 28(2), 255–271.
Knapp, A. N., D. M. Sigman, and F. Lipschultz (2005), N isotopic compo-sition of dissolved organic nitrogen and nitrate at the Bermuda AtlanticTime-series study site, Global. Biogeochem. Cy., 19(1), 1–15,doi:10.1029/2004GB002320.
Knapp, A. N., D. M. Sigman, F. Lipschultz, A. B. Kustka, and D. G. Capone(2011), Interbasin isotopic correspondence between upper-ocean bulkDON and subsurface nitrate and its implications for marine nitrogen cycling,Global. Biogeochem. Cy., 25(4), doi:10.1029/2010GB003878.
Lipschultz, F. (2001), A time-series assessment of the nitrogen cycle atBATS, Deep Sea Res. Pt. II, 48(8–9), 1897–1924.
Lumpkin, R., N. Maximenko, and M. Pazos (2012), Evaluating where andwhy drifters die, J. Atmos. Ocean. Tech., 29(2), 300–308, doi:10.1175/JTECH-D-11-00100.1.
Mahaffey, C., R. G. Williams, G. A. Wolff, and W. T. Anderson (2004),Physical supply of nitrogen to phytoplankton in the Atlantic Ocean,Global. Biogeochem. Cy., 18(1), GB1034, 1–12.
Maximenko, N., J. Hafner, and P. Niiler (2012), Pathways of marine debrisderived from trajectories of Lagrangian drifters,Mar. Pollut. Bull., 65(1–3),51–62, doi:10.1016/j.marpolbul.2011.04.016.
McCarthy, M., T. Pratum, J. Hedges, and R. Benner (1997), Chemicalcomposition of dissolved organic nitrogen in the ocean, Nature, 390(6656),150–154.
McCarthy, M. D., R. Benner, C. Lee, J. I. Hedges, and M. L. Fogel (2004),Amino acid carbon isotopic fractionation patterns in oceanic dissolvedorganic matter: An unaltered photoautotrophic source for dissolvedorganic nitrogen in the ocean? Mar. Chem., 92(1–4), 123–134,doi:10.1016/j.marchem.2004.06.021.
Morris, R. M., K. L. Vergin, J. Cho, M. S. Rappé, C. A. Carlson, andS. J. Giovannoni (2005), Temporal and spatial response of bacterioplanktonlineages to annual convective overturn at the Bermuda AtlanticTime-series Study site, Limnol. Oceanogr., 50(5), 1687–1696,doi:10.4319/lo.2005.50.5.1687.
Niiler, P. P. (2001), The world ocean surface circulation, inOcean Circulationand Climate, International Geophysics Series, Vol. 77, edited by G. Siedleret al., pp. 193–204, Academic Press, New York.
LETSCHER ET AL.: DISSOLVED ORGANIC NITROGEN IN THE GLOBAL SURFACE OCEAN
152
Palenik, B., and F. M. M. Morel (1991), Amine oxidases of marinephytoplankton, Appl. Environ. Microb., 57(8), 2440–2443.
Porter, K. G., and Y. S. Feig (1980), The use of DAPI for identifyingand counting aquatic microflora, Limnol. Oceanogr. 25, 943–948.
Roussenov, V., R. G. Williams, C. Mahaffey, and G. A. Wolff (2006),Does the transport of dissolved organic nutrients affect export productionin the Atlantic Ocean? Global. Biogeochem. Cy., 20(3), doi:10.1029/2005GB002510.
Schlitzer, R. (2012), Ocean Data View 4, http://odv.awi.deSiedler, G., A. Kuhl, and W. Zenk (1987), The Madeira mode water, J.Phys. Oceanogr., 17, 1561–1570, doi:10.1175/1520-0485(1987)017<1561:TMMW>2.0.CO;2.
Stedmon, C. A., S. Markager, L. Tranvik, L. Kronberg, T. Slätis, and W.Martinsen (2007), Photochemical production of ammonium and transfor-mation of dissolved organic matter in the Baltic Sea, Mar. Chem., 104(3–4), 227–240, doi:10.1016/j.marchem.2006.11.005.
Torres-Valdés, S., V. M. Roussenov, R. Sanders, S. Reynolds, X. Pan, R.Mather, A. Landolfi, G. A. Wolff, E. P. Achterberg, and R. G. Williams
(2009), Distribution of dissolved organic nutrients and their effect onexport production over the Atlantic Ocean, Global. Biogeochem. Cy.,23(4), doi:10.1029/2008GB003389.
Treusch, A. H., K. L. Vergin, L. A. Finlay, M. G. Donatz, R. M. Burton,C. A. Carlson, and S. J. Giovannoni (2009), Seasonality and verticalstructure of microbial communities in an ocean gyre, ISME J., 3(10),1148–1163, doi:10.1038/ismej.2009.60.
Vähätalo, A. V., and R. G. Zepp (2005), Photochemical mineralizationof dissolved organic nitrogen to ammonium in the Baltic Sea, Envir.Sci. Tech., 39(18), 6985–6992, doi:10.1021/es050142z.
Walsh, T. W. (1989), Total dissolved nitrogen in seawater: a new hightemperature combustion method and a comparison with photo-oxidation,Mar. Chem., 26(4), 295–311.
Ward, B. B., K. A. Kilpatrick, E. H. Renger, and R.W. Eppley (1989), Biologicalnitrogen cycling in the nitracline, Limnol. Oceanogr., 34(3), 493–513.
Williams, R. G., and M. J. Follows (1998), The Ekman transfer of nutrientsand maintenance of new production over the North Atlantic, Deep SeaRes. Part I: Oceanogr. Res. Pap., 45(2–3), 461–489.
LETSCHER ET AL.: DISSOLVED ORGANIC NITROGEN IN THE GLOBAL SURFACE OCEAN
153


