Embed Size (px)
Citation preview

This article appeared in a journal published by Elsevier. The attachedcopy is furnished to the author for internal non-commercial researchand education use, including for instruction at the authors institution
and sharing with colleagues.
Other uses, including reproduction and distribution, or selling orlicensing copies, or posting to personal, institutional or third party
websites are prohibited.
In most cases authors are permitted to post their version of thearticle (e.g. in Word or Tex form) to their personal website orinstitutional repository. Authors requiring further information
regarding Elsevier’s archiving and manuscript policies areencouraged to visit:
http://www.elsevier.com/copyright
Author's personal copy
Life Cycle Assessment, ExternE and Comprehensive Analysis for an integratedevaluation of the environmental impact of anthropogenic activities
F. Pietrapertosa a,c,*, C. Cosmi a,c, M. Macchiato b,c, M. Salvia a, V. Cuomo a
a National Research Council, Institute of Methodologies for Environmental Analysis C.N.R.-I.M.A.A. C.da S.Loja, I-85050 Tito Scalo (PZ), Italyb Federico II University, Department of Physical Sciences, Via Cinthia, I-80126 Naples, Italyc National Research Council, National Institute for the Physics of Matter, C.N.R.-I.N.F.M. Via Cinthia, I-80126 Naples, Italy
Contents
1. Introduction . . . . . . . . . . . . . . . . . . . . . . . . . . . . . . . . . . . . . . . . . . . . . . . . . . . . . . . . . . . . . . . . . . . . . . . . . . . . . . . . . . . . . . . . . . . . . . . . . . . . 1040
2. Methodology . . . . . . . . . . . . . . . . . . . . . . . . . . . . . . . . . . . . . . . . . . . . . . . . . . . . . . . . . . . . . . . . . . . . . . . . . . . . . . . . . . . . . . . . . . . . . . . . . . . 1040
2.1. The Life Cycle Assessment . . . . . . . . . . . . . . . . . . . . . . . . . . . . . . . . . . . . . . . . . . . . . . . . . . . . . . . . . . . . . . . . . . . . . . . . . . . . . . . . . . . 1040
2.2. The Comprehensive Analysis . . . . . . . . . . . . . . . . . . . . . . . . . . . . . . . . . . . . . . . . . . . . . . . . . . . . . . . . . . . . . . . . . . . . . . . . . . . . . . . . . 1040
2.3. The ExternE approach . . . . . . . . . . . . . . . . . . . . . . . . . . . . . . . . . . . . . . . . . . . . . . . . . . . . . . . . . . . . . . . . . . . . . . . . . . . . . . . . . . . . . . 1041
2.4. A combined approach for energy systems analysis . . . . . . . . . . . . . . . . . . . . . . . . . . . . . . . . . . . . . . . . . . . . . . . . . . . . . . . . . . . . . . . 1041
3. The reference energy and material system of Val d’Agri . . . . . . . . . . . . . . . . . . . . . . . . . . . . . . . . . . . . . . . . . . . . . . . . . . . . . . . . . . . . . . . . . 1042
3.1. Oil extraction activities . . . . . . . . . . . . . . . . . . . . . . . . . . . . . . . . . . . . . . . . . . . . . . . . . . . . . . . . . . . . . . . . . . . . . . . . . . . . . . . . . . . . . 1043
3.2. Electric power generation technologies. . . . . . . . . . . . . . . . . . . . . . . . . . . . . . . . . . . . . . . . . . . . . . . . . . . . . . . . . . . . . . . . . . . . . . . . . 1043
4. Scenario assumptions . . . . . . . . . . . . . . . . . . . . . . . . . . . . . . . . . . . . . . . . . . . . . . . . . . . . . . . . . . . . . . . . . . . . . . . . . . . . . . . . . . . . . . . . . . . . 1043
4.1. Post-optimal analysis . . . . . . . . . . . . . . . . . . . . . . . . . . . . . . . . . . . . . . . . . . . . . . . . . . . . . . . . . . . . . . . . . . . . . . . . . . . . . . . . . . . . . . . 1044
4.1.1. BAU scenario . . . . . . . . . . . . . . . . . . . . . . . . . . . . . . . . . . . . . . . . . . . . . . . . . . . . . . . . . . . . . . . . . . . . . . . . . . . . . . . . . . . . . . 1044
Renewable and Sustainable Energy Reviews 13 (2009) 1039–1048
A R T I C L E I N F O
Article history:
Received 16 April 2008
Accepted 12 May 2008
Keywords:
Life Cycle Assessment
Comprehensive Analysis
MARKAL
External costs
Local energy planning
A B S T R A C T
The implementation of resource management strategies aimed at reducing the impacts of the
anthropogenic activities system requires a comprehensive approach to evaluate on the whole the
environmental burdens of productive processes and to identify the best recovery strategies from both an
environmental and an economic point of view.
In this framework, an analytical methodology based on the integration of Life Cycle Assessment (LCA),
ExternE and Comprehensive Analysis was developed to perform an in-depth investigation of energy
systems. The LCA methodology, largely utilised by the international scientific community for the
assessment of the environmental performances of technologies, combined with Comprehensive Analysis
allows modelling the overall system of anthropogenic activities, as well as sub-systems, the economic
consequences of the whole set of environmental damages. Moreover, internalising external costs into
partial equilibrium models, as those utilised by Comprehensive Analysis, can be useful to identify the best
paths for implementing technology innovation and strategies aimed to a more sustainable energy supply
and use.
This paper presents an integrated application of these three methodologies to a local scale case study
(the Val D’Agri area in Basilicata, Southern Italy), aimed to better characterise the environmental impacts
of the energy system, with particular reference to extraction activities. The innovative methodological
approach utilised takes advantage from the strength points of each methodology with an added value
coming from their integration as emphasised by the main results obtained by the scenario analysis.
� 2008 Elsevier Ltd. All rights reserved.
* Corresponding author at: National Research Council, Institute of Methodologies for Environmental Analysis C.N.R.-I.M.A.A. C.da S.Loja, I-85050 Tito Scalo (PZ), Italy.
Tel.: +39 0971 427207; fax: +39 0971 427271.
E-mail addresses: [email protected] (F. Pietrapertosa), [email protected] (C. Cosmi), [email protected] (M. Macchiato), [email protected] (M. Salvia),
[email protected] (V. Cuomo).
Contents lists available at ScienceDirect
Renewable and Sustainable Energy Reviews
journal homepage: www.elsev ier .com/ locate / rser
1364-0321/$ – see front matter � 2008 Elsevier Ltd. All rights reserved.
doi:10.1016/j.rser.2008.05.006
Author's personal copy
4.1.2. The ‘‘Impacts’’ scenario . . . . . . . . . . . . . . . . . . . . . . . . . . . . . . . . . . . . . . . . . . . . . . . . . . . . . . . . . . . . . . . . . . . . . . . . . . . . . . 1044
4.1.3. Evaluation of external costs . . . . . . . . . . . . . . . . . . . . . . . . . . . . . . . . . . . . . . . . . . . . . . . . . . . . . . . . . . . . . . . . . . . . . . . . . . 1045
5. Conclusions . . . . . . . . . . . . . . . . . . . . . . . . . . . . . . . . . . . . . . . . . . . . . . . . . . . . . . . . . . . . . . . . . . . . . . . . . . . . . . . . . . . . . . . . . . . . . . . . . . . . 1046
Acknowledgements. . . . . . . . . . . . . . . . . . . . . . . . . . . . . . . . . . . . . . . . . . . . . . . . . . . . . . . . . . . . . . . . . . . . . . . . . . . . . . . . . . . . . . . . . . . . . . 1047
References . . . . . . . . . . . . . . . . . . . . . . . . . . . . . . . . . . . . . . . . . . . . . . . . . . . . . . . . . . . . . . . . . . . . . . . . . . . . . . . . . . . . . . . . . . . . . . . . . . . . . 1047
1. Introduction
A key issue for sustainable development is to harmoniseenvironmental protection with economic growth to assure futuregeneration the fulfilment of goods and services demand and abetter environmental quality through the improvement of eco-efficient productive processes. Moreover, the integration ofenvironmental protection issues into management strategies isof fundamental importance to drive producers and consumerstowards the choice of technologies and products with a reducedenvironmental impact.
The Sixth Environment Action Programme [1] sets out thepriorities for the European Community up to 2010, underlining thenecessity of a strategic approach based on the optimisation ofresources management to face the increasing environmentalproblems. In fact, a bare normative approach is not sufficient tolimit the environmental damages due to anthropogenic activitiesas significant changes in production and consumption patterns arerequired to achieve an effective improvement of air quality as wellas climate change mitigation. In this context, it is of fundamentalimportance to characterise in detail the environmental burdensassociated to the different phases of the life cycle of products, theenergy-environmental performances of technologies and toexploit the correlations among the supply and end-use sectors.
A Comprehensive Analysis of the anthropogenic system is thusnecessary to estimate the overall environmental impact and totake into account feedbacks among the different sectors involved.However, to perform an in depth investigation of the local systemsand to better understand the total impact of anthropogenicactivities, Comprehensive Analysis should be integrated with othertools as Life Cycle Assessment (LCA) and external cost evaluation.
These tools are in fact of fundamental importance for takinginto account the contribution of the different life-cycle phases andthe economic value of the environmental damage, in order todefine policy and tariff strategies capable of reducing the overallimpact of productive activities and promoting technology innova-tion.
The interest on these issues have been growing in recent years,and many studies [2,3] are being devoted to the development ofdecisional tools based on analytical models capable to identifysound and economically feasible energy-environmental strategies.
This work shows an example of soft-linking integrationbetween the Comprehensive Analysis (MARKAL models genera-tor), Life Cycle Assessment (LCA) techniques and externalitiesevaluation to explore the environmental impact of products andprocesses in terms of primary pollutants concentration as well astheir main effects on environment (e.g. acidification, greenhousepotential, . . .) and include in resources’ price the economic value ofpotential environmental damages.
2. Methodology
Life Cycle Assessment, evaluation of external costs andComprehensive Analysis are the fundamental methodologies usedfor the evaluation and the minimisation of the environmentalimpact of the commodities production system (in terms ofphysical–chemical parameters and damage costs). However, they
are based on different scientific assumptions that lead to differentresults that could be usefully complemented.
The main features of each methodology are briefly summarisedin the following.
2.1. The Life Cycle Assessment
The LCA ‘‘is a process to evaluate the environmental burdensassociated with a product, process, or activity by identifying andquantifying energy and materials used and wastes released to theenvironment; to assess the impact of those energy and materialsused and released to the environment; and to identify and evaluateopportunities to affect environmental improvements’’ [4].
In particular, LCA is aimed to the identification and quantifica-tion of physical flows of energy and materials, focusing on singletechnologies or processes and it is very useful to compare theenvironmental performances of products with the same function-ality or to find out the bottlenecks of productive processes. LCA istime specific and, in general does not allow analysing the effects oftechnology substitution on medium–long term as well as the cost-effectiveness of different choices.
Some attempts to have a monetary evaluation of products andprocesses has led to integration of conventional LCA with Life CycleCost Analysis (LCC) [5] and input–output economic analysis (IOA-LCA) [6,7].
In particular, LCC follows the typical approach of LCA evaluatinganalytically all costs experienced during the life cycle ofequipments (from inception to disposal) in order to choose thecost-effective approach from a series of alternatives. On thecontrary, IOA-LCA is a method based on the monetary flowsinduced throughout the economy from a given sector output. Itprovides an automatic evaluation of energy consumption andpollutant releases linked to monetary transactions between theinvolved productive sectors, which are based on average values ofemissions and energy consumption per economic unit of output.This feature makes IOA-LCA very useful for sector studies but notmuch reliable for detailed analysis. In this study, the modelling toolused for LCA analysis is the GEMIS software (Global EmissionModel for Integrated Systems database) developed by Oko-Institut[8].
2.2. The Comprehensive Analysis
Comprehensive Analysis [9] focuses on a global system level,with a bottom-up characterisation of its components. The analysedenergy–environment system is represented as a network (the ‘‘so-called’’ Reference Energy and Material System—REMS) whichdescribes energy and material flows, from extraction to end-usedemands/waste production, through conversion processes. Eachelement in the network is characterised by a set of technologiesdescribed by means of technical–economic data (e.g., capacity,efficiency, average lifetime, availability, investment costs, operat-ing and maintenance costs, date of commercialization, etc.) andenvironmental parameters (e.g. pollutants emitted). A linearpartial equilibrium model is set up to represent the relationshipsamong the system’s components and the boundary conditions overa planning time horizon (usually from 20 to 50 years) chosen by the
F. Pietrapertosa et al. / Renewable and Sustainable Energy Reviews 13 (2009) 1039–10481040

Author's personal copy
users, divided into time periods of fixed or variable length. Theoptimal solution found by the model determines the energysystem configuration which minimises the cost of energy servicesin compliance with the considered exogenous constraints (i.e.availability of resources and technologies, emission targets, etc.).
Among the partial equilibrium models generators, MARKAL[10,11] is one of the most widespread tools, being used in manyOECD countries to perform energy-environmental analysis onsupra-national, national and regional level. A first version ofMARKAL was developed in the end-seventies at the BrookhavenNational Laboratory of New York in a collaborative effort underthe auspices of the International Energy Agency-Energy Tech-nology Systems Analysis Programme (ETSAP) [12] and the UnitedStates Department of Energy and was mainly addressed tooptimise energy production in response to oil crisis. At present,its flexibility allows modelling systems with very differentfeatures and to examine a variety of policy issues related toenvironmental protection, sustainable use of resources andsecurity of supply.
MARKAL is a linear programming optimising models generatorwhose main inputs are represented by the demand for energyservices by sector (e.g. dwellings heating, lighting, water heating,air conditioning, etc.) together with resource availability andenvironmental constraints. The optimal solution selects the bestset of technologies and fuels that, for each time period and over theentire time horizon, allows to satisfy the end-use sectors’ energydemand and to achieve the prefixed environmental targets at theminimum feasible total system cost [13–16].
The model structure allows the users to include damagefunctions and coefficients to get an estimate on medium–long termof the environmental costs due to atmospheric pollution as well asto internalise such external costs in goods and services prices [17].
From the model’s results, it is therefore possible to identify thecost-effective strategies under superimposed constraints, toevaluate the effects of different implementation mechanisms(regulations, taxes and subsidies, emissions trading) and the role oftechnology innovation. In particular, different competing technol-ogies are compared in terms of techno-economic and environ-mental performances. In this framework, costs analysis (inparticular focused on shadow prices of resources and reducedcosts of technologies) is used to find out the best availablesolutions and to define the investment strategies that foster theirmarket penetration.
2.3. The ExternE approach
The methodology developed in the framework of the ExternE(Externalities of Energy) project [18] is the main internationalreference for the monetary evaluations of environmental burdensas well as the internalisation of external costs related to the energysector. ExternE [19–26] is a research project of the European
Commission launched in collaboration with the US Department ofEnergy in 1991 that established a methodology and accountingframework for the comparable assessment of the externalitiesfrom a wide range of different fuel cycles. The main objective ofthis project was to apply this methodology to a wide range ofdifferent fossil, nuclear and renewable fuel cycles for powergeneration and energy conservation options, and subsequently ithas been extended to address the evaluation of externalitiesassociated with the use of energy in the transport and domesticsectors and to also include a number of non-environmentalexternalities such as those associated with security of supply.
This methodology is constantly updated to improve theevaluation of impacts and an estimation of associated costs[27,28].
2.4. A combined approach for energy systems analysis
A crucial point of Comprehensive Analysis is the level of detailof energy and materials flows representation which is related to asector by sector characterisation of technologies. A combination ofglobal analysis with subsystem analysis is usually envisaged toobtain more specific responses and to perform a strategic energy-environmental planning on medium–long term.
In this framework, integrating Comprehensive Analysis withLCA and external costs evaluation into a unique modellingapproach allows to take advantage from the inputs of the threemethodologies, increasing the level of detail relatively to thecharacterisation of the overall life cycle impact, associating aneconomic value to each atmospheric pollutant and evaluating theireffects in a long term perspective.
In such a context, LCA feeds into the energy models detailed‘‘cradle to grave’’ information on resources and technologies;ExternE provides an estimate of cost externalities per emission/burden whereas Comprehensive Analysis, taking into accountthese data, allows defining the minimum feasible system cost andthe optimal energy and technology mix [29]. It is therefore possibleto perform a so called ‘‘LCA of energy systems’’ [30] that points outthe cause–effects relationships among sectors, taking into accountat the same time the atmospheric pollutants and their effects onthe environment.
In this way, both the external and internal environmentalimpacts of energy systems can be analysed contemporaneously(Fig. 1).
From an operative point of view, the results of LCA areintroduced in the comprehensive model by adding new indicatorsin the model’s set of environmental variables (SET ENV), whichusually includes only the typical primary pollutants (NOx, CO, CO2,SO2, TSP, etc.).
Besides that, the considered environmental pollutants’ effects(Acidification, Global warming, Smog) are modelled by utilisingthe ‘‘Multiple Emissions Accounting (MEA)’’ variable that is a
Fig. 1. Integrated approach for energy systems analysis.
F. Pietrapertosa et al. / Renewable and Sustainable Energy Reviews 13 (2009) 1039–1048 1041

Author's personal copy
weighted linear combination of primary pollutants (1):
envðMEAÞ ¼ K1 � env1 þ � � � þ Kn � envn (1)
where the weight factors Kn define the unitary contribution of eachpollutant envn to the represented indicator (the values utilisedwere taken from the IPCC—Intergovernmental Panel on ClimateChange documentation and other governmental regulations [31]).
In addition to that, the damage costs of pollutants (the ExternEvalues) are inserted in the MARKAL model by a ‘‘damage function’’attribute that represents the estimated external cost per unit ofpollutant emitted.
The damage per pollutant (DAM(env)) is therefore modelled as(2):
DAMðenvÞ ¼ EVcoef ðenvÞ � EMðenvÞ (2)
where EM(env) is the total emission of the ‘‘env’’ pollutant,EVcoef(env) is the value of external cost for unit of ‘‘env’’.
Subsequently, the computation of environmental damages canbe performed with two different approaches: ‘‘ex post’’, withoutfeedback into the optimisation process, or ‘‘ex ante’’, adding thedamage function to the objective function, to take its value intoaccount in the optimisation process [32].
3. The reference energy and material system of Val d’Agri
The integrated methodological approach was applied to thecharacterisation of Val d’Agri energy system, that concerns a smallarea of Basilicata Region (Southern Italy) in which is located thelargest Italy oilfield with an average production of 90,000 oilbarrels per day that is going to reach more than 100,000 barrels perday within next years [33,34].
The Val d’Agri area is also a place of great interest from anaturalistic and architectural point of view and was recentlyacknowledged as a national Natural Park. The coexistence of anatural park and oil fields drives the attention towards the
environmental problems caused by energy uses and, in particular,from the increasing mining activities that may cause irreparabledamages, compromising the environmental sustainability of thewhole area.
The REMS of the Val d’Agri energy system schematises theenergy and materials flows through the intermediate conversionand end-uses processes. Each component of this network wascharacterised from a technical, economic and environmental pointof view, further technical details can be found in a previous paper[35].
As concerns the supply side, the oil extraction activities have, assaid before, an important role for their high impact on theenvironment. In 2000 electricity produced from renewable wasabout 89% (133 GWh/year, of which 116.6 GWh/year by hydro-electric power plants, 16.58 GWh/year by wind and 0.06 GWh/yearby small photovoltaic plants). The remaining 11% was produced bythermoelectric power plants, mainly gas fuelled.
According to the Regional Energy Plan estimations (PER) [36]the renewable share could increase up to 93% with the installationof mini-hydroelectric (16.4 GWh/year), PV (20.78 GWh/year) wind(181.797 GWh/year) and biomass (40.5 GWh/year) power plants.These capacity potentials were taken into account to model in arealistic way the system development over the considered timehorizon.
The end-use demand is about 2,486,912 GJ of which 5% fulfilledby endogenous resources. A detailed sectoral breakdown of energyend-use was estimated for year 2000 with reference to theavailable statistical data sources [37–39], revealing that Residen-tial and Industry are the prevailing consumers, each of themaccounting for 34% (Table 1).
The LCA information were essential to model in depth theimpacts of both oil extraction activities and electric powergeneration (EPG) technologies (Fig. 2), taking into account theconstruction and disposal phases and completing the data alreadyavailable on the operating phase.
Table 1Final energy consumption by sector—year 2000 (GJ)
Wood Coal Other solids Natural gas LPG Diesel Fuel oil Electricity Total
Residential 148,989 2,001 175,920 53,546 5,973 – 185,029 2,001
Space heating 148,989 1,747 140,384 33,413 5,585 – 2,352 1,747
Water heating 196 23,221 3,962 388 – 42,109 196
Cooking 58 12,314 16,171 – – 7,857 58
Refrigeration – – – – – 45,748 –
Washing machine – – – – – 24,885 –
Dishwasher – – – – – 7,190 –
Lighting – – – – – 29,589 –
other electric uses – – – – – 25,299 –
Commercial and services 189 69,881 9,598 956 – 83,091 189
Public administration – – – – – 10,340 –
Public illumination – – – – – 25,867 –
Agriculture – – 12,765 792,520 – – –
Industry 55,864 8,658 171,359 2,991 13,442 37,100 312,658 602,100
Food and drink 877 230 27,529 484 743 5,891 24,624 –
Other industries 552 – 184 295 517 3,750 5,895 –
Paper 22 – 2,577 32 55 1,421 2,541 –
Chemical 38 17 12,426 235 131 3,647 30,683 55,864
Rubber and plastic 94 42 15,922 124 326 2,567 18,082 877
Buildings – 1,880 304 111 3,442 1,880 2,641 552
Mining 87 – 13,997 68 632 607 2,772 22
Mechanic 277 – 10,264 332 475 1,089 8,869 38
Iron and steel industry 39,969 – 36,810 438 170 887 59,575 94
Textile 180 – 4,923 179 392 3,177 58,663 –
Electric energy, gas and water 42,051 87
Building materials 13,605 6,517 42,445 379 6,517 10,520 47,151 277
Glass-ceramics 164 – 3,978 314 44 1,665 9,111 39,969
Total 148,989 58,054 8,685 428,884 86,177 1,060,833 40,031 655,259 2,486,912
F. Pietrapertosa et al. / Renewable and Sustainable Energy Reviews 13 (2009) 1039–10481042

Author's personal copy
3.1. Oil extraction activities
Oil mining activities represent the main cause of environmentaldamage in the local area, therefore, their impacts were analysedwith reference to the different phases: construction of perforationsinfrastructures, drilling activities, flaring, (i.e. the emissions causedby the combustion in torch of the gas associated to oil) and the so-called ‘‘blow-out’’ (uncontrolled eruptions that can take place forthe income of fluid of layer in the sink).
Three main categories of environmental burdens were com-puted using LCA: Acidification, Smog and Greenhouse effect. Theywere introduced into the Val d’Agri model by the ‘‘MultipleEmissions Accounting’’ variable (see Section 2.4), using the weightfactors reported in Table 2.
In Table 3 the total impacts of oil extraction activities to eachimpact category are reported, with reference to the average oil
production in 2000, emphasising the huge contribution to all theconsidered impact categories.
These results underline the importance of devising ‘‘ad hoc’’solutions for this sector, addressed both to protecting theenvironment and to increasing the security of energy supply.
3.2. Electric power generation technologies
Construction and dismantling phases of electric power gen-eration (EPG) technologies may strongly contribute to environ-mental degradation. Thus LCA was applied to the characterisationof the environmental impact of the already existing plants and theones whose installation is foreseen by the PER within the planningtime horizon.
Table 4 reports for the considered EPG technologies the unitaryimpact coefficients and the total impacts estimated for Greenhouseeffect, Acidification and Smog [8] considering the extrapolations ofthe PER [36]. It can be seen that greenhouse effect has a high valuein all the plants, with the most significant contribution belongingto hydro and PV. Biomass technologies contribute remarkably to allthe considered impact categories.
4. Scenario assumptions
The multi-period structure of MARKAL models generatorrequires the specification of the basic energy system featureson the planning time horizon in terms of end-use energy demands,technology and fuels availability. Moreover it is necessary todefine quantitatively the variations of the scenario parameters(e.g. emission levels, aggregated environmental impacts, externalcosts of pollutants) and their variations to perform the scenarioanalysis.
For the Val d’Agri energy system, a 27-year time horizon (1996–2023), divided into nine time periods of equal length, wasconsidered. The base year is 1997 but the reference year forenergy consumption is year 2000. A constant demand of goods andservices on the analysed time horizon, was considered taking intoaccount a negative trend of population growth rate (�7% between1991 and 2001) [40], and the effects of the new building standardsand technology turnover in end-use sectors. A 4% discount rate wasadopted for costs actualisation.
The Reference scenario (Business As Usual—BAU case) imple-ments the PER hypotheses [36] as concerns the contribution ofrenewable sources (PV, wind, biomass and mini-hydroelectric). Infact, the BAU case models the evolution of the reference energysystem without exogenous environmental constraints providingthe baseline for scenario analysis. Efficiency increase due totechnology turnover as well as energy conservation measures inresidential (double glazed windows and thermal insulation ofroofs, ceilings and external walls) were taken into account.
Two additional scenarios were defined to examine and comparethe effects on the energy system’s configuration, costs ofconstraints on environmental impacts and eco-taxes on the main
Fig. 2. Application of LCA to sector analysis.
Table 2Weight factors used for calculating aggregated indicators in MARKAL-VdA [31]
Environmental burdens Pollutants Weight factor
Acidification (ton SO2eq) SO2 1
NH3 1.88
Smog (ton SPMeq) Particulate 1
PM10 1
Greenhouse (ton CO2eq) CO2 1
CH4 11
Table 3Environmental impacts of oil extraction activities—year 2000
Impact category Unitary impact per kton
of oil produced
Total impact
Acidification (kg SO2eq) 1,770 800,040
Greenhouse (kg CO2eq) 283,000 127,916,000
Smog (kg SPMeq) 677 306,004
Table 4Unitary indicators and total impacts estimated for EPG technologies
Greenhouse effect Acidification Smog
kg CO2eq/GJ kg CO2eq kg SO2eq/GJ kg SO2eq kg SPM/GJ kg SPM
Mini-hydro 0.867 51 0.002 0.11 0.001 311.60
Wind 6.00 358 0.01 0.86 0.005 61.95
Hydroelectric 8.01 3363 0.01 6.22 0.006 467.71
Thermoelectric 64.21 352 0.12 6.87 0.01 1865
PV 44.34 3363 0.12 8.99 0.11 6.48
Biomass 9.35 1362 0.91 133.10 4.44 1322
F. Pietrapertosa et al. / Renewable and Sustainable Energy Reviews 13 (2009) 1039–1048 1043

Author's personal copy
pollutants. As shown in Table 5, the Impacts scenario, includes fourcases that analyse the effects of exogenous constraints onaggregated impacts indicators (Greenhouse effect, Acidification,Smog, and a combination of all the indicators), whereas theEcotaxes scenario, includes six cases in which the external costswere introduced as taxes on local air pollutants (NOx, SO2, TSP andVOC) as well as on CO2, to evaluate their influence on the systemconfiguration and to assess their synergies.
In particular, the SO2, NOx, VOC and TSP external costs are thevalues reported for Italy in the Benefits Table database (BeTa) [41],developed by netcen (AEA Technology) for 15 countries of theEuropean Union. As concerns carbon dioxide, as well known, thedetermination of the external cost is affected by a largeuncertainty, due to the large set of harmful effects on humanhealth and on the environment and to the long time horizon (100–500 years) on which these impacts could span [20]. Therefore thevalues are ranging in a wide interval (from 0.1 to 139 euro/ton[42,43]). As concerns our case study, an average value of 19 Euro/ton CO2 [44] was considered.
4.1. Post-optimal analysis
The main results obtained by the optimization routine aredescribed in terms of fuel mixing, technological configura-tion, environmental impacts and the variations of total systemcost.
4.1.1. BAU scenario
The Reference scenario results described in detail in [35] arebriefly resumed here.
The optimization of energy uses performed under the BAUassumptions conveys in a 10% reduction of energy consumption onthe whole time horizon (15% of which due to energy savingsobtained by insulation interventions in buildings and theremaining 85% due to more efficient end-uses technologies).
As concerns the fuel mix, fossil fuels are substituted by amassive use of natural gas driven by a large availability ofcombined natural gas boilers in Residential, which replace mainlyLPG and diesel boilers.
In electricity production there is an increased use of endogen-ous renewable sources that fosters a reduction of electricity import(Fig. 3). On average, in 2009 the 85% of the electricity will beproduced from renewable (70% hydro, 9% wind and 6% wasteincineration) according to the deployment of renewables energysources foreseen by the PER [36], with the exception of biomassand PV for which specific support policies are necessary in order toreduce the gap due to their high investment costs.
4.1.2. The ‘‘Impacts’’ scenario
The Impacts scenario is aimed to exploring the possibility ofreducing three of the most important effects due to atmosphericpollution: Greenhouse effect, Acidification and Smog. Theseindicators were chosen as the most effective to focus on the most
Table 5Main scenarios assumptions
Scenario Cases Main features Constraints External costs
Reference BAU Do nothing No All pollutants, ex post
Impacts Greenhouse Constraint on Greenhouse Effect �1.1% Greenhouse Effect All pollutants, ex post
Acidification Constraint on Acidification �0.6% Acidification All pollutants, ex post
Smog Constraint on dusts level �1.5% Smog All pollutants, ex post
Mix Combined constraint on environmental
impacts: Greenhouse Effect + Acidification + Smog
�1.1% Greenhouse Effect, �0.56%
Acidification, �0.02% Smog
All pollutants, ex post
Eco-taxes TAX-CO2 19 Euro/ton on CO2 No CO2, ex ante
TAX-NOX 7100 Euro/ton on NOx No NOx, ex ante
TAX-SO2 5000 Euro/ton on SO2 No SO2, ex ante
TAX-TSP 12000 Euro/ton on TSP No TSP, ex ante
TAX-VOC 2800 Euro/ton on VOC No VOC, ex ante
TAX-TOT Taxes on all the analysed emissions (CO2, NOx, SO2, TSP, VOC) No All pollutants, ex ante
Fig. 3. Contribution of different sources to the electricity production—BAU scenario.
F. Pietrapertosa et al. / Renewable and Sustainable Energy Reviews 13 (2009) 1039–10481044
Author's personal copy
dangerous effects caused by local air pollutants (SO2, NOx andparticulate matter—PM10 and PM2.5) as well as to examine thesynergies between local and global pollutants. In fact, as wellknown, CO2 has a major role in the greenhouse effect, SO2 and NOx
emissions are primary contributors of acid rains, whereasparticulate matter (which is formed in the atmosphere bycondensation or the transformation of emitted gases such asSO2 and VOCs) is a main contributor to smog and causes manyadverse effects on human health and materials damage.
The total consumptions obtained in the four cases are prettysimilar to the ones obtained in the Reference scenario; however inthe Greenhouse case a further 0.6% reduction of energy consump-tion is achieved.
As concerns electricity production, a larger use of renewablefuels as well as of the technologies with a lower overallenvironmental impact can be noticed.
In particular, some differences in technology choice character-ise the four cases, even if conventional power plants are still usedon the overall time horizon and the most expensive newtechnologies, that require high investment costs, as PV are notchosen by the model.
In the Acidification case, mini-hydroelectric is the preferredtechnology (which is used at the maximum allowable capacity alsoin the Smog case).
In the Greenhouse and Mix cases the biomass plant substitutesconventional thermal power plants and, among renewabletechnologies wind power is the less used (�6% and �18%respectively).
In the Smog case, as already said mini-hydroelectric is thepreferred technology whereas the biomass plant is not activatedand wind power is the less used renewable technology, because ofits high contribution to this effect.
As concerns the synergies among local and global effects, theconstraints on Acidification and Smog induce a reduction ofgreenhouse effect of about 1%, CO2 emissions decreasing respec-tively 1.5%, 3%, 5.7% and 7.3% in the Smog, Acidification, Mix andGreenhouse cases.
Table 6 summarises the total emissions of TSP, VOC, NOx, SO2
and CO2 on the overall time horizon for the analysed scenarios (theminimum values are highlighted in bold). It can be seen that thelowest values for NOx and SO2 are obtained in the Mix case(respectively �0.05% and �1.19% respect to the BAU case), for TSPand VOC in Acidification and Smog (respectively �0.12% and�0.01%). As concerns CO2, the minimum is achieved obviously inthe Greenhouse case (�7.27% respect to the BAU case) but anoticeable reduction is observed also in the Mix case (�5.70%respect to the BAU case).
These data highlight the effectiveness of the constraints on theaggregated impacts that allow reducing single pollutants emis-sions emphasising at the same time the cause–effects relation-ships.
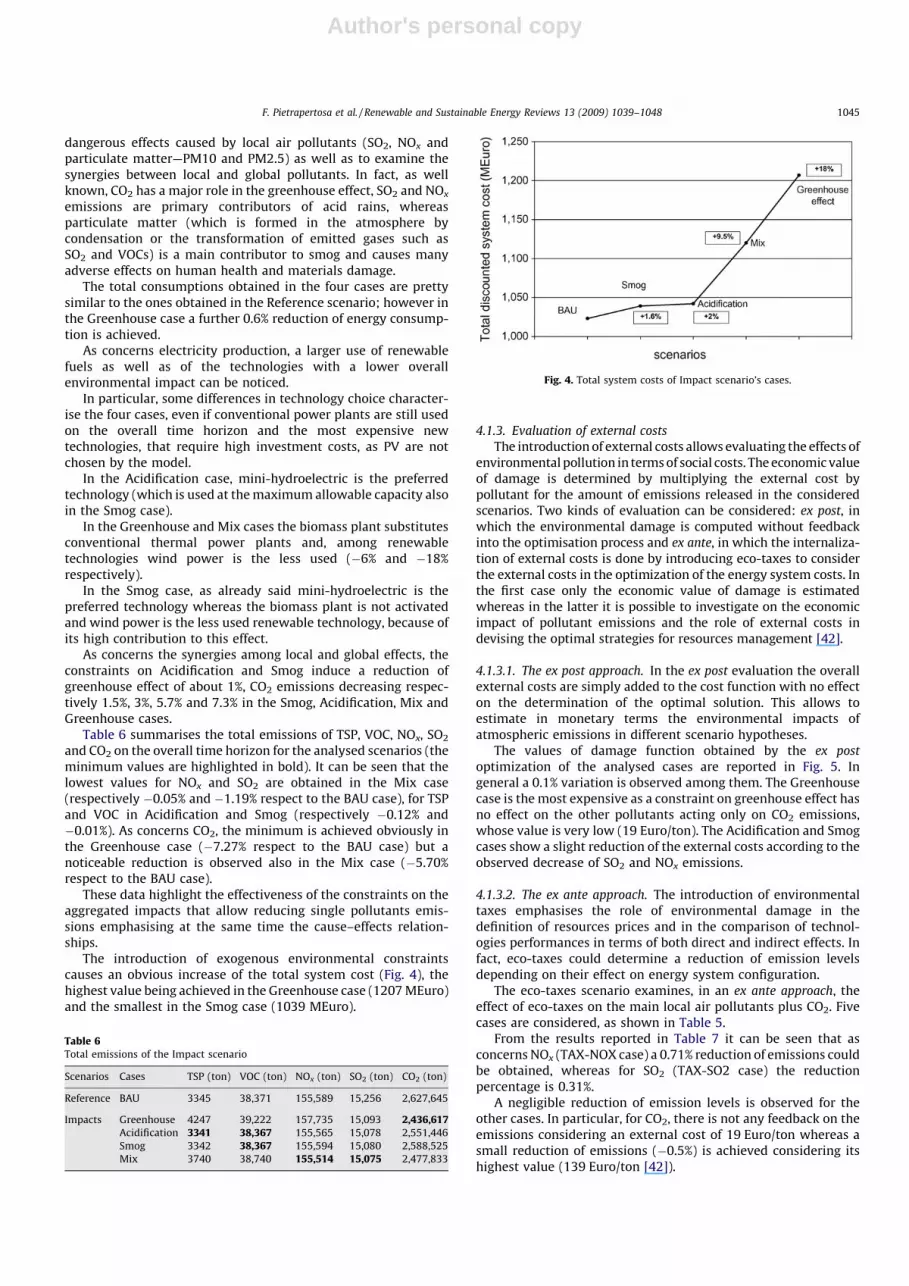
The introduction of exogenous environmental constraintscauses an obvious increase of the total system cost (Fig. 4), thehighest value being achieved in the Greenhouse case (1207 MEuro)and the smallest in the Smog case (1039 MEuro).
4.1.3. Evaluation of external costs
The introduction of external costs allows evaluating the effects ofenvironmental pollution in terms of social costs. The economic valueof damage is determined by multiplying the external cost bypollutant for the amount of emissions released in the consideredscenarios. Two kinds of evaluation can be considered: ex post, inwhich the environmental damage is computed without feedbackinto the optimisation process and ex ante, in which the internaliza-tion of external costs is done by introducing eco-taxes to considerthe external costs in the optimization of the energy system costs. Inthe first case only the economic value of damage is estimatedwhereas in the latter it is possible to investigate on the economicimpact of pollutant emissions and the role of external costs indevising the optimal strategies for resources management [42].
4.1.3.1. The ex post approach. In the ex post evaluation the overallexternal costs are simply added to the cost function with no effecton the determination of the optimal solution. This allows toestimate in monetary terms the environmental impacts ofatmospheric emissions in different scenario hypotheses.
The values of damage function obtained by the ex post
optimization of the analysed cases are reported in Fig. 5. Ingeneral a 0.1% variation is observed among them. The Greenhousecase is the most expensive as a constraint on greenhouse effect hasno effect on the other pollutants acting only on CO2 emissions,whose value is very low (19 Euro/ton). The Acidification and Smogcases show a slight reduction of the external costs according to theobserved decrease of SO2 and NOx emissions.
4.1.3.2. The ex ante approach. The introduction of environmentaltaxes emphasises the role of environmental damage in thedefinition of resources prices and in the comparison of technol-ogies performances in terms of both direct and indirect effects. Infact, eco-taxes could determine a reduction of emission levelsdepending on their effect on energy system configuration.
The eco-taxes scenario examines, in an ex ante approach, theeffect of eco-taxes on the main local air pollutants plus CO2. Fivecases are considered, as shown in Table 5.
From the results reported in Table 7 it can be seen that asconcerns NOx (TAX-NOX case) a 0.71% reduction of emissions couldbe obtained, whereas for SO2 (TAX-SO2 case) the reductionpercentage is 0.31%.
A negligible reduction of emission levels is observed for theother cases. In particular, for CO2, there is not any feedback on theemissions considering an external cost of 19 Euro/ton whereas asmall reduction of emissions (�0.5%) is achieved considering itshighest value (139 Euro/ton [42]).
Table 6Total emissions of the Impact scenario
Scenarios Cases TSP (ton) VOC (ton) NOx (ton) SO2 (ton) CO2 (ton)
Reference BAU 3345 38,371 155,589 15,256 2,627,645
Impacts Greenhouse 4247 39,222 157,735 15,093 2,436,617Acidification 3341 38,367 155,565 15,078 2,551,446
Smog 3342 38,367 155,594 15,080 2,588,525
Mix 3740 38,740 155,514 15,075 2,477,833
Fig. 4. Total system costs of Impact scenario’s cases.
F. Pietrapertosa et al. / Renewable and Sustainable Energy Reviews 13 (2009) 1039–1048 1045

Author's personal copy
Besides a straightforward effect on the related pollutants,the eco-taxes induce a reduction of the emission levels ofcorrelated untaxed pollutants that in some cases is higher thatthe one achieved in the correspondent case (Table 7). As anexample, the eco-tax on NOx induces a 0.18% decrease of TSPemissions whereas the one obtained in the TAX-TSP case is0.03%. The same happens for VOC emissions that seem to be notinfluenced by a direct eco-tax, but show a slight decrease(0.03%) under a tax on NOx. A similar behavior can be observedalso for CO2, whose emissions decrease 0.79% in the case TAX-SO2.
To highlight the synergies among pollutants, the additionalcase TAX-TOT was thus defined including in the model the eco-taxes of the whole set of pollutants (CO2, NOx, SO2, TSPand VOC). The optimization of such a case induces a decrease ofthe emissions of all the pollutants considered. In particular,for NOx, TSP and VOC the maximum allowable percentagesare achieved (respectively: �0.71%; �0.18% and �0.03%)whereas SO2 and NOx decrease respectively 0.13 and 0.04%.Comparing these results with the ones obtained for the Impactsscenario it could be seen that a tax on NOx emissions is effec-tive not only for NOx but also for TSP and VOC that achieve inthis case the lowest values. On the contrary, for SO2 andCO2 a constraint on the related impact categories is moreeffective.
The total discounted system’s costs obtained in the ex post andex ante approach, including the external costs on all the pollutantsare respectively 2039 MEuro (BAU case) and 1959 MEuro (TAX-TOT case), highlighting that a 4% of cost reduction could beachieved including the environmental taxes in the objectivefunction.
5. Conclusions
The integration of partial equilibrium models with LCA andExternE allows to estimate in depth the overall environmentalimpact due to anthropogenic activities and to devise sustainablestrategies for energy systems development that include the socialcosts due to atmospheric pollution. In this framework the MARKALmodels generator structure is particularly suitable to integrate theparameters coming from the different methodologies into a uniquemodeling platform achieving their operative integration and along-term evaluation of the effects of environmental damage alsofrom an economic point of view.
In this paper a soft linking between LCA, ExternE andComprehensive Analysis is presented, with reference to a localcase study (Val d’Agri energy system) being focused to bettercharacterise the impact of oil mining activities and the role ofREMS in energy supply. The scenario analysis shows once morethat efficiency increase and energy saving are privileged tools fordriving a steady reduction of energy consumption, whereasrenewable energy sources have a key role in the supply systembut need an in depth characterisation of the construction anddismantling phases, that may contribute heavily to environmentaldamage.
In this sense, the integration with LCA is particularlyimportant for the full evaluation of environmental impact ofendogenous anthropogenic activities, emphasising the role of thesupply system as well as the limits of RES technologiesimplementation.
As concerns the integration of externalities, eco-taxes areimportant to estimate fair prices of resources and to promote theuse of eco-compatible technologies and resources. In fact,including the environmental component in the costs of goodsand services, it is possible to reduce the cost gap among traditionaland innovative technologies.
As concerns local scale investigations, an in depth knowledge ofthe territorial peculiarity is a prerequisite to reduce uncertaintyand to get sound results effectively implementable.
To conclude, this work set the basis for defining a generalapplicable methodology that could drive to the definition ofadvanced support tools for decision makers that can assure thecoherence of strategies at different time and spatial scales,demonstrating a fundamental importance for the assessmentand the implementation of energy-environmental policies.
Fig. 5. Total external costs (ex post evaluation).
Table 7Total pollutant emissions on the full time horizon—eco-tax scenario
Scenarios Cases TSP (ton) VOC (ton) NOx (ton) SO2 (ton) CO2 (ton)
Reference BAU 3345 38,371 155,589 15,256 2,627,645
Eco-taxes TAX-CO2 3345 38,371 155,589 15,256 2,627,645
TAX-NOX 3339 38,361 154,488 15,260 2,628,419
TAX-SO2 3346 38,371 155,625 15,208 2,648,299
TAX-TSP 3345 38,371 155,585 15,255 2,627,645
TAX-VOC 3345 38,371 155,585 15,255 2,627,645
TAX-TOT 3339 38,360 154,480 15,236 2,626,567
F. Pietrapertosa et al. / Renewable and Sustainable Energy Reviews 13 (2009) 1039–10481046

Author's personal copy
Acknowledgements
This research constitute integral part of the PhD thesis ofFilomena Pietrapertosa and was carried out with the financialsupport of the Italian Ministry of University and Research in theframework of the National Operational Programme ‘‘ScientificResearch, Technological Development, Higher Training 2000–2006’’ Project ‘‘Development of Industrial Districts for EarthObservation COS(OT)’’ under the scientific responsibility of Prof.V. Cuomo and Prof. M. Macchiato.
References
[1] VI EAP—Sixth Community Environment Action Programme. Decision no.1600/2002/CE of 22 July 2002Goedkoop M. The Eco-indicator 95. Final Report; 1996.
[2] Rafaj P, Kypreos S. Internalisation of external cost in the power generationsector: analysis with Global Multi-regional MARKAL model. Energy Policy2007;35:828–43.
[3] Munksgaard J, Ramskov J. Effect of internalising external production costs in aNorth European power market. Energy Policy 2002;30:501–10.
[4] SETAC—Society of Environmental Toxicology and Chemistry. http://www.se-tac.org/.
[5] Senthil Kumaran D, Ong SK, Nee AYC, Tan Reginald BH. A proposed tool tointegrate environmental and economical assessments of products. EnvironImpact Assess Rev 2003;23:51–72.
[6] Rebitzer G, Loerincik Y, Jolliet O. Input–Output Life Cycle Assessment: fromtheory to applications. 16th Discussion forum on Life Cycle Assessment. Int JLCA 2002;7:174–6.
[7] Suh S, Lenzen M, Treloar GJ, Hondo H, Horvath A, Huppes G, et al. Systemboundary selection in life-cycle inventories using hybrid approaches. EnvironSci Technol 2004;38:657–64.
[8] GEMIS—Global Emission Model for Integrated Systems database available atOko-Institut website: www.oeko.de.
[9] Reinhard J, editor. A Guidebook for Advanced Local Energy Planning. Bietigh-eim-Bissingen, Germany: Fachinstitut Gebaude Klima e.V (FGH); 2000.
[10] Fishbone LG, Abilock H. MARKAL a linear-programming model for energysystems analysis: technical description of the BNL version. Int J Energy Res1981;5:353–75.
[11] Seebregts Ad J, Goldstein GA, Smekens K. Energy/environmental modellingusing the MARKAL family of models. In: Proceedings of the OR2001 confer-ence, energy and environment session; 2001.
[12] ETSAP—Energy Technology Systems Analysis Programme. www.etsap.org.[13] Fishbone LG, Giesen G, Goldstein G, Hymmen HA, Stocks KJ, Vos H, et al. User’s
Guide for MARKAL (BNL/KFA version 2.0). BNL-51701. Upton, New York, USA/Julich, Germany: Department of Applied Science, Brookhaven National Labora-tory/Kernforschungsanlage Julich (KFA Julich); 1983.
[14] Fragniere E, Haurie A. A stochastic programming model for energy/environ-mental choices under uncertainty. Integrated regional health and environ-mental risk assessment and safety management. Int J Environ Pollut1996;6:587–603.
[15] Goldstein GA, Hill D. Getting started with PC-MARKAL and the MARKAL User’ssupport system. Petten, the Netherlands: ECN; 1996.
[16] Manne AS, Wene CO. MARKAL-MACRO: a linked model for energy economyanalysis, BNL-47161. Upton, NY, USA: Brookhaven National Laboratory; 1992.
[17] Loulou R, Goldstein G, Noble K. Documentation for the MARKAL Family ofModels. October 2004 available at www.etsap.org.
[18] ExternE project website: http://www.externe.info/.[19] European Commission, DG XII Science, Research and Development. ExternE—
Externalities of Energy. Methodology Annexes; 1995.[20] Krewitt W. External costs of energy—do the answers match the questions?
Looking back at 10 years of ExternE. Energy Policy 2002;30:839–48.[21] European Commission, DGXII, Science, Research and Development, JOULE.
Externalities of Fuel Cycles ‘‘ExternE’’ Project. Report 1, Summary; 1995.[22] European Commission, DGXII, Science, Research and Development, JOULE.
Externalities of Fuel Cycles ‘‘ExternE’’ Project. Report 2, Methodology; 1995.[23] European Commission, DGXII, Science, Research and Development, JOULE.
Externalities of Fuel Cycles ‘‘ExternE’’ Project. Report 3, Coal and Lignite FuelCycles; 1995.
[24] European Commission, DGXII, Science, Research and Development, JOULE.Externalities of Fuel Cycles ‘‘ExternE’’ Project. Report 4, Oil and Gas FuelCycles; 1995.
[25] European Commission, DGXII, Science, Research and Development, JOULE.Externalities of Fuel Cycles ‘‘ExternE’’ Project. Report 5, Nuclear Fuel Cycle;1995.
[26] European Commission, DGXII, Science, Research and Development, JOULE.Externalities of Fuel Cycles ‘‘ExternE’’ Project. Report 6, Wind and Hydro FuelCycles; 1995.
[27] New Energy Externalities Development for Sustainability—NEEDS projectwebsite: http://www.needs-project.org/index.asp.
[28] Cost Assessment for Sustainable Energy Systems—CASES project website:http://www.feem-project.net/cases/.
[29] Tosato G, Van Regemorter D. Internalising externalities in MARKAL-TIMESmodels, a contribution of different approaches. In: Annual meeting of theInternational Energy Workshop jointly organized by EMF/IEA/IIASA; 2003.
[30] Weiner David. Life Cycle Assessment of Energy Systems. Energy SystemsTechnology—Annual Report 1997, vol. 1; 1998, p. 16–8.
[31] Goedkoop M. The Eco-indicator 95. Final Report; 1996.[32] Proost S, Van Regemorter D. Energy, Transport and Environment. Working
Paper Series no. 2001-16 Interaction between Local Air Pollution and GlobalWarming Policy and its Policy Implications; 2003.
[33] http://www.assomineraria.org/2006.[34] http://www.eni.it2006.[35] Pietrapertosa F, Cosmi C, Macchiato M, Marmo G, Salvia M. Comprehensive
modelling for approaching the Kyoto targets on a local scale. Renew SustainEnergy Rev 2003;7:249–70.
[36] PER—Regional Energy Plan of Basilicata Region. Official Bulletin of BasilicataRegion no. 64; 18 September 2001 [in Italian].
[37] GRTN—Gestore Rete Trasmissione Nazionale. Dati statistici sull’energia elet-trica in Italia [Statistical data on electricity in Italy]; 2000 [in Italian]. Availableat http://www.grtn.it.
[38] ENEA—Rapporto Energia e Ambiente. I dati [Report on Energy and Environ-ment. The data]; 2000 [in Italian].
[39] ISTAT Italian Statistical Institute—Censimento dell’industria [Industrial cen-sus]; 1997 [in Italian].
[40] ISTAT Italian Statistical Institute—148 Censimento Generale della Popolazionee delle Abitazioni [14th General Population and Housing Census]; 2001 [inItalian].
[41] Holland M, Watkiss P. BeTa—Benefits Table database: estimates of the mar-ginal external costs of air pollution in Europe. Version E1.02a. Created forEuropean Commission DG Environment by netcen. Available at: http://euro-pa.eu.int/comm/environment/enveco/air/betaec02a.pdf; 1999.
[42] Hamacher T, Saez RM, Aquilonius K, Cabal H, Hallberg B, Korhonen R, et al. Acomprehensive evaluation of the environmental external costs of a fusionpower plant. Fusion Eng Des 2001;56–57:95–103.
[43] Smekens K, van der Zwaan B. Atmospheric and geological CO2 damage costs inenergy scenarios. Environ Sci Policy 2006;9:217–27.
[44] Lechon, Y, Saez R, Cabal H, Schneider T, Lepicard S, Vaillant L, et al. Socio-Economic Research on Fusion SERF3. External Costs of Fusion. CIEMAT. ISBN:84-7834-453-5 (2003).
Filomena Pietrapertosa is researcher at IMAA-CNR since June 2005. Her
main activity deals with energy system analysis using the ETSAP/IEA model
generators to identify sustainable development strategies, with particular
reference to the investigation on the contribution of renewable and high efficient
technologies at local and national scale. Recent activities include the devel-
opment of a consistent analytical platform in which MARKAL model, LCA and
ExternE methodologies are linked to provide a comprehensive computation of
the environmental impacts of the energy systems and to internalise environ-
mental damage costs (externalities). She is fully involved in the FP6 Integrated
Project ‘‘NEEDS’’, in the IEE RES2020 and FP7 REACCESS Projects, where
her work is mainly focused on analysing the Italian energy system in the
framework of a Pan-European modelling platform.
Carmelina Cosmi is researcher at IMAA-CNR since March 1998. Her
current research interests’ deal with energy system analysis with regard to
the characterisation of the impact of anthropogenic activities on environment
and multi-objective data analysis. Most of her research activities have been
carried out in the framework of the Energy Technology Systems Analysis
Programme (ETSAP) of the International Energy Agency (IEA). From 1994 she
has being coordinating the research activities of the research line ‘‘Environ-
mental modelling and planning’’, in the framework of the CNR Project
‘‘Sustainability of Environmental systems’’. Currently she is participating to
the IMAA-CNR activities performed in the framework of the FP6 IP NEEDS
and in the FP7 REACCESS CP, and she acts as scientific responsible of the
IMAA-CNR participation to the IEE RES2020 Project.
Maria Macchiato is full professor of Physics at the University of Naples
Federico II. Her main areas of interests concerns: integrated methodologies for
environmental planning; physical methodologies for the dynamical character-
isation of geophysical and environmental processes; in situ measurements of
atmospheric particulate to characterise heavy metal content; integrated che-
mical and geophysical techniques for soil monitoring in contaminated sites. In
recent years, she has been coordinating several national and international
projects concerning sustainable energy systems management and strategies
for local and GHG emissions reduction. On behalf of INFM-CNR she has been
responsible of the activities related to environmental modelling at DSF (Depart-
F. Pietrapertosa et al. / Renewable and Sustainable Energy Reviews 13 (2009) 1039–1048 1047

Author's personal copy
ment of Physics Sciences) of the University Federico II of Naples. As concerns
this thematic area, she is involved in the FP6 Integrated Project NEEDS, leading
the participation of INFM-CNR.
Monica Salvia is researcher at IMAA-CNR since April 2001. In 2003 she was
a Visiting Researcher at Centre for Social and Economic Research on the Global
Environment (CSERGE, England), funded by a NATO-CNR fellowship. Her
main areas of interests concern the field of modelling for waste management and
energy systems. During these years, she has been taking part in several national
and international research projects in the field of energy environmental plan-
ning, participating actively at the ETSAP/IEA Programme activities. At present
she is involved in the FP6 Integrated Project ‘‘NEEDS’’, in the IEE RES2020
Project and acts as scientific responsible of the IMAA-CNR participation to the
FP7 REACCESS Project.
Vincenzo Cuomo, since 1993, is Director of the Institute of Methodol-
ogies for Environmental Analysis (IMAA) of the Italian National Research
Council (CNR). Since 1975, the main topics of his research dealt with
environmental physics, being focused on: earth observation by satellite;
airborne and ground based instrumentation; development of new advanced
sensors for observation from space; monitoring and control of environmental
processes; protection against and prevention of natural risks; energy and
environmental planning.He is member of Scientific Committee of Italian
Space Agency, member of Scientific Committee of CNIT (National Inter-
University Consortium for Telecommunications), chair of the Italian Coor-
dination Group of Earth Observation, coordinator of projects funded by
U.E., ESA, EUMETSAT, National Research Council, Italian Minister of
University and Research, Italian Space Agency, Italian Institute of Physics
Matter.
F. Pietrapertosa et al. / Renewable and Sustainable Energy Reviews 13 (2009) 1039–10481048