Embed Size (px)
Citation preview
Florida International UniversityFIU Digital Commons
FIU Electronic Theses and Dissertations University Graduate School
11-7-2007
Life Cycle of Deccan Trap Magma Chambers: ACrystal Scale Elemental and Strontium IsotopicInvestigationMelroy R. BorgesFlorida International University, [email protected]
DOI: 10.25148/etd.FI08081505Follow this and additional works at: https://digitalcommons.fiu.edu/etd
This work is brought to you for free and open access by the University Graduate School at FIU Digital Commons. It has been accepted for inclusion inFIU Electronic Theses and Dissertations by an authorized administrator of FIU Digital Commons. For more information, please contact [email protected].
Recommended CitationBorges, Melroy R., "Life Cycle of Deccan Trap Magma Chambers: A Crystal Scale Elemental and Strontium Isotopic Investigation"(2007). FIU Electronic Theses and Dissertations. 10.https://digitalcommons.fiu.edu/etd/10
FLORIDA INTERNATIONAL UNIVERSITY
Miami, Florida
LIFE CYCLE OF DECCAN TRAP MAGMA CHAMBERS: A CRYSTAL SCALE
ELEMENTAL AND STRONTIUM ISOTOPIC INVESTIGATION
A dissertation submitted in partial fulfillment of the
requirements for the degree of
DOCTOR OF PHILOSOPHY
in
GEOSCIENCES
by
Melroy R. Borges
2008
To: Dean Kenneth Furton College of Arts and Sciences
This dissertation, written by Melroy R. Borges, and entitled Life Cycle of Deccan Trap Magma Chambers: A Crystal Scale Elemental and Strontium Isotopic Investigation, having been approved in respect to style and intellectual content, is referred to you for judgment.
We have read this dissertation and recommend that it be approved.
_______________________________________
Grenville Draper
_______________________________________ Stephen Haggerty
_______________________________________
Andrew Macfarlane
_______________________________________ Surendra Saxena
_______________________________________
Michael Sukop
_______________________________________ Gautam Sen, Major Professor
Date of Defense: November 7, 2007
The dissertation of Melroy R. Borges is approved.
_______________________________________ Dean Kenneth Furton
College of Arts and Sciences
_______________________________________ Dean George Walker
University Graduate School
Florida International University, 2008
ii
iii
ACKNOWLEDGMENTS
I owe a tremendous debt of gratitude to a number of people who have helped me
grow intellectually, and survive my PhD at FIU with sanity more or less intact. Firstly, I
would like to thank Gautam Sen, my advisor, who has always encouraged and supported
me, and pushed me to aim high. My committee members Drs. Gren Draper, Steve
Haggerty, Andrew Macfarlane, Surendra Saxena and Mike Sukop have also been very
supportive, and have provided valuable guidance. I thank my collaborators in WSU, Dr.
John Wolff and Garret Hart, who along with Charles Knaack, Paul Olin, Richard Conrey
and Diane Johnson Cornelius helped me with my analyses, and made me feel at home in
Pullman. I also thank Dr. D. Chandrasekharam, Dr. Michael Higgins and Ayaz Alam for
help in the field.
I thank the FIU Graduate School for assisting my work through a Presidential
Fellowship and a Dissertation Year Fellowship.
I thank the members of the FIU Earth Sciences community who have been a great
help to me in various aspects of my work. Bonnie Boddicker, Rosa Necolardes and Yaniz
Gallimore deserve a special mention for diligently working out the various administrative
kinks endemic to FIU. Diane Pirie has always been helpful in making sure that our labs
are well stocked and run smoothly. Tom Beasley and Barbara Maloney of FCAEM have
not only provided valuable support to my research, but have also gone out of their way to
help me in other matters as well. Of course I cannot neglect all my friends at Miami who
have helped me keep a sunny disposition throughout my time here especially Shantanu,
Sedelia, Indra, Adriana, Jozsef, Yukary, Gari and Kishore: thank you all for helping me
enjoy Miami.
iv
I would like to thank my dear friends Jehangir Bhadha, Rahul Chopra and Maya
Dodd for their constant friendship, advice and home improvement tips. I would like to
thank my parents and sister for all their love and support.
Finally, I owe a deep debt of gratitude to Dr. S. Viladkar and Dr. R. K. Avasia of
St. Xavier’s College, Mumbai, India, for setting me on an intellectual journey that has
culminated in this degree; a journey that I hope to continue in my career as a geoscientist.
v
ABSTRACT OF THE DISSERTATION
LIFE CYCLE OF DECCAN TRAP MAGMA CHAMBERS: A CRYSTAL SCALE
ELEMENTAL AND STRONTIUM ISOTOPIC INVESTIGATION
by
Melroy R. Borges
Florida International University, 2008
Miami, Florida
Professor Gautam Sen, Major Professor
The Deccan Trap basalts are the remnants of a massive series of lava flows that
erupted at the K/T boundary and covered 1-2 million km2 of west-central India. This
eruptive event is of global interest because of its possible link to the major mass
extinction event, and there is much debate about the duration of this massive volcanic
event. In contrast to isotopic or paleomagnetic dating methods, I explore an alternative
approach to determine the lifecycle of the magma chambers that supplied the lavas, and
extend the concept to obtain a tighter constraint on Deccan’s duration. My method relies
on extracting time information from elemental and isotopic diffusion across zone
boundaries in individual crystals.
I determined elemental and Sr-isotopic variations across abnormally large (2-5
cm) plagioclase crystals from the Thalghat and Kashele “Giant Plagioclase Basalts” from
the lowermost Jawhar and Igatpuri Formations respectively in the thickest Western Ghats
section near Mumbai. I also obtained bulk rock major, trace and rare earth element
chemistry of each lava flow from the two formations. Thalghat flows contain only 12%
zoned crystals, with 87
Sr/86
Sr ratios of 0.7096 in the core and 0.7106 in the rim, separated
vi
by a sharp boundary. In contrast, all Kashele crystals have a wider range of 87
Sr/86
Sr
values, with multiple zones. Geochemical modeling of the data suggests that the two
types of crystals grew in distinct magmatic environments. Modeling intracrystalline
diffusive equilibration between the core and rim of Thalghat crystals led me to obtain a
crystal growth rate of 2.03x10⁻¹⁰
cm/s and a residence time of 780 years for the crystals in
the magma chamber(s). Employing some assumptions based on field and geochronologic
evidence, I extrapolated this residence time to the entire Western Ghats and obtained an
estimate of 25,000 – 35,000 years for the duration of Western Ghats volcanism. This
gave an eruptive rate of 30 – 40 km3/yr, which is much higher than any presently erupting
volcano. This result will remain speculative until a similarly detailed analytical-modeling
study is performed for the rest of the Western Ghats formations.
vii
TABLE OF CONTENTS
CHAPTER PAGE
I. INTRODUCTION .................................................................................................. 1
Large Igneous Provinces ................................................................................... 1 The Deccan Trap Basalts .................................................................................. 3 Crystal Isotope Stratigraphy ............................................................................. 8
II. ANALYTICAL METHODS ................................................................................ 15 Sample collection and preparation .................................................................. 15
Electron Microscopy ....................................................................................... 15 LA-ICPMS ...................................................................................................... 16 Data Correction ............................................................................................... 18
III. GEOCHEMISTRY OF THE JAWHAR AND IGATPURI
FORMATIONS..................................................................................................... 24 Stratigraphy of the Western Ghats .................................................................. 24
The Lowermost Deccan Formations ............................................................... 26 Giant Plagioclase Basalts ................................................................................ 26
Stratigraphy and Geochemistry of the Jawhar and Igatpuri Formations ........ 27
IV. OBSERVATIONS ON ZONING IN PLAGIOCLASE FROM THE
THALGHAT AND KASHELE GPB FLOWS..................................................... 47
A note on nomenclature used .......................................................................... 49 87
Sr/86
Sr Zoning in Thalghat GPB. ................................................................. 50 87
Sr/86
Sr Zoning in Kashele GPB. ................................................................... 51 Decoupled vs. non-decoupled zoning in An-content, trace element and
Sr-isotope composition ............................................................................. 52 Inferences from zoning in Thalghat and Kashele GPB .................................. 53
V. MODELING 87
SR/86
SR ZONING IN GIANT PLAGIOCLASE
CRYSTALS: IMPLICATIONS FOR DECCAN ERUPTION DURATION ....... 81
Introductory Remarks ..................................................................................... 81 Different cases of growth vs. diffusion: Application to the Thalghat
plagioclase................................................................................................. 82 Different initial and boundary conditions ....................................................... 87 Diffusion model results ................................................................................... 92
Calculation of crystal growth rates ................................................................. 94
Implications for Deccan eruptive rates ........................................................... 95
VI. DISCUSSION, CONCLUSIONS AND FUTURE WORK ............................... 112 Deccan Magma Chambers and growth of “giant” crystals ........................... 112 Comparative evaluation of previous models: Further discussion and a
new model ............................................................................................... 116

viii
Future research directions ............................................................................. 124
Summary of Conclusions .............................................................................. 124
LIST OF REFERENCES ................................................................................................ 135
APPENDIX ..................................................................................................................... 144
VITA ............................................................................................................................. 152
ix
LIST OF FIGURES
FIGURE PAGE
1. Figure 1.1. Geographical distribution of Large Igneous Provinces on Earth. .............11
2. Figure 1.2. Landsat Image of the Indian subcontinent showing the extent of
the Deccan Basalts. ......................................................................................................12
3. Figure 1.3. Exposure of Deccan lava flows in the Western Ghats. .............................13
4. Figure 1.4. Field photograph of a Giant Plagioclase Basalt from the Deccan
traps. .............................................................................................................................14
5. Figure 2.1. Photograph of the UP213 Nd-YAG laser used for Laser Ablation. ..........20
6. Figure 2.2. Photograph of the HR-ICPMS used for trace element analysis. ...............22
7. Figure 2.3. Photograph of the MC-ICPMS used for isotopic analyses. .......................23
8. Figure 3.1. The three spatial subdivisions of the Deccan lavas. ..................................32
9. Figure 3.2. Le Maitre classification of lava flows from the Jawhar and Igatpuri
Formations. ..................................................................................................................36
10. Figure 3.3 Stratigraphic variation of Mg# and 87
Sr/86
Sr in the Jawhar and
Igatpuri Formations. .....................................................................................................39
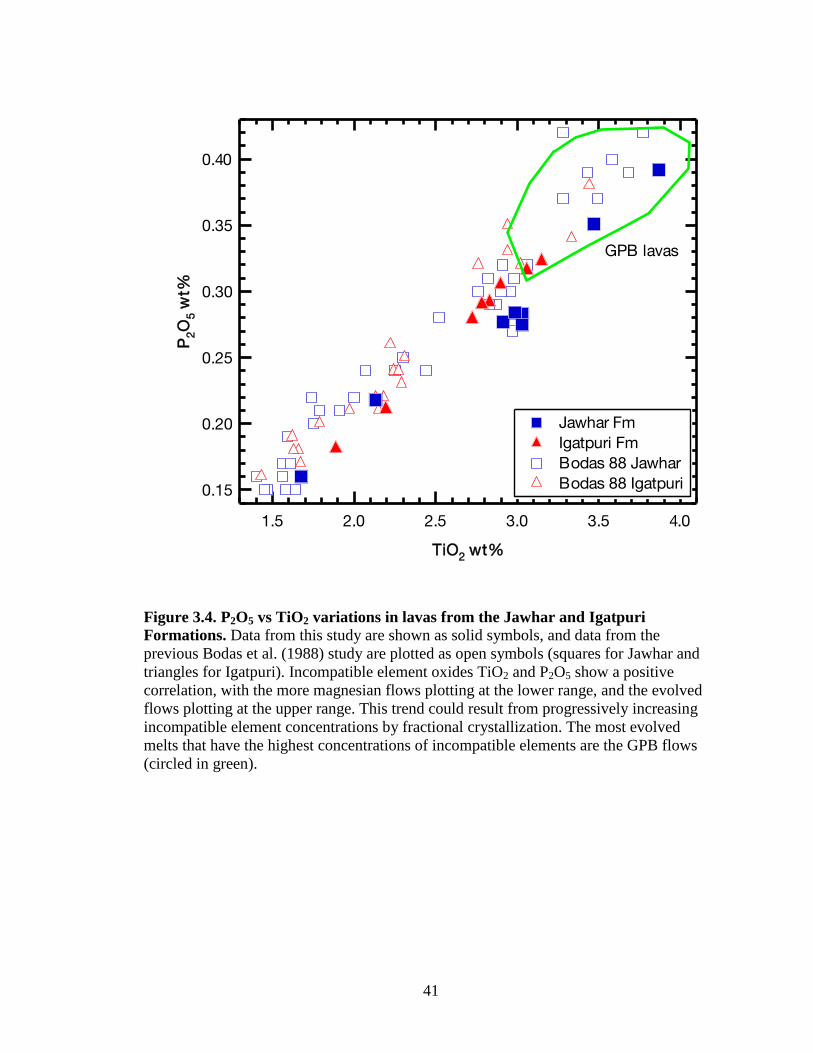
11. Figure 3.4. P2O5 vs TiO2 variations in lavas from the Jawhar and Igatpuri
Formations. ..................................................................................................................41
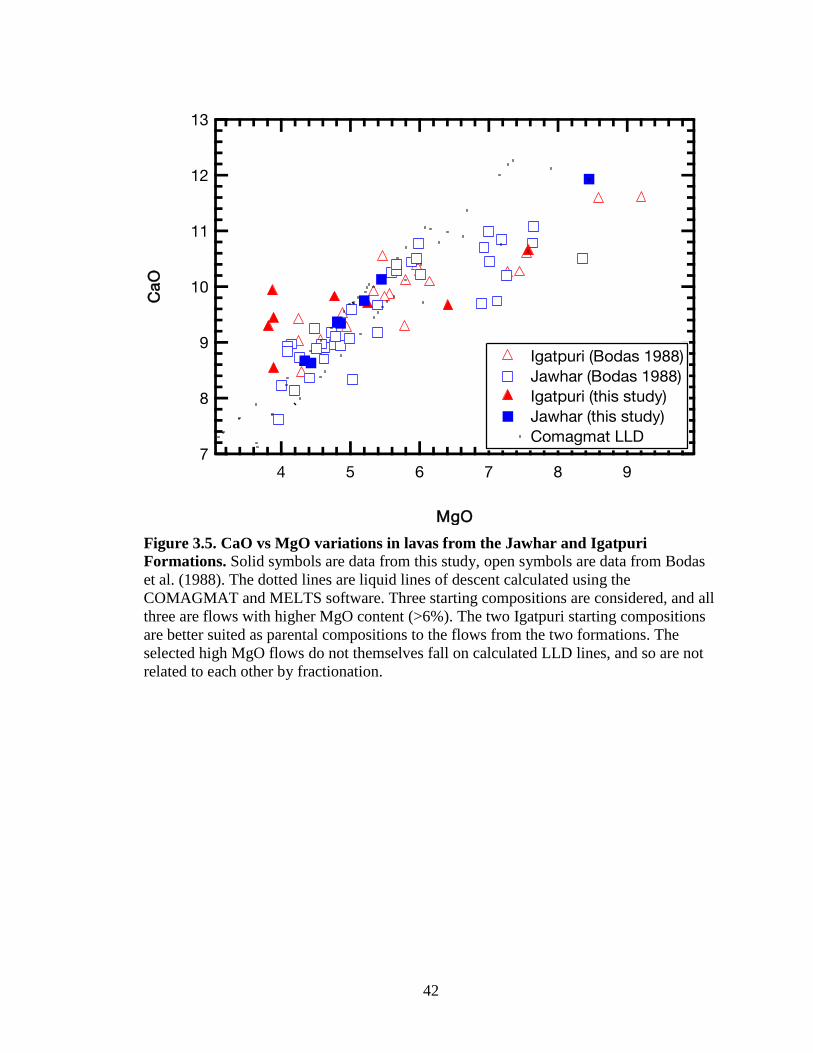
12. Figure 3.5. CaO vs MgO variations in lavas from the Jawhar and Igatpuri
Formations. ..................................................................................................................42
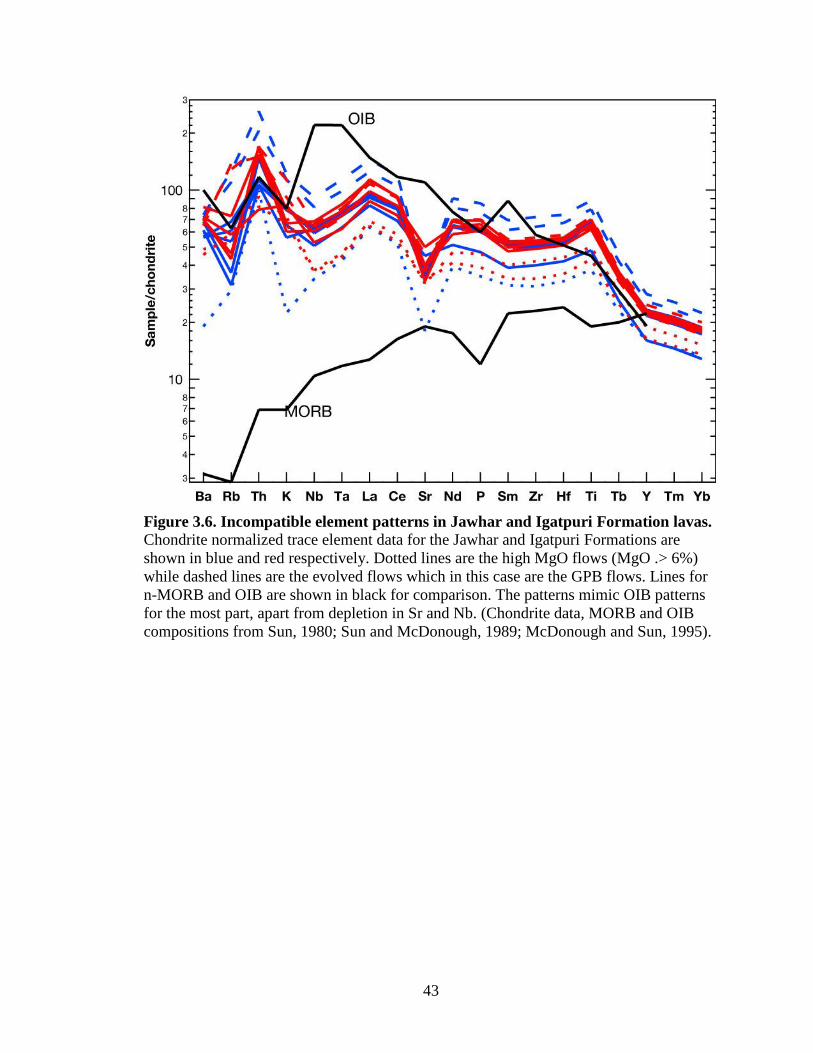
13. Figure 3.6. Incompatible element patterns in Jawhar and Igatpuri Formation
lavas. ............................................................................................................................43
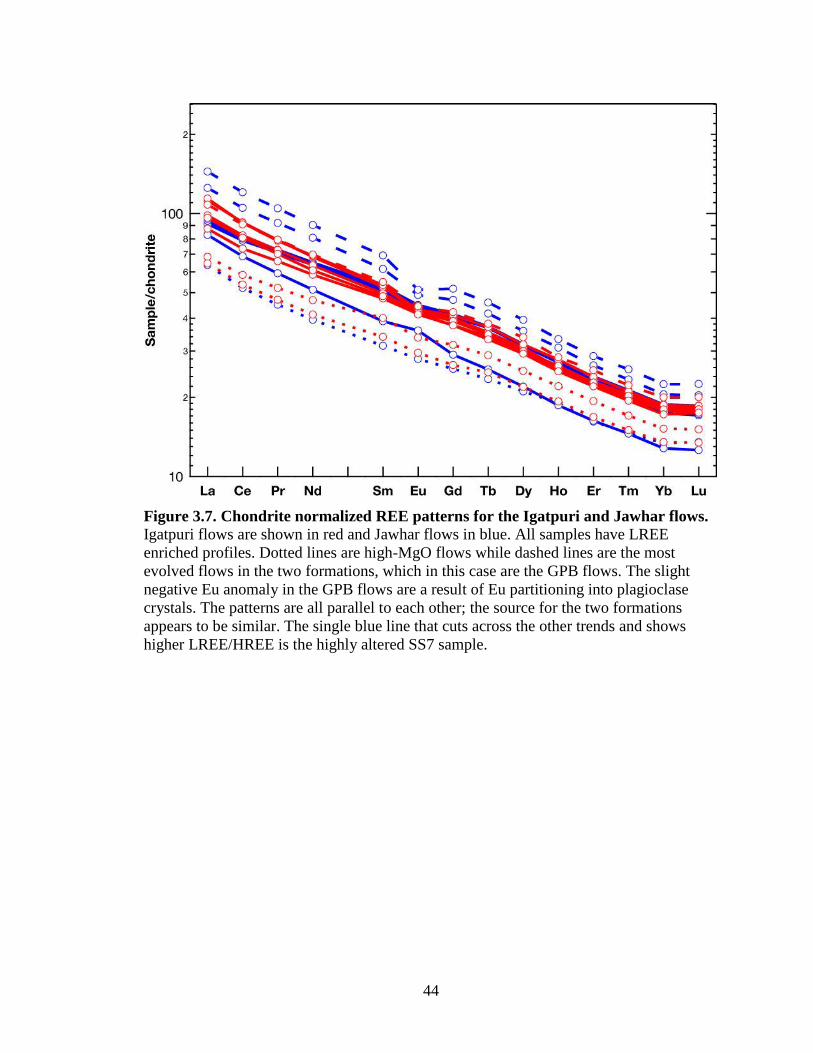
14. Figure 3.7. Chondrite normalized REE patterns for the Igatpuri and Jawhar
flows. ............................................................................................................................44
15. Figure 3.8. 87
Sr/86
Sr vs Mg# variations in lavas from the Jawhar and Igatpuri
Formations. ..................................................................................................................45
16. Figure 3.9. TiO2 and Zr variations in GPB lavas from the Deccan Traps. ..................46
17. Figure 4.1. Oscillatory zoning in a giant plagioclase crystal. ......................................58
x
18. Figure 4.2. CL images of zoned and unzoned plagioclase from the Thalghat
GPB. .............................................................................................................................60
19. Figure 4.3. CL image of a typical Kashele plagioclase phenocryst. ............................62
20. Figure 4.4. Sr isotope variations in unzoned Thalghat GPB crystals. .........................63
21. Figure 4.5. Zoning in crystal SS23A_tr2 from the Thalghat GPB. .............................65
22. Figure 4.6. Zoning in crystal SS23A_tr2 from the Thalghat GPB. .............................66
23. Figure 4.7. Zoning in crystal SS16A_tr1 from the Kashele GPB. ...............................68
24. Figure 4.8. Zoning in crystal SS16A_tr2 from the Kashele GPB. ...............................69
25. Figure 4.9. Zoning in crystal SS11_tr2 from the Kashele GPB. ..................................71
26. Figure 4.10 Zoning in crystal SS11B from the Kashele GPB. ....................................73
27. Figure 4.11. Zoning in crystal SS11_tr1 from the Kashele GPB.................................75
28. Figure 4.12. Schematic for Sr isotopic zoning in Kashele crystals. ............................77
29. Figure 4.13. Correlation between crystal zones and flow compositions. ....................79
30. Figure 5.1. Schematic of crystal growth and diffusion. ...............................................98
31. Figure 5.2. 87
Sr/86
Sr variation in zoned crystals from the Thalghat GPB. ...................99
32. Figure 5.3. Schematic showing decoupled growth and diffusion. .............................100
33. Figure 5.4. Compositional variations resulting from interfering growth and
diffusion processes. ....................................................................................................101
34. Figure 5.5. Compositional variations resulting from non-interfering growth
and diffusion. .............................................................................................................102
35. Figure 5.6. Comparison of growth rate and diffusion rate over similar
timescales. ..................................................................................................................103
36. Figure 5.7. Diffusion profiles calculated assuming no initial zoning. .......................105
37. Figure 5.8. Diffusion profile calculated assuming a lower initial core
composition. ...............................................................................................................106
38. Figure 5.9. Schematic of the effect of diffusion at the crystal – melt boundary. .......107
xi
39. Figure 5.10. Crystal zoning profile resulting from growth within a magma of
varying composition...................................................................................................108
40. Figure 5.11. Comparison of orthogonal zoning profiles from a single zoned
crystal. ........................................................................................................................109
41. Figure 5.12. Results of diffusion modeling of Thalghat plagioclase zoning
profiles. ......................................................................................................................110
42. Figure 6.1. Schematic of a solidification front magma chamber. ..............................127
43. Figure 6.2. Schematic of the Sen (2001) model of GPB formation. ..........................129
44. Figure 6.3. Schematic of the Higgins and Chandrasekharam (2007) model of
GPB formation. ..........................................................................................................131
45. Figure 6.4. Origin of zoning in Thalghat GPB. .........................................................133
46. Figure 6.5. Schematic of Kashele crystal growth in a magma conduit......................134
1
CHAPTER I
INTRODUCTION
Large Igneous Provinces
Large volume basaltic eruptions, variously called Flood Basalts, Continental
Flood Basalts (CFBs) or Large Igneous Provinces (LIPs), have occurred sporadically on
Earth over geologic time. Such eruptions create volcanic provinces consisting of flow
upon flow of mostly tholeiitic lava and the erupted volumes of lava are on the order of
millions of cubic km with some reaching as much as 40 million cubic km (the Ontong
Java Plateau in the western Pacific ocean). LIPs vary greatly in present-day areal extent,
but most are thought to have covered areas larger than a million square km when
originally erupted (Eldholm and Coffin, 2000; Courtillot and Renne). Many CFBs are
found on continent margins, coinciding with the initiation of rifting – for example, the
Parana-Etendeka province, the Deccan Province (Courtillot et al., 1999). Others occur in
the middle of continents and oceanic basins, like the Ontong Jawa Plateau and the
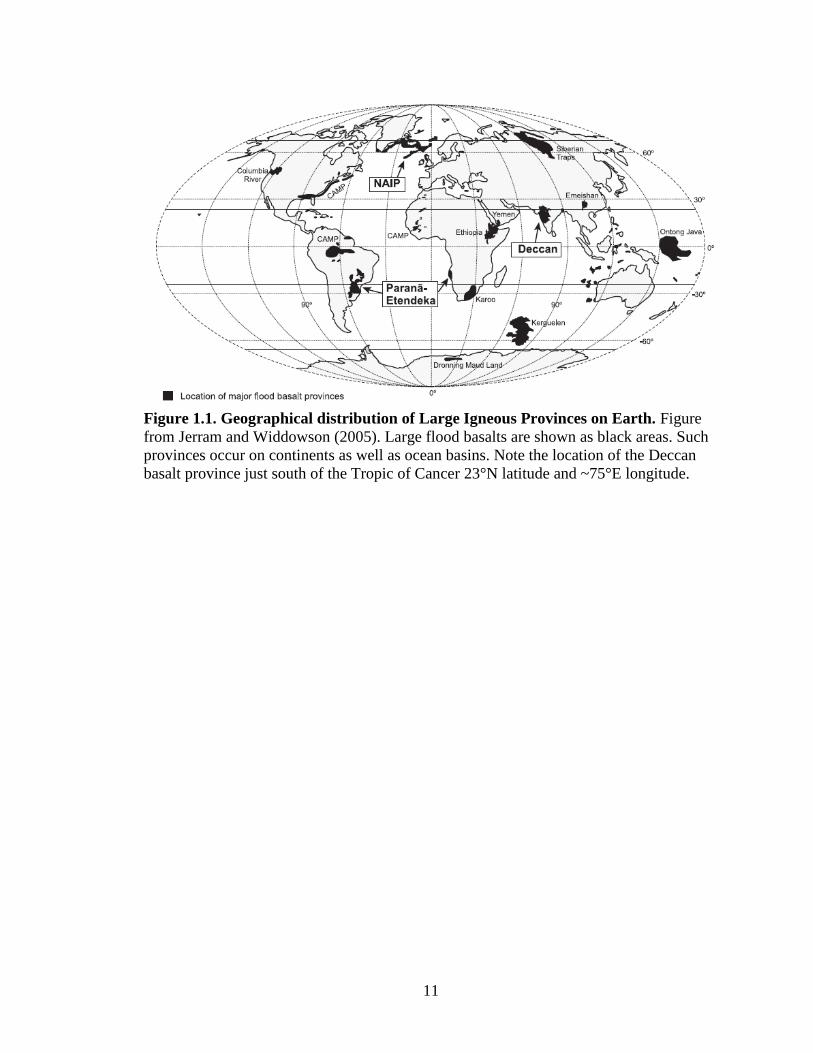
Siberian Traps. Figure 1.1 shows the current location and extent of LIPs on Earth’s
surface (from Jerram and Widdowson, 2005). In spite of very large volumes of such
provinces, the eruptive durations are short, in the order of a few million years, and ~75-
90% of the final volume seems to have erupted within a single pulse that did not last
more than 1 Ma. (e.g. Courtillot and Renne, 2003). Flood basalt eruptions have been
associated with extinction events due to the coincidence of many of the eruptive events
with mass extinction or oceanic anoxia events (Rampino and Stothers, 1988; Courtillot
and Renne, 2003).
2
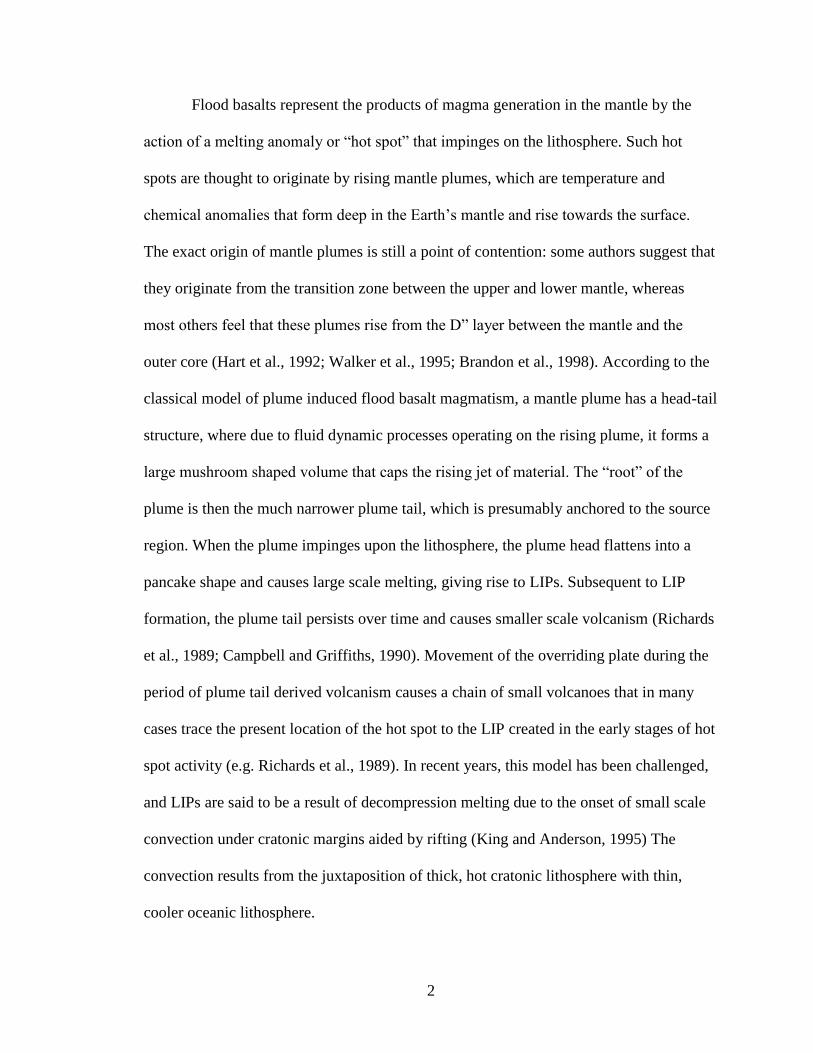
Flood basalts represent the products of magma generation in the mantle by the
action of a melting anomaly or “hot spot” that impinges on the lithosphere. Such hot
spots are thought to originate by rising mantle plumes, which are temperature and
chemical anomalies that form deep in the Earth’s mantle and rise towards the surface.
The exact origin of mantle plumes is still a point of contention: some authors suggest that
they originate from the transition zone between the upper and lower mantle, whereas
most others feel that these plumes rise from the D” layer between the mantle and the
outer core (Hart et al., 1992; Walker et al., 1995; Brandon et al., 1998). According to the
classical model of plume induced flood basalt magmatism, a mantle plume has a head-tail
structure, where due to fluid dynamic processes operating on the rising plume, it forms a
large mushroom shaped volume that caps the rising jet of material. The “root” of the
plume is then the much narrower plume tail, which is presumably anchored to the source
region. When the plume impinges upon the lithosphere, the plume head flattens into a
pancake shape and causes large scale melting, giving rise to LIPs. Subsequent to LIP
formation, the plume tail persists over time and causes smaller scale volcanism (Richards
et al., 1989; Campbell and Griffiths, 1990). Movement of the overriding plate during the
period of plume tail derived volcanism causes a chain of small volcanoes that in many
cases trace the present location of the hot spot to the LIP created in the early stages of hot
spot activity (e.g. Richards et al., 1989). In recent years, this model has been challenged,
and LIPs are said to be a result of decompression melting due to the onset of small scale
convection under cratonic margins aided by rifting (King and Anderson, 1995) The
convection results from the juxtaposition of thick, hot cratonic lithosphere with thin,
cooler oceanic lithosphere.
3
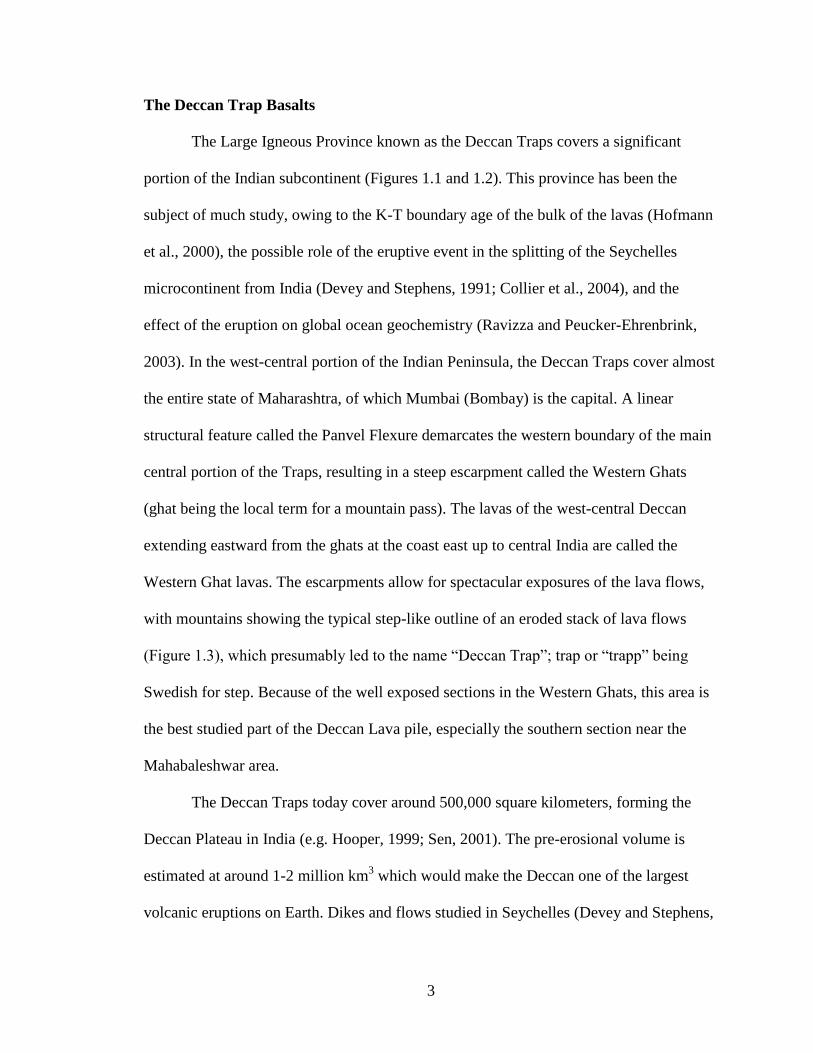
The Deccan Trap Basalts
The Large Igneous Province known as the Deccan Traps covers a significant
portion of the Indian subcontinent (Figures 1.1 and 1.2). This province has been the
subject of much study, owing to the K-T boundary age of the bulk of the lavas (Hofmann
et al., 2000), the possible role of the eruptive event in the splitting of the Seychelles
microcontinent from India (Devey and Stephens, 1991; Collier et al., 2004), and the
effect of the eruption on global ocean geochemistry (Ravizza and Peucker-Ehrenbrink,
2003). In the west-central portion of the Indian Peninsula, the Deccan Traps cover almost
the entire state of Maharashtra, of which Mumbai (Bombay) is the capital. A linear
structural feature called the Panvel Flexure demarcates the western boundary of the main
central portion of the Traps, resulting in a steep escarpment called the Western Ghats
(ghat being the local term for a mountain pass). The lavas of the west-central Deccan
extending eastward from the ghats at the coast east up to central India are called the
Western Ghat lavas. The escarpments allow for spectacular exposures of the lava flows,
with mountains showing the typical step-like outline of an eroded stack of lava flows
(Figure 1.3), which presumably led to the name “Deccan Trap”; trap or “trapp” being
Swedish for step. Because of the well exposed sections in the Western Ghats, this area is
the best studied part of the Deccan Lava pile, especially the southern section near the
Mahabaleshwar area.
The Deccan Traps today cover around 500,000 square kilometers, forming the
Deccan Plateau in India (e.g. Hooper, 1999; Sen, 2001). The pre-erosional volume is
estimated at around 1-2 million km3 which would make the Deccan one of the largest
volcanic eruptions on Earth. Dikes and flows studied in Seychelles (Devey and Stephens,
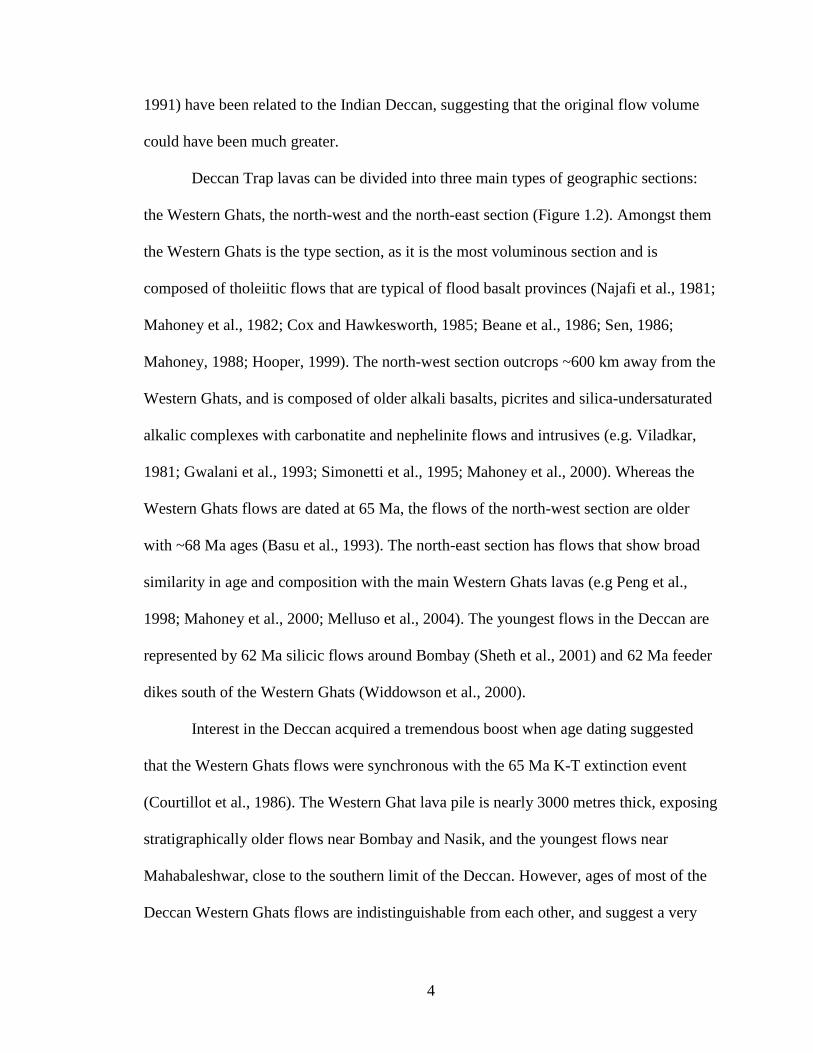
4
1991) have been related to the Indian Deccan, suggesting that the original flow volume
could have been much greater.
Deccan Trap lavas can be divided into three main types of geographic sections:
the Western Ghats, the north-west and the north-east section (Figure 1.2). Amongst them
the Western Ghats is the type section, as it is the most voluminous section and is
composed of tholeiitic flows that are typical of flood basalt provinces (Najafi et al., 1981;
Mahoney et al., 1982; Cox and Hawkesworth, 1985; Beane et al., 1986; Sen, 1986;
Mahoney, 1988; Hooper, 1999). The north-west section outcrops ~600 km away from the
Western Ghats, and is composed of older alkali basalts, picrites and silica-undersaturated
alkalic complexes with carbonatite and nephelinite flows and intrusives (e.g. Viladkar,
1981; Gwalani et al., 1993; Simonetti et al., 1995; Mahoney et al., 2000). Whereas the
Western Ghats flows are dated at 65 Ma, the flows of the north-west section are older
with ~68 Ma ages (Basu et al., 1993). The north-east section has flows that show broad
similarity in age and composition with the main Western Ghats lavas (e.g Peng et al.,
1998; Mahoney et al., 2000; Melluso et al., 2004). The youngest flows in the Deccan are
represented by 62 Ma silicic flows around Bombay (Sheth et al., 2001) and 62 Ma feeder
dikes south of the Western Ghats (Widdowson et al., 2000).
Interest in the Deccan acquired a tremendous boost when age dating suggested
that the Western Ghats flows were synchronous with the 65 Ma K-T extinction event
(Courtillot et al., 1986). The Western Ghat lava pile is nearly 3000 metres thick, exposing
stratigraphically older flows near Bombay and Nasik, and the youngest flows near
Mahabaleshwar, close to the southern limit of the Deccan. However, ages of most of the
Deccan Western Ghats flows are indistinguishable from each other, and suggest a very
5
short duration (<1 Ma) for the eruption of the Western Ghats (Courtillot et al., 1986;
Courtillot et al., 1988; Duncan and Pyle, 1988; Gallet et al., 1989; Hofmann et al., 2000;
Pande, 2002; Chenet et al., 2007). The synchronicity of the Deccan with the K-T
extinction led to a debate over the cause of this extinction event. It had famously been
suggested that the extinction was caused by catastrophic climatic disturbance by a
meteorite impact (Alvarez et al., 1980). But the temporal coincidence of the Deccan
eruption with the event, the short eruptive duration of the Deccan led others to suggest
climatic effects of volcanism and volcanic gases as an alternative cause of the K-T
extinction. This debate has continued and has not been unequivocally resolved as of
today.
Self et al (2006) note that the Deccan eruption would have pumped massive
amounts of SO2 into the atmosphere, while the release of CO2 was insufficient to affect
the climate. Recently, Self et al. (2008) measured S and Cl in Deccan melt inclusions and
calculate a yield of 3.5 teragrams (1012
gm) of SO2 and 1 teragram of HCl per cubic km
of Deccan lava erupted. Since the Deccan had between 1-2 million km3 erupted volume,
the tremendous amount of poisonous gases released into the atmosphere would have a
marked effect on climate and biota. The exact mechanism by which eruptive events
would cause extinction is still not well defined, however it should be noted that the
climatic effects of volcanism would be of a longer duration than those of a meteorite
impact. A study of oceanic sediment cores has shown that the 187
Os/188
Os content of
global seawater suffered a gradual change towards mantle-like ratios at around 65 Ma,
and this change commenced some time before the impact-related Ir rich layer of the K-T
boundary were deposited (Ravizza and Peucker-Ehrenbrink, 2003). The Deccan eruption
6
therefore did have an impact on global chemistry and could have had the potential to
impact global climate. Of course, the shorter the Deccan timescale, the more pronounced
would be the climatic effects of the eruption. A 1 Ma timescale of the Deccan means that
the average eruptive rate was 1-2 km3/yr, which is higher than the average 0.4 km
3/yr
value of currently erupting Hawaiian lavas at Kilauea (calculated with data from the
University of Hawaii’s Hawaiian Center for Volcanology website:
http://www.soest.hawaii.edu/GG/HCV/kil-hist.html). The 1783 Laki eruption in Iceland
had a very high eruption rate of 271 km3/yr (Thordarson and Self, 1993), although when
combined with the 900 AD Eldja eruption, a lower average rate of 0.03 km3/yr is
obtained.
It must be noted that the duration limit of 1 Ma mentioned above for the Deccan
Western Ghats activity is not an independently measured limit, i.e. the lowermost flows
are not 1 Ma older than the uppermost flows. Most of the age dating on the Deccan was
done using the K-Ar or Ar-Ar methods (Courtillot et al., 1986; Duncan and Pyle, 1988;
Vandamme et al., 1991; Hofmann et al., 2000; Pande, 2002; Chenet et al., 2007) and this
method has an error of ±1 Ma. Re-Os ages on the Deccan (Allegre et al., 1999) also show
a 65.6±0.3 Ma age. It has been suggested that the upper formations of the Western Ghats
have a younger age of 64.5 Ma (Pande, 2002). However, the true duration of the Deccan
could have been orders of magnitude lesser than 1 Ma. A better estimate of duration is
needed, in order to provide realistic eruptive rates for the Deccan.
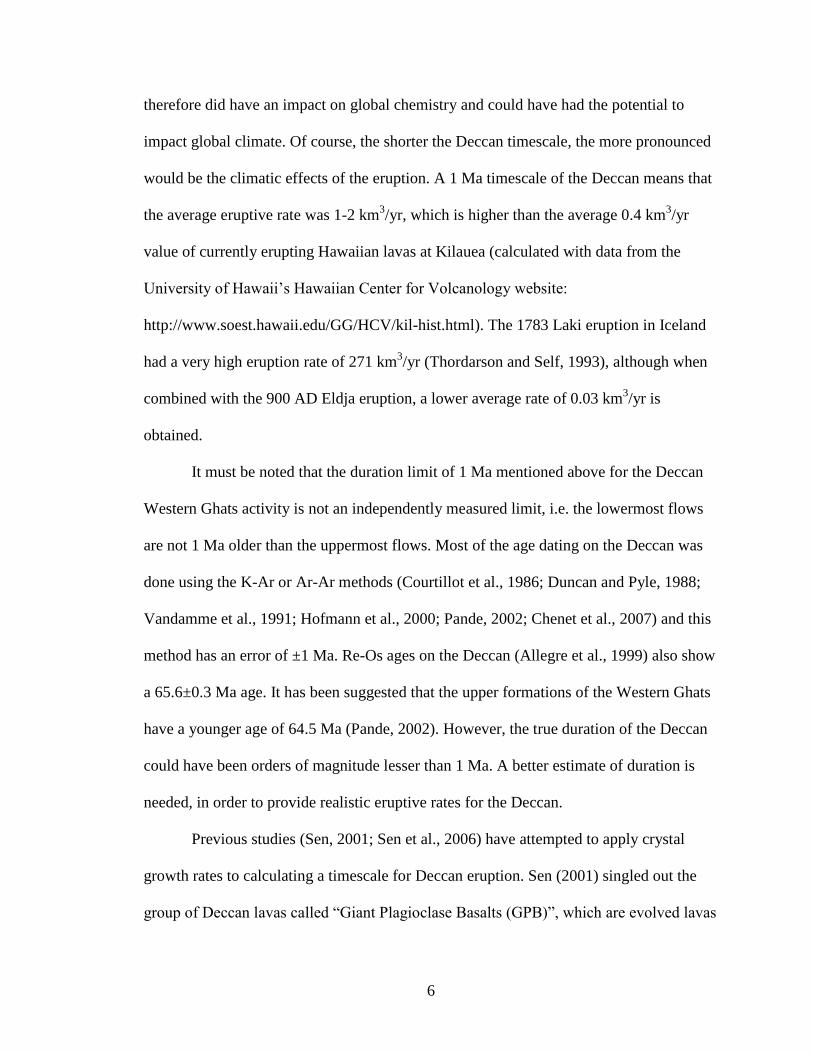
Previous studies (Sen, 2001; Sen et al., 2006) have attempted to apply crystal
growth rates to calculating a timescale for Deccan eruption. Sen (2001) singled out the
group of Deccan lavas called “Giant Plagioclase Basalts (GPB)”, which are evolved lavas
7
carrying very large (upto 5 cm long) tabular plagioclase phenocrysts (Figure 1.4).
Because of the large size of GPB phenocrysts, Sen (2001) speculated that the giant
plagioclase grew throughout the life cycle of a magma chamber and different zones of the
crystal would carry geochemical signatures of different flows originating from the same
magma chamber. Sen (2001) assumed a crystal growth rate from studies of Hawaiian lava
lakes (Cashman and Marsh, 1988) and calculated a timescale of 3200 years for the
growth of plagioclase crystals in the GPBs. Assuming that this growth time would be
related to the eruption timescale of the formation, Sen (2001) extrapolated the calculated
time to the GPB-bearing formations, and then to the entire Deccan, arriving at a timescale
of just 55,000 years for the Deccan eruption. In a subsequent study, this technique was
refined by using a better estimate of crystal size, and using the Johnson-Mehl-Avrami
equation to model crystal growth times (Sen et al. 2006). This study yielded an estimate
of 22800 years for the Deccan eruptive duration.
The crystal growth technique does have the potential to obtain a tighter constraint
on eruptive timescales. The method outlined by Sen (2001, 2006) is based on some
testable assumptions that need to be verified. For example, the rate of growth of a GPB
crystal is unlikely to be constant, and in particular, such a crystal may have undergone
episodes of partial dissolution of during its life-time. Second, whether a single GPB
crystal represents the entire life cycle of a magma chamber (i.e., formation) needs to be
verified by correlating Sr-isotope ratios within individual zones within the GPB crystal
with phenocryst or whole rock isotopic composition of older lavas from the same
formation. The present study was initiated with these goals in mind.
8
Crystal Isotope Stratigraphy
In this study I have applied a relatively new technique to the problem of Deccan
eruptive duration. Recent advances in mass spectrometry have made it easier to couple a
laser to a multi-collector inductively coupled plasma mass spectrometer (MC-ICPMS) in
order to measure trace element and isotopic variations on the micron scale in thick
petrographic sections. This technique has been applied to the measurement of isotopic
ratios of Sr in single plagioclase crystals. With a reasonably sized laser beam (~100
microns), one can sample individual zones within a crystal, thus obtaining a trace
elemental or isotopic zoning profile across the crystal. Such a profile would record the
changes in magmatic conditions during the growth time of the crystal; much like tree
rings or glacial ice layers record earth’s climate over time. This technique, dubbed
“Crystal Isotope Stratigraphy”, has been used mainly in the study of lavas from
convergent plate boundaries, many of which contain strongly zoned plagioclase crystals
(e.g. Tepley et al., 1997; Zellmer et al., 1999; Tepley et al., 2000; Davidson et al., 2001;
Costa et al., 2003; Tepley and Davidson, 2003). In a recent study (Ramos et al., 2005)
this technique has been used on plagioclase crystals from another flood basalt terrain, the
Columbia River Basalts, to decipher the relationship between plagioclase phenocrysts to
the host lava. This study is the only application of such a technique to large basaltic
terranes, and the authors have successfully shown that the plagioclase crystals were
mostly out of equilibrium with the host lava. They reached this conclusion based on the
observation that the 87
Sr/86
Sr composition of plagioclase groundmass of the host lava is
not the same as that of the phenocryst cores and in some cases the phenocryst rims. Using
diffusive modeling of the rim-core 87
Sr/86
Sr profiles in the phenocrysts, they arrived at a
9
timescale for the residence time of the phenocryst in the magma that erupted. Such
information would not be available by any other method.
I used crystal scale measurements of major, trace elements and Sr isotope ratios to
decipher magmatic events recorded by the plagioclase crystals in Deccan lavas. I focus
on the Jawhar and Igatpuri Formations of the Kalsubai Subgroup. These formations are
capped by GPB flows called the Thalghat GPB and Kashele GPB respectively. The
primary objective is to refine the methods of the previous studies to arrive at a timescale
of Deccan eruption. The procedure is two-fold. I use the zoning profiles in the
phenocrysts to evaluate the relationship of the GPB crystals to the host lava, and evaluate
whether the phenocrysts have been in equilibrium with previously erupted lava flows as
suggested by Sen (2001). I then use diffusion modeling where applicable to constrain
residence timescales of the crystals within the Deccan magmatic system. Diffusion
modeling allows for a better constraint on residence times. These residence times are then
related to crystal growth times, allowing the calculation of an independent crystal growth
rate for the Deccan plagioclase. Hence this study is not dependent on crystal growth rates
from Hawaiian lavas, which may not necessarily be applicable to the Deccan system. The
calculated crystal growth rate is then used in a similar manner as the previous studies
(Sen, 2001; 2006), and a timeframe of eruption of lava is obtained. However the eruption
rate depends on what proportion of the lava flows can be related using Sr isotopes to the
crystal zones within GPB crystals. Implications for the total Deccan eruptive duration are
discussed, along with caveats related to the diffusion modeling.

10
Apart from crystal scale studies, I have also collected whole rock XRF and trace
element data and 87
Sr/86
Sr ratios from the other flows of these two formations to model
the mixing processes prevalent in the origin of these lavas.
11
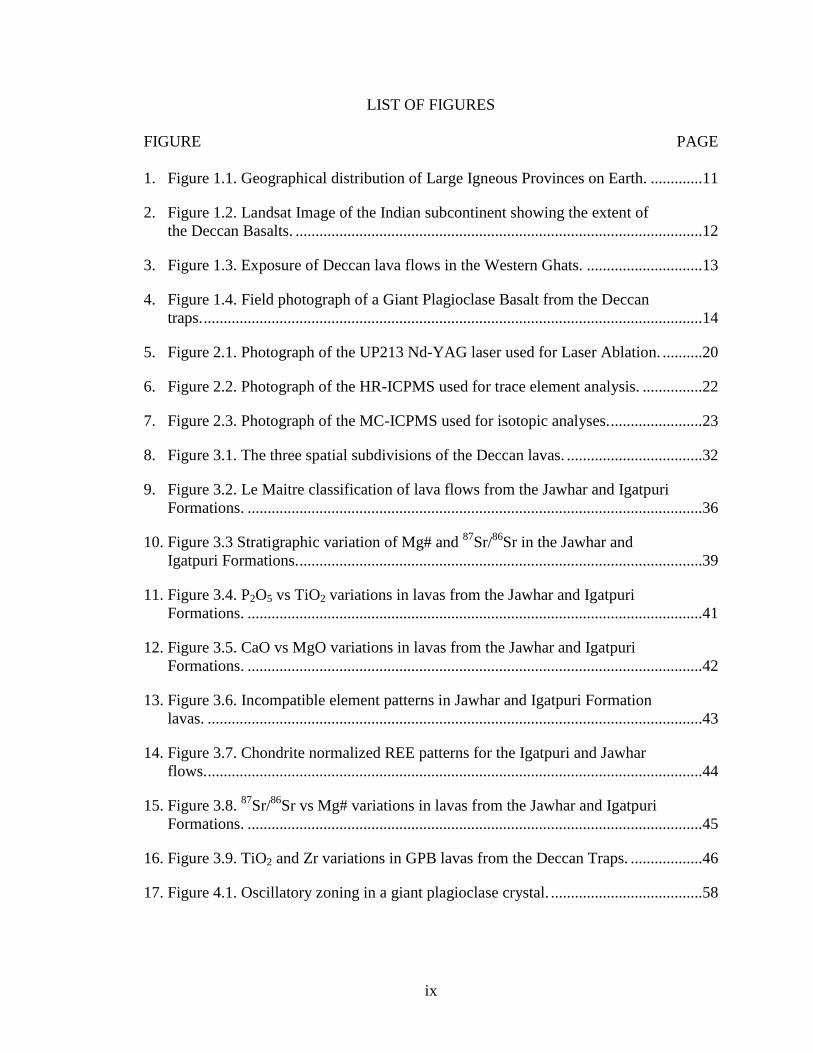
Figure 1.1. Geographical distribution of Large Igneous Provinces on Earth. Figure
from Jerram and Widdowson (2005). Large flood basalts are shown as black areas. Such
provinces occur on continents as well as ocean basins. Note the location of the Deccan
basalt province just south of the Tropic of Cancer 23°N latitude and ~75°E longitude.
12
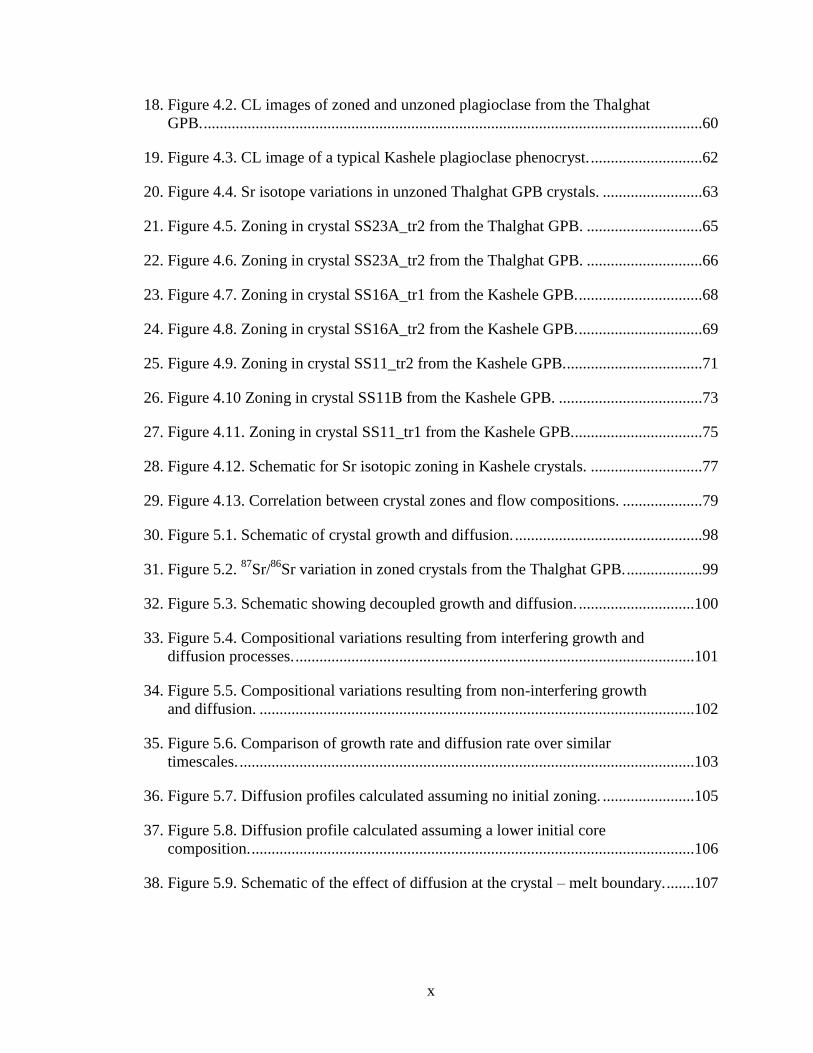
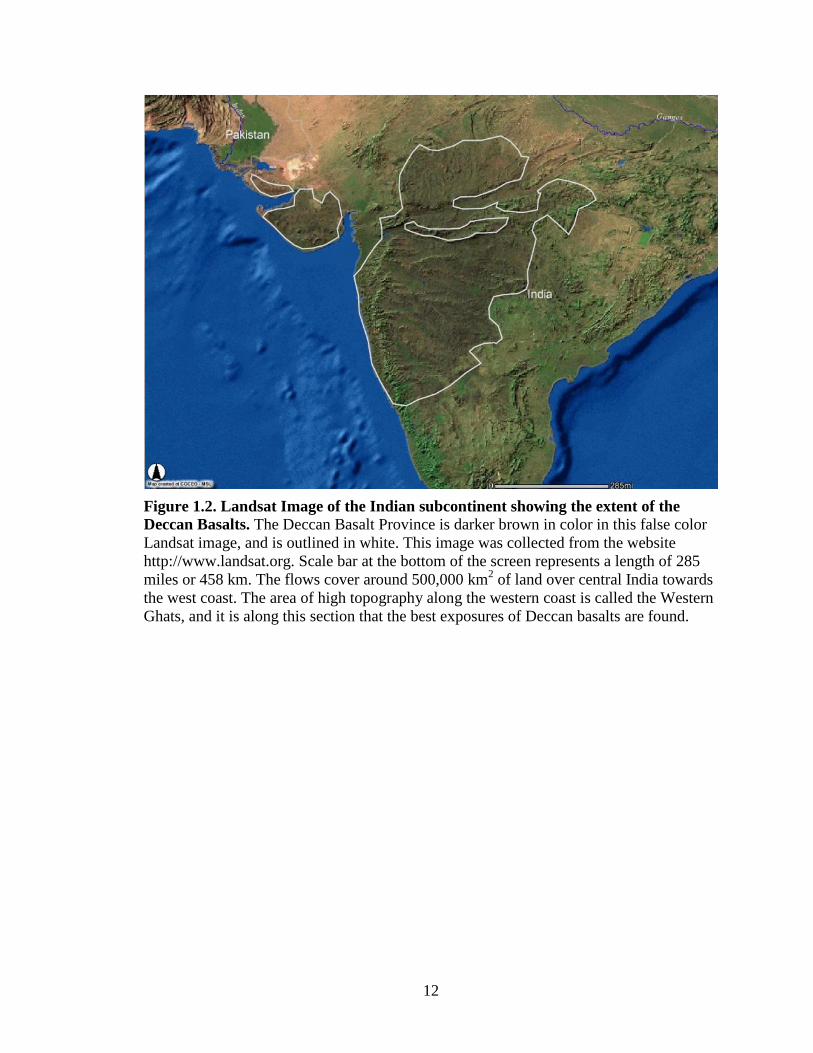
Figure 1.2. Landsat Image of the Indian subcontinent showing the extent of the
Deccan Basalts. The Deccan Basalt Province is darker brown in color in this false color
Landsat image, and is outlined in white. This image was collected from the website
http://www.landsat.org. Scale bar at the bottom of the screen represents a length of 285
miles or 458 km. The flows cover around 500,000 km2 of land over central India towards
the west coast. The area of high topography along the western coast is called the Western
Ghats, and it is along this section that the best exposures of Deccan basalts are found.
13
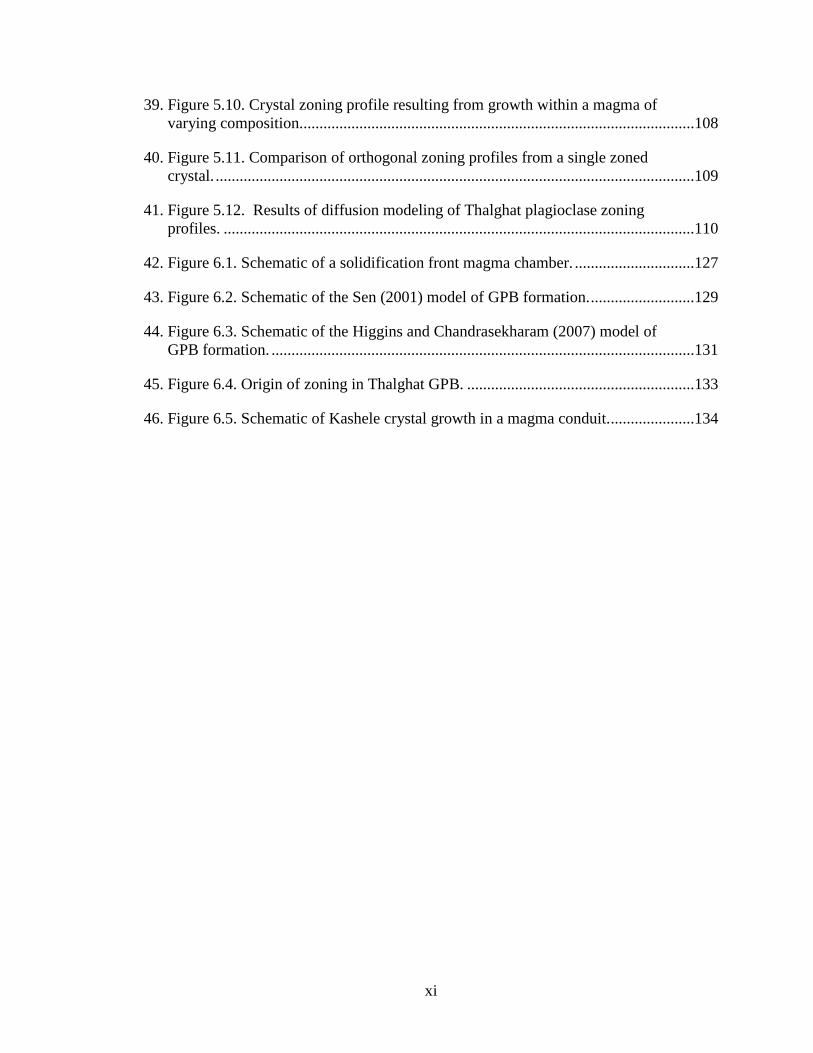
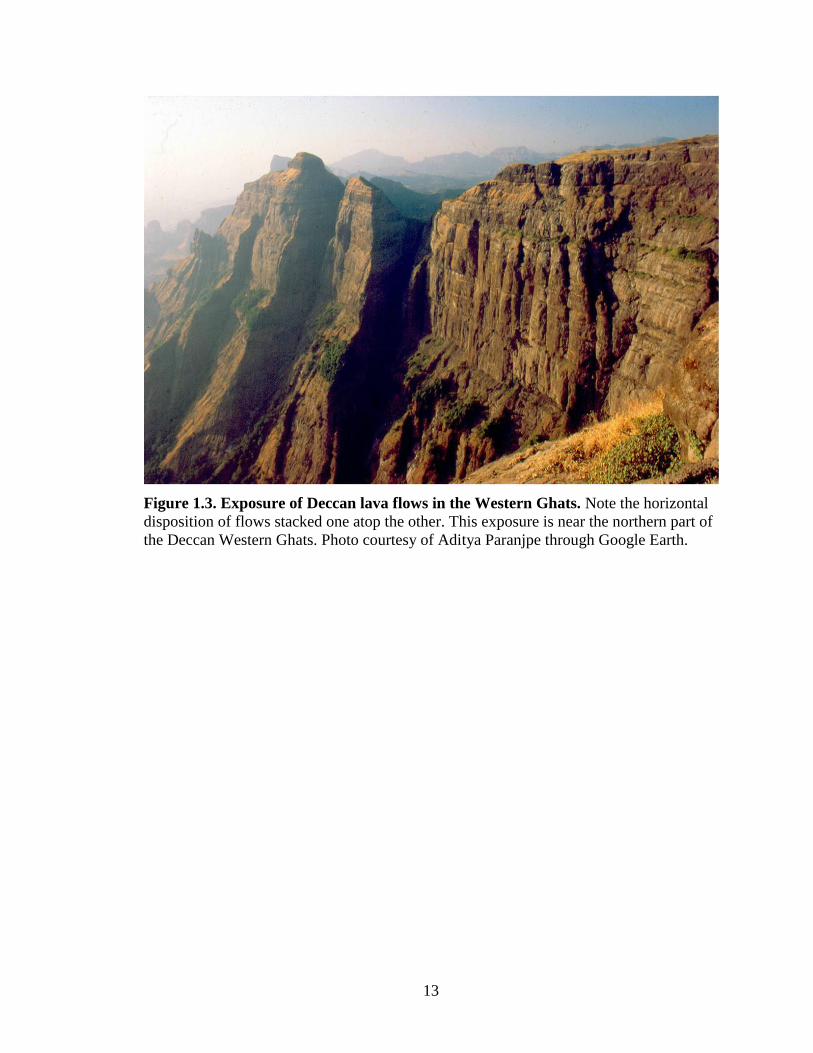
Figure 1.3. Exposure of Deccan lava flows in the Western Ghats. Note the horizontal
disposition of flows stacked one atop the other. This exposure is near the northern part of
the Deccan Western Ghats. Photo courtesy of Aditya Paranjpe through Google Earth.
14
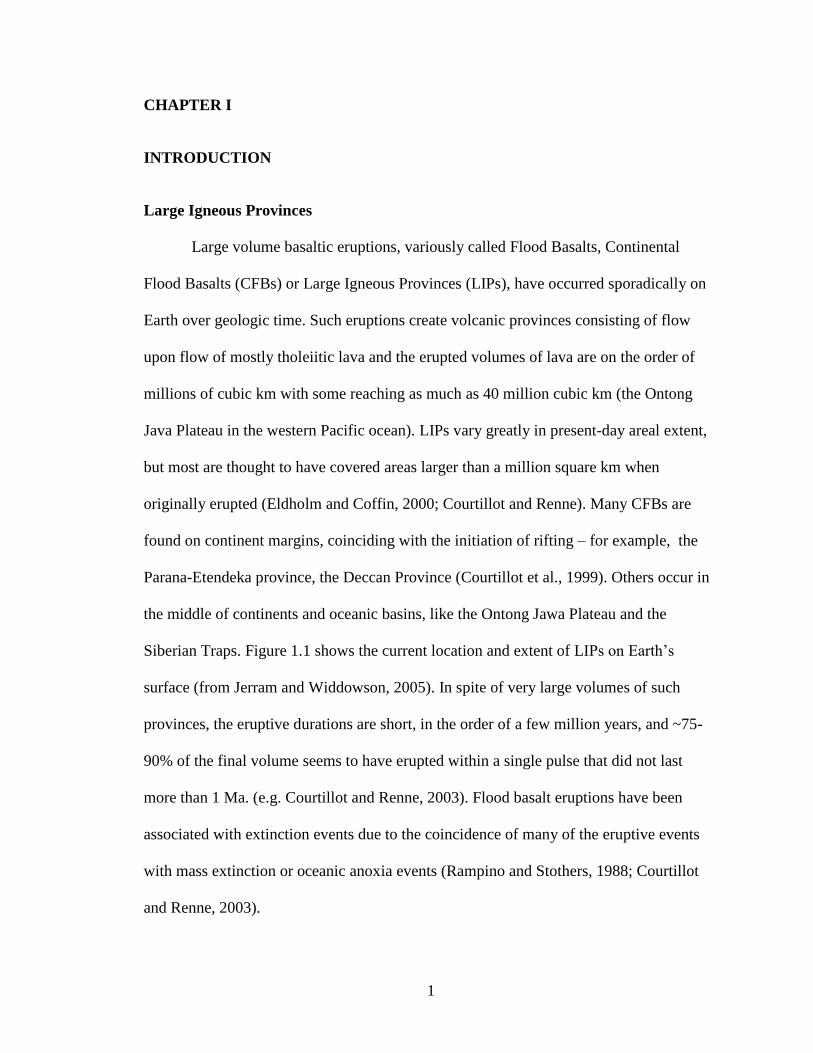
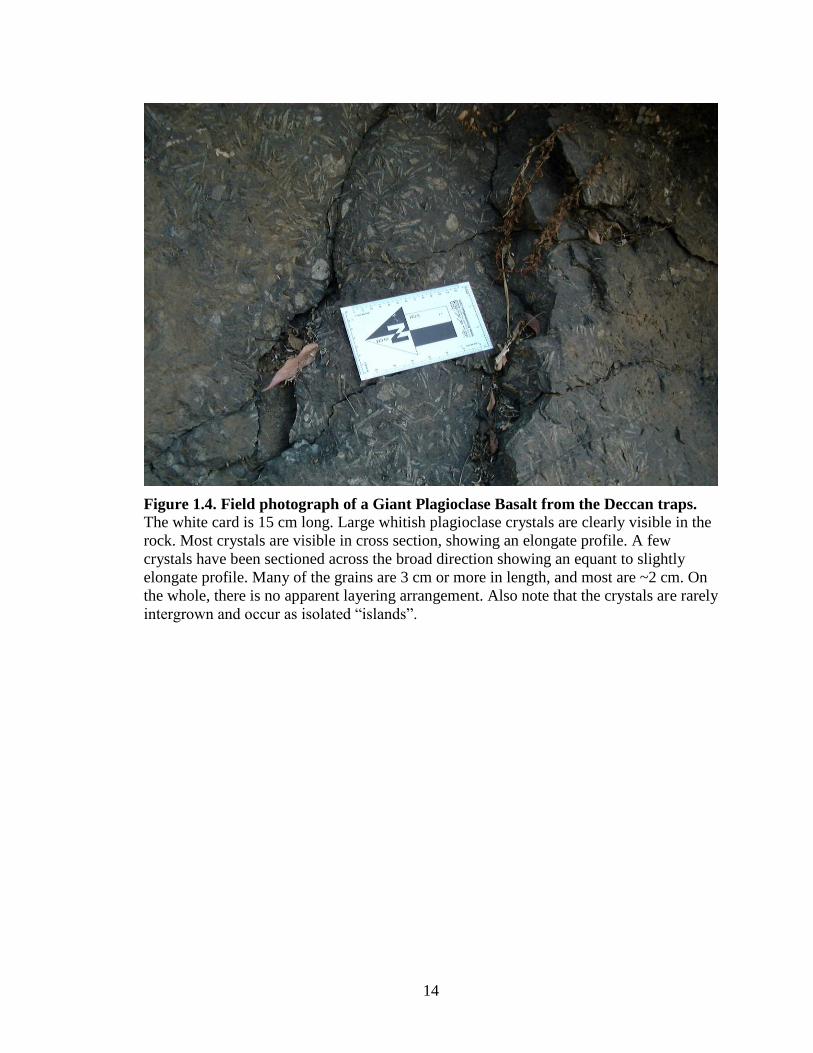
Figure 1.4. Field photograph of a Giant Plagioclase Basalt from the Deccan traps. The white card is 15 cm long. Large whitish plagioclase crystals are clearly visible in the
rock. Most crystals are visible in cross section, showing an elongate profile. A few
crystals have been sectioned across the broad direction showing an equant to slightly
elongate profile. Many of the grains are 3 cm or more in length, and most are ~2 cm. On
the whole, there is no apparent layering arrangement. Also note that the crystals are rarely
intergrown and occur as isolated “islands”.
15
CHAPTER II
ANALYTICAL METHODS
Sample collection and preparation
Samples were collected for this study during a 5 day field trip in the Bombay –
Nasik – Pune area of Western India in January 2004. This area has the best exposures of
the lower formations of the Deccan Western Ghats section. The two oldest formations
were sampled, viz. the Jawhar and Igatpuri Formations. Flows were identified on field
and correlated between transects based on elevation. Thin-section (4.5 x 2.5 cm) sized
blocks were cut from the fresh parts of the samples, and both thin sections and thick
sections were prepared for electron microprobe (EPMA) analyses and Laser Ablation
ICP-MS (LAICPMS) analyses. Chips were also prepared for whole rock X-Ray
Fluorescence spectrometric (XRF) analyses. In the case of GPB flows, I took care to
avoid large plagioclase crystals in preparation of the rock chips for whole rock analyses.
Polished thin sections were studied under the polarized light microscope and the
Scanning Electron microscope (SEM).
Electron Microscopy
Following regular examination with a petrographic microscope, plagioclase
crystals in individual specimens were studied using a JEOL JSM 5900LV Scanning
Electron Microscope at the Florida Center for Analytical Electron Microscopy (FCAEM)
at FIU. Both back-scattered (BSE) and cathodoluminiscence (CL) imaging was used, as
plagioclase zoning was only visible in CL. The same samples were then analyzed for
major elements using a JEOL 8900 Superprobe at FCAEM. Plagioclase crystals were
16
analyzed for major elements as well as Mg and Fe. The JEOL 8900 was run at 15kv and a
beam current of 20 nA. Count times were 10s for the major elements Si, Al, Ca. Due to
the mobility of Na under the beam it was counted for 10s using a high-count spectrometer
crystal, and was among the first elements analyzed during a run. K was analyzed for 20s
and both Mg and Fe for 60-100 sec. Transects were measured across plagioclase crystals
at 2-5 micron intervals to study zoning. The error in An content as measured on a
plagioclase standard was always <0.8%.
LA-ICPMS
87Sr/
86Sr isotope ratios were measured on plagioclase crystals from the lavas from
the Igatpuri and Jawhar formation using a LA-ICPMS housed in the GeoAnalytical
Laboratory at Washington State University. Both phenocryst and groundmass plagioclase
crystals were analyzed. Samples were cut into thick sections measuring 4.5 x 2.5 cm in
width and length and 1-4 mm in thickness. Each sample was sectioned in a way so that
large plagioclase crystals were sliced right down the middle of the crystal The sections
were ground so that the two larger faces were parallel, and were then polished to a 1µm
diamond finish. The samples were cleaned with ethanol during and after polishing. Laser
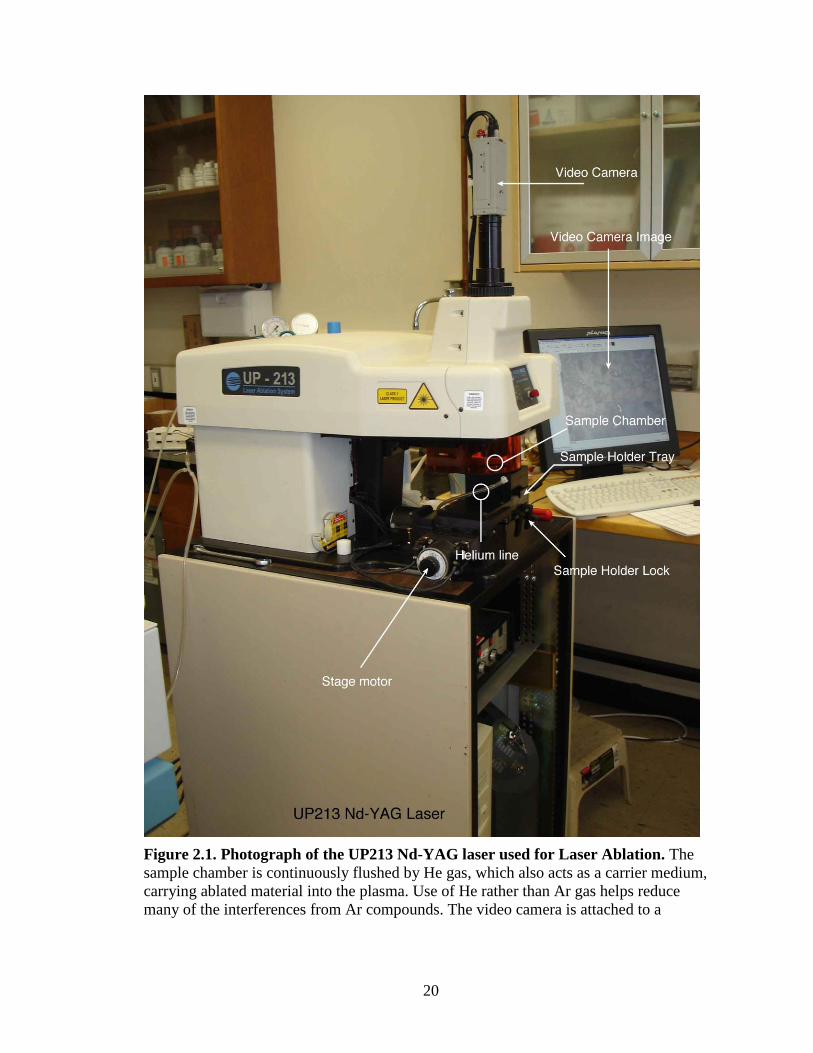
ablation was performed using a NewWave UP213nm Nd-YAG laser (see Figure 2.1). We
ablated and analyzed tracks rather than spots, since it allowed us to use a smaller beam
size. The tracks were arranged parallel to zone boundaries in the crystals, and
perpendicular to the direction of traverse (see images of analyzed crystals in the next
chapter).
17
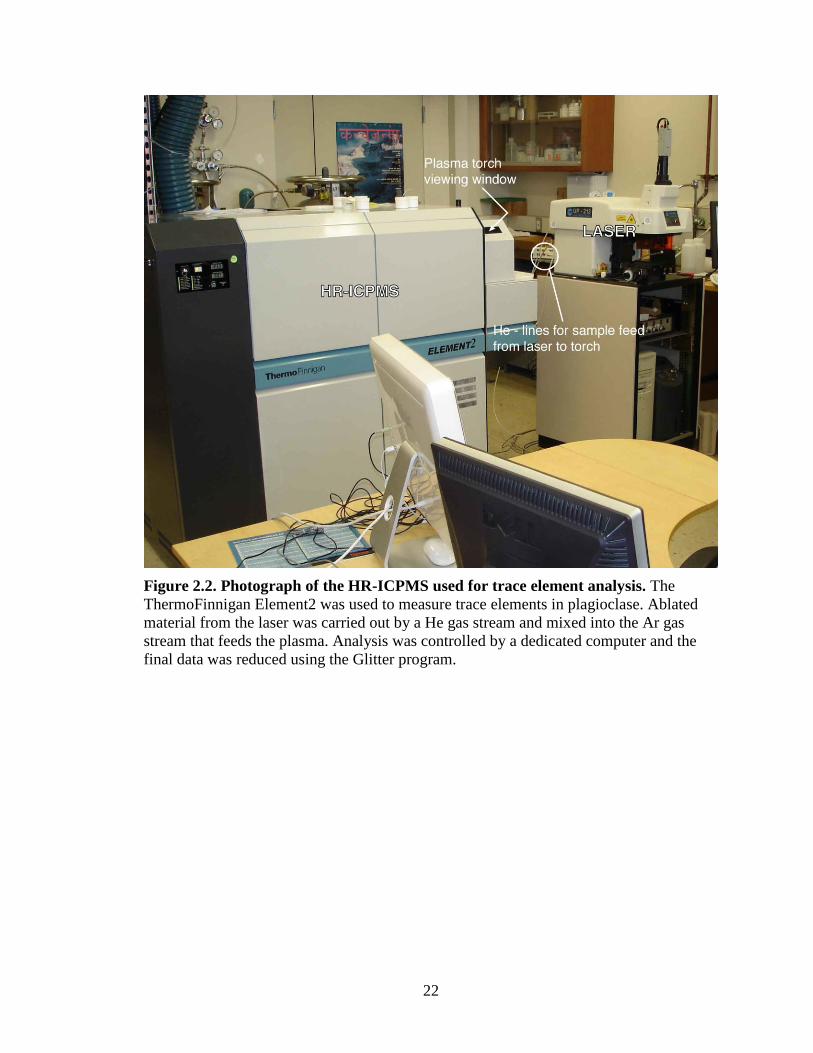
Prior to isotopic study, the samples were analyzed for trace element
concentrations using a ThermoFinnigan Element2 High Resolution (HR) ICPMS (Figure
2.2). Each analysis was done in a single 350 µm pass of a 20 µm wide laser beam. USGS
reference materials BCR-2 (Columbia River Basalt) and BIR (Icelandic Basalt) were
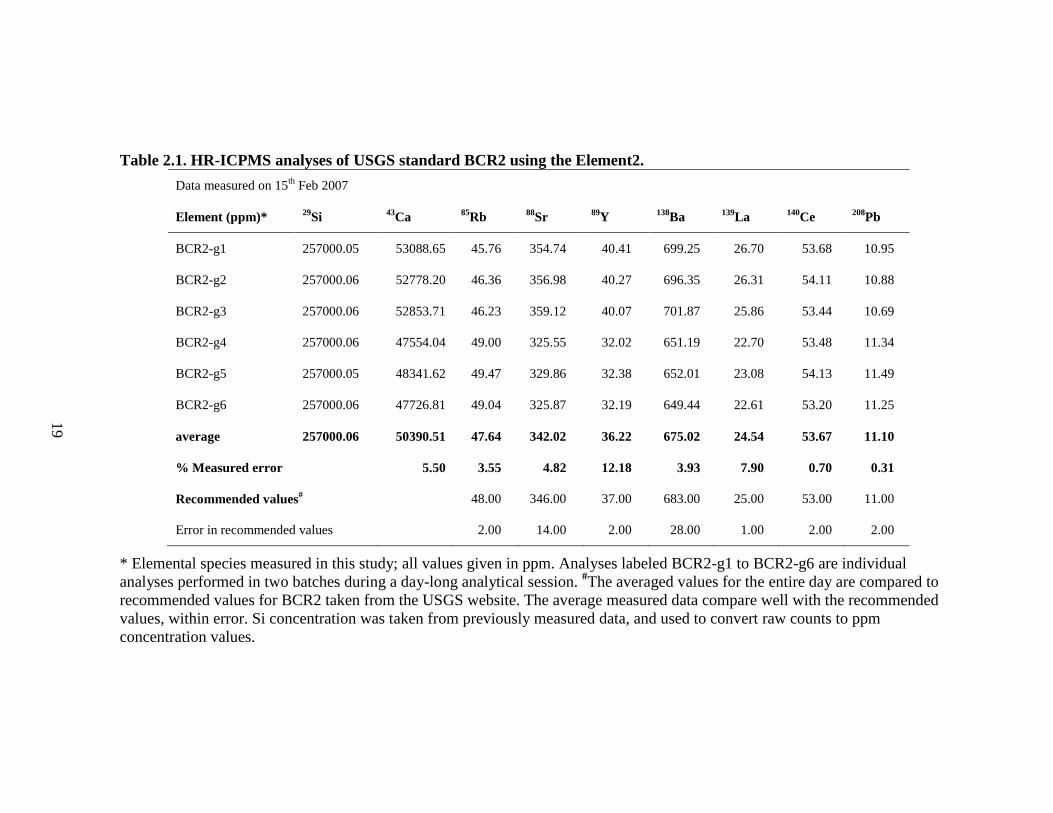
used as standards. Data reduction was performed using the GLITTER program. Table 2.1
shows the measured composition of BCR-2 collected over a day in comparison to the
recommended values for the standard. The measured data is in good agreement with the
recommended standard data, and the errors for Sr and Ba were ~ 4 – 5 %.
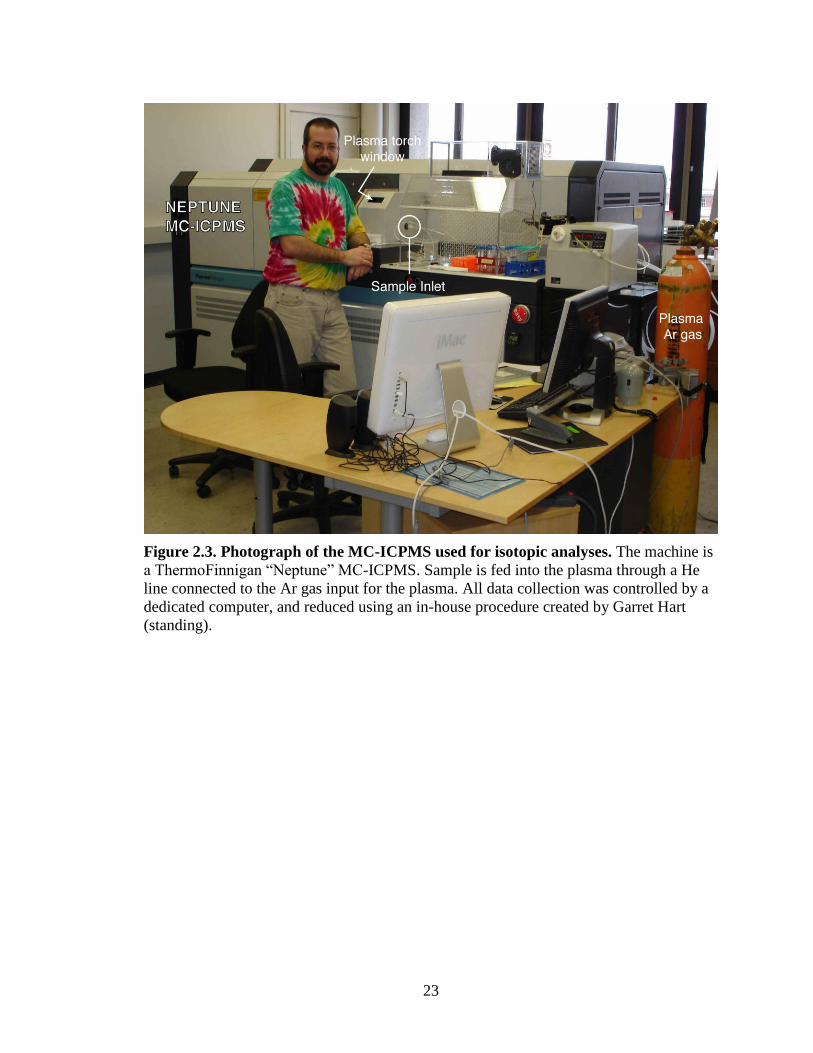
87Sr/
86Sr isotopes were analyzed using the Finnigan Neptune Multi Collector
(MC) ICPMS (Figure 2.3). Count times were set at approximately 100 seconds to obtain
100 count cycles per analysis. The laser was set to a spot size of 80 µm. Laser tracks
were typically 600 – 700 microns long. Each track was scanned around 10 times, with the
first pass of the laser excluded from data collection. A plagioclase crystal from the
Imnaha formation of the Columbia River Basalts, with 87
Sr/86
Sr ratio of 0.70405 was
used as a standard. The standard was analyzed at the beginning of the day’s analysis and
every 2-3 hours thereafter. The standard data for the entire day was used to determine the
analytical error, and the values were then corrected using the known standard ratio of
0.70405; which had been previously determined by micro-drilling (Ramos et al. 2004)..
The 100 measurements per data point were checked using an in-house spreadsheet that
disregards outliers based on elevated 85
Rb/88
Sr ratios (also cf. Ramos et al. 2004). Errors
on the measured 87
Sr/86
Sr of the standard varied day by day, but were always less than
0.00010. Typical errors were ~0.00008.
18
After data collection, CL images were collected once again, which enabled us to
correlate the location of the laser troughs with zones in the crystal that were revealed in
CL imaging. The distance of tracks from the edge of the crystal was measured from these
images using the commercial image processing software Igor Pro, Adobe Photoshop and
Adobe Acrobat.
Data Correction
The major or trace element data were did not require additional correction apart
from what was done by the instrument. The 87
Sr/86
Sr data were not age corrected. All the
analyses were performed on plagioclase, which has low Rb of ~1.2-2 ppm. Rb in
groundmass crystals is generally higher, ranging from 1.2-5 ppm. 87
Sr/86
Sr age correction
for most of the phenocrysts is around 0.00001, and the highest correction factor for a
laser track that crosses a Rb-rich crack is 0.000035, which is smaller than our best
standard error of 0.00004. Age correction is therefore not necessary for the measured
ratios, and the collected data are can be directly compared to other age-corrected whole
rock data from the literature.
19
Table 2.1. HR-ICPMS analyses of USGS standard BCR2 using the Element2.
Data measured on 15th
Feb 2007
Element (ppm)* 29
Si 43
Ca 85
Rb 88
Sr 89
Y 138
Ba 139
La 140
Ce 208
Pb
BCR2-g1 257000.05 53088.65 45.76 354.74 40.41 699.25 26.70 53.68 10.95
BCR2-g2 257000.06 52778.20 46.36 356.98 40.27 696.35 26.31 54.11 10.88
BCR2-g3 257000.06 52853.71 46.23 359.12 40.07 701.87 25.86 53.44 10.69
BCR2-g4 257000.06 47554.04 49.00 325.55 32.02 651.19 22.70 53.48 11.34
BCR2-g5 257000.05 48341.62 49.47 329.86 32.38 652.01 23.08 54.13 11.49
BCR2-g6 257000.06 47726.81 49.04 325.87 32.19 649.44 22.61 53.20 11.25
average 257000.06 50390.51 47.64 342.02 36.22 675.02 24.54 53.67 11.10
% Measured error 5.50 3.55 4.82 12.18 3.93 7.90 0.70 0.31
Recommended values# 48.00 346.00 37.00 683.00 25.00 53.00 11.00
Error in recommended values 2.00 14.00 2.00 28.00 1.00 2.00 2.00
* Elemental species measured in this study; all values given in ppm. Analyses labeled BCR2-g1 to BCR2-g6 are individual
analyses performed in two batches during a day-long analytical session. #The averaged values for the entire day are compared to
recommended values for BCR2 taken from the USGS website. The average measured data compare well with the recommended
values, within error. Si concentration was taken from previously measured data, and used to convert raw counts to ppm
concentration values.
20
Figure 2.1. Photograph of the UP213 Nd-YAG laser used for Laser Ablation. The
sample chamber is continuously flushed by He gas, which also acts as a carrier medium,
carrying ablated material into the plasma. Use of He rather than Ar gas helps reduce
many of the interferences from Ar compounds. The video camera is attached to a

21
microscope that provides reflected and transmitted light images of the sample. All stage
processes and ablation processes are controlled by the adjacent computer using the New
Wave / Mercantek software interface.
22
Figure 2.2. Photograph of the HR-ICPMS used for trace element analysis. The
ThermoFinnigan Element2 was used to measure trace elements in plagioclase. Ablated
material from the laser was carried out by a He gas stream and mixed into the Ar gas
stream that feeds the plasma. Analysis was controlled by a dedicated computer and the
final data was reduced using the Glitter program.
23
Figure 2.3. Photograph of the MC-ICPMS used for isotopic analyses. The machine is
a ThermoFinnigan “Neptune” MC-ICPMS. Sample is fed into the plasma through a He
line connected to the Ar gas input for the plasma. All data collection was controlled by a
dedicated computer, and reduced using an in-house procedure created by Garret Hart
(standing).
24
CHAPTER III
GEOCHEMISTRY OF THE JAWHAR AND IGATPURI FORMATIONS
Stratigraphy of the Western Ghats
The Western Ghats range represents the type section of Deccan Traps as 2.8 km
of lava is exposed here. The Western Ghats lavas have been mapped and studied by
numerous workers (e.g. Najafi et al., 1981; Mahoney et al., 1982; Cox and Hawkesworth,
1985; Beane et al., 1986; Lightfoot and Hawkesworth, 1988; Peng et al., 1994; Melluso
et al., 2004). The flows are predominantly tholeiitic basalts. Picritic flows (MgO content
≥10%) are rare in the Western Ghats, but common in the Northwestern Deccan
(Krishnamurthy and Cox, 1977; Krishnamurthy et al., 2000; Melluso et al., 2006), as are
alkali basalts lamprophyres, nephelinites and carbonatites (Viladkar, 1981; Basu et al.,
1993; Gwalani et al., 1993; Simonetti et al., 1995; Simonetti et al., 1998). The picritic
flows from the Western Ghats have been interpreted to have originated by post-
emplacement olivine accumulation on the basis of field evidence, petrography, and
geochemistry (Beane et al., 1988).
The Western Ghats lava pile has been divided into three subgroups called
Kalsubai, Lonavala, and Wai (oldest to youngest) on the basis of lava geochemistry (Cox
and Hawkesworth, 1985; Beane et al., 1986; Beane, 1988; Peng et al., 1994). Each
subgroup has in turn been subdivided into formations; and an individual formation
consists of numerous flows grouped as members or chemical types (Table 3.1). Although
there is some intraformational geochemical variation, those variations are generally small
25
relative to the differences between formations. In general, the bulk of the lavas are low in
MgO (<8%) and are enriched in large-ion lithophile elements (LILE).
Most of the formations shown in Table 3.1 have elevated Sr-isotope ratios (0.709-
0.712), except for the Ambenali Formation that has ratios of 0.7038-0.7044. The
Ambenali flows have been generally thought to be least contaminated by the continental
crust (e.g. Mahoney et al., 1982; Cox and Hawkesworth, 1985; Sen, 2001).The Bushe
Formation exhibits the highest Sr isotopic ratios in all of Deccan. Interestingly, Bushe
lavas are also higher in Mg# (defined as MgO/MgO+FeO on a molar basis) than most of
the Western Ghats lavas. The relationship between the MgO content of flows and
87Sr/
86Sr ratios is opposite to what would be expected in a normal crustal contamination
process. DePaolo (1981) presented the assimilation – fractional crystallization model
(AFC) where assimilation of crustal material is accompanied by loss of heat, which then
causes crystallization and evolution of the magma body to less primitive compositions.
AFC processes therefore result in a negative correlation between MgO and 87
Sr/86
Sr
ratios. The Deccan, however, shows “anti-AFC” trends, high MgO flows tend to show
evolved 87
Sr/86
Sr ratios. This trend is not limited to the Bushe Formation, but is seen
throughout the Deccan (Devey and Cox, 1987).
Based on isotopic compositions, the origin of various Deccan formations have
been modeled as mixing between various geochemical reservoirs (Mahoney et al., 1982;
Cox and Hawkesworth, 1985; Peng et al., 1994). To explain the younger formations like
the Ambenali and Mahabaleshwar, mixing of a Reunion plume member and a depleted
MORB member is required. The Bushe Formation, which is the most contaminated, can
form by mixing between a Reunion-like end member and a crustal end member. For the
26
lowermost formations of the Kalsubai Subgroup, three separate end members are required
(Peng et al., 1994). The Deccan Traps therefore have a complicated mode of origin.
The Lowermost Deccan Formations
Most early Deccan studies concentrated on the younger formations of the Wai and
Lonavla Subgroups that outcrop near the Mahabaleshwar area (Figure 3.1). The older
formations outcrop further to the north near the Mumbai – Nasik area. Fewer studies have
been done on the oldest Kalsubai Subgroup (Beane et al., 1986; Bodas et al., 1988; Peng
et al., 1994). Peng et al. (1994) found that the six lowermost Western Ghats formations
that make up the Kalsubai Subgroup have a unique mode of origin, completely separate
from the upper formations like the Ambenali and Bushe. These formations define trends
in Sr-Nd and Pb-isotopic space that are separate from each other and separate from the
trends of the younger formations. The trends appear to diverge from a common
composition which has been termed as the “common signature” of the lowermost
formations. This common signature has been modeled as a mixture of mantle plume-type
material with 40% amphibolite crust (Peng et al., 1994).
Giant Plagioclase Basalts
The lowermost Kalsubai Subgroup is host to a unique class of basaltic flows
termed the “Giant Plagioclase Basalts” (GPB) (Hooper et al., 1988). Each of these flows
is the last to erupt within a formation and is also chemically the most differentiated
member of the formation. The “giant” plagioclase phenocrysts can reach up to 5 cm in
length (previous chapter Figure 1.4); and crystals double that size have also been reported
(Karmarkar et al., 1972). In general, plagioclase phenocrysts from “regular” lava flows in
27
the Deccan and other localities are usually less than 1 cm in length; and therefore, the
growth of such large crystals and subsequent eruption of the host lava need a special
mechanism.
Sen (2001) proposed a model where each formation represents lava extrusions
fed by the same magma chamber. He suggested that the “giant phenocrysts” grew in the
magma chamber while the magma chamber experienced multiple episodes of input of
fresh magma and extrusion of basalts. In his view, the various compositional zones
within each “giant” crystal chemically equilibrated with mixed melts, a part of which
erupted as lava. Thus, a single crystal recorded the geochemical signature of the older
lava flows within the same formation. The GPB flows are then the last product of a
magma chamber, which was expelled when the magma chamber’s roof collapsed. Using
a plagioclase growth rate of 10-10
cm/s, Sen (2001) calculated an average time of 3200
years for residence of these crystals in the magma chamber. Recently, Higgins and
Chandrasekharam (2007) have carried out a crystal size distribution (CSD) study of the
Deccan GPBs. Using a growth rate of 10-11
cm/s the authors calculate residence times of
500-1500 years for such crystals. Higgins and Chandrasekharam (2007) postulate that
such crystals grew in sub-volcanic magma chambers and plagioclase accumulated by
flotation to the top of such chambers. Expulsion of the crystals took place by a new,
aphyric magma that infiltrated the chamber and erupted.
Stratigraphy and Geochemistry of the Jawhar and Igatpuri Formations
The Jawhar and Igatpuri Formations were sampled along road cuts and stream
valleys in the Mumbai – Nasik – Pune area (Figure 3.1) in January 2004. Bulk-rock
28
major and trace element data were collected by X-ray Fluorescence Spectrometery
(XRF), and REE and trace elements data by ICPMS. 87
Sr/86
Sr isotopes were measured by
LA-ICPMS on plagioclase crystals from the groundmass the lava flows sampled. In some
samples, the groundmass crystals were not of a sufficient size to allow for sampling with
the laser. In such cases, 87
Sr/86
Sr data were taken from the literature.
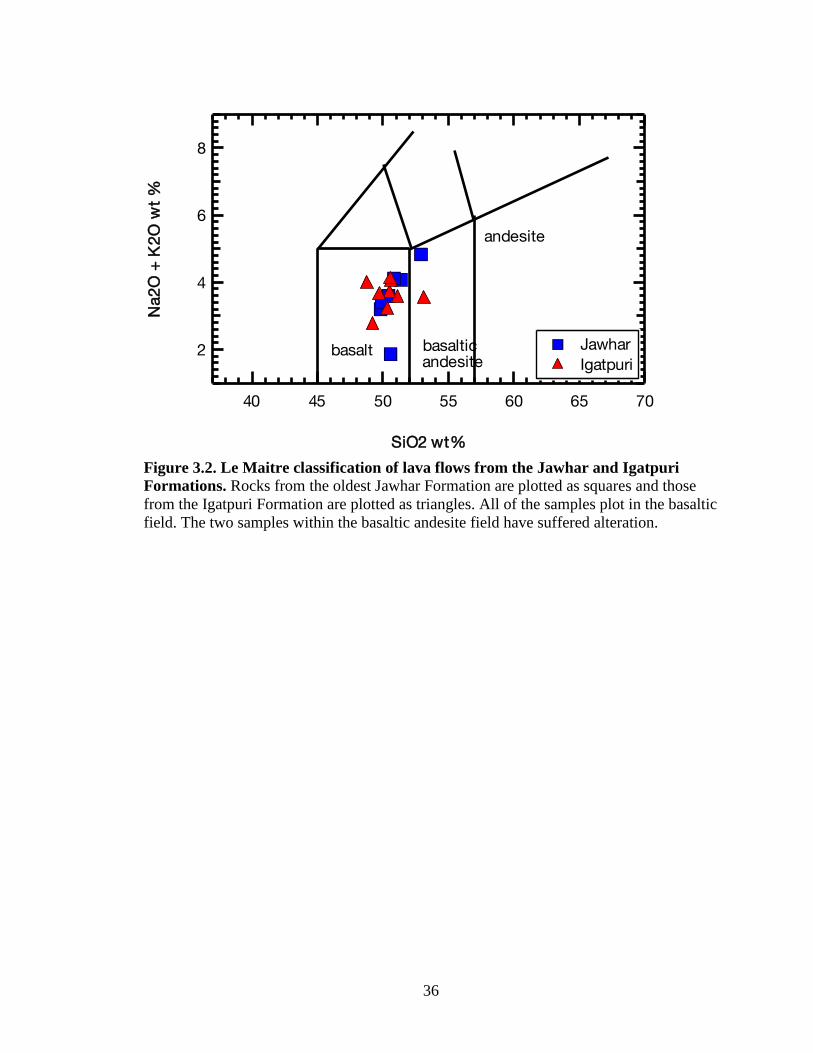
Based on flow chemistry and field observations, samples from this study can be
placed in the stratigraphic framework of Beane et al. (1986). In the total alkali – silica
diagram (Figure 3.2), flows from the Jawhar and Igatpuri Formations all plot in the basalt
field. Table 3.2 lists chemical data from the Jawhar and Igatpuri flows analyzed in this
study. Some flows are be directly correlated with flows sampled and named by Beane et
al. (1986) and Beane (1988), based on similarities in Mg#, Sr-isotope composition and
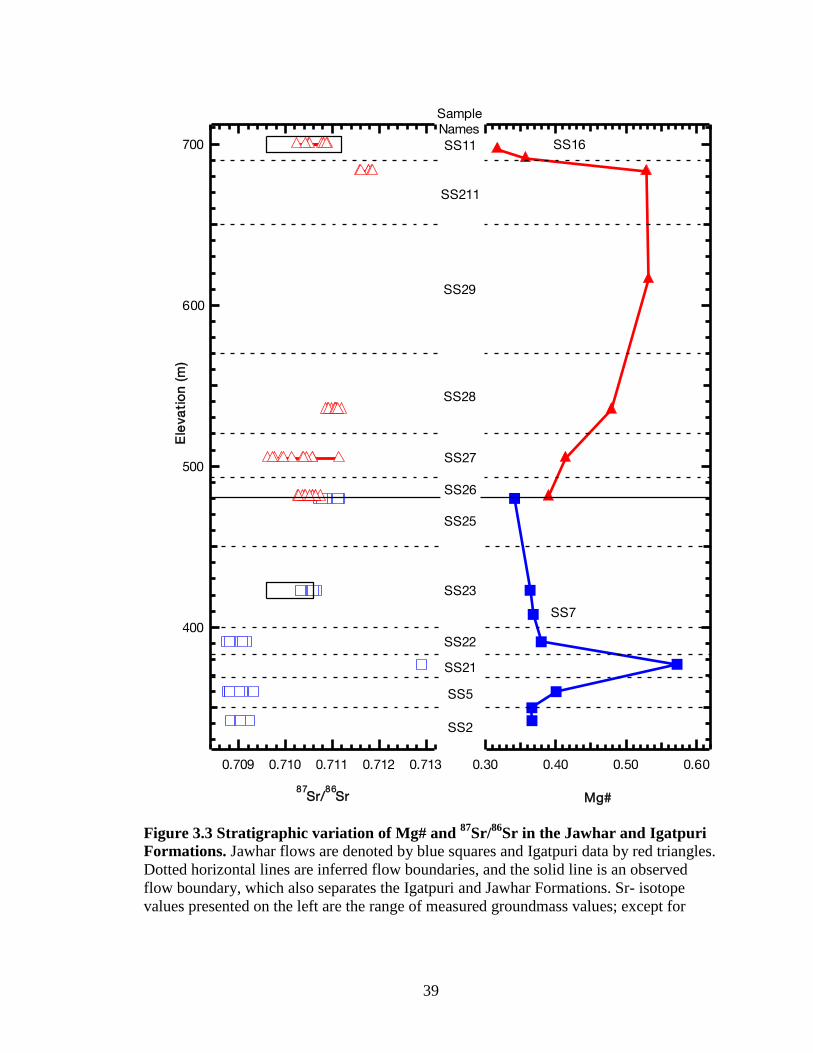
physical descriptions. Variation of Mg# and 87
Sr/86
Sr with elevation is shown in Figure
3.3. In the Jawhar Formation, Mg# tends to decrease with increasing elevation, except for
one high magnesian flow SS21. Igatpuri flows have the opposite tendency, with Mg#
increasing with increasing elevation, only to drop down at the very top of the pile because
of the eruption of the Kashele GPB.
Petrography
Petrographically, most of the flows in the Jawhar and Igatpuri Formations are
aphyric to sparsely porphyritic with exceptions being the GPB flows. The primary
phenocryst phase is plagioclase. Altered olivine phenocrysts are seen in some flows, and
have forsterite content (Fo) ranging from 76 – 62 (Table 3.2). Table 3.2 also shows the
calculated olivine compositions based on olivine-liquid equilibria, and the olivine
phenocrysts appear to be in equilibrium with the host lava. Fayalitic olivine crystals are
29
seen in the groundmass of these flows having Fo between 30 – 40, probably representing
post eruptive growth in a rapidly cooling lava. In the GPB flows, the large plagioclase
crystals have inclusions of olivine phenocrysts. Thalghat GPB crystals have inclusions of
both types of olivine phenocrysts, showing that these crystals were growing continuously
as magmatic conditions changed. Sample SS26 from the Igatpuri Formation is unique in
having clots of clinopyroxene + plagioclase phenocrysts. Otherwise, clinopyroxene is not
seen as a phenocryst phase. Sample SS27 from the Igatpuri Fm. has large plagioclase
phenocrysts comparable in size to the “giant” plagioclase of the GPB, with the important
difference that the plagioclase crystals occur as sub radiating glomerocrysts, as opposed
to the separate “islands” of plagioclase in the GPB flows. It differs from GPB flows in
other respects too: it is not the most evolved flow in the formation, nor does it occur as a
capping flow.
Major element data are plotted in Figures 3.4 and 3.5. Incompatible element data
and Rare Earth Element (REE) data are plotted in Figures 3.6 and 3.7 respectively. Figure
3.4 is a plot of incompatible major elements P2O5 and TiO2. Lava compositions from the
Jawhar and Igatpuri Formations form a linear trend in incompatible elements, possibly a
result of the tapping of a continuously evolving magma body. The GPB flows have the
highest concentration of incompatible elements. Figure 3.5 compares CaO and MgO
compositions for the flows. Also shown are evolution trends calculated with the
COMAGMAT and MELTS programs (Ghiorso and Sack, 1995; Ariskin, 1999; Ghiorso
et al., 2002). Jawhar and Igatpuri flows could be related to each other by simple
fractionation as Figure 3.4 shows, so the three least evolved flows were used as starting
compositions for the liquid line of descent (LLD) calculations. The Jawhar high MgO
30
flow – the least evolved – does not seem to be parental, as the calculated compositions do
not match the other flows. Igatpuri high MgO flows are better candidates as LLDs
calculated with these compositions match the measured compositions closely. This result
is in agreement with that of Subbarao et al. (1988).
Jawhar flows show a simultaneous decrease in MgO and CaO and show a closer
match to the calculated evolution trend. Igatpuri flows appear to fall away from the
calculated evolution trends. The evolved Igatpuri flows show abnormally high CaO
concentrations, and the high MgO flows show low CaO concentrations. The high CaO in
the evolved flows may be a result of plagioclase flotation in the magma chamber, locally
increasing the CaO and Al2O3 content. The less evolved Igatpuri flows cannot result from
fractional crystallization processes, as the compositions do not fall on or close to the
calculated evolution lines.
The incompatible element plot (Figure 3.6) shows the lavas of these formations to
have an OIB-like pattern with an enrichment of the less incompatible elements and large
ion lithophile elements (LILE) like Ba, K, Rb. Sr shows a somewhat abnormal negative
spike. Jawhar and Igatpuri flows do not show any differences in patterns, with the minor
exception being a slightly wider range in values in the Jawhar flows. The two formations
show light REE (LREE) enriched patterns, where once again there is no major difference
in the Jawhar and Igatpuri data.
High magnesian flows
Figure 3.3 shows stratigraphic variations of Mg# and 87
Sr/86
Sr in the Igatpuri and
Jawhar flows. Most Jawhar flows have low Mg# (<40), but flow SS21 is a high
magnesian flow with Mg# 57. A large thickness of the Igatpuri Formation is composed of
31
high magnesian flows (Mg# > 45). These flows however have higher 87
Sr/86
Sr ratios than
the more evolved flows, typical of the “anti-AFC” trend mentioned earlier. Figure 3.8 is a
plot of Mg# v/s 87
Sr/86
Sr, showing the anti-AFC trend. This trend has been reported for
flows from the younger formations (Mahoney et al., 1982; Lightfoot et al., 1990), but to
my knowledge this is the first time it has been recognized in the older formations. Figure
3.8 shows this “anti-AFC” trend and shows that the compositions of the magnesian flows
of the Igatpuri Formation form a linear trend in Mg# - Sr-isotope space with high and low
Mg# flows from the Jawhar Formation as end members.
Comparison with previous studies
Lava compositions measured in this study have been correlated with those of
Beane et al. (1986, 1988) in Table 3.2. In Figure 3.4 and 3.5, data from this study are
compared to those of Bodas et al (1988), and the two datasets show good agreement.
Figure 3.9 compares TiO2 and Zr variations in the GPB flows from the lowermost
formations. Hooper et al. (1988) separate GPB flows into separate fields in this plot,
allowing them to be easily distinguished from each other. Data from this study fall within
the fields of Thalghat and Kashele GPB.
32
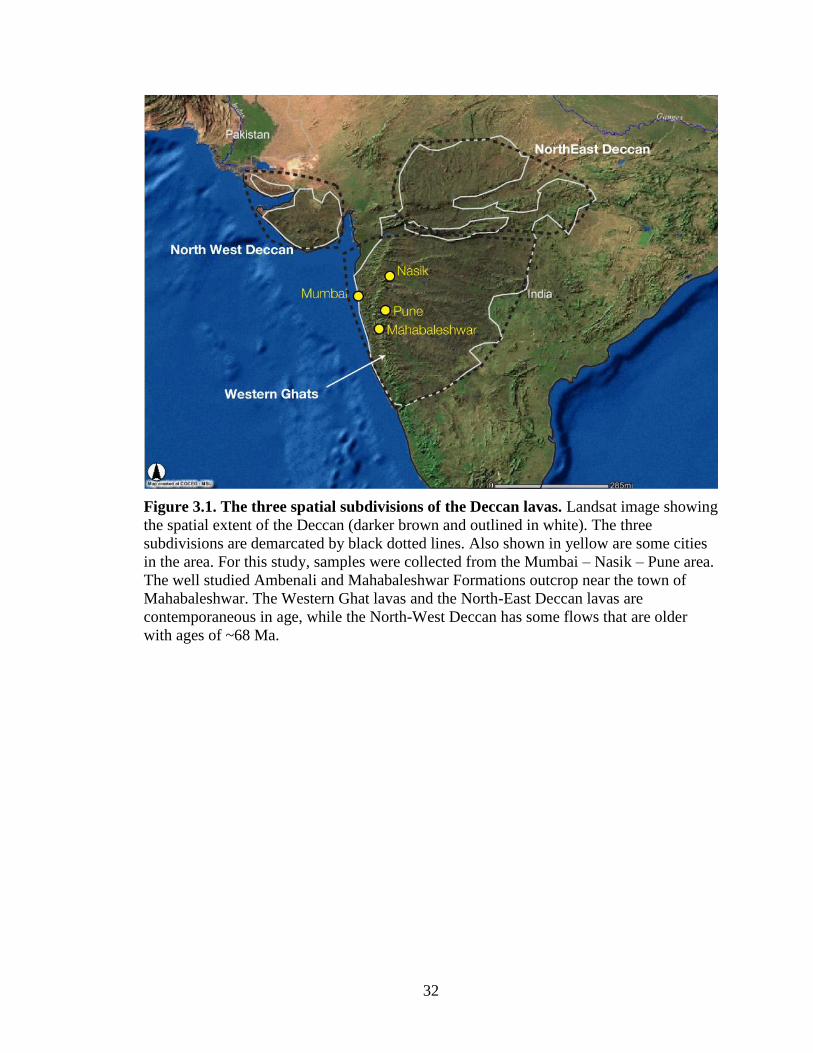
Figure 3.1. The three spatial subdivisions of the Deccan lavas. Landsat image showing
the spatial extent of the Deccan (darker brown and outlined in white). The three
subdivisions are demarcated by black dotted lines. Also shown in yellow are some cities
in the area. For this study, samples were collected from the Mumbai – Nasik – Pune area.
The well studied Ambenali and Mahabaleshwar Formations outcrop near the town of
Mahabaleshwar. The Western Ghat lavas and the North-East Deccan lavas are
contemporaneous in age, while the North-West Deccan has some flows that are older
with ages of ~68 Ma.
33
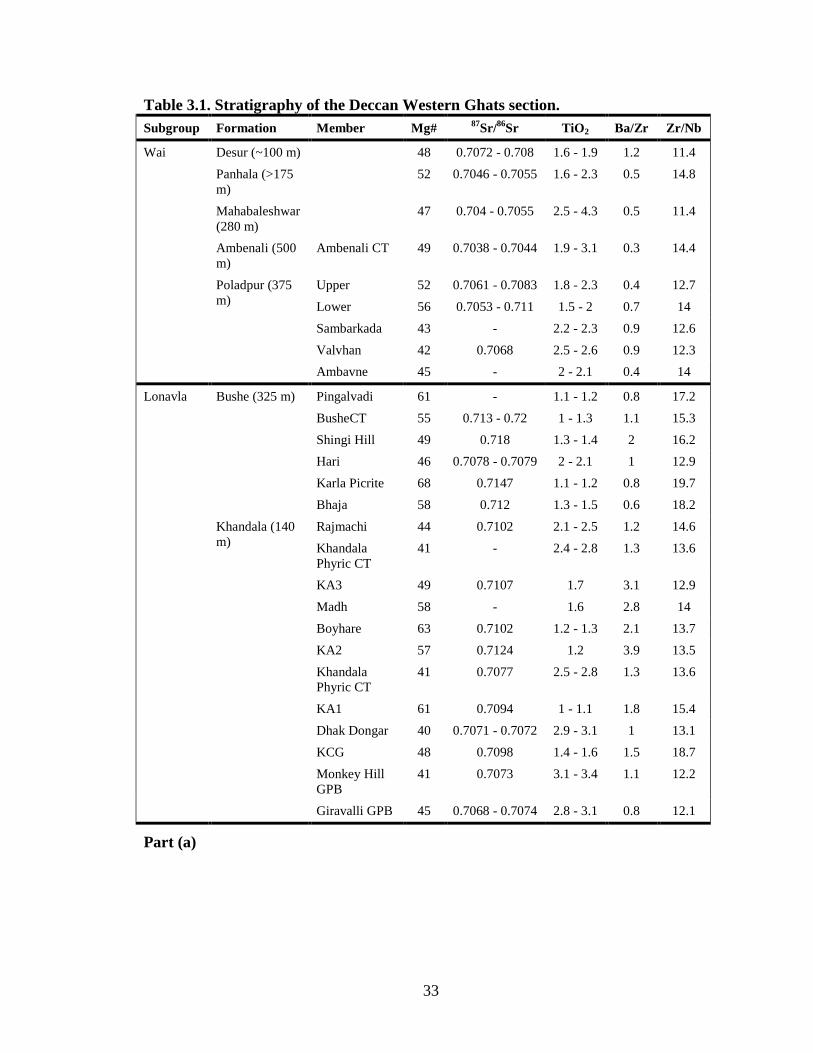
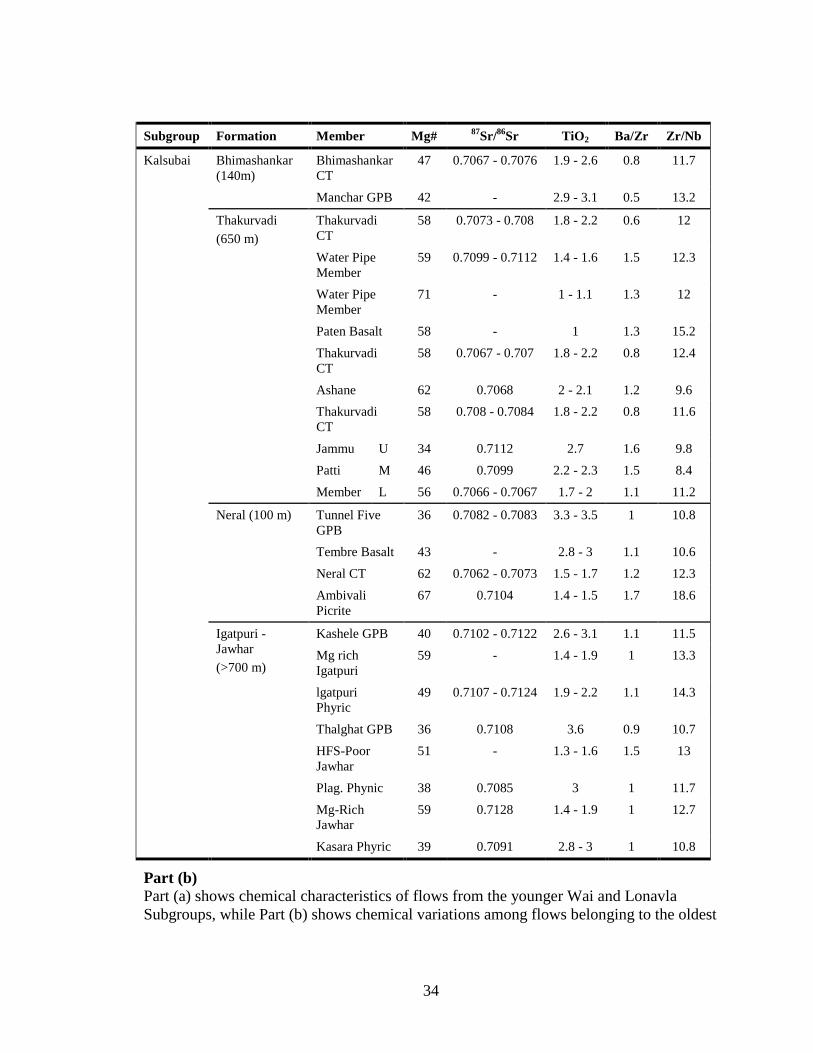
Table 3.1. Stratigraphy of the Deccan Western Ghats section.
Subgroup Formation Member Mg# 87
Sr/86
Sr TiO2 Ba/Zr Zr/Nb
Wai Desur (~100 m) 48 0.7072 - 0.708 1.6 - 1.9 1.2 11.4
Panhala (>175
m)
52 0.7046 - 0.7055 1.6 - 2.3 0.5 14.8
Mahabaleshwar
(280 m)
47 0.704 - 0.7055 2.5 - 4.3 0.5 11.4
Ambenali (500
m)
Ambenali CT 49 0.7038 - 0.7044 1.9 - 3.1 0.3 14.4
Poladpur (375
m)
Upper 52 0.7061 - 0.7083 1.8 - 2.3 0.4 12.7
Lower 56 0.7053 - 0.711 1.5 - 2 0.7 14
Sambarkada 43 - 2.2 - 2.3 0.9 12.6
Valvhan 42 0.7068 2.5 - 2.6 0.9 12.3
Ambavne 45 - 2 - 2.1 0.4 14
Lonavla Bushe (325 m) Pingalvadi 61 - 1.1 - 1.2 0.8 17.2
BusheCT 55 0.713 - 0.72 1 - 1.3 1.1 15.3
Shingi Hill 49 0.718 1.3 - 1.4 2 16.2
Hari 46 0.7078 - 0.7079 2 - 2.1 1 12.9
Karla Picrite 68 0.7147 1.1 - 1.2 0.8 19.7
Bhaja 58 0.712 1.3 - 1.5 0.6 18.2
Khandala (140
m)
Rajmachi 44 0.7102 2.1 - 2.5 1.2 14.6
Khandala
Phyric CT
41 - 2.4 - 2.8 1.3 13.6
KA3 49 0.7107 1.7 3.1 12.9
Madh 58 - 1.6 2.8 14
Boyhare 63 0.7102 1.2 - 1.3 2.1 13.7
KA2 57 0.7124 1.2 3.9 13.5
Khandala
Phyric CT
41 0.7077 2.5 - 2.8 1.3 13.6
KA1 61 0.7094 1 - 1.1 1.8 15.4
Dhak Dongar 40 0.7071 - 0.7072 2.9 - 3.1 1 13.1
KCG 48 0.7098 1.4 - 1.6 1.5 18.7
Monkey Hill
GPB
41 0.7073 3.1 - 3.4 1.1 12.2
Giravalli GPB 45 0.7068 - 0.7074 2.8 - 3.1 0.8 12.1
Part (a)
34
Subgroup Formation Member Mg# 87
Sr/86
Sr TiO2 Ba/Zr Zr/Nb
Kalsubai Bhimashankar
(140m)
Bhimashankar
CT
47 0.7067 - 0.7076 1.9 - 2.6 0.8 11.7
Manchar GPB 42 - 2.9 - 3.1 0.5 13.2
Thakurvadi
(650 m)
Thakurvadi
CT
58 0.7073 - 0.708 1.8 - 2.2 0.6 12
Water Pipe
Member
59 0.7099 - 0.7112 1.4 - 1.6 1.5 12.3
Water Pipe
Member
71 - 1 - 1.1 1.3 12
Paten Basalt 58 - 1 1.3 15.2
Thakurvadi
CT
58 0.7067 - 0.707 1.8 - 2.2 0.8 12.4
Ashane 62 0.7068 2 - 2.1 1.2 9.6
Thakurvadi
CT
58 0.708 - 0.7084 1.8 - 2.2 0.8 11.6
Jammu U 34 0.7112 2.7 1.6 9.8
Patti M 46 0.7099 2.2 - 2.3 1.5 8.4
Member L 56 0.7066 - 0.7067 1.7 - 2 1.1 11.2
Neral (100 m)
Tunnel Five
GPB
36 0.7082 - 0.7083 3.3 - 3.5 1 10.8
Tembre Basalt 43 - 2.8 - 3 1.1 10.6
Neral CT 62 0.7062 - 0.7073 1.5 - 1.7 1.2 12.3
Ambivali
Picrite
67 0.7104 1.4 - 1.5 1.7 18.6
Igatpuri -
Jawhar
(>700 m)
Kashele GPB 40 0.7102 - 0.7122 2.6 - 3.1 1.1 11.5
Mg rich
Igatpuri
59 - 1.4 - 1.9 1 13.3
lgatpuri
Phyric
49 0.7107 - 0.7124 1.9 - 2.2 1.1 14.3
Thalghat GPB 36 0.7108 3.6 0.9 10.7
HFS-Poor
Jawhar
51 - 1.3 - 1.6 1.5 13
Plag. Phynic 38 0.7085 3 1 11.7
Mg-Rich
Jawhar
59 0.7128 1.4 - 1.9 1 12.7
Kasara Phyric 39 0.7091 2.8 - 3 1 10.8
Part (b)
Part (a) shows chemical characteristics of flows from the younger Wai and Lonavla
Subgroups, while Part (b) shows chemical variations among flows belonging to the oldest
35
Kalsubai Subgroup. Table taken from Peng et al., (1994), data from Beane et al., (1986)
and Peng et al., (1994). Divisions of subgroups into formations are shown along with the
thickness of each formation in meters. Major chemical types (CT) and flow members
within each formation are shown in column 3. There is wide variation in chemistry
among flows, but most of them are tholeiitic and evolved with Mg# ~40 (Mg# =
MgO/MgO+Fe2+
O). A few high Mg# flows are interspersed at various elevations within
the lava pile. Flows in a single formation can have a range of chemical and isotopic
compositions. The notable exceptions are the Ambenali, Mahabaleshwar and Bushe
Formations, having flows with fairly limited compositional ranges. Most flows have
slightly to highly elevated Sr-isotopic ratios, which at first order is a result of crustal
contamination. The Ambenali Formation is the only formation showing little to no sign of
such contamination, having Sr-isotope ratios close to bulk earth values. Part (b) shows
the lowermost formations, with the capping GPB members. Note that in some cases the
GPB flows have been included in the formations that overlie them rather than the
formations that underlie them. Peng et al., (1994) also combine the Igatpuri and Jawhar
into a single formation.
36
basalt basaltic
andesite
andesite
8
6
4
2
Na2
O +
K2O
wt
%
70656055504540
SiO2 wt%
Jawhar Igatpuri
Figure 3.2. Le Maitre classification of lava flows from the Jawhar and Igatpuri
Formations. Rocks from the oldest Jawhar Formation are plotted as squares and those
from the Igatpuri Formation are plotted as triangles. All of the samples plot in the basaltic
field. The two samples within the basaltic andesite field have suffered alteration.
37
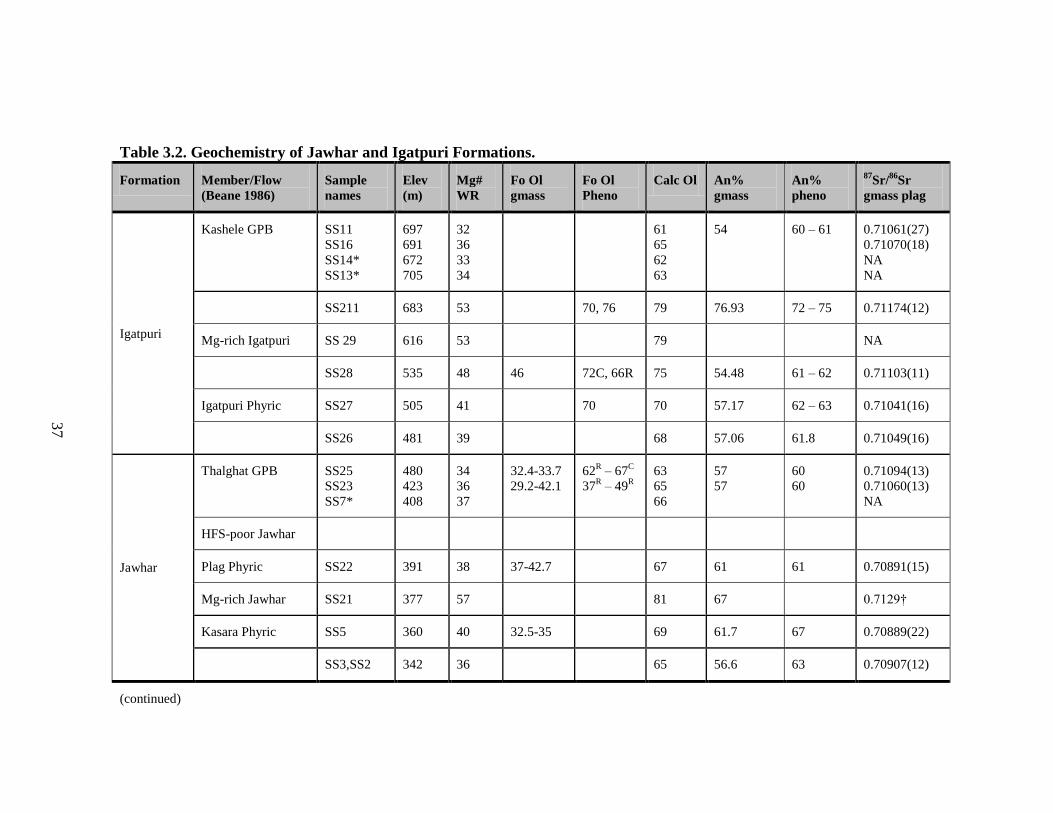
Table 3.2. Geochemistry of Jawhar and Igatpuri Formations.
Formation Member/Flow
(Beane 1986)
Sample
names
Elev
(m)
Mg#
WR
Fo Ol
gmass
Fo Ol
Pheno
Calc Ol An%
gmass
An%
pheno
87Sr/
86Sr
gmass plag
Igatpuri
Kashele GPB SS11
SS16
SS14*
SS13*
697
691
672
705
32
36
33
34
61
65
62
63
54 60 – 61 0.71061(27)
0.71070(18)
NA
NA
SS211 683 53 70, 76 79 76.93 72 – 75 0.71174(12)
Mg-rich Igatpuri SS 29 616 53 79 NA
SS28 535 48 46 72C, 66R 75 54.48 61 – 62 0.71103(11)
Igatpuri Phyric SS27 505 41 70 70 57.17 62 – 63 0.71041(16)
SS26 481 39 68 57.06 61.8 0.71049(16)
Jawhar
Thalghat GPB SS25
SS23
SS7*
480
423
408
34
36
37
32.4-33.7
29.2-42.1
62R – 67
C
37R – 49
R
63
65
66
57
57
60
60
0.71094(13)
0.71060(13)
NA
HFS-poor Jawhar
Plag Phyric SS22 391 38 37-42.7 67 61 61 0.70891(15)
Mg-rich Jawhar SS21 377 57 81 67 0.7129†
Kasara Phyric SS5 360 40 32.5-35 69 61.7 67 0.70889(22)
SS3,SS2 342 36 65 56.6 63 0.70907(12)
(continued)
38
† data from Beane et al. (1986) * altered samples Elev = elevation, gmass = groundmass, pheno = phenocryst, plag = plagioclase
Mg# = 100*MgO/(Mgo+FeO); MgO and FeO counted on a molar basis, all Fe taken as Fe2+
.
C, R core and rim of olivine phenocryst
R Fo of olivine enclosed in rims of plagioclase phenocrysts
C Fo of olivine enclosed in cores of plagioclase phenocrysts
Calc Ol : Cacluated olivine compositions in equilibrium with the Mg# of the matrix. Based on an olivine - liquid (Fe/Mg) Kd of 0.3.
The table shows detailed geochemistry of flows from the Lowermost formations of the Western Ghats, analysed in this study. The
last column shows the 87
Sr/86
Sr error in parentheses, corresponding to the last two digits. Olivine compositions were measured
only in samples that had fresh olivine phenocrysts. Flows sampled in this study have been correlated to those named by Beane et
al. (1986) and Beane (1988). Variations in Mg# and 87
Sr/86
Sr are plotted with respect to elevation in Figure 3.
39
700
600
500
400
Ele
vati
on
(m
)
0.7130.7120.7110.7100.709
87Sr/
86Sr
0.600.500.400.30
Mg#
SS11
SS211
SS29
SS28
SS27
SS26
SS25
SS23
SS21
SS22
SS5
SS2
SS16
SS7
SampleNames
Figure 3.3 Stratigraphic variation of Mg# and 87
Sr/86
Sr in the Jawhar and Igatpuri
Formations. Jawhar flows are denoted by blue squares and Igatpuri data by red triangles.
Dotted horizontal lines are inferred flow boundaries, and the solid line is an observed
flow boundary, which also separates the Igatpuri and Jawhar Formations. Sr- isotope
values presented on the left are the range of measured groundmass values; except for

40
SS27, which is the range of phenocryst values. Black boxes outline the range of giant
plagioclase phenocryst values. Some altered samples, which were not analyzed for Sr
isotopes, have been omitted for clarity.
41
0.40
0.35
0.30
0.25
0.20
0.15
P2O
5 w
t%
4.03.53.02.52.01.5
TiO2 wt%
GPB lavas
Jawhar Fm Igatpuri Fm Bodas 88 Jawhar Bodas 88 Igatpuri
Figure 3.4. P2O5 vs TiO2 variations in lavas from the Jawhar and Igatpuri
Formations. Data from this study are shown as solid symbols, and data from the
previous Bodas et al. (1988) study are plotted as open symbols (squares for Jawhar and
triangles for Igatpuri). Incompatible element oxides TiO2 and P2O5 show a positive
correlation, with the more magnesian flows plotting at the lower range, and the evolved
flows plotting at the upper range. This trend could result from progressively increasing
incompatible element concentrations by fractional crystallization. The most evolved
melts that have the highest concentrations of incompatible elements are the GPB flows
(circled in green).
42
13
12
11
10
9
8
7
CaO
987654
MgO
Igatpuri (Bodas 1988) Jawhar (Bodas 1988) Igatpuri (this study) Jawhar (this study) Comagmat LLD
Figure 3.5. CaO vs MgO variations in lavas from the Jawhar and Igatpuri
Formations. Solid symbols are data from this study, open symbols are data from Bodas
et al. (1988). The dotted lines are liquid lines of descent calculated using the
COMAGMAT and MELTS software. Three starting compositions are considered, and all
three are flows with higher MgO content (>6%). The two Igatpuri starting compositions
are better suited as parental compositions to the flows from the two formations. The
selected high MgO flows do not themselves fall on calculated LLD lines, and so are not
related to each other by fractionation.
43
Figure 3.6. Incompatible element patterns in Jawhar and Igatpuri Formation lavas. Chondrite normalized trace element data for the Jawhar and Igatpuri Formations are
shown in blue and red respectively. Dotted lines are the high MgO flows (MgO .> 6%)
while dashed lines are the evolved flows which in this case are the GPB flows. Lines for
n-MORB and OIB are shown in black for comparison. The patterns mimic OIB patterns
for the most part, apart from depletion in Sr and Nb. (Chondrite data, MORB and OIB
compositions from Sun, 1980; Sun and McDonough, 1989; McDonough and Sun, 1995).
44
Figure 3.7. Chondrite normalized REE patterns for the Igatpuri and Jawhar flows. Igatpuri flows are shown in red and Jawhar flows in blue. All samples have LREE
enriched profiles. Dotted lines are high-MgO flows while dashed lines are the most
evolved flows in the two formations, which in this case are the GPB flows. The slight
negative Eu anomaly in the GPB flows are a result of Eu partitioning into plagioclase
crystals. The patterns are all parallel to each other; the source for the two formations
appears to be similar. The single blue line that cuts across the other trends and shows
higher LREE/HREE is the highly altered SS7 sample.
45
0.713
0.712
0.711
0.710
0.709
0.708
87S
r/86
Sr
555045403530
Mg#
FC
AFC
Mixing
Igatpuri Jawhar
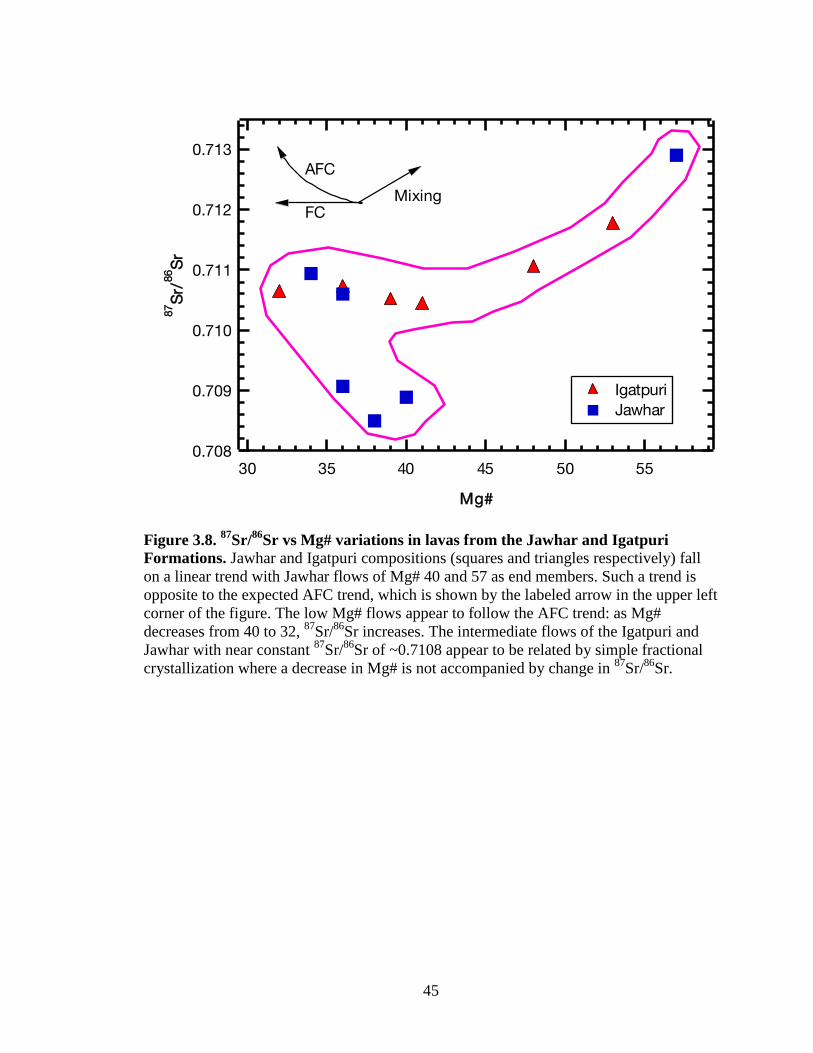
Figure 3.8. 87
Sr/86
Sr vs Mg# variations in lavas from the Jawhar and Igatpuri
Formations. Jawhar and Igatpuri compositions (squares and triangles respectively) fall
on a linear trend with Jawhar flows of Mg# 40 and 57 as end members. Such a trend is
opposite to the expected AFC trend, which is shown by the labeled arrow in the upper left
corner of the figure. The low Mg# flows appear to follow the AFC trend: as Mg#
decreases from 40 to 32, 87
Sr/86
Sr increases. The intermediate flows of the Igatpuri and
Jawhar with near constant 87
Sr/86
Sr of ~0.7108 appear to be related by simple fractional
crystallization where a decrease in Mg# is not accompanied by change in 87
Sr/86
Sr.
46
Ambenali
Manchar
Keshele
Thalghat
Tunnel 5
4.5
4.0
3.5
3.0
2.5
2.0
TiO
2 %
250200150100
Zr ppm
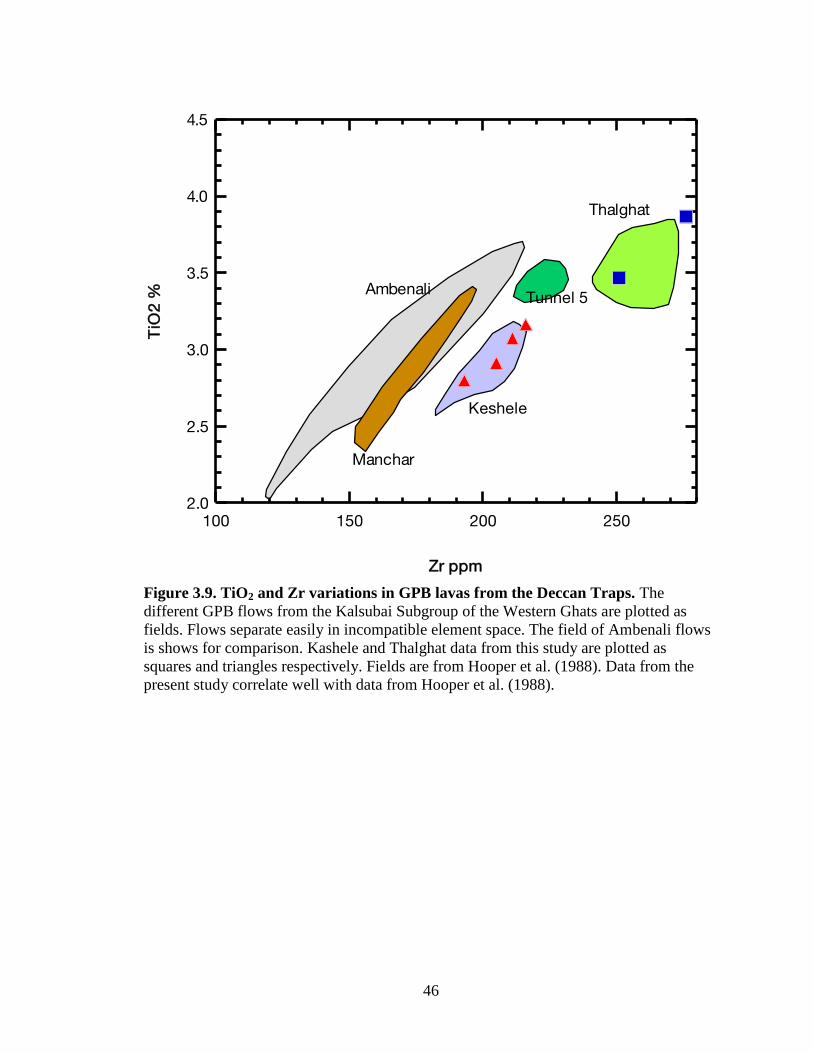
Figure 3.9. TiO2 and Zr variations in GPB lavas from the Deccan Traps. The
different GPB flows from the Kalsubai Subgroup of the Western Ghats are plotted as
fields. Flows separate easily in incompatible element space. The field of Ambenali flows
is shows for comparison. Kashele and Thalghat data from this study are plotted as
squares and triangles respectively. Fields are from Hooper et al. (1988). Data from the
present study correlate well with data from Hooper et al. (1988).
47
CHAPTER IV
OBSERVATIONS ON ZONING IN PLAGIOCLASE FROM THE THALGHAT
AND KASHELE GPB FLOWS.
The giant plagioclase crystals from the Jawhar and Igatpuri Formations were the
main focus of this study. Crystals were sectioned and studied for compositional zoning
characteristics. The GPB crystals were first analyzed for zoning with plane polarized and
cross polarized microscopy. Plagioclase crystals from both Thalghat and Kashele
Formations show faint but pervasive oscillatory zoning, with the more typical normal or
reverse core-rim compositional zoning absent. The only exception was one single crystal
from the Kashele GPB that had a clearly visible “mantle” of higher anorthite (An) content
than the core and rim. The variation due to oscillatory zoning is not more than 2-3% in
An content (Figure 4.1).
Under back-scattered electron (BSE) imaging, the crystals appear completely
homogeneous. The intragrain 2-3% variation in the mean atomic number across
individual crystals is not strong enough to be picked up by BSE imaging; however, a
~200 µm outermost rim forms a darker border around the crystals. Examination of this
zoning with the electron microprobe shows that this rim is drastically lower in An-
content and higher in K and Fe (Figure 4.1). This outermost rim most likely grew during
rapid cooling of the host lava.
In contrast to the weakly visible optical zoning, cathodoluminescence (CL)
imaging revealed conspicuous zoning features.. In the Thalghat GPB, some plagioclase
crystals appear to have a well defined central core about 1/3rd
the length and width of the
48
crystal (Figure 4.2). In Kashele GPB crystals, the zoning is different and all crystals show
a number of well developed zones (Figure 4.3). Oscillatory zoning can also be observed
in CL images, although it is much lower in intensity than the core-rim zoning. In Figure
4.9, both types of zoning are exhibited by the Kashele crystal SS11_tr1.
Cathodoluminescence in plagioclase is activated by a number of ions. CL can be
caused by variation in An-content, which is why the oscillatory zoning is seen in CL but
not in BSE images. Mn2+
, Ti3+
and Fe3+
can also activate CL in plagioclase (Mora and
Ramseyer, 1992; Goetze et al., 1999; Lee et al., 2007). Fe3+
causes plagioclase to
fluoresce in the red spectrum (~690 nm wavelength) and Ti3+
causes emission in the blue
spectrum (~450 nm) (Goetze et al., 1999; Lee et al., 2007). Since CL images were taken
on an electron microprobe rather than an optical CL microscope, the exact cause of the
major core-rim zoning cannot be determined. However, it is possible that the zoning
revealed by CL imaging reflects a change in Fe3+
or Ti3+
, which in turn may reflect a
change in oxidation states of the surrounding melt from which the crystal grew. One
could further speculate that this rapid local changes in the redox state of the melt
occurred as a result of mixing of differentially oxidized melts, or perhaps due to an
increase in the dissolved water content of the magma.
Plagioclase phenocrysts and plagioclase groundmass crystals in the two
formations were analyzed for major elements, trace elements (Sr, Ba, Mg, Fe, K) and
87Sr/
86Sr ratios. All analyses were performed along transects that cut across zones of
crystals as revealed by CL imaging, shown in Figure 4.2. . As stated before in the
Methods section, 87
Sr/86
Sr data from this study do not need age-correction and can be
compared with whole-rock age-corrected data extracted from the published literature.
49
Zoning systematics in the Thalghat and Kashele GPB phenocrysts are very
different, pointing to varying magmatic processes involved during crystal growth. There
are some commonalities between the crystals, namely a weak to nonexistent major
element zoning, even when zoning is clearly visible in CL images (Figures 4.5 and 4.6).
These features are discussed below.
A note on nomenclature used
In this chapter and in later chapters, compositional zones in a crystal are named as
follows. The innermost zone is termed as the core. It is around 1 mm - 1 cm in length in
the crystals studied. In some crystals, the core may not be observed, depending on the
plane across which the crystal is sectioned. Zones which grow over the core are termed as
rims. Note that there can be more than one rim depending on how many cycles of
compositional change the magma undergoes. Rims are a few mm in thickness. Where
more than one rim is present, the layers are termed as rim1, rim2 etc. In all crystals
studied, there is an outermost selvage that has a strongly contrasting composition. This
outermost layer is a few tens of microns thick, and has compositions that are increasingly
albitic: compositions change from An60 to An40 or less in this thickness. It probably
originates during post eruptional cooling of the lava flow. Since this layer is seen in both,
zoned and unzoned crystals, it has no relation with the core-rim zoning. This outermost
rim is therefore not considered during the evaluation of magmatic processes involved in
the creation of crystal zoning. Where referred to it will be termed the “outermost rim”. To
summarize, the zoned crystals are composed of a core, one or more rim, and an outermost
rim.
50
87Sr/
86Sr Zoning in Thalghat GPB.
Thalghat GPB crystals are mostly unzoned, and only 2 of the 16 crystals studied
showed zoning. CL images of zoned and unzoned crystals are shown in Figure 4.2.
Figure 4.4 shows data collected across three unzoned (in terms of elemental zoning)
phenocrysts from the Thalghat GPB. Sr-isotope ratios in these crystals vary from 0.71040
to 0.71060, with a few outliers. 87
Sr/86
Sr ratios of the groundmass plagioclase crystals
form a tight cluster at ~0.71060, which is the same as that of the outermost ratios at the
edges of the phenocrysts, both zoned and unzoned. Because the groundmass crystals have
likely formed during eruption and cooling of the lava, it is reasonable to conclude that
both such crystals and the rims of the plagioclase phenocrysts grew in the host lava while
maintaining isotopic equilibrium with it.
Compositional variations along the length and width of the zoned crystals are
shown Figures 4.5 and 4.6. As seen in the CL images of zoned crystals SS23A_tr1 and
SS23A_tr2, the zoning is simple core-rim zoning. This zoning is not reflected in the
major element or the trace element profile, but 87
Sr/86
Sr shows strong zoning with distinct
core and rim isotopic ratios. The rim 87
Sr/86
Sr composition in both cases is ~0.71060;
similar to that of the groundmass plagioclase, and therefore similar to the unzoned
crystals. The cores and the rims both appear homogeneous within error, with a sharp
change in composition across the core-rim boundary. The two crystals shown in Figures
4.5 and 4.6 differ in core compositions, SS23_tr1 has a higher core 87
Sr/86
Sr of 0.70985
(Figure 4.5) while SS23_tr2 has a core 87
Sr/86
Sr of ~0.70970 (Figure 4.6).
51
87Sr/
86Sr Zoning in Kashele GPB.
In contrast to the Thalghat GPB, Kashele GPB crystals are all zoned, a typical
example of which is shown in Figure 4.3. Additional CL images of Kashele crystals
accompanied by compositional data are shown in Figures 4.7 – 4.11. Kashele GPB was
sampled in two locations with Sample numbers SS16 and SS11. While SS11 was a fresh
sample with clear plagioclase, SS16 was an altered flow that had plagioclase riddled with
cracks. However, the Sr-isotope analyses for both groups of crystals showed similar
measured Sr-isotopic ratios and crystal profiles were also comparable; for example the
core-rim variation of 0.70980 - 0.71080 in crystal SS16A_tr1 (Figure 4.7) is similar to
that in SS11B (Figure 4.10 center graph), therefore Sr isotope data from the altered SS16
was included in this study.
It is clear from Figures 4.10 and 4.11 that zoning in Kashele GPB is quite unlike
the simple core-rim zoning of the Thalghat. In CL images of Kashele crystals, the darker
zone boundaries show evidence of resorption features, especially in the outermost rims
(e.g. Figure 4.9). In a single crystal, core-rim variations range from 0.0004 to 0.0016 in
Δ87
Sr/86
Sr ratios, depending on the location of the transect. Tracks through crystal centers
(Figure 4.10 and Figure 4.11 bottom graphs) have small variations from 0.71040 (rim) to
0.71080 (core). This is opposite in style to Thalghat zoning where the core has a lower
ratio than the rim. When transects away from the center of the crystal are considered, the
variation increases to 0.70960 (rim) and 0.71080 (core, middle graph in Figure 4.10). At
the crystal extremities, the lower ratio of 0.70960 sharply rises to ~0.71040. Groundmass
plagioclase also shows a wide variation from 0.71020 to 0.71090.
52
Decoupled vs. non-decoupled zoning in An-content, trace element and Sr-isotope
composition
Figures 4.5 and 4.6 show the variations in Sr, Ba and An-content across Thalghat
GPB crystals and Figure 4.10 shows the same in a Kashele GPB crystal. For a crystal
growing in thermodynamic equilibrium with a melt, there is a definite relationship
between Ba and Sr in the plagioclase crystal versus that in the melt. Specifically, Sr is
compatible in plagioclase while Ba is not (for An contents of 30% and above at 1100 °C
e.g. Blundy and Wood, 1991). There is also a relationship between An content of
plagioclase and Ba and Sr composition, viz that both are increasingly compatible in more
albitic plagioclase. Relationship between trace elements and An content is therefore a
measure of thermodynamic equilibrium in a crystal, and has been used by Zellmer et al.
(1999) and Costa et al. (2003) to calculate crystal residence times.
In zoned Thalghat GPB crystals, Sr and Ba variations are very small over the bulk
of the crystal, in fact, as Figure 4.5 and 4.6 show, the core and the rim have essentially
the same Sr or Ba concentrations. This also corresponds with the An content, which
shows little variation from an average An60 composition. There is therefore complete
decoupling between isotopic and elemental variation in the Thalghat GPB. This is a
surprising feature, because it requires growth of core and rim from two magmas that were
nearly identical in major and trace elemental composition but widely different in isotopic
composition. At the core-rim zone boundaries, there is a slight positive jump in An,
which is reflected by negative dips in Sr and Ba. This behavior is expected from the
thermodynamic relationship of Ba and Sr partitioning in plagioclase to the An content of
the plagioclase (Blundy and Wood, 1991).
53
The Kashele GPB shows an interesting manner of coupling between trace element
contents and isotopic ratios. Here the decoupling is not as strong and Sr and Ba are seen
to vary directly with 87
Sr/86
Sr. This variation is clearly seen at the crystal edge in the
bottom left graph in Figure 4.11: as 87
Sr/86
Sr dips close to the crystal edge, Sr and Ba
follow suit. However, this coupling does not extend to An content. Apart from a jump
near the crystal edge, there is no variation in An corresponding to the trace element and
isotopic variation.
Inferences from zoning in Thalghat and Kashele GPB
Equilibrium growth of Thalghat GPB
The Thalghat GPB are mostly unzoned, and the zoned crystals show simple core-
rim zoning. The rims of the zoned crystals are similar in Sr-isotope composition to the
unzoned crystals. The cores of the zoned crystals have lower Sr-ratios which are different
from each other. This may be due to the two cores having separate growth histories
before being introduced into the magma chamber in which the rim grew. Conversely, the
core ratios could have been the same initially, but changed by solid state processes like
diffusive equilibration. It is clear however that the rim zones and the unzoned crystals
have a shared history. The cores and rims grew from two different magmas, perhaps in
two separate chambers: the crystals initially formed in a chamber with 87
Sr/86
Sr
compositions of ~0.7097 – 0.7098 and were then transported to a second magma
reservoir where the rims began to grow. This is consistent with the idea that tholeiitic
magmas pass through several magma chambers linked via dikes during transit from
source to eruption (Marsh, 1988). The uniform groundmass composition, fairly uniform
54
rim composition of the Thalghat GPB crystal, and the broad thickness of its rim all
appear to suggest that this crystal’s rim grew in a steady-state, homogenized magma
chamber. The equilibrium behaviour of trace elements in response to changing An-
content is also a sign of equilibrium growth. In such a steady state condition of growth,
the variation between the core and the rim 87
Sr/86
Sr composition can be thought to have
resulted from diffusive equilibration across the core-rim boundary. The timescale of this
diffusive process would allow the calculation of the residence time of the crystal in the
magma chamber, since its growth has not been interrupted by crystal dissolution events.
Disequilibrium growth of Kashele GPB
By combining transects from all Kashele crystals measured, I prepared a
schematic of 87
Sr/86
Sr zoning within a typical Kashele crystal showing a core and three
rim zones: R1, R2 and R3 (Figure 4.12). The growth history can then be summarized as
follows: during the initial part of the crystal’s growth duration, the crystal grew in a
magma of 87
Sr/86
Sr ratio 0.71080, although large and short lived variations did take place
(as in Figure 4.11 top). Growth of rim R1 was accompanied by a smooth increase in of
the crystal layers to 0.71120, followed by a smooth decrease back to 0.71080 and the
growth of rim R2. This smooth increase and decrease could mean that the original
magma mixed with another of higher 87
Sr/86
Sr ratio and its composition change was
recorded in the growing crystal. Another change took place when a magma of lower
87Sr/
86Sr was introduced, causing a smooth lowering of the
87Sr/
86Sr composition to
0.70960. This event was then suddenly interrupted and magma composition changed
rapidly to ~0.71040, growing rim R3 on the crystal. The crystal has therefore seen a
55
number of magmatic composition, and likely grew in a magma conduit rather than a
homogeneous magma chamber.
The magnitude of Sr-isotopic variation in Kashele GPB (0.70960-0.71120) is
larger than that of the Thalghat GPB crystals (0.70970-0.71080). Unlike Thalghat
crystals, the zone boundaries do not exhibit large jumps in 87
Sr/86
Sr, instead small
oscillations in 87
Sr/86
Sr are seen. In this case, it appears that the crystal’s growing faces
were receiving nutrients from an adjacent melt whose 87
Sr/86
Sr composition was
continuously changing. This is also borne out by the wide variation in Kashele
groundmass plagioclase 87
Sr/86
Sr (0.71020 to 0.71090). This large variation mirrors the
oscillatory behavior of 87
Sr/86
Sr in the giant plagioclase crystal, perhaps implying that in
this case the crystals grew in a fairly unsettled, non-steady state environment. This type
of growth may have happened in a solidification front in a dike-like conduit, rather than a
magma chamber network as suggested by Sen et al. (2006).
In both the Kashele and Thalghat GPB crystals, the An content does not vary
more than ±5%, which corresponds to a variation of about 150 ppm Sr and 45 ppm Ba;
calculated at 1100°C using equations in Blundy and Wood (1991). These are more or less
the variations we see in our samples. However, the trace element variation in the Kashele
GPB does not follow the thermodynamic condition that Sr and Ba variation should be
opposite to that of An, as there is no positive An peak corresponding to the dip in trace
elements (bottom graph Figure 4.11). The Kashele therefore grew in disequilibrium
conditions, an additional effect of growth in a non steady state environment.
56
Correlation between zones and erupted flow compositions
It is clear that the zoned Kashele and Thalghat GPB crystals have recorded
multiple magmatic signals. Sen (2001) postulated that the signals recorded by GPB
crystals would be inherited from magmas that gave rise to flows underlying the GPB.
Figure 4.13 compares 87
Sr/86
Sr of crystal zones with 87
Sr/86
Sr of sub-GPB flows. The
outer rims of the crystals are seen to be in equilibrium with the host lava flows. In the
Thalghat GPB, the core zone with lower 87
Sr/86
Sr cannot be explicitly correlated to an
underlying flow. Of the flows underlying the Thalghat GPB, SS21 can be discounted as it
has high 87
Sr/86
Sr ratios, but flows SS3, SS5 and SS22 all have low 87
Sr/86
Sr of~ 0.70900.
This value is significantly smaller than the Thalghat GPB core value of 0.70960. The
magma in which the GPB core grew thus has a composition intermediate between the
highest and lowest in the Jawhar Formation, and has no surface expression as a lava flow.
The Kashele GPB zones show good correlation with the stratigraphically lower
flows of the Igatpuri Formation. The 87
Sr/86
Sr variations in analyzed Kashele crystals
represent nearly all the Igatpuri flows, with exceptions being the high Mg# flows. The
source magma of the high Mg# flows SS211 and SS29 would have a higher temperature,
and would probably cause dissolution of plagioclase rather than growth. This may be why
87Sr/
86Sr compositions of the high Mg# flows are not recorded in growing plagioclase
crystals. Close to the outer rim, the 87
Sr/86
Sr compositions of Kashele plagioclase
decrease to 0.70960 (Figures 4.10, 4.12). This composition is not seen in any of the
Igatpuri flows. Oddly, this value is the same as that of the Thalghat GPB zone, which, as
seen above, has no correlation with erupted Jawhar Formation lavas (these values are
listed in bold lettering in Figure 4.13). The ~2 cm phenocrysts from flow SS27 (which
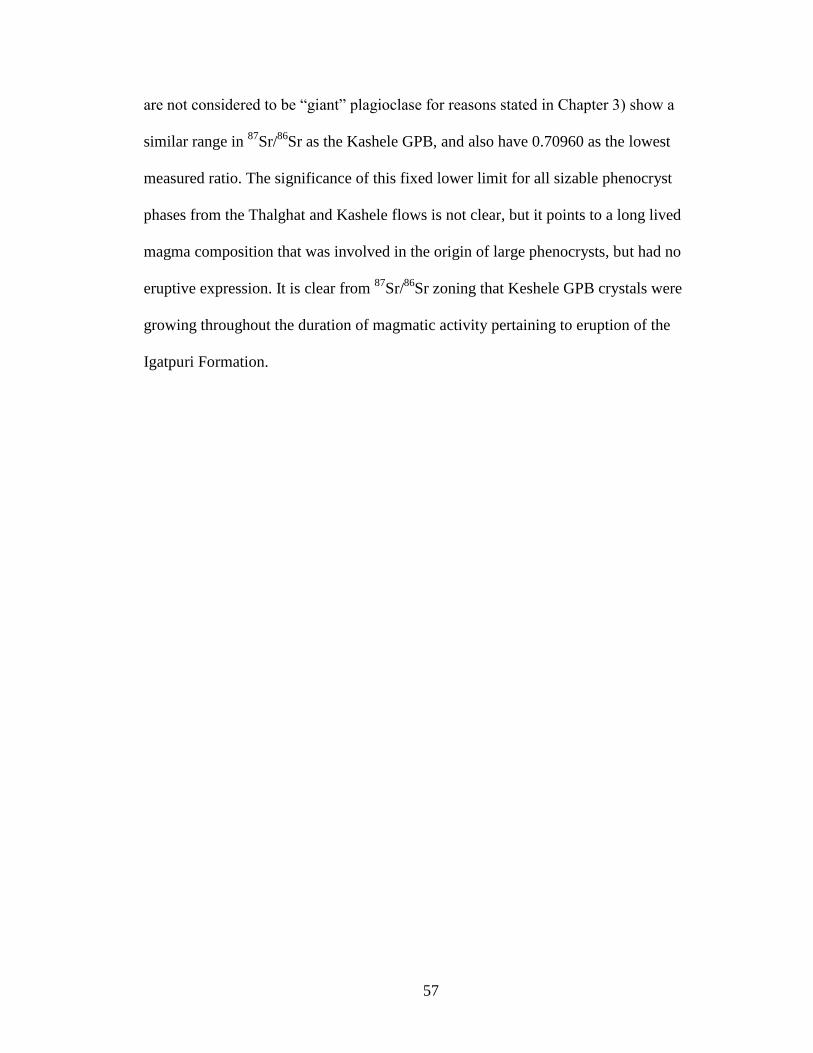
57
are not considered to be “giant” plagioclase for reasons stated in Chapter 3) show a
similar range in 87
Sr/86
Sr as the Kashele GPB, and also have 0.70960 as the lowest
measured ratio. The significance of this fixed lower limit for all sizable phenocryst
phases from the Thalghat and Kashele flows is not clear, but it points to a long lived
magma composition that was involved in the origin of large phenocrysts, but had no
eruptive expression. It is clear from 87
Sr/86
Sr zoning that Keshele GPB crystals were
growing throughout the duration of magmatic activity pertaining to eruption of the
Igatpuri Formation.
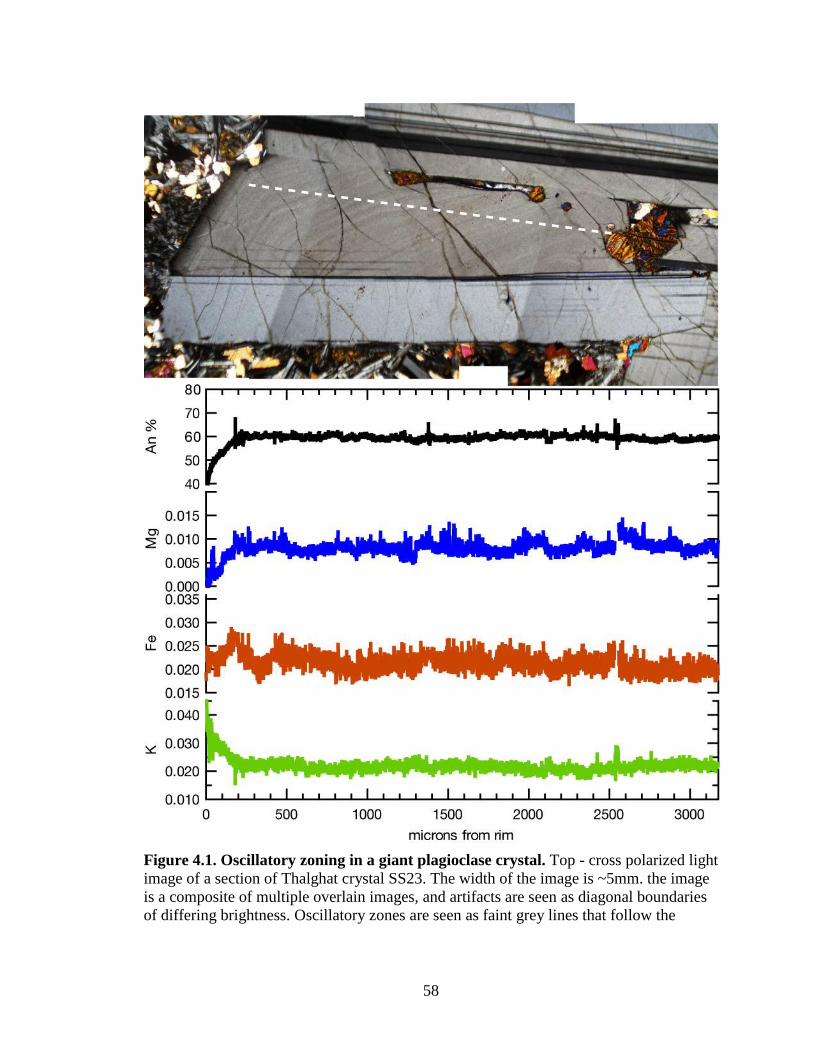
58
Figure 4.1. Oscillatory zoning in a giant plagioclase crystal. Top - cross polarized light
image of a section of Thalghat crystal SS23. The width of the image is ~5mm. the image
is a composite of multiple overlain images, and artifacts are seen as diagonal boundaries
of differing brightness. Oscillatory zones are seen as faint grey lines that follow the
59
outline of the crystal. The crystal contains inclusions of altered olivines and glass
pockets. The edge of the crystal at the right of the image shows a markedly darker rim,
which could be due to an albitic overgrowth. White dashed line shows the path along
which electron microprobe analyses were carried out at 1 micron intervals. Bottom: data
from electron microprobe transects across the crystal. An content, Mg, Fe and K are
presented as molar proportions calculated according to the plagioclase structural formula.
It is seen that major zoning is absent and variations due to the oscillatory zoning are
small. The albitic overgrowth is ~200 microns thick and is characterized by a smooth
decrease in An content accompanied by a decrease in Mg and an increase in K.
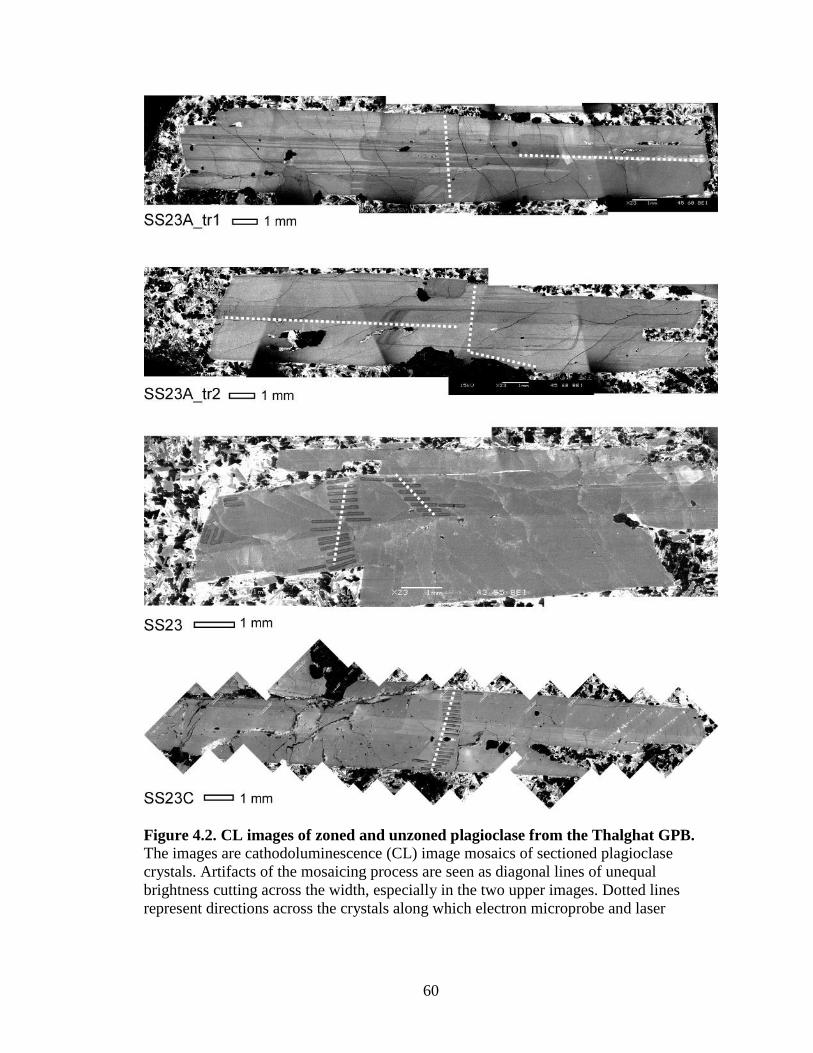
60
Figure 4.2. CL images of zoned and unzoned plagioclase from the Thalghat GPB. The images are cathodoluminescence (CL) image mosaics of sectioned plagioclase
crystals. Artifacts of the mosaicing process are seen as diagonal lines of unequal
brightness cutting across the width, especially in the two upper images. Dotted lines
represent directions across the crystals along which electron microprobe and laser

61
ablation ICPMS data has been collected. The crystals in the upper figures are zoned, with
the core zone visible in CL. In the lower two figures, laser ablation tracks are clearly
visible, arranged parallel to each other, and orthogonal to the actual direction of traverse.
In the two upper crystals, SS23A_tr1 and SS23A_tr2, data have been measured in two
directions across the crystal, rim-to-rim in the short direction, and rim-to-core in the long
direction.
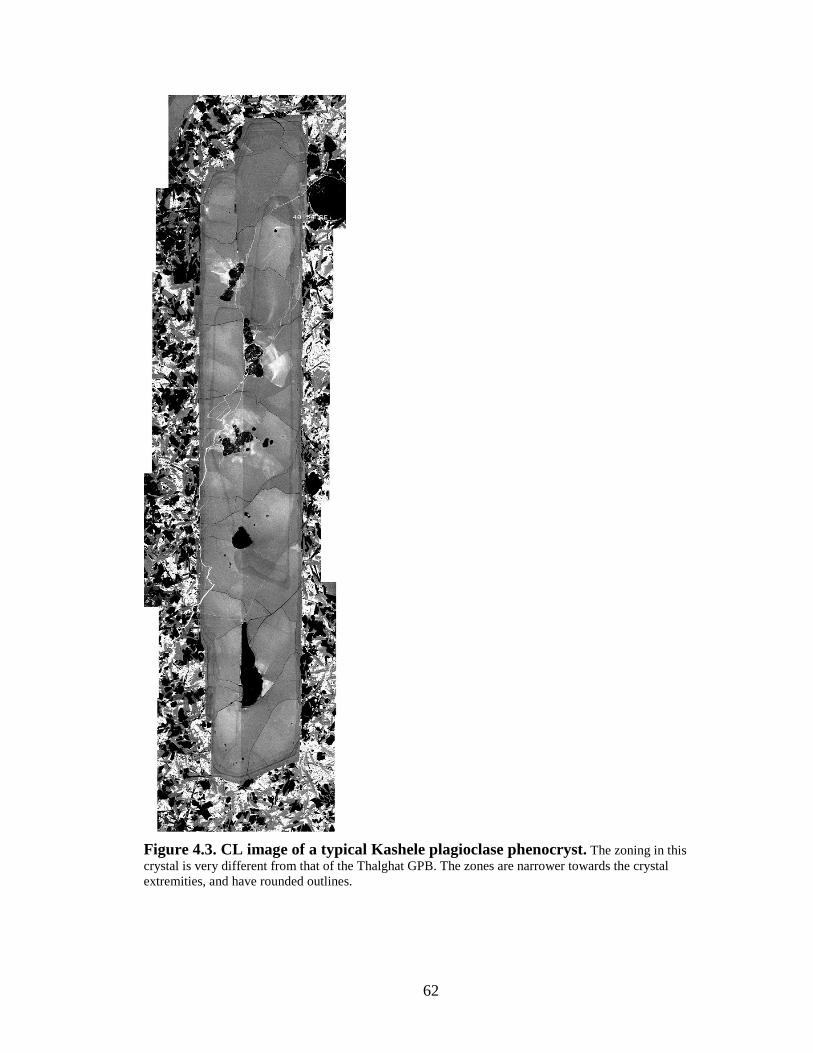
62
Figure 4.3. CL image of a typical Kashele plagioclase phenocryst. The zoning in this
crystal is very different from that of the Thalghat GPB. The zones are narrower towards the crystal
extremities, and have rounded outlines.
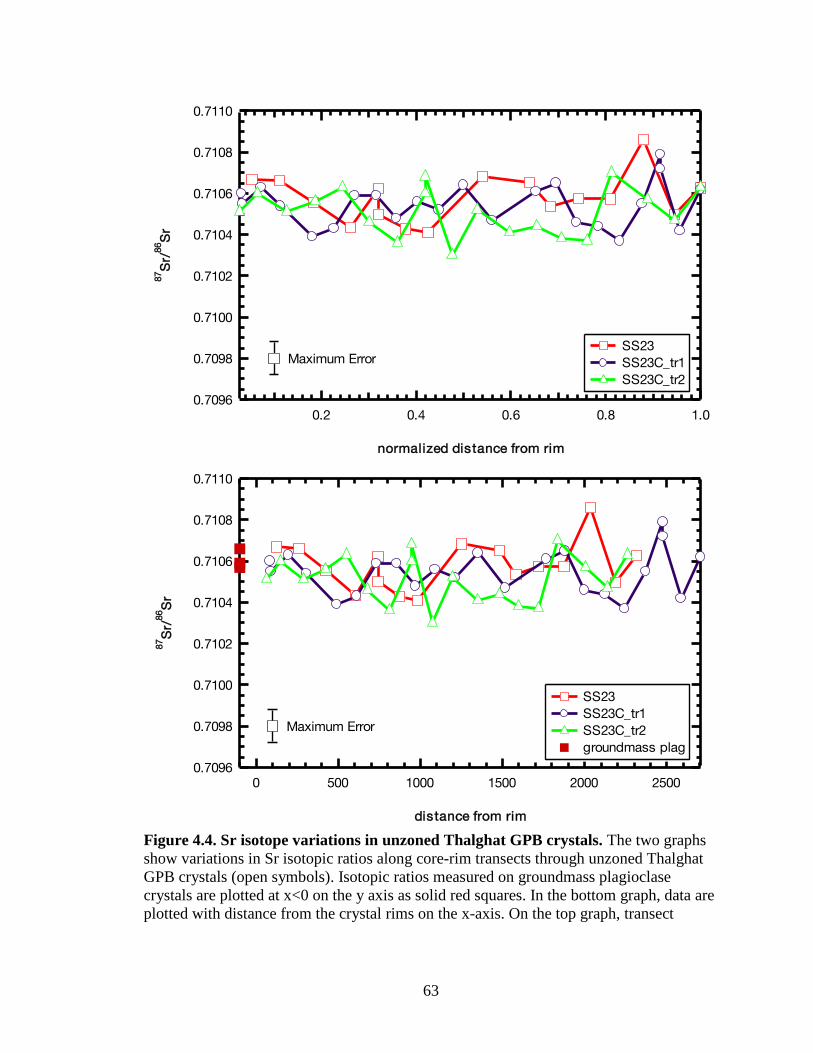
63
0.7110
0.7108
0.7106
0.7104
0.7102
0.7100
0.7098
0.7096
87S
r/86
Sr
1.00.80.60.40.2
normalized distance from rim
SS23 SS23C_tr1 SS23C_tr2
Maximum ErrorMaximum Error
0.7110
0.7108
0.7106
0.7104
0.7102
0.7100
0.7098
0.7096
87S
r/86
Sr
25002000150010005000
distance from rim
SS23 SS23C_tr1 SS23C_tr2 groundmass plag
Maximum Error
Figure 4.4. Sr isotope variations in unzoned Thalghat GPB crystals. The two graphs
show variations in Sr isotopic ratios along core-rim transects through unzoned Thalghat
GPB crystals (open symbols). Isotopic ratios measured on groundmass plagioclase
crystals are plotted at x<0 on the y axis as solid red squares. In the bottom graph, data are
plotted with distance from the crystal rims on the x-axis. On the top graph, transect

64
distances are normalized from 0 to 1, so that rims can be better compared. Though there
is some variation in Sr-isotopic ratios, the rims of the crystals are consistently around
0.71060, which is also the isotopic ratio of the groundmass plagioclase (solid squares).
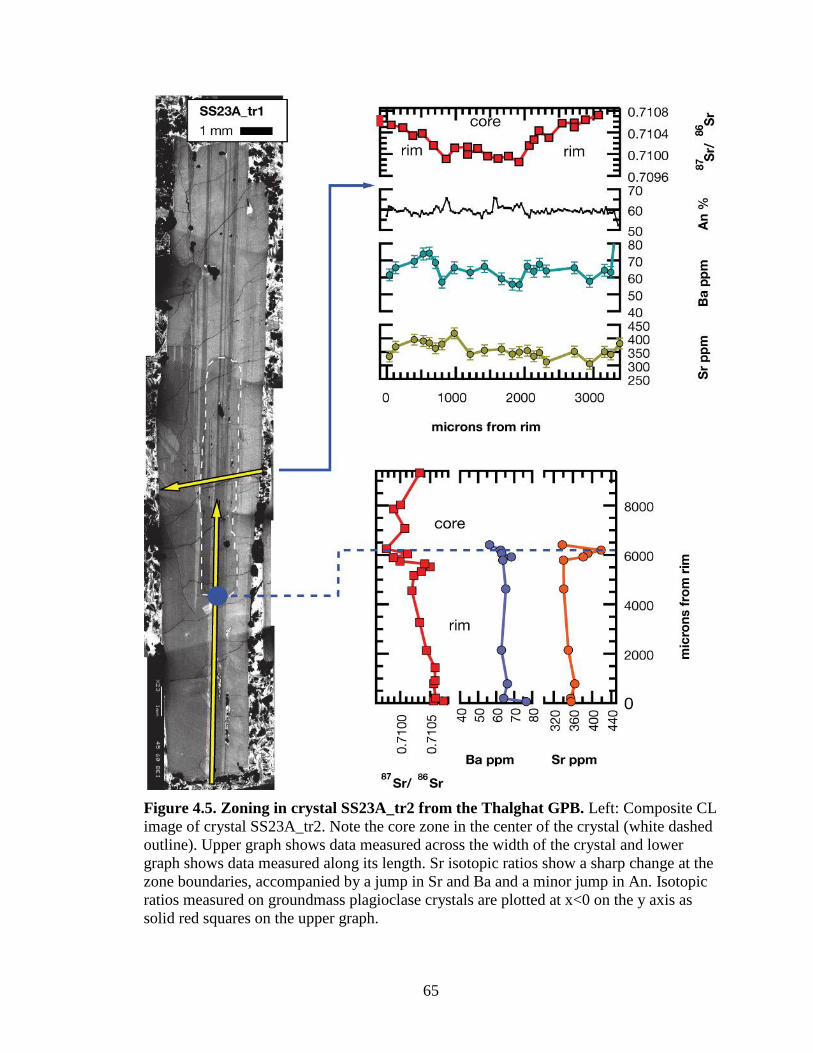
65
Figure 4.5. Zoning in crystal SS23A_tr2 from the Thalghat GPB. Left: Composite CL
image of crystal SS23A_tr2. Note the core zone in the center of the crystal (white dashed
outline). Upper graph shows data measured across the width of the crystal and lower
graph shows data measured along its length. Sr isotopic ratios show a sharp change at the
zone boundaries, accompanied by a jump in Sr and Ba and a minor jump in An. Isotopic
ratios measured on groundmass plagioclase crystals are plotted at x<0 on the y axis as
solid red squares on the upper graph.
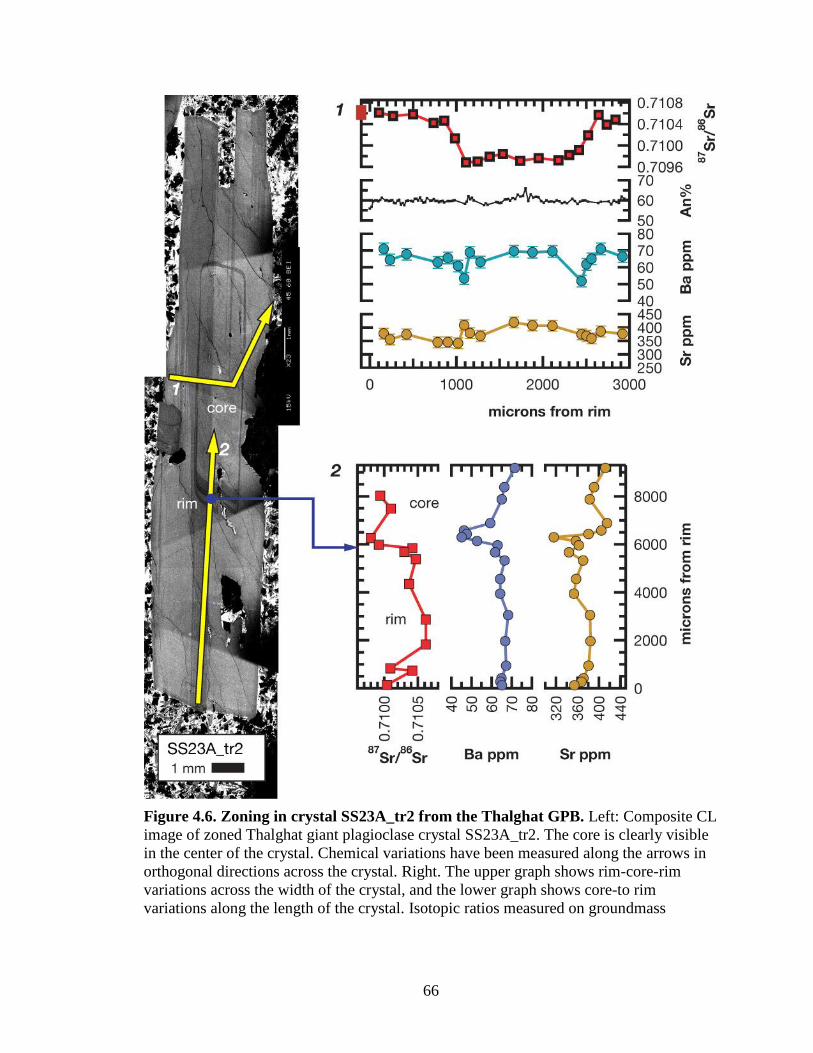
66
Figure 4.6. Zoning in crystal SS23A_tr2 from the Thalghat GPB. Left: Composite CL
image of zoned Thalghat giant plagioclase crystal SS23A_tr2. The core is clearly visible
in the center of the crystal. Chemical variations have been measured along the arrows in
orthogonal directions across the crystal. Right. The upper graph shows rim-core-rim
variations across the width of the crystal, and the lower graph shows core-to rim
variations along the length of the crystal. Isotopic ratios measured on groundmass

67
plagioclase crystals are plotted at x<0 on the y axis as solid red squares in the upper
graph.
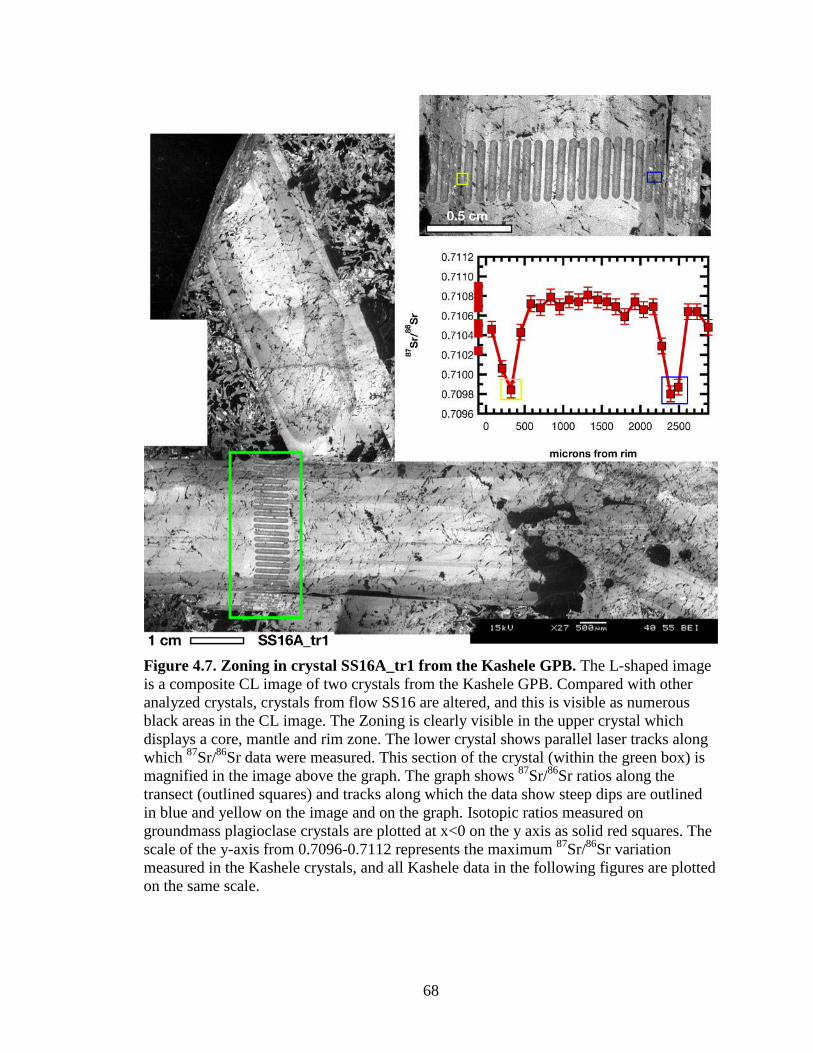
68
Figure 4.7. Zoning in crystal SS16A_tr1 from the Kashele GPB. The L-shaped image
is a composite CL image of two crystals from the Kashele GPB. Compared with other
analyzed crystals, crystals from flow SS16 are altered, and this is visible as numerous
black areas in the CL image. The Zoning is clearly visible in the upper crystal which
displays a core, mantle and rim zone. The lower crystal shows parallel laser tracks along
which 87
Sr/86
Sr data were measured. This section of the crystal (within the green box) is
magnified in the image above the graph. The graph shows 87
Sr/86
Sr ratios along the
transect (outlined squares) and tracks along which the data show steep dips are outlined
in blue and yellow on the image and on the graph. Isotopic ratios measured on
groundmass plagioclase crystals are plotted at x<0 on the y axis as solid red squares. The
scale of the y-axis from 0.7096-0.7112 represents the maximum 87
Sr/86
Sr variation
measured in the Kashele crystals, and all Kashele data in the following figures are plotted
on the same scale.
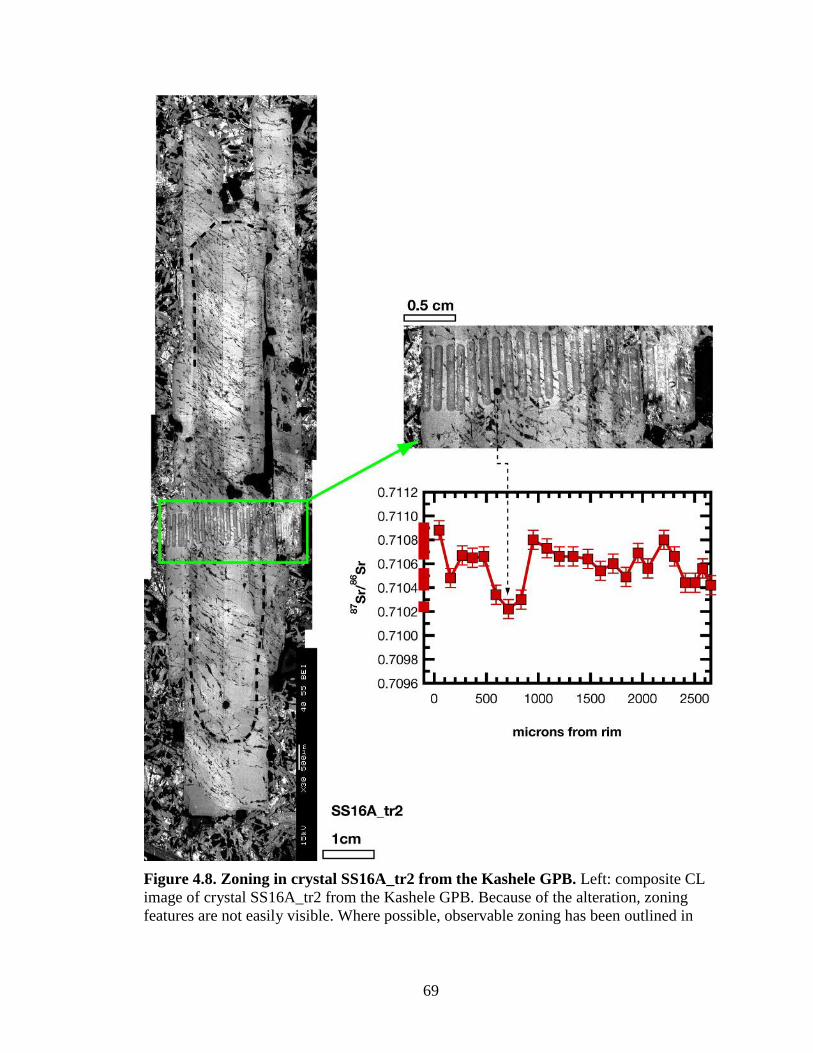
69
Figure 4.8. Zoning in crystal SS16A_tr2 from the Kashele GPB. Left: composite CL
image of crystal SS16A_tr2 from the Kashele GPB. Because of the alteration, zoning
features are not easily visible. Where possible, observable zoning has been outlined in

70
dashed black lines. The upper right image is a magnified view of the laser ablation tracks.
The graph shows 87
Sr/86
Sr ratios along the transect. Not much variation is seen, and the
location of the single dip in ratios is marked on the image. Isotopic ratios measured on
groundmass plagioclase crystals are plotted at x<0 on the y axis as solid red squares.
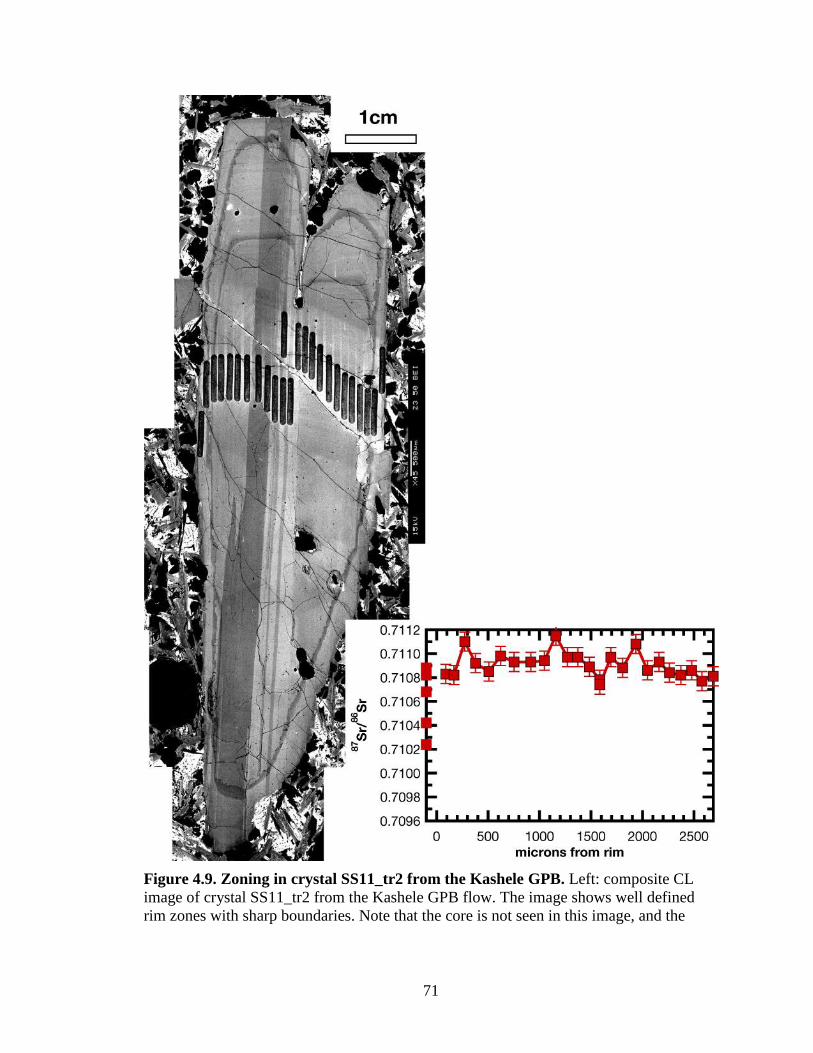
71
Figure 4.9. Zoning in crystal SS11_tr2 from the Kashele GPB. Left: composite CL
image of crystal SS11_tr2 from the Kashele GPB flow. The image shows well defined
rim zones with sharp boundaries. Note that the core is not seen in this image, and the
72
number of zones are also smaller that those seen in the crystals in the following graphs.
Oscillatory zoning is faintly seen between the more clearly defined rim zones. The rim
zones have a tapering outline towards the crystal edge. The outermost zone boundary
shows an undulating outline that could have resulted from dissolution events. The graph
shows 87
Sr/86
Sr data across the ablation tracks visible in the crystal. The variation in this
crystal is very small, and the 87
Sr/86
Sr ratios the highest in the Kashele crystals studied.
Isotopic ratios measured on groundmass plagioclase crystals are plotted at x<0 on the y
axis as solid red squares.
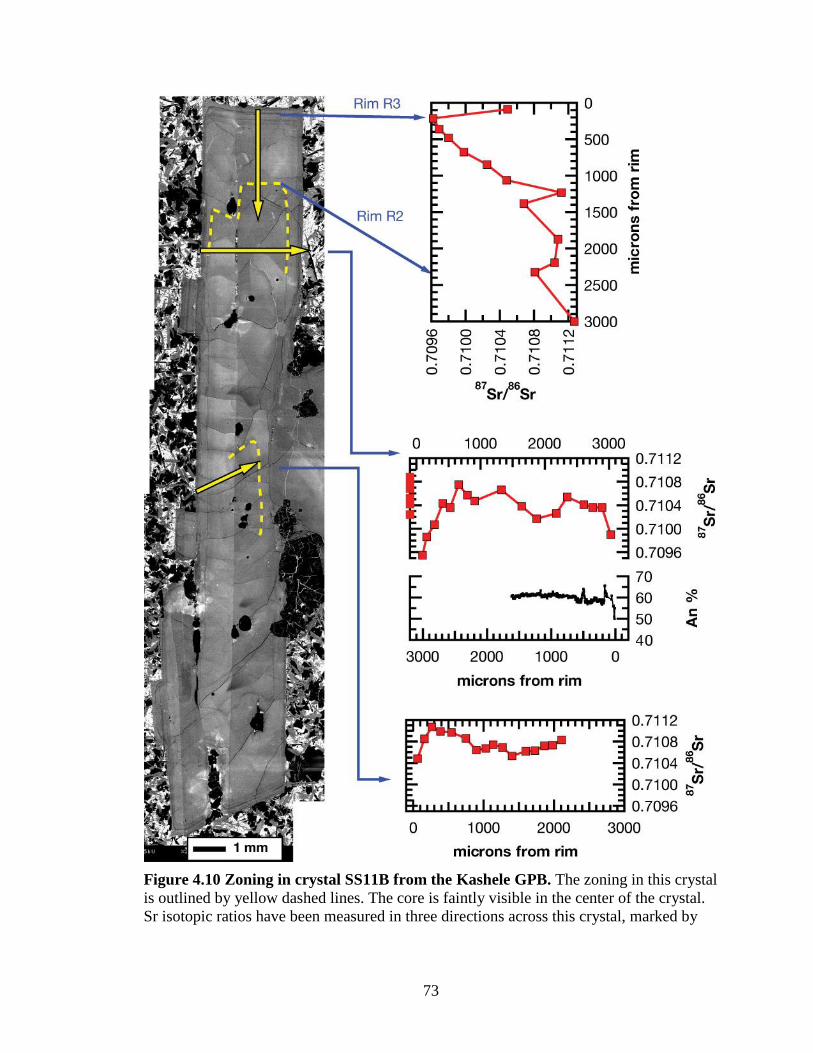
73
Figure 4.10 Zoning in crystal SS11B from the Kashele GPB. The zoning in this crystal
is outlined by yellow dashed lines. The core is faintly visible in the center of the crystal.
Sr isotopic ratios have been measured in three directions across this crystal, marked by

74
yellow arrows and data are shown in the graphs alongside. Arrows marked Rim R3 and
Rim R2 locate the data points corresponding to the rims on the y axis of the upper right
graph. The middle graph also shows An-content measured parallel to the laser tracks. The
An-content of the crystal is nearly constant at An60 except near the crystal edge. It does
not follow the variations in 87
Sr/86
Sr. Isotopic ratios measured on groundmass plagioclase
crystals are plotted at x<0 on the y axis as solid red squares in the middle graph
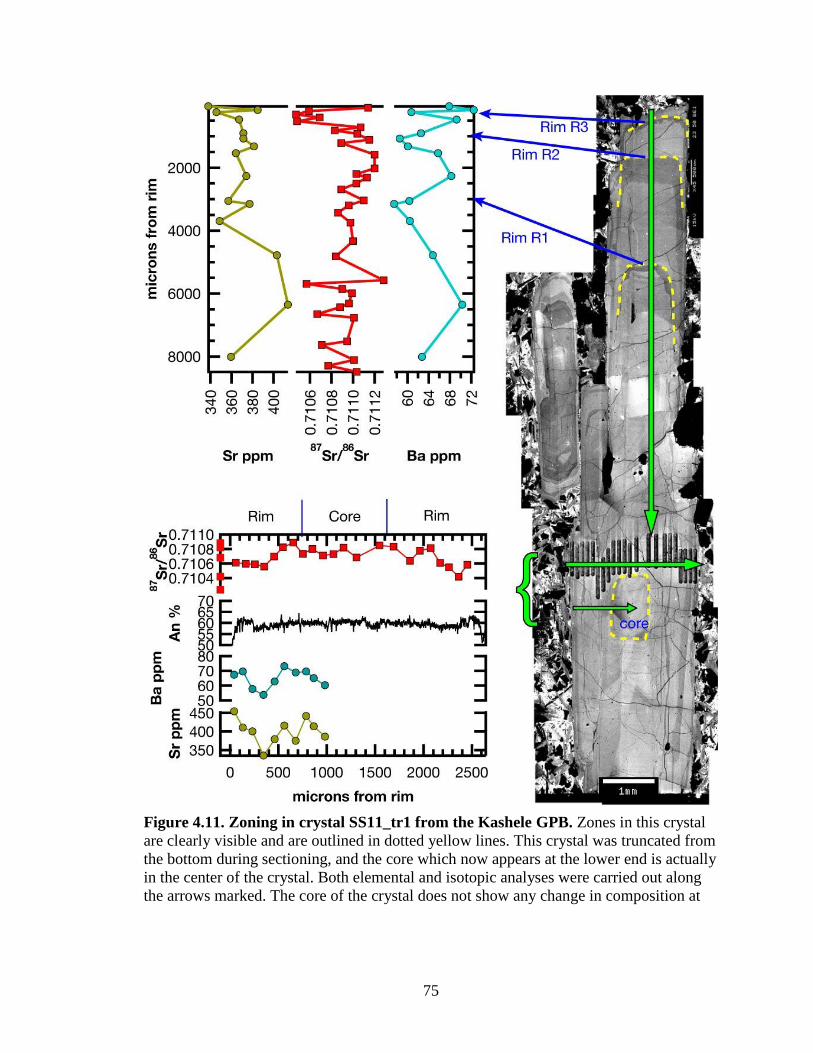
75
Figure 4.11. Zoning in crystal SS11_tr1 from the Kashele GPB. Zones in this crystal
are clearly visible and are outlined in dotted yellow lines. This crystal was truncated from
the bottom during sectioning, and the core which now appears at the lower end is actually
in the center of the crystal. Both elemental and isotopic analyses were carried out along
the arrows marked. The core of the crystal does not show any change in composition at

76
its boundaries (lower graph). Elemental Sr and Ba concentrations seem to roughly follow
the isotopic variations, but An-content does not.
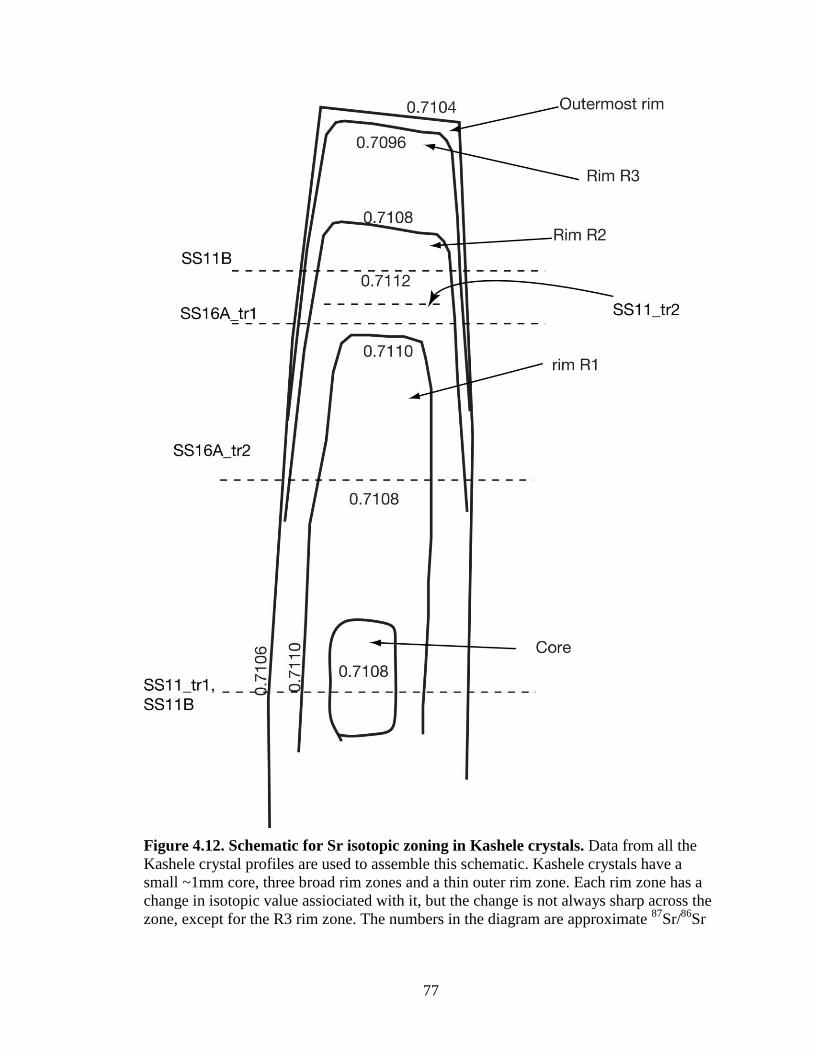
77
Figure 4.12. Schematic for Sr isotopic zoning in Kashele crystals. Data from all the
Kashele crystal profiles are used to assemble this schematic. Kashele crystals have a
small ~1mm core, three broad rim zones and a thin outer rim zone. Each rim zone has a
change in isotopic value assiociated with it, but the change is not always sharp across the
zone, except for the R3 rim zone. The numbers in the diagram are approximate 87
Sr/86
Sr

78
values at various locations in the crystal. Dashed lines are approximate locations across
which profiles have been measured in different Kashele GPB crystals, and are labeled
with names of the crystals.
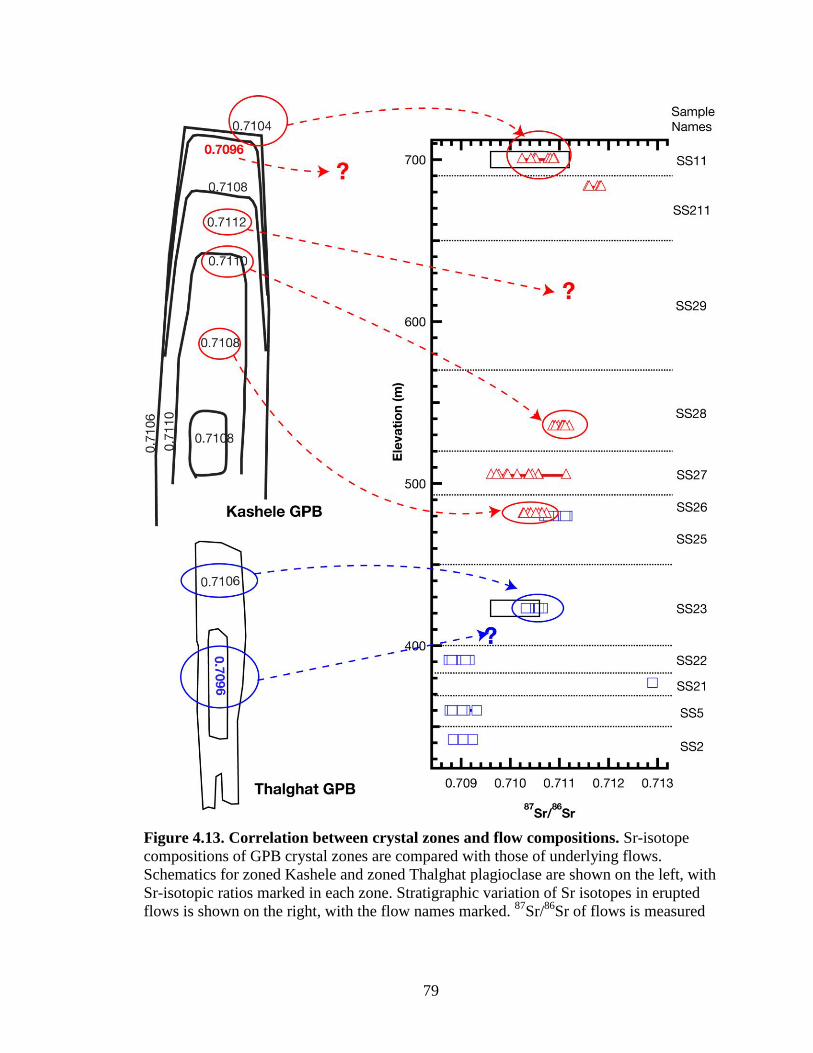
79
Figure 4.13. Correlation between crystal zones and flow compositions. Sr-isotope
compositions of GPB crystal zones are compared with those of underlying flows.
Schematics for zoned Kashele and zoned Thalghat plagioclase are shown on the left, with
Sr-isotopic ratios marked in each zone. Stratigraphic variation of Sr isotopes in erupted
flows is shown on the right, with the flow names marked. 87
Sr/86
Sr of flows is measured

80
on groundmass plagioclase crystals, except for SS27, data from which were collected on
plagioclase phenocrysts. Arrows connect zones and flows of similar compositions.
Question marks denote zones that cannot be correlated with any flow. Zones with the 87
Sr/86
Sr value of 0.7096, which have no corresponding flow of similar composition, are
marked with bold lettering; red for Kashele and blue for Thalghat plagioclase.
81
CHAPTER V
MODELING 87
Sr/86
Sr ZONING IN GIANT PLAGIOCLASE CRYSTALS:
IMPLICATIONS FOR DECCAN ERUPTION DURATION
Introductory Remarks
Plagioclase phenocrysts in basaltic and andesitic magma often preserve elemental
and Sr-isotopic zoning during growth from magma, examples of which we have seen in
the previous chapter. The task of the petrologist is to unscramble such records and obtain
information on time scales of crystal growth processes and evaluate the chemical and
thermodynamic, and kinetic conditions in which the crystals grew (Zellmer et al., 1999;
Davidson et al., 2001; Costa et al., 2003; Tepley and Davidson, 2003; Ramos et al.,
2005). In this chapter, I treat the observed Sr-isotope zoning in the plagioclase crystals as
possible diffusion profiles and obtain time information from modeling such diffusion
profiles. I consider a variety of initial and boundary conditions that are possible in the
situation of a plagioclase crystal growing in a magma chamber. I also discuss the
interplay of diffusion and crystal growth processes, and compare the profiles arising from
these considerations to the measured data.
In order to illustrate the processes involved in forming the giant plagioclase
phenocrysts, let us consider a crystal growing in a magma chamber as shown in Figure
5.1. At some point in the growth history, a new batch of magma has been introduced,
changing the composition of the mixed magma. The continuous growth of the crystal
through this event introduces a compositional jump, leading to the formation of a crystal
rim with a separate composition (note that the use of the terms “core” and “rim” is
82
clarified in the previous chapter). Diffusion will act to smooth out the compositional
change across the zone boundary. There are several possible combinations of diffusion
and crystal growth processes that can occur. The two “end-member” possibilities are: (1)
the diffusive equilibration starts only after the zoned crystal is fully grown, and (2)
diffusion starts as soon as a new zone forms. In both cases and in all intermediate
possibilities diffusion continues as long as the crystal resides within the magma but stops
as soon as the magma erupts, i.e., the crystal is “quenched” below the closure temperature
for the element in question – in this case Sr.
As we noted in Chapter IV, the zoning profiles in the large plagioclase crystals in
the Thalghat GPB and Keshele GPB are very different. The simple core-rim zoning of the
Thalghat crystals (Figure 5.2) is better suited for diffusion modeling as discussed below.
Following these discussions, I will attempt to extrapolate the calculated timescales from
phenocrysts to the life span of an individual magma chamber.
Different cases of growth vs. diffusion: Application to the Thalghat plagioclase
Case 0. Growth from mixed magma and no subsequent diffusion across the zone
boundary
As a “zeroth” condition, one can consider a case where diffusion does not play a
role in the modification of crystal compositions. In this case, a crystal grows from an
isotopically homogeneous magma until it reaches a certain size at which point a different
magma with very different isotopic composition intrudes the magma chamber and mixes
with the preexisting magma. The nature of the isotopic zoning within the crystal would
depend upon whether the crystal was growing in a melt-dominated vs. crystal-dominated
83
environment within the magma chamber. Mixing of the new magma with the preexisting
melt would be most efficient in the melt-dominated part of the magma chamber where
crystal proportion is less than 25% (i.e., suspension zone, Marsh, 1996). A rapidly
growing plagioclase crystal in the suspension zone would capture this mixing event by
developing a zoning pattern with a sharp step across the zone boundary. This is
schematically shown in the top and middle row of Figure 5.2. The size of the step would
depend on the difference in the isotopic composition of the two magmas and on relative
rates of mixing vs. crystal growth. On the other hand, in the mush zone (25-50% melt),
the chances are that mixing of the new and existing melts would not occur
instantaneously. A crystal growing in the mush zone may simply record a “mixing
profile”, a reflection of the changing composition of the surrounding melt during the
mixing event. This situation is considered in Case 7.
As seen in Figure 5.2, TGPB zoning can be thought to be a simple case of a
homogeneous core and homogeneous rim zone with 87
Sr/86
Sr values of 0.7096-0.7098
and 0.7106, respectively. However, within the ~400 micron boundary layer between the
two zones, 87
Sr/86
Sr profile clearly does not show a sharp step like boundary. The
boundary could have resulted from slower growth in a mush zone as stated above, or it
could have resulted from diffusive equilibration. The different possibilites are considered
below.
Case 1: Independent growth and diffusion
In this case, the crystal grows in a melt-dominated part of the magma chamber as
described above. Diffusion will act to smooth out the initial step profile and here I
consider diffusion to occur only after the crystal has reached its full size i.e. growth is
84
assumed to be decoupled from diffusion. Such a situation will be possible if growth rates
of the core and rim are infinitely faster than diffusion rates. Core and rim growth in such
a situation is schematically illustrated in Figure 5.3. In this case the initial profile prior to
diffusion will be a square U-shaped step profile as shown in the second row of Figure 5.3.
Diffusion then acts to smooth the profile (third row of Figure 5.3).
Under these conditions, diffusion modeling will enable the calculation of the
residence time of the crystal in the magma chamber, but we cannot have a handle on the
growth rates, except to note that they will be faster than diffusion. However, at high
magmatic temperatures, it is highly unlikely that diffusion would be completely inhibited
during the entire time of crystal growth. It is more likely that diffusion ensues
immediately after a chemical gradient is set up between two adjacent layers within the
crystal.
Calculations with the software COMAGMAT (Ariskin, 1999), show that liquidus
of the GPB lava (minus the giant plagioclase crystals) is 1150° C; and at 1100° C, the
magma forms 25% plagioclase crystals whose An-content would be similar to those of
the analyzed phenocrysts. It is therefore likely that these crystals grew at 1100 – 1150° C.
Under such conditions diffusion of Sr would be fairly rapid: at 1100° C, DSr (diffusivity
of Sr) is ~10-17
m2/s (Cherniak and Watson, 1994; Giletti and Casserly, 1994) as opposed
to 10-21
for DSi (Cherniak, 2003). Furthermore, the Sr-isotope contrast between the core
and rim is large, and therefore, the tendency to diffuse will be strong.
Case 2: Simultaneous and interfering growth vs. diffusion
As in the previous case, the crystal is growing in the melt, and at one point, a new
batch of melt with contrasting Sr-isotope composition is introduced into the chamber,
85
causing the growth of the crystal rim layer. Once rim growth begins and a gradient in Sr-
ratios is initiated, diffusion will commence simultaneously. Let us first consider a case
where diffusion rates are very rapid, so that the growth front never lags behind the
diffusion front. At any timestep, a new layer added to the growing crystal will always be
affected by diffusion (See Figure 5.4). The final diffusion profile will have to be modeled
as a moving boundary problem, where at each time interval, the diffusion front reaches
the crystal boundary. As a result, the final profile will not be flat near the crystal edge
(line t3 in Figure 5.4). Note that in the analyzed crystals (Figure 5.2), the isotopic profile
in the rim is flat from the edge up to a distance of 700 microns inward, showing that the
diffusive front has not yet reached the crystal edge; therefore the condition of diffusion
and growth fronts interfering is not applicable to the measured TGPB data. Also note
Figure 5.6 where calculations of the relative positions of growth and diffusive fronts for
appropriate rates are presented; the diffusive front always lag behind the growth front.
Case 3: Simultaneous and non-interfering growth vs. diffusion
In this case, the diffusion front always lags behind the growth front. Diffusion
will once again begin immediately after a layer of rim grows over the core, but the
outermost edge of the rim is still not affected by diffusion (Figure 5.5). In Figure 5.6,
positions of growth and diffusive fronts are calculated at timescales upto 30 years, using
growth rates from Cashman and Marsh (1988), and Sr diffusion rates from Giletti and
Casserly (1994) and Cherniak and Watson (1994). Within less than a year, the growth
front is seen to overtake the diffusive front. Even if an order of magnitude lower growth
rate is used (as suggested by Higgins and Chandrasekharam, 2007, for Deccan GPB), the
growth front overtakes the diffusive front in 20 years. Non interfering growth and
86
diffusion is therefore the most likely manner in which the Sr isotope profiles developed in
the TGPB crystals.
The final profile can be modeled in a similar manner to Case 1 since diffusion
and growth can be treated separately for modeling. The diffusion timescale will be the
same as the rim growth time, provided diffusion and growth begin and end
simultaneously. As noted earlier, diffusion will commence as soon as a crystal layer of
contrasting composition is added to the growing crystal. The closure temperature for Sr
diffusion in plagioclase is high, ~800 °C for An64 at a cooling rate of 200 °C/Ma (Giletti
and Casserly, 1994), and after the crystal bearing lava is erupted at ~1100 °C, diffusion
would stop fairly quickly. Growth of albitic rims on the crystals (An 40) is evidence of
further growth in a cooling magma, but these rims are just tens of microns wide, and can
be ignored since the resolution of each 87
Sr/86
Sr data point is 80 microns. Hence, we can
assume that diffusion and rim growth began and ended simultaneously, and the diffusion
timescale is equivalent to the rim growth time.
To summarize, the Thalghat GPB crystals can be considered to have grown in two
stages, the core growth stage and the rim growth stage. The initiation of rim growth
corresponds to the initiation of diffusive activity. Diffusion can also be considered to
have terminated at more or less the same time as the termination of crystal growth.
Diffusion will always lag behind growth, enabling diffusive equilibrium to be calculated
without taking into account the position of the crystal growth front. In order to set up the
diffusion model, initial and boundary conditions of the model have to be set up.
87
Different initial and boundary conditions
There are many possible initial and boundary conditions under which diffusion
could occur, and the model results depend strongly on the choice of initial and boundary
conditions. I now consider the different possible situations.
Case 4: Initially unzoned core and rim
In Figure 5.1, and in the treatments so far, core and rim growth were assumed to
have occurred separately, possibly in different magma chambers, from melts that had
different Sr isotope ratios. Another possibility is that the entire crystal was initially
homogeneous with Sr-ratios of 0.7096, and the fully-grown crystal was transferred to
another magma chamber that had a 87
Sr/86
Sr of 0.7106. This may explain the lack of
variation in major and trace elements that are seen in the Thalghat and Keshele GPB
crystals (previous chapter). In this case, after the crystal is transferred to the new
chamber, diffusion will act to elevate the ratios at the boundary, and after an infinite
amount of time, the entire crystal will have the ratio of 0.7106. To test such a situation, I
model the variations seen in crystal SS23A_tr2 from Figure 5.2. Results are shown in
Figure 5.7. The initial condition, as shown by the dotted t=0 line will be a flat profile
throughout the crystal, with a composition of the core. At the crystal boundary, the
profile will sharply rise to the magma composition of 0.7106. In the first instant after
diffusion begins, the composition at the crystal edge will rise to equal the composition of
the magma, but the core would remain unchanged. Profiles after various timescales are
shown in Figure 5.7. It is clear that no matter what the diffusion timescale, the flat profile
from the crystal edge to ~700 microns into the rim cannot be replicated under these
88
conditions. This boundary condition is clearly not applicable to model diffusion in the
Thalghat GPB crystals.
Case 5: Lower initial core ratio
In the situations so far, the core was assumed to have an initial composition
similar to the measured near-homogenous core compositions. However, once rim growth
and therefore diffusion begins, there is no reason for the core composition to remain
constant, i.e. the core composition is not a fixed boundary condition. In fact, if diffusion
continues infinitely, the final composition of the crystal will be a homogenous flat profile
that has the composition of the rim. In order to test the possibility that the initial core
composition could have been different, I consider a special case of the profile SS23A_tr2
from Figure 5.2, where the initial core 87
Sr/86
Sr value is taken to be lower than 0.7096,
and assume that diffusion has acted to raise the core ratio to the measured value. I
investigated this by modeling the diffusive re-equilibration of 87
Sr/86
Sr assuming a lower
initial core 87
Sr/86
Sr ratio of 0.7095.
Figure 5.8 shows the initial profile as well as a calculated profile at t = 600 years
that fits the core compositions. While the 600 yr profile matches the measured core ratios,
the measured rim compositions are well above the calculated values; that is, a proper fit
cannot be obtained simultaneously for the core and rim. Therefore, the possibility of a
lower initial core ratio is ruled out.
Case 6: Non-constant boundary condition due to diffusion in the melt
So far, we have assumed the rim of the crystal to be in equilibrium with the melt,
so that crystal-melt diffusive exchange is minimal to non-existent. This condition can be
89
met if the melt surrounding the crystal is frequently replenished by vigorous convection.
Here I consider the implications of diffusive exchange between the crystal and melt.
Diffusion in melt is much faster than in crystals, e.g. at 1200 °C, DSr = 10-11
m2.s
-1 in
basalts (from Brady, 1995) and ~10-17
m2.s
-1 in An64 (Cherniak and Watson, 1994; Giletti
and Casserly, 1994). Figure 5.9 shows a schematic of a crystal in contact with a melt of
differing composition. The initial profile across the crystal melt interface will be a step
(dotted line in Figure 5.9). Over time, diffusion will act to smooth out this profile. The
degree of smoothing will vary in the melt and crystal. Diffusive distance is related to D
by the expression tDx Sr , and because of larger Ds of elements in melt, the diffusive
front will travel further into the melt than into the crystal after the same amount of time
(Figure 9 bottom). The crystal-melt boundary, i.e. the outermost edge of the crystal, will
have a composition intermediate between the magma composition and the crystal core
composition. Therefore, the crystal edge cannot be considered a fixed boundary.
If the measured Sr-isotope profile in TGPB crystals has been affected by diffusion
in melt, then the crystal core, rim and melt Sr-isotope compositions will be as shown in
the bottom graph in Figure 5.9. The concentration will show a sharp dip at the crystal
edge, flattening out at the core. This profile will be similar to the profiles obtained in
Case 4, shown in Figure 5.7. Measured data, however, show a different profile, having
nearly constant values up to ~700 microns from the crystal edge. This non constant
boundary condition can therefore be discounted. Also, if melt 87
Sr/86
Sr composition
changes by diffusion, the major element composition of the melt would also change,
since most elements have D of ~ 10-10
– 10-11
m2.s
-1 in a basaltic melt (Brady, 1995;
LaTourrette et al., 1996). Variations in melt concentrations would cause variation in
90
major and trace elements in the crystal, which is not seen. It appears from major element
zoning that melt replenishment was rapid, and the depletion was minor. Higgins and
Chandrasekharam (2007) calculate a mass transfer Peclet number and a thermal Peclet
number for crystals growing in convecting magma and conclude that transport of both
matter and heat around a growing crystal take place by advection. They further attribute
the tabular shape of Deccan GPB crystals to growth in a strongly advecting medium i.e. a
“well stirred” magma. Depleted melt surrounding a growing GPB crystal can therefore be
assumed to be rapidly refreshed, and that 87
Sr/86
Sr (and major and trace element
composition) in the melt has stayed constant while the crystals were growing.
Case 7: No diffusion but mixing
In Case 0, the crystal growth during rapid magma mixing was considered, without
the influence of diffusion. In the remainder of the situations considered, the initial step
function was maintained, with the added effect of diffusion that acted to produce the
zoning profiles seen in the crystals. The last situation I will consider is of zoning due to
growth from a magma whose composition has changed along a mixing line between end
members. The difference here is that the zoning does not appear as a step function, but as
a series of smaller steps that define a nearly straight line compositional gradient in the
crystal (Figure 5.10). The ~400 micron core-rim zone boundary (Figure 5.2) will
therefore not be a diffusion zone, but a mixing zone. As mentioned earlier, this situation
can occur if the crystal is growing in a magmatic mush zone, where the liquid proportion
is ~50%. This situation may also occur if crystal growth rate is much faster than the rate
of magma homogenization.
91
Whether the zone boundary is diffusion related or growth related cannot be
unequivocally resolved with the present dataset. It is possible that closer spaced tracks
with a beam diameter less than the 80-micron laser beam used could better define the
zoning profile, enabling us to obtain a straight mixing line or a curved diffusion profile. If
the profile is taken to result from mixing rather than diffusion, then diffusive timescales
would be vanishingly small. This would mean that growth far surpassed the diffusion
rate, and that the residence time was too small to allow for diffusion. Treating the profiles
as diffusion profiles enables us to calculate a more conservative rate, and enables us to
match diffusion and rim growth timescales, allowing for calculation of crystal growth
rates.
One straightforward way to check if profiles are diffusion related is to compare
orthogonal profiles across the width and length of a crystal section. These crystals have a
1:8 aspect ratio, and growth along the b-axis direction was slower, leading to the
shortening of the crystals along this direction (Higgins and Chandrasekharam, 2007). So
if the zone boundary has a thickness of 100 microns in the short directions, it would have
a thickness of 800 microns in the long direction, which is what we see in the CL images
of these crystals (see Figure 5.11). Now if Sr- isotope variations were due to mixing, then
the distance over which the isotopes vary at the zone boundary should also conform to
the 1:8 aspect ratio. Figure 5.11 shows a comparison between transects along the short
and long directions in crystal SS23A_tr2. The graph in Figure 5.11 shows Sr-isotopic
variations across the zone boundary in orthogonal directions. The thickness of the zone
boundary is the same in both cases, ~400 microns. Therefore the variation in the zone
boundary of these crystals cannot be due to growth from a mixed melt. It is therefore
92
reasonable to assume that the zone boundary variation was due to diffusion, and that the
initial condition was a sharp step profile, which then was smoothed out by diffusion.
Diffusion model results
Based on the elimination of diffusive conditions, can assume that diffusion
occurred as described in Case 3 above, where diffusion began immediately after rim
growth was initiated. We can then diffusively model intracrystalline diffusion between
the core and the rim of zoned TGPB crystals, at a constant temperature of 1100 °C.
Diffusion in zoned crystals can be modeled using the 1-dimensional diffusion equation:
2
2
Srx
CD
t
C
where C is the 87
Sr/86
Sr ratio, x is distance in meters and t is time in seconds. In this
study, DSr is the self-diffusion constant for strontium in plagioclase rather than the
elemental or chemical diffusion constant. Sr elemental concentrations are near
homogenous throughout the crystal, and so there would be no chemical potential over
which chemical diffusion would take place. Diffusion will therefore occur by 87
Sr and
86Sr moving across the zone boundary by random walk. A similar effect has been
demonstrated by in diffusion experiments. LaTourrette et al. (1996) used glass-glass
diffusion couples of similar major element compositions but differing isotopic
compositions. After the experiments, they found that MgO content was constant over the
interface, but measured profiles of the isotope 25
Mg showed a well-defined diffusion
profile (Figures 3 and 4 of LaTourrette et al., 1996). The data measured on the Thalghat
crystals shows a similar effect, where core and rim Sr trace element composition is nearly
constant, but 87
Sr/86
Sr shows a clear difference (Chapter 4, Figures 4.5 and 4.6).
93
Using data from Gilleti and Casserly (1994), and Cherniak and Watson (1994) I
obtain a calculated average DSr of 6.27x10⁻¹⁸
m2.s
-1 for An64. I assume that both isotopes
of Sr have the same diffusivity. I assume that diffusion across the zone boundary can be
treated as diffusion in a semi-infinite medium. I also assume that temperature does not
change much during the diffusive timescale, which is borne out by the constant An
content and lack of major dissolution features. Using a step initial condition (dotted lines
in Figure 5.12), and fixing the boundary conditions at the edge of the rim to 0.7106,
which is the groundmass and whole rock value, I modeled diffusion numerically using
finite difference methods. Numerical modeling allows for calculating diffusion without
holding the core value steady, a condition that is closer to the natural scenario.
Because plagioclase shows significant directional anisotropy in its physical
properties (e.g. Smith, 1974), profiles along the length should be more elongated than the
profile along the width, since diffusion should act faster along the length for the same
timescale. However, many workers have noted the lack of diffusive anisotropy in
plagioclase for Sr (Giletti and Casserly, 1994), and also for Na, Ca and Fe (Behrens et al.,
1990). Cherniak and Watson (1992) note the lack of diffusional anisotropy in orthoclase
feldspar, but also note an order of magnitude difference in plagioclase feldspar diffusivity
DSr with the diffusion along the c-axis faster than that along the b axis (long and short
dimensions respectively in the above figures). Since diffusion distance x is related to D
and time by the expression tDx Sr , an order of magnitude variation in D would lead
to a half order of magnitude (factor of 5) difference in diffusion distance, time remaining
94
constant. Comparison of orthogonal profiles in Figure 5.11 shows no difference in the
diffusion distance, so here I assume isotropic diffusion throughout the crystal.
Results of the diffusion models are shown in Figure 5.12. The initial “square
wave” condition is shown by dotted lines. Dashed curves are calculated profiles at
various timescales. The best-fit profiles are profiles corresponding to t=200 years and
t=150 years for crystals SS23_tr1 and SS23_tr2 respectively. Note that the dashed lines,
which represent profiles at ± 50 years from the best fit, are not too different from the best
fit profiles. It must be assumed that the calculated time has a ± 50 year error. At 1100° C,
the largest timescale we obtain is 200 years for diffusive equilibrium.
Calculation of crystal growth rates
The calculated diffusion duration for relaxation of Sr-isotope profiles is 200 years
at 1100° C and as noted above, this time is the same as that of rim growth, therefore the
rim growth duration is also 200 years. The width of the rim, from the figure above is ~0.8
mm, on each side of the core and the combined width of the rim is then 1.6mm. As stated
before, the crystals have an aspect ratio of 1:8, and this gives us a lengthwise rim
thickness of 12.8mm. This lengthwise total rim thickness of 12.8 mm and the 200-year
duration of rim growth gives us a rim growth rate of 2.03x10⁻¹⁰
cm.s-1
. This lengthwise
growth rate can be compared to growth rates obtained from other studies, and it agrees
well with data from natural measurements on Hawaii and Kamchatka, as well as some
experimental results (see Table 5.1).
The rim growth rate we have calculated should be considered the mean growth
rate, since it is likely that growth rates varied in the magma chamber over time. From the
95
small variability of major element composition, the lack of dissolution boundaries, and
the chemical equibrilium between major and trace element compositions in Thalghat
plagioclase (see previous chapter), it appears that growth conditions were uniform.
Therefore, variations in crystal growth rates were likely small in magnitude. Diffusion
modeling does not allow the calculation of the growth rate of the core or the growth rate
of the non-zoned crystals. It can however be assumed that non-zoned crystals shared the
same history as the rims of the zoned crystals owing to the similarity in major, trace
element and isotopic compositions. The core of the crystal had a separate history,
although it does share similar major and trace element compositions, and likely had very
similar growth conditions. I assume here that non-zoned crystals and zoned cores grew at
the same rate: the calculated rim growth rate of 2.03x10⁻¹⁰
cm.s-1
at 1100° C.
Implications for Deccan eruptive rates
Using the Deccan-specific growth rate calculated above we can calculate
residence times for all TGPB crystals. Assuming a maximum crystal size of 5 cm, we
calculate (2.03x10⁻¹⁰
cm.s-1
) ÷ (5 cm) = 781 years as the growth time of the crystal, which
is also the residence time, assuming uninterrupted growth.
We can apply this timescale to all the flows that these crystals have been in
equilibrium with. The core of the TGPB crystals are not in equilibrium with any
underlying flow, though the ratio is in between that of the TGPB lava and the
immediately underlying flow, as described in the previous chapter. The thickness of the
TGPB flow (SS23) is 80 m and that of the underlying flow (SS22) is 20 m. We can
directly relate the incubation and eruption of the 80 m thick TGPB to the residence time
96
of the crystals and obtain a 1-dimensional eruption rate of 0.1 m.y-1
for the TGPB. If we
assume that the TGPB was also in equilibrium with the magma of flow SS22, we can
apply the timescale to both the GPB and the underlying flow, obtaining a rate of 0.13
m.y-1
. Ideally, one would calculate a volumetric rate, but there are no estimates of flow
volumes for most of the Deccan Western Ghats lavas, especially for the older formations
as the outcrops are limited and most are overlain by younger formations over a large area
of the Western Ghats.
The Keshele GPB shows more complicated zoning patterns, but an interesting
aspect is that the crystals hold evidence of having been in equilibrium with at least two
underlying lava flows, and may have been growing throughout the life cycle of the
Igatpuri Formation. Residence times of the KGPB would therefore give the eruptive
duration of the entire 220 m thick Igatpuri Formation. Unfortunately, because of
dissolution boundaries, the residence times cannot be known for sure. Close to the crystal
edge, KGPB crystals show a smooth change in 87
Sr/86
Sr from 0.7112 to 0.7096. This
variation is seen in both the lengthwise and widthwise transects, however the variations
occur over very different length scales in these directions. The variation takes place over
~2500 microns and ~400 microns in the lengthwise and widthwise directions
respectively, and if these variations are modeled as diffusion profiles, this gives us 1500
years and 70 years respectively. Sr self diffusion is close to isotropic in plagioclase
(Giletti and Casserly, 1994), so this large difference in timescales could mean rapid
growth from a varying melt composition and a short diffusion timescale (as noted in Case
7). So at least the outer 3 mm of the crystal can be said to have grown faster than the
calculated rate for the TGPB, assuming that the homogenization rate of the mixed magma
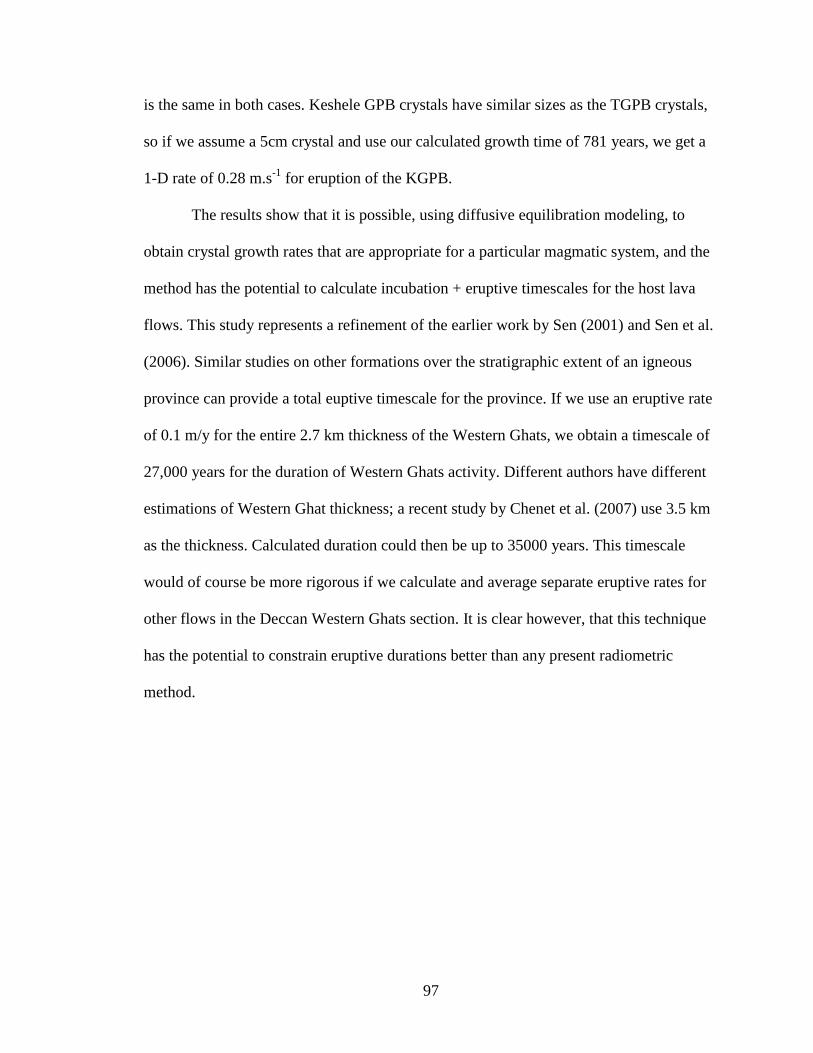
97
is the same in both cases. Keshele GPB crystals have similar sizes as the TGPB crystals,
so if we assume a 5cm crystal and use our calculated growth time of 781 years, we get a
1-D rate of 0.28 m.s-1
for eruption of the KGPB.
The results show that it is possible, using diffusive equilibration modeling, to
obtain crystal growth rates that are appropriate for a particular magmatic system, and the
method has the potential to calculate incubation + eruptive timescales for the host lava
flows. This study represents a refinement of the earlier work by Sen (2001) and Sen et al.
(2006). Similar studies on other formations over the stratigraphic extent of an igneous
province can provide a total euptive timescale for the province. If we use an eruptive rate
of 0.1 m/y for the entire 2.7 km thickness of the Western Ghats, we obtain a timescale of
27,000 years for the duration of Western Ghats activity. Different authors have different
estimations of Western Ghat thickness; a recent study by Chenet et al. (2007) use 3.5 km
as the thickness. Calculated duration could then be up to 35000 years. This timescale
would of course be more rigorous if we calculate and average separate eruptive rates for
other flows in the Deccan Western Ghats section. It is clear however, that this technique
has the potential to constrain eruptive durations better than any present radiometric
method.
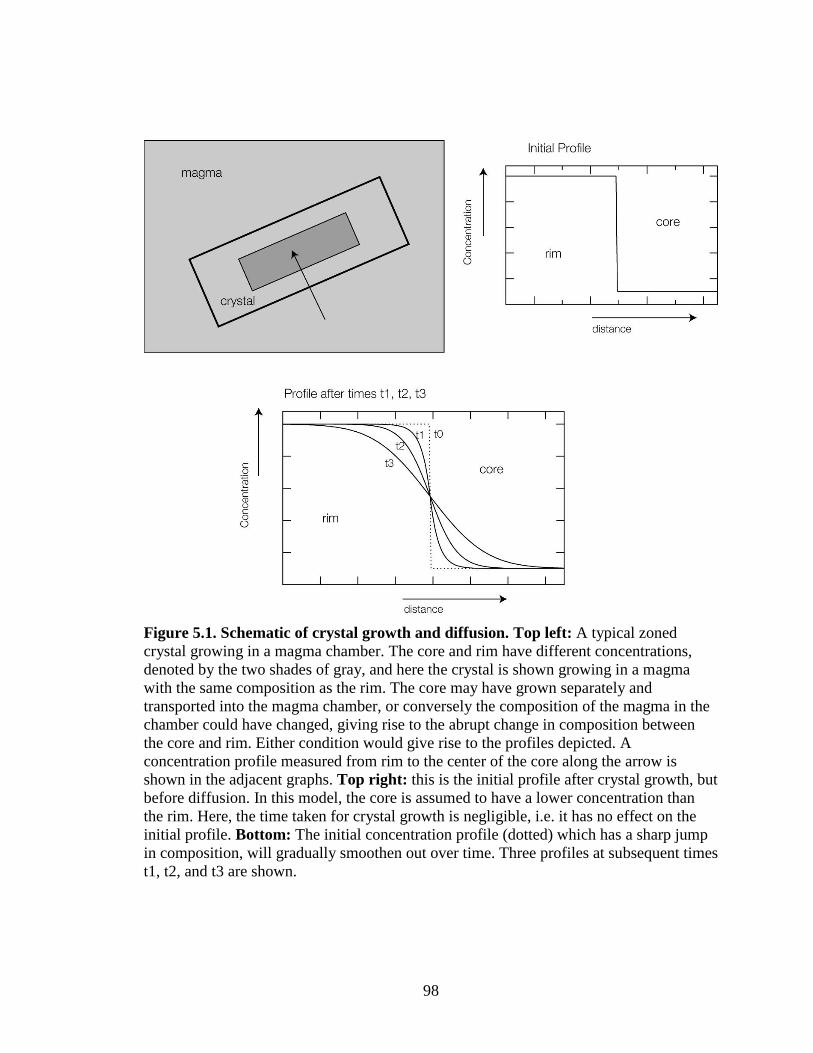
98
Figure 5.1. Schematic of crystal growth and diffusion. Top left: A typical zoned
crystal growing in a magma chamber. The core and rim have different concentrations,
denoted by the two shades of gray, and here the crystal is shown growing in a magma
with the same composition as the rim. The core may have grown separately and
transported into the magma chamber, or conversely the composition of the magma in the
chamber could have changed, giving rise to the abrupt change in composition between
the core and rim. Either condition would give rise to the profiles depicted. A
concentration profile measured from rim to the center of the core along the arrow is
shown in the adjacent graphs. Top right: this is the initial profile after crystal growth, but
before diffusion. In this model, the core is assumed to have a lower concentration than
the rim. Here, the time taken for crystal growth is negligible, i.e. it has no effect on the
initial profile. Bottom: The initial concentration profile (dotted) which has a sharp jump
in composition, will gradually smoothen out over time. Three profiles at subsequent times
t1, t2, and t3 are shown.
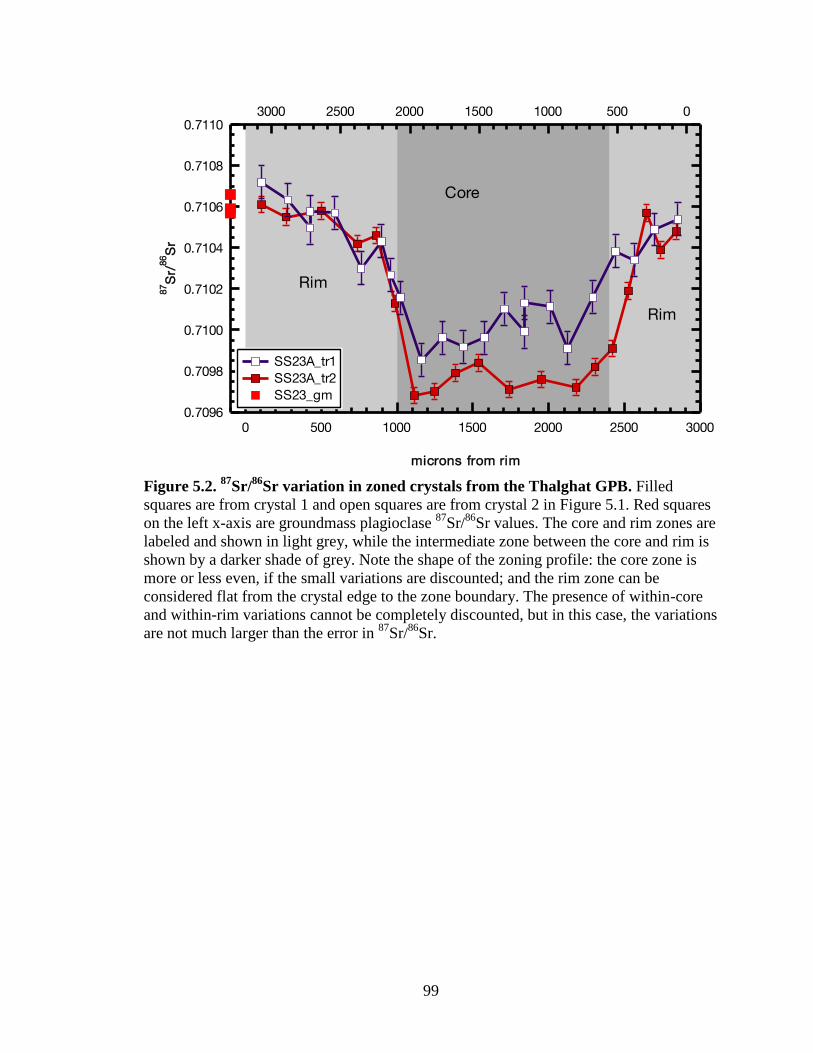
99
Core
Rim
Rim
0.7110
0.7108
0.7106
0.7104
0.7102
0.7100
0.7098
0.7096
87S
r/86
Sr
300025002000150010005000
microns from rim
3000 2500 2000 1500 1000 500 0
SS23A_tr1 SS23A_tr2 SS23_gm
Figure 5.2. 87
Sr/86
Sr variation in zoned crystals from the Thalghat GPB. Filled
squares are from crystal 1 and open squares are from crystal 2 in Figure 5.1. Red squares
on the left x-axis are groundmass plagioclase 87
Sr/86
Sr values. The core and rim zones are
labeled and shown in light grey, while the intermediate zone between the core and rim is
shown by a darker shade of grey. Note the shape of the zoning profile: the core zone is
more or less even, if the small variations are discounted; and the rim zone can be
considered flat from the crystal edge to the zone boundary. The presence of within-core
and within-rim variations cannot be completely discounted, but in this case, the variations
are not much larger than the error in 87
Sr/86
Sr.
100
Figure 5.3. Schematic showing decoupled growth and diffusion. Top row: crystal
growing in a magma chamber, left to right: core growth, initiation of rim growth and final
crystal. Middle row: transect across the center of the domain in the upper figure (dotted
line in the top left diagram). Dotted lines are outlines of the crystal; solid lines are 87
Sr/86
Sr concentration profiles. Bottom row: Profile after diffusion has acted for a certain
time.
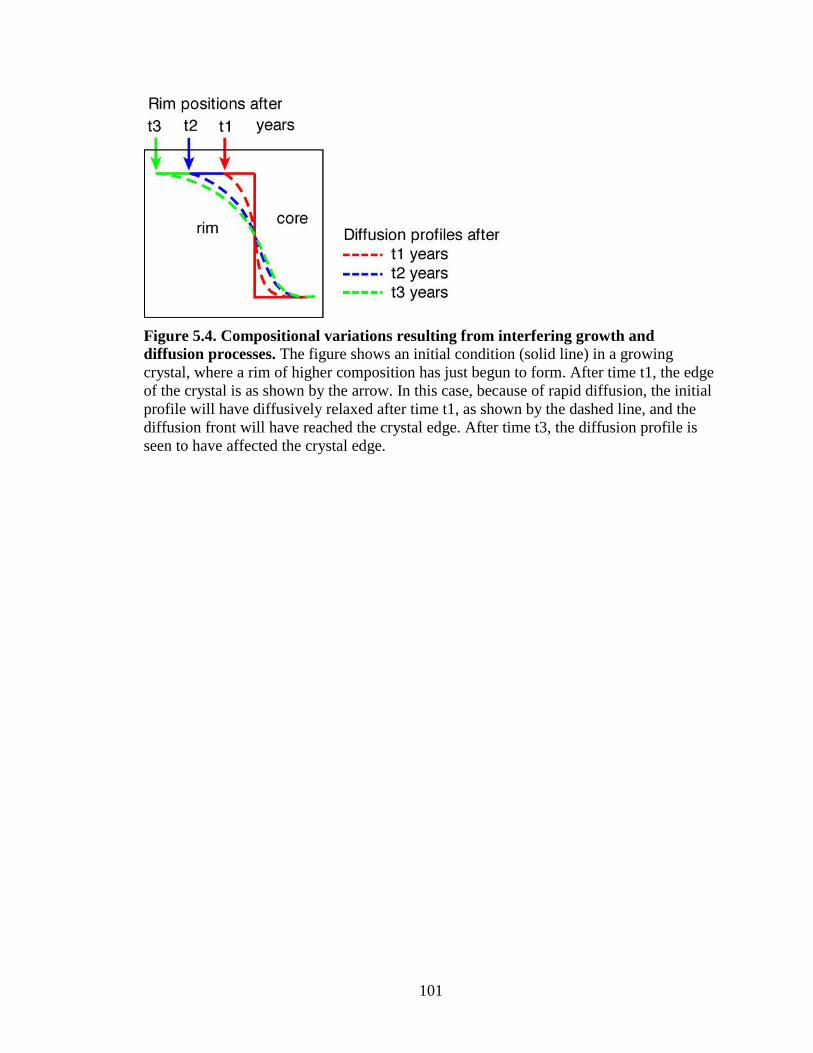
101
Figure 5.4. Compositional variations resulting from interfering growth and
diffusion processes. The figure shows an initial condition (solid line) in a growing
crystal, where a rim of higher composition has just begun to form. After time t1, the edge
of the crystal is as shown by the arrow. In this case, because of rapid diffusion, the initial
profile will have diffusively relaxed after time t1, as shown by the dashed line, and the
diffusion front will have reached the crystal edge. After time t3, the diffusion profile is
seen to have affected the crystal edge.
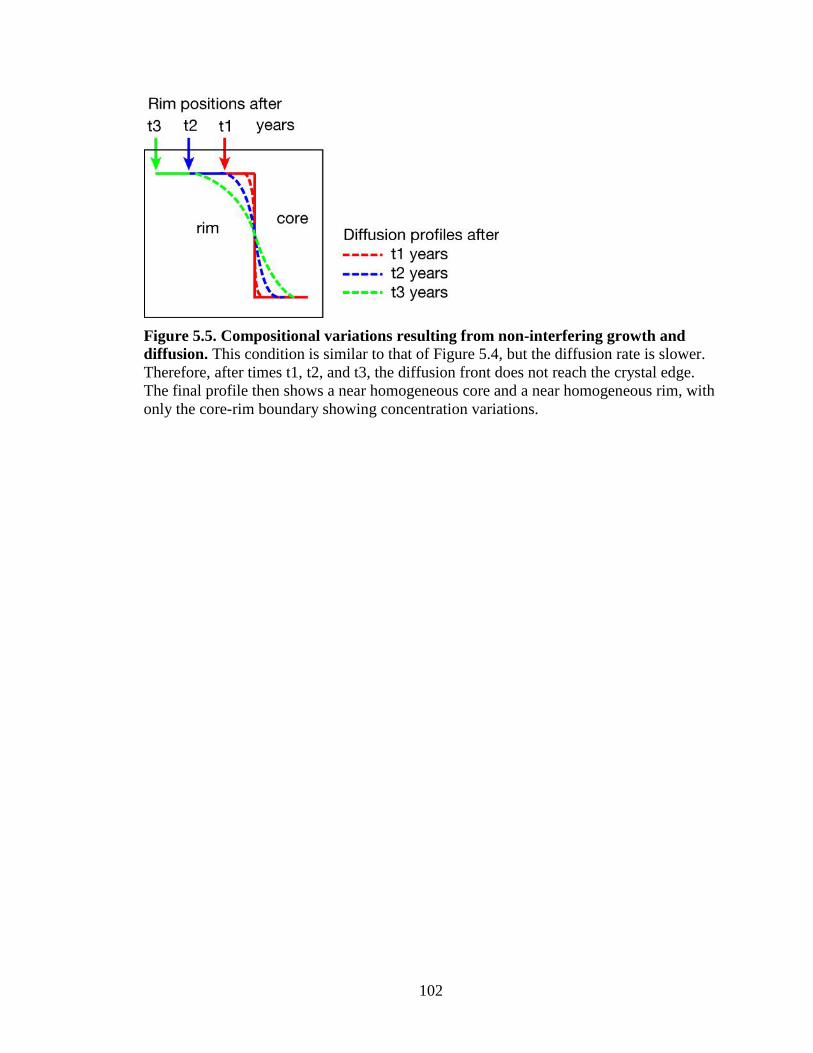
102
Figure 5.5. Compositional variations resulting from non-interfering growth and
diffusion. This condition is similar to that of Figure 5.4, but the diffusion rate is slower.
Therefore, after times t1, t2, and t3, the diffusion front does not reach the crystal edge.
The final profile then shows a near homogeneous core and a near homogeneous rim, with
only the core-rim boundary showing concentration variations.
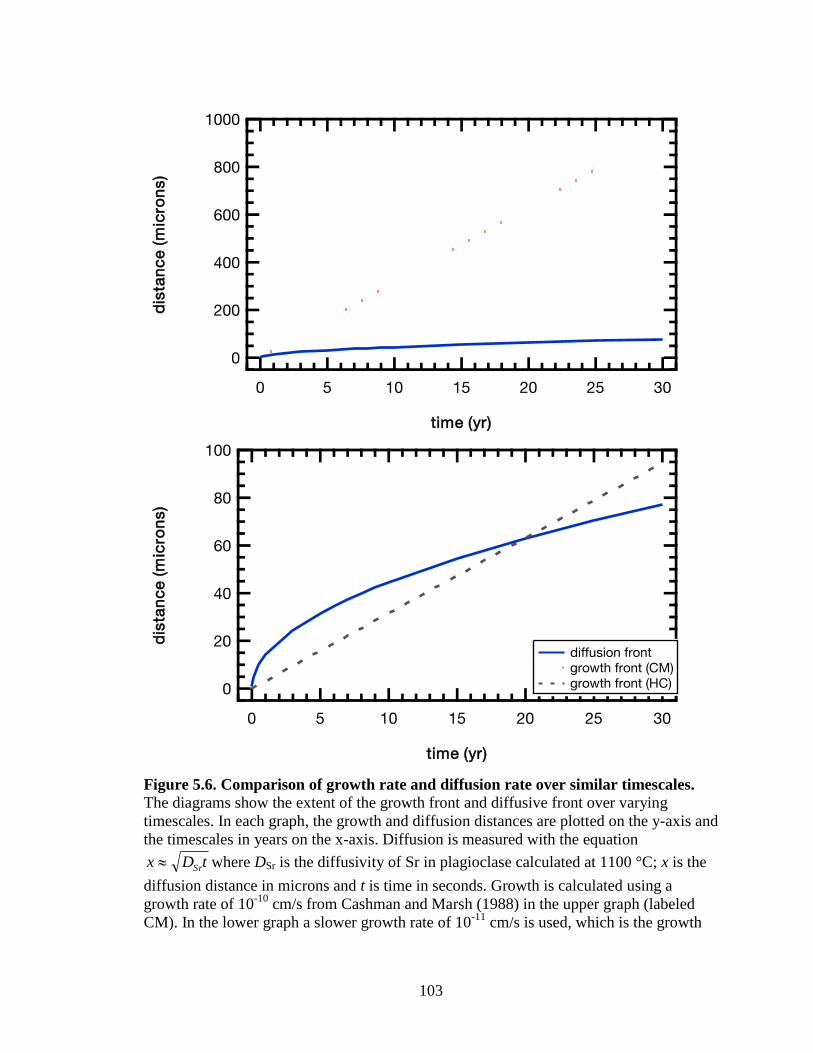
103
100
80
60
40
20
0
dis
tan
ce (m
icro
ns)
302520151050
time (yr)
1000
800
600
400
200
0
dis
tan
ce (m
icro
ns)
302520151050
time (yr)
diffusion front growth front (CM) growth front (HC)
Figure 5.6. Comparison of growth rate and diffusion rate over similar timescales. The diagrams show the extent of the growth front and diffusive front over varying
timescales. In each graph, the growth and diffusion distances are plotted on the y-axis and
the timescales in years on the x-axis. Diffusion is measured with the equation
tDx Sr where DSr is the diffusivity of Sr in plagioclase calculated at 1100 °C; x is the
diffusion distance in microns and t is time in seconds. Growth is calculated using a
growth rate of 10-10
cm/s from Cashman and Marsh (1988) in the upper graph (labeled
CM). In the lower graph a slower growth rate of 10-11
cm/s is used, which is the growth
104
rate suggested by Higgins and Chandrasekharam (2007) for plagioclase growth in a
subsurface magma chamber. Note that this rate is much smaller than growth rates from
the literature shown in Table 5.1. In the upper graph, the growth front supersedes the
diffusion front almost immediately after t=0, whereas in the case of the slower growth
rate (lower graph), the growth front will overtake the diffusion front after 20 years.
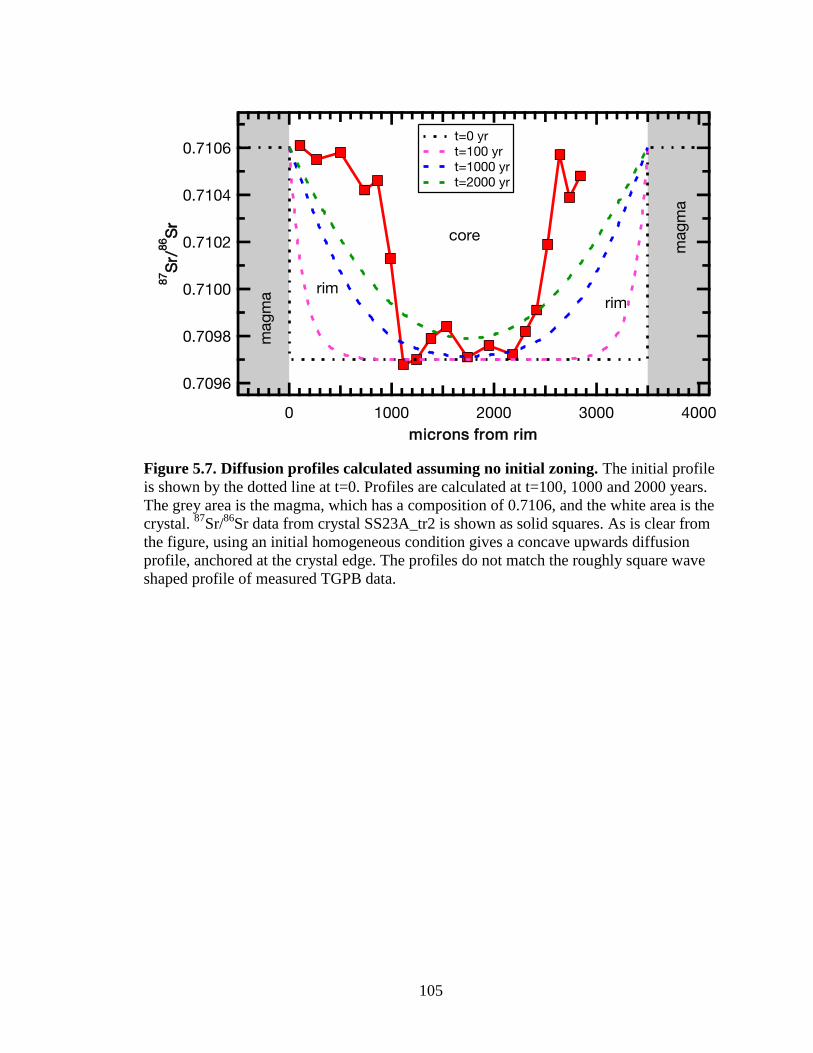
105
0.7106
0.7104
0.7102
0.7100
0.7098
0.7096
87S
r/86
Sr
40003000200010000microns from rim
mag
ma
mag
ma
rim
core
rim
t=0 yr t=100 yr t=1000 yr t=2000 yr
Figure 5.7. Diffusion profiles calculated assuming no initial zoning. The initial profile
is shown by the dotted line at t=0. Profiles are calculated at t=100, 1000 and 2000 years.
The grey area is the magma, which has a composition of 0.7106, and the white area is the
crystal. 87
Sr/86
Sr data from crystal SS23A_tr2 is shown as solid squares. As is clear from
the figure, using an initial homogeneous condition gives a concave upwards diffusion
profile, anchored at the crystal edge. The profiles do not match the roughly square wave
shaped profile of measured TGPB data.
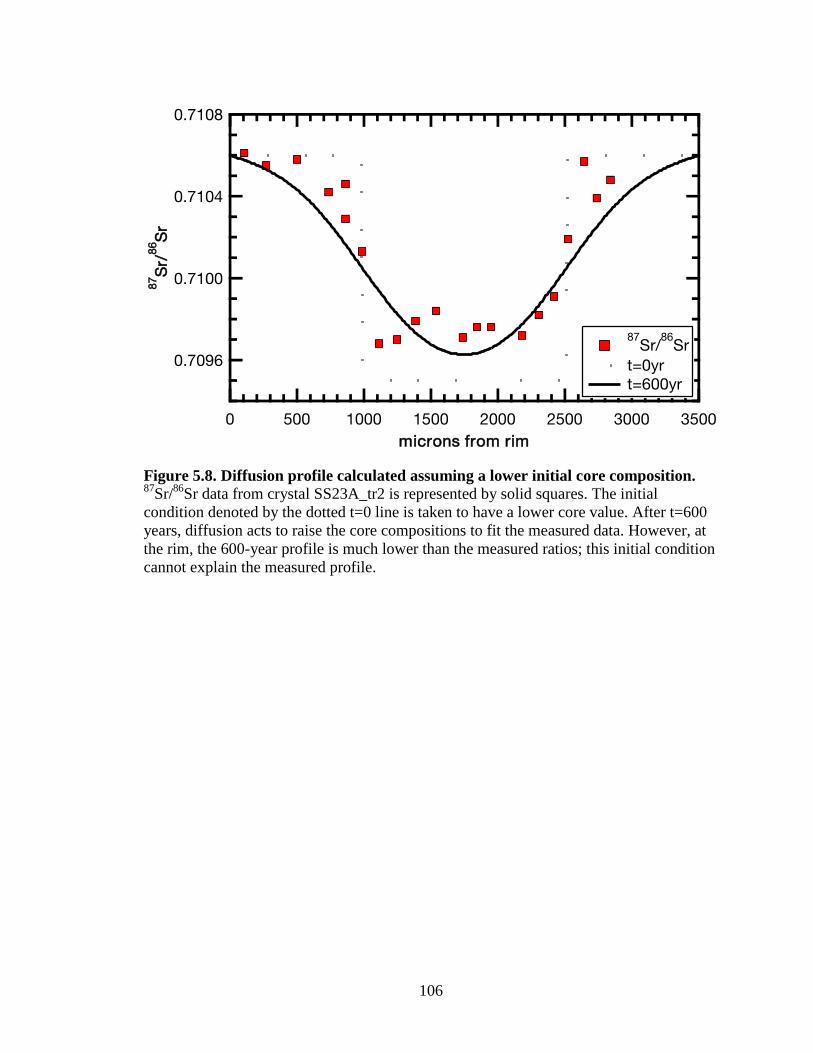
106
0.7108
0.7104
0.7100
0.7096
87S
r/86
Sr
3500300025002000150010005000microns from rim
87
Sr/86
Sr t=0yr t=600yr
Figure 5.8. Diffusion profile calculated assuming a lower initial core composition. 87
Sr/86
Sr data from crystal SS23A_tr2 is represented by solid squares. The initial
condition denoted by the dotted t=0 line is taken to have a lower core value. After t=600
years, diffusion acts to raise the core compositions to fit the measured data. However, at
the rim, the 600-year profile is much lower than the measured ratios; this initial condition
cannot explain the measured profile.
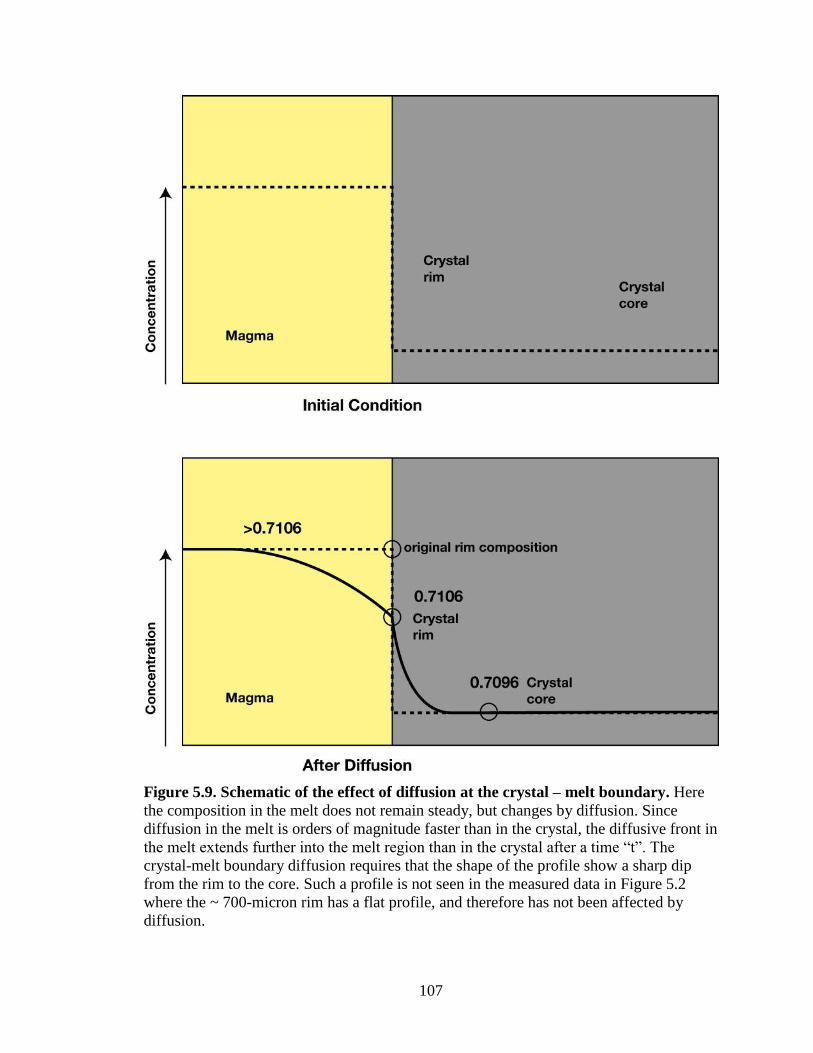
107
Figure 5.9. Schematic of the effect of diffusion at the crystal – melt boundary. Here
the composition in the melt does not remain steady, but changes by diffusion. Since
diffusion in the melt is orders of magnitude faster than in the crystal, the diffusive front in
the melt extends further into the melt region than in the crystal after a time “t”. The
crystal-melt boundary diffusion requires that the shape of the profile show a sharp dip
from the rim to the core. Such a profile is not seen in the measured data in Figure 5.2
where the ~ 700-micron rim has a flat profile, and therefore has not been affected by
diffusion.
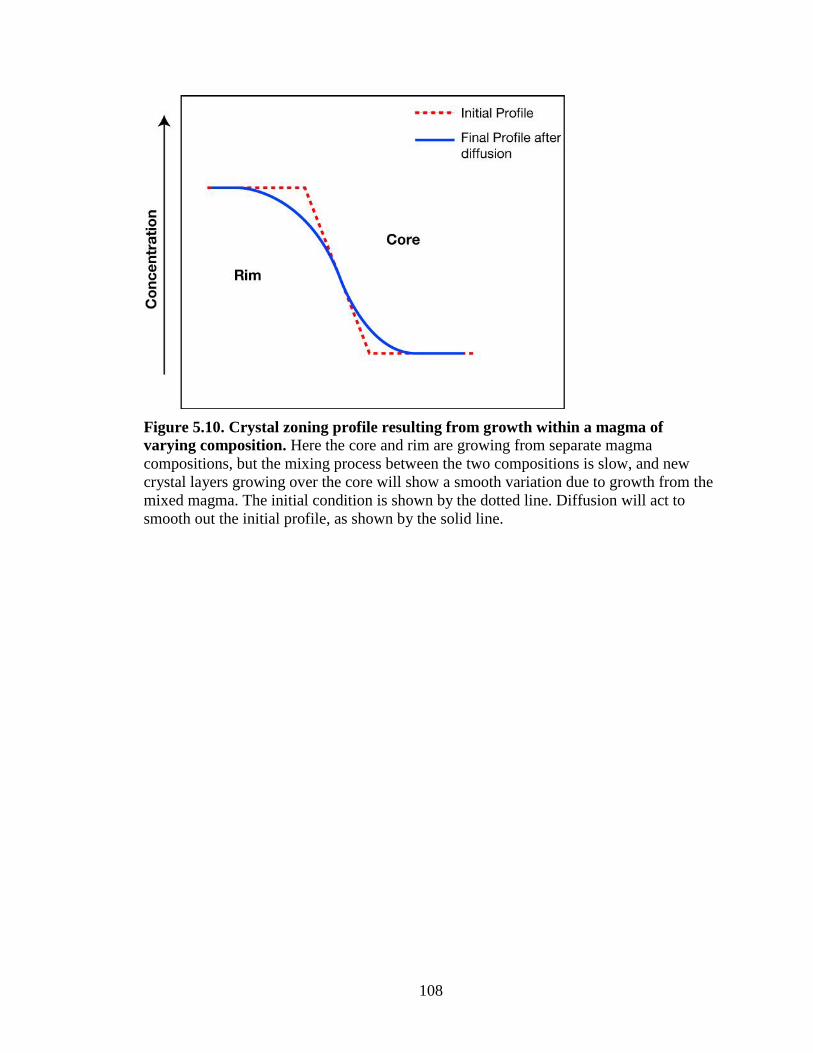
108
Figure 5.10. Crystal zoning profile resulting from growth within a magma of
varying composition. Here the core and rim are growing from separate magma
compositions, but the mixing process between the two compositions is slow, and new
crystal layers growing over the core will show a smooth variation due to growth from the
mixed magma. The initial condition is shown by the dotted line. Diffusion will act to
smooth out the initial profile, as shown by the solid line.
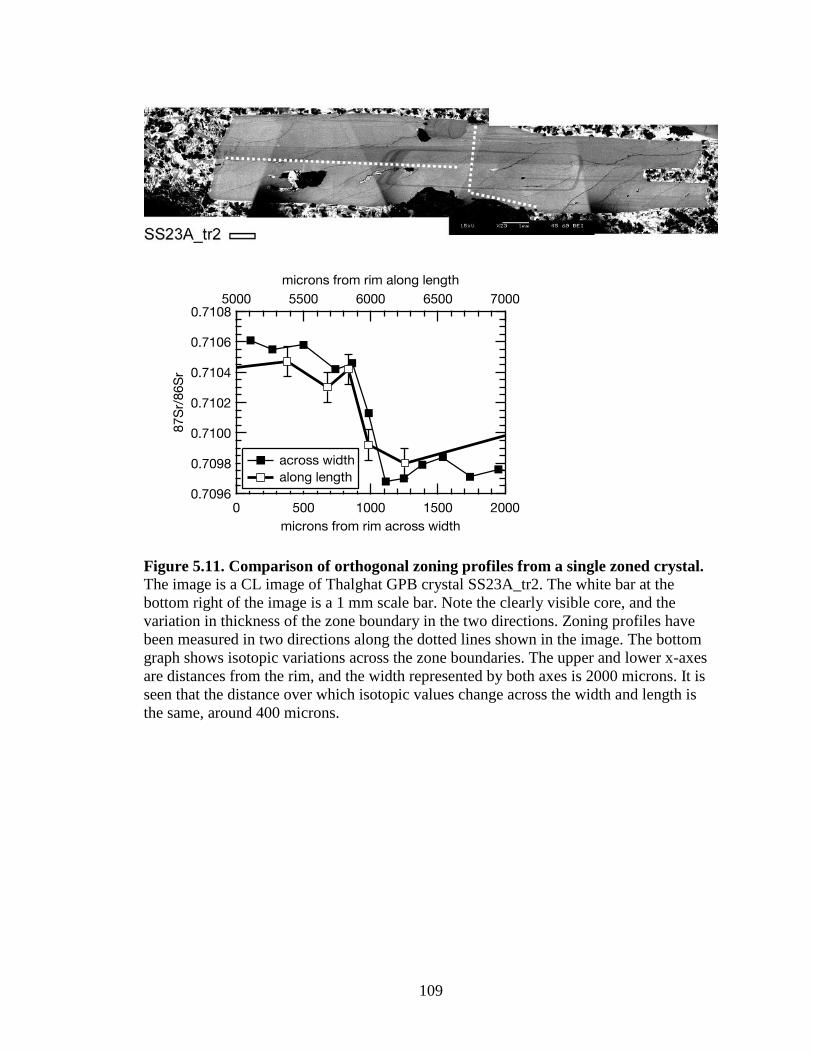
109
0.7108
0.7106
0.7104
0.7102
0.7100
0.7098
0.7096
87S
r/86
Sr
2000150010005000microns from rim across width
70006500600055005000microns from rim along length
across width along length
Figure 5.11. Comparison of orthogonal zoning profiles from a single zoned crystal.
The image is a CL image of Thalghat GPB crystal SS23A_tr2. The white bar at the
bottom right of the image is a 1 mm scale bar. Note the clearly visible core, and the
variation in thickness of the zone boundary in the two directions. Zoning profiles have
been measured in two directions along the dotted lines shown in the image. The bottom
graph shows isotopic variations across the zone boundaries. The upper and lower x-axes
are distances from the rim, and the width represented by both axes is 2000 microns. It is
seen that the distance over which isotopic values change across the width and length is
the same, around 400 microns.
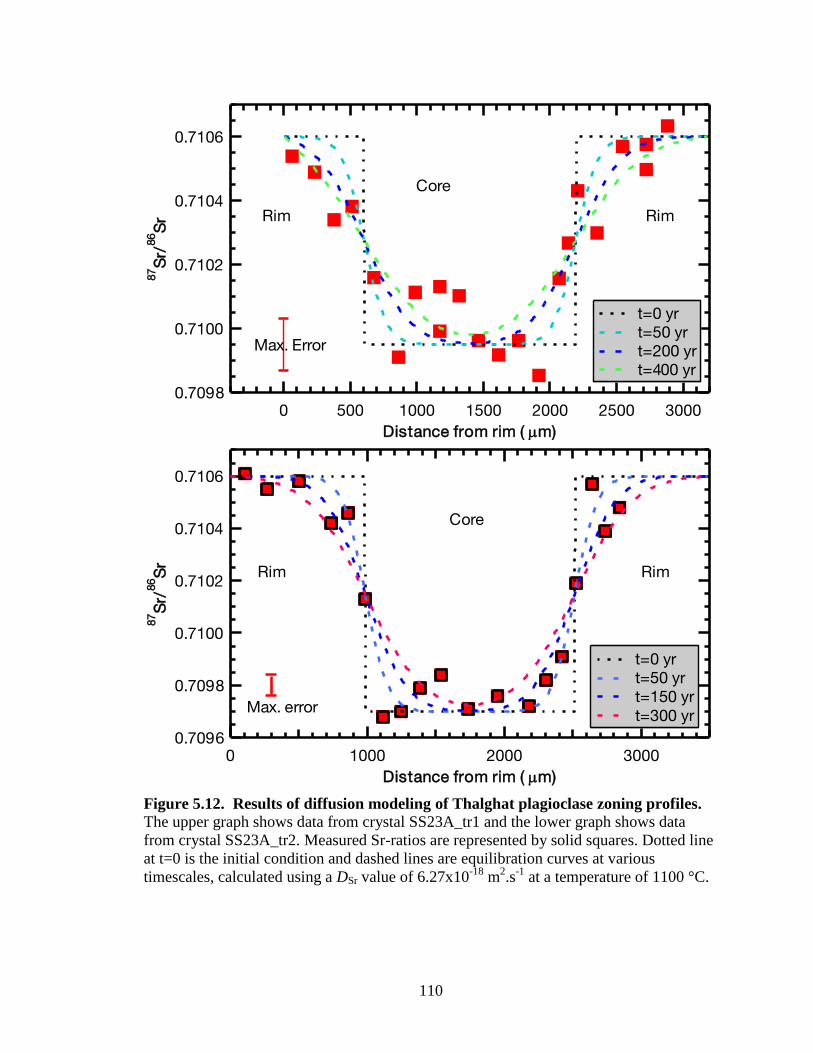
110
0.7106
0.7104
0.7102
0.7100
0.7098
87S
r/86
Sr
300025002000150010005000Distance from rim ( m)
Core
Rim Rim
Max. Error
t=0 yr t=50 yr t=200 yr t=400 yr
0.7106
0.7104
0.7102
0.7100
0.7098
0.7096
87S
r/86
Sr
3000200010000Distance from rim ( m)
Rim Rim
Core
Max. error
t=0 yr t=50 yr t=150 yr t=300 yr
Figure 5.12. Results of diffusion modeling of Thalghat plagioclase zoning profiles. The upper graph shows data from crystal SS23A_tr1 and the lower graph shows data
from crystal SS23A_tr2. Measured Sr-ratios are represented by solid squares. Dotted line
at t=0 is the initial condition and dashed lines are equilibration curves at various
timescales, calculated using a DSr value of 6.27x10⁻¹⁸
m2.s
-1 at a temperature of 1100 °C.
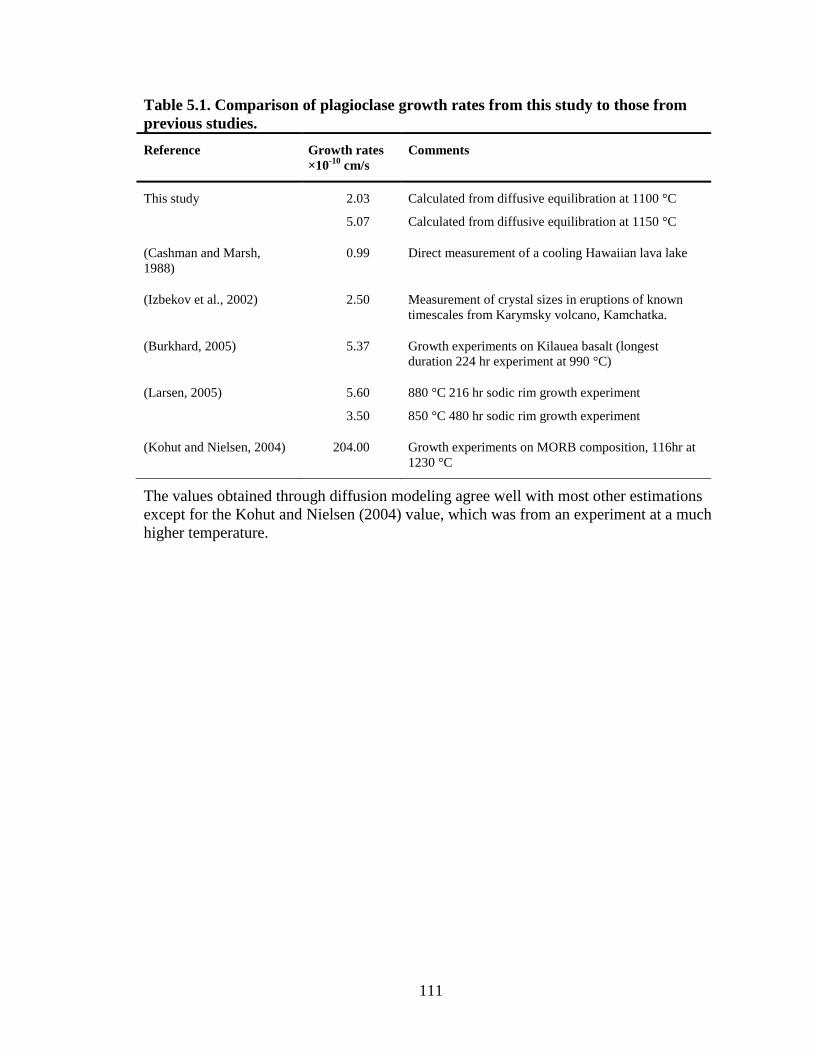
111
Table 5.1. Comparison of plagioclase growth rates from this study to those from
previous studies.
Reference Growth rates
×10-10
cm/s
Comments
This study 2.03
5.07
Calculated from diffusive equilibration at 1100 °C
Calculated from diffusive equilibration at 1150 °C
(Cashman and Marsh,
1988)
0.99 Direct measurement of a cooling Hawaiian lava lake
(Izbekov et al., 2002) 2.50 Measurement of crystal sizes in eruptions of known
timescales from Karymsky volcano, Kamchatka.
(Burkhard, 2005) 5.37 Growth experiments on Kilauea basalt (longest
duration 224 hr experiment at 990 °C)
(Larsen, 2005) 5.60
3.50
880 °C 216 hr sodic rim growth experiment
850 °C 480 hr sodic rim growth experiment
(Kohut and Nielsen, 2004) 204.00 Growth experiments on MORB composition, 116hr at
1230 °C
The values obtained through diffusion modeling agree well with most other estimations
except for the Kohut and Nielsen (2004) value, which was from an experiment at a much
higher temperature.
112
CHAPTER VI
DISCUSSION, CONCLUSIONS AND FUTURE WORK
Deccan Magma Chambers and growth of “giant” crystals
An interesting question is what type of environment was it that allowed the
plagioclase crystals to grow to “giant” sizes. Previous authors (Sen, 2001; Sen et al.,
2006; Higgins and Chandrasekharam, 2007) have pondered this issue, and based on my
new data, I evaluate their models and present my own hypothesis. As a starting point, it is
reasonable to assume that such crystals grew in shallow crustal magma chambers since
phase equilibrium studies on Western Ghat tholeiites show that fractionation occurred at
relatively shallow depths of ~0.2 GPa or less (Cohen and Sen, 1994; Sano et al., 2001). A
cooling magma chamber loses heat through the chamber walls and as a result develops a
solidification front that advances toward the interior of the chamber with time (Figure
6.1). The solidification front is zoned in terms of the crystal and melt proportions.
Crystals are more abundant towards the walls and the liquidius marks the inner edge of
the front.
Marsh (1988, 1996) suggested that the part of the solidification front with crystal
proportion >55% rheologically behaves like the wall rock, and the liquid entrapped in this
part does not communicate with the rest of the magma chamber. The region with 25-50%
crystallinity is a “mushy” region from where crystals are unlikely to migrate into the
liquid rich part of the chamber. The plane of 25% crystallinity that bounds this region is
called the “capture front”. In Figure 6.1, crystals to the left of the capture front (25 – 55%
crystals ) are “non-eruptible”, while crystals to the right of the front (25% - 0% crystals)
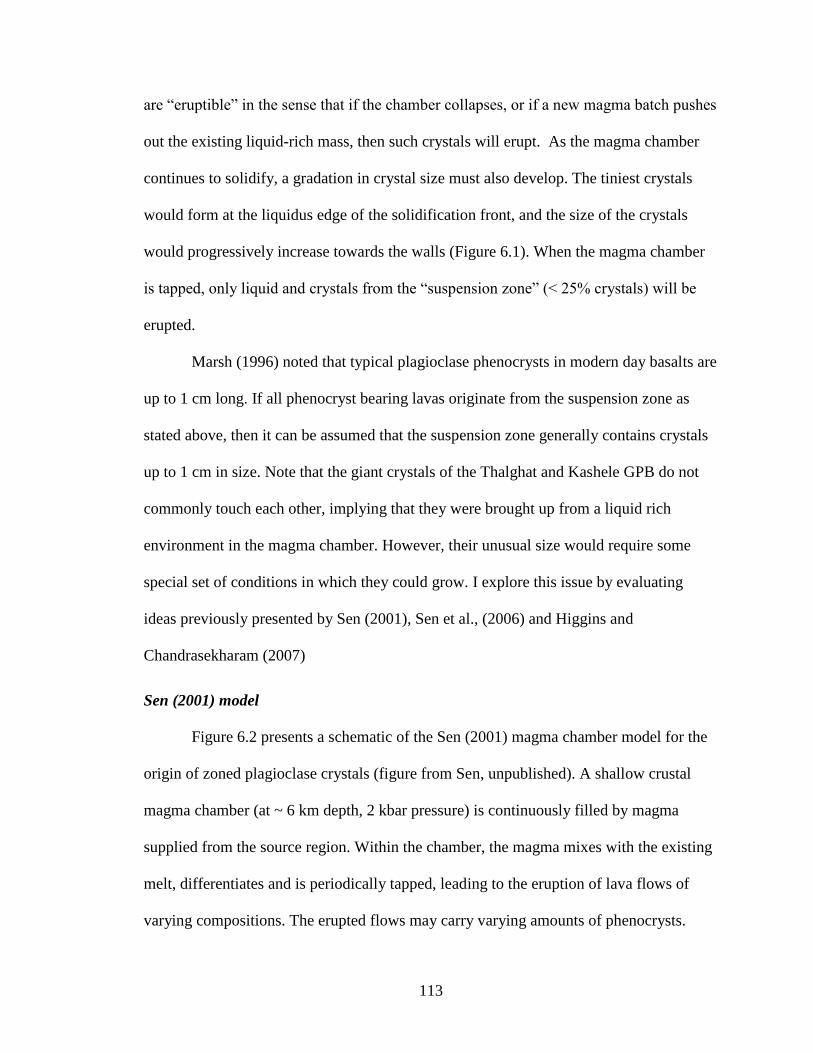
113
are “eruptible” in the sense that if the chamber collapses, or if a new magma batch pushes
out the existing liquid-rich mass, then such crystals will erupt. As the magma chamber
continues to solidify, a gradation in crystal size must also develop. The tiniest crystals
would form at the liquidus edge of the solidification front, and the size of the crystals
would progressively increase towards the walls (Figure 6.1). When the magma chamber
is tapped, only liquid and crystals from the “suspension zone” (< 25% crystals) will be
erupted.
Marsh (1996) noted that typical plagioclase phenocrysts in modern day basalts are
up to 1 cm long. If all phenocryst bearing lavas originate from the suspension zone as
stated above, then it can be assumed that the suspension zone generally contains crystals
up to 1 cm in size. Note that the giant crystals of the Thalghat and Kashele GPB do not
commonly touch each other, implying that they were brought up from a liquid rich
environment in the magma chamber. However, their unusual size would require some
special set of conditions in which they could grow. I explore this issue by evaluating
ideas previously presented by Sen (2001), Sen et al., (2006) and Higgins and
Chandrasekharam (2007)
Sen (2001) model
Figure 6.2 presents a schematic of the Sen (2001) magma chamber model for the
origin of zoned plagioclase crystals (figure from Sen, unpublished). A shallow crustal
magma chamber (at ~ 6 km depth, 2 kbar pressure) is continuously filled by magma
supplied from the source region. Within the chamber, the magma mixes with the existing
melt, differentiates and is periodically tapped, leading to the eruption of lava flows of
varying compositions. The erupted flows may carry varying amounts of phenocrysts.
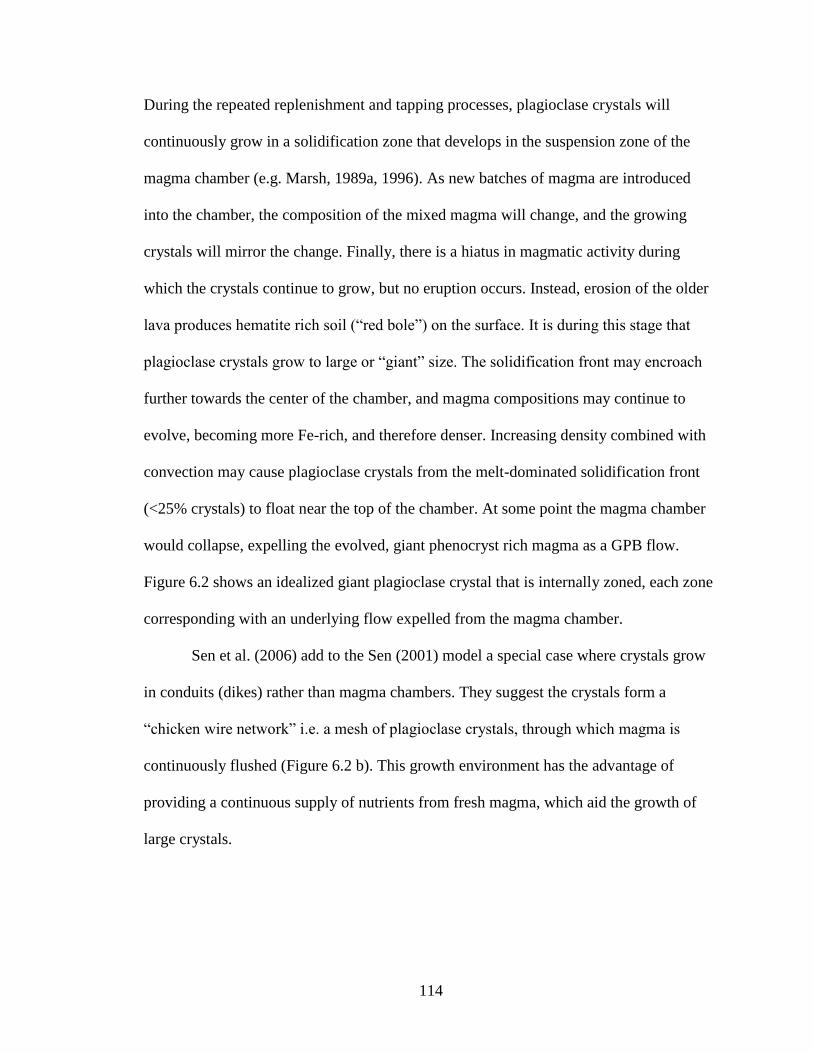
114
During the repeated replenishment and tapping processes, plagioclase crystals will
continuously grow in a solidification zone that develops in the suspension zone of the
magma chamber (e.g. Marsh, 1989a, 1996). As new batches of magma are introduced
into the chamber, the composition of the mixed magma will change, and the growing
crystals will mirror the change. Finally, there is a hiatus in magmatic activity during
which the crystals continue to grow, but no eruption occurs. Instead, erosion of the older
lava produces hematite rich soil (“red bole”) on the surface. It is during this stage that
plagioclase crystals grow to large or “giant” size. The solidification front may encroach
further towards the center of the chamber, and magma compositions may continue to
evolve, becoming more Fe-rich, and therefore denser. Increasing density combined with
convection may cause plagioclase crystals from the melt-dominated solidification front
(<25% crystals) to float near the top of the chamber. At some point the magma chamber
would collapse, expelling the evolved, giant phenocryst rich magma as a GPB flow.
Figure 6.2 shows an idealized giant plagioclase crystal that is internally zoned, each zone
corresponding with an underlying flow expelled from the magma chamber.
Sen et al. (2006) add to the Sen (2001) model a special case where crystals grow
in conduits (dikes) rather than magma chambers. They suggest the crystals form a
“chicken wire network” i.e. a mesh of plagioclase crystals, through which magma is
continuously flushed (Figure 6.2 b). This growth environment has the advantage of
providing a continuous supply of nutrients from fresh magma, which aid the growth of
large crystals.
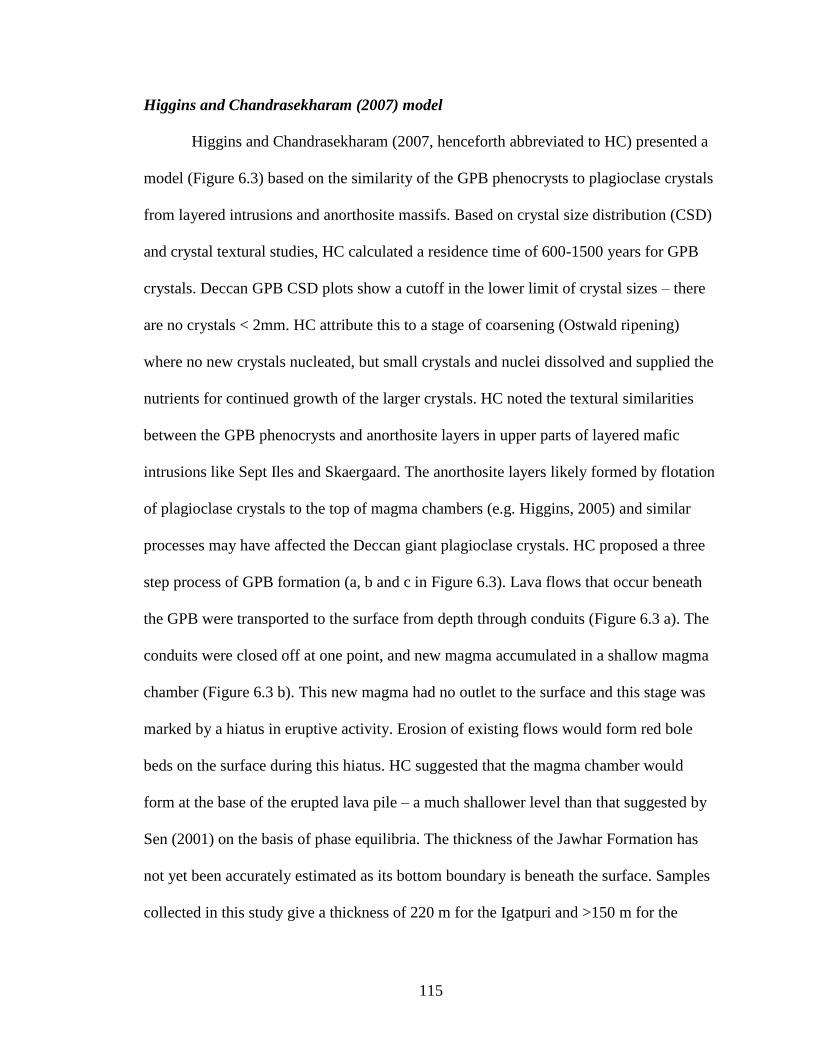
115
Higgins and Chandrasekharam (2007) model
Higgins and Chandrasekharam (2007, henceforth abbreviated to HC) presented a
model (Figure 6.3) based on the similarity of the GPB phenocrysts to plagioclase crystals
from layered intrusions and anorthosite massifs. Based on crystal size distribution (CSD)
and crystal textural studies, HC calculated a residence time of 600-1500 years for GPB
crystals. Deccan GPB CSD plots show a cutoff in the lower limit of crystal sizes – there
are no crystals < 2mm. HC attribute this to a stage of coarsening (Ostwald ripening)
where no new crystals nucleated, but small crystals and nuclei dissolved and supplied the
nutrients for continued growth of the larger crystals. HC noted the textural similarities
between the GPB phenocrysts and anorthosite layers in upper parts of layered mafic
intrusions like Sept Iles and Skaergaard. The anorthosite layers likely formed by flotation
of plagioclase crystals to the top of magma chambers (e.g. Higgins, 2005) and similar
processes may have affected the Deccan giant plagioclase crystals. HC proposed a three
step process of GPB formation (a, b and c in Figure 6.3). Lava flows that occur beneath
the GPB were transported to the surface from depth through conduits (Figure 6.3 a). The
conduits were closed off at one point, and new magma accumulated in a shallow magma
chamber (Figure 6.3 b). This new magma had no outlet to the surface and this stage was
marked by a hiatus in eruptive activity. Erosion of existing flows would form red bole
beds on the surface during this hiatus. HC suggested that the magma chamber would
form at the base of the erupted lava pile – a much shallower level than that suggested by
Sen (2001) on the basis of phase equilibria. The thickness of the Jawhar Formation has
not yet been accurately estimated as its bottom boundary is beneath the surface. Samples
collected in this study give a thickness of 220 m for the Igatpuri and >150 m for the
116
Jawhar. Peng et al. (1994) give the combined thickness as >700m. If the giant crystals did
grow in a magma chamber at the base of this erupted pile, then the pressure at that depth
in the HC model would be ~ 0.3 kbar. Plagioclase crystals would nucleate and grow, and
eventually collect at the roof of the chamber by convection. When another conduit is
opened to the surface, or the pre-existing conduit remobilized, the crystal laden contents
of the chamber will erupt as GPB flows (Figure 6.3 c). Following this, the magma
chamber is abandoned, and later flows are transported to the surface from depth as in
Figure 6.3 a
Comparative evaluation of previous models: Further discussion and a new model
There are notable differences between the models of Sen (2001) and HC (2007).
Sen (2001) considers GPB eruption as the culmination of a magmatic cycle, while HC
consider the GPB eruption to be the start of a new magmatic cycle. The Sen (2001)
model will lead to the formation of zoned plagioclase crystals owing to the passage of
multiple compositionally diverse melts through the same magma chamber that the
crystals grew in. The HC model does not explicitly allow for the passage of different
magmas through the chamber: growth of the GPB is confined to the chamber below the
lava pile, and all other flows bypass this chamber.
I summarize the similarities and differences between the Sen (2001), Sen et al.
(2006) and HC models as follows:
1. Both models require that the giant crystals form in shallow magma chambers. The
Sen (2001) model suggests formation of these crystals around 0.2 GPa while the HC
model prefers a much shallower depth. There is no constraint on the depth of such a
117
magma chamber other than the fact that the Western Ghats tholeiites all plot at the 0.2
GPa plagioclase+olivine+augite+melt pseudocotectic (Sen, 1995).
2. One of the similarities between the models is in that both require accumulation of
plagioclase crystals in Fe-rich differentiated liquid near the roof of the magma
chamber. The HC model calls for active convection currents in the magma chamber
that will sweep the lighter plagioclase crystals towards the roof. Whether or not
convection can occur in a differentiated magma chamber is an issue of dispute
(Marsh, 1989b; Huppert and Turner, 1991). Marsh suggests that convection in magma
chamber is sluggish or nonexistent, except in ultramafic intrusions (e.g. Duke Island
Irvine, 1987). Another problem with flotation is that the cooler, denser Fe-rich melts,
in which the plagioclase crystals would accumulate, should sink in the magma
chamber. Yet another problem is the manner in which the crystals occur in the
erupted lava. HC indicate that they occur in clusters, but within each cluster the
crystals are sharply angular to each other. In layered intrusions in which plagioclase
flotation has been invoked, crystals conspicuously touch each other and are sub
parallel to each other, a texture termed “igneous lamination” (Hess, 1960). My own
examination of the GPB flows in the field (see the field photo - Figure 1.4) indicates
that the crystals have little to no layering and rarely touch each other, suggesting an
origin in a melt dominated environment, and not in an environment where crystals
would align themselves by flotation and accumulation. The role of plagioclase
flotation in the origin of the giant crystals would therefore be minor.
118
3. An important observation by HC is that plagioclase crystals <2mm in size do not
occur among the “giant” plagioclase. They therefore proposed that these crystals grew
by Ostwald ripening processes after accumulation by flotation. Studies of layered
intrusions suggest that such processes generally result in the development of
adcumulus texture (e.g. Higgins, 2005). HC proposed that such continued growth
occurred due to supply of nutrients from dissolving smaller crystals. In the case of
GPB, individual plagioclase crystals are euhedral, and show little evidence of
adcumulus growth. If Ostwald ripening did affect the giant plagioclase crystals, it
probably was not accompanied by segregation of the crystals by flotation.
The present study provides minute details of intracrystalline variations in
elemental chemistry and Sr-isotope ratio, and therefore introduces crystal chemistry as a
further constraint to crystal growth processes. Based on the new information I present a
new model for giant plagioclase formation.
Effect of volatiles on crystal growth
The presence of volatiles can enhance crystal growth rates, leading to large crystal
sizes as seen in the large crystals from volatile-rich, pegmatitic liquids. While the effect
of volatiles cannot be fully discounted, it may not be the sole reason for the growth of
large crystals as Deccan lavas, and flood basalt lavas in general, do not have large
amounts of dissolved water. Water contents of ~0.6% have been measured in melt
pockets within phenocrysts in Deccan Basalts (Sano et al., 2001). Amount of water in
basaltic magmas will increase with pressure and it may be argued that giant crystals grew
at depth, where the GPB magmas had more dissolved water. This effect may however be
119
buffered by lower growth rates at high pressures. Growth in water-saturated conditions
would not support the argument of HC that the plagioclase grew in extremely shallow
chambers. The effect of water would also be to increase the An content of crystallized
plagioclase (e.g. Panjasawatwong et al., 1995). This is not supported by the measured An
content of plagioclase from GPB flows, which are the lowest among the flows of the
Jawhar and Igatpuri. It can therefore be concluded that these crystals could not have
grown in shallow chambers under water-rich conditions.
Growth of Thalghat GPB
The presence of zoned and non-zoned plagioclase in Thalghat GPB can provide
further constraints to test the models. As stated in previous chapters, zoned Thalghat GPB
shows a near-homogeneous core with 87
Sr/86
Sr of ~0.7096 – 0.7098 and a near-
homogeneous rim with 87
Sr/86
Sr 0.7106. Unzoned Thalghat plagioclase, which form the
majority of the phenocrysts, have 87
Sr/86
Sr of ~0.7106. There is no size difference
between zoned and unzoned crystals, nor are there major, trace element, and isotopic
differences in the zoned crystal rims and unzoned crystals.
Growth of zoned plagioclase could have occurred in two ways: 1) growth of the
core and rim in the same magma chamber, by an influx of magma with a different Sr-
isotope composition, or 2) by transport of crystals between two magma chambers, each
with a different Sr-isotope composition. In the first case the following would be the series
of events that would occur:
1. The magma chamber originally contained magma with 87
Sr/86
Sr composition of
0.7096, containing some proportion of plagioclase phenocrysts.
120
2. Another magma intruded into this chamber, the 87
Sr/86
Sr of this would be >0.7106
and the mixed magma would have the composition of 0.7106.
3. New crystals nucleated in this mixed magma, and grew as unzoned crystals with a
composition of 0.7106.
4. Simultaneously, new layers grew onto pre-existing crystals with 87
Sr/86
Sr of 0.7096
forming zoned crystals.
Assuming that growth rates in the mixed magma were constant for all crystals
growing in it, the zoned crystals would be the largest sized crystals, owing to a pre-
existing rim. This is not found to be the case. If the input melt contained crystals, then
this size difference would not exist. However, since the input melt has to have a 87
Sr/86
Sr
higher than 0.7106, there would exist two kinds of zoned crystals, those having cores
with 87
Sr/86
Sr greater than 0.7106 and those with cores of 87
Sr/86
Sr < 0.7106. This is also
not observed.
The origin of this zoning is best explained by a magma of 87
Sr/86
Sr 0.7096
carrying plagioclase phenocrysts intruding into a magma chamber with a 87
Sr/86
Sr
composition slightly higher than 0.7106. The proportion of two magmas is important,
because the end result has to be a magma with a composition of 0.7106. The volume of
magma with 87
Sr/86
Sr of 0.7096 has to be negligible to ensure such a resulting mixed
magma composition. This is borne out by the volumetrically insignificant amount of
plagioclase with 87
Sr/86
Sr 0.7096 (i.e. crystal cores) in the total crystal population. Only
two out of 16 crystals studied showed zoning. While the crystal proportion does not
necessary correspond to the magma volume proportion, it must be noted that the extreme
121
similarity of major and trace element compositions in the plagioclase core and rim
suggest that the major element compositions of the two magmas were similar. Therefore,
at a certain temperature, the magmas would have the same proportion of phases
crystallized, assuming equilibrium conditions prevailed. Therefore the phase ratio can be
taken to be a reflection of the magma ratio. The addition of 12.5% of magma with
87Sr/
86Sr of 0.7096 to a chamber with
87Sr/
86Sr 0.7106 would result in a mixed magma
with 87
Sr/86
Sr of ~0.7015, similar to the measured ratios in groundmass from the Thalghat
GPB flow. The mixed population of Thalghat crystals could therefore have grown in a
steady-state magma chamber, and the only disruption to this steady-state was the
introduction of ~12.5% of crystal bearing magma with a differing composition. This is
schematically illustrated in Figure 6.4. Note that magma homogenization after this
mixing event would be rapid, as the crystal core-rim interface shows a sharp change in
87Sr/
86Sr, and it has been shown in the previous chapter that this variation cannot be due
to growth in a variable magma composition.
Kashele GPB crystals require a different mode of formation. We have seen in
Chapter IV that different zones in the Kashele GPB correspond to different flows from
the Igatpuri Formation, and the relative age of the flow corresponds to the relative age of
the corresponding crystal zone. The growth of the Kashele crystals therefore coincided
with the magmatic activity that resulted in the eruption of Igatpuri flows. There are a
number of features that require further explanation. Most important is the fact that
Igatpuri flows are more mafic than the Jawhar flows, and the Mg# increases with
87Sr/
86Sr. Therefore An content of the plagioclase should have been higher than An60,
closer to the An63 or even An75, as seen in plagioclase from the Igatpuri flows. This is
122
not the case . If the flows originated from a single magma chamber, and if GPB crystals
also grew in the same magma chamber, then the final crystal population should contain a
mixed population of crystals of different An contents. This is also not the case. One
reason why high An zones are not seen could be that introduction of the hotter magma
caused dissolution rather than crystallization, evidence for which is seen in the Kashele
crystals.
A more likely environment where crystals would come in contact with multiple
batches of melt is a magma conduit through which melt is transferred between magma
chambers. A schematic of magma movement through such a conduit is shown in Figure
6.5. For magma moving through a dike under conditions of laminar flow, the flow
velocity would be greatest at the center and lowest at the dike walls, where a
solidification front could perhaps be maintained. Because the flow is laminar, mixing
between melt from the center and melt from the edges of the dike will be minimized.
Within the suspension zone, there would likely be some turbulence, ensuring that input
melts are mixed with the melts in the suspension zone. Since flow rates are low near the
suspension zone, the mixing process would be relatively slow, and growth rate of crystals
could be faster than the rate of melt homogenization. A growing crystal will record this
slower mixing process as gradual changes between compositional zones, as opposed to
sharp zone boundary changes. Since crystals can grow at variable rates along the different
crystallographic directions, the width over which the variations are recorded would
depend on the aspect ratio of the crystal. As discussed in Chapters VI and V, this is true
for the Kashele giant plagioclase.
123
Eruption of the GPB crystals could have taken place when magma of 87
Sr/86
Sr
composition 0.7096 passed through the conduit and swept the crystals into a temporary
holding chamber. This step is necessary, since the composition 0.7096 is not observed as
an eruptive unit. The outermost zone of the Kashele crystals is a thin rim with 87
Sr/86
Sr of
0.71040 – 0.71050. We can assume all magmas that passed through the conduit to have
collected in the staging area (i.e. shallow magma chamber) before eruption. Magma of
87Sr/
86Sr 0.7096 would pick up the plagioclase crystals from the conduit and introduce
them into the shallow chamber, which would probably contain magma of 87
Sr/86
Sr
composition 0.71174, similar to the Igatpuri flow erupted immediately before the Kashele
GPB. Mixing between the two compositions in the chamber would be rapid, and a 50:50
mix would result in homogenized magma of 87
Sr/86
Sr 0.7106, which then erupted as the
Kashele GPB. During this process, GPB crystals may have suffered dissolution, followed
by the growth of the outermost rim with 87
Sr/86
Sr of 0.71040 – 0.71050. Kashele
groundmass has highly variable 87
Sr/86
Sr ratios of 0.71061±0.00027, which may be
because incomplete homogenization of the magma prior to eruption.
It must be noted that the final stage in the growth of the GPB, viz. transfer from
the conduit to the low level staging area has some similarity to the HC model. the
difference being that the bulk of crystal growth occurred separately. The growth of the
crystals in the dike is similar to the Sen et al. (2006) “chicken wire” model. However, it is
probably not possible to erupt the interconnected mass of crystals in the chicken wire
network. A phenocryst bearing magma would likely lose its crystal population when
passing through such a network, and if the mass of crystals was erupted, it would have
crystals of mixed origin. This is not the case with the GPB as all crystals show similar
124
compositions and zoning features. The laminar flow model of Figure 6.5 seems to be the
best explanation for the Kashele GPB.
Future research directions
We have seen that diffusion modeling of zoning in the “giant” plagioclase crystals
is a useful tool to better constrain the eruptive duration of the Deccan and I plan to use
the same techniques on plagioclase phenocrysts from other Deccan Formations. The first
step would be to complete similar studies on the other GPB flows from the Kalsubai
Subgroup. Apart from the application to timescale calculations, we have seen that
plagioclase zoning is a useful tool in the study of magma chamber processes. Two
stratigraphically successive formations (Jawhar and Igatpuri) have plagioclase crystals
with widely varying zoning systematics and growth histories. The study of the other
formations will provide a near-continuous of magmatic processes leading to the eruption
of the Kalsubai Subgroup. GPB flows appear to be absent from the younger subgroups,
however zoning studies could still be carried out on other plagioclase phyric flows. The
well studied, chemically uniform and volumetrically significant Ambenali Formation
would be an ideal subject of study, and another advantage is that the spatial extent of this
formation is probably the best known of the Western Ghats formations. This could enable
the calculation of a more robust 3-D extrusion rate.
Summary of Conclusions
1. The lowermost Jawhar Formation of the Deccan Western Ghats consists of evolved
lava flows that have elevated Sr isotopic ratios of 0.7090 – 0.7128.
125
2. Flows from the Igatpuri Formation are higher in Mg# than most Jawhar flows, and
have correspondingly higher 87
Sr/86
Sr ratios.
3. The high Mg# flows of the Jawhar and Igatpuri Formations define a trend in Mg# vs
87Sr/
86Sr opposite to that expected from AFC processes.
4. Zoning systematics in giant plagioclase phenocrysts from the Thalghat and Kashele
GPB are dissimilar, possibly owing to differing growth histories and / or growth
environments.
5. Thalghat giant plagioclase crystals are mostly unzoned, with respect to 87
Sr/86
Sr,
major and trace elements. The few crystals that show zoning have a single rim layer
over a core zone. Zonal variations are seen only in 87
Sr/86
Sr, major and trace element
concentrations are roughly equal in the core and rim. Growth was probably in a
steady state magma chamber under equilibrium growth conditions.
6. All Keshele plagioclase crystals studied were zoned with multiple growth zones and
widely varying compositional variations in 87
Sr/86
Sr between zones. Keshele
plagioclase probably grew in a constantly varying magma composition in
disequilibrium conditions, and this growth likely took place in a magma conduit
rather than a magma chamber.
7. Zoning profiles in Thalghat GPB have been affected by intracrystalline diffusive
processes, and diffusion modeling can constrain the residence timescales of these
crystals.
8. Thalghat plagioclase phenocrysts have a calculated growth rate of 2.03x10⁻¹⁰
cm/s.
126
9. Residence time of a 5 cm long Thalghat crystal will be 781 years.
10. 1-D eruptive rate of Thalghat GPB flow is 0.1 m/y. Deccan eruptive duration could be
on the order of 35,000 years. A more rigorous estimate would require similar studies
to be carried out on the remaining Deccan formations.
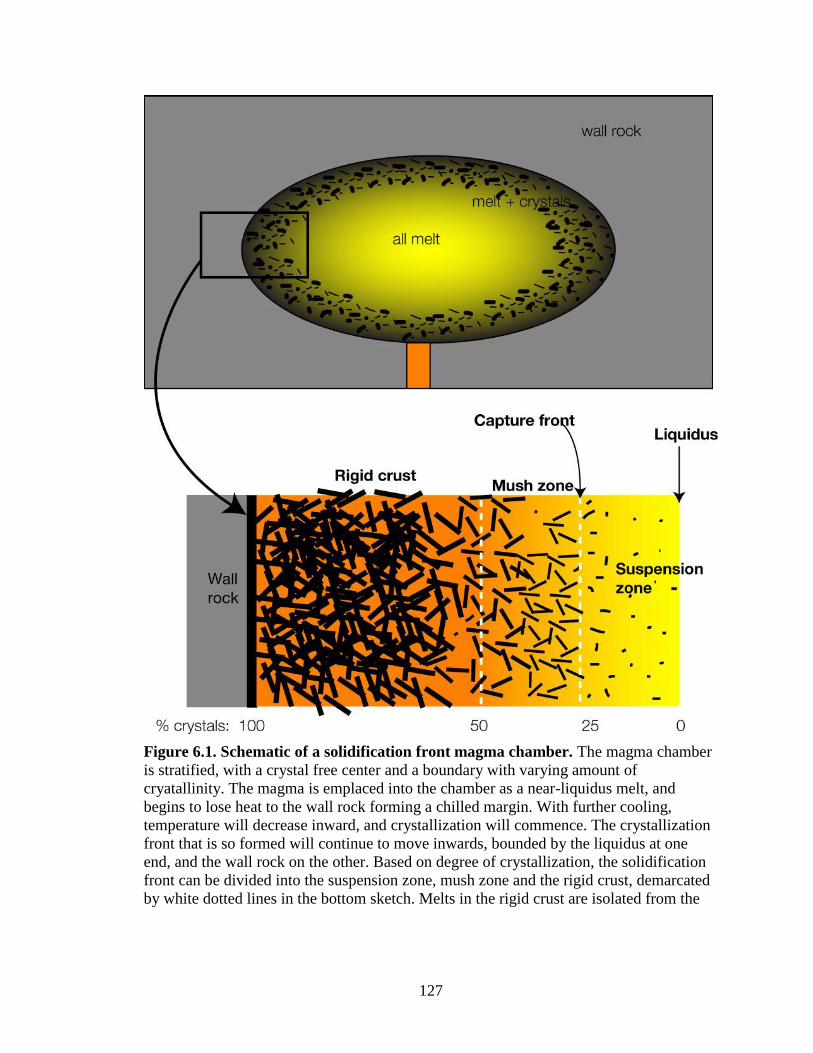
127
Figure 6.1. Schematic of a solidification front magma chamber. The magma chamber
is stratified, with a crystal free center and a boundary with varying amount of
cryatallinity. The magma is emplaced into the chamber as a near-liquidus melt, and
begins to lose heat to the wall rock forming a chilled margin. With further cooling,
temperature will decrease inward, and crystallization will commence. The crystallization
front that is so formed will continue to move inwards, bounded by the liquidus at one
end, and the wall rock on the other. Based on degree of crystallization, the solidification
front can be divided into the suspension zone, mush zone and the rigid crust, demarcated
by white dotted lines in the bottom sketch. Melts in the rigid crust are isolated from the

128
rest of the chamber, and will continue to differentiate to silicic compositions. Only
liquids from the suspension zone are eruptible.
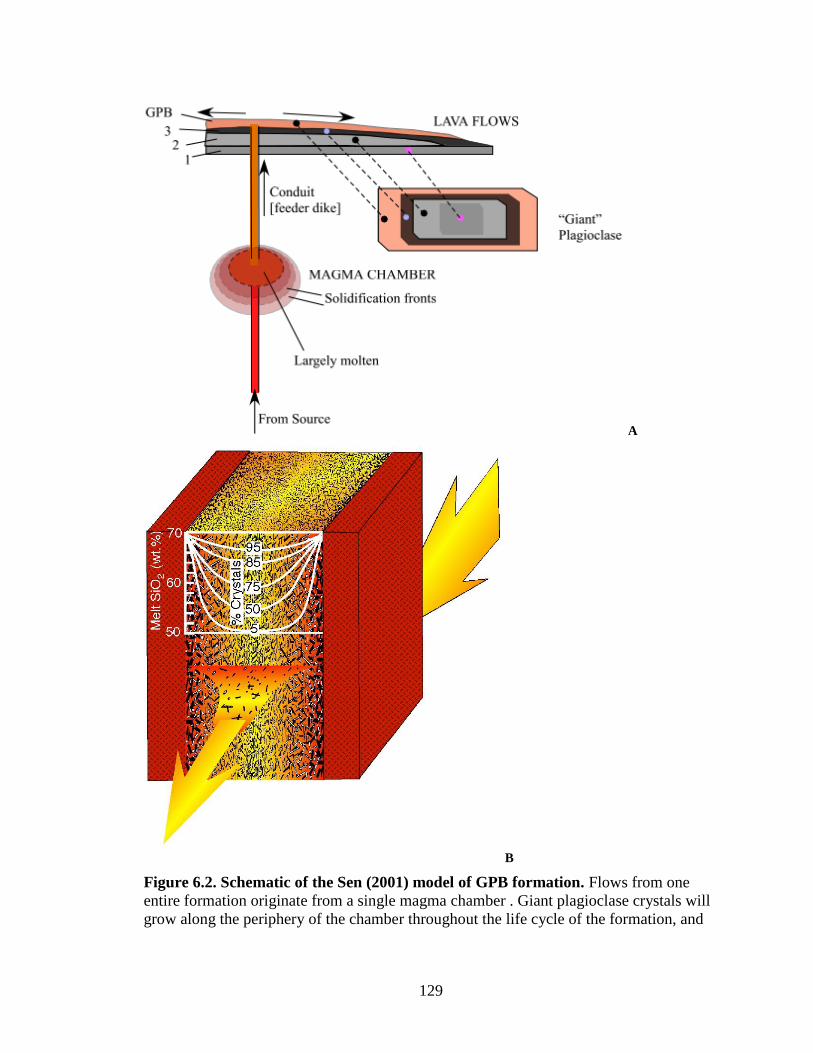
129
A
B
Figure 6.2. Schematic of the Sen (2001) model of GPB formation. Flows from one
entire formation originate from a single magma chamber . Giant plagioclase crystals will
grow along the periphery of the chamber throughout the life cycle of the formation, and
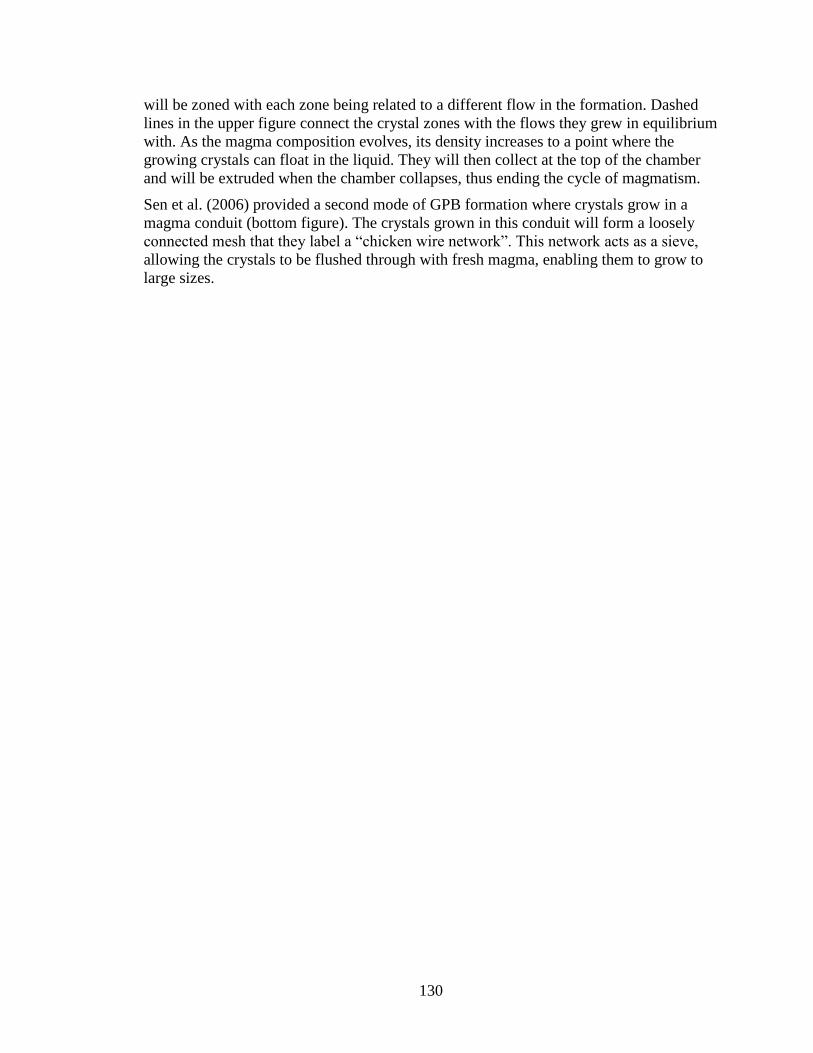
130
will be zoned with each zone being related to a different flow in the formation. Dashed
lines in the upper figure connect the crystal zones with the flows they grew in equilibrium
with. As the magma composition evolves, its density increases to a point where the
growing crystals can float in the liquid. They will then collect at the top of the chamber
and will be extruded when the chamber collapses, thus ending the cycle of magmatism.
Sen et al. (2006) provided a second mode of GPB formation where crystals grow in a
magma conduit (bottom figure). The crystals grown in this conduit will form a loosely
connected mesh that they label a “chicken wire network”. This network acts as a sieve,
allowing the crystals to be flushed through with fresh magma, enabling them to grow to
large sizes.
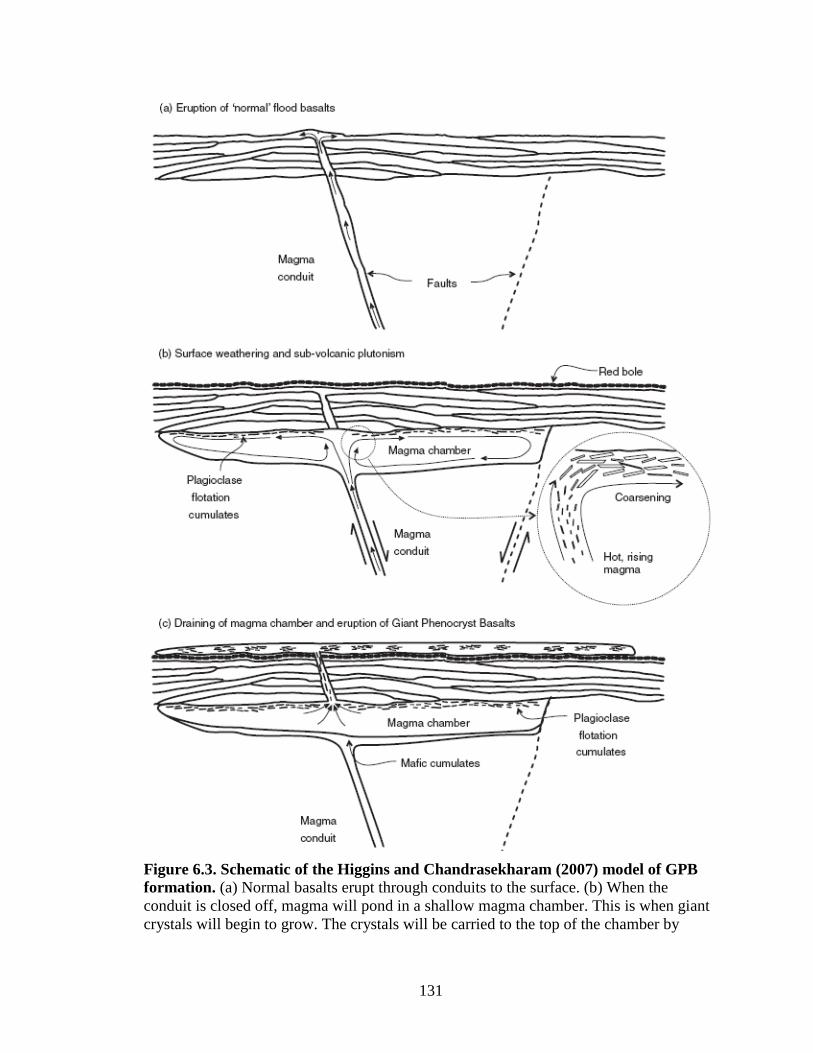
131
Figure 6.3. Schematic of the Higgins and Chandrasekharam (2007) model of GPB
formation. (a) Normal basalts erupt through conduits to the surface. (b) When the
conduit is closed off, magma will pond in a shallow magma chamber. This is when giant
crystals will begin to grow. The crystals will be carried to the top of the chamber by

132
convection, where they will accumulate and coarsen. (c) When the pathway to the surface
is reopened, the crystal laden magma will erupt as a GPB flow.
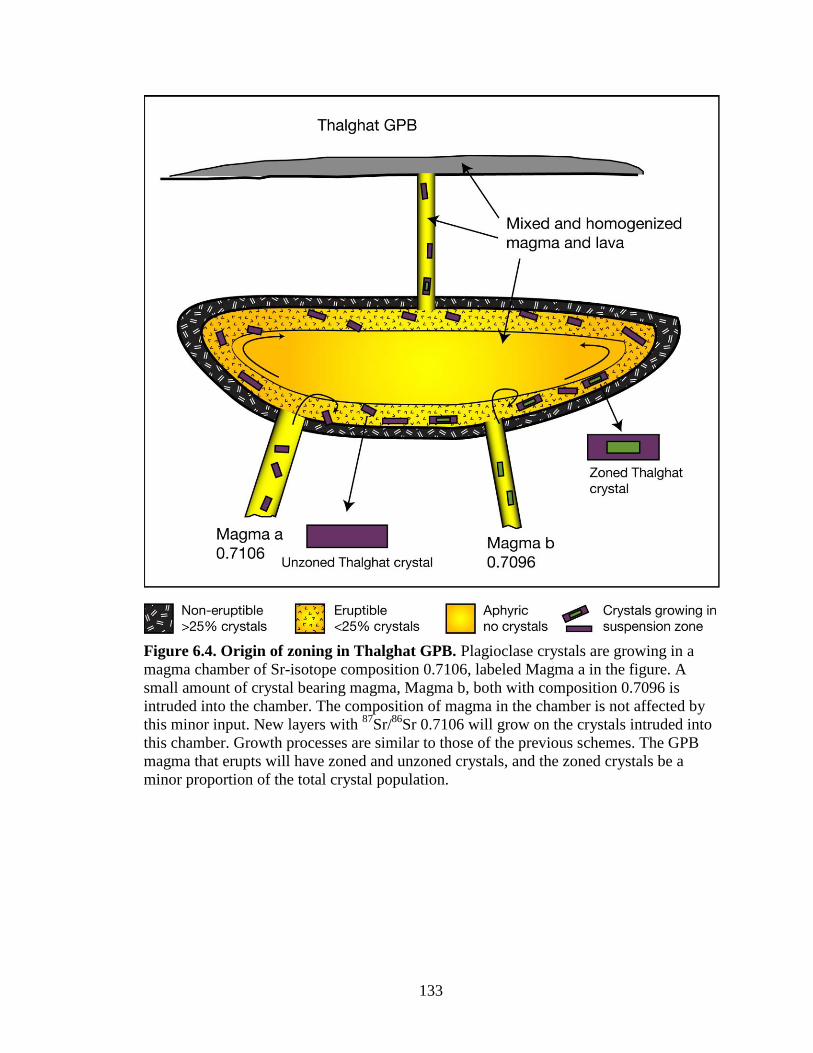
133
Figure 6.4. Origin of zoning in Thalghat GPB. Plagioclase crystals are growing in a
magma chamber of Sr-isotope composition 0.7106, labeled Magma a in the figure. A
small amount of crystal bearing magma, Magma b, both with composition 0.7096 is
intruded into the chamber. The composition of magma in the chamber is not affected by
this minor input. New layers with 87
Sr/86
Sr 0.7106 will grow on the crystals intruded into
this chamber. Growth processes are similar to those of the previous schemes. The GPB
magma that erupts will have zoned and unzoned crystals, and the zoned crystals be a
minor proportion of the total crystal population.
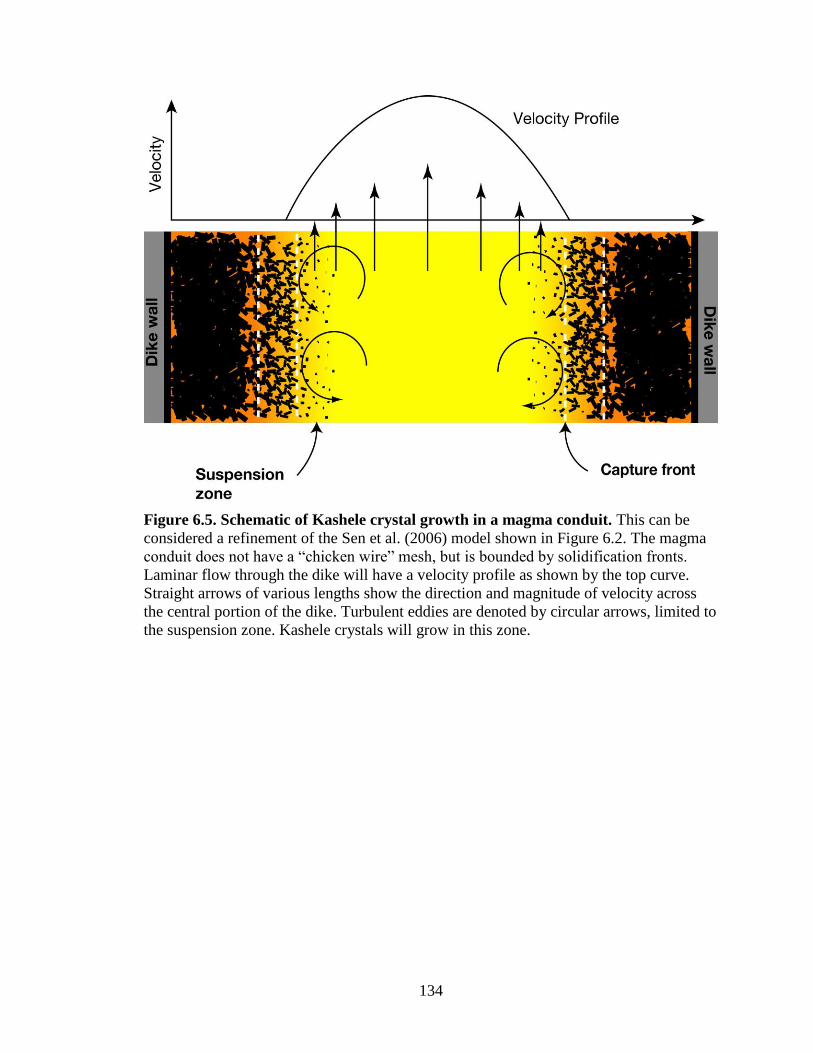
134
Figure 6.5. Schematic of Kashele crystal growth in a magma conduit. This can be
considered a refinement of the Sen et al. (2006) model shown in Figure 6.2. The magma
conduit does not have a “chicken wire” mesh, but is bounded by solidification fronts.
Laminar flow through the dike will have a velocity profile as shown by the top curve.
Straight arrows of various lengths show the direction and magnitude of velocity across
the central portion of the dike. Turbulent eddies are denoted by circular arrows, limited to
the suspension zone. Kashele crystals will grow in this zone.
135
LIST OF REFERENCES
Allegre, C.J., Birck, J.L., Capmas, F., and Courtillot, V., 1999, Age of the Deccan Traps
using 187
Re-187
Os systematics: Earth and Planetary Science Letters, v. 170, p. 197-
204.
Alvarez, L.W., Alvarez, W., Asaro, F., and Michel, H.V., 1980, Extraterrestrial cause for
the Cretaceous Tertiary extinction: Science, v. 208, p. 1095-1108.
Ariskin, A.A., 1999, Phase equilibria modeling in igneous petrology; use of
COMAGMAT model for simulating fractionation of ferro-basaltic magmas and
the genesis of high-alumina basalt: Journal of Volcanology and Geothermal
Research, v. 90, p. 115-162.
Basu, A.R., Renne, P.R., Dasgupta, D.K., Teichmann, F., and Poreda, R.J., 1993, Early
and late alkali igneous pulses and a high- 3He plume origin for the Deccan flood
basalts: Science, v. 261, p. 902-906.
Beane, J.E., 1988, Flow stratigraphy, chemical variation and petrogenesis of Deccan
flood basalts from the Western Ghats, India [Ph.D. thesis], Washington State
University, Pullman, WA, United States (USA).
Beane, J.E., Hooper, P.R., and Subbarao, K.V., 1988, A note on the picrite basalts of the
Western Ghats, Deccan Traps, India: Memoir - Geological Society of India, v. 10,
p. 117-133.
Beane, J.E., Turner, C.A., Hooper, P.R., Subbarao, K.V., and Walsh, J.N., 1986,
Stratigraphy, composition and form of the Deccan Basalts, Western Ghats, India:
Bulletin of Volcanology, v. 48, p. 61-83.
Behrens, H., Johannes, W., and Schmalzried, H., 1990, On the mechanisms of cation
diffusion processes in ternary feldspars: Physics and Chemistry of Minerals, v. 17,
p. 62-78.
Blundy, J.D., and Wood, B.J., 1991, Crystal-chemical controls on the partitioning of Sr
and Ba between plagioclase feldspar, silicate melts, and hydrothermal solutions:
Geochimica et Cosmochimica Acta, v. 55, p. 193-209.
Bodas, M.S., Khadri, S.F.R., Subbarao, K.V., and Subbarao, K.V., 1988, Stratigraphy of
the Jawhar and Igatpuri formations, western Ghat lava pile, India: Memoir -
Geological Society of India, v. 10, p. 235-252.
Brady, J.B., 1995, Diffusion data for silicate minerals, glasses, and liquids: AGU
Reference Shelf, v. 2, p. 269-290.
136
Brandon, A.D., Walker, R.J., Morgan, J.W., Norman, M.D., and Prichard, H.M., 1998,
Coupled 186
Os and 187
Os Evidence for Core-Mantle Interaction: Science, v. 280,
p. 1570-1573.
Burkhard, D.J.M., 2005, Nucleation and growth rates of pyroxene, plagioclase, and Fe-Ti
oxides in basalt under atmospheric conditions: European Journal of Mineralogy,
v. 17, p. 675-685.
Campbell, I.H., and Griffiths, R.W., 1990, Implications of mantle plume structure for the
evolution of flood basalts: Earth and Planetary Science Letters, v. 99, p. 79-93.
Cashman, K.V., and Marsh, B.D., 1988, Crystal size distribution (CSD) in rocks and the
kinetics and dynamics of crystallization; 2, Makaopuhi lava lake: Contributions to
Mineralogy and Petrology, v. 99, p. 292-305.
Chenet, A.-L., Quidelleur, X., Fluteau, F., Courtillot, V., and Bajpai, S., 2007, 40
K-40
Ar
dating of the Main Deccan large igneous province: Further evidence of KTB age
and short duration: Earth and Planetary Science Letters, v. 263, p. 1-15.
Cherniak, D.J., 2003, Silicon self-diffusion in single-crystal natural quartz and feldspar:
Earth and Planetary Science Letters, v. 214, p. 655-668.
Cherniak, D.J., and Watson, E.B., 1994, A study of strontium diffusion in plagioclase
using Rutherford backscattering spectroscopy: Geochimica et Cosmochimica
Acta, v. 58, p. 5179-5190.
Cohen, T.H., and Sen, G., 1994, Fractionation and ascent of Deccan Trap magmas; an
experimental study at 6 kilobar pressure, in Subbarao, K.V., ed., Volcanism,
Wiley Eastern Limited, p. 173-186.
Collier, J.S., Minshull, T.A., Kendall, J.M., Whitmarsh, R.B., Ruempker, G., Joseph, P.,
Samson, P., Lane, C.I., Sansom, V., Vermeesch, P.M., Hammond, J., Wookey, J.,
Teanby, N., Ryberg, T.M., and Dean, S.M., 2004, Rapid continental breakup and
microcontinent formation in the western Indian Ocean: Eos, Transactions,
American Geophysical Union, v. 85, p. 481.
Costa, F., Chakraborty, S., and Dohmen, R., 2003, Diffusion coupling between trace and
major elements and a model for calculation of magma residence times using
plagioclase: Geochimica et Cosmochimica Acta, v. 67, p. 2189-2200.
Courtillot, V., Besse, J., Vandamme, D., Montigny, R., Jaeger, J.-J., and Cappetta, H.,
1986, Deccan flood basalts at the Cretaceous/Tertiary boundary?: Earth and
Planetary Science Letters, v. 80, p. 361-374.
Courtillot, V., Feraud, G., Maluski, H., Vandamme, D., Moreau, M.G., and Besse, J.,
1988, Deccan flood basalts and the Cretaceous/Tertiary boundary: Nature, v. 333,
p. 843-846.
137
Courtillot, V., Jaupart, C., Manighetti, I., Tapponnier, P., and Besse, J., 1999, On causal
links between flood basalts and continental breakup: Earth and Planetary Science
Letters, v. 166, p. 177-195.
Courtillot, V.E., and Renne, P.R., 2003, On the ages of flood basalt events: Comptes
Rendus Geosciences, v. 335, p. 113-140.
Cox, K.G., and Hawkesworth, C.J., 1985, Geochemical stratigraphy of the Deccan Traps
at Mahabaleshwar, western Ghats, India, with implications for open system
magmatic processes: Journal of Petrology, v. 26, p. 355-377.
Davidson, J., Tepley, F., III, Palacz, Z., and Meffan-Main, S., 2001, Magma recharge,
contamination and residence times revealed by in situ laser ablation isotopic
analysis of feldspar in volcanic rocks: Earth and Planetary Science Letters, v. 184,
p. 427-442.
DePaolo, D.J., 1981, Trace element and isotopic effects of combined wallrock
assimilation and fractional crystallization: Earth and Planetary Science Letters, v.
53, p. 189-202.
Devey, C.W., and Cox, K.G., 1987, Relationships between crustal contamination and
crystallisation in continental flood basalt magmas with special reference to the
Deccan Traps of the Western Ghats, India: Earth and Planetary Science Letters, v.
84, p. 59-68.
Devey, C.W., and Stephens, W.E., 1991, Tholeiitic dykes in the Seychelles and the
original spatial extent of the Deccan: Journal of the Geological Society of
London, v. 148, p. 979-983.
Duncan, R.A., and Pyle, D.G., 1988, Rapid eruption of the Deccan flood basalts at the
Cretaceous/Tertiary boundary: Nature, v. 333, p. 841-843.
Eldholm, O., and Coffin, M.F., 2000, Large igneous provinces and plate tectonics:
Geophysical Monograph, v. 121, p. 309-326.
Gallet, Y., Weeks, R., Vandamme, D., and Courtillot, V., 1989, Duration of Deccan Trap
volcanism; a statistical approach: Earth and Planetary Science Letters, v. 93, p.
273-282.
Ghiorso, M.S., Hirschmann, M.M., Reiners, P.W., and Kress, V.C., III, 2002, The
pMELTS: A revision of MELTS aimed at improving calculation of phase
relations and major element partitioning involved in partial melting of the mantle
at pressures up to 3 GPa: Geochemistry, Geophysics, Geosystems, v. 3, p. 28.
Ghiorso, M.S., and Sack, R.O., 1995, Chemical mass transfer in magmatic processes; IV,
A revised and internally consistent thermodynamic model for the interpolation
and extrapolation of liquid-solid equilibria in magmatic systems at elevated
138
temperatures and pressures: Contributions to Mineralogy and Petrology, v. 119, p.
197-212.
Giletti, B.J., and Casserly, J.E.D., 1994, Strontium diffusion kinetics in plagioclase
feldspars: Geochimica et Cosmochimica Acta, v. 58, p. 3785-3793.
Goetze, J., Habermann, D., Kempe, U., Neuser, R.D., and Richter, D.K., 1999,
Cathodoluminescence microscopy and spectroscopy of plagioclases from lunar
soil: American Mineralogist, v. 84, p. 1027-1032.
Gwalani, L.G., Rock, N.M.S., Chang, W.J., Fernandez, S., Allegre, C.J., and Prinzhofer,
A., 1993, Alkaline rocks and carbonatites of Amba Dongar and adjacent areas,
Deccan igneous province, Gujarat, India; 1, Geology, petrography and
petrochemistry: Mineralogy and Petrology, v. 47, p. 219-253.
Hart, S.R., Hauri, E.H., Oschmann, L.A., and Whitehead, J.A., 1992, Mantle Plumes and
Entrainment: Isotopic Evidence: Science, v. 256, p. 517-520.
Hess, H.H., 1960, Stillwater igneous complex, Montana--a quantitative mineralogical
study: Memoir - Geological Society of America, p. 230.
Higgins, M.D., 2005, A new interpretation of the structure of the Sept Iles intrusive suite,
Canada: Lithos, v. 83, p. 199-213.
Higgins, M.D., and Chandrasekharam, D., 2007, Nature of Sub-volcanic Magma
Chambers, Deccan Province, India: Evidence from Quantitative Textural Analysis
of Plagioclase Megacrysts in the Giant Plagioclase Basalts: J. Petrology, v. 48, p.
885-900.
Hofmann, C., Feraud, G., and Courtillot, V., 2000, 40
Ar/39
Ar dating of mineral separates
and whole rocks from the Western Ghats lava pile; further constraints on duration
and age of the Deccan Traps: Earth and Planetary Science Letters, v. 180, p. 13-
27.
Hooper, P.R., 1999, The winds of change, the Deccan Traps; a personal perspective:
Memoir - Geological Society of India, v. 43, Part 1, p. 153-165.
Hooper, P.R., Subbarao, K.V., Beane, J.E., and Subbarao, K.V., 1988, The giant
plagioclase basalts (GPBs) of the Western Ghats, Deccan Traps: Memoir -
Geological Society of India, v. 10, p. 135-144.
Huppert, H.E., and Turner, J.S., 1991, Comments on On convective style and vigor in
sheet-like magma chambers by Bruce D. Marsh: Journal of Petrology, v. 32, p.
851-860.
139
Irvine, T.N., 1987, Layering and related structures in the Duke Island and Skaergaard
intrusions; similarities, differences, and origins: NATO ASI Series Series C:
Mathematical and Physical Sciences, v. 196, p. 185-245.
Izbekov, P.E., Eichelberger, J.C., Patino, L.C., Vogel, T.A., and Ivanov, B.V., 2002,
Calcic cores of plagioclase phenocrysts in andesite from Karymsky Volcano;
evidence for rapid introduction by basaltic replenishment: Geology (Boulder), v.
30, p. 799-802.
Jerram, D.A., and Widdowson, M., 2005, The anatomy of continental flood basalt
provinces; geological constraints on the processes and products of flood
volcanism, in Kerr, A.C., England, R.W., and Wignall, P.B., eds., Lithos, Volume
79, p. 385-405.
Karmarkar, B.M., Kulkarni, S.R., Marathe, S.S., Sowani, P.V., and Peshwa, V.V., 1972,
Giant Phenocryst Basalts in the Deccan Trap: Bulletin of Volcanology, v. 35, p.
965-974.
King, S.D., and Anderson, D.L., 1995, An alternative mechanism of flood basalt
formation: Earth and Planetary Science Letters, v. 136, p. 269-279.
Kohut, E., and Nielsen, R.L., 2004, Melt inclusion formation mechanisms and
compositional effects in high-An feldspar and high-Fo olivine in anhydrous mafic
silicate liquids: Contributions to Mineralogy and Petrology, v. 147, p. 684-704.
Krishnamurthy, P., and Cox, K.G., 1977, Picrite basalts and related lavas from the
Deccan Traps of western India: Contributions to Mineralogy and Petrology, v. 62,
p. 53-75.
Krishnamurthy, P., Gopalan, K., and Macdougall, J.D., 2000, Olivine compositions in
picrite basalts and the Deccan volcanic cycles: Journal of Petrology, v. 41, p.
1057-1069.
Larsen, J.F., 2005, Experimental study of plagioclase rim growth around anorthite seed
crystals in rhyodacitic melt: American Mineralogist, v. 90, p. 417-427.
LaTourrette, T., Wasserburg, G.J., and Fahey, A.J., 1996, Self diffusion of Mg, Ca, Ba,
Nd, Yb, Ti, Zr, and U in haplobasaltic melt: Geochimica et Cosmochimica Acta,
v. 60, p. 1329-1340.
Lee, M.R., Parsons, I., Edwards, P.R., Martin, R.W., Coulson, I.M., Edwards, P.R., and
Lee, M.R., 2007, Identification of cathodoluminescence activators in zoned alkali
feldspars by hyperspectral imaging and electron-probe microanalysis: American
Mineralogist, v. 92, p. 243-253.
140
Lightfoot, P.C., and Hawkesworth, C.J., 1988, Origin of Deccan Trap lavas; evidence
from combined trace element and Sr-, Nd- and Pb-isotope studies: Earth and
Planetary Science Letters, v. 91, p. 89-104.
Lightfoot, P.C., Hawkesworth, C.J., Devey, C.W., Rogers, N.W., and van Calsteren,
P.W.C., 1990, Source and differentiation of Deccan Trap lavas; implications of
geochemical and mineral chemical variations: Journal of Petrology, v. 31, p.
1165-1200.
Mahoney, J., Macdougall, J.D., Lugmair, G.W., Murali, A.V., Sankar Das, M., and
Gopalan, K., 1982, Origin of the Deccan Trap flows at Mahabaleshwar inferred
from Nd and Sr isotopic and chemical evidence: Earth and Planetary Science
Letters, v. 60, p. 47-60.
Mahoney, J.J., 1988, Deccan Basalts, in Macdougall, J.D., ed., Continental Flood Basalts,
Kluwer Academic Publishers.
Mahoney, J.J., Sheth, H.C., Chandrasekharam, D., Peng, Z.X., and Anonymous, 2000,
Geochemistry of flood basalts of the Toranmal section, northern Deccan Traps,
India; implications for regional Deccan stratigraphy: Journal of Petrology, v. 41,
p. 1099-1120.
Marsh, B.D., 1988, Crystal capture, sorting, and retention in convecting magma:
Geological Society of America Bulletin, v. 100, p. 1720-1737.
Marsh, B.D., 1989a, Magma chambers: Annual Review of Earth and Planetary Sciences,
v. 17, p. 439-474.
Marsh, B.D., 1989b, On convective style and vigor in sheet-like magma chambers:
Journal of Petrology, v. 30, p. 479-530.
Marsh, B.D., 1996, Solidification fronts and magmatic evolution: Mineralogical
Magazine, v. 60, p. 5-40.
McDonough, W.F., and Sun, S.S., 1995, The composition of the Earth: Chemical
Geology, v. 120, p. 223-253.
Melluso, L., Barbieri, M., and Beccaluva, L., 2004, Chemical evolution, petrogenesis,
and regional chemical correlations of the flood basalt sequence in the central
Deccan Traps, India: Proceedings of the Indian Academy of Sciences: Earth and
Planetary Sciences, v. 113, p. 587-603.
Melluso, L., Mahoney, J.J., and Dallai, L., 2006, Mantle sources and crustal input as
recorded in high-Mg Deccan Traps basalts of Gujarat (India): Lithos, v. 89, p.
259-274.
141
Mora, C.I., and Ramseyer, K., 1992, Cathodoluminescence of coexisting plagioclases,
Boehls Butte anorthosite; CL activators and fluid flow paths: American
Mineralogist, v. 77, p. 1258-1265.
Najafi, S.J., Cox, K.G., Sukheswala, R.N., Subbarao, K.V., and Sukheswala, R.N., 1981,
Geology and geochemistry of the basalt flows (Deccan Traps) of the Mahad-
Mahableshwar section, India: Memoir - Geological Society of India, v. 3, p. 300-
315.
Pande, K., 2002, Age and duration of the Deccan Traps, India; a review of radiometric
and paleomagnetic constraints: Proceedings of the Indian Academy of Sciences:
Earth and Planetary Sciences, v. 111, p. 115-123.
Panjasawatwong, Y., Danyushevsky, L.V., Crawford, A.J., and Harris, K.L., 1995, An
experimental study of the effects of melt composition on plagioclase; melt
equilibria at 5 and 10 kbar; implications for the origin of magmatic high-An
plagioclase: Contributions to Mineralogy and Petrology, v. 118, p. 420-432.
Peng, Z.X., Mahoney, J., Hooper, P., Harris, C., and Beane, J., 1994, A role for lower
continental crust in flood basalt genesis? Isotopic and incompatible element study
of the lower six formations of the western Deccan Traps: Geochimica et
Cosmochimica Acta, v. 58, p. 267-288.
Peng, Z.X., Mahoney, J.J., Hooper, P.R., Macdougall, J.D., and Krishnamurthy, P., 1998,
Basalts of the northeastern Deccan Traps, India; isotopic and elemental
geochemistry and relation to southwestern Deccan stratigraphy: Journal of
Geophysical Research, B, Solid Earth and Planets, v. 103, p. 29,843-29,865.
Ramos, F.C., Wolff, J.A., and Tollstrup, D.L., 2005, Sr isotope disequilibrium in
Columbia River flood basalts; evidence for rapid shallow-level open-system
processes: Geology (Boulder), v. 33, p. 457-460.
Rampino, M.R., and Stothers, R.B., 1988, Flood Basalt Volcanism During the Past 250
Million Years: Science, v. 241, p. 663-668.
Ravizza, G., and Peucker-Ehrenbrink, B., 2003, Chemostratigraphic evidence of Deccan
volcanism from the marine osmium isotope record: Science, v. 302, p. 1392-1395.
Richards, M.A., Duncan, R.A., and Courtillot, V.E., 1989, Flood basalts and hot-spot
tracks; plume heads and tails: Science, v. 246, p. 103-107.
Sano, T., Fujii, T., Deshmukh, S.S., Fukuoka, T., and Aramaki, S., 2001, Differentiation
processes of Deccan Trap basalts; contribution from geochemistry and
experimental petrology: Journal of Petrology, v. 42, p. 2175-2195.
142
Self, S., Blake, S., Sharma, K., Widdowson, M., and Sephton, S., 2008, Sulfur and
Chlorine in Late Cretaceous Deccan Magmas and Eruptive Gas Release: Science,
v. 319, p. 1654-1657.
Self, S., Widdowson, M., Thordarson, T., and Jay, A.E., 2006, Volatile fluxes during
flood basalt eruptions and potential effects on the global environment: A Deccan
perspective: Earth and Planetary Science Letters, v. 248, p. 518-532.
Sen, G., 1986, Mineralogy and petrogenesis of the Deccan Trap lava flows around
Mahabaleshwar, India: Journal of Petrology, v. 27, p. 627-663.
Sen, G., 1995, A simple petrologic model for the generation of Deccan Trap magmas:
International Geology Review, v. 37, p. 825-850.
Sen, G., 2001, Generation of Deccan Trap magmas: Proceedings of the Indian Academy
of Sciences: Earth and Planetary Sciences, v. 110, p. 409-431.
Sen, G., Borges, M., and Marsh, B.D., 2006, A case for short duration of Deccan Trap
eruption: Eos, Transactions, American Geophysical Union, v. 87, p. 197.
Sheth, H.C., Pande, K., and Bhutani, R., 2001, 40
Ar/39
Ar ages of Bombay trachytes;
evidence for a Palaeocene phase of Deccan volcanism: Geophysical Research
Letters, v. 28, p. 3513-3516.
Simonetti, A., Bell, K., and Viladkar, S.G., 1995, Isotopic data from the Amba Dongar
carbonatite complex, west-central India; evidence for an enriched mantle source:
Chemical Geology, v. 122, p. 185-198.
Simonetti, A., Goldstein, S.L., Schmidberger, S.S., and Viladkar, S.G., 1998,
Geochemical and Nd, Pb, and Sr isotope data from Deccan alkaline complexes;
inferences for mantle sources and plume; lithosphere interaction: Journal of
Petrology, v. 39, p. 1847-1864.
Smith, J.V., 1974, Feldspar Minerals; 1, Crystal Structure and Physical Properties,
Springer-Verlag.
Subbarao, K.V., Bodas, M.S., Hooper, P.R., Walsh, J.N., and Subbarao, K.V., 1988,
Petrogenesis of Jawhar and Igatpuri formations, western Deccan basalt province:
Memoir - Geological Society of India, v. 10, p. 253-280.
Sun, S.S., 1980, Lead isotopic study of young volcanic rocks from mid-ocean ridges,
ocean islands and island arcs: Philosophical Transactions of the Royal Society of
London, Series A: Mathematical and Physical Sciences, v. 297, p. 409-445.
Sun, S.S., and McDonough, W.F., 1989, Chemical and isotopic systematics of oceanic
basalts; implications for mantle composition and processes: Geological Society
Special Publications, v. 42, p. 313-345.
143
Tepley, F.J., III, and Davidson, J.P., 2003, Mineral-scale Sr-isotope constraints on
magma evolution and chamber dynamics in the Rum layered intrusion, Scotland:
Contributions to Mineralogy and Petrology, v. 145, p. 628-641.
Tepley, F.J., III, Davidson, J.P., and Clynne, M.A., 1997, Magma interactions at Chaos
Crags, Lassen Volcanic National Park, California: LPI Contribution, v. 921, p.
205.
Tepley, F.J., III, Davidson, J.P., Tilling, R.I., and Arth, J.G., 2000, Magma mixing,
recharge and eruption histories recorded in plagioclase phenocrysts from El
Chichon Volcano, Mexico: Journal of Petrology, v. 41, p. 1397-1411.
Thordarson, T., and Self, S., 1993, The Laki (Skaftar Fires) and Grimsvotn eruptions in
1783-1785: Bulletin of Volcanology, v. 55, p. 233-263.
Vandamme, D., Courtillot, V., Besse, J., and Montigny, R., 1991, Paleomagnetism and
age determinations of the Deccan Traps (India); results of a Nagpur-Bombay
traverse and review of earlier work: Reviews of Geophysics, v. 29, p. 159-190.
Viladkar, S.G., 1981, The carbonatites of Amba Dongar, Gujarat, India: Bulletin of the
Geological Society of Finland, v. 53, p. 17-28.
Walker, R.J., Morgan, J.W., and Horan, M.F., 1995, Osmium-187 Enrichment in Some
Plumes: Evidence for Core-Mantle Interaction?: Science, v. 269, p. 819-822.
Widdowson, M., Pringle, M.S., and Fernandez, O.A., 2000, A post K-T boundary (early
Palaeocene) age for Deccan-type feeder dykes, Goa, India: Journal of Petrology,
v. 41, p. 1177-1194.
Zellmer, G.F., Blake, S., Vance, D., Hawkesworth, C., and Turner, S., 1999, Plagioclase
residence times at two island arc volcanoes (Kameni Islands, Santorini, and
Soufriere, St. Vincent) determined by Sr diffusion systematics: Contributions to
Mineralogy and Petrology, v. 136, p. 345-357.
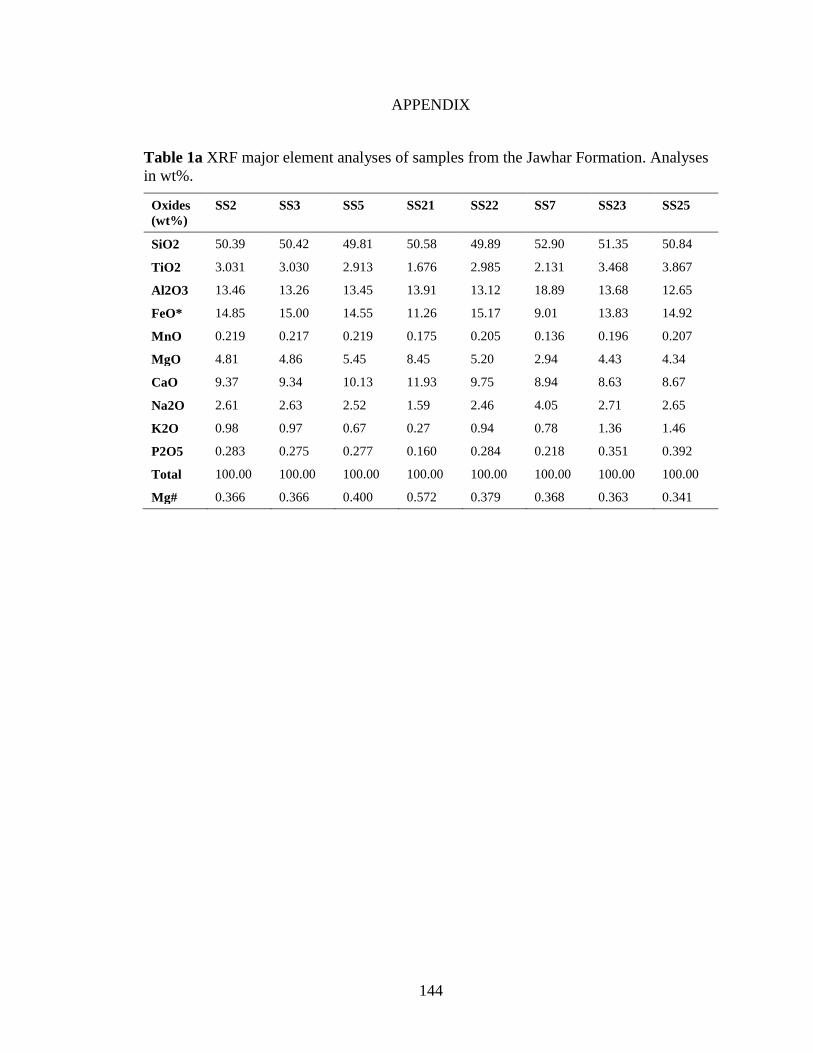
144
APPENDIX
Table 1a XRF major element analyses of samples from the Jawhar Formation. Analyses
in wt%.
Oxides
(wt%)
SS2 SS3 SS5 SS21 SS22 SS7 SS23 SS25
SiO2 50.39 50.42 49.81 50.58 49.89 52.90 51.35 50.84
TiO2 3.031 3.030 2.913 1.676 2.985 2.131 3.468 3.867
Al2O3 13.46 13.26 13.45 13.91 13.12 18.89 13.68 12.65
FeO* 14.85 15.00 14.55 11.26 15.17 9.01 13.83 14.92
MnO 0.219 0.217 0.219 0.175 0.205 0.136 0.196 0.207
MgO 4.81 4.86 5.45 8.45 5.20 2.94 4.43 4.34
CaO 9.37 9.34 10.13 11.93 9.75 8.94 8.63 8.67
Na2O 2.61 2.63 2.52 1.59 2.46 4.05 2.71 2.65
K2O 0.98 0.97 0.67 0.27 0.94 0.78 1.36 1.46
P2O5 0.283 0.275 0.277 0.160 0.284 0.218 0.351 0.392
Total 100.00 100.00 100.00 100.00 100.00 100.00 100.00 100.00
Mg# 0.366 0.366 0.400 0.572 0.379 0.368 0.363 0.341
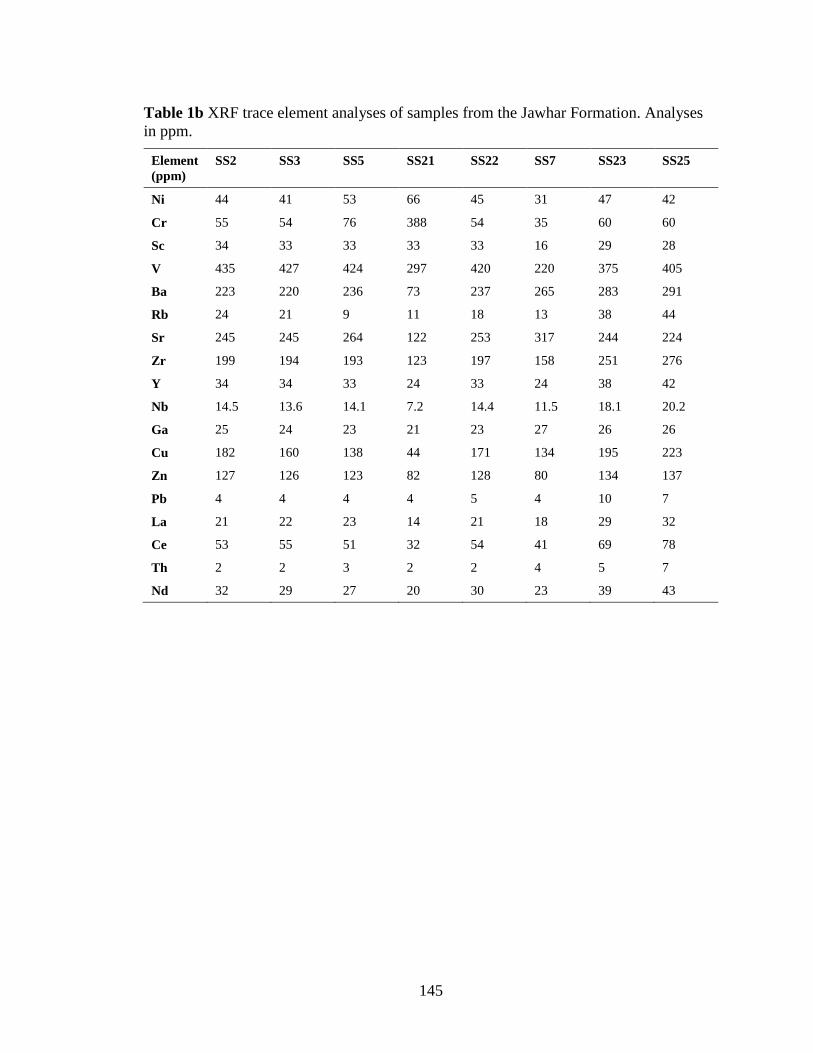
145
Table 1b XRF trace element analyses of samples from the Jawhar Formation. Analyses
in ppm.
Element
(ppm)
SS2 SS3 SS5 SS21 SS22 SS7 SS23 SS25
Ni 44 41 53 66 45 31 47 42
Cr 55 54 76 388 54 35 60 60
Sc 34 33 33 33 33 16 29 28
V 435 427 424 297 420 220 375 405
Ba 223 220 236 73 237 265 283 291
Rb 24 21 9 11 18 13 38 44
Sr 245 245 264 122 253 317 244 224
Zr 199 194 193 123 197 158 251 276
Y 34 34 33 24 33 24 38 42
Nb 14.5 13.6 14.1 7.2 14.4 11.5 18.1 20.2
Ga 25 24 23 21 23 27 26 26
Cu 182 160 138 44 171 134 195 223
Zn 127 126 123 82 128 80 134 137
Pb 4 4 4 4 5 4 10 7
La 21 22 23 14 21 18 29 32
Ce 53 55 51 32 54 41 69 78
Th 2 2 3 2 2 4 5 7
Nd 32 29 27 20 30 23 39 43
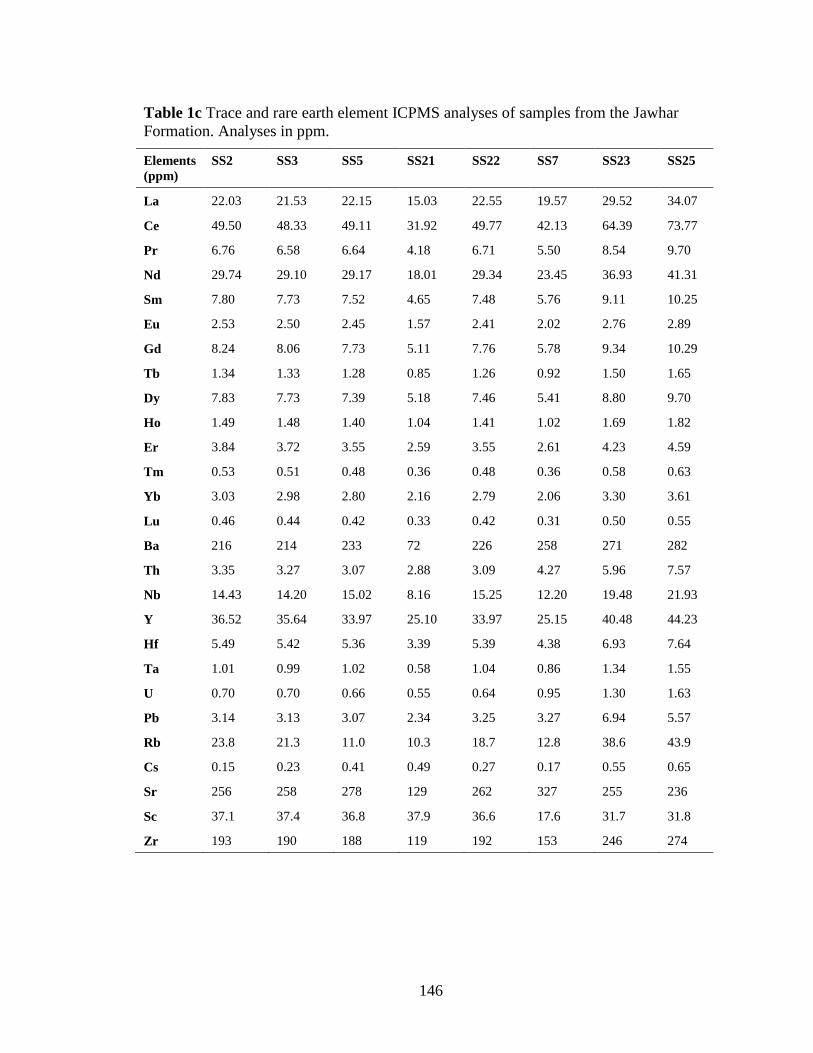
146
Table 1c Trace and rare earth element ICPMS analyses of samples from the Jawhar
Formation. Analyses in ppm.
Elements
(ppm)
SS2 SS3 SS5 SS21 SS22 SS7 SS23 SS25
La 22.03 21.53 22.15 15.03 22.55 19.57 29.52 34.07
Ce 49.50 48.33 49.11 31.92 49.77 42.13 64.39 73.77
Pr 6.76 6.58 6.64 4.18 6.71 5.50 8.54 9.70
Nd 29.74 29.10 29.17 18.01 29.34 23.45 36.93 41.31
Sm 7.80 7.73 7.52 4.65 7.48 5.76 9.11 10.25
Eu 2.53 2.50 2.45 1.57 2.41 2.02 2.76 2.89
Gd 8.24 8.06 7.73 5.11 7.76 5.78 9.34 10.29
Tb 1.34 1.33 1.28 0.85 1.26 0.92 1.50 1.65
Dy 7.83 7.73 7.39 5.18 7.46 5.41 8.80 9.70
Ho 1.49 1.48 1.40 1.04 1.41 1.02 1.69 1.82
Er 3.84 3.72 3.55 2.59 3.55 2.61 4.23 4.59
Tm 0.53 0.51 0.48 0.36 0.48 0.36 0.58 0.63
Yb 3.03 2.98 2.80 2.16 2.79 2.06 3.30 3.61
Lu 0.46 0.44 0.42 0.33 0.42 0.31 0.50 0.55
Ba 216 214 233 72 226 258 271 282
Th 3.35 3.27 3.07 2.88 3.09 4.27 5.96 7.57
Nb 14.43 14.20 15.02 8.16 15.25 12.20 19.48 21.93
Y 36.52 35.64 33.97 25.10 33.97 25.15 40.48 44.23
Hf 5.49 5.42 5.36 3.39 5.39 4.38 6.93 7.64
Ta 1.01 0.99 1.02 0.58 1.04 0.86 1.34 1.55
U 0.70 0.70 0.66 0.55 0.64 0.95 1.30 1.63
Pb 3.14 3.13 3.07 2.34 3.25 3.27 6.94 5.57
Rb 23.8 21.3 11.0 10.3 18.7 12.8 38.6 43.9
Cs 0.15 0.23 0.41 0.49 0.27 0.17 0.55 0.65
Sr 256 258 278 129 262 327 255 236
Sc 37.1 37.4 36.8 37.9 36.6 17.6 31.7 31.8
Zr 193 190 188 119 192 153 246 274
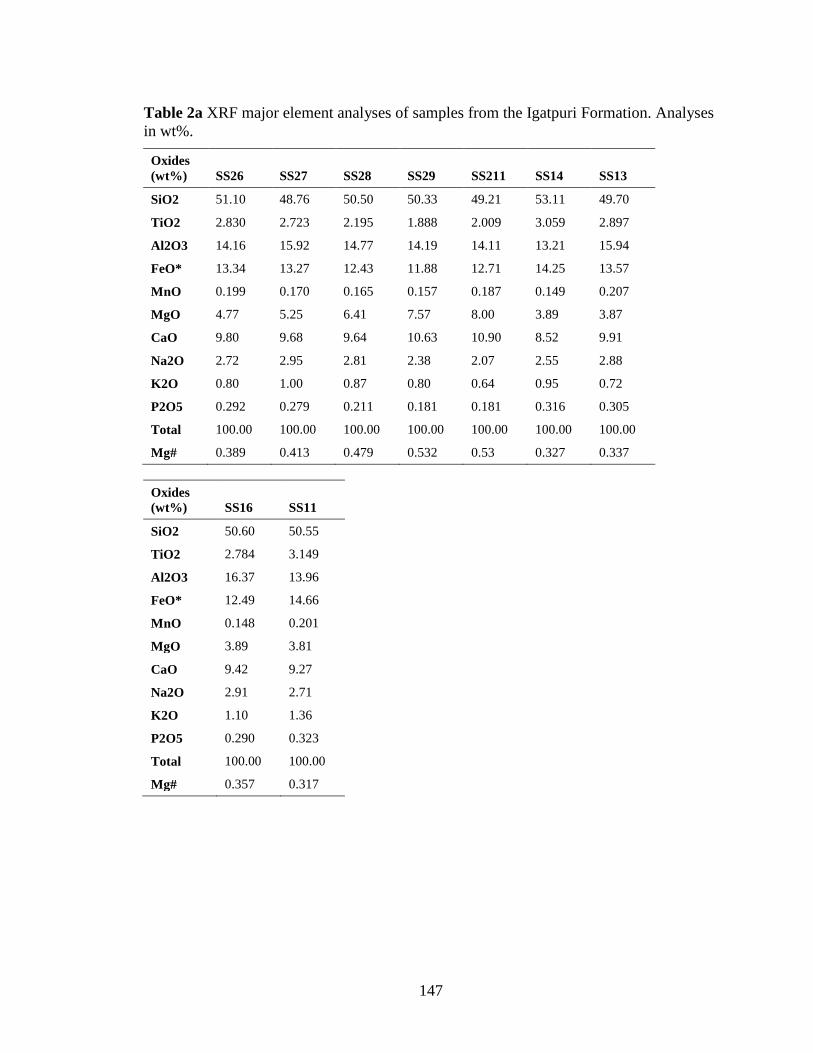
147
Table 2a XRF major element analyses of samples from the Igatpuri Formation. Analyses
in wt%.
Oxides
(wt%) SS26 SS27 SS28 SS29 SS211 SS14 SS13
SiO2 51.10 48.76 50.50 50.33 49.21 53.11 49.70
TiO2 2.830 2.723 2.195 1.888 2.009 3.059 2.897
Al2O3 14.16 15.92 14.77 14.19 14.11 13.21 15.94
FeO* 13.34 13.27 12.43 11.88 12.71 14.25 13.57
MnO 0.199 0.170 0.165 0.157 0.187 0.149 0.207
MgO 4.77 5.25 6.41 7.57 8.00 3.89 3.87
CaO 9.80 9.68 9.64 10.63 10.90 8.52 9.91
Na2O 2.72 2.95 2.81 2.38 2.07 2.55 2.88
K2O 0.80 1.00 0.87 0.80 0.64 0.95 0.72
P2O5 0.292 0.279 0.211 0.181 0.181 0.316 0.305
Total 100.00 100.00 100.00 100.00 100.00 100.00 100.00
Mg# 0.389 0.413 0.479 0.532 0.53 0.327 0.337
Oxides
(wt%) SS16 SS11
SiO2 50.60 50.55
TiO2 2.784 3.149
Al2O3 16.37 13.96
FeO* 12.49 14.66
MnO 0.148 0.201
MgO 3.89 3.81
CaO 9.42 9.27
Na2O 2.91 2.71
K2O 1.10 1.36
P2O5 0.290 0.323
Total 100.00 100.00
Mg# 0.357 0.317
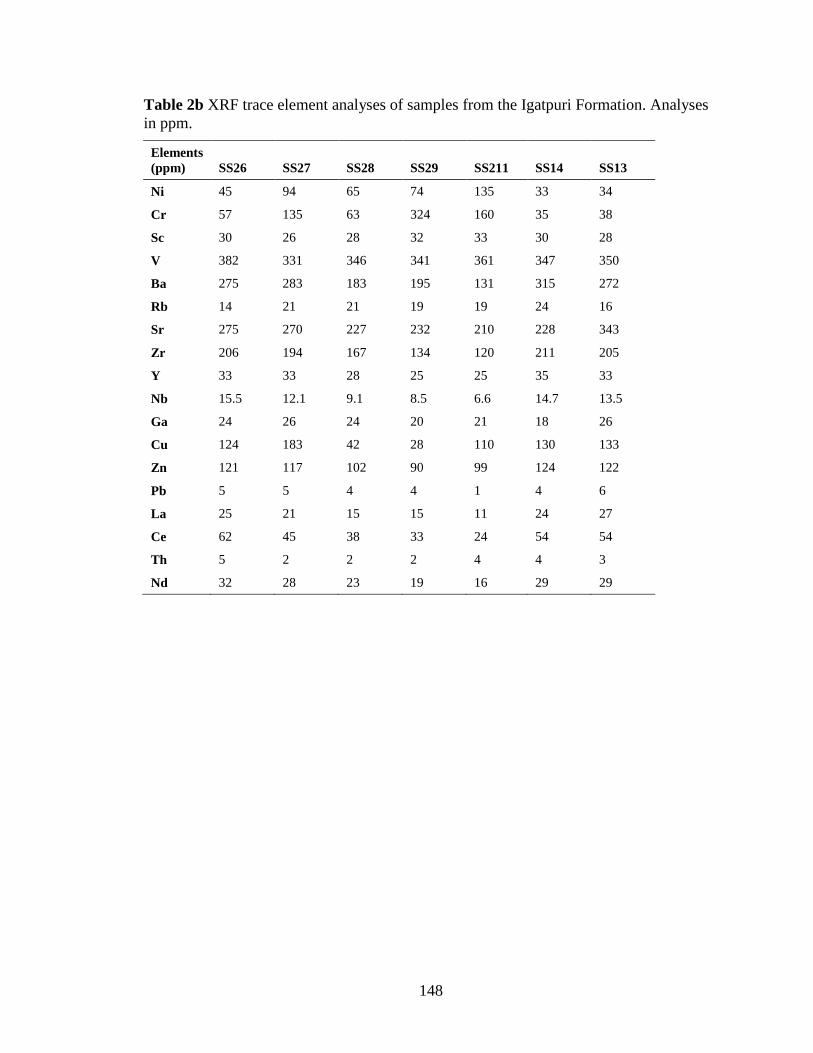
148
Table 2b XRF trace element analyses of samples from the Igatpuri Formation. Analyses
in ppm.
Elements
(ppm) SS26 SS27 SS28 SS29 SS211 SS14 SS13
Ni 45 94 65 74 135 33 34
Cr 57 135 63 324 160 35 38
Sc 30 26 28 32 33 30 28
V 382 331 346 341 361 347 350
Ba 275 283 183 195 131 315 272
Rb 14 21 21 19 19 24 16
Sr 275 270 227 232 210 228 343
Zr 206 194 167 134 120 211 205
Y 33 33 28 25 25 35 33
Nb 15.5 12.1 9.1 8.5 6.6 14.7 13.5
Ga 24 26 24 20 21 18 26
Cu 124 183 42 28 110 130 133
Zn 121 117 102 90 99 124 122
Pb 5 5 4 4 1 4 6
La 25 21 15 15 11 24 27
Ce 62 45 38 33 24 54 54
Th 5 2 2 2 4 4 3
Nd 32 28 23 19 16 29 29
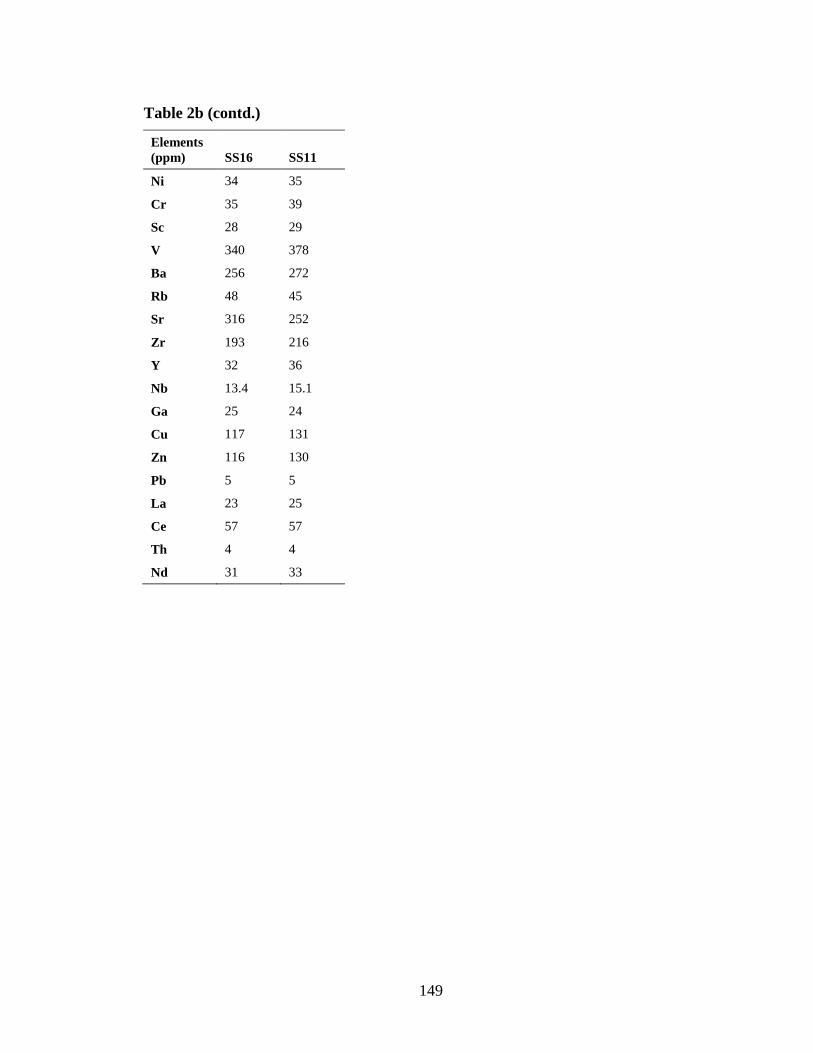
149
Table 2b (contd.)
Elements
(ppm) SS16 SS11
Ni 34 35
Cr 35 39
Sc 28 29
V 340 378
Ba 256 272
Rb 48 45
Sr 316 252
Zr 193 216
Y 32 36
Nb 13.4 15.1
Ga 25 24
Cu 117 131
Zn 116 130
Pb 5 5
La 23 25
Ce 57 57
Th 4 4
Nd 31 33
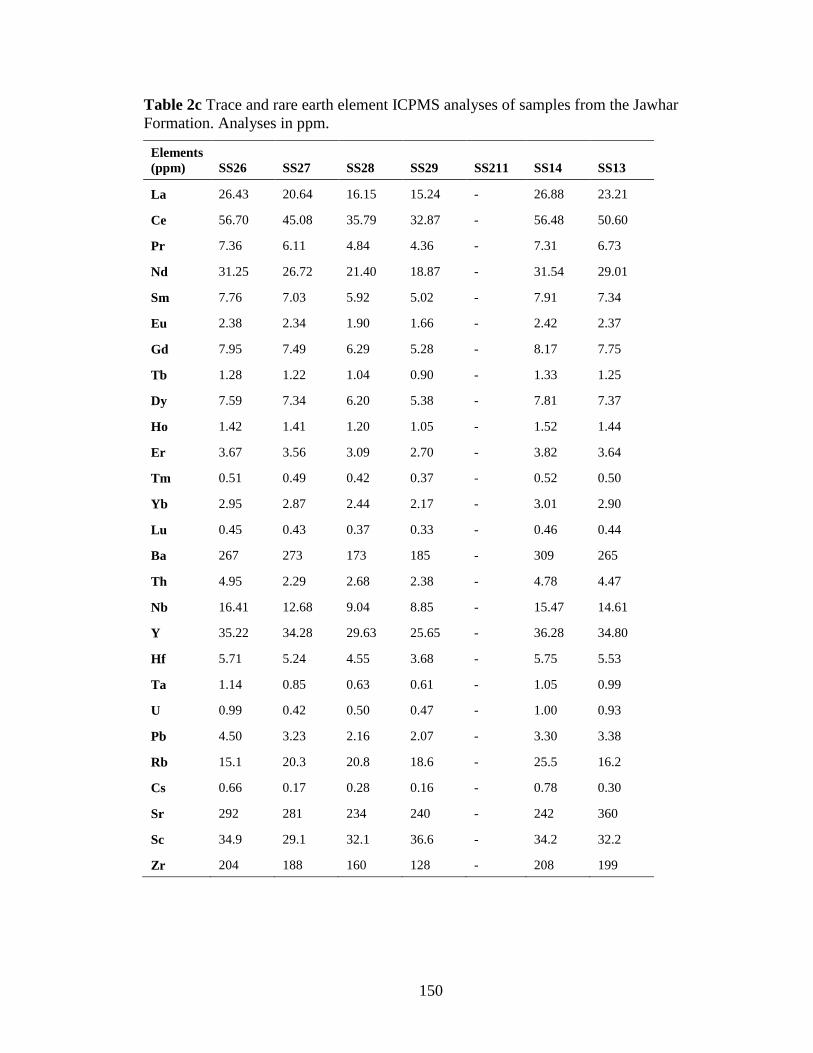
150
Table 2c Trace and rare earth element ICPMS analyses of samples from the Jawhar
Formation. Analyses in ppm.
Elements
(ppm) SS26 SS27 SS28 SS29 SS211 SS14 SS13
La 26.43 20.64 16.15 15.24 - 26.88 23.21
Ce 56.70 45.08 35.79 32.87 - 56.48 50.60
Pr 7.36 6.11 4.84 4.36 - 7.31 6.73
Nd 31.25 26.72 21.40 18.87 - 31.54 29.01
Sm 7.76 7.03 5.92 5.02 - 7.91 7.34
Eu 2.38 2.34 1.90 1.66 - 2.42 2.37
Gd 7.95 7.49 6.29 5.28 - 8.17 7.75
Tb 1.28 1.22 1.04 0.90 - 1.33 1.25
Dy 7.59 7.34 6.20 5.38 - 7.81 7.37
Ho 1.42 1.41 1.20 1.05 - 1.52 1.44
Er 3.67 3.56 3.09 2.70 - 3.82 3.64
Tm 0.51 0.49 0.42 0.37 - 0.52 0.50
Yb 2.95 2.87 2.44 2.17 - 3.01 2.90
Lu 0.45 0.43 0.37 0.33 - 0.46 0.44
Ba 267 273 173 185 - 309 265
Th 4.95 2.29 2.68 2.38 - 4.78 4.47
Nb 16.41 12.68 9.04 8.85 - 15.47 14.61
Y 35.22 34.28 29.63 25.65 - 36.28 34.80
Hf 5.71 5.24 4.55 3.68 - 5.75 5.53
Ta 1.14 0.85 0.63 0.61 - 1.05 0.99
U 0.99 0.42 0.50 0.47 - 1.00 0.93
Pb 4.50 3.23 2.16 2.07 - 3.30 3.38
Rb 15.1 20.3 20.8 18.6 - 25.5 16.2
Cs 0.66 0.17 0.28 0.16 - 0.78 0.30
Sr 292 281 234 240 - 242 360
Sc 34.9 29.1 32.1 36.6 - 34.2 32.2
Zr 204 188 160 128 - 208 199
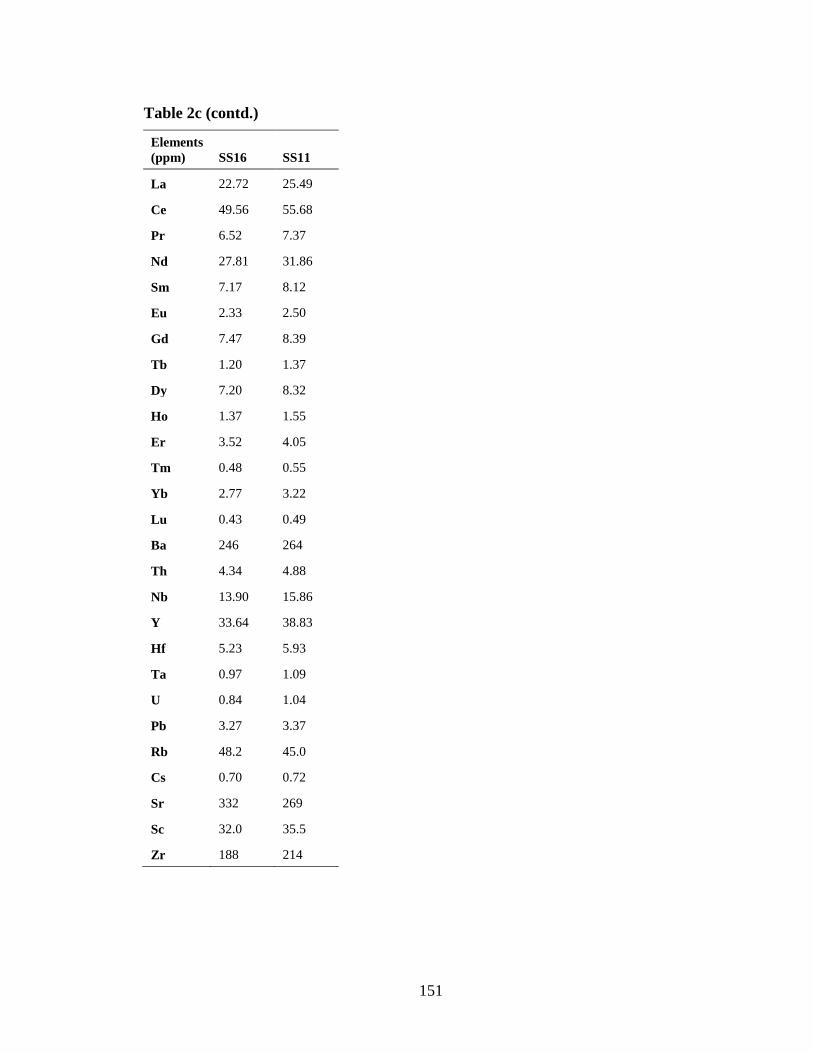
151
Table 2c (contd.)
Elements
(ppm) SS16 SS11
La 22.72 25.49
Ce 49.56 55.68
Pr 6.52 7.37
Nd 27.81 31.86
Sm 7.17 8.12
Eu 2.33 2.50
Gd 7.47 8.39
Tb 1.20 1.37
Dy 7.20 8.32
Ho 1.37 1.55
Er 3.52 4.05
Tm 0.48 0.55
Yb 2.77 3.22
Lu 0.43 0.49
Ba 246 264
Th 4.34 4.88
Nb 13.90 15.86
Y 33.64 38.83
Hf 5.23 5.93
Ta 0.97 1.09
U 0.84 1.04
Pb 3.27 3.37
Rb 48.2 45.0
Cs 0.70 0.72
Sr 332 269
Sc 32.0 35.5
Zr 188 214
152
VITA
MELROY R. BORGES
October 1, 1975 Born, Mumbai, India
May 1997 BSc. St. Xavier’s College, University of Mumbai
1998-1999 Instructor, Gemological Institute of India, Mumbai
May 1999 MSc. St. Xavier’s College, University of Mumbai
1999-2001 Teaching Assistant, University of Michigan, Ann Arbor,
Research Assistant, University of Michigan, Ann Arbor
August 2001 MS. University of Michigan, Ann Arbor
2004-2005 Teaching Assistant, Florida International University,
Miami
AWARDS
2000 Turner Research Award, University of Michigan, Ann
Arbor
2002-2005 Presidential Fellowship, FIU, Miami
2007 Dissertation Year Fellowship, FIU, Miami
PUBLICATIONS
Borges, M.; Sen, G.; Hart, G.; Wolff, J. (2008), Application of single crystal Sr isotope
diffusion modeling to determine timescales of flood basalt eruptions, EGU
General Assembly 2008 (invited), Abstract EGU2008-A-00864.
Borges M R, Sen G, Hart G L, Wolff J A (2007), Sr Isotope Zoning in Plagioclase
Phenocrysts from Giant Plagioclase Basalts: Mixing Processes in the Oldest
Deccan Formations, Eos Trans. AGU, 88(52), Fall Meet. Suppl., Abstract V11B-
0589.
Borges M R, Sen G, Hart G L, Wolff J A (2006), Crystal Zoning in Deccan Giant
Plagioclase Basalts: Implications for a Short Duration of Deccan Trap Eruption,
Eos Trans. AGU, 87(52), Fall Meet. Suppl., Abstract V51B-1677.
153
Gautam Sen, Melroy Borges, and Bruce D. Marsh, A case for short duration of Deccan
Trap eruption Eos, Transactions, American Geophysical Union (May 2006),
87(20):197, 200
Hall, C.M., Kesler, S.E., Russell, N., Piñero, E., Sanchez C., R., Perez R., M., Moreira, J.
and Borges, M., 2004, Age and tectonic setting of the Camagüey volcanic-
intrusive arc, Cuba: Late Cretaceous extension and uplift in the western
Caribbean: Journal of Geology, v. 112, p. 521-542.
Borges M, Zhang Y, Essene E., 2002, New calibrations of Garnet-Clinopyroxene
thermobarometers.; Eos Trans. AGU, 83(47), Fall Meet. Suppl., Abstract V51B-
1252.


