Embed Size (px)
Citation preview

P1.35 LIGHTNING CASUALTIES AND THEIR PROXIMITY TO SURROUNDING CLOUD-TO-GROUND LIGHTNING
Megan M. Lengyel*, H. E. Brooks^, R.L. Holle$, and M.A. Cooper%
*University of Oklahoma School of Meteorology ^ National Severe Storms Laboratory, Norman, OK
$Holle Meteorology and Photography, Oro Valley, AZ % Departments of Bioengineering and Emergency Medicine
University of Illinois at Chicago, Chicago, IL
1. INTRODUCTION
Every year, hundreds of people are injured or killed by cloud-to-ground (CG) lightning in the United States. Lightning occurs somewhere in the US on every day during the summer and on almost every other day during the rest of the year (Holle et al. 1999). The National Weather Service has a well-defined system of watches and warning for many convective weather hazards including hurricanes, tornadoes, floods and flash floods. However, the combination of the high frequency and resulting unpredictability of lightning flashes to the ground during all times of the year makes it much more difficult to warn the public of potential lightning danger. This arguably makes lightning the most frequent and dangerous convective weather hazard threatening the general public (Holle et al. 1999). However, in the 1990s, the total number of lightning deaths per years has decreased compared to the early part of the lightning fatality records. In fact, according to Lengyel (2004), annual lightning deaths have decreased and stabilized to around 72 deaths per year since 1992 in comparison to previous totals averaging around 100 deaths per year from 1959-1991.
All detected CG flashes are located by this National Lightning Detection Network (NLDN). With this type of location and time specific data available for most CG lightning flashes, it is now possible to evaluate the pattern of CG lightning flashes that surrounded a lightning casualty before, during and after their injury or death.
With the CG flash information provided by the NLDN, the CG lightning risk facing lightning victims near the time of their injury or death will be determined relative to the overall distribution of lightning flashes to the ground. The CG lightning surrounding the victim will be quantified to establish specifically if the lightning casualty had little or no warning of imminent CG flash danger or if the victim used poor judgment by not heeding previous CG lightning flashes as warning of an approaching storm. A victim who had little or no warning may have been struck at the beginning of an approaching storm, struck by the first CG flash out of a newly developing storm, or struck by a single isolated flash or bolt from the blue. A person who used poor judgment was struck at a time or place at which application of the current NOAA guidelines or with flashes occurring within a 10 km radius (i.e. 30-30 rule), would have dictated that the victim should have already
sought shelter or left the appropriate shelter before the threat of CG lightning had passed.
Holle et al. (1993) found that victims tended to be struck by lightning about the same number of times before, during, and after the time of maximum CG lightning frequency. The authors recommended that a more thorough investigation, with more precise locations and times of occurrences of lightning casualties, be undertaken. The present work is intended to address that recommendation by means of a victim-centric study. It is a similar, yet more inclusive study, using lightning casualties in the contiguous United States for 8 years of available NLDN data from 1995-2002 and casualty reports recorded in Storm Data (SD). Lightning casualty cases will be subjectively categorized into two populations: victims that had little or no warning or victims that used poor judgment. A further examination will establish an objective classification between the two populations and further characterize the populations by time of year of occurrence, total number of associated CG flashes surrounding the victim, and the victims regional location.
2. SELECTION OF LIGHTNING CASUALTY CASES FROM STORM DATA
SD has been recording lightning deaths and injuries since 1959. There have been tens of thousands of lightning casualties recorded in SD since then. It is highly improbable that the time and location of the each incident was recorded accurately. Further, not every casualty can be tied unambiguously to a CG flash identified in the NLDN data base based on the location and time reported within SD when matched to the NLDN data. To have meaningful and consistent results, a set of criteria was established for a lightning casualty case to meet in order to be included in this study.
The NLDN has been upgraded several times since its inception, but the most consistent lightning data for the contiguous United States are those recorded since January of 1995. Thus, this study focuses on all lightning casualties recorded in SD between 1995-2002. Every lightning casualty from January 1995 until December 2002 was investigated further to see what types of details surrounding the individual s lightning strike incident was available within the SD storm report. If multiple casualties occurred within a single storm report, it was considered as only one lightning incident case. SD had on record 1,658 separate lightning strike

casualty reports that included a total of 410 fatalities and 2631 injuries.
Each storm report in SD has the following information included: date, local standard time, county, state, location, type of casualty, and a narrative description. To narrow down casualty cases, the location of the incident had to be very clearly stated. For example, a specific golf course, school, park, intersection or street address had to be specified in either the location or narrative section of the storm report. Secondly, the recorded time of the event was examined for validity. Any event that did not have a specific location described within the storm report could not be used in this study. If an event is recorded as occurring on the hour, it is likely that the actual time of the incident was unknown and probably occurred before the recorded time in the storm report (Holle et al. 1993). Unless the location of the incident could be traced to an actual street address or intersection, lightning casualty reports with ambiguous times recorded were thrown out. These first qualifications for the lightning casualty reports were met by 411 separate lightning casualties over the 8 year period from 1995-2002.
3. IDENTIFYING THE LIGHTNING FLASH ASSOCIATED WITH EACH CASUALTY INCIDENCE
The initial task of this study was identification of the CG lightning flashes associated with each casualty. The 30-30 rule would suggest that lightning flashes within a 10 km grid centered on the location of the casualty within 30-minutes around the time of occurrence should characterize the situation for the casualty reasonable well. Since the times reported are not typically accurate to the minute, a time window of one hour previous to one hour following the recorded time of the lightning casualty was used. Similarly, a 50 km grid around the lightning victim was used to inspect the injurious storm visually as it approached and retreated from the victim.
The NLDN database has specific information pertaining to each flash recorded including date, time, latitude, and longitude. The locations of lightning casualties were converted into latitude and longitude to the nearest 0.001 (100 meters). Any cloud-to-ground lightning flash that occurred within a radius of 50 km of the casualty s location within one hour before or after the time of the casualty was included in the initial analysis of the CG lightning flashes surrounding each lightning victim.
The flashes that fall within this spatial and temporal window are at worst the minimum number of flashes that characterize the situation at the time and place of the casualty. The NLDN does not include any information about flashes that do not make it to the ground. Although cloud flashes might have provided added lead time for a victim to take shelter previous to their injury, there is no way to quantify the scope of these types of flashes within this study since there are no total lightning flash data currently available for the contiguous US (Murphy et al. 2005). Therefore, the NLDN data provide the minimum estimate of the amount
of information available to the victim previous to the incident. Further, since the detection efficiency for the contiguous United Sates of the NLDN is over 90%, some CG flashes are missed by the network and therefore are not available for use in the analysis of the CG flashes surrounding each lightning victim.
4. ASSESSMENT OF THE CG FLASHES ASSOCIATED WITH EACH LIGHTNING CASUALTY
There were 411 lightning casualty cases that met the criteria for further study. For each case, the distance (km) away vs. time (s) away from the location and time of the casualty report in SD was plotted. Each plot was individually analyzed to determine the actual CG flash that injured the victim based on the location and time information reported. Each case was categorized according to subjective confidence level at which the injurious lightning flash could be identified. These subjective confidence levels were high, medium, low, or no confidence.
In high confidence cases, there is little uncertainty in identification and resulting outcome of the flash responsible for the casualty. This means that the lightning flash from the NLDN database matched perfectly with the location and/or the time of the reported event. The location associated with each case was also examined in high confidence cases. If a location could be pinpointed at a street level resolution, then certain cases with imprecisely stated times were still placed in the high confidence category (Fig 1). Typically, if a time listed in the storm report was specific, the data were accepted as reasonable for identifying the injurious flash (Fig. 2). Other cases in the high confidence category included those for which the frequency of cloud-to-ground flashes was so high that picking the exact lightning flash would have been impossible to do considering the density of the lightning flashes around the victim (Fig. 3). As stated earlier, these could be considered as high confidence cases since the choosing of one lightning flash over another would not affect the outcome for determining the extent of the CG lightning risk approaching the lightning victim.
For the final statistical analysis, 107 high confidence cases were used to characterize the CG lightning risk in which the victim was immersed leading up to the time of their injury. Only these cases were used in the data analysis.

-3600 -3000 -2400 -1800 -1200 -600 0 600 1200 1800 2400 3000 3600
T im e (s)
0
10
20
30
40
50D
ista
nce
(km
)
Figure 1. High confidence case on July 14, 1996 at 200 UTC in the Geauga Lake Amusement Park parking lot located in Portage County, Ohio. Time (s) away from the casualty report is on the horizontal axis with time increasing to the right. The distance away from the victim in kilometers is listed on the vertical axis. Note that the origin represents the time and location as reported by SD. This a case where the time was not very specific but the location could be narrowed to a street level resolution such that the actual injurious flash could be singled out from the other surrounding flashes.
-3600 -3000 -2400 -1800 -1200 -600 0 600 1200 1800 2400 3000 3600
T im e (s )
0
10
20
30
40
50
Dis
tanc
e (k
m)
Figure 2. The CG lightning flashes associated with the high confidence case occurring on February 22, 1995 at 0003 UTC at Phoenix Sky Harbor Airport in Maricopa County, Arizona, and an example of a high confidence case in which the location could not be narrowed to street level resolution but the time of the incident was so specific and unambiguous that the actual lightning flash could be picked out from the other surrounding
flashes. Figure 3. High confidence case on September 7, 1998 at 400 UTC at the Golden Hill State Park in Niagara County, New York. This is a case where the choosing of one lightning flash over another will not affect the outcome of the whether or not a victim is classified as having sufficient warning or not of imminent CG flash danger. It is an example of a very unspecific time report but near street level resolution locale report.
5. OVERVIEW OF THE HIGH CONFIDENCE LIGHTNING CASUALTY CASES
There were 107 casualty cases out of 1,658 in SD that had enough specific and correct information recorded in the storm report to support reliable conclusions in this study. These 107 cases incorporate 230 total casualties including 35 deaths and 195 injuries. Each case was re-centered in order to place the chosen injurious flash at the origin. Every CG flash associated with the lightning strike incident was plotted using a smaller temporal and spatial grid of 35 minutes and 20 km surrounding the injurious flash. This spatial and temporal grid gave a closer look at the CG flashes each victim may or may not have had as warning that lightning danger was approaching.
The plots of all the CG lightning surrounding the victim near the time of their injury or death were used to determine whether or not each case had little or no warning of approaching lightning danger or used poor judgment by not seeking proper shelter when CG lightning danger should have been apparent to the victim. All CG flashes that occurred within 10 km of the victim leading up to the time of their injury or death were considered as a possible warning flash for future CG lightning danger.
A few casualty cases that were classified as having little or no warning before being struck by lightning had not even a single CG flash within 20 km before or after they were struck (Fig. 4). Other casualty cases classified as being struck with little or no warning are situations in which a victim is struck at the beginning of a developing storm such that they had very few flashes if any to warn them of approaching CG lightning danger (Fig. 5). In figure 5, the victim had only 3 flashes of CG lightning which to alert him to the potentially deadly situation. Furthermore, these 3 flashes occurred within a period of less than two minutes before the person was struck. These 3 flashes might not give a reasonable amount of reaction time to take shelter for the average person.
Figure 4. All lightning flashes within a 20 km radius and +
35 minute time scale surrounding the lightning casualty case. This casualty occurred with absolutely no warning of approaching CG lightning. The single lightning flash that injured or killed the victim is located at the origin.
-3600 -3000 -2400 -1800 -1200 -600 0 600 1200 1800 2400 3000 3600
Time (s)
0
10
20
30
40
50
Dis
tanc
e (k
m)
-2100 -1500 -900 -300 300 900 1500 2100-1800 -1200 -600 0 600 1200 1800
T im e (s )
0
5
10
15
20
Dis
tanc
e (k
m)

Most lightning casualty cases that were classified as having used poor judgment were struck when there was ample warning of impending CG lightning danger. In figure 6, there was a high frequency of CG lightning flashes within 10 km for the entire 30 minutes leading up to the time of the injury or death. This particular victim had over 130 CG lightning flashes before being struck to indicate that proper shelter should be sought. Other casualty cases that were classified as having used poor judgment include those who were struck by resuming their unsheltered activities too early or before 30 minutes since the last flash of lightning was seen. In figure 7, CG lightning was very frequent up to 7 minutes before the victim was struck, with the frequency of CG flashes decreasing rapidly afterward. However, the 30-30 rule suggests that a person wait 30 minutes after the last clap of thunder or flash of lightning before resuming any potentially lightning risky activities. In this case, it appears that the person resumed their activities too quickly after what he may have perceived as the final lightning flash out of the storm.
A few of the casualty cases could not be classified into either having little or no warning or using poor judgment. For example, sometimes there were several CG flashes associated with a distant storm that may or may not have provided warning to the victim. If they were able to see those flashes and hear the resulting thunder, then the victim would be classified as having used poor judgment. However, if those particular lightning flashes were not visible and/or thunder not audible, then there were not enough CG flashes prior to their injury to have given the victim an appropriate amount of time to seek shelter.
Figure 5. A case in which a victim who had very little warning of approaching CG lightning danger. There were 3 flashes within 10 km immediately before the victim was struck.
Figure 6. The CG lightning activity surrounding a victim at 0 seconds and 0 kilometers. There was plenty of warning for this particular victim so the case was classified as using poor judgment.
Figure 7. The surrounding CG flashes associated with a victim located at 0 s and 0 km. In this case, the victim resumed activities too early and was classified as having used poor judgment.
6. RESULTS OF CLASSIFYING THE CASUALTY CASES
Of the 107 high confidence lightning casualty cases, 54% were classified as victims who had little or no warning of the approaching threat of cloud to ground lightning. These cases included 131 casualties of which 19 were killed and 112 were injured. The cases that were classified as having used poor judgment (ignoring warning signs of imminent CG lightning) totaled 42% of the high confidence cases. This included 90 casualties with 14 deaths and 76 injuries. There were 7 cases (4%) that could not be classified into either category including 9 casualties with 2 deaths and 7 injuries.
7. AN OBJECTIVE CLASSIFICATION OF THE CATEGORIZED LIGHTNING CASUALTY CASES
From the results, one can see clearly that there are two distinct populations of casualty cases: those with little or no warning of approaching CG lightning, and those in which the victim presumably used poor judgment and did not seek appropriate shelter in time. Initially, these two populations were classified subjectively. However, a secondary objective classification seems to support the two populations as
-2100 -1500 -900 -300 300 900 1500 2100-1800 -1200 -600 0 600 1200 1800
T im e (s )
0
5
10
15
20
Dis
tanc
e (k
m)
-2100 -1500 -900 -300 300 900 1500 2100-1800 -1200 -600 0 600 1200 1800
Time (s)
0
5
10
15
20
Dis
tanc
e (k
m)
-2100 -1500 -900 -300 300 900 1500 2100-1800 -1200 -600 0 600 1200 1800
T im e (s )
0
5
10
15
20
Dis
tanc
e (k
m)
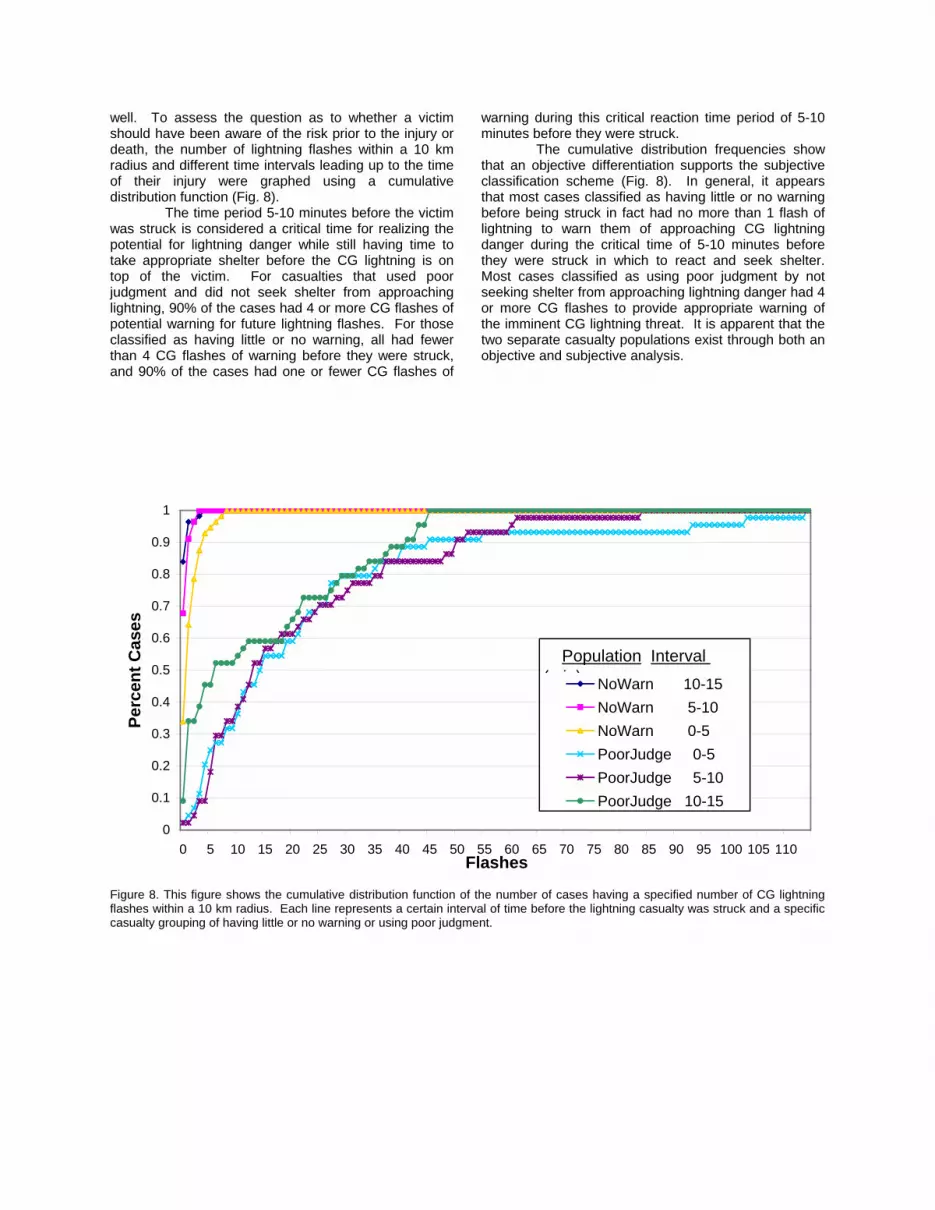
well. To assess the question as to whether a victim should have been aware of the risk prior to the injury or death, the number of lightning flashes within a 10 km radius and different time intervals leading up to the time of their injury were graphed using a cumulative distribution function (Fig. 8).
The time period 5-10 minutes before the victim was struck is considered a critical time for realizing the potential for lightning danger while still having time to take appropriate shelter before the CG lightning is on top of the victim. For casualties that used poor judgment and did not seek shelter from approaching lightning, 90% of the cases had 4 or more CG flashes of potential warning for future lightning flashes. For those classified as having little or no warning, all had fewer than 4 CG flashes of warning before they were struck, and 90% of the cases had one or fewer CG flashes of
warning during this critical reaction time period of 5-10 minutes before they were struck.
The cumulative distribution frequencies show that an objective differentiation supports the subjective classification scheme (Fig. 8). In general, it appears that most cases classified as having little or no warning before being struck in fact had no more than 1 flash of lightning to warn them of approaching CG lightning danger during the critical time of 5-10 minutes before they were struck in which to react and seek shelter. Most cases classified as using poor judgment by not seeking shelter from approaching lightning danger had 4 or more CG flashes to provide appropriate warning of the imminent CG lightning threat. It is apparent that the two separate casualty populations exist through both an objective and subjective analysis.
0
0.1
0.2
0.3
0.4
0.5
0.6
0.7
0.8
0.9
1
0 5 10 15 20 25 30 35 40 45 50 55 60 65 70 75 80 85 90 95 100 105 110Flashes
Per
cen
t C
ases
NoWarn 10-15
NoWarn 5-10
NoWarn 0-5
PoorJudge 0-5
PoorJudge 5-10
PoorJudge 10-15
Population Interval (min)
Figure 8. This figure shows the cumulative distribution function of the number of cases having a specified number of CG lightning flashes within a 10 km radius. Each line represents a certain interval of time before the lightning casualty was struck and a specific casualty grouping of having little or no warning or using poor judgment.

8. CHARACTERISTICS OF THE TWO CLASSIFICATIONS OF LIGHTNING CASUALTIES
Now that lightning casualties have been characterized into two categories of available warning type, further characteristics of the two populations will provide interesting insight into possible explanations for the initial classifications. The time of the year that the casualty occurred, the total number of flashes associated with the storm that initiated the injurious flash, and the regional trends of the subjective classification system will be considered.
8.1 Casualty Cases by Day of the Year
The classifiable lightning casualty cases were examined to determine the frequency of occurrence of the two classes as a function of the time of the year that each case occurred (Fig. 9). In both classifications, the highest frequency of cases occurs during the warm season, April through September. There is an especially high frequency of cases occurring during June and July, which is the peak of lightning season (Orville et al. 2000) combined with the peak of outdoor recreation season. There are only 9 total cold season cases occurring between the months of October through March. Of these 9 cold season cases, 7 of them were classified as casualty cases that had little or no warning of approaching CG lightning. This might be explained that during the cold season, the public is much less aware of the dangers of lightning to begin with and having even a few flashes of warning may not be enough to make someone seek shelter.
8.2. Total Number of CG Flashes Associated with the Classified Populations
The total number of CG flashes within 10 km of the victim and 30 minutes surrounding the victim s incident were plotted on a logarithmic scale versus the day of the year (Fig 9). Most of the cold season cases had very low flash rates of 11 flashes or less occurring within 30 minutes of the lightning incident. The cold season cases that do not have low flash rates were cases that were classified as victims who used poor judgment by not seeking shelter. Of the 56 cases classified as having little or no warning of CG lightning danger, 47 (84%) had lightning flash densities of 20 or fewer total CG flashes associated with the lightning incident. The low flash density threshold for cases classified as having used poor judgment is raised to 40 total flashes within 10 km since these cases usually had CG flashes occurring before and after the victim was struck. Of the 44 cases classified as having used poor judgment, 27% had fewer than 40 total flashes. Although some cases classified as having used poor judgment had low flash densities associated with the entire storm, the majority of the cases classified as
having little or no warning had low flash densities thus there were not many CG flashes to begin with in order to provide warning of the approaching threat of CG lightning.
Figure 9. The number of flashes on a logarithmic scale associated with each case versus the day of the year (day 1-365) the case occurred. The pink triangles indicate cases classified as using poor judgment and the blue circles indicate cases that were classified as having little or no warning. The thresholds for low flash density storms are indicated by the darkened lines at 40 and 20 flashes.
8.3 The Geographical Distribution of the Classified Casualty Cases
The annual distribution averaged over 1996-2000 of CG lightning flashes throughout the contiguous United States has been analyzed by Orville et al. (2002). Flash densities are at their maximum in the southeast, especially in Florida. The densities decrease towards the north and west to the US west coast. It would seem reasonable to expect that the spatial distribution of lightning casualties should look similar to the lightning flash densities found in the US. Figure 10 shows the spatial distribution of all 107 lightning casualty cases marked by the type of classification assigned to each case. There is of course a very high frequency of cases occurring in the Southeast and especially Florida. There are very few that occur in New England and none that occur in California, the Pacific Northwest, and the Northern Great Plains. In fact most of the cases occur in the eastern half of the United States, which is consistent with the aforementioned lightning flash densities. There are, however, 11 casualty cases that do occur in the West. Of these 11 cases, 9 of them were classified as having little or no warning of the threat of lightning. This might be explained by an increase in outdoor activities taking place in mountainous regions where storms can quickly develop or in many cases have low flash densities, thus catching victims by surprise.
0 30 60 90 120 150 180 210 240 270 300 330 360Day
1
10
100
1000
2
3
4567
20
30
40506070
200
300
400500600700
Fla
shes

Figure 10. This shows the geographical distribution of lightning casualty cases occurring throughout the United States. The blue circles (o) indicate cases that occurred with little or no warning, the crosses (+) indicate those who used poor judgment, and the x s indicate cases that could not be classified into either category.
9. CONCLUSIONS
9.1. Decreasing Lightning Fatalities through Education
Lightning casualty cases were classified into categories that best described their proximity to CG lightning flashes occurring near the place and time of their injury or death. Casualties who were struck by lightning with few flashes of warning of approaching CG lightning were categorized as having little or no warning of the danger of CG lightning. Casualties who had an ample number of CG flashes to warn them of approaching lightning danger were classified as having used poor judgment by not taking the appropriate shelter necessary to be safe from the threat of lightning. It was found that 54% of lightning casualty cases reported in SD had little or no warning of the threat of approaching CG lightning. This means that 42% of the lightning casualty cases reported in SD had ample warning of CG lightning danger but used poor judgment and did not seek appropriate shelter. The 42% classified as using poor judgment represent the population that can still be saved through lightning safety education only. This means that the current annual lightning death rate could be cut by 42% or lowered to about 42 deaths per year if effective education about lightning hazards could reach those who need it, and if they would heed it. This includes education involving the 30-30 rule and implementing regulations for outdoor recreation areas such as golf courses, soccer fields, and school playgrounds.
9.2 Recommendations
In order to decrease lightning fatalities beyond education, other routes of lightning awareness need to be taken. Education could go beyond understanding
just the 30-30 rule, however this proves to be the most quantitative and effective way to educate the general public. It would be difficult to educate the non-meteorologist about the types of convective cloud structures they should be looking for in order to completely avoid the possibility of getting struck by lightning. Realistically, even a seasoned meteorologist might not abide by their own observations of threatening clouds to avoid electrocution. Other means of lightning detection may help to warn the public of pending CG lightning danger. Probabilistic lightning forecasts may provide the best possibility beyond the 30-30 rule for decreasing lightning casualties in the future. These probabilistic lightning forecasts could specifically target categories of potential casualties, for example, hikers and campers, so that they could consider the lightning threat for their own destination before setting out for the day.
10. REFERENCES
American Meteorological Society, 2002: Updated Rec- ommendations for Lightning Safety 2002. <URL: www.ametsoc.org/policy/Lightning_Safety_Article. pdf>.
Holle, R.L., R.E. López, R. Ortiz, C.H. Paxton, D.M. Decker, and D.L. Smith, 1993: The local meteorological environment of lightning casualties in central Florida. Proc. 17th Conf. On Severe Local Storms and Conf. on Atmospheric Electricity, St. Louis, MO, Amer. Meteor. Soc., 779-784.
Holle, R.L., R.E. López, and C. Zimmermann, 1999: Updated recommendations for lightning safety
1998. Bull. Am. Met. Soc, 80, 2035-2041. Lengyel, M.M., 2004: Lightning casualties and their
proximity to surrounding cloud-to-ground lightning. M.S. Thesis, University of Oklahoma, Norman, 68 pp.
National Weather Service, 2004: STORM DATA PREP- ARATION, National Weather Service Instruction 10-1605. <URL:www.nws.noaa.gov/directives/010/
pd01016005b.pdf> Orville, R. E., and G.R. Huffines, 2000: Cloud-to-
Ground Lightning in the United States: NLDN Results in the First Decade, 1989-98. Mon. Wea. Rev., 129, 1179 - 1193.
Orville, R. E., and G.R. Huffines, W.R. Burrows, R.L. Holle, and K.L. Cummins, 2002: The North American Lightning Detection (NALDN) First results: 1998-2000. Mon. Wea. Rev., 130, 2098- 2109.
Used poor judgment
Unclassifiable
Little or No warning