Embed Size (px)
Citation preview

Contents lists available at ScienceDirect
Journal of Quantitative Spectroscopy &Radiative Transfer
Journal of Quantitative Spectroscopy & Radiative Transfer 111 (2010) 2185–2196
0022-40
doi:10.1
� Cor
E-m
journal homepage: www.elsevier.com/locate/jqsrt
Line positions and energy levels of the 18O substitutions from theHDO/D2O spectra between 5600 and 8800 cm�1
S.N. Mikhailenko a,�, S.A. Tashkun a, L. Daumont b, A. Jenouvrier b, M. Carleer c,S. Fally d, A.C. Vandaele d
a Laboratory of Theoretical Spectroscopy, V.E. Zuev Institute of Atmospheric Optics SB RAS, 1, Akademicheskii Av., 634055 Tomsk, Russiab Groupe de Spectrometrie Moleculaire et Atmospherique, UMR CNRS 6089, Universite de Reims-Champagne-Ardenne, UFR Sciences BP 1039,
51687 Reims Cedex 2, Francec Universite Libre de Bruxelles, Faculte des Sciences, Service de Chimie Quantique et Photophysique, Brussels, Belgiumd Belgian Institute for Space Aeronomy, Brussels, Belgium
a r t i c l e i n f o
Article history:
Received 16 November 2009
Received in revised form
26 January 2010
Accepted 27 January 2010
Keywords:
Fourier transform spectroscopy
Infrared absorption
D218O and HD18O molecules
Line positions
Energy levels
73/$ - see front matter & 2010 Elsevier Ltd. A
016/j.jqsrt.2010.01.028
responding author. Tel.: +7 382 2 49 17 94; fax
ail address: [email protected] (S.N. Mikhailenk
a b s t r a c t
Absorption spectra of HDO/D2O mixtures recorded in the 5600–8800 cm�1 region with
a total pressure of water from 13 up to 18 hPa and an absorption path length of 600 m
have been analyzed in order to obtain new spectroscopic data for HD18O and D218O. In
spite of the low natural 18O concentration (about 2�10�3 with respect to the 16O one),
about 1100 transitions belonging to HD18O and more than 280 transitions belonging to
D218O have been assigned. Most of the D2
18O transitions belong to the n1+n2+n3 and
2n1+n3 bands. Sets of energy levels for seven vibrational states of D218O and four states of
HD18O are reported for the first time. The comparison of the experimental data with the
calculated values based on Partridge–Schwenke global variational calculations is
discussed.
& 2010 Elsevier Ltd. All rights reserved.
1. Introduction
In recent years, there has been an increasing interest instudying the infrared spectra of rare species of the watermolecule containing either deuterium (D) or the 18O isotope(see for example, Refs. [1–4] on HD18O and D2
18O). Besidesthe pure spectroscopic interest, these molecules are startingto be the object of a number of atmospheric applications.For instance, HD18O lines have been identified instratospheric and mesospheric spectra [5]. Spectroscopicline parameters of this molecule have also been includedinto the latest version of the HITRAN database [6].
On the other hand, the existence of high sensitivitymethods of recording high-resolution infrared spectra givesthe possibility to obtaining spectroscopic data of rare species
ll rights reserved.
: +7 382 2 49 20 86.
o).
using non-enriched samples. For instance, a number ofHD18O lines have been found and assigned in ICLAS [7] andCW–CRDS [4] 18O enriched water spectra. However, in bothcases, there was no deuterium enrichment. Previously Toth[8] assigned a number of HD18O and D2
18O lines in themixtures of H2O and D2O which were not 18O enriched.
In this study, we used long path absorption spectra ofwater gas mixtures enriched by deuterium to obtainthe spectroscopic information of HD18O and D2
18O.Measurements have been made in the Groupe de Spectro-metrie Moleculaire et Atmospherique of the ReimsUniversity. A high-resolution Fourier transform spectro-meter (FTS) Bruker IFS 120M of the Universite Libre deBruxelles was used for this purpose.
2. Experimental spectra and line assignment
Absorption spectra of HDO and D2O gas mixtures inthe 5600–8800 cm�1 range were recorded by the

S.N. Mikhailenko et al. / Journal of Quantitative Spectroscopy & Radiative Transfer 111 (2010) 2185–21962186
Reims–Brussels group [9] at room temperature using aBruker IFS 120M FTS. The use of a 50 m base lengthmulti-pass absorption cell allowed us to obtain a 600 mtotal path length with a total pressure of the watermixtures up to 13 hPa. An additional spectrum of a gasmixture with natural abundance of water was alsorecorded. All spectra were recorded with a maximumoptical path difference (MOPD) of 60 cm, whichcorresponds to a 0.015 cm�1 resolution. The experimentalconditions of the measurements as well as theabundances of water isotopic species are given in Table 1.Analysis of these spectra enabled us to obtain extensiveline lists (positions, strengths, and self-broadeningcoefficients) for HD16O and D2
16O. These line lists will bepublished elsewhere. In this study we focus on absorptionlines belonging to HD18O and D2
18O.An overview of the recorded spectra obtained with
different partial pressures of H2O, HDO and D2O is shownin Fig. 1. A zoomed portion of the spectrum correspondingto the run a conditions (see Table 1 for its description)together with the proposed line assignments is presentedin Fig. 2 for the interval between 6500.0 and 6503.5 cm�1.Unassigned lines are marked by asterisks. Table 2 containsthe list of the vibration–rotation assignments of theobserved lines plotted in Fig. 2. Among the 46 observedlines, 33 lines were assigned to HD16O and D2
16O, 13 lineswere assigned to HD18O and D2
18O, and only 3 very weaklines were left unassigned. The simultaneous analysis ofthe three spectra recorded for this study enabled us toassign more than 17 300 lines to HDO and D2O. The set of
Table 1Summary of the laboratory measurement conditions for the HDO/D2O spectra
Run Region (cm�1) Path length (m) MOPD (cm)
a 5600–8800 602.32 60
b 5600–8800 602.32 60
c 5600–8800 602.32 60
Fig. 1. Overview of the observed water spectra in the 5600–8800 cm�1 range. U
for the descriptions of the runs).
observed lines covers the 10�27–10�21 cm/moleculeintensity range. The H2O lines were not taken intoaccount.
The rotation–vibration line assignment of HDO andD2O (both 16O and 18O) was done using known energylevels and theoretical line lists (PS), which were calculatedon the basis of results of Partridge and Schwenke (PS)[10,11]. The PS line lists are available via the Institute ofAtmospheric Optics web site http://spectra.iao.ru.
The absorption spectra of HD16O and D216O are not
well known in the region under investigation(5600–8800 cm�1). For example, according to the IUPACtask group’s review [12] only 6386 transitions of HD16Owere reported in previous studies. Therefore, the first stepof our study was to find and assign the HD16O and D2
16Olines. We were able to assign more than 8550 lines toHD16O and more than 5000 lines to D2
16O. The assignmentof the HD18O and D2
18O lines focused on the 3700 lineswhich were left unassigned. The assignment procedurewas based on a comparison between the measured linepositions and intensities and the values of the PS line list.In most cases, especially for D2
18O, upper energy levelswere determined only from one single transition. Thecombination difference method was therefore useless tovalidate the assignments. We used the following criteriato check the assignments: (i) the measured intensity (IOBS)should be close to the calculated PS intensity (IPS), and (ii)the difference (nOBS–nPS) should be a smooth function ofthe rotational quantum numbers J and Ka. With thesecriteria, which will be discussed in more details in the
in the 5600–8800 cm�1 spectral range.
Pressure (hPa) Temperature (K) HDO/D2O/H2O ratio (%)
13.4 291.4 24/73/3
13.2 290.1 51/27/22
18.0 293.2 Natural
pper panel—run c. Middle panel—run b. Lower panel—run a (see Table 1

Fig. 2. Example of line assignments of the run a spectrum in the 6500.0–6503.5 cm�1 range. Blue—lines of the 16O species (4—HD16O, 7—D216O).
Magenta—lines of the 18O species (5—HD18O, 8—D218O) (see Table 1 for the descriptions of the runs).
S.N. Mikhailenko et al. / Journal of Quantitative Spectroscopy & Radiative Transfer 111 (2010) 2185–2196 2187
next section, we were able to assign more than 1140 lineswhich correspond to 1300 transitions belonging to HD18Oand D2
18O.The final verification of the assignments and the
determination of the experimental energy levels of allspecies were done by the RITZ program [13]. A moredetailed description of the procedures of data reduction,line assignments and energy levels determination is givenin [14].
3. Results and discussion
The majority of available HD18O data (about 800transitions belonging to the n1+n3, 2n2+n3, 2n1+n2, 4n2,5n2, 2n3, 3n1, n1+n2+n3 and n2+2n3 bands) were publishedin a recent paper [14]. In this paper all publishedrotation–vibration data in the 0.2–12 105 cm�1 regionwere critically analyzed and used to obtain the mostcomplete set of the experimental energy levels of thismolecule.
Here we report mainly the results for D218O together
with some additional lines and energy levels of HD18O.Line lists of observed HD18O and D2
18O transitions aregiven in the Supplementary data to this paper.
3.1. HD18O molecule
In addition to the data of Ref. [14], about 300transitions belonging to 11 bands have been assigned inthis study. Transitions of four new bands 4n2, 3n2+n3,n1+n2+n3 and n1+2n2 were found. These new data have
been combined with the previously collected ones.Altogether, more than 7500 observed transitionsincluding those of [1–4,7,8,14–18] have been used todetermine the new energy levels. As in our previous study[14], this was done using the RITZ code [13].
In Table 3, 130 rotational levels of 11 vibrational statesof HD18O are listed. The energy levels marked by anasterisk were already mentioned in [14], but werecorrected in this study with the help of the new data.Vibrational (V1V2V3) and rotational (JKaKc) quantumnumbers as well as the term value (Energy (cm�1)), theterm value standard error (dE, in last digits of the termvalue) and the number of observed transitions (N) aregiven for each experimental energy level. The tablecontains the term values of 118 new and 12 correctedrotational levels.
3.2. D218O molecule
The rotation–vibration spectrum of D218O has been less
studied than the spectrum of HD18O. Pure rotationallines of D2
18O were studied by Bellet et al. [19] in themicrowave and by Fleming and Gibson [16] and Johns[17] in the far-infrared spectral regions. The fundamentaln2 band was analyzed in several studies [8,20–22].The spectrum between 2088 and 3218 cm�1 was studiedby Toth [1] (only the n3 band) and by Ni et al. [3]. Inthis last paper about 3900 transitions of six rotation–vibration bands (n1, n3, 2n2, 3n2�n2, n1+n2�n2, andn2+n3�n2) were reported. No data above 3200 cm�1 arein the literature.

Table 2Line list and the vibration–rotation assignments of the lines observed in the 6500.0–6503.5 cm�1 range.
nOBS (cm�1) dn (10�4) IOBS (cm�1) dI (cm/molecule) IPS (%) Elow (cm/molecule) Mol (cm�1) Upper state Lower state
V1V2V3 J Ka Kc V1V2V3 J Ka Kc
6500.0915 4 1.13E�25 12 9.471E�26 114.9867 D2O 210 3 3 1 000 4 0 4
6500.1410 4 5.20E�25 5 7.689E�25 1466.1590 D2O 121 4 4 1 010 4 4 0
6500.1759 4 2.74E�25 5 3.883E�25 1466.1544 D2O 121 4 4 0 010 4 4 1
6500.2462 4 7.93E�25 5 4.653E�25 981.1278 HDO 210 6 5 2 000 7 6 1
4.652E�25 981.1279 HDO 210 6 5 1 000 7 6 2
6500.3404 4 2.19E�24 5 2.081E�24 117.3122 D2O 210 5 0 5 000 4 1 4
6500.3964 4 2.32E�23 5 6.212E�23 308.6154 HDO 101 7 1 7 000 6 1 6
6500.4139 4 2.55E�22 5 1.369E�22 74.5062 D2O 111 2 1 2 000 3 1 3
6500.5967 4 5.65E�24 8 6.154E�24 1049.1241 HDO 101 11 3 9 000 11 2 10
6500.6373 4 1.91E�22 5 2.171E�22 66.1842 HDO 101 3 2 2 000 2 1 1
6500.6709 4 1.34E�23 5 1.260E�23 100.3907 HDO 021 4 0 4 000 3 1 3
6500.7895 4 3.09E�25 13 2.612E�25 1692.0014 D2O 121 6 5 2 010 6 5 1
1.305E�25 1691.9969 D2O 121 6 5 1 010 6 5 2
6500.8993 4 7.73E�26 12 4.858E�26 656.5693 D218O 111 7 6 1 000 7 6 2
2.428E�26 656.5696 D218O 111 7 6 2 000 7 6 1
6500.9806 4 8.30E�26 9 1.001E�25 581.9618 HDO 050 6 1 5 000 7 3 4
6500.9989 4 2.61E�26 16 2.548E�26 470.9374 HD18O 101 8 1 7 000 7 1 6
6501.0749 4 2.90E�25 5 1.678E�25 403.0335 D218O 111 5 5 0 000 5 5 1
8.384E�26 403.0343 D218O 111 5 5 1 000 5 5 0
6501.1498 4 1.52E�25 7 1.682E�25 1341.3820 D2O 121 4 2 2 010 4 2 3
6501.2297 4 7.06E�26 20 1.269E�25 1394.9146 D2O 220 4 4 1 010 4 3 2
6501.2667 4 3.16E�26 40 5.084E�26 156.4246 D218O 111 4 2 2 000 4 2 3
6501.5967 4 5.78E�23 5 6.323E�23 306.3145 HDO 101 7 0 7 000 6 0 6
6501.7964 4 5.06E�23 5 5.654E�23 467.5143 HDO 101 6 4 3 000 6 3 4
6501.8560 20 2.00E�25 20 1.959E�25 1456.6313 D2O 220 5 4 2 010 5 3 3
6501.8999 4 4.93E�26 11 1.387E�25 1673.0173 HDO 111 6 1 5 010 5 1 4
6501.9560 4 1.47E�25 10 2.088E�25 155.5257 HD18O 021 4 2 2 000 3 2 1
6502.1177 4 6.47E�26 11 4.716E�26 41.5825 D218O 111 2 1 1 000 2 1 2
2.898E�26 769.1165 HDO 021 9 2 7 000 10 1 10
6502.1756 4 4.66E�25 5 4.191E�25 668.8516 D2O 012 6 5 1 000 7 6 2
2.095E�25 668.8519 D2O 012 6 5 2 000 7 6 1
6502.2093 4 2.00E�25 5 1.626E�25 1630.0299 HDO 210 14 0 14 000 15 1 15
9.189E�26 1630.0241 HDO 210 14 0 14 000 15 0 15
6502.2371 4 3.24E�25 5 4.419E�25 949.5772 HDO 210 8 3 5 000 9 4 6
6502.3015 4 2.70E�25 5 2.171E�25 980.2574 D2O 111 11 4 8 000 11 4 7
1.579E�25 1221.5053 D2O 121 2 1 1 010 2 1 2
6502.3982 4 3.09E�24 5 3.385E�24 573.8905 HDO 101 7 4 4 000 6 4 3
6502.4620 20 1.00E�25 20
6502.5009 4 2.10E�25 5 1.604E�25 1630.0241 HDO 210 14 1 14 000 15 0 15
8.953E�26 1630.0298 HDO 210 14 1 14 000 15 1 15
6502.5516 4 2.69E�25 5 2.044E�25 473.9175 HDO 101 7 3 5 000 7 1 6
1.992E�25 1106.2641 HDO 021 10 4 6 000 10 4 7
6502.6117 4 1.95E�24 5 2.098E�24 1278.4379 HDO 101 11 5 7 000 11 4 8
6502.6634 4 2.61E�24 6 3.386E�24 573.9704 HDO 101 7 4 3 000 6 4 2
6502.7018 4 1.10E�22 5 1.443E�22 306.3145 HDO 101 7 1 7 000 6 0 6
6502.7345 4 2.30E�24 14 1.983E�24 540.8817 D2O 210 8 4 4 000 8 3 5
6502.8000 20 8.00E�26 25 6.248E�26 630.3046 HD18O 101 10 0 10 000 9 1 9
6502.8730 20 5.00E�26 5 3.740E�26 2109.5737 D2O 121 8 7 2 010 8 7 1
1.869E�26 2109.5736 D2O 121 8 7 1 010 8 7 2
6502.9114 4 4.18E�24 5 5.136E�24 1110.7596 HDO 101 10 5 5 000 10 4 6
6502.9740 20 5.00E�26 20
6503.0165 4 6.43E�26 10 6.832E�26 1534.3553 D2O 121 6 3 3 010 6 3 4
3.283E�26 2068.4214 HDO 111 9 2 7 010 8 2 6
6503.1347 4 2.67E�26 23 3.326E�26 629.9693 HD18O 101 10 0 10 000 9 0 9
6503.1714 10 3.98E�26 24
6503.2373 4 1.81E�25 9 8.740E�26 570.2930 D218O 111 6 6 1 000 6 6 0
4.368E�26 570.2933 D218O 111 6 6 0 000 6 6 1
1.013E�25 1106.2641 HDO 130 10 1 10 000 10 4 7
6503.2686 4 3.27E�26 19 6.274E�26 629.9693 HD18O 101 10 1 10 000 9 0 9
6503.3918 4 5.45E�23 5 6.168E�23 374.4099 HDO 101 5 4 1 000 5 3 2
Note: nobs (cm�1), observed line position; dn (10�4 cm�1), standard error of observed line position; Iobs (in units cm�1/(molecule cm�2) at 296 K),
observed line strength; dIobs (%), standard error of observed line strength; IPS (in units cm�1/(molecule cm�2) at 296 K), calculated line strength; Elow
(cm�1), experimental energy of the lower state; Mol, molecule code; V1V2V3, J, Ka, Kc, vibrational and rotational quantum numbers of the upper and lower
states.
S.N. Mikhailenko et al. / Journal of Quantitative Spectroscopy & Radiative Transfer 111 (2010) 2185–21962188

Table 3Experimental energies of the HD18O molecule.
V1V2V3 J Ka Kc Energy (cm�1) dE N V1V2V3 J Ka Kc Energy (cm�1) dE N
002 10 6 5 8540.7120 4 1 101 8 6 3 7438.3979 20 1
002 10 6 4 8540.7412 4 1 101 8 6 2 7438.3978 20 1
002 11 6 5 8709.3811 5 1 101 9 3 7 7203.4849 3 3
002 12 1 11 8411.2687 4 1 101 9 3 6 7223.8071 5 1
002 13 3 10 8811.6830 6 1 101 9 4 5 7306.3278 4 1
101 10 1 9 7248.0501 5 1
012 4 3 1 8872.1364 50 1 101 10 2 9 7251.3469 9 3
012 7 5 3 9380.9831 20 1 101 10 2 8 7328.2283 19 2
012 7 5 2 9380.9758 20 1 101 10 3 8 7353.1779 3 2
012 7 6 2 9535.7339 20 1 101 10 5 6 7577.4623 5 1
012 7 6 1 9535.7339 20 1 101 11 1 10 7403.5699 4 1
012 8 3 5 9288.1729 20 1 101 11 2 10 7405.4301 15 2
012 10 2 8 *9540.0301 30 1 101 12 0 12 7428.7860 4 1
012 10 3 7 9601.6816 10 1 101 12 1 12 7428.8179 4 1
012 10 5 6 9798.3936 4 1 101 12 2 11 7571.8486 50 1
012 12 1 11 9774.0741 5 1 101 13 0 13 7594.8005 5 1
101 13 1 13 7594.8156 5 1
021 6 2 4 6840.0070 16 3 101 13 1 12 7749.9581 50 1
021 7 7 1 7697.6866 20 1
021 7 7 0 7697.6867 20 1 111 1 0 1 7789.9722 20 1
021 8 2 7 *7041.3268 15 2 111 1 1 0 7809.5009 30 1
021 8 4 5 7271.9941 17 2 111 2 0 2 7820.1062 5 1
021 9 0 9 7046.0443 4 1 111 2 1 2 7833.9424 5 1
021 9 1 9 7046.4699 8 1 111 3 1 2 7893.1814 20 1
021 9 2 7 7240.8539 4 1 111 4 1 4 7929.2311 11 1
021 9 4 6 7412.7454 6 1 111 4 2 3 7955.5965 7 1
021 9 6 4 7748.1370 20 1 111 5 0 5 7991.7843 5 1
021 9 6 3 7748.1363 20 1 111 5 1 5 7996.5348 49 2
021 10 1 10 7176.6829 4 1 111 6 0 6 8073.7411 5 1
021 10 2 9 7317.4086 8 2 111 7 2 5 8257.0296 10 1
021 10 2 8 7404.5872 4 1
021 11 0 11 7318.9720 5 1 120 8 5 3 6474.5022 12 1
021 11 1 11 7319.0876 5 1
210 3 3 1 *6951.8075 5 1
031 2 0 2 7770.4870 5 1 210 3 3 0 *6951.8342 4 1
S.N.
Mik
ha
ilenk
oet
al.
/Jo
urn
al
of
Qu
an
titativ
eSp
ectrosco
py
&R
ad
iativ
eT
ran
sfer1
11
(20
10
)2
18
5–
21
96
21
89

Table 3 (continued )
V1V2V3 J Ka Kc Energy (cm�1) dE N V1V2V3 J Ka Kc Energy (cm�1) dE N
031 2 2 1 7893.8624 36 2 210 4 4 1 7127.5722 20 1
031 3 1 2 7846.7416 50 1 210 4 4 0 7127.5710 20 1
031 3 2 1 7941.6785 7 1 210 5 4 2 *7202.3176 30 1
031 4 4 1 8236.5338 30 1 210 5 4 1 7202.3226 4 1
031 4 4 0 8236.5326 30 1 210 5 5 1 *7348.1036 21 2
031 5 2 4 8076.6879 9 1 210 5 5 0 *7348.1030 16 2
031 5 2 3 8087.8674 8 1 210 6 6 1 7612.1993 20 1
031 5 4 1 8314.5161 7 1 210 6 6 0 7612.1992 20 1
031 6 2 4 8185.6560 30 1 210 7 3 4 7286.7913 4 1
210 7 7 1 7918.3953 20 1
040 4 4 1 5998.3676 20 1 210 7 7 0 7918.3954 20 1
040 4 4 0 5998.3664 20 1 210 8 0 8 *7204.1093 50 1
040 5 5 1 6289.2383 20 1 210 8 1 7 7285.5897 15 1
040 5 5 0 6289.2382 20 1 210 8 2 7 7302.4497 5 1
040 6 3 3 6004.1323 14 1 210 8 2 6 7346.1827 20 1
040 7 3 5 6112.4753 8 1 210 8 3 6 *7401.9381 5 1
040 9 3 6 6392.3424 6 1 210 8 5 4 7661.1427 4 1
210 8 5 3 7661.1684 4 1
050 2 2 1 6848.8670 5 1 210 10 1 10 7451.0443 4 1
050 2 2 0 6849.0854 15 1 210 10 4 7 7803.2183 6 1
050 3 2 2 6895.2683 30 1 210 11 2 9 7819.4981 4 1
050 4 2 3 6956.9331 6 1
050 4 2 2 6962.4898 4 1 300 3 3 0 *8097.7006 34 2
050 5 1 4 6950.4097 6 1 300 4 3 1 8156.4271 19 2
300 5 2 3 8162.4345 5 1
101 7 5 3 *7168.4020 20 1 300 5 3 2 8230.2464 4 1
101 7 5 2 *7168.4089 17 3 300 6 4 2 8419.8622 5 1
101 7 7 1 7493.1336 15 2 300 6 5 2 8549.6381 71 2
101 7 7 0 7493.1336 15 2 300 6 5 1 8549.6379 68 2
101 8 3 6 7067.8963 6 2 300 7 3 5 8420.4214 5 1
101 8 3 5 7079.5803 9 2 300 8 2 6 8489.7451 5 1
101 8 4 5 7166.6288 7 1 300 9 0 9 8475.1036 30 1
101 8 4 4 7167.6760 27 2 300 9 1 9 8475.4968 5 1
101 8 5 4 7289.3935 4 1 300 9 3 6 8684.3806 5 1
101 8 5 3 7289.4438 5 1 300 10 0 10 8602.1505 30 1
Note: V1V2V3, vibrational quantum numbers; J, Ka, Kc, rotational quantum numbers; Energy (cm�1), experimental energy (term value); dE, standard error in units of last digits of experimental term value; N,
number of observed transitions used to define the energy level.
S.N.
Mik
ha
ilenk
oet
al.
/Jo
urn
al
of
Qu
an
titativ
eSp
ectrosco
py
&R
ad
iativ
eT
ran
sfer1
11
(20
10
)2
18
5–
21
96
21
90
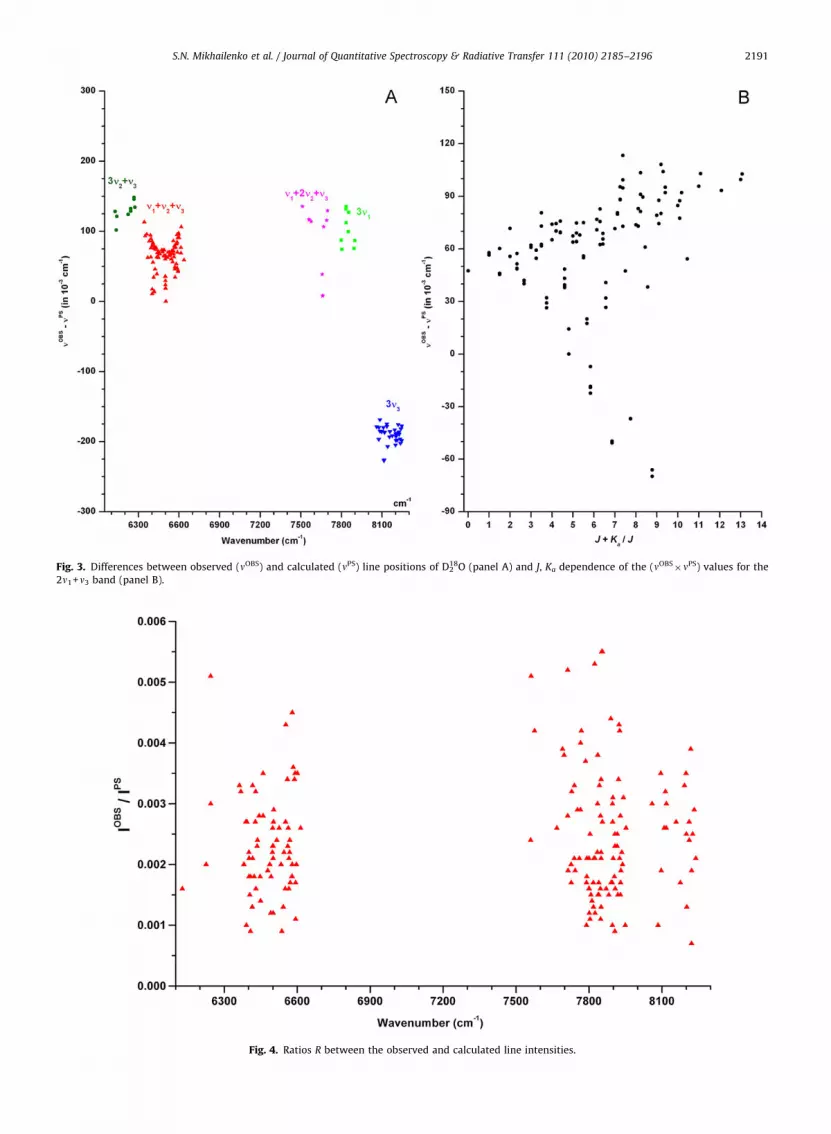
Fig. 3. Differences between observed (nOBS) and calculated (nPS) line positions of D218O (panel A) and J, Ka dependence of the (nOBS
�nPS) values for the
2n1+n3 band (panel B).
Fig. 4. Ratios R between the observed and calculated line intensities.
S.N. Mikhailenko et al. / Journal of Quantitative Spectroscopy & Radiative Transfer 111 (2010) 2185–2196 2191

S.N. Mikhailenko et al. / Journal of Quantitative Spectroscopy & Radiative Transfer 111 (2010) 2185–21962192
According to theoretical calculations based on theresults of [10,11], there must be more than 1000 lines ofD2
18O in the 5600–8800 cm�1 region with line intensitiesstronger than 5�10�27 cm/molecule, taking into accountthe natural abundance of 18O (2�10�3). These linesbelong to the bands associated with the upper states ofthe second hexade {(050), (130), (031), (210), (111),(012)} and of the first decade {(060), (140), (041), (220),(121), (022), (300), (201), (102), (003)} of vibrationalinteracting states.
We were able to assign lines of three bands of thesecond hexade (3n2+n3, n1+n2+n3, and 2n1+n2) and of fourbands of the first decade (3n1, n1+2n2+n3, 2n1+n3, and3n3). The comparison between observed and calculatedline positions for the five bands is shown in the left side(panel A) of Fig. 3. Data of the 2n1+n2 band are not plottedin this figure because the number of line positions was toosmall for this band. This plot shows the high quality ofthe theoretical predictions for the line positions in thisspectral region. The rotational dependence of the(nOBS
�nPS) values is shown in the right side (panel B) ofFig. 3 where the results obtained for the 2n1+n3 bandare presented. As can be seen from this figure, theKa-dependence of the (nOBS
�nPS) differences is strongerthan the J-dependence. Nevertheless, both J- andKa-dependences are very smooth. In any case, thesediscrepancies are not larger than 70.3 cm�1. As a resultthe line assignment procedure is rather straightforward.On the other hand, the ratio of observed (IOBS) andcalculated (IPS) line intensities can be an additional
Fig. 5. General view of the energy level
criterion for the line assignment correctness. This ratioR= IOBS/IPS must be close to the natural abundance of 18O(2�10�3). R ratios for all isolated assigned lines areplotted in Fig. 4. For most of them this ratio is between1�10�3 and 4�10�3, which is in good agreement withthe value 2�10�3.
In total about 4900 observed transitions from 0.3 up to3218 cm�1 have been collected from the literature. Thesedata have been augmented by more than 280 transitionsfrom the present study in the 6127–8246 cm�1 region.The final set of more than 5180 transitions wasconsidered as input for the RITZ program [13] to obtaina set of experimental energy levels. The graphicalrepresentation of the full set of the energy levelsdetermined in this study is given in Fig. 5. The energiesof the first eight vibrational states are coming fromtransitions reported in [1,3,8,16,17,19–22]. The energiesof seven highest states are reported for the first time andgiven in Tables 4 and 5.
3.3. Unassigned lines
After having carefully assigned all possible linespresent in the 5600–8800 cm�1 region, some lines arestill left unassigned. Stick spectra of the observed linesbelonging to the four water vapor isotopologues studiedare shown in Fig. 6, Panels A–D, for HD16O, D2
16O, HD18Oand D2
18O, respectively. Most of the assigned lines ofHD18O (panel C) and D2
18O (panel D) are grouped aroundthe most strong bands present in the region investigated
s obtained for the D218O molecule.

Table 4Experimental energies of the second hexade vibrational interacting states of the D2
18O molecule.
V1V2V3 J Ka Kc Energy (cm�1) dE N V1V2V3 J Ka Kc Energy (cm�1) dE N
031 2 1 2 6235.7632 30 1 111 6 0 6 6719.8897 3 2
031 3 0 3 6261.2103 5 1 111 6 1 6 6719.9310 3 2
031 4 1 4 6308.9633 30 1 111 6 1 5 6769.6899 3 2
031 5 0 5 6358.2125 3 2 111 6 2 5 6778.7718 5 1
031 5 1 5 6360.4027 5 1 111 6 2 4 6801.0446 5 1
031 6 3 4 6559.6668 50 1 111 6 3 4 6835.7582 5 1
031 8 0 8 6571.0177 50 1 111 6 4 3 6894.4431 5 1
031 8 1 8 6571.2417 25 1 111 6 4 2 6894.7809 3 2
031 9 0 9 6660.0150 30 1 111 6 5 2 6976.0533 15 2
111 6 5 1 6976.0461 30 1
210 4 4 0 6694.3228 3 2 111 6 6 1 7073.5302 15 2
210 6 4 2 6824.9750 3 2 111 6 6 0 7073.5302 30 2
210 6 5 1 6913.8372 50 1 111 7 0 7 6790.1702 3 2
210 8 4 4 7019.4138 10 1 111 7 1 7 6790.3008 20 1
111 7 2 6 6860.0695 30 1
111 0 0 0 6494.7479 5 1 111 7 2 5 6891.6134 3 2
111 1 0 1 6506.6186 30 1 111 7 3 4 6928.3143 30 1
111 1 1 1 6514.7678 5 1 111 7 4 4 6978.6129 50 1
111 1 1 0 6517.3602 20 1 111 7 4 3 6979.6634 3 2
111 2 0 2 6529.8213 3 3 111 7 6 2 7157.4662 10 2
111 2 1 2 6535.9391 3 2 111 7 6 1 7157.4686 5 2
111 2 1 1 6543.7000 4 1 111 8 0 8 6869.6149 20 1
111 2 2 1 6568.0460 20 1 111 8 1 8 6869.6613 3 2
111 3 0 3 6563.4373 6 3 111 8 2 7 6943.9793 5 1
111 3 1 3 6567.3902 3 2 111 8 4 5 7074.9185 5 1
111 3 2 2 6603.8137 5 2 111 8 5 4 7156.8628 5 1
111 3 2 1 6606.2828 3 3 111 8 5 3 7156.8407 5 1
111 4 0 4 6606.5402 5 1 111 9 0 9 6958.2348 5 1
111 4 1 4 6608.8499 3 2 111 9 1 9 6958.2535 10 1
111 4 1 3 6634.1350 3 2 111 9 2 7 7107.4366 30 1
111 4 2 3 6651.0449 3 2 111 9 5 5 7265.9874 18 1
111 4 2 2 6657.6935 3 2 111 10 0 10 7056.0350 5 1
111 4 3 2 6700.7115 5 1 111 10 1 10 7056.0539 5 1
111 4 3 1 6701.0472 9 1 111 10 1 9 7151.2246 8 1
111 4 4 1 6762.8663 5 1 111 10 2 9 7151.6154 30 1
111 4 4 0 6762.8787 5 1 111 10 5 6 7387.5199 5 1
111 5 0 5 6658.7052 5 1 111 10 5 5 7388.0858 10 1
111 5 1 5 6660.2239 30 1 111 11 0 11 7163.0422 40 1
111 5 2 4 6709.4252 5 1 111 11 1 10 7268.8438 3 2
111 5 2 3 6722.7875 3 2 111 12 1 12 7279.2377 4 1
111 5 4 2 6822.5388 5 1 111 13 0 13 7404.5976 5 1
111 5 5 1 6904.1091 10 1 111 13 1 13 7404.6009 10 1
111 5 5 0 6904.1088 5 1
Note: V1V2V3, vibrational quantum numbers; J, Ka, Kc, rotational quantum numbers; Energy (cm�1), experimental energy (term value); dE, standard error
in units of last digits of experimental term value; N, number of observed transitions used to define the energy level.
S.N. Mikhailenko et al. / Journal of Quantitative Spectroscopy & Radiative Transfer 111 (2010) 2185–2196 2193
in this study. There are still near 2500 unassigned linesdistributed all over the studied region and with intensitieslower than 5�10�25 cm/molecule (panel E). We believethat most of these remaining lines belong to HD16Oor D2
16O.
4. Conclusion
In spite of the low natural concentration of 18O (about2�10�3 with respect to the 16O one), it was possible toobserve and assign lines of HD18O and D2
18O. About 1100transitions belonging to HD18O and more than 280transitions belonging to D2
18O were found and assignedamong the lines of HD16O and D2
16O. 118 new and 12corrected energy levels of HD18O have been determined.Energy levels of the (040), (031), (120), and (111)
vibrational states are reported for the first time. Linepositions of seven rotation–vibration bands of D2
18Ohave been observed and assigned for the first time.We were able to obtain 204 new rotational energy levelsof seven vibrational states. The maximal values of thequantum numbers J and Ka are 13 and 7, respectively.The range of known experimental energy levels wasextended from 5828 cm�1 [3] up to 8830 cm�1.
In order to assign the transitions belonging to HD18O andD2
18O in the experimental spectra, we used a two-stageprocedure. First, we performed a thorough assignment ofthe HD16O and D2
16O transitions, leading to a more completeset of assignments than is currently known in the literature(these results will be published in a separate paper).Second, we focused on lines left unassigned after this firststep and used reliable theoretical line lists to assign theHD18O and D2
18O transitions among these left-over lines.

Table 5Experimental energies of the first decade vibrational interacting states of the D2
18O molecule.
V1V2V3 J Ka Kc Energy (cm�1) dE N V1V2V3 J Ka Kc Energy (cm�1) dE N
121 2 2 1 7705.1352 50 1 201 6 4 2 8237.4032 20 1
121 3 1 2 7716.5796 30 2 201 6 6 1 8394.6141 5 1
121 3 3 0 7793.8483 50 1 201 6 6 0 8394.6141 10 1
121 4 1 4 7741.7697 5 1 201 7 0 7 8150.8027 5 1
121 5 0 5 7791.0159 10 1 201 7 1 6 8207.9799 3 2
121 5 1 5 7793.3690 6 1 201 7 2 6 8210.0787 5 1
121 5 5 1 8065.0320 40 1 201 7 2 5 8246.0855 3 2
121 5 5 0 8065.0317 20 1 201 7 3 4 8271.6615 15 2
121 7 0 7 7922.1374 5 1 201 7 4 3 8321.4655 5 1
121 8 1 8 8001.3324 7 1 201 7 6 2 8477.1338 12 1
201 7 6 1 8477.1337 6 1
300 2 0 2 7853.7286 50 1 201 8 0 8 8229.5151 5 1
300 3 1 3 7890.0637 30 1 201 8 1 8 8229.5714 5 1
300 3 3 1 7967.3661 15 2 201 8 1 7 8297.0595 5 1
300 4 2 2 7976.4888 20 1 201 8 2 7 8298.0056 3 2
300 4 3 2 8010.3829 7 1 201 8 2 6 8345.3681 5 1
300 4 3 1 8015.0520 15 2 201 8 3 6 8355.6399 5 2
300 5 2 4 8025.9204 50 1 201 8 4 5 8415.2465 5 1
300 5 2 3 8039.5574 30 1 201 8 5 4 8485.8124 20 1
300 6 4 2 8203.4075 50 1 201 8 7 2 8671.6790 10 2
300 8 0 8 8189.1651 50 1 201 8 7 1 8671.6786 30 2
201 9 0 9 8317.4512 5 1
201 0 0 0 7859.0987 30 1 201 9 1 9 8317.4700 10 1
201 1 0 1 7870.8256 3 2 201 9 1 8 8394.9087 6 2
201 1 1 1 7877.8095 3 2 201 9 2 8 8395.3102 50 1
201 1 1 0 7880.2649 13 1 201 9 2 7 8454.0287 5 1
201 2 0 2 7893.7031 3 2 201 9 3 6 8497.9509 20 1
201 2 1 2 7898.9272 3 3 201 9 4 6 8522.1068 30 1
201 2 1 1 7906.2191 9 1 201 9 4 5 8529.7560 5 1
201 2 2 1 7927.0785 6 2 201 10 0 10 8414.5426 10 1
201 2 2 0 7927.6195 5 2 201 10 1 10 8414.5449 3 2
201 3 0 3 7926.8028 3 2 201 10 2 9 8501.8718 5 1
201 3 1 2 7944.6727 3 2 201 11 0 11 8520.7934 5 1
201 3 2 2 7960.8569 3 2 201 11 1 10 8617.5427 8 1
201 3 2 1 7962.6104 3 2 201 12 1 12 8636.1043 5 1
201 3 3 1 8003.3149 5 1 201 13 0 13 8760.6732 8 1
201 3 3 0 8003.3956 3 2 201 13 1 13 8760.6765 16 1
201 4 0 4 7969.2600 3 2
201 4 1 4 7969.9966 3 2 003 1 0 1 8175.6408 5 1
201 4 1 3 7995.0298 3 2 003 1 1 0 8184.6376 20 1
201 4 2 3 8006.5714 3 2 003 2 2 1 8230.1617 50 1
201 4 2 2 8017.6368 5 2 003 2 2 0 8230.7802 50 2
201 4 3 2 8050.3230 3 3 003 3 0 3 8231.9890 5 1
201 4 3 1 8050.8411 3 2 003 3 1 3 8234.6734 3 2
201 4 4 1 8106.9060 20 1 003 3 1 2 8249.6426 3 2
201 4 4 0 8106.8991 40 1 003 4 1 4 8275.9911 4 1
201 5 0 5 8020.7292 3 2 003 4 2 3 8312.5704 8 1
201 5 1 5 8021.1923 3 2 003 4 3 2 8352.7391 8 1
201 5 1 4 8056.3758 3 2 003 4 4 0 8405.0337 20 1
201 5 2 3 8081.1701 30 1 003 5 0 5 8326.3691 3 2
201 5 3 2 8111.0717 3 3 003 5 1 4 8362.1790 6 2
201 5 4 2 8165.9038 5 1 003 5 2 3 8385.0147 4 1
201 5 4 1 8165.9589 5 1 003 5 3 2 8415.5295 7 1
201 5 5 1 8237.5192 3 2 003 6 1 6 8387.6501 3 2
201 5 5 0 8237.5226 3 2 003 6 3 4 8485.5219 50 1
201 6 1 6 8081.4135 3 3 003 6 6 1 8684.6083 8 1
201 6 1 5 8127.6371 5 1 003 6 6 0 8684.6083 16 1
201 6 2 5 8131.8233 3 2 003 7 0 7 8457.2227 5 1
201 6 2 4 8157.6312 40 1 003 7 3 4 8581.6987 5 1
201 6 3 4 8179.8758 3 2 003 8 1 8 8536.4837 4 2
201 6 3 3 8184.6766 5 1 003 9 2 8 8702.7862 20 1
201 6 4 3 8236.9742 3 2 003 9 4 6 8830.8104 20 1
Note: V1V2V3, vibrational quantum numbers; J, Ka, Kc, rotational quantum numbers; Energy (cm�1), experimental energy (term value); dE, standard error
in units of last digits of experimental term value; N, number of observed transitions used to define the energy level.
S.N. Mikhailenko et al. / Journal of Quantitative Spectroscopy & Radiative Transfer 111 (2010) 2185–21962194

Fig. 6. Stick-diagram of the lines observed in the 5600–8800 cm�1 range (panel A—HD16O lines, panel B—D216O lines, panel C—HD18O lines, panel
D—D218O lines, panel E—unassigned lines).
S.N. Mikhailenko et al. / Journal of Quantitative Spectroscopy & Radiative Transfer 111 (2010) 2185–2196 2195

S.N. Mikhailenko et al. / Journal of Quantitative Spectroscopy & Radiative Transfer 111 (2010) 2185–21962196
After having carefully assigned all possible lines presentin the 5600–8800 cm�1 region to HD16O, D2
16O, HD18O orD2
18O, some 2500 weak lines (intensity lower than 5�10�25
cm/molecule) are still left unassigned.The transitions and energy levels obtained in this study
could be used to create the next version of the HITRANdatabase as well as other databases aimed at atmospheric,planetary and astrophysical applications.
Acknowledgments
This work was supported in part by the program 2.10‘‘Optical Spectroscopy and Frequency Standards’’of Russian Academy of Science, by Grant no. RUG1-2954-TO-09 of CRDF (USA) and Grant no. 09-05-92508-NK_a by RFBR (Russia), by Grant no. 09-05-93105 of RFBRand CNRS (France), by Grant no. 06-03-39014 of RFBR andNSFC-China (Grant nos. 20903085 and 10574124), byFNRS (Belgium), by the Belgian Federal Science PolicyOffice (SSD program, SD/AT/01B), by the CommunauteFranc-aise de Belgique (Actions de Recherche Concertees)and by INSU, CNRS (France) through the Program National‘‘Les Enveloppes Fluides et l’Environnement-ChimieAtmospherique’’ (LEFE-ChAt).
S.T. acknowledges Dr. D.W. Schwenke for supplying hiscomputer code VTET which was used to calculate theoreticalline lists and the Reims University Computer Center forproviding an access to Romeo 2 Itanium cluster.
S.M. gratefully acknowledges support of the Groupe deSpectrometrie Moleculaire et Atmospherique (GSMA) ofthe Universite de Reims for giving him the opportunity tocontinue his research on the water spectra.
Authors also acknowledge the reviewers and JonathanTennyson for careful reading of the text and detailedcomments which enabled us to improve the quality of thepaper.
Appendix A. Supplementary material
Supplementary data associated with this articlecan be found in the online version at doi:10.1016/j.jqsrt.2010.01.028.
References
[1] Toth RA. Measurements of line positions and strengths of HD18Oand D2
18O in the 2500–4280 cm�1 region. J Mol Struct 2005;742:49–68.
[2] Liu AW, Du JH, Song KF, Wang L, Wan L, Hu SM. High-resolutionFourier-transform spectroscopy of 18O enriched water molecule inthe 1080–7800 cm�1 region. J Mol Spectrosc 2006;237:149–62.
[3] Ni HY, Liu AW, Song KF, Hu SM, Naumenko OV, Kruglova TV, et al.High-resolution spectroscopy of the triple-substituted isotopologueof water D2
18O: the first triad. Mol Phys 2008;106:1793–801.[4] Liu A, Naumenko O, Kassi S, Campargue A. High sensitivity
CW–CDRS of 18O enriched water near 1.6mm. JQSRT 2009;110:1781–800.
[5] Zelinger Z, Barret B, Kubat P, Ricaud P, Attie JL, Le Flochmoen E, et al.Observations of HD18O, CH3OH and vibrationally-excitedN2O from Odin/SMR measurements. Mol Phys 2006;104:2815–20.
[6] Rothman LS, Gordon IE, Barbe A, Benner DC, Bernath PF, Birk M, etal. The HITRAN 2008 molecular spectroscopic database. JQSRT2009;110:533–72.
[7] Mazzotti F, Tolchenov RN, Campargue A. High sensitivity ICLAS ofH2
18O in the region of the second decade (11 520–12 810 cm–1). JMol Spectrosc 2007;243:78–89.
[8] Toth RA. Air- and N2-broadening parameters of HDO and D2O, 709to 1936 cm�1. J Mol Spectrosc 1999;198:358–70.
[9] Daumont L, Jenouvrier A, Carleer M, Fally S, Hermans C, VandaeleAC, et al. High resolution Fourier transform spectroscopy ofwater deuterated species in the 5600–8800 cm�1 region. 21stColloquium on high-resolution molecular spectroscopy, Castellam-mare di Stabia, Italy, August 31–September 4 (2009),Poster L32.
[10] Partridge H, Schwenke DW. The determination of an accurateisotope dependent potential energy surface for water fromextensive ab initio calculations and experimental data. J Chem Phys1997;106:4618–39.
[11] Schwenke DW, Partridge H. Convergence testing of the analyticrepresentation of an ab initio dipole moment function for water:improved fitting yields improved intensities. J Chem Phys2000;113:6592–7.
[12] Tennyson J, Bernath PF, Brown LR, Campargue A, Carleer MR,Csaszar AG, et al. IUPAC critical evaluation of the rotational–vibrational spectra of water vapor. Part II. Energy levels andtransitions wavenumbers for HD16O, HD17O, and HD18O. JQSRT, tobe published.
[13] Tashkun SA, Perevalov VI, Teffo JL, Bykov AD, Lavrentieva NN.CDSD–1000, the high-temperature carbon dioxide spectroscopicdatabank. JQSRT 2003;82:165–96.
[14] Mikhailenko SN, Tashkun SA, Putilova TA, Starikova EN, Daumont L,Jenouvrier A, et al. Critical evaluation of measured rotation–vibration transitions and an experimental dataset of energy levelsof HD18O. JQSRT 2009;110:597–608.
[15] Steenbeckeliers G. Private communication. July 1971.[16] Fleming JW, Gibson MJ. Far-infrared absorption spectra of water
vapor H216O and isotopic modifications. J Mol Spectrosc 1976;62:
326–37.[17] Johns JWC. High-resolution far-infrared (20–350 cm�1) spectra of
several species of H2O. J Opt Soc Am B 1985;2:1340–54.[18] Toth RA. HD16O, HD18O, and HD17O transition frequencies and
strengths in the n2 bands. J Mol Spectrosc 1993;162:20–40.[19] Bellet J, Lafferty WJ, Steenbeckeliers G. Microwave spectra of D2
17Oand D2
18O. J Mol Spectrosc 1973;47:388–402.[20] Di Lonardo G, Fusina L. The n2 band of D2
18O. J Mol Spectrosc1989;135:250–8.
[21] Toth RA. D216O and D2
18O transition frequencies and strengths in then2 bands. J Mol Spectrosc 1993;162:41–54.
[22] Wang WF, Tan TL, Tan BL, Ong PP. The n2 bands of HD18O and D218O:
rovibrational constants and additional transitions. J Mol Spectrosc1996;176:226–8.


