Embed Size (px)
Citation preview
Undergraduate Economic Review Undergraduate Economic Review
Volume 4 Issue 1 Article 10
2008
Linking Depressed Earnings to Adolescent Depression Linking Depressed Earnings to Adolescent Depression
Emily Sands Princeton University
Follow this and additional works at: https://digitalcommons.iwu.edu/uer
Recommended Citation Sands, Emily (2008) "Linking Depressed Earnings to Adolescent Depression," Undergraduate Economic Review: Vol. 4 : Iss. 1 , Article 10. Available at: https://digitalcommons.iwu.edu/uer/vol4/iss1/10
This Article is protected by copyright and/or related rights. It has been brought to you by Digital Commons @ IWU with permission from the rights-holder(s). You are free to use this material in any way that is permitted by the copyright and related rights legislation that applies to your use. For other uses you need to obtain permission from the rights-holder(s) directly, unless additional rights are indicated by a Creative Commons license in the record and/ or on the work itself. This material has been accepted for inclusion by faculty at Illinois Wesleyan University. For more information, please contact [email protected]. ©Copyright is owned by the author of this document.
Linking Depressed Earnings to Adolescent Depression Linking Depressed Earnings to Adolescent Depression
Abstract Abstract In this study, I analyze empirically the ways in which adolescent depression depresses earnings in young adulthood. I test the prominent assertions that adolescent depression is predictive of young adult depression and of lower educational attainment, both of which are, in turn, predictive of lower earnings. I then expand upon the current literature by testing the assumption that those depressed in adolescence would benefit from staying in school. To that end, I first estimate the relationship between adolescent depression and returns to education. Since one relevant alternative to educational attainment is work experience, I then estimate the relationship between adolescent depression and returns to work experience. Finally, I compare the returns to educational attainment with the returns to work experience for individuals depressed in adolescence relative to the returns for their non-depressed peers; I make this comparison first using the full sample, and then using subsamples distinguished by gender, race, and socio-economic status (SES).
This article is available in Undergraduate Economic Review: https://digitalcommons.iwu.edu/uer/vol4/iss1/10
0
Linking Depressed Earnings to
Adolescent Depression
A Junior Independent Work Paper
by Emily Sands
Advisor: Dr. Christina Paxson
Submitted: 04/06/07
Princeton University
Department of Economics
This research uses data from Add Health, a program project designed by J. Richard Udry, Peter
S. Bearman, and Kathleen Mullan Harris, and funded by a grant P01-HD31921 from the
National Institute of Child Health and Human Development, with cooperative funding from 17
other agencies. Special acknowledgment is due Ronald R. Rindfuss and Barbara Entwisle for
assistance in the original design. Persons interested in obtaining data files from Add Health
should contact Add Health, Carolina Population Center, 123 W. Franklin Street, Chapel Hill, NC
27516-2524 (Add [email protected]).
I pledge my honor that this paper represents my own work in accordance with the University
Honor Code.
1
Sands: Linking Depressed Earnings to Adolescent Depression
Published by Digital Commons @ IWU, 2008
1
Introduction:
Depression is the primary cause of disability globally (WHO, 2007). A common mental
disorder affecting 119 million people, it strikes individuals of both genders, from diverse
backgrounds, and of all ages – particularly adolescents (NIMH, 2007). Peak depression rates
occur in mid- to late-adolescence, between the ages of fifteen and eighteen (Hankin et al., 1998).
When depression strikes in youth, the episodes tend to last longer and recur more frequently
(Greden, 2001). With symptoms including depressed mood, loss of interest, low self-esteem, and
trouble concentrating, depression in adolescence can have particularly deleterious implications
(WHO, 2007). In the short term, adolescent depression is emotionally distressing; in the long
term, it can limit educational advancement and job opportunities, thereby impeding upon success
in adulthood (Klein et al., 1997; Hamilton et al., 1997).
Given the high rates of adolescent depression and the potential severity of long-term
implications, the paucity of longitudinal study on the effects of adolescent depression on
economic success is surprising. Most studies on adolescent depression focus primarily on the
contributory factors or on the efficacy of treatments; granted, the potential severity of the
immediate consequences of depression – including suicide – creates a sense of urgency in
evaluation and treatment. However, understanding the mechanisms through which adolescent
depression can hinder success in adult life is also crucial, as it can help to maximize returns to
this particular human capital endowment.
In this study, I analyze empirically the ways in which adolescent depression depresses
earnings in young adulthood. I test the prominent assertions that adolescent depression is
predictive of young adult depression and of lower educational attainment, both of which are, in
turn, predictive of lower earnings. I then expand upon the current literature by testing the
2
Undergraduate Economic Review, Vol. 4 [2008], Iss. 1, Art. 10
https://digitalcommons.iwu.edu/uer/vol4/iss1/10
2
assumption that those depressed in adolescence would benefit from staying in school. To that
end, I first estimate the relationship between adolescent depression and returns to education.
Since one relevant alternative to educational attainment is work experience, I then estimate the
relationship between adolescent depression and returns to work experience. Finally, I compare
the returns to educational attainment with the returns to work experience for individuals
depressed in adolescence relative to the returns for their non-depressed peers; I make this
comparison first using the full sample, and then using subsamples distinguished by gender, race,
and socio-economic status (SES).
Literature Review:
Literature relevant to the relationship between adolescent depression and adult earnings
can be separated into two strands. The first links adolescent depression and adult depression. The
second links adolescent depression and lower educational attainment. Both adult depression and
lower educational attainment are, in turn, linked to lower earnings.
Adolescent depression has been shown to be predictive of adult depression. Analyzing an
epidemiologic sample of 776 individuals who were psychiatrically evaluated in 1983, 1985, and
1992, Pine et al. (1999) find that individuals with major depression in adolescence are at a two to
four times greater risk for depression in young adulthood as compared to those without major
depression in adolescence. This finding is consistent with clinical studies. Weissman et al.
(1999) examined seventy-three subjects with onset of major depressive disorder (MDD) in
adolescence as compared to thirty-seven controls with no evidence of psychiatric disorder,
performing follow-up studies ten to fifteen years after the initial assessment. They find a two-
fold increase in the risk of MDD in adult life among those with early-onset depression (relative
risk, 2.2 [95% confidence interval, 1.0-4.7; p<0.05]).
3
Sands: Linking Depressed Earnings to Adolescent Depression
Published by Digital Commons @ IWU, 2008
3
Adult depression is, in turn, correlated with lower labor force participation rates. Lerner
et al. (2004) followed 229 employees with depression and a healthy control group of 173
employees. They find that at the six-month follow-up, employees with depression have more
new unemployment as compared to the control group (12% as compared to 2%).
In cases where depressed individuals are employed, moreover, adult depression is
correlated with significantly more job turnover, absenteeism, and lost productive time. Depressed
employees have four times the job turnover of the control group (20% as compared to 5% at the
six-month follow-up) and four times the mean productivity loss (20.7±4 percent as compared to
5.2±3 percent) (Lerner et al., 2004). Stewart et al. (2003) find that depression reduces
performance while at work. Analyzing data from the American Productivity Audit, they
conclude that the average health-related lost productive time (LPT) among workers with
depression is markedly higher than among workers without depression (5.6 hours per week as
compared to 1.5 hours per week). Over eighty percent of depressed workers’ LPT is explained
by lower performance while at work.
With higher unemployment, job turnover, absenteeism, and lost productive time,
depressed adults have, on average, lower earnings as compared to their non-depressed
colleagues. Greenberg et al. (2003) used National Comorbidity Survey Replications (NCS-R)
diagnoses rates and statistics from the National Bureau of Labor Statistics to estimate the total
economic burden of depression in the US in 2000 at over $83 billion, up seven percent from
1990. Of this, the workplace costs of depression were an estimated $51.5 billion. Seventy percent
of these workplace costs were attributable to reduced productivity while at work; the remainder
was due to unemployment and absenteeism.
4
Undergraduate Economic Review, Vol. 4 [2008], Iss. 1, Art. 10
https://digitalcommons.iwu.edu/uer/vol4/iss1/10
4
Adolescent depression is correlated not only with adult depression, but also with lower
educational attainment, particularly among women. Asarnow et al. (2005) define low educational
attainment as more than two years behind in school or failure to complete high school by age
twenty. Examining a cross-sectional survey of 3,471 primary care patients aged 13 to 21 they
find that those adolescents who screen positive for depression are 1.5 times more likely to have
low educational attainment (CI 1.21-1.78; p<0.001). Similarly, Berndt et al. (2000) integrate the
data of 531 adult women with chronic depression with the 1995 Census Bureau data to find that
women with early-onset depression are less likely to graduate from college as compared to the
general female population (16% versus 23%).
In one of the few studies that uses a large, nationally-representative sample of adolescents
to examine adolescent depression, Currie and Stabile (2007) also find a positive correlation
between adolescent depression and low educational attainment. Using grade repetition as a
measure of low educational attainment, they analyze data from the Canadian National
Longitudinal Survey of Children and Youth and Add Health. They find that depression is
positively correlated with grade repetition at the one-percent significance level.
Lower educational attainment is, in turn, correlated with lower earnings. Upon studying
the lower educational attainment among female depressed adolescents, Berndt et al. (2000)
conclude that “a randomly selected 21-year-old woman with early onset major depressive
disorder in 1995 could expect future annual earnings that were 12%-18% lower than those of a
randomly selected 21-year-old woman whose onset of major depressive disorder occurred after
age 21 or not at all.” Thus, adolescent depression seems to impinge on success in adulthood in
part by reducing educational attainment and the accumulation of human capital.
5
Sands: Linking Depressed Earnings to Adolescent Depression
Published by Digital Commons @ IWU, 2008
5
Although the literature examines the correlation between adolescent depression and lower
earnings through adult depression and through lower educational attainment, it has yet to address
the correlation between adolescent depression and returns to education. Choices of educational
attainment are contingent on the perceived returns to schooling. If a variable that could lower
returns to schooling, such as depression, is known in advance or predictable by the individual
when making educational decisions, it is reasonable to assume that the decision of how far to go
in school will at least partially reflect this lower expected return.
It remains unclear, however, whether depressed adolescents’ lower average educational
attainment is justified by lower average returns to education. According to cognitive theory of
depression, depression is correlated with negative thoughts about oneself, the world, and one’s
future (Beck, 1963). Depressed individuals often report feeling that their lives have been failures
and that they are not as good as other people; they lack hope about the future. Comparing
normal, non-depressed psychiatric samples and depressed psychiatric samples of 12- to 17- year-
old adolescents, Kath and Zettle (1990) conclude that depressed individuals have more cognitive
distortions. The work of Haley et al. (1985) and Marton et al. (1993) confirm this finding.
Marton et al. also find that measures of cognitive distortion drop somewhat upon remission of
the depressive episode, but still persist at higher levels than among individuals not depressed in
adolescence. The combination of lower educational attainment and higher cognitive bias among
those depressed in adolescence begs the following question: To what extent is the decision of
depressed adolescents to go less far in school justified by lower returns to education?
The decision to pursue additional years of education could be influenced not only by
cognitive bias and by returns to schooling, but also by returns to work experience, a key relevant
alternative to educational attainment. To date, the literature relating depression to employment
6
Undergraduate Economic Review, Vol. 4 [2008], Iss. 1, Art. 10
https://digitalcommons.iwu.edu/uer/vol4/iss1/10
6
emphasizes the increased job turnover, absenteeism, and lost productive time among depressed
workers, as well as the correspondingly lower earnings (Lerner et al., 2004; Greenberg et al.,
2003); it has yet to analyze the returns to work experience following a depressive episode. Any
discrepancy between the returns to work experience for those depressed and not depressed in
adolescence could shed additional light on the decision of depressed adolescents to pursue fewer
years of education. Specifically, if depressed adolescents’ lower average educational attainment
is not justified by lower returns to education, perhaps it is justified by higher returns to work
experience.
Data: 1
I analyze results of the National Longitudinal Study of Adolescent Health (Add Health), a
school-based longitudinal study of adolescent health and young adult outcomes, using the
restricted use version of the data available to Princeton researchers subject to approval by the
suppliers of the data (Udry, 2003). I focus on the results of the 15,011 respondents who
completed both the 1994-1995 Wave I survey and the 2001-2002 Wave III survey, and who
responded to the full Feelings Scale in both waves. With this large, nationally representative
sample, the Add Health data facilitates generalization to the population of American adolescents.
At the time of Wave I, individuals in grades seven through twelve were administered an
in-school questionnaire and an in-home interview. The in-school questionnaire included
questions about gender, race, parents’ educational attainment, and grades in four core classes.
Parents’ educational attainment is the most common measure of SES in epidemiological studies
(Winkleby, 1992); as such, I define SES as the average level of parental educational attainment.
A proxy for school performance, GPA is calculated as the mean of the grades in each of four
core classes. Wave I also included the Add Health Peabody Picture Vocabulary Test, an abridged
1 My programs for coding and analyzing Add Health data are available upon request.
7
Sands: Linking Depressed Earnings to Adolescent Depression
Published by Digital Commons @ IWU, 2008
7
version of the Peabody Picture Vocabulary Test (PPVT), which has been used since 1959 to
assess verbal ability in English-speaking individuals of all ages (Dunn and Dunn, 1981). Total
scores on this 78 item test of receptive vocabulary are standardized by age and have been used
widely as a proxy for verbal ability (Stockman, 2000).
In both the Wave I and the Wave III in-home interviews, respondents were administered
a Feelings Scale nearly identical to The Center for Epidemiologic Studies Depression (CES-D)
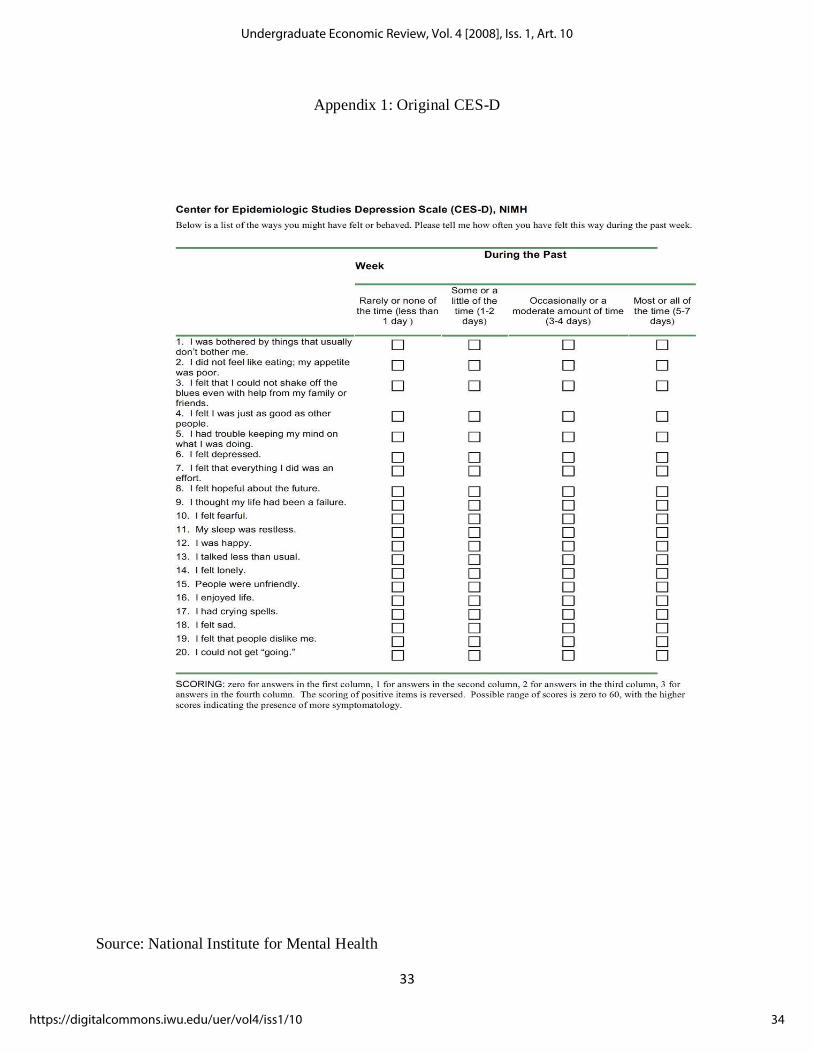
screener. The original CES-D, reproduced in Appendix 1, was developed in 1977 to measure
somatic and affective symptoms of depression in samples of adults (Radloff, 1977). It measures
frequency of depressive symptoms in the general population by employing twenty components
of depressive symptomology, including feelings of guilt and worthlessness, loss of appetite, and
psychomotor retardation. Respondents are asked how frequently they have experienced myriad
symptoms in the past week. Each depressive symptom is assigned a score on the basis of
frequency and the individual symptom scores are then summed for a total score ranging from 0
to 60. A score below sixteen is indicative of no depression, sixteen to twenty-three represents
mild depression, and twenty-four and above constitutes severe depression. Although developed
for use with adults, the CES-D has been used widely in research on adolescents as well (Phillips
et al., 2006; Radloff, 1999; Roberts et al., 1990; Roberts et al., 1991). At the time of Wave I,
respondents were administered the original CES-D with the single omission of the symptom,
“Sleep was restless” (Appendix 2); at the time of Wave III, the same individuals, now at the
approximate ages of 18 to 24, were administered a more condensed version, covering nine of the
nineteen symptoms tested in Wave I (Appendix 3).
I define Dep1994 as a measure of depression at the time of Wave I, and Dep2001 as a
measure of depression at the time of Wave III. Since Dep1994 and Dep2001 will often be used in
8
Undergraduate Economic Review, Vol. 4 [2008], Iss. 1, Art. 10
https://digitalcommons.iwu.edu/uer/vol4/iss1/10
8
tandem, I develop CES-D-equivalent scores for the variables based only on responses to the nine
questions that appeared in both surveys, thereby creating a consistent, abbreviated CES-D. The
abbreviated CES-D has been found to have reliability, validity, and dimensionality comparable
to the full version (Cornwell, 2003; Roberts et al., 1991; Turvey et al., 1999). Since total scores
on the abbreviated nine-question Feelings Scale range from 0 to 27, rescaling with multiplication
by 20
9 yields scores for the Wave I and Wave III data comparable not only to each other, but also
to the original CES-D. I define depression in both periods both as a continuous random variable
on the 0 to 60 CES-D scale and as binary variables, one each for mild and severe depression
(DepMildi=1 for 16 ≤ CES − D𝑖 < 24, DepMildi=0 otherwise; DepSeverei=1 for 24 ≤ CES − D𝑖,
DepSeverei=0 otherwise).
The in-home interview of Wave III also collected data on educational and employment
status. Respondents reported the highest year of regular school completed, any degrees or
diplomas received, and whether they were in school full-time, part-time, or not at all at the time
of the survey. They also reported whether they were employed in each of the years between
1995 and 2002. If employed in the contemporary year, 2001-2002, there is data on whether this
employment was full-time or part-time. Respondents were also asked to report personal earned
income, defined as income received from wages or salaries, tips, bonuses, overtime pay, and
income from self-employment in the current year. In cases where respondents were employed,
but stated they was unsure of their personal earned income, they were subsequently asked to
choose an income window of best fit; in this study, respondents who self-identified with a
particular income window will be assigned that window’s mid-point income.
During Wave III, respondents ranged in age from 18 to 24; at these young ages, many
were still in school. Although some attend school and work simultaneously, school is largely a
9
Sands: Linking Depressed Earnings to Adolescent Depression
Published by Digital Commons @ IWU, 2008
9
substitute for participation in the labor market; therefore, only on a subset of respondents am I
able to analyze earnings. In addition, all analysis of earnings using the currently available Add
Health data is an analysis not of long-term, eventual earnings, but rather of earnings in young
adulthood. Although these earnings are likely positively correlated with earnings later in life, any
extrapolation to the relationship between adolescent depression and eventual labor market
outcomes may be tenuous. Data from Add Health’s Wave IV will better illuminate the long-term
labor market outcomes.
Corroborating Linkages, Methodology and Results:
As discussed, the literature relevant to the relationship between adolescent depression and
labor market outcomes finds a positive correlation between adolescent depression and adult
depression and a negative correlation between adult depression and earnings; it also finds a
negative correlation between adolescent depression and educational attainment and a positive
correlation between educational attainment and earnings. Using Add Health data, I test these
relationships empirically. Throughout, I perform OLS regressions with robust standard errors.
I define earnings as ln(1+personal earned income) in line with Mincer (1958) and Becker
and Chiswick’s (1966) findings that the regression of the logarithm of earnings on years of
schooling is a direct result of the human capital model. This is consistent with Thurow (1969)
and Griliches and Mason’s (1972) findings that the logarithmic dependent variable best fits the
data on education, experience, and earnings. Card and Krueger (1992) and Heckman and
Polachek (1974) provide additional evidence in favor of the log-linear relationship.
Analysis of earnings is restricted by the young ages of respondents, nearly thirty percent
of whom are still in school full-time during Wave III (Table A); since those pursuing an
education are less likely to be in the labor force, earnings are negatively correlated with
10
Undergraduate Economic Review, Vol. 4 [2008], Iss. 1, Art. 10
https://digitalcommons.iwu.edu/uer/vol4/iss1/10
10
educational attainment in the full sample. I thus analyze the relationship between educational
attainment and earnings using two smaller samples. I tabulate schooling by year of birth and find
that most respondents born before 1979 are no longer in school. Sample A, then, consists of the
9,420 respondents born before 1979. This sample excludes some respondents already out of
school, thereby limiting efficiency of the estimators; dropping respondents on the basis of age,
however, engenders no selection bias. Sample B consists of the 10,765 respondents who, at the
time of Wave III, self-report not being in school full-time. Although this sample yields more
precise estimates, selecting on the basis of school attendance engenders some selection bias,
especially since depression affects earnings in part through its effects on education. In Samples
A and B reports of zero earnings provide valuable information about lack of involvement in
gainful activity; I therefore choose to define the dependent variable as ln(1+personal earned
income) instead of ln(personal earned income) because the latter definition would necessitate
dropping all respondents with zero earned income. Let lnE, then, denote the natural log of (1+
personal earned income) (Table A).
11
Sands: Linking Depressed Earnings to Adolescent Depression
Published by Digital Commons @ IWU, 2008
11
Table A: Corroborating Linkages, Summary Statistics
Mean Standard
Error Observations
1994 Depression CES-D 13.28 9.52 20,641
DepMild 0.17 0.37 20,641
DepSevere 0.14 0.35 20,641
2001 Depression CES-D 10.32 9.11 15,095
DepMild 0.11 0.31 15,095
DepSevere 0.09 0.29 15,095
Earnings LnE in Sample A 7.12 3.81 9,420
LnE in Sample B 7.25 3.85 10,765
Schooling Educational Attainment (Years) 13.19 1.97 15,011
School Full-Time 0.28 0.45 15,011
School Part-Time 0.09 0.29 15,011
I analyze the correlation between adolescent depression and young adult depression by
estimating regressions first with the binary variables
𝑬𝒒𝒖𝒂𝒕𝒊𝒐𝒏 (𝟏): 𝐷𝑒𝑝𝑀𝑖𝑙𝑑 𝑖 ,2001 = 𝜎𝑜 + 𝜎1𝐷𝑒𝑝𝑀𝑖𝑙𝑑 𝑖 ,1994+𝜎2𝐷𝑒𝑝𝑆𝑒𝑣𝑒𝑟𝑒𝑖 ,1994 + 𝜎3𝑋𝑖 + 𝑈𝑖
𝑬𝒒𝒖𝒂𝒕𝒊𝒐𝒏 (𝟐): 𝐷𝑒𝑝𝑆𝑒𝑣𝑒𝑟𝑒𝑖 ,2001 = 𝛼𝑜 + 𝛼1𝐷𝑒𝑝𝑀𝑖𝑙𝑑 𝑖 ,1994+𝛼2𝐷𝑒𝑝𝑆𝑒𝑣𝑒𝑟𝑒𝑖 ,1994 + 𝛼3𝑋𝑖 + 𝑈𝑖
where i indexes respondents and the vector X controls for race, gender, SES, and ability. It is
plausible that adolescents with scores too low to be diagnosed with even mild depression may
nonetheless have a higher probability of adult depression; I thus estimate a model with
depression measured continuously
𝑬𝒒𝒖𝒂𝒕𝒊𝒐𝒏 𝟑 : 𝐷𝑒𝑝𝑖 ,2001 = 𝜌𝑜 + 𝜌1𝐷𝑒𝑝𝑖 ,1994+𝜌3𝑋𝑖 + 𝑈𝑖
I find 𝜎1 ,𝜎2,𝛼1 ,𝛼2, and 𝜌1 all greater than zero at the one-percent significance level, confirming
Garrison et al.’s (1997) findings that depression is recurrent and thus that adolescent depression
is predictive of young adult depression (Table B).
Using the available data on young adult earnings, I next regress
12
Undergraduate Economic Review, Vol. 4 [2008], Iss. 1, Art. 10
https://digitalcommons.iwu.edu/uer/vol4/iss1/10
12
𝑬𝒒𝒖𝒂𝒕𝒊𝒐𝒏 (𝟒): lnE𝑖 ,2001 = 𝜃𝑜 + 𝜃1 𝐷𝑒𝑝𝑖 ,2001 + 𝜃4𝐾𝑖 + 𝑈𝑖
where the vector K controls for race, gender, SES, ability, and educational attainment. With both
Samples A and B, I find that young adult depression is negatively correlated with lnE at the one-
percent significance level (Table B). Consistent with the literature, then, I find that the negative
correlation between adolescent depression and young adult earnings acts in part through the
positive correlation between adolescent depression and young adult depression and, in turn,
through the negative correlation between young adult depression and young adult earnings.
Returning to the full sample of 15,011 observations and regressing
𝑬𝒒𝒖𝒂𝒕𝒊𝒐𝒏 (𝟓): 𝐸𝑑𝐴𝑡𝑡𝑎𝑖𝑛𝑖 = 𝜏𝑜 + 𝜏1𝐷𝑒𝑝𝑖 ,1994 + 𝜏2𝑌𝑖 + 𝑈𝑖:
where the vector Y controls for race, gender, SES, ability, and age, I find 𝜏1 < 0 at the one-
percent significance level (𝜏1 = -0.0329, standard error 0.0017). This holds when controlling not
only for gender, race, SES, and ability, but also for depression in young adulthood (Equation 7,
Table B). These estimates confirm Asarnow et al. (2005), Currie and Stabile (2007), and Berndt
et al.’s (2000) findings that adolescent depression is negatively correlated with educational
attainment.
To study the relationship between educational attainment and earnings, I then estimate
the model
𝑬𝒒𝒖𝒂𝒕𝒊𝒐𝒏 𝟕 : ln 𝐸𝑖,2001 = 𝜇𝑜 + 𝜇1𝐸𝑑𝐴𝑡𝑡𝑎𝑖𝑛𝑖+𝜇2𝑌𝑖 + 𝑈𝑖
I find that an additional year of education is correlated with approximately nine percent higher
earnings in Sample A and seventeen percent higher earnings in Sample B (standard errors 0.0194
and 0.0200, respectively) (Table B). Indeed, individuals depressed in adolescence seem to earn
less in young adulthood in part because they have lower educational attainment, which is, in turn,
correlated with lower earnings.
13
Sands: Linking Depressed Earnings to Adolescent Depression
Published by Digital Commons @ IWU, 2008
13
Table B: Corroborating Linkages, Results
Coefficients on and Standard Errors (in parentheses)
Explanatory Variable
Sample (Obs)
Mild Young Adult Depression (1)
Severe Young Adult Depression (2)
Young Adult CES-D (3) lnE (4)
Educational Attainment (5)
Educational Attainment (6) lnE (7)
Mild Adolescent Depression
Full (15,011)
0.0601*** (0.0081)
0.0632*** (0.0071)
Severe Adolescent Depression
Full (15,011)
0.1080*** (0.0092)
0.1454*** (0.0091)
Adolescent CES-D
Full (15,011)
0.2940*** (0.0090)
-0.0329*** (0.0017)
-0.0257*** (0.0018)
Young Adult CES-D
Full (15,011)
-0.0251*** (0.0017)
A (9,420)
-0.0229***
-0.00439
B (10,765)
-0.0228*** (0.0040)
Educational Attainment
A (9,420)
0.0907*** (0.0194)
B (10,765)
0.1689*** (0.0200)
(***) Estimates are significant at the 1% significance level
Results of the Add Health surveys, then, are consistent with previous findings that
adolescent depression is correlated with lower young adult earnings in part through its positive
correlation with young adult depression and in part through its negative correlation with
educational attainment. The latter has been interpreted as indicating that the lower average
educational attainment among individuals depressed in adolescence restricts their development
of human capital. As Berndt et al. (2000) note,
“The clinical trial data provides strong empirical support for the hypothesis that
early-onset major depressive disorder adversely affects the final educational attainment. .
. . The negative educational attainment effect for women constitutes one form of lost
human capital from early-onset major depressive disorder. . . . While employment rates
for patients with early- and late-onset major depressive disorder were similar, the reduced
14
Undergraduate Economic Review, Vol. 4 [2008], Iss. 1, Art. 10
https://digitalcommons.iwu.edu/uer/vol4/iss1/10
14
educational attainment of women with early-onset major depressive disorder results in
lower expected income.”
The view that lower educational attainment among individuals depressed in adolescence results
in lower expected income, however, relies on a key assumption; it assumes that, for the
depressed individual in particular, continuing in school has not only positive returns, but also
more substantial returns than does the relevant alternative. I turn now to a test of this assumption.
Testing the Assumption, Methodology and Results:
First, abstracting from the alternatives to educational attainment, I test if the returns to
education are positive for depressed individuals. Positive returns to education for the average
individual have repeatedly been shown empirically (Becker, 1964; Card, 1995); positive returns
for the depressed individual, however, have not. Second, I note that positive returns to education
do not suffice to show that depressed individuals would benefit from staying in school; rather,
the returns to educational attainment must exceed the returns to its relevant alternative. After
showing that it is valid to treat work experience as a relevant alternative to educational
attainment, I compare the returns to work experience and educational attainment for those
depressed in adolescence with the returns to each for their non-depressed peers. I estimate two
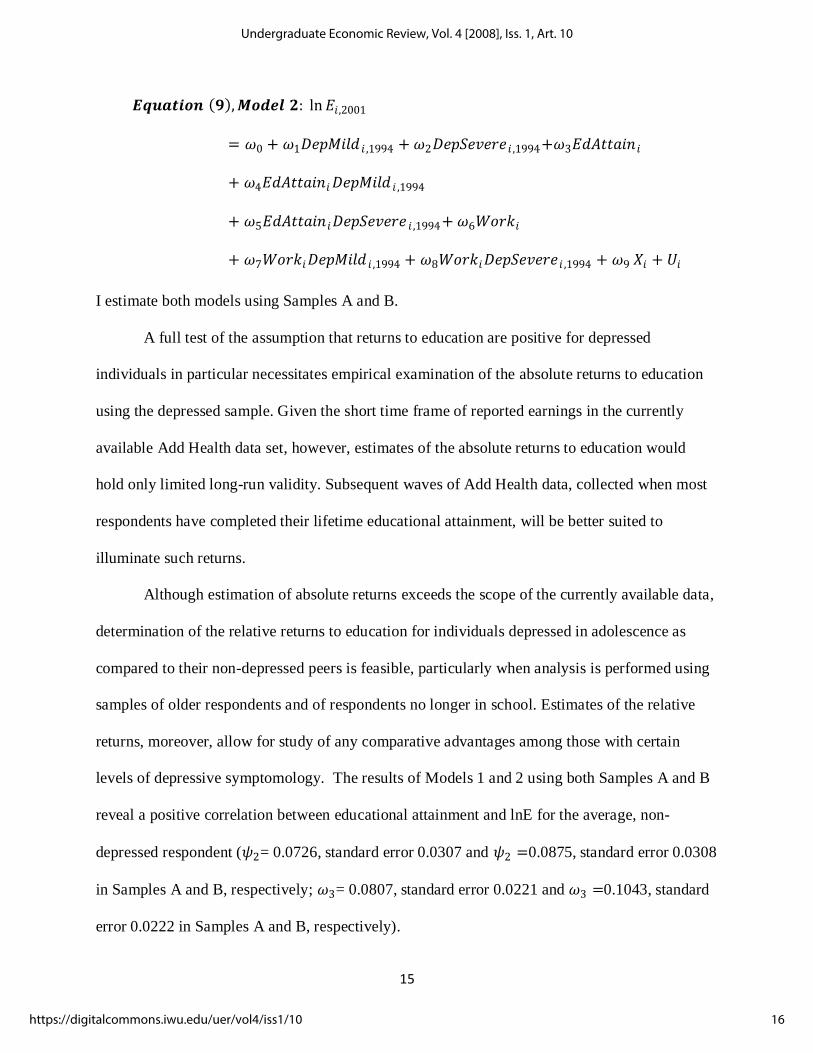
models. First, defining depression in adolescence as a continuous random variable, I estimate
𝑬𝒒𝒖𝒂𝒕𝒊𝒐𝒏 𝟖 ,𝑴𝒐𝒅𝒆𝒍 𝟏: ln 𝐸𝑖,2001
= 𝜓0 + 𝜓1𝐷𝑒𝑝𝑖 ,1994 + 𝜓2𝐸𝑑𝐴𝑡𝑡𝑎𝑖𝑛 𝑖 + 𝜓3𝐸𝑑𝐴𝑡𝑡𝑎𝑖𝑛𝑖𝐷𝑒𝑝𝑖 ,1994
+ 𝜓4𝑊𝑜𝑟𝑘𝑖 + 𝜓5𝑊𝑜𝑟𝑘𝑖𝐷𝑒𝑝𝑖 ,1994 + 𝜓6𝑋𝑖 + 𝑈𝑖
Second, defining depression in adolescence as two binary variables, one each for mild and severe
depression, I estimate
15
Sands: Linking Depressed Earnings to Adolescent Depression
Published by Digital Commons @ IWU, 2008
15
𝑬𝒒𝒖𝒂𝒕𝒊𝒐𝒏 𝟗 ,𝑴𝒐𝒅𝒆𝒍 𝟐: ln 𝐸𝑖,2001
= 𝜔0 + 𝜔1𝐷𝑒𝑝𝑀𝑖𝑙𝑑 𝑖 ,1994 + 𝜔2𝐷𝑒𝑝𝑆𝑒𝑣𝑒𝑟𝑒𝑖 ,1994+𝜔3𝐸𝑑𝐴𝑡𝑡𝑎𝑖𝑛 𝑖
+ 𝜔4𝐸𝑑𝐴𝑡𝑡𝑎𝑖𝑛𝑖𝐷𝑒𝑝𝑀𝑖𝑙𝑑 𝑖 ,1994
+ 𝜔5𝐸𝑑𝐴𝑡𝑡𝑎𝑖𝑛𝑖𝐷𝑒𝑝𝑆𝑒𝑣𝑒𝑟𝑒 𝑖 ,1994+ 𝜔6𝑊𝑜𝑟𝑘𝑖
+ 𝜔7𝑊𝑜𝑟𝑘𝑖𝐷𝑒𝑝𝑀𝑖𝑙𝑑 𝑖 ,1994 + 𝜔8𝑊𝑜𝑟𝑘𝑖𝐷𝑒𝑝𝑆𝑒𝑣𝑒𝑟𝑒𝑖 ,1994 + 𝜔9
𝑋𝑖 + 𝑈𝑖
I estimate both models using Samples A and B.
A full test of the assumption that returns to education are positive for depressed
individuals in particular necessitates empirical examination of the absolute returns to education
using the depressed sample. Given the short time frame of reported earnings in the currently
available Add Health data set, however, estimates of the absolute returns to education would
hold only limited long-run validity. Subsequent waves of Add Health data, collected when most
respondents have completed their lifetime educational attainment, will be better suited to
illuminate such returns.
Although estimation of absolute returns exceeds the scope of the currently available data,
determination of the relative returns to education for individuals depressed in adolescence as
compared to their non-depressed peers is feasible, particularly when analysis is performed using
samples of older respondents and of respondents no longer in school. Estimates of the relative
returns, moreover, allow for study of any comparative advantages among those with certain
levels of depressive symptomology. The results of Models 1 and 2 using both Samples A and B
reveal a positive correlation between educational attainment and lnE for the average, non-
depressed respondent (𝜓2= 0.0726, standard error 0.0307 and 𝜓2 =0.0875, standard error 0.0308
in Samples A and B, respectively; 𝜔3= 0.0807, standard error 0.0221 and 𝜔3 =0.1043, standard
error 0.0222 in Samples A and B, respectively).
16
Undergraduate Economic Review, Vol. 4 [2008], Iss. 1, Art. 10
https://digitalcommons.iwu.edu/uer/vol4/iss1/10
16
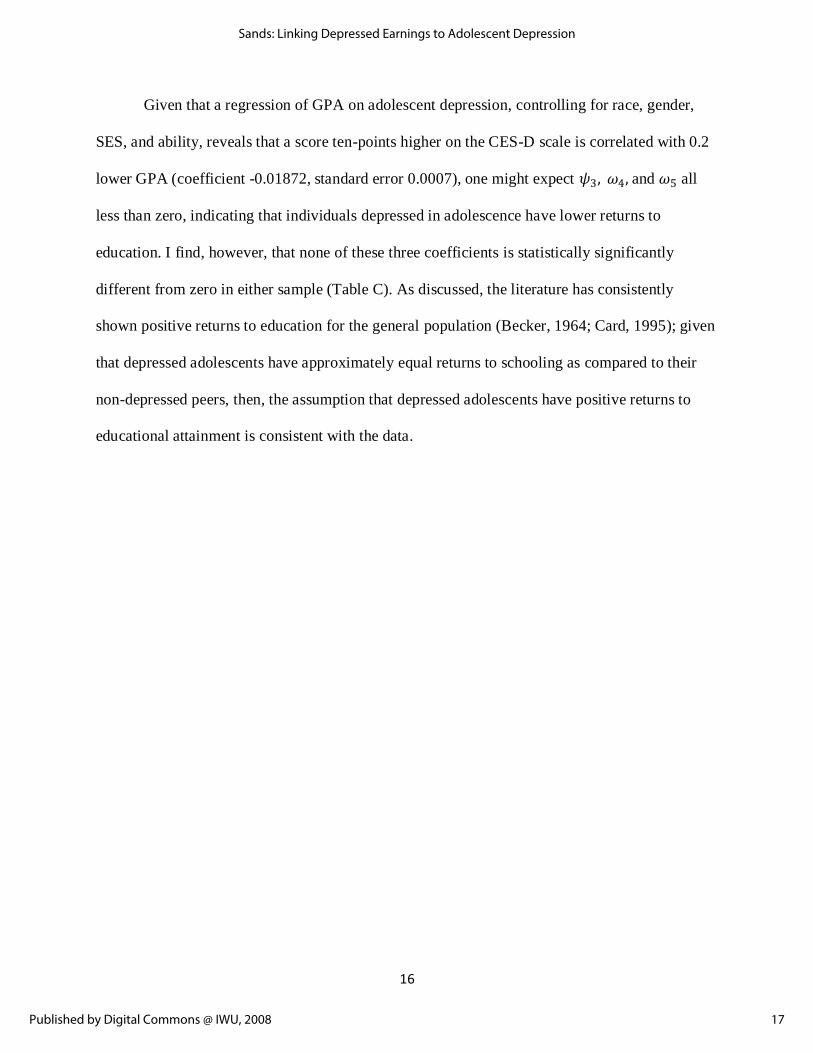
Given that a regression of GPA on adolescent depression, controlling for race, gender,
SES, and ability, reveals that a score ten-points higher on the CES-D scale is correlated with 0.2
lower GPA (coefficient -0.01872, standard error 0.0007), one might expect 𝜓3, 𝜔4, and 𝜔5 all
less than zero, indicating that individuals depressed in adolescence have lower returns to
education. I find, however, that none of these three coefficients is statistically significantly
different from zero in either sample (Table C). As discussed, the literature has consistently
shown positive returns to education for the general population (Becker, 1964; Card, 1995); given
that depressed adolescents have approximately equal returns to schooling as compared to their
non-depressed peers, then, the assumption that depressed adolescents have positive returns to
educational attainment is consistent with the data.
17
Sands: Linking Depressed Earnings to Adolescent Depression
Published by Digital Commons @ IWU, 2008
17
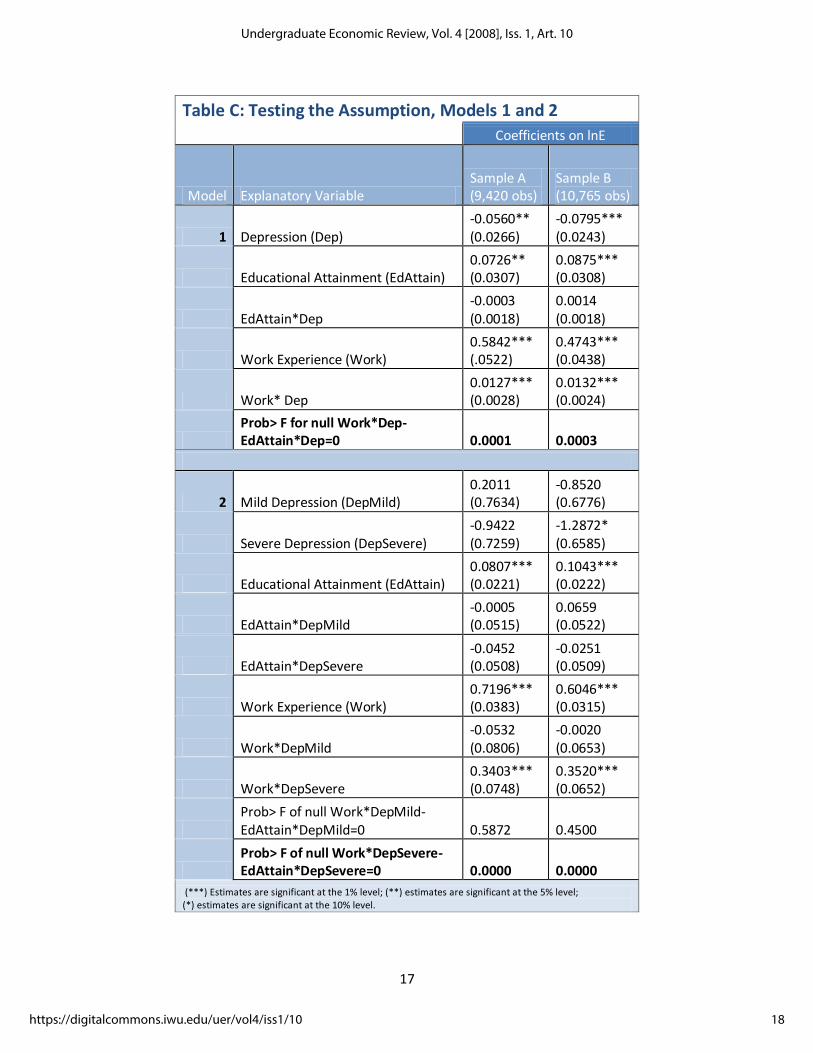
Table C: Testing the Assumption, Models 1 and 2
Coefficients on lnE
Model Explanatory Variable Sample A (9,420 obs)
Sample B (10,765 obs)
1 Depression (Dep) -0.0560** (0.0266)
-0.0795*** (0.0243)
Educational Attainment (EdAttain) 0.0726** (0.0307)
0.0875*** (0.0308)
EdAttain*Dep -0.0003 (0.0018)
0.0014 (0.0018)
Work Experience (Work) 0.5842*** (.0522)
0.4743*** (0.0438)
Work* Dep 0.0127*** (0.0028)
0.0132*** (0.0024)
Prob> F for null Work*Dep-EdAttain*Dep=0 0.0001 0.0003
2 Mild Depression (DepMild) 0.2011 (0.7634)
-0.8520 (0.6776)
Severe Depression (DepSevere) -0.9422 (0.7259)
-1.2872* (0.6585)
Educational Attainment (EdAttain) 0.0807*** (0.0221)
0.1043*** (0.0222)
EdAttain*DepMild -0.0005 (0.0515)
0.0659 (0.0522)
EdAttain*DepSevere -0.0452 (0.0508)
-0.0251 (0.0509)
Work Experience (Work) 0.7196*** (0.0383)
0.6046*** (0.0315)
Work*DepMild -0.0532 (0.0806)
-0.0020 (0.0653)
Work*DepSevere 0.3403*** (0.0748)
0.3520*** (0.0652)
Prob> F of null Work*DepMild-EdAttain*DepMild=0 0.5872 0.4500
Prob> F of null Work*DepSevere-EdAttain*DepSevere=0 0.0000 0.0000
(***) Estimates are significant at the 1% level; (**) estimates are significant at the 5% level; (*) estimates are significant at the 10% level.
18
Undergraduate Economic Review, Vol. 4 [2008], Iss. 1, Art. 10
https://digitalcommons.iwu.edu/uer/vol4/iss1/10
18
Second, I test if continuing in school is more beneficial than the relevant alternative
among those depressed in adolescence. Although work experience and educational attainment
are sometimes pursued simultaneously, it is valid to treat work experience as a relevant
alternative to schooling. A full test of the extent to which work experience and educational
attainment are substitutes in each year from 1995 to 2001 is not feasible since the Add Health
data has a direct measure only of whether a respondent was working in each year, and not of
whether he was in school; both variables are, however, available for 2001. I thus estimate
𝑬𝒒𝒖𝒂𝒕𝒊𝒐𝒏 𝟏𝟎 : 𝑊𝑜𝑟𝑘𝑖 ,2001 = 𝜂𝑜 + 𝜂1𝑆𝑐ℎ𝑜𝑜𝑙𝐹𝑢𝑙𝑙 𝑖 ,2001 + 𝜂2𝑅𝑖 + 𝑈𝑖
where the vector R controls for gender, race, SES, ability, and depression in both periods. I find,
as expected, that full-time school attendance is negatively correlated with employment at the
one-percent significance level; specifically, respondents in school full-time at the time of Wave
III are forty percent less likely simultaneously to be working (𝜂1 = -0.3921, standard error
0.0126).
Work experience is an alternative to educational attainment not only in the full sample,
but also in the depressed sample in particular. I twice estimate
𝑬𝒒𝒖𝒂𝒕𝒊𝒐𝒏 𝟏𝟏 : 𝑊𝑜𝑟𝑘𝑋 = 𝜆𝑜 + 𝜆1𝐷𝑒𝑝𝑖 ,1994 + 𝜆2𝑋𝑖 + 𝑈𝑖
for each year X = [1995, 1996, (. . .) , 2000], once controlling only for race, gender, SES, ability,
and age, and once when controlling also for educational attainment. In the later case, 𝜆1 is
significantly larger than in the former case, indicating that the higher work experience of
depressed adolescents is directly related to their lower educational attainment (Table D).
Justification for the view that depressed adolescents should stay in school, then, necessitates
evidence that, for depressed individuals in particular, educational attainment is more rewarding
than the relevant alternative of work experience.
19
Sands: Linking Depressed Earnings to Adolescent Depression
Published by Digital Commons @ IWU, 2008
19
Table D: Adolescent Depression and Work Experience Coefficient and Standard Error (in parentheses)
Variable Work95 Work96 Work97 Work98 Work99 Work00
Dep1 (1)
0.0037*** (0.0004)
0.0029*** (0.0004)
0.0017*** (0.0004)
0.0007*** (0.0003)
-0.0002 (0.0003)
-0.0006** (0.0003)
Dep1 (2)
0.0045*** (0.0004)
0.0038*** (0.0004)
0.0023*** (0.0004)
0.0011*** (0.0003)
0.0000 (0.0003)
-0.0003 (0.0003)
(***) Estimates are significant at the 1% level; (**) estimates are significant at the 5% level. Results based on 15,011 observations
The control variables in (1) are gender, race, SES, ability, and age; in (2), the control variable of educational attainment is appended to the preceding list.
I now compare the returns to an additional year of schooling with the returns to an
additional year of work experience for individuals depressed in adolescence. As discussed with
regards to estimating the absolute returns to schooling, empirical challenges in estimating the
absolute returns to work experience abound; nonetheless, as before, it is feasible to estimate the
returns to work experience for depressed adolescents using as a base value the returns to work
experience for their non-depressed peers. Note, however, that these comparisons are still based
on the short-run returns in the young adult labor market; release of the Wave IV data set will
provide insight into longer-term returns.
In Samples A and B I find, as expected, a positive correlation between work experience
and lnE (𝜓4=0.5842, standard error 0.0522 and 𝜓4=0.4743, standard error 0.0438 in Samples A
and B, respectively; 𝜔6=0.7196, standard error 0.0383 and 𝜔6=0.6046, standard error 0.0315 in
Samples A and B, respectively). Of particular interest, I find also that individuals depressed in
adolescence have higher returns to work experience than do their non-depressed peers. In both
samples, the results of Model 1 indicate that a ten-point higher CES-D score in adolescence is
correlated with about thirteen percent higher young adult earnings returns to each year of work
20
Undergraduate Economic Review, Vol. 4 [2008], Iss. 1, Art. 10
https://digitalcommons.iwu.edu/uer/vol4/iss1/10
20
experience. The coefficient of this interaction term is significant at the one-percent level
(𝜓5=0.0127, standard error 0.0028 and 𝜓5=0.0132, standard error 0.0024 in Samples A and B,
respectively). Additionally, the results of Model 2 indicate that, although respondents with mild
adolescent depression have approximately equal returns to work experience as compared to those
with no depressive symptomology, respondents with severe adolescent depression have about
thirty-five percent higher young adult earnings returns to each year of work experience (𝜔7=-
0.0532, standard error 0.0806 and 𝜔7=-0.0020, standard error 0.0653 in Samples A and B,
respectively; 𝜔8=0.3403, standard error 0.0748 and 𝜔7=0.3520, standard error 0.0652 in
Samples A and B, respectively)
To illuminate the time frame in which these higher returns to work experience are
accrued by those depressed in adolescence, I next regress
𝑬𝒒𝒖𝒂𝒕𝒊𝒐𝒏 𝟏𝟐 : ln 𝐸𝑖,2001 = 𝛽𝑜 + 𝛽1𝐷𝑒𝑝𝑖 ,1994 + 𝛽2𝐸𝑑𝐴𝑡𝑡𝑎𝑖𝑛𝑖 + 𝛽3𝐸𝑑𝐴𝑡𝑡𝑎𝑖𝑛 𝑖𝐷𝑒𝑝𝑖 ,1994 +
𝛽4𝑊𝑜𝑟𝑘95𝑖 + 𝛽5𝑊𝑜𝑟𝑘96𝑖 +
𝛽6𝑊𝑜𝑟𝑘97𝑖+𝛽7𝑊𝑜𝑟𝑘98𝑖+𝛽8𝑊𝑜𝑟𝑘99𝑖+𝛽9𝑊𝑜𝑟𝑘00𝑖 +𝛽10𝑊𝑜𝑟𝑘95 ∗ 𝐷𝑒𝑝𝑖 ,1994+𝛽11𝑊𝑜𝑟𝑘96 ∗
𝐷𝑒𝑝𝑖 ,1994+𝛽12𝑊𝑜𝑟𝑘97 ∗ 𝐷𝑒𝑝𝑖 ,1994+𝛽13𝑊𝑜𝑟𝑘98 ∗ 𝐷𝑒𝑝𝑖 ,1994+𝛽14𝑊𝑜𝑟𝑘99 ∗
𝐷𝑒𝑝𝑖 ,1994+𝛽15𝑊𝑜𝑟𝑘00 ∗ 𝐷𝑒𝑝𝑖 ,1994+𝛽16𝑋𝑖 + 𝑈𝑖
Although the estimated values of 𝛽11 ,𝛽12 , 𝛽13 ,𝛽14 , and 𝛽15 are all positive, the estimated value
of 𝛽10 is slightly negative in both samples and none of these coefficients is statistically
significant. I do, however, fail to reject the null that 𝛽10 = 𝛽11 = 𝛽12 = 𝛽13 = 𝛽14 = 𝛽15 in both
Samples A and B, evidence that adolescent depression does not merely temporarily increase the
labor-market returns to work experience, but rather may create sustained higher returns (F(5,
9391)=0.94, Prob>F=0.4522 and F(5, 10,733)=1.90, Prob>F=0.0902 for Samples A and B,
respectively). The higher returns to work experience among those depressed in adolescence for
21
Sands: Linking Depressed Earnings to Adolescent Depression
Published by Digital Commons @ IWU, 2008
21
at least the five years following a depressive episode may partially justify the decision of
individuals depressed in adolescence to enter the work force instead of pursuing additional years
of education.
Having found empirically that individuals depressed in adolescence have equal young
adult earnings returns to educational attainment and higher young adult earnings returns to work
experience as compared to their non-depressed peers, I next perform F-tests on the coefficients
of these interaction terms. With Model 1, I reject the null that 𝜓3 = 𝜓5in favor of the
alternative 𝜓3 < 𝜓5 . This result holds with both Samples A and B at the one-percent significance
level. With Model 2, I fail to reject the null that 𝜔4 = 𝜔7; meantime, I reject the null that
𝜔5 = 𝜔8 in favor of the alternative that 𝜔5 < 𝜔8 . Those with severe depression in adolescence,
then, have a comparative advantage in the acquisition of human capital through work experience
over their peers with mild or low levels of adolescent depressive symptomology. While the Add
Health data reveals that the returns to educational attainment are approximately equal for those
depressed and not depressed in adolescence, evidence that depression is correlated with higher
returns to work experience calls into question the assertion that depressed adolescents who
choose to work would benefit from instead staying in school (Berndt et al., 2000).
Note that the positive correlation between adolescent depression and returns to work
experience does not imply that each individual depressed in adolescence would have higher
returns to work experience than his non-depressed peer; the correlation need not be taken as
indication of a causal relationship. I have controlled manually for race, gender, SES, educational
attainment, and ability across individuals, but a host of confounding variables could be cited.
One could argue, for example, that working amid depression is correlated with the more general
22
Undergraduate Economic Review, Vol. 4 [2008], Iss. 1, Art. 10
https://digitalcommons.iwu.edu/uer/vol4/iss1/10
22
personality trait of persistence, and that this persistence – and not the depressive episode – results
in higher returns to work experience.
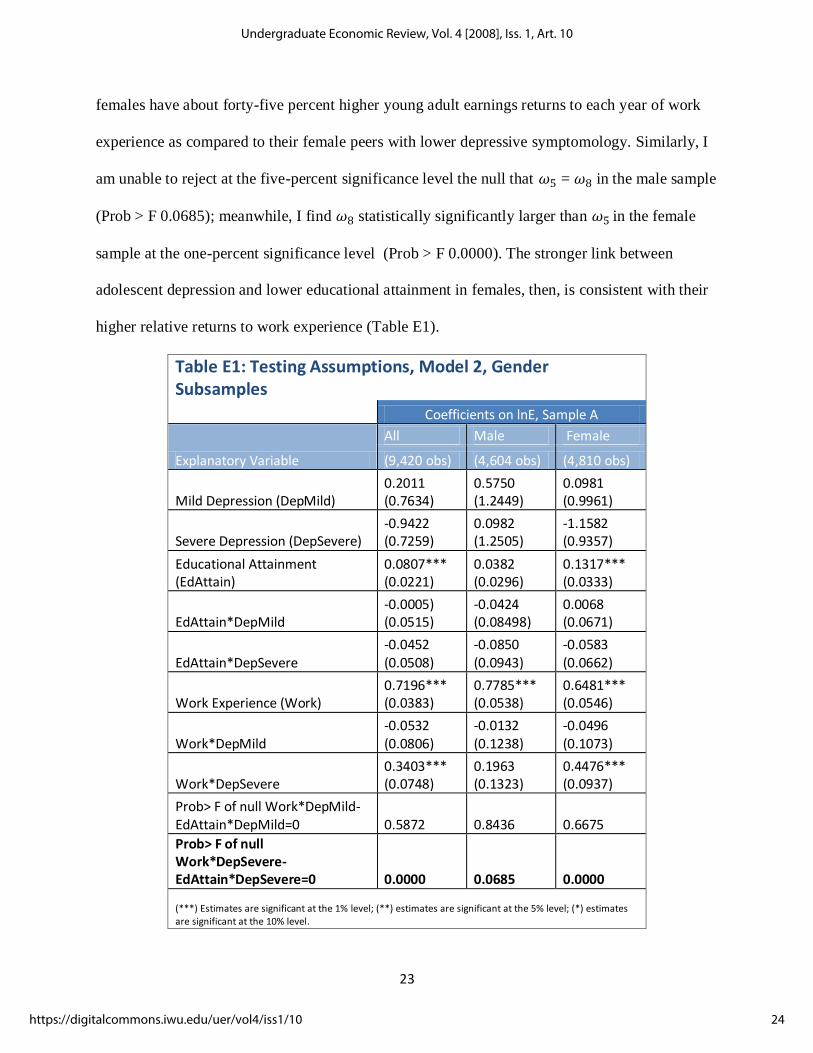
Testing the Assumption on Subsamples, Methodology and Results:
Having found a comparative advantage in the acquisition of human capital through work
experience for those with severe depression in adolescence using Samples A and B, I turn now to
a similar analysis using subsamples. I focus on Model 2 in order to illuminate the relationship
between severe depression in particular and the returns to educational attainment and work
experience; I use Sample A to minimize selection bias, separating the sample by gender, race,
and SES.
Analyzing the Add Health data, Fletcher (2007) finds no statistically significant
relationship between adolescent depression and educational attainment among males, but finds
that female adolescents with depression are 3.5 percentage points less likely to graduate from
high school as compared to those without depression; this is consistent with previous findings
that depression primarily affects female educational attainment (Berndt et al., 2000; Ding et al.,
2006). In light of these findings, I test if there are gender differences in the relative returns to
educational attainment and work experience for those depressed in adolescence. To that end, I re-
estimate Model 2 using each of two approximately equally-sized subsamples. The first is
comprised of the male respondents in Sample A; the second, of the female respondents.
With the male subsample, I am unable to reject at the ten-percent significance level the
null that the returns to work experience are equal across levels of depressive
symptomology (𝜔8 = 0.1963, standard error 0.1323). In the female subsample, however, I find
that those severely depressed in adolescence have higher returns to work-experience at the one-
percent significance level (𝜔8 = 0.4476, standard error 0.0937); specifically, severely depressed
23
Sands: Linking Depressed Earnings to Adolescent Depression
Published by Digital Commons @ IWU, 2008
23
females have about forty-five percent higher young adult earnings returns to each year of work
experience as compared to their female peers with lower depressive symptomology. Similarly, I
am unable to reject at the five-percent significance level the null that 𝜔5 = 𝜔8 in the male sample
(Prob > F 0.0685); meanwhile, I find 𝜔8 statistically significantly larger than 𝜔5 in the female
sample at the one-percent significance level (Prob > F 0.0000). The stronger link between
adolescent depression and lower educational attainment in females, then, is consistent with their
higher relative returns to work experience (Table E1).
Table E1: Testing Assumptions, Model 2, Gender Subsamples
Coefficients on lnE, Sample A
Explanatory Variable
All Male Female
(9,420 obs) (4,604 obs) (4,810 obs)
Mild Depression (DepMild) 0.2011 (0.7634)
0.5750 (1.2449)
0.0981 (0.9961)
Severe Depression (DepSevere) -0.9422 (0.7259)
0.0982 (1.2505)
-1.1582 (0.9357)
Educational Attainment (EdAttain)
0.0807*** (0.0221)
0.0382 (0.0296)
0.1317*** (0.0333)
EdAttain*DepMild -0.0005) (0.0515)
-0.0424 (0.08498)
0.0068 (0.0671)
EdAttain*DepSevere -0.0452 (0.0508)
-0.0850 (0.0943)
-0.0583 (0.0662)
Work Experience (Work) 0.7196*** (0.0383)
0.7785*** (0.0538)
0.6481*** (0.0546)
Work*DepMild -0.0532 (0.0806)
-0.0132 (0.1238)
-0.0496 (0.1073)
Work*DepSevere 0.3403*** (0.0748)
0.1963 (0.1323)
0.4476*** (0.0937)
Prob> F of null Work*DepMild-EdAttain*DepMild=0 0.5872 0.8436 0.6675
Prob> F of null Work*DepSevere-EdAttain*DepSevere=0 0.0000 0.0685 0.0000
(***) Estimates are significant at the 1% level; (**) estimates are significant at the 5% level; (*) estimates are significant at the 10% level.
24
Undergraduate Economic Review, Vol. 4 [2008], Iss. 1, Art. 10
https://digitalcommons.iwu.edu/uer/vol4/iss1/10
24
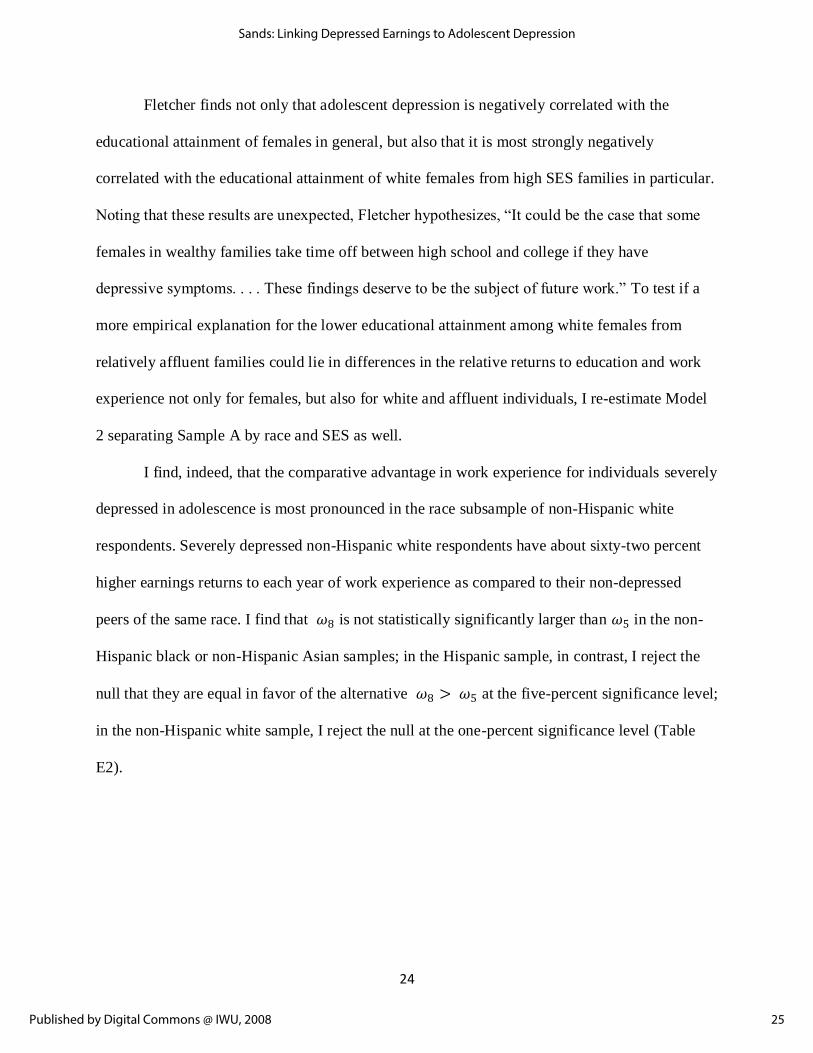
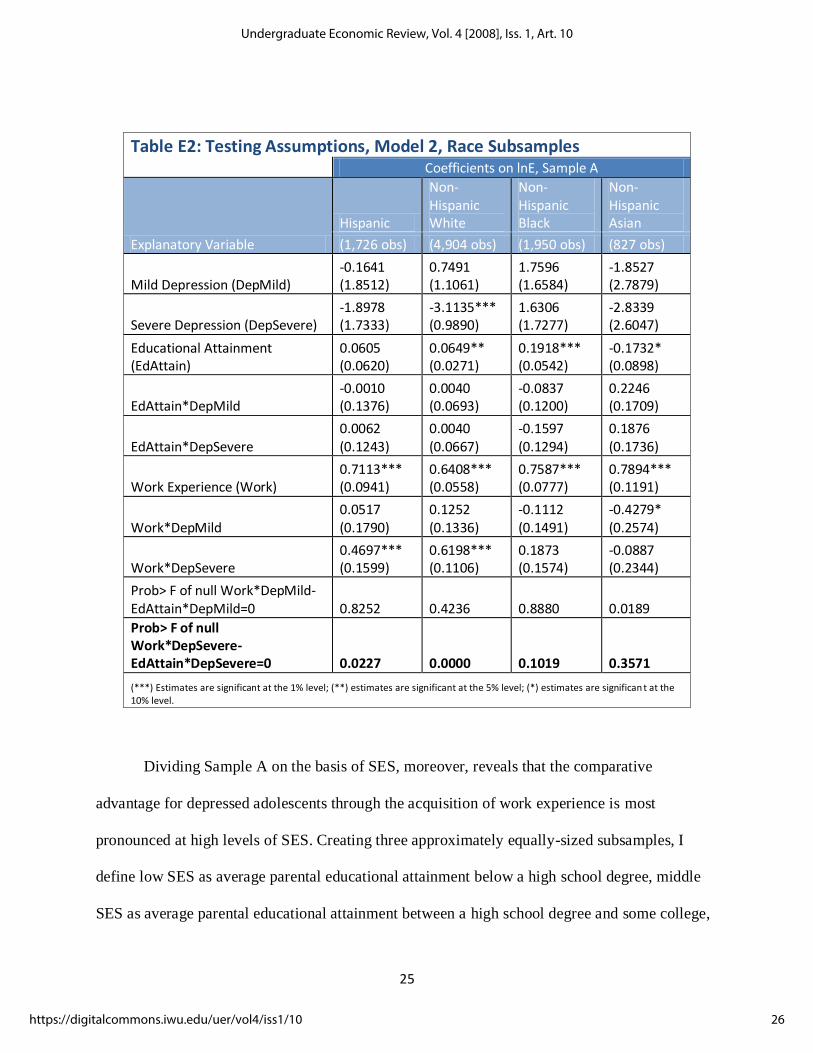
Fletcher finds not only that adolescent depression is negatively correlated with the
educational attainment of females in general, but also that it is most strongly negatively
correlated with the educational attainment of white females from high SES families in particular.
Noting that these results are unexpected, Fletcher hypothesizes, “It could be the case that some
females in wealthy families take time off between high school and college if they have
depressive symptoms. . . . These findings deserve to be the subject of future work.” To test if a
more empirical explanation for the lower educational attainment among white females from
relatively affluent families could lie in differences in the relative returns to education and work
experience not only for females, but also for white and affluent individuals, I re-estimate Model
2 separating Sample A by race and SES as well.
I find, indeed, that the comparative advantage in work experience for individuals severely
depressed in adolescence is most pronounced in the race subsample of non-Hispanic white
respondents. Severely depressed non-Hispanic white respondents have about sixty-two percent
higher earnings returns to each year of work experience as compared to their non-depressed
peers of the same race. I find that 𝜔8 is not statistically significantly larger than 𝜔5 in the non-
Hispanic black or non-Hispanic Asian samples; in the Hispanic sample, in contrast, I reject the
null that they are equal in favor of the alternative 𝜔8 > 𝜔5 at the five-percent significance level;
in the non-Hispanic white sample, I reject the null at the one-percent significance level (Table
E2).
25
Sands: Linking Depressed Earnings to Adolescent Depression
Published by Digital Commons @ IWU, 2008
25
Table E2: Testing Assumptions, Model 2, Race Subsamples Coefficients on lnE, Sample A
Explanatory Variable
Hispanic
Non-Hispanic White
Non-Hispanic Black
Non-Hispanic Asian
(1,726 obs) (4,904 obs) (1,950 obs) (827 obs)
Mild Depression (DepMild) -0.1641 (1.8512)
0.7491 (1.1061)
1.7596 (1.6584)
-1.8527 (2.7879)
Severe Depression (DepSevere) -1.8978 (1.7333)
-3.1135*** (0.9890)
1.6306 (1.7277)
-2.8339 (2.6047)
Educational Attainment (EdAttain)
0.0605 (0.0620)
0.0649** (0.0271)
0.1918*** (0.0542)
-0.1732* (0.0898)
EdAttain*DepMild -0.0010 (0.1376)
0.0040 (0.0693)
-0.0837 (0.1200)
0.2246 (0.1709)
EdAttain*DepSevere 0.0062 (0.1243)
0.0040 (0.0667)
-0.1597 (0.1294)
0.1876 (0.1736)
Work Experience (Work) 0.7113*** (0.0941)
0.6408*** (0.0558)
0.7587*** (0.0777)
0.7894*** (0.1191)
Work*DepMild 0.0517 (0.1790)
0.1252 (0.1336)
-0.1112 (0.1491)
-0.4279* (0.2574)
Work*DepSevere 0.4697*** (0.1599)
0.6198*** (0.1106)
0.1873 (0.1574)
-0.0887 (0.2344)
Prob> F of null Work*DepMild-EdAttain*DepMild=0 0.8252 0.4236 0.8880 0.0189
Prob> F of null Work*DepSevere-EdAttain*DepSevere=0 0.0227 0.0000 0.1019 0.3571
(***) Estimates are significant at the 1% level; (**) estimates are significant at the 5% level; (*) estimates are significan t at the 10% level.
Dividing Sample A on the basis of SES, moreover, reveals that the comparative
advantage for depressed adolescents through the acquisition of work experience is most
pronounced at high levels of SES. Creating three approximately equally-sized subsamples, I
define low SES as average parental educational attainment below a high school degree, middle
SES as average parental educational attainment between a high school degree and some college,
26
Undergraduate Economic Review, Vol. 4 [2008], Iss. 1, Art. 10
https://digitalcommons.iwu.edu/uer/vol4/iss1/10
26
inclusive, and high SES as average parental educational attainment of a college degree or above.
I find that I am unable to reject the null that the relative returns to work experience and
educational attainment are equal in the low and middle SES subsamples at the ten-percent
significance level. I do, however, reject the null that they are equal in favor of the alternative that
severely depressed adolescents have higher returns to work experience in the high SES
subsample at the one-percent significance level (Table E3). Consistent with Fletcher’s findings
that the strongest negative correlation between adolescent depression and educational attainment
exists among white females from affluent families, then, I find that the highest relative returns to
work experience for those with severe adolescent depression exist among females, non-Hispanic
whites, and individuals of high SES.
27
Sands: Linking Depressed Earnings to Adolescent Depression
Published by Digital Commons @ IWU, 2008
27
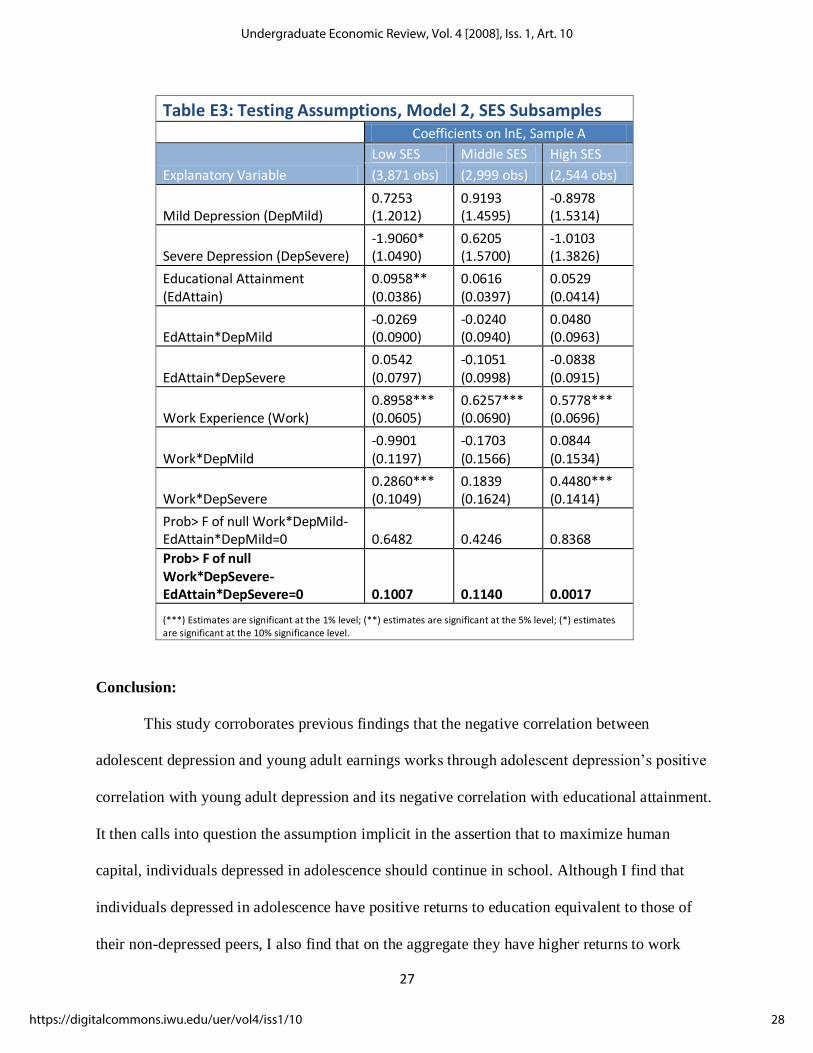
Table E3: Testing Assumptions, Model 2, SES Subsamples Coefficients on lnE, Sample A
Explanatory Variable
Low SES Middle SES High SES
(3,871 obs) (2,999 obs) (2,544 obs)
Mild Depression (DepMild) 0.7253 (1.2012)
0.9193 (1.4595)
-0.8978 (1.5314)
Severe Depression (DepSevere) -1.9060* (1.0490)
0.6205 (1.5700)
-1.0103 (1.3826)
Educational Attainment (EdAttain)
0.0958** (0.0386)
0.0616 (0.0397)
0.0529 (0.0414)
EdAttain*DepMild -0.0269 (0.0900)
-0.0240 (0.0940)
0.0480 (0.0963)
EdAttain*DepSevere 0.0542 (0.0797)
-0.1051 (0.0998)
-0.0838 (0.0915)
Work Experience (Work) 0.8958*** (0.0605)
0.6257*** (0.0690)
0.5778*** (0.0696)
Work*DepMild -0.9901 (0.1197)
-0.1703 (0.1566)
0.0844 (0.1534)
Work*DepSevere 0.2860*** (0.1049)
0.1839 (0.1624)
0.4480*** (0.1414)
Prob> F of null Work*DepMild-EdAttain*DepMild=0 0.6482 0.4246 0.8368
Prob> F of null Work*DepSevere-EdAttain*DepSevere=0 0.1007 0.1140 0.0017
(***) Estimates are significant at the 1% level; (**) estimates are significant at the 5% level; (*) estimates are significant at the 10% significance level.
Conclusion:
This study corroborates previous findings that the negative correlation between
adolescent depression and young adult earnings works through adolescent depression’s positive
correlation with young adult depression and its negative correlation with educational attainment.
It then calls into question the assumption implicit in the assertion that to maximize human
capital, individuals depressed in adolescence should continue in school. Although I find that
individuals depressed in adolescence have positive returns to education equivalent to those of
their non-depressed peers, I also find that on the aggregate they have higher returns to work
28
Undergraduate Economic Review, Vol. 4 [2008], Iss. 1, Art. 10
https://digitalcommons.iwu.edu/uer/vol4/iss1/10
28
experience than do respondents not depressed in adolescence. In particular, I find that the higher
returns to work experience among those with severe adolescent depression are most pronounced
among women, non-Hispanic whites, and individuals of high SES. Interestingly, the literature
has found that it is precisely white, affluent females who experience the strongest negative
correlation between adolescent depression and educational attainment (Fletcher, 2007).
Note that I compare not the absolute returns to educational attainment and to work
experience, but rather the relative returns for individuals depressed in adolescence, taking as
given the returns for their non-depressed peers. I select the relative analysis since, given the short
time-span of the currently available longitudinal data, any attempt at an absolute comparison
could well misrepresent long-run returns. Additional waves of Add Health will soon expand the
data on earnings, thereby facilitating just such an analysis of eventual returns to education and to
work experience. At that time, an analysis of the absolute returns will provide a more definitive
understanding of the trade-offs between educational attainment and work experience for those
depressed in adolescence. 2
2 I have sincere gratitude for all Dr. Christina Paxson insights, advice, and suggestions. Many
thanks to Nandita Gawade for her guidance throughout the process, to Dr. Andres Aradillas-
Lopez for his comments on methodology, to Thu Vu for her assistance accessing the Add Health
dataset, to Alexis Furuichi and Oscar Torres-Reyna for their assistance coding, and to my
parents, Bob and Sally Sands, for all our discussions. Holger Staude provided excellent editing.
29
Sands: Linking Depressed Earnings to Adolescent Depression
Published by Digital Commons @ IWU, 2008
29
Works Cited
Allgood-Merten, Betty (1990). Sex differences and adolescent depression. Journal of abnormal
psychology, 99(1), 55
Anderson, Katheryn (1993). The effect of deviance during adolescence on the choice of jobs.
Southern economic journal, 60(2), 341
Asarnow, Joan. (2005). Depression and role impairment among adolescents in primary care
clinics. Journal of adolescent health, 37(6), 477
Beck, A. T. (1963). Thinking and Depression: Idiosyncratic Content and Cognitive Distortions.
Archives of general psychiatry, 9, 324
Becker, Gary. and Chiswick, R. Education and the Distribution of Earnings . American
Economic Review, (56), 358.
Becker, Gary S. (1964), Human capital: a theoretical and empirical analysis, with special
reference to education (Columbia University Press, New York).
Berndt, Earst R. (2000). Lost human capital from early-onset chronic depression. The American
journal of psychiatry, 157(6), 940
Card, David (1995), “Earnings, schooling, and ability revisited” in Solomon Polachek, ed,
Research in labor economics, Vol. 14 (JAI Press, Greenwich, CT)
Cornwell, B. 2002. The dynamic properties of social support: decay, growth, and staticity, and
their effects on adolescent depression. Docial Forces 81(3) 953-978.
Cseh, Attila. (2006). Mental health and the labor market.
Currie, Janet, & Stabile, M. (2007). Mental health in childhood and human capital. National
Bureau of Economic Research, Diagnostic and statistical manual of mental disorders .
Ding, Weili . (2006). The impact of poor health on education: New evidence using genetic
markers
Fletcher, Jasom M. (2007) Adolescent depression: diagnosis, treatment, and educational
attainment. Health Economics.
Garber, Judy. (1988). Recurrent depression in adolescents: A follow-up study. Journal of the
American Academy of Child Adolescent Psychiatry, 27(1), 49
Garrison, Carol Z. (1997). Incidence of major depressive disorder and dysthymia in young
adolescents. Journal of the American Academy of Child Adolescent Psychiatry, 36(4), 458
30
Undergraduate Economic Review, Vol. 4 [2008], Iss. 1, Art. 10
https://digitalcommons.iwu.edu/uer/vol4/iss1/10
30
Gilman, Stephen E. (2003). Socio-economic status, family disruption and residential stability in
childhood: Relation to onset, recurrence and remission of major depression. Psychological
medicine, 33(8), 1341
Glied, Sherry (2002). Consequences and correlates of adolescent depression. Archives of
pediatrics adolescent medicine, 156(10), 1009
Greden, John F. (2001). The burden of recurrent depression: Causes, consequences, and future
prospects. The Journal of clinical psychiatry, 62 Suppl 22, 5
Greenberg, Paul E. (2003). The economic burden of depression in the United States: How did it
change between 1990 and 2000? The Journal of clinical psychiatry, 64(12), 1465
Griliches, Zvi (1977). Estimating the Returns to Schooling: Some Econometric Problems.
Econometrica, Vol. 45, No. 1.
Griliches, Zvi and Mason, William M. (1972). Education, income and ability. Journal of
Political Economy, 80(3, Part II), 74.
Haley, Glenn M. (1985). Cognitive bias and depression in psychiatrically disturbed children and
adolescents. Journal of consulting and clinical psychology, 53(4), 535
Hamilton V, Merrigan P, Dufresne E. 1997. Down and out: estimating the relationship between
mental health and unemployment. Health Economics 6: 397-406
Hankin, Benjamin L. (1998) Development of Depression from Preadolescence to Young
Adulthood: Emering Gender Differences in a 10-Year Longitudinal Study. Journal of
Abnormal Psychology, Vol. 107, No 1, 128-140.
Heckman, James. (1974). Empirical evidence on the functional form of the earnings-schooling
relationship. Journal of the American Statistical Association, 69(346), 350
Jofre-Bonet, Mireia (2005). Poor mental health and smoking: Interactive impact on wages. The
journal of mental health policy and economics, 8(4), 193
Kauth, Michael R. (1990). Validation of depression measures in adolescent populations. Journal
of clinical psychology, 46(3), 291
Klein, Daniel N. (1997). Psychosocial characteristics of adolescents with a past history of
dysthymic disorder: Comparison with adolescents with past histories of major depressive
and non-affective disorders, and never mentally ill controls. Journal of Affective Disorders,
42(2-3), 127
Knyspel, Mary. Mental health global policies and human rights-edited by morrall, P. and
hazelton, M. and the economics of gender and mental illness-edited by marcotte, DE and
wilcox-gok, V.
31
Sands: Linking Depressed Earnings to Adolescent Depression
Published by Digital Commons @ IWU, 2008
31
Lerner, Debra. (2004). Unemployment, job retention, and productivity loss among employees
with depression. Psychiatric services, 55(12), 1371
Lewinsohn, Peter. M. (1993). Adolescent psychopathology: I. prevalence and incidence of
depression and other DSM-III-R disorders in high school students. Journal of abnormal
psychology, 102(1), 133
Lewinsohn, Peter. M. (1998). Treatment of adolescent depression: Frequency of services and
impact on functioning in young adulthood. Depression and anxiety, 7(1), 47
Marton, P. (1993). Cognitive distortion in depressed adolescents. Journal of psychiatry
neuroscience, 18(3), 103
Miech, Richard. (1999). Low socioeconomic status and mental disorders: A longitudinal study of
selection and causation during young adulthood. The American journal of sociology, 104(4),
1096
Mincer, Jacob. (1958). Investment in human capital and personal income distribution. Journal of
Political Economy, (66), 281.
National Institute of Mental Health. (2007). The numbers count: Mental disorders in america.
Retrieved October 28, 2007, from http://www.nimh.nih.gov/health/publications/the-
numbers-count-mental-disorders-in-america.shtml#Mood
Phillips, Glenn. (2006). The center for epidemiologic studies depression scale with a young
adolescent population: A confirmatory factor analysis. Multivariate behavioral research,
41(2), 147
Pine, Daniel S., Cohen, E., Cohen, P., & Brook, J. (1999). Adolescent depressive symptoms as
predictors of adult depression: Moodiness or mood disorder? American Journal of
Psychiatry, 156(1), 133-135.
Pinto, Aureen (1996). Negative affect and cognitive biases in suicidal and nonsuicidal
hospitalized adolescents. Journal of the American Academy of Child and Adolescent
Psychiatry, 35(2), 158
Radloff, Lenore Sawyer. (1977). The CES-D scale: A self-report depression scale for research in
the general population. Applied psychological measurement, 1(3), 385
Radloff, Lenore Sawyer. (1991). The use of the center for epidemiologic studies depression scale
in adolescents and young adults. Journal of Youth and Adolescence, 20(2), 149
Roberts R, Lewinsohn P, Seeley J. 1991 Screening for adolescent depression: a comparison of
depression scales. Jounal of the American Academy for Child Adolescent Psychiatry 30(1):
58-66.
32
Undergraduate Economic Review, Vol. 4 [2008], Iss. 1, Art. 10
https://digitalcommons.iwu.edu/uer/vol4/iss1/10
32
Stockman, Ida J. (2000). The new peabody picture vocabulary test-III an illusion of unbiased
assessment? Language, speech hearing services in schools, 31(4), 340
Thurow, Lester. (Ed.). (1969). Poverty and discrimination. Washington, D.C.: The Brookings
Institution.
Turvey, Carolyn L. (1999). A revised CES-D measure of depressive symptoms and a DSM-
based measure of major depressive episodes in the elderly. International psychogeriatrics,
11(2), 139
Udry, J. R. 2003. The National Longitudinal Study of Adolescent Health (Add Health), Waves I
& II, 1994–1996; Wave III, 2001–2002 [machine-readable data file and documentation].
Chapel Hill, NC: Carolina Population Center, University of North Carolina at Chapel Hill.
Weissman, Myrna A. (1999). Depressed adolescents grown up. JAMA, 281(18), 1707
Williams, Daniel R. (1997). Racial differences in physical and mental health: Socio-economic
status, stress and discrimination. Journal of health psychology, 2(3), 335
World Health Organization. (2007). Mental health: Depression. Retrieved October 20, 2007,
from http://www.who.int/mental_health/management/depression/definition/en/
Zimmerman, Frederick J. (2005). Social and economic determinants of disparities in professional
help-seeking for child mental health problems: Evidence from a national sample. Health
services research, 40(5 Pt 1), 1514
33
Sands: Linking Depressed Earnings to Adolescent Depression
Published by Digital Commons @ IWU, 2008
33
Appendix 1: Original CES-D
Source: National Institute for Mental Health
34
Undergraduate Economic Review, Vol. 4 [2008], Iss. 1, Art. 10
https://digitalcommons.iwu.edu/uer/vol4/iss1/10
34
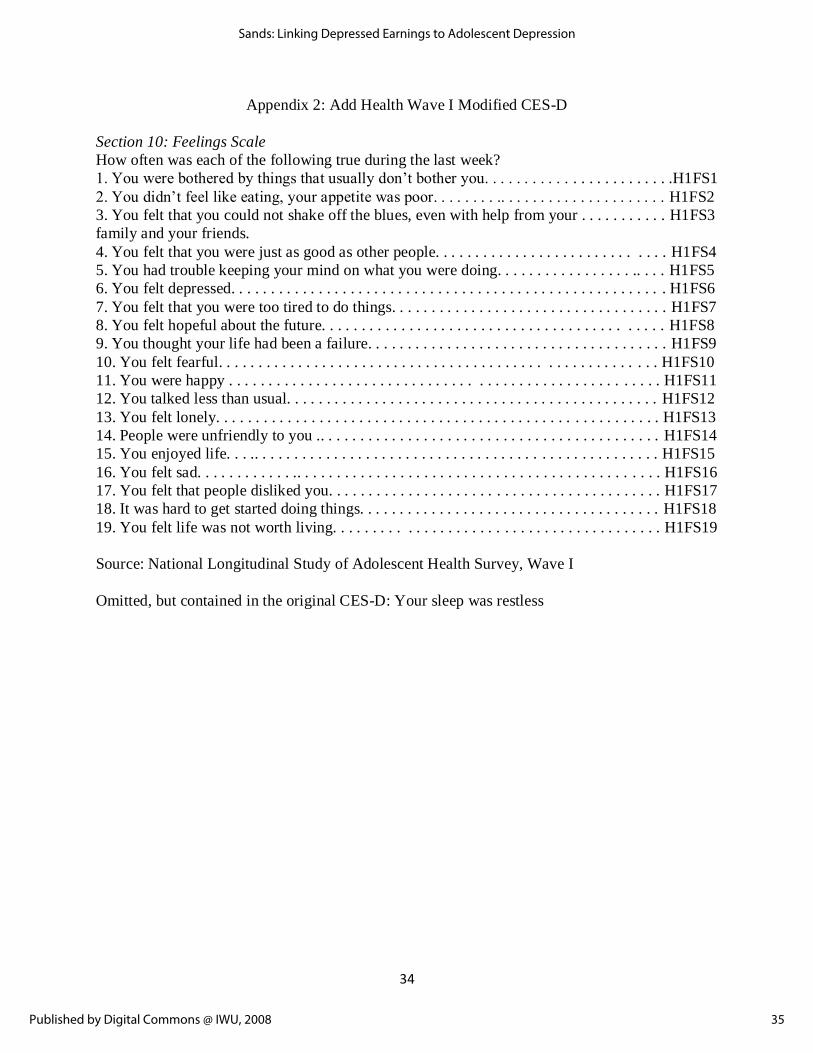
Appendix 2: Add Health Wave I Modified CES-D
Section 10: Feelings Scale
How often was each of the following true during the last week?
1. You were bothered by things that usually don’t bother you. . . . . . . . . . . . . . . . . . . . . . . .H1FS1
2. You didn’t feel like eating, your appetite was poor. . . . . . . . .. . . . . . . . . . . . . . . . . . . . . H1FS2
3. You felt that you could not shake off the blues, even with help from your . . . . . . . . . . . H1FS3
family and your friends.
4. You felt that you were just as good as other people. . . . . . . . . . . . . . . . . . . . . . . . . . . . . H1FS4
5. You had trouble keeping your mind on what you were doing. . . . . . . . . . . . . . . . . .. . . . H1FS5
6. You felt depressed. . . . . . . . . . . . . . . . . . . . . . . . . . . . . . . . . . . . . . . . . . . . . . . . . . . . . . . H1FS6
7. You felt that you were too tired to do things. . . . . . . . . . . . . . . . . . . . . . . . . . . . . . . . . . . H1FS7
8. You felt hopeful about the future. . . . . . . . . . . . . . . . . . . . . . . . . . . . . . . . . . . . . . . . . . . H1FS8
9. You thought your life had been a failure. . . . . . . . . . . . . . . . . . . . . . . . . . . . . . . . . . . . . . H1FS9
10. You felt fearful. . . . . . . . . . . . . . . . . . . . . . . . . . . . . . . . . . . . . . . . . . . . . . . . . . . . . . . H1FS10
11. You were happy . . . . . . . . . . . . . . . . . . . . . . . . . . . . . . . . . . . . . . . . . . . . . . . . . . . . . . H1FS11
12. You talked less than usual. . . . . . . . . . . . . . . . . . . . . . . . . . . . . . . . . . . . . . . . . . . . . . . H1FS12
13. You felt lonely. . . . . . . . . . . . . . . . . . . . . . . . . . . . . . . . . . . . . . . . . . . . . . . . . . . . . . . . H1FS13
14. People were unfriendly to you .. . . . . . . . . . . . . . . . . . . . . . . . . . . . . . . . . . . . . . . . . . . H1FS14
15. You enjoyed life. . . .. . . . . . . . . . . . . . . . . . . . . . . . . . . . . . . . . . . . . . . . . . . . . . . . . . . H1FS15
16. You felt sad. . . . . . . . . . . . .. . . . . . . . . . . . . . . . . . . . . . . . . . . . . . . . . . . . . . . . . . . . . . H1FS16
17. You felt that people disliked you. . . . . . . . . . . . . . . . . . . . . . . . . . . . . . . . . . . . . . . . . . H1FS17
18. It was hard to get started doing things. . . . . . . . . . . . . . . . . . . . . . . . . . . . . . . . . . . . . . H1FS18
19. You felt life was not worth living. . . . . . . . . . . . . . . . . . . . . . . . . . . . . . . . . . . . . . . . . H1FS19
Source: National Longitudinal Study of Adolescent Health Survey, Wave I
Omitted, but contained in the original CES-D: Your sleep was restless
35
Sands: Linking Depressed Earnings to Adolescent Depression
Published by Digital Commons @ IWU, 2008
35
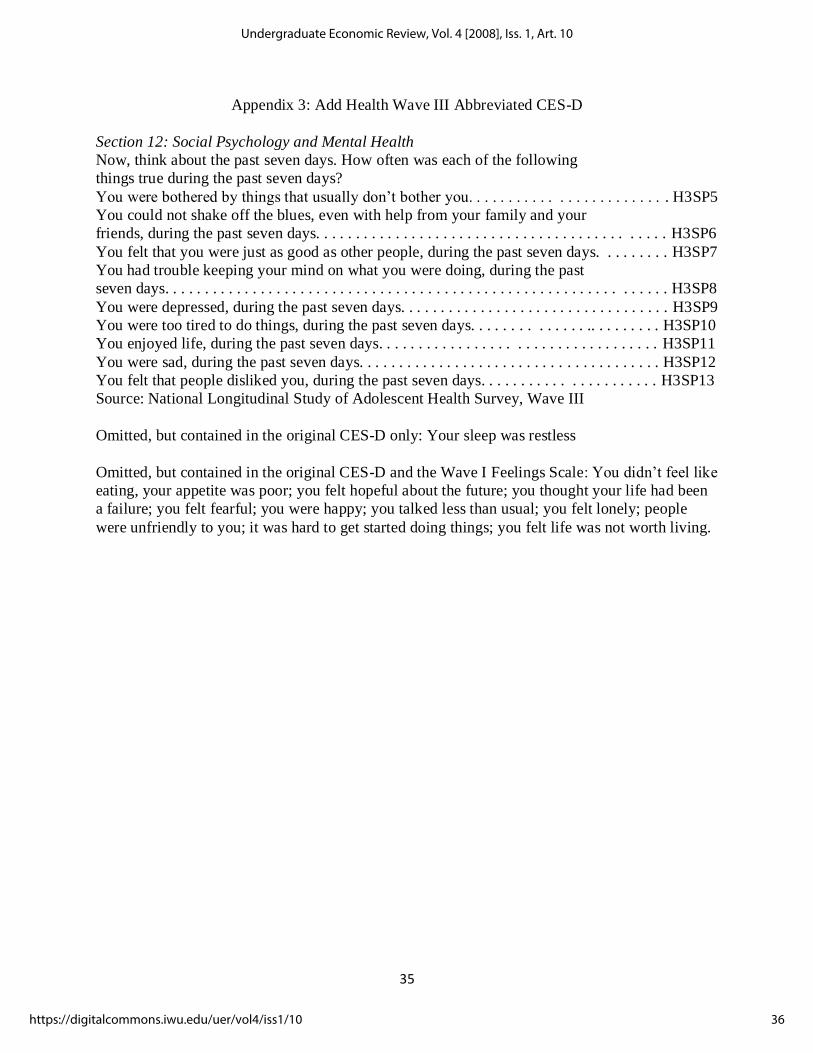
Appendix 3: Add Health Wave III Abbreviated CES-D
Section 12: Social Psychology and Mental Health
Now, think about the past seven days. How often was each of the following
things true during the past seven days?
You were bothered by things that usually don’t bother you. . . . . . . . . . . . . . . . . . . . . . . . . H3SP5
You could not shake off the blues, even with help from your family and your
friends, during the past seven days. . . . . . . . . . . . . . . . . . . . . . . . . . . . . . . . . . . . . . . . . . . . H3SP6
You felt that you were just as good as other people, during the past seven days. . . . . . . . . H3SP7
You had trouble keeping your mind on what you were doing, during the past
seven days. . . . . . . . . . . . . . . . . . . . . . . . . . . . . . . . . . . . . . . . . . . . . . . . . . . . . . . . . . . . . . . H3SP8
You were depressed, during the past seven days. . . . . . . . . . . . . . . . . . . . . . . . . . . . . . . . . . H3SP9
You were too tired to do things, during the past seven days. . . . . . . . . . . . . . .. . . . . . . . . H3SP10
You enjoyed life, during the past seven days. . . . . . . . . . . . . . . . . . . . . . . . . . . . . . . . . . . H3SP11
You were sad, during the past seven days. . . . . . . . . . . . . . . . . . . . . . . . . . . . . . . . . . . . . . H3SP12
You felt that people disliked you, during the past seven days. . . . . . . . . . . . . . . . . . . . . . H3SP13
Source: National Longitudinal Study of Adolescent Health Survey, Wave III
Omitted, but contained in the original CES-D only: Your sleep was restless
Omitted, but contained in the original CES-D and the Wave I Feelings Scale: You didn’t feel like
eating, your appetite was poor; you felt hopeful about the future; you thought your life had been
a failure; you felt fearful; you were happy; you talked less than usual; you felt lonely; people
were unfriendly to you; it was hard to get started doing things; you felt life was not worth living.
36
Undergraduate Economic Review, Vol. 4 [2008], Iss. 1, Art. 10
https://digitalcommons.iwu.edu/uer/vol4/iss1/10


