Embed Size (px)
Citation preview

http://abs.sagepub.com/American Behavioral Scientist
http://abs.sagepub.com/content/56/7/961The online version of this article can be found at:
DOI: 10.1177/0002764211409196
2011 2012 56: 961 originally published online 13 DecemberAmerican Behavioral Scientist
Annie Georges, Jeanne Brooks-Gunn and Lizabeth M. MaloneSocial Class and Classroom Composition
Links Between Young Children's Behavior and Achievement: The Role of
Published by:
http://www.sagepublications.com
can be found at:American Behavioral ScientistAdditional services and information for
http://abs.sagepub.com/cgi/alertsEmail Alerts:
http://abs.sagepub.com/subscriptionsSubscriptions:
http://www.sagepub.com/journalsReprints.navReprints:
http://www.sagepub.com/journalsPermissions.navPermissions:
http://abs.sagepub.com/content/56/7/961.refs.htmlCitations:
What is This?
- Dec 13, 2011OnlineFirst Version of Record
- May 22, 2012Version of Record >>
at COLUMBIA UNIV on June 18, 2014abs.sagepub.comDownloaded from at COLUMBIA UNIV on June 18, 2014abs.sagepub.comDownloaded from

American Behavioral Scientist56(7) 961 –990
© 2012 SAGE PublicationsReprints and permission: http://www.sagepub.com/journalsPermissions.nav
DOI: 10.1177/0002764211409196http://abs.sagepub.com
1Columbia University, New York, NY2Mathematica, Washington, D.C., USA
Corresponding Author:Jeanne Brooks-Gunn, Columbia University, 525 West, 120th Street, New York, NY 10024, USAEmail:[email protected]
Links Between Young Children’s Behavior and Achievement: The Role of Social Class and Classroom Composition
Annie Georges1, Jeanne Brooks-Gunn1, and Lizabeth M. Malone2
Abstract
A growing number of studies examine the influence of classroom behavior on teaching and individual children’s behavior. However, limited work has examined the effects of classroom behavior on academic achievement. The present study used 14,537 children in 2,109 classrooms from the Early Childhood Longitudinal Study -Kindergarten Class of 1998-99 (ECLS -K) to examine the association between attention, aggressive behav-ior, and achievement at two levels --the child and classroom. Children with low atten-tion, alone or in combination with aggressive behavior, made fewer gains in test scores during kindergarten. The achievement gap between children with low attention and those without was larger than those based on low-income status or race/ethnicity. Additionally, having more children in the classroom with low attention was negatively associated with achievement gains. No similar association was found for the number of children with high aggression. The authors discuss avenues for teacher training and intervention to facilitate attention.
Keywords
attention, aggression, kindergarten, achievement, low-income children, poverty, classroom fixed effects
Articles
at COLUMBIA UNIV on June 18, 2014abs.sagepub.comDownloaded from

962 American Behavioral Scientist 56(7)
The present study investigated the association between low attention and aggressive behavior and test scores using data from the Early Childhood Longitudinal Study–Kindergarten Class of 1998-99 (ECLS-K), a nationally representative sample of kin-dergarteners in the United States. Low attention reflects the lack (or lower levels of) persistence, task orientation, organization, and focus. Aggressive behavior reflects externalizing or acting out behavior in interactions with classmates and teachers such as disrupting instruction, hitting, or arguing. Our approach takes into account that low attention and high aggression might each be independently associated with test scores as well as the possibility that both problems, in combination, may be associated with test scores. Specifically, we examined clusters of children based on whether they exhib-ited neither problem, both problems, or one particular problem. Then, we examined whether any differences, or gaps, between these four groups were larger or smaller than test score gaps that have been seen between children with socieconomic status (SES) differences and from various race/ethnic groups. Finally, we also investigated the asso-ciation between the two problem behaviors and achievement test scores at not only the child level, but at the classroom level (the latter often being term a compositional effect).
It is important to examine both levels if aggressive behavior impacts instructional time. Less instructional time will likely reduce opportunities to learn and could be det-rimental to academic progress for all children in the classroom. Even if the child is not aggressive, inattentive classmates could nonetheless affect his or her opportunity to learn. Being an inattentive child is not necessarily disruptive to other children, but clearly such a child might not actively engage with peers, which could mean that the child is not receptive to, nor would benefit from, a classroom setting that stresses active participation with classmates.
The extant literature demonstrates that being attentive is positively associated with test scores; lack thereof was detrimental to learning. The relation of aggressive behavior to learning is less clear, having both negative and null associations with test scores. Moreover, the relation of attention and aggressive behavior to test scores has less often been examined concurrently and simultaneously, making it difficult to determine, at the individual and classroom levels, the differential impact of both problem behaviors versus one or none. And few if any studies have estimated the strength of the behavior problem–achievement association, in comparison to test score gaps for low-SES and minority children. Additionally, the literature is largely silent on how a child’s test scores are associated with behavior problem of other children in the class. These gaps in the literature motivate the current study.
The present study addressed three questions. First, to what extent are attention and aggressive behavior problems associated with mathematics and reading scores? Second, are these associations stronger than those for SES and ethnic test score gaps? Third, to what extent is the behavior of other children associated with a child’s mathematics and reading scores? We investigated differences among four behavior groups: children demonstrating no problem behavior, both attention and aggressive behavior, or one particular problem behavior.
at COLUMBIA UNIV on June 18, 2014abs.sagepub.comDownloaded from
Georges et al. 963
Prior Studies
Research suggests that aggressive behavior and attention problems influence children’s learning by impeding their skills to interact with classmates and teachers, making for a tougher adjustment to school (Ladd, Kochenderfer, & Coleman, 1997; Miech, Essex, & Goldsmith, 2001). Children’s ability to regulate aggressive behavior facilitates work-ing with groups and involvement with class discussion, both of which permit children to be aware of and become engaged in their own learning. Being attentive also fits the instruction model of school (Alexander, Entwisle, & Dauber, 1993; DiLalla, Marcus, & Wright-Phillips, 2004). For example, children with attention problems lack persis-tence, are unable to avoid distractions, and are limited in their ability to focus on tasks, which may lead to lower achievement and to greater problems in adjusting to the school setting (Miech et al., 2001).
Attention skills have been consistently linked to children’s school readiness and test scores (Howse, Lange, Farran, & Boyles, 2003; NICHD Early Child Care Research Network [ECCRN], 2003; Schoen & Nagle, 1994). For example, the NICHD study of early child care (NICHD ECCRN, 2003) found that sustained attention explained achieve-ment gains between preschool and kindergarten. Studies also showed the association between attentive skills and test scores remained through elementary grades (Alexander et al., 1993; Linares et al., 2005; McClelland, Morrison, & Holmes, 2000; Yen, Konold, & McDermott, 2004). For example, using a sample drawn from Baltimore public school students, Alexander et al. (1993) found children’s attention skills were significantly asso-ciated with higher mathematics scores between the first and second grades. There were also indirect effects through increased first-grade academics and later social behavior on reading and mathematics scores between second and fourth grades among these students. Further evidence from a study that examined children’s achievement using data from six countries, including the United States, showed that attention skills during preschool and kindergarten were linked with gains in reading 3 to 9 years later, even after controlling for early cognitive skills at school entry and aggressive behavior (Duncan et al., 2007).
By contrast, findings of the association between aggressive behavior and test scores are mixed in that the association is not always statistically significant and the magnitude, when significant, tends to be weak. One study found aggressive behavior at age 5 strongly predicted lower academic achievement 2 years later (Trzesniewski, Moffitt, Caspi, Taylor, & Maughan, 2006). However, longitudinal investigations that controlled for prior achievement did not find a significant association between aggressive behavior and later achievement. For example, there were no significant associations between aggressive behavior and test scores between first and second grade for children in both working-class and low-income families (Miles & Stipek, 2006; Welsh, Parke, Widaman, & O’Neil, 2001). Similarly, in Alexander et al.’s (1993) investigation of Baltimore public school students, aggressive behavior was not significantly associated with mathematics or reading scores within a given year or across years except for one instance—first-grade behavior to fourth-grade mathematics. In a more recent investigation, Duncan et al.’s (2007) analyses of test scores showed that aggressive behavior at school entry generally
at COLUMBIA UNIV on June 18, 2014abs.sagepub.comDownloaded from

964 American Behavioral Scientist 56(7)
was not significant at predicting later mathematics or reading test scores, and in the few cases where the association was significant, the coefficients were weak in magnitude, ranging from 2 to 5 percentile points (i.e., -0.05 to 0.11 SD). Furthermore, the meta-analyses across the six data sets including the ECLS-K revealed no significant associa-tions between aggressive behavior and test scores (Duncan et al., 2007).
Part of the explanation for the negative association between aggressive behavior and test scores could be that children who are aggressive are unable to interact with peers effectively and have difficulty reading environmental cues (Crick & Dodge, 1994; Dodge, 1991). These children may also be frustrated with their academic difficulties such that they act out, in turn resulting in less task time and more negative interactions with classmates and teachers (Ladd, Birch, & Buhs, 1999; McEvoy & Welker, 2000; Miles & Stipek, 2006; Raver, 2002). Aggressive behavior has also been linked to lower achievement via lower class participation, indicating fewer opportunities to work coop-eratively with and learn from classmates (Ladd et al., 1999; Raver, 2002). The negative interactions with teachers may result in less instructional feedback (Carr, Taylor, & Robinson, 1991; Raver, 2002), which could negatively affect the child’s test scores.
In all of these studies, attention and aggressive behavior problems tend to be exam-ined separately (or attention is not included in regressions as a control when aggressive behavior is the outcome of interest such that links between aggressive behavior and achievement may be confounded by a third variable–in this case, attention problems). An examination of the combination of both behavior problems matter if their root includes difficulty processing information, difficulty with social skills, and inability to function (Dodge, 1991; McEvoy & Walker, 2000; Zhou et al., 2007). Some studies, like the one conducted by Duncan et al. (2007), included measures of both aggressive behavior and attention problems simultaneously to determine unique influences. How-ever, their approach overlooked the comorbidity and reciprocal nature of both types of problems (Arnold et al., 1999).
The combination of attentive and aggressive behavior problems has been examined in only a handful of studies. In studies that did not control for prior academic achieve-ment or ability, aggressive behavior appeared mediated by attention problems (Arnold, 1997; Friedman-Weieneth, Harvey, Youngwirth, & Goldstein, 2007). Attention problems were significant predictors of achievement, even while controlling for aggressive behavior (Duncan et al., 2007; Friedman-Weieneth et al., 2007). Aggressive behavior had an indirect path with achievement, operating through attention skills, in one study (Normandeau & Guay, 1998). In another study, aggressive behavior was not a significant predictor in a regression model once attention skills (Duncan et al., 2007) or teacher-student relationships were added (Graziano, Reavis, Keane, & Calkins, 2007) to the models. In general, direct associations between aggressive behavior and achievement were not maintained when considering attention skills. These models, though providing indication of the weight of aggressive behavior versus attention problems, did not clarify the influence of demonstrating one versus both types of problem behavior.
at COLUMBIA UNIV on June 18, 2014abs.sagepub.comDownloaded from

Georges et al. 965
One study to date has considered the co-occurrence of attention and aggressive behavior problems by specifying groups based on the exact behavior present, though it did not consider test score gains or prior achievement. This study, conducted by Finn, Pannozzo, and Voelkl (1995), examined mathematics and reading scores among four groups of 1,000 fourth graders classified as aggressive behavior, attention problems, both aggressive and attention problems, and neither aggressive nor attention problems. In comparison to children with one problem behavior, those children with no such problems showed higher reading and mathematics scores, whereas children with both problems were no different from those with only one. Among children with one type of behavior problems, children who were aggressive scored higher than children who had attention problems. The authors did not formally contrast children with both problem behaviors versus the other groups; however, mean comparisons indicated they had lower test scores than children with aggressive behavior or no problem behaviors but were similar to children with attention problems (Finn et al., 1995). Thus, in isolation, atten-tion is a significant predictor of test scores, but aggressive behavior may not be.
The classroom context established by other children’s behavior may play a role in academic achievement. Studies showed classroom disruption due to the presence of behavior problems among children reduced the instructional time provided to the class and to the individual child (Carr et al., 1991; Reynolds, 1998). Even for children who did not exhibit aggressive behavior, instruction time can be limited due to the teachers’ con-centration on behavior management of other children. Reduced instruction time, in turn, may lead to lower test scores (Carr et al., 1991; Raver, 2002). Besides teachers’ ability to deliver instruction and children’s adjustment to the curriculum, children in collabora-tive, friendly, and empathetic groups have higher achievement test scores than children in groups with less of these qualities (Battistich, Solomon, & Delucchi, 1993). This kind of high-quality group may not occur as often in classrooms where there are children with behavior problems. For instance, children in classrooms with higher average classroom levels of aggressive behavior were rated on average as having less close relationships with teachers as compared to children in classrooms with lower classroom average aggressive behavior (Buyse, Verschueren, Doumen, Van Damme, & Maes, 2008).
Studies have focused on how the aggressive behavior may influence a child’s own behavior from year to year (Barth, Dunlap, Dane, Lochman, & Wells, 2004; Hanish, Martin, Fabes, Leonard, & Herzog, 2005), whereas limited work has focused on the extent to which the classroom compositional effects of other children’s behavior as a context informing academic achievement. The closest direct examination of this rela-tionship comes from Finn and Pannozzo’s (2004) analysis with the ECLS-K. They found that the child’s own attention problems or aggressive behavior were weakly correlated with the overall classroom behavior, which they measured as teacher’s global rating of misbehavior, (-0.20 and -0.16, respectively), and that classroom behavior had a weak correlation with kindergarten reading and mathematics test scores. The measure of classroom behavior was based on teachers’ report of the overall behavior of the children rather than on the composition of behavior from each individual child.
at COLUMBIA UNIV on June 18, 2014abs.sagepub.comDownloaded from

966 American Behavioral Scientist 56(7)
MethodParticipantsData were from the ECLS-K, a nationally representative sample of children in the United States enrolled in kindergarten during the 1998-1999 school year. The ECLS-K data are well suited for this analysis because children were sampled within classrooms. Children were assessed (mathematics and reading achievement scores), and teachers and parents were interviewed at the beginning and end of the kindergarten year—the former on classroom characteristics, individual children’s behavior, and instructional techniques; and the latter on family characteristics and activities as well as on children’s behavior. After kindergarten, given the movement of children into different schools and first-grade classrooms, it is impossible to examine classroom composition.
At baseline, the ECLS-K consisted of 21,260 children. We excluded children who did not have mathematics and reading scores at both time points of the kindergarten survey (N = 4,587). Children with missing test scores were disproportionately in low-income families, more likely to be Asians, Blacks, or Latinos. Children who did not pass the English language assessment but spoke Spanish took the Spanish version of the mathematics assessment. However, because these children did not take the reading assessment, they were also among the children excluded due to missing reading scores (N = 1,115). We excluded children whose classrooms could not be identified or children who changed classrooms during the kindergarten school year (N = 887). We excluded any remaining classrooms with fewer than three sampled children, which resulted in an additional 134 children excluded.
After these exclusions, our analytic sample consisted of 14,537 children clustered in 2,109 classrooms in 895 public and private kindergarten programs. This sample reflects children who progressed normally without interruptions either by changing schools or classroom during kindergarten. Other than the exclusions described above, all predictors with missing values were imputed using the multiple imputation procedure described by Allison (2002) and Schaffer and Graham (2002).1 The imputed values are such that their values are consistent with the observed variable values. In the imputation procedure model we incorporated all the variables in the analysis as well as several auxiliary vari-ables that are correlated with the variables to be imputed. Moreover, the model accounted for the nested structure of the data by performing the imputation procedure for class-room- and school-level variables separately. The classroom and school models included, in addition to the classroom and school variables used in the analysis, auxiliary variables reflecting the average characteristics of the students in those classrooms and schools.
The full sample of 14,537 children was used to classify children into behavior groups and to evaluate whether distinct groups were formed. For the multivariate models, however, to be able to detect minimum effect size, we included classrooms where at least 50% of the children in the classroom were in the sample. This restriction resulted in a sample for the multivariate model of 6,212 children in 508 classrooms, with four to 27 children per classroom.
at COLUMBIA UNIV on June 18, 2014abs.sagepub.comDownloaded from

Georges et al. 967
Mathematics and Reading Scores
Children completed one-on-one direct assessments of their mathematical and literacy skills with trained assessors. The ECLS-K assessments involved a two-stage format where all children took a common routing test that then directed them to a second skill-level test. The mathematics domain included recognizing numbers, counting, comparing, and ordering numbers; solving word problems; and recognizing and solving problems involving graphs and geometric relationships. The reading domain included vocabulary, listening and reading comprehension, knowledge of the alphabet, phonetics, print rec-ognition and orientation, and sight vocabulary. We used the ECLS-K Item Response Theory (IRT) scale scores, which were based on an IRT model estimating item param-eters for difficulty, discrimination, and “guessability” to calculate the probability of the child’s answering a particular item correctly as if she or he had taken all items in the assessment (Rock & Pollack, 2002). The IRT scale score is the sum of these probabilities across all items. The reliability coefficient for the mathematics scores was .92 in fall and .94 in spring; and for the reading scores it was .93 in fall and .95 in spring. The average spring mathematics scores were 28.3 points, with a range of 7.6 to 59.3 points. The average reading scores were 32.6 points, with a range of 11.0 to 70.8 points.
Behavior ProblemsTeachers rated each sampled child on attention skills and aggressive behavior. Attention skills were derived from the Approaches Toward Learning scale in the ECLS-K, a composite score of the child’s level of attentiveness, task persistence, eagerness to learn, learning independence, flexibility, and organization (alpha = .89; rated on a 4-point Likert scale of 1 = never to 4 = very often). We reverse coded the composite score so that a high number would show that the child had attention problems such as distractibility and lack of persistence, organization, or flexibility. Aggressive behavior was derived from teachers’ responses about the child’s externalizing behavior, which was a composite score of the frequency with which the child argued, fought, got angry, acted impulsively, and disturbed ongoing activities (alpha = .90; rated on a 4-point Likert scale of 1 = never to 4 = very often). A high score on the externalizing behavior scale indicated the child had aggressive behavior. We used both the attention and aggressive behavior problems composite scores to specify groups based on the observed distribution of each behavior. After identifying each child’s behavior group membership, we computed the proportion of children, excluding the individual child, in each behavior group in each classroom.
Child and Family BackgroundWe measured family and child characteristics to account for potential confounding factors known to be important determinants of test scores. We used several child and family characteristics variables including socioeconomic status (SES), a composite score (M = 0, SD = 1) derived from parents’ education, parents’ occupation
at COLUMBIA UNIV on June 18, 2014abs.sagepub.comDownloaded from

968 American Behavioral Scientist 56(7)
and household income. The continuous SES composite score was then converted into quintiles. We used the data based on quintiles to create a dichotomous variable where low income is set to 1 if the family’s SES is in the fourth or fifth quintile; otherwise it is set to 0 (therefore, both poor (bottom quintile) and near poor (second to bottom quintile) were included in the low-income group). We created five ethnic groups: Asian American, African American, European American, Hispanic American, and Other. Other variables included whether the child lived in a single-parent family, the number of siblings, the child’s age at the time of the assessment, the mother’s age at the child’s birth, the child’s gender, the child’s birth weight, whether the primary language spoken at home was Eng-lish, and number of places the child lived. We accounted for whether the child had any disability such as a diagnosed learning problem, hearing problem or sign language, vision problem, or enrolled in special needs classes.
We measured the frequency of reading activities either alone or with a parent and participation in organized activities outside the home (e.g., dance lessons, organized clubs, music lessons, drama classes, athletic or sporting events, art and craft classes, educational trips and visits to the library, a gallery, museum or historical site). We controlled for the number of children’s books and other educational media in the home and the child’s primary care arrangement prior to kindergarten (e.g., center, relative care, nonrelative care, or Head Start).
We controlled for the number of months that elapsed between fall and the end of the kindergarten assessments and the teachers’ rating of the child’s behavior. We decided to control for time between assessments and rating of the child’s behavior because children who are assessed later in the school year might have higher test scores than those assessed earlier by virtue of the fact that these children had additional learning time. Children whose behavior was assessed later may be rated somewhat differently because the teacher would have had more time to observe them.
Teacher CharacteristicsWe accounted for confounding factors in teachers’ ratings of the child’s behavior by controlling for teachers’ education, ethnicity, number of years of teaching experience at the kindergarten level and preschool level, and the number of courses taken in early childhood education and child development. We also measured two types of professional development participation. One measure was whether the child’s teacher participated in in-service days, problem-solving group, consultant meeting, early childhood confer-ence, or computer and technology workshop. A second measure was whether the teacher participated in professional development that provided support to the teacher such as peer feedback, new skills support, or observed other school.
Classroom and School CharacteristicsThe school measures were whether it was a private or public kindergarten program and whether the school was located in a central city, in an urban fringe and large town, or
at COLUMBIA UNIV on June 18, 2014abs.sagepub.comDownloaded from

Georges et al. 969
in a small town or rural area. We accounted for teachers’ perceptions of whether discipline was maintained in the school to account for the possibility that schools that maintained stronger discipline may affect the level of aggressive behavior in the classroom.
Analytic ProceduresWe performed cluster analysis using the K-Means algorithm method (Aldenderfer & Blashfield, 1984) to specify groups based on the distribution of attention and aggressive behavior. We specified separate models that tested for the presence of two to 10 behavior groups. We evaluated each model to determine whether the groups were distinct and whether some groups were more separated than others. The number of observations in each group was examined to determine if any outlier cases formed meaningless groups. Finally, for each cluster solution, we compared the behavior groups using multivariate analysis vari-ance (MANOVA). The results of the cluster analysis are discussed subsequently.
Our regression strategy was to include rich sets of child and family characteristics to adjust for differences across children and to include rich measures of teacher, classroom, and school characteristics to account for potential confounding factors affecting how children’s behavior might be rated. These extensive set of controls will not fully account for the possibility that children within a classroom, because they are taught together, may tend to be similar in test scores; that the teacher may tend to rate the children in the same classroom similarly in their behavior; or that a child’s behavior is rated relative to the other children in their classroom. To account for these unobserved factors, we estimate two classroom fixed-effect models. One model examined end of kindergarten scores, given by
T V V X X C Z Tijs j 1 ijs 2 ijs 3 ij 4 ij 5 j 6 j 8 ijf j= + + + + + + + + +− − −α β β β β β β β µ ε iij (1)
The second model examined gains in scores over the kindergarten year, given by
T V V X X C
Z T T
ijs j 1 ijs 2 ijs 3 ij 4 ij 5 j
6 j 7 ijf 8 i
= + + + + +
+ + +− −
−
α β β β β β
β β β jjf j ij+ +µ ε (2)
where f indicates that the variable was measured at kindergarten entry, s indicates that the variable was measured in spring of kindergarten, α is the average classroom-level test scores, T is mathematics or reading scores for child i in classroom j, V
i rep-
resents the behavior group the child is a member of, and V– is the proportion of other
children in a given behavior group. The vector Xi represents child and family charac-
teristics, X– represents average measures for child and family characteristics for the other
children in the class (not including the individual child), C reflects teacher and classroom characteristics, and Z is school characteristics. In the second model, we controlled for test scores at kindergarten entry for child i, T
if; T– is the average test scores of the other children
in the classroom at kindergarten entry, which we include in both models. There is a classroom-specific error term, µ, and an individual-specific error term, ε
i.
at COLUMBIA UNIV on June 18, 2014abs.sagepub.comDownloaded from

970 American Behavioral Scientist 56(7)
The coefficient β1 is interpreted as the association of the child’s behavior problems
on test scores. The coefficient β2 is interpreted as the association between the behaviors
of other children on the individual child’s test scores.The outcome variables and all the continuous predictors are standardized (M = 0,
SD = 1). As such, the coefficient estimates are in units of effect size. That is, the coef-ficient represents the expected standard deviation gain in test scores per standard devia-tion change in the predictor.
ResultsWe specified behavior groups based upon the distribution of attention and aggressive behavior. The model that specified four behavior groups yielded more satisfying solu-tions under all validation techniques. Figure 1 shows the mean value for the attention and aggressive behavior scale for each of the four groups: (a) group with both problems (11%), (b) group with low attention (26%), (c) group with high aggression (23%), and (d) group with neither (40%).
Table 1 shows the multivariate test statistics for group mean differences from the MANOVA analysis. Every test shows there are significant differences among the four
2.79
1.68
2.52
1.3
2.94
1.97
1.6
1.17
0
0.5
1
1.5
2
2.5
3
3.5
Both Attention and
Aggressive
Problems (n = 1668)
Aggressive Behavior
Problem
(n = 3372)
Attention Problems
(n = 3716)
Neither
(n = 5781)
Mea
n Sc
ores
Attention Aggressive Behavior
Figure 1. Mean attention and aggressive behavior scale score, by behavior groups: ECLS-K 1998-99
at COLUMBIA UNIV on June 18, 2014abs.sagepub.comDownloaded from

Georges et al. 971
Table 1. MANOVA Multivariate Analysis of Variance Tests of Group Mean Differences
Test statistics Value F value df Sig.
Wilks’s Lambda .443 72.78 186 .0001Pillai’s Trace .695 70.36 186 .0001Hotelling-Lawley Trace .968 75.35 186 .0001Roy’s Greatest Root .568 132.83 62 .0001
Authors’ calculations based on data from the Early Childhood Longitudinal Study, Kindergarten Cohort. Estimates are weighted.
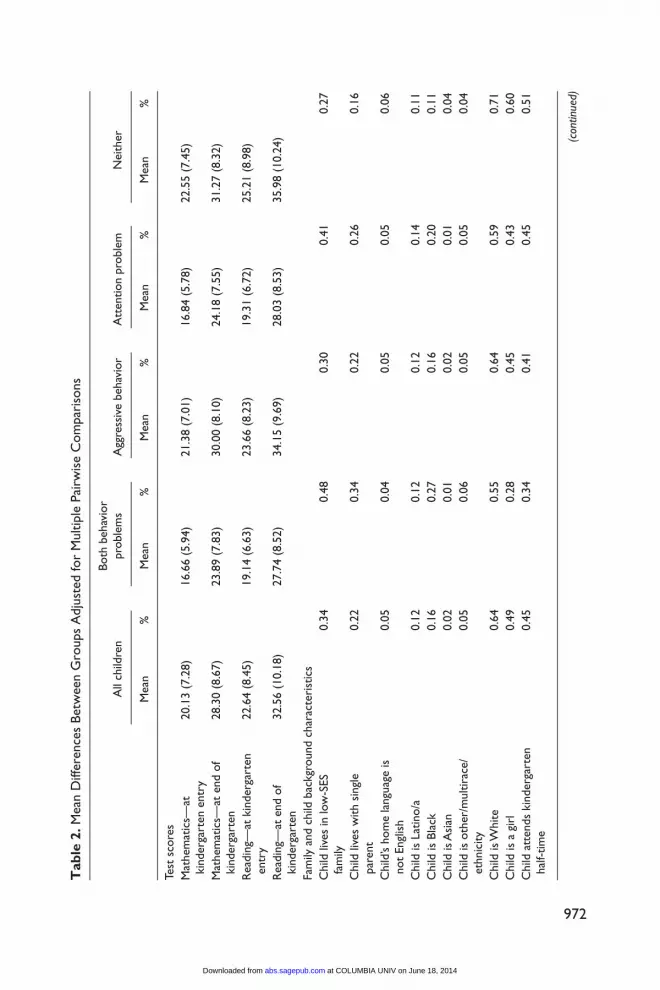
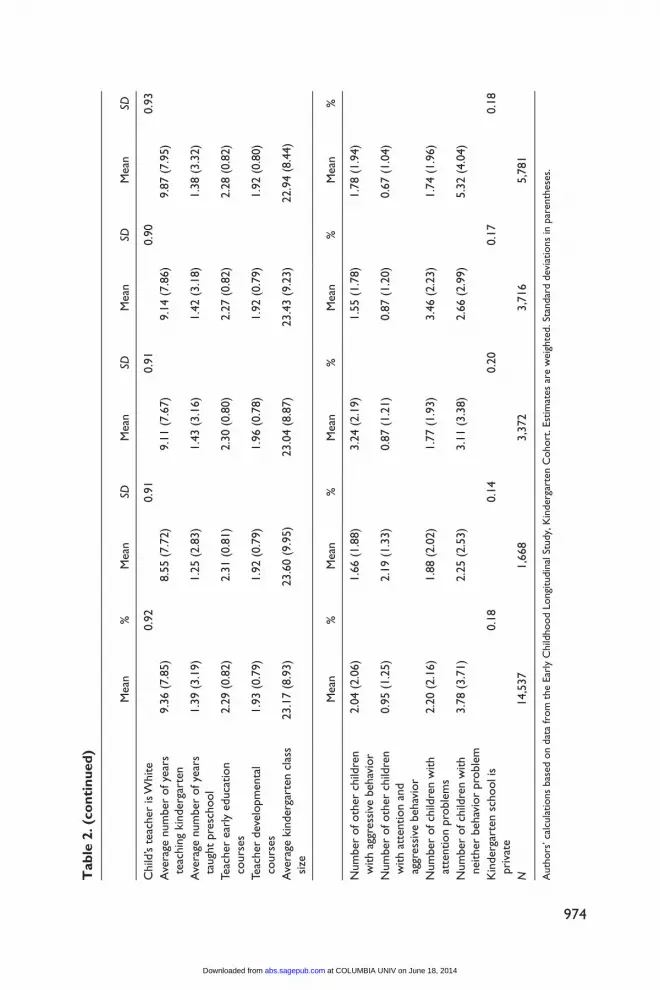
groups. Table 2 presents mean values of family background and classroom variables for all children and for each of the four groups. A disproportionate share of children in low-SES families were in the both behavior problems or the attention problem group. For instance, children in low-SES families composed 34% of the sample; however, 48% of children in the both behavior problems group were low-SES, and 41% in the attention problems group were low-SES (Table 2). On the other hand, aggressive behavior was lower among children in low-SES families; 30% of the children in the aggressive behavior group were in low-SES families.
There are differences in the race/ethnicity and gender makeup of the four groups. The race/ethnic composition of the sample was 64% White, 16% Black, 12% Latino, and 2% Asian. As shown in Table 2, Black and Latino children were overrepresented in the attention problem group, whereas Asian children were overrepresented in the neither problem group. For instance, 27% of children in the both behavior problems group were Black as well as 20% of children in the attention problems group (Table 2). Boys were more likely to be in the both behavior problems group compared to girls.
Table 3 shows whether the mean differences between groups are significant. To mini-mize the possibility of false positive comparisons due to multiple pairwise tests, we adjusted each comparison using Tukey’s HSD test and Scheffe test. As shown in Table 3, children in the attention problem group had similar test scores as children in the both behavior problems group. However, children in the attention problem group differed in background characteristics from children in the both behavior problems group. For instance, in com-parison to the both behavior problems group, a significantly lower proportion of children in the attention problem group were in low-SES families, lived with a single parent, were Black, were boys, had a disability, or attended center-based programs (Table 3).
Children in the aggressive behavior group differed from the attention problem group in test scores and in family background characteristics. In particular, children in the aggressive behavior group had significantly higher mathematics and reading scores compared to children in the attention problem group. A significantly higher proportion of Whites, girls, and children who attended center-based programs were in the aggressive behavior group compared to the attention problem group. Another difference is that children in the aggressive behavior group have teachers with fewer years of kindergarten teaching experience compared to children without any behavior problem.
at COLUMBIA UNIV on June 18, 2014abs.sagepub.comDownloaded from
972
Tab
le 2
. Mea
n D
iffer
ence
s Be
twee
n G
roup
s A
djus
ted
for
Mul
tiple
Pai
rwis
e C
ompa
riso
ns
All
child
ren
Both
beh
avio
r pr
oble
ms
Agg
ress
ive
beha
vior
Att
entio
n pr
oble
mN
eith
er
M
ean
%M
ean
%M
ean
%M
ean
%M
ean
%
Test
sco
res
M
athe
mat
ics—
at
kin
derg
arte
n en
try
20.1
3 (7
.28)
16.6
6 (5
.94)
21.3
8 (7
.01)
16.8
4 (5
.78)
22.5
5 (7
.45)
Mat
hem
atic
s—at
end
of
kin
derg
arte
n28
.30
(8.6
7)23
.89
(7.8
3)30
.00
(8.1
0)24
.18
(7.5
5)31
.27
(8.3
2)
Rea
ding
—at
kin
derg
arte
n e
ntry
22.6
4 (8
.45)
19.1
4 (6
.63)
23.6
6 (8
.23)
19.3
1 (6
.72)
25.2
1 (8
.98)
Rea
ding
—at
end
of
kin
derg
arte
n32
.56
(10.
18)
27.7
4 (8
.52)
34.1
5 (9
.69)
28.0
3 (8
.53)
35.9
8 (1
0.24
)
Fam
ily a
nd c
hild
bac
kgro
und
char
acte
rist
ics
Chi
ld li
ves
in lo
w-S
ES
fam
ily0.
340.
480.
300.
410.
27
Chi
ld li
ves
with
sin
gle
p
aren
t0.
220.
340.
220.
260.
16
Chi
ld’s
hom
e la
ngua
ge is
n
ot E
nglis
h0.
050.
040.
050.
050.
06
Chi
ld is
Lat
ino/
a0.
120.
120.
120.
140.
11C
hild
is B
lack
0.16
0.27
0.16
0.20
0.11
Chi
ld is
Asi
an0.
020.
010.
020.
010.
04C
hild
is o
ther
/mul
tirac
e/
eth
nici
ty0.
050.
060.
050.
050.
04
Chi
ld is
Whi
te0.
640.
550.
640.
590.
71C
hild
is a
gir
l0.
490.
280.
450.
430.
60C
hild
att
ends
kin
derg
arte
n h
alf-t
ime
0.45
0.34
0.41
0.45
0.51
(con
tinue
d)
at COLUMBIA UNIV on June 18, 2014abs.sagepub.comDownloaded from

973
All
child
ren
Both
beh
avio
r pr
oble
ms
Agg
ress
ive
beha
vior
Att
entio
n pr
oble
mN
eith
er
M
ean
%M
ean
%M
ean
%M
ean
%M
ean
%
Chi
ld w
as in
rel
ativ
e ca
re
pri
or t
o ki
nder
gart
en0.
180.
190.
180.
210.
17
Chi
ld w
as in
info
rmal
car
e
pri
or t
o ki
nder
gart
en0.
110.
090.
110.
100.
12
Chi
ld w
as in
cen
ter-
base
d
car
e pr
ior
to k
inde
rgar
ten
0.18
0.26
0.23
0.16
0.14
Chi
ld w
as in
oth
er t
ype
o
f chi
ld c
are
arra
ngem
ent
pri
or t
o ki
nder
gart
en
0.02
0.02
0.02
0.02
0.02
Chi
ld w
as p
rim
arily
in
par
enta
l car
e pr
ior
to
kin
derg
arte
n en
try
0.50
0.44
0.46
0.51
0.54
Cla
ssro
om a
nd s
choo
l cha
ract
eris
tics
Chi
ld’s
teac
hers
has
a
bac
helo
r’ s d
egre
e0.
280.
310.
290.
290.
26
Chi
ld’s
teac
hers
has
pos
t
bac
helo
r’ s t
rain
ing
but
no
mas
ter’s
deg
ree
0.34
0.33
0.33
0.32
0.35
Chi
ld’s
teac
hers
has
a
mas
ter’s
deg
ree
0.37
0.36
0.36
0.37
0.38
Chi
ld’s
teac
her
is A
sian
0.01
0.01
0.01
0.01
0.01
Chi
ld’s
teac
her
is B
lack
or
A
fric
an A
mer
ican
0.06
0.07
0.06
0.08
0.05
Tab
le 2
. (co
ntin
ued)
(con
tinue
d)
at COLUMBIA UNIV on June 18, 2014abs.sagepub.comDownloaded from
974
M
ean
%M
ean
SDM
ean
SDM
ean
SDM
ean
SD
Chi
ld’s
teac
her
is W
hite
0.92
0.91
0.91
0.90
0.93
Ave
rage
num
ber
of y
ears
t
each
ing
kind
erga
rten
9.36
(7.
85)
8.55
(7.
72)
9.11
(7.
67)
9.14
(7.
86)
9.87
(7.
95)
Ave
rage
num
ber
of y
ears
t
augh
t pr
esch
ool
1.39
(3.
19)
1.25
(2.
83)
1.43
(3.
16)
1.42
(3.
18)
1.38
(3.
32)
Teac
her
earl
y ed
ucat
ion
c
ours
es2.
29 (
0.82
)2.
31 (
0.81
)2.
30 (
0.80
)2.
27 (
0.82
)2.
28 (
0.82
)
Teac
her
deve
lopm
enta
l c
ours
es1.
93 (
0.79
)1.
92 (
0.79
)1.
96 (
0.78
)1.
92 (
0.79
)1.
92 (
0.80
)
Ave
rage
kin
derg
arte
n cl
ass
siz
e23
.17
(8.9
3)23
.60
(9.9
5)23
.04
(8.8
7)23
.43
(9.2
3)22
.94
(8.4
4)
M
ean
%M
ean
%M
ean
%M
ean
%M
ean
%
Num
ber
of o
ther
chi
ldre
n
with
agg
ress
ive
beha
vior
2.04
(2.
06)
1.66
(1.
88)
3.24
(2.
19)
1.55
(1.
78)
1.78
(1.
94)
Num
ber
of o
ther
chi
ldre
n
with
att
entio
n an
d
agg
ress
ive
beha
vior
0.95
(1.
25)
2.19
(1.
33)
0.87
(1.
21)
0.87
(1.
20)
0.67
(1.
04)
Num
ber
of c
hild
ren
with
a
tten
tion
prob
lem
s2.
20 (
2.16
)1.
88 (
2.02
)1.
77 (
1.93
)3.
46 (
2.23
)1.
74 (
1.96
)
Num
ber
of c
hild
ren
with
n
eith
er b
ehav
ior
prob
lem
3.78
(3.
71)
2.25
(2.
53)
3.11
(3.
38)
2.66
(2.
99)
5.32
(4.
04)
Kin
derg
arte
n sc
hool
is
pri
vate
0.18
0.14
0.20
0.17
0.18
N14
,537
1,66
83,
372
3,71
65,
781
Aut
hors
’ cal
cula
tions
bas
ed o
n da
ta fr
om t
he E
arly
Chi
ldho
od L
ongi
tudi
nal S
tudy
, Kin
derg
arte
n C
ohor
t. Es
timat
es a
re w
eigh
ted.
Sta
ndar
d de
viat
ions
in p
aren
thes
es.
Tab
le 2
. (co
ntin
ued)
at COLUMBIA UNIV on June 18, 2014abs.sagepub.comDownloaded from

975
Tab
le 3
. MA
NO
VA
Pai
rwis
e M
ultip
le C
ompa
riso
ns fo
r O
bser
ved
Mea
ns
Mea
n di
ffere
nces
bet
wee
n ag
gres
sive
be
havi
or a
nd .
. .M
ean
diffe
renc
es b
etw
een
both
beh
avio
r pr
oble
ms
and
. . .
Mea
n di
ffere
nces
be
twee
n at
tent
ion
prob
lem
and
. . .
Both
be
havi
or
prob
lem
sA
tten
tion
prob
lem
Nei
ther
Att
entio
n pr
oble
mN
eith
erN
eith
er
Test
sco
res
Mat
hem
atic
s—at
k
inde
rgar
ten
entr
y−
4.72
*−
0.18
*−
5.90
*4.
55−
1.17
*−
5.72
*
M
athe
mat
ics—
at e
nd o
f k
inde
rgar
ten
−6.
11*
−0.
30*
−7.
38*
5.82
−1.
27*
−7.
09*
R
eadi
ng—
at
kin
derg
arte
n en
try
−4.
52*
−0.
17*
−6.
07*
4.35
−1.
55*
−5.
90*
R
eadi
ng—
at e
nd o
f k
inde
rgar
ten
−6.
41*
−0.
29*
−8.
24*
6.12
−1.
83*
−7.
96*
Fam
ily a
nd c
hild
bac
kgro
und
char
acte
rist
ics
C
hild
live
s in
low
-SES
f
amily
0.17
*0.
07*
0.21
*−
0.10
*0.
04*
0.14
*
C
hild
live
s w
ith s
ingl
e
par
ent
0.12
*0.
08*
0.18
*−
0.04
*0.
06*
0.10
*
C
hild
’s ho
me
lang
uage
i
s no
t En
glis
h−
0.01
−0.
01−
0.02
0.00
*−
0.01
*0.
00
C
hild
is L
atin
o/a
0.00
−0.
03*
0.01
−0.
02*
0.01
0.03
*
Chi
ld is
Bla
ck0.
10*
0.07
*0.
16*
−0.
04*
0.05
*0.
09*
C
hild
is A
sian
−0.
01*
−0.
01−
0.03
*0.
01−
0.01
*−
0.02
*
(con
tinue
d)
at COLUMBIA UNIV on June 18, 2014abs.sagepub.comDownloaded from

976
Mea
n di
ffere
nces
bet
wee
n ag
gres
sive
be
havi
or a
nd .
. .M
ean
diffe
renc
es b
etw
een
both
beh
avio
r pr
oble
ms
and
. . .
Mea
n di
ffere
nces
be
twee
n at
tent
ion
prob
lem
and
. . .
Both
be
havi
or
prob
lem
sA
tten
tion
prob
lem
Nei
ther
Att
entio
n pr
oble
mN
eith
erN
eith
er
C
hild
is o
ther
/mul
tirac
e/
eth
nici
ty0.
010.
000.
020.
000.
010.
01
C
hild
is W
hite
−0.
09*
−0.
04*
−0.
15*
0.05
−0.
06*
−0.
12*
C
hild
is a
gir
l−
0.17
*−
0.14
−0.
32*
0.02
*−
0.15
*−
0.18
*
Chi
ld a
tten
ds
kin
derg
arte
n ha
lf-tim
e−
0.07
*−
0.11
−0.
17*
−0.
04*
−0.
10*
−0.
06*
C
hild
was
in r
elat
ive
c
are
prio
r to
k
inde
rgar
ten
0.01
−0.
02*
0.02
−0.
030.
000.
03*
C
hild
was
in in
f orm
al
car
e pr
ior
to
kin
derg
arte
n
−0.
010.
00−
0.03
0.01
−0.
02*
−0.
03*
C
hild
was
in c
ente
r-
bas
ed c
are
prio
r to
k
inde
rgar
ten
0.02
0.09
*0.
11*
0.07
*0.
09*
0.02
C
hild
was
in o
ther
t
ype
of c
hild
car
e
arr
ange
men
t pr
ior
to
kin
derg
arte
n
0.00
0.00
0.00
0.00
0.00
0.00
Tab
le 3
. (co
ntin
ued)
(con
tinue
d)
at COLUMBIA UNIV on June 18, 2014abs.sagepub.comDownloaded from

977
Mea
n di
ffere
nces
bet
wee
n ag
gres
sive
be
havi
or a
nd .
. .M
ean
diffe
renc
es b
etw
een
both
beh
avio
r pr
oble
ms
and
. . .
Mea
n di
ffere
nces
be
twee
n at
tent
ion
prob
lem
and
. . .
Both
be
havi
or
prob
lem
sA
tten
tion
prob
lem
Nei
ther
Att
entio
n pr
oble
mN
eith
erN
eith
er
C
hild
was
pri
mar
ily in
p
aren
tal c
are
prio
r to
k
inde
rgar
ten
entr
y
−0.
03−
0.08
−0.
10−
0.05
−0.
07−
0.02
Cla
ssro
om a
nd s
choo
l cha
ract
eris
tics
C
hild
’s te
ache
r ha
s a
b
ache
lor’s
deg
ree
0.02
0.02
0.05
*0.
000.
03*
0.03
C
hild
’s te
ache
r ha
s po
st
bac
helo
r’s t
rain
ing
but
no
mas
ter’s
deg
ree
−0.
010.
00−
0.03
0.01
−0.
02*
−0.
03
C
hild
’s te
ache
r ha
s a
m
aste
r’s d
egre
e−
0.01
−0.
02−
0.02
−0.
01−
0.02
0.00
C
hild
’ s te
ache
r is
Asi
an0.
000.
000.
00*
0.00
0.00
0.00
C
hild
’s te
ache
r is
Bla
ck
or A
fric
an A
mer
ican
0.01
−0.
010.
02−
0.01
0.01
*0.
02*
C
hild
’s te
ache
r is
Whi
te0.
000.
01−
0.02
*0.
01−
0.01
*−
0.03
*
Ave
rage
num
ber
o
f yea
rs t
each
ing
k
inde
rgar
ten
−0.
55−
0.59
−1.
32*
−0.
03−
0.76
*−
0.73
*
A
vera
ge n
umbe
r of
y
ears
tau
ght
pres
choo
l−
0.18
−0.
17−
0.13
0.01
0.05
0.04 (con
tinue
d)
Tab
le 3
. (co
ntin
ued)
at COLUMBIA UNIV on June 18, 2014abs.sagepub.comDownloaded from

978
Mea
n di
ffere
nces
bet
wee
n ag
gres
sive
be
havi
or a
nd .
. .M
ean
diffe
renc
es b
etw
een
both
beh
avio
r pr
oble
ms
and
. . .
Mea
n di
ffere
nces
be
twee
n at
tent
ion
prob
lem
and
. . .
Both
be
havi
or
prob
lem
sA
tten
tion
prob
lem
Nei
ther
Att
entio
n pr
oble
mN
eith
erN
eith
er
Te
ache
r ea
rly
educ
atio
n
cou
rses
0.01
0.04
0.02
0.03
0.01
−0.
01
Te
ache
r de
velo
pmen
tal
cou
rses
−0.
040.
000.
000.
040.
030.
00
A
vera
ge k
inde
rgar
ten
c
lass
siz
e0.
560.
17*
0.66
−0.
390.
100.
49*
N
umbe
r of
oth
er
chi
ldre
n w
ith
agg
ress
ive
beha
vior
−1.
58*
0.11
*−
0.12
*1.
69*
1.46
−0.
23*
N
umbe
r of
oth
er
chi
ldre
n w
ith a
tten
tion
and
agg
ress
ive
beha
vior
1.32
*1.
321.
52*
0.01
*0.
21*
0.20
*
N
umbe
r of
chi
ldr e
n
with
att
entio
n pr
oble
ms
0.10
−1.
58*
0.14
−1.
69*
0.04
*1.
72*
N
umbe
r of
chi
ldre
n
with
nei
ther
beh
avio
r
pro
blem
−0.
87*
−0.
41*
−3.
07*
0.46
*−
2.21
*−
2.66
*
K
inde
rgar
ten
scho
ol is
p
riva
te−
0.06
*−
0.03
*−
0.04
*0.
030.
03*
0.00
N50
4070
8891
5353
8474
49 9
497
Aut
hors
’ cal
cula
tions
bas
ed o
n da
ta fr
om t
he E
arly
Chi
ldho
od L
ongi
tudi
nal S
tudy
, Kin
derg
arte
n C
ohor
t.*p
< .0
5. *
*p <
.01.
***
p <
.000
1.
Tab
le 3
. (co
ntin
ued)
at COLUMBIA UNIV on June 18, 2014abs.sagepub.comDownloaded from

Georges et al. 979
Behavior Problems and Test Scores
We estimated two models as specified in Equations (1) and (2) to determine the extent to which membership in one of the four behavior groups is associated with end of kin-dergarten test scores and gains in scores over the kindergarten year.2 Both models investigated the association between a child’s own membership in a behavior group, the behavior of the other children, and test scores. Table 4 shows the results for both models. There is a significant mathematics and reading score gap for children with any behavior problem, all else equal. Children with both behavior problems and those with attention problems lagged further behind children with aggressive behavior. Specifically, children with both behavior problems had a gap of 7 percentile points in mathematics (effect size = -.18, ρ < .0001) and 6 percentile points in reading (effect size = -.16, ρ < .0001). The mathematics score gap for children with attention problems was 8 percentile points (effect size = -.20, ρ < .0001) and 7 percentile points in reading (effect size = -.18, ρ < .0001). By contrast, children with aggressive behavior were not as far behind as were children with both behavior problems or those with attention problems. There was a gap of 2 percentile points in mathematics (effect size = -.06, ρ < .0001) and a gap of 3 percentile points in reading (effect size = -.07, ρ < .0001) for children with aggressive behavior.
The score gap for children with both behavior problems or with attention problems trumps the SES, gender, and race/ethnic gap. The SES score gap in mathematics and reading was very modest at 2 percentile points (Table 4). There was no significant Black-White score gap or Latino-White score gap in reading, all else equal. There was a significant Black-White mathematics score gap of 3 percentile points (effect size = -.07, ρ < .0001).
Classroom Behavior and Test ScoresThere are mixed results with respect to the association between the behaviors of other children and test scores. Higher proportions of other children in the classroom with atten-tion problems were negatively associated with mathematics (effect size = -.12, ρ < .05) and reading scores (effect size = -.13, ρ < .05). These effect sizes represent a score gap of 5 percentile points in mathematics and reading among children in classrooms where other children had attention problems. Contrary to what might be expected, the child’s mathematics or reading score was not significantly affected if other children in the classroom exhibited aggressive behavior (Table 4).
Behavior Problems and Gain ScoresChildren with attention problems made slower gains in mathematics and reading com-pared to children with aggressive behavior and children with no behavior problem. The slower pace of growth in mathematics and reading for children with both behavior problems or with attention problems was associated with a 4 percentile points gap in mathematics (effect size = -.10, ρ < .0001 for attention problems; effect size = -.09, ρ < .0001 for both behavior problems) and in reading (effect size = -.11, ρ < .0001 for
at COLUMBIA UNIV on June 18, 2014abs.sagepub.comDownloaded from

980
Tab
le 4
. Rel
atio
nshi
ps o
f Beh
avio
r Pr
oble
m t
o M
athe
mat
ics
and
Rea
ding
Sco
res
in K
inde
rgar
ten
Mat
h—en
d ki
nder
gart
en s
core
Mat
h—ga
in s
core
sR
eadi
ng—
end
kind
erga
rten
sco
reR
eadi
ng—
gain
sco
res
B
SEB
SEB
SEB
SE
Inte
rcep
t−
0.34
0.35
−0.
060.
110.
430.
380.
000.
11C
hild
’s te
st s
core
at
k
inde
rgar
ten
entr
y
0.71
0.01
***
0.72
0.01
***
Chi
ld-le
vel b
ehav
ior
Chi
ld h
as a
ggre
ssiv
e
beh
avio
r−
0.06
0.01
***
−0.
020.
01*
−0.
070.
01**
*−
0.04
0.01
***
C
hild
has
att
entio
n
pro
blem
s−
0.20
0.01
***
−0.
100.
01**
*−
0.18
0.01
***
−0.
110.
01**
*
C
hild
has
bot
h be
havi
or
pro
blem
s−
0.18
0.02
***
−0.
090.
01**
*−
0.16
0.02
***
−0.
090.
01**
*
Beha
vior
of o
ther
chi
ldre
n in
the
cla
ssro
om
C
lass
room
-leve
l a
ggre
ssiv
e be
havi
or−
0.10
0.06
0.00
0.01
−0.
090.
06−
0.01
0.01
C
lass
room
-leve
l bot
h
beh
avio
r pr
oble
ms
−0.
120.
05*
0.01
0.01
−0.
130.
05*
0.00
0.01
C
lass
room
-leve
l a
tten
tion
prob
lem
−0.
100.
050.
020.
01*
−0.
050.
060.
020.
01**
Fam
ily a
nd c
hild
bac
kgro
und
char
acte
rist
ics
C
hild
live
s in
low
-SES
f
amily
−0.
040.
01**
*−
0.02
0.01
*−
0.04
0.01
***
−0.
020.
01**
C
hild
is a
gir
l−
0.06
0.01
***
−0.
040.
010.
010.
010.
000.
01
Chi
ld is
Lat
ino/
a−
0.02
0.01
*−
0.02
0.01
*0.
000.
01−
0.01
0.01
C
hild
is B
lack
−0.
080.
01**
*−
0.06
0.01
***
−0.
030.
01*
−0.
020.
01
(con
tinue
d)
at COLUMBIA UNIV on June 18, 2014abs.sagepub.comDownloaded from

981
Mat
h—en
d ki
nder
gart
en s
core
Mat
h—ga
in s
core
sR
eadi
ng—
end
kind
erga
rten
sco
reR
eadi
ng—
gain
sco
res
B
SEB
SEB
SEB
SE
C
hild
is A
sian
0.02
0.01
0.00
0.01
0.02
0.01
0.01
0.01
C
hild
is o
ther
/ m
ultir
ace/
ethn
icity
−0.
030.
01**
−0.
020.
01**
0.00
0.01
0.00
0.01
C
hild
live
s w
ith s
ingl
e
par
ent
−0.
110.
060.
020.
02−
0.16
0.07
*−
0.03
0.02
C
hild
hom
e la
ngua
ge is
n
ot E
nglis
h0.
010.
080.
030.
04−
0.01
0.09
0.03
0.04
C
hild
was
in r
elat
ive
c
are
prio
r to
k
inde
rgar
ten
0.00
0.02
0.00
0.02
−0.
020.
020.
000.
02
C
hild
was
in in
form
al
car
e pr
ior
to
kind
erga
rten
0.00
0.03
−0.
020.
020.
060.
03*
0.05
0.02
C
hild
was
in c
ente
r-
bas
ed c
are
prio
r to
k
inde
rgar
ten
0.05
0.03
*0.
020.
020.
020.
020.
010.
02
C
hild
has
a d
isab
ility
−0.
290.
05**
*−
0.22
0.04
***
−0.
160.
05**
*−
0.16
0.04
C
hild
att
ends
k
inde
rgar
ten
half-
time
−0.
530.
21*
−0.
140.
03**
*−
0.94
0.23
***
−0.
160.
03
Cla
ssro
om c
hara
cter
istic
s
A
vera
ge k
inde
rgar
ten
c
lass
siz
e−
0.42
0.16
0.02
0.02
−0.
430.
180.
030.
02
Pr
ivat
e ki
nder
gart
en
sch
ool
0.61
0.27
−0.
020.
030.
230.
310.
020.
04
Tab
le 4
. (co
ntin
ued)
(con
tinue
d)
at COLUMBIA UNIV on June 18, 2014abs.sagepub.comDownloaded from

982
Mat
h—en
d ki
nder
gart
en s
core
Mat
h—ga
in s
core
sR
eadi
ng—
end
kind
erga
rten
sco
reR
eadi
ng—
gain
sco
res
B
SEB
SEB
SEB
SE
A
vera
ge S
ES in
chi
ld’s
k
inde
rgar
ten
clas
sroo
m1.
360.
15−
0.01
0.02
1.36
0.17
0.00
0.02
Es
timat
eSE
Estim
ate
SEEs
timat
eSE
Estim
ate
SE
V ari
ance
bet
wee
n
cla
ssro
om4.
180.
320.
020.
003
5.63
0.42
0.04
0.00
4
Vari
ance
with
in c
lass
room
0.32
0.01
0.26
0.00
50.
310.
010.
230.
005
Vari
ance
att
ribu
tabl
e to
c
lass
room
0.93
0.09
0.95
0.14
Mod
el fi
t st
atis
tics
–2 lo
g lik
elih
ood
13,2
38.2
59,
802.
5013
,123
.57
9,46
5.85
BI
C (
smal
ler
is b
ette
r)13
,711
.77
10,2
82.2
513
,597
.09
9,94
5.59
Sam
ple
size
is 6
,212
stu
dent
s in
508
pub
lic a
nd p
riva
te k
inde
rgar
ten
prog
ram
s. T
he c
oeffi
cien
ts a
re s
tand
ardi
zed.
Rob
ust
stan
dard
err
ors
adju
sted
for
clus
teri
ng a
re s
how
n. C
ontin
uous
var
iabl
es a
t th
e st
uden
t le
vel a
re c
ente
red
at t
he c
lass
room
mea
n fo
r th
at v
aria
ble.
Dic
hoto
mou
s va
riab
les
are
not
cent
ered
. Ea
ch m
odel
incl
udes
a c
ompo
site
sco
re fo
r so
cial
eco
nom
ic s
tatu
s (S
ES);
mot
her’
s ag
e; t
he c
hild
’s g
ende
r an
d ra
ce/e
thni
city
; the
mod
e of
car
e th
e ch
ild
atte
nded
pri
or t
o ki
nder
gart
en; t
he t
ype
of s
truc
ture
d ac
tiviti
es t
he c
hild
par
ticip
ated
in o
utsi
de o
f sch
ool;
the
child
’s w
eigh
t at
bir
th; w
heth
er t
he c
hild
has
a
disa
bilit
y; a
ge a
t tim
e of
ass
essm
ent;
whe
ther
the
chi
ld e
nrol
led
in a
par
t-tim
e ki
nder
gart
en p
rogr
am; w
heth
er t
he c
hild
live
s w
ith o
ne p
aren
t; nu
mbe
r of
si
blin
gs; n
umbe
r of
pla
ces
the
child
live
d si
nce
birt
h; a
nd w
heth
er t
he c
hild
’s p
rim
ary
hom
e la
ngua
ge is
Eng
lish.
The
mod
el a
lso
cont
rols
for
clas
s si
ze; t
each
ers’
ed
ucat
ion;
tea
cher
’s r
ace/
ethn
icity
; num
ber
of y
ears
of t
each
er e
xper
ienc
e; t
each
ers
perc
eptio
n of
how
freq
uent
ly c
hild
ren
in t
he c
lass
room
mis
beha
ve; a
nd
whe
ther
the
re is
ord
er in
the
sch
ool.
The
mod
el a
lso
incl
uded
the
ave
rage
bac
kgro
und
char
acte
rist
ics
of t
he o
ther
chi
ldre
n in
the
cla
ssro
om. S
choo
l-lev
el
vari
able
s in
clud
e th
e ge
ogra
phic
loca
tion
of t
he s
choo
l and
whe
ther
it is
a p
riva
te k
inde
rgar
ten
prog
ram
. Var
ianc
e at
trib
utab
le t
o cl
assr
oom
is c
ompu
ted
as:
(var
ianc
e be
twee
n cl
assr
oom
s) d
ivid
ed b
y th
e su
m o
f the
var
ianc
e be
twee
n cl
assr
oom
and
the
var
ianc
e w
ithin
cla
ssro
om.
*p <
.05.
**p
< .0
1. *
**p
< .0
001.
Tab
le 4
. (co
ntin
ued)
at COLUMBIA UNIV on June 18, 2014abs.sagepub.comDownloaded from

Georges et al. 983
attention problems; effect size = -.09, ρ < .0001 for both behavior problems). The pace of growth for children with aggressive behavior was not statistically different from that of children with neither behavior problem (Table 4).
There was a significant association between the behavior of other children and mathematics and reading score gains, but only in classrooms where the other children had attention problems. The presence of other children with aggressive behavior was not significantly associated with mathematics or reading gains scores. The largest source for the differences in the pace of growth in test scores was associated with the child’s own behavior and the child’s starting point in mathematics or reading at kindergarten entry (Table 4).
Interaction EffectsGiven the difference in SES, gender, and minority status characteristics between the four behavior groups previously shown in Table 2, we tested whether the test score gap associated with any behavior problem is moderated or modified by SES, gender, or minority status. The score gaps were not moderated by SES, gender, or minority status. Interaction effects were not significant suggesting that the relation of behavior problems, SES, gender, and minority status to test score gaps are independent of each other. This means that the test scores of children in low-SES families with behavior problems are as adversely affected as the test scores of children in high-SES families with behavior problems.
DiscussionWe unpacked the association between attention problems, aggressive behavior, and mathematics and reading scores over the kindergarten year at the child level as well as at the classroom contextual level. Unlike previous studies, we examined the combined effects of attention and aggressive behavior problems, making it possible to unpack to read, in order to tease apart the specific associations of aggressive behavior, as as children with such behavior may also have attention problems. (McWayne, Fantuzzo, & McDermott, 2004).
Behavior Problems and Test ScoresChildren with both behavior problems and those with attention problems alone had lower scores and made fewer gains in both mathematics and reading over the kindergarten year compared with children with neither behavior problem or children with only aggressive behavior. The findings on the association between attention problems and test scores were consistent with previous studies (Alexander et al., 1993; Duncan et al., 2007; Finn et al., 1995; Friedman-Weieneth et al., 2007). For example, Duncan et al. (2007) found effect size of .08 (p < .001) for reading and effect size of .11 for mathematics (p < .001) when estimating the relation of attention skills to test scores with the ECLS-K
at COLUMBIA UNIV on June 18, 2014abs.sagepub.comDownloaded from

984 American Behavioral Scientist 56(7)
data set. The present study goes further than previous research. It showed the negative association between attention problems and the mathematics and reading scores was greater than that associated with aggressive behavior. At the end of kindergarten, the score gap among children with attention problems was about 8 percentile points, and among children with aggressive behavior, the gap was 3 percentile points. Children with attention problems gained fewer points, about 4 percentile points, over the school year than children in low-SES families or minority children. When we consider that low-achieving children are more likely to have lower achievement in the future, such gap could widen considerably in middle school and high school. The present study shows that lack of attention skills is damaging and puts children at risk of school failure even more so than the risks of low academic performance often seen among children in low-SES families and minority children.
Classroom Behavior and Test ScoresWith respect to the behavior of other children, our findings are consistent with other studies, with some distinctions. Classrooms with many aggressive children could affect the effectiveness of instruction because children who act out—such as arguing, fighting, getting angry, disturbing ongoing activities—may to get an immediate response from the teacher, as such instructional time is more likely to be affected, which could then adversely affect learning for all children (Finn et al., 1995; Raver, 2002; Reynolds, 1998). Our analyses show that a child’s test scores were unaffected if the classroom had other children with aggressive behavior. The classroom effects were related to the proportion of children with attention problems.
We did not find the expected large negative externalities from the presence of aggres-sive behavior in other children for several reasons. In kindergarten, the duration of academic instruction tends to be short, and classrooms tend to be, on average, small. The combination of short duration of instruction and small number of children with aggressive behavior in typically small classes might minimize negative externalities associated with the presence of aggressive children. It could also be that the kind of aggression that is typical among 5- and 6-year old children is not so detrimental to the point that children would be negatively affected by such behavior if teachers are able to easily regain control of the classroom.
The lack of large negative externalities could also stem from what children are learn-ing in kindergarten. For example, the mathematics young children are expected to learn tend to be primarily computational and are not taught with emphasis on conceptual understanding, but rather with an emphasis on memorization (Georges, 2009). As such, the content of the curriculum and the approach of teaching mathematics in kindergarten may not require sustained collaboration or empathetic peers, both of which can be impeded by aggressive behavior. By contrast, if the curriculum emphasizes memoriza-tion, then a child with attention problems would have great difficulty academically. Children with attention problems are not engaged in their own learning and potentially are not engaged with their peers. However, even though they are not disruptive to their
at COLUMBIA UNIV on June 18, 2014abs.sagepub.comDownloaded from

Georges et al. 985
peers, nor do they disrupt ongoing instructional activities, the lack of engagement with their peers and teacher could limit learning opportunities. Consequently, such detach-ment negatively impacts learning not only for the child but other children in the classroom as well.
The study has some limitations. The classroom behavior measure was based on children sampled for the ECLS-K, rather than all children in the classroom. Even though that is the case, we captured at least the lower boundary effect because we still found significant, albeit modest, association with classroom-level behavior problems. To counter the measurement error of not observing all children in all classrooms, which could undermine the effect size of classroom behavior, we controlled for class size and included in all models the teacher’s rating of the overall level of behavior problem for the entire class. Another limitation of the data was that the individual items that com-posed each of the behavior scales were not available. It would have been desirable to have the individual items to extrapolate those specific items that directly measured levels of attention skills. This would have allowed us to estimate directly the importance of each type of skills and be able to isolate specific forms of children’s engagement and provide more specificity about intervention measures.
We conjecture that even though aggressive behavior among other children had minimal relation to gains in scores at the kindergarten level, in later grades being in classrooms with aggressive and disruptive children could have negative influences on test scores because older children may be more difficult to discipline than younger children. We were unable to test this hypothesis with the ECLS-K because even though the children are followed until fifth grade, over time the children transitioned to differ-ent schools and different classrooms. Over time there was insufficient number of children per classroom or school to perform a longitudinal test of the relation between aggressive and disruptive children in the classroom and test scores.
There could be concerns about measuring attention skills and aggressive behavior using teacher ratings because such measures may be neither reliable nor valid. Teachers’ ratings of a child’s behavior could be subjectively biased. Teachers’ ratings of children’s behavior have been shown to reflect perceptions and embed the teachers’ own charac-teristics or the classroom’s characteristics rather than the child’s actual behavior (Downey & Pribesh, 2004; Konold & Pianta, 2007; Mashburn, Hamre, Downer, & Pianta, 2006). For example, race influences teachers’ rating of the child’s behavior. In a study using ECLS-K data, Downey and Pribesh (2004) concluded that Black children were consis-tently rated lower than White children on behavior, but the poorer evaluation of Black children were from White teachers rather than from Black teachers. Similarly, Mashburn et al. (2006) examined whether the characteristics of teachers and classrooms were associated with teachers’ ratings of children social competencies. They found teachers’ race, years of teaching experience, the child-teacher ratio, and the length of school days significantly affected teachers’ ratings of children’s social competencies. As such, they concluded, teachers’ ratings of a child’s behavior were not solely a function of the child, but encompassed other external factors unrelated to the child’s actual behavior.
at COLUMBIA UNIV on June 18, 2014abs.sagepub.comDownloaded from

986 American Behavioral Scientist 56(7)
Our analysis did control for both the children’s and teachers’ race/ethnicity to account for the potential subjective bias arising from the teacher and the classroom environment in rating a child’s behavior. We also included several teacher characteristics variables to account, in part, for rater effects of children’s behavior including teacher’s education, years of teaching experience in kindergarten and preschool, and types of early childhood courses taken.
ConclusionWe found test score gaps among children with any behavior problems. The gap associ-ated with attention problems was larger than that of aggressive behavior, SES, race/ethnicity, and gender. The score gaps for children with attention problems were 7 and 8 percentile points in mathematics and reading, respectively, which were greater than the score gaps for children in low-SES families (2 percentile points) and minority children (2 percentile points), all else equal. Being in a classroom where other children had attention problems also affected gains in test scores over the school year. On the other hand, aggressive behavior among other children in the classroom was not signifi-cantly associated with gains in mathematics or reading.
The results showed behavior problems that interfere with attending to and engaging in instructional activities, even if such behavior does not interfere with instructional activities, affect the ability to learn. The findings from this study and others (e.g., Epstein, Atkins, Cullinan, Kutash, & Weaver, 2008) show significant barriers to learning are present as early as the kindergarten year for children who lack attention skills. Minimizing the impact of attention problems is important because of its potential recipro-cal nature with subsequent school failure (Miles & Stipek, 2006; Trzesniewski et al., 2006; Welsh et al., 2001) and also because children who start a grade lagging behind will not, on average, do well academically in that school year; and they may act out to avoid tasks that are too difficult for them (Epstein et al., 2008). It becomes important for schools to be prepared to address attention problems, in promoting academic success, and to minimize school failure because such failure might lead to aggressive behavior later on.
Given the fundamental goal of improving academic achievement and minimizing test score gaps, it makes sense to align teacher training and school intervention to foster children’s attentive behavior. Teachers can take some simple measures to foster attentive behavior. For example, teachers should be persistent in communicating the skills the child needs such as listening, following directions, and asking questions. These skills not only need to be communicated consistently but should be modeled for the child. Teachers should provide time for the child to understand the required skills, and the child should get feedback on their behavior (Epstein et al., 2008). We also believe that school psychologists and social workers should be integral to school intervention to address behavior problems because they might perhaps have greater familiarity with or be the best agent to train on helping young children with behavior problems. In that way, teachers will focus on what they do best, and at the same time children will get the intervention they need to be successful in school.
at COLUMBIA UNIV on June 18, 2014abs.sagepub.comDownloaded from

Georges et al. 987
Declaration of Conflicting Interests
The author(s) declared no conflicts of interest with respect to the authorship and/or publication of this article.
Funding
The author(s) received no financial support for the research and/or authorship of this article.
Notes
1. We use the SAS procedure PROC MI for the multiple imputation procedure.2. We also tested the model using teachers’ responses in the fall of the kindergarten year to
test whether there might be any risks of reverse causality in that children who are excited to learn become more engaged and less disruptive during the school year. The results using fall reports are similar to the results presented in the article. That is, we find achievement gains are primarily affected by inattention. These results are available upon request.
References
Aldenderfer, M. S., & Blashfield, R. K. (1984). Cluster analysis. Thousand Oaks, CA: Sage.Alexander, K. L., Entwisle, D. R., & Dauber, S. L. (1993). First-grade classroom behavior: Its
short- and long-term consequences for school performance. Child Development, 64, 801-814.
Allison, P. D. (2002). Missing data. Thousand Oaks, CA: Sage.Arnold, D. H. (1997). Co-occurrence of externalizing behavior problems and emergent academic
difficulties in young high-risk boys: A preliminary evaluation of patterns and mechanisms. Journal of Applied Developmental Psychology, 18(3), 317-330.
Arnold, D. H., Ortiz, C., Curry, J. C., Stowe, R. M., Goldstein, N. E., Fisher, P. H., . . . Yershova, K. (1999). Promoting academic success and preventing disruptive behavior disorders through community partnership. Journal of Community Psychology, 27(5), 589-598.
Barth, J. M., Dunlap, S. T., Dane, H., Lochman, J. E., & Wells, K. C. (2004). Classroom environ-ment influences on aggression, peer relations, and academic focus. Journal of School Psychology, 42, 115-133.
Battistich, V., Solomon, D., & Delucchi, K. (1993). Interaction processes and student outcomes in cooperative learning groups. Elementary School Journal, 94, 19-32.
Buyse, E., Verschueren, K., Doumen, S., Van Damme, J., & Maes, F. (2008). Classroom problem behavior and teacher-child relationships in kindergarten: The moderating role of classroom climate. Journal of School Psychology, 46, 367-391.
Carr, E. G., Taylor, J. C., & Robinson, S. (1991). The effects of severe behavior problems in children on the teaching behavior of adults. Journal of Applied Behavior Analysis, 24, 523-535.
Crick, N. R., & Dodge K. A. (1994). A review and reformulation of social-information process-ing mechanisms in children’s social adjustment. Psychological Bulletin, 115(1), 74-101.
at COLUMBIA UNIV on June 18, 2014abs.sagepub.comDownloaded from

988 American Behavioral Scientist 56(7)
DiLalla, L. F., Marcus, J. L., & Wright-Phillips, M. V. (2004). Longitudinal effects of preschool behavioral styles on early adolescent school performance. Journal of School Psychology, 42, 385-401.
Dodge, K. A. (1991). Emotion and social information processing. In J. Garber & K. A. Dodge (Eds.), The development of emotion regulation and dysregulation (pp. 159-181). Cambridge, UK: Cambridge University Press.
Downey, D. B., & Pribesh, S. (2004). When race matters: Teachers’ evaluations of students’ classroom behavior. Sociology of Education, 77, 267-282.
Duncan, G. J., Dowsett, C. J., Claessens, A., Magnuson, K., Huston, A. C., Klebanov, P., . . . Japel, C. (2007). School readiness and later achievement. Developmental Psychology, 43(6), 1428-1446.
Epstein, M., Atkins, M., Cullinan, D., Kutash, K., & Weaver, R. (2008). Reducing behavior problems in the elementary school classroom: A practice guide (NCEE #2008-012). Washington, DC: National Center for Education Evaluation and Regional Assistance, Institute of Education Sciences, U.S. Department of Education. Retrieved from http://ies.ed.gov/ncee/wwc/publications/practiceguides.
Finn, J. D., & Pannozzo, G. M. (2004). Classroom organization and student behavior in kindergarten. Journal of Educational Research, 98, 79-92.
Finn, J. D., Pannozzo, G. M., & Voelkl, K. E. (1995). Disruptive and inattentive-withdrawn behavior and achievement among fourth graders. Elementary School Journal, 95, 421-434.
Friedman-Weieneth, J. L., Harvey, E. A., Youngwirth, S. D., & Goldstein, L. H. (2007). The relations between 3-year-old children’s skills and their hyperactivity, inattention, and aggres-sion. Journal of Educational Psychology, 99(3), 671-681.
Georges, A. (2009). Relation of instruction and poverty to mathematics achievement gains dur-ing kindergarten. Teachers College Record, 111, 2148-2178.
Graziano, P. A., Reavis, R. D., Keane, S. P., & Calkins, S. D. (2007). The role of emotional regu-lation in children’s early academic success. Journal of School Psychology, 45, 3-19.
Hamre, B. K., & Pianta, R. C. (2005). Can instructional and emotional support in the first-grade classroom make a difference for children at risk of school failure? Child Development, 76, 949-1127.
Hanish, L. D., Martin, C. L., Fabes, R. A., Leonard, S., & Herzog, M. (2005). Exposure to exter-nalizing peers in early childhood: Homophily and peer contagion processes. Journal of Abnormal Child Psychology, 33, 267-281.
Howse, R. B., Lange, G., Farran, D. C., & Boyles, C. D. (2003). Motivation and self-regulation as predictors of achievement in economically disadvantaged young children. Journal of Experimental Education, 71, 151-174.
Konold, T. R., & Pianta, R. C. (2007). The influence of informants on ratings of children’s behavioral functioning: A latent variable approach. Journal of Psychoeducational Assessment, 25, 222-236.
Ladd, G. W., Birch, S. H., & Buhs, E. S. (1999). Children’s social and scholastic lives in kinder-garten: Related spheres of influence? Child Development, 70, 1373-1400.
at COLUMBIA UNIV on June 18, 2014abs.sagepub.comDownloaded from

Georges et al. 989
Ladd, G. W., Kochenderfer, B. J., & Coleman, C. C. (1997). Classroom peer acceptance, friend-ship and victimization: Distinct relational systems that contribute uniquely to children’s school adjustment? Child Development, 68(6), 1181-1197.
Linares, L. O., Rosbruch, N., Stern, M. B., Edwards, M. E., Walker, G., Abikoff, H. B., et al. (2005). Developing cognitive-social-emotional competencies to enhance academic learning. Psychology in the Schools, 42, 405-417.
Mashburn, A. J., Hamre, B. K., Downer, J. T., & Pianta, R. C. (2006). Teacher and classroom characteristics associated with teachers’ ratings of prekindergartners’ relationship and behav-iors. Journal of Psychoeducational Assessment, 24, 367-380.
McClelland, M. M., Morrison, F. J., & Holmes, D. L. (2000). Children at risk for early academic problems: The role of learning-related social skills. Early Childhood Research Quarterly, 15, 307-329.
McEvoy, A., & Welker, R. (2000). Antisocial behavior, academic failure, and school climate: A critical review. Journal of Emotional & Behavioral Disorders, 8(3), 130-140.
McWayne, C. M., Fantuzzo, J. W., & McDermott, P. A. (2004). Preschool competency in con-text: An investigation of the unique contribution of child competencies to early academic success. Developmental Psychology, 40, 633-645.
Miech, R., Essex, M. J., & Goldsmith, H. (2001). Socioeconomic status and the adjustment to school: The role of self-regulation during early childhood. Sociology of Education, 74, 102-120.
Miles, S. B., & Stipek, D. (2006). Contemporaneous and longitudinal associations between social behavior and literacy achievement in a sample of low-income elementary school chil-dren. Child Development, 77, 103-117.
NICHD Early Child Care Research Network. (2003). Do children’s attention processes mediate the link between family predictors and school readiness? Developmental Psychology, 39, 581-593.
Normandeau, S., & Guay, F. (1998). Preschool behavior and first-grade school achievement: The mediational role of cognitive self-control. Journal of Educational Psychology, 90(1), 111-121.
Raver, C. C. (2002). Emotions matter: Making the case for the role of young children’s emo-tional development for early school readiness. Social Policy Report, 16, 3-19.
Reynolds, D. (1998). Schooling for literacy: A review of research on teacher effectiveness and school effectiveness and its implications for contemporary educational policies. Educational Review, 50, 147-162.
Rock, D. A., & Pollack, J. M. (2002). ECLS-K user’s manual for the ECLS-K base year data files and electronic codebook, NCES 2001-029 (Revised). Washington, DC: U.S. Department of Education, National Center for Education Statistics.
Schaffer, J. L., & Graham, J. W. (2002). Missing data: Our view of the state of the art. Psychological Methods, 7, 147-177.
Schoen, M. J., & Nagle, R. J. (1994). Prediction of school readiness from kindergarten tempera-ment scores. Journal of School Psychology, 32(2), 135-147.
Trzesniewski, K. H., Moffitt, T. E., Caspi, A., Taylor, A., & Maughan, B. (2006). Revisiting the association between reading achievement and antisocial behavior: New evidence of an envi-ronmental explanation from a twin study. Child Development, 77, 72-88.
at COLUMBIA UNIV on June 18, 2014abs.sagepub.comDownloaded from

990 American Behavioral Scientist 56(7)
Welsh, M., Parke, R. D., Widaman, K., & O’Neil, R. (2001). Linkages between children’s social and academic competence: A longitudinal analysis. Journal of School Psychology, 39, 463-481.
Yen, C.-J., Konold, T. R., & McDermott, P. A. (2004). Does learning behavior augment cognitive ability as an indicator of academic achievement? Journal of School Psychology, 42, 157-169.
Zhou, Q., Hofer, C., Eisenberg, N., Reiser, M., Spinrad, T. L., & Fabes, R. L. (2007). The devel-opmental trajectories of attention focusing, attentional and behavioral persistence, and exter-nalizing problems during the school-age years. Developmental Psychology, 43(2), 369-385.
Bios
Annie Georges, PhD, was a research scientist at the National Center for Children and Families, Columbia University, at the time of this work. An educational economist, her research focuses on classroom instruction and on achievement gaps.
Jeanne Brooks-Gunn, PhD is Virginia and Leonard Marx Professor of Child Development at Teachers College and the College of Physician and Surgeons of Columbia University. She directs the National Center for Children and Families. Her research focuses on the development of children and youth, with a particular focus on family and neighborhood characteristics of poverty, single parenthood, and low education. She also designs and evaluates programs and policies for at risk children and their families.
Lizabeth M. Malone, PhD, was a graduate research fellow at the National Center for Children and Families, Columbia University, at the time of this work and currently is a researcher at Mathematica Policy Research. Her research interests focus on early childhood development, in particular assessment and school readiness, and ecological factors influencing development.
at COLUMBIA UNIV on June 18, 2014abs.sagepub.comDownloaded from


