Embed Size (px)
Citation preview

Inter-American Development BankBanco Interamericano de Desarrollo
Latin American Research NetworkRed de Centros de Investigación
Research Network Working paper #R-433
Social Mobility in Latin America:Social Mobility in Latin America:Social Mobility in Latin America:Social Mobility in Latin America:Links with Adolescent SchoolingLinks with Adolescent SchoolingLinks with Adolescent SchoolingLinks with Adolescent Schooling
by
Lykke E. Andersen*
Universidad Católica BolivianaUniversidad Católica BolivianaUniversidad Católica BolivianaUniversidad Católica Boliviana
July 2001

2
Cataloging-in-Publication data provided by theInter-American Development BankFelipe Herrera Library
Andersen, Lykke E.
Social mobility in Latin America : links with adolescent schooling / by Lykke E.Andersen.
p. cm. (Research Network working papers ; R-433) Includes bibliographical references.
1. Social mobility--Latin America--Effect of Education, Secondary on. I. Inter-AmericanDevelopment Bank. Research Dept. II. Latin American Research Network. III. Series.
373 A558--dc21
�2001Inter-American Development Bank1300 New York Avenue, N.W.Washington, D.C. 20577
The views and interpretations in this document are those of the authors and should not beattributed to the Inter-American Development Bank, or to any individual acting on its behalf.
The Research Department (RES) produces the Latin American Economic Policies Newsletter,as well as working papers and books, on diverse economic issues. To obtain a complete list ofRES publications, and read or download them please visit our web site at:http://www.iadb.org/res/32.htm

3
Abstract1
This paper proposes a new measure of social mobility. It is based onschooling gap regressions and uses the Fields decomposition to determinethe importance of family background in explaining teenagers’ schoolinggaps. The method is applied to a sample of 18 Latin American householdsurveys conducted in the late 1990s. We find Chile, Argentina, Uruguay,and Peru among the countries with the highest social mobility, andGuatemala and Brazil among the least socially mobile countries. The resultsshow that social mobility is positively correlated with GDP and generaleducational attainment, but not related to income inequality in any obviousway. Social mobility is generally higher in highly urbanized countries. The schooling gap regressions also reveal differences in opportunitieswithin the family. Resources are clearly being diverted away from oldersiblings (especially sisters) towards younger siblings. In addition, it is anadvantage to be born into the household relatively late in the lifecycle of theparents. For most countries, female teenagers were found to havesignificantly smaller schooling gaps than male teenagers. This did not makethem significantly more mobile, however.
1 This paper was prepared for the 8th round of the Inter-American Development Bank Research Network Projecton Adolescents and Young Adults: Critical Decisions at a Critical Age. Financial assistance from the Bank isgreatly appreciated. The findings, interpretations, and conclusions expressed are entirely those of the author,however, and do not necessarily represent the views of the Inter-American Development Bank. I would like tothank Ricardo Fuentes for extensive help with non-standard data for this project, and Eduardo Antelo, AliceBrooks, Alejandra Cox Edwards, Suzanne Duryea, Alejandro Gaviria, Marianne Hilgert, Osvaldo Nina,Manuelita Ureta, Miguel Urquiola, Diana Weinhold, and Ernesto Yáñez for their valuable comments andsuggestions. I also thank the Catholic University in La Paz for the release time and resources they provided forthis study.

4
TABLE OF CONTENTS
1 Introduction...........................................................................................................................7
2 Methodology..........................................................................................................................8
3 Data ......................................................................................................................................10
4 Main Results........................................................................................................................134.1 Social Mobility across Countries...................................................................................134.2 Comparison with Other Social Mobility Rankings .......................................................14
5 DISCUSSION......................................................................................................................165.1 Cross-Country Analysis.................................................................................................16
Income Inequality ..........................................................................................................16Per Capita Income.........................................................................................................18Urbanization Rates ........................................................................................................19The Education System....................................................................................................20The Marriage Market ....................................................................................................23
5.2 Inter-Family Differences ...............................................................................................24Female-Headed Households..........................................................................................24Single Parent Households .............................................................................................25Indigenous Households..................................................................................................25Rural-Urban Differences ...............................................................................................25
5.3 Intra-Household Analysis ..............................................................................................26The Reverse Gender Gap in Education in Latin America .............................................26Life-Cycle Effects...........................................................................................................29Birth Order Effects ........................................................................................................30Extended Families .........................................................................................................30
5.4 Teenagers versus Young Adults ....................................................................................31
6 Conclusions and Policy Implications ................................................................................33
7 References............................................................................................................................37
Appendix A. A Theoretical Derivation of the Fields Decomposition..................................40
Appendix B. Social Mobility Estimates .................................................................................42
Appendix C. Macro Data .......................................................................................................43
Appendix D. Regression Results and Fields Decomposition for Colombia 1997...............44

5
LIST OF TABLES
Table 1: Summary information about household surveys used in the paper............................ 11Table 2: Summary information about schooling gaps ............................................................. 18Table 3: Schooling gaps for teenagers, by gender and zone .................................................... 22Table 4: Social Mobility by gender .......................................................................................... 23Table 5: SMI estimates with 95% confidence intervals for teenagers and young adults ......... 33Table 6: Macro economic variables used for correlation analysis .......................................... 34
LIST OF FIGURES
Figure 1: Social Mobility Index based on teenagers (13-19 years)............................................ 9Figure 2: Social Mobility and income inequality..................................................................... 12Figure 3: Social Mobility and GDP per capita ......................................................................... 14Figure 4: Social mobility and urbanization rates...................................................................... 15Figure 5: Social Mobility and schooling gaps.......................................................................... 16Figure 6: Social Mobility and pupil-teacher ratios in secondary education............................. 17Figure 7: Social Mobility and assortative mating..................................................................... 18Figure 8: Comparison of Social Mobility Indices based on teenagers and on young adults.... 26

6

7
1 Introduction
Latin American countries are generally known to have very unequal income distributions
compared to most other countries in the world. This is considered undesirable because it
implies that many people live in poverty.
However, high inequality combined with high social mobility is not as bad as high
inequality combined with low social mobility. Actually, the high inequality-high mobility
combination appears to be beneficial for long-run growth prospects. It provides people with
very good incentives to work hard, be innovative, and take risks, because the expected returns
are high. The high inequality-low mobility combination, on the other hand, does not provide
such incentives. Rich people have little incentive to work hard, because they are born rich and
they will remain rich no matter what they do. Poor people also have little incentive to work
hard, because no matter what they do they are unlikely to move up the economic ladder.
The purpose of this paper is to investigate the degree of social mobility in Latin
American countries. For that purpose we propose a new measure of social mobility, which has
the strong advantage that it can be calculated from standard household survey data, which is
available for most countries. It basically measures the importance of family background in
determining the education of teenagers. If family background is very important, we will say
that social mobility is low.
Social mobility in this sense is likely to be correlated with income mobility, given the
close connection between education and income. A measure based on education, however, is
more desirable than a measure based on income, because there are many more problems
associated with the reporting of income than the reporting of education.2
The remainder of the paper is organized as follows. Section 2 describes the
methodology used to estimate social mobility. Section 3 describes the data used for this
project. Section 4 summarizes the main results and compares them with previous estimates of
social mobility in Latin America. Section 5 discusses the results both at the cross-country
level and at the household level. Section 6 provides conclusions and policy implications.
2 Székely and Hilgert (1999) have written a very interesting paper on all the problems that arise in trying tocompare income measures and Gini coefficients from different Latin American countries.

8
2 Methodology
The main idea behind our proposed methodology is the following: If family background
(parents’ education and household income) is important in determining a child’s
opportunities, then social mobility is low. On the other hand, if family background is not
important in explaining opportunities, then social mobility is high.
As an indicator of opportunities we use the schooling gap, which is defined as the
disparity between the years of education that a teenager or young adult would have completed
had she entered school at normal school starting age3 and advanced one grade each year, on
one hand, and the actual years of education, on the other hand. Thus, the schooling gap
measures years of missing education.
For example, an 18-year old teenager who has completed 9 years of schooling will
register a schooling gap of (18-9-6) = 3 years, if he lives in a country where children are
supposed to start school at age 6. If he has actually gone to school all the time between age six
and 18 (12 years), but has been retained 3 times and required to repeat a year, then he will still
register as having a schooling gap of 3 years, because years of education is calculated on the
basis of the level of schooling attained and not the actual years of study.
The schooling gap is a very simple indicator of future opportunities, but it is well
suited for our purpose and has several advantages compared to measures based on earnings or
years of education. First, income measures are notoriously inaccurate, highly dependent on
season for large groups of the population, and generally difficult to compare across countries.4
Second, years of education is not a good measure of educational attainment for young people,
because many of them are still in school. For example, a 14-year-old with 8 years of
schooling is doing fine, while an 18-year-old teenager with 8 years of schooling is a drop-out.
The schooling gap measure solves these problems, because years of missing education is a
relatively simple measure that is easily comparable across countries and population groups, it
is rarely misreported, and it can be used for teenagers who are still of school age. It does not
take into account differences in school quality, however, and that seems to be the main
drawback. School quality issues will be discussed in Sections 5 and 6.
3 Normal school starting age is 6 for most countries, but 7 for Brazil, El Salvador, Guatemala, Honduras, andNicaragua.4 See Székely and Hilgert (1999) for an excellent discussion of the differences in income measures in LatinAmerican household surveys.

9
We will determine the importance of family background in the following way. For
each country we select all the teenagers who live at home (with at least one parent) and
regress their schooling gaps on two family background variables (adult household income per
capita, and the maximum of father’s and mother’s education) and a variety of other variables
that might be relevant in explaining schooling gaps (age, age of head parent at birth of the
child, dummies for the presence of older sisters, older brothers, younger sisters, or younger
brothers, a dummy for a non-biological relation to the household head, a dummy for female-
headed households, a dummy for single parent households, a self-employment dummy for the
family head, average regional income, and average regional education). We then use the
Fields decomposition (Fields, 1996) on the regression results to calculate the percentage of
the total variance in schooling gaps that can be explained by the two family background
variables.
A theoretical derivation of the Fields decomposition is given in Appendix A. In
practice it works as follows: For each explanatory variable, we calculate a factor inequality
weight, which is the product of the coefficient estimate for each explanatory variable, the
standard deviation of that same variable, and the correlation between the same variable and
the dependent variable. All factor inequality weights in the regression are scaled to sum to R2,
and each is intended to measure what percentage of the total variation is explained by the
respective variable. Our Social Mobility Index is 1 minus the sum of the two factor inequality
weights belonging to the two family background variables. When our index is low, family
background is an important determinant of the education gap, and consequently, social
mobility is low.
The two basic assumptions underlying this methodology are that a smaller schooling
gap should imply better future opportunities for young people and that equality of opportunity
is a good indicator of social mobility. These appear to be reasonable assumptions, given
previous vast empirical evidence on the positive links between education and earnings,
between educational inequality and income inequality (Lam, 1999), between educational gaps
and inequality (Dahan and Gaviria, 2000) and between educational gaps and social mobility
(Dahan and Gaviria 2000).
While the schooling gap regressions are mainly used as intermediate inputs in the
calculation of a Social Mobility Index, they contain other important information about the

10
differences in opportunities between young people from different types of households and
even between young people within the same household. For example, a child’s position in the
family might affect his educational attainment and thereby his future opportunities. First-born
children, for example, usually enter the family early in the life-cycle of the parents, and as a
result, there may not be as many resources available for them as for siblings born later in the
life-cycle of the parents (Binder and Woodruff, 1999). This argument suggests that younger
siblings should have a smaller educational gap than older siblings, and that children with
young parents should have a larger schooling gap than children with older parents. There is
also likely to be gender differences between educational attainment of siblings, and possibly
cross-effects between gender and birth order. An older sister may, for example, receive less
education than an older brother because the opportunity costs of her education are greater,
while younger siblings may benefit from having older siblings who work and contribute to
total household income (see Jensen, 1999). For these reasons we include other variables
describing the teenager’s position in the family, and we discuss the results in detail in Section
5.
Due to clustering at the regional level, we use cluster correction (the Huber/White/
sandwich estimator) in all of our estimations (see Moulton, 1986).
3 Data
The main data used for this project is a collection of 18 standardized household surveys from
the Inter-American Development Bank. These are briefly described in Table 1.
The surveys vary greatly in sample size. The largest is the Brazilian survey, containing
346,106 observations, while the smallest is the Peruvian survey, with only 19,745
observations. The precision with which we can estimate our Social Mobility Indices will
therefore vary considerably across countries, and it is important to calculate confidence
intervals for our SMI estimates in order to make sensible comparisons.
The surveys are representative at the national level, except in two cases. The surveys
for Argentina and Uruguay cover only urban areas, but since these are highly urbanized
countries, the surveys cover most of their populations (80-90%).

11
Table 1. Summary Information on Household Surveys Used in the Paper
Country YearSamplesize Coverage Name of survey
Argentina 1996 111235 Urban Encuesta Permanente de HogaresBolivia 1997 36752 National Encuesta Nacional de EmpleoBrazil 1997 346106 National Pesquisa Nacional por Amostra de DomiciliosChile 1998 188360 National Encuesta de Caracterizacion Socioeconomica NacionalColombia 1997 143398 National Encuesta Nacional de Hogares-Fuerza de TrabajoCosta Rica 1998 43944 National Encuesta de Hogares de Propositos MultiplesDominican Rep. 1996 24041 National Encuesta Nacional de Fuerza de TrabajoEcuador 1998 26134 National Encuesta de Condiciones de VidaEl Salvador 1995 40004 National Encuesta de Hogares de Propositos MultiplesGuatemala 1998 35725 National Encuesta Nacional de Ingresos y Gastos FamiliaresHonduras 1998 32696 National Encuesta Permanente de Hogares de Propositos MultiplesMexico 1996 64916 National Encuesta Nacional de Ingreso Gasto de los HogaresNicaragua 1998 23637 National Enc. Nac. de Hogares sobre Medicion de Niveles de VidaPanama 1997 40320 National Encuesta de HogaresParaguay 1998 21910 National Encuesta de HogaresPeru 1997 19745 National Enc. Nac. de Hogares sobre Medicion de Niveles de VidaUruguay 1997 64028 Urban Encuesta Continua de HogaresVenezuela 1997 76965 National Encuesta de Hogares por Muestreo
Source: Inter-American Development Bank, Research Department.
The most important variable we use in our analysis is years of education, which should
be reasonably reliable and comparable across countries. Table 2 provides a summary of
schooling gaps for all the teenagers (aged 13-19) and young adults (aged 20-25) included in
our analysis, i.e., those still living at home. The normal school start age, which is used to
calculate schooling gaps, is also given in this table.
The table shows that about 95% of all teenagers can be included in our analysis, with
the remaining 5% excluded because they no longer live at home (i.e., they have formed their
own households or reside as live-in maids in other households) or because we are missing
some crucial information for them (e.g., parents’ education levels or household income). The
share of teenagers included is relatively stable, varying from 91% in Nicaragua to 98% in
Peru.
In the case of young adults (20–25 year-olds) we would only be able to include an
average of 54% of all observations in a social mobility analysis, since almost half of this age
group has left home. There is thus a very large group of young adults excluded from analysis.
Since young adults who leave home relatively early may differ significantly from those who
leave home later in terms of social mobility, we suspect that a social mobility measure based
on young adults may be biased. Furthermore, the share of young adults that can be included in
the analysis varies greatly across countries, from 47% in Nicaragua to 68% in Mexico.
12
Table 2: Summary Information on Schooling Gaps for Teenagers and AdolescentsIncluded in the Analysis
Country YearNormalschool
startingage
Averageschoolinggap for
teenagers
Averageschooling gap
for youngadults
% ofteenagersincluded
in analysis
% of youngadults
included inanalysis
Argentina* 1996 6 0.75 5.39 95% 53%Bolivia 1997 6 2.33 6.52 94% 47%Brazil 1997 7 3.27 8.24 94% 49%Chile 1998 6 1.66 5.89 94% 57%Colombia 1997 6 2.88 7.81 94% 55%Costa Rica 1998 6 3.00 8.17 94% 48%DominicanRepublic
1996 6 2.38 7.22 95% 58%
Ecuador 1998 6 2.25 6.79 95% 53%El Salvador 1995 7 2.71 7.46 94% 51%Guatemala 1998 7 2.81 7.37 94% 53%Honduras 1998 7 3.82 9.10 94% 51%Mexico 1996 6 2.38 8.19 98% 68%Nicaragua 1998 7 3.75 9.62 91% 47%Panama 1997 6 2.03 6.48 93% 55%Paraguay 1998 6 2.80 8.36 94% 49%Peru 1997 6 1.92 5.83 98% 61%Uruguay* 1997 6 1.39 6.20 97% 62%Venezuela 1997 6 2.29 7.67 96% 62%Average 2.47 7.35 95% 54%
Source: The Inter-American Development Bank, Research Department. Note: *The samples for Argentina andUruguay cover only urban areas.
The variable that is most prone to measurement error and least comparable across
countries is “total adult household income.” For some countries that includes only labor
income, while for other countries it also includes non-labor income, capital rents, property
rents, and non-monetary income. In some cases missing observations have been imputed by
the national statistical offices, in other cases they have been imputed by the research
department at the Inter-American Development Bank. Only in the latter case were we able to
include a dummy when values were imputed.5
In the discussion section of this paper we correlate our Social Mobility estimates with
various macro level variables. They have all been found on the homepage of the Inter-
American Development Bank and are shown in Table 6 in Appendix C.
5 For more information about the variables used for this project, please contact Suzanne Duryea([email protected]) at the IADB.

13
4 Main Results
4.1 Social Mobility across Countries
Figure 1 (and Table 5 in Appendix B) shows our main social mobility index with 95%
confidence bounds. The index is based on teenagers representing the whole country, but in
two cases (Argentina and Uruguay) the samples only include urban residents. These two
countries are both highly urbanized (more than 85% of the population living in urban areas),
so the urban samples provide a reasonable approximation to a global sample.
The confidence bounds have been estimated by bootstrapping (100 repetitions) and the
span of the confidence interval reflects the number of observations in the sample. The larger
the sample, the narrower the confidence interval.
Figure 1. Social Mobility Index Based on Teenagers (13-19 years)
1. Chile
2. Argentina*
3. Uruguay*
4. Peru
5. Mexico
6. Paraguay
7. Panama
8. Venezuela
9. Dominican Rep.
10. El Salvador
11. Honduras
12. Colombia
13. Costa Rica
14. Nicaragua
15. Ecuador
16. Bolivia
17. Brazil
18. Guatemala
0.70 0.75 0.80 0.85 0.90
SMI for teenagers (point estimate and 95% confidence interval) * Based on urban samples only.

14
Chile, Argentina, Uruguay, and Peru stand out as having high social mobility, while
Guatemala and Brazil stand out as having very low social mobility. The picture for those in
between is less clear since their confidence intervals tend to overlap. However, Bolivia,
Ecuador, Nicaragua, Costa Rica, and Colombia all have rather low social mobility.
Appendix D contains full regression results and a full Fields decomposition for one
typical country, Colombia. To save space we do not report full regression results for all
countries, but they are all very similar to Colombia. The Stata code created to make the Fields
decomposition is available from the author upon request.
4.2 Comparison with Other Social Mobility Rankings
Two papers from the Inter-American Development Bank have previously attempted to
calculate Social Mobility Indices for Latin American countries using household surveys
identical or similar to the ones used in this paper. Like this study, both attempt to measure the
importance of family background in determining the schooling gap.
The first of these papers is by Behrman, Birdsall and Székely (1998). They regress the
schooling gap on three family background variables (father’s years of schooling, mother’s
years of schooling, and household income) and two dummies (urban and female-headed
household). They then calculate the proportion of the variance in the schooling gap that is
associated with a weighted average of the family background variables, where the weights are
the regression coefficient estimates for these three variables.
The idea is similar to ours, but we include many more explanatory variables in the
regressions, and thus hopefully obtain a better-specified model, and we use the Fields
decomposition to determine the importance of the three family background variables. The
advantage of the Fields decomposition is that it is invariant to scaling of the variables. For
example, it is not necessary to translate all incomes into a common currency, as was necessary
for Behrman, Birdsall and Székely in order to make their index reasonably comparable across
countries.
Instead of both father’s and mother’s education, we use the maximum of the two,
which has the advantage that we can include adolescents who live with only one parent. In
addition, it seems likely that the better educated of the parents has greater say in the education
decisions of their children.

15
The correlation between our main Social Mobility Index and their Family Background
Immobility Index is -0.71.6 The two indices agree that Chile, Argentina and Uruguay are the
three most socially mobile countries, and Brazil the least mobile.7 The ranking of those in
between differ, but as shown above, the differences are not statistically different. The
differences appear to be due to their larger age group (10-21 year-olds), and the fact that some
of our surveys are more recent than theirs.
The second paper on the subject is by Dahan and Gaviria (2000). They also use the
schooling gap to calculate their social mobility index, but in order to gauge the influence of
family background they compare the correlation in gaps between siblings to the correlation in
gaps between random adolescents.
The correlation between our main SMI and their index is -0.52, but with little
agreement on the ranking. They find Costa Rica, Peru, and Paraguay to be more socially
mobile than Chile, and Bolivia, Ecuador, Nicaragua, Colombia, Mexico, and El Salvador to
be even less mobile than Brazil. Besides applying a completely different methodology, there
is another important difference. Dahan and Gaviria’s samples are much smaller than ours,
since they require households with at least two siblings in the chosen age range (16-20) in
order to calculate correlations.
We think that our index is an improvement over the previous ones for the following
reasons. First, our schooling gap regressions are more inclusive and better specified than those
in Behrman, Birdsall and Székely, and unlike their indices ours is not sensitive to the scaling
of variables. Second, our method includes, on average, 95% of all teenagers, while the Dahan
and Gaviria index only includes an average of about 37% of all the adolescents in their
selected age group. There is reason to believe that these are not representative of all
adolescents in the age group, since adolescents with many siblings are much more likely to be
included. Third, our method measures directly what we are interested in—namely the
influence of family background on education gaps—while Dahan and Gaviria’s method
measures this only indirectly.
None of the other indices have been reported with confidence intervals or standard
errors, so it is unknown whether the reported differences between countries are in fact
6 When excluding Bolivia, for which Behrman et al. had data only for urban areas.7 Behrman et al. did not have data for Guatemala.

16
significant. Behrman, Birdsall and Székely divide their samples into 559 sub-samples, many
of which may be so small that the results cannot be significantly different from each other.
They neither report the number of observations in their regressions, nor any standard errors or
confidence intervals.
5 Discussion
In this section we will discuss our social mobility results in much more detail and discuss
what factors are associated with social mobility.
5.1 Cross-Country Analysis
Income Inequality
One of the main reasons for measures of social mobility being important is that the
conventional GINI coefficient does not capture all, or even the most important part, of the
“fairness” of income distributions.
The GINI coefficient is a static measure of inequality, and even if we measure it at
several points in time, it does not tell us whether the same people who are at the bottom of the
distribution every time. A country where income recipients move relatively freely around the
income distribution would seem fairer than one where the poor are stuck consistently at the
low end. Social Mobility indices are designed to measure that part of “unfairness.”
Figure 2 compares our measure of Social Mobility with a GINI coefficient for each
country. We use a GINI measure that has been adjusted for differences in household survey
characteristics, such as coverage, income measure used, and timing (Székely and Hilgert,
1999, Table 5, Column 8), so they should be reasonably comparable across countries.

17
Figure 2. Social Mobility and Income Inequality
Notes: Argentina and Uruguay estimates are based on urban populations only. The GINI coefficients are fromSzékely and Hilgert 1999, which generally uses the same surveys as are used for the social mobility index.However, in a few cases the SMI is based upon a slightly more recent survey than the GINI.
We see that there is no clear relationship between Social Mobility and Inequality (ρ =
–0.12). Guatemala, Ecuador, and Brazil are clearly “unfair” countries, since they have both
high income inequality and low social mobility. In those countries, there are large gaps
between rich and poor and there is little chance of crossing those gaps.
There are no clearly “fair” countries in our sample. Chile and Argentina have high
social mobility, but they also have very high income inequality. Honduras has reasonably low
income inequality (by Latin American standards), but its social mobility is at the low end.
While low mobility and high income inequality is clearly the worst combination, high
mobility and low income inequality is not necessarily the best. High income inequality and
high mobility (as in the case of Chile) may provide better incentives for people to study hard,
work hard, be innovative, and take risks, because the returns are higher. Better incentives may
lead to greater growth in the long run because the work force is better motivated, better
educated, more innovative, and less dependent on social safety nets.
Chile
Colombia
Nicaragua
Costa Rica
Ecuador
Bolivia
Brazil
Guatemala
Argentina*MexicoPanama
Venezuela
Uruguay*Peru
Paraguay
Dom.R.
Honduras
El Salvador
45.0
50.0
55.0
60.0
65.0
0.7000 0.8000 0.9000 1.0000
SMI based on teenagers (13-19 years)
Adju
sted
GIN
I

18
Per Capita Income
Several theoretical papers have suggested mechanisms through which social mobility and
economic growth might be related. Murphy, Shleifer and Vishny (1991), Raut (1996), and
Hassler and Mora (1998) all use the idea that intelligent agents may contribute to higher
technological growth if they are assigned appropriate positions in the economy (e.g.,
entrepreneurs rather than workers or engineers rather than lawyers). If social mobility is low,
educational attainment and job allocation will depend more on family background and less on
intelligence, implying an inefficient education and use of the intelligent people in the society.
The authors show (in different types of models) how this can give rise to multiple equilibria:
One with low growth and low social mobility and another with high growth and high social
mobility.
The causality between growth and mobility goes in both directions. High social
mobility implies a better use of human resources, which implies higher growth. High growth
rates, on the other hand, facilitate social mobility because the rate of change in the society is
higher. In a highly dynamic society children cannot just follow in their parents’ footsteps as
they could in a more static society.
The correlation between our Social Mobility Index and GDP per capita is 0.53,
implying that higher per capita GDP is indeed associated with higher social mobility. The
correlation is relatively strong and thus lends evidence to the theoretical arguments stated
above.
Figure 3 suggests that Argentina, Chile, and Uruguay are located in high growth-high
social mobility equilibria, while Guatemala, Bolivia, Nicaragua, and Colombia are stuck in
low growth-low social mobility equilibria (assuming that the higher GDPs are caused by
higher long-term growth rates).
In contrast to our results, Dahan and Gaviria (2000) did not find any clear correlation
between social mobility and per capita income.

19
Note: Argentina and Uruguay estimates are based on urban populations only.
Urbanization Rates
There is a tendency for highly urbanized countries to have higher social mobility than less
urbanized countries, probably because it is easier for governments to provide decent education
for everyone when children are clustered together in urban centers. Figure 4 shows the
relationship, with Argentina and Uruguay having 100% urbanization rates as in the samples
used to calculate social mobility.
We could have adjusted the social mobility estimates for Argentina and Uruguay
downwards to reflect their actual urbanization rates (87.1 and 85.6, respectively), but the
adjustment would be very small and would not affect their ranks among the four most mobile
countries in the sample.
Figure 3. Social Mobility and GDP Per Capita
El Salvador
HondurasDom.R.
Paraguay
Peru
Uruguay*
Venezuela
Panama
Mexico
Argentina*
Guatemala
Brazil
BoliviaEcuador
Costa Rica
Nicaragua
Colombia
Chile
0.0
1000.0
2000.0
3000.0
4000.0
5000.0
6000.0
7000.0
0.7000 0.8000 0.9000 1.0000
SMI based on teenagers (13-19 years)
GD
P pe
r cap
ita (1
990
US$
)

20
The positive relationship between urbanization rates and social mobility (ρ = 0.55)
leads us to suspect that urban teenagers might be more socially mobile than rural teenagers.
However, when dividing the samples by zone, we did not find evidence of that hypothesis.
Rural and urban teenagers are affected in approximately the same way by family background.
On average, rural teenagers are actually slightly more mobile than urban teenagers, but the
difference is not statistically significant. The average SMI for rural teenagers is 0.8725, while
it is only 0.8549 for urban teenagers. Bolivia is the only country in the sample where urban
teenagers are significantly more mobile than their rural counterparts (SMIs of 0.8841 and
0.8239, respectively).
The Education System
A free education system of high quality would seem the obvious way to increase social
mobility. Theoretically, any teenager could then get the education he wants independent of his
family background. His idea of the ideal education may still depend on family background,
though, so social mobility need not be perfect.
Figure 5 shows that there is a clear, negative relationship between social mobility and
schooling gaps (ρ = -0.60). The lower the average schooling gap the higher the mobility. This
Figure 4. Social Mobility and Urbanization Rates
Chile
ColombiaNicaragua
Costa Rica
EcuadorBolivia
Brazil
Guatemala
Argentina*
Mexico
Panama
Venezuela
Uruguay*
Peru
Paraguay
Dom.Rep.
HondurasEl Salvador
40.0
50.0
60.0
70.0
80.0
90.0
100.0
0.7000 0.8000 0.9000 1.0000
SMI based on teenagers (13-19 years)
Urb
aniz
atio
n ra
tes

21
makes it likely that countries could improve their social mobility just by reducing schooling
gaps. It is not inevitable, however. Bolivia and Ecuador have below average schooling gaps,
but still have very low social mobility.
It is interesting to notice that four of the five countries where children start school at
age seven instead of age six (i.e., Guatemala, Brazil, Nicaragua, and Honduras), are among
the countries with the largest schooling gaps and the lowest social mobility. The correlation
between school start age and social mobility is –0.54, and the correlation between school start
age and teenage schooling gaps is 0.66, indicating that it might be an advantage to send
children to school at age six rather than seven.
One way to reduce schooling gaps is to make sure that the quality of public education
is sufficiently high so that students do not drop out simply because classrooms are so crowded
or teachers so incompetent that the benefit of attending school is very small.
If we choose the pupil-teacher ratio in secondary education as an indicator of the
quality of the public education system, we find Nicaragua among the worst (34 pupils per
Figure 5. Social Mobility and Schooling Gaps
Chile
Colombia
Nicaragua
Costa Rica
EcuadorBolivia
Brazil
Guatemala
Argentina*
Mexico
PanamaVenezuela
Uruguay*
Peru
Paraguay
Dom.Rep.
Honduras
El Salvador
0.0
0.5
1.0
1.5
2.0
2.5
3.0
3.5
4.0
4.5
0.7000 0.8000 0.9000 1.0000
SMI based on teenagers (13-19 years)
Aver
age
scho
olin
g ga
p

22
teacher) and Venezuela and Argentina among the best (10 pupils per teacher), as shown in
Figure 6.
The pupil-teacher ratio is weakly correlated to our Social Mobility Index (ρ = -0.31
across countries) implying that better school quality tends to lead to higher social mobility,
basically through lowr drop-out rates and smaller schooling gaps.
The fact that we cannot control for school quality at the individual level may lead to a
bias in the mobility estimate. Usually rich and well-educated families tend to choose better
and more expensive private schools than poorer families. Thus, even if children in poor public
schools have a zero schooling gap, they may be far behind children in expensive private
schools. If we could construct and use “quality-adjusted” schooling gaps, we would probably
see that family background is more important than when we use simple schooling gaps. This
is because there are many children from poor families who appear to have all the schooling
they should, but in fact this schooling may not be worth much. The bias is likely to be larger
Figure 6. Social Mobility and Pupil-Teacher Ratios in Secondary Education
Chile
Colombia
Nicaragua
Costa Rica
Ecuador
BoliviaBrazil
Guatemala
Argentina*
Mexico
Panama
Venezuela
Uruguay*Peru
Paraguay
Dom.Rep.Honduras
El Salvador
5.0
10.0
15.0
20.0
25.0
30.0
35.0
0.7000 0.8000 0.9000 1.0000
SMI based on teenagers (13-19 years)
Pupi
l-tea
cher
ratio
in
sec
onda
ry e
duca
tion

23
in countries where the public education system covers the population well, but is of very poor
quality compared to private schools.
The Marriage Market
The marriage market can work either to increase or to decrease social mobility, depending on
the degree of assortative mating in the country. If people tend to marry only people from their
own class, then social mobility is restrained by marriage customs. If, on the other hand,
people often marry outside their class, then social mobility is promoted by the marriage
market, and inequality is lower, since resources are spread out more evenly across
households.
A simple measure of the degree of assortative mating is the correlation between
spouses’ education levels, ρm. This correlation is generally high in Latin America, ranging
from 0.67 in Costa Rica to 0.79 in Bolivia. The corresponding figure for United States in 1990
is 0.62 (Kremer, 1996).
Figure 7 shows that there is only a weak negative relationship between spouses’
education levels and social mobility (ρ = -0.36). In Bolivia and Colombia, the marriage
market contributes to low social mobility as the correlations between spouses’ education
levels are extremely high. In Uruguay, Honduras and Argentina the less segregated marriage
market contributes to higher social mobility. Chile has high social mobility, despite the fact
that the correlation between spouses’ education levels is among the highest in Latin America.

24
Figure 7. Social Mobility and Assortative Mating
El Salvador
Honduras
Dom.Rep.
ParaguayPeru
Uruguay*
Venezuela
PanamaMexico
Argentina*
Guatemala
Brazil
Bolivia
Ecuador
Costa Rica
Nicaragua
ColombiaChile
0.60
0.62
0.64
0.66
0.68
0.70
0.72
0.74
0.76
0.78
0.80
0.7000 0.8000 0.9000 1.0000
SMI based on teenagers (13-19 years)
Cor
rela
tion
betw
een
spou
ses'
edu
catio
n le
vels
Note: Argentina and Uruguay estimates are based on urban populations only, but have been adjusted to bedirectly comparable to the other estimates.
5.2 Inter-Family Differences
This section explores differences in social mobility between different types of households.
The types we consider are male versus female-headed households, dual-parent versus single-
parent households, indigenous versus non-indigenous households, and rural versus urban
households.
Female-Headed Households
Just as girls seem to be better educated than boys in most Latin American countries (see
Section 5.3 below), it appears that teenagers living in female-headed households are better off
than teenagers living in male-headed households.
On average the schooling gaps for teenagers in female-headed households are 0.22
years (or 9%) smaller than those in male-headed households. For no country in the sample is
it a significant disadvantage to live in a female-headed household, although in about half of
our countries there is no significant difference.

25
Single-Parent Households
Most single-parent households are headed by women, so it is possible that the single parent
dummy rather than the female-headed household dummy would pick up the expected
disadvantage from living with a single mother.
But contrary to expectations, it is generally not a disadvantage to be a teenager in a
single-parent household. Only in Ecuador and Paraguay does the single dummy come out
significantly positive, thus indicating that the gap is a little higher when living in a single
parent household rather than a dual-parent household.
Indigenous Households
Indigenous teenagers generally have larger schooling gaps than non-indigenous teenagers. We
have ethnicity data for six countries in our sample, but only for three countries (Costa Rica,
Ecuador, and Guatemala) does the ethnic dummy come out positive. In these three countries
being ethnic adds about half a year to the schooling gap. For Bolivia, Brazil, and Peru there
were no significant differences between ethnic groups after controlling for other factors.
Rural-Urban Differences
Both the demand for and the supply of schooling differ dramatically between rural and urban
areas in Latin America. Thus, the average gap for teenagers in rural areas is 4.0 years, while it
is only 2.2 years in urban areas (see Table 3). On average gaps are 82% higher in rural areas
than in urban areas, but there is wide variation across countries. Bolivia has the highest
relative difference, with 121% greater gaps in rural areas, while Guatemala has the greatest
absolute difference (2.78 years). Brazil, Costa Rica, Paraguay, and the Dominican Republic
have the smallest relative differences (less than 50% greater gaps in rural areas).
Some of the difference is explained by differences in characteristics, such as a higher
number of siblings and a higher proportion of indigenous people. The pure effect of location
is only 0.70 years on average, implying that the schooling gap of urban teenagers is 28%
smaller than the gap of rural teenagers, all else being equal.
In Bolivia, rural teenagers are significantly less socially mobile than urban teenagers,
while in Guatemala and Nicaragua rural teenagers are significantly more mobile than their
urban counterparts. For all other countries the difference is not statistically significant.

26
5.2 Intra-Household Analysis
In this section we will explore the differences in opportunities between children of the same
household. The differences we will consider are gender, birth order, timing of birth, and
whether the teenager is a biological child of the head of household.
The Reverse Gender Gap in Education in Latin America
Generally, women in developing countries are less likely than men to attend high school—on
average there are only 8 women in high school for every 10 men (World Development Report
1999). In Latin America, however, there is a reverse gender gap. In almost all Latin American
countries, women are more likely to attend high school than men are, and this anomaly is also
reflected in our schooling gaps. Only in Bolivia, Mexico, and Guatemala do women have
higher schooling gaps than men. In the rest of the countries in our sample, women have
smaller gaps. We have not been able to find any explanations in the literature for the reverse
gender gap in Latin America, so here we will venture some tentative suggestions, which
remain to be empirically tested.
In Latin America, girls have typically contributed greatly to domestic and agricultural
work, while boys more often have paid jobs outside the house. With the demographic
transition and increase in household amenities, however, girls’ time on household chores may
have been slowly reducing over time. If boys’ time has not been freed up in a similar manner,
and if girls have not been pushed to work outside the house instead, this might explain how
girls have caught up and even surpassed boys in education level.8 Latin American culture may
also work in favor of the girls’ education, since families are much more reluctant to send their
daughters out to work than their sons.
It is also possible that the female advantage is only in the length of education and not
in the quality of education. With the relatively low labor force participation of women in
Latin America, many parents expect a lower return to girls’ education than to boys’ education.
Consequently, cash-constrained families may send their male offspring to better and more
expensive schools, while letting the girls attend cheaper public schools. If such behavior is
8 This idea was suggested by Suzanne Duryea and Mary Arends-Kuenning of the IADB Research Department.
27
widespread, then girls’ quantitative advantage may not be big enough to compensate for their
qualitative disadvantage.
We do not have the information necessary to test this hypothesis, but can only hope it
is not true. If there really is a reverse gender gap then it will have positive long run
consequences for the general education level in Latin America, since mothers’ education is
much more important in determining children’s education than fathers’ education.9
In addition, several studies have shown that women’s education is important in
reducing fertility (Robbins, 1999), improving health (Ranis and Stewart, 2000), promoting
economic growth (Klasen, 2000), reducing poverty (Dollar and Gatti, 2000), and even
reducing corruption (Dollar, Fisman and Gatti, 2000), so there appear to be many benefits
deriving from this reverse gap.
9 In an earlier version of this paper we used both father’s education and mother’s education as family backgroundvariables rather than the maximum of the two. The results showed that mother’s education was at least twice asimportant in determining variations in schooling gaps as father’s education. Behrman, Birdsall and Székely(1998) found the same result.

28
Table 3. Schooling Gaps for Teenagers, by Gender and Zone
CountryAverage
education gapMale
Education gapFemale
education gapGender
gapArgentina, urban ‘96 0.71 0.88 0.52 ReversedBolivia ‘97 2.36 2.24 2.49 Normal Rural 3.73 3.33 4.17 Normal Urban 1.69 1.66 1.73 NormalBrazil ‘97 4.37 4.74 4.01 Reversed Rural 5.91 6.34 5.43 Reversed Urban 3.96 4.27 3.65 ReversedChile ‘98 1.55 1.66 1.43 Reversed Rural 2.24 2.41 2.06 Reversed Urban 1.42 1.52 1.32 ReversedColombia ‘97 3.04 3.27 2.81 Reversed Rural 4.23 4.56 3.87 Reversed Urban 2.25 2.33 2.18 ReversedCosta Rica ‘98 2.97 3.15 2.77 Reversed Rural 3.40 3.54 3.23 Reversed Urban 2.37 2.57 2.17 ReversedDom. Rep. ‘96 2.56 2.98 2.16 Reversed Rural 3.14 3.53 2.65 Reversed Urban 2.12 2.45 1.86 ReversedEcuador ‘98 2.28 2.48 2.08 Reversed Rural 3.12 3.29 2.94 Reversed Urban 1.62 1.80 1.43 ReversedEl Salvador ‘98 3.72 3.90 3.54 Reversed Rural 4.96 5.10 4.81 Reversed Urban 2.71 2.88 2.55 ReversedGuatemala ‘98 5.25 5.09 5.40 Normal Rural 6.34 6.03 6.66 Normal Urban 3.56 3.62 3.50 ReversedHonduras ‘98 4.17 4.44 3.89 Reversed Rural 4.92 5.24 4.57 Reversed Urban 3.20 3.35 3.06 ReversedMexico ‘96 2.32 2.28 2.36 Normal Rural 3.16 3.08 3.24 Normal Urban 1.70 1.68 1.72 NormalNicaragua ‘98 4.48 4.84 4.12 Reversed Rural 5.91 6.23 5.57 Reversed Urban 3.30 3.60 3.03 ReversedPanama ‘97 1.96 2.23 1.69 Reversed Rural 2.67 2.92 2.37 Reversed Urban 1.49 1.71 1.28 ReversedParaguay ‘95 2.90 3.09 2.71 Reversed Rural 3.53 3.69 3.34 Reversed Urban 2.37 2.53 2.23 ReversedPeru ‘97 1.90 1.94 1.87 Reversed Rural 2.81 2.71 2.92 Normal Urban 1.41 1.51 1.31 ReversedUruguay, urban ‘97 1.43 1.64 1.24 ReversedVenezuela ‘97 2.33 2.74 1.91 ReversedUn-weighted average 3.01 3.19 2.83 Reversed Rural 4.00 4.13 3.83 Reversed Urban 2.19 2.35 2.05 Reversed
Source: Authors’ calculations using teenagers (13-19 year old).

29
Given that female teenagers have more education than male teenagers, we would also
expect them to be more socially mobile. To test that hypothesis, we have split our samples by
gender and calculated Social Mobility Indices for both males and females. Table 4 shows the
results.
On average female teenagers are slightly more mobile than male teenagers, but only in
a few countries are they significantly more mobile (Brazil and Venezuela). Bolivia is the only
country where boys are significantly more socially mobile than girls, but Bolivia is also one
of the few countries where boys are better educated than girls.
Table 4. Social Mobility by Gender SMI for teenagers
Country Male Female Most mobile**
Argentina* 0.8923 0.9035 EqualBolivia 0.8282 0.7696 MaleBrazil 0.7727 0.7987 FemaleChile 0.9000 0.9237 EqualColombia 0.8245 0.8349 EqualCosta Rica 0.8195 0.8270 EqualDominican Republic 0.8191 0.8623 EqualEcuador 0.7817 0.8273 EqualEl Salvador 0.8318 0.8525 EqualGuatemala 0.7342 0.7160 EqualHonduras 0.8405 0.8380 EqualMexico 0.8654 0.8558 EqualNicaragua 0.8122 0.8083 EqualPanama 0.8416 0.8642 EqualParaguay 0.8504 0.8644 EqualPeru 0.9088 0.8574 EqualUruguay* 0.9017 0.8696 EqualVenezuela 0.8210 0.8706 FemaleAverage 0.8359 0.8413 Equal*Argentina and Uruguay include only urban citizens.** Using a 5% significance level.
Life-Cycle Effects
If a child is born early in the life cycle of the parents there will usually be fewer resources
available for the education of the child. We have attempted to capture this effect by including
in our schooling gap regressions a variable measuring the age of the household head at the
time of the birth of the teenager. The estimated coefficients came out negative for all

30
countries and usually highly significant (average t-statistic of -8.0). The average coefficient
estimate across countries was –0.018, which implies that a child born to a 30-year-old
household head is likely to have a schooling gap that is 0.18 year (or approximately 7%)
smaller than a child born to a 20-year-old household head.
The life cycle effect is larger in urban areas than rural areas. Here a teenager born to a
head of household ten years later in life would have a 13% smaller gap.
Birth Order Effects
The number and order of siblings were also found to be important. Generally, a higher
number of siblings increases a teenager’s schooling gap, but the kind of siblings he/she has is
not unimportant. The presence of a younger sister, a younger brother, or an older brother
would on average increase the gap by 0.26 years. The presence of an older sister, on the other
hand, would not on average have any effect on the schooling gap.
Thus, in a hypothetical family who raised first a girl, then a boy, and then a girl, the
oldest sister would have a 0.52 year (or 24%) greater schooling gap than the younger sister.
And this is not counting the life-cycle effect, which would further tend to increase the older
sister’s schooling gap compared to the younger sister’s gap.
The effects of siblings are larger in urban areas than rural areas. The estimated
coefficients are slightly higher and because the gaps are generally smaller the relative effect is
substantially larger. In urban Argentina, for example, an average family who raised first a girl,
then a boy, and then a girl, would see that the oldest sister would have a 0.70 year (or 92%)
higher schooling gap than the younger sister (again not counting the life-cycle effect).
The conclusion is that it is best for educational attainment to be an only child, or only
to have older sisters. Younger siblings or older brothers will tend to divert resources away
from any child’s education. In urban areas, having many siblings is more of a disadvantage
than are in rural areas.
Extended Families
Many parents in Latin America raise children other than their own. Only a minority of these
non-biological children are formally adopted, in which case they would be counted the same
way as the biological children. Most of these children are just accepted as part of the family as
a favor to relatives or friends who are unable to take care of their own children. As “adopted”

31
we count all the teenagers living in the household who are not spouses, sons or daughters of
the household head, who are not maids or relatives to maids, and who are not tenants or
guests.10 By this definition, “adopted” teenagers account for about 15.7% of all teenagers, so
they are not an insignificant group.
Adopted children, by this very broad definition, have significantly larger schooling
gaps than the household heads’ own children. On average the schooling gap is 0.36 years (or
14%) larger than the gap for own children, other things being equal.
This should not be taken as a sign that adopting parents are unfair in their treatment of
adopted children relative to their treatment of their own children. Serious disruptive events
may have taken place in the child’s life prior to adoption, and these events may easily have
caused the child to miss several months of school. Indeed, the child is likely to benefit from
being taken in to a friend or relative’s home, and it may even be his only chance of continuing
his education.
5.3 Teenagers versus Young Adults
In this paper we have chosen to focus exclusively on teenagers (aged 13-19) in our analysis of
social mobility. This choice reflects a trade-off between the desire to analyze young people’s
education decisions late enough that they have passed the compulsory part of their education
but still early enough that remain at home.
Our method is limited to the share of adolescents who live at home with at least one
parent figure, and this share is substantially higher and more stable across countries for
teenagers than it is for young adults. The adolescents that our method ignores are those who
have formed their own households (i.e., are heads or spouses), and those who work as live-in
household help.11 These two groups comprise only about five percent of teenagers, but about
46% of all adolescents. Since the young people who leave home relatively early may be
substantially different from those who live with their parents until far into their twenties, we
suspect that using the later age-group would lead to serious biases due to exclusion.
However, it is possible to argue that the high level of social mobility found in Chile,
Argentina, and Uruguay is mainly due to the high level of education in these countries. If
10 For technical reasons, the group of adopted teenagers includes grandchildren of heads of household, even ifthe parents of the children live in the house also.11 Homeless adolescents are of course also left out, as they are by definition not included in household surveys.

school is basically compulsory until the age of 18 (12 years of schooling), then family
background will not have much effect. There is some truth to this argument, as indicated by
the strong correlation between teenage schooling gaps and teenage social mobility (ρ = -0.60).
In order to see how much of a difference it would make if we chose a later age group,
we calculated our social mobility estimate based on young adults (aged 20-25). The
correlation between social mobility estimates based on teenagers and social mobility estimates
based on young adults is 0.75 across the 18 countries. Figure 8 shows the relationship.
N
co
tw
Figure 8. Comparison of Social Mobility Indices Based on Teenagers and on YoungAdults
32
ote: * Argentina and Uruguay estimates are based on urban populations only.
Note that Chile, Peru, and Argentina are among the four most socially mobile
untries, when measured both for teenagers and young adults. Guatemala and Brazil are the
o least socially mobile countries by both measures.
El Salvador
Honduras
Dom.R.
Paraguay
Peru
Uruguay*Venezuela
PanamaMexico
Argentina*
Guatemala
Brazil
Bolivial
Ecuador
Costa Rica
Nicaragua
Colombia
Chile
0.6000
0.6500
0.7000
0.7500
0.8000
0.8500
0.9000
0.9500
1.0000
0.6000 0.7000 0.8000 0.9000 1.0000
SMI based on teenagers (13-19 years)
SMI b
ased
on
youn
g ad
ults
(20-
25 y
ears
)

33
6 Conclusions and Policy Implications
This paper has proposed a new measure of social mobility, which can be calculated from
ordinary household surveys rather than the more rare longitudinal surveys typically used to
measure intergenerational mobility.
Our Social Mobility Index is based on schooling gap regressions for teenagers (13-19
year-olds) and uses the Fields decomposition to determine the importance of family
background in explaining schooling gaps. When family background is important in
determining schooling outcomes, we say that social mobility is low. Conversely, if family
background is unimportant, we say that social mobility is high.
The method was applied to household surveys from 18 different Latin American
countries conducted in the late 1990s. The process yielded results at two levels. First, the
schooling gap regressions provided us with a considerable information on differences in
opportunities between individuals within any given country and even within any given
household. Second, our cross-country analysis of social mobility provided some indication on
the factors associated with social mobility. In the remainder of this section we will try to
extract the policy implications that arise from this research.
At the micro-level we found that the age of the household head at the birth of the
teenager was highly significant and negative in all countries, implying that children who are
born early in the life-cycle of the parents have higher schooling gaps than children who are
born later. The reason for this relationship is that young parents have not had time to become
firmly rooted in the labor market, so their income is lower and more erratic at the time when
they have to make schooling decisions for their child.
Low and erratic income may affect the education decision in several different ways.
First, poor parents may decide to postpone school start in order to postpone the costs of
schooling. Even if school is free, there are costs in terms of school uniforms and other
supplies, transportation costs, loss of work from the child, and loss of work from the parent
who has to enroll the child, walk the child to school, help with homework, and perform other
other school-related tasks. Second, the parents may choose the cheapest school rather than the
best school. This will not immediately appear in our schooling gap measure, but being in a
poor school seriously reduces the possibilities for continued study at secondary and tertiary
levels. Third, poor parents may let their children drop out of school early because they need

34
the income they can generate in the labor market. Fourth, young parents who are not yet
established in the labor market may move repeatedly to search for opportunities, and such
moving may be highly disruptive for a child’s schooling. Fifth, young parents have probably
had to terminate their own education early in order to take care of their own children, and
such behavior has a tendency to be transmitted to the next generation.
The strong evidence of the life-cycle effect suggests that policies designed to prevent
early child-bearing would be beneficial for both parents and children. If young people can
postpone the arrival of their first child until they have finished their desired level of education
and have gotten a foothold in the labor market, then they have much more freedom to choose
how they want to live their life and how they want to educate their children. If they have their
first child before they have finished their education, they are likely to drop out of school, be
unable to find a decent job, and be unable to give everything they really wanted to their child.
Another very clear result from our regression is that each younger sibling that arrives
in the family will divert resources away from the older siblings. So a girl born to very young
parents, who keep having more children, is unlikely to get much schooling at all.
The clear evidence that the oldest siblings are disadvantaged with respect to schooling
suggests that it would be better to subsidize the first children’s education rather than the
education of younger siblings. Currently most schools charge full fees for the first child and
then reduced fees for additional siblings. It would make more sense if the first children were
subsidized, while number three or higher should pay full price. The latter would provide an
incentive to reduce the number of children to the benefit of the children already born. In
practice such an incentive system would be more difficult to administer, though, since it
cannot be left to the schools but must be administered by a government agency.
Our micro results also show that girls in most Latin American countries receive more
education than boys. This is very good news, since mothers’ education is the single most
important determinant of children’s education. In addition, other studies have shown that
women’s education is important in reducing fertility, improving health, reducing poverty,
reducing inequality, and reducing corruption, so there appear to be many benefits deriving
from this reverse gender gap.
However, with the current data we cannot rule out that the female advantage may just
be in the quantity of education and not in the quality of education. Some parents, expecting

35
their girls’ future to be determined by marriage rather than education, may choose to send
their boys to expensive private schools, while letting their girls attend cheap public schools.
In any case, it would be interesting to investigate the unusual reverse gender gap in
Latin America further. Are girls really better educated, and, if so, why? Given the key role
mothers’ education plays in the future of children, this topic is well worth further attention.
At the macro level, we first showed that there is no apparent relationship between
social mobility and income inequality. They are really two complementary measures. High
income inequality can be good if it is accompanied by high social mobility (as in the case of
Chile), or it can be bad if it is accompanied by low social mobility (as in the case of
Guatemala). In the first case the prospects for long-run growth look good, because people
have strong incentives to study hard, work hard, take risks, and be innovative. In the second
case the prospects for growth look bleak, because people do not have good incentives. Rich
people do not have much incentive to work because they were born rich and they are going to
stay rich. Poor people do not have any incentive to work hard, either, because they are very
unlikely to move to a higher social strata no matter how hard they work or study.
Given that all Latin American countries have high income inequality, they should try
to encourage social mobility in order to take advantage of the incentives that high inequality
offer. Encouraging social mobility basically requires making high quality education available
for all, which means vastly improving the quality of public education systems.
We also showed that social mobility is strongly correlated with per capita GDP. High
social mobility and high growth seem to reinforce each other, because countries with high
social mobility can make better use of their human capital. Essentially, high mobility allows
people to apply their talents in the best way. Most Latin American countries, however, seem
to be stuck in a low growth-low social mobility equilibrium. The low mobility means that the
richest children, rather than the smartest children, get to study and occupy the most important
positions in the society, and there is thus a lot of wasted talent in the population. The strong
empirical correlation between per capita GDP and social mobility adds another incentive for
governments to try to improve social mobility.
A final point of policy interest is that countries that require the children to start school
at age seven rather than at age six, seem to perform worse both with respect to schooling gaps

36
and with respect to social mobility. It seems that sending children to school earlier reduces the
risk of drop-out, especially among the poor.
This paper has argued all the way through that it is a clear advantage to have high
social mobility in a country. Not only is high social mobility related to high growth rates, both
theoretically and empirically, but it also seems more fair if the same families are not stuck at
the bottom of the income distribution period after period and generation after generation.
High social mobility allows children of poor and uneducated families to escape poverty and
illiteracy, since they have essentially the same opportunities for education as richer children.
But of course there is a flip side to that argument. If family background is unimportant, then
the rich and well-educated do not have much influence on their kids’ education outcomes,
either. However, the frustration that some rich families may feel if their kids drop out of high
school does ring a little hollow compared to the pride and relief poor families must experience
when their kids graduate and become able to sustain themselves and their extended families.

37
7 References
Altonji, J.G., and T.A. Dunn. 1995. “The Effect of School and Family Characteristics on the
Returns to Education.” NBER Working Paper 5072. Cambridge, United States:
National Bureau of Economic Research.
Behrman, J.R., N. Birdsall and M. Székely. 1998. “Intergenerational Schooling Mobility and
Macro Conditions and Schooling Policies in Latin America.” Research Department
Working Paper 386. Washington, DC, United States: Inter-American Development
Bank, Research Department.
Behrman, J.R., and P. Taubman. 1986. “Birth Order, Schooling, and Earnings.” Journal of
Labour Economics 4: 127-131.
Binder, M., and C. Woodruff. 1999. “Intergenerational Mobility in Educational Attainment in
Mexico.” Department of Economics, University of New Mexico and Graduate School
of International Relations and Pacific Studies, University of California-San Diego.
http://papers.ssrn.com/paper.taf?ABSTRACT_ID=166388
Dahan, M., and A. Gaviria. 2000. “Sibling Correlations and Social Mobility in Latin
America.” Inter-American Development Bank, Office of the Chief Economist.
Mimeographed document.
Dollar, D., R. Fisman and R. Gatti. 2000. “Are Women Really the ‘Fairer’ Sex? Corruption
and Women in Government.” Paper prepared for the forthcoming World Bank Policy
Research Report on Gender and Development. Washington, DC, United States: World
Bank.
Dollar, D., and R. Gatti, 2000. “Gender Inequality, Income, and Growth: Are Good Times
Good for Women?” Paper prepared for the forthcoming World Bank Policy Research
report on Gender and Development. Washington, DC, United States: World Bank.
Fields, G.S. 1996. “Accounting for Differences in Income Inequality.” Ithaca, United States:
Cornell University, School of Industrial and Labor Relations, Cornell University.
Mimeographed document.
----. 1997. “Accounting for Income Inequality and Its Change.” Paper presented at the annual
meetings of the American Economic Association, New Orleans, United States.

38
Gaviria, A. 1998. “Intergenerational Mobility, Siblings’ Inequality and Borrowing
Constraints.” Discussion Paper 98-13. San Diego, United States: University of
California, San Diego, Department of Economics.
Hassler, J., and J.V. Rodríguez Mora. 1998. “IQ, Social Mobility and Growth.” Seminar
Papers No. 635. Stockholm, Sweden: Stockholm University, Institute for International
Economic Studies.
Jensen, R.T. 1999. “Patterns, Causes and Consequences of Child Labor in Pakistan.”
Cambridge, United States: Harvard University, John F. Kennedy School of
Government and Center for International Development. Mimeographed document.
Klasen, S. 2000. “Does Gender Inequality reduce Growtht and Development? Evidence from
Cross-country Regressions” Paper prepared for the forthcoming World Bank. Policy
Research Report on Gender and Development. Washington, DC, United States: World
Bank.
Kremer, M. 1996. “How Much Does Sorting Increase Inequality?” NBER Working Paper
5566. Cambridge, United States: National Bureau of Economic Research.
Lam, D. 1999. “Generating Extreme Inequality: Schooling, Earnings, and Intergenerational
Transmission of Human Capital in South Africa and Brazil.” Research Report No. 99-
439. Ann Arbor, United States: University of Michigan, Population Studies Center.
Moulton, B.R. 1986. “Random Group Effects and the Precision of Regression Estimates.”
Journal of Econometrics 32: 385-397.
Murphy, K.M., A. Shleifer and R.W. Vishny, 1991. “The Allocation of Talent: Implications
for Growth.” Quarterly Journal of Economics 106(2): 503-530.
Ranis, G., and F. Stewart. 2000. “Strategies for Success in Human Development.” Working
Paper 32. Oxford, United Kingdom: Oxford University, Queen Elizabeth House.
Raut, L.K. 1996. “Signaling Equilibrium, Intergenerational Mobility and Long-Run Growth.”
Manoa, United States: University of Hawaii-Manoa.
Robbins, D. J. 1999. “Gender, Human Capital and Growth: Evidence from Six Latin
American Countries.” Technical Papers No 151. Paris, France: OECD Development
Centre.

39
Székely, M., and M. Hilgert. 1999. “What’s Behind the Inequality We Measure: An
Investigation Using Latin American Data for the 1990s.” Washington, DC, United
States: Inter-American Development Bank, Research Department.
40
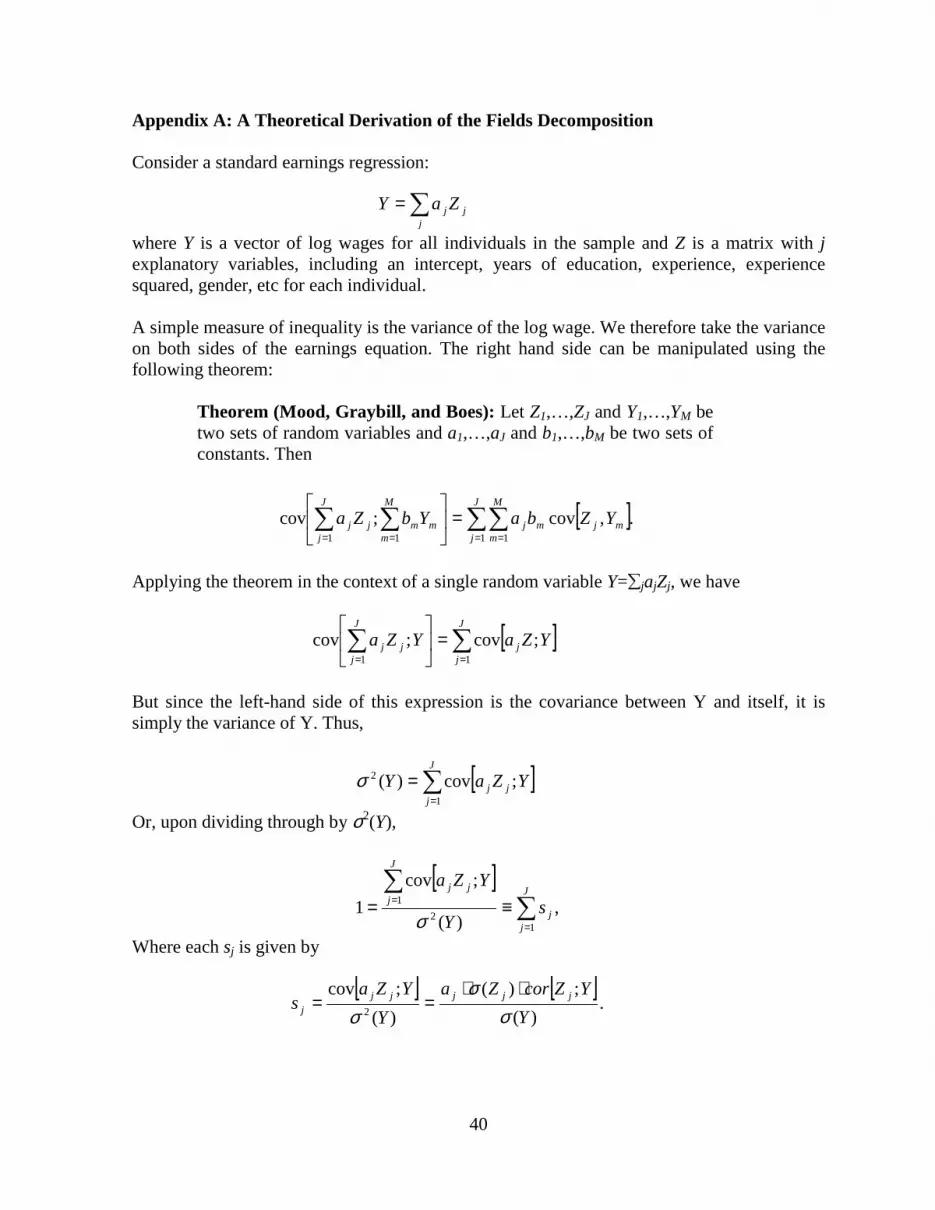
Appendix A: A Theoretical Derivation of the Fields Decomposition
Consider a standard earnings regression:
where Y is a vector of log wages for all individuals in the sample and Z is a matrix with jexplanatory variables, including an intercept, years of education, experience, experiencesquared, gender, etc for each individual.
A simple measure of inequality is the variance of the log wage. We therefore take the varianceon both sides of the earnings equation. The right hand side can be manipulated using thefollowing theorem:
Theorem (Mood, Graybill, and Boes): Let Z1,…,ZJ and Y1,…,YM betwo sets of random variables and a1,…,aJ and b1,…,bM be two sets ofconstants. Then
Applying the theorem in the context of a single random variable Y=�jajZj, we have
But since the left-hand side of this expression is the covariance between Y and itself, it issimply the variance of Y. Thus,
Or, upon dividing through by σ2(Y),
Where each sj is given by
�=j
jj ZaY
[ ].,cov;cov1 111����
= ===
=��
���
� J
j
M
mmjmj
M
mmm
J
jjj YZbaYbZa
[ ]��==
=��
���
� J
jj
J
jjj YZaYZa
11;cov;cov
[ ]�=
=J
jjj YZaY
1
2 ;cov)(σ
[ ],
)(
;cov1
12
1�
�
=
= ≡=J
jj
J
jjj
sY
YZa
σ
[ ] [ ].
)(;)(
)(;cov
2 YYZcorZa
YYZa
s jjjjjj σ
σσ
⋅⋅==

41
The sj’s are the factor inequality weights and they add to 1 over all explanatory factors. Eachsj is decomposable in an intuitively appealing manner. For example, years of education (edu)explains a larger share of income inequality:
• The higher the regression coefficient on education (aedu) in the earnings regression.• The higher the standard deviation of years of education (σedu).• And the higher the correlation between education and earnings (cor(edu,Y)).
Fields (1996) also shows that this decomposition carries over to other commonly usedinequality measures, such as the Gini coefficient, the Atkinson index, the generalized entropyfamily, as well as the log variance.

42
Appendix B: Social Mobility Estimates
Table 5. SMI Estimates with 95% Confidence Intervals for Teenagers and YoungAdults
Country
SMIteenagers
(13-19)SMI teen
lowerbound
SMI teenupperbound
SMIyoungadults(20-25)
SMIyoungadultslowerbound
SMIyoungadultsupperbound
Argentina* 0.1017 0.0941 0.1093 0.1847 0.1687 0.2026Bolivia 0.1487 0.1343 0.1617 0.2076 0.1715 0.2489Brazil 0.1880 0.1836 0.1931 0.2455 0.2349 0.2553Chile 0.0880 0.0804 0.0969 0.1969 0.1814 0.2081Colombia 0.1570 0.1496 0.1648 0.2193 0.2066 0.2310Costa Rica 0.1534 0.1405 0.1650 0.2389 0.2119 0.2776Dominican Republic 0.1401 0.1219 0.1626 0.1786 0.1444 0.2193Ecuador 0.1867 0.1711 0.2051 0.2343 0.2009 0.2744El Salvador 0.1529 0.1429 0.1666 0.1788 0.1637 0.2118Guatemala 0.1581 0.1407 0.1750 0.1590 0.1304 0.1913Honduras 0.1570 0.1406 0.1688 0.2613 0.2252 0.2912Mexico 0.1391 0.1288 0.1489 0.2287 0.2106 0.2513Nicaragua 0.1589 0.1431 0.1755 0.1649 0.1365 0.1970Panama 0.1297 0.1134 0.1445 0.2144 0.1849 0.2464Paraguay 0.1212 0.1043 0.1410 0.2334 0.1863 0.2946Peru 0.1309 0.1133 0.1517 0.1574 0.1356 0.1916Uruguay* 0.1147 0.1033 0.1261 0.2080 0.1864 0.2296Venezuela 0.1631 0.1497 0.1739 0.2446 0.2182 0.2698Average 0.1448 0.2042
Source: Authors’ calculations based on household surveys.Note: Argentina and Uruguay estimates are based on urban populations only, but have been adjusted to fit their actual urbanization rates
(87.1% and 85.6%). They should therefore be directly comparable to the other estimates.

43
Appendix C: Macro Data
Table 6. Macro Economic Variables Used for Correlation Analysis in Section 5
Country
AdjustedGINI
(a)
GDPper
capita
(b)
% ofpop.
living inurbanareas
(c)
Pupil-teacherratio in
secondaryeducation
(d)
Correlationbetweenspouses
educationlevels
(e)
Landarea(1000km2)
(f)
Ruralpop.
density
(g)Argentina 53.95 6068.7 87.1 10 0.68 2767 1.7Bolivia 52.17 946.7 60.8 17 0.79 1099 2.8Brazil 55.07 3194.1 82.6 15 0.72 8512 3.4Chile 58.33 3739.6 88.1 13 0.76 757 2.3Colombia 55.24 1616.9 69.3 20 0.77 1139 11.0Costa Rica 49.86 1994.6 47.8 18 0.67 51 39.4Dominican Rep. 51.95 992.5 67.4 22 0.69 49 54.8Ecuador 60.99 1368.7 62.8 20 0.75 284 15.9El Salvador 51.30 1308.8 49.9 19.8 0.74 21 143.8Guatemala 56.49 1016.6 45.3 17 0.75 108 54.8Honduras 46.02 671.5 49.8 20 0.67 112 27.6Mexico 54.20 3263.9 74.9 16 0.72 1973 12.2Nicaragua 51.96 464.5 69.3 34 0.71 130 11.4Panama 54.07 2696.9 56.4 18 0.73 77 15.7Paraguay 58.53 1445.1 53.5 12 0.74 407 6.0Peru 51.56 2083.1 72.3 18.5 0.73 1285 5.4Uruguay 51.00 3390.7 85.6 17 0.63 176 2.7Venezuela 49.32 3315.3 94.8 10 0.71 912 1.3Average 53.45 2014.6 62.4 18 0.72 1159 22.9
Sources: (a) Székely and Hilgert (1999, Table 5, Column 8). (b,c,d,g) The Statistics section of the Inter-American Development Bank’s homepage. (e) Authors’ calculations based on household surveys. (f)World Development Report (1994).
Notes: (a) The adjusted GINI should be reasonably comparable across countries, since it is based on the largestcomparable income measure (labor income in urban areas) and adjusted for seasonal differences. Yearsvary, but coincide with the year of the survey in most cases.(b) Refers to the year of the survey but is measured in fixed 1990-USD.(c) 1998.(d) Refers to the year of the survey (or the closest available).(e) Refers to the year of the survey.(g) 1998.

44
Appendix D: Regression Results and Fields Decomposition for Colombia 1997
. * Fields decomposition for teenagers
. fields edugap hhypc maxedu hhhage femhhh single kidsis kidbro oldsis oldbrowoman edad adopt rurselfh urbselfh avreginc avregedu urban impyA_h if teen==1
Regression with robust standard errors Number of obs = 20279 F( 18, 23) = 1270.66 Prob > F = 0.0000 R-squared = 0.3942Number of clusters (region) = 24 Root MSE = 2.1063
------------------------------------------------------------------------------ | Robust edugap | Coef. Std. Err. t P>|t| [95% Conf. Interval]---------+-------------------------------------------------------------------- hhypc | -.1311743 .0202104 -6.490 0.000 -.1729828 -.0893658 maxedu | -.2063958 .0099163 -20.814 0.000 -.2269093 -.1858823 hhhage | -.021367 .0023355 -9.149 0.000 -.0261983 -.0165357 femhhh | -.1384118 .0824865 -1.678 0.107 -.3090481 .0322245 single | -.0923255 .0858135 -1.076 0.293 -.2698443 .0851933 kidsis | .300141 .0279096 10.754 0.000 .2424055 .3578765 kidbro | .3179825 .0366565 8.675 0.000 .2421528 .3938122 oldsis | .0312519 .038279 0.816 0.423 -.0479343 .1104381 oldbro | .3244019 .0337838 9.602 0.000 .2545148 .3942889 woman | -.5719596 .0431029 -13.270 0.000 -.6611247 -.4827944 edad | .4797143 .0234412 20.465 0.000 .4312226 .528206 adopt | .4390392 .0588618 7.459 0.000 .3172743 .5608041rurselfh | .1733438 .1045916 1.657 0.111 -.0430203 .3897079urbselfh | .0269456 .0747493 0.360 0.722 -.1276851 .1815762avreginc | -.131681 .2257881 -0.583 0.565 -.5987593 .3353974avregedu | .0196536 .0762135 0.258 0.799 -.1380059 .1773131 urban | -1.125841 .1033273 -10.896 0.000 -1.33959 -.9120925 impyA_h | .0674244 .276355 0.244 0.809 -.5042594 .6391083 _cons | .8671943 2.157552 0.402 0.691 -3.596042 5.33043------------------------------------------------------------------------------
hhypc = adult household income per capitamaxedu = maximum of father’s and mother’s years of educationhhhage = age of the head of household at birth of teenagerfemhhh = dummy for female headed householdssingle = dummy for single parent householdskidsis = dummy for the presence of younger sisterkidbro = dummy for the presence of younger brotheroldsis = dummy for the presence of older sisteroldbro = dummy for the presence of older brotherwoman = dummy if the teenager is femaleedad = age of teenageradopt = dummy if the teenager is not the son or daughter of the head of householdrurselfh= dummy if the head of household is self employed and ruralurbselfh= dummy if the head of household is self employed and urbanavreginc= average regional incomeavregedu= average regional education levelurban = dummy if teenager lives in urban areaimpyA_h = dummy if household income is imputed by the IDB_cons = constant.

45
Fields decomposition and Social Mobility Index-----------------------------------------------------------------
X Coeff. Sd(X) Corr(X,Y) F.I.W.
hhypc -0.1312 1.5331 -0.2883 0.0214maxedu -0.2064 4.3261 -0.4470 0.1476hhhage -0.0214 11.6194 0.0565 -0.0052femhhh -0.1384 0.4286 -0.0120 0.0003single -0.0923 0.4407 0.0041 -0.0001kidsis 0.3001 0.4986 0.1581 0.0087kidbro 0.3180 0.4967 0.1736 0.0101oldsis 0.0313 0.4706 -0.0237 -0.0001oldbro 0.3244 0.4865 0.0699 0.0041woman -0.5720 0.4997 -0.1202 0.0127edad 0.4797 1.9337 0.3213 0.1102adopt 0.4390 0.3969 0.0667 0.0043rurselfh 0.1733 0.3494 0.2495 0.0056urbselfh 0.0269 0.4172 -0.1046 -0.0004avreginc -0.1317 0.4065 -0.1945 0.0038avregedu 0.0197 1.0781 -0.2059 -0.0016urban -1.1258 0.4691 -0.3726 0.0728impyA_h 0.0674 0.0876 0.0180 0.0000
Sum of Factor Inequality Weights = 0.3942
Social Mobility Index = 0.8310 (= 1 – 0.0214 – 0.1476)