Embed Size (px)
Citation preview

Energies 2015, 8, 4513-4528; doi:10.3390/en8054513
energies ISSN 1996-1073
www.mdpi.com/journal/energies
Article
Lithium-Ion Battery Cell Cycling and Usage Analysis in a Heavy-Duty Truck Field Study
Pontus Svens 1,*, Mårten Behm 2 and Göran Lindbergh 2
1 Scania CV AB, SE-151 87 Södertälje, Sweden 2 Department of Chemical Engineering and Technology, Applied Electrochemistry,
School of Chemical Science and Engineering, KTH Royal Institute of Technology,
SE-100 44 Stockholm, Sweden; E-Mails: [email protected] (M.B.); [email protected] (G.L.)
* Author to whom correspondence should be addressed; E-Mail: [email protected];
Tel.: +46-8-553-51661; Fax: +46-8-553-82841.
Academic Editor: Joeri Van Mierlo
Received: 18 March 2015 / Accepted: 12 May 2015 / Published: 20 May 2015
Abstract: This paper presents results from a field test performed on commercial
power-optimized lithium-ion battery cells cycled on three heavy-duty trucks. The goal with
this study was to age battery cells in a hybrid electric vehicle (HEV) environment and find
suitable methods for identifying cell ageing. The battery cells were cycled on in-house
developed equipment intended for testing on conventional vehicles by emulating an HEV
environment. A hybrid strategy that allows battery usage to vary within certain limits
depending on driving patterns was used. This concept allows unobtrusive and low-cost
testing of battery cells under realistic conditions. Each truck was equipped with one cell
cycling equipment and two battery cells. One cell per vehicle was cycled during the test
period while a reference cell on each vehicle experienced the same environmental
conditions without being cycled. Differential voltage analysis and electrochemical
impedance spectroscopy were used to identify ageing of the tested battery cells. Analysis
of driving patterns and battery usage was performed from collected vehicle data and
battery cell data.
Keywords: hybrid electric vehicle; HEV; lithium-ion battery; dV/dQ; Electrochemical
Impedance Spectroscopy (EIS)
OPEN ACCESS
Energies 2015, 8 4514
1. Introduction
The main reason for hybridization of vehicles is to reduce tail pipe emissions by saving fuel.
Passenger cars have previously been the main contributor of tailpipe emissions amongst the transport
sector in Europe, but during recent years, trucks have instead become the main contributor. The
transport sector is responsible for 28% of the CO2 emissions in Europe and almost half of those
emissions are related to heavy-duty trucks [1,2]. Globally, the transport sector contributes to about
18% of the total greenhouse gas emissions [3]. In 2007, the European Union agreed on a greenhouse
gas emission reduction target, aiming at reaching a 20% reduction of greenhouse gas emissions from
1990 levels in 2020 [4]. New emission targets have also contributed to more stringent legislation on
tail pipe emissions for heavy-duty trucks and buses. Harsher emission legislation and higher customer
demands on lower fuel consumption have driven heavy-duty truck and bus manufacturers to introduce
hybridized vehicles. However, the additional cost for a hybrid system needs to be low enough to
achieve a reasonable payback time for the customer. The high cost of batteries intended for hybrid
electric vehicles (HEVs) is a factor that greatly affects the total cost of a hybrid system. The main type
of hybrid systems used by vehicle manufacturers today are the parallel hybrid, the serial hybrid, and
the power split hybrid systems [5], where the latter one in a simplified way can be regarded as a
combination of the first two. The main difference between the parallel hybrid system and the serial
hybrid one is that the former has a mechanical connection between the internal combustion engine and
the propelling wheels, while the latter has not. Hence, a serial hybrid vehicle needs two electrical
motors while the parallel one only needs one. If the battery system in a hybrid vehicle can be charged
externally, the vehicle is referred to as a plug-in hybrid [6]. The benefit with this configuration is the
possibility to drive on pure electric power and also have the possibility to travel longer distances using
the combustion engine when needed.
When designing a hybrid system, fuel consumption, battery cost, and battery lifetime need to be
optimized to find a reasonable cost level for both vehicle manufacturers and customers. For example,
the battery pack needs to be light enough and have a sufficiently low volume not to influence load
capacity of a HEV truck or limit passenger capacity of a HEV bus. In addition, the hybrid strategy
needs to provide high enough energy flow through the battery for a variety of driving patterns without
sacrificing battery lifetime. Furthermore, the charge and discharge energy efficiency should be as high
as possible to maximize the kinetic energy recuperation without sacrificing energy throughput.
It is obvious from the reasoning above that the relationship between several parameters needs to be
considered when designing an HEV battery system. One approach to try to fulfil the demands would
be to minimize the size of the battery, both regarding dimensions and capacity, and maximize the
usage, i.e., allowing large cycle depth and high power. This would reduce the dimensions and the cost
of the hybrid system while maximizing the energy throughput. However, this approach may jeopardize
long battery lifetime since deep cycling and high power can have a negative impact on battery life. It is
hence important to estimate the impact of battery usage on battery life when designing the battery
system. Estimating battery lifetime in a real application is a difficult task since the usage will have a
more or less large spread between vehicles depending on hybrid vehicle strategy. To handle this,
laboratory battery testing could be performed on an estimated worst case scenario to have a marginal
for this spread in usage. Estimating battery lifetime from too harsh testing could, however, lead to

Energies 2015, 8 4515
pessimistic battery life estimations, possibly resulting in an unnecessary high cost for the customer.
To prevent this, laboratory testing of batteries could be performed using a variety of synthetic driving
cycles to mimic real life usage. In addition, an assumption of variations of environmental parameters
such as temperature and resting times is also required. Hence, a more accurate way of acquiring battery
ageing information would be to collect data from a fleet of HEVs. The drawback of this could be
longer test time depending on the yearly covered mileage of the test fleet. However, acquiring battery
usage information and battery ageing results from a fleet of HEVs is most likely more time consuming
than laboratory testing and not even feasible in an early HEV development stage. With this understanding,
we will in this work demonstrate an alternative way of collecting battery usage data including the
possibility to monitor battery ageing during field tests on heavy-duty trucks using recently developed
test equipment [7]. This test equipment is intended for use on conventional heavy-duty trucks which
facilitate access of test vehicles in an early battery development phase. In addition, this test method
allows validation of computer modelled battery usage for various real life driving patterns in an HEV
environment. With this test method, a larger spread of battery usage should be possible to obtain
compared to laboratory testing. The main advantages compared to real heavy-duty HEV testing are
lower cost, shorter test time, and availability of test vehicles. In this study, driving patterns and battery
usage are analyzed as well as an early stage of battery cell ageing.
2. Experimental Section
This field study includes three heavy-duty trucks from the truck and bus manufacturer Scania CV AB
(Södertälje, Sweden), each equipped with recently developed test equipment intended for battery cell
cycling [7]. Each test set-up contains two battery cells, one that is continuously cycled during the test
and one reference cell that is calendar-aged under the same ambient conditions. Cell performance tests
can be performed periodically on the test equipment.
Commercially available composite LiMn2O4-LiCoO2/Li4Ti5O12 (LMO-LCO/LTO) cells with a rated
initial capacity of 3.1 Ah and nominal voltage of 2.4 V were acquired from a reputable supplier for this
study. The measured initial capacity for all cells in the study was 3.45 ± 0.05 Ah. All calendar aged
reference cells were charged to State of Charge (SOC) 50% before starting the test and were held at
open circuit. The reference cell on Truck 1 self-discharged to SOC 0% between the intermediate
laboratory measurement and the end of the test, while the reference cells on Trucks 2 and 3
self-discharged to around SOC 35% between the intermediate measurements and the end of the test.
The hybrid strategy implemented in the test equipment was developed to be used on hybrid vehicles
from Scania CV AB and allows high charge and discharge power and large depth of discharge (DOD)
in order to minimize fuel consumption even with a relatively small battery pack. One main characteristic
with this hybrid strategy is to allow higher charging than discharging power. Mild hybridization has
been found to be the most cost-effective approach for Scania heavy-duty vehicles, as well as
a relatively small battery pack. This means that an abundance of braking power is available and that
charging power is restricted to the size of the electrical motor or battery limitations.
Cell currents and voltages were measured during the field test as well as cell temperatures. The
vehicle speed was received from the vehicle internal communication network. The energy throughput
was calculated in real time and stored as a separate parameter. SOC was also calculated based on
Energies 2015, 8 4516
coulomb counting and open circuit voltage measurements. Actual battery capacity was continuously
updated from periodically performed capacity tests on-board the vehicles. A flowchart describing the
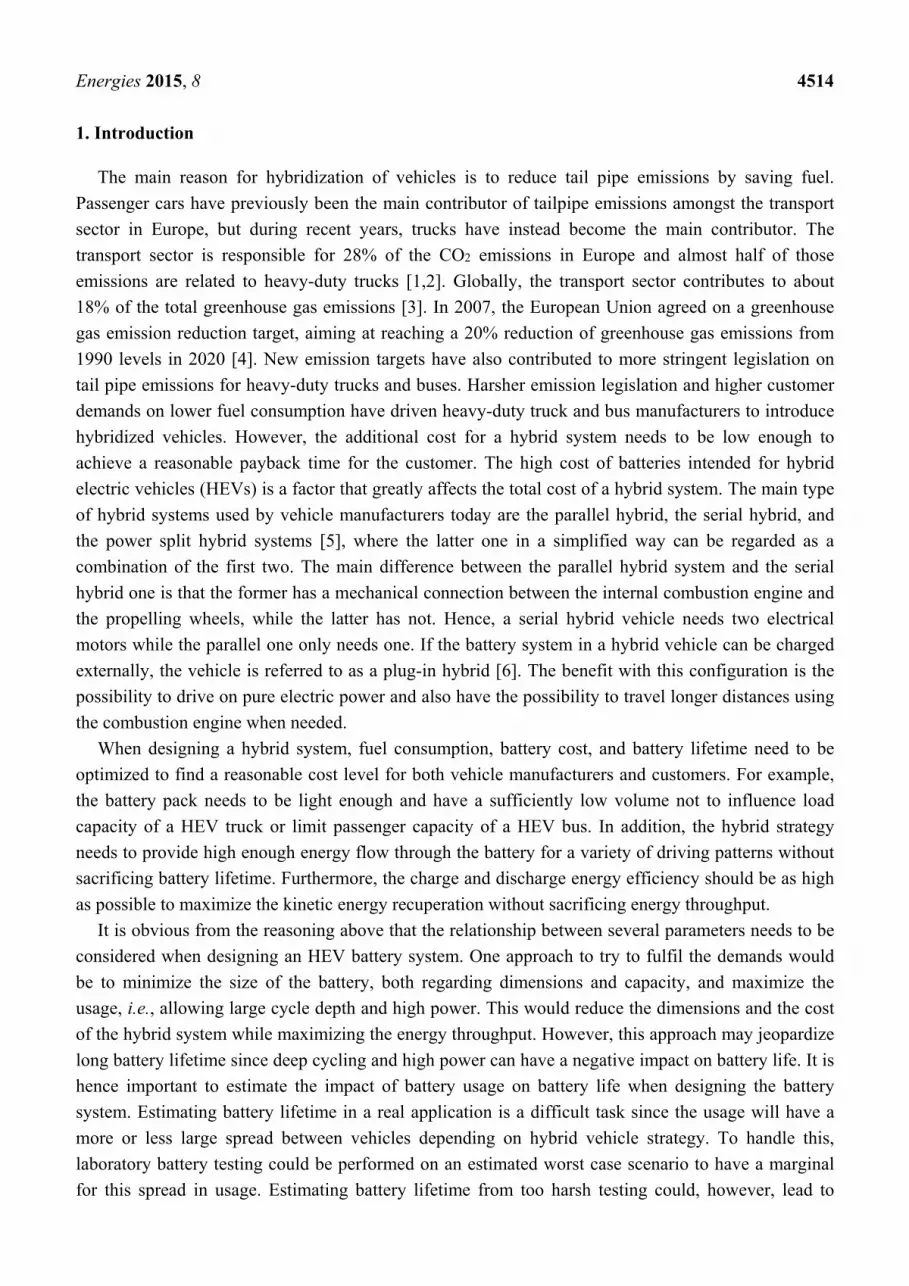
data collection process during the field test is presented in Figure 1.
Figure 1. Flowchart describing the field test data collection. The electronic control unit
(ECU) communicates with the vehicle and calculates and sends cell cycling data to the
battery management unit (BMU). The cycled cell and the reference cell are physically
placed in the vicinity of the BMU.
To obtain information about the internal electrode matching of this cell type, one completely
discharged fresh cell from a different batch but of the same generation as the tested cells was opened in
an argon-filled glove box (<1 ppm H2O). Samples from both electrodes were collected by cutting out
circular pieces of 9.6 cm2. One side of each electrode was cleaned from active material using
N-methyl-2-pyrrolidone (NMP) (Merck, Darmstadt, Germany). Care was taken to prevent any NMP
from reaching the other side of the electrode during the procedure. The samples were rinsed in
dimethyl carbonate (DMC) (SelectiLyte, Merck) and left to dry for thirty minutes before being
assembled into cells. Half-cells were made from the positive and negative electrodes, respectively,
using lithium foil as references and counter electrode (two electrode cell). Assembly was done together
with electrolyte-soaked separator (glass microfiber filter material, Whatman GF/A from Sigma-Aldrich,
St. Louis, MO, USA) and nickel and aluminium current collectors. The electrolyte used was 1 M LiPF6
in EC/DEC (1:1 by weight, Merck LP40). The half cells were encapsulated in pouch material
(polymer coated aluminium laminate) and vacuum sealed inside the glove box.
Discharge capacity measurements on cells and half cells were carried out using a Solartron SI 1287
electrochemical interface (AMETEK, Berwyn, PA, USA). Discharge capacity was measured at 0.17 A
(C/20) for the fresh cell prior to opening and at 0.335 mA (C/20) and at 0.27 mA (C/20) for the half
cells containing positive electrode samples and negative electrode samples, respectively. All measurements
were done at 23 °C. The use of very small currents assured negligible impact of polarization resistance
on the voltage profiles. All electrochemical impedance spectroscopy (EIS) measurements were
performed on a Solartron SI 1260 Impedance/Gain-phase analyzer (AMETEK, Berwyn, PA, USA).
Measurements were performed using a voltage amplitude of 10 mV and a frequency span between
1 kHz and 0.01 Hz.

Energies 2015, 8 4517
3. Results and Discussion
3.1. Driving Pattern and Battery Usage Analysis
Figure 2 shows distribution plots over vehicle speed, battery cell SOC and battery cell charge and
discharge power. Figure 2a shows the vehicle speed distribution for all trucks and it is clear that
Truck 1 mostly has been driving at low speeds, typically around 20 km/h and very seldomly above
60 km/h. Two broad peaks are seen around 20 km/h and 50 km/h and a very small peak around
89 km/h. This is a typical inner city transportation type of drive pattern. Truck 2 has a relatively even
speed distribution up to 60 km/h, and there are two distinctive peaks around 80 km/h and 89 km/h.
Truck 2 spends a large time driving at speeds higher than 60 km/h which is reflected in the highest
average speed of the three test vehicles. Truck 3 has a similar speed distribution as truck 2 but lacks a
peak at around 80 km/h and also spends a large part of the driving at speeds below 30 km/h. This type
of driving pattern is typical for intercity transportation where the vehicles are driving both within cities
and between cities. The driving pattern for Truck 1 is similar to the City Suburban Cycle (CSC)
presented in Figure 2b. The CSC is a chassis dynamometer test for heavy-duty vehicles developed
within the West Virginia University [8] and has an average speed of 22.8 km/h. Truck 2, and to some
extent also Truck 3, have a driving pattern similar to the Urban Dynamometer Driving Schedule (UDDS)
in Figure 2b. The UDDS was developed for chassis dynamometer testing of heavy-duty vehicles by the
US Environmental Protection Agency (EPA) [9]. The average speed for this driving schedule is
30.4 km/h. Figure 2c depicts SOC distributions for all three trucks. The cycled cell on Truck 1 shows a
Gaussian-like SOC distribution centered around 50% while the cells on Trucks 2 and 3 show
distributions with peaks at SOC levels lower than 50%. The probable cause for this is the driving at
higher speeds for Trucks 2 and 3 since the hybrid strategy tends to drive battery SOC towards the
lower limit during acceleration. The cycled cell on Truck 1 is seldom discharged to the lower SOC
limit at 20%, probably due to relatively short time between acceleration and braking in most cases. The
cycled cell on Truck 2 has a distinct high peak at 20% SOC and a wide peak around 40% SOC.
Frequent highway driving is the probable cause for this. The cycled cell on Truck 3 has a small peak
around 20% SOC but the main distribution is around 30% SOC. The difference between SOC
distributions for the cells on Trucks 2 and 3 can be explained by looking at the corresponding vehicle
speed distributions. Truck 2 appears to have been driving frequently on roads where the speed limit
changes between 80 km/h and 90 km/h. It is also seen that the peak around 80 km/h in the speed
distribution plot for Truck 2 actually consists of three peaks. This indicates extensive acceleration and
braking even at highway speeds that should have caused cycling of the battery cell to some extent.
This could explain the wide peak around 40% SOC, even though Truck 2 spends the least amount of
time driving at low speeds of the three trucks. The sole distinctive peak around 89 km/h in the speed
distribution plot for Truck 3 indicates that there is only minor acceleration and braking at highway
speeds with subsequent minor cell cycling, and this would correlate to the peak at 20% SOC.

Energies 2015, 8 4518
Figure 2. Distribution plots for the complete test period showing: (a) vehicle speed
(vehicle idling data excluded for better visibility, resolution 0.5 km/h); (b) vehicle speed
for two reference driving schedules; (c) battery cell SOC (resolution 0.5%) and (d) battery
cell power (resolution 0.1 W, charge power is positive).
Figure 2d shows cell power distributions for the trucks. Negative power values correspond to
discharging and positive power values to charging. The cell power reflects how the hybrid strategy is
controlling the battery cycling. The evaluated hybrid strategy was developed with the assumption that
there is an excess of available braking energy in most cases. Hence, the charging and discharging
strategies are not the same. The charging power is proportional to the driver-demanded power
according to Equation (1):
∝ (1)
Pch is the charge power and Pdd the driver-demanded power. Plim is the limiting hybrid system input
power that depends on both battery limitations and electric motor limitations. A comparison between
Pdd and Plim is done continuously, and the lowest value is chosen. A proportionality sign in Equation (1)
is used since other braking methods such as retarder braking and exhaust braking are also involved
when charging the battery. It is clearly seen that the cycled cell on Truck 1, which has a typical inner
city transportation driving pattern, has the largest charge power peak around 160 W. This is most
probably due to more frequent and harder braking connected to the inner city driving pattern. The
cycled cell on Truck 2 also has a distinctive peak at 160 W while the cycled cell on Truck 3 lacks
charge peaks above 35 W. The difference in charge power distribution for the cycled cell on Truck 3
compared to Truck 2 is most likely due to softer braking in the previous case. The weight of the

Energies 2015, 8 4519
vehicles would also affect the charge power since a heavier vehicle would have more kinetic energy
requiring harder braking during deceleration, which would generate higher positive power peaks for
the tested battery cell. Discharge power distributions for all cycled cells have a smooth appearance
connected to the discharge strategy, which is presented below.
∝ ∗/2
(2)
Pdisch is the battery discharge power and Pdd the driver demanded power. Plim is the limiting hybrid
system output power and depends on both battery limitations and electric motor limitations.
A comparison between Pdd/2 and Plim is done continuously, and the lowest value is chosen. SOCU is
the upper limit of the SOC window (80%) and SOCL is the lower limit (20%). v is the vehicle speed
and vmax is the maximum allowed vehicle speed (89 km/h). It is seen from Equation (2) that the
allowed discharge power in general is lower than the allowed charge power. In addition, the discharge
power is also scaled by vehicle speed and actual battery SOC. Hence, a high SOC and high vehicle
velocity will generate a high discharge power. The vehicle speed scaling factor explains the discharge
power peak close to zero that is seen for all cycled cells (truncated in Figure 2d for better visibility).
This concept results in smooth discharge curves as seen in Figure 2d. Since one main purpose of this
study was to evaluate a hybrid vehicle strategy, and since the evaluated hybrid vehicle strategy
calculates battery load as the power transferred between the battery system and the power electronics
part, we choose to use battery energy throughput (Wh) instead of capacity throughput (Ah) when
presenting the results.
Table 1 presents the most important driving pattern and battery usage results from the field test. It is
seen from the table that Truck 2 has the highest average speed due to more frequent highway driving
compared to Trucks 1 and 3. In spite of this, the cycled cell on Truck 2 was exposed to higher energy
throughput per driving distance compared to the cell on Truck 3. This is almost certainly connected to
the different type of highway driving Truck 2 has experienced in combination with an overall harder
braking pattern, possibly connected to heavier goods transportation. The highest energy throughput per
driving distance is found for the cycled cell on Truck 1. This is expected due to the typical inner city
transportation driving pattern this truck has experienced. It is also seen in Table 1 that the average cell
charge power for all trucks are higher than the average cell discharge power. This is also expected
since it is the main characteristic of the tested hybrid strategy. The total travelled distance for each
truck during the test period is low but representative for this type of transportation trucks that are only
operated during dayshifts and not on weekends. Hence, the equivalent number of full cycles for the
battery cells is low even for the cell on Truck 1 that has been cycled for almost two years, and the
cycling time is only about 6% of the total testing time. Thus, calendar ageing has a significant impact
on battery pack lifetime for this type of driving and should be addressed in an early phase of HEV
development. The average cell temperature is highest for Truck 2, and this is explained by the use of a
lower set point for the operating temperature of the battery cells in Trucks 1 and 3 during the early
stage of cycling. Since the cycle-aged and the calendar-aged cells on each truck were placed in the
same heat conducting holder, each pair of cycle-aged and calendar-aged cell experienced the same
temperature distribution during the test. The temperature distributions for each truck are shown in
Figure 3.

Energies 2015, 8 4520
Table 1. Key figures from the driving pattern and battery usage analysis.
Truck Test
Duration
Travelled
Distance/km
Average
Vehicle
Speed/km h−1
Charge
Energy/kWh
Discharge
Energy/kWh
Average
Energy
Efficiency/%
Total Cycled
Energy/kWh
Equivalent
Number of Full
Cycles, Neq
Cycled Energy per
Driving Distance/
Wh km−1
Average
Cell Charge
Power/W
Average Cell
Discharge
Power/W
Average Cell
Temperature
during Cycling/°C
1 23 months 25430 26 12.8 12.1 94.5 24.9 1496 0.98 83 26 32
2 12 months 19400 47 7.26 6.94 95.6 14.2 859 0.73 89 18 38
3 21 months 19000 30 3.49 3.44 98.6 6.9 419 0.36 27 9.5 31
Figure 3. Distribution plots for the complete test period showing cell temperatures (the reference cells have the same distributions at the
cycled cells, resolution 0.5 °C).

Energies 2015, 8 4521
This test concept should have a great potential for comparing different hybrid strategies in a real
application in order to validate simulations. For example, by using a large fleet of vehicles, a large
spread of battery usage would give a good input to how different hybrid strategies combined with
different battery cells would influence energy throughput. However, evaluation of hybrid strategies
with this test concept also has limitations. For example, an HEV could have a different gear-shifting
pattern compared to a conventional vehicle, and this is difficult to emulate using this test method.
Validation of battery management strategies such as, for example, SOC estimation and SOC
calibration is another possible field of application for this test concept. In this case, the test concept has
an additional advantage compared to testing on real HEVs due to its capability to perform periodical
SOC calibrations and performance tests during vehicle operation.
3.2. Capacity Measurements
Initial discharge capacity for all cells in the field study was measured in the laboratory prior to
testing. Capacity measurements were also performed a number of times during the field test. Equivalent
full cycles were calculated from the total cycled energy and the initial cell capacity according to
Equation (3):
initnom
toteq QU
WN
2 (3)
Neq is the equivalent number of full cycles, Wtot is the accumulated energy throughput for the cycled
cell, Unom is the specified nominal battery voltage and Qinit is the measured initial battery capacity.
Figure 4 shows discharge curves from different measurement occasions for the cycle-aged cells,
as well as discharge curves for the calendar-aged reference cells.
The cycled cell on Truck 1 experienced a capacity loss of 3.0% after 1072 equivalent cycles and
6.6% after 1496 equivalent cycles. The corresponding capacity loss for the reference cell was 1.2%
and 1.5%, respectively. The cycled cell on Truck 2 experienced no capacity loss after 79 cycles but
1.3% after 859 cycles compared to 0.5% for the corresponding reference cell at the end of test.
The cycled cell on Truck 3 experienced no capacity loss after either 177 or 419 cycles while the
corresponding reference cell experienced a capacity loss of 0.5% at the end of test.

Energies 2015, 8 4522
Figure 4. Discharge capacity (C/20) at different equivalent cycles (Neq) for (a) cycle aged
cell on Truck 1; (b) calendar-aged cell on Truck 1 (half-time corresponds to 1072 cycles
for the cycle-aged cell); (c) cycle-aged cell on Truck 2; (d) calendar-aged cell on Truck 2;
(e) cycle-aged cell on truck 3 and (f) calendar-aged cell on Truck 3.
3.3. Differential Voltage Analysis
This cell type has in a previous study [10] shown that loss of cell capacity mainly correlates to
ageing of the positive electrode. The positive electrode contains LMO and LCO active material, which
both have been investigated regarding ageing mechanisms in earlier studies [11–14]. The negative
electrode active material LTO has a flat discharge curve over almost the complete State of Charge
(SOC) range [15,16] resulting in that the differential voltage (dV/dQ) curve of the cell will mirror the
differential voltage curve of the positive electrode. Hence, dV/dQ analysis is a useful method for
evaluating ageing of the positive electrode for this cell type. The dV/dQ analysis method has been
described in our earlier work [10] and in other publications [17–19] and will not be discussed further
here. A dV/dQ plot for this cell type has two peaks corresponding to phase changes in the positive
electrode active material. By analyzing changes in position of the peaks, it is possible to identify
ageing of the positive electrode and correlate it to loss of cell capacity. Figure 5 displays dV/dQ plots
for all cells in the study.

Energies 2015, 8 4523
Figure 5. dV/dQ-plots corresponding to the discharge curves in Figure 4: (a) cycle-aged
cell on Truck 1; (b) calendar-aged cell on Truck 1; (c) cycle-aged cell on Truck 2;
(d) calendar-aged cell on Truck 2; (e) cycle-aged cell on Truck 3 and (f) calendar-aged cell
on Truck 3.
The ratio between the heights of the two peaks in the dV/dQ plots in Figure 5 is different for all
cycled cells at the end of test compared to the calendar aged reference cells. The effect is also seen for
the initial curve compared to the aged curves in Figure 5a. This is a clear indication that all cycled cells
have experienced ageing of the positive electrode, even though the discharge capacity for the cycled
cell on truck 3 indicates the opposite. The existence of two dV/dQ peaks clearly indicates presence of
LMO and LCO active material, according to literature [20]. The distance between the peaks correlates
to the capacity of the positive electrode so that a larger distance between peaks corresponds to a higher
electrode capacity. It is seen in Figure 5a,c,e that the distance between peaks has become smaller
between measurement occasions for all cycled cells while no difference is seen for the corresponding

Energies 2015, 8 4524
measurements on reference cells in Figure 5b,d,f. The lower temperature in the early stage of testing
for the cycled cells on Truck 1 (Figure 5a) and Truck 3 (Figure 5e) is probably the origin of the
difference in dV/dQ behavior compared to the cycled cell on Truck 2 (Figure 5c). The calendar-aged
cells are, however, apparently not affected by this difference in temperature distribution.
This suggests that all cycled cells have experienced a loss of positive electrode active material to
some extent, except between the initial measurement and the first 1072 cycles for the cells on Truck 1.
However, the cells on Truck 1 experience a change of ratio between the heights of the two peaks in the
dV/dQ plots during that period. This indicates presence of an ageing mechanism in the early stage of
cycling that does not immediately result in capacity loss, possibly related to the composition of
the electrode active material. A Scanning Electron Microscopy Energy Dispersive X-ray
(SEM EDX)-analysis of fresh positive electrode material (not shown here, more information about the
measurement setup can be found in our previous paper [10]) from a cell with the same specification as
the tested cells but from a different batch, revealed a higher content of LMO than LCO. Since we in
our previous paper [10] found that the LMO active material likely ages faster than the LCO, this could
explain the change of ratio between the heights of the two peaks in the dV/dQ plots in Figure 5a,c.
To understand if it is possible to obtain loss of positive electrode active material without observing
an influence on the cell capacity, a graphical representation of the electrode matching within the cell is
used (Figure 6a). The fitting procedure used is presented elsewhere [10] and includes half cell
measurements on both positive and negative electrode material samples collected from a fresh cell
from a different batch but of the same generation as the tested cells. dV/dQ data from the positive
electrode sample are fitted to full cell dV/dQ data according to Equation (4):
1 δ (4)
The scaling factor is denoted s (unit less) and the capacity for each half cell electrode sample is
denoted q (mAh). The shift is called slippage and is denoted δ (mAh). The calculated open circuit
voltage (OCV) curve is in turn obtained by subtracting the negative electrode potential from the
positive. However, to get the half-cell OCV-curves to fit the full cell OCV-curves, the x-axis values
have to be scaled. In addition, the OCV curves need to be shifted along the x-axis for each electrode
relative the full cell OCV, according to Equation (5):
δ δ (5)
The fitting parameters for the fresh cells were calculated to spos = sneg = 636, δpos = 20 mAh and
δneg = −32 mAh. It is seen in Figure 6a that this cell type has an excess of positive electrode active
material and that it is the negative electrode that limits the cell capacity when fully charged.
Comparing with an earlier study of this cell type [6], it can be concluded that the main part of the
ageing is due to loss of positive electrode active material, resulting in a smaller positive electrode
capacity curve in Figure 6a. If only positive electrode active material is lost, the left end of the positive
electrode capacity curve will move rightward in Figure 6a while the right end of the curve stays in
position. This would result in a simultaneous loss of cell capacity. However, since the loss of positive
active electrode material essentially creates an excess of cyclable lithium for this cell type, loss of
cyclable lithium in combination with loss of positive electrode active material would instead make the

Energies 2015, 8 4525
right end of the positive electrode capacity curve to move leftward while the left end stays in position.
In the latter case, the cell capacity will initially be unaffected since there is an excess of positive
electrode active material. This could be the case for the cycled cell on Truck 3 since there is an
influence on dV/dQ from cycling but not on cell capacity. If both the loss of positive electrode active
material and the loss of cyclable lithium are taking place simultaneously, the dV/dQ-peaks should also
move towards each other, which is the case for the cycled cells in Trucks 2 and 3 in Figure 5c,e.
However, for the cell on Truck 1, the dV/dQ curve at 1496 cycles seems to have shifted to the left
compared to the previous measurement, indicating that only positive electrode active material has been
lost in this case. This suggests that this cell type experiences both a loss of positive electrode active
material and a loss of cyclable lithium in the beginning of cycling. During further cycling, loss of
cyclable lithium seems to gradually decrease while the loss of positive electrode active material seems
to continue. Hence, the initial excess of positive electrode active material seen for this cell type is not
possible to fully access due to this increasing surplus of cyclable lithium relative to the positive
electrode. This virtual surplus of cyclable lithium is generated when the amount of lost positive
electrode active material exceeds the loss of cyclable lithium and at this point the peaks in the
dV/dQ-plot should start to move leftwards, while also decreasing the distance between peaks.
Figure 6. (a) Internal cell matching for a fresh cell. (b) Fitted positive electrode
dV/dQ-data to full cell dV/dQ-data.
3.4. Impedance Measurements
Impedance measurements were performed on all cells in the test and the results are presented in
Figure 7.
The most visible change in impedance is a growth of the semicircle and a shift to the right in the
Nyqvist plot for all cycled cells. This trend is in line with our earlier findings for this cell type and is
most probably connected to the positive electrode. There is an initial difference in low frequency
impedance behaviour between the cells on Truck 1 and the cells on Trucks 2 and 3. One explanation to
this could be that the initial impedance measurement on the cells on Trucks 2 and 3 were performed
five months later than the initial impedance measurement on the cells on Truck 1. This would then
imply that there is an initial calendar ageing effect on the low frequency impedance for this type of

Energies 2015, 8 4526
cells, followed by a calendar ageing effect also influencing the impedance at higher frequencies,
according to Figure 7.
Figure 7. Nyquist plots at SOC 50% and 23 °C for both cycled and calendar-aged cells.
Blue square markings represent 1 Hz and red represents 0.01 Hz. (a) Cells from Truck 1;
(b) cells from Truck 2; (c) cells from Truck 3.
4. Conclusions
In this study, lithium-ion battery cells were cycled and data was collected from three heavy-duty
Scania trucks using in-house developed test equipment. Driving patterns were analyzed and
verification of hybrid strategy functionality was performed. SOC and power distributions were
analyzed to show how battery usage depends on driving pattern.
A comparison of capacity reduction between cycle-aged cells and calendar-aged cells was made.
The cycle-aged cell on Truck 1 experienced 1496 corresponding full cycles and a total capacity loss of
6.6%. The corresponding calendar-aged cell lost 1.4% of the initial capacity during the same test period.
The cells from the two other trucks in the study showed smaller differences between cycle-aged and
calendar-aged cells. The capacity fade and impedance rise was found to be related to the positive
electrode. The probable cause for capacity fade for this type of battery cell is loss of positive electrode
active material in combination with excess of cyclable lithium relative the positive electrode. The
difference in cell temperature distribution between the three trucks in the study should only have a
minor impact on ageing since no significant difference in calendar ageing were seen for the reference cells.
This implies that the ageing of the cycled cells mainly is caused by usage, not temperature differences.
Energies 2015, 8 4527
Vehicle speed distribution plots revealed inner city and intercity transportation types of driving.
The relatively low yearly mileage coverage supports this statement. The energy throughput per driving
distance was as expected highest for the truck driving exclusively in city traffic. A high energy
throughput per driving distance was however also obtained for Truck 2 that during a large part of the
test period was driving at highway speeds.
This study has shown that the described single battery cell testing concept has a great potential for
evaluating hybrid vehicle strategies and should also have a potential for evaluating battery
management strategies. However, the concept of real life battery cycling is not optimal as a substitute
to laboratory battery cycling due to the need for longer test periods. A potential enhancement of the
concept would be to increase the number of cycled cells per vehicle, including adding the corresponding
number of reference cells. This would improve the robustness of the test regarding potential cell failures,
and it would also give additional data for statistical analysis. With this method, it is not possible to
obtain exactly the same cell temperature distribution between vehicles, even if active cell heating and
cooling is used. It is hence not possible to obtain cell usage at the exact same cell temperature
distribution. Using a larger number of vehicles operating in the same region would, on the other hand,
minimize the difference in cell temperature distributions between vehicles. The test concept is, however,
a relatively cheap way of performing hybrid strategy testing and battery management testing on vehicles.
Acknowledgments
The authors would like to send their gratitude to Niclas Höök, Olle Gelin, Carl Tengstedt,
Ulf Söderberg and Anders Ohlsson for their support during this work. The financial support from
Scania CV AB and the Swedish Energy Agency are greatly appreciated.
Author Contributions
Pontus Svens performed the field tests, lab tests and the data analysis. All authors contributed to the
writing of the manuscript, and have read and approved the final manuscript
Conflicts of Interest
The authors declare no conflict of interest.
References
1. Mantzos, L.; Capros, P.; Kouvaritakis, N.; Zeka-Paschou, M. European Commission
Directorate-General Energy and Transport; Office for Official Publications of the European
Communities: Luxembourg, Luxembourg, 2003; p. 149.
2. European Union. Policy Area Transport in More Competitive, Resource-Efficient Transport;
European Union: Brussels, Belgium, 2011.
3. Anderson, J.; Fergusson, M.; Valsecchi, C. Policy Department Economic and Scientific Policy;
European Union: Brussels, Belgium, 2008; p. 12.
4. European Commision. Europe 2020 Targets; European Union: Brussels, Belgium, 2007.

Energies 2015, 8 4528
5. Tanoue, K.; Yanagihara, H.; Kusumi, H. Hybrid is a key technology for future automobiles.
In Hydrogen Technology: Mobile and Portable Applications; Leon, A., Ed.; Springer Science &
Business Media: Karlsruhe, Germany, 2008; pp. 235–272.
6. Matthé, R.; Eberle, U. The voltec system: Energy storage and electric propulsion. In Lithium-Ion
Batteries: Advances and Applications; Pistoia, G., Ed.; Elsevier Science: Oxford, UK, 2013;
pp. 151–176.
7. Svens, P.; Lindstrom, J.; Gelin, O.; Behm, M.; Lindbergh, G. Novel field test equipment for
lithium-ion batteries in hybrid electrical vehicle applications. Energies 2011, 4, 741–757.
8. West Virginia University’s Center for Alternative Fuels, Engines and Emissions.
Available online: http://cafee.wvu.edu/ (accessed on 2 April 2015).
9. US Environmental Protection Agency. Available online: http://www.epa.gov/ (accessed on
2 April 2015).
10. Svens, P.; Eriksson, R.; Hansson, J.; Behm, M.; Gustafsson, T.; Lindbergh, G. Analysis of aging of
commercial composite metal oxide—Li4Ti5O12 battery cells. J. Power Sources 2014, 270, 131–141.
11. Du Pasquier, A.; Blyr, A.; Cressent, A.; Lenain, C.; Amatucci, G.; Tarascon, J.M. An update on
the high temperature ageing mechanism in LiMn2O4-based Li-ion cells. J. Power Sources 1999,
81–82, 54–59.
12. Moss, P.L.; Au, G.; Plichta, E.J.; Zheng, J.P. Study of capacity fade of lithium-ion polymer
rechargeable batteries with continuous cycling. J. Electrochem. Soc. 2010, 157, A1–A7.
13. Eriksson, T.; Gustafsson, T.; Thomas, J.O. Surface structure of LiMn2O4 electrodes.
Electrochem. Solid State Lett. 2002, 5, A35–A38.
14. Smith, A.J.; Dahn, H.M.; Burns, J.C.; Dahn, J.R. Long-term low-rate cycling of LiCoO2/graphite
Li-ion cells at 55 °C. J. Electrochem. Soc. 2012, 159, A705–A710.
15. Colbow, K.M.; Dahn, J.R.; Haering, R.R. Structure and electrochemistry of the spinel oxides
LiTi2O4 and Li4/3Ti5/3O4. J. Power Sources 1989, 26, 397–402.
16. Ohzuku, T.; Ueda, A.; Yamamoto, N. Zero-strain insertion material of Li[Li1/3Ti5/3]O4 for
rechargeable lithium cells. J. Electrochem. Soc. 1995, 142, 1431–1435.
17. Bloom, I.; Jansen, A.N.; Abraham, D.P.; Knuth, J.; Jones, S.A.; Battaglia, V.S.; Henriksen, G.L.
Differential voltage analyses of high-power, lithium-ion cells: 1. Technique and application.
J. Power Sources 2005, 139, 295–303.
18. Dahn, H.M.; Smith, A.J.; Burns, J.C.; Stevens, D.A.; Dahn, J.R. User-friendly differential voltage
analysis freeware for the analysis of degradation mechanisms in Li-ion batteries. J. Electrochem. Soc.
2012, 159, A1405–A1409.
19. Honkura, K.; Honbo, H.; Koishikawa, Y.; Horiba, T. State analysis of lithium-ion batteries using
discharge curves. ECS Trans. 2008, 13, 61–73.
20. Han, X.; Ouyang, M.; Lu, L.; Li, J.; Zheng, Y.; Li, Z. A comparative study of commercial lithium
ion battery cycle life in electrical vehicle: Aging mechanism identification. J. Power Sources
2014, 251, 38–54.
© 2015 by the authors; licensee MDPI, Basel, Switzerland. This article is an open access article
distributed under the terms and conditions of the Creative Commons Attribution license
(http://creativecommons.org/licenses/by/4.0/).


