Embed Size (px)
Citation preview

‘Livelihoods and economic crisis: the case
of smallholder farmers in Zimbabwe (1999-2008)’
Marleen Dekker
African Studies Centre.
Wassenaarseweg 52
2300 RB Leiden, The Netherlands
Paper for the conference “Economic Development in Africa”, Centre for the Study of
African Economies, University of Oxford, Oxford UK. 22-24 March 2009
Work in progress
Abstract
In the past decade a political and economic crisis has unfolded in Zimbabwe,
resulting in two-digit negative growth rates, sky-rocketing inflation, decline in the
rule of law and a disintegration of markets, notably rural input, output and labour
markets. There has been little or no primary data collection to document the effects of
these crises on the livelihoods of smallholder farmers. This paper aims to do so by
revisiting a subsample of 75 households from the Zimbabwe Rural Household
Dynamics Study (ZRHDS). Building on existing survey data from the late 1990s, we
collected new survey data in 2007/8 and are able to explore important developments
regarding the mobility of household members, crop choices, engagement in off-farm
activities and the development of asset holdings, notable cattle ownership. We find
important differences in these key indicators between households residing in different
settlement types (communal and resettlement) or agro-ecological regions. Households
in the better agro-ecological region and resettlement areas are more likely to
maintain their livelihoods while households in the region that is more restricted in
terms of opportunities for (cash crop) cultivation and in communal areas face
considerable constraints in doing so. The observed variation across these different
livelihood options are strongly determined by the local and regional institutional
environment in which households and individuals operate, ranging from traditional
village heads and local security forces to private cotton input suppliers and
government based assistance programs.

1
1. Introduction
In the past decade a political and economic crisis has unfolded in Zimbabwe, resulting
in two-digit negative growth rates, sky-rocketing inflation, decline in the rule of law
and a disintegration of markets, notably rural input, output and labour markets. There
has been little data collection to document the effects of these crises on the livelihoods
and wellbeing of smallholder farmers. Based on a revisit of 75 households who are
part of a panel study covering the years 1994 to 2000, this paper studies the effects of
these ongoing crises.
At the macro-economic level, Zimbabwe’s real GDP growth rate decreased from 7
percent in 1990 to minus 6 percent in 2007 (IMF, WEO, 2008). Figure one shows this
reduction in the growth rate started from 1997/8 onwards and became negative before
the large scale farm invasions in 2000 and 2001. The negative growth rate peaked at
minus 10 percent in the drought year 2003. Figure one also clearly shows the
shrinkage of the Zimbabwean economy is at odds with the average development of
other African economies, which showed increasing growth since 2000. In Zimbabwe,
the official rate of inflation increased from a mere 15 percent in 1990, to 525 percent
in 2003, nearly 8000 percent in August 2007 and 231 million percent in July 2008. At
the same time, Kaufmann et al (2008) report a downward trend in all governance
indicators from 1996 to 2007, with most pronounced deterioration in government
effectiveness, rule of law and control of corruption.
Since 2000, national crop production has been affected by tenure insecurity, drought,
distorted markets, weak agricultural support services and acute shortages of seeds,
fertilizer and fuel (World Bank, 2007). Areas under cultivation have decreased
substantially between 1999/2000 and 2007/8. Maize plantations reduced from
850.000ha to 500.000 ha1, soy plantations from 220.000 ha to 60.000 ha and tobacco
from 180.000-60.000ha. The associated decline in tobacco production amounted from
236 million kilograms in 2000 to 73 million kilograms in 2007. Although the Fast
Track Resettlement Program started in the early 2000s, provided new opportunities
for farmers to make a living (Scoones, 2008), the shrinking economy severely reduced
employment opportunities in general and structural unemployment had increased to
more than 50 percent in the early 2000s and an estimated 80 to 94 percent in
2007/2008. Poverty is widespread and increasing from 25.5% in 1990 to an estimated
63% in 2006 (World Bank).
These macro-economic developments have clear repercussions on other welfare
dimensions. Child malnutrition increased from 13 percent of under-fives in 1999 to 20
percent in 2002 (GOZ, 2004). Infant mortality is on the increase from 49 per 1000
children in 1990 to 58 per 1000 children in 2006 (World Bank, 2007). The decrease in
life expectancy from 62 in 1990 to 33 years in 2006, is largely related to the high
prevalence of HIV/AIDS and the low coverage of ART medication (only 17% of
infected have access to ART programs). In 2009, UNICEF estimated school
attendance plummeted from 80 to 20 percent in 2008 and nearly all rural schools
remained closed after Christmas holidays early 2009 (UNICEF, 2009).
1 Anderson (2007) emphasizes this reduction is not only related to the collapse of the commercial
farming sector, during the 1990s, maize was increasingly produced in small scale farming areas, not
commercial farms.

2
Given this context, many educated as well as non-educated, Zimbabweans have
started to look for greener pastures in neighbouring Botswana and South Africa, or
further away. On the one hand this causes a severe brain drain, effectively reducing
the capacity of government institutions, while on the other hand it provides an
essential safety net for those who have stayed behind, in the form of remittances.
Already in 2002, an estimated 20 percent of the population was living in the Diaspora
(World Bank, 2007) and this number has increased dramatically since.
These macro-economic figures suggest a very grim situation but do not tell us what is
happening to the socio-economic environment in which people live and how ordinary
Zimbabweans are managing their everyday lives. For some groups in society, such
reports are available. For example, on the situation of former farm-workers who lost
their job and place of residence when farms were seized from white commercial
farmers (Magaramombe, 2007) or the impact of operation Murambatsvina (Restore
Order) on urban dwellers and their responses to rebuild their livelihoods (Potts, 2006,
Kamete, 2007). Also work is underway to describe the progress made in the newly
resettled schemes (Sukume, nd, Scoones, 2008 and Marongwe, 2008) and the
challenges faced by Zimbabweans who have crossed the border to South Africa (ref).
Studies by Mosley et al (2007) and Bird and Prowse (2007) discuss the situation in
smallholder farming areas. Mosley et al. use survey data and report on movements in
and out of poverty between 2001 and 2005/6, while Bird and Prowse present two rural
case studies based on life histories and describe a process of impoverishment and
adverse coping. These studies suggest there are indeed profound changes in the
economic environment of farmers, specifically related to the functioning of the credit,
input, output and labour markets. Although illustrative and important for an
understanding of the impact of the economic crisis in rural farming areas, these
studies either miss the long-term perspective to address these changes (Mosley et al.
cover a period when negative economic growth rates had already set in) or are very
limited and possibly selective in scope (Bird and Prowse describe two cases of
extreme adverse coping).
This study aims to contribute to this gap in knowledge by comparing farming
livelihoods before and after 2000 and to explore changes in these livelihoods in the
context of changing market environments and local institutions. We do this by
revisiting farmers who were included in a panel data-set covering the period before
2000. This approach allows us to document the current situation and changes that
have taken place since the early 2000s. Although a first glance at key livelihood
indicators between 2000 and 2007 show few significant differences, we document
patterns in household member mobility and changes in cropping patterns (a significant
increase in area under food crops) and find decreasing opportunities for non-farm
activities and a clear increase in the number of cattle-poor households. Although
based on a small sample and preliminary and tentative analysis, our findings show
some pronounced regional differences in the impact of the economic crisis on
livelihoods of farmers and the possibilities to deal with it. These regional differences
can be understood in more detail with reference to the local institutional and market
environment, notably the input market.
3
The remainder of this paper is organized as follows. In Section two we describe the
data collection and the background of the farmers in our sample. Section three
describes the changes in some key livelihood indicators between 2000 and 2007.
Section four further explores the development in three key indicators: mobility of
people, livestock possessions and crop cultivation. Section five concludes.
2. Data collection and background of the farmers
The data used in this paper is derived from the Zimbabwe Rural Household Dynamics
Study (ZRHDS) collected by Bill Kinsey. For this study, we revisited a sub-sample of
75 households (of the 550 originally in the ZRHDS) in two regions of the country, as
indicated in figure two.2 The sub-sample is evenly split between households residing
in the more favourable region for agriculture (II) between Shamva and Mount Darwin,
and natural region III, west of Rusape. Table one shows the main characteristics of
our sub-sample. In total 41 of the households reside in a resettlement area3 and 34 in a
communal area.
Given the political and economic situation in Zimbabwe at the time of data collection
it was not possible to randomly select villages and households for this follow-up
study. We selected villages from the original ZRHDS that were easily accessible for
the field researchers (in terms of logistics as well as hospitability of village heads) and
aimed at talking to households that had different backgrounds in 2000. The indicators
used to select households included household size and composition, crop cultivation
(acreage and diversity), social connectedness in the village, wealth (measured in cattle
possessions). Ranking the households was based on either a high or low score on any
(or more) of these indicators, with the average households at the bottom of the list. In
practice, the field researchers did not always find first-ranked households present and
consequently selected households that were less diverse in terms of their situation in
2000.
Table three presents information on key characteristics of the households in our sub-
sample, relative to the other households in the ZRHDS sample in 2000. With respect
to household size, number of non-farm activities, diversity of crops cultivated and the
acreage under food crops, the sub-sample in the current study is not significantly
different from the other households in the ZRHDS. The households in the sub-sample
are however less wealthy in terms of cattle possessions, they grow on average a
smaller acreage under crops and cash crops in particular. These differences are not
related to the selection of households in the villages in the sample, but are rather
related to the selection of villages in the sub-sample. When comparing the households
in the sub-sample to households in the same village (not reported here) they are very
similar. There are two exceptions: households in the sub-sample in Mudzinge on
average grew a larger acreage of crops compared to the other ZRHDS households in
that village, while sub-sample households in Muringamombe on average had a higher
livestock possessions compared to non sum-sample households.
2 I would like to thank our two field researchers for their incredible work in challenging circumstances
and Bill Kinsey for coordinating data-collection and tackling the many challenges of doing fieldwork in
a hyperinflationary environment. 3 These are so-called “old-resettlement schemes” established in the early 1980 and not part of the Fast
Track Resettlement Program started in the early 2000s
4
After some in-depth interviews with selected resettled households, a more structured
data collection instrument was developed and administered to the households early
2008. Given the political situation in the run-up to the March 2008 presidential
elections, it was not possible to extend the sample to the communal areas straight
away. There, interviews took place one month after the second round of the elections
in June 2008.4 The questions were adjusted in such a way to maximize comparability
between resettled and communal households. In the context of hyperinflation, ranging
from 60 to 600 percent per month during the period of our study (Hanke, 2009), it was
not possible to collect meaningful information about crop and input prices,
remuneration of non-agricultural jobs or the value of assets (including livestock)
purchased and bought.
2.2. Background of the farmers
The farmers studied in the ZRHDS data set resettled in the early 1980s and were first
interviewed in 1983, again in 1987 and every year between 1992 and 2001. In 1997,
the ZRHDS data set was expanded to include farmers from communal areas, adjacent
to the resettlement schemes from which the initial sample was drawn. This allowed
for a comparison between resettled and communal farmers, showing for example in
2000 that resettled households had significantly larger landholdings, higher per capita
incomes and higher assets holdings compared to communal areas households (Dekker,
2004a, Hoogeveen and Kinsey, 2001). Resettled households were substantially larger,
as it was not possible to formally subdivide the allocated land to adult sons who start
their own family. As a consequence, many resettled households were multi-
generational households, with (an) adult son(s) co-residing on his parents plot
(Dekker, 2004a).
Also resettled farmers lived amongst fewer kin people compared to communal
farmers, but invested more in the development of associations in their communities
(Barr, 2004). This in turn affected the way households responded to individual crisis
situations such as illness or death. Resettled households more often used individual
strategies (e.g. asset sales or generation of additional income) to cope with crisis
situations and found it less easy to access support through their social networks
(Dekker, 2004b).
For resettled farmers, the dominant sources of livelihoods were crops and livestock,
with crop income accounting to some 75 percent of annual household income or more
(Bourdillon et al. 2003). This is related to the relatively large plots of relatively good
quality land these households were endowed with, and the result of past legal
restrictions for head of households to work outside agriculture. In non-drought years,
households produced maize in excess of subsistence needs and most farmers produced
cash crops, such as cotton and tobacco (Dekker, 2004a). Maize production, even in
subsistence farming, was based on a so-called high input farming regime, 70-90
percent of farmers used hybrid maize in the 1999-2000 cropping season (Bourdillon et
4 It should be noted that the macro-economic situation has worsened tremendously since the data was
collected and anecdotal evidence suggests increased food insecurity and large scale asset depletion,
suggesting the picture provided by the data used on this paper is only a first indication and
underestimation of the current situation. New data collection in the same sub-sample is underway to
document the more recent changes.

5
al., 2003). For this reason, most farmers participated in input (seeds and fertilizer)
and output (crops, cattle) markets, while the labour market offered opportunities to
generate income for the poorer households or in times of cash needs to pay school
fees, medical bills or funeral costs. Until the early 1990s the government supported
smallholder farmers with a system of agricultural credit and producer price support
(Andersson, 2007). In the mid 1990s the government withdrew support and private
firms filled the gap where this was attractive to do so (i.e. in areas with sufficient
production potential), as was the case in the resettlement schemes under
consideration. Hybrid maize production not only raised income, but also resulted in an
accumulation of assets such as tools and livestock. In turn, the accumulation of
livestock is important for households to be able to cope with shocks, such as droughts
or illness (Kinsey et al., 1998, Bourdillon et al., 2003, Dekker, 2004b).
Given this background we expected the macro-economic situation affected farmers
and their livelihoods in three, sometimes interrelated ways. First, the establishment of
Fast Track Resettlement Schemes offered opportunities for adult sons in the
resettlement schemes and communal areas to start their own farm. The 2001 ZRHDS
survey showed a considerable interest on the part of youngsters in establishing their
own farms and in moving away from the old resettlement schemes. At the same time,
the increasing unemployment rate and operation Murambatsvina may have forced
migrants to return to their rural home and look for alternative occupations, either in
the rural home, in the new resettlement areas or elsewhere. In the context of these two
opposing forces and for the whole sample of the ZRHDS, Kinsey (2008) reports an
increase in household size in the communal households while the size of the resettled
households reduced.
Secondly, the collapse of the commercial farming sector and increased price controls
on inputs and output, have changed the agricultural landscape in Zimbabwe
dramatically. Input and output markets have disintegrated. Moreover, by offering
favourable conditions for settlers in the Fast Track Resettlement Schemes, the
government unintentionally provided an opportunity for a parallel market to develop
and flourish (Bird and Prowse, 2007). These changes in the market environment affect
farming operations, with potential shifts in cropping patterns and cultivation practices.
Given the diversity of agro-ecological conditions and related market and institutional
structures across the country, the effects of these changes are likely to vary across
space as well. Richardson (2007) for example reports an increase in cotton production
of small holder farmers.
Thirdly, the shrinking economy clearly reduces opportunities for diversification while
at the same time the need for diversification may be growing. Bourdillon et al (2003)
report a reduced opportunity for non-agricultural incomes and it is expected the same
will apply for asset strategies. Moreover, the commercial farming sector does not
provide as much (temporal) job opportunities as before.
In the next section we look at changes in key indicators related to the three issues
discussed here and explore the differential impact per agro-ecological region and
settlement type.

6
3. Descriptive key indicators 2000-2007
Table three provides information on the development of key indicators between 2000
and 2007: household size, the acreage under cultivation (with a breakdown for cash
crops and food crops), crop diversity, the number of non-farm activities and the
number of livestock owned. A first glance at the 2000 and 2007 averages for the full
sample, show few statistically significant changes, with the exception of an increase
in area under food crops and a decrease in the number of off-farm activities.
Disaggregation to type of settlement (resettlement vs communal farmers) and agro-
ecological region (region two vs region three) however shows opposing
developments.
3.1. Household size and mobility
Between 2000 and 2008, average household size reduced from 7.70 to 7.37. This
difference is not significant. There are however clear regional differences, with a
reduction (from 8.9 to 7.8 household members) in resettlement areas and a strong and
significant reduction in region two (from 9.3 to 7.76). In natural region three and
communal areas, household size shows an insignificant increase. These averages over
seven years conceal a dynamic pattern of household member mobility. When we
interviewed these 75 households in 2000, we found 579 individuals residing on the
plots. In 2008 this number had decreased to 553 individuals. A total of 221
individuals had left, 240 new household members came and 45 died between 2000
and 2008.
Most individuals left in 2002 (predominantly in the resettlement areas and natural
region two) or after 2005 (communal areas and natural region three). Of all
individuals who left, 20% are girls who married and started to live with their spouse,
18% settled in Fast Track Resettlement Scheme, 9% settled on a new plot in the
village5 or elsewhere, 19% left the household to look for employment and 13% are
children who joined their parents. The reasons for leaving the households are not
significantly different for members leaving communal or resettled households, but are
different between members living in different agro-ecological regions. In natural
region two, members predominantly leave to marry (girls) or to settle on a new farm
(small families), either in the Fast Track Resettlement Schemes6 or elsewhere, while
in natural region three almost half of the members left to look for work. Going abroad
to look for a job was more common here compared to natural region two. The average
age of household members who left the household after 2000 was 26.71 (age in 2007),
with a range of 9-88 years. This number is very similar for migrants across settlement
types and agro-ecological regions.
Given the larger household sizes in natural region two and the resettlement areas in
2000 it is important to correct for initial household size. In communal and
5 In the two villages in Mupfurudzi Resettlement Scheme, the village headmen had decided early 2007
to allow married sons who resided on the homestead of their father to clear land and establish their own
residential plots on the outskirts of the village. Note this concerns land for residential purposes only
(possibly including a garden). For cropping activities these sons still depended on their fathers land. 6 This may be related to the fact that the study areas in natural region two were surrounded by large
commercial farms that have been seized in the Fast Track Resettlement process and youngsters in this
area joined early in this process.

7
resettlement areas, the proportion of household members who left is very similar, but
there are clear differences between region three where a proportion of 0.3 left and
region two where 0.41 left.
At the same time, one in every five household members currently living on the plot
came to live in this place of residence since 2000, with a significant higher number of
returnees or newcomers in the communal areas (0.30) compared to the resettlement
villages (0.17) and to households residing in natural region (0.27) as compared to
region 2 (0.19). The average age of new household members was 12.1 in 2007,
ranging from 0 to 66 years. Members who came were significantly older in communal
areas compared to resettled areas (14.6 years versus 9.72 years), with more returnee
migrants in the former areas.
On average, these descriptives suggests the opportunities provided by the Fast Track
Resettlement Scheme only provided some relief to the overcrowded communal areas;
although it allowed some members to establish their own farm, other members
returned to the communal area households in response to the economic hardships and
or security situation related to operation Murambatsvina.
3.2. Cattle ownership
When comparing livestock ownership between 2000 and 2007, we observe a
downward, but not significant reduction in herd size. For the full sample the number
of livestock owned decreased from five ox-equivalent7 in 2000 to 3.9 in 2007.In the
communal areas, the reduction in herd size is significant, albeit only marginally.8 On
the other hand, the proportion of households that are poor in terms of livestock wealth
did increase. The percentage of households with no cattle has increased only slightly
from 11 to 13 percent. The proportion of households with one ox-equivalent or less
has increased significantly from 17 to 27 percent, while the proportion of households
with two ox-equivalent or less has increased significantly from 28 to 36 percent. The
increase is highest in natural region two and the communal areas.
The development of herd size between 2000 and 2007 is determined by the total of
animal deaths, sales, theft, new born and cattle taken/brought by people who left/came
to live in the household. We do not have details on all these events. Farmers did
however report on the number of cattle sold and often referred to the need to buy food
or to pay for school fees for cattle sales. These reasons now feature high on the list of
reasons to sell, followed by the need to buy seeds or fertilizer. In 2000 purchasing
inputs was the most frequent mentioned reason for selling livestock.
3.3. Crop cultivation
In terms of crop cultivation, comparing the acreage under cultivation between 2000
and 2007 shows an increase.9 Although this increase is not significant for all the
households in the sample, the comparison of acreage between households living in
natural region two and in resettled areas yields a significant increase. Communal area
and natural region three show a marginal, but not significant, decrease in acreage
7 The ox-equivalent is used to make livestock herds with varied composition comparable. Based on
1995 market rates, livestock is weighted relative to the price of 1 ox. The weights used are: cow: 0.71,
bull: 0.83, young ox: 0.59; heifers 0.58; calves: 0.18, sheep 0.08, goats and pigs: 0.06. 8 The results are the same for per capita livestock holdings
9 The questions in the 2007/8 questionnaire mainly referred to the completed 2006/7 cropping season.
Planting for the 2007/8 season was still partly ongoing during the first interviews.

8
under cultivation. Interestingly, and in contrast to Richardsons (2007) finding, the
increase in acreage is related to food crop production only. In fact, the acreage under
cash crop production shows a downward trend although the differences between 2000
and 2007 are not significant. The increase in area under food crops is however only
significant in region two and the resettled areas; the communal areas and natural
region three again show a reduction (although not statistically significant). Overall
there is an increase in the crop diversity, but this increase is only significant in the
region with most agricultural potential and especially in the communal area in that
locality.
If we look more specifically at individual crops (not reported in table three), there is
no change in maize production, except for the communal village in the less favourable
region where acreage under maize reduced significantly from 2.3 acre in 2000 to 1.8
acre in 2007. Farmers in the same region, both resettled and communal, show more
interest in the production of rapoko (finger millet) that does not need fertilizer and
hybrid seeds. Across all regions, and especially in resettled villages and natural region
three, we find a reduced acreage of nyimo beans, related to the difficulty to find the
seeds for this crop. On the other hand, across the sample we find an increase in
sunflower cultivation, especially in the region with best agro-ecological conditions
and then especially in the communal village there, where this crop was not cultivated
in 2000. The crop is easy to grow, does not need fertilizer and seeds are easy to get
from previous harvests or from friends and relatives. The sunflowers are used to press
cooking oil and reduce the pressure on household budgets in the inflationary
environment. Oil presses are available at village level or in local business centres.
Resettled farmers and farmers from natural region two also grow larger portions of
their land with soya beans. Soya beans are pounded for baking bread or just cooked
and eaten as beans. Growing them is good for the soil and it does not need fertilizer.
The seeds are bought from local shops or farmers get a cup from the previous harvest
of other farmers.
The increase in acreage and in food crops more specifically, is intriguing given the
large number of people who have left the homestead to establish a plot somewhere
else. It is important to explore this a little further as some members have left and
established their residential plot in the same village as their father. This means they
are still cultivating their father’s land as they were doing for some years before they
settled on their own, which would not necessarily have to lead to a reduction in the
area of cultivation that might otherwise be related to a reduced labour force and/or
reduction in the number of mouths to be fed. Potentially this split of households may
increase the acreage under cultivation, as the sons will farm more independently from
their fathers compared to the situation where they were still living at the same
residential plot, even when it does concerns a portion of their fathers plot. This is
however not what we are observing here. The data we refer to here relate to the
cropping season 2006/7, with the harvest in April 07. The relocation of married sons
to their own plots took place in the course of 2007 and will only influence crop
production in the 2007/08 season.10
10
Some preliminary information on cropping patterns for that farming season reveals the acreage under
cash crop production increases.

9
The increase of the acreage under cultivation, the acreage under food crops and
diversity of crops grown, is more likely to be understood in relation to input and
output markets. In the increasingly inflationary environment it is more and more
difficult for farmers who face a food shortage, to buy food with the income they earn
through cash crop cultivation. In such a context farmers will try to make sure they
grow enough maize to feed their own families and possibly sell or barter any surplus
in the market. In these areas, maize farming is mostly based on expensive inputs.
Alternatively, lack of access to fertilizer may force farmers to grow larger plots of
land under food crops to ensure household food security.11
Given the importance of access to inputs, avenues to do so should be explored in more
detail. In 2000 farmers were generally able to buy inputs on credit, either from the
Grain Marketing Board (parastatal), which provided seeds and fertilizer for maize, or
from commercial companies providing inputs for cotton and tobacco. The latter were
only active in the region with higher agro-ecological potential as these areas were
suitable for cash crop cultivation, while natural region 3 was not. Although aimed at
cash crop production, the fertilizer for the cotton was also sometimes used for maize
cultivation (Bourdillon et al). Most of these private companies were still active in the
area in 2006/7 and 2008; in fact the number of companies has actually increased. On
the other hand, maize input provision was no longer organized by the GMB, but
through the Maguta Program, a government initiated and sponsored military operation
to boost food security in Zimbabwe. Although predominantly aimed at providing
assistance and support to farmers in the Fast Track Resettlement Schemes established
since 2000, the farmers in our research sites were also eligible for inputs on credit,
delivered through the political structures at village level.
The Maguta Program has been widely criticized for the redirection of the inputs both
by senior ministers and high-up officials (Chimete, 2009) as well as soldiers
responsible for the local level implementation of the program (Prowse and Bird,
2007). The farmers in our sample present a very mixed experience with the input
provision under the Maguta Program. In 2006, farmers in natural region two in
general had access to seeds and fertilizer for maize production through the program.
This however was not the case for farmers in natural region three, who reported
scarcity of inputs related to a redirection of the inputs to the parallel market. Farmers
in natural region three had to resort to private purchase, or cultivation without
fertilizers, because there was no alternative provider of inputs on credit. In region two
on the other hand, there are several cotton companies providing inputs on loan to
farmers that could also be used for maize farming.
In reviewing these regional factors, we find that existing market structures (which are
strongly related to the agro-ecological potential of the area) and access to government
input programmes in region two allows farmers at least to a large extent to maintain
their livelihoods, and when necessary to expand food production, while a lack of
market players and restricted access to government input programmes makes it more
difficult for farmers in natural region three to hold on to their cropping practices.
3.4. Non-farm activities
In the current economic context, farmers have significantly less economic activities
outside crop cultivation. In 1999/2000 farmers reported to have two to three activities
11
Inputs use and crop output should be explored in more detail to unravel this issue.

10
while in 2007/8 they had one or two such activities. The reduction in activities is most
significant for farmers living in resettlement areas and Natural Region two, who had
more of these activities to start with. Resettled farmers are still more active outside
agriculture, while farmers residing in natural region two are now equally active
compared to those in natural region three.
Farmers reported to have stopped making bricks and building, crafts production (mats,
pots etc.) and trading. Reasons cited to stop often include the lack of profitability of
the activities, but also include health/age reasons and the security situation (operation
Murambatsvina and illegal activities). When comparing the type of activities reported
in 2007/8 with those in 1999, we find a larger proportion of activities in the field of
building/brick making12
, gardening, the sale of firewood, grass and thatch grass and
being a neighbourhood police. At the same time, people are less likely to take up
piece jobs, to make peanut butter for sale and to be engaged in gold panning. Piece
jobs at commercial farms are now difficult to find and given the scarcity of food and
money, it is also not easy for farmers to hire labour from someone else in the village,
as it is difficult to pay for this labour in return.
The neighbourhood police function is not new, it existed before 2000 as well, with
one or two neighbourhood police officers in each village. In the context of security
issues relating to the presidential election in 2008, the number of neighbourhood
police officers has increased substantially, especially in natural region three, where
farmers were recruited as security officers for rallies and other political events.
4. Analysis of Mobility, cropping patterns and cattle wealth
The comparison of farmer’s livelihoods between 2000 and 2007 in the previous
section revealed some interesting patterns in terms of household member mobility,
changes in cropping patterns and changes in cattle wealth. Disaggregation to
settlement type and agro-ecological region showed these changes are not the same for
all farmers; the areas they live in provide opportunities and constraints to respond to
the changing macro-economic environment. In this section we explore in more detail
the influence of household characteristics and regional factors on the observed
changes.
4.1. Household member mobility
To understand more fully the dynamics of mobility, we try to unravel some of the
determinants of migration. Our first regression aims at explaining who left the
household after 2000 and is restricted the members living in the household in 2000.
The dependent variable equals one if a household member has left the household after
2000 and zero if the household member is still resident. As explanatory variables we
include both individual characteristics of the household members and characteristics
of the household, all measured in 2000. We include the sex of the household member
(women are more likely to move out as they get married) and the age and level of
schooling of the household members in years (both linear and square to account for
decreasing effects of higher age and education). We expect older household members
12
The absolute number of builders/brick makers has declined, but their relative proportion has
increased.

11
are more likely to move, but not the elderly, and schooling might also have a positive
effect on leaving the household, as there may be more opportunities for the educated.
As there are a considerable number of married children who lived on their parents
homestead because they did not have access to land, these may have moved away
given the new opportunities to obtain a residential plot or farming plot, either in the
village or elsewhere. For this reason we include a dummy variable that equals one for
married children.
Household characteristics included in the regression are household size; when there is
more pressure on resources we expect people are more likely to move. Also, the
number migrants tied to the household in 2000 may have an effect on the likelihood
that people move. The direction of this effect is an empirical matter; they may provide
support to household members who remained in the rural area to maintain their
livelihoods (f.e. through the provision of fertilizers from town), or they may attract
more members to look for greener pastures in their place of residence and provide
accommodation and a first point of entry to the job market.13
The economic position
of the household may also affect the likeliness to move, therefore we include the size
of their cattle herd (an important indicator of wealth), the acreage under crop
cultivation (in acres), the proportion of land cultivated under cash crops and the
number of non-agricultural activities household members are engaged in. The latter
three variables may signal an economic embeddedness in the area. Again the direction
of this effect in an empirical matter when on the one hand a (relative) secure
economic position may keep farmers where they are, while the members from the
poorest households may want to explore other opportunities but simply do not have
the means to do so. Finally, we also consider the embeddedness of households in
their local social environment (measured as the number of memberships in local
religious and non-religious associations and the number of intra-village kinship ties)
as indicators of social safety net that is present in the village.
The results are reported in table four. Considering the individual characteristics of
household members, we find women are more likely to move away, they get married.
We find no significant relationship between age and likelihood of moving, but do find
a strong and positive effect of marital status of children residing on the homestead.
Married children are more likely to move away to establish their own homestead and
or farm. This is clearly related to the possibilities offered by the village headmen to
establish residential plots in the two villages in Mupfurudzi Resettlement Scheme and
the opportunities to start an independent farm in the Fast Track Resettlement
Schemes. Household members with more education are also more likely to move
away, possibly in search of jobs.
With respect to household characteristics, we find household size has a negative but
insignificant effect on the likelihood to move; while the squared term is significantly
positive, indicating that only in the very large households, household size (crowded
homesteads or scarcity of resources) may be a push factor. Cattle wealth or acreage
under cultivation in 2000 do not affect the likelihood to move, nor does local social
embeddedness. We do however find a significant negative effect of cash crop
orientation and migrants. Members from a household that has a larger proportion of
their cultivated land under cash crops are less likely to move away from their place of
13
Note that migrants coming back to live in the rural areas after operation Murambatsvina or because
they lost their jobs in the contracting economy, are not included in this analysis as we only consider
members who resided in the household in 2000.
12
residence. Households with cash crop production may be more economically stable,
with less need to look for greener pastures. This economic stability is not only related
to the possibility to generate income, but also to secure access to inputs needed for
food crop production, as described in the previous section. Interestingly, household
members living in a household with more migrant members in 2000 are also less
likely to move away, suggesting migrant members might still be able to provide some
economic security to the remaining household members, or their experiences are
negative and do not attract other household members to move away either.
We also find positive and significant effects of settlement and regional indicators.
Members from households living in communal areas are more likely to move away, as
are members of households living in the better agro-ecological region.
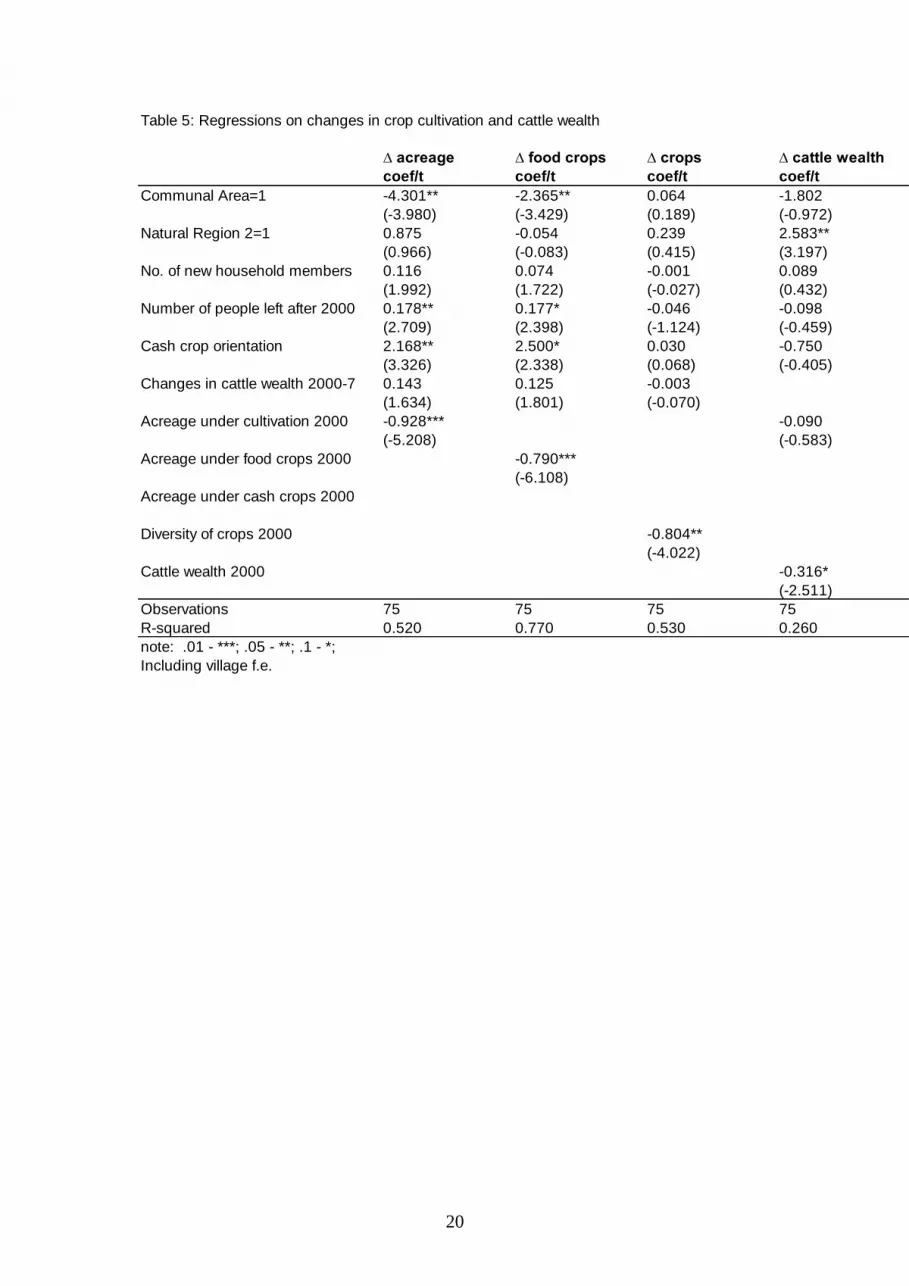
4.2. Cropping patterns and cattle wealth
In our second set of regressions, which are still tentative at the moment, we aim to get
more insight in changes in cropping patterns and livestock possession. In table five we
explore regressions with four different dependent variables: the second column shows
the results for change in acreage under cultivation between 2000 and 2007, the third
for change in acreage under food crops and the fourth change in cattle wealth. On the
right hand side, we include dummies for settlement type and natural region. To
explore the effect of household member mobility, we also include the number of new
household members since 2000 and the number of household members who left since
2000. Given the importance of cattle in crop cultivation and the access to inputs
related to cash crop production, we also include cash crop orientation (measured as
the proportion of land under cash crops) and changes in cattle wealth between 2000
and 2007 measured in ox-equivalents. To control for “initial conditions” we also
include the lagged level value of the dependent variable, i.e. acreage under cultivation
in 2000 in the regression on changes in acreage under cultivation etc.
We find the changes in cropping patterns and cattle wealth are significantly and
negatively related to their levels in 2000; e.g. the larger the acreage under cultivation
in 2000, the smaller the change in acreage between 2000 and 2007. Changes in
cropping patterns are not significantly related to changes in livestock possessions, nor
the number of new household members. We do find a significant and positive effect
of a cash-crop orientation and the number of people who left the household on
changes in acreage under cultivation and to a lesser extent food crop cultivation. A
significant negative effect is also found for communal area residence on changes in
cropping patterns communal areas, while households in natural region two have a
significant and positive effect on cattle wealth.14
The latter is in line with the earlier
suggestion that households in natural region two may find it easier to maintain their
livelihoods; controlling for differences in household member mobility (and the
potentially associated transfer of cattle from one area to the other) and initial herd
size, households in natural region two have larger cattle wealth.
5. Conclusion Over the past ten years, a political and economic crisis has unfolded in Zimbabwe,
resulting in two-digit negative growth rates, sky-rocketing inflation, decline in the rule
14
The estimation results are very similar when we include the level of acreage, food crops, cash crops,
crops and livestock possessions.
13
of law and a disintegration of markets, notably rural input, output and labour markets.
There has been little data collection to document the effects of these crises on the
livelihoods and wellbeing of smallholder farmers. Based on a revisit of 75 households
who are part of a panel study covering the years 1994 to 2000, this paper studied the
effects of these ongoing crises.
Comparison of key livelihood indicators shows a remarkable similarity between 2000
and 2007 in terms of average household size, acreage under cultivation and cash
crops, crop diversity and livestock holdings. At the same time, there is a significant
increase in acreage under food crops, a decrease in number of off-farm activities and
an increase of cattle poor households. Moreover, we found clear regional differences
in household member mobility, patterns of crop cultivation, non-farm activities and
livestock holdings. These regional differences are to a large extent related to the agro-
ecological conditions and related market and government input provision structures,
benefitting farmers residing in natural region two. On average these farmers are able
to maintain cash crop cultivation and increase food crop cultivation, with an increased
diversity of crops.
With reference to household member mobility we found a significant larger number
of new comers or returnees to communal area households. And this influx is on
average larger than the number of members who left the household to look for greener
pastures (either in the fast track resettlement schemes or to look for a job in town or
abroad), suggesting the Fast Track Resettlement Programme did not bring a relief to
the overcrowded communal area in our sample. At the same time, resettled household
members, and especially married sons who still resided on their fathers plot, did
benefit from the new opportunities offered by Fast Track, especially the site in region
two that is in close vicinity of the new resettlement schemes.

14
References
Andersson, J. A. (2007) How much did property rights matter? Understanding Food
Insecurity in Zimbabwe: A critique of Richardson. African Affairs, 106 (425), p.*
Barr, A. (2004) Forging Effective New Communities. The Evolution of Civil Society
in Zimbabwean Resettlement Villages. World Development 32(10), p.1753-1766.
Bird, K. and M. Prowse (2007) Vulnerability, Poverty and Coping in Zimbabwe.
Paper presented at UNU-WIDER Conference on Fragile States-Fragile Groups, 15-16
June 2007, Helsinki.
Bourdillon, M., P. Hebinck, J. Hoddinott, B. Kinsey, J. Marondo, N, Mudege and T.
Owens (2003) Assessing the impact of high-yielding varieties of maize in resettlement
areas of Zimbabwe. FCND Discussion Paper 161. Washington D.C.: IFPRI (FCND).
Chimete, C. (2009) Zimbabwe: No Naming and Shaming for Maguta Looters. The
Standard, 31 January 2009. http://allafrica.com/stories/200902021000.html
Dekker, M (2004a) Risk, Resettlement and Relations: Social Security in Rural
Zimbabwe. PhD Thesis Vrije Universiteit Amsterdam: Thela Thesis, Tinbergen
Instititute.
Dekker, M. (2004b) Sustainability and Resourcefulness. Support Networks during
periods of Stress. World Development 32(10), p.1735-1751.
Hanke, S.H. (2009) RIP Zimbabwe Dollar. http://www.cato.org/zimbabwe
Hoogeveen, H. and B.H. Kinsey (2001) Land Reform, growth and equity: a sequel.
Journal of southern African Studies, 27, p.127-136
Kamete, A.Y. (2007) Not exactly like the phoenix, but rising all the same: recovery
and resistance among displaced youth in post-murambatsvina Harare. Paper
presented at AEGIS European Conference on African Studies, July 2007, African
Studies Centre, Leiden, Netherlands.
Kaufmann, D. , A. Kraay, M. Mastuzzi (2008) Governance Matters VII. Aggregate
and Individual Governance Indicators 1996-2007. Washington D.C., The World
Bank, World Bank Policy Research Working Paper, 4654).
Kinsey, B.H., K. Burger and J. W. Gunning (1998) Coping with drought in
Zimbabwe. Survey evidence on responses of rural households to risk. World
Development 25(1), p.89-110.
Kinsey, B.H. (2008) Who Went Where ... and Why: Patterns and Consequences of
Displacement in Rural Zimbabwe after February 2000. Paper presented at the
International Conference on Political Economies of Displacement in Post-2000
Zimbabwe, University of the Witwatersrand, Johannesburg, 9-11 June 2008
Magaramombe, G. (2007) Internal Displacement of ex-farm workers and copying
mechanisms in a rural informal settlement in Zimbabwe. Paper presented at AEGIS

15
European Conference on African Studies, July 2007, African Studies Centre, Leiden,
Netherlands.
Marongwe, N (nd) Redistributive Land Reform and Poverty Reduction in Zimbabwe.
Working Paper Research Project Livelihoods After Landreform.
Mosley, P., A.Suleiman and B. Chiripanhura (2007) Escape routes from the rural
poverty trap: evidence from three African countries. Paper presented at CSAE
conference on Economic Development in Africa, March 2007, Oxford, UK.
Potts, D. (2006) Restoring Order? Operation Murambatsvina and the Urban Crisis in
Zimbabwe. Journal of Southern African Studies 32(2).
Richardson, C.J. (2007) How much did droughts matter? Linking rainfall and GDP
growth in Zimbabwe. African Affairs 106 (424), p.463-478.
Scoones, I. (2008) A new start for Zimbabwe? Challenging the myths about
Zimbabwean Agriculture and Land Reform.
https://cms.ids.ac.uk/UserFiles/file/news/2008/A%20new%20start%20for%20Zimbab
we.pdf
Sukume, C (nd) Agrarian Transformation and Emerging Constraints: A case study of
Shamva District. University of Zimbabwe; Department of Agricultural Economics
and Extension in collaboration with Shamva Rural District Council.
UNICEF (2009) Zimbabwe crisis worsens: nearly all of rural schools closed. UNICEF
Newsnote, 10 February 2009. http://www.unicef.org/media/media_47915.html
World Bank, The (2007) Interim Strategy Note FY 2008-2009 for The Republic of
Zimbabwe. Washington D.C.
Zimbabwe, Government of (2004) Zimbabwe Millenium Development Goals, 2004
Progress Report. Harare: Government of Zimbabwe with support from UNDP.

16
Figure 1. Annual Real GDP Growth Africa and Zimbabwe 1980-2007
Source: IMF WEO, 2008
Figure 2: location of the research sites in Zimbabwe

17
Table 1. Characteristics of the sample
Village Natural Region
Settlement Type Number of HH
Mudzinge II Mufpurudzi Resettlement
10
Muringamombe II Mupfurudzi Resettlement
11
Chichera II Communal Area 17
Rundu III Sengezi Resettlement 10
Mungo III Sengezi Resettlement 10
Sengenda III Communal Area 17
Total 75
Table 2. Key indicators on selection of sub-sample
Characteristics 2000 Sub-
sample ZRHDS-sample
Sig. diff in means
Household Size 7.700 8.552 0.185
Acreage under cultivation 4.820 5.755 0.012
Acreage under food crops 3.670 4.050 0.389
Acreage under cash crops 1.150 1.700 0.060
Crop diversity 3.010 2.941 0.543
Number of non-crop activities 2.630 2.493 0.428
Livestock holdings 5.024 6.316 0.062

18
Table 3. Descriptive statistics key indicators 2000-2007.
Sample Region 3 Region 2 Resettled Communal
Household Size
2000 7.700 6.135 9.240 8.850 6.320
2007 7.370 6.970 7.760 7.750 6.910
Sign. 0.495 0.133 0.060 0.144 0.155
Proportion members 2000 left
2007 0.356 0.310 0.400 0.370 0.350
Sign. 0.090 0.700
New household members
2007 0.220 0.270 0.190 0.170 0.300
Sign. 0.003 0.000
Acreage under cultivation
2000 4.82 4.62 5.04 5.83 3.63
2007 5.49 4.48 6.48 7.43 3.15
Sign. 0.167 0.823 0.050 0.015 0.254
Acreage under food crops
2000 3.67 4.49 2.84 4.1 3.11
2007 4.45 4.4 4.51 5.83 2.79
Sign. 0.093 0.876 0.014 0.017 0.403
Acreage under cash crops
2000 1.15 0.13 2.2 1.73 0.51
2007 1.04 0.08 1.97 1.6 0.37
Sign. 0.773 0.609 0.73 0.838 0.597
Crop diversity
2000 3.01 3.14 2.89 3.32 2.64
2007 3.09 2.76 3.42 3.46 2.65
Sign. 0.674 0.163 0.04 0.604 0.963
Number of non-crop activities
2000 2.630 2.170 3.080 2.950 2.240
2007 1.640 1.780 1.500 1.410 1.910
Sign. 0.000 0.233 0.000 0.000 0.316
Livestock holdings
2000 5.024 3.888 5.901 5.594 4.083
2007 3.945 3.408 4.469 5.012 2.659
Sign. 0.136 0.616 0.182 0.597 0.094
Sign: significance level two-tailed ttest

19
Table 4 Probit regression on leaving the household after 2000
coef t
Individual Characteristics
Female=1 0.359*** (4.569)
Age 0.025 (1.329)
Age-sq -0.000 (-1.398)
Yrs of schooling 0.190*** (3.581)
Yrs of schooling-sq -0.006 (-1.447)
Married child 1.272*** (6.654)
Household Characteristics
Household size 2000 -0.045 (-0.886)
Household size 2000-sq 0.004** (2.030)
Number of migrants 2000 -0.109*** (-2.712)
Cattle wealth 2000 -0.007 (-0.325)
Acreage under crops 2000 0.035 (1.352)
Cashcrop orientation 2000 -0.238*** (-2.802)
Memberships in local associations 2000 -0.021 (-0.947)
Number of blood relatives in the village 2000 -0.012 (-0.816)
Characteristics of the area
Natural Region 2=1 0.844*** (7.950)
Communal Area=1 0.638*** (3.155)
Observations 697
R-squared 0.270
note: .01 - ***; .05 - **; .1 - *;
Village f.e. included
20
Table 5: Regressions on changes in crop cultivation and cattle wealth
∆ acreage ∆ food crops ∆ crops ∆ cattle wealth
coef/t coef/t coef/t coef/t
Communal Area=1 -4.301** -2.365** 0.064 -1.802
(-3.980) (-3.429) (0.189) (-0.972)
Natural Region 2=1 0.875 -0.054 0.239 2.583**
(0.966) (-0.083) (0.415) (3.197)
No. of new household members 0.116 0.074 -0.001 0.089
(1.992) (1.722) (-0.027) (0.432)
Number of people left after 2000 0.178** 0.177* -0.046 -0.098
(2.709) (2.398) (-1.124) (-0.459)
Cash crop orientation 2.168** 2.500* 0.030 -0.750
(3.326) (2.338) (0.068) (-0.405)
Changes in cattle wealth 2000-7 0.143 0.125 -0.003
(1.634) (1.801) (-0.070)
Acreage under cultivation 2000 -0.928*** -0.090
(-5.208) (-0.583)
Acreage under food crops 2000 -0.790***
(-6.108)
Acreage under cash crops 2000
Diversity of crops 2000 -0.804**
(-4.022)
Cattle wealth 2000 -0.316*
(-2.511)
Observations 75 75 75 75
R-squared 0.520 0.770 0.530 0.260
note: .01 - ***; .05 - **; .1 - *;
Including village f.e.


