Embed Size (px)
Citation preview

Journal of Colloid and Interface Science 321 (2008) 242–250www.elsevier.com/locate/jcis
Loading–unloading of an elastic–plastic adhesive spherical microcontact
Y. Kadin, Y. Kligerman, I. Etsion ∗
Department of Mechanical Engineering, Technion–Israel Institute of Technology, Technion City, Haifa 32000, Israel
Received 9 November 2007; accepted 29 December 2007
Available online 13 February 2008
Abstract
A numerical solution is presented for a single load–unload cycle of an adhesive contact between an elastic–plastic sphere and a rigid flat.The interacting forces between the sphere and the flat are obtained through connecting nonlinear spring elements having force-displacementbehavior that obeys the Lennard-Jones potential. Kinematic, rather than isotropic, hardening is assumed for the sphere material to account forpossible secondary plastification during the unloading. The well-known Tabor parameter and a plasticity parameter are shown to be the two maindimensionless parameters governing the problem. The effects of these two parameters on the load-approach curves, on the plastically deformedsphere profiles, and on the plastic strain fields inside the sphere are presented, showing different modes of separation during the unloading.© 2008 Elsevier Inc. All rights reserved.
Keywords: Adhesion; Surface forces; Lennard-Jones potential; Elastic–plastic contact; Load–unload cycle; Ductile separation; Kinematic hardening
1. Introduction
Cycling contacts with significant effects of adhesion arewidely found in different engineering applications, especially inmodern technology such as MEMS microswitches, AFM sys-tems, and magnetic storage devices. Considering adhesion inthe modeling of such contacts that also experience surface de-formation is a challenging and complicated endeavor.
The first contact model by Hertz (see, e.g., [1], p. 84) treatedelastic nonadhesive spheres and that by Bradley [2] consideredadhesive interaction of absolutely rigid spheres. The pioneer-ing works on adhesive contact between elastic spheres weredone by Johnson et al. [3] (the JKR model) and by Derjaguinet al. [4] (the DMT model). According to the JKR model theelastic deformation of the sphere caused by adhesion forms a“neck” at the contact zone to which all the surface forces areconfined. The surface-force distribution varies from compres-sion near the center of the contact zone to infinite attractionat the edge of the neck. The DMT model, on the other hand,assumes that adhesion is too weak to alter the sphere profileand hence its deformation is fully governed by the compres-sive Hertzian force distribution (see, e.g., [1], p. 65) inside the
* Corresponding author.E-mail address: [email protected] (I. Etsion).
0021-9797/$ – see front matter © 2008 Elsevier Inc. All rights reserved.doi:10.1016/j.jcis.2007.12.046
contact zone while the attractive surface forces act only outsidethe contact. Both the JKR and the DMT models are not univer-sal and, as was stated by Tabor [5], they describe two limitingcases. While the JKR model may well describe the behaviorof large and soft spheres, the DMT model is more suitable forsmall and hard spheres. A dimensionless parameter, μ, havingthe form
(1)μ =[R∗(�γ )2
E∗2ε3
]1/3
was suggested by Tabor as a criterion that characterizes theabove two limiting cases. The parameter μ (also known as theTabor parameter) is in fact the ratio of the neck height (formedin the JKR model) over the equilibrium interatomic distance, ε.Hence, large values of μ correspond to the JKR case whilesmall values correspond to the DMT case. The parameters E∗and R∗ in Eq. (1) are the equivalent elastic modulus and equiv-alent radius of the two contacting spheres, respectively, givenby
(2)E∗ =[(1 − ν2
1)
E1+ (1 − ν2
2)
E2
]−1
and
(3)R∗ =(
1 + 1)−1
,
R1 R2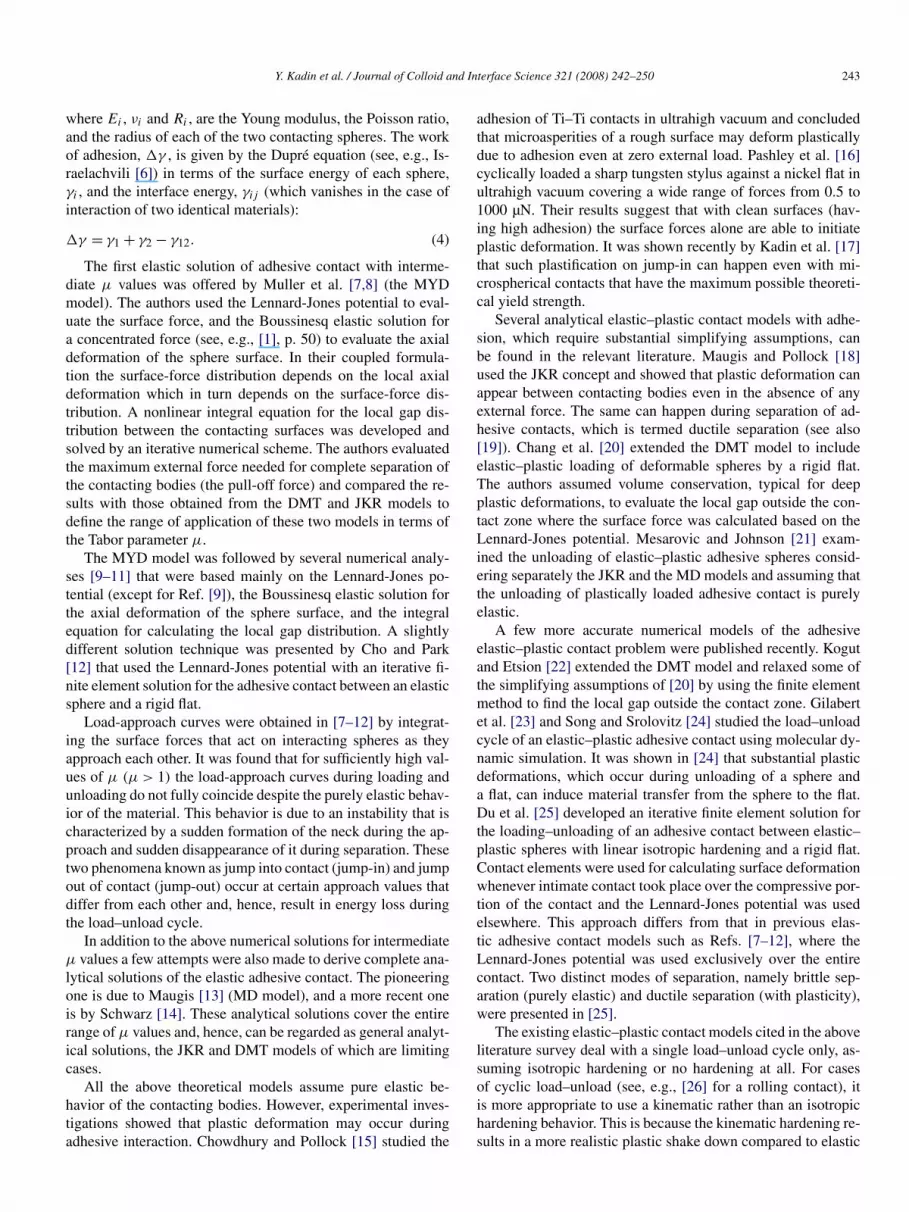
Y. Kadin et al. / Journal of Colloid and Interface Science 321 (2008) 242–250 243
where Ei , νi and Ri , are the Young modulus, the Poisson ratio,and the radius of each of the two contacting spheres. The workof adhesion, �γ , is given by the Dupré equation (see, e.g., Is-raelachvili [6]) in terms of the surface energy of each sphere,γi , and the interface energy, γij (which vanishes in the case ofinteraction of two identical materials):
(4)�γ = γ1 + γ2 − γ12.
The first elastic solution of adhesive contact with interme-diate μ values was offered by Muller et al. [7,8] (the MYDmodel). The authors used the Lennard-Jones potential to eval-uate the surface force, and the Boussinesq elastic solution fora concentrated force (see, e.g., [1], p. 50) to evaluate the axialdeformation of the sphere surface. In their coupled formula-tion the surface-force distribution depends on the local axialdeformation which in turn depends on the surface-force dis-tribution. A nonlinear integral equation for the local gap dis-tribution between the contacting surfaces was developed andsolved by an iterative numerical scheme. The authors evaluatedthe maximum external force needed for complete separation ofthe contacting bodies (the pull-off force) and compared the re-sults with those obtained from the DMT and JKR models todefine the range of application of these two models in terms ofthe Tabor parameter μ.
The MYD model was followed by several numerical analy-ses [9–11] that were based mainly on the Lennard-Jones po-tential (except for Ref. [9]), the Boussinesq elastic solution forthe axial deformation of the sphere surface, and the integralequation for calculating the local gap distribution. A slightlydifferent solution technique was presented by Cho and Park[12] that used the Lennard-Jones potential with an iterative fi-nite element solution for the adhesive contact between an elasticsphere and a rigid flat.
Load-approach curves were obtained in [7–12] by integrat-ing the surface forces that act on interacting spheres as theyapproach each other. It was found that for sufficiently high val-ues of μ (μ > 1) the load-approach curves during loading andunloading do not fully coincide despite the purely elastic behav-ior of the material. This behavior is due to an instability that ischaracterized by a sudden formation of the neck during the ap-proach and sudden disappearance of it during separation. Thesetwo phenomena known as jump into contact (jump-in) and jumpout of contact (jump-out) occur at certain approach values thatdiffer from each other and, hence, result in energy loss duringthe load–unload cycle.
In addition to the above numerical solutions for intermediateμ values a few attempts were also made to derive complete ana-lytical solutions of the elastic adhesive contact. The pioneeringone is due to Maugis [13] (MD model), and a more recent oneis by Schwarz [14]. These analytical solutions cover the entirerange of μ values and, hence, can be regarded as general analyt-ical solutions, the JKR and DMT models of which are limitingcases.
All the above theoretical models assume pure elastic be-havior of the contacting bodies. However, experimental inves-tigations showed that plastic deformation may occur duringadhesive interaction. Chowdhury and Pollock [15] studied the
adhesion of Ti–Ti contacts in ultrahigh vacuum and concludedthat microasperities of a rough surface may deform plasticallydue to adhesion even at zero external load. Pashley et al. [16]cyclically loaded a sharp tungsten stylus against a nickel flat inultrahigh vacuum covering a wide range of forces from 0.5 to1000 µN. Their results suggest that with clean surfaces (hav-ing high adhesion) the surface forces alone are able to initiateplastic deformation. It was shown recently by Kadin et al. [17]that such plastification on jump-in can happen even with mi-crospherical contacts that have the maximum possible theoreti-cal yield strength.
Several analytical elastic–plastic contact models with adhe-sion, which require substantial simplifying assumptions, canbe found in the relevant literature. Maugis and Pollock [18]used the JKR concept and showed that plastic deformation canappear between contacting bodies even in the absence of anyexternal force. The same can happen during separation of ad-hesive contacts, which is termed ductile separation (see also[19]). Chang et al. [20] extended the DMT model to includeelastic–plastic loading of deformable spheres by a rigid flat.The authors assumed volume conservation, typical for deepplastic deformations, to evaluate the local gap outside the con-tact zone where the surface force was calculated based on theLennard-Jones potential. Mesarovic and Johnson [21] exam-ined the unloading of elastic–plastic adhesive spheres consid-ering separately the JKR and the MD models and assuming thatthe unloading of plastically loaded adhesive contact is purelyelastic.
A few more accurate numerical models of the adhesiveelastic–plastic contact problem were published recently. Kogutand Etsion [22] extended the DMT model and relaxed some ofthe simplifying assumptions of [20] by using the finite elementmethod to find the local gap outside the contact zone. Gilabertet al. [23] and Song and Srolovitz [24] studied the load–unloadcycle of an elastic–plastic adhesive contact using molecular dy-namic simulation. It was shown in [24] that substantial plasticdeformations, which occur during unloading of a sphere anda flat, can induce material transfer from the sphere to the flat.Du et al. [25] developed an iterative finite element solution forthe loading–unloading of an adhesive contact between elastic–plastic spheres with linear isotropic hardening and a rigid flat.Contact elements were used for calculating surface deformationwhenever intimate contact took place over the compressive por-tion of the contact and the Lennard-Jones potential was usedelsewhere. This approach differs from that in previous elas-tic adhesive contact models such as Refs. [7–12], where theLennard-Jones potential was used exclusively over the entirecontact. Two distinct modes of separation, namely brittle sep-aration (purely elastic) and ductile separation (with plasticity),were presented in [25].
The existing elastic–plastic contact models cited in the aboveliterature survey deal with a single load–unload cycle only, as-suming isotropic hardening or no hardening at all. For casesof cyclic load–unload (see, e.g., [26] for a rolling contact), itis more appropriate to use a kinematic rather than an isotropichardening behavior. This is because the kinematic hardening re-sults in a more realistic plastic shake down compared to elastic

244 Y. Kadin et al. / Journal of Colloid and Interface Science 321 (2008) 242–250
shake down with isotropic hardening [26]. In anticipation of fu-ture study of multiple load–unload cycles of adhesive sphericalcontacts there is room for a refinement of the current modelsby applying the more realistic hardening. In addition, the morephysical and straightforward Lennard-Jones potential can beapplied over the entire contact zone, similar to its applicationin some of the purely elastic contact models.
The main goal of the current work is therefore to develop arealistic model for a single loading–unloading cycle of an adhe-sive microcontact between an elastic–plastic sphere and a rigidflat. The sphere material in this model will have kinematic hard-ening behavior and the surface interaction will be exclusivelybased on the Lennard-Jones potential.
2. The adhesive contact problem
A schematic representation of the problem is shown inFig. 1. An original, yet undeformed, hemisphere (the dashedline) has an initial approach, ω, which denotes the distance be-tween the summit of the undeformed hemisphere and a rigidflat. In this case Eqs. (2) and (3) are reduced to E∗ = E/(1−ν2)
and R∗ = R. The base of the hemisphere is clamped but itsspherical surface is allowed to deform (the solid lines) due tosurface atomic interaction. Negative values of ω correspond toa gap between the undeformed sphere and the rigid flat, whilepositive values correspond to an interference between them.
The surface atomic interaction is governed by the Lennard-Jones potential [6]. Hence, the local traction, p(r), between theapproaching surfaces, at a radial location r is given by
(5)p(r) = 8�γ
3ε
{[ε
h(r)
]3
−[
ε
h(r)
]9}
.
(a)
(b)
Fig. 1. Schematic of the adhesive contact between a deformable sphere and arigid flat for two cases: (a) without a neck, and (b) with a neck.
Here h(r) is the local distance between the deformed spheresurface and the rigid flat (see Fig. 1). Note that the first termin Eq. (5) corresponds to attraction between the surfaces, andthe second term to repulsion. When the local separation h(r) issmaller than the equilibrium interatomic distance, ε, the short-range repulsive forces prevail and the local traction p(r) be-comes negative. Otherwise, when h(r) is larger than ε the at-traction forces dominate and the local traction p(r) is positive.Note that an essential feature of the adhesive contact problem,formulated by the Lennard-Jones potential, is the ever positivegap, h(r), due to extremely strong repulsive forces as the gapapproaches zero.
The nonlinear relation between the local traction, p(r), andthe local separation, h(r), can be simulated by continuouslydistributed imaginary nonlinear springs that connect the spheresurface to the rigid flat (see Fig. 2 and Section 3). Each springapplies a pointwise force to the sphere in accordance to its ex-tension. Assuming that ε is the free length of each spring andusing Eq. (5), the differential local force, dF(r), due to a springelongation, �(r), at a radial coordinate, r , is
dF(r) = 2πr8�γ
3ε
[(�(r) + 1
)−3 − (�(r) + 1
)−9]
dr,
(6)�(r) = h(r)
ε− 1.
The material of the sphere is assumed elastic linear kinematichardening with a tangent modulus ET that is 2% of the Young’smodulus E. This linear hardening significantly improves con-vergence compared to an elastic perfectly plastic material with-out causing any significant change in the results even up toET = 5%. The von Mises yielding criterion is used to detect lo-cal transition from elastic to plastic deformation, and the Hookeand the Prandtl Reuss constitutive laws govern the stress-strainstate in the elastic and plastic deformation zones, respectively.
Fig. 2. Schematic of the finite element model.

Y. Kadin et al. / Journal of Colloid and Interface Science 321 (2008) 242–250 245
Depending on the values of the Tabor parameter μ (seeEq. (1)) and the approach ω the sphere can deform either with-out a neck when μ < 1 (Fig. 1a), or with a neck when μ > 1having a radius a (Fig. 1b). The deformations of the sphere inthe first case are rather small compared to the larger ones in thesecond case when a neck is formed during loading at jump-inand is sustained during unloading until jump-out. We shall de-note by ωin and ωout the values of ω for which the jump-in andjump-out occur, respectively.
3. The finite element model
A commercial ANSYS 9.0 package was used to solve theaxisymmetrical (2D) elastic–plastic adhesive contact problemusing only one-half of the axisymmetric hemisphere section.A nonlinear finite deformation definition (NLGEOM com-mand), corresponding to Lagrangian strain formulation, wasused to accommodate large strains.
The model, shown in Fig. 2 was meshed with 9500 six-nodetriangular axisymmetrical elements (PLANE183) comprising atotal of 19330 nodes. Note that during the sphere–flat interac-tion the highest stresses and plastification occur in the vicinityof the sphere summit. Therefore, the sphere was divided intotwo nonequal mesh density zones, where zone I covers the dis-tances of 0.15R from the sphere summit and zone II is outsidethe 0.15R distance. Zone I has a fine mesh with equal distancesbetween two neighboring nodes on the surface of the sphereto accommodate the springs that apply the local traction p(r)
between the sphere and the rigid flat (see Fig. 2). Zone II con-sists of gradually coarser mesh at increasing distance from thesummit. The nodes located on the base of the hemisphere areconstrained in the vertical and radial directions and the nodeson the axis of symmetry are constrained in the radial direction.
The common barrier method, often used in computationalcontact mechanics to prevent penetration of two contacting bod-ies by employing springs between them, has been modified toprovide a force-gap relation that is dictated by the Lennard-Jones potential. Unidirectional two-node elements represent-ing springs with nonlinear force-deflection capability (COM-BIN39) were used in the current finite element analysis to sim-ulate Eq. (6). Each one of the surface nodes corresponding tozone I is connected to one of the two nodes of such a springelement (see Fig. 2), which has a free length, ε. Hence, in theabsence of any surface force the free nodes of the undistortedsprings are located at a uniform distance ε from the undeformedsphere surface as shown in Fig. 2a. In order to simulate theactual sphere–flat interaction the previously free nodes of thesprings are attached to the rigid flat situated at the distance ω
from the summit of undeformed sphere as shown in Fig. 2b.A displacement control formulation was used for the numericalsolution by which the approach, ω, between the rigid flat andthe sphere represents the input parameter of the problem.
The validity of the finite element model was verified by com-paring its load-approach results for a purely elastic adhesivecontact with the results of Ref. [11] for the same value of μ.Good agreement (within about 3% differences) was found be-tween the two models. Gradual increase of the mesh density
until the difference in the load-approach results for successivedensity levels became less than 5% was used to validate the fi-nite element model in the elastic–plastic regime.
4. Results and discussion
Previous studies of pure elastic adhesive contact (e.g., [7])showed that the dimensionless load-approach curves are solelydependent on the dimensionless Tabor parameter μ. In ourpresent elastic–plastic case we found, similar to the finding in[25], that yet another dimensionless parameter, S, also plays animportant role. This parameter, which we denote as the plastic-ity parameter, is defined here by the ratio
(7)S = �γ
εY0,
where �γ/ε is a natural adhesive stress, and Y0 is the virginyield strength of the sphere material. Large values of S corre-spond to considerable plastic deformations in the contact zonewhile small values of S to mostly elastic ones. Note that in Refs.[21,25] the material hardness, H , instead of its yield strength,Y0, was used to define the plasticity parameter S. An additionaldimensionless parameter, ωmax/ε, representing the maximumapproach from which the unloading begins is involved in the un-loading stage of the dimensionless load-approach curves. ThePoisson’s ratio, ν, was found to have only a negligible effectin the range of 0.3 � ν � 0.42. To demonstrate the effect ofthe above dimensionless parameters, several numerical simu-lations were performed for μ = 1.0 and 1.6, S = 1.6 and 2.8,ωmax/ε = 0,2, and 4, and a single value of ν = 0.42. These val-ues represent typical micro/nanocontact applications such as,for example, gold nanospheres with a typical radius of 300 nm,E = 80 GPa, typical energy of adhesion �γ = 1 J/m2, andequilibrium interatomic distance ε = 0.3 nm, in contact witha rigid flat. The yield strength of such nanoscale spheres canbe much higher than the engineering strength of the mater-ial (see, e.g., [27]). Hence, 1.2 � Y0 � 2 GPa was selected tocover the range of gold microsphere strength (see [28]). A sim-ilar case of a spherical gold microcontact was studied in [25]but with a sphere radius of 1 µm and a lower yield strength ofY0 = 0.67 GPa.
Fig. 3 shows the deformed sphere profiles (compared tothe undeformed original profile shown by the dashed line) forthe case of μ = 1 and S = 2.8 at three specific approach val-ues during one loading–unloading cycle. These are ω = ωin atjump-into contact, ω = ωmax = 4ε at the maximum loading, andω = ωout at jump-out of contact. Both the vertical and the radialcoordinates are scaled by the original radius of the sphere, R. Atω = ωin the entire sphere surface is subjected to attraction anda neck is formed. At maximum loading ω = ωmax = 4ε most ofthe contact zone is subjected to repulsion, except its peripheralpart which is still subjected to adhesive attraction. A somewhatdifferent sphere profile compared to the one at ωin is evident atω = ωout. This is due to plastic deformation during the loadingstage, which results in a small residual secondary neck duringthe unloading close to the radial location of the periphery of thecontact zone at the maximum loading. A similar residual neckwas also observed in [24].

246 Y. Kadin et al. / Journal of Colloid and Interface Science 321 (2008) 242–250
Fig. 3. Profiles of the deformed sphere during the loading–unloading cycle(μ = 1, S = 2.8, ωmax/ε = 4).
Fig. 4 presents the von Mises plastic strain field inside thesphere corresponding to the three specific approach values andthe same case of μ = 1 and S = 2.8 that is shown in Fig. 3.Prior to the jump into contact the sphere deformations werepurely elastic. The first appearance of a small plastic region (seeFig. 4a) with up to 1% plastic strain occurs instantaneously to-gether with the jump into contact and is located close to the pe-riphery of the neck (see also [17,25]). With further approach theplastic region propagates and intensifies and at ω = ωmax = 4ε
a plastic strain of up to 4.5% can be observed (see Fig. 4b)near the periphery of the contact zone. The extent of the plas-tic region at maximum loading is maintained, with some smallchanges, during the unloading as shown in Fig. 4c at ω = ωout,clearly indicating ductile separation that was also predicted inprevious works [18,19,24,25].
When making a comparison of the present results with thoseof Ref. [25], for example, the differences in defining the di-mensionless approach should be noted. In [25] ω is normalizedby the critical interference, ωc, that marks plastic inception innonadhesive spherical contacts [29]. The adhesive gold con-tact in [25] was loaded up to 30ωc and extremely high levelof plasticity (maximum stress of over 2Y0) was achieved duringunloading just before the jump out of contact. Since the mate-rial hardening in [25] was only ET/E = 0.02 the high level ofplasticity must be a result of very large deformation during theunloading.
Using the expression for ωc provided in [29] we have
(8)ωc =(
πKH
2E∗
)2
R,
where H = 2.8Y0, and K = 0.454+0.41ν. Substituting Eq. (1)for E∗ and Eq. (7) for Y0 in Eq. (8) yields
(9)ωc = (1.4πK)2 μ3
S2ε.
From Eq. (9) it is easy to see that for the case of ν = 0.42,μ = 1, and S = 2.8, the critical interference is ωc ≈ ε. Hence,the maximum approach of 4ε in our case corresponds to only
Fig. 4. Von Mises plastic strain fields during the loading–unloading cycle forspecific values of ω: (a) ω = ωin, (b) ω = ωmax = 4ε, and (c) ω = ωout(μ = 1, S = 2.8, ωmax/ε = 4).
about 4ωc (compared to 30ωc in [25]). This small approach,which in nonadhesive contacts would cause very small plastic-ity (see, e.g., [30]), is sufficient in the presence of adhesion tocause large amounts of plastic deformations as shown in Fig. 4.
Fig. 5 shows the variations of the central gap, h0, at r = 0(see Fig. 1) and the corresponding radius of curvature, R′, atthe same radial location, vs the approach for the case of μ = 1,S = 2.8, and ωmax/ε = 4. Note that the results shown in the fig-ure are limited to the approach values during the load–unloadcycle when the sphere surface is exposed to attractive forcesonly, namely prior to the jump-in during loading (solid lines),and following the jump-out, during unloading (dashed lines).From the instance of forming of the neck at ωin until the jump-

Y. Kadin et al. / Journal of Colloid and Interface Science 321 (2008) 242–250 247
Fig. 5. Variations of the dimensionless central gap, h0/ε, and the radius of cur-vature, R′/R, vs the dimensionless approach prior to jump-in during loading,and following the jump-out during unloading (μ = 1, S = 2.8, ωmax/ε = 4).
out at ωout, the central gap remains very close to ε and the radiusof curvature is almost infinite (e.g., Fig. 1b); hence, this partof the load–unload cycle is omitted from Fig. 5. At the earlystage of the approach and up to ω/ε of about −2.8 the cen-tral gap decreases proportionally to the increasing approach.Thereafter, the decrease of the central gap is accelerated dueto larger deformation of the sphere until the sudden jump-in oc-curs and h0 decreases abruptly from about 2ε to ε. Due to itsattraction to the flat during the early loading phase, the spheredeforms into an “egg-like” shape and thus, its radius of curva-ture decreases slightly but it suddenly becomes almost infinite(not shown in the figure) when the neck is formed at ωin. Dur-ing the unloading after the jump-out both the central gap andthe radius of curvature are larger than what they were duringthe loading at the same values of ω/ε. This is due to residualplastic deformation which prevents the unloaded sphere fromrestoring its previous shape from the loading phase, similar tothe behavior of nonadhesive contacts [31]. The residual plasticdeformation also results in a residual interference (as in [31]),which reduces the original height of the sphere, causing the ap-proach during jump-out to be higher than the approach duringjump-in as clearly observed in Fig. 3.
Fig. 6 shows the dimensionless neck radius, a/ε, vs the ap-proach for μ = 1, S = 2.8, and ωmax/ε = 4. The neck existsfollowing the jump-in during the loading (solid lines) and priorto jump-out during the unloading (dashed line) and hence, onlythat portion of the load–unload cycle is shown in Fig. 6. Aswould be expected, the radius of the neck (which can also beinterpreted as the contact area radius) increases monotonicallywith the increase of the approach. During the initial stage ofthe unloading from ωmax/ε = 4 down to ω/ε = 1 the decreaseof the neck radius is very slow followed by a steep decreasefor ω/ε < 1. This behavior demonstrates strong sticking of theneck to the retracting rigid flat, due to high adhesion at its pe-riphery, when unloading begins. As the unloading continuesthe bond between the neck and the flat brakes and a decreasesrapidly.
Fig. 6. Dimensionless radius of the neck, a/ε, vs the dimensionless approachfollowing the jump-in during loading, and prior to jump-out during unloading(μ = 1, S = 2.8, ωmax/ε = 4).
Fig. 7. Dimensionless external force vs the dimensionless approach during sin-gle loading–unloading cycles for different maximum loading values (μ = 1,S = 2.8).
Fig. 7 presents the total force acting between the sphere andthe flat, normalized by the DMT pull-off force 2πR�γ (see,e.g., [8]), as a function of the dimensionless approach (our inputfor the displacement control), for the case of μ = 1 and S = 2.8.Negative values of the force correspond to attraction betweenthe sphere and the flat while positive force values correspond torepulsion between them. Note that the force presented in Fig. 7is the external force required to maintain a given approach be-tween the two bodies. The solid and the dashed lines shown inFig. 7 correspond to the loading and unloading portions, respec-tively, of the load–unload cycle.
As shown in Fig. 7, with increasing approach the loadingcurve becomes discontinuous when jump-in occurs at ωin ≈−2.7ε, and the attractive force increases abruptly. Further in-crease of the approach to ω ≈ −2ε continues to increase theattraction between the flat and the sphere to its maximum value
248 Y. Kadin et al. / Journal of Colloid and Interface Science 321 (2008) 242–250
Fig. 8. Dimensionless external force vs the dimensionless approach during asingle loading–unloading cycle (μ = 1, S = 1.6).
after which the attractive force decreases monotonically. Even-tually at ω = ε the attractive force vanishes, and the forcebecomes compressive when the repulsive part of the Lennard-Jones potential prevails for ω > ε (see Eq. (5)). The presentresults for the loading phase are compared in Fig. 7 with thepurely elastic solution of Ref. [11] (the open circles). Surpris-ingly, the two models give almost identical results despite theappreciable plastic deformation of the sphere material duringthe loading phase as seen in Fig. 4. Similar agreement of theload-approach results for purely elastic and for elastic–plasticloaded spheres was found in [23] up to Fe/2πR�γ = 5 forμ = 1.3 and S = 2.8.
The unloading curves shown in Fig. 7 depend strongly onωmax/ε. As this parameter increases, the loading and unload-ing curves become more distinct, and the pull-off force (theextremum of the unloading force) increases and shifts to alarger approach. This is due to increasing residual plastic defor-mations which result in larger residual interference and largerresidual radius of curvature of the unloaded sphere (see thediscussion of Fig. 5). A larger residual radius of curvature com-bined with a larger residual interference is responsible for alarger pull-off force at a corresponding larger approach.
Fig. 7 also shows that the maximum approach ωmax/ε affectsthe jump-out approach, ωout, during the unloading. It is interest-ing to note that with the lowest maximum loading, ωmax/ε = 0,the jump-out occurs at ωout < ωin, contrary to the two othercases with higher maximum loading where ωout > ωin. Thisdifference is due to the absence of considerable residual plas-tic deformations in the former case of a lightly loaded sphere.It clearly demonstrates the difference between purely elasticmodels (e.g., [11]) that neglect plasticity and, hence, always re-sult in ωout < ωin regardless of the loading level, and the moreaccurate present elastic–plastic model where plastic deforma-tions are considered. The unloading curves shown in Fig. 7 arequalitatively similar to these presented in Ref. [25]. However,since the resolution of the approach in our simulations is muchhigher, more details can be observed near the jump-out of con-
Fig. 9. Dimensionless external force vs the dimensionless approach duringa single loading unloading cycle for two different maximum loading values(μ = 1.6, S = 2.8).
tact in Fig. 7 compared to the results in [25]. While in [25] thejump-out of contact seems to occur at an approach that corre-sponds to the pull-off force (see Fig. 7 there), in our case itoccurs at an appreciably lower approach.
Fig. 8 shows the effect of reducing the plasticity parameterS from its previous value of S = 2.8 (see Fig. 7) to S = 1.6while maintaining the same Tabor parameter value μ = 1. Onlyone case of the load approach curve for maximum loading ofωmax/ε = 4 is presented as a typical example. As can be seenthe distinction between the loading and the unloading curvesis much smaller than in the previous case of S = 2.8 that ispresented in Fig. 7. This effect of S is comprehensible sincelower values of S correspond to higher yield strength materialswith less plastic deformation than in the case of softer material.The unloading curves for lower values of ωmax/ε are not shownin the figure because of their very slight distinction from theloading curve.
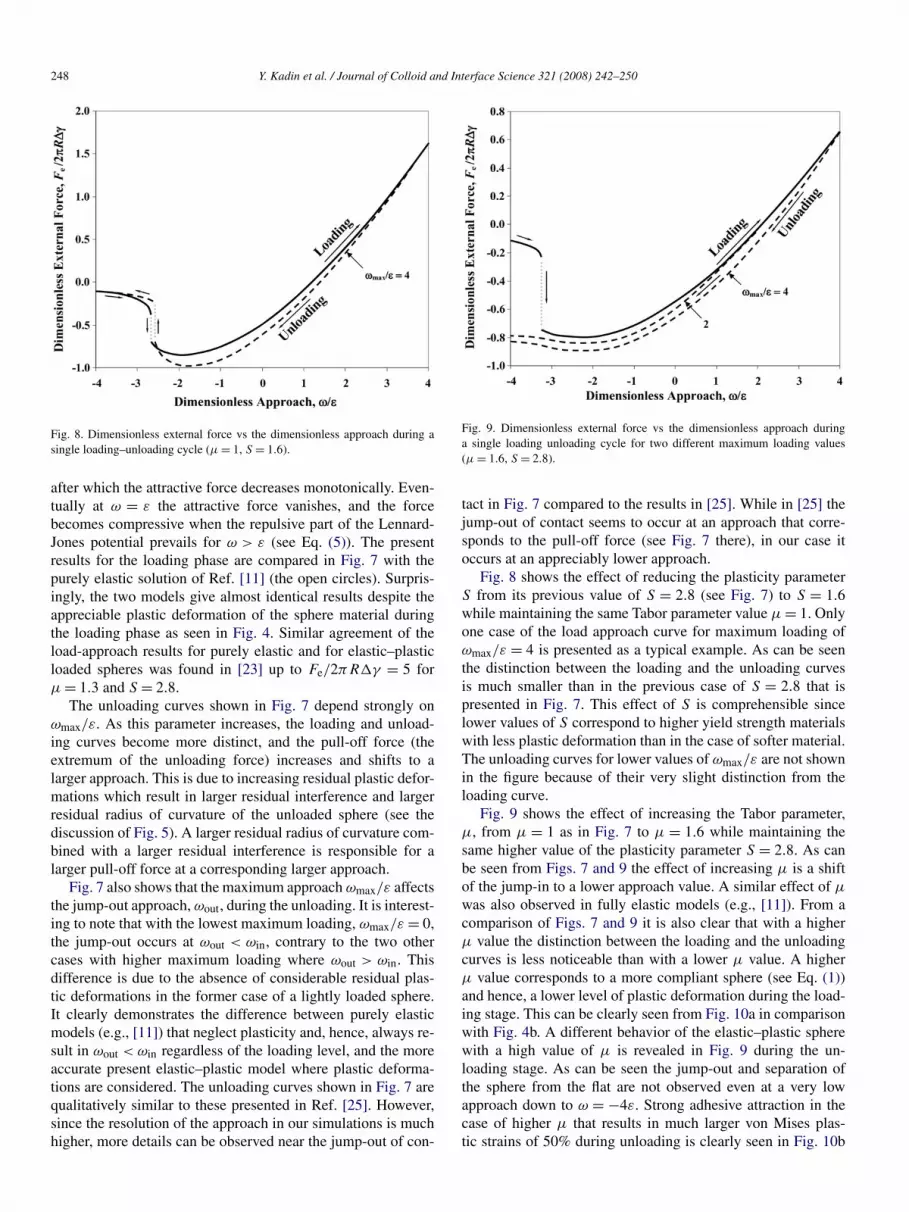
Fig. 9 shows the effect of increasing the Tabor parameter,μ, from μ = 1 as in Fig. 7 to μ = 1.6 while maintaining thesame higher value of the plasticity parameter S = 2.8. As canbe seen from Figs. 7 and 9 the effect of increasing μ is a shiftof the jump-in to a lower approach value. A similar effect of μ
was also observed in fully elastic models (e.g., [11]). From acomparison of Figs. 7 and 9 it is also clear that with a higherμ value the distinction between the loading and the unloadingcurves is less noticeable than with a lower μ value. A higherμ value corresponds to a more compliant sphere (see Eq. (1))and hence, a lower level of plastic deformation during the load-ing stage. This can be clearly seen from Fig. 10a in comparisonwith Fig. 4b. A different behavior of the elastic–plastic spherewith a high value of μ is revealed in Fig. 9 during the un-loading stage. As can be seen the jump-out and separation ofthe sphere from the flat are not observed even at a very lowapproach down to ω = −4ε. Strong adhesive attraction in thecase of higher μ that results in much larger von Mises plas-tic strains of 50% during unloading is clearly seen in Fig. 10b

Y. Kadin et al. / Journal of Colloid and Interface Science 321 (2008) 242–250 249
Fig. 10. Von Mises plastic strain fields during the loading–unloading cyclefor specific values of ω: (a) ω = ωmax = 4ε and (b) ω = −4ε (μ = 1.6,S = 2.8,ωmax/ε = 4).
in comparison with only 4.5% in Fig. 4c. The persistence ofthe neck at higher μ during unloading as observed in Fig. 9,which results in typical ductile separation, is clearly demon-strated in Fig. 11 when compared with Fig. 3. The simulationsshown in Fig. 9 were not carried out for approach values below−4ε due to high distortion of the elements at the periphery ofthe neck which may result in large errors (see [32]). However,it may be postulated that increased separation will eventuallycause neck rupture and material transfer from the sphere to theflat, as illustrated in Fig. 12 generated by molecular dynamicssimulations in [24]. It is interesting to observe in Fig. 9 thatthe absence of the jump-out phenomenon is common for bothhigh and low values of ωmax/ε and, hence, may be consideredindependent of this parameter. A possible explanation for thisbehavior at increasing μ values is the increased compliance ofthe sphere.
From Figs. 7–9 it is clear that the combination of the Taborparameter μ and the plasticity parameter S has a strong effecton the amount of hysteresis in the load–unload cycle. A low μ
combined with a high S produce more hysteresis than any otherpossible combination. Hence, from Eqs. (1) and (7) it can beseen that smaller radius R and higher elastic modulus E (high
Fig. 11. Profiles of the deformed sphere during the loading–unloading cycle(μ = 1.6, S = 2.8, ωmax/ε = 4).
sphere stiffness) combined with lower yield strength Y0 havemore plasticity in the form of hysteresis as would be expected.
Finally, Fig. 13 shows a comparison of the results obtained in[23] by using molecular dynamic simulations for a case of μ =0.7 and S = 2.3, with results obtained from our FE model forthe same case. A fairly good agreement can be seen during theloading phase but the unloading curves are noticeably different.
5. Conclusion
A numerical model for a single load–unload cycle of anelastic–plastic adhesive spherical microcontact was developed.Linear kinematic hardening was assumed for the sphere ma-terial and the Lennard-Jones potential was used exclusively toprescribe the interacting forces between a sphere and a rigidflat. This representation of the interaction between the contact-ing bodies is probably more realistic, from the physical point ofview, than using contact elements for the compressive portionof the contact.
It was shown that three dimensionless parameters governthe load–unload behavior of elastic–plastic adhesive contacts.These are the classical Tabor parameter, μ, a plasticity para-meter, S, and the maximum approach, ωmax/ε, from which theunloading begins. Load-approach curves for relatively small ap-proach values, close to the jump-into and -out of contact, werepresented for different values of the above three dimensionlessparameters. It was shown that large plastic deformations cantake place even with small maximum approach that is an orderof magnitude smaller than that considered in a previous similarwork.
It was found that additional plastic deformation can occurduring the unloading stage, indicating ductile separation, as waspredicted in some previous works. All the three dimensionlessparameters noted above have an apparent effect on the elastic–plastic behavior of the adhesive contact. Higher values of theplasticity parameter or the maximum approach combined with

250 Y. Kadin et al. / Journal of Colloid and Interface Science 321 (2008) 242–250
Fig. 12. Material transfer during the contact separation demonstrated by the molecular dynamics simulations of Ref. [24].
Fig. 13. Dimensionless external force vs the dimensionless approach duringa single loading unloading cycle for two different maximum loading values(μ = 0.7, S = 2.3).
low values of the Tabor parameter result in more intensive plas-tic deformations and more noticeable distinction between theloading and the unloading portion of the load–unload cycle.High values of the Tabor parameter may cause the unloadedsphere to remain bonded to the flat, avoiding the jump-out ofcontact and resulting in neck fracture.
References
[1] K.L. Johnson, Contact Mechanics, Cambridge Univ. Press, Cambridge,1985.
[2] R.S. Bradley, Philos. Mag. 13 (1932) 853–862.[3] K.L. Johnson, K. Kendall, A.D. Roberts, Proc. R. Soc. London A 324
(1971) 301–313.
[4] B.V. Derjaguin, V.M. Muller, Y.P. Toporov, J. Colloid Interface Sci. 53(1975) 314–326.
[5] D. Tabor, J. Colloid Interface Sci. 58 (1977) 2–13.[6] J.N. Israelachvili, Intermolecular and Surface Forces, second ed., Acad-
emic Press, San Diego, 1992.[7] V.M. Muller, V.S. Yuschenko, B.V. Derjaguin, J. Colloid Interface Sci. 77
(1980) 91–101.[8] V.M. Muller, V.S. Yuschenko, B.V. Derjaguin, J. Colloid Interface Sci. 92
(1980) 92–100.[9] P. Attard, J.L. Parker, Phys. Rev. A 46 (1992) 7959–7971.
[10] J.A. Greenwood, Proc. R. Soc. London A 453 (1997) 1277–1297.[11] J.Q. Feng, Colloids Surf. A 172 (2000) 175–198.[12] S.S. Cho, S. Park, Tribol. Int. 37 (9) (2004) 763–769.[13] D. Maugis, J. Colloid Interface Sci. 150 (1992) 243–269.[14] U.D. Schwarz, J. Colloid Interface Sci. 261 (2003) 99–106.[15] R.S.K. Chowdhury, H.M. Pollock, Wear 66 (1981) 307–321.[16] M.D. Pashley, J.B. Pethica, D. Tabor, Wear 100 (1984) 7–31.[17] Y. Kadin, Y. Kligerman, I. Etsion, J. Appl. Phys. 103 (2008) 013513.[18] D. Maugis, H.M. Pollock, Acta Metall. 32 (1984) 1323–1334.[19] K.L. Johnson, Proc. 4th IUTAM Congress, Amsterdam, North Holland,
1976, pp. 133–143.[20] W.R. Chang, I. Etsion, D.B. Bogy, J. Tribol. 110 (1987) 1–7.[21] S.D. Mesarovic, K.L. Johnson, J. Mech. Phys. Solids 48 (2000) 2009–
2033.[22] L. Kogut, I. Etsion, J. Colloid Interface Sci. 261 (2003) 372–378.[23] F.A. Gilabert, M.A.S. Quintanilla, A. Castellanos, J.M. Valverde, ZAMM
– Z. Angew. Math. Mech. 87 (2) (2007) 128–138.[24] J. Song, D.J. Srolovitz, Acta Mater. 54 (2006) 5305–5312.[25] Y. Du, L. Chen, N.E. McGruer, G.G. Adams, I. Etsion, J. Colloid Interface
Sci. 312 (2007) 522–528.[26] A.F. Bower, K.L. Johnson, J. Mech. Phys. Solids 37 (1989) 471–493.[27] A. Stalder, U. Dürig, Appl. Phys. Lett. 68 (1996) 637–639.[28] A. Kelly, Strong Solids, Clarendon, Oxford, 1973.[29] W.R. Chang, I. Etsion, D.B. Bogy, J. Tribol. 109 (1987) 257–263.[30] L. Kogut, I. Etsion, J. Appl. Mech. 69 (2002) 657–662.[31] I. Etsion, Y. Kligerman, Y. Kadin, Int. J. Solids Struct. 42 (2005) 3716–
3729.[32] H. Borouchaki, P. Laug, A. Cherouat, K. Saanouni, Int. J. Numer. Methods
Eng. 63 (2005) 1–36.


