Embed Size (px)
Citation preview
LOCAL
2005
HANDBOOK
ELECTIONS
Colin Rallings & Michael Thrasher
LOCAL ELECTIONS HANDBOOK
2005
The 2005 Local Election Results
Colin Rallings and Michael Thrasher
with the assistance of
Galina Borisyuk, Brian Cheal, Dawn Cole and Lawrence Ware
Local Government Chronicle Elections Centre
University of Plymouth
Local Elections Handbook 2005
© Colin Rallings and Michael Thrasher 2005
All rights reserved. No part of this publication may be reproduced,
stored in a retrieval system, or transmitted in any form or by any
means, electronic, mechanical, photocopying, recording, or
otherwise without the prior permission of the publishers.
Published by the Local Government Chronicle Elections Centre,
University of Plymouth,
Plymouth PL4 8AA
ISBN 0 948858 38 9
Distributed by: LGC Information,
Greater London House,
Hampstead Road,
London, NW1 7EJ
Table of Contents
Acknowledgements .......................................................................................... v
Introduction ..................................................................................................... vii
Using the Handbook ......................................................................................xvii
Aggregate Statistics for Local Authorities ......................................................... 1
County Council Election Results ................................................................... 15
Unitary Council Election Results .................................................................... 91
Tables............................................................................................................. 97

2
v
Acknowledgements
We are grateful, as always, for the response to our requests for
information by Returning Officers and Electoral Administrators . There is no
doubt that combining elections, as has been done for the last three general
elections, improves county council election turnout. It is seldom noted that it
also increases the stresses and strains on an already over-stretched local
government service. Few appreciate that conducting two elections
simultaneously, where the qualifications for voting are different, produces
limited economies of scale but lots of administrative headaches. This year
was made even more difficult by the media focus on increased postal voting
and the potential for electoral fraud. In our view, some of this attention bordered
on the irresponsible and imposed additional and uneccessary strains on those
ensuring the conduct of a free and fair election. Understandably, there were
some occasions after the election was over when our ‘simple request’ for a
small piece of missing information appeared to be the proverbial back-breaking
piece of straw. For this we can only apologise for our bad timing and hope
sincerely that no domestic animal suffered from misdirected frustration.
Our thanks also go to the Electoral Commission, which provided
support for our collection of data, principally that concerning the numbers
voting by post and in person. More electors are taking advantage of the
relaxation of rules and choosing to vote by post. Clearly, there remain issues
surrounding electoral registration and ballot security that need to be addressed
but good policy is invariably evidence based. Policy making in this vital area
of our democracy benefits from having the figures available for detailed
analysis.
We would also like to express our gratitude to David Cowling, Head of
BBC Political Research, for sharing his data on the mayoral elections. He
gives us data and we print an acknolwedgement; sounds like a fair exchange
to us.
vi
We never apologise for telling people that, compared with local
elections, the collection and collation of general election data are rather
straightforward processes. This year is an excellent example. The UK general
election consisted of contests for a mere 646 constituencies. By contrast,
there were elections for 2,217 contested wards or divisions. The amount of
data for each contest, parliamentary and local, is roughly the same and requires
the same level of attention to detail. For this reason we decided that the
people that help most in this work should emerge from the shadows and have
their names revealed in alphabetical order on the inside cover. Of course,
fame always has its price. So, instead of us thanking everyone we can think
of, whilst accepting the blame for any errors or ommissions etc., we’d like to
break with tradtion and invite Galina, Brian, Dawn and Lawrence to do that
instead.
Colin Rallings and Michael Thrasher
October 2005.
vii
Introduction
Local elections in 2005 were held in England for 34 county and 3 unitary
councils. These elections were held simultaneously with the UK general
election on May 5th. This is the third successive occasion that county and
general elections have been held on the same day (1997 and 2001 were the
previous two). In four authorities (Doncaster, Hartlepool, North Tyneside and
Stoke on Trent) an election was held for mayor whilst one unitary authority,
Isle of Wight, also conducted a referendum on the issue of an elected mayor.
The referendum was defeated, with 37,097 (56.3%) voting ‘No’ and 28,786
(43.7%) voting ‘Yes’. Details of the four mayoral elections are included below.
Boundary changes were implemented for county divisions. Since 1985,
all county divisions had been single-member, but these changes saw the
introduction of 143 two-member and 3 three-member divisions. The net effect
is a decrease in the number of divisions from 2,215 to 2,120. However, the
number of county councillors has increased by 54 taking the total of 2,269.
There were no boundary changes in the three unitary councils but the irregular
electoral cycle means that in only one, Isle of Wight, is the result comparable
to 2001.
Across England, elections were scheduled for a total of 2,217 divisions
(wards in the unitary authorities) and 2,396 seats. It has not proved possible
on this occasion to take account of boundary changes when calculating each
party’s seat gains and losses. A number of councils changed hands.
Northamptonshire was gained from Labour by the Conservative party but in
turn it lost Cornwall to the Liberal Democrats. No further councils were
exchanged directly between the parties. Six councils (Gloucestershire,
Oxfordshire, Shropshire, Suffolk, Worcestershire and the Isle of Wight) moved
from no overall control to Conservative majority administration. The Liberal
Democrats gained control of two more counties (Devon and Somerset, from
no overall control) whilst Labour lost its overall majority on Stockton-on- Tees
council.
viii
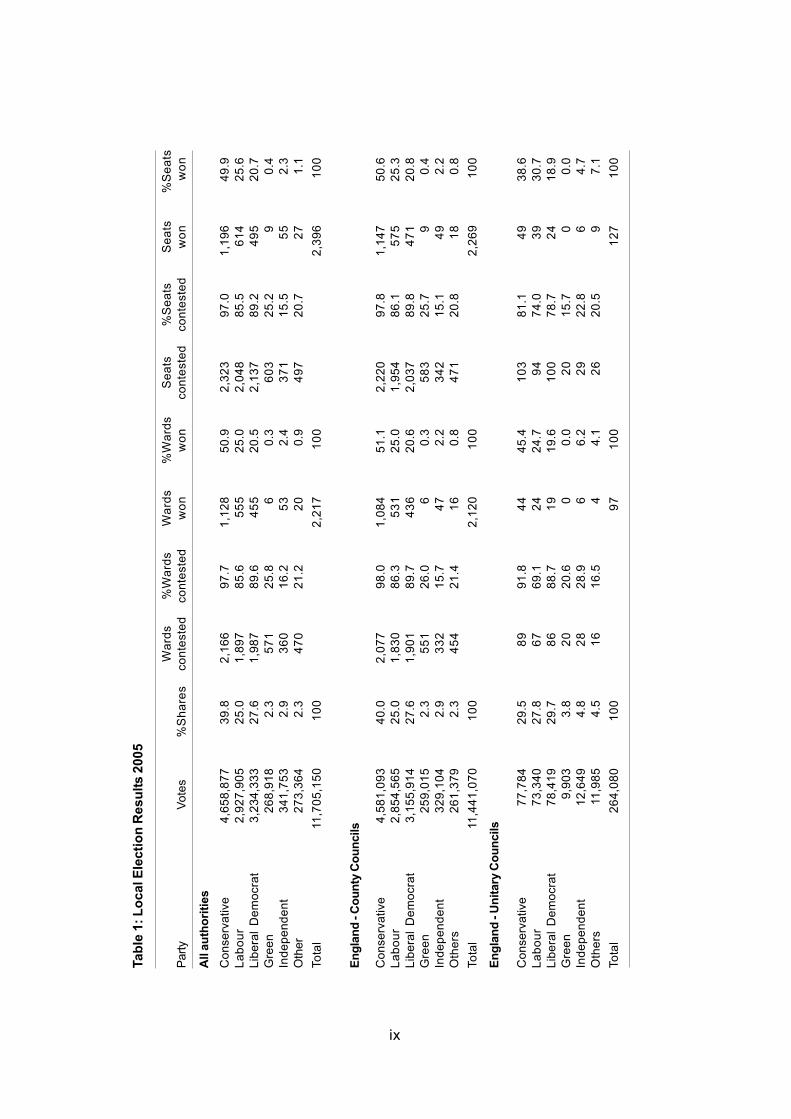
Table 1 provides the broad picture. The absence of urban local
authorities means that the Conservative party is particularly favoured in this
part of the local electoral cycle. More than four and a half million votes were
cast in its favour. Its overall vote share, 39.8%, placed it well ahead of the
second-placed Liberal Democrats, 27.6%. However, a comparison with the
previous county elections shows the limits of Conservative recovery. In 2001
the party polled 39.9% but in 2005 could only improve on that figure by a
meagre one tenth of one percentage point. Although the clear lack of progress
at the general election received considerable attention its failure to advance
at the local level is symptomatic of a party still struggling to recover its former
prominence. Labour’s own vote declined five points in the county elections
from 30.4% to a mere 25%. One possible point in mitigation is that it chose to
contest a smaller proportion of seats (85.6%) than four years earlier (92%).
Votes for Independent candidates were more or less static but there were
increases both for the Greens (from 1% in 2001 to 2.3% in 2005) whose
candidates challenged in one in four seats, and also for other minor parties
(0.8% to 2.3%).
The Conservative lead in votes is magnified when the distribution of
seats is examined. The party performed better than in 2001, winning a majority
of divisions (though it was fractionally short of taking the majority of seats)
and winning almost twice as many seats as Labour. For Labour the distribution
neatly reflected its vote share but the Liberal Democrat vote was not as
efficiently distributed. The party almost won 500 seats but its share of seats,
20.7%, was seven points lower than vote share. Despite attracting more
support the Green party won just nine seats overall, a share considerably
below its vote.
Some measure of Conservative lack of progress is highlighted by the
fact that in exactly half of the 34 county councils its vote fell (Conservative
optimists would, with justification, point out that in the other half its vote
increased!). The largest decrease took place in Nottingham (-3.2%) but in
Durham (where Liberal Democrats advanced), Lincolnshire and Suffolk also
the party lost support. At the opposite end of the scale the vote increased by
almost seven percentage points in Shropshire, due in part to more contestation,
while there were notable performances in Buckinghamshire (where an absolute
majority voted in favour) and Essex, the latter also swinging in the party’s
favour at the general election. Certainly, the electoral system, which works to
the party’s disadvantage at general elections, worked in its favour at the county
contests. Although only one county’s voters gave the party majority support
Conservative councillors have an absolute majority on 23 of the 34 counties.
Ta
ble
1:
Lo
cal E
lecti
on
Resu
lts 2
005
Wa
rds
%W
ard
sW
ard
s%
Wa
rds
Se
ats
%S
ea
tsS
ea
ts%
Se
ats
Part
yV
ote
s%
Sh
are
sco
nte
ste
dco
nte
ste
dw
on
wo
nco
nte
ste
dco
nte
ste
dw
on
wo
n
All a
uth
ori
ties
Co
nse
rva
tive
4,6
58
,87
73
9.8
2,1
66
97
.71
,12
85
0.9
2,3
23
97
.01
,19
64
9.9
La
bo
ur
2,9
27
,90
52
5.0
1,8
97
85
.65
55
25
.02
,04
88
5.5
61
42
5.6
Lib
era
l D
em
ocra
t3
,23
4,3
33
27
.61
,98
78
9.6
45
52
0.5
2,1
37
89
.24
95
20
.7
Gre
en
26
8,9
18
2.3
57
12
5.8
60
.36
03
25
.29
0.4
Ind
ep
en
de
nt
34
1,7
53
2.9
36
01
6.2
53
2.4
37
11
5.5
55
2.3
Oth
er
27
3,3
64
2.3
47
02
1.2
20
0.9
49
72
0.7
27
1.1
To
tal
11
,70
5,1
50
10
02
,21
71
00
2,3
96
10
0
En
gla
nd
- C
ou
nty
Co
un
cils
Co
nse
rva
tive
4,5
81
,09
34
0.0
2,0
77
98
.01
,08
45
1.1
2,2
20
97
.81
,14
75
0.6
La
bo
ur
2,8
54
,56
52
5.0
1,8
30
86
.35
31
25
.01
,95
48
6.1
57
52
5.3
Lib
era
l D
em
ocra
t3
,15
5,9
14
27
.61
,90
18
9.7
43
62
0.6
2,0
37
89
.84
71
20
.8
Gre
en
25
9,0
15
2.3
55
12
6.0
60
.35
83
25
.79
0.4
Ind
ep
en
de
nt
32
9,1
04
2.9
33
21
5.7
47
2.2
34
21
5.1
49
2.2
Oth
ers
26
1,3
79
2.3
45
42
1.4
16
0.8
47
12
0.8
18
0.8
To
tal
11
,44
1,0
70
10
02
,12
01
00
2,2
69
10
0
En
gla
nd
- U
nit
ary
Co
un
cils
Co
nse
rva
tive
77
,78
42
9.5
89
91
.84
44
5.4
10
38
1.1
49
38
.6
La
bo
ur
73
,34
02
7.8
67
69
.12
42
4.7
94
74
.03
93
0.7
Lib
era
l D
em
ocra
t7
8,4
19
29
.78
68
8.7
19
19
.61
00
78
.72
41
8.9
Gre
en
9,9
03
3.8
20
20
.60
0.0
20
15
.70
0.0
Ind
ep
en
de
nt
12
,64
94
.82
82
8.9
66
.22
92
2.8
64
.7
Oth
ers
11
,98
54
.51
61
6.5
44
.12
62
0.5
97
.1
To
tal
26
4,0
80
10
09
71
00
12
71
00
ix
x
Labour’s vote share increased in both Shropshire and Cornwall but for
the remaining 32 counties the story was one of varying misery. There was an
almost ten-point fall in the vote in Cambridgeshire while the decline in
Bedfordshire was comparable. In parts of the East Midlands, most notably
Leicestershire and Nottinghamshire, there was an above average swing
against Labour.
In terms of the re-distribution of vote the Liberal Democrats were the
chief beneficiaries of Labour’s misfortune – as indeed happened at the general
election. The Liberal Democrat advance in Cambridgeshire and Durham has
already been noted but there was a six-point rise also in Northumberland and
Warwickshire. As well as three county councils where the Liberal Democrats
have majority control they are in a clear second place in a further ten authorities.
The Greens’ best performance came in Oxfordshire, where virtually one
in ten voters supported the party’s candidates. The biggest contribution to
this surge was made in Oxford City where more than one in five voted Green.
Oxfordshire was nearly double the support in their second-placed county,
Essex. Independents received their biggest support in Cornwall, where 22%
of all voters eschewed party political candidates. But the general decline of
Independents in county elections continues. The total in Cornwall was more
than twice the proportion in Lincolnshire and even Shropshire, traditionally an
Independent area of strength, there was a nine-point decline in votes, leaving
them with just 8.4% overall.
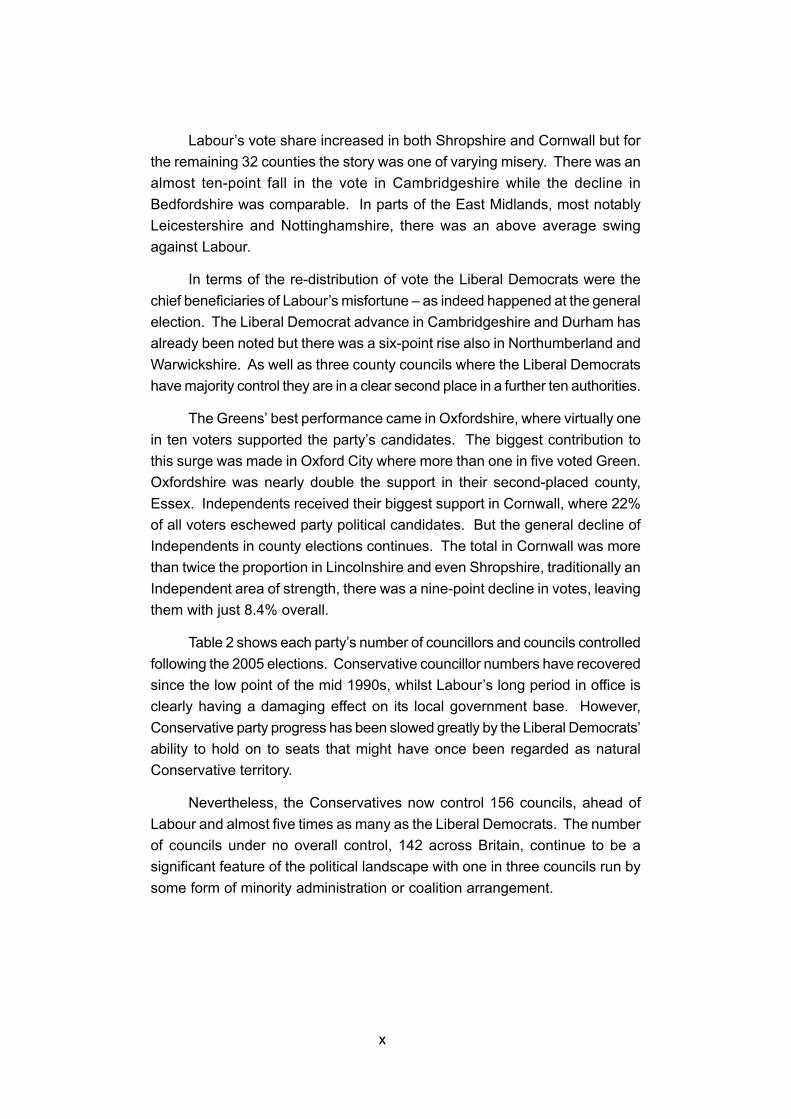
Table 2 shows each party’s number of councillors and councils controlled
following the 2005 elections. Conservative councillor numbers have recovered
since the low point of the mid 1990s, whilst Labour’s long period in office is
clearly having a damaging effect on its local government base. However,
Conservative party progress has been slowed greatly by the Liberal Democrats’
ability to hold on to seats that might have once been regarded as natural
Conservative territory.
Nevertheless, the Conservatives now control 156 councils, ahead of
Labour and almost five times as many as the Liberal Democrats. The number
of councils under no overall control, 142 across Britain, continue to be a
significant feature of the political landscape with one in three councils run by
some form of minority administration or coalition arrangement.
xi
Table 2: Councillors and Councils after the May 2005 local elections
Councillors
Con Lab LD Ind/Other Nat Total
Scotland 126 504 175 233 184 1,222
Wales 109 479 149 354 173 1,264
England
London 650 854 317 40 – 1,861
Mets 546 1,182 593 124 – 2,445
Counties 1,147 575 470 77 – 2,269
Districts 4,837 2,116 2,377 1,246 – 10,576
Unitaries 778 808 662 159 – 2,407
Great Britain 8,193 6,518 4,743 2,233 357 22,044
England & Wales 8,067 6,014 4,568 2,000 173 20,822
England 7,958 5,535 4,419 1,646 0 19,558
Councils
Con Lab LD Ind/Other Nat NOC
Scotland 0 13 1 6 1 11
Wales 1 8 0 3 1 9
England
London 8 15 3 0 0 6
Mets 4 16 3 0 0 13
Counties 23 6 3 0 0 2
Districts 109 22 17 7 0 83
Unitaries 11 12 5 0 0 18
Great Britain 156 92 32 16 2 142
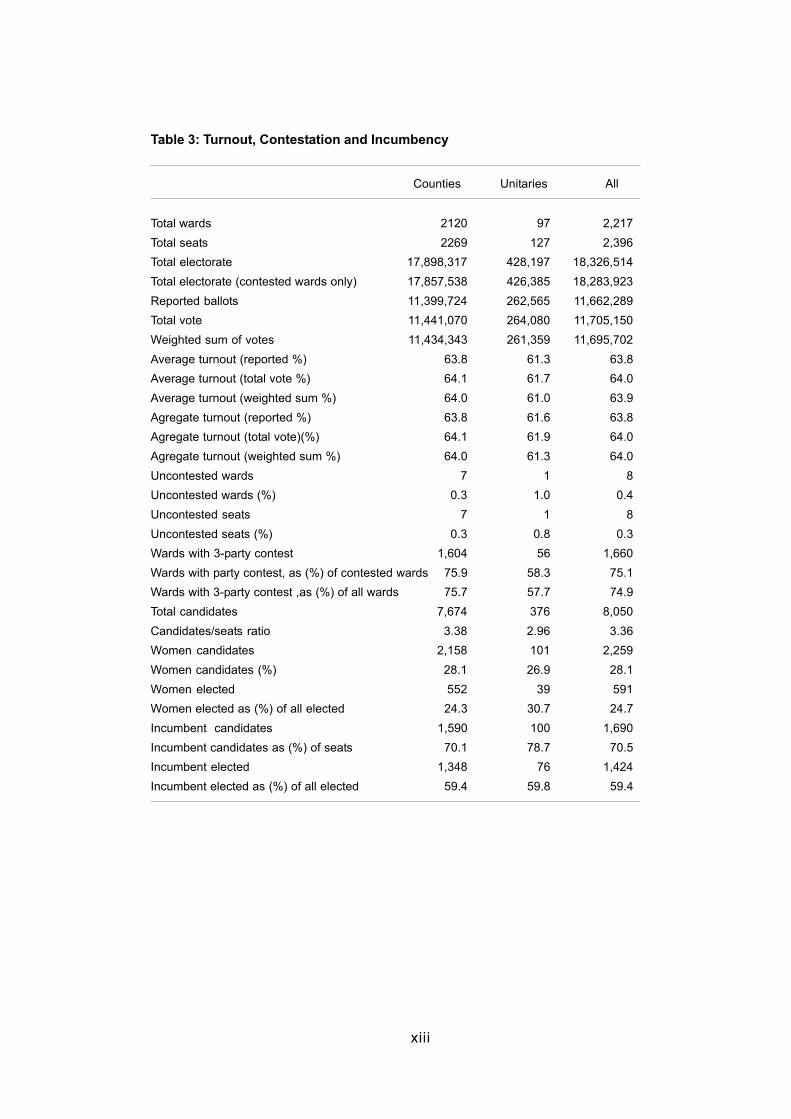
As with last year’s handbook we show (Table 3; see also Appendix)
various calculations for electoral turnout. Assisted by the Electoral
Commission, we made considerable effort to obtain from local authorities the
actual number of ballot papers included in the official count. This figure is
shown as ‘reported ballots’. However, because of the existence of multimember
divisions in the English counties the 2005 election provided another opportunity
to check the relative accuracy of different algorithms for calculating the vote
in such cases. The figure for ‘total vote’ is calculated using the traditional
method (counting the vote of each party’s best placed candidate) whilst
‘weighted sum of votes’ derives from a newer method first tested at the 2004
local elections. The overall difference between these calculations and reported
vote is 42,861 and 33,413 votes respectively. Assuming that the reported
figure is itself accurate, this gives an error of 0.4% for top vote and 0.3% for
the weighted sum method. It does appear, from this evidence and last year’s
xii
experiment, that weighted sum is a superior algorithm. Of course, it would be
better that all local authorities with multimember wards/divisions recorded
and reported formally the actual number of ballot papers included in every
official count.
It does not appear, therefore, that the method used to calculate turnout
is critical. Average turnout is 63.8% and aggregate turnout 64%. These
figures are close to the general election figure although we are unable to be
more precise because parliamentary constituencies do not map neatly across
the English shire counties. It generally confirms what we have encountered
before when general and local elections have coincided – when voters complete
a general election ballot they invariably complete one also for the local election.
Nevertheless, it would be interesting to undertake a detailed study to examine
whether there are marginal differences between in-person and postal voters
in their likelihood of voting at both elections.
There were just eight uncontested divisions (all single member), 0.4%
of the total. With competition so fierce it is unsurprising to find that three-
quarters of contests featured candidates from the three main parties. Overall,
the ratio of candidates to seats was 3.36, slightly higher than the ratio at the
equivalent election of four years before.
More than two thousand women candidates stood, 28.1% of the total
candidates, and a very modest increase compared with 2001. The trend has
been gently downwards for numbers of women councillors in county authorities
but in 2005 the figure rose to 24.3%, a rise of one percentage point. At the
beginning of the period following the 1970s local government reorganisation
the proportion of women councillors was highest for the shire counties but
that position is now reversed. We have no firm evidence at the moment why
this should be the case.
Councillors seeking re-election continue to account for a sizeable number
of candidates. Overall, 1,690 sought a further four year term of office, meaning
that 70.5% of seats featured a retiring councillor. Just 266 (16%) of such
candidates were subsequently defeated. The biggest factor in accounting for
councillor turnover continues to be voluntary resignation rather than defeat at
the ballot box. Some six in ten of councillors elected this May were returning
for at least a second term.
xiii
Table 3: Turnout, Contestation and Incumbency
Counties Unitaries All
Total wards 2120 97 2,217
Total seats 2269 127 2,396
Total electorate 17,898,317 428,197 18,326,514
Total electorate (contested wards only) 17,857,538 426,385 18,283,923
Reported ballots 11,399,724 262,565 11,662,289
Total vote 11,441,070 264,080 11,705,150
Weighted sum of votes 11,434,343 261,359 11,695,702
Average turnout (reported %) 63.8 61.3 63.8
Average turnout (total vote %) 64.1 61.7 64.0
Average turnout (weighted sum %) 64.0 61.0 63.9
Agregate turnout (reported %) 63.8 61.6 63.8
Agregate turnout (total vote)(%) 64.1 61.9 64.0
Agregate turnout (weighted sum %) 64.0 61.3 64.0
Uncontested wards 7 1 8
Uncontested wards (%) 0.3 1.0 0.4
Uncontested seats 7 1 8
Uncontested seats (%) 0.3 0.8 0.3
Wards with 3-party contest 1,604 56 1,660
Wards with party contest, as (%) of contested wards 75.9 58.3 75.1
Wards with 3-party contest ,as (%) of all wards 75.7 57.7 74.9
Total candidates 7,674 376 8,050
Candidates/seats ratio 3.38 2.96 3.36
Women candidates 2,158 101 2,259
Women candidates (%) 28.1 26.9 28.1
Women elected 552 39 591
Women elected as (%) of all elected 24.3 30.7 24.7
Incumbent candidates 1,590 100 1,690
Incumbent candidates as (%) of seats 70.1 78.7 70.5
Incumbent elected 1,348 76 1,424
Incumbent elected as (%) of all elected 59.4 59.8 59.4
xiv
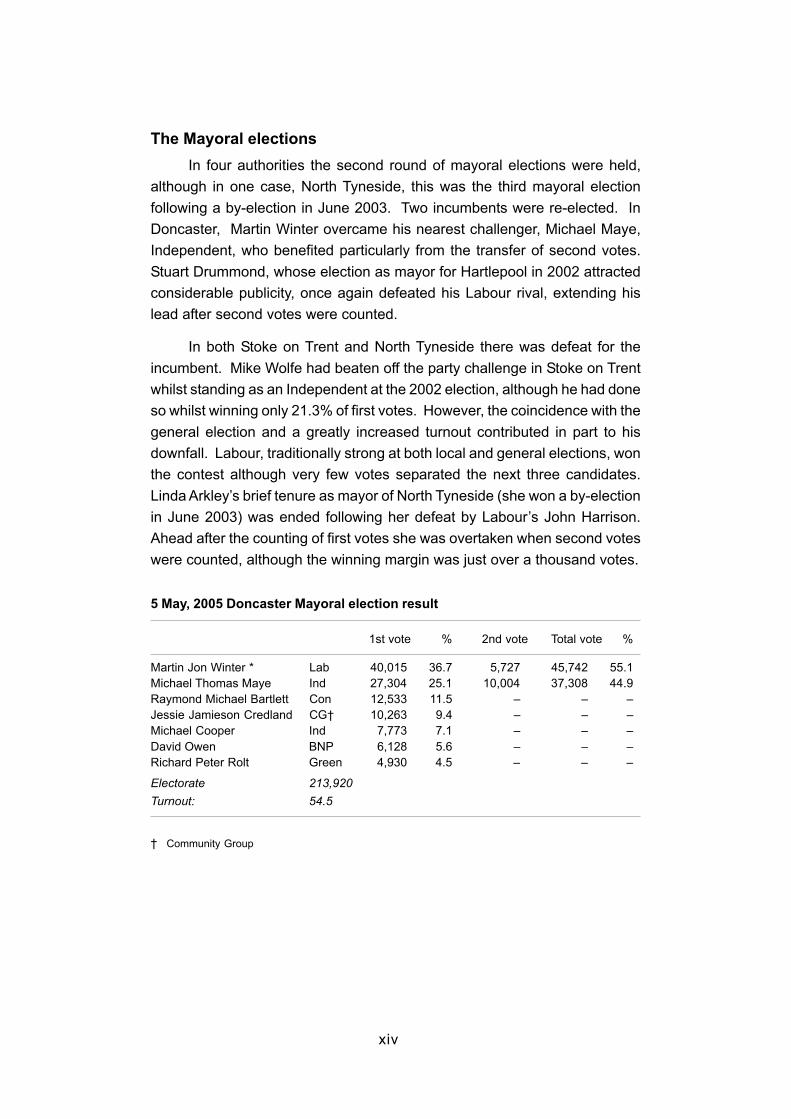
The Mayoral elections
In four authorities the second round of mayoral elections were held,
although in one case, North Tyneside, this was the third mayoral election
following a by-election in June 2003. Two incumbents were re-elected. In
Doncaster, Martin Winter overcame his nearest challenger, Michael Maye,
Independent, who benefited particularly from the transfer of second votes.
Stuart Drummond, whose election as mayor for Hartlepool in 2002 attracted
considerable publicity, once again defeated his Labour rival, extending his
lead after second votes were counted.
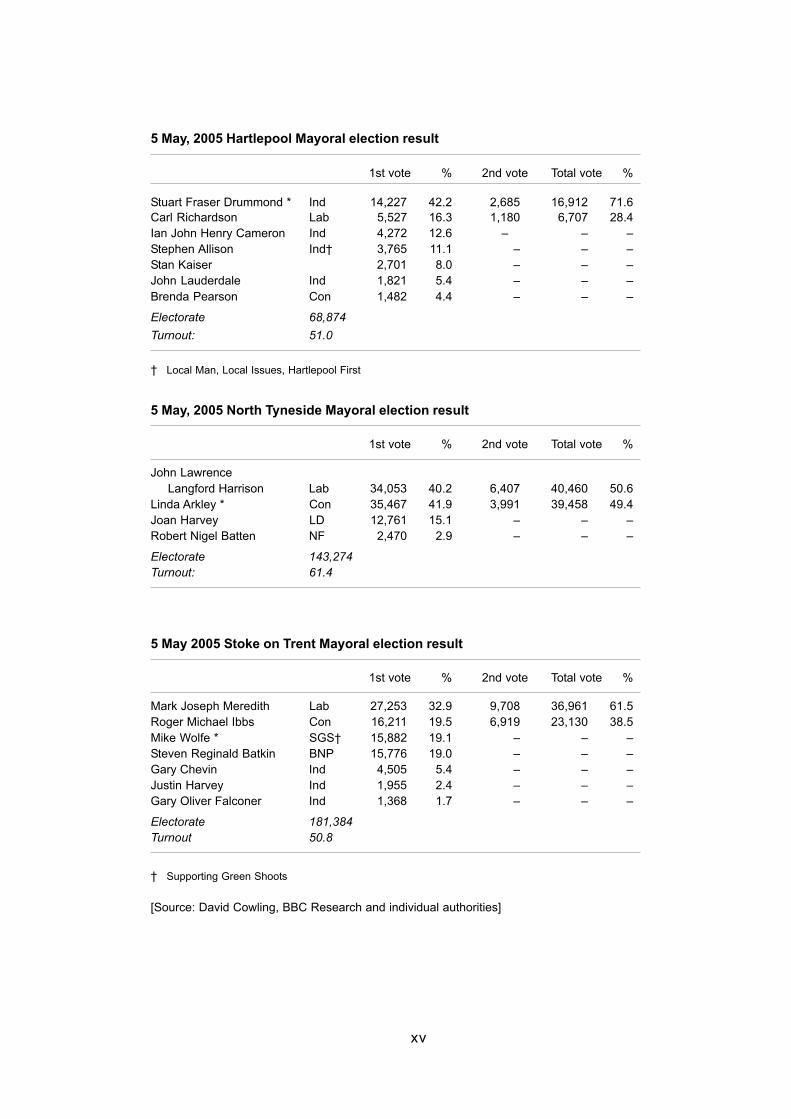
In both Stoke on Trent and North Tyneside there was defeat for the
incumbent. Mike Wolfe had beaten off the party challenge in Stoke on Trent
whilst standing as an Independent at the 2002 election, although he had done
so whilst winning only 21.3% of first votes. However, the coincidence with the
general election and a greatly increased turnout contributed in part to his
downfall. Labour, traditionally strong at both local and general elections, won
the contest although very few votes separated the next three candidates.
Linda Arkley’s brief tenure as mayor of North Tyneside (she won a by-election
in June 2003) was ended following her defeat by Labour’s John Harrison.
Ahead after the counting of first votes she was overtaken when second votes
were counted, although the winning margin was just over a thousand votes.
5 May, 2005 Doncaster Mayoral election result
1st vote % 2nd vote Total vote %
Martin Jon Winter * Lab 40,015 36.7 5,727 45,742 55.1
Michael Thomas Maye Ind 27,304 25.1 10,004 37,308 44.9
Raymond Michael Bartlett Con 12,533 11.5 – – –
Jessie Jamieson Credland CG† 10,263 9.4 – – –
Michael Cooper Ind 7,773 7.1 – – –
David Owen BNP 6,128 5.6 – – –
Richard Peter Rolt Green 4,930 4.5 – – –
Electorate 213,920
Turnout: 54.5
† Community Group
xv
5 May, 2005 Hartlepool Mayoral election result
1st vote % 2nd vote Total vote %
Stuart Fraser Drummond * Ind 14,227 42.2 2,685 16,912 71.6
Carl Richardson Lab 5,527 16.3 1,180 6,707 28.4
Ian John Henry Cameron Ind 4,272 12.6 – – –
Stephen Allison Ind† 3,765 11.1 – – –
Stan Kaiser 2,701 8.0 – – –
John Lauderdale Ind 1,821 5.4 – – –
Brenda Pearson Con 1,482 4.4 – – –
Electorate 68,874
Turnout: 51.0
† Local Man, Local Issues, Hartlepool First
5 May, 2005 North Tyneside Mayoral election result
1st vote % 2nd vote Total vote %
John Lawrence
Langford Harrison Lab 34,053 40.2 6,407 40,460 50.6
Linda Arkley * Con 35,467 41.9 3,991 39,458 49.4
Joan Harvey LD 12,761 15.1 – – –
Robert Nigel Batten NF 2,470 2.9 – – –
Electorate 143,274
Turnout: 61.4
5 May 2005 Stoke on Trent Mayoral election result
1st vote % 2nd vote Total vote %
Mark Joseph Meredith Lab 27,253 32.9 9,708 36,961 61.5
Roger Michael Ibbs Con 16,211 19.5 6,919 23,130 38.5
Mike Wolfe * SGS† 15,882 19.1 – – –
Steven Reginald Batkin BNP 15,776 19.0 – – –
Gary Chevin Ind 4,505 5.4 – – –
Justin Harvey Ind 1,955 2.4 – – –
Gary Oliver Falconer Ind 1,368 1.7 – – –
Electorate 181,384
Turnout 50.8
† Supporting Green Shoots
[Source: David Cowling, BBC Research and individual authorities]

xvi
xvii
Using the Handbook
In 2004 there were elections in England for a total of 37 local authorities
comprising 34 County councils and 3 Unitary councils. Additionally, there
were four mayoral elections and a referendum on the issue of a directly elected
mayor. There were no local elections at all in either Scotland or Wales.
The Handbook is organised into two sections, which cover the County
and Unitary councils respectively. Within these categories councils are
organised alphabetically. Results are reported in alphabetical order of division/
ward name. County divisions are listed alphabetically within their respective
district authorities, which are in turn in alphabetical order within county. Election
results have generally been taken from figures provided by, and checked
with, Electoral Administrators.
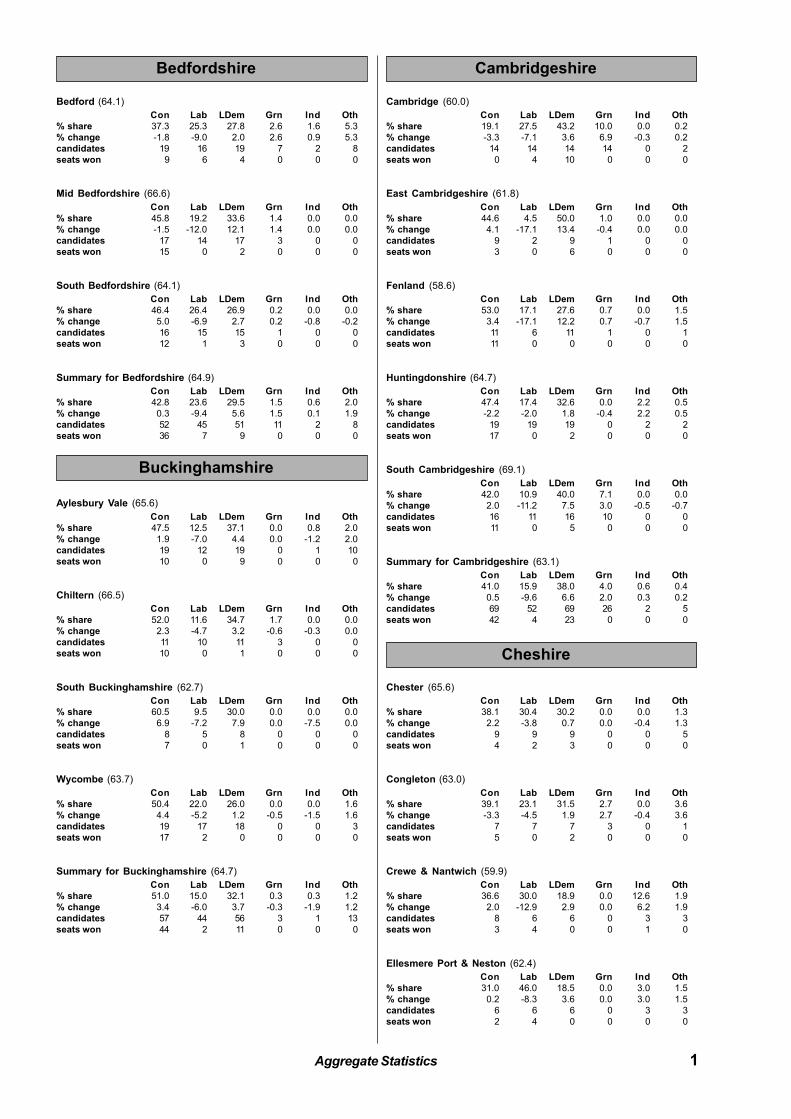
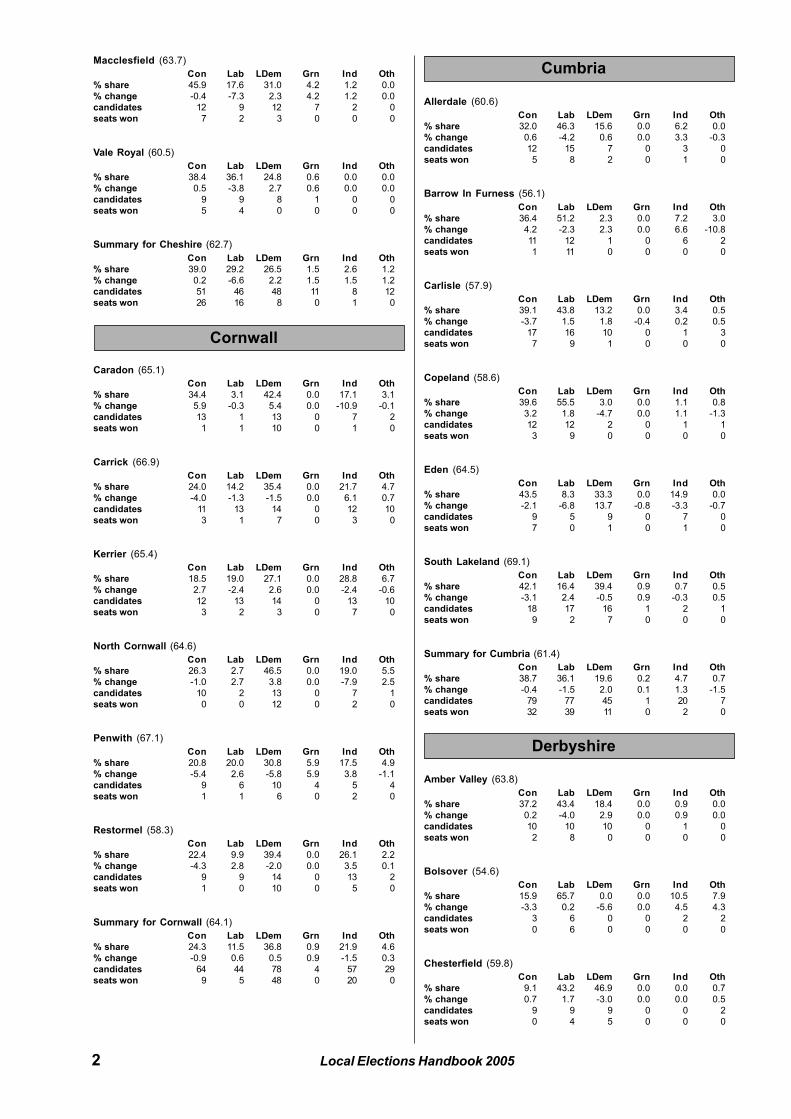
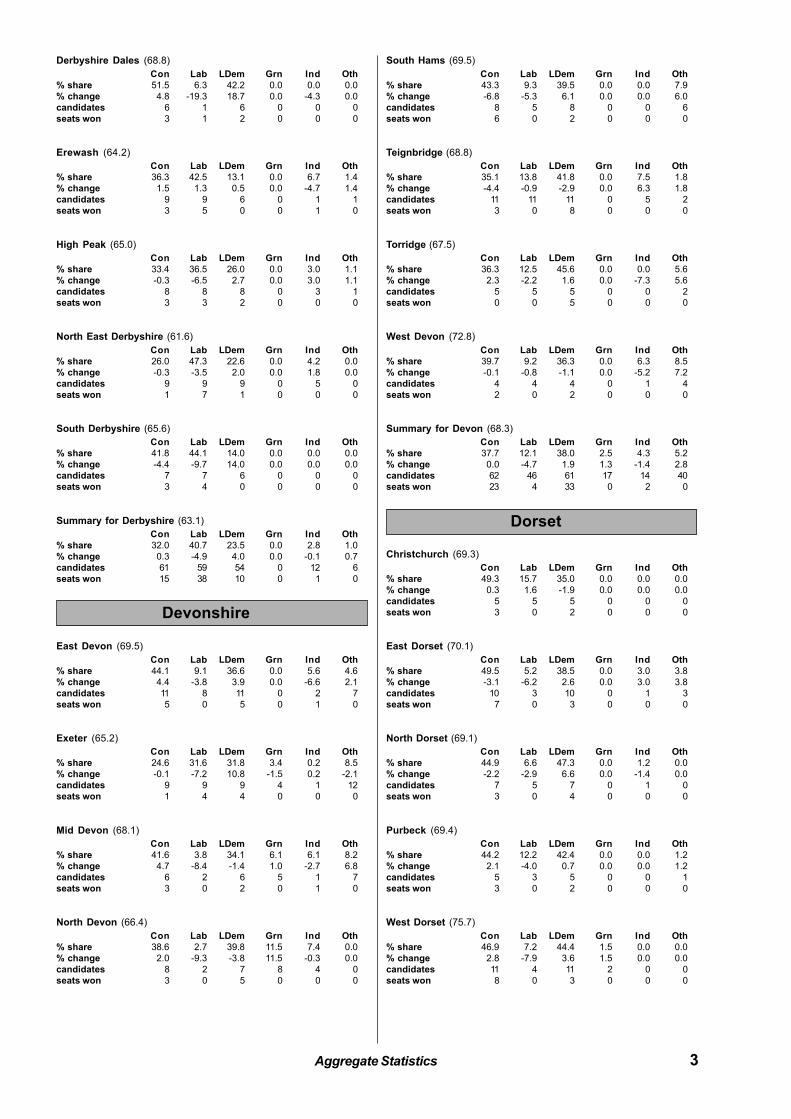
Before the division/ward results we have provided a section containing
aggregate data covering each local authority. Results for each authority were
aggregated to produce this set of summary statistics. These include the
percentage vote share for a range of parties and Independent candidates.
Where more than one councillor is elected then the vote of the best placed
candidate for each party is used in calculating total vote. In contests featuring
multiple Independent candidates these were grouped according to the number
of seats in a division/ward. In the case of a three-member seat with six
Independent candidates, therefore, the votes of the first and fourth placed
Independent contribute towards the total vote figure. The number of seats
contested and the number of seats won by each party is also noted.
Turnout, in brackets after the name of the authority, is the average turnout
in those divisions/wards which had a contested election. Table 3A in the
Appendix contains details of local authority turnout that has been calculated
using different methods. These methods for calculating local authority level
turnout will produce slightly different figures for those authorities that have a
large range for electorates and where complex patterns of contestation result
in an under- or over-estimate of actual votes cast. In the majority of cases the
differences between the two methods are rather small.
xviii
In those authorities where a direct comparison with the 2001 election is
possible we have also provided the percentage change for the different parties.
In two of the unitary councils this has not proved practicable because of the
nature of their electoral cycles.
The final two lines of the summary of aggregate statistics provide
information relating to the number of candidates fielded by each party as well
as the number of candidates that were successfully elected. Note, that since
the unitary councils are electing only a fraction of the council body that the
‘seats won’ category is not an equivalent to the full council composition.
In the main body of the book the results for each division/ward are listed
in alphabetical order within each local authority (and within district order also
for the county divisions). The figure in brackets is the electorate for 2005.
The practice adopted by local authorities for calculating this figure varies but
the introduction of rolling electoral registers means that this figure is a good
approximation of the numbers eligible to vote on election day. Nevertheless,
it has been impossible to adopt a standard definition of electorate or reliably
to identify the particular procedures used by each authority.
The appearance of a date in [square brackets] after the electorate
indicates that the election for some reason was not held on May 5 but was
contested on the later, specified date. This year there were only two such
contests. The first special election was for Town Close division (Norwich,
Norfolk) on 26th May. The postponement of the Staffordshire South
parliamentary election, caused by the death of Josephine Harrison, Liberal
Democrat, also caused the postponement of an election to the Kinver division
(South Staffordshire, Staffordshire) where she was also a candidate. This
special election, along with that for the parliamentary constituency, was held
on 23rd June. These particular results have been incorporated into the
aggregate statistics as though they did take place on May 5.
There was also an unusual occurrence affecting the Falmouth South
division (Kerrier, Cornwall). Initially the result was officially declared as Liberal
Democrat 348 votes, Conservative 340, Labour 200; Independent 108.
Subsequently, a ballot box that had been overlooked during the original count
was located. The ballot papers in this box were counted and added to the
original result. The amended result is printed within the handbook. Since the
overall result was the same, with the Liberal Democrats winning the seat,
there was no reason for the original declaration to be set aside and for the
election to be re-run.
xix
Candidates are listed in descending order of vote within each division/
ward. The first initial is given; ‘Ms.’ after a candidate’s name indicates a
woman; and ‘*’ indicates that the candidate was a sitting councillor, although
not necessarily for the same division/ward. Vote is the number of electors
who supported each candidate and Share the proportion of the total number
who cast a valid ballot supporting each candidate. The process of rounding
means that some shares do not necessarily sum to 100.
In the case of multi-member divisions/wards where more than one
vacancy was filled we have used the vote of each party’s best placed candidate
in order to calculate total vote and hence party shares. Where a candidate(s)
was returned unopposed then either ‘0’ or ‘0.0’ are used in the fields for vote,
share and turnout.
Below the list of candidates is a further line of data. First, we print the
name of the party whose candidate finished top of the poll at the corresponding
election in 2001. Recent boundary changes that were implemented for the
first time in 2005 mean that it has not been possible to indicate a winning
party at the previous election in a large number of cases.
Next, is recorded the percentage turnout. Turnout is the proportion of
the electorate that cast valid ballots at the election. In the overwhelming
majority of cases in 2005 turnout is that given by the local Electoral
Administrator and has thus been calculated knowing the number of valid ballot
papers issued. In a relatively small number of cases we have ourselves
calculated turnout from the available information but this year only for single
member wards – turnout data for all multimember divisions/wards has been
collected from Electoral Administrators. The figure to the right of the turnout
represents the lead of the winning party over the second placed party in
percentage terms rounded to one decimal place. The process of rounding
means that in some cases the percentage majority may not be exactly the
same as the winning party’s vote share minus the second-placed party’s share.
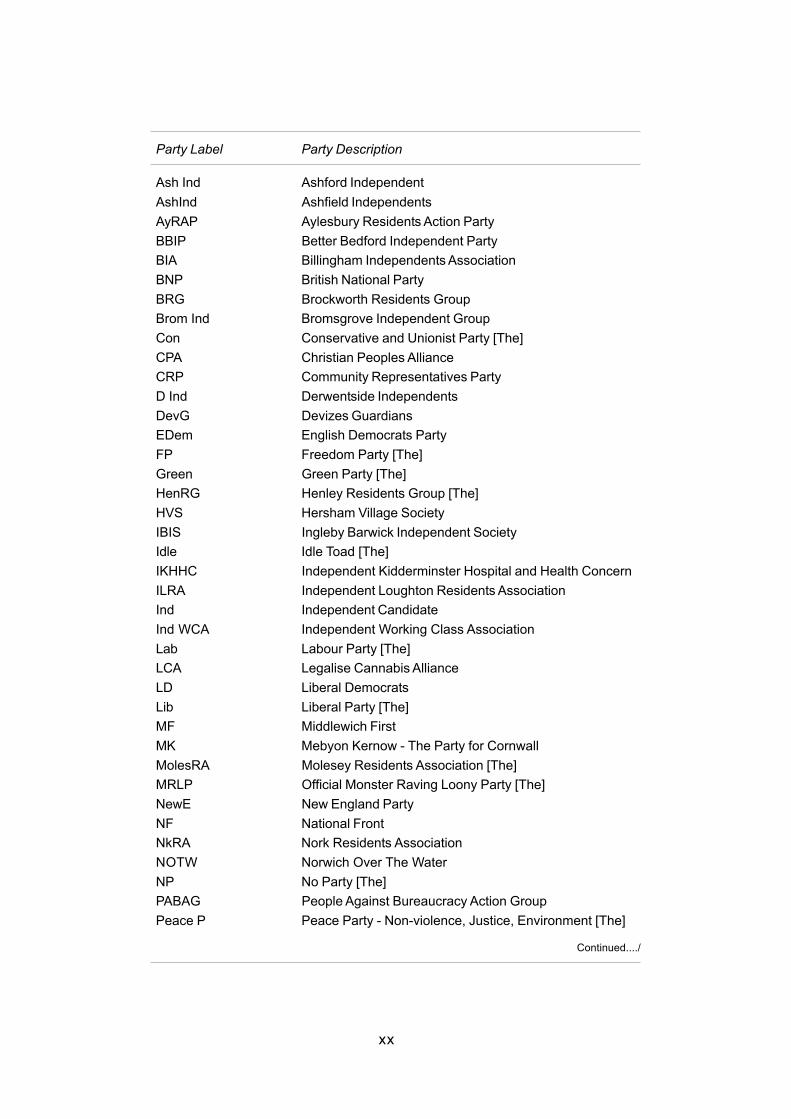
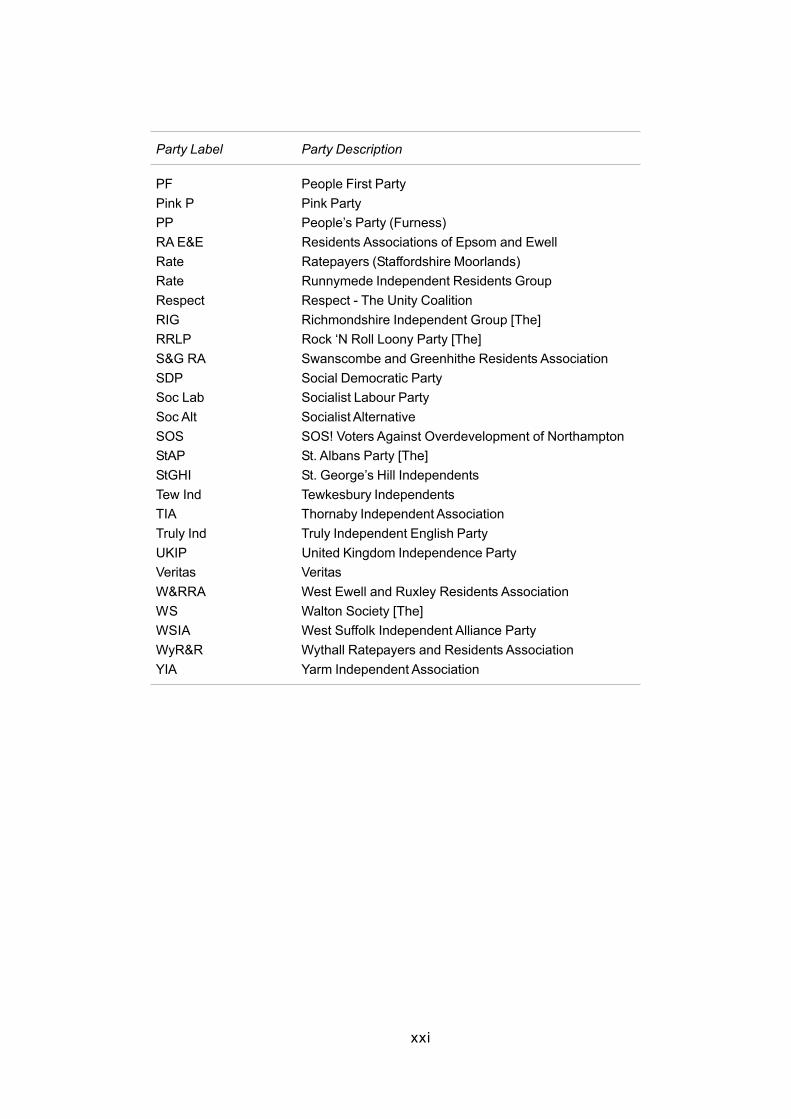
Candidates standing for local election use an extensive variety of party
labels that now have to be officially registered with the Electoral Commission.
These have been used throughout the Handbook, leading to a proliferation of
party labels. These labels, and the abbreviations we have used, are described
below.
xx
Party Label Party Description
Ash Ind Ashford Independent
AshInd Ashfield Independents
AyRAP Aylesbury Residents Action Party
BBIP Better Bedford Independent Party
BIA Billingham Independents Association
BNP British National Party
BRG Brockworth Residents Group
Brom Ind Bromsgrove Independent Group
Con Conservative and Unionist Party [The]
CPA Christian Peoples Alliance
CRP Community Representatives Party
D Ind Derwentside Independents
DevG Devizes Guardians
EDem English Democrats Party
FP Freedom Party [The]
Green Green Party [The]
HenRG Henley Residents Group [The]
HVS Hersham Village Society
IBIS Ingleby Barwick Independent Society
Idle Idle Toad [The]
IKHHC Independent Kidderminster Hospital and Health Concern
ILRA Independent Loughton Residents Association
Ind Independent Candidate
Ind WCA Independent Working Class Association
Lab Labour Party [The]
LCA Legalise Cannabis Alliance
LD Liberal Democrats
Lib Liberal Party [The]
MF Middlewich First
MK Mebyon Kernow - The Party for Cornwall
MolesRA Molesey Residents Association [The]
MRLP Official Monster Raving Loony Party [The]
NewE New England Party
NF National Front
NkRA Nork Residents Association
NOTW Norwich Over The Water
NP No Party [The]
PABAG People Against Bureaucracy Action Group
Peace P Peace Party - Non-violence, Justice, Environment [The]
Continued..../
xxi
Party Label Party Description
PF People First Party
Pink P Pink Party
PP People’s Party (Furness)
RA E&E Residents Associations of Epsom and Ewell
Rate Ratepayers (Staffordshire Moorlands)
Rate Runnymede Independent Residents Group
Respect Respect - The Unity Coalition
RIG Richmondshire Independent Group [The]
RRLP Rock ‘N Roll Loony Party [The]
S&G RA Swanscombe and Greenhithe Residents Association
SDP Social Democratic Party
Soc Lab Socialist Labour Party
Soc Alt Socialist Alternative
SOS SOS! Voters Against Overdevelopment of Northampton
StAP St. Albans Party [The]
StGHI St. George’s Hill Independents
Tew Ind Tewkesbury Independents
TIA Thornaby Independent Association
Truly Ind Truly Independent English Party
UKIP United Kingdom Independence Party
Veritas Veritas
W&RRA West Ewell and Ruxley Residents Association
WS Walton Society [The]
WSIA West Suffolk Independent Alliance Party
WyR&R Wythall Ratepayers and Residents Association
YIA Yarm Independent Association

xxii
Aggregate Statistics for:
34 County Councils
3 Unitary Councils

2
Aggregate Statistics 1
Bedford (64.1)
Con Lab LDem Grn Ind Oth
% share 37.3 25.3 27.8 2.6 1.6 5.3
% change -1.8 -9.0 2.0 2.6 0.9 5.3
candidates 19 16 19 7 2 8
seats won 9 6 4 0 0 0
Mid Bedfordshire (66.6)
Con Lab LDem Grn Ind Oth
% share 45.8 19.2 33.6 1.4 0.0 0.0
% change -1.5 -12.0 12.1 1.4 0.0 0.0
candidates 17 14 17 3 0 0
seats won 15 0 2 0 0 0
South Bedfordshire (64.1)
Con Lab LDem Grn Ind Oth
% share 46.4 26.4 26.9 0.2 0.0 0.0
% change 5.0 -6.9 2.7 0.2 -0.8 -0.2
candidates 16 15 15 1 0 0
seats won 12 1 3 0 0 0
Summary for Bedfordshire (64.9)
Con Lab LDem Grn Ind Oth
% share 42.8 23.6 29.5 1.5 0.6 2.0
% change 0.3 -9.4 5.6 1.5 0.1 1.9
candidates 52 45 51 11 2 8
seats won 36 7 9 0 0 0
Aylesbury Vale (65.6)
Con Lab LDem Grn Ind Oth
% share 47.5 12.5 37.1 0.0 0.8 2.0
% change 1.9 -7.0 4.4 0.0 -1.2 2.0
candidates 19 12 19 0 1 10
seats won 10 0 9 0 0 0
Chiltern (66.5)
Con Lab LDem Grn Ind Oth
% share 52.0 11.6 34.7 1.7 0.0 0.0
% change 2.3 -4.7 3.2 -0.6 -0.3 0.0
candidates 11 10 11 3 0 0
seats won 10 0 1 0 0 0
South Buckinghamshire (62.7)
Con Lab LDem Grn Ind Oth
% share 60.5 9.5 30.0 0.0 0.0 0.0
% change 6.9 -7.2 7.9 0.0 -7.5 0.0
candidates 8 5 8 0 0 0
seats won 7 0 1 0 0 0
Wycombe (63.7)
Con Lab LDem Grn Ind Oth
% share 50.4 22.0 26.0 0.0 0.0 1.6
% change 4.4 -5.2 1.2 -0.5 -1.5 1.6
candidates 19 17 18 0 0 3
seats won 17 2 0 0 0 0
Summary for Buckinghamshire (64.7)
Con Lab LDem Grn Ind Oth
% share 51.0 15.0 32.1 0.3 0.3 1.2
% change 3.4 -6.0 3.7 -0.3 -1.9 1.2
candidates 57 44 56 3 1 13
seats won 44 2 11 0 0 0
Cambridge (60.0)
Con Lab LDem Grn Ind Oth
% share 19.1 27.5 43.2 10.0 0.0 0.2
% change -3.3 -7.1 3.6 6.9 -0.3 0.2
candidates 14 14 14 14 0 2
seats won 0 4 10 0 0 0
East Cambridgeshire (61.8)
Con Lab LDem Grn Ind Oth
% share 44.6 4.5 50.0 1.0 0.0 0.0
% change 4.1 -17.1 13.4 -0.4 0.0 0.0
candidates 9 2 9 1 0 0
seats won 3 0 6 0 0 0
Fenland (58.6)
Con Lab LDem Grn Ind Oth
% share 53.0 17.1 27.6 0.7 0.0 1.5
% change 3.4 -17.1 12.2 0.7 -0.7 1.5
candidates 11 6 11 1 0 1
seats won 11 0 0 0 0 0
Huntingdonshire (64.7)
Con Lab LDem Grn Ind Oth
% share 47.4 17.4 32.6 0.0 2.2 0.5
% change -2.2 -2.0 1.8 -0.4 2.2 0.5
candidates 19 19 19 0 2 2
seats won 17 0 2 0 0 0
South Cambridgeshire (69.1)
Con Lab LDem Grn Ind Oth
% share 42.0 10.9 40.0 7.1 0.0 0.0
% change 2.0 -11.2 7.5 3.0 -0.5 -0.7
candidates 16 11 16 10 0 0
seats won 11 0 5 0 0 0
Summary for Cambridgeshire (63.1)
Con Lab LDem Grn Ind Oth
% share 41.0 15.9 38.0 4.0 0.6 0.4
% change 0.5 -9.6 6.6 2.0 0.3 0.2
candidates 69 52 69 26 2 5
seats won 42 4 23 0 0 0
Chester (65.6)
Con Lab LDem Grn Ind Oth
% share 38.1 30.4 30.2 0.0 0.0 1.3
% change 2.2 -3.8 0.7 0.0 -0.4 1.3
candidates 9 9 9 0 0 5
seats won 4 2 3 0 0 0
Congleton (63.0)
Con Lab LDem Grn Ind Oth
% share 39.1 23.1 31.5 2.7 0.0 3.6
% change -3.3 -4.5 1.9 2.7 -0.4 3.6
candidates 7 7 7 3 0 1
seats won 5 0 2 0 0 0
Crewe & Nantwich (59.9)
Con Lab LDem Grn Ind Oth
% share 36.6 30.0 18.9 0.0 12.6 1.9
% change 2.0 -12.9 2.9 0.0 6.2 1.9
candidates 8 6 6 0 3 3
seats won 3 4 0 0 1 0
Ellesmere Port & Neston (62.4)
Con Lab LDem Grn Ind Oth
% share 31.0 46.0 18.5 0.0 3.0 1.5
% change 0.2 -8.3 3.6 0.0 3.0 1.5
candidates 6 6 6 0 3 3
seats won 2 4 0 0 0 0
Bedfordshire
Buckinghamshire
Cambridgeshire
Cheshire
Local Elections Handbook 20052
Macclesfield (63.7)
Con Lab LDem Grn Ind Oth
% share 45.9 17.6 31.0 4.2 1.2 0.0
% change -0.4 -7.3 2.3 4.2 1.2 0.0
candidates 12 9 12 7 2 0
seats won 7 2 3 0 0 0
Vale Royal (60.5)
Con Lab LDem Grn Ind Oth
% share 38.4 36.1 24.8 0.6 0.0 0.0
% change 0.5 -3.8 2.7 0.6 0.0 0.0
candidates 9 9 8 1 0 0
seats won 5 4 0 0 0 0
Summary for Cheshire (62.7)
Con Lab LDem Grn Ind Oth
% share 39.0 29.2 26.5 1.5 2.6 1.2
% change 0.2 -6.6 2.2 1.5 1.5 1.2
candidates 51 46 48 11 8 12
seats won 26 16 8 0 1 0
Caradon (65.1)
Con Lab LDem Grn Ind Oth
% share 34.4 3.1 42.4 0.0 17.1 3.1
% change 5.9 -0.3 5.4 0.0 -10.9 -0.1
candidates 13 1 13 0 7 2
seats won 1 1 10 0 1 0
Carrick (66.9)
Con Lab LDem Grn Ind Oth
% share 24.0 14.2 35.4 0.0 21.7 4.7
% change -4.0 -1.3 -1.5 0.0 6.1 0.7
candidates 11 13 14 0 12 10
seats won 3 1 7 0 3 0
Kerrier (65.4)
Con Lab LDem Grn Ind Oth
% share 18.5 19.0 27.1 0.0 28.8 6.7
% change 2.7 -2.4 2.6 0.0 -2.4 -0.6
candidates 12 13 14 0 13 10
seats won 3 2 3 0 7 0
North Cornwall (64.6)
Con Lab LDem Grn Ind Oth
% share 26.3 2.7 46.5 0.0 19.0 5.5
% change -1.0 2.7 3.8 0.0 -7.9 2.5
candidates 10 2 13 0 7 1
seats won 0 0 12 0 2 0
Penwith (67.1)
Con Lab LDem Grn Ind Oth
% share 20.8 20.0 30.8 5.9 17.5 4.9
% change -5.4 2.6 -5.8 5.9 3.8 -1.1
candidates 9 6 10 4 5 4
seats won 1 1 6 0 2 0
Restormel (58.3)
Con Lab LDem Grn Ind Oth
% share 22.4 9.9 39.4 0.0 26.1 2.2
% change -4.3 2.8 -2.0 0.0 3.5 0.1
candidates 9 9 14 0 13 2
seats won 1 0 10 0 5 0
Summary for Cornwall (64.1)
Con Lab LDem Grn Ind Oth
% share 24.3 11.5 36.8 0.9 21.9 4.6
% change -0.9 0.6 0.5 0.9 -1.5 0.3
candidates 64 44 78 4 57 29
seats won 9 5 48 0 20 0
Allerdale (60.6)
Con Lab LDem Grn Ind Oth
% share 32.0 46.3 15.6 0.0 6.2 0.0
% change 0.6 -4.2 0.6 0.0 3.3 -0.3
candidates 12 15 7 0 3 0
seats won 5 8 2 0 1 0
Barrow In Furness (56.1)
Con Lab LDem Grn Ind Oth
% share 36.4 51.2 2.3 0.0 7.2 3.0
% change 4.2 -2.3 2.3 0.0 6.6 -10.8
candidates 11 12 1 0 6 2
seats won 1 11 0 0 0 0
Carlisle (57.9)
Con Lab LDem Grn Ind Oth
% share 39.1 43.8 13.2 0.0 3.4 0.5
% change -3.7 1.5 1.8 -0.4 0.2 0.5
candidates 17 16 10 0 1 3
seats won 7 9 1 0 0 0
Copeland (58.6)
Con Lab LDem Grn Ind Oth
% share 39.6 55.5 3.0 0.0 1.1 0.8
% change 3.2 1.8 -4.7 0.0 1.1 -1.3
candidates 12 12 2 0 1 1
seats won 3 9 0 0 0 0
Eden (64.5)
Con Lab LDem Grn Ind Oth
% share 43.5 8.3 33.3 0.0 14.9 0.0
% change -2.1 -6.8 13.7 -0.8 -3.3 -0.7
candidates 9 5 9 0 7 0
seats won 7 0 1 0 1 0
South Lakeland (69.1)
Con Lab LDem Grn Ind Oth
% share 42.1 16.4 39.4 0.9 0.7 0.5
% change -3.1 2.4 -0.5 0.9 -0.3 0.5
candidates 18 17 16 1 2 1
seats won 9 2 7 0 0 0
Summary for Cumbria (61.4)
Con Lab LDem Grn Ind Oth
% share 38.7 36.1 19.6 0.2 4.7 0.7
% change -0.4 -1.5 2.0 0.1 1.3 -1.5
candidates 79 77 45 1 20 7
seats won 32 39 11 0 2 0
Amber Valley (63.8)
Con Lab LDem Grn Ind Oth
% share 37.2 43.4 18.4 0.0 0.9 0.0
% change 0.2 -4.0 2.9 0.0 0.9 0.0
candidates 10 10 10 0 1 0
seats won 2 8 0 0 0 0
Bolsover (54.6)
Con Lab LDem Grn Ind Oth
% share 15.9 65.7 0.0 0.0 10.5 7.9
% change -3.3 0.2 -5.6 0.0 4.5 4.3
candidates 3 6 0 0 2 2
seats won 0 6 0 0 0 0
Chesterfield (59.8)
Con Lab LDem Grn Ind Oth
% share 9.1 43.2 46.9 0.0 0.0 0.7
% change 0.7 1.7 -3.0 0.0 0.0 0.5
candidates 9 9 9 0 0 2
seats won 0 4 5 0 0 0
Cornwall
Cumbria
Derbyshire
Aggregate Statistics 3
Derbyshire Dales (68.8)
Con Lab LDem Grn Ind Oth
% share 51.5 6.3 42.2 0.0 0.0 0.0
% change 4.8 -19.3 18.7 0.0 -4.3 0.0
candidates 6 1 6 0 0 0
seats won 3 1 2 0 0 0
Erewash (64.2)
Con Lab LDem Grn Ind Oth
% share 36.3 42.5 13.1 0.0 6.7 1.4
% change 1.5 1.3 0.5 0.0 -4.7 1.4
candidates 9 9 6 0 1 1
seats won 3 5 0 0 1 0
High Peak (65.0)
Con Lab LDem Grn Ind Oth
% share 33.4 36.5 26.0 0.0 3.0 1.1
% change -0.3 -6.5 2.7 0.0 3.0 1.1
candidates 8 8 8 0 3 1
seats won 3 3 2 0 0 0
North East Derbyshire (61.6)
Con Lab LDem Grn Ind Oth
% share 26.0 47.3 22.6 0.0 4.2 0.0
% change -0.3 -3.5 2.0 0.0 1.8 0.0
candidates 9 9 9 0 5 0
seats won 1 7 1 0 0 0
South Derbyshire (65.6)
Con Lab LDem Grn Ind Oth
% share 41.8 44.1 14.0 0.0 0.0 0.0
% change -4.4 -9.7 14.0 0.0 0.0 0.0
candidates 7 7 6 0 0 0
seats won 3 4 0 0 0 0
Summary for Derbyshire (63.1)
Con Lab LDem Grn Ind Oth
% share 32.0 40.7 23.5 0.0 2.8 1.0
% change 0.3 -4.9 4.0 0.0 -0.1 0.7
candidates 61 59 54 0 12 6
seats won 15 38 10 0 1 0
East Devon (69.5)
Con Lab LDem Grn Ind Oth
% share 44.1 9.1 36.6 0.0 5.6 4.6
% change 4.4 -3.8 3.9 0.0 -6.6 2.1
candidates 11 8 11 0 2 7
seats won 5 0 5 0 1 0
Exeter (65.2)
Con Lab LDem Grn Ind Oth
% share 24.6 31.6 31.8 3.4 0.2 8.5
% change -0.1 -7.2 10.8 -1.5 0.2 -2.1
candidates 9 9 9 4 1 12
seats won 1 4 4 0 0 0
Mid Devon (68.1)
Con Lab LDem Grn Ind Oth
% share 41.6 3.8 34.1 6.1 6.1 8.2
% change 4.7 -8.4 -1.4 1.0 -2.7 6.8
candidates 6 2 6 5 1 7
seats won 3 0 2 0 1 0
North Devon (66.4)
Con Lab LDem Grn Ind Oth
% share 38.6 2.7 39.8 11.5 7.4 0.0
% change 2.0 -9.3 -3.8 11.5 -0.3 0.0
candidates 8 2 7 8 4 0
seats won 3 0 5 0 0 0
South Hams (69.5)
Con Lab LDem Grn Ind Oth
% share 43.3 9.3 39.5 0.0 0.0 7.9
% change -6.8 -5.3 6.1 0.0 0.0 6.0
candidates 8 5 8 0 0 6
seats won 6 0 2 0 0 0
Teignbridge (68.8)
Con Lab LDem Grn Ind Oth
% share 35.1 13.8 41.8 0.0 7.5 1.8
% change -4.4 -0.9 -2.9 0.0 6.3 1.8
candidates 11 11 11 0 5 2
seats won 3 0 8 0 0 0
Torridge (67.5)
Con Lab LDem Grn Ind Oth
% share 36.3 12.5 45.6 0.0 0.0 5.6
% change 2.3 -2.2 1.6 0.0 -7.3 5.6
candidates 5 5 5 0 0 2
seats won 0 0 5 0 0 0
West Devon (72.8)
Con Lab LDem Grn Ind Oth
% share 39.7 9.2 36.3 0.0 6.3 8.5
% change -0.1 -0.8 -1.1 0.0 -5.2 7.2
candidates 4 4 4 0 1 4
seats won 2 0 2 0 0 0
Summary for Devon (68.3)
Con Lab LDem Grn Ind Oth
% share 37.7 12.1 38.0 2.5 4.3 5.2
% change 0.0 -4.7 1.9 1.3 -1.4 2.8
candidates 62 46 61 17 14 40
seats won 23 4 33 0 2 0
Christchurch (69.3)
Con Lab LDem Grn Ind Oth
% share 49.3 15.7 35.0 0.0 0.0 0.0
% change 0.3 1.6 -1.9 0.0 0.0 0.0
candidates 5 5 5 0 0 0
seats won 3 0 2 0 0 0
East Dorset (70.1)
Con Lab LDem Grn Ind Oth
% share 49.5 5.2 38.5 0.0 3.0 3.8
% change -3.1 -6.2 2.6 0.0 3.0 3.8
candidates 10 3 10 0 1 3
seats won 7 0 3 0 0 0
North Dorset (69.1)
Con Lab LDem Grn Ind Oth
% share 44.9 6.6 47.3 0.0 1.2 0.0
% change -2.2 -2.9 6.6 0.0 -1.4 0.0
candidates 7 5 7 0 1 0
seats won 3 0 4 0 0 0
Purbeck (69.4)
Con Lab LDem Grn Ind Oth
% share 44.2 12.2 42.4 0.0 0.0 1.2
% change 2.1 -4.0 0.7 0.0 0.0 1.2
candidates 5 3 5 0 0 1
seats won 3 0 2 0 0 0
West Dorset (75.7)
Con Lab LDem Grn Ind Oth
% share 46.9 7.2 44.4 1.5 0.0 0.0
% change 2.8 -7.9 3.6 1.5 0.0 0.0
candidates 11 4 11 2 0 0
seats won 8 0 3 0 0 0
Devonshire
Dorset
Local Elections Handbook 20054
Weymouth & Portland (68.1)
Con Lab LDem Grn Ind Oth
% share 28.4 34.2 27.7 0.0 7.7 2.1
% change -2.1 -5.3 7.4 0.0 -2.1 2.1
candidates 7 7 7 0 3 2
seats won 0 4 2 0 1 0
Summary for Dorset (70.7)
Con Lab LDem Grn Ind Oth
% share 44.3 12.3 39.7 0.4 2.0 1.3
% change -0.4 -4.8 3.4 0.4 0.2 1.3
candidates 45 27 45 2 5 6
seats won 24 4 16 0 1 0
Chester Le Street (55.9)
Con Lab LDem Grn Ind Oth
% share 16.3 54.8 22.2 0.0 6.7 0.0
% change -12.0 -16.9 22.2 0.0 6.7 0.0
candidates 7 7 7 0 3 0
seats won 0 7 0 0 0 0
Derwentside (54.9)
Con Lab LDem Grn Ind Oth
% share 11.1 53.3 14.2 0.0 0.0 21.4
% change -2.1 -9.0 1.3 0.0 -11.6 21.4
candidates 11 11 8 0 0 8
seats won 0 9 0 0 0 2
Durham (63.4)
Con Lab LDem Grn Ind Oth
% share 9.5 45.8 44.7 0.0 0.0 0.0
% change -3.1 -0.9 9.0 -0.9 -4.0 0.0
candidates 10 11 11 0 0 0
seats won 0 6 5 0 0 0
Easington (49.7)
Con Lab LDem Grn Ind Oth
% share 17.2 80.9 0.0 0.0 1.1 0.8
% change 4.8 3.9 -5.0 0.0 -4.5 0.8
candidates 12 12 0 0 1 1
seats won 0 12 0 0 0 0
Sedgefield (58.8)
Con Lab LDem Grn Ind Oth
% share 14.9 59.4 16.3 0.0 9.4 0.0
% change -3.4 -9.8 6.8 0.0 6.4 0.0
candidates 11 11 6 0 5 0
seats won 0 11 0 0 0 0
Teesdale (61.3)
Con Lab LDem Grn Ind Oth
% share 50.6 42.5 0.0 0.0 6.9 0.0
% change 6.1 2.8 0.0 0.0 -8.9 0.0
candidates 3 3 0 0 1 0
seats won 2 1 0 0 0 0
Wear Valley (54.0)
Con Lab LDem Grn Ind Oth
% share 6.4 50.9 30.5 0.0 12.2 0.0
% change -5.1 -1.0 9.2 0.0 -3.2 0.0
candidates 4 8 8 0 3 0
seats won 0 7 0 0 1 0
Summary for Durham (56.4)
Con Lab LDem Grn Ind Oth
% share 14.7 56.7 20.4 0.0 4.5 3.7
% change -2.4 -5.1 6.4 -0.2 -2.5 3.7
candidates 58 63 40 0 13 9
seats won 2 53 5 0 1 2
Eastbourne (62.9)
Con Lab LDem Grn Ind Oth
% share 39.6 9.0 45.2 5.2 0.0 1.1
% change -0.9 -5.3 1.4 3.7 0.0 1.1
candidates 9 8 9 9 0 3
seats won 4 0 5 0 0 0
Hastings (56.2)
Con Lab LDem Grn Ind Oth
% share 33.4 40.3 20.2 5.6 0.0 0.5
% change 0.0 -7.5 1.5 5.6 0.0 0.5
candidates 8 8 8 8 0 1
seats won 3 5 0 0 0 0
Lewes (68.4)
Con Lab LDem Grn Ind Oth
% share 33.4 13.4 38.1 6.5 8.6 0.0
% change -4.4 -3.8 -2.3 2.6 8.6 -0.8
candidates 9 9 9 9 5 0
seats won 4 0 4 0 1 0
Rother (67.8)
Con Lab LDem Grn Ind Oth
% share 48.1 14.7 37.1 0.0 0.0 0.0
% change 0.3 -5.9 6.3 0.0 0.0 -0.7
candidates 9 5 9 0 0 0
seats won 7 0 2 0 0 0
Wealden (68.1)
Con Lab LDem Grn Ind Oth
% share 48.6 10.9 34.1 3.0 1.6 1.8
% change -0.7 -2.6 -2.5 2.3 1.6 1.8
candidates 14 11 14 4 2 2
seats won 11 0 3 0 0 0
Summary for East Sussex (64.9)
Con Lab LDem Grn Ind Oth
% share 41.8 15.9 35.4 3.9 2.2 0.8
% change -1.2 -4.6 0.5 2.7 2.2 0.5
candidates 49 41 49 30 7 6
seats won 29 5 14 0 1 0
Basildon (60.4)
Con Lab LDem Grn Ind Oth
% share 43.9 30.8 17.8 6.9 0.0 0.6
% change 1.5 -9.1 0.3 6.9 -0.1 0.6
candidates 9 9 9 5 0 1
seats won 5 4 0 0 0 0
Braintree (65.4)
Con Lab LDem Grn Ind Oth
% share 42.8 30.4 18.3 6.8 0.0 1.8
% change 2.7 -5.4 0.9 0.0 0.0 1.8
candidates 8 8 8 8 0 4
seats won 6 2 0 0 0 0
Brentwood (68.2)
Con Lab LDem Grn Ind Oth
% share 49.3 12.9 29.6 2.9 0.0 5.3
% change 9.9 -3.8 -4.3 -1.0 -6.1 5.3
candidates 4 4 4 3 0 4
seats won 4 0 0 0 0 0
Castle Point (60.2)
Con Lab LDem Grn Ind Oth
% share 50.2 34.3 10.8 4.7 0.0 0.0
% change 1.4 -5.6 0.4 3.9 0.0 0.0
candidates 5 5 5 5 0 0
seats won 5 0 0 0 0 0
Durham
East Sussex
Essex
Aggregate Statistics 5
Chelmsford (62.4)
Con Lab LDem Grn Ind Oth
% share 43.6 18.0 31.7 5.0 1.0 0.8
% change 3.4 -6.6 0.4 1.0 1.0 0.8
candidates 9 8 9 8 1 2
seats won 4 0 5 0 0 0
Colchester (59.9)
Con Lab LDem Grn Ind Oth
% share 37.4 23.0 31.3 6.6 1.7 0.0
% change -0.2 -5.5 -1.4 5.3 1.7 0.0
candidates 9 9 9 9 1 0
seats won 4 2 3 0 0 0
Epping Forest (63.5)
Con Lab LDem Grn Ind Oth
% share 49.1 17.5 22.7 2.9 0.0 7.7
% change 3.0 -7.5 -1.8 2.9 -4.3 7.7
candidates 7 7 7 5 0 4
seats won 6 0 0 0 0 1
Harlow (60.6)
Con Lab LDem Grn Ind Oth
% share 36.6 40.1 17.3 5.9 0.0 0.0
% change 4.7 -4.7 -5.9 5.9 0.0 0.0
candidates 4 4 4 3 0 0
seats won 1 3 0 0 0 0
Maldon (66.3)
Con Lab LDem Grn Ind Oth
% share 51.3 23.8 17.2 7.7 0.0 0.0
% change 2.8 -5.1 1.0 1.3 0.0 0.0
candidates 3 3 3 3 0 0
seats won 3 0 0 0 0 0
Rochford (64.6)
Con Lab LDem Grn Ind Oth
% share 50.1 23.4 20.5 6.1 0.0 0.0
% change 2.9 -4.1 -1.8 6.1 -3.1 0.0
candidates 5 5 5 5 0 0
seats won 5 0 0 0 0 0
Tendring (63.1)
Con Lab LDem Grn Ind Oth
% share 41.1 27.3 18.9 4.5 0.0 8.2
% change 3.6 -9.3 -0.8 4.1 -0.4 2.8
candidates 8 7 7 8 0 6
seats won 5 2 0 0 0 1
Uttlesford (68.4)
Con Lab LDem Grn Ind Oth
% share 48.3 9.6 34.0 6.9 0.0 1.2
% change 0.4 -8.8 1.6 5.5 0.0 1.2
candidates 4 3 4 4 0 1
seats won 4 0 0 0 0 0
Summary for Essex (63.2)
Con Lab LDem Grn Ind Oth
% share 44.5 24.4 23.0 5.6 0.3 2.3
% change 2.8 -6.6 -0.7 3.5 -0.7 1.7
candidates 75 72 74 66 2 22
seats won 52 13 8 0 0 2
Cheltenham (62.0)
Con Lab LDem Grn Ind Oth
% share 36.7 13.6 34.9 7.2 0.0 7.7
% change -0.3 0.8 -7.6 5.8 -6.3 7.6
candidates 12 11 12 5 0 4
seats won 6 0 4 0 0 2
Cotswold (66.5)
Con Lab LDem Grn Ind Oth
% share 48.7 13.9 33.0 0.0 4.4 0.0
% change -0.6 8.9 -5.7 0.0 -2.5 0.0
candidates 9 7 9 0 2 0
seats won 7 0 2 0 0 0
Forest Of Dean (70.1)
Con Lab LDem Grn Ind Oth
% share 36.6 32.4 27.4 0.0 2.8 0.8
% change 4.4 0.4 -1.9 0.0 -3.7 0.8
candidates 9 9 9 0 1 1
seats won 4 5 0 0 0 0
Gloucester (62.7)
Con Lab LDem Grn Ind Oth
% share 34.8 33.5 28.1 2.2 0.0 1.3
% change 2.0 -6.7 1.6 2.2 -0.3 1.2
candidates 12 12 12 4 0 3
seats won 5 4 3 0 0 0
Stroud (70.3)
Con Lab LDem Grn Ind Oth
% share 38.6 32.5 26.1 2.3 0.4 0.0
% change 0.9 -3.7 3.9 -1.2 0.4 -0.4
candidates 12 12 12 1 1 0
seats won 6 4 2 0 0 0
Tewkesbury (66.3)
Con Lab LDem Grn Ind Oth
% share 40.5 14.5 35.5 1.0 0.0 8.6
% change 1.8 -7.2 5.9 1.0 -10.1 8.6
candidates 9 7 9 2 0 3
seats won 5 0 2 0 0 2
Summary for Gloucestershire (66.5)
Con Lab LDem Grn Ind Oth
% share 39.0 24.1 30.5 2.3 1.2 2.9
% change 1.2 -1.3 -0.6 1.3 -3.4 2.8
candidates 63 58 63 12 4 11
seats won 33 13 13 0 0 4
Basingstoke & Deane (65.3)
Con Lab LDem Grn Ind Oth
% share 44.1 24.2 30.3 0.9 0.0 0.5
% change 0.8 -5.3 3.4 0.9 -0.2 0.5
candidates 10 10 10 2 0 1
seats won 7 2 1 0 0 0
East Hampshire (66.4)
Con Lab LDem Grn Ind Oth
% share 45.7 13.2 41.1 0.0 0.0 0.0
% change -2.8 -1.8 4.6 0.0 0.0 0.0
candidates 7 7 7 0 0 0
seats won 4 0 3 0 0 0
Eastleigh (66.8)
Con Lab LDem Grn Ind Oth
% share 33.4 16.8 44.9 0.0 0.1 4.7
% change -0.6 -5.6 3.7 0.0 -0.1 2.6
candidates 7 7 7 0 1 6
seats won 1 0 6 0 0 0
Fareham (68.0)
Con Lab LDem Grn Ind Oth
% share 47.4 18.7 30.5 3.3 0.0 0.0
% change 1.2 -4.8 0.3 3.3 0.0 0.0
candidates 7 7 7 3 0 0
seats won 6 0 1 0 0 0
Gloucestershire
Hampshire
Local Elections Handbook 20056
Gosport (57.1)
Con Lab LDem Grn Ind Oth
% share 38.4 29.5 28.3 3.9 0.0 0.0
% change -1.4 -6.2 3.7 3.9 0.0 0.0
candidates 5 5 5 2 0 0
seats won 2 1 2 0 0 0
Hart (66.1)
Con Lab LDem Grn Ind Oth
% share 44.0 9.0 36.2 2.1 8.0 0.7
% change -2.7 -6.2 2.3 2.1 3.8 0.7
candidates 5 4 5 2 2 1
seats won 3 0 2 0 0 0
Havant (62.5)
Con Lab LDem Grn Ind Oth
% share 41.7 24.6 26.3 6.1 0.0 1.4
% change -1.9 -4.2 -1.4 6.1 0.0 1.4
candidates 7 7 7 6 0 1
seats won 5 1 1 0 0 0
New Forest (64.9)
Con Lab LDem Grn Ind Oth
% share 49.8 9.6 39.0 0.0 0.8 0.8
% change 1.6 -5.1 2.5 0.0 0.2 0.8
candidates 11 7 11 0 1 1
seats won 7 0 4 0 0 0
Rushmoor (59.1)
Con Lab LDem Grn Ind Oth
% share 42.2 22.0 31.9 1.0 1.6 1.3
% change 0.9 -5.4 4.8 -2.4 0.9 1.3
candidates 5 5 5 1 1 1
seats won 5 0 0 0 0 0
Test Valley (66.7)
Con Lab LDem Grn Ind Oth
% share 47.4 14.1 37.4 1.1 0.0 0.0
% change 0.6 -2.2 1.1 1.1 0.0 -0.5
candidates 7 7 7 1 0 0
seats won 4 0 3 0 0 0
Winchester (72.8)
Con Lab LDem Grn Ind Oth
% share 43.0 10.9 45.5 0.6 0.0 0.0
% change 0.9 -1.7 0.2 0.6 0.0 0.0
candidates 7 7 7 1 0 0
seats won 2 0 5 0 0 0
Summary for Hampshire (65.5)
Con Lab LDem Grn Ind Oth
% share 43.9 16.8 36.1 1.5 0.8 0.9
% change -0.1 -4.3 2.2 1.3 0.3 0.6
candidates 78 73 78 18 5 11
seats won 46 4 28 0 0 0
Broxbourne (57.6)
Con Lab LDem Grn Ind Oth
% share 56.5 25.4 12.9 1.7 0.8 2.7
% change 2.0 -6.1 0.3 1.7 0.8 1.3
candidates 6 6 6 2 1 2
seats won 6 0 0 0 0 0
Dacorum (66.3)
Con Lab LDem Grn Ind Oth
% share 41.9 28.6 23.6 5.5 0.0 0.4
% change 0.4 -6.1 2.7 2.8 0.0 0.2
candidates 10 10 10 10 0 1
seats won 5 4 1 0 0 0
East Hertfordshire (67.5)
Con Lab LDem Grn Ind Oth
% share 51.2 20.2 22.4 6.2 0.0 0.0
% change 3.4 -7.3 0.1 3.9 0.0 0.0
candidates 10 10 10 10 0 0
seats won 10 0 0 0 0 0
Hertsmere (62.4)
Con Lab LDem Grn Ind Oth
% share 50.5 25.3 22.5 1.7 0.0 0.0
% change 4.7 -6.4 0.4 1.7 -0.5 0.0
candidates 7 7 7 3 0 0
seats won 5 1 1 0 0 0
North Hertfordshire (65.6)
Con Lab LDem Grn Ind Oth
% share 42.8 26.0 25.7 5.4 0.0 0.0
% change 1.3 -8.2 2.6 4.4 0.0 0.0
candidates 9 9 9 9 0 0
seats won 7 2 0 0 0 0
St Albans (70.2)
Con Lab LDem Grn Ind Oth
% share 38.1 21.5 34.9 5.0 0.0 0.5
% change 1.7 -6.5 0.1 5.0 -0.6 0.4
candidates 10 10 10 9 0 2
seats won 5 0 5 0 0 0
Stevenage (59.3)
Con Lab LDem Grn Ind Oth
% share 29.2 44.4 24.3 2.0 0.0 0.0
% change 2.3 -8.4 6.2 0.3 0.0 -0.4
candidates 6 6 6 2 0 0
seats won 0 5 1 0 0 0
Three Rivers (67.1)
Con Lab LDem Grn Ind Oth
% share 39.2 17.2 39.3 4.3 0.0 0.0
% change 0.5 -6.2 1.4 4.3 0.0 0.0
candidates 6 6 6 6 0 0
seats won 3 1 2 0 0 0
Watford (62.4)
Con Lab LDem Grn Ind Oth
% share 25.3 27.5 38.5 8.8 0.0 0.0
% change -3.6 -11.7 11.1 4.8 -0.7 0.0
candidates 6 6 6 6 0 0
seats won 1 1 3 1 0 0
Welwyn Hatfield (67.7)
Con Lab LDem Grn Ind Oth
% share 45.0 32.0 18.3 4.7 0.0 0.0
% change 2.5 -7.2 0.9 3.8 0.0 0.0
candidates 7 7 7 6 0 0
seats won 4 2 1 0 0 0
Summary for Hertfordshire (65.2)
Con Lab LDem Grn Ind Oth
% share 42.5 26.1 26.3 4.7 0.1 0.3
% change 1.7 -7.4 2.3 3.4 -0.1 0.1
candidates 77 77 77 63 1 5
seats won 46 16 14 1 0 0
Ashford (64.2)
Con Lab LDem Grn Ind Oth
% share 46.9 15.4 26.7 4.5 0.0 6.4
% change 0.6 -14.4 2.8 4.5 0.0 6.4
candidates 7 4 7 5 0 5
seats won 5 1 1 0 0 0
Hertfordshire
Kent
Aggregate Statistics 7
Canterbury (63.2)
Con Lab LDem Grn Ind Oth
% share 39.7 23.3 27.4 5.2 1.3 3.1
% change 1.1 -5.3 -0.9 0.6 1.3 3.1
candidates 9 9 9 5 2 3
seats won 8 0 1 0 0 0
Dartford (61.7)
Con Lab LDem Grn Ind Oth
% share 40.3 42.3 4.5 0.0 0.0 13.0
% change 0.5 -6.0 -1.8 0.0 -5.7 13.0
candidates 6 6 2 0 0 11
seats won 2 4 0 0 0 0
Dover (66.6)
Con Lab LDem Grn Ind Oth
% share 36.8 39.2 19.7 2.2 0.8 1.3
% change -0.6 -6.0 2.3 2.2 0.8 1.3
candidates 7 7 7 1 1 2
seats won 2 5 0 0 0 0
Gravesham (63.7)
Con Lab LDem Grn Ind Oth
% share 44.3 38.8 12.6 3.7 0.0 0.5
% change 5.0 -9.9 0.7 3.7 0.0 0.5
candidates 5 5 5 2 0 1
seats won 1 4 0 0 0 0
Maidstone (64.6)
Con Lab LDem Grn Ind Oth
% share 41.8 21.3 29.5 4.7 0.0 2.7
% change -1.3 -3.6 -0.9 3.1 0.0 2.7
candidates 9 9 9 7 0 5
seats won 6 1 2 0 0 0
Sevenoaks (66.3)
Con Lab LDem Grn Ind Oth
% share 48.6 16.7 24.9 1.7 6.1 2.0
% change -0.3 -7.0 -0.3 1.7 3.9 2.0
candidates 7 6 7 1 3 3
seats won 6 1 0 0 0 0
Shepway (68.2)
Con Lab LDem Grn Ind Oth
% share 51.9 13.6 25.7 1.5 0.0 7.4
% change 9.3 -7.7 -10.4 1.5 0.0 7.4
candidates 6 6 6 2 0 7
seats won 6 0 0 0 0 0
Swale (62.8)
Con Lab LDem Grn Ind Oth
% share 44.0 35.0 19.3 1.0 0.0 0.6
% change 5.1 -0.7 -2.6 1.0 0.0 -2.8
candidates 7 7 7 1 0 1
seats won 5 2 0 0 0 0
Thanet (58.9)
Con Lab LDem Grn Ind Oth
% share 36.8 34.5 15.1 0.0 0.0 13.6
% change -7.1 -7.0 2.6 0.0 -0.5 11.9
candidates 8 8 7 0 0 13
seats won 5 3 0 0 0 0
Tonbridge & Malling (65.2)
Con Lab LDem Grn Ind Oth
% share 48.1 17.4 27.3 2.6 3.6 0.9
% change 4.6 -10.3 -1.4 2.6 3.6 0.9
candidates 7 5 6 3 1 1
seats won 5 0 2 0 0 0
Tunbridge Wells (65.4)
Con Lab LDem Grn Ind Oth
% share 49.1 14.2 28.8 7.3 0.0 0.6
% change -0.1 -6.3 0.1 6.1 0.0 0.2
candidates 6 5 6 6 0 1
seats won 6 0 0 0 0 0
Summary for Kent (64.3)
Con Lab LDem Grn Ind Oth
% share 43.8 25.6 22.4 2.9 1.0 4.2
% change 1.1 -6.9 -0.6 2.2 0.4 3.8
candidates 84 77 78 33 7 53
seats won 57 21 6 0 0 0
Burnley (59.1)
Con Lab LDem Grn Ind Oth
% share 19.1 38.7 27.6 0.0 0.0 14.7
% change -1.9 -13.5 12.8 0.0 -12.1 14.7
candidates 6 6 6 0 0 5
seats won 0 6 0 0 0 0
Chorley (61.4)
Con Lab LDem Grn Ind Oth
% share 40.1 45.1 12.7 2.1 0.0 0.0
% change 5.0 -2.7 -3.7 1.4 0.0 0.0
candidates 7 7 4 1 0 0
seats won 3 4 0 0 0 0
Fylde (60.0)
Con Lab LDem Grn Ind Oth
% share 47.5 23.3 22.8 0.0 6.3 0.0
% change -3.3 -5.9 3.9 0.0 5.2 0.0
candidates 6 6 6 0 1 0
seats won 5 0 0 0 1 0
Hyndburn (58.5)
Con Lab LDem Grn Ind Oth
% share 39.0 52.5 8.5 0.0 0.0 0.0
% change -2.7 -5.8 8.5 0.0 0.0 0.0
candidates 6 6 3 0 0 0
seats won 0 6 0 0 0 0
Lancaster (60.3)
Con Lab LDem Grn Ind Oth
% share 31.7 36.2 19.1 10.8 2.2 0.0
% change -0.8 -3.7 12.1 -0.4 -7.3 0.0
candidates 10 10 9 10 2 0
seats won 3 6 0 1 0 0
Pendle (63.1)
Con Lab LDem Grn Ind Oth
% share 28.4 27.9 33.3 0.0 0.0 10.4
% change -1.4 -11.8 3.2 0.0 -0.4 10.4
candidates 6 6 6 0 0 7
seats won 2 1 3 0 0 0
Preston (57.0)
Con Lab LDem Grn Ind Oth
% share 31.7 35.8 25.0 0.0 1.9 5.6
% change 0.3 -5.6 1.4 0.0 -1.7 5.6
candidates 10 10 10 0 2 6
seats won 3 6 1 0 0 0
Ribble Valley (66.5)
Con Lab LDem Grn Ind Oth
% share 52.1 17.6 30.3 0.0 0.0 0.0
% change -1.1 8.6 -7.5 0.0 0.0 0.0
candidates 4 4 4 0 0 0
seats won 3 0 1 0 0 0
Rossendale (60.4)
Con Lab LDem Grn Ind Oth
% share 40.1 40.8 13.9 1.1 4.0 0.0
% change -7.1 -11.9 13.9 1.1 4.0 0.0
candidates 5 5 4 1 1 0
seats won 2 3 0 0 0 0
Lancashire
Local Elections Handbook 20058
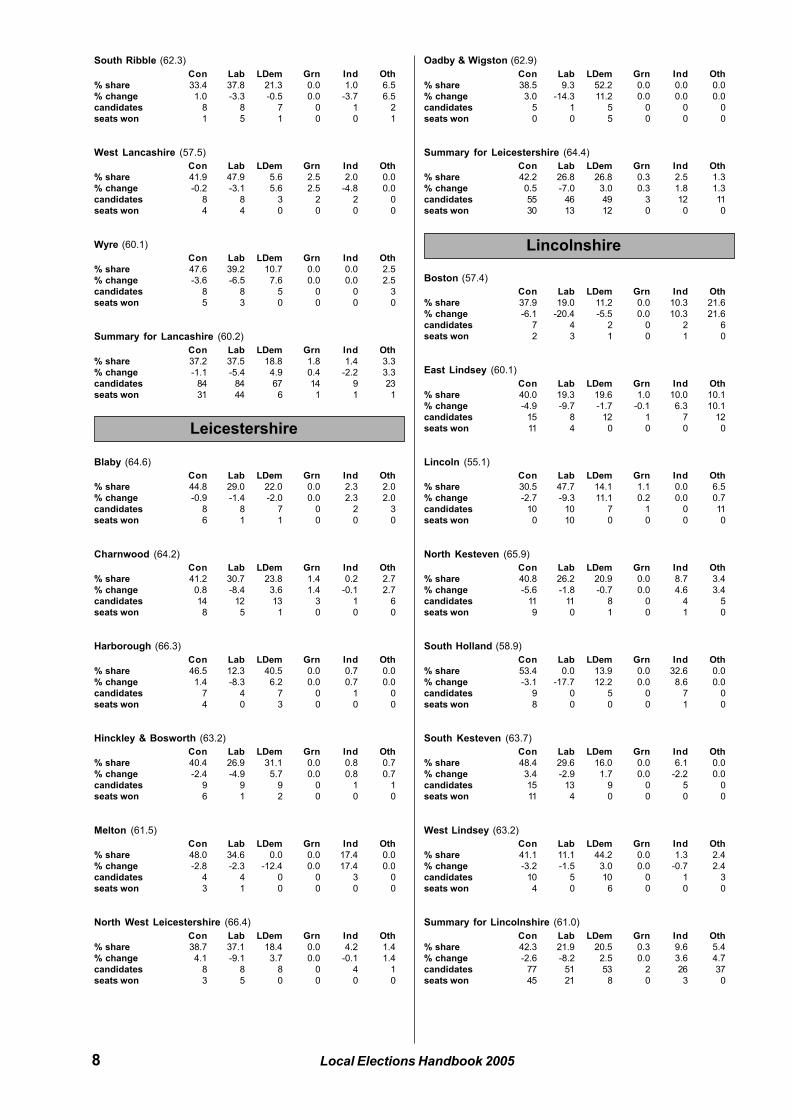
South Ribble (62.3)
Con Lab LDem Grn Ind Oth
% share 33.4 37.8 21.3 0.0 1.0 6.5
% change 1.0 -3.3 -0.5 0.0 -3.7 6.5
candidates 8 8 7 0 1 2
seats won 1 5 1 0 0 1
West Lancashire (57.5)
Con Lab LDem Grn Ind Oth
% share 41.9 47.9 5.6 2.5 2.0 0.0
% change -0.2 -3.1 5.6 2.5 -4.8 0.0
candidates 8 8 3 2 2 0
seats won 4 4 0 0 0 0
Wyre (60.1)
Con Lab LDem Grn Ind Oth
% share 47.6 39.2 10.7 0.0 0.0 2.5
% change -3.6 -6.5 7.6 0.0 0.0 2.5
candidates 8 8 5 0 0 3
seats won 5 3 0 0 0 0
Summary for Lancashire (60.2)
Con Lab LDem Grn Ind Oth
% share 37.2 37.5 18.8 1.8 1.4 3.3
% change -1.1 -5.4 4.9 0.4 -2.2 3.3
candidates 84 84 67 14 9 23
seats won 31 44 6 1 1 1
Blaby (64.6)
Con Lab LDem Grn Ind Oth
% share 44.8 29.0 22.0 0.0 2.3 2.0
% change -0.9 -1.4 -2.0 0.0 2.3 2.0
candidates 8 8 7 0 2 3
seats won 6 1 1 0 0 0
Charnwood (64.2)
Con Lab LDem Grn Ind Oth
% share 41.2 30.7 23.8 1.4 0.2 2.7
% change 0.8 -8.4 3.6 1.4 -0.1 2.7
candidates 14 12 13 3 1 6
seats won 8 5 1 0 0 0
Harborough (66.3)
Con Lab LDem Grn Ind Oth
% share 46.5 12.3 40.5 0.0 0.7 0.0
% change 1.4 -8.3 6.2 0.0 0.7 0.0
candidates 7 4 7 0 1 0
seats won 4 0 3 0 0 0
Hinckley & Bosworth (63.2)
Con Lab LDem Grn Ind Oth
% share 40.4 26.9 31.1 0.0 0.8 0.7
% change -2.4 -4.9 5.7 0.0 0.8 0.7
candidates 9 9 9 0 1 1
seats won 6 1 2 0 0 0
Melton (61.5)
Con Lab LDem Grn Ind Oth
% share 48.0 34.6 0.0 0.0 17.4 0.0
% change -2.8 -2.3 -12.4 0.0 17.4 0.0
candidates 4 4 0 0 3 0
seats won 3 1 0 0 0 0
North West Leicestershire (66.4)
Con Lab LDem Grn Ind Oth
% share 38.7 37.1 18.4 0.0 4.2 1.4
% change 4.1 -9.1 3.7 0.0 -0.1 1.4
candidates 8 8 8 0 4 1
seats won 3 5 0 0 0 0
Oadby & Wigston (62.9)
Con Lab LDem Grn Ind Oth
% share 38.5 9.3 52.2 0.0 0.0 0.0
% change 3.0 -14.3 11.2 0.0 0.0 0.0
candidates 5 1 5 0 0 0
seats won 0 0 5 0 0 0
Summary for Leicestershire (64.4)
Con Lab LDem Grn Ind Oth
% share 42.2 26.8 26.8 0.3 2.5 1.3
% change 0.5 -7.0 3.0 0.3 1.8 1.3
candidates 55 46 49 3 12 11
seats won 30 13 12 0 0 0
Boston (57.4)
Con Lab LDem Grn Ind Oth
% share 37.9 19.0 11.2 0.0 10.3 21.6
% change -6.1 -20.4 -5.5 0.0 10.3 21.6
candidates 7 4 2 0 2 6
seats won 2 3 1 0 1 0
East Lindsey (60.1)
Con Lab LDem Grn Ind Oth
% share 40.0 19.3 19.6 1.0 10.0 10.1
% change -4.9 -9.7 -1.7 -0.1 6.3 10.1
candidates 15 8 12 1 7 12
seats won 11 4 0 0 0 0
Lincoln (55.1)
Con Lab LDem Grn Ind Oth
% share 30.5 47.7 14.1 1.1 0.0 6.5
% change -2.7 -9.3 11.1 0.2 0.0 0.7
candidates 10 10 7 1 0 11
seats won 0 10 0 0 0 0
North Kesteven (65.9)
Con Lab LDem Grn Ind Oth
% share 40.8 26.2 20.9 0.0 8.7 3.4
% change -5.6 -1.8 -0.7 0.0 4.6 3.4
candidates 11 11 8 0 4 5
seats won 9 0 1 0 1 0
South Holland (58.9)
Con Lab LDem Grn Ind Oth
% share 53.4 0.0 13.9 0.0 32.6 0.0
% change -3.1 -17.7 12.2 0.0 8.6 0.0
candidates 9 0 5 0 7 0
seats won 8 0 0 0 1 0
South Kesteven (63.7)
Con Lab LDem Grn Ind Oth
% share 48.4 29.6 16.0 0.0 6.1 0.0
% change 3.4 -2.9 1.7 0.0 -2.2 0.0
candidates 15 13 9 0 5 0
seats won 11 4 0 0 0 0
West Lindsey (63.2)
Con Lab LDem Grn Ind Oth
% share 41.1 11.1 44.2 0.0 1.3 2.4
% change -3.2 -1.5 3.0 0.0 -0.7 2.4
candidates 10 5 10 0 1 3
seats won 4 0 6 0 0 0
Summary for Lincolnshire (61.0)
Con Lab LDem Grn Ind Oth
% share 42.3 21.9 20.5 0.3 9.6 5.4
% change -2.6 -8.2 2.5 0.0 3.6 4.7
candidates 77 51 53 2 26 37
seats won 45 21 8 0 3 0
Leicestershire
Lincolnshire
Aggregate Statistics 9
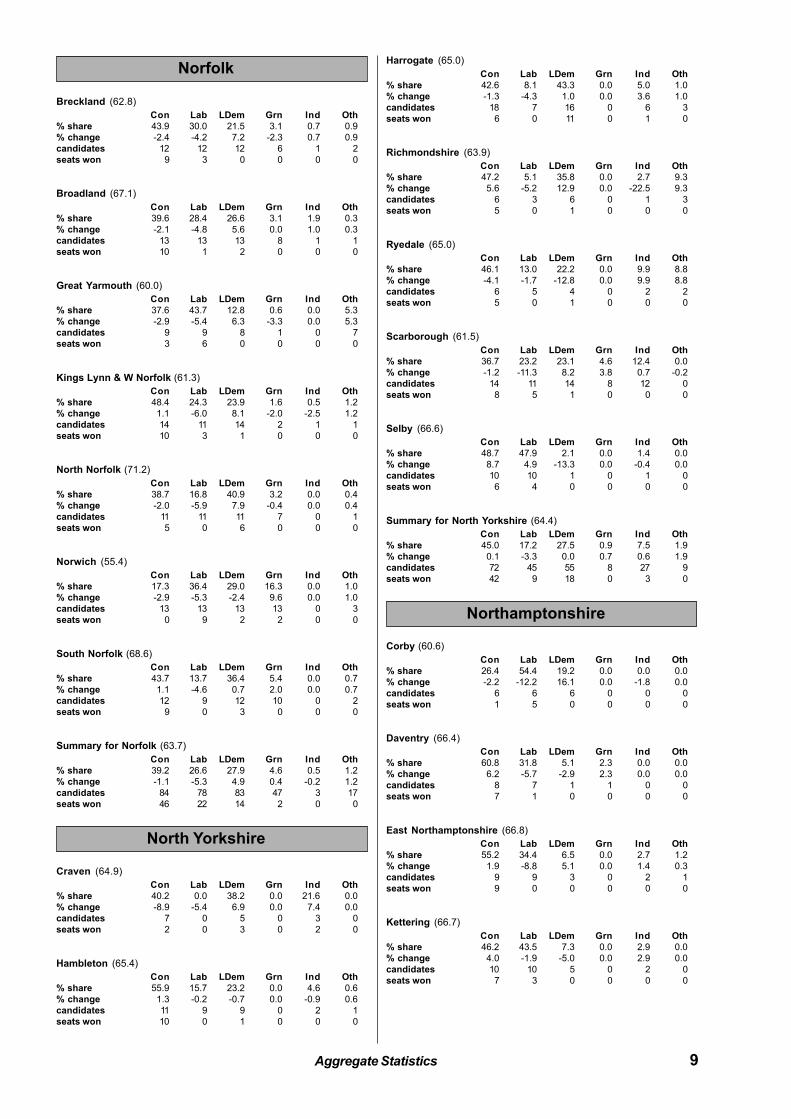
Breckland (62.8)
Con Lab LDem Grn Ind Oth
% share 43.9 30.0 21.5 3.1 0.7 0.9
% change -2.4 -4.2 7.2 -2.3 0.7 0.9
candidates 12 12 12 6 1 2
seats won 9 3 0 0 0 0
Broadland (67.1)
Con Lab LDem Grn Ind Oth
% share 39.6 28.4 26.6 3.1 1.9 0.3
% change -2.1 -4.8 5.6 0.0 1.0 0.3
candidates 13 13 13 8 1 1
seats won 10 1 2 0 0 0
Great Yarmouth (60.0)
Con Lab LDem Grn Ind Oth
% share 37.6 43.7 12.8 0.6 0.0 5.3
% change -2.9 -5.4 6.3 -3.3 0.0 5.3
candidates 9 9 8 1 0 7
seats won 3 6 0 0 0 0
Kings Lynn & W Norfolk (61.3)
Con Lab LDem Grn Ind Oth
% share 48.4 24.3 23.9 1.6 0.5 1.2
% change 1.1 -6.0 8.1 -2.0 -2.5 1.2
candidates 14 11 14 2 1 1
seats won 10 3 1 0 0 0
North Norfolk (71.2)
Con Lab LDem Grn Ind Oth
% share 38.7 16.8 40.9 3.2 0.0 0.4
% change -2.0 -5.9 7.9 -0.4 0.0 0.4
candidates 11 11 11 7 0 1
seats won 5 0 6 0 0 0
Norwich (55.4)
Con Lab LDem Grn Ind Oth
% share 17.3 36.4 29.0 16.3 0.0 1.0
% change -2.9 -5.3 -2.4 9.6 0.0 1.0
candidates 13 13 13 13 0 3
seats won 0 9 2 2 0 0
South Norfolk (68.6)
Con Lab LDem Grn Ind Oth
% share 43.7 13.7 36.4 5.4 0.0 0.7
% change 1.1 -4.6 0.7 2.0 0.0 0.7
candidates 12 9 12 10 0 2
seats won 9 0 3 0 0 0
Summary for Norfolk (63.7)
Con Lab LDem Grn Ind Oth
% share 39.2 26.6 27.9 4.6 0.5 1.2
% change -1.1 -5.3 4.9 0.4 -0.2 1.2
candidates 84 78 83 47 3 17
seats won 46 22 14 2 0 0
Craven (64.9)
Con Lab LDem Grn Ind Oth
% share 40.2 0.0 38.2 0.0 21.6 0.0
% change -8.9 -5.4 6.9 0.0 7.4 0.0
candidates 7 0 5 0 3 0
seats won 2 0 3 0 2 0
Hambleton (65.4)
Con Lab LDem Grn Ind Oth
% share 55.9 15.7 23.2 0.0 4.6 0.6
% change 1.3 -0.2 -0.7 0.0 -0.9 0.6
candidates 11 9 9 0 2 1
seats won 10 0 1 0 0 0
Harrogate (65.0)
Con Lab LDem Grn Ind Oth
% share 42.6 8.1 43.3 0.0 5.0 1.0
% change -1.3 -4.3 1.0 0.0 3.6 1.0
candidates 18 7 16 0 6 3
seats won 6 0 11 0 1 0
Richmondshire (63.9)
Con Lab LDem Grn Ind Oth
% share 47.2 5.1 35.8 0.0 2.7 9.3
% change 5.6 -5.2 12.9 0.0 -22.5 9.3
candidates 6 3 6 0 1 3
seats won 5 0 1 0 0 0
Ryedale (65.0)
Con Lab LDem Grn Ind Oth
% share 46.1 13.0 22.2 0.0 9.9 8.8
% change -4.1 -1.7 -12.8 0.0 9.9 8.8
candidates 6 5 4 0 2 2
seats won 5 0 1 0 0 0
Scarborough (61.5)
Con Lab LDem Grn Ind Oth
% share 36.7 23.2 23.1 4.6 12.4 0.0
% change -1.2 -11.3 8.2 3.8 0.7 -0.2
candidates 14 11 14 8 12 0
seats won 8 5 1 0 0 0
Selby (66.6)
Con Lab LDem Grn Ind Oth
% share 48.7 47.9 2.1 0.0 1.4 0.0
% change 8.7 4.9 -13.3 0.0 -0.4 0.0
candidates 10 10 1 0 1 0
seats won 6 4 0 0 0 0
Summary for North Yorkshire (64.4)
Con Lab LDem Grn Ind Oth
% share 45.0 17.2 27.5 0.9 7.5 1.9
% change 0.1 -3.3 0.0 0.7 0.6 1.9
candidates 72 45 55 8 27 9
seats won 42 9 18 0 3 0
Corby (60.6)
Con Lab LDem Grn Ind Oth
% share 26.4 54.4 19.2 0.0 0.0 0.0
% change -2.2 -12.2 16.1 0.0 -1.8 0.0
candidates 6 6 6 0 0 0
seats won 1 5 0 0 0 0
Daventry (66.4)
Con Lab LDem Grn Ind Oth
% share 60.8 31.8 5.1 2.3 0.0 0.0
% change 6.2 -5.7 -2.9 2.3 0.0 0.0
candidates 8 7 1 1 0 0
seats won 7 1 0 0 0 0
East Northamptonshire (66.8)
Con Lab LDem Grn Ind Oth
% share 55.2 34.4 6.5 0.0 2.7 1.2
% change 1.9 -8.8 5.1 0.0 1.4 0.3
candidates 9 9 3 0 2 1
seats won 9 0 0 0 0 0
Kettering (66.7)
Con Lab LDem Grn Ind Oth
% share 46.2 43.5 7.3 0.0 2.9 0.0
% change 4.0 -1.9 -5.0 0.0 2.9 0.0
candidates 10 10 5 0 2 0
seats won 7 3 0 0 0 0
Norfolk
North Yorkshire
Northamptonshire
Local Elections Handbook 200510
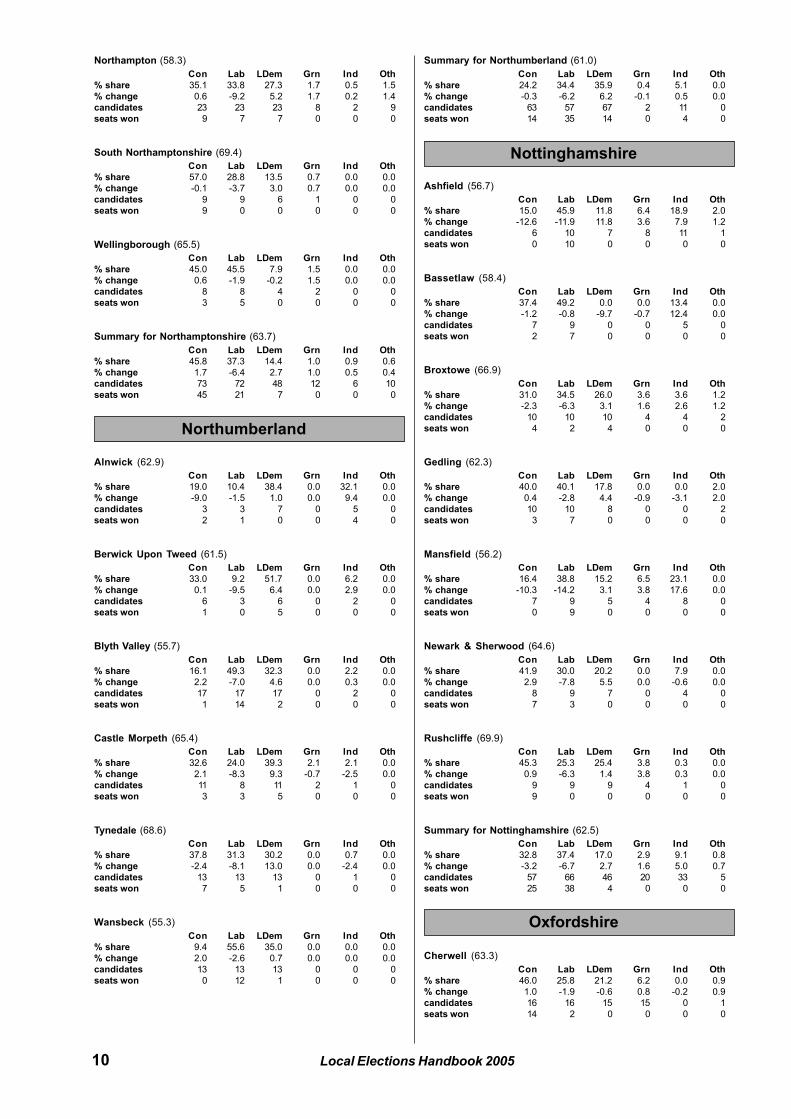
Northampton (58.3)
Con Lab LDem Grn Ind Oth
% share 35.1 33.8 27.3 1.7 0.5 1.5
% change 0.6 -9.2 5.2 1.7 0.2 1.4
candidates 23 23 23 8 2 9
seats won 9 7 7 0 0 0
South Northamptonshire (69.4)
Con Lab LDem Grn Ind Oth
% share 57.0 28.8 13.5 0.7 0.0 0.0
% change -0.1 -3.7 3.0 0.7 0.0 0.0
candidates 9 9 6 1 0 0
seats won 9 0 0 0 0 0
Wellingborough (65.5)
Con Lab LDem Grn Ind Oth
% share 45.0 45.5 7.9 1.5 0.0 0.0
% change 0.6 -1.9 -0.2 1.5 0.0 0.0
candidates 8 8 4 2 0 0
seats won 3 5 0 0 0 0
Summary for Northamptonshire (63.7)
Con Lab LDem Grn Ind Oth
% share 45.8 37.3 14.4 1.0 0.9 0.6
% change 1.7 -6.4 2.7 1.0 0.5 0.4
candidates 73 72 48 12 6 10
seats won 45 21 7 0 0 0
Alnwick (62.9)
Con Lab LDem Grn Ind Oth
% share 19.0 10.4 38.4 0.0 32.1 0.0
% change -9.0 -1.5 1.0 0.0 9.4 0.0
candidates 3 3 7 0 5 0
seats won 2 1 0 0 4 0
Berwick Upon Tweed (61.5)
Con Lab LDem Grn Ind Oth
% share 33.0 9.2 51.7 0.0 6.2 0.0
% change 0.1 -9.5 6.4 0.0 2.9 0.0
candidates 6 3 6 0 2 0
seats won 1 0 5 0 0 0
Blyth Valley (55.7)
Con Lab LDem Grn Ind Oth
% share 16.1 49.3 32.3 0.0 2.2 0.0
% change 2.2 -7.0 4.6 0.0 0.3 0.0
candidates 17 17 17 0 2 0
seats won 1 14 2 0 0 0
Castle Morpeth (65.4)
Con Lab LDem Grn Ind Oth
% share 32.6 24.0 39.3 2.1 2.1 0.0
% change 2.1 -8.3 9.3 -0.7 -2.5 0.0
candidates 11 8 11 2 1 0
seats won 3 3 5 0 0 0
Tynedale (68.6)
Con Lab LDem Grn Ind Oth
% share 37.8 31.3 30.2 0.0 0.7 0.0
% change -2.4 -8.1 13.0 0.0 -2.4 0.0
candidates 13 13 13 0 1 0
seats won 7 5 1 0 0 0
Wansbeck (55.3)
Con Lab LDem Grn Ind Oth
% share 9.4 55.6 35.0 0.0 0.0 0.0
% change 2.0 -2.6 0.7 0.0 0.0 0.0
candidates 13 13 13 0 0 0
seats won 0 12 1 0 0 0
Summary for Northumberland (61.0)
Con Lab LDem Grn Ind Oth
% share 24.2 34.4 35.9 0.4 5.1 0.0
% change -0.3 -6.2 6.2 -0.1 0.5 0.0
candidates 63 57 67 2 11 0
seats won 14 35 14 0 4 0
Ashfield (56.7)
Con Lab LDem Grn Ind Oth
% share 15.0 45.9 11.8 6.4 18.9 2.0
% change -12.6 -11.9 11.8 3.6 7.9 1.2
candidates 6 10 7 8 11 1
seats won 0 10 0 0 0 0
Bassetlaw (58.4)
Con Lab LDem Grn Ind Oth
% share 37.4 49.2 0.0 0.0 13.4 0.0
% change -1.2 -0.8 -9.7 -0.7 12.4 0.0
candidates 7 9 0 0 5 0
seats won 2 7 0 0 0 0
Broxtowe (66.9)
Con Lab LDem Grn Ind Oth
% share 31.0 34.5 26.0 3.6 3.6 1.2
% change -2.3 -6.3 3.1 1.6 2.6 1.2
candidates 10 10 10 4 4 2
seats won 4 2 4 0 0 0
Gedling (62.3)
Con Lab LDem Grn Ind Oth
% share 40.0 40.1 17.8 0.0 0.0 2.0
% change 0.4 -2.8 4.4 -0.9 -3.1 2.0
candidates 10 10 8 0 0 2
seats won 3 7 0 0 0 0
Mansfield (56.2)
Con Lab LDem Grn Ind Oth
% share 16.4 38.8 15.2 6.5 23.1 0.0
% change -10.3 -14.2 3.1 3.8 17.6 0.0
candidates 7 9 5 4 8 0
seats won 0 9 0 0 0 0
Newark & Sherwood (64.6)
Con Lab LDem Grn Ind Oth
% share 41.9 30.0 20.2 0.0 7.9 0.0
% change 2.9 -7.8 5.5 0.0 -0.6 0.0
candidates 8 9 7 0 4 0
seats won 7 3 0 0 0 0
Rushcliffe (69.9)
Con Lab LDem Grn Ind Oth
% share 45.3 25.3 25.4 3.8 0.3 0.0
% change 0.9 -6.3 1.4 3.8 0.3 0.0
candidates 9 9 9 4 1 0
seats won 9 0 0 0 0 0
Summary for Nottinghamshire (62.5)
Con Lab LDem Grn Ind Oth
% share 32.8 37.4 17.0 2.9 9.1 0.8
% change -3.2 -6.7 2.7 1.6 5.0 0.7
candidates 57 66 46 20 33 5
seats won 25 38 4 0 0 0
Cherwell (63.3)
Con Lab LDem Grn Ind Oth
% share 46.0 25.8 21.2 6.2 0.0 0.9
% change 1.0 -1.9 -0.6 0.8 -0.2 0.9
candidates 16 16 15 15 0 1
seats won 14 2 0 0 0 0
Northumberland
Nottinghamshire
Oxfordshire
Aggregate Statistics 11
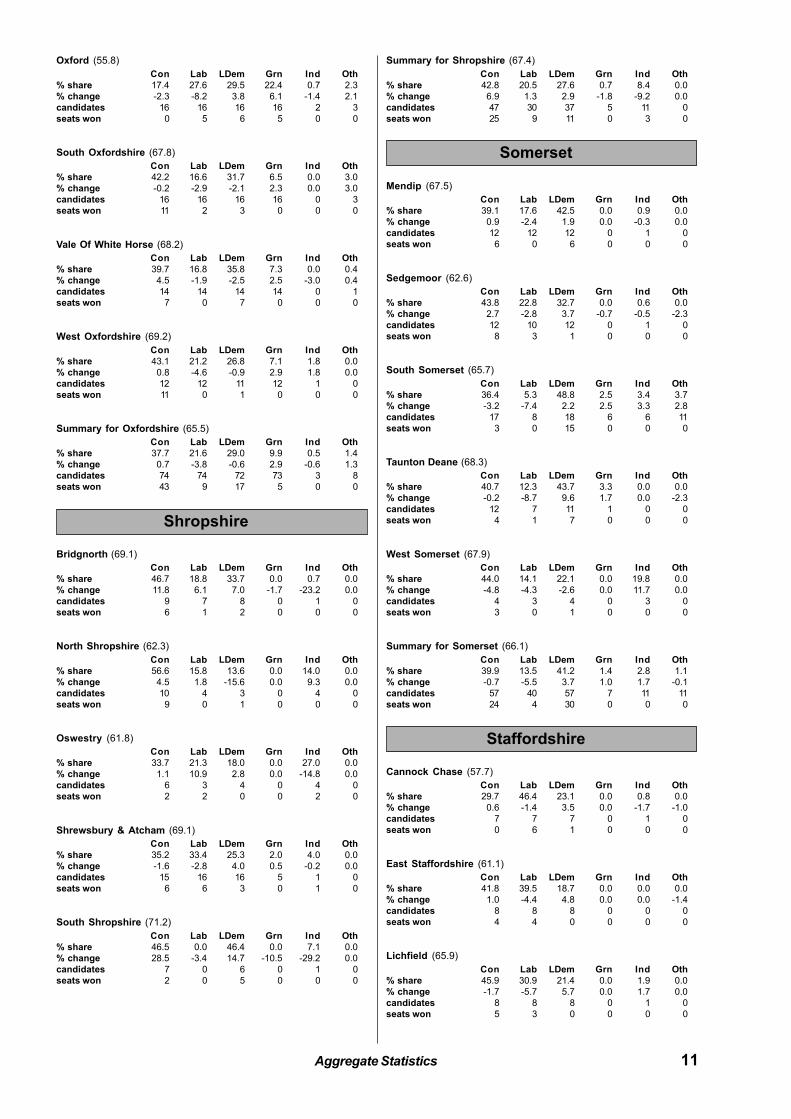
Oxford (55.8)
Con Lab LDem Grn Ind Oth
% share 17.4 27.6 29.5 22.4 0.7 2.3
% change -2.3 -8.2 3.8 6.1 -1.4 2.1
candidates 16 16 16 16 2 3
seats won 0 5 6 5 0 0
South Oxfordshire (67.8)
Con Lab LDem Grn Ind Oth
% share 42.2 16.6 31.7 6.5 0.0 3.0
% change -0.2 -2.9 -2.1 2.3 0.0 3.0
candidates 16 16 16 16 0 3
seats won 11 2 3 0 0 0
Vale Of White Horse (68.2)
Con Lab LDem Grn Ind Oth
% share 39.7 16.8 35.8 7.3 0.0 0.4
% change 4.5 -1.9 -2.5 2.5 -3.0 0.4
candidates 14 14 14 14 0 1
seats won 7 0 7 0 0 0
West Oxfordshire (69.2)
Con Lab LDem Grn Ind Oth
% share 43.1 21.2 26.8 7.1 1.8 0.0
% change 0.8 -4.6 -0.9 2.9 1.8 0.0
candidates 12 12 11 12 1 0
seats won 11 0 1 0 0 0
Summary for Oxfordshire (65.5)
Con Lab LDem Grn Ind Oth
% share 37.7 21.6 29.0 9.9 0.5 1.4
% change 0.7 -3.8 -0.6 2.9 -0.6 1.3
candidates 74 74 72 73 3 8
seats won 43 9 17 5 0 0
Bridgnorth (69.1)
Con Lab LDem Grn Ind Oth
% share 46.7 18.8 33.7 0.0 0.7 0.0
% change 11.8 6.1 7.0 -1.7 -23.2 0.0
candidates 9 7 8 0 1 0
seats won 6 1 2 0 0 0
North Shropshire (62.3)
Con Lab LDem Grn Ind Oth
% share 56.6 15.8 13.6 0.0 14.0 0.0
% change 4.5 1.8 -15.6 0.0 9.3 0.0
candidates 10 4 3 0 4 0
seats won 9 0 1 0 0 0
Oswestry (61.8)
Con Lab LDem Grn Ind Oth
% share 33.7 21.3 18.0 0.0 27.0 0.0
% change 1.1 10.9 2.8 0.0 -14.8 0.0
candidates 6 3 4 0 4 0
seats won 2 2 0 0 2 0
Shrewsbury & Atcham (69.1)
Con Lab LDem Grn Ind Oth
% share 35.2 33.4 25.3 2.0 4.0 0.0
% change -1.6 -2.8 4.0 0.5 -0.2 0.0
candidates 15 16 16 5 1 0
seats won 6 6 3 0 1 0
South Shropshire (71.2)
Con Lab LDem Grn Ind Oth
% share 46.5 0.0 46.4 0.0 7.1 0.0
% change 28.5 -3.4 14.7 -10.5 -29.2 0.0
candidates 7 0 6 0 1 0
seats won 2 0 5 0 0 0
Summary for Shropshire (67.4)
Con Lab LDem Grn Ind Oth
% share 42.8 20.5 27.6 0.7 8.4 0.0
% change 6.9 1.3 2.9 -1.8 -9.2 0.0
candidates 47 30 37 5 11 0
seats won 25 9 11 0 3 0
Mendip (67.5)
Con Lab LDem Grn Ind Oth
% share 39.1 17.6 42.5 0.0 0.9 0.0
% change 0.9 -2.4 1.9 0.0 -0.3 0.0
candidates 12 12 12 0 1 0
seats won 6 0 6 0 0 0
Sedgemoor (62.6)
Con Lab LDem Grn Ind Oth
% share 43.8 22.8 32.7 0.0 0.6 0.0
% change 2.7 -2.8 3.7 -0.7 -0.5 -2.3
candidates 12 10 12 0 1 0
seats won 8 3 1 0 0 0
South Somerset (65.7)
Con Lab LDem Grn Ind Oth
% share 36.4 5.3 48.8 2.5 3.4 3.7
% change -3.2 -7.4 2.2 2.5 3.3 2.8
candidates 17 8 18 6 6 11
seats won 3 0 15 0 0 0
Taunton Deane (68.3)
Con Lab LDem Grn Ind Oth
% share 40.7 12.3 43.7 3.3 0.0 0.0
% change -0.2 -8.7 9.6 1.7 0.0 -2.3
candidates 12 7 11 1 0 0
seats won 4 1 7 0 0 0
West Somerset (67.9)
Con Lab LDem Grn Ind Oth
% share 44.0 14.1 22.1 0.0 19.8 0.0
% change -4.8 -4.3 -2.6 0.0 11.7 0.0
candidates 4 3 4 0 3 0
seats won 3 0 1 0 0 0
Summary for Somerset (66.1)
Con Lab LDem Grn Ind Oth
% share 39.9 13.5 41.2 1.4 2.8 1.1
% change -0.7 -5.5 3.7 1.0 1.7 -0.1
candidates 57 40 57 7 11 11
seats won 24 4 30 0 0 0
Cannock Chase (57.7)
Con Lab LDem Grn Ind Oth
% share 29.7 46.4 23.1 0.0 0.8 0.0
% change 0.6 -1.4 3.5 0.0 -1.7 -1.0
candidates 7 7 7 0 1 0
seats won 0 6 1 0 0 0
East Staffordshire (61.1)
Con Lab LDem Grn Ind Oth
% share 41.8 39.5 18.7 0.0 0.0 0.0
% change 1.0 -4.4 4.8 0.0 0.0 -1.4
candidates 8 8 8 0 0 0
seats won 4 4 0 0 0 0
Lichfield (65.9)
Con Lab LDem Grn Ind Oth
% share 45.9 30.9 21.4 0.0 1.9 0.0
% change -1.7 -5.7 5.7 0.0 1.7 0.0
candidates 8 8 8 0 1 0
seats won 5 3 0 0 0 0
Shropshire
Somerset
Staffordshire
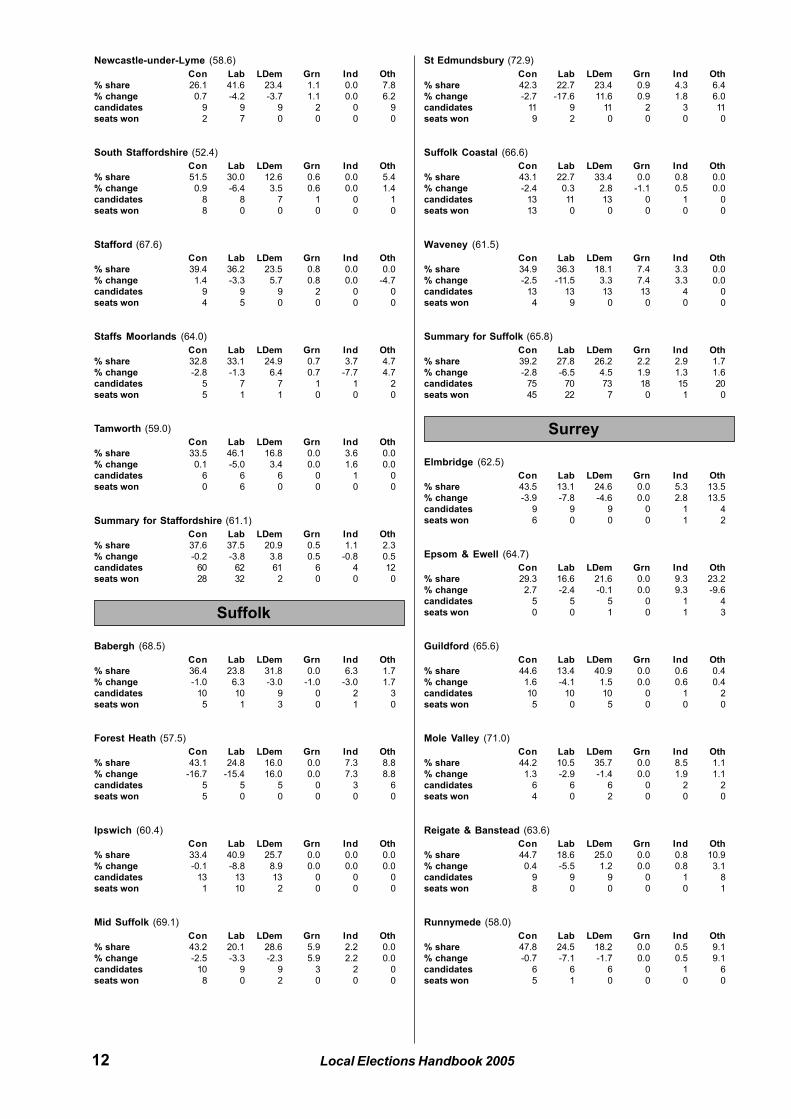
Local Elections Handbook 200512
Newcastle-under-Lyme (58.6)
Con Lab LDem Grn Ind Oth
% share 26.1 41.6 23.4 1.1 0.0 7.8
% change 0.7 -4.2 -3.7 1.1 0.0 6.2
candidates 9 9 9 2 0 9
seats won 2 7 0 0 0 0
South Staffordshire (52.4)
Con Lab LDem Grn Ind Oth
% share 51.5 30.0 12.6 0.6 0.0 5.4
% change 0.9 -6.4 3.5 0.6 0.0 1.4
candidates 8 8 7 1 0 1
seats won 8 0 0 0 0 0
Stafford (67.6)
Con Lab LDem Grn Ind Oth
% share 39.4 36.2 23.5 0.8 0.0 0.0
% change 1.4 -3.3 5.7 0.8 0.0 -4.7
candidates 9 9 9 2 0 0
seats won 4 5 0 0 0 0
Staffs Moorlands (64.0)
Con Lab LDem Grn Ind Oth
% share 32.8 33.1 24.9 0.7 3.7 4.7
% change -2.8 -1.3 6.4 0.7 -7.7 4.7
candidates 5 7 7 1 1 2
seats won 5 1 1 0 0 0
Tamworth (59.0)
Con Lab LDem Grn Ind Oth
% share 33.5 46.1 16.8 0.0 3.6 0.0
% change 0.1 -5.0 3.4 0.0 1.6 0.0
candidates 6 6 6 0 1 0
seats won 0 6 0 0 0 0
Summary for Staffordshire (61.1)
Con Lab LDem Grn Ind Oth
% share 37.6 37.5 20.9 0.5 1.1 2.3
% change -0.2 -3.8 3.8 0.5 -0.8 0.5
candidates 60 62 61 6 4 12
seats won 28 32 2 0 0 0
Babergh (68.5)
Con Lab LDem Grn Ind Oth
% share 36.4 23.8 31.8 0.0 6.3 1.7
% change -1.0 6.3 -3.0 -1.0 -3.0 1.7
candidates 10 10 9 0 2 3
seats won 5 1 3 0 1 0
Forest Heath (57.5)
Con Lab LDem Grn Ind Oth
% share 43.1 24.8 16.0 0.0 7.3 8.8
% change -16.7 -15.4 16.0 0.0 7.3 8.8
candidates 5 5 5 0 3 6
seats won 5 0 0 0 0 0
Ipswich (60.4)
Con Lab LDem Grn Ind Oth
% share 33.4 40.9 25.7 0.0 0.0 0.0
% change -0.1 -8.8 8.9 0.0 0.0 0.0
candidates 13 13 13 0 0 0
seats won 1 10 2 0 0 0
Mid Suffolk (69.1)
Con Lab LDem Grn Ind Oth
% share 43.2 20.1 28.6 5.9 2.2 0.0
% change -2.5 -3.3 -2.3 5.9 2.2 0.0
candidates 10 9 9 3 2 0
seats won 8 0 2 0 0 0
St Edmundsbury (72.9)
Con Lab LDem Grn Ind Oth
% share 42.3 22.7 23.4 0.9 4.3 6.4
% change -2.7 -17.6 11.6 0.9 1.8 6.0
candidates 11 9 11 2 3 11
seats won 9 2 0 0 0 0
Suffolk Coastal (66.6)
Con Lab LDem Grn Ind Oth
% share 43.1 22.7 33.4 0.0 0.8 0.0
% change -2.4 0.3 2.8 -1.1 0.5 0.0
candidates 13 11 13 0 1 0
seats won 13 0 0 0 0 0
Waveney (61.5)
Con Lab LDem Grn Ind Oth
% share 34.9 36.3 18.1 7.4 3.3 0.0
% change -2.5 -11.5 3.3 7.4 3.3 0.0
candidates 13 13 13 13 4 0
seats won 4 9 0 0 0 0
Summary for Suffolk (65.8)
Con Lab LDem Grn Ind Oth
% share 39.2 27.8 26.2 2.2 2.9 1.7
% change -2.8 -6.5 4.5 1.9 1.3 1.6
candidates 75 70 73 18 15 20
seats won 45 22 7 0 1 0
Elmbridge (62.5)
Con Lab LDem Grn Ind Oth
% share 43.5 13.1 24.6 0.0 5.3 13.5
% change -3.9 -7.8 -4.6 0.0 2.8 13.5
candidates 9 9 9 0 1 4
seats won 6 0 0 0 1 2
Epsom & Ewell (64.7)
Con Lab LDem Grn Ind Oth
% share 29.3 16.6 21.6 0.0 9.3 23.2
% change 2.7 -2.4 -0.1 0.0 9.3 -9.6
candidates 5 5 5 0 1 4
seats won 0 0 1 0 1 3
Guildford (65.6)
Con Lab LDem Grn Ind Oth
% share 44.6 13.4 40.9 0.0 0.6 0.4
% change 1.6 -4.1 1.5 0.0 0.6 0.4
candidates 10 10 10 0 1 2
seats won 5 0 5 0 0 0
Mole Valley (71.0)
Con Lab LDem Grn Ind Oth
% share 44.2 10.5 35.7 0.0 8.5 1.1
% change 1.3 -2.9 -1.4 0.0 1.9 1.1
candidates 6 6 6 0 2 2
seats won 4 0 2 0 0 0
Reigate & Banstead (63.6)
Con Lab LDem Grn Ind Oth
% share 44.7 18.6 25.0 0.0 0.8 10.9
% change 0.4 -5.5 1.2 0.0 0.8 3.1
candidates 9 9 9 0 1 8
seats won 8 0 0 0 0 1
Runnymede (58.0)
Con Lab LDem Grn Ind Oth
% share 47.8 24.5 18.2 0.0 0.5 9.1
% change -0.7 -7.1 -1.7 0.0 0.5 9.1
candidates 6 6 6 0 1 6
seats won 5 1 0 0 0 0
Suffolk
Surrey
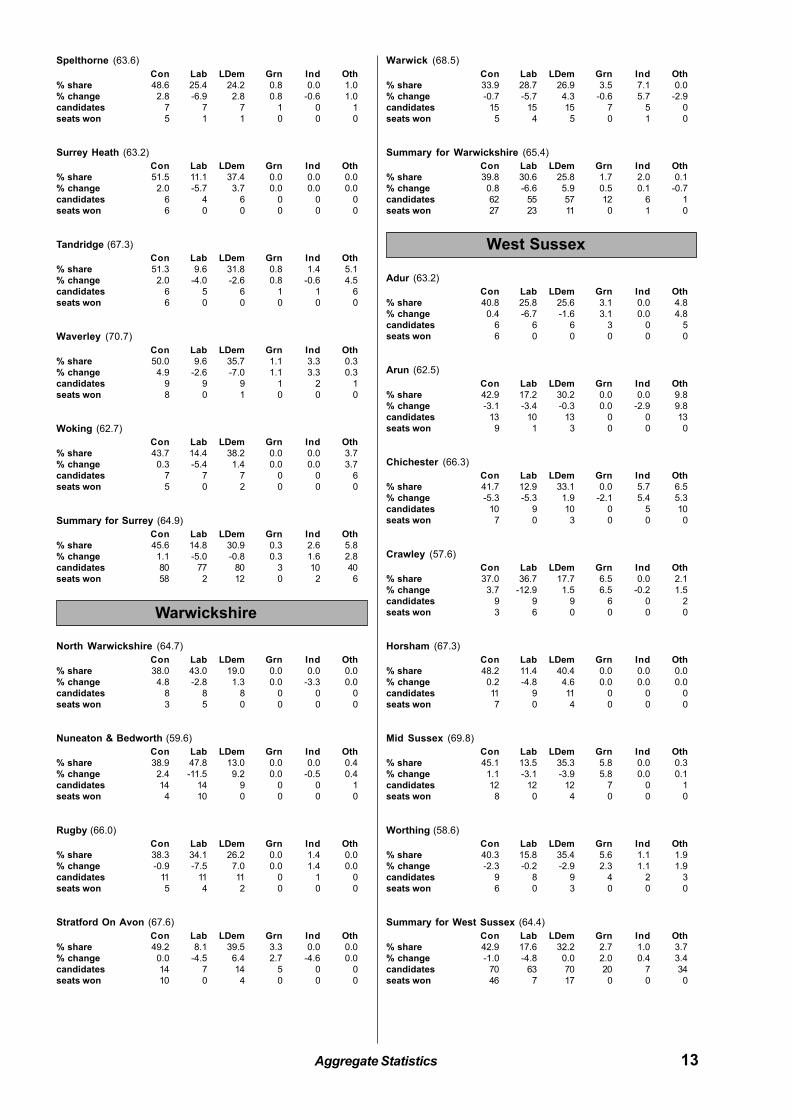
Aggregate Statistics 13
Spelthorne (63.6)
Con Lab LDem Grn Ind Oth
% share 48.6 25.4 24.2 0.8 0.0 1.0
% change 2.8 -6.9 2.8 0.8 -0.6 1.0
candidates 7 7 7 1 0 1
seats won 5 1 1 0 0 0
Surrey Heath (63.2)
Con Lab LDem Grn Ind Oth
% share 51.5 11.1 37.4 0.0 0.0 0.0
% change 2.0 -5.7 3.7 0.0 0.0 0.0
candidates 6 4 6 0 0 0
seats won 6 0 0 0 0 0
Tandridge (67.3)
Con Lab LDem Grn Ind Oth
% share 51.3 9.6 31.8 0.8 1.4 5.1
% change 2.0 -4.0 -2.6 0.8 -0.6 4.5
candidates 6 5 6 1 1 6
seats won 6 0 0 0 0 0
Waverley (70.7)
Con Lab LDem Grn Ind Oth
% share 50.0 9.6 35.7 1.1 3.3 0.3
% change 4.9 -2.6 -7.0 1.1 3.3 0.3
candidates 9 9 9 1 2 1
seats won 8 0 1 0 0 0
Woking (62.7)
Con Lab LDem Grn Ind Oth
% share 43.7 14.4 38.2 0.0 0.0 3.7
% change 0.3 -5.4 1.4 0.0 0.0 3.7
candidates 7 7 7 0 0 6
seats won 5 0 2 0 0 0
Summary for Surrey (64.9)
Con Lab LDem Grn Ind Oth
% share 45.6 14.8 30.9 0.3 2.6 5.8
% change 1.1 -5.0 -0.8 0.3 1.6 2.8
candidates 80 77 80 3 10 40
seats won 58 2 12 0 2 6
North Warwickshire (64.7)
Con Lab LDem Grn Ind Oth
% share 38.0 43.0 19.0 0.0 0.0 0.0
% change 4.8 -2.8 1.3 0.0 -3.3 0.0
candidates 8 8 8 0 0 0
seats won 3 5 0 0 0 0
Nuneaton & Bedworth (59.6)
Con Lab LDem Grn Ind Oth
% share 38.9 47.8 13.0 0.0 0.0 0.4
% change 2.4 -11.5 9.2 0.0 -0.5 0.4
candidates 14 14 9 0 0 1
seats won 4 10 0 0 0 0
Rugby (66.0)
Con Lab LDem Grn Ind Oth
% share 38.3 34.1 26.2 0.0 1.4 0.0
% change -0.9 -7.5 7.0 0.0 1.4 0.0
candidates 11 11 11 0 1 0
seats won 5 4 2 0 0 0
Stratford On Avon (67.6)
Con Lab LDem Grn Ind Oth
% share 49.2 8.1 39.5 3.3 0.0 0.0
% change 0.0 -4.5 6.4 2.7 -4.6 0.0
candidates 14 7 14 5 0 0
seats won 10 0 4 0 0 0
Warwick (68.5)
Con Lab LDem Grn Ind Oth
% share 33.9 28.7 26.9 3.5 7.1 0.0
% change -0.7 -5.7 4.3 -0.6 5.7 -2.9
candidates 15 15 15 7 5 0
seats won 5 4 5 0 1 0
Summary for Warwickshire (65.4)
Con Lab LDem Grn Ind Oth
% share 39.8 30.6 25.8 1.7 2.0 0.1
% change 0.8 -6.6 5.9 0.5 0.1 -0.7
candidates 62 55 57 12 6 1
seats won 27 23 11 0 1 0
Adur (63.2)
Con Lab LDem Grn Ind Oth
% share 40.8 25.8 25.6 3.1 0.0 4.8
% change 0.4 -6.7 -1.6 3.1 0.0 4.8
candidates 6 6 6 3 0 5
seats won 6 0 0 0 0 0
Arun (62.5)
Con Lab LDem Grn Ind Oth
% share 42.9 17.2 30.2 0.0 0.0 9.8
% change -3.1 -3.4 -0.3 0.0 -2.9 9.8
candidates 13 10 13 0 0 13
seats won 9 1 3 0 0 0
Chichester (66.3)
Con Lab LDem Grn Ind Oth
% share 41.7 12.9 33.1 0.0 5.7 6.5
% change -5.3 -5.3 1.9 -2.1 5.4 5.3
candidates 10 9 10 0 5 10
seats won 7 0 3 0 0 0
Crawley (57.6)
Con Lab LDem Grn Ind Oth
% share 37.0 36.7 17.7 6.5 0.0 2.1
% change 3.7 -12.9 1.5 6.5 -0.2 1.5
candidates 9 9 9 6 0 2
seats won 3 6 0 0 0 0
Horsham (67.3)
Con Lab LDem Grn Ind Oth
% share 48.2 11.4 40.4 0.0 0.0 0.0
% change 0.2 -4.8 4.6 0.0 0.0 0.0
candidates 11 9 11 0 0 0
seats won 7 0 4 0 0 0
Mid Sussex (69.8)
Con Lab LDem Grn Ind Oth
% share 45.1 13.5 35.3 5.8 0.0 0.3
% change 1.1 -3.1 -3.9 5.8 0.0 0.1
candidates 12 12 12 7 0 1
seats won 8 0 4 0 0 0
Worthing (58.6)
Con Lab LDem Grn Ind Oth
% share 40.3 15.8 35.4 5.6 1.1 1.9
% change -2.3 -0.2 -2.9 2.3 1.1 1.9
candidates 9 8 9 4 2 3
seats won 6 0 3 0 0 0
Summary for West Sussex (64.4)
Con Lab LDem Grn Ind Oth
% share 42.9 17.6 32.2 2.7 1.0 3.7
% change -1.0 -4.8 0.0 2.0 0.4 3.4
candidates 70 63 70 20 7 34
seats won 46 7 17 0 0 0
Warwickshire
West Sussex
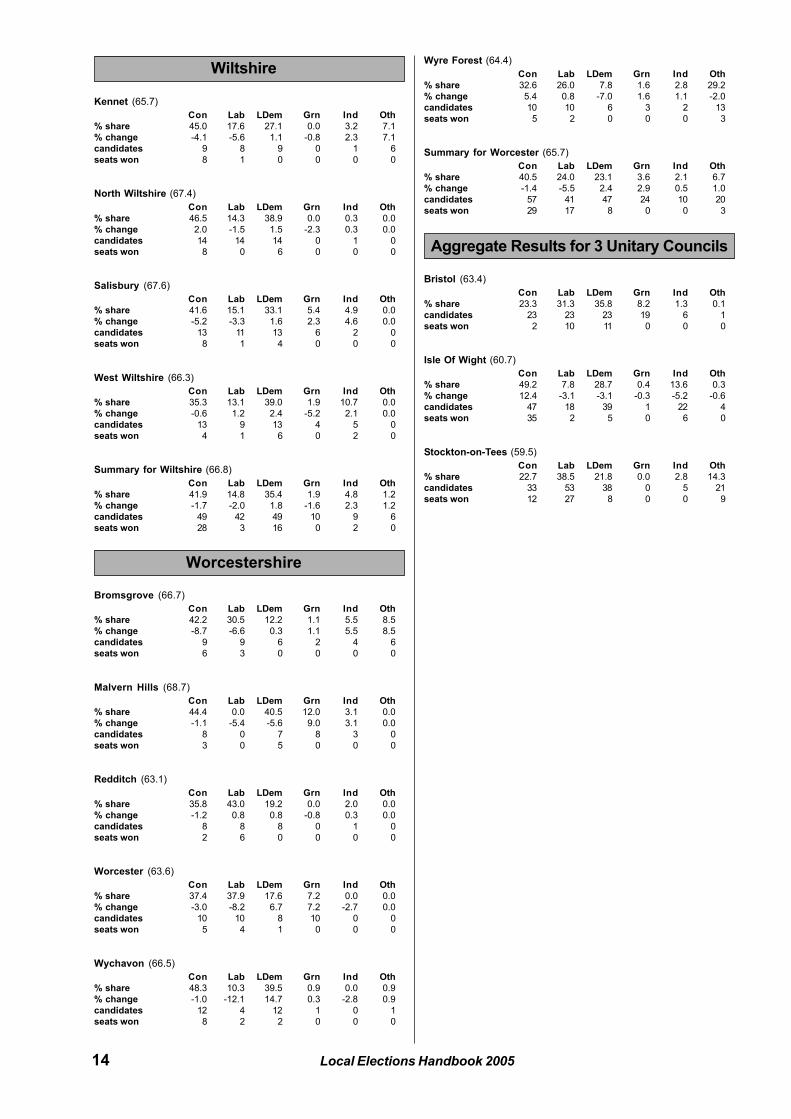
Local Elections Handbook 200514
Kennet (65.7)
Con Lab LDem Grn Ind Oth
% share 45.0 17.6 27.1 0.0 3.2 7.1
% change -4.1 -5.6 1.1 -0.8 2.3 7.1
candidates 9 8 9 0 1 6
seats won 8 1 0 0 0 0
North Wiltshire (67.4)
Con Lab LDem Grn Ind Oth
% share 46.5 14.3 38.9 0.0 0.3 0.0
% change 2.0 -1.5 1.5 -2.3 0.3 0.0
candidates 14 14 14 0 1 0
seats won 8 0 6 0 0 0
Salisbury (67.6)
Con Lab LDem Grn Ind Oth
% share 41.6 15.1 33.1 5.4 4.9 0.0
% change -5.2 -3.3 1.6 2.3 4.6 0.0
candidates 13 11 13 6 2 0
seats won 8 1 4 0 0 0
West Wiltshire (66.3)
Con Lab LDem Grn Ind Oth
% share 35.3 13.1 39.0 1.9 10.7 0.0
% change -0.6 1.2 2.4 -5.2 2.1 0.0
candidates 13 9 13 4 5 0
seats won 4 1 6 0 2 0
Summary for Wiltshire (66.8)
Con Lab LDem Grn Ind Oth
% share 41.9 14.8 35.4 1.9 4.8 1.2
% change -1.7 -2.0 1.8 -1.6 2.3 1.2
candidates 49 42 49 10 9 6
seats won 28 3 16 0 2 0
Bromsgrove (66.7)
Con Lab LDem Grn Ind Oth
% share 42.2 30.5 12.2 1.1 5.5 8.5
% change -8.7 -6.6 0.3 1.1 5.5 8.5
candidates 9 9 6 2 4 6
seats won 6 3 0 0 0 0
Malvern Hills (68.7)
Con Lab LDem Grn Ind Oth
% share 44.4 0.0 40.5 12.0 3.1 0.0
% change -1.1 -5.4 -5.6 9.0 3.1 0.0
candidates 8 0 7 8 3 0
seats won 3 0 5 0 0 0
Redditch (63.1)
Con Lab LDem Grn Ind Oth
% share 35.8 43.0 19.2 0.0 2.0 0.0
% change -1.2 0.8 0.8 -0.8 0.3 0.0
candidates 8 8 8 0 1 0
seats won 2 6 0 0 0 0
Worcester (63.6)
Con Lab LDem Grn Ind Oth
% share 37.4 37.9 17.6 7.2 0.0 0.0
% change -3.0 -8.2 6.7 7.2 -2.7 0.0
candidates 10 10 8 10 0 0
seats won 5 4 1 0 0 0
Wychavon (66.5)
Con Lab LDem Grn Ind Oth
% share 48.3 10.3 39.5 0.9 0.0 0.9
% change -1.0 -12.1 14.7 0.3 -2.8 0.9
candidates 12 4 12 1 0 1
seats won 8 2 2 0 0 0
Wyre Forest (64.4)
Con Lab LDem Grn Ind Oth
% share 32.6 26.0 7.8 1.6 2.8 29.2
% change 5.4 0.8 -7.0 1.6 1.1 -2.0
candidates 10 10 6 3 2 13
seats won 5 2 0 0 0 3
Summary for Worcester (65.7)
Con Lab LDem Grn Ind Oth
% share 40.5 24.0 23.1 3.6 2.1 6.7
% change -1.4 -5.5 2.4 2.9 0.5 1.0
candidates 57 41 47 24 10 20
seats won 29 17 8 0 0 3
Wiltshire
Worcestershire
Bristol (63.4)
Con Lab LDem Grn Ind Oth
% share 23.3 31.3 35.8 8.2 1.3 0.1
candidates 23 23 23 19 6 1
seats won 2 10 11 0 0 0
Isle Of Wight (60.7)
Con Lab LDem Grn Ind Oth
% share 49.2 7.8 28.7 0.4 13.6 0.3
% change 12.4 -3.1 -3.1 -0.3 -5.2 -0.6
candidates 47 18 39 1 22 4
seats won 35 2 5 0 6 0
Stockton-on-Tees (59.5)
Con Lab LDem Grn Ind Oth
% share 22.7 38.5 21.8 0.0 2.8 14.3
candidates 33 53 38 0 5 21
seats won 12 27 8 0 0 9
Aggregate Results for 3 Unitary Councils
County Council
Election Results

2
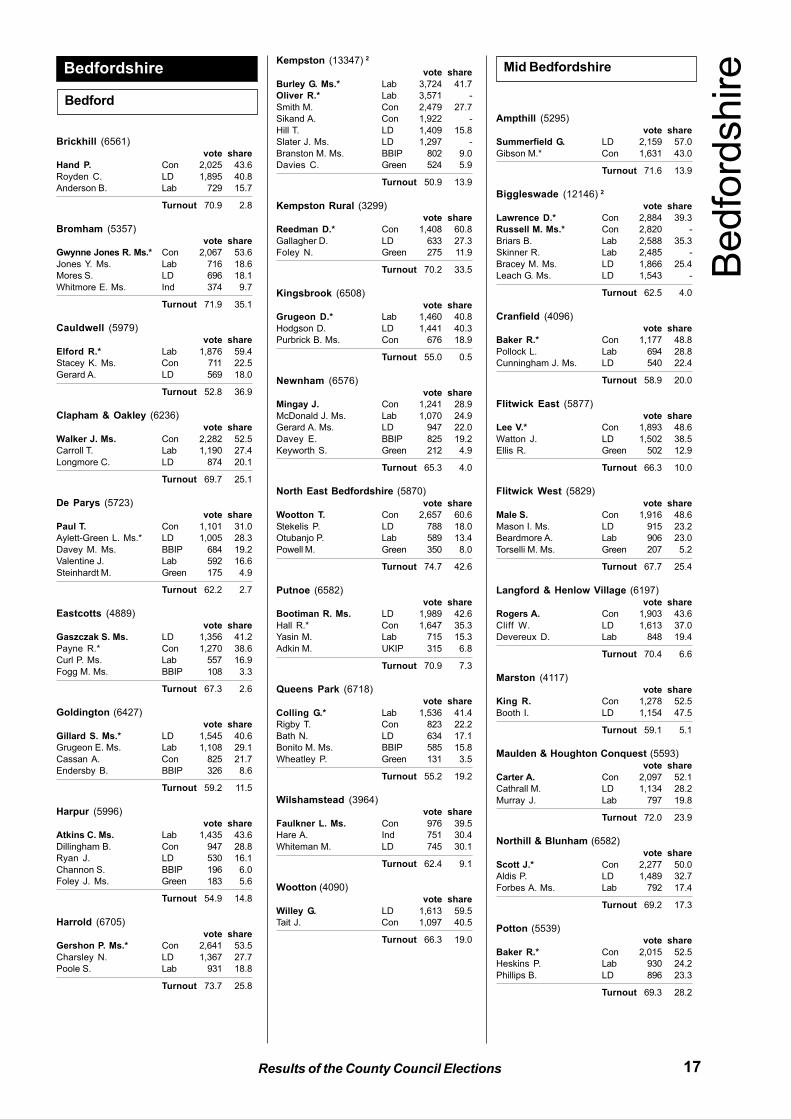
17Results of the County Council Elections
Brickhill (6561)
vote share
Hand P. Con 2,025 43.6
Royden C. LD 1,895 40.8
Anderson B. Lab 729 15.7
Turnout 70.9 2.8
Bromham (5357)
vote share
Gwynne Jones R. Ms.* Con 2,067 53.6
Jones Y. Ms. Lab 716 18.6
Mores S. LD 696 18.1
Whitmore E. Ms. Ind 374 9.7
Turnout 71.9 35.1
Cauldwell (5979)
vote share
Elford R.* Lab 1,876 59.4
Stacey K. Ms. Con 711 22.5
Gerard A. LD 569 18.0
Turnout 52.8 36.9
Clapham & Oakley (6236)
vote share
Walker J. Ms. Con 2,282 52.5
Carroll T. Lab 1,190 27.4
Longmore C. LD 874 20.1
Turnout 69.7 25.1
De Parys (5723)
vote share
Paul T. Con 1,101 31.0
Aylett-Green L. Ms.* LD 1,005 28.3
Davey M. Ms. BBIP 684 19.2
Valentine J. Lab 592 16.6
Steinhardt M. Green 175 4.9
Turnout 62.2 2.7
Eastcotts (4889)
vote share
Gaszczak S. Ms. LD 1,356 41.2
Payne R.* Con 1,270 38.6
Curl P. Ms. Lab 557 16.9
Fogg M. Ms. BBIP 108 3.3
Turnout 67.3 2.6
Goldington (6427)
vote share
Gillard S. Ms.* LD 1,545 40.6
Grugeon E. Ms. Lab 1,108 29.1
Cassan A. Con 825 21.7
Endersby B. BBIP 326 8.6
Turnout 59.2 11.5
Harpur (5996)
vote share
Atkins C. Ms. Lab 1,435 43.6
Dillingham B. Con 947 28.8
Ryan J. LD 530 16.1
Channon S. BBIP 196 6.0
Foley J. Ms. Green 183 5.6
Turnout 54.9 14.8
Harrold (6705)
vote share
Gershon P. Ms.* Con 2,641 53.5
Charsley N. LD 1,367 27.7
Poole S. Lab 931 18.8
Turnout 73.7 25.8
Kempston (13347) 2
vote share
Burley G. Ms.* Lab 3,724 41.7
Oliver R.* Lab 3,571 -
Smith M. Con 2,479 27.7
Sikand A. Con 1,922 -
Hill T. LD 1,409 15.8
Slater J. Ms. LD 1,297 -
Branston M. Ms. BBIP 802 9.0
Davies C. Green 524 5.9
Turnout 50.9 13.9
Kempston Rural (3299)
vote share
Reedman D.* Con 1,408 60.8
Gallagher D. LD 633 27.3
Foley N. Green 275 11.9
Turnout 70.2 33.5
Kingsbrook (6508)
vote share
Grugeon D.* Lab 1,460 40.8
Hodgson D. LD 1,441 40.3
Purbrick B. Ms. Con 676 18.9
Turnout 55.0 0.5
Newnham (6576)
vote share
Mingay J. Con 1,241 28.9
McDonald J. Ms. Lab 1,070 24.9
Gerard A. Ms. LD 947 22.0
Davey E. BBIP 825 19.2
Keyworth S. Green 212 4.9
Turnout 65.3 4.0
North East Bedfordshire (5870)
vote share
Wootton T. Con 2,657 60.6
Stekelis P. LD 788 18.0
Otubanjo P. Lab 589 13.4
Powell M. Green 350 8.0
Turnout 74.7 42.6
Putnoe (6582)
vote share
Bootiman R. Ms. LD 1,989 42.6
Hall R.* Con 1,647 35.3
Yasin M. Lab 715 15.3
Adkin M. UKIP 315 6.8
Turnout 70.9 7.3
Queens Park (6718)
vote share
Colling G.* Lab 1,536 41.4
Rigby T. Con 823 22.2
Bath N. LD 634 17.1
Bonito M. Ms. BBIP 585 15.8
Wheatley P. Green 131 3.5
Turnout 55.2 19.2
Wilshamstead (3964)
vote share
Faulkner L. Ms. Con 976 39.5
Hare A. Ind 751 30.4
Whiteman M. LD 745 30.1
Turnout 62.4 9.1
Wootton (4090)
vote share
Willey G. LD 1,613 59.5
Tait J. Con 1,097 40.5
Turnout 66.3 19.0
Ampthill (5295)
vote share
Summerfield G. LD 2,159 57.0
Gibson M.* Con 1,631 43.0
Turnout 71.6 13.9
Biggleswade (12146) 2
vote share
Lawrence D.* Con 2,884 39.3
Russell M. Ms.* Con 2,820 -
Briars B. Lab 2,588 35.3
Skinner R. Lab 2,485 -
Bracey M. Ms. LD 1,866 25.4
Leach G. Ms. LD 1,543 -
Turnout 62.5 4.0
Cranfield (4096)
vote share
Baker R.* Con 1,177 48.8
Pollock L. Lab 694 28.8
Cunningham J. Ms. LD 540 22.4
Turnout 58.9 20.0
Flitwick East (5877)
vote share
Lee V.* Con 1,893 48.6
Watton J. LD 1,502 38.5
Ellis R. Green 502 12.9
Turnout 66.3 10.0
Flitwick West (5829)
vote share
Male S. Con 1,916 48.6
Mason I. Ms. LD 915 23.2
Beardmore A. Lab 906 23.0
Torselli M. Ms. Green 207 5.2
Turnout 67.7 25.4
Langford & Henlow Village (6197)
vote share
Rogers A. Con 1,903 43.6
Cliff W. LD 1,613 37.0
Devereux D. Lab 848 19.4
Turnout 70.4 6.6
Marston (4117)
vote share
King R. Con 1,278 52.5
Booth I. LD 1,154 47.5
Turnout 59.1 5.1
Maulden & Houghton Conquest (5593)
vote share
Carter A. Con 2,097 52.1
Cathrall M. LD 1,134 28.2
Murray J. Lab 797 19.8
Turnout 72.0 23.9
Northill & Blunham (6582)
vote share
Scott J.* Con 2,277 50.0
Aldis P. LD 1,489 32.7
Forbes A. Ms. Lab 792 17.4
Turnout 69.2 17.3
Potton (5539)
vote share
Baker R.* Con 2,015 52.5
Heskins P. Lab 930 24.2
Phillips B. LD 896 23.3
Turnout 69.3 28.2
Bedfordshire
Bedford
Mid Bedfordshire
Bedfo
rdshire
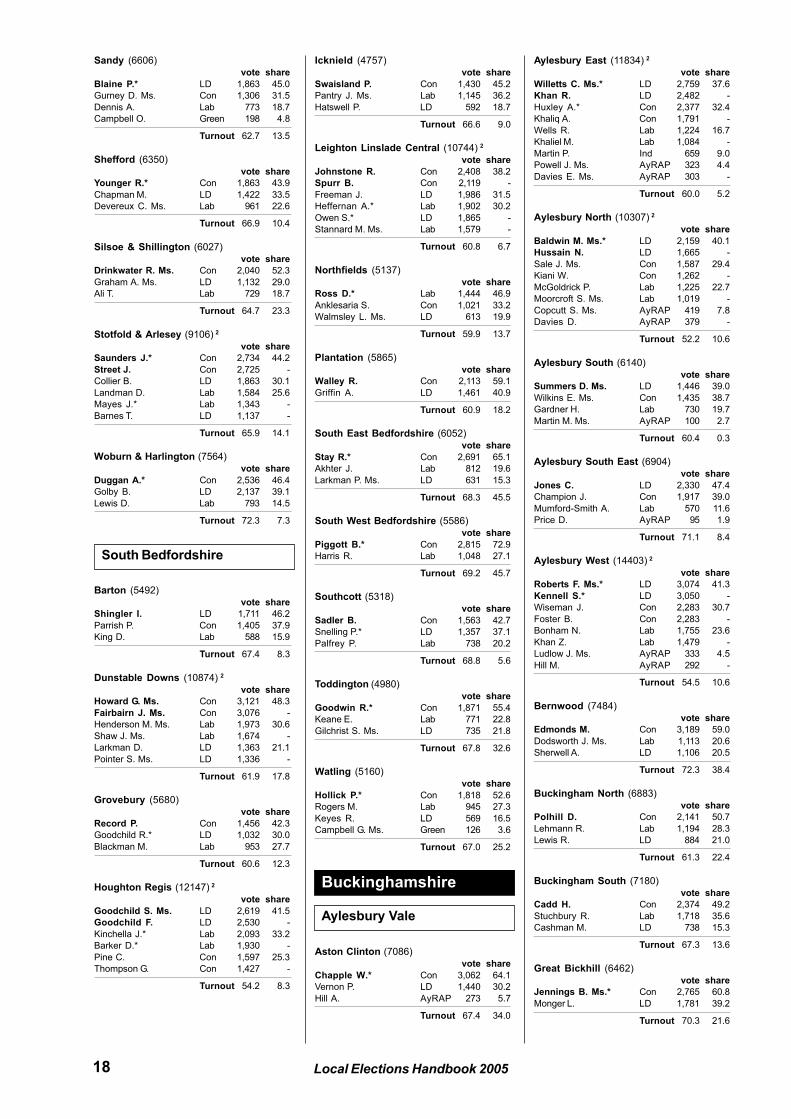
18 Local Elections Handbook 2005
Sandy (6606)
vote share
Blaine P.* LD 1,863 45.0
Gurney D. Ms. Con 1,306 31.5
Dennis A. Lab 773 18.7
Campbell O. Green 198 4.8
Turnout 62.7 13.5
Shefford (6350)
vote share
Younger R.* Con 1,863 43.9
Chapman M. LD 1,422 33.5
Devereux C. Ms. Lab 961 22.6
Turnout 66.9 10.4
Silsoe & Shillington (6027)
vote share
Drinkwater R. Ms. Con 2,040 52.3
Graham A. Ms. LD 1,132 29.0
Ali T. Lab 729 18.7
Turnout 64.7 23.3
Stotfold & Arlesey (9106) 2
vote share
Saunders J.* Con 2,734 44.2
Street J. Con 2,725 -
Collier B. LD 1,863 30.1
Landman D. Lab 1,584 25.6
Mayes J.* Lab 1,343 -
Barnes T. LD 1,137 -
Turnout 65.9 14.1
Woburn & Harlington (7564)
vote share
Duggan A.* Con 2,536 46.4
Golby B. LD 2,137 39.1
Lewis D. Lab 793 14.5
Turnout 72.3 7.3
Barton (5492)
vote share
Shingler I. LD 1,711 46.2
Parrish P. Con 1,405 37.9
King D. Lab 588 15.9
Turnout 67.4 8.3
Dunstable Downs (10874) 2
vote share
Howard G. Ms. Con 3,121 48.3
Fairbairn J. Ms. Con 3,076 -
Henderson M. Ms. Lab 1,973 30.6
Shaw J. Ms. Lab 1,674 -
Larkman D. LD 1,363 21.1
Pointer S. Ms. LD 1,336 -
Turnout 61.9 17.8
Grovebury (5680)
vote share
Record P. Con 1,456 42.3
Goodchild R.* LD 1,032 30.0
Blackman M. Lab 953 27.7
Turnout 60.6 12.3
Houghton Regis (12147) 2
vote share
Goodchild S. Ms. LD 2,619 41.5
Goodchild F. LD 2,530 -
Kinchella J.* Lab 2,093 33.2
Barker D.* Lab 1,930 -
Pine C. Con 1,597 25.3
Thompson G. Con 1,427 -
Turnout 54.2 8.3
Icknield (4757)
vote share
Swaisland P. Con 1,430 45.2
Pantry J. Ms. Lab 1,145 36.2
Hatswell P. LD 592 18.7
Turnout 66.6 9.0
Leighton Linslade Central (10744) 2
vote share
Johnstone R. Con 2,408 38.2
Spurr B. Con 2,119 -
Freeman J. LD 1,986 31.5
Heffernan A.* Lab 1,902 30.2
Owen S.* LD 1,865 -
Stannard M. Ms. Lab 1,579 -
Turnout 60.8 6.7
Northfields (5137)
vote share
Ross D.* Lab 1,444 46.9
Anklesaria S. Con 1,021 33.2
Walmsley L. Ms. LD 613 19.9
Turnout 59.9 13.7
Plantation (5865)
vote share
Walley R. Con 2,113 59.1
Griffin A. LD 1,461 40.9
Turnout 60.9 18.2
South East Bedfordshire (6052)
vote share
Stay R.* Con 2,691 65.1
Akhter J. Lab 812 19.6
Larkman P. Ms. LD 631 15.3
Turnout 68.3 45.5
South West Bedfordshire (5586)
vote share
Piggott B.* Con 2,815 72.9
Harris R. Lab 1,048 27.1
Turnout 69.2 45.7
Southcott (5318)
vote share
Sadler B. Con 1,563 42.7
Snelling P.* LD 1,357 37.1
Palfrey P. Lab 738 20.2
Turnout 68.8 5.6
Toddington (4980)
vote share
Goodwin R.* Con 1,871 55.4
Keane E. Lab 771 22.8
Gilchrist S. Ms. LD 735 21.8
Turnout 67.8 32.6
Watling (5160)
vote share
Hollick P.* Con 1,818 52.6
Rogers M. Lab 945 27.3
Keyes R. LD 569 16.5
Campbell G. Ms. Green 126 3.6
Turnout 67.0 25.2
Aston Clinton (7086)
vote share
Chapple W.* Con 3,062 64.1
Vernon P. LD 1,440 30.2
Hill A. AyRAP 273 5.7
Turnout 67.4 34.0
Aylesbury East (11834) 2
vote share
Willetts C. Ms.* LD 2,759 37.6
Khan R. LD 2,482 -
Huxley A.* Con 2,377 32.4
Khaliq A. Con 1,791 -
Wells R. Lab 1,224 16.7
Khaliel M. Lab 1,084 -
Martin P. Ind 659 9.0
Powell J. Ms. AyRAP 323 4.4
Davies E. Ms. AyRAP 303 -
Turnout 60.0 5.2
Aylesbury North (10307) 2
vote share
Baldwin M. Ms.* LD 2,159 40.1
Hussain N. LD 1,665 -
Sale J. Ms. Con 1,587 29.4
Kiani W. Con 1,262 -
McGoldrick P. Lab 1,225 22.7
Moorcroft S. Ms. Lab 1,019 -
Copcutt S. Ms. AyRAP 419 7.8
Davies D. AyRAP 379 -
Turnout 52.2 10.6
Aylesbury South (6140)
vote share
Summers D. Ms. LD 1,446 39.0
Wilkins E. Ms. Con 1,435 38.7
Gardner H. Lab 730 19.7
Martin M. Ms. AyRAP 100 2.7
Turnout 60.4 0.3
Aylesbury South East (6904)
vote share
Jones C. LD 2,330 47.4
Champion J. Con 1,917 39.0
Mumford-Smith A. Lab 570 11.6
Price D. AyRAP 95 1.9
Turnout 71.1 8.4
Aylesbury West (14403) 2
vote share
Roberts F. Ms.* LD 3,074 41.3
Kennell S.* LD 3,050 -
Wiseman J. Con 2,283 30.7
Foster B. Con 2,283 -
Bonham N. Lab 1,755 23.6
Khan Z. Lab 1,479 -
Ludlow J. Ms. AyRAP 333 4.5
Hill M. AyRAP 292 -
Turnout 54.5 10.6
Bernwood (7484)
vote share
Edmonds M. Con 3,189 59.0
Dodsworth J. Ms. Lab 1,113 20.6
Sherwell A. LD 1,106 20.5
Turnout 72.3 38.4
Buckingham North (6883)
vote share
Polhill D. Con 2,141 50.7
Lehmann R. Lab 1,194 28.3
Lewis R. LD 884 21.0
Turnout 61.3 22.4
Buckingham South (7180)
vote share
Cadd H. Con 2,374 49.2
Stuchbury R. Lab 1,718 35.6
Cashman M. LD 738 15.3
Turnout 67.3 13.6
Great Bickhill (6462)
vote share
Jennings B. Ms.* Con 2,765 60.8
Monger L. LD 1,781 39.2
Turnout 70.3 21.6
Buckinghamshire
Aylesbury Vale
South Bedfordshire
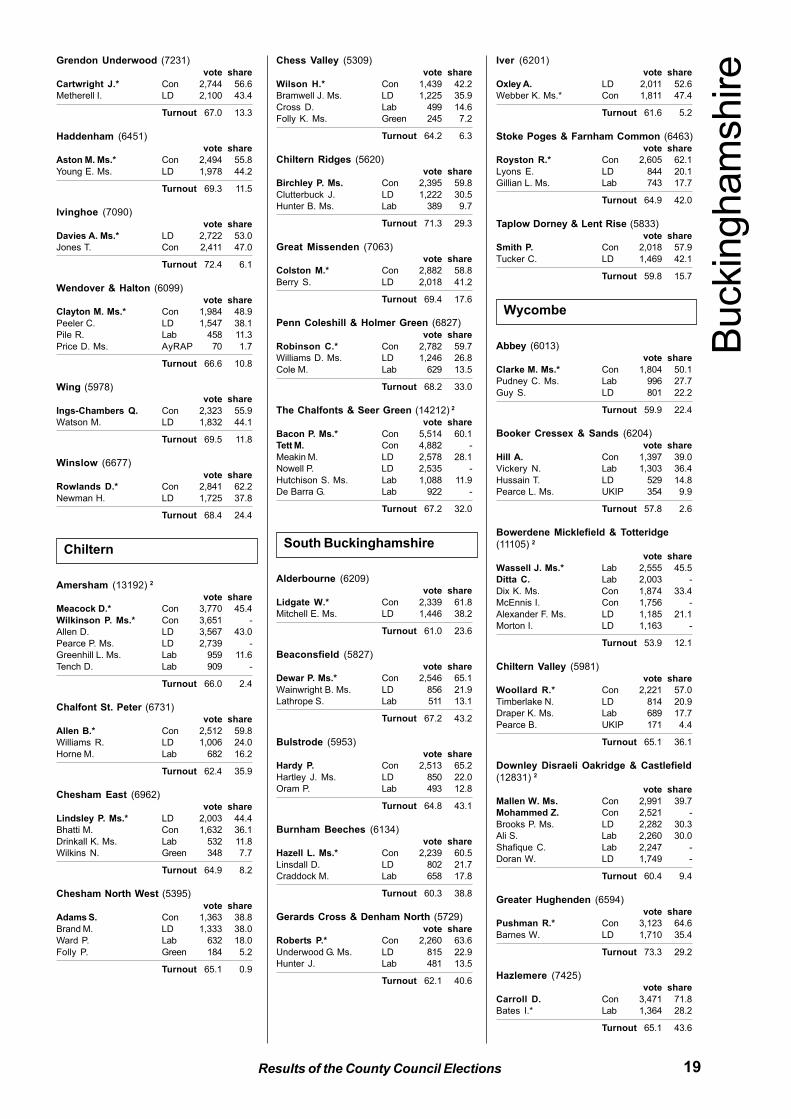
19Results of the County Council Elections
Grendon Underwood (7231)
vote share
Cartwright J.* Con 2,744 56.6
Metherell I. LD 2,100 43.4
Turnout 67.0 13.3
Haddenham (6451)
vote share
Aston M. Ms.* Con 2,494 55.8
Young E. Ms. LD 1,978 44.2
Turnout 69.3 11.5
Ivinghoe (7090)
vote share
Davies A. Ms.* LD 2,722 53.0
Jones T. Con 2,411 47.0
Turnout 72.4 6.1
Wendover & Halton (6099)
vote share
Clayton M. Ms.* Con 1,984 48.9
Peeler C. LD 1,547 38.1
Pile R. Lab 458 11.3
Price D. Ms. AyRAP 70 1.7
Turnout 66.6 10.8
Wing (5978)
vote share
Ings-Chambers Q. Con 2,323 55.9
Watson M. LD 1,832 44.1
Turnout 69.5 11.8
Winslow (6677)
vote share
Rowlands D.* Con 2,841 62.2
Newman H. LD 1,725 37.8
Turnout 68.4 24.4
Amersham (13192) 2
vote share
Meacock D.* Con 3,770 45.4
Wilkinson P. Ms.* Con 3,651 -
Allen D. LD 3,567 43.0
Pearce P. Ms. LD 2,739 -
Greenhill L. Ms. Lab 959 11.6
Tench D. Lab 909 -
Turnout 66.0 2.4
Chalfont St. Peter (6731)
vote share
Allen B.* Con 2,512 59.8
Williams R. LD 1,006 24.0
Horne M. Lab 682 16.2
Turnout 62.4 35.9
Chesham East (6962)
vote share
Lindsley P. Ms.* LD 2,003 44.4
Bhatti M. Con 1,632 36.1
Drinkall K. Ms. Lab 532 11.8
Wilkins N. Green 348 7.7
Turnout 64.9 8.2
Chesham North West (5395)
vote share
Adams S. Con 1,363 38.8
Brand M. LD 1,333 38.0
Ward P. Lab 632 18.0
Folly P. Green 184 5.2
Turnout 65.1 0.9
Chess Valley (5309)
vote share
Wilson H.* Con 1,439 42.2
Bramwell J. Ms. LD 1,225 35.9
Cross D. Lab 499 14.6
Folly K. Ms. Green 245 7.2
Turnout 64.2 6.3
Chiltern Ridges (5620)
vote share
Birchley P. Ms. Con 2,395 59.8
Clutterbuck J. LD 1,222 30.5
Hunter B. Ms. Lab 389 9.7
Turnout 71.3 29.3
Great Missenden (7063)
vote share
Colston M.* Con 2,882 58.8
Berry S. LD 2,018 41.2
Turnout 69.4 17.6
Penn Coleshill & Holmer Green (6827)
vote share
Robinson C.* Con 2,782 59.7
Williams D. Ms. LD 1,246 26.8
Cole M. Lab 629 13.5
Turnout 68.2 33.0
The Chalfonts & Seer Green (14212) 2
vote share
Bacon P. Ms.* Con 5,514 60.1
Tett M. Con 4,882 -
Meakin M. LD 2,578 28.1
Nowell P. LD 2,535 -
Hutchison S. Ms. Lab 1,088 11.9
De Barra G. Lab 922 -
Turnout 67.2 32.0
Alderbourne (6209)
vote share
Lidgate W.* Con 2,339 61.8
Mitchell E. Ms. LD 1,446 38.2
Turnout 61.0 23.6
Beaconsfield (5827)
vote share
Dewar P. Ms.* Con 2,546 65.1
Wainwright B. Ms. LD 856 21.9
Lathrope S. Lab 511 13.1
Turnout 67.2 43.2
Bulstrode (5953)
vote share
Hardy P. Con 2,513 65.2
Hartley J. Ms. LD 850 22.0
Oram P. Lab 493 12.8
Turnout 64.8 43.1
Burnham Beeches (6134)
vote share
Hazell L. Ms.* Con 2,239 60.5
Linsdall D. LD 802 21.7
Craddock M. Lab 658 17.8
Turnout 60.3 38.8
Gerards Cross & Denham North (5729)
vote share
Roberts P.* Con 2,260 63.6
Underwood G. Ms. LD 815 22.9
Hunter J. Lab 481 13.5
Turnout 62.1 40.6
Iver (6201)
vote share
Oxley A. LD 2,011 52.6
Webber K. Ms.* Con 1,811 47.4
Turnout 61.6 5.2
Stoke Poges & Farnham Common (6463)
vote share
Royston R.* Con 2,605 62.1
Lyons E. LD 844 20.1
Gillian L. Ms. Lab 743 17.7
Turnout 64.9 42.0
Taplow Dorney & Lent Rise (5833)
vote share
Smith P. Con 2,018 57.9
Tucker C. LD 1,469 42.1
Turnout 59.8 15.7
Abbey (6013)
vote share
Clarke M. Ms.* Con 1,804 50.1
Pudney C. Ms. Lab 996 27.7
Guy S. LD 801 22.2
Turnout 59.9 22.4
Booker Cressex & Sands (6204)
vote share
Hill A. Con 1,397 39.0
Vickery N. Lab 1,303 36.4
Hussain T. LD 529 14.8
Pearce L. Ms. UKIP 354 9.9
Turnout 57.8 2.6
Bowerdene Micklefield & Totteridge
(11105) 2
vote share
Wassell J. Ms.* Lab 2,555 45.5
Ditta C. Lab 2,003 -
Dix K. Ms. Con 1,874 33.4
McEnnis I. Con 1,756 -
Alexander F. Ms. LD 1,185 21.1
Morton I. LD 1,163 -
Turnout 53.9 12.1
Chiltern Valley (5981)
vote share
Woollard R.* Con 2,221 57.0
Timberlake N. LD 814 20.9
Draper K. Ms. Lab 689 17.7
Pearce B. UKIP 171 4.4
Turnout 65.1 36.1
Downley Disraeli Oakridge & Castlefield
(12831) 2
vote share
Mallen W. Ms. Con 2,991 39.7
Mohammed Z. Con 2,521 -
Brooks P. Ms. LD 2,282 30.3
Ali S. Lab 2,260 30.0
Shafique C. Lab 2,247 -
Doran W. LD 1,749 -
Turnout 60.4 9.4
Greater Hughenden (6594)
vote share
Pushman R.* Con 3,123 64.6
Barnes W. LD 1,710 35.4
Turnout 73.3 29.2
Hazlemere (7425)
vote share
Carroll D. Con 3,471 71.8
Bates I.* Lab 1,364 28.2
Turnout 65.1 43.6
Buckin
gham
shire
Wycombe
South BuckinghamshireChiltern
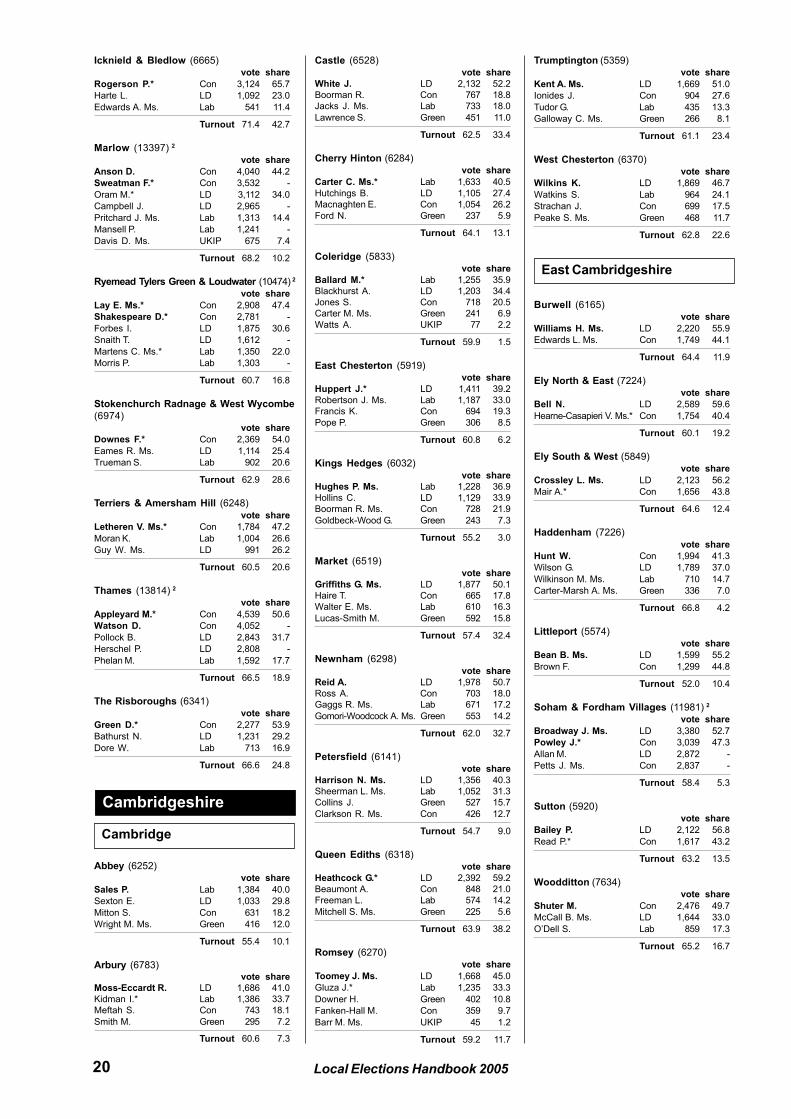
20 Local Elections Handbook 2005
Icknield & Bledlow (6665)
vote share
Rogerson P.* Con 3,124 65.7
Harte L. LD 1,092 23.0
Edwards A. Ms. Lab 541 11.4
Turnout 71.4 42.7
Marlow (13397) 2
vote share
Anson D. Con 4,040 44.2
Sweatman F.* Con 3,532 -
Oram M.* LD 3,112 34.0
Campbell J. LD 2,965 -
Pritchard J. Ms. Lab 1,313 14.4
Mansell P. Lab 1,241 -
Davis D. Ms. UKIP 675 7.4
Turnout 68.2 10.2
Ryemead Tylers Green & Loudwater (10474) 2
vote share
Lay E. Ms.* Con 2,908 47.4
Shakespeare D.* Con 2,781 -
Forbes I. LD 1,875 30.6
Snaith T. LD 1,612 -
Martens C. Ms.* Lab 1,350 22.0
Morris P. Lab 1,303 -
Turnout 60.7 16.8
Stokenchurch Radnage & West Wycombe
(6974)
vote share
Downes F.* Con 2,369 54.0
Eames R. Ms. LD 1,114 25.4
Trueman S. Lab 902 20.6
Turnout 62.9 28.6
Terriers & Amersham Hill (6248)
vote share
Letheren V. Ms.* Con 1,784 47.2
Moran K. Lab 1,004 26.6
Guy W. Ms. LD 991 26.2
Turnout 60.5 20.6
Thames (13814) 2
vote share
Appleyard M.* Con 4,539 50.6
Watson D. Con 4,052 -
Pollock B. LD 2,843 31.7
Herschel P. LD 2,808 -
Phelan M. Lab 1,592 17.7
Turnout 66.5 18.9
The Risboroughs (6341)
vote share
Green D.* Con 2,277 53.9
Bathurst N. LD 1,231 29.2
Dore W. Lab 713 16.9
Turnout 66.6 24.8
Abbey (6252)
vote share
Sales P. Lab 1,384 40.0
Sexton E. LD 1,033 29.8
Mitton S. Con 631 18.2
Wright M. Ms. Green 416 12.0
Turnout 55.4 10.1
Arbury (6783)vote share
Moss-Eccardt R. LD 1,686 41.0
Kidman I.* Lab 1,386 33.7
Meftah S. Con 743 18.1
Smith M. Green 295 7.2
Turnout 60.6 7.3
Castle (6528)
vote share
White J. LD 2,132 52.2
Boorman R. Con 767 18.8
Jacks J. Ms. Lab 733 18.0
Lawrence S. Green 451 11.0
Turnout 62.5 33.4
Cherry Hinton (6284)
vote share
Carter C. Ms.* Lab 1,633 40.5
Hutchings B. LD 1,105 27.4
Macnaghten E. Con 1,054 26.2
Ford N. Green 237 5.9
Turnout 64.1 13.1
Coleridge (5833)
vote share
Ballard M.* Lab 1,255 35.9
Blackhurst A. LD 1,203 34.4
Jones S. Con 718 20.5
Carter M. Ms. Green 241 6.9
Watts A. UKIP 77 2.2
Turnout 59.9 1.5
East Chesterton (5919)
vote share
Huppert J.* LD 1,411 39.2
Robertson J. Ms. Lab 1,187 33.0
Francis K. Con 694 19.3
Pope P. Green 306 8.5
Turnout 60.8 6.2
Kings Hedges (6032)
vote share
Hughes P. Ms. Lab 1,228 36.9
Hollins C. LD 1,129 33.9
Boorman R. Ms. Con 728 21.9
Goldbeck-Wood G. Green 243 7.3
Turnout 55.2 3.0
Market (6519)
vote share
Griffiths G. Ms. LD 1,877 50.1
Haire T. Con 665 17.8
Walter E. Ms. Lab 610 16.3
Lucas-Smith M. Green 592 15.8
Turnout 57.4 32.4
Newnham (6298)
vote share
Reid A. LD 1,978 50.7
Ross A. Con 703 18.0
Gaggs R. Ms. Lab 671 17.2
Gomori-Woodcock A. Ms. Green 553 14.2
Turnout 62.0 32.7
Petersfield (6141)
vote share
Harrison N. Ms. LD 1,356 40.3
Sheerman L. Ms. Lab 1,052 31.3
Collins J. Green 527 15.7
Clarkson R. Ms. Con 426 12.7
Turnout 54.7 9.0
Queen Ediths (6318)
vote share
Heathcock G.* LD 2,392 59.2
Beaumont A. Con 848 21.0
Freeman L. Lab 574 14.2
Mitchell S. Ms. Green 225 5.6
Turnout 63.9 38.2
Romsey (6270)
vote share
Toomey J. Ms. LD 1,668 45.0
Gluza J.* Lab 1,235 33.3
Downer H. Green 402 10.8
Fanken-Hall M. Con 359 9.7
Barr M. Ms. UKIP 45 1.2
Turnout 59.2 11.7
Trumptington (5359)
vote share
Kent A. Ms. LD 1,669 51.0
Ionides J. Con 904 27.6
Tudor G. Lab 435 13.3
Galloway C. Ms. Green 266 8.1
Turnout 61.1 23.4
West Chesterton (6370)
vote share
Wilkins K. LD 1,869 46.7
Watkins S. Lab 964 24.1
Strachan J. Con 699 17.5
Peake S. Ms. Green 468 11.7
Turnout 62.8 22.6
Burwell (6165)
vote share
Williams H. Ms. LD 2,220 55.9
Edwards L. Ms. Con 1,749 44.1
Turnout 64.4 11.9
Ely North & East (7224)
vote share
Bell N. LD 2,589 59.6
Hearne-Casapieri V. Ms.* Con 1,754 40.4
Turnout 60.1 19.2
Ely South & West (5849)
vote share
Crossley L. Ms. LD 2,123 56.2
Mair A.* Con 1,656 43.8
Turnout 64.6 12.4
Haddenham (7226)
vote share
Hunt W. Con 1,994 41.3
Wilson G. LD 1,789 37.0
Wilkinson M. Ms. Lab 710 14.7
Carter-Marsh A. Ms. Green 336 7.0
Turnout 66.8 4.2
Littleport (5574)
vote share
Bean B. Ms. LD 1,599 55.2
Brown F. Con 1,299 44.8
Turnout 52.0 10.4
Soham & Fordham Villages (11981) 2
vote share
Broadway J. Ms. LD 3,380 52.7
Powley J.* Con 3,039 47.3
Allan M. LD 2,872 -
Petts J. Ms. Con 2,837 -
Turnout 58.4 5.3
Sutton (5920)
vote share
Bailey P. LD 2,122 56.8
Read P.* Con 1,617 43.2
Turnout 63.2 13.5
Woodditton (7634)
vote share
Shuter M. Con 2,476 49.7
McCall B. Ms. LD 1,644 33.0
O’Dell S. Lab 859 17.3
Turnout 65.2 16.7
Cambridgeshire
East Cambridgeshire
Cambridge
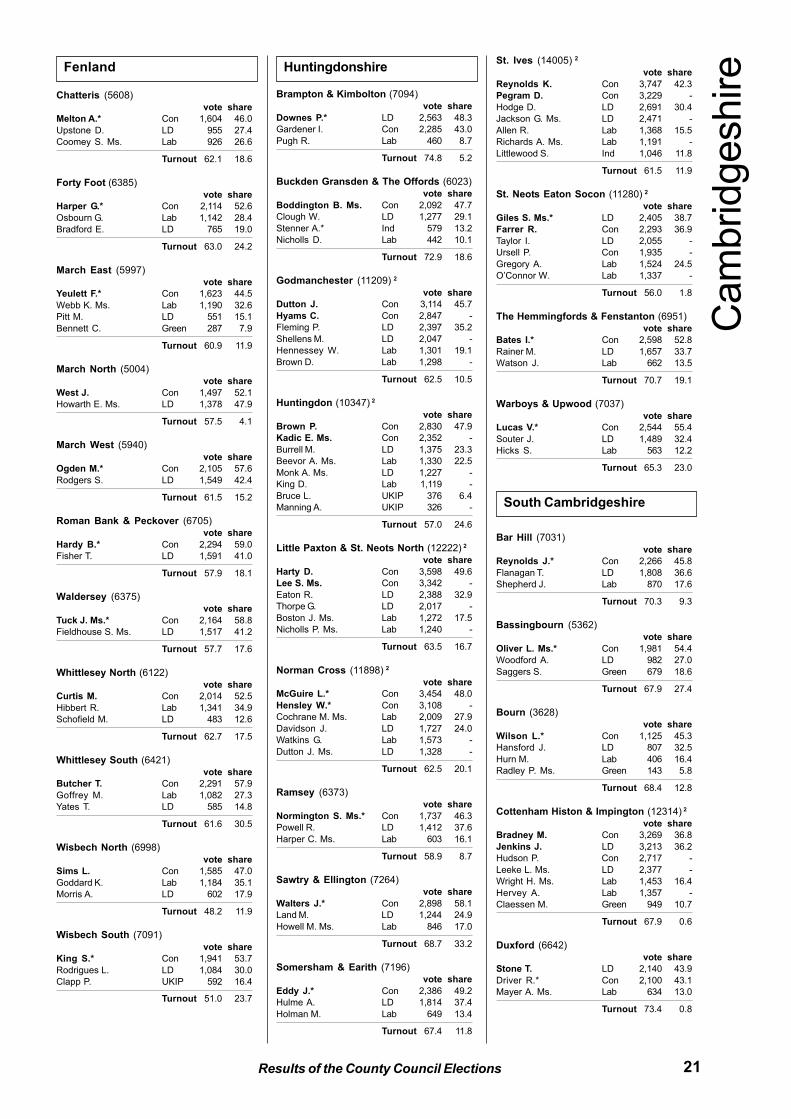
21Results of the County Council Elections
Chatteris (5608)
vote share
Melton A.* Con 1,604 46.0
Upstone D. LD 955 27.4
Coomey S. Ms. Lab 926 26.6
Turnout 62.1 18.6
Forty Foot (6385)
vote share
Harper G.* Con 2,114 52.6
Osbourn G. Lab 1,142 28.4
Bradford E. LD 765 19.0
Turnout 63.0 24.2
March East (5997)
vote share
Yeulett F.* Con 1,623 44.5
Webb K. Ms. Lab 1,190 32.6
Pitt M. LD 551 15.1
Bennett C. Green 287 7.9
Turnout 60.9 11.9
March North (5004)
vote share
West J. Con 1,497 52.1
Howarth E. Ms. LD 1,378 47.9
Turnout 57.5 4.1
March West (5940)
vote share
Ogden M.* Con 2,105 57.6
Rodgers S. LD 1,549 42.4
Turnout 61.5 15.2
Roman Bank & Peckover (6705)
vote share
Hardy B.* Con 2,294 59.0
Fisher T. LD 1,591 41.0
Turnout 57.9 18.1
Waldersey (6375)
vote share
Tuck J. Ms.* Con 2,164 58.8
Fieldhouse S. Ms. LD 1,517 41.2
Turnout 57.7 17.6
Whittlesey North (6122)
vote share
Curtis M. Con 2,014 52.5
Hibbert R. Lab 1,341 34.9
Schofield M. LD 483 12.6
Turnout 62.7 17.5
Whittlesey South (6421)
vote share
Butcher T. Con 2,291 57.9
Goffrey M. Lab 1,082 27.3
Yates T. LD 585 14.8
Turnout 61.6 30.5
Wisbech North (6998)
vote share
Sims L. Con 1,585 47.0
Goddard K. Lab 1,184 35.1
Morris A. LD 602 17.9
Turnout 48.2 11.9
Wisbech South (7091)
vote share
King S.* Con 1,941 53.7
Rodrigues L. LD 1,084 30.0
Clapp P. UKIP 592 16.4
Turnout 51.0 23.7
Brampton & Kimbolton (7094)
vote share
Downes P.* LD 2,563 48.3
Gardener I. Con 2,285 43.0
Pugh R. Lab 460 8.7
Turnout 74.8 5.2
Buckden Gransden & The Offords (6023)
vote share
Boddington B. Ms. Con 2,092 47.7
Clough W. LD 1,277 29.1
Stenner A.* Ind 579 13.2
Nicholls D. Lab 442 10.1
Turnout 72.9 18.6
Godmanchester (11209) 2
vote share
Dutton J. Con 3,114 45.7
Hyams C. Con 2,847 -
Fleming P. LD 2,397 35.2
Shellens M. LD 2,047 -
Hennessey W. Lab 1,301 19.1
Brown D. Lab 1,298 -
Turnout 62.5 10.5
Huntingdon (10347) 2
vote share
Brown P. Con 2,830 47.9
Kadic E. Ms. Con 2,352 -
Burrell M. LD 1,375 23.3
Beevor A. Ms. Lab 1,330 22.5
Monk A. Ms. LD 1,227 -
King D. Lab 1,119 -
Bruce L. UKIP 376 6.4
Manning A. UKIP 326 -
Turnout 57.0 24.6
Little Paxton & St. Neots North (12222) 2
vote share
Harty D. Con 3,598 49.6
Lee S. Ms. Con 3,342 -
Eaton R. LD 2,388 32.9
Thorpe G. LD 2,017 -
Boston J. Ms. Lab 1,272 17.5
Nicholls P. Ms. Lab 1,240 -
Turnout 63.5 16.7
Norman Cross (11898) 2
vote share
McGuire L.* Con 3,454 48.0
Hensley W.* Con 3,108 -
Cochrane M. Ms. Lab 2,009 27.9
Davidson J. LD 1,727 24.0
Watkins G. Lab 1,573 -
Dutton J. Ms. LD 1,328 -
Turnout 62.5 20.1
Ramsey (6373)
vote share
Normington S. Ms.* Con 1,737 46.3
Powell R. LD 1,412 37.6
Harper C. Ms. Lab 603 16.1
Turnout 58.9 8.7
Sawtry & Ellington (7264)
vote share
Walters J.* Con 2,898 58.1
Land M. LD 1,244 24.9
Howell M. Ms. Lab 846 17.0
Turnout 68.7 33.2
Somersham & Earith (7196)
vote share
Eddy J.* Con 2,386 49.2
Hulme A. LD 1,814 37.4
Holman M. Lab 649 13.4
Turnout 67.4 11.8
St. Ives (14005) 2
vote share
Reynolds K. Con 3,747 42.3
Pegram D. Con 3,229 -
Hodge D. LD 2,691 30.4
Jackson G. Ms. LD 2,471 -
Allen R. Lab 1,368 15.5
Richards A. Ms. Lab 1,191 -
Littlewood S. Ind 1,046 11.8
Turnout 61.5 11.9
St. Neots Eaton Socon (11280) 2
vote share
Giles S. Ms.* LD 2,405 38.7
Farrer R. Con 2,293 36.9
Taylor I. LD 2,055 -
Ursell P. Con 1,935 -
Gregory A. Lab 1,524 24.5
O’Connor W. Lab 1,337 -
Turnout 56.0 1.8
The Hemmingfords & Fenstanton (6951)
vote share
Bates I.* Con 2,598 52.8
Rainer M. LD 1,657 33.7
Watson J. Lab 662 13.5
Turnout 70.7 19.1
Warboys & Upwood (7037)
vote share
Lucas V.* Con 2,544 55.4
Souter J. LD 1,489 32.4
Hicks S. Lab 563 12.2
Turnout 65.3 23.0
Bar Hill (7031)
vote share
Reynolds J.* Con 2,266 45.8
Flanagan T. LD 1,808 36.6
Shepherd J. Lab 870 17.6
Turnout 70.3 9.3
Bassingbourn (5362)
vote share
Oliver L. Ms.* Con 1,981 54.4
Woodford A. LD 982 27.0
Saggers S. Green 679 18.6
Turnout 67.9 27.4
Bourn (3628)
vote share
Wilson L.* Con 1,125 45.3
Hansford J. LD 807 32.5
Hurn M. Lab 406 16.4
Radley P. Ms. Green 143 5.8
Turnout 68.4 12.8
Cottenham Histon & Impington (12314) 2
vote share
Bradney M. Con 3,269 36.8
Jenkins J. LD 3,213 36.2
Hudson P. Con 2,717 -
Leeke L. Ms. LD 2,377 -
Wright H. Ms. Lab 1,453 16.4
Hervey A. Lab 1,357 -
Claessen M. Green 949 10.7
Turnout 67.9 0.6
Duxford (6642)
vote share
Stone T. LD 2,140 43.9
Driver R.* Con 2,100 43.1
Mayer A. Ms. Lab 634 13.0
Turnout 73.4 0.8
Cam
bridgeshireFenland Huntingdonshire
South Cambridgeshire
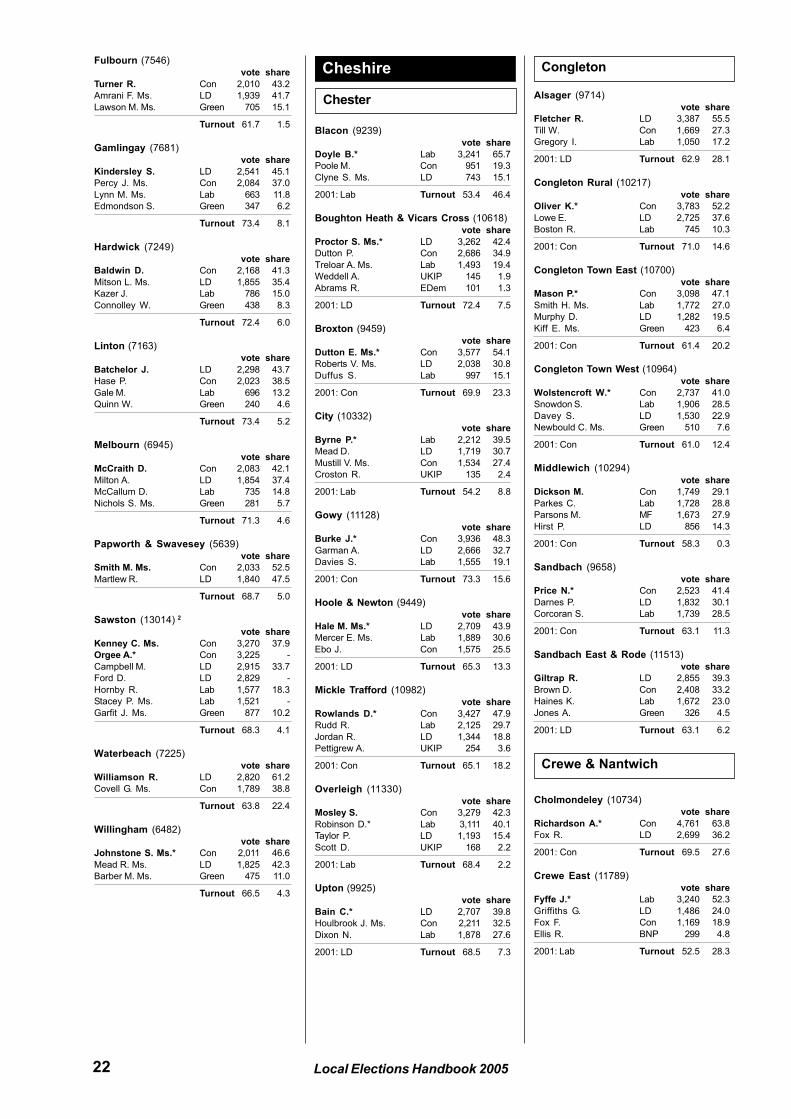
22 Local Elections Handbook 2005
Fulbourn (7546)
vote share
Turner R. Con 2,010 43.2
Amrani F. Ms. LD 1,939 41.7
Lawson M. Ms. Green 705 15.1
Turnout 61.7 1.5
Gamlingay (7681)
vote share
Kindersley S. LD 2,541 45.1
Percy J. Ms. Con 2,084 37.0
Lynn M. Ms. Lab 663 11.8
Edmondson S. Green 347 6.2
Turnout 73.4 8.1
Hardwick (7249)
vote share
Baldwin D. Con 2,168 41.3
Mitson L. Ms. LD 1,855 35.4
Kazer J. Lab 786 15.0
Connolley W. Green 438 8.3
Turnout 72.4 6.0
Linton (7163)
vote share
Batchelor J. LD 2,298 43.7
Hase P. Con 2,023 38.5
Gale M. Lab 696 13.2
Quinn W. Green 240 4.6
Turnout 73.4 5.2
Melbourn (6945)
vote share
McCraith D. Con 2,083 42.1
Milton A. LD 1,854 37.4
McCallum D. Lab 735 14.8
Nichols S. Ms. Green 281 5.7
Turnout 71.3 4.6
Papworth & Swavesey (5639)
vote share
Smith M. Ms. Con 2,033 52.5
Martlew R. LD 1,840 47.5
Turnout 68.7 5.0
Sawston (13014) 2
vote share
Kenney C. Ms. Con 3,270 37.9
Orgee A.* Con 3,225 -
Campbell M. LD 2,915 33.7
Ford D. LD 2,829 -
Hornby R. Lab 1,577 18.3
Stacey P. Ms. Lab 1,521 -
Garfit J. Ms. Green 877 10.2
Turnout 68.3 4.1
Waterbeach (7225)
vote share
Williamson R. LD 2,820 61.2
Covell G. Ms. Con 1,789 38.8
Turnout 63.8 22.4
Willingham (6482)
vote share
Johnstone S. Ms.* Con 2,011 46.6
Mead R. Ms. LD 1,825 42.3
Barber M. Ms. Green 475 11.0
Turnout 66.5 4.3
Blacon (9239)
vote share
Doyle B.* Lab 3,241 65.7
Poole M. Con 951 19.3
Clyne S. Ms. LD 743 15.1
2001: Lab Turnout 53.4 46.4
Boughton Heath & Vicars Cross (10618)
vote share
Proctor S. Ms.* LD 3,262 42.4
Dutton P. Con 2,686 34.9
Treloar A. Ms. Lab 1,493 19.4
Weddell A. UKIP 145 1.9
Abrams R. EDem 101 1.3
2001: LD Turnout 72.4 7.5
Broxton (9459)
vote share
Dutton E. Ms.* Con 3,577 54.1
Roberts V. Ms. LD 2,038 30.8
Duffus S. Lab 997 15.1
2001: Con Turnout 69.9 23.3
City (10332)
vote share
Byrne P.* Lab 2,212 39.5
Mead D. LD 1,719 30.7
Mustill V. Ms. Con 1,534 27.4
Croston R. UKIP 135 2.4
2001: Lab Turnout 54.2 8.8
Gowy (11128)
vote share
Burke J.* Con 3,936 48.3
Garman A. LD 2,666 32.7
Davies S. Lab 1,555 19.1
2001: Con Turnout 73.3 15.6
Hoole & Newton (9449)
vote share
Hale M. Ms.* LD 2,709 43.9
Mercer E. Ms. Lab 1,889 30.6
Ebo J. Con 1,575 25.5
2001: LD Turnout 65.3 13.3
Mickle Trafford (10982)
vote share
Rowlands D.* Con 3,427 47.9
Rudd R. Lab 2,125 29.7
Jordan R. LD 1,344 18.8
Pettigrew A. UKIP 254 3.6
2001: Con Turnout 65.1 18.2
Overleigh (11330)
vote share
Mosley S. Con 3,279 42.3
Robinson D.* Lab 3,111 40.1
Taylor P. LD 1,193 15.4
Scott D. UKIP 168 2.2
2001: Lab Turnout 68.4 2.2
Upton (9925)
vote share
Bain C.* LD 2,707 39.8
Houlbrook J. Ms. Con 2,211 32.5
Dixon N. Lab 1,878 27.6
2001: LD Turnout 68.5 7.3
Alsager (9714)
vote share
Fletcher R. LD 3,387 55.5
Till W. Con 1,669 27.3
Gregory I. Lab 1,050 17.2
2001: LD Turnout 62.9 28.1
Congleton Rural (10217)
vote share
Oliver K.* Con 3,783 52.2
Lowe E. LD 2,725 37.6
Boston R. Lab 745 10.3
2001: Con Turnout 71.0 14.6
Congleton Town East (10700)
vote share
Mason P.* Con 3,098 47.1
Smith H. Ms. Lab 1,772 27.0
Murphy D. LD 1,282 19.5
Kiff E. Ms. Green 423 6.4
2001: Con Turnout 61.4 20.2
Congleton Town West (10964)
vote share
Wolstencroft W.* Con 2,737 41.0
Snowdon S. Lab 1,906 28.5
Davey S. LD 1,530 22.9
Newbould C. Ms. Green 510 7.6
2001: Con Turnout 61.0 12.4
Middlewich (10294)
vote share
Dickson M. Con 1,749 29.1
Parkes C. Lab 1,728 28.8
Parsons M. MF 1,673 27.9
Hirst P. LD 856 14.3
2001: Con Turnout 58.3 0.3
Sandbach (9658)
vote share
Price N.* Con 2,523 41.4
Darnes P. LD 1,832 30.1
Corcoran S. Lab 1,739 28.5
2001: Con Turnout 63.1 11.3
Sandbach East & Rode (11513)
vote share
Giltrap R. LD 2,855 39.3
Brown D. Con 2,408 33.2
Haines K. Lab 1,672 23.0
Jones A. Green 326 4.5
2001: LD Turnout 63.1 6.2
Cholmondeley (10734)
vote share
Richardson A.* Con 4,761 63.8
Fox R. LD 2,699 36.2
2001: Con Turnout 69.5 27.6
Crewe East (11789)
vote share
Fyffe J.* Lab 3,240 52.3
Griffiths G. LD 1,486 24.0
Fox F. Con 1,169 18.9
Ellis R. BNP 299 4.8
2001: Lab Turnout 52.5 28.3
Congleton
Crewe & Nantwich
Cheshire
Chester
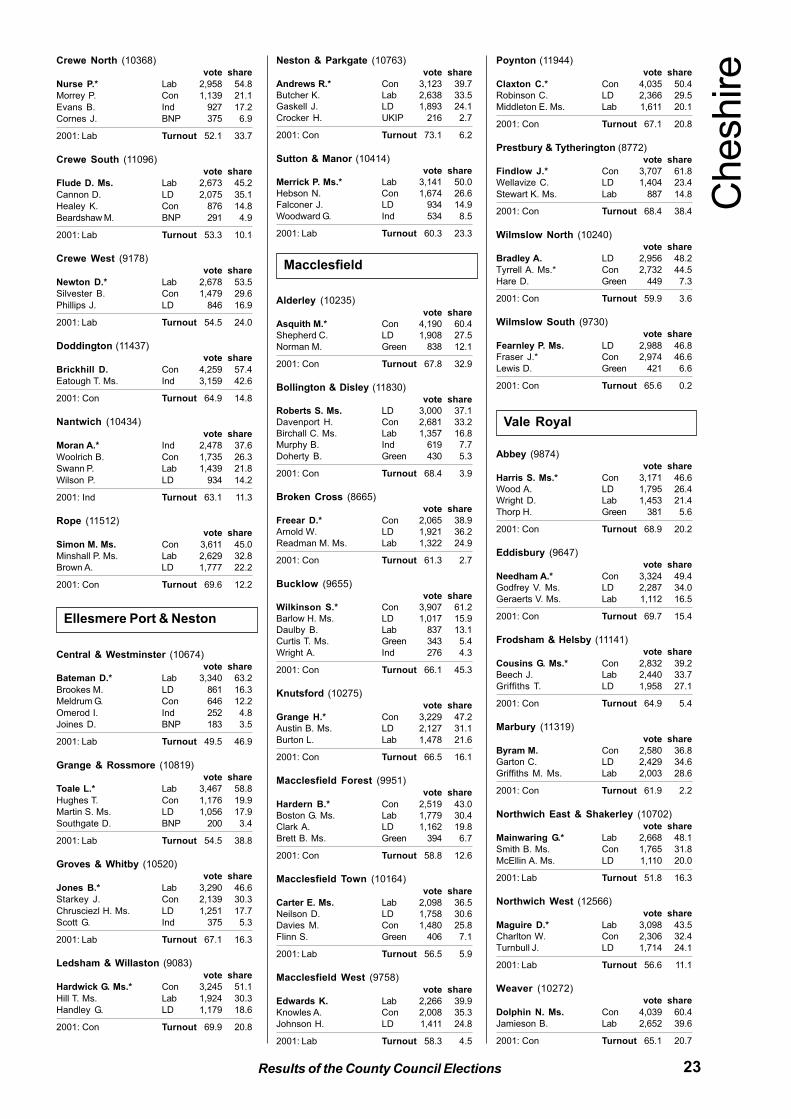
23Results of the County Council Elections
Crewe North (10368)
vote share
Nurse P.* Lab 2,958 54.8
Morrey P. Con 1,139 21.1
Evans B. Ind 927 17.2
Cornes J. BNP 375 6.9
2001: Lab Turnout 52.1 33.7
Crewe South (11096)
vote share
Flude D. Ms. Lab 2,673 45.2
Cannon D. LD 2,075 35.1
Healey K. Con 876 14.8
Beardshaw M. BNP 291 4.9
2001: Lab Turnout 53.3 10.1
Crewe West (9178)
vote share
Newton D.* Lab 2,678 53.5
Silvester B. Con 1,479 29.6
Phillips J. LD 846 16.9
2001: Lab Turnout 54.5 24.0
Doddington (11437)
vote share
Brickhill D. Con 4,259 57.4
Eatough T. Ms. Ind 3,159 42.6
2001: Con Turnout 64.9 14.8
Nantwich (10434)
vote share
Moran A.* Ind 2,478 37.6
Woolrich B. Con 1,735 26.3
Swann P. Lab 1,439 21.8
Wilson P. LD 934 14.2
2001: Ind Turnout 63.1 11.3
Rope (11512)
vote share
Simon M. Ms. Con 3,611 45.0
Minshall P. Ms. Lab 2,629 32.8
Brown A. LD 1,777 22.2
2001: Con Turnout 69.6 12.2
Central & Westminster (10674)
vote share
Bateman D.* Lab 3,340 63.2
Brookes M. LD 861 16.3
Meldrum G. Con 646 12.2
Omerod I. Ind 252 4.8
Joines D. BNP 183 3.5
2001: Lab Turnout 49.5 46.9
Grange & Rossmore (10819)
vote share
Toale L.* Lab 3,467 58.8
Hughes T. Con 1,176 19.9
Martin S. Ms. LD 1,056 17.9
Southgate D. BNP 200 3.4
2001: Lab Turnout 54.5 38.8
Groves & Whitby (10520)
vote share
Jones B.* Lab 3,290 46.6
Starkey J. Con 2,139 30.3
Chrusciezl H. Ms. LD 1,251 17.7
Scott G. Ind 375 5.3
2001: Lab Turnout 67.1 16.3
Ledsham & Willaston (9083)
vote share
Hardwick G. Ms.* Con 3,245 51.1
Hill T. Ms. Lab 1,924 30.3
Handley G. LD 1,179 18.6
2001: Con Turnout 69.9 20.8
Neston & Parkgate (10763)
vote share
Andrews R.* Con 3,123 39.7
Butcher K. Lab 2,638 33.5
Gaskell J. LD 1,893 24.1
Crocker H. UKIP 216 2.7
2001: Con Turnout 73.1 6.2
Sutton & Manor (10414)
vote share
Merrick P. Ms.* Lab 3,141 50.0
Hebson N. Con 1,674 26.6
Falconer J. LD 934 14.9
Woodward G. Ind 534 8.5
2001: Lab Turnout 60.3 23.3
Alderley (10235)
vote share
Asquith M.* Con 4,190 60.4
Shepherd C. LD 1,908 27.5
Norman M. Green 838 12.1
2001: Con Turnout 67.8 32.9
Bollington & Disley (11830)
vote share
Roberts S. Ms. LD 3,000 37.1
Davenport H. Con 2,681 33.2
Birchall C. Ms. Lab 1,357 16.8
Murphy B. Ind 619 7.7
Doherty B. Green 430 5.3
2001: Con Turnout 68.4 3.9
Broken Cross (8665)
vote share
Freear D.* Con 2,065 38.9
Arnold W. LD 1,921 36.2
Readman M. Ms. Lab 1,322 24.9
2001: Con Turnout 61.3 2.7
Bucklow (9655)
vote share
Wilkinson S.* Con 3,907 61.2
Barlow H. Ms. LD 1,017 15.9
Daulby B. Lab 837 13.1
Curtis T. Ms. Green 343 5.4
Wright A. Ind 276 4.3
2001: Con Turnout 66.1 45.3
Knutsford (10275)
vote share
Grange H.* Con 3,229 47.2
Austin B. Ms. LD 2,127 31.1
Burton L. Lab 1,478 21.6
2001: Con Turnout 66.5 16.1
Macclesfield Forest (9951)
vote share
Hardern B.* Con 2,519 43.0
Boston G. Ms. Lab 1,779 30.4
Clark A. LD 1,162 19.8
Brett B. Ms. Green 394 6.7
2001: Con Turnout 58.8 12.6
Macclesfield Town (10164)
vote share
Carter E. Ms. Lab 2,098 36.5
Neilson D. LD 1,758 30.6
Davies M. Con 1,480 25.8
Flinn S. Green 406 7.1
2001: Lab Turnout 56.5 5.9
Macclesfield West (9758)
vote share
Edwards K. Lab 2,266 39.9
Knowles A. Con 2,008 35.3
Johnson H. LD 1,411 24.8
2001: Lab Turnout 58.3 4.5
Poynton (11944)
vote share
Claxton C.* Con 4,035 50.4
Robinson C. LD 2,366 29.5
Middleton E. Ms. Lab 1,611 20.1
2001: Con Turnout 67.1 20.8
Prestbury & Tytherington (8772)
vote share
Findlow J.* Con 3,707 61.8
Wellavize C. LD 1,404 23.4
Stewart K. Ms. Lab 887 14.8
2001: Con Turnout 68.4 38.4
Wilmslow North (10240)
vote share
Bradley A. LD 2,956 48.2
Tyrrell A. Ms.* Con 2,732 44.5
Hare D. Green 449 7.3
2001: Con Turnout 59.9 3.6
Wilmslow South (9730)
vote share
Fearnley P. Ms. LD 2,988 46.8
Fraser J.* Con 2,974 46.6
Lewis D. Green 421 6.6
2001: Con Turnout 65.6 0.2
Abbey (9874)
vote share
Harris S. Ms.* Con 3,171 46.6
Wood A. LD 1,795 26.4
Wright D. Lab 1,453 21.4
Thorp H. Green 381 5.6
2001: Con Turnout 68.9 20.2
Eddisbury (9647)
vote share
Needham A.* Con 3,324 49.4
Godfrey V. Ms. LD 2,287 34.0
Geraerts V. Ms. Lab 1,112 16.5
2001: Con Turnout 69.7 15.4
Frodsham & Helsby (11141)
vote share
Cousins G. Ms.* Con 2,832 39.2
Beech J. Lab 2,440 33.7
Griffiths T. LD 1,958 27.1
2001: Con Turnout 64.9 5.4
Marbury (11319)
vote share
Byram M. Con 2,580 36.8
Garton C. LD 2,429 34.6
Griffiths M. Ms. Lab 2,003 28.6
2001: Con Turnout 61.9 2.2
Northwich East & Shakerley (10702)
vote share
Mainwaring G.* Lab 2,668 48.1
Smith B. Ms. Con 1,765 31.8
McEllin A. Ms. LD 1,110 20.0
2001: Lab Turnout 51.8 16.3
Northwich West (12566)
vote share
Maguire D.* Lab 3,098 43.5
Charlton W. Con 2,306 32.4
Turnbull J. LD 1,714 24.1
2001: Lab Turnout 56.6 11.1
Weaver (10272)
vote share
Dolphin N. Ms. Con 4,039 60.4
Jamieson B. Lab 2,652 39.6
2001: Con Turnout 65.1 20.7
Ellesmere Port & Neston
Macclesfield
Vale Royal
Cheshire
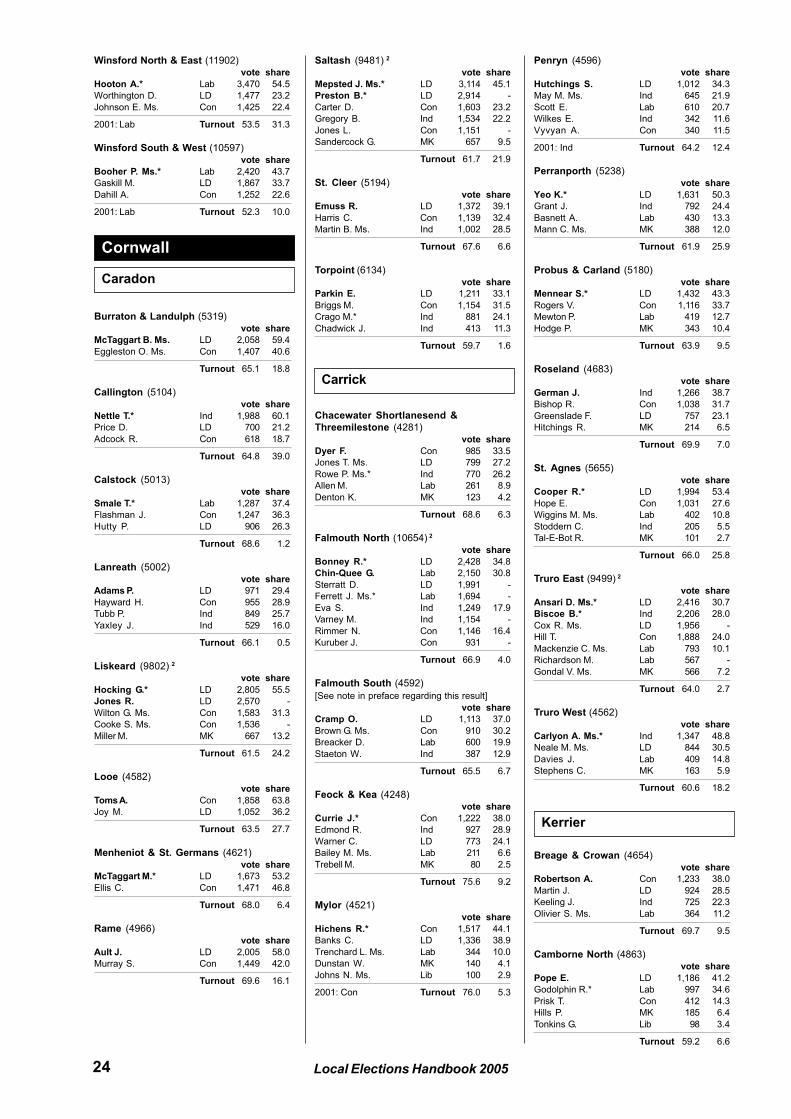
24 Local Elections Handbook 2005
Winsford North & East (11902)
vote share
Hooton A.* Lab 3,470 54.5
Worthington D. LD 1,477 23.2
Johnson E. Ms. Con 1,425 22.4
2001: Lab Turnout 53.5 31.3
Winsford South & West (10597)
vote share
Booher P. Ms.* Lab 2,420 43.7
Gaskill M. LD 1,867 33.7
Dahill A. Con 1,252 22.6
2001: Lab Turnout 52.3 10.0
Burraton & Landulph (5319)
vote share
McTaggart B. Ms. LD 2,058 59.4
Eggleston O. Ms. Con 1,407 40.6
Turnout 65.1 18.8
Callington (5104)
vote share
Nettle T.* Ind 1,988 60.1
Price D. LD 700 21.2
Adcock R. Con 618 18.7
Turnout 64.8 39.0
Calstock (5013)
vote share
Smale T.* Lab 1,287 37.4
Flashman J. Con 1,247 36.3
Hutty P. LD 906 26.3
Turnout 68.6 1.2
Lanreath (5002)
vote share
Adams P. LD 971 29.4
Hayward H. Con 955 28.9
Tubb P. Ind 849 25.7
Yaxley J. Ind 529 16.0
Turnout 66.1 0.5
Liskeard (9802) 2
vote share
Hocking G.* LD 2,805 55.5
Jones R. LD 2,570 -
Wilton G. Ms. Con 1,583 31.3
Cooke S. Ms. Con 1,536 -
Miller M. MK 667 13.2
Turnout 61.5 24.2
Looe (4582)
vote share
Toms A. Con 1,858 63.8
Joy M. LD 1,052 36.2
Turnout 63.5 27.7
Menheniot & St. Germans (4621)
vote share
McTaggart M.* LD 1,673 53.2
Ellis C. Con 1,471 46.8
Turnout 68.0 6.4
Rame (4966)
vote share
Ault J. LD 2,005 58.0
Murray S. Con 1,449 42.0
Turnout 69.6 16.1
Saltash (9481) 2
vote share
Mepsted J. Ms.* LD 3,114 45.1
Preston B.* LD 2,914 -
Carter D. Con 1,603 23.2
Gregory B. Ind 1,534 22.2
Jones L. Con 1,151 -
Sandercock G. MK 657 9.5
Turnout 61.7 21.9
St. Cleer (5194)
vote share
Emuss R. LD 1,372 39.1
Harris C. Con 1,139 32.4
Martin B. Ms. Ind 1,002 28.5
Turnout 67.6 6.6
Torpoint (6134)
vote share
Parkin E. LD 1,211 33.1
Briggs M. Con 1,154 31.5
Crago M.* Ind 881 24.1
Chadwick J. Ind 413 11.3
Turnout 59.7 1.6
Chacewater Shortlanesend &
Threemilestone (4281)
vote share
Dyer F. Con 985 33.5
Jones T. Ms. LD 799 27.2
Rowe P. Ms.* Ind 770 26.2
Allen M. Lab 261 8.9
Denton K. MK 123 4.2
Turnout 68.6 6.3
Falmouth North (10654) 2
vote share
Bonney R.* LD 2,428 34.8
Chin-Quee G. Lab 2,150 30.8
Sterratt D. LD 1,991 -
Ferrett J. Ms.* Lab 1,694 -
Eva S. Ind 1,249 17.9
Varney M. Ind 1,154 -
Rimmer N. Con 1,146 16.4
Kuruber J. Con 931 -
Turnout 66.9 4.0
Falmouth South (4592)
[See note in preface regarding this result]
vote share
Cramp O. LD 1,113 37.0
Brown G. Ms. Con 910 30.2
Breacker D. Lab 600 19.9
Staeton W. Ind 387 12.9
Turnout 65.5 6.7
Feock & Kea (4248)
vote share
Currie J.* Con 1,222 38.0
Edmond R. Ind 927 28.9
Warner C. LD 773 24.1
Bailey M. Ms. Lab 211 6.6
Trebell M. MK 80 2.5
Turnout 75.6 9.2
Mylor (4521)
vote share
Hichens R.* Con 1,517 44.1
Banks C. LD 1,336 38.9
Trenchard L. Ms. Lab 344 10.0
Dunstan W. MK 140 4.1
Johns N. Ms. Lib 100 2.9
2001: Con Turnout 76.0 5.3
Penryn (4596)
vote share
Hutchings S. LD 1,012 34.3
May M. Ms. Ind 645 21.9
Scott E. Lab 610 20.7
Wilkes E. Ind 342 11.6
Vyvyan A. Con 340 11.5
2001: Ind Turnout 64.2 12.4
Perranporth (5238)
vote share
Yeo K.* LD 1,631 50.3
Grant J. Ind 792 24.4
Basnett A. Lab 430 13.3
Mann C. Ms. MK 388 12.0
Turnout 61.9 25.9
Probus & Carland (5180)
vote share
Mennear S.* LD 1,432 43.3
Rogers V. Con 1,116 33.7
Mewton P. Lab 419 12.7
Hodge P. MK 343 10.4
Turnout 63.9 9.5
Roseland (4683)
vote share
German J. Ind 1,266 38.7
Bishop R. Con 1,038 31.7
Greenslade F. LD 757 23.1
Hitchings R. MK 214 6.5
Turnout 69.9 7.0
St. Agnes (5655)
vote share
Cooper R.* LD 1,994 53.4
Hope E. Con 1,031 27.6
Wiggins M. Ms. Lab 402 10.8
Stoddern C. Ind 205 5.5
Tal-E-Bot R. MK 101 2.7
Turnout 66.0 25.8
Truro East (9499) 2
vote share
Ansari D. Ms.* LD 2,416 30.7
Biscoe B.* Ind 2,206 28.0
Cox R. Ms. LD 1,956 -
Hill T. Con 1,888 24.0
Mackenzie C. Ms. Lab 793 10.1
Richardson M. Lab 567 -
Gondal V. Ms. MK 566 7.2
Turnout 64.0 2.7
Truro West (4562)
vote share
Carlyon A. Ms.* Ind 1,347 48.8
Neale M. Ms. LD 844 30.5
Davies J. Lab 409 14.8
Stephens C. MK 163 5.9
Turnout 60.6 18.2
Breage & Crowan (4654)
vote share
Robertson A. Con 1,233 38.0
Martin J. LD 924 28.5
Keeling J. Ind 725 22.3
Olivier S. Ms. Lab 364 11.2
Turnout 69.7 9.5
Camborne North (4863)
vote share
Pope E. LD 1,186 41.2
Godolphin R.* Lab 997 34.6
Prisk T. Con 412 14.3
Hills P. MK 185 6.4
Tonkins G. Lib 98 3.4
Turnout 59.2 6.6
Cornwall
Caradon
Carrick
Kerrier
25Results of the County Council Elections
Camborne South (5034)
vote share
Bunce A. LD 1,382 43.8
Bunt A. Lab 1,065 33.8
Sanders A. MK 493 15.6
Trengove R. Ms. Lib 213 6.8
Turnout 62.6 10.1
Camborne West (5169)
vote share
Woodward J. Con 884 25.5
Bickford C. Lab 868 25.0
Wilson J. LD 813 23.4
Cullimore S. MK 780 22.5
Hart R. Ms. Lib 127 3.7
Turnout 67.2 0.5
Carn Brea (5309)
vote share
Moyle M.* Lab 1,416 44.1
Wright J. Ms. LD 898 28.0
Fleming P. Con 556 17.3
Duncan W. UKIP 340 10.6
Turnout 60.5 16.1
Constantine (5307)
vote share
Hatton N.* Con 1,933 48.4
Hewett-Silk D. LD 956 23.9
Lambert M. Ms. Lab 564 14.1
Fryer G. Ms. Ind 539 13.5
Turnout 75.2 24.5
Helston North (4563)
vote share
Phillips P. LD 1,351 46.3
Martin P.* Ind 1,053 36.1
Powell P. Con 512 17.6
Turnout 63.9 10.2
Illogan & Portreath (5329)
vote share
Rowe T. Ind 813 23.0
Ekinsmyth D. LD 684 19.4
Holmes P.* Lib 673 19.1
Thomas U. Ms. Con 636 18.0
Phillips R. Ms. Lab 576 16.3
Cann G. Ind 148 4.2
2001: Lib Turnout 66.2 3.7
Meneage & South Helston (3709)
vote share
Lyne P. Ms.* Ind 1,267 54.8
Evershed A. LD 773 33.4
Pullen T. Lab 271 11.7
Turnout 62.3 21.4
Porthleven (4017)
vote share
Curnow W. Ind 1,356 55.2
Lewarne R. Ms. LD 810 33.0
Webster G. Lab 289 11.8
Turnout 61.1 22.2
Redruth North (4754)
vote share
Barnes R. Lab 1,152 41.3
Cannicott D. LD 616 22.1
Bennett M. Con 392 14.0
Dolley A. Ms. Ind 316 11.3
Eddowes M. Ind 217 7.8
Uren C. Ms. Lib 98 3.5
Turnout 58.7 19.2
Redruth South (4736)
vote share
Hicks G.* Ind 1,636 51.6
Aston P. Ms. LD 637 20.1
Fry R. Lab 535 16.9
Bosworth I. Con 283 8.9
Skinner C. Lib 79 2.5
Turnout 66.9 31.5
St. Day Lanner & Carharrack (4311)
vote share
Kaczmarek M.* Ind 1,535 52.7
Thomas J. LD 721 24.8
Fry V. Ms. Lab 357 12.3
Anson M. Ms. Con 300 10.3
2001: Ind Turnout 67.6 27.9
St. Keverne (4718)
vote share
Rule C. Ms. Ind 2,450 75.3
Southwood P. Con 803 24.7
Turnout 68.9 50.6
Stithians (4262)
vote share
Plummer J.* Ind 1,265 41.8
Ryall C. Ms. LD 785 26.0
Whyte Trudgeon H. Ms. Con 611 20.2
Clarke D. Lab 362 12.0
Turnout 70.9 15.9
Bodmin St. Marys (5163)
vote share
Kerridge A. Ms. LD 1,477 54.2
Quinnell A.* Ind 465 17.1
Battersby J. Con 419 15.4
Acton D. Lab 364 13.4
Turnout 52.8 37.1
Bodmin St. Petroc (4994)
vote share
Rogerson S. LD 1,953 71.7
Parkyn K. Ms. Con 771 28.3
Turnout 54.5 43.4
Bude-Stratton (9159) 2
vote share
Whalley D.* LD 3,059 43.1
Heard E. Ms.* LD 2,773 -
Bolitho J. MK 2,329 32.8
Heenan J. Ms. Con 1,715 24.1
Turnout 66.7 10.3
Camelford & Altarnun (4821)
vote share
Comber B. Ms. LD 1,357 41.3
Goodenough K. Ind 1,152 35.1
Hall C. Ms. Con 774 23.6
Turnout 68.1 6.2
Helland (3520)
vote share
Bryant D. LD 0 0.0
Turnout 0.0 0.0
Launceston (7562) 2
vote share
Paynter A.* LD 2,208 42.4
Nicholls G.* LD 2,182 -
Chapman E. Ind 1,835 35.3
Reeve A. Con 1,162 22.3
Jordan G. Ind 716 -
Turnout 63.2 7.2
Marhamchurch & Week St. Mary (4664)
vote share
Booker R. LD 1,796 53.8
Tucker P. Con 1,543 46.2
Turnout 71.6 7.6
Padstow (5121)
vote share
Townrow S. Ms.* LD 1,665 52.1
Brewer P. Con 1,532 47.9
Turnout 62.4 4.2
Stokeclimsland (4549)
vote share
Burden N. Ind 1,591 48.3
Scoble K.* LD 1,103 33.5
Ayres J. Con 603 18.3
Turnout 72.5 14.8
Tintagel (4441)
vote share
Brown G.* LD 2,122 71.4
Walker D. Con 851 28.6
Turnout 66.9 42.8
Wadebridge & St. Minver (10635) 2
vote share
Brewer C.* Ind 3,000 35.6
Rowe J. LD 2,904 34.5
Richards H. Ms.* Ind 2,435 -
Cooke A. Con 1,751 20.8
Battle P. Lab 763 9.1
Turnout 67.2 1.1
Hayle-Gwinear-Gwithian (8942) 2
vote share
Lello T.* LD 2,250 31.8
Oliver S. Ms.* Ind 1,949 27.5
Cook D. LD 1,600 -
Penhaligon G. Con 1,284 18.1
Gregory R. Lab 990 14.0
Watson Y. Ms. Con 834 -
Mager J. UKIP 602 8.5
Turnout 63.0 4.3
Ludgvan (5002)
vote share
Mann R.* Ind 1,705 49.0
Squire M. LD 1,379 39.6
Marsham A. Lab 395 11.4
Turnout 69.6 9.4
Marazion (4596)
vote share
Walker N.* LD 1,535 47.1
Roskilly S. Ms. Con 1,319 40.5
Murray T. Lab 404 12.4
Turnout 70.9 6.6
Penzance (16551) 3
vote share
Payne M.* Lab 3,999 27.1
Mates P. LD 3,195 21.7
Williams T. Ms.* LD 3,188 -
Pilcher M. Con 2,912 19.8
Sanderson P. Ms. LD 2,730 -
Schofield P. Ms. Con 2,057 -
Champion J. Con 1,947 -
Power J. Ms. Green 1,534 10.4
Russell M. Green 1,303 -
Faulkner M. UKIP 1,290 8.8
Rendle P. MK 1,277 8.7
Barnes R. UKIP 1,021 -
Dennis C. Ms. Ind 523 3.6
Turnout 65.4 5.5
North Cornwall
Penwith
Corn
wall
26 Local Elections Handbook 2005
St. Ives (9055) 2
vote share
Mitchell A.* LD 2,272 31.0
Symons J. Ms. Con 1,580 21.6
Penhaligon E. Ms. Con 1,463 -
Tonkin G.* LD 1,426 -
Tanner J. Ms. Ind 1,416 19.3
Isaacs H. Lab 1,337 18.2
Slack K. Ms. Green 723 9.9
Richards P. Ms. Green 418 -
Turnout 65.8 9.4
St. Just (5831)
vote share
Angove P. Ms. LD 1,253 31.5
Goninan C. Ind 1,173 29.5
Maddern W. Con 945 23.8
Olivier C. Lab 601 15.1
Turnout 68.1 2.0
Fowey & Lostwithiel (4265)
vote share
Bain S. Ms.* Con 1,257 43.8
Gillett I. LD 943 32.9
Boosey E. Ms. Ind 670 23.3
Turnout 67.3 10.9
Grampound & Mevagissey (4558)
vote share
Hunkin B.* LD 1,387 46.6
Mason J. Ms. Con 1,254 42.1
Baker J. Ms. Lab 336 11.3
Turnout 65.3 4.5
Luxulyan Valley (3641)
vote share
Roberts W.* Ind 0 0.0
Turnout 0.0 0.0
Mount Charles (4598)
vote share
Rawlins B.* LD 1,106 45.3
Polmounter E. Ms. Ind 838 34.3
Derry P. Lab 497 20.4
Turnout 53.1 11.0
Newquay Central (4813)
vote share
Edwards R.* LD 1,107 43.2
Freeman D. Ms. Con 1,022 39.9
Varga J. Ind 434 16.9
Turnout 53.3 3.3
Newquay North (5619)
vote share
Brooke E. LD 1,279 37.6
Lambshead P. Con 1,231 36.2
Heywood H.* Ind 889 26.2
Turnout 60.5 1.4
Newquay West (4834)
vote share
Dent D. Ind 976 36.5
Clarke L. Ms. Con 902 33.7
Irons O. Ms.* LD 799 29.8
Turnout 55.4 2.8
Roche (4433)
vote share
Higman B.* LD 1,145 46.2
Wood J. Ind 995 40.2
Crampton M. Lab 337 13.6
Turnout 55.9 6.1
St. Austell Bay (5164)
vote share
Bull J. Ms. LD 1,343 42.1
Stewart R.* Con 1,336 41.9
Richardson M. Ms. Lab 510 16.0
Turnout 61.8 0.2
St. Austell North (4623)
vote share
Stocker J. LD 1,051 43.2
Heyward S. Ms. Ind 670 27.5
Parkinson R. Lab 453 18.6
Morton-Nance P. MK 261 10.7
Turnout 52.7 15.6
St. Blaise (4922)
vote share
Burley M. LD 1,355 51.7
Riddle T. Lab 659 25.2
Christie R. Ind 606 23.1
Turnout 53.2 26.6
St. Columb (4252)
vote share
Glanville P.* Ind 1,963 76.1
Ellery Y. Ms. Con 616 23.9
Turnout 60.7 52.2
St. Enoder & Colan (4226)
vote share
Waters A. Ind 964 39.0
Rainbow J. LD 571 23.1
Clarke K. Con 560 22.6
Hawken E. Ms. Ind 378 15.3
Turnout 58.5 15.9
St. Mewan (4133)
vote share
Egerton A. Ms. LD 1,450 53.1
Bennett C. Con 938 34.4
Doyle D. Lab 341 12.5
Turnout 66.0 18.8
St. Stephen (4696)
vote share
Curnow D. Ind 1,258 49.4
Thomas K. Ms.* LD 907 35.6
Watling P. Ms. Lab 384 15.1
Turnout 54.3 13.8
Treverbyn (4806)
vote share
Vincent E. Ms.* LD 1,590 57.8
Luke M. MK 654 23.8
Lucas D. Ms. Lab 509 18.5
Turnout 57.3 34.0
Aspatria & Wharrels (5186)
vote share
Buchanan J. Con 1,609 48.4
McCarron-Holmes C. Ms. Lab 997 30.0
Burgess E. LD 717 21.6
2001: Con Turnout 64.1 18.4
Bowness Thursby & Caldbeck (4945)
vote share
Fairbairn D.* Con 1,969 62.2
Luckley O. Ms. LD 1,195 37.8
2001: Con Turnout 64.0 24.5
Cockermouth East (4836)
vote share
Nicholson E.* Con 1,789 54.9
Smith A. Lab 1,471 45.1
2001: Con Turnout 67.4 9.8
Cockermouth West (4224)
vote share
Heslop T.* Con 1,550 55.9
Bacon W. Lab 1,221 44.1
2001: Con Turnout 65.6 11.9
Dearham & Broughton (5302)
vote share
Clark A.* Lab 2,031 59.0
Harris C. Con 1,412 41.0
2001: Lab Turnout 64.9 18.0
Harrington Clifton & Stainburn (5066)
vote share
Caine A. LD 1,603 52.5
Holliday J.* Lab 1,450 47.5
2001: Lab Turnout 60.3 5.0
Keswick & Derwent (5293)
vote share
Barraclough E. Ms. LD 1,602 45.6
Munby R. Con 1,099 31.3
Kemp D. Lab 810 23.1
2001: Con Turnout 66.3 14.3
Maryport East (4518)
vote share
Little K. Lab 2,044 82.9
Pattinson D. Con 421 17.1
2001: Lab Turnout 54.6 65.8
Maryport West (3997)
vote share
Cameron W.* Lab 1,706 73.5
Lishman N. Con 615 26.5
2001: Lab Turnout 58.1 47.0
Moorclose (3326)
vote share
Humes G.* Lab 1,358 71.1
Johanssen C. Ms. LD 551 28.9
2001: Lab Turnout 57.4 42.3
Moss Bay (3005)
vote share
Cannon B. Ms.* Lab 1,172 78.8
Hardon R. Con 316 21.2
2001: Lab Turnout 49.5 57.5
Seaton (3961)
vote share
Fee T. Ind 1,202 51.3
Ardron J. Lab 1,140 48.7
2001: Lab Turnout 59.1 2.6
Solway Coast (4994)
vote share
Markley A. Con 1,269 40.3
Allison R.* Lab 1,127 35.8
Jefferson W. Ind 749 23.8
2001: Lab Turnout 63.0 4.5
St. Johns (3912)
vote share
Samson J.* Lab 1,345 57.8
Heathcote J. Con 984 42.2
2001: Lab Turnout 59.5 15.5
Restormel
Allerdale
Cumbria
27Results of the County Council Elections
St. Michaels (3445)
vote share
Barry A. Lab 1,282 62.7
Francis I. LD 763 37.3
2001: Lab Turnout 59.4 25.4
Wigton (4714)
vote share
Crouch J. Lab 856 32.1
Moffat S. Con 804 30.1
Scott G. Ind 711 26.6
Forsyth J. Ms. LD 299 11.2
2001: Con Turnout 56.6 1.9
Dalton North (4716)
vote share
Phizacklea P.* Lab 1,495 54.5
Crosthwaite W. Con 1,246 45.5
2001: Lab Turnout 58.1 9.1
Dalton South (4400)
vote share
Smith W.* Lab 1,215 47.7
Murray F. Con 985 38.7
Young H. Ms. Ind 348 13.7
2001: Lab Turnout 57.9 9.0
Hawcoat (4212)
vote share
Richardson J.* Con 1,924 67.3
Kegg T. Ms. Lab 935 32.7
2001: Con Turnout 67.9 34.6
Hindpool (3894)
vote share
Burns A. Ms.* Lab 1,327 73.2
Murray J. Con 485 26.8
2001: Lab Turnout 46.5 46.5
Newbarns (4114)
vote share
Murphy J. Lab 1,106 44.8
Pears W.* Con 1,067 43.2
Tongue J. Ind 295 12.0
2001: Con Turnout 60.0 1.6
Old Barrow (3158)
vote share
Kitchen C. Lab 657 43.4
Wood E. Ind 645 42.6
Hamezeian R. Ms. PP 211 13.9
2001: Lab Turnout 47.9 0.8
Ormsgill (3830)
vote share
Wilson E.* Lab 954 49.0
Hamezeian J. PP 615 31.6
Macur T. Ms. Con 376 19.3
2001: Lab Turnout 50.8 17.4
Parkside (3826)
vote share
Nicholson A.* Lab 1,307 58.9
Richardson S. Ms. Con 913 41.1
2001: Lab Turnout 58.0 17.7
Risedale (4662)
vote share
Hamilton K.* Lab 1,654 71.9
English D. Con 645 28.1
2001: Lab Turnout 49.3 43.9
Roosecote (4345)
vote share
Shaw N.* Lab 1,057 38.5
Williams K. Con 1,052 38.3
Titcombe A. LD 635 23.1
2001: Lab Turnout 63.2 0.2
Walney North (4095)
vote share
Murphy J. Ms.* Lab 1,315 58.6
Lauderdale B. Ms. Con 632 28.2
Arts K. Ind 298 13.3
2001: Lab Turnout 54.8 30.4
Walney South (4127)
vote share
Garnett J. Lab 1,211 50.1
Pritchard G. Con 786 32.5
Smart S. Ind 315 13.0
Weall T. Ind 103 4.3
2001: Lab Turnout 58.5 17.6
Belah (4812)
vote share
Toole A.* Con 1,644 53.9
Hendry J. Lab 1,284 42.1
Gibson M. LCA 124 4.1
2001: Con Turnout 63.4 11.8
Belle Vue (4204)
vote share
Weber C.* Lab 1,200 49.7
Bain G. Con 745 30.9
Tootle J. LD 411 17.0
Peacock J. LCA 57 2.4
2001: Lab Turnout 57.4 18.9
Botcherby (4498)
vote share
Glendinning A. Ms.* Lab 1,456 71.1
Cartner T. Ms. Con 591 28.9
2001: Lab Turnout 45.5 42.3
Brampton & Gilsland (5201)
vote share
Howard P. Con 1,370 47.8
Faulds A. Lab 809 28.2
Marsden A. LD 689 24.0
2001: Con Turnout 55.1 19.6
Castle (4224)
vote share
Hodgson T. LD 937 43.8
Riddle J. Ms. Lab 853 39.9
Smith P. Ms. Con 349 16.3
2001: LD Turnout 50.6 3.9
Currock (4345)
vote share
Bradley H. Ms. Lab 1,414 61.7
Fisher L. Con 510 22.3
Richardson M. Ms. LD 366 16.0
2001: Lab Turnout 52.7 39.5
Dalston & Cummersdale (5944)
vote share
Collier J.* Con 2,057 50.6
Warwick A. Ms. Lab 1,042 25.6
Wyllie W. LD 968 23.8
2001: Con Turnout 68.4 25.0
Denton Holme (4671)
vote share
McDevitt H. Lab 1,587 61.7
Parsons D. Ms. Con 543 21.1
Struthers R. LD 442 17.2
2001: Lab Turnout 55.1 40.6
Harraby (4601)
vote share
Richardson M.* Lab 1,423 56.1
Stevenson A. Con 691 27.2
Hall O. Ms. LD 423 16.7
2001: Lab Turnout 55.1 28.9
Longtown & Bewcastle (5071)
vote share
Prest G. Con 1,417 52.6
Dodds R. Lab 769 28.5
Gallagher J. Ms. LD 509 18.9
2001: Con Turnout 53.1 24.0
Morton (4833)
vote share
Bell J. Lab 1,540 49.9
Farmer J.* LD 1,102 35.7
Fisher C. Ms. Con 404 13.1
Gibson L. Ms. LCA 43 1.4
2001: LD Turnout 63.9 14.2
St. Aidans (4512)
vote share
Watson R.* Lab 1,518 63.3
Bainbridge J. Con 880 36.7
2001: Lab Turnout 53.1 26.6
Stanwix & Irthington (5097)
vote share
Mallinson J.* Con 1,760 51.9
Graham W. Ind 1,632 48.1
2001: Con Turnout 66.5 3.8
Stanwix Urban (4809)
vote share
Mallinson E. Ms.* Con 1,736 54.1
Stothard G. Lab 1,475 45.9
2001: Con Turnout 66.8 8.1
Upperby (4030)
vote share
Young S.* Lab 1,297 60.5
Clarke M. Con 448 20.9
Osler J. LD 398 18.6
2001: Lab Turnout 53.2 39.6
Wetheral (5561)
vote share
Robinson J.* Con 2,206 64.7
Horne R. Lab 1,205 35.3
2001: Con Turnout 61.3 29.3
Yewdale (4903)
vote share
Horne H. Ms.* Lab 1,890 61.1
Ellis G. Con 1,202 38.9
2001: Lab Turnout 63.1 22.3
Bransty (4869)
vote share
Kirk B.* Lab 1,746 64.4
Hall D. Con 964 35.6
2001: Lab Turnout 55.7 28.9
Barrow In Furness
Carlisle
Copeland
Cum
bria
28 Local Elections Handbook 2005
Cleator Moor North & Frizington (5306)
vote share
Knowles T.* Lab 2,082 71.4
Carroll A. Con 834 28.6
2001: Lab Turnout 55.0 42.8
Cleator Moor South & Egremont (5212)
vote share
Leyton S.* Lab 1,990 63.9
Lewthwaite J. Ms. Con 1,126 36.1
2001: Lab Turnout 59.8 27.7
Distington & Moresby (4216)
vote share
Ross A.* Lab 1,522 65.1
Higgins G. Con 817 34.9
2001: Lab Turnout 55.5 30.1
Gosforth & Ennerdale (4301)
vote share
Clarkson N. Con 1,467 50.2
Watson P. Lab 897 30.7
Minogue M. LD 561 19.2
2001: Con Turnout 68.0 19.5
Hensingham & Arlecdon (4471)
vote share
Calvin R.* Lab 1,712 67.2
Simpson M. Ms. Con 836 32.8
2001: Lab Turnout 57.0 34.4
Hillcrest (4420)
vote share
Andersen J. Ms.* Lab 1,237 46.9
Norwood A. Con 984 37.3
Hollowell F. LD 419 15.9
2001: Lab Turnout 59.7 9.6
Kells & Sandwith (3897)
vote share
McAllister J.* Lab 1,367 65.8
Brown G. Ind 357 17.2
Higgins L. Ms. Con 355 17.1
2001: Lab Turnout 53.3 48.6
Millom (5647)
vote share
Cole R. Con 1,700 50.0
Woodward R. Lab 1,698 50.0
2001: Con Turnout 60.2 0.1
Mirehouse (3587)
vote share
Woolley J.* Lab 1,357 74.2
Swift M. Con 473 25.8
2001: Lab Turnout 51.0 48.3
Seascale & Wicham (4833)
vote share
Brown S. Ms.* Con 2,321 71.0
Holliday A. Lab 946 29.0
2001: Con Turnout 67.6 42.1
St. Bees & Egremont (4326)
vote share
Southward D.* Lab 1,411 53.9
Davis-Johnston A. Con 940 35.9
Mossop A. EDem 269 10.3
2001: Lab Turnout 60.6 18.0
Alston & East Fellside (4929)
vote share
Henderson I. Ms. Con 1,257 35.7
Metz B. Ind 1,028 29.2
Collinge G. LD 775 22.0
Bagshaw C. Lab 463 13.1
2001: Con Turnout 71.5 6.5
Appleby (4434)
vote share
Warburton M. Ms.* Con 1,474 51.0
Connell A. LD 1,418 49.0
2001: Con Turnout 65.2 1.9
Eden Lakes (4381)
vote share
Bird R.* Con 1,315 44.8
Hughes N. LD 1,152 39.2
Wildish J. Ms. Ind 470 16.0
2001: Con Turnout 67.0 5.5
Greystoke & Hesket (4713)
vote share
Richardson A.* Con 1,775 54.9
Leonard D. LD 1,063 32.9
Huddleston P. Ind 395 12.2
2001: Con Turnout 68.6 22.0
Kirkby Stephen (4862)
vote share
Stoddard T.* Con 1,334 42.4
Raw J. LD 954 30.3
Brook J. Ms. Ind 861 27.3
2001: Con Turnout 64.8 12.1
Penrith East (4493)
vote share
Ash M.* LD 1,129 45.1
Nicolson G. Con 765 30.6
Dovaston K. Lab 467 18.7
Nicholson J. Ind 141 5.6
2001: LD Turnout 55.7 14.5
Penrith North (4546)
vote share
Chappelhow P.* Con 1,132 39.0
Bell A. LD 1,034 35.6
Rockliffe-King G. Lab 432 14.9
Robinson M. Ms. Ind 304 10.5
2001: Con Turnout 63.8 3.4
Penrith Rural (4478)
vote share
Strong G.* Con 1,793 57.7
Hughes S. LD 850 27.4
Crompton A. Ms. Lab 464 14.9
2001: Con Turnout 69.4 30.4
Penrith West (4108)
vote share
Nineham C.* Ind 754 33.8
Thompson J. Con 663 29.7
Burgin R. LD 455 20.4
Wilson E. Lab 360 16.1
2001: Ind Turnout 54.3 4.1
Cartmel (4406)
vote share
Walsh E. Con 1,332 44.3
Birchall D. LD 1,302 43.3
Molloy M. Ms. Lab 374 12.4
2001: LD Turnout 68.3 1.0
Grange (4964)
vote share
Wearing W. Con 1,973 53.7
Hall J. Ms. LD 1,374 37.4
Scullard L. Lab 328 8.9
2001: Con Turnout 74.0 16.3
High Furness (4250)
vote share
Pearson O.* Con 1,426 46.7
Davies E. LD 1,265 41.5
Cross R. Ms. Lab 360 11.8
2001: Con Turnout 71.8 5.3
Kendal Castle (4734)
vote share
Clare T.* LD 1,941 57.6
Robinson E. Ms. Con 1,034 30.7
Batteson C. Lab 395 11.7
2001: LD Turnout 71.2 26.9
Kendal Highgate (4284)
vote share
Cook G. LD 1,167 43.6
Jowett M.* Lab 900 33.6
Chisholm Caunt J. Ms. Con 611 22.8
2001: Lab Turnout 62.5 10.0
Kendal Nether (4667)
vote share
Lishman L.* LD 1,506 48.9
Braithwaite P. Lab 791 25.7
Patrick K. Ms. Con 781 25.4
2001: LD Turnout 66.0 23.2
Kendal South (4748)
vote share
Bobbett A.* Con 1,480 42.2
Vincent G. LD 1,443 41.2
Rothwell R. Lab 478 13.6
Billson-Page A. Ind 103 2.9
2001: Con Turnout 73.8 1.1
Kendal Strickland & Fell (4621)
vote share
Clarke D.* Lab 1,434 45.3
Coleman S. LD 1,149 36.3
Mackie M. Con 582 18.4
2001: Lab Turnout 68.5 9.0
Kent Estuary (5177)
vote share
Stewart I.* LD 2,038 52.5
Coates A. Con 1,526 39.3
Strang A. Lab 319 8.2
2001: LD Turnout 75.0 13.2
Lakes (4153)
vote share
Barton B. Con 1,025 40.5
Abrahams M. Ms. LD 908 35.9
Middleton G. Ind 324 12.8
Colquhoun M. Ms. Lab 275 10.9
2001: LD Turnout 61.0 4.6
Low Furness (4698)
vote share
Hemingway J. LD 1,636 53.4
Steel D. Con 1,425 46.6
2001: Con Turnout 65.2 6.9
Lower Kentdale (4612)
vote share
Bingham R.* Con 2,209 64.5
Jolley A. LD 925 27.0
Horner P. Lab 292 8.5
2001: Con Turnout 74.3 37.5
Eden
South Lakeland
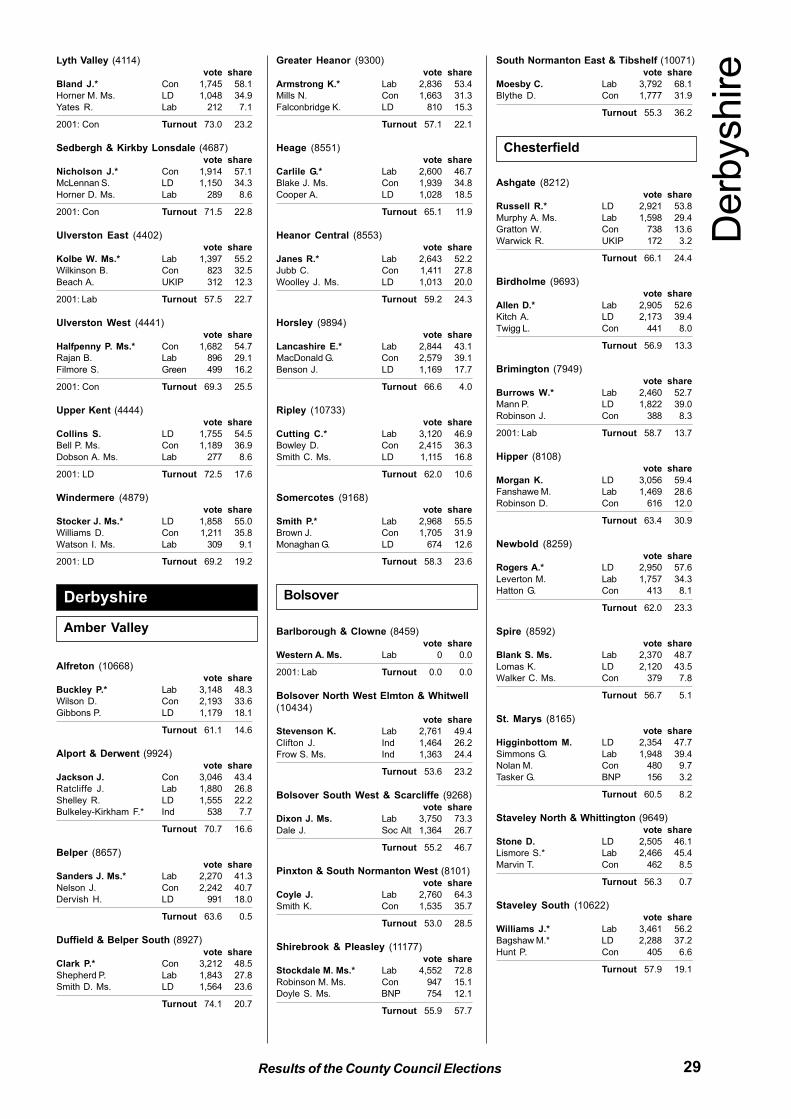
29Results of the County Council Elections
Lyth Valley (4114)
vote share
Bland J.* Con 1,745 58.1
Horner M. Ms. LD 1,048 34.9
Yates R. Lab 212 7.1
2001: Con Turnout 73.0 23.2
Sedbergh & Kirkby Lonsdale (4687)
vote share
Nicholson J.* Con 1,914 57.1
McLennan S. LD 1,150 34.3
Horner D. Ms. Lab 289 8.6
2001: Con Turnout 71.5 22.8
Ulverston East (4402)
vote share
Kolbe W. Ms.* Lab 1,397 55.2
Wilkinson B. Con 823 32.5
Beach A. UKIP 312 12.3
2001: Lab Turnout 57.5 22.7
Ulverston West (4441)
vote share
Halfpenny P. Ms.* Con 1,682 54.7
Rajan B. Lab 896 29.1
Filmore S. Green 499 16.2
2001: Con Turnout 69.3 25.5
Upper Kent (4444)
vote share
Collins S. LD 1,755 54.5
Bell P. Ms. Con 1,189 36.9
Dobson A. Ms. Lab 277 8.6
2001: LD Turnout 72.5 17.6
Windermere (4879)
vote share
Stocker J. Ms.* LD 1,858 55.0
Williams D. Con 1,211 35.8
Watson I. Ms. Lab 309 9.1
2001: LD Turnout 69.2 19.2
Alfreton (10668)
vote share
Buckley P.* Lab 3,148 48.3
Wilson D. Con 2,193 33.6
Gibbons P. LD 1,179 18.1
Turnout 61.1 14.6
Alport & Derwent (9924)
vote share
Jackson J. Con 3,046 43.4
Ratcliffe J. Lab 1,880 26.8
Shelley R. LD 1,555 22.2
Bulkeley-Kirkham F.* Ind 538 7.7
Turnout 70.7 16.6
Belper (8657)
vote share
Sanders J. Ms.* Lab 2,270 41.3
Nelson J. Con 2,242 40.7
Dervish H. LD 991 18.0
Turnout 63.6 0.5
Duffield & Belper South (8927)
vote share
Clark P.* Con 3,212 48.5
Shepherd P. Lab 1,843 27.8
Smith D. Ms. LD 1,564 23.6
Turnout 74.1 20.7
Greater Heanor (9300)
vote share
Armstrong K.* Lab 2,836 53.4
Mills N. Con 1,663 31.3
Falconbridge K. LD 810 15.3
Turnout 57.1 22.1
Heage (8551)
vote share
Carlile G.* Lab 2,600 46.7
Blake J. Ms. Con 1,939 34.8
Cooper A. LD 1,028 18.5
Turnout 65.1 11.9
Heanor Central (8553)
vote share
Janes R.* Lab 2,643 52.2
Jubb C. Con 1,411 27.8
Woolley J. Ms. LD 1,013 20.0
Turnout 59.2 24.3
Horsley (9894)
vote share
Lancashire E.* Lab 2,844 43.1
MacDonald G. Con 2,579 39.1
Benson J. LD 1,169 17.7
Turnout 66.6 4.0
Ripley (10733)
vote share
Cutting C.* Lab 3,120 46.9
Bowley D. Con 2,415 36.3
Smith C. Ms. LD 1,115 16.8
Turnout 62.0 10.6
Somercotes (9168)
vote share
Smith P.* Lab 2,968 55.5
Brown J. Con 1,705 31.9
Monaghan G. LD 674 12.6
Turnout 58.3 23.6
Barlborough & Clowne (8459)
vote share
Western A. Ms. Lab 0 0.0
2001: Lab Turnout 0.0 0.0
Bolsover North West Elmton & Whitwell
(10434)
vote share
Stevenson K. Lab 2,761 49.4
Clifton J. Ind 1,464 26.2
Frow S. Ms. Ind 1,363 24.4
Turnout 53.6 23.2
Bolsover South West & Scarcliffe (9268)
vote share
Dixon J. Ms. Lab 3,750 73.3
Dale J. Soc Alt 1,364 26.7
Turnout 55.2 46.7
Pinxton & South Normanton West (8101)
vote share
Coyle J. Lab 2,760 64.3
Smith K. Con 1,535 35.7
Turnout 53.0 28.5
Shirebrook & Pleasley (11177)
vote share
Stockdale M. Ms.* Lab 4,552 72.8
Robinson M. Ms. Con 947 15.1
Doyle S. Ms. BNP 754 12.1
Turnout 55.9 57.7
South Normanton East & Tibshelf (10071)
vote share
Moesby C. Lab 3,792 68.1
Blythe D. Con 1,777 31.9
Turnout 55.3 36.2
Ashgate (8212)
vote share
Russell R.* LD 2,921 53.8
Murphy A. Ms. Lab 1,598 29.4
Gratton W. Con 738 13.6
Warwick R. UKIP 172 3.2
Turnout 66.1 24.4
Birdholme (9693)
vote share
Allen D.* Lab 2,905 52.6
Kitch A. LD 2,173 39.4
Twigg L. Con 441 8.0
Turnout 56.9 13.3
Brimington (7949)
vote share
Burrows W.* Lab 2,460 52.7
Mann P. LD 1,822 39.0
Robinson J. Con 388 8.3
2001: Lab Turnout 58.7 13.7
Hipper (8108)
vote share
Morgan K. LD 3,056 59.4
Fanshawe M. Lab 1,469 28.6
Robinson D. Con 616 12.0
Turnout 63.4 30.9
Newbold (8259)
vote share
Rogers A.* LD 2,950 57.6
Leverton M. Lab 1,757 34.3
Hatton G. Con 413 8.1
Turnout 62.0 23.3
Spire (8592)
vote share
Blank S. Ms. Lab 2,370 48.7
Lomas K. LD 2,120 43.5
Walker C. Ms. Con 379 7.8
Turnout 56.7 5.1
St. Marys (8165)
vote share
Higginbottom M. LD 2,354 47.7
Simmons G. Lab 1,948 39.4
Nolan M. Con 480 9.7
Tasker G. BNP 156 3.2
Turnout 60.5 8.2
Staveley North & Whittington (9649)
vote share
Stone D. LD 2,505 46.1
Lismore S.* Lab 2,466 45.4
Marvin T. Con 462 8.5
Turnout 56.3 0.7
Staveley South (10622)
vote share
Williams J.* Lab 3,461 56.2
Bagshaw M.* LD 2,288 37.2
Hunt P. Con 405 6.6
Turnout 57.9 19.1
Amber Valley
Derbyshire Bolsover
Derb
yshire
Chesterfield
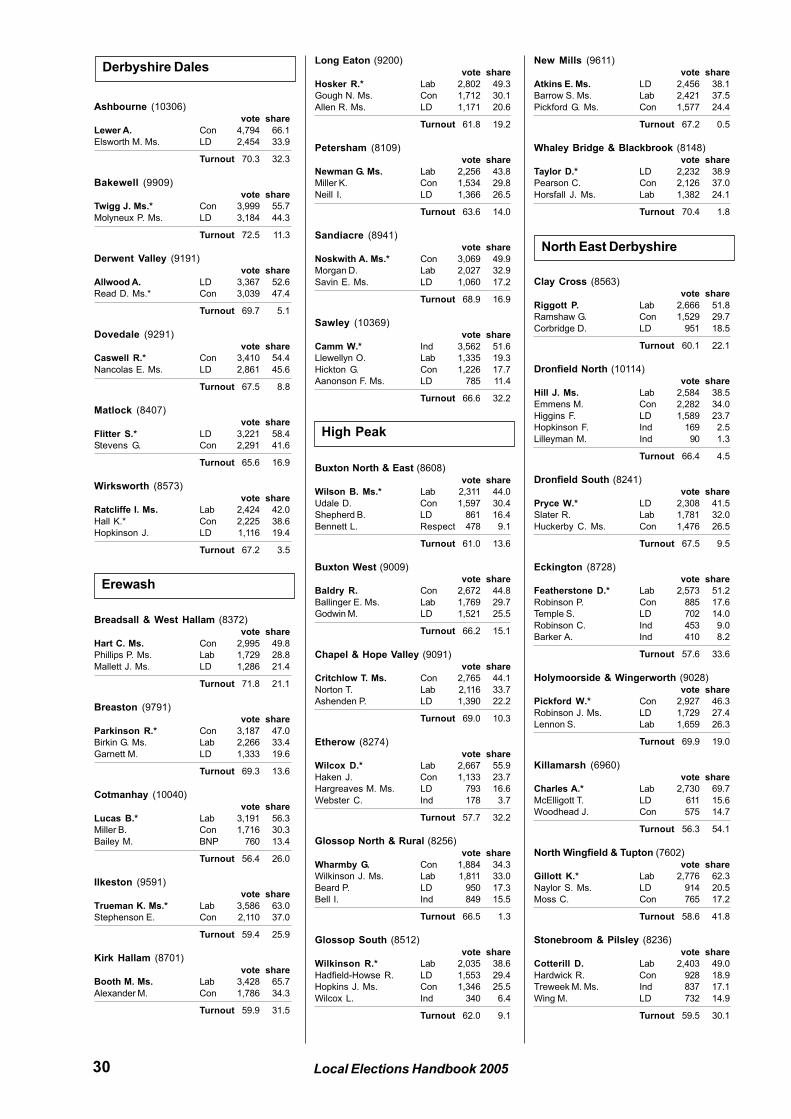
30 Local Elections Handbook 2005
Ashbourne (10306)
vote share
Lewer A. Con 4,794 66.1
Elsworth M. Ms. LD 2,454 33.9
Turnout 70.3 32.3
Bakewell (9909)
vote share
Twigg J. Ms.* Con 3,999 55.7
Molyneux P. Ms. LD 3,184 44.3
Turnout 72.5 11.3
Derwent Valley (9191)
vote share
Allwood A. LD 3,367 52.6
Read D. Ms.* Con 3,039 47.4
Turnout 69.7 5.1
Dovedale (9291)
vote share
Caswell R.* Con 3,410 54.4
Nancolas E. Ms. LD 2,861 45.6
Turnout 67.5 8.8
Matlock (8407)
vote share
Flitter S.* LD 3,221 58.4
Stevens G. Con 2,291 41.6
Turnout 65.6 16.9
Wirksworth (8573)
vote share
Ratcliffe I. Ms. Lab 2,424 42.0
Hall K.* Con 2,225 38.6
Hopkinson J. LD 1,116 19.4
Turnout 67.2 3.5
Breadsall & West Hallam (8372)
vote share
Hart C. Ms. Con 2,995 49.8
Phillips P. Ms. Lab 1,729 28.8
Mallett J. Ms. LD 1,286 21.4
Turnout 71.8 21.1
Breaston (9791)
vote share
Parkinson R.* Con 3,187 47.0
Birkin G. Ms. Lab 2,266 33.4
Garnett M. LD 1,333 19.6
Turnout 69.3 13.6
Cotmanhay (10040)
vote share
Lucas B.* Lab 3,191 56.3
Miller B. Con 1,716 30.3
Bailey M. BNP 760 13.4
Turnout 56.4 26.0
Ilkeston (9591)
vote share
Trueman K. Ms.* Lab 3,586 63.0
Stephenson E. Con 2,110 37.0
Turnout 59.4 25.9
Kirk Hallam (8701)
vote share
Booth M. Ms. Lab 3,428 65.7
Alexander M. Con 1,786 34.3
Turnout 59.9 31.5
Long Eaton (9200)
vote share
Hosker R.* Lab 2,802 49.3
Gough N. Ms. Con 1,712 30.1
Allen R. Ms. LD 1,171 20.6
Turnout 61.8 19.2
Petersham (8109)
vote share
Newman G. Ms. Lab 2,256 43.8
Miller K. Con 1,534 29.8
Neill I. LD 1,366 26.5
Turnout 63.6 14.0
Sandiacre (8941)
vote share
Noskwith A. Ms.* Con 3,069 49.9
Morgan D. Lab 2,027 32.9
Savin E. Ms. LD 1,060 17.2
Turnout 68.9 16.9
Sawley (10369)
vote share
Camm W.* Ind 3,562 51.6
Llewellyn O. Lab 1,335 19.3
Hickton G. Con 1,226 17.7
Aanonson F. Ms. LD 785 11.4
Turnout 66.6 32.2
Buxton North & East (8608)
vote share
Wilson B. Ms.* Lab 2,311 44.0
Udale D. Con 1,597 30.4
Shepherd B. LD 861 16.4
Bennett L. Respect 478 9.1
Turnout 61.0 13.6
Buxton West (9009)
vote share
Baldry R. Con 2,672 44.8
Ballinger E. Ms. Lab 1,769 29.7
Godwin M. LD 1,521 25.5
Turnout 66.2 15.1
Chapel & Hope Valley (9091)
vote share
Critchlow T. Ms. Con 2,765 44.1
Norton T. Lab 2,116 33.7
Ashenden P. LD 1,390 22.2
Turnout 69.0 10.3
Etherow (8274)
vote share
Wilcox D.* Lab 2,667 55.9
Haken J. Con 1,133 23.7
Hargreaves M. Ms. LD 793 16.6
Webster C. Ind 178 3.7
Turnout 57.7 32.2
Glossop North & Rural (8256)
vote share
Wharmby G. Con 1,884 34.3
Wilkinson J. Ms. Lab 1,811 33.0
Beard P. LD 950 17.3
Bell I. Ind 849 15.5
Turnout 66.5 1.3
Glossop South (8512)
vote share
Wilkinson R.* Lab 2,035 38.6
Hadfield-Howse R. LD 1,553 29.4
Hopkins J. Ms. Con 1,346 25.5
Wilcox L. Ind 340 6.4
Turnout 62.0 9.1
New Mills (9611)
vote share
Atkins E. Ms. LD 2,456 38.1
Barrow S. Ms. Lab 2,421 37.5
Pickford G. Ms. Con 1,577 24.4
Turnout 67.2 0.5
Whaley Bridge & Blackbrook (8148)
vote share
Taylor D.* LD 2,232 38.9
Pearson C. Con 2,126 37.0
Horsfall J. Ms. Lab 1,382 24.1
Turnout 70.4 1.8
Clay Cross (8563)
vote share
Riggott P. Lab 2,666 51.8
Ramshaw G. Con 1,529 29.7
Corbridge D. LD 951 18.5
Turnout 60.1 22.1
Dronfield North (10114)
vote share
Hill J. Ms. Lab 2,584 38.5
Emmens M. Con 2,282 34.0
Higgins F. LD 1,589 23.7
Hopkinson F. Ind 169 2.5
Lilleyman M. Ind 90 1.3
Turnout 66.4 4.5
Dronfield South (8241)
vote share
Pryce W.* LD 2,308 41.5
Slater R. Lab 1,781 32.0
Huckerby C. Ms. Con 1,476 26.5
Turnout 67.5 9.5
Eckington (8728)
vote share
Featherstone D.* Lab 2,573 51.2
Robinson P. Con 885 17.6
Temple S. LD 702 14.0
Robinson C. Ind 453 9.0
Barker A. Ind 410 8.2
Turnout 57.6 33.6
Holymoorside & Wingerworth (9028)
vote share
Pickford W.* Con 2,927 46.3
Robinson J. Ms. LD 1,729 27.4
Lennon S. Lab 1,659 26.3
Turnout 69.9 19.0
Killamarsh (6960)
vote share
Charles A.* Lab 2,730 69.7
McElligott T. LD 611 15.6
Woodhead J. Con 575 14.7
Turnout 56.3 54.1
North Wingfield & Tupton (7602)
vote share
Gillott K.* Lab 2,776 62.3
Naylor S. Ms. LD 914 20.5
Moss C. Con 765 17.2
Turnout 58.6 41.8
Stonebroom & Pilsley (8236)
vote share
Cotterill D. Lab 2,403 49.0
Hardwick R. Con 928 18.9
Treweek M. Ms. Ind 837 17.1
Wing M. LD 732 14.9
Turnout 59.5 30.1
Derbyshire Dales
Erewash
High Peak
North East Derbyshire
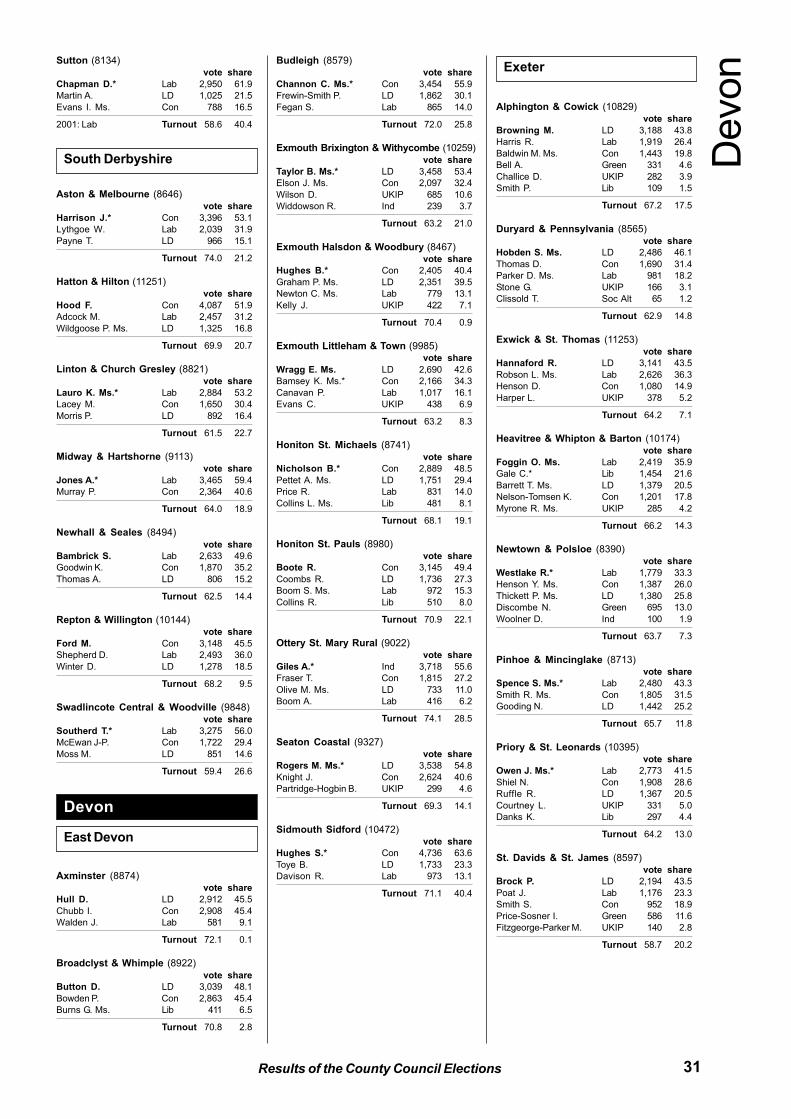
31Results of the County Council Elections
Sutton (8134)
vote share
Chapman D.* Lab 2,950 61.9
Martin A. LD 1,025 21.5
Evans I. Ms. Con 788 16.5
2001: Lab Turnout 58.6 40.4
Aston & Melbourne (8646)
vote share
Harrison J.* Con 3,396 53.1
Lythgoe W. Lab 2,039 31.9
Payne T. LD 966 15.1
Turnout 74.0 21.2
Hatton & Hilton (11251)
vote share
Hood F. Con 4,087 51.9
Adcock M. Lab 2,457 31.2
Wildgoose P. Ms. LD 1,325 16.8
Turnout 69.9 20.7
Linton & Church Gresley (8821)
vote share
Lauro K. Ms.* Lab 2,884 53.2
Lacey M. Con 1,650 30.4
Morris P. LD 892 16.4
Turnout 61.5 22.7
Midway & Hartshorne (9113)
vote share
Jones A.* Lab 3,465 59.4
Murray P. Con 2,364 40.6
Turnout 64.0 18.9
Newhall & Seales (8494)
vote share
Bambrick S. Lab 2,633 49.6
Goodwin K. Con 1,870 35.2
Thomas A. LD 806 15.2
Turnout 62.5 14.4
Repton & Willington (10144)
vote share
Ford M. Con 3,148 45.5
Shepherd D. Lab 2,493 36.0
Winter D. LD 1,278 18.5
Turnout 68.2 9.5
Swadlincote Central & Woodville (9848)
vote share
Southerd T.* Lab 3,275 56.0
McEwan J-P. Con 1,722 29.4
Moss M. LD 851 14.6
Turnout 59.4 26.6
Axminster (8874)
vote share
Hull D. LD 2,912 45.5
Chubb I. Con 2,908 45.4
Walden J. Lab 581 9.1
Turnout 72.1 0.1
Broadclyst & Whimple (8922)
vote share
Button D. LD 3,039 48.1
Bowden P. Con 2,863 45.4
Burns G. Ms. Lib 411 6.5
Turnout 70.8 2.8
Budleigh (8579)
vote share
Channon C. Ms.* Con 3,454 55.9
Frewin-Smith P. LD 1,862 30.1
Fegan S. Lab 865 14.0
Turnout 72.0 25.8
Exmouth Brixington & Withycombe (10259)
vote share
Taylor B. Ms.* LD 3,458 53.4
Elson J. Ms. Con 2,097 32.4
Wilson D. UKIP 685 10.6
Widdowson R. Ind 239 3.7
Turnout 63.2 21.0
Exmouth Halsdon & Woodbury (8467)
vote share
Hughes B.* Con 2,405 40.4
Graham P. Ms. LD 2,351 39.5
Newton C. Ms. Lab 779 13.1
Kelly J. UKIP 422 7.1
Turnout 70.4 0.9
Exmouth Littleham & Town (9985)
vote share
Wragg E. Ms. LD 2,690 42.6
Bamsey K. Ms.* Con 2,166 34.3
Canavan P. Lab 1,017 16.1
Evans C. UKIP 438 6.9
Turnout 63.2 8.3
Honiton St. Michaels (8741)
vote share
Nicholson B.* Con 2,889 48.5
Pettet A. Ms. LD 1,751 29.4
Price R. Lab 831 14.0
Collins L. Ms. Lib 481 8.1
Turnout 68.1 19.1
Honiton St. Pauls (8980)
vote share
Boote R. Con 3,145 49.4
Coombs R. LD 1,736 27.3
Boom S. Ms. Lab 972 15.3
Collins R. Lib 510 8.0
Turnout 70.9 22.1
Ottery St. Mary Rural (9022)
vote share
Giles A.* Ind 3,718 55.6
Fraser T. Con 1,815 27.2
Olive M. Ms. LD 733 11.0
Boom A. Lab 416 6.2
Turnout 74.1 28.5
Seaton Coastal (9327)
vote share
Rogers M. Ms.* LD 3,538 54.8
Knight J. Con 2,624 40.6
Partridge-Hogbin B. UKIP 299 4.6
Turnout 69.3 14.1
Sidmouth Sidford (10472)
vote share
Hughes S.* Con 4,736 63.6
Toye B. LD 1,733 23.3
Davison R. Lab 973 13.1
Turnout 71.1 40.4
Alphington & Cowick (10829)
vote share
Browning M. LD 3,188 43.8
Harris R. Lab 1,919 26.4
Baldwin M. Ms. Con 1,443 19.8
Bell A. Green 331 4.6
Challice D. UKIP 282 3.9
Smith P. Lib 109 1.5
Turnout 67.2 17.5
Duryard & Pennsylvania (8565)
vote share
Hobden S. Ms. LD 2,486 46.1
Thomas D. Con 1,690 31.4
Parker D. Ms. Lab 981 18.2
Stone G. UKIP 166 3.1
Clissold T. Soc Alt 65 1.2
Turnout 62.9 14.8
Exwick & St. Thomas (11253)
vote share
Hannaford R. LD 3,141 43.5
Robson L. Ms. Lab 2,626 36.3
Henson D. Con 1,080 14.9
Harper L. UKIP 378 5.2
Turnout 64.2 7.1
Heavitree & Whipton & Barton (10174)
vote share
Foggin O. Ms. Lab 2,419 35.9
Gale C.* Lib 1,454 21.6
Barrett T. Ms. LD 1,379 20.5
Nelson-Tomsen K. Con 1,201 17.8
Myrone R. Ms. UKIP 285 4.2
Turnout 66.2 14.3
Newtown & Polsloe (8390)
vote share
Westlake R.* Lab 1,779 33.3
Henson Y. Ms. Con 1,387 26.0
Thickett P. Ms. LD 1,380 25.8
Discombe N. Green 695 13.0
Woolner D. Ind 100 1.9
Turnout 63.7 7.3
Pinhoe & Mincinglake (8713)
vote share
Spence S. Ms.* Lab 2,480 43.3
Smith R. Ms. Con 1,805 31.5
Gooding N. LD 1,442 25.2
Turnout 65.7 11.8
Priory & St. Leonards (10395)
vote share
Owen J. Ms.* Lab 2,773 41.5
Shiel N. Con 1,908 28.6
Ruffle R. LD 1,367 20.5
Courtney L. UKIP 331 5.0
Danks K. Lib 297 4.4
Turnout 64.2 13.0
St. Davids & St. James (8597)
vote share
Brock P. LD 2,194 43.5
Poat J. Lab 1,176 23.3
Smith S. Con 952 18.9
Price-Sosner I. Green 586 11.6
Fitzgeorge-Parker M. UKIP 140 2.8
Turnout 58.7 20.2
South Derbyshire
East Devon
Devon
DevonExeter
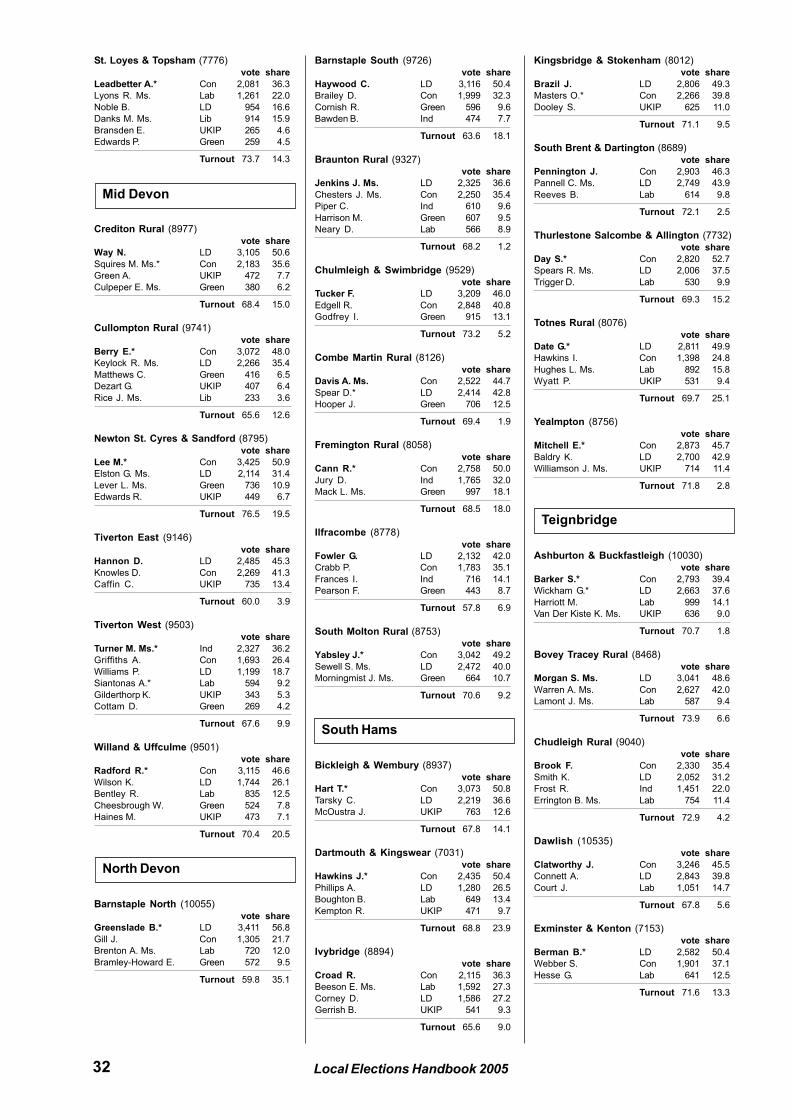
32 Local Elections Handbook 2005
St. Loyes & Topsham (7776)
vote share
Leadbetter A.* Con 2,081 36.3
Lyons R. Ms. Lab 1,261 22.0
Noble B. LD 954 16.6
Danks M. Ms. Lib 914 15.9
Bransden E. UKIP 265 4.6
Edwards P. Green 259 4.5
Turnout 73.7 14.3
Crediton Rural (8977)
vote share
Way N. LD 3,105 50.6
Squires M. Ms.* Con 2,183 35.6
Green A. UKIP 472 7.7
Culpeper E. Ms. Green 380 6.2
Turnout 68.4 15.0
Cullompton Rural (9741)
vote share
Berry E.* Con 3,072 48.0
Keylock R. Ms. LD 2,266 35.4
Matthews C. Green 416 6.5
Dezart G. UKIP 407 6.4
Rice J. Ms. Lib 233 3.6
Turnout 65.6 12.6
Newton St. Cyres & Sandford (8795)
vote share
Lee M.* Con 3,425 50.9
Elston G. Ms. LD 2,114 31.4
Lever L. Ms. Green 736 10.9
Edwards R. UKIP 449 6.7
Turnout 76.5 19.5
Tiverton East (9146)
vote share
Hannon D. LD 2,485 45.3
Knowles D. Con 2,269 41.3
Caffin C. UKIP 735 13.4
Turnout 60.0 3.9
Tiverton West (9503)
vote share
Turner M. Ms.* Ind 2,327 36.2
Griffiths A. Con 1,693 26.4
Williams P. LD 1,199 18.7
Siantonas A.* Lab 594 9.2
Gilderthorp K. UKIP 343 5.3
Cottam D. Green 269 4.2
Turnout 67.6 9.9
Willand & Uffculme (9501)
vote share
Radford R.* Con 3,115 46.6
Wilson K. LD 1,744 26.1
Bentley R. Lab 835 12.5
Cheesbrough W. Green 524 7.8
Haines M. UKIP 473 7.1
Turnout 70.4 20.5
Barnstaple North (10055)
vote share
Greenslade B.* LD 3,411 56.8
Gill J. Con 1,305 21.7
Brenton A. Ms. Lab 720 12.0
Bramley-Howard E. Green 572 9.5
Turnout 59.8 35.1
Barnstaple South (9726)
vote share
Haywood C. LD 3,116 50.4
Brailey D. Con 1,999 32.3
Cornish R. Green 596 9.6
Bawden B. Ind 474 7.7
Turnout 63.6 18.1
Braunton Rural (9327)
vote share
Jenkins J. Ms. LD 2,325 36.6
Chesters J. Ms. Con 2,250 35.4
Piper C. Ind 610 9.6
Harrison M. Green 607 9.5
Neary D. Lab 566 8.9
Turnout 68.2 1.2
Chulmleigh & Swimbridge (9529)
vote share
Tucker F. LD 3,209 46.0
Edgell R. Con 2,848 40.8
Godfrey I. Green 915 13.1
Turnout 73.2 5.2
Combe Martin Rural (8126)
vote share
Davis A. Ms. Con 2,522 44.7
Spear D.* LD 2,414 42.8
Hooper J. Green 706 12.5
Turnout 69.4 1.9
Fremington Rural (8058)
vote share
Cann R.* Con 2,758 50.0
Jury D. Ind 1,765 32.0
Mack L. Ms. Green 997 18.1
Turnout 68.5 18.0
Ilfracombe (8778)
vote share
Fowler G. LD 2,132 42.0
Crabb P. Con 1,783 35.1
Frances I. Ind 716 14.1
Pearson F. Green 443 8.7
Turnout 57.8 6.9
South Molton Rural (8753)
vote share
Yabsley J.* Con 3,042 49.2
Sewell S. Ms. LD 2,472 40.0
Morningmist J. Ms. Green 664 10.7
Turnout 70.6 9.2
Bickleigh & Wembury (8937)
vote share
Hart T.* Con 3,073 50.8
Tarsky C. LD 2,219 36.6
McOustra J. UKIP 763 12.6
Turnout 67.8 14.1
Dartmouth & Kingswear (7031)
vote share
Hawkins J.* Con 2,435 50.4
Phillips A. LD 1,280 26.5
Boughton B. Lab 649 13.4
Kempton R. UKIP 471 9.7
Turnout 68.8 23.9
Ivybridge (8894)
vote share
Croad R. Con 2,115 36.3
Beeson E. Ms. Lab 1,592 27.3
Corney D. LD 1,586 27.2
Gerrish B. UKIP 541 9.3
Turnout 65.6 9.0
Kingsbridge & Stokenham (8012)
vote share
Brazil J. LD 2,806 49.3
Masters O.* Con 2,266 39.8
Dooley S. UKIP 625 11.0
Turnout 71.1 9.5
South Brent & Dartington (8689)
vote share
Pennington J. Con 2,903 46.3
Pannell C. Ms. LD 2,749 43.9
Reeves B. Lab 614 9.8
Turnout 72.1 2.5
Thurlestone Salcombe & Allington (7732)
vote share
Day S.* Con 2,820 52.7
Spears R. Ms. LD 2,006 37.5
Trigger D. Lab 530 9.9
Turnout 69.3 15.2
Totnes Rural (8076)
vote share
Date G.* LD 2,811 49.9
Hawkins I. Con 1,398 24.8
Hughes L. Ms. Lab 892 15.8
Wyatt P. UKIP 531 9.4
Turnout 69.7 25.1
Yealmpton (8756)
vote share
Mitchell E.* Con 2,873 45.7
Baldry K. LD 2,700 42.9
Williamson J. Ms. UKIP 714 11.4
Turnout 71.8 2.8
Ashburton & Buckfastleigh (10030)
vote share
Barker S.* Con 2,793 39.4
Wickham G.* LD 2,663 37.6
Harriott M. Lab 999 14.1
Van Der Kiste K. Ms. UKIP 636 9.0
Turnout 70.7 1.8
Bovey Tracey Rural (8468)
vote share
Morgan S. Ms. LD 3,041 48.6
Warren A. Ms. Con 2,627 42.0
Lamont J. Ms. Lab 587 9.4
Turnout 73.9 6.6
Chudleigh Rural (9040)
vote share
Brook F. Con 2,330 35.4
Smith K. LD 2,052 31.2
Frost R. Ind 1,451 22.0
Errington B. Ms. Lab 754 11.4
Turnout 72.9 4.2
Dawlish (10535)
vote share
Clatworthy J. Con 3,246 45.5
Connett A. LD 2,843 39.8
Court J. Lab 1,051 14.7
Turnout 67.8 5.6
Exminster & Kenton (7153)
vote share
Berman B.* LD 2,582 50.4
Webber S. Con 1,901 37.1
Hesse G. Lab 641 12.5
Turnout 71.6 13.3
Mid Devon
North Devon
South Hams
Teignbridge
33Results of the County Council Elections
Kingsteignton (8712)
vote share
Smith J.* LD 2,450 43.5
Walters M. Con 1,978 35.1
White J. Lab 1,200 21.3
Turnout 64.6 8.4
Newton Abbot North (8710)
vote share
Fry A. Ms. LD 2,829 52.7
Johnson M. Con 1,641 30.5
Kaye B. Lab 903 16.8
Turnout 61.7 22.1
Newton Abbot South (9565)
vote share
Hook G. LD 3,275 53.3
Vizor A. Con 1,819 29.6
Lewis L. Ms. Lab 1,048 17.1
Turnout 64.2 23.7
Teign Estuary (8433)
vote share
Cox D. LD 1,837 32.3
Brown C. Ms. Con 1,491 26.2
Clarance C. Ind 957 16.8
Kennedy M. Ms. Lab 802 14.1
Whitlock C. UKIP 594 10.5
Turnout 67.4 6.1
Teignbridge South (8756)
vote share
Cook P.* LD 2,406 37.9
Long W. Con 2,088 32.9
Colclough M. Ms. Ind 1,192 18.8
Verbrugge E. Ms. Lab 660 10.4
Turnout 72.5 5.0
Teignmouth (7593)
vote share
Bray C. LD 1,883 35.6
Bladon G. Con 1,465 27.7
Russell S. Ms. Ind 784 14.8
Phillips R. Ind 590 11.2
Tucker M. Ms. Lab 564 10.7
Turnout 69.6 7.9
Bideford East (8919)
vote share
Barton H.* LD 2,613 47.5
Leather C. Con 1,891 34.4
Brenton D. Lab 1,001 18.2
Turnout 61.7 13.1
Bideford South & Hartland (9032)
vote share
Temperley H. LD 2,825 47.4
Williamson R. Con 2,162 36.2
Gale V. Lab 978 16.4
Turnout 66.0 11.1
Holsworthy Rural (9720)
vote share
Shadrick D.* LD 3,864 55.2
Tabor G. Ms. Con 2,617 37.4
Vanstone W. Lab 517 7.4
Turnout 72.0 17.8
Northam (9693)
vote share
Ford L. LD 2,459 37.3
Collins A.* Con 2,151 32.6
Eastman A. UKIP 1,190 18.0
Prokowski S. Ms. Lab 799 12.1
Turnout 68.1 4.7
Torrington Rural (9943)
vote share
Rawlinson J.* LD 2,849 41.0
Morrish W. Con 2,788 40.1
Pettifer H. Lab 714 10.3
Merchant P. UKIP 596 8.6
Turnout 69.9 0.9
Hatherleigh & Chagford (9178)
vote share
McInnes J. Con 3,358 48.0
Carter A. Ms. LD 2,609 37.3
Bamford S. Ms. UKIP 529 7.6
Lopez B. Ms. Lab 493 7.1
Turnout 76.1 10.7
Okehampton Rural (10283)
vote share
Marsh C. Ms.* Con 3,216 43.8
Williams K. LD 2,747 37.5
Young A. Ms. Lab 740 10.1
Kelly W. UKIP 632 8.6
Turnout 71.3 6.4
Tavistock (9698)
vote share
Connelly R.* LD 2,109 31.0
Sanders P. Con 1,898 27.9
Sherrell E. Ind 1,769 26.0
Hardy D. Ms. Lab 565 8.3
Mudge D. Ms. UKIP 464 6.8
Turnout 70.2 3.1
Yelverton Rural (9770)
vote share
Hosking A. LD 2,810 39.2
Hitchins P. Con 2,770 38.6
Lopez E. Lab 809 11.3
Mudge A. UKIP 783 10.9
Turnout 73.4 0.6
Burton Grange (6585)
vote share
Fox-Hodges B. Ms.* LD 1,651 40.2
Jones D. Con 1,549 37.7
Hill V. Ms. Lab 910 22.1
Turnout 62.4 2.5
Christchurch Central (7481)
vote share
Hall P.* LD 2,331 46.4
Duckworth M. Con 2,038 40.6
Jacques M. Lab 653 13.0
Turnout 67.1 5.8
Commons (7936)
vote share
Fox D.* Con 2,687 48.6
Viney J. LD 1,968 35.6
Brennan J. Lab 872 15.8
Turnout 69.6 13.0
Highcliffe & Walkford (7369)
vote share
Lofts J.* Con 2,986 55.0
Legg C. LD 1,614 29.7
Trim S. Lab 832 15.3
Turnout 73.7 25.3
Mudeford & Highcliffe (7391)
vote share
Havelock A.* Con 3,328 61.3
Campbell J. LD 1,368 25.2
Wilcox C. Ms. Lab 732 13.5
Turnout 73.4 36.1
Colehill & Stapehill (7595)
vote share
Dover J. Ms. LD 2,710 48.1
Packer D. Con 2,393 42.5
Parish K. Ms. Lab 527 9.4
Turnout 74.1 5.6
Corfe Mullen (7946)
vote share
Jefferies S. Ms. LD 3,488 63.0
Carmichael G. Ms. Con 2,047 37.0
Turnout 69.7 26.0
Cranborne Chase (6741)
vote share
Palmer T.* Con 2,859 59.1
Tooke D. LD 1,977 40.9
Turnout 71.7 18.2
Ferndown (15669) 2
vote share
Wilson J.* Con 5,390 45.4
Burt D.* Con 5,306 -
Smith N. LD 2,422 20.4
Bartlett P. LD 2,316 -
Birr M. Ind 1,497 12.6
Hampton C. Lab 1,480 12.5
Heaslip R. UKIP 1,083 9.1
Turnout 69.1 25.0
Minster (7466)
vote share
Osner M. Ms.* LD 2,428 47.3
Hodkinson M. Con 2,122 41.4
Parish G. Lab 581 11.3
Turnout 68.7 6.0
St. Leonards & St. Ives (6048)
vote share
Warman A. Ms.* Con 2,923 66.4
Briggs D. Ms. LD 1,103 25.1
Tallett A. UKIP 376 8.5
Turnout 72.8 41.3
Verwood & Three Legged Cross (11278) 2
vote share
Coombs T. Ms.* Con 4,232 57.2
Flower S. Con 3,558 -
Dedden L. Ms. LD 3,173 42.8
Baker P. LD 3,099 -
Turnout 66.7 14.3
West Moors & Holt (7330)
vote share
Gaussen P.* Con 2,654 53.6
Holden P. LD 1,881 38.0
Eckel M. UKIP 419 8.5
Turnout 67.6 15.6
Blackmore Vale (7582)
vote share
Fox D. LD 2,805 53.3
Ash R. Ms.* Con 2,460 46.7
Turnout 69.4 6.6
Torridge
Dorset
West Devon
Christchurch
East Dorset Dors
et
North Dorset
34 Local Elections Handbook 2005
Blandford (7145)
vote share
Cooper B.* LD 2,385 51.9
Stayt J. Ms. Con 1,595 34.7
White H. Lab 617 13.4
Turnout 64.3 17.2
Gillingham (7457)
vote share
Milsted D. LD 2,862 57.9
Mason L.* Con 2,077 42.1
Turnout 66.2 15.9
Hambledon (8016)
vote share
Campbell A.* Con 3,035 52.3
Spencer G. LD 2,389 41.2
Wardleworth D. Lab 378 6.5
Turnout 72.4 11.1
Shaftesbury (5465)
vote share
Cook T. LD 1,894 50.8
Hine G.* Con 1,100 29.5
Thomas R. Ind 407 10.9
Pestell J. Lab 331 8.9
Turnout 68.3 21.3
Stour Vale (6411)
vote share
Cattaway A. Con 2,472 52.8
Jeffery M. LD 1,842 39.4
Harvey D. Lab 365 7.8
Turnout 73.0 13.5
Winterborne (7456)
vote share
Cox H. Ms.* Con 2,616 50.1
Burton G. LD 2,021 38.7
Ormerod T. Lab 582 11.2
Turnout 70.0 11.4
Egdon Heath (6418)
vote share
Shakesby M.* Con 2,237 50.6
Angel M. LD 1,256 28.4
Killingback J. Lab 930 21.0
Turnout 68.9 22.2
Lytchett (8653)
vote share
Drane F. LD 3,351 56.5
Hindley P. Ms. Con 2,578 43.5
Turnout 68.5 13.0
Purbeck Hills (5758)
vote share
Lovell M. Con 2,071 50.4
Wilson W. LD 1,322 32.2
Davey J. Lab 718 17.5
Turnout 71.4 18.2
Swanage (7980)
vote share
Hiett D.* Con 2,223 40.1
Clark P. LD 1,650 29.8
Rabson C. Ms. Lab 1,364 24.6
Madeley M. Ms. UKIP 302 5.5
Turnout 69.4 10.3
Wareham (6763)
vote share
Budd D.* LD 2,863 61.6
Russell M. Con 1,781 38.4
Turnout 68.7 23.3
Beaminster (6231)
vote share
Gregson P. Con 2,523 52.0
Wallace K. LD 2,326 48.0
Turnout 77.8 4.1
Bride Valley (6342)
vote share
Coatsworth R.* Con 2,728 54.9
Harrison A. LD 1,773 35.7
Sea L. Green 467 9.4
Turnout 78.3 19.2
Bridport (6518)
vote share
Brown S. Ms.* Con 1,940 42.3
Ray C. LD 1,695 36.9
Nicholls R. Lab 622 13.6
Judd N. Green 331 7.2
Turnout 70.4 5.3
Chickerell & Chesil Bank (5925)
vote share
Nash R. Con 1,831 42.3
Canning A. LD 1,523 35.1
Hutchings A. Lab 979 22.6
Turnout 73.1 7.1
Dorchester (12522) 2
vote share
Biggs R.* LD 4,844 52.8
Jones T.* LD 4,814 -
Halewood J. Con 2,850 31.1
Parry A. Con 2,758 -
Fell J. Ms. Lab 1,478 16.1
Turnout 73.3 21.7
Linden Lea (7040)
vote share
Crowhurst D.* Con 2,607 47.3
Harries T. LD 2,013 36.5
Owen M. Lab 889 16.1
Turnout 78.3 10.8
Marshwood Vale (6983)
vote share
Brierley G.* Con 2,724 51.9
Turner D. Ms. LD 2,520 48.1
Turnout 75.1 3.9
Sherborne (6355)
vote share
Mildenhall D.* Con 2,612 55.5
Hewson S. Ms. LD 2,094 44.5
Turnout 74.1 11.0
Sherborne Rural (7323)
vote share
Legg R.* LD 2,993 51.6
Clark M. Con 2,809 48.4
Turnout 79.2 3.2
Three Valleys (7280)
vote share
Peake J.* Con 3,063 54.3
Tarr R. LD 2,582 45.7
Turnout 77.5 8.5
Broadwey (8116)
vote share
Burden H.* Lab 2,485 43.6
Goodman M. Con 2,099 36.8
Keets R. LD 1,115 19.6
Turnout 70.2 6.8
Lodmoor (7218)
vote share
Ellis B. LD 2,554 45.9
Bruce H. Ms. Con 2,117 38.1
Drake M. Ms. Lab 890 16.0
Turnout 77.0 7.9
Portland Harbour (6810)
vote share
Kenwood A. Ms. Lab 1,927 42.2
Alsop M. Ms. Con 1,126 24.6
Roe L. Ms. LD 682 14.9
Munro T. Ind 438 9.6
Biggs J. UKIP 397 8.7
Turnout 67.1 17.5
Portland Tophill (6295)
vote share
Ames L.* Ind 1,531 36.1
Draper J. Lab 981 23.2
Redfern J. Ms. Ind 621 14.7
Lindley S. Ms. Con 575 13.6
Legg H. LD 528 12.5
Turnout 67.3 13.0
Rodwell (6768)
vote share
Sutton C. Ms. Lab 1,734 36.9
O’Neill P. Con 1,476 31.4
Birtwhistle J. LD 1,186 25.2
Hopper A. UKIP 305 6.5
Turnout 69.5 5.5
Westham (6731)
vote share
Byatt M.* Lab 2,012 43.4
James C. Ms. LD 1,593 34.4
Wyness N. Con 1,028 22.2
Turnout 68.8 9.0
Weymouth Town (7396)
vote share
Farrell P.* LD 1,641 39.0
Climo L. Ms. Lab 1,449 34.4
Afedakis G. Con 1,117 26.6
Turnout 56.9 4.6
Chester-Le-Street North & East (6540)
vote share
Knox J.* Lab 1,816 47.3
Hutchinson S. Ms. LD 799 20.8
Bainbridge B. Ms. Con 630 16.4
Brown L. Ind 592 15.4
Turnout 58.7 26.5
Chester-Le-Street South (6610)
vote share
Carr R. Ms. Lab 1,946 49.3
Haswell R. LD 1,254 31.8
Hall A. Ms. Con 745 18.9
Turnout 59.7 17.5
Purbeck
West Dorset Weymouth & Portland
Durham
Chester Le Street
35Results of the County Council Elections
Chester-Le-Street West Central (5839)
vote share
Ebbatson B.* Lab 1,853 63.6
Kilkenny S. LD 682 23.4
Stevens P. Con 378 13.0
Turnout 49.9 40.2
Lumley (6025)
vote share
Walker J.* Lab 1,860 53.1
Rae A. Ms. LD 593 16.9
Garrod J. Con 576 16.4
Willis A. Ms. Ind 475 13.6
2001: Lab Turnout 58.2 36.2
Ouston & Urpeth (6160)
vote share
Smith C. Ms.* Lab 2,170 60.5
Leake P. LD 827 23.1
Norman J. Con 588 16.4
Turnout 58.2 37.5
Pelton (6555)
vote share
Cordon J.* Lab 1,848 49.3
Gardner G. LD 698 18.6
Lumsden F. Con 655 17.5
Laverick W. Ind 545 14.5
Turnout 57.1 30.7
Sacriston (5120)
vote share
Wright L. Ms.* Lab 1,693 66.6
Key S. LD 499 19.6
Watson M. Con 349 13.7
Turnout 49.6 47.0
Annfield Plain (5969)
vote share
Hodgson M. Ms.* Lab 2,119 70.1
Raine G. Ms. LD 623 20.6
Watson J. Ms. Con 280 9.3
Turnout 50.6 49.5
Benfieldside (5124)
vote share
Davies J.* Lab 1,250 40.4
Healey J. D Ind 866 28.0
McCaig B. LD 647 20.9
Ross J. Ms. Con 330 10.7
Turnout 60.4 12.4
Burnopfield & Dipton (5943)
vote share
Ord R. D Ind 1,578 45.9
Turnbull E. Ms. Lab 1,474 42.9
Ross R. Con 385 11.2
Turnout 57.8 3.0
Consett North (6228)
vote share
Robson C.* Lab 2,120 61.2
Temple O. LD 947 27.4
Wilson K. Con 395 11.4
Turnout 55.6 33.9
Craghead & South Moor (5652)
vote share
Marshall D.* Lab 1,825 67.8
Harper J. D Ind 450 16.7
Jackson D. LD 279 10.4
Turner J. Ms. Con 136 5.1
Turnout 47.6 51.1
Delves Lane & Consett South (7623)
vote share
Young R. Lab 2,178 56.1
Westgarth A. D Ind 1,389 35.8
Wilson I. Ms. Con 316 8.1
Turnout 50.9 20.3
Esh (5071)
vote share
Armstrong J.* Lab 1,463 50.9
Tyrie W. D Ind 556 19.3
Shaw N. LD 484 16.8
Adams P. Ms. Con 374 13.0
2001: Lab Turnout 56.7 31.5
Lanchester (5952)
vote share
Forster T.* Lab 1,508 40.4
Carr P. Con 797 21.3
Young R. D Ind 717 19.2
English C. Ms. LD 713 19.1
2001: Lab Turnout 62.8 19.0
Leadgate & Medomsley (7409)
vote share
Stelling W.* D Ind 2,279 51.4
Turner E. Lab 1,663 37.5
Adams G. Con 495 11.2
Turnout 59.9 13.9
Stanley (6399)
vote share
Vasey C. Ms. Lab 2,169 69.2
Rolfe D. LD 628 20.0
Turner J. Con 220 7.0
McAdam D. BNP 119 3.8
Turnout 49.0 49.1
Tanfield (6355)
vote share
Hunter E. Ms.* Lab 2,036 60.3
Curtis A. LD 945 28.0
Webb J. Ms. Con 395 11.7
Turnout 53.1 32.3
Belmont (5119)
vote share
Holroyd K. LD 1,868 53.1
Johnston P. Ms. Lab 1,286 36.6
Bean D. Con 362 10.3
Turnout 68.7 16.6
Brandon (7351)
vote share
Rodgers R.* Lab 2,593 61.4
Smith M. Ms. LD 1,629 38.6
Turnout 57.4 22.8
Coxhoe (5297)
vote share
Morgan D.* Lab 2,260 66.0
Martin S. LD 866 25.3
Farley F. Con 300 8.8
Turnout 64.7 40.7
Deerness Valley (7280)
vote share
Chaplow J. Ms. Lab 2,705 60.9
Simpson A. LD 1,357 30.5
Tebbit A. Con 381 8.6
Turnout 61.0 30.3
Durham South (4827)
vote share
Whitfield D. Ms. Lab 1,526 46.8
Lunan I. Ms. LD 1,429 43.8
Wakefield J. Ms. Con 306 9.4
Turnout 67.6 3.0
Elvet (7282)
vote share
Freeman D. LD 2,184 56.8
Ashby J. Lab 925 24.0
Arthur C. Con 739 19.2
Turnout 52.8 32.7
Framwellgate Moor (7457)
vote share
Ross N.* Lab 2,339 48.9
Crooks R. LD 1,952 40.8
Wynne P. Ms. Con 496 10.4
Turnout 64.2 8.1
Gilesgate (5984)
vote share
Southwell D. LD 1,848 48.2
Thompson P.* Lab 1,763 45.9
Stocker J. Con 226 5.9
Turnout 64.1 2.2
Nevilles Cross (6665)
vote share
Martin N.* LD 2,681 63.8
Roberts J. Lab 923 22.0
Smith M. Con 601 14.3
Turnout 63.1 41.8
Newton Hall (6269)
vote share
Simmons F. Ms. LD 2,328 54.0
Smith A. Ms. Lab 1,569 36.4
Osborn H. Ms. Con 415 9.6
2001: LD Turnout 68.8 17.6
Sherburn (6909)
vote share
Pye R.* Lab 2,412 53.8
King L. Ms. LD 1,690 37.7
Fishwick M. Con 385 8.6
2001: Lab Turnout 64.9 16.1
Blackhalls (6229)
vote share
Cox A.* Lab 2,639 80.1
Welford J. Ms. Con 655 19.9
2001: Lab Turnout 52.9 60.2
Dawdon (4891)
vote share
Fenwick A.* Lab 1,717 79.7
Butler J. Ms. Con 438 20.3
Turnout 44.1 59.4
Deneside (5409)
vote share
Nugent A.* Lab 1,921 74.7
Nicholson M. Con 361 14.0
Colborn S. Soc Alt 288 11.2
Turnout 47.5 60.7
Easington (5993)
vote share
Barker A.* Lab 2,519 79.4
Reid M. Ms. Con 652 20.6
2001: Lab Turnout 52.9 58.9
Derwentside
Durham
Durh
am
Easington
36 Local Elections Handbook 2005
Horden (6363)
vote share
Stradling P.* Lab 2,723 88.2
Riley M. Ms. Con 366 11.8
2001: Lab Turnout 48.5 76.3
Murton (5655)
vote share
Maddison J.* Lab 2,510 85.2
Butler C. Con 436 14.8
Turnout 52.1 70.4
Peterlee East (5821)
vote share
Tennant G.* Lab 1,856 75.2
Reynolds L. Ind 404 16.4
Booth R. Con 209 8.5
Turnout 42.4 58.8
Peterlee West (5735)
vote share
Coates D.* Lab 2,276 85.8
Lodge H. Ms. Con 376 14.2
Turnout 46.2 71.6
Seaham (5918)
vote share
Meir R. Lab 2,246 69.8
Dixon D. Con 971 30.2
Turnout 54.4 39.6
Shotton (6745)
vote share
Wade N.* Lab 2,735 83.6
Nicholson L. Ms. Con 538 16.4
2001: Lab Turnout 48.5 67.1
Thornley (5381)
vote share
Nicholls M.* Lab 2,642 89.9
Seear J. Con 297 10.1
2001: Lab Turnout 54.6 79.8
Wingate (7798)
vote share
O’Donnell L.* Lab 3,205 78.7
Seear L. Ms. Con 870 21.3
Turnout 52.3 57.3
Aycliffe East (4935)
vote share
Iveson S. Ms. Lab 1,836 59.6
Blenkinsopp W.* Ind 890 28.9
Crass G. Con 356 11.6
Turnout 62.5 30.7
Aycliffe North (5844)
vote share
Henderson K.* Lab 1,859 53.3
Hogan T.* Ind 991 28.4
Raine J. Ms. Con 636 18.2
Turnout 59.7 24.9
Aycliffe West (5526)
vote share
Gray G. Lab 1,815 57.0
Paylor E. Ms. Ind 956 30.0
Waller P. Ms. Con 412 12.9
Turnout 57.6 27.0
Chilton (6836)
vote share
Porter G.* Lab 2,516 65.2
Sproat C. Ms. LD 890 23.1
Turner W. Con 453 11.7
Turnout 56.5 42.1
Ferryhill (7490)
vote share
Magee C.* Lab 2,728 66.1
Mountford P. LD 1,156 28.0
Whan P. Ms. Con 243 5.9
Turnout 55.1 38.1
Sedgefield (5505)
vote share
Robinson J. Lab 2,196 57.6
Brown D. Con 1,616 42.4
2001: Lab Turnout 69.2 15.2
Shildon East (6758)
vote share
Bowman D. Ms. Lab 1,968 53.0
Howe G. LD 791 21.3
Brown S. Ind 595 16.0
Booth A. Con 356 9.6
Turnout 54.9 31.7
Shildon West (5483)
vote share
Chapman V. Lab 1,312 42.5
Huntington J. LD 1,310 42.5
Smith J. Ind 337 10.9
Swan M. Ms. Con 126 4.1
Turnout 56.3 0.1
Spennymoor & Middlestone (7449)
vote share
Foster E.* Lab 2,413 57.4
Thompson K. LD 1,358 32.3
Carmedy P. Con 431 10.3
Turnout 56.4 25.1
Trimdon (5799)
vote share
Trippett P.* Lab 2,744 76.2
Moyle C. Ms. Con 857 23.8
2001: Lab Turnout 62.1 52.4
Tudhoe (7218)
vote share
Foster N.* Lab 2,526 61.8
Jones M. LD 1,041 25.5
Miller M. Con 523 12.8
Turnout 56.7 36.3
Barnard Castle East (6842)
vote share
Fergus J. Ms.* Con 2,423 57.5
Blackwell F. Lab 1,788 42.5
Turnout 61.5 15.1
Barnard Castle West (6316)
vote share
Bell R. Con 2,155 52.1
Stokeld K. Lab 1,143 27.6
Wearmouth D. Ind 842 20.3
Turnout 65.5 24.4
Evenwood (6758)
vote share
Priestley J.* Lab 2,246 58.5
Richardson G. Con 1,592 41.5
2001: Lab Turnout 56.8 17.0
Bishop Auckland Town (6175)
vote share
Manton K. Lab 1,459 41.4
Foote-Wood C. LD 1,042 29.6
Raine C. Con 666 18.9
Hare S. Ind 208 5.9
Waggott T. Ind 145 4.1
Turnout 57.0 11.8
Coundon (5332)
vote share
Graham P.* Lab 1,616 59.8
Taylor T. LD 787 29.1
Milne D. Con 300 11.1
Turnout 50.7 30.7
Crook North & Tow Law (5592)
vote share
Carroll T.* Lab 1,553 54.2
Bailey J. LD 1,314 45.8
Turnout 51.3 8.3
Crook South (6108)
vote share
Pendlebury R.* Lab 2,194 69.0
English D. LD 987 31.0
Turnout 52.1 37.9
Weardale (6495)
vote share
Shuttleworth J.* Ind 2,853 67.8
Allan D. Ms. LD 774 18.4
Hiles A. Ms. Lab 583 13.8
Turnout 64.8 49.4
West Auckland (5754)
vote share
Douthwaite H.* Lab 1,619 52.5
Ferguson J. LD 1,057 34.3
Bowen-Jones H. Con 407 13.2
Turnout 53.6 18.2
Willington (6608)
vote share
Myers B.* Lab 2,199 62.7
Glynn A. Ms. LD 1,309 37.3
Turnout 53.1 25.4
Woodhouse Close (6379)
vote share
Lethbridge J. Lab 2,119 67.7
Perkins W. LD 712 22.7
Moorhouse S. Ms. Con 299 9.6
Turnout 49.1 45.0
Devonshire (7870)
vote share
Healy B. Ms.* LD 2,395 55.3
Graham K. Con 1,074 24.8
Goude R. Lab 509 11.7
Gross C. Green 231 5.3
Richardson L. UKIP 125 2.9
Turnout 55.1 30.5
Sedgefield
Teesdale
Wear Valley
East Sussex
Eastbourne
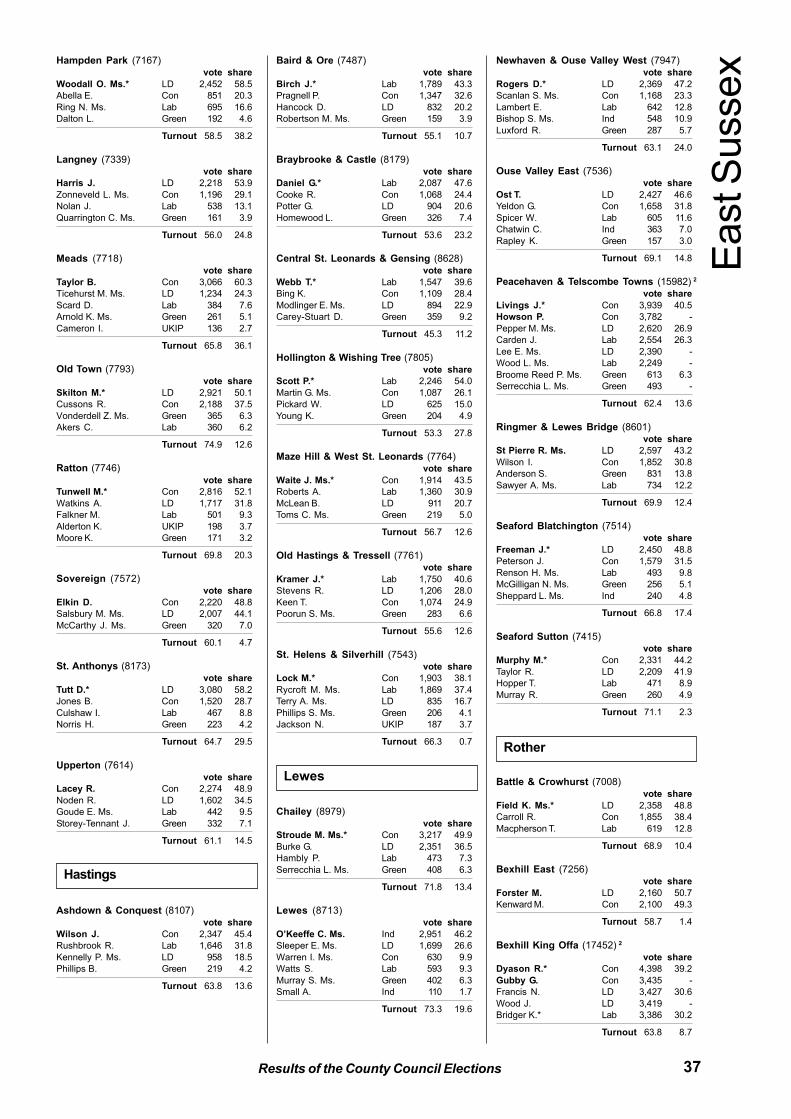
37Results of the County Council Elections
Hampden Park (7167)
vote share
Woodall O. Ms.* LD 2,452 58.5
Abella E. Con 851 20.3
Ring N. Ms. Lab 695 16.6
Dalton L. Green 192 4.6
Turnout 58.5 38.2
Langney (7339)
vote share
Harris J. LD 2,218 53.9
Zonneveld L. Ms. Con 1,196 29.1
Nolan J. Lab 538 13.1
Quarrington C. Ms. Green 161 3.9
Turnout 56.0 24.8
Meads (7718)
vote share
Taylor B. Con 3,066 60.3
Ticehurst M. Ms. LD 1,234 24.3
Scard D. Lab 384 7.6
Arnold K. Ms. Green 261 5.1
Cameron I. UKIP 136 2.7
Turnout 65.8 36.1
Old Town (7793)
vote share
Skilton M.* LD 2,921 50.1
Cussons R. Con 2,188 37.5
Vonderdell Z. Ms. Green 365 6.3
Akers C. Lab 360 6.2
Turnout 74.9 12.6
Ratton (7746)
vote share
Tunwell M.* Con 2,816 52.1
Watkins A. LD 1,717 31.8
Falkner M. Lab 501 9.3
Alderton K. UKIP 198 3.7
Moore K. Green 171 3.2
Turnout 69.8 20.3
Sovereign (7572)
vote share
Elkin D. Con 2,220 48.8
Salsbury M. Ms. LD 2,007 44.1
McCarthy J. Ms. Green 320 7.0
Turnout 60.1 4.7
St. Anthonys (8173)
vote share
Tutt D.* LD 3,080 58.2
Jones B. Con 1,520 28.7
Culshaw I. Lab 467 8.8
Norris H. Green 223 4.2
Turnout 64.7 29.5
Upperton (7614)
vote share
Lacey R. Con 2,274 48.9
Noden R. LD 1,602 34.5
Goude E. Ms. Lab 442 9.5
Storey-Tennant J. Green 332 7.1
Turnout 61.1 14.5
Ashdown & Conquest (8107)
vote share
Wilson J. Con 2,347 45.4
Rushbrook R. Lab 1,646 31.8
Kennelly P. Ms. LD 958 18.5
Phillips B. Green 219 4.2
Turnout 63.8 13.6
Baird & Ore (7487)
vote share
Birch J.* Lab 1,789 43.3
Pragnell P. Con 1,347 32.6
Hancock D. LD 832 20.2
Robertson M. Ms. Green 159 3.9
Turnout 55.1 10.7
Braybrooke & Castle (8179)
vote share
Daniel G.* Lab 2,087 47.6
Cooke R. Con 1,068 24.4
Potter G. LD 904 20.6
Homewood L. Green 326 7.4
Turnout 53.6 23.2
Central St. Leonards & Gensing (8628)
vote share
Webb T.* Lab 1,547 39.6
Bing K. Con 1,109 28.4
Modlinger E. Ms. LD 894 22.9
Carey-Stuart D. Green 359 9.2
Turnout 45.3 11.2
Hollington & Wishing Tree (7805)
vote share
Scott P.* Lab 2,246 54.0
Martin G. Ms. Con 1,087 26.1
Pickard W. LD 625 15.0
Young K. Green 204 4.9
Turnout 53.3 27.8
Maze Hill & West St. Leonards (7764)
vote share
Waite J. Ms.* Con 1,914 43.5
Roberts A. Lab 1,360 30.9
McLean B. LD 911 20.7
Toms C. Ms. Green 219 5.0
Turnout 56.7 12.6
Old Hastings & Tressell (7761)
vote share
Kramer J.* Lab 1,750 40.6
Stevens R. LD 1,206 28.0
Keen T. Con 1,074 24.9
Poorun S. Ms. Green 283 6.6
Turnout 55.6 12.6
St. Helens & Silverhill (7543)
vote share
Lock M.* Con 1,903 38.1
Rycroft M. Ms. Lab 1,869 37.4
Terry A. Ms. LD 835 16.7
Phillips S. Ms. Green 206 4.1
Jackson N. UKIP 187 3.7
Turnout 66.3 0.7
Chailey (8979)
vote share
Stroude M. Ms.* Con 3,217 49.9
Burke G. LD 2,351 36.5
Hambly P. Lab 473 7.3
Serrecchia L. Ms. Green 408 6.3
Turnout 71.8 13.4
Lewes (8713)
vote share
O’Keeffe C. Ms. Ind 2,951 46.2
Sleeper E. Ms. LD 1,699 26.6
Warren I. Ms. Con 630 9.9
Watts S. Lab 593 9.3
Murray S. Ms. Green 402 6.3
Small A. Ind 110 1.7
Turnout 73.3 19.6
Newhaven & Ouse Valley West (7947)
vote share
Rogers D.* LD 2,369 47.2
Scanlan S. Ms. Con 1,168 23.3
Lambert E. Lab 642 12.8
Bishop S. Ms. Ind 548 10.9
Luxford R. Green 287 5.7
Turnout 63.1 24.0
Ouse Valley East (7536)
vote share
Ost T. LD 2,427 46.6
Yeldon G. Con 1,658 31.8
Spicer W. Lab 605 11.6
Chatwin C. Ind 363 7.0
Rapley K. Green 157 3.0
Turnout 69.1 14.8
Peacehaven & Telscombe Towns (15982) 2
vote share
Livings J.* Con 3,939 40.5
Howson P. Con 3,782 -
Pepper M. Ms. LD 2,620 26.9
Carden J. Lab 2,554 26.3
Lee E. Ms. LD 2,390 -
Wood L. Ms. Lab 2,249 -
Broome Reed P. Ms. Green 613 6.3
Serrecchia L. Ms. Green 493 -
Turnout 62.4 13.6
Ringmer & Lewes Bridge (8601)
vote share
St Pierre R. Ms. LD 2,597 43.2
Wilson I. Con 1,852 30.8
Anderson S. Green 831 13.8
Sawyer A. Ms. Lab 734 12.2
Turnout 69.9 12.4
Seaford Blatchington (7514)
vote share
Freeman J.* LD 2,450 48.8
Peterson J. Con 1,579 31.5
Renson H. Ms. Lab 493 9.8
McGilligan N. Ms. Green 256 5.1
Sheppard L. Ms. Ind 240 4.8
Turnout 66.8 17.4
Seaford Sutton (7415)
vote share
Murphy M.* Con 2,331 44.2
Taylor R. LD 2,209 41.9
Hopper T. Lab 471 8.9
Murray R. Green 260 4.9
Turnout 71.1 2.3
Battle & Crowhurst (7008)
vote share
Field K. Ms.* LD 2,358 48.8
Carroll R. Con 1,855 38.4
Macpherson T. Lab 619 12.8
Turnout 68.9 10.4
Bexhill East (7256)
vote share
Forster M. LD 2,160 50.7
Kenward M. Con 2,100 49.3
Turnout 58.7 1.4
Bexhill King Offa (17452) 2
vote share
Dyason R.* Con 4,398 39.2
Gubby G. Con 3,435 -
Francis N. LD 3,427 30.6
Wood J. LD 3,419 -
Bridger K.* Lab 3,386 30.2
Turnout 63.8 8.7
Hastings
Lewes
East S
ussex
Rother
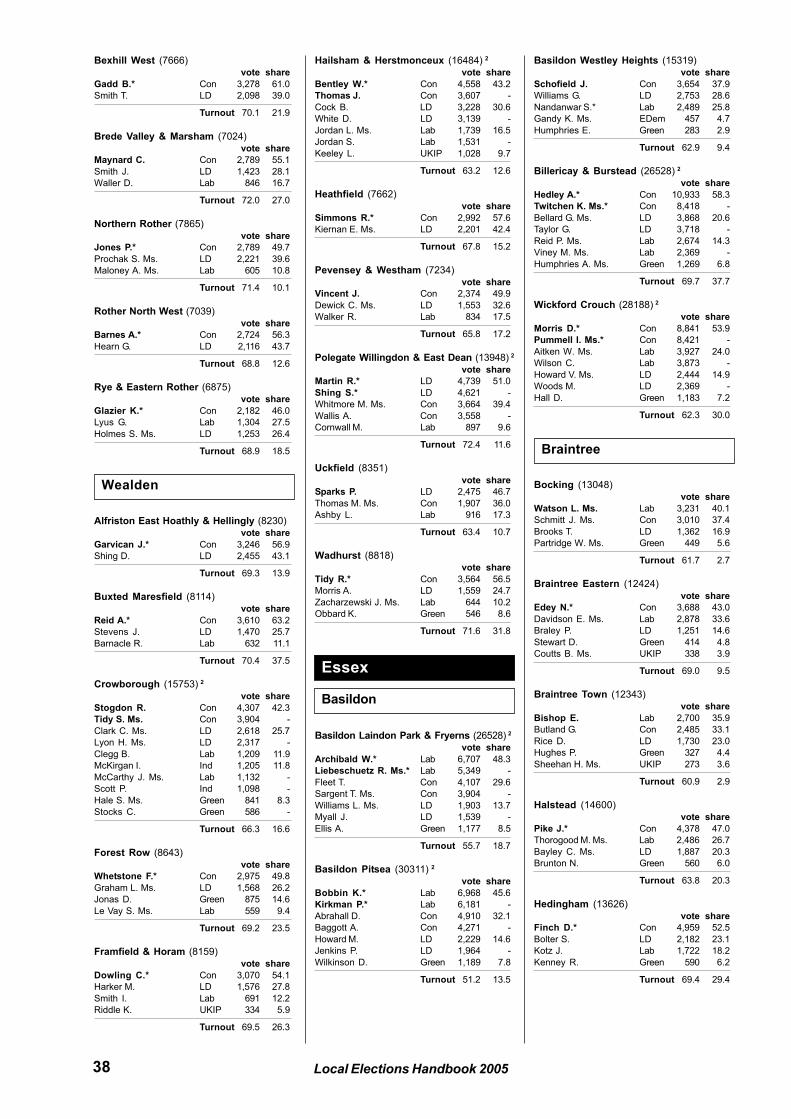
38 Local Elections Handbook 2005
Bexhill West (7666)
vote share
Gadd B.* Con 3,278 61.0
Smith T. LD 2,098 39.0
Turnout 70.1 21.9
Brede Valley & Marsham (7024)
vote share
Maynard C. Con 2,789 55.1
Smith J. LD 1,423 28.1
Waller D. Lab 846 16.7
Turnout 72.0 27.0
Northern Rother (7865)
vote share
Jones P.* Con 2,789 49.7
Prochak S. Ms. LD 2,221 39.6
Maloney A. Ms. Lab 605 10.8
Turnout 71.4 10.1
Rother North West (7039)
vote share
Barnes A.* Con 2,724 56.3
Hearn G. LD 2,116 43.7
Turnout 68.8 12.6
Rye & Eastern Rother (6875)
vote share
Glazier K.* Con 2,182 46.0
Lyus G. Lab 1,304 27.5
Holmes S. Ms. LD 1,253 26.4
Turnout 68.9 18.5
Alfriston East Hoathly & Hellingly (8230)
vote share
Garvican J.* Con 3,246 56.9
Shing D. LD 2,455 43.1
Turnout 69.3 13.9
Buxted Maresfield (8114)
vote share
Reid A.* Con 3,610 63.2
Stevens J. LD 1,470 25.7
Barnacle R. Lab 632 11.1
Turnout 70.4 37.5
Crowborough (15753) 2
vote share
Stogdon R. Con 4,307 42.3
Tidy S. Ms. Con 3,904 -
Clark C. Ms. LD 2,618 25.7
Lyon H. Ms. LD 2,317 -
Clegg B. Lab 1,209 11.9
McKirgan I. Ind 1,205 11.8
McCarthy J. Ms. Lab 1,132 -
Scott P. Ind 1,098 -
Hale S. Ms. Green 841 8.3
Stocks C. Green 586 -
Turnout 66.3 16.6
Forest Row (8643)
vote share
Whetstone F.* Con 2,975 49.8
Graham L. Ms. LD 1,568 26.2
Jonas D. Green 875 14.6
Le Vay S. Ms. Lab 559 9.4
Turnout 69.2 23.5
Framfield & Horam (8159)
vote share
Dowling C.* Con 3,070 54.1
Harker M. LD 1,576 27.8
Smith I. Lab 691 12.2
Riddle K. UKIP 334 5.9
Turnout 69.5 26.3
Hailsham & Herstmonceux (16484) 2
vote share
Bentley W.* Con 4,558 43.2
Thomas J. Con 3,607 -
Cock B. LD 3,228 30.6
White D. LD 3,139 -
Jordan L. Ms. Lab 1,739 16.5
Jordan S. Lab 1,531 -
Keeley L. UKIP 1,028 9.7
Turnout 63.2 12.6
Heathfield (7662)
vote share
Simmons R.* Con 2,992 57.6
Kiernan E. Ms. LD 2,201 42.4
Turnout 67.8 15.2
Pevensey & Westham (7234)
vote share
Vincent J. Con 2,374 49.9
Dewick C. Ms. LD 1,553 32.6
Walker R. Lab 834 17.5
Turnout 65.8 17.2
Polegate Willingdon & East Dean (13948) 2
vote share
Martin R.* LD 4,739 51.0
Shing S.* LD 4,621 -
Whitmore M. Ms. Con 3,664 39.4
Wallis A. Con 3,558 -
Cornwall M. Lab 897 9.6
Turnout 72.4 11.6
Uckfield (8351)
vote share
Sparks P. LD 2,475 46.7
Thomas M. Ms. Con 1,907 36.0
Ashby L. Lab 916 17.3
Turnout 63.4 10.7
Wadhurst (8818)
vote share
Tidy R.* Con 3,564 56.5
Morris A. LD 1,559 24.7
Zacharzewski J. Ms. Lab 644 10.2
Obbard K. Green 546 8.6
Turnout 71.6 31.8
Basildon Laindon Park & Fryerns (26528) 2
vote share
Archibald W.* Lab 6,707 48.3
Liebeschuetz R. Ms.* Lab 5,349 -
Fleet T. Con 4,107 29.6
Sargent T. Ms. Con 3,904 -
Williams L. Ms. LD 1,903 13.7
Myall J. LD 1,539 -
Ellis A. Green 1,177 8.5
Turnout 55.7 18.7
Basildon Pitsea (30311) 2
vote share
Bobbin K.* Lab 6,968 45.6
Kirkman P.* Lab 6,181 -
Abrahall D. Con 4,910 32.1
Baggott A. Con 4,271 -
Howard M. LD 2,229 14.6
Jenkins P. LD 1,964 -
Wilkinson D. Green 1,189 7.8
Turnout 51.2 13.5
Basildon Westley Heights (15319)
vote share
Schofield J. Con 3,654 37.9
Williams G. LD 2,753 28.6
Nandanwar S.* Lab 2,489 25.8
Gandy K. Ms. EDem 457 4.7
Humphries E. Green 283 2.9
Turnout 62.9 9.4
Billericay & Burstead (26528) 2
vote share
Hedley A.* Con 10,933 58.3
Twitchen K. Ms.* Con 8,418 -
Bellard G. Ms. LD 3,868 20.6
Taylor G. LD 3,718 -
Reid P. Ms. Lab 2,674 14.3
Viney M. Ms. Lab 2,369 -
Humphries A. Ms. Green 1,269 6.8
Turnout 69.7 37.7
Wickford Crouch (28188) 2
vote share
Morris D.* Con 8,841 53.9
Pummell I. Ms.* Con 8,421 -
Aitken W. Ms. Lab 3,927 24.0
Wilson C. Lab 3,873 -
Howard V. Ms. LD 2,444 14.9
Woods M. LD 2,369 -
Hall D. Green 1,183 7.2
Turnout 62.3 30.0
Bocking (13048)
vote share
Watson L. Ms. Lab 3,231 40.1
Schmitt J. Ms. Con 3,010 37.4
Brooks T. LD 1,362 16.9
Partridge W. Ms. Green 449 5.6
Turnout 61.7 2.7
Braintree Eastern (12424)
vote share
Edey N.* Con 3,688 43.0
Davidson E. Ms. Lab 2,878 33.6
Braley P. LD 1,251 14.6
Stewart D. Green 414 4.8
Coutts B. Ms. UKIP 338 3.9
Turnout 69.0 9.5
Braintree Town (12343)
vote share
Bishop E. Lab 2,700 35.9
Butland G. Con 2,485 33.1
Rice D. LD 1,730 23.0
Hughes P. Green 327 4.4
Sheehan H. Ms. UKIP 273 3.6
Turnout 60.9 2.9
Halstead (14600)
vote share
Pike J.* Con 4,378 47.0
Thorogood M. Ms. Lab 2,486 26.7
Bayley C. Ms. LD 1,887 20.3
Brunton N. Green 560 6.0
Turnout 63.8 20.3
Hedingham (13626)
vote share
Finch D.* Con 4,959 52.5
Bolter S. LD 2,182 23.1
Kotz J. Lab 1,722 18.2
Kenney R. Green 590 6.2
Turnout 69.4 29.4
Wealden
Essex
Basildon
Braintree
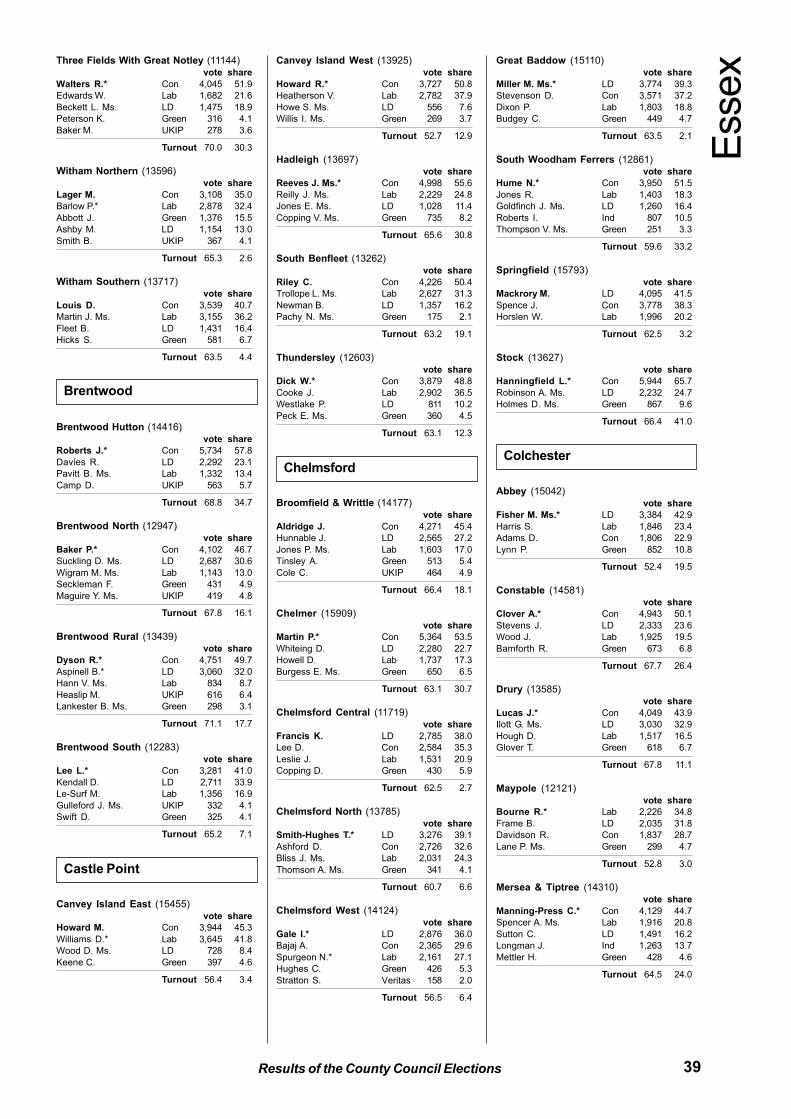
39Results of the County Council Elections
Three Fields With Great Notley (11144)
vote share
Walters R.* Con 4,045 51.9
Edwards W. Lab 1,682 21.6
Beckett L. Ms. LD 1,475 18.9
Peterson K. Green 316 4.1
Baker M. UKIP 278 3.6
Turnout 70.0 30.3
Witham Northern (13596)
vote share
Lager M. Con 3,108 35.0
Barlow P.* Lab 2,878 32.4
Abbott J. Green 1,376 15.5
Ashby M. LD 1,154 13.0
Smith B. UKIP 367 4.1
Turnout 65.3 2.6
Witham Southern (13717)
vote share
Louis D. Con 3,539 40.7
Martin J. Ms. Lab 3,155 36.2
Fleet B. LD 1,431 16.4
Hicks S. Green 581 6.7
Turnout 63.5 4.4
Brentwood Hutton (14416)
vote share
Roberts J.* Con 5,734 57.8
Davies R. LD 2,292 23.1
Pavitt B. Ms. Lab 1,332 13.4
Camp D. UKIP 563 5.7
Turnout 68.8 34.7
Brentwood North (12947)
vote share
Baker P.* Con 4,102 46.7
Suckling D. Ms. LD 2,687 30.6
Wigram M. Ms. Lab 1,143 13.0
Seckleman F. Green 431 4.9
Maguire Y. Ms. UKIP 419 4.8
Turnout 67.8 16.1
Brentwood Rural (13439)
vote share
Dyson R.* Con 4,751 49.7
Aspinell B.* LD 3,060 32.0
Hann V. Ms. Lab 834 8.7
Heaslip M. UKIP 616 6.4
Lankester B. Ms. Green 298 3.1
Turnout 71.1 17.7
Brentwood South (12283)
vote share
Lee L.* Con 3,281 41.0
Kendall D. LD 2,711 33.9
Le-Surf M. Lab 1,356 16.9
Gulleford J. Ms. UKIP 332 4.1
Swift D. Green 325 4.1
Turnout 65.2 7.1
Canvey Island East (15455)
vote share
Howard M. Con 3,944 45.3
Williams D.* Lab 3,645 41.8
Wood D. Ms. LD 728 8.4
Keene C. Green 397 4.6
Turnout 56.4 3.4
Canvey Island West (13925)
vote share
Howard R.* Con 3,727 50.8
Heatherson V. Lab 2,782 37.9
Howe S. Ms. LD 556 7.6
Willis I. Ms. Green 269 3.7
Turnout 52.7 12.9
Hadleigh (13697)
vote share
Reeves J. Ms.* Con 4,998 55.6
Reilly J. Ms. Lab 2,229 24.8
Jones E. Ms. LD 1,028 11.4
Copping V. Ms. Green 735 8.2
Turnout 65.6 30.8
South Benfleet (13262)
vote share
Riley C. Con 4,226 50.4
Trollope L. Ms. Lab 2,627 31.3
Newman B. LD 1,357 16.2
Pachy N. Ms. Green 175 2.1
Turnout 63.2 19.1
Thundersley (12603)
vote share
Dick W.* Con 3,879 48.8
Cooke J. Lab 2,902 36.5
Westlake P. LD 811 10.2
Peck E. Ms. Green 360 4.5
Turnout 63.1 12.3
Broomfield & Writtle (14177)
vote share
Aldridge J. Con 4,271 45.4
Hunnable J. LD 2,565 27.2
Jones P. Ms. Lab 1,603 17.0
Tinsley A. Green 513 5.4
Cole C. UKIP 464 4.9
Turnout 66.4 18.1
Chelmer (15909)
vote share
Martin P.* Con 5,364 53.5
Whiteing D. LD 2,280 22.7
Howell D. Lab 1,737 17.3
Burgess E. Ms. Green 650 6.5
Turnout 63.1 30.7
Chelmsford Central (11719)
vote share
Francis K. LD 2,785 38.0
Lee D. Con 2,584 35.3
Leslie J. Lab 1,531 20.9
Copping D. Green 430 5.9
Turnout 62.5 2.7
Chelmsford North (13785)
vote share
Smith-Hughes T.* LD 3,276 39.1
Ashford D. Con 2,726 32.6
Bliss J. Ms. Lab 2,031 24.3
Thomson A. Ms. Green 341 4.1
Turnout 60.7 6.6
Chelmsford West (14124)
vote share
Gale I.* LD 2,876 36.0
Bajaj A. Con 2,365 29.6
Spurgeon N.* Lab 2,161 27.1
Hughes C. Green 426 5.3
Stratton S. Veritas 158 2.0
Turnout 56.5 6.4
Great Baddow (15110)
vote share
Miller M. Ms.* LD 3,774 39.3
Stevenson D. Con 3,571 37.2
Dixon P. Lab 1,803 18.8
Budgey C. Green 449 4.7
Turnout 63.5 2.1
South Woodham Ferrers (12861)
vote share
Hume N.* Con 3,950 51.5
Jones R. Lab 1,403 18.3
Goldfinch J. Ms. LD 1,260 16.4
Roberts I. Ind 807 10.5
Thompson V. Ms. Green 251 3.3
Turnout 59.6 33.2
Springfield (15793)
vote share
Mackrory M. LD 4,095 41.5
Spence J. Con 3,778 38.3
Horslen W. Lab 1,996 20.2
Turnout 62.5 3.2
Stock (13627)
vote share
Hanningfield L.* Con 5,944 65.7
Robinson A. Ms. LD 2,232 24.7
Holmes D. Ms. Green 867 9.6
Turnout 66.4 41.0
Abbey (15042)
vote share
Fisher M. Ms.* LD 3,384 42.9
Harris S. Lab 1,846 23.4
Adams D. Con 1,806 22.9
Lynn P. Green 852 10.8
Turnout 52.4 19.5
Constable (14581)
vote share
Clover A.* Con 4,943 50.1
Stevens J. LD 2,333 23.6
Wood J. Lab 1,925 19.5
Bamforth R. Green 673 6.8
Turnout 67.7 26.4
Drury (13585)
vote share
Lucas J.* Con 4,049 43.9
Ilott G. Ms. LD 3,030 32.9
Hough D. Lab 1,517 16.5
Glover T. Green 618 6.7
Turnout 67.8 11.1
Maypole (12121)
vote share
Bourne R.* Lab 2,226 34.8
Frame B. LD 2,035 31.8
Davidson R. Con 1,837 28.7
Lane P. Ms. Green 299 4.7
Turnout 52.8 3.0
Mersea & Tiptree (14310)
vote share
Manning-Press C.* Con 4,129 44.7
Spencer A. Ms. Lab 1,916 20.8
Sutton C. LD 1,491 16.2
Longman J. Ind 1,263 13.7
Mettler H. Green 428 4.6
Turnout 64.5 24.0
Brentwood
Castle Point
Chelmsford
Essex
Colchester
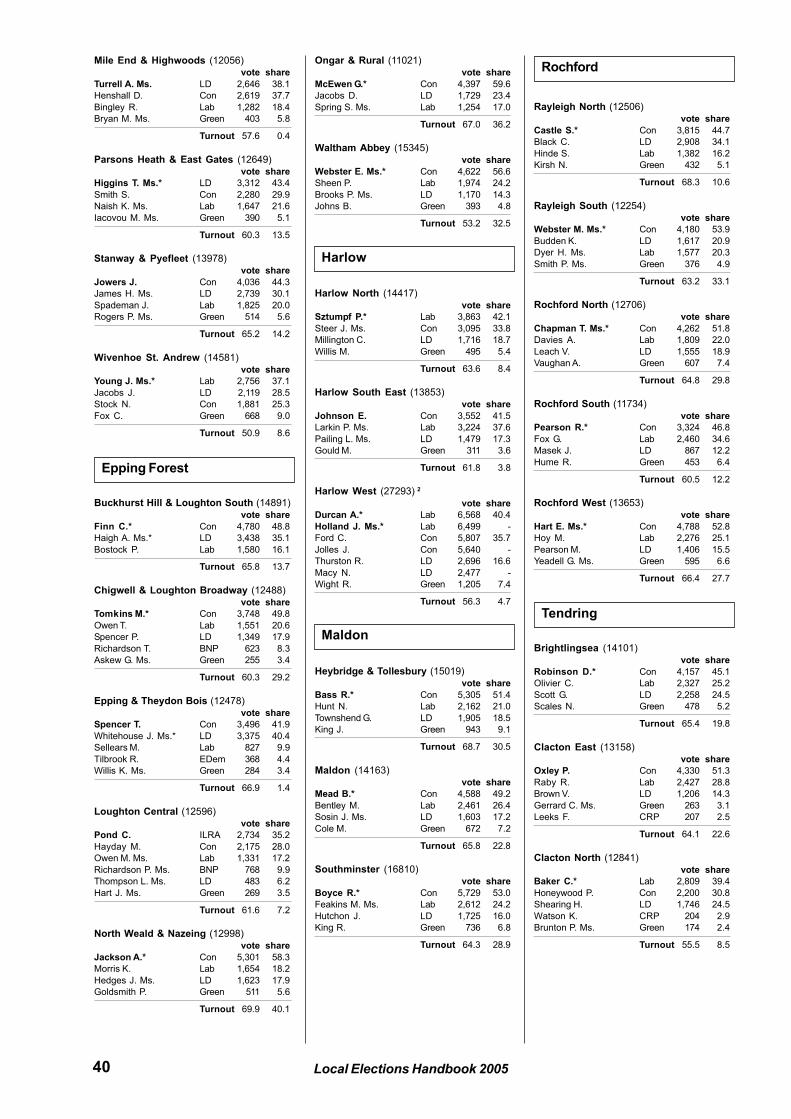
40 Local Elections Handbook 2005
Mile End & Highwoods (12056)
vote share
Turrell A. Ms. LD 2,646 38.1
Henshall D. Con 2,619 37.7
Bingley R. Lab 1,282 18.4
Bryan M. Ms. Green 403 5.8
Turnout 57.6 0.4
Parsons Heath & East Gates (12649)
vote share
Higgins T. Ms.* LD 3,312 43.4
Smith S. Con 2,280 29.9
Naish K. Ms. Lab 1,647 21.6
Iacovou M. Ms. Green 390 5.1
Turnout 60.3 13.5
Stanway & Pyefleet (13978)
vote share
Jowers J. Con 4,036 44.3
James H. Ms. LD 2,739 30.1
Spademan J. Lab 1,825 20.0
Rogers P. Ms. Green 514 5.6
Turnout 65.2 14.2
Wivenhoe St. Andrew (14581)
vote share
Young J. Ms.* Lab 2,756 37.1
Jacobs J. LD 2,119 28.5
Stock N. Con 1,881 25.3
Fox C. Green 668 9.0
Turnout 50.9 8.6
Buckhurst Hill & Loughton South (14891)
vote share
Finn C.* Con 4,780 48.8
Haigh A. Ms.* LD 3,438 35.1
Bostock P. Lab 1,580 16.1
Turnout 65.8 13.7
Chigwell & Loughton Broadway (12488)
vote share
Tomkins M.* Con 3,748 49.8
Owen T. Lab 1,551 20.6
Spencer P. LD 1,349 17.9
Richardson T. BNP 623 8.3
Askew G. Ms. Green 255 3.4
Turnout 60.3 29.2
Epping & Theydon Bois (12478)
vote share
Spencer T. Con 3,496 41.9
Whitehouse J. Ms.* LD 3,375 40.4
Sellears M. Lab 827 9.9
Tilbrook R. EDem 368 4.4
Willis K. Ms. Green 284 3.4
Turnout 66.9 1.4
Loughton Central (12596)
vote share
Pond C. ILRA 2,734 35.2
Hayday M. Con 2,175 28.0
Owen M. Ms. Lab 1,331 17.2
Richardson P. Ms. BNP 768 9.9
Thompson L. Ms. LD 483 6.2
Hart J. Ms. Green 269 3.5
Turnout 61.6 7.2
North Weald & Nazeing (12998)
vote share
Jackson A.* Con 5,301 58.3
Morris K. Lab 1,654 18.2
Hedges J. Ms. LD 1,623 17.9
Goldsmith P. Green 511 5.6
Turnout 69.9 40.1
Ongar & Rural (11021)
vote share
McEwen G.* Con 4,397 59.6
Jacobs D. LD 1,729 23.4
Spring S. Ms. Lab 1,254 17.0
Turnout 67.0 36.2
Waltham Abbey (15345)
vote share
Webster E. Ms.* Con 4,622 56.6
Sheen P. Lab 1,974 24.2
Brooks P. Ms. LD 1,170 14.3
Johns B. Green 393 4.8
Turnout 53.2 32.5
Harlow North (14417)
vote share
Sztumpf P.* Lab 3,863 42.1
Steer J. Ms. Con 3,095 33.8
Millington C. LD 1,716 18.7
Willis M. Green 495 5.4
Turnout 63.6 8.4
Harlow South East (13853)
vote share
Johnson E. Con 3,552 41.5
Larkin P. Ms. Lab 3,224 37.6
Pailing L. Ms. LD 1,479 17.3
Gould M. Green 311 3.6
Turnout 61.8 3.8
Harlow West (27293) 2
vote share
Durcan A.* Lab 6,568 40.4
Holland J. Ms.* Lab 6,499 -
Ford C. Con 5,807 35.7
Jolles J. Con 5,640 -
Thurston R. LD 2,696 16.6
Macy N. LD 2,477 -
Wight R. Green 1,205 7.4
Turnout 56.3 4.7
Heybridge & Tollesbury (15019)
vote share
Bass R.* Con 5,305 51.4
Hunt N. Lab 2,162 21.0
Townshend G. LD 1,905 18.5
King J. Green 943 9.1
Turnout 68.7 30.5
Maldon (14163)
vote share
Mead B.* Con 4,588 49.2
Bentley M. Lab 2,461 26.4
Sosin J. Ms. LD 1,603 17.2
Cole M. Green 672 7.2
Turnout 65.8 22.8
Southminster (16810)
vote share
Boyce R.* Con 5,729 53.0
Feakins M. Ms. Lab 2,612 24.2
Hutchon J. LD 1,725 16.0
King R. Green 736 6.8
Turnout 64.3 28.9
Rayleigh North (12506)
vote share
Castle S.* Con 3,815 44.7
Black C. LD 2,908 34.1
Hinde S. Lab 1,382 16.2
Kirsh N. Green 432 5.1
Turnout 68.3 10.6
Rayleigh South (12254)
vote share
Webster M. Ms.* Con 4,180 53.9
Budden K. LD 1,617 20.9
Dyer H. Ms. Lab 1,577 20.3
Smith P. Ms. Green 376 4.9
Turnout 63.2 33.1
Rochford North (12706)
vote share
Chapman T. Ms.* Con 4,262 51.8
Davies A. Lab 1,809 22.0
Leach V. LD 1,555 18.9
Vaughan A. Green 607 7.4
Turnout 64.8 29.8
Rochford South (11734)
vote share
Pearson R.* Con 3,324 46.8
Fox G. Lab 2,460 34.6
Masek J. LD 867 12.2
Hume R. Green 453 6.4
Turnout 60.5 12.2
Rochford West (13653)
vote share
Hart E. Ms.* Con 4,788 52.8
Hoy M. Lab 2,276 25.1
Pearson M. LD 1,406 15.5
Yeadell G. Ms. Green 595 6.6
Turnout 66.4 27.7
Brightlingsea (14101)
vote share
Robinson D.* Con 4,157 45.1
Olivier C. Lab 2,327 25.2
Scott G. LD 2,258 24.5
Scales N. Green 478 5.2
Turnout 65.4 19.8
Clacton East (13158)
vote share
Oxley P. Con 4,330 51.3
Raby R. Lab 2,427 28.8
Brown V. LD 1,206 14.3
Gerrard C. Ms. Green 263 3.1
Leeks F. CRP 207 2.5
Turnout 64.1 22.6
Clacton North (12841)
vote share
Baker C.* Lab 2,809 39.4
Honeywood P. Con 2,200 30.8
Shearing H. LD 1,746 24.5
Watson K. CRP 204 2.9
Brunton P. Ms. Green 174 2.4
Turnout 55.5 8.5
Epping Forest
Harlow
Maldon
Rochford
Tendring
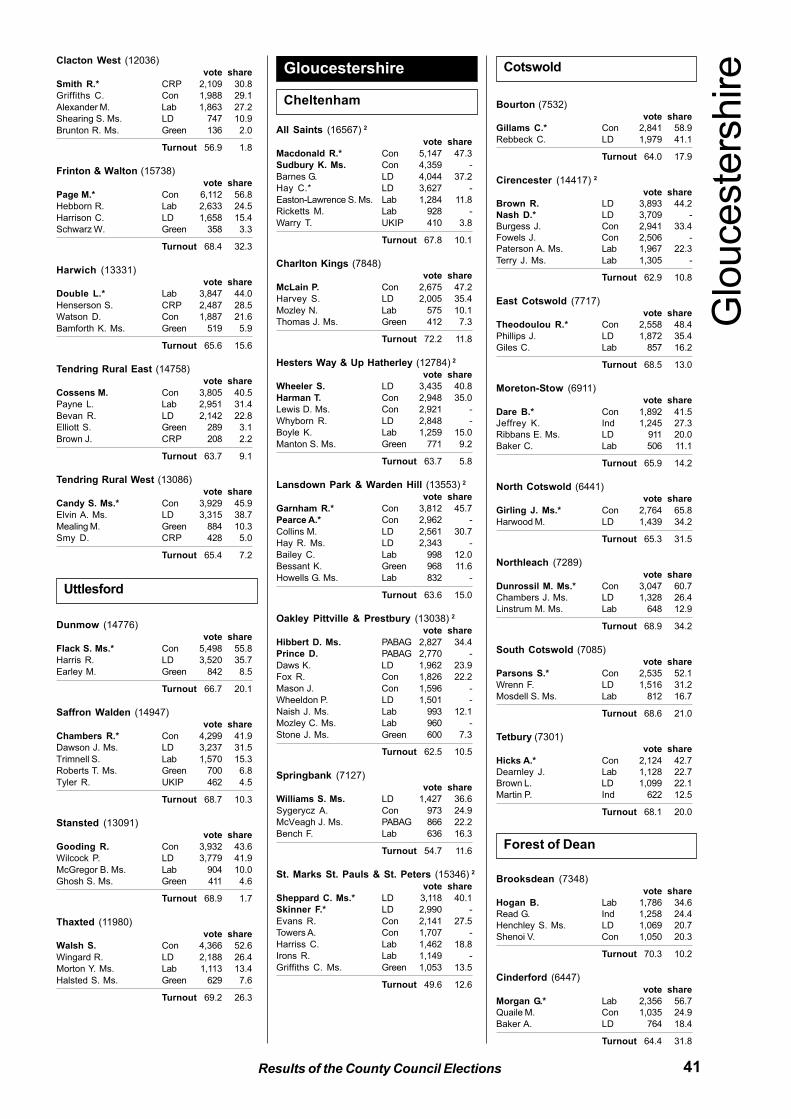
41Results of the County Council Elections
Clacton West (12036)
vote share
Smith R.* CRP 2,109 30.8
Griffiths C. Con 1,988 29.1
Alexander M. Lab 1,863 27.2
Shearing S. Ms. LD 747 10.9
Brunton R. Ms. Green 136 2.0
Turnout 56.9 1.8
Frinton & Walton (15738)
vote share
Page M.* Con 6,112 56.8
Hebborn R. Lab 2,633 24.5
Harrison C. LD 1,658 15.4
Schwarz W. Green 358 3.3
Turnout 68.4 32.3
Harwich (13331)
vote share
Double L.* Lab 3,847 44.0
Henserson S. CRP 2,487 28.5
Watson D. Con 1,887 21.6
Bamforth K. Ms. Green 519 5.9
Turnout 65.6 15.6
Tendring Rural East (14758)
vote share
Cossens M. Con 3,805 40.5
Payne L. Lab 2,951 31.4
Bevan R. LD 2,142 22.8
Elliott S. Green 289 3.1
Brown J. CRP 208 2.2
Turnout 63.7 9.1
Tendring Rural West (13086)
vote share
Candy S. Ms.* Con 3,929 45.9
Elvin A. Ms. LD 3,315 38.7
Mealing M. Green 884 10.3
Smy D. CRP 428 5.0
Turnout 65.4 7.2
Dunmow (14776)
vote share
Flack S. Ms.* Con 5,498 55.8
Harris R. LD 3,520 35.7
Earley M. Green 842 8.5
Turnout 66.7 20.1
Saffron Walden (14947)
vote share
Chambers R.* Con 4,299 41.9
Dawson J. Ms. LD 3,237 31.5
Trimnell S. Lab 1,570 15.3
Roberts T. Ms. Green 700 6.8
Tyler R. UKIP 462 4.5
Turnout 68.7 10.3
Stansted (13091)
vote share
Gooding R. Con 3,932 43.6
Wilcock P. LD 3,779 41.9
McGregor B. Ms. Lab 904 10.0
Ghosh S. Ms. Green 411 4.6
Turnout 68.9 1.7
Thaxted (11980)
vote share
Walsh S. Con 4,366 52.6
Wingard R. LD 2,188 26.4
Morton Y. Ms. Lab 1,113 13.4
Halsted S. Ms. Green 629 7.6
Turnout 69.2 26.3
All Saints (16567) 2
vote share
Macdonald R.* Con 5,147 47.3
Sudbury K. Ms. Con 4,359 -
Barnes G. LD 4,044 37.2
Hay C.* LD 3,627 -
Easton-Lawrence S. Ms. Lab 1,284 11.8
Ricketts M. Lab 928 -
Warry T. UKIP 410 3.8
Turnout 67.8 10.1
Charlton Kings (7848)
vote share
McLain P. Con 2,675 47.2
Harvey S. LD 2,005 35.4
Mozley N. Lab 575 10.1
Thomas J. Ms. Green 412 7.3
Turnout 72.2 11.8
Hesters Way & Up Hatherley (12784) 2
vote share
Wheeler S. LD 3,435 40.8
Harman T. Con 2,948 35.0
Lewis D. Ms. Con 2,921 -
Whyborn R. LD 2,848 -
Boyle K. Lab 1,259 15.0
Manton S. Ms. Green 771 9.2
Turnout 63.7 5.8
Lansdown Park & Warden Hill (13553) 2
vote share
Garnham R.* Con 3,812 45.7
Pearce A.* Con 2,962 -
Collins M. LD 2,561 30.7
Hay R. Ms. LD 2,343 -
Bailey C. Lab 998 12.0
Bessant K. Green 968 11.6
Howells G. Ms. Lab 832 -
Turnout 63.6 15.0
Oakley Pittville & Prestbury (13038) 2
vote share
Hibbert D. Ms. PABAG 2,827 34.4
Prince D. PABAG 2,770 -
Daws K. LD 1,962 23.9
Fox R. Con 1,826 22.2
Mason J. Con 1,596 -
Wheeldon P. LD 1,501 -
Naish J. Ms. Lab 993 12.1
Mozley C. Ms. Lab 960 -
Stone J. Ms. Green 600 7.3
Turnout 62.5 10.5
Springbank (7127)
vote share
Williams S. Ms. LD 1,427 36.6
Sygerycz A. Con 973 24.9
McVeagh J. Ms. PABAG 866 22.2
Bench F. Lab 636 16.3
Turnout 54.7 11.6
St. Marks St. Pauls & St. Peters (15346) 2
vote share
Sheppard C. Ms.* LD 3,118 40.1
Skinner F.* LD 2,990 -
Evans R. Con 2,141 27.5
Towers A. Con 1,707 -
Harriss C. Lab 1,462 18.8
Irons R. Lab 1,149 -
Griffiths C. Ms. Green 1,053 13.5
Turnout 49.6 12.6
Bourton (7532)
vote share
Gillams C.* Con 2,841 58.9
Rebbeck C. LD 1,979 41.1
Turnout 64.0 17.9
Cirencester (14417) 2
vote share
Brown R. LD 3,893 44.2
Nash D.* LD 3,709 -
Burgess J. Con 2,941 33.4
Fowels J. Con 2,506 -
Paterson A. Ms. Lab 1,967 22.3
Terry J. Ms. Lab 1,305 -
Turnout 62.9 10.8
East Cotswold (7717)
vote share
Theodoulou R.* Con 2,558 48.4
Phillips J. LD 1,872 35.4
Giles C. Lab 857 16.2
Turnout 68.5 13.0
Moreton-Stow (6911)
vote share
Dare B.* Con 1,892 41.5
Jeffrey K. Ind 1,245 27.3
Ribbans E. Ms. LD 911 20.0
Baker C. Lab 506 11.1
Turnout 65.9 14.2
North Cotswold (6441)
vote share
Girling J. Ms.* Con 2,764 65.8
Harwood M. LD 1,439 34.2
Turnout 65.3 31.5
Northleach (7289)
vote share
Dunrossil M. Ms.* Con 3,047 60.7
Chambers J. Ms. LD 1,328 26.4
Linstrum M. Ms. Lab 648 12.9
Turnout 68.9 34.2
South Cotswold (7085)
vote share
Parsons S.* Con 2,535 52.1
Wrenn F. LD 1,516 31.2
Mosdell S. Ms. Lab 812 16.7
Turnout 68.6 21.0
Tetbury (7301)
vote share
Hicks A.* Con 2,124 42.7
Dearnley J. Lab 1,128 22.7
Brown L. LD 1,099 22.1
Martin P. Ind 622 12.5
Turnout 68.1 20.0
Brooksdean (7348)
vote share
Hogan B. Lab 1,786 34.6
Read G. Ind 1,258 24.4
Henchley S. Ms. LD 1,069 20.7
Shenoi V. Con 1,050 20.3
Turnout 70.3 10.2
Cinderford (6447)
vote share
Morgan G.* Lab 2,356 56.7
Quaile M. Con 1,035 24.9
Baker A. LD 764 18.4
Turnout 64.4 31.8
Uttlesford
Gloucestershire
Cheltenham
Cotswold
Glo
uceste
rshire
Forest of Dean
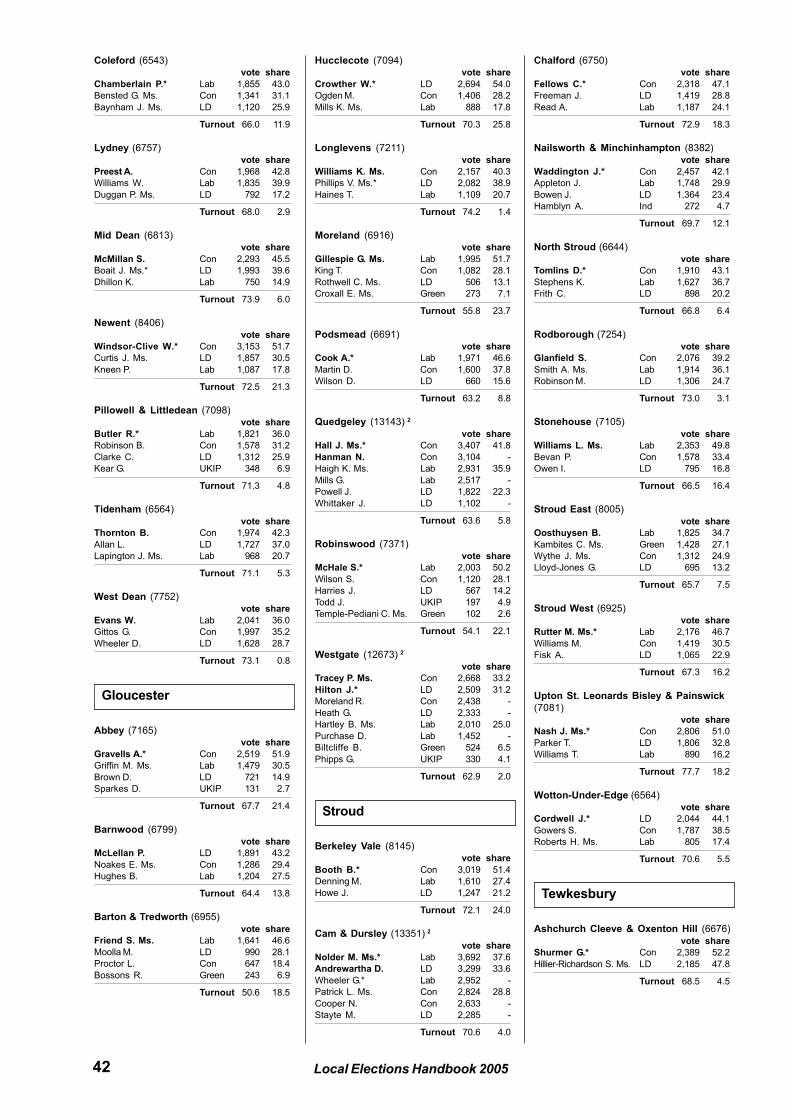
42 Local Elections Handbook 2005
Coleford (6543)
vote share
Chamberlain P.* Lab 1,855 43.0
Bensted G. Ms. Con 1,341 31.1
Baynham J. Ms. LD 1,120 25.9
Turnout 66.0 11.9
Lydney (6757)
vote share
Preest A. Con 1,968 42.8
Williams W. Lab 1,835 39.9
Duggan P. Ms. LD 792 17.2
Turnout 68.0 2.9
Mid Dean (6813)
vote share
McMillan S. Con 2,293 45.5
Boait J. Ms.* LD 1,993 39.6
Dhillon K. Lab 750 14.9
Turnout 73.9 6.0
Newent (8406)
vote share
Windsor-Clive W.* Con 3,153 51.7
Curtis J. Ms. LD 1,857 30.5
Kneen P. Lab 1,087 17.8
Turnout 72.5 21.3
Pillowell & Littledean (7098)
vote share
Butler R.* Lab 1,821 36.0
Robinson B. Con 1,578 31.2
Clarke C. LD 1,312 25.9
Kear G. UKIP 348 6.9
Turnout 71.3 4.8
Tidenham (6564)
vote share
Thornton B. Con 1,974 42.3
Allan L. LD 1,727 37.0
Lapington J. Ms. Lab 968 20.7
Turnout 71.1 5.3
West Dean (7752)
vote share
Evans W. Lab 2,041 36.0
Gittos G. Con 1,997 35.2
Wheeler D. LD 1,628 28.7
Turnout 73.1 0.8
Abbey (7165)
vote share
Gravells A.* Con 2,519 51.9
Griffin M. Ms. Lab 1,479 30.5
Brown D. LD 721 14.9
Sparkes D. UKIP 131 2.7
Turnout 67.7 21.4
Barnwood (6799)
vote share
McLellan P. LD 1,891 43.2
Noakes E. Ms. Con 1,286 29.4
Hughes B. Lab 1,204 27.5
Turnout 64.4 13.8
Barton & Tredworth (6955)
vote share
Friend S. Ms. Lab 1,641 46.6
Moolla M. LD 990 28.1
Proctor L. Con 647 18.4
Bossons R. Green 243 6.9
Turnout 50.6 18.5
Hucclecote (7094)
vote share
Crowther W.* LD 2,694 54.0
Ogden M. Con 1,406 28.2
Mills K. Ms. Lab 888 17.8
Turnout 70.3 25.8
Longlevens (7211)
vote share
Williams K. Ms. Con 2,157 40.3
Phillips V. Ms.* LD 2,082 38.9
Haines T. Lab 1,109 20.7
Turnout 74.2 1.4
Moreland (6916)
vote share
Gillespie G. Ms. Lab 1,995 51.7
King T. Con 1,082 28.1
Rothwell C. Ms. LD 506 13.1
Croxall E. Ms. Green 273 7.1
Turnout 55.8 23.7
Podsmead (6691)
vote share
Cook A.* Lab 1,971 46.6
Martin D. Con 1,600 37.8
Wilson D. LD 660 15.6
Turnout 63.2 8.8
Quedgeley (13143) 2
vote share
Hall J. Ms.* Con 3,407 41.8
Hanman N. Con 3,104 -
Haigh K. Ms. Lab 2,931 35.9
Mills G. Lab 2,517 -
Powell J. LD 1,822 22.3
Whittaker J. LD 1,102 -
Turnout 63.6 5.8
Robinswood (7371)
vote share
McHale S.* Lab 2,003 50.2
Wilson S. Con 1,120 28.1
Harries J. LD 567 14.2
Todd J. UKIP 197 4.9
Temple-Pediani C. Ms. Green 102 2.6
Turnout 54.1 22.1
Westgate (12673) 2
vote share
Tracey P. Ms. Con 2,668 33.2
Hilton J.* LD 2,509 31.2
Moreland R. Con 2,438 -
Heath G. LD 2,333 -
Hartley B. Ms. Lab 2,010 25.0
Purchase D. Lab 1,452 -
Biltcliffe B. Green 524 6.5
Phipps G. UKIP 330 4.1
Turnout 62.9 2.0
Berkeley Vale (8145)
vote share
Booth B.* Con 3,019 51.4
Denning M. Lab 1,610 27.4
Howe J. LD 1,247 21.2
Turnout 72.1 24.0
Cam & Dursley (13351) 2
vote share
Nolder M. Ms.* Lab 3,692 37.6
Andrewartha D. LD 3,299 33.6
Wheeler G.* Lab 2,952 -
Patrick L. Ms. Con 2,824 28.8
Cooper N. Con 2,633 -
Stayte M. LD 2,285 -
Turnout 70.6 4.0
Chalford (6750)
vote share
Fellows C.* Con 2,318 47.1
Freeman J. LD 1,419 28.8
Read A. Lab 1,187 24.1
Turnout 72.9 18.3
Nailsworth & Minchinhampton (8382)
vote share
Waddington J.* Con 2,457 42.1
Appleton J. Lab 1,748 29.9
Bowen J. LD 1,364 23.4
Hamblyn A. Ind 272 4.7
Turnout 69.7 12.1
North Stroud (6644)
vote share
Tomlins D.* Con 1,910 43.1
Stephens K. Lab 1,627 36.7
Frith C. LD 898 20.2
Turnout 66.8 6.4
Rodborough (7254)
vote share
Glanfield S. Con 2,076 39.2
Smith A. Ms. Lab 1,914 36.1
Robinson M. LD 1,306 24.7
Turnout 73.0 3.1
Stonehouse (7105)
vote share
Williams L. Ms. Lab 2,353 49.8
Bevan P. Con 1,578 33.4
Owen I. LD 795 16.8
Turnout 66.5 16.4
Stroud East (8005)
vote share
Oosthuysen B. Lab 1,825 34.7
Kambites C. Ms. Green 1,428 27.1
Wythe J. Ms. Con 1,312 24.9
Lloyd-Jones G. LD 695 13.2
Turnout 65.7 7.5
Stroud West (6925)
vote share
Rutter M. Ms.* Lab 2,176 46.7
Williams M. Con 1,419 30.5
Fisk A. LD 1,065 22.9
Turnout 67.3 16.2
Upton St. Leonards Bisley & Painswick
(7081)
vote share
Nash J. Ms.* Con 2,806 51.0
Parker T. LD 1,806 32.8
Williams T. Lab 890 16.2
Turnout 77.7 18.2
Wotton-Under-Edge (6564)
vote share
Cordwell J.* LD 2,044 44.1
Gowers S. Con 1,787 38.5
Roberts H. Ms. Lab 805 17.4
Turnout 70.6 5.5
Ashchurch Cleeve & Oxenton Hill (6676)
vote share
Shurmer G.* Con 2,389 52.2
Hillier-Richardson S. Ms. LD 2,185 47.8
Turnout 68.5 4.5
Gloucester
Stroud
Tewkesbury
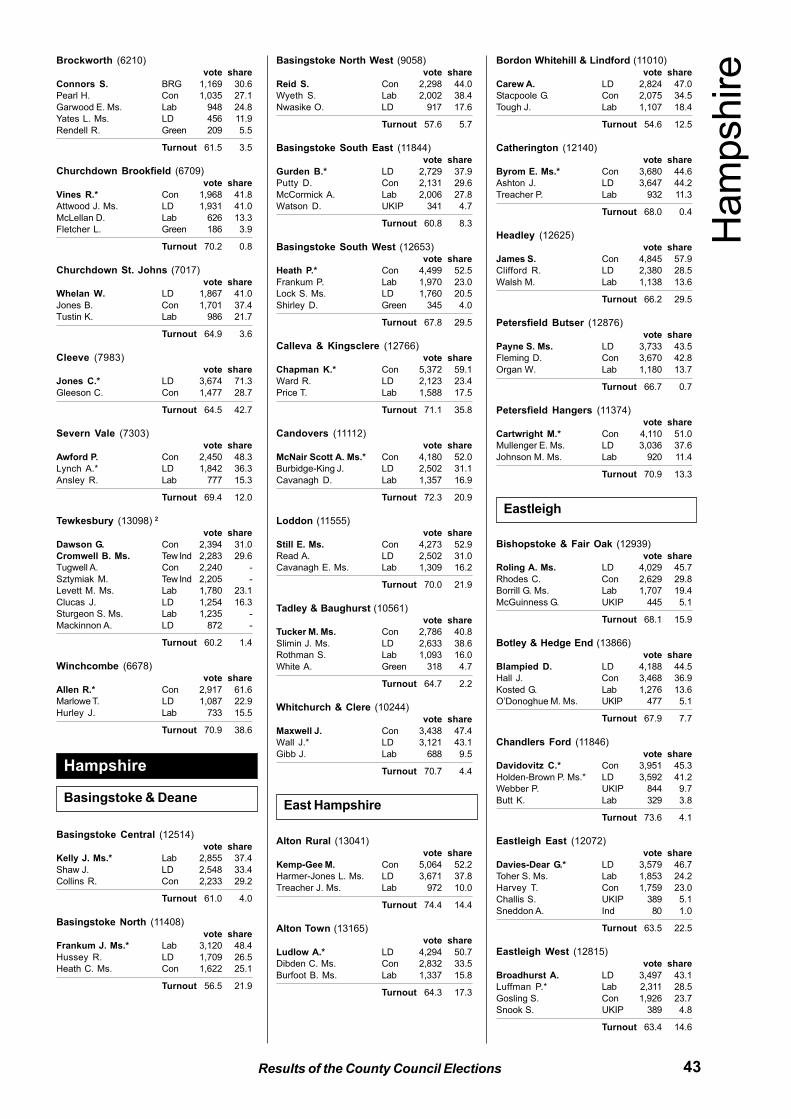
43Results of the County Council Elections
Brockworth (6210)
vote share
Connors S. BRG 1,169 30.6
Pearl H. Con 1,035 27.1
Garwood E. Ms. Lab 948 24.8
Yates L. Ms. LD 456 11.9
Rendell R. Green 209 5.5
Turnout 61.5 3.5
Churchdown Brookfield (6709)
vote share
Vines R.* Con 1,968 41.8
Attwood J. Ms. LD 1,931 41.0
McLellan D. Lab 626 13.3
Fletcher L. Green 186 3.9
Turnout 70.2 0.8
Churchdown St. Johns (7017)
vote share
Whelan W. LD 1,867 41.0
Jones B. Con 1,701 37.4
Tustin K. Lab 986 21.7
Turnout 64.9 3.6
Cleeve (7983)
vote share
Jones C.* LD 3,674 71.3
Gleeson C. Con 1,477 28.7
Turnout 64.5 42.7
Severn Vale (7303)
vote share
Awford P. Con 2,450 48.3
Lynch A.* LD 1,842 36.3
Ansley R. Lab 777 15.3
Turnout 69.4 12.0
Tewkesbury (13098) 2
vote share
Dawson G. Con 2,394 31.0
Cromwell B. Ms. Tew Ind 2,283 29.6
Tugwell A. Con 2,240 -
Sztymiak M. Tew Ind 2,205 -
Levett M. Ms. Lab 1,780 23.1
Clucas J. LD 1,254 16.3
Sturgeon S. Ms. Lab 1,235 -
Mackinnon A. LD 872 -
Turnout 60.2 1.4
Winchcombe (6678)
vote share
Allen R.* Con 2,917 61.6
Marlowe T. LD 1,087 22.9
Hurley J. Lab 733 15.5
Turnout 70.9 38.6
Basingstoke Central (12514)
vote share
Kelly J. Ms.* Lab 2,855 37.4
Shaw J. LD 2,548 33.4
Collins R. Con 2,233 29.2
Turnout 61.0 4.0
Basingstoke North (11408)
vote share
Frankum J. Ms.* Lab 3,120 48.4
Hussey R. LD 1,709 26.5
Heath C. Ms. Con 1,622 25.1
Turnout 56.5 21.9
Basingstoke North West (9058)
vote share
Reid S. Con 2,298 44.0
Wyeth S. Lab 2,002 38.4
Nwasike O. LD 917 17.6
Turnout 57.6 5.7
Basingstoke South East (11844)
vote share
Gurden B.* LD 2,729 37.9
Putty D. Con 2,131 29.6
McCormick A. Lab 2,006 27.8
Watson D. UKIP 341 4.7
Turnout 60.8 8.3
Basingstoke South West (12653)
vote share
Heath P.* Con 4,499 52.5
Frankum P. Lab 1,970 23.0
Lock S. Ms. LD 1,760 20.5
Shirley D. Green 345 4.0
Turnout 67.8 29.5
Calleva & Kingsclere (12766)
vote share
Chapman K.* Con 5,372 59.1
Ward R. LD 2,123 23.4
Price T. Lab 1,588 17.5
Turnout 71.1 35.8
Candovers (11112)
vote share
McNair Scott A. Ms.* Con 4,180 52.0
Burbidge-King J. LD 2,502 31.1
Cavanagh D. Lab 1,357 16.9
Turnout 72.3 20.9
Loddon (11555)
vote share
Still E. Ms. Con 4,273 52.9
Read A. LD 2,502 31.0
Cavanagh E. Ms. Lab 1,309 16.2
Turnout 70.0 21.9
Tadley & Baughurst (10561)
vote share
Tucker M. Ms. Con 2,786 40.8
Slimin J. Ms. LD 2,633 38.6
Rothman S. Lab 1,093 16.0
White A. Green 318 4.7
Turnout 64.7 2.2
Whitchurch & Clere (10244)
vote share
Maxwell J. Con 3,438 47.4
Wall J.* LD 3,121 43.1
Gibb J. Lab 688 9.5
Turnout 70.7 4.4
Alton Rural (13041)
vote share
Kemp-Gee M. Con 5,064 52.2
Harmer-Jones L. Ms. LD 3,671 37.8
Treacher J. Ms. Lab 972 10.0
Turnout 74.4 14.4
Alton Town (13165)
vote share
Ludlow A.* LD 4,294 50.7
Dibden C. Ms. Con 2,832 33.5
Burfoot B. Ms. Lab 1,337 15.8
Turnout 64.3 17.3
Bordon Whitehill & Lindford (11010)
vote share
Carew A. LD 2,824 47.0
Stacpoole G. Con 2,075 34.5
Tough J. Lab 1,107 18.4
Turnout 54.6 12.5
Catherington (12140)
vote share
Byrom E. Ms.* Con 3,680 44.6
Ashton J. LD 3,647 44.2
Treacher P. Lab 932 11.3
Turnout 68.0 0.4
Headley (12625)
vote share
James S. Con 4,845 57.9
Clifford R. LD 2,380 28.5
Walsh M. Lab 1,138 13.6
Turnout 66.2 29.5
Petersfield Butser (12876)
vote share
Payne S. Ms. LD 3,733 43.5
Fleming D. Con 3,670 42.8
Organ W. Lab 1,180 13.7
Turnout 66.7 0.7
Petersfield Hangers (11374)
vote share
Cartwright M.* Con 4,110 51.0
Mullenger E. Ms. LD 3,036 37.6
Johnson M. Ms. Lab 920 11.4
Turnout 70.9 13.3
Bishopstoke & Fair Oak (12939)
vote share
Roling A. Ms. LD 4,029 45.7
Rhodes C. Con 2,629 29.8
Borrill G. Ms. Lab 1,707 19.4
McGuinness G. UKIP 445 5.1
Turnout 68.1 15.9
Botley & Hedge End (13866)
vote share
Blampied D. LD 4,188 44.5
Hall J. Con 3,468 36.9
Kosted G. Lab 1,276 13.6
O’Donoghue M. Ms. UKIP 477 5.1
Turnout 67.9 7.7
Chandlers Ford (11846)
vote share
Davidovitz C.* Con 3,951 45.3
Holden-Brown P. Ms.* LD 3,592 41.2
Webber P. UKIP 844 9.7
Butt K. Lab 329 3.8
Turnout 73.6 4.1
Eastleigh East (12072)
vote share
Davies-Dear G.* LD 3,579 46.7
Toher S. Ms. Lab 1,853 24.2
Harvey T. Con 1,759 23.0
Challis S. UKIP 389 5.1
Sneddon A. Ind 80 1.0
Turnout 63.5 22.5
Eastleigh West (12815)
vote share
Broadhurst A. LD 3,497 43.1
Luffman P.* Lab 2,311 28.5
Gosling S. Con 1,926 23.7
Snook S. UKIP 389 4.8
Turnout 63.4 14.6
Hampshire
Basingstoke & DeaneEast Hampshire
Ham
pshire
Eastleigh
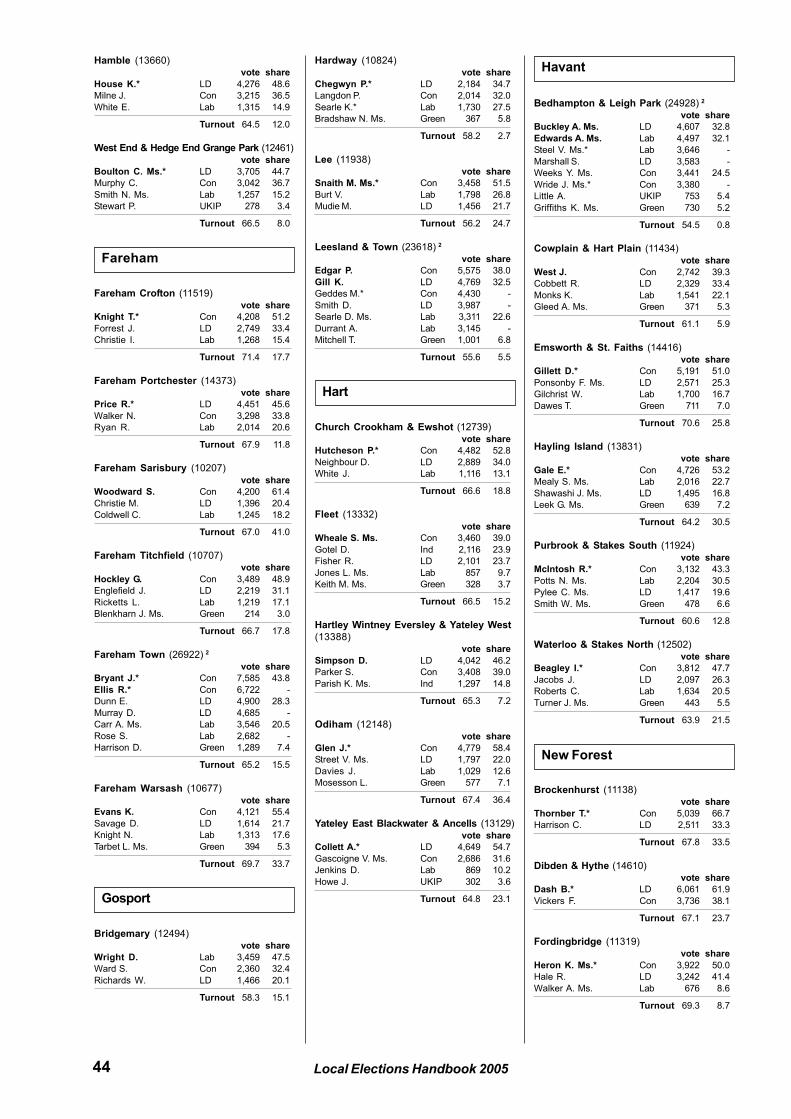
44 Local Elections Handbook 2005
Hamble (13660)
vote share
House K.* LD 4,276 48.6
Milne J. Con 3,215 36.5
White E. Lab 1,315 14.9
Turnout 64.5 12.0
West End & Hedge End Grange Park (12461)
vote share
Boulton C. Ms.* LD 3,705 44.7
Murphy C. Con 3,042 36.7
Smith N. Ms. Lab 1,257 15.2
Stewart P. UKIP 278 3.4
Turnout 66.5 8.0
Fareham Crofton (11519)
vote share
Knight T.* Con 4,208 51.2
Forrest J. LD 2,749 33.4
Christie I. Lab 1,268 15.4
Turnout 71.4 17.7
Fareham Portchester (14373)
vote share
Price R.* LD 4,451 45.6
Walker N. Con 3,298 33.8
Ryan R. Lab 2,014 20.6
Turnout 67.9 11.8
Fareham Sarisbury (10207)
vote share
Woodward S. Con 4,200 61.4
Christie M. LD 1,396 20.4
Coldwell C. Lab 1,245 18.2
Turnout 67.0 41.0
Fareham Titchfield (10707)
vote share
Hockley G. Con 3,489 48.9
Englefield J. LD 2,219 31.1
Ricketts L. Lab 1,219 17.1
Blenkharn J. Ms. Green 214 3.0
Turnout 66.7 17.8
Fareham Town (26922) 2
vote share
Bryant J.* Con 7,585 43.8
Ellis R.* Con 6,722 -
Dunn E. LD 4,900 28.3
Murray D. LD 4,685 -
Carr A. Ms. Lab 3,546 20.5
Rose S. Lab 2,682 -
Harrison D. Green 1,289 7.4
Turnout 65.2 15.5
Fareham Warsash (10677)
vote share
Evans K. Con 4,121 55.4
Savage D. LD 1,614 21.7
Knight N. Lab 1,313 17.6
Tarbet L. Ms. Green 394 5.3
Turnout 69.7 33.7
Bridgemary (12494)
vote share
Wright D. Lab 3,459 47.5
Ward S. Con 2,360 32.4
Richards W. LD 1,466 20.1
Turnout 58.3 15.1
Hardway (10824)
vote share
Chegwyn P.* LD 2,184 34.7
Langdon P. Con 2,014 32.0
Searle K.* Lab 1,730 27.5
Bradshaw N. Ms. Green 367 5.8
Turnout 58.2 2.7
Lee (11938)
vote share
Snaith M. Ms.* Con 3,458 51.5
Burt V. Lab 1,798 26.8
Mudie M. LD 1,456 21.7
Turnout 56.2 24.7
Leesland & Town (23618) 2
vote share
Edgar P. Con 5,575 38.0
Gill K. LD 4,769 32.5
Geddes M.* Con 4,430 -
Smith D. LD 3,987 -
Searle D. Ms. Lab 3,311 22.6
Durrant A. Lab 3,145 -
Mitchell T. Green 1,001 6.8
Turnout 55.6 5.5
Church Crookham & Ewshot (12739)
vote share
Hutcheson P.* Con 4,482 52.8
Neighbour D. LD 2,889 34.0
White J. Lab 1,116 13.1
Turnout 66.6 18.8
Fleet (13332)
vote share
Wheale S. Ms. Con 3,460 39.0
Gotel D. Ind 2,116 23.9
Fisher R. LD 2,101 23.7
Jones L. Ms. Lab 857 9.7
Keith M. Ms. Green 328 3.7
Turnout 66.5 15.2
Hartley Wintney Eversley & Yateley West
(13388)
vote share
Simpson D. LD 4,042 46.2
Parker S. Con 3,408 39.0
Parish K. Ms. Ind 1,297 14.8
Turnout 65.3 7.2
Odiham (12148)
vote share
Glen J.* Con 4,779 58.4
Street V. Ms. LD 1,797 22.0
Davies J. Lab 1,029 12.6
Mosesson L. Green 577 7.1
Turnout 67.4 36.4
Yateley East Blackwater & Ancells (13129)
vote share
Collett A.* LD 4,649 54.7
Gascoigne V. Ms. Con 2,686 31.6
Jenkins D. Lab 869 10.2
Howe J. UKIP 302 3.6
Turnout 64.8 23.1
Bedhampton & Leigh Park (24928) 2
vote share
Buckley A. Ms. LD 4,607 32.8
Edwards A. Ms. Lab 4,497 32.1
Steel V. Ms.* Lab 3,646 -
Marshall S. LD 3,583 -
Weeks Y. Ms. Con 3,441 24.5
Wride J. Ms.* Con 3,380 -
Little A. UKIP 753 5.4
Griffiths K. Ms. Green 730 5.2
Turnout 54.5 0.8
Cowplain & Hart Plain (11434)
vote share
West J. Con 2,742 39.3
Cobbett R. LD 2,329 33.4
Monks K. Lab 1,541 22.1
Gleed A. Ms. Green 371 5.3
Turnout 61.1 5.9
Emsworth & St. Faiths (14416)
vote share
Gillett D.* Con 5,191 51.0
Ponsonby F. Ms. LD 2,571 25.3
Gilchrist W. Lab 1,700 16.7
Dawes T. Green 711 7.0
Turnout 70.6 25.8
Hayling Island (13831)
vote share
Gale E.* Con 4,726 53.2
Mealy S. Ms. Lab 2,016 22.7
Shawashi J. Ms. LD 1,495 16.8
Leek G. Ms. Green 639 7.2
Turnout 64.2 30.5
Purbrook & Stakes South (11924)
vote share
McIntosh R.* Con 3,132 43.3
Potts N. Ms. Lab 2,204 30.5
Pylee C. Ms. LD 1,417 19.6
Smith W. Ms. Green 478 6.6
Turnout 60.6 12.8
Waterloo & Stakes North (12502)
vote share
Beagley I.* Con 3,812 47.7
Jacobs J. LD 2,097 26.3
Roberts C. Lab 1,634 20.5
Turner J. Ms. Green 443 5.5
Turnout 63.9 21.5
Brockenhurst (11138)
vote share
Thornber T.* Con 5,039 66.7
Harrison C. LD 2,511 33.3
Turnout 67.8 33.5
Dibden & Hythe (14610)
vote share
Dash B.* LD 6,061 61.9
Vickers F. Con 3,736 38.1
Turnout 67.1 23.7
Fordingbridge (11319)
vote share
Heron K. Ms.* Con 3,922 50.0
Hale R. LD 3,242 41.4
Walker A. Ms. Lab 676 8.6
Turnout 69.3 8.7
Fareham
Gosport
Hart
Havant
New Forest
45Results of the County Council Elections
Lymington (11754)
vote share
Evans A. Con 4,204 56.4
Humber M. Ms. LD 2,330 31.3
Short S. Lab 917 12.3
Turnout 63.4 25.2
Lyndhurst (12478)
vote share
Kendal M.* Con 4,931 56.7
Harris L. LD 2,701 31.1
Kershaw K. Lab 1,066 12.3
Turnout 69.7 25.6
Milford & Hordle (13219)
vote share
Rice A.* Con 5,349 62.8
Davies W. LD 3,170 37.2
Turnout 64.4 25.6
New Milton (13457)
vote share
Banks P. Ms.* Con 4,837 54.2
Newlands M. Ms. LD 2,001 22.4
Dance P. Lab 1,364 15.3
Field M. UKIP 725 8.1
Turnout 66.3 31.8
Ringwood (11537)
vote share
Clarke N. Con 3,725 51.5
Whitehead M. Ms. LD 2,052 28.4
Harper P. Lab 1,452 20.1
Turnout 62.7 23.1
South Waterside (12607)
vote share
Dunsdon L. LD 4,601 61.3
McEvoy A. Ms. Con 2,903 38.7
Turnout 59.5 22.6
Totton North (12688)
vote share
Weeks A. LD 3,210 41.0
Bright F.* Con 3,096 39.6
Sopowski P. Lab 1,522 19.4
Turnout 61.7 1.5
Totton South & Marchwood (13585)
vote share
Harrison D. LD 3,145 37.0
Belfitt S. Ms. Con 2,975 35.0
Goodfellow A. Lab 1,628 19.2
Randall E. Ms.* Ind 748 8.8
Turnout 62.5 2.0
Aldershot East (11658)
vote share
Neal E. Con 2,439 36.6
Roberts M.* Lab 2,276 34.2
Colpus I. LD 1,944 29.2
Turnout 57.1 2.4
Aldershot West (10554)
vote share
Kimber R.* Con 2,448 43.8
Thompson P. LD 1,445 25.9
Rust P. Lab 1,343 24.0
Fowler J. Ms. Green 351 6.3
Turnout 52.9 18.0
Farnborough North (11943)
vote share
Baulk R.* Con 2,465 36.9
Fraser-Fleming C. LD 2,222 33.3
Smith J. Ms. Lab 1,423 21.3
Weston J. Ind 570 8.5
Turnout 55.9 3.6
Farnborough South (12414)
vote share
Devereux P. Ms.* Con 4,067 50.6
Neal L. Ms. LD 2,668 33.2
Jones B. Lab 1,296 16.1
Turnout 64.7 17.4
Farnborough West (12555)
vote share
Leversha C. Ms. Con 3,390 41.5
Card C. LD 2,927 35.9
Grattan C. Lab 1,390 17.0
Cowd G. EDem 453 5.6
Turnout 65.0 5.7
Andover North (13209)
vote share
Hughes R. LD 2,732 38.4
Whitehouse K. Con 2,708 38.1
Mumford M. Lab 1,669 23.5
Turnout 53.8 0.3
Andover South (11601)
vote share
Kirk D.* Con 3,344 45.1
Bailey R. LD 1,899 25.6
Goddard P. Lab 1,528 20.6
Todd J. Green 638 8.6
Turnout 63.9 19.5
Andover West (12808)
vote share
West P. Ms.* Con 4,492 54.7
Wilson P. LD 2,045 24.9
Cotter A. Lab 1,672 20.4
Turnout 64.1 29.8
Baddesley (12409)
vote share
Dowden A.* LD 5,056 56.4
Oliver R. Con 3,138 35.0
Addison B. Ms. Lab 772 8.6
Turnout 72.3 21.4
Romsey Extra (11852)
vote share
Perry R. Con 4,431 53.3
Baverstock D. Ms. LD 3,014 36.2
Ford A. Ms. Lab 871 10.5
Turnout 70.2 17.0
Romsey Town (11770)
vote share
Cooper M. LD 4,052 48.7
Ray J. Con 3,582 43.1
Moran D. Lab 684 8.2
Turnout 70.7 5.7
Test Valley Central (14184)
vote share
Woodhall M.* Con 6,077 59.4
Anderson A. LD 3,118 30.5
Edwards A. Lab 1,037 10.1
Turnout 72.1 28.9
Bishops Waltham (12135)
vote share
Mason P.* LD 4,579 50.9
Ellerton P. Con 3,568 39.6
Haines S. Lab 857 9.5
Turnout 74.2 11.2
Itchen Valley (11983)
vote share
Porter J. Ms. LD 4,055 44.6
Lipscomb B. Con 3,999 44.0
Fullaway E. Ms. Lab 665 7.3
Craig E. Ms. Green 369 4.1
Turnout 75.8 0.6
Meon Valley (11051)
vote share
Hindson H. Ms.* Con 4,499 52.9
Day C. LD 3,349 39.4
Curran T. Lab 657 7.7
Turnout 77.0 13.5
Winchester Downlands (12289)
vote share
Bailey C. Ms. LD 4,593 49.0
Evershed S. Ms. Con 4,173 44.5
De Peyer P. Lab 614 6.5
Turnout 76.3 4.5
Winchester Eastgate (13404)
vote share
Peskett P. Ms.* LD 4,244 47.4
Drummond F. Ms. Con 3,110 34.7
Pines C. Lab 1,596 17.8
Turnout 66.8 12.7
Winchester Southern Parishes (11016)
vote share
Allgood F. Con 3,981 52.4
Nicholls S. LD 2,795 36.8
Hayward P. Ms. Lab 825 10.9
Turnout 69.0 15.6
Winchester Westgate (12855)
vote share
Dickens P. Ms.* LD 4,426 49.0
Tait I. Con 3,116 34.5
Davies P. Lab 1,496 16.6
Turnout 70.3 14.5
Cheshunt Central (10955)
vote share
Hewitt D. Con 3,338 53.2
Meadows J. Lab 1,640 26.1
Gould M. LD 731 11.6
McCole S. BNP 571 9.1
2001: Con Turnout 57.3 27.0
Flamstead End & Turnford (12228)
vote share
Mitchell A. Con 4,118 59.4
McCole R. Lab 1,685 24.3
Huse P. LD 799 11.5
Harris T. Green 327 4.7
2001: Con Turnout 56.7 35.1
Rushmoor
Test Valley
Winchester
Hert
ford
shire
Hertfordshire
Broxbourne
46 Local Elections Handbook 2005
Goffs Oak & Bury Green (10716)
vote share
Thomas R. Con 3,949 61.8
Robbins C. Ms. Lab 1,400 21.9
Winrow M. LD 736 11.5
Ager A. Ind 302 4.7
2001: Con Turnout 59.6 39.9
Hoddesdon North (10085)
vote share
Morton J.* Con 3,258 54.8
Marples A. Ms. Lab 1,629 27.4
Garton N. LD 741 12.5
Willis D. Ms. Green 322 5.4
2001: Con Turnout 59.0 27.4
Hoddesdon South (12122)
vote share
Searing A.* Con 4,590 64.1
Kousoulou M. Lab 1,315 18.4
De Rivaz R. Ms. LD 1,260 17.6
2001: Con Turnout 59.1 45.7
Waltham Cross (10093)
vote share
Price T. Con 2,317 42.5
Aitken M. Lab 2,020 37.0
Savage N. LD 662 12.1
Lankester R. BNP 454 8.3
2001: Con Turnout 54.0 5.4
Berkhamsted (13037)
vote share
Coleman K.* Con 3,807 41.5
Stevens G. LD 3,417 37.3
Jones R. Lab 1,336 14.6
Baker M. Ms. Green 613 6.7
2001: Con Turnout 70.4 4.3
Bridgewater (8434)
vote share
Lloyd D.* Con 3,409 56.4
Harris L. LD 1,243 20.6
Milnes B. Ms. Lab 1,065 17.6
Sandford P. Green 331 5.5
2001: Con Turnout 71.7 35.8
Hemel Hempstead East (9728)
vote share
Channell P.* Con 2,933 46.4
Hogg J. Ms. Lab 2,138 33.8
Daly S. Ms. LD 994 15.7
Johnson H. Ms. Green 257 4.1
2001: Con Turnout 65.0 12.6
Hemel Hempstead North East (9976)
vote share
Coxage M. Ms. Lab 2,277 40.1
Guest F. Ms.* Con 2,248 39.6
Blackman J. LD 893 15.7
Thoma C. Green 265 4.7
2001: Con Turnout 57.0 0.5
Hemel Hempstead North West (11378)
vote share
Laidlaw-Dickson I.* Lab 3,190 42.0
Wyatt-Lowe C. Ms. Con 2,692 35.4
Lawrence G. LD 1,100 14.5
Harris P. Green 375 4.9
Piears A. UKIP 247 3.2
2001: Lab Turnout 66.8 6.5
Hemel Hempstead South East (10739)
vote share
Cook G.* Lab 2,856 42.4
Douris T. Con 2,400 35.6
Fry S. Ms. LD 1,158 17.2
Henderson F. Green 322 4.8
2001: Lab Turnout 62.7 6.8
Hemel Hempstead St. Pauls (8906)
vote share
Singam E.* Lab 2,340 44.1
Minier K. Con 1,588 29.9
Link B. Ms. LD 1,128 21.2
Harris I. Green 256 4.8
2001: Lab Turnout 59.6 14.2
Hemel Hempstead Town (11214)
vote share
Holmes S. Con 2,904 39.1
Flint M. Ms. Lab 2,494 33.6
Murray L. Ms. LD 1,534 20.6
Johnson A. Green 499 6.7
2001: Con Turnout 66.3 5.5
Kings Langley (10154)
vote share
Roberts R. Con 3,777 52.5
Cox S. Lab 1,490 20.7
Batchelor B. LD 1,458 20.3
Humphrey M. Green 467 6.5
2001: Con Turnout 70.8 31.8
Tring (11861)
vote share
Hollinghurst N. LD 3,616 42.2
Mills S.* Con 3,577 41.8
Maloney M. Lab 877 10.2
Kruger C. Green 493 5.8
2001: Con Turnout 72.2 0.5
All Saints (9175)
vote share
Newton S. Ms. Con 2,962 46.3
Foster J. Lab 1,720 26.9
Wrangles B. Ms. LD 1,333 20.9
Tierney-Howitt N. Green 376 5.9
2001: Con Turnout 69.7 19.4
Bishops Stortford East (9125)
vote share
Engel B.* Con 2,591 41.9
Wood M. LD 2,399 38.8
Mitchell D. Ms. Lab 885 14.3
Evans B. Green 306 5.0
2001: Con Turnout 67.7 3.1
Bishops Stortford Rural (9984)
vote share
Bayes M. Ms.* Con 3,739 55.9
Macpherson A. LD 1,367 20.4
O’Reilly N. Ms. Lab 1,114 16.6
Leggett C. Green 473 7.1
2001: Con Turnout 67.0 35.4
Bishops Stortford West (10371)
vote share
Peek D.* Con 2,997 45.3
Francis G. LD 1,977 29.9
Battersby J. Lab 1,308 19.8
White G. Green 331 5.0
2001: Con Turnout 63.8 15.4
Braughing (9652)
vote share
Pitman J. Ms.* Con 3,704 55.0
Stone S. Lab 1,420 21.1
Moore P. LD 1,192 17.7
Chatterjee A. Green 423 6.3
2001: Con Turnout 69.8 33.9
Hertford Rural (9210)
vote share
Hammond B.* Con 4,071 60.0
Lloyd J. Lab 1,249 18.4
Ledden J. LD 1,015 14.9
Somerville L. Ms. Green 455 6.7
2001: Con Turnout 73.7 41.6
Sawbridgeworth (10266)
vote share
Dodd A.* Con 3,931 57.4
Harvey L. Ms. Lab 1,302 19.0
Davies D. LD 1,221 17.8
Tibbitts S. Green 396 5.8
2001: Con Turnout 66.7 38.4
St. Andrews (9369)
vote share
Ruffles P.* Con 3,140 51.1
Bodley A. Lab 1,623 26.4
Jones M. LD 945 15.4
Cheal B. Green 438 7.1
2001: Con Turnout 65.6 24.7
Ware North (9588)
vote share
Beatty D.* Con 2,904 45.8
Wing J. LD 1,874 29.6
Young A. Lab 1,215 19.2
Baker G. Green 342 5.4
2001: Con Turnout 66.1 16.3
Ware South (9605)
vote share
Tucker M. Con 3,245 51.9
Stapleton J. Lab 1,295 20.7
Gubb A. LD 1,232 19.7
Hart P. Green 479 7.7
2001: Con Turnout 65.1 31.2
Borehamwood North (10502)
vote share
Metcalf J.* Lab 2,516 44.2
Heywood M. Con 2,153 37.8
Silverman M. LD 774 13.6
Waller S. Ms. Green 248 4.4
2001: Lab Turnout 54.2 6.4
Borehamwood South (9698)
vote share
Heywood J. Ms. Con 2,400 43.0
York B.* Lab 2,329 41.7
Kakoulakis Z. LD 854 15.3
2001: Lab Turnout 57.6 1.3
Bushey North (8511)
vote share
Colne M.* LD 2,559 46.8
Slade J. Con 1,807 33.1
Bath G. Lab 876 16.0
Rackett A. Ms. Green 223 4.1
2001: LD Turnout 64.2 13.8
Dacorum
East Hertfordshire
Hertsmere
47Results of the County Council Elections
Bushey South (9665)
vote share
Quilty S.* Con 3,609 56.6
Kutchinsky R. LD 1,534 24.0
Bearfield D. Lab 965 15.1
Alvarado-Vega R. Green 272 4.3
2001: Con Turnout 66.0 32.5
Potters Bar East (11241)
vote share
Roach E. Con 4,130 57.5
Ramshaw R. Lab 1,600 22.3
Bonner P. LD 1,451 20.2
2001: Con Turnout 63.9 35.2
Potters Bar West & Shenley (8662)
vote share
Usher J.* Con 2,999 53.8
Fisher J. Lab 1,394 25.0
Dean C. LD 1,186 21.3
2001: Con Turnout 64.4 28.8
Watling (10546)
vote share
Saunders H.* Con 4,546 65.0
Bird D. LD 1,283 18.3
Kirk R. Lab 1,170 16.7
2001: Con Turnout 66.4 46.6
Hitchin North (10829)
vote share
Billing D.* Lab 2,840 40.5
Thake R. Con 2,204 31.4
Shirley D. LD 1,425 20.3
Pond S. Ms. Green 545 7.8
2001: Lab Turnout 64.8 9.1
Hitchin Rural (9074)
vote share
Brook N.* Con 2,825 49.0
Stears M. Lab 1,700 29.5
Ircha A. LD 878 15.2
Bland H. Green 359 6.2
2001: Con Turnout 63.5 19.5
Hitchin South (9572)
vote share
Ashley D.* Con 3,072 44.8
Clark P. LD 2,466 36.0
McCall D. Lab 980 14.3
Ware T. Green 338 4.9
2001: Con Turnout 71.6 8.8
Knebworth & Codicote (10963)
vote share
Ellis R.* Con 4,054 55.3
Wilkins D. Ms. LD 1,417 19.3
Jackson S. Ms. Lab 1,343 18.3
Ashton D. Green 512 7.0
2001: Con Turnout 66.8 36.0
Letchworth East & Baldock (11275)
vote share
Muir M. Con 2,781 40.9
Kercher L. Ms.* Lab 2,456 36.1
Hollands G. LD 1,230 18.1
Smith J. Green 338 5.0
2001: Lab Turnout 60.4 4.8
Letchworth North West (9316)
vote share
Agar N.* Lab 2,446 43.8
Paterson M. Con 1,781 31.9
Winder J. LD 1,065 19.1
Mollart-Griffin H. Ms. Green 293 5.2
2001: Lab Turnout 60.0 11.9
Letchworth South (11145)
vote share
Emsall K. Con 3,177 42.7
Winder J. LD 1,968 26.4
Mardell P. Lab 1,955 26.2
Flockhart D. Green 348 4.7
2001: Con Turnout 66.8 16.2
North Herts Rural (10140)
vote share
Hunter A. Con 3,226 44.4
Simpson I.* LD 2,890 39.8
Garland K. Lab 873 12.0
Madgin S. Green 270 3.7
2001: LD Turnout 71.6 4.6
Royston (12256)
vote share
Drake D.* Con 3,471 43.4
Coates C. Ms. LD 2,584 32.3
West V. Lab 1,572 19.6
Harmel K. Ms. Green 375 4.7
2001: Con Turnout 65.3 11.1
Harpenden North East (10083)
vote share
Lloyd D.* Con 3,366 46.6
Phillips J. LD 2,452 34.0
Ross R. Ms. Lab 990 13.7
Taylor-Roome D. Ms. Green 414 5.7
2001: Con Turnout 71.6 12.7
Harpenden South West (10386)
vote share
Tarry I. Ms.* Con 4,271 56.2
Canfield C. LD 1,952 25.7
Spiri L. Ms. Lab 908 11.9
Scheimann M. Green 469 6.2
2001: Con Turnout 73.2 30.5
Sandridge (8352)
vote share
Churchard G.* LD 2,359 39.8
Read B. Con 2,232 37.6
Baughan J. Lab 1,054 17.8
Harber E. Green 285 4.8
2001: LD Turnout 71.0 2.1
St. Albans Central (9482)
vote share
White C.* LD 2,833 42.6
Harvey D. Con 1,610 24.2
Byatt D. Lab 1,569 23.6
Grover S. Green 535 8.0
Tinson V. Ms. StAP 104 1.6
2001: LD Turnout 70.1 18.4
St. Albans East (9639)
vote share
Prowse R. LD 2,247 34.1
Hill E. Lab 2,044 31.1
Vessey J. Con 1,705 25.9
Paul R. Ms. Green 335 5.1
Saul E. Ms. StAP 250 3.8
2001: Lab Turnout 68.3 3.1
St. Albans North (9981)
vote share
Witherick A. LD 2,260 32.2
Bretherton R. Con 2,250 32.1
Allan D. Lab 1,993 28.4
Ewington M. Green 508 7.2
2001: Lab Turnout 70.2 0.1
St. Albans Rural (9062)
vote share
Hills D.* Con 2,778 42.6
Oxley C. LD 2,627 40.3
Viner A. Lab 720 11.1
Berrington W. Green 389 6.0
2001: Con Turnout 71.9 2.3
St. Albans South (9941)
vote share
Clarkson R. Con 2,529 36.3
Burton P. LD 2,486 35.7
Smith J. Ms. Lab 1,956 28.1
2001: Lab Turnout 70.1 0.6
St. Stephens (10061)
vote share
Lee A. Ms.* LD 3,195 44.2
Clarkson P. Ms. Con 2,803 38.8
Blackwell J. Ms. Lab 1,020 14.1
Tizzard K. Green 206 2.9
2001: LD Turnout 71.8 5.4
The Colneys (9850)
vote share
Lee B. Con 2,381 37.8
Sanderson R. Ms.* Lab 2,353 37.3
Biddle R. LD 1,334 21.2
Clough S. Green 237 3.8
2001: Lab Turnout 64.0 0.4
Bedwell (8849)
vote share
Kent T. Ms.* Lab 2,690 55.5
St Leitner L. Ms. Con 1,209 24.9
Griffith A. Ms. LD 949 19.6
2001: Lab Turnout 54.8 30.5
Broadwater (8693)
vote share
Batson S. Ms.* Lab 2,309 43.7
Hurst M. Con 1,608 30.4
Knight E. Ms. LD 1,074 20.3
Hoyes W. Green 292 5.5
2001: Lab Turnout 60.8 13.3
Chells (8788)
vote share
Parker R. LD 2,533 42.7
Tessier H. Lab 2,002 33.7
Dimelow G. Ms. Con 1,399 23.6
2001: Lab Turnout 67.5 8.9
Old Stevenage (10828)
vote share
Downing M.* Lab 2,707 41.2
Fraser J. Con 2,347 35.7
Moorcroft J. Ms. LD 1,122 17.1
Chapman B. Green 391 6.0
2001: Lab Turnout 60.6 5.5
Shephall (8899)
vote share
Royall D.* Lab 2,532 51.0
Dimelow R. Con 1,401 28.2
Baskerville N. LD 1,032 20.8
2001: Lab Turnout 55.8 22.8
St. Nicholas (10697)
vote share
Cullen D. Lab 2,681 44.6
Hanafin J. Ms. Con 1,860 30.9
Snell G. LD 1,474 24.5
2001: Lab Turnout 56.2 13.6
North Hertfordshire
Stevenage
Hert
ford
shire
St Albans
48 Local Elections Handbook 2005
Abbots Langley (12117)
vote share
Goggins P.* LD 4,511 54.2
Paddington T. Ms. Con 2,043 24.5
Mehta J. Ms. Lab 1,465 17.6
March M. Ms. Green 309 3.7
2001: LD Turnout 68.7 29.6
Chorleywood (9432)
vote share
Spencer L. Con 3,493 50.4
Trevett M. LD 2,603 37.6
Warburton D. Lab 547 7.9
Kamei T. Ms. Green 289 4.2
2001: LD Turnout 73.5 12.8
Croxley (9114)
vote share
Drury D. LD 3,043 46.8
Sansom D. Con 2,147 33.0
Tippen L. Lab 1,043 16.0
Dowdle J. Green 270 4.2
2001: LD Turnout 71.4 13.8
Oxhey Park (10266)
vote share
Clements R.* Con 3,473 49.2
Hames P. Ms. LD 2,309 32.7
Head A. Lab 1,006 14.2
Cohen J. Ms. Green 278 3.9
2001: Con Turnout 68.8 16.5
Rickmansworth (11950)
vote share
Lamb B. Ms.* Con 4,002 49.9
Struck R. LD 2,563 32.0
Dale G. Lab 1,101 13.7
West I. Green 353 4.4
2001: Con Turnout 67.1 17.9
South Oxhey (7490)
vote share
Hobday J. Ms.* Lab 1,849 46.7
Brading P. LD 1,007 25.5
Benatar D. Con 856 21.6
Edwards E. Ms. Green 244 6.2
2001: Lab Turnout 52.8 21.3
Callowland Leggatts (10220)
vote share
Rackett S. Green 1,820 29.2
O’Connell G. Lab 1,715 27.5
Chohan T. LD 1,535 24.6
O’Brien S. Con 1,170 18.8
2001: Lab Turnout 61.1 1.7
Central Oxhey (9968)
vote share
Giles-Medhurst S.* LD 2,751 45.4
Jones M. Lab 1,498 24.7
Bamford R. Con 1,430 23.6
Atkin R. Ms. Green 375 6.2
2001: LD Turnout 60.7 20.7
Meriden Tudor (9800)
vote share
Oaten A. Ms. LD 2,468 39.1
Chambers M. Ms. Lab 1,922 30.5
Southern R. Con 1,641 26.0
Byrne S. Ms. Green 275 4.4
2001: Lab Turnout 64.3 8.7
Nascot Park (10430)
vote share
Gordon R.* Con 3,017 41.4
Derbyshire G. LD 2,800 38.4
Meldrum T. Lab 1,128 15.5
Ivins S. Ms. Green 339 4.7
2001: Con Turnout 69.8 3.0
Vicarage Holywell (10500)
vote share
Bell N. Lab 2,478 42.4
Green M. Ms.* LD 2,116 36.2
Ealey D. Con 966 16.5
Mitchell P. Green 286 4.9
2001: Lab Turnout 55.7 6.2
Woodside Stanborough (10056)
vote share
Scudder D.* LD 2,975 47.1
Young J. Lab 1,711 27.1
Cordell J. Con 1,384 21.9
Pettifer K. Green 244 3.9
2001: LD Turnout 62.8 20.0
Haldens (9644)
vote share
Mays R.* Lab 2,652 40.7
Bennett D. Con 2,436 37.4
Arch J. LD 1,051 16.1
Pearce D. Ms. Green 373 5.7
2001: Lab Turnout 67.5 3.3
Handside & Peartree (9486)
vote share
Cowan M. LD 2,146 33.9
Hobday M.* Lab 2,113 33.4
Storer C. Con 2,067 32.7
2001: Lab Turnout 66.7 0.5
Hatfield North (12858)
vote share
Berry C. Ms. Con 3,121 38.5
Cook M. Ms. Lab 3,112 38.4
Meyland-Smith L. Ms. LD 1,434 17.7
Laverick G. Green 430 5.3
2001: Lab Turnout 63.0 0.1
Hatfield Rural (9160)
vote share
Storey W.* Con 4,783 71.6
Jones M. Lab 804 12.0
Blumsom J. Ms. LD 741 11.1
Wright G. Ms. Green 351 5.3
2001: Con Turnout 72.9 59.6
Hatfield South (9026)
vote share
Pile S. Con 2,418 42.2
Mendez L. Ms. Lab 2,159 37.7
Archer S. LD 934 16.3
Toole A. Green 215 3.8
2001: Lab Turnout 63.4 4.5
Welwyn (11370)
vote share
Smith R.* Con 4,607 53.8
Crump A. Lab 1,894 22.1
Skidmore I. LD 1,536 17.9
Somerville R. Green 524 6.1
2001: Con Turnout 75.3 31.7
Welwyn Garden City South (8844)
vote share
Jones S. Ms.* Lab 2,545 44.1
Pieri K. Con 2,020 35.0
Smith E. Ms. LD 885 15.3
Pressland K. Green 324 5.6
2001: Lab Turnout 65.3 9.1
Ashford Central (10585)
vote share
Tweed E. Ms. Con 2,835 42.6
Hubert M. Lab 2,242 33.7
Cowley R. LD 1,156 17.4
Sansom L. Ms. Green 265 4.0
Serretiello A. Ash Ind 164 2.5
Turnout 62.9 8.9
Ashford East (11102)
vote share
Koowaree S. LD 2,553 36.8
Heyes B. Con 2,182 31.5
Groves I. Lab 1,704 24.6
Dawe S. Green 257 3.7
Nelson D. Ms. Ash Ind 235 3.4
Turnout 62.4 5.4
Ashford Rural East (11382)
vote share
Findlay C.* Con 4,132 52.3
Dove S. LD 2,212 28.0
Harvey S. Ms. Green 954 12.1
Woodford J. Ash Ind 604 7.6
Turnout 69.4 24.3
Ashford Rural South (11111)
vote share
Angell M.* Con 3,384 47.5
Neighbour E. Ms. LD 1,875 26.3
Davison P. Ash Ind 1,868 26.2
Turnout 64.1 21.2
Ashford Rural West (13153)
vote share
King R.* Con 4,913 55.3
English G. LD 1,964 22.1
Watts J. Ms. Lab 1,457 16.4
Jones H. Ms. Green 558 6.3
Turnout 67.6 33.2
Ashford South (10857)
vote share
Smyth D.* Lab 2,476 41.5
Wedgbury J. Con 1,636 27.4
Packham R. LD 1,131 19.0
Elliff M. Ash Ind 430 7.2
Dawe H. Ms. Green 291 4.9
Turnout 54.9 14.1
Tenterden (11289)
vote share
Hill P.* Con 4,927 63.9
Wright B. LD 2,780 36.1
Turnout 68.3 27.9
Three Rivers
Watford
Welwyn Hatfield
Kent
Ashford
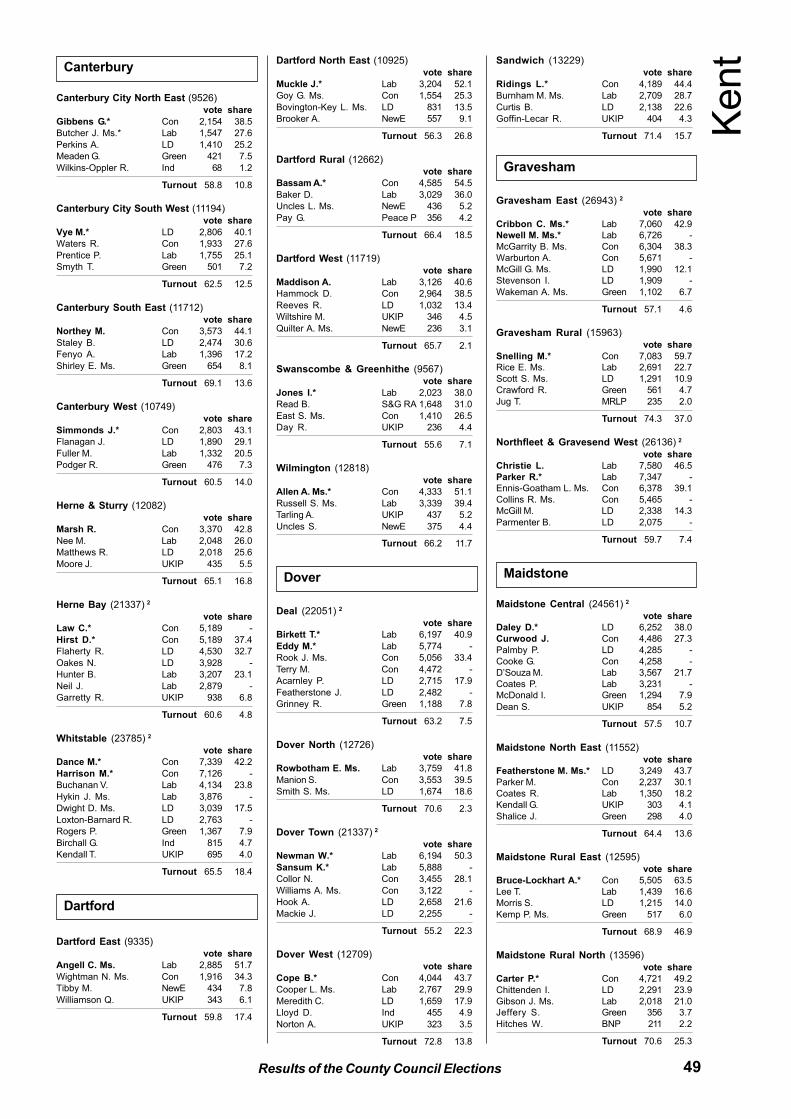
49Results of the County Council Elections
Canterbury City North East (9526)
vote share
Gibbens G.* Con 2,154 38.5
Butcher J. Ms.* Lab 1,547 27.6
Perkins A. LD 1,410 25.2
Meaden G. Green 421 7.5
Wilkins-Oppler R. Ind 68 1.2
Turnout 58.8 10.8
Canterbury City South West (11194)
vote share
Vye M.* LD 2,806 40.1
Waters R. Con 1,933 27.6
Prentice P. Lab 1,755 25.1
Smyth T. Green 501 7.2
Turnout 62.5 12.5
Canterbury South East (11712)
vote share
Northey M. Con 3,573 44.1
Staley B. LD 2,474 30.6
Fenyo A. Lab 1,396 17.2
Shirley E. Ms. Green 654 8.1
Turnout 69.1 13.6
Canterbury West (10749)
vote share
Simmonds J.* Con 2,803 43.1
Flanagan J. LD 1,890 29.1
Fuller M. Lab 1,332 20.5
Podger R. Green 476 7.3
Turnout 60.5 14.0
Herne & Sturry (12082)
vote share
Marsh R. Con 3,370 42.8
Nee M. Lab 2,048 26.0
Matthews R. LD 2,018 25.6
Moore J. UKIP 435 5.5
Turnout 65.1 16.8
Herne Bay (21337) 2
vote share
Law C.* Con 5,189 -
Hirst D.* Con 5,189 37.4
Flaherty R. LD 4,530 32.7
Oakes N. LD 3,928 -
Hunter B. Lab 3,207 23.1
Neil J. Lab 2,879 -
Garretty R. UKIP 938 6.8
Turnout 60.6 4.8
Whitstable (23785) 2
vote share
Dance M.* Con 7,339 42.2
Harrison M.* Con 7,126 -
Buchanan V. Lab 4,134 23.8
Hykin J. Ms. Lab 3,876 -
Dwight D. Ms. LD 3,039 17.5
Loxton-Barnard R. LD 2,763 -
Rogers P. Green 1,367 7.9
Birchall G. Ind 815 4.7
Kendall T. UKIP 695 4.0
Turnout 65.5 18.4
Dartford East (9335)
vote share
Angell C. Ms. Lab 2,885 51.7
Wightman N. Ms. Con 1,916 34.3
Tibby M. NewE 434 7.8
Williamson Q. UKIP 343 6.1
Turnout 59.8 17.4
Dartford North East (10925)
vote share
Muckle J.* Lab 3,204 52.1
Goy G. Ms. Con 1,554 25.3
Bovington-Key L. Ms. LD 831 13.5
Brooker A. NewE 557 9.1
Turnout 56.3 26.8
Dartford Rural (12662)
vote share
Bassam A.* Con 4,585 54.5
Baker D. Lab 3,029 36.0
Uncles L. Ms. NewE 436 5.2
Pay G. Peace P 356 4.2
Turnout 66.4 18.5
Dartford West (11719)
vote share
Maddison A. Lab 3,126 40.6
Hammock D. Con 2,964 38.5
Reeves R. LD 1,032 13.4
Wiltshire M. UKIP 346 4.5
Quilter A. Ms. NewE 236 3.1
Turnout 65.7 2.1
Swanscombe & Greenhithe (9567)
vote share
Jones I.* Lab 2,023 38.0
Read B. S&G RA 1,648 31.0
East S. Ms. Con 1,410 26.5
Day R. UKIP 236 4.4
Turnout 55.6 7.1
Wilmington (12818)
vote share
Allen A. Ms.* Con 4,333 51.1
Russell S. Ms. Lab 3,339 39.4
Tarling A. UKIP 437 5.2
Uncles S. NewE 375 4.4
Turnout 66.2 11.7
Deal (22051) 2
vote share
Birkett T.* Lab 6,197 40.9
Eddy M.* Lab 5,774 -
Rook J. Ms. Con 5,056 33.4
Terry M. Con 4,472 -
Acarnley P. LD 2,715 17.9
Featherstone J. LD 2,482 -
Grinney R. Green 1,188 7.8
Turnout 63.2 7.5
Dover North (12726)
vote share
Rowbotham E. Ms. Lab 3,759 41.8
Manion S. Con 3,553 39.5
Smith S. Ms. LD 1,674 18.6
Turnout 70.6 2.3
Dover Town (21337) 2
vote share
Newman W.* Lab 6,194 50.3
Sansum K.* Lab 5,888 -
Collor N. Con 3,455 28.1
Williams A. Ms. Con 3,122 -
Hook A. LD 2,658 21.6
Mackie J. LD 2,255 -
Turnout 55.2 22.3
Dover West (12709)
vote share
Cope B.* Con 4,044 43.7
Cooper L. Ms. Lab 2,767 29.9
Meredith C. LD 1,659 17.9
Lloyd D. Ind 455 4.9
Norton A. UKIP 323 3.5
Turnout 72.8 13.8
Sandwich (13229)
vote share
Ridings L.* Con 4,189 44.4
Burnham M. Ms. Lab 2,709 28.7
Curtis B. LD 2,138 22.6
Goffin-Lecar R. UKIP 404 4.3
Turnout 71.4 15.7
Gravesham East (26943) 2
vote share
Cribbon C. Ms.* Lab 7,060 42.9
Newell M. Ms.* Lab 6,726 -
McGarrity B. Ms. Con 6,304 38.3
Warburton A. Con 5,671 -
McGill G. Ms. LD 1,990 12.1
Stevenson I. LD 1,909 -
Wakeman A. Ms. Green 1,102 6.7
Turnout 57.1 4.6
Gravesham Rural (15963)
vote share
Snelling M.* Con 7,083 59.7
Rice E. Ms. Lab 2,691 22.7
Scott S. Ms. LD 1,291 10.9
Crawford R. Green 561 4.7
Jug T. MRLP 235 2.0
Turnout 74.3 37.0
Northfleet & Gravesend West (26136) 2
vote share
Christie L. Lab 7,580 46.5
Parker R.* Lab 7,347 -
Ennis-Goatham L. Ms. Con 6,378 39.1
Collins R. Ms. Con 5,465 -
McGill M. LD 2,338 14.3
Parmenter B. LD 2,075 -
Turnout 59.7 7.4
Maidstone Central (24561) 2
vote share
Daley D.* LD 6,252 38.0
Curwood J. Con 4,486 27.3
Palmby P. LD 4,285 -
Cooke G. Con 4,258 -
D’Souza M. Lab 3,567 21.7
Coates P. Lab 3,231 -
McDonald I. Green 1,294 7.9
Dean S. UKIP 854 5.2
Turnout 57.5 10.7
Maidstone North East (11552)
vote share
Featherstone M. Ms.* LD 3,249 43.7
Parker M. Con 2,237 30.1
Coates R. Lab 1,350 18.2
Kendall G. UKIP 303 4.1
Shalice J. Green 298 4.0
Turnout 64.4 13.6
Maidstone Rural East (12595)
vote share
Bruce-Lockhart A.* Con 5,505 63.5
Lee T. Lab 1,439 16.6
Morris S. LD 1,215 14.0
Kemp P. Ms. Green 517 6.0
Turnout 68.9 46.9
Maidstone Rural North (13596)
vote share
Carter P.* Con 4,721 49.2
Chittenden I. LD 2,291 23.9
Gibson J. Ms. Lab 2,018 21.0
Jeffery S. Green 356 3.7
Hitches W. BNP 211 2.2
Turnout 70.6 25.3
Dartford
Dover
Gravesham
Kent
Maidstone
Canterbury
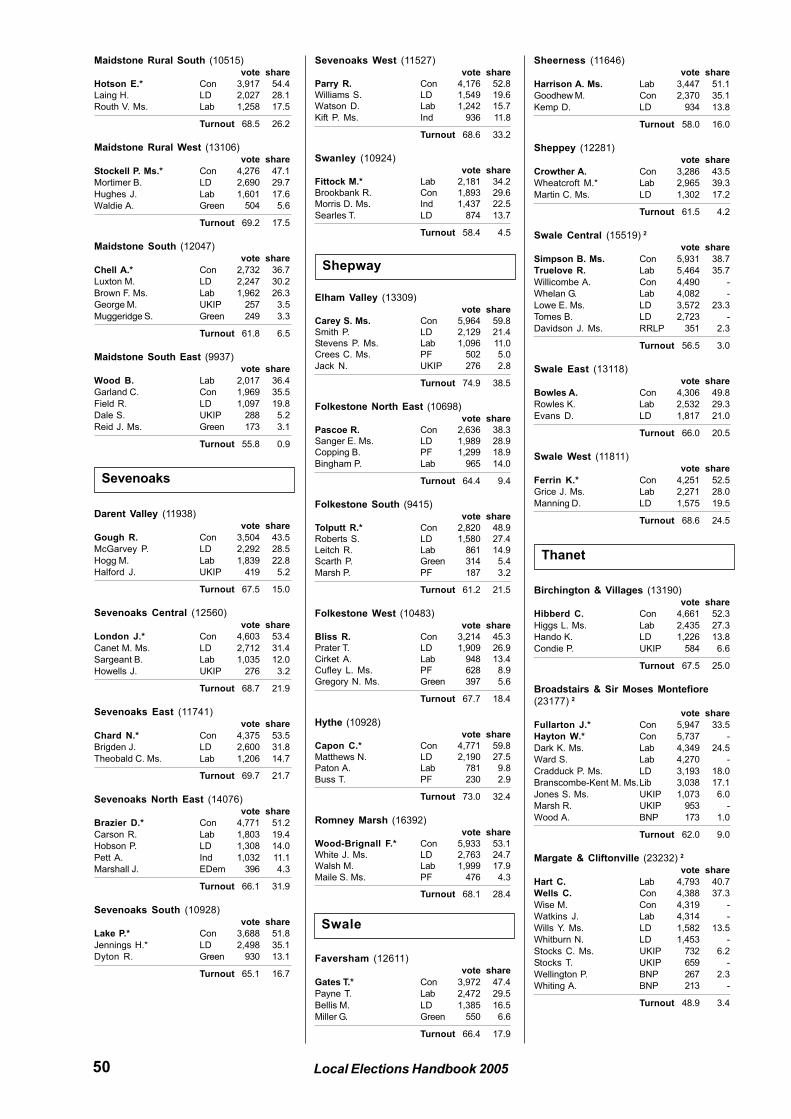
50 Local Elections Handbook 2005
Sevenoaks West (11527)
vote share
Parry R. Con 4,176 52.8
Williams S. LD 1,549 19.6
Watson D. Lab 1,242 15.7
Kift P. Ms. Ind 936 11.8
Turnout 68.6 33.2
Swanley (10924)
vote share
Fittock M.* Lab 2,181 34.2
Brookbank R. Con 1,893 29.6
Morris D. Ms. Ind 1,437 22.5
Searles T. LD 874 13.7
Turnout 58.4 4.5
Elham Valley (13309)
vote share
Carey S. Ms. Con 5,964 59.8
Smith P. LD 2,129 21.4
Stevens P. Ms. Lab 1,096 11.0
Crees C. Ms. PF 502 5.0
Jack N. UKIP 276 2.8
Turnout 74.9 38.5
Folkestone North East (10698)
vote share
Pascoe R. Con 2,636 38.3
Sanger E. Ms. LD 1,989 28.9
Copping B. PF 1,299 18.9
Bingham P. Lab 965 14.0
Turnout 64.4 9.4
Folkestone South (9415)
vote share
Tolputt R.* Con 2,820 48.9
Roberts S. LD 1,580 27.4
Leitch R. Lab 861 14.9
Scarth P. Green 314 5.4
Marsh P. PF 187 3.2
Turnout 61.2 21.5
Folkestone West (10483)
vote share
Bliss R. Con 3,214 45.3
Prater T. LD 1,909 26.9
Cirket A. Lab 948 13.4
Cufley L. Ms. PF 628 8.9
Gregory N. Ms. Green 397 5.6
Turnout 67.7 18.4
Hythe (10928)
vote share
Capon C.* Con 4,771 59.8
Matthews N. LD 2,190 27.5
Paton A. Lab 781 9.8
Buss T. PF 230 2.9
Turnout 73.0 32.4
Romney Marsh (16392)
vote share
Wood-Brignall F.* Con 5,933 53.1
White J. Ms. LD 2,763 24.7
Walsh M. Lab 1,999 17.9
Maile S. Ms. PF 476 4.3
Turnout 68.1 28.4
Faversham (12611)
vote share
Gates T.* Con 3,972 47.4
Payne T. Lab 2,472 29.5
Bellis M. LD 1,385 16.5
Miller G. Green 550 6.6
Turnout 66.4 17.9
Maidstone Rural South (10515)
vote share
Hotson E.* Con 3,917 54.4
Laing H. LD 2,027 28.1
Routh V. Ms. Lab 1,258 17.5
Turnout 68.5 26.2
Maidstone Rural West (13106)
vote share
Stockell P. Ms.* Con 4,276 47.1
Mortimer B. LD 2,690 29.7
Hughes J. Lab 1,601 17.6
Waldie A. Green 504 5.6
Turnout 69.2 17.5
Maidstone South (12047)
vote share
Chell A.* Con 2,732 36.7
Luxton M. LD 2,247 30.2
Brown F. Ms. Lab 1,962 26.3
George M. UKIP 257 3.5
Muggeridge S. Green 249 3.3
Turnout 61.8 6.5
Maidstone South East (9937)
vote share
Wood B. Lab 2,017 36.4
Garland C. Con 1,969 35.5
Field R. LD 1,097 19.8
Dale S. UKIP 288 5.2
Reid J. Ms. Green 173 3.1
Turnout 55.8 0.9
Darent Valley (11938)
vote share
Gough R. Con 3,504 43.5
McGarvey P. LD 2,292 28.5
Hogg M. Lab 1,839 22.8
Halford J. UKIP 419 5.2
Turnout 67.5 15.0
Sevenoaks Central (12560)
vote share
London J.* Con 4,603 53.4
Canet M. Ms. LD 2,712 31.4
Sargeant B. Lab 1,035 12.0
Howells J. UKIP 276 3.2
Turnout 68.7 21.9
Sevenoaks East (11741)
vote share
Chard N.* Con 4,375 53.5
Brigden J. LD 2,600 31.8
Theobald C. Ms. Lab 1,206 14.7
Turnout 69.7 21.7
Sevenoaks North East (14076)
vote share
Brazier D.* Con 4,771 51.2
Carson R. Lab 1,803 19.4
Hobson P. LD 1,308 14.0
Pett A. Ind 1,032 11.1
Marshall J. EDem 396 4.3
Turnout 66.1 31.9
Sevenoaks South (10928)
vote share
Lake P.* Con 3,688 51.8
Jennings H.* LD 2,498 35.1
Dyton R. Green 930 13.1
Turnout 65.1 16.7
Sheerness (11646)
vote share
Harrison A. Ms. Lab 3,447 51.1
Goodhew M. Con 2,370 35.1
Kemp D. LD 934 13.8
Turnout 58.0 16.0
Sheppey (12281)
vote share
Crowther A. Con 3,286 43.5
Wheatcroft M.* Lab 2,965 39.3
Martin C. Ms. LD 1,302 17.2
Turnout 61.5 4.2
Swale Central (15519) 2
vote share
Simpson B. Ms. Con 5,931 38.7
Truelove R. Lab 5,464 35.7
Willicombe A. Con 4,490 -
Whelan G. Lab 4,082 -
Lowe E. Ms. LD 3,572 23.3
Tomes B. LD 2,723 -
Davidson J. Ms. RRLP 351 2.3
Turnout 56.5 3.0
Swale East (13118)
vote share
Bowles A. Con 4,306 49.8
Rowles K. Lab 2,532 29.3
Evans D. LD 1,817 21.0
Turnout 66.0 20.5
Swale West (11811)
vote share
Ferrin K.* Con 4,251 52.5
Grice J. Ms. Lab 2,271 28.0
Manning D. LD 1,575 19.5
Turnout 68.6 24.5
Birchington & Villages (13190)
vote share
Hibberd C. Con 4,661 52.3
Higgs L. Ms. Lab 2,435 27.3
Hando K. LD 1,226 13.8
Condie P. UKIP 584 6.6
Turnout 67.5 25.0
Broadstairs & Sir Moses Montefiore
(23177) 2
vote share
Fullarton J.* Con 5,947 33.5
Hayton W.* Con 5,737 -
Dark K. Ms. Lab 4,349 24.5
Ward S. Lab 4,270 -
Cradduck P. Ms. LD 3,193 18.0
Branscombe-Kent M. Ms.Lib 3,038 17.1
Jones S. Ms. UKIP 1,073 6.0
Marsh R. UKIP 953 -
Wood A. BNP 173 1.0
Turnout 62.0 9.0
Margate & Cliftonville (23232) 2
vote share
Hart C. Lab 4,793 40.7
Wells C. Con 4,388 37.3
Wise M. Con 4,319 -
Watkins J. Lab 4,314 -
Wills Y. Ms. LD 1,582 13.5
Whitburn N. LD 1,453 -
Stocks C. Ms. UKIP 732 6.2
Stocks T. UKIP 659 -
Wellington P. BNP 267 2.3
Whiting A. BNP 213 -
Turnout 48.9 3.4
Sevenoaks
Shepway
Swale
Thanet
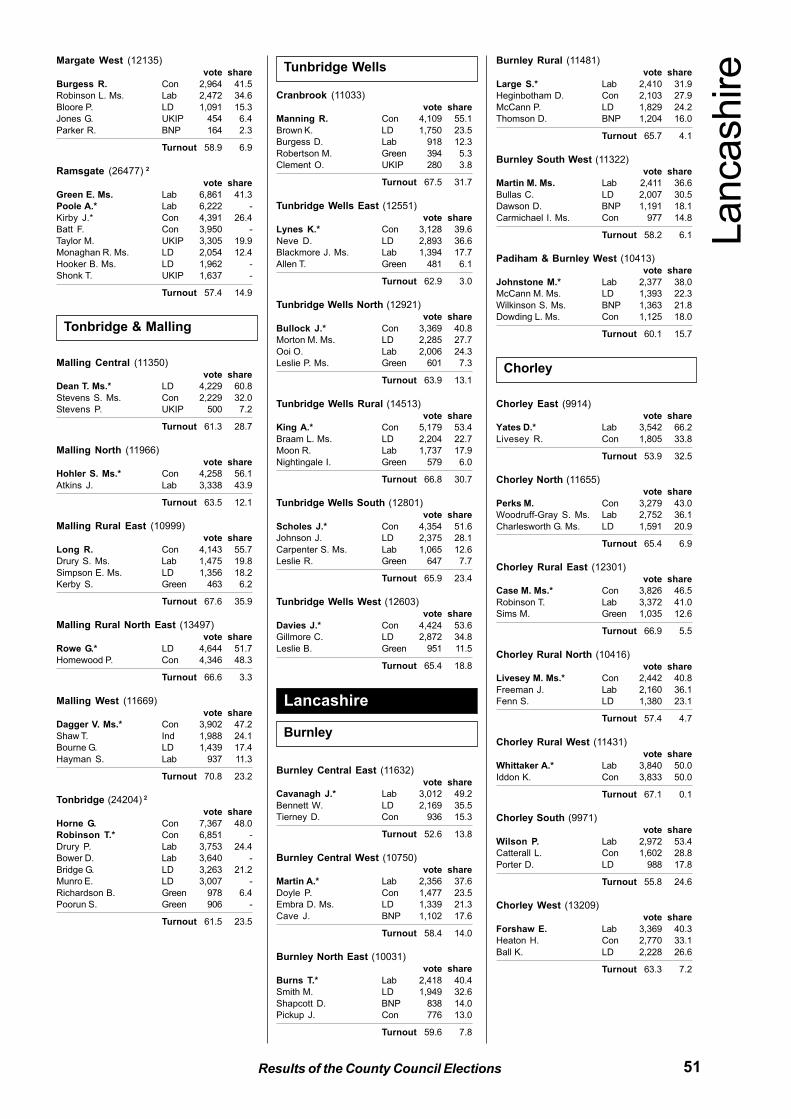
51Results of the County Council Elections
Margate West (12135)
vote share
Burgess R. Con 2,964 41.5
Robinson L. Ms. Lab 2,472 34.6
Bloore P. LD 1,091 15.3
Jones G. UKIP 454 6.4
Parker R. BNP 164 2.3
Turnout 58.9 6.9
Ramsgate (26477) 2
vote share
Green E. Ms. Lab 6,861 41.3
Poole A.* Lab 6,222 -
Kirby J.* Con 4,391 26.4
Batt F. Con 3,950 -
Taylor M. UKIP 3,305 19.9
Monaghan R. Ms. LD 2,054 12.4
Hooker B. Ms. LD 1,962 -
Shonk T. UKIP 1,637 -
Turnout 57.4 14.9
Malling Central (11350)
vote share
Dean T. Ms.* LD 4,229 60.8
Stevens S. Ms. Con 2,229 32.0
Stevens P. UKIP 500 7.2
Turnout 61.3 28.7
Malling North (11966)
vote share
Hohler S. Ms.* Con 4,258 56.1
Atkins J. Lab 3,338 43.9
Turnout 63.5 12.1
Malling Rural East (10999)
vote share
Long R. Con 4,143 55.7
Drury S. Ms. Lab 1,475 19.8
Simpson E. Ms. LD 1,356 18.2
Kerby S. Green 463 6.2
Turnout 67.6 35.9
Malling Rural North East (13497)
vote share
Rowe G.* LD 4,644 51.7
Homewood P. Con 4,346 48.3
Turnout 66.6 3.3
Malling West (11669)
vote share
Dagger V. Ms.* Con 3,902 47.2
Shaw T. Ind 1,988 24.1
Bourne G. LD 1,439 17.4
Hayman S. Lab 937 11.3
Turnout 70.8 23.2
Tonbridge (24204) 2
vote share
Horne G. Con 7,367 48.0
Robinson T.* Con 6,851 -
Drury P. Lab 3,753 24.4
Bower D. Lab 3,640 -
Bridge G. LD 3,263 21.2
Munro E. LD 3,007 -
Richardson B. Green 978 6.4
Poorun S. Green 906 -
Turnout 61.5 23.5
Cranbrook (11033)
vote share
Manning R. Con 4,109 55.1
Brown K. LD 1,750 23.5
Burgess D. Lab 918 12.3
Robertson M. Green 394 5.3
Clement O. UKIP 280 3.8
Turnout 67.5 31.7
Tunbridge Wells East (12551)
vote share
Lynes K.* Con 3,128 39.6
Neve D. LD 2,893 36.6
Blackmore J. Ms. Lab 1,394 17.7
Allen T. Green 481 6.1
Turnout 62.9 3.0
Tunbridge Wells North (12921)
vote share
Bullock J.* Con 3,369 40.8
Morton M. Ms. LD 2,285 27.7
Ooi O. Lab 2,006 24.3
Leslie P. Ms. Green 601 7.3
Turnout 63.9 13.1
Tunbridge Wells Rural (14513)
vote share
King A.* Con 5,179 53.4
Braam L. Ms. LD 2,204 22.7
Moon R. Lab 1,737 17.9
Nightingale I. Green 579 6.0
Turnout 66.8 30.7
Tunbridge Wells South (12801)
vote share
Scholes J.* Con 4,354 51.6
Johnson J. LD 2,375 28.1
Carpenter S. Ms. Lab 1,065 12.6
Leslie R. Green 647 7.7
Turnout 65.9 23.4
Tunbridge Wells West (12603)
vote share
Davies J.* Con 4,424 53.6
Gillmore C. LD 2,872 34.8
Leslie B. Green 951 11.5
Turnout 65.4 18.8
Burnley Central East (11632)
vote share
Cavanagh J.* Lab 3,012 49.2
Bennett W. LD 2,169 35.5
Tierney D. Con 936 15.3
Turnout 52.6 13.8
Burnley Central West (10750)
vote share
Martin A.* Lab 2,356 37.6
Doyle P. Con 1,477 23.5
Embra D. Ms. LD 1,339 21.3
Cave J. BNP 1,102 17.6
Turnout 58.4 14.0
Burnley North East (10031)
vote share
Burns T.* Lab 2,418 40.4
Smith M. LD 1,949 32.6
Shapcott D. BNP 838 14.0
Pickup J. Con 776 13.0
Turnout 59.6 7.8
Burnley Rural (11481)
vote share
Large S.* Lab 2,410 31.9
Heginbotham D. Con 2,103 27.9
McCann P. LD 1,829 24.2
Thomson D. BNP 1,204 16.0
Turnout 65.7 4.1
Burnley South West (11322)
vote share
Martin M. Ms. Lab 2,411 36.6
Bullas C. LD 2,007 30.5
Dawson D. BNP 1,191 18.1
Carmichael I. Ms. Con 977 14.8
Turnout 58.2 6.1
Padiham & Burnley West (10413)
vote share
Johnstone M.* Lab 2,377 38.0
McCann M. Ms. LD 1,393 22.3
Wilkinson S. Ms. BNP 1,363 21.8
Dowding L. Ms. Con 1,125 18.0
Turnout 60.1 15.7
Chorley East (9914)
vote share
Yates D.* Lab 3,542 66.2
Livesey R. Con 1,805 33.8
Turnout 53.9 32.5
Chorley North (11655)
vote share
Perks M. Con 3,279 43.0
Woodruff-Gray S. Ms. Lab 2,752 36.1
Charlesworth G. Ms. LD 1,591 20.9
Turnout 65.4 6.9
Chorley Rural East (12301)
vote share
Case M. Ms.* Con 3,826 46.5
Robinson T. Lab 3,372 41.0
Sims M. Green 1,035 12.6
Turnout 66.9 5.5
Chorley Rural North (10416)
vote share
Livesey M. Ms.* Con 2,442 40.8
Freeman J. Lab 2,160 36.1
Fenn S. LD 1,380 23.1
Turnout 57.4 4.7
Chorley Rural West (11431)
vote share
Whittaker A.* Lab 3,840 50.0
Iddon K. Con 3,833 50.0
Turnout 67.1 0.1
Chorley South (9971)
vote share
Wilson P. Lab 2,972 53.4
Catterall L. Con 1,602 28.8
Porter D. LD 988 17.8
Turnout 55.8 24.6
Chorley West (13209)
vote share
Forshaw E. Lab 3,369 40.3
Heaton H. Con 2,770 33.1
Ball K. LD 2,228 26.6
Turnout 63.3 7.2
Lancashire
Tonbridge & Malling
Lancashire
Burnley
Chorley
Tunbridge Wells
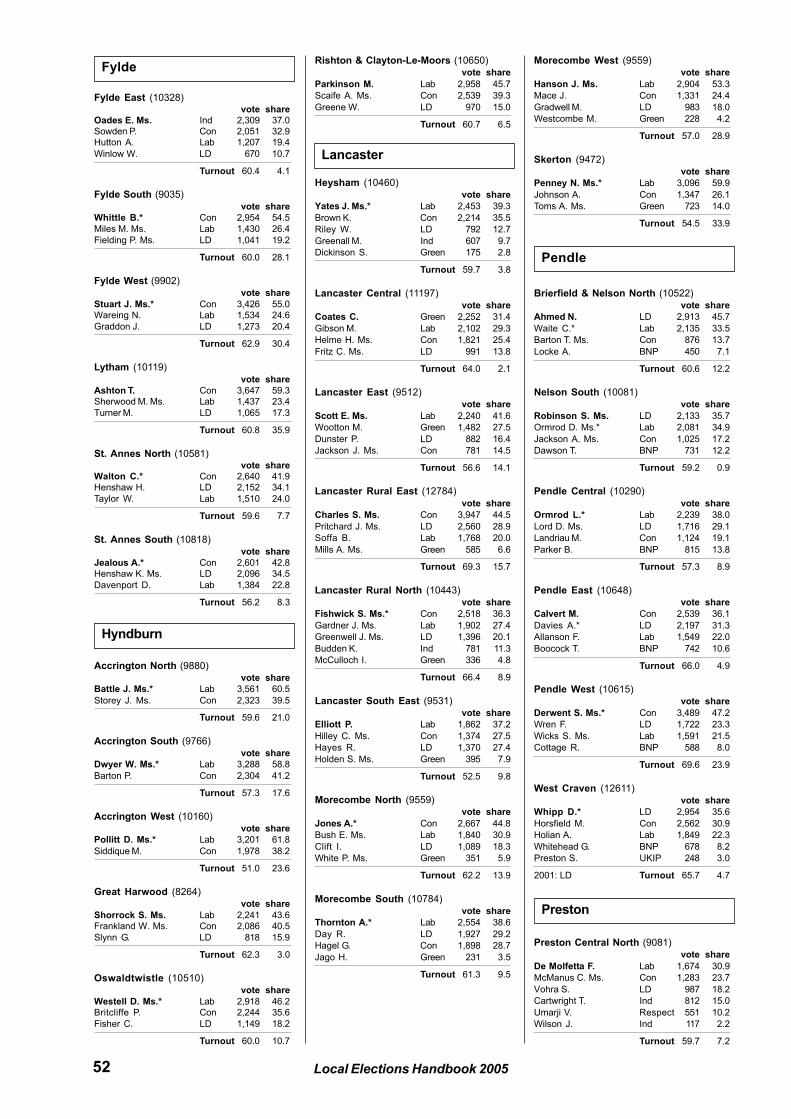
52 Local Elections Handbook 2005
Fylde East (10328)vote share
Oades E. Ms. Ind 2,309 37.0
Sowden P. Con 2,051 32.9
Hutton A. Lab 1,207 19.4
Winlow W. LD 670 10.7
Turnout 60.4 4.1
Fylde South (9035)
vote share
Whittle B.* Con 2,954 54.5
Miles M. Ms. Lab 1,430 26.4
Fielding P. Ms. LD 1,041 19.2
Turnout 60.0 28.1
Fylde West (9902)
vote share
Stuart J. Ms.* Con 3,426 55.0
Wareing N. Lab 1,534 24.6
Graddon J. LD 1,273 20.4
Turnout 62.9 30.4
Lytham (10119)
vote share
Ashton T. Con 3,647 59.3
Sherwood M. Ms. Lab 1,437 23.4
Turner M. LD 1,065 17.3
Turnout 60.8 35.9
St. Annes North (10581)vote share
Walton C.* Con 2,640 41.9
Henshaw H. LD 2,152 34.1
Taylor W. Lab 1,510 24.0
Turnout 59.6 7.7
St. Annes South (10818)
vote share
Jealous A.* Con 2,601 42.8
Henshaw K. Ms. LD 2,096 34.5
Davenport D. Lab 1,384 22.8
Turnout 56.2 8.3
Accrington North (9880)
vote share
Battle J. Ms.* Lab 3,561 60.5
Storey J. Ms. Con 2,323 39.5
Turnout 59.6 21.0
Accrington South (9766)
vote share
Dwyer W. Ms.* Lab 3,288 58.8
Barton P. Con 2,304 41.2
Turnout 57.3 17.6
Accrington West (10160)
vote share
Pollitt D. Ms.* Lab 3,201 61.8
Siddique M. Con 1,978 38.2
Turnout 51.0 23.6
Great Harwood (8264)
vote share
Shorrock S. Ms. Lab 2,241 43.6
Frankland W. Ms. Con 2,086 40.5
Slynn G. LD 818 15.9
Turnout 62.3 3.0
Oswaldtwistle (10510)
vote share
Westell D. Ms.* Lab 2,918 46.2
Britcliffe P. Con 2,244 35.6
Fisher C. LD 1,149 18.2
Turnout 60.0 10.7
Rishton & Clayton-Le-Moors (10650)
vote share
Parkinson M. Lab 2,958 45.7
Scaife A. Ms. Con 2,539 39.3
Greene W. LD 970 15.0
Turnout 60.7 6.5
Heysham (10460)
vote share
Yates J. Ms.* Lab 2,453 39.3
Brown K. Con 2,214 35.5
Riley W. LD 792 12.7
Greenall M. Ind 607 9.7
Dickinson S. Green 175 2.8
Turnout 59.7 3.8
Lancaster Central (11197)
vote share
Coates C. Green 2,252 31.4
Gibson M. Lab 2,102 29.3
Helme H. Ms. Con 1,821 25.4
Fritz C. Ms. LD 991 13.8
Turnout 64.0 2.1
Lancaster East (9512)
vote share
Scott E. Ms. Lab 2,240 41.6
Wootton M. Green 1,482 27.5
Dunster P. LD 882 16.4
Jackson J. Ms. Con 781 14.5
Turnout 56.6 14.1
Lancaster Rural East (12784)
vote share
Charles S. Ms. Con 3,947 44.5
Pritchard J. Ms. LD 2,560 28.9
Soffa B. Lab 1,768 20.0
Mills A. Ms. Green 585 6.6
Turnout 69.3 15.7
Lancaster Rural North (10443)
vote share
Fishwick S. Ms.* Con 2,518 36.3
Gardner J. Ms. Lab 1,902 27.4
Greenwell J. Ms. LD 1,396 20.1
Budden K. Ind 781 11.3
McCulloch I. Green 336 4.8
Turnout 66.4 8.9
Lancaster South East (9531)
vote share
Elliott P. Lab 1,862 37.2
Hilley C. Ms. Con 1,374 27.5
Hayes R. LD 1,370 27.4
Holden S. Ms. Green 395 7.9
Turnout 52.5 9.8
Morecombe North (9559)
vote share
Jones A.* Con 2,667 44.8
Bush E. Ms. Lab 1,840 30.9
Clift I. LD 1,089 18.3
White P. Ms. Green 351 5.9
Turnout 62.2 13.9
Morecombe South (10784)
vote share
Thornton A.* Lab 2,554 38.6
Day R. LD 1,927 29.2
Hagel G. Con 1,898 28.7
Jago H. Green 231 3.5
Turnout 61.3 9.5
Morecombe West (9559)
vote share
Hanson J. Ms. Lab 2,904 53.3
Mace J. Con 1,331 24.4
Gradwell M. LD 983 18.0
Westcombe M. Green 228 4.2
Turnout 57.0 28.9
Skerton (9472)
vote share
Penney N. Ms.* Lab 3,096 59.9
Johnson A. Con 1,347 26.1
Toms A. Ms. Green 723 14.0
Turnout 54.5 33.9
Brierfield & Nelson North (10522)
vote share
Ahmed N. LD 2,913 45.7
Waite C.* Lab 2,135 33.5
Barton T. Ms. Con 876 13.7
Locke A. BNP 450 7.1
Turnout 60.6 12.2
Nelson South (10081)
vote share
Robinson S. Ms. LD 2,133 35.7
Ormrod D. Ms.* Lab 2,081 34.9
Jackson A. Ms. Con 1,025 17.2
Dawson T. BNP 731 12.2
Turnout 59.2 0.9
Pendle Central (10290)
vote share
Ormrod L.* Lab 2,239 38.0
Lord D. Ms. LD 1,716 29.1
Landriau M. Con 1,124 19.1
Parker B. BNP 815 13.8
Turnout 57.3 8.9
Pendle East (10648)
vote share
Calvert M. Con 2,539 36.1
Davies A.* LD 2,197 31.3
Allanson F. Lab 1,549 22.0
Boocock T. BNP 742 10.6
Turnout 66.0 4.9
Pendle West (10615)
vote share
Derwent S. Ms.* Con 3,489 47.2
Wren F. LD 1,722 23.3
Wicks S. Ms. Lab 1,591 21.5
Cottage R. BNP 588 8.0
Turnout 69.6 23.9
West Craven (12611)
vote share
Whipp D.* LD 2,954 35.6
Horsfield M. Con 2,562 30.9
Holian A. Lab 1,849 22.3
Whitehead G. BNP 678 8.2
Preston S. UKIP 248 3.0
2001: LD Turnout 65.7 4.7
Preston Central North (9081)
vote share
De Molfetta F. Lab 1,674 30.9
McManus C. Ms. Con 1,283 23.7
Vohra S. LD 987 18.2
Cartwright T. Ind 812 15.0
Umarji V. Respect 551 10.2
Wilson J. Ind 117 2.2
Turnout 59.7 7.2
Hyndburn
Lancaster
Pendle
Preston
Fylde
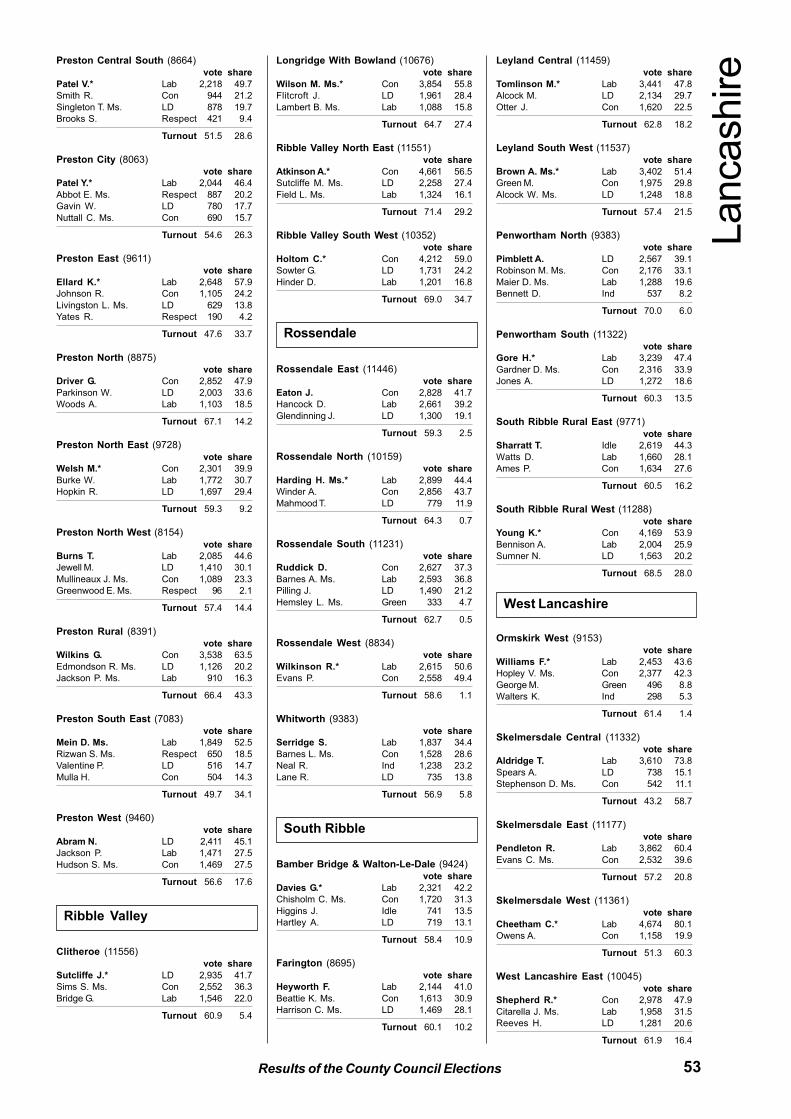
53Results of the County Council Elections
Preston Central South (8664)
vote share
Patel V.* Lab 2,218 49.7
Smith R. Con 944 21.2
Singleton T. Ms. LD 878 19.7
Brooks S. Respect 421 9.4
Turnout 51.5 28.6
Preston City (8063)
vote share
Patel Y.* Lab 2,044 46.4
Abbot E. Ms. Respect 887 20.2
Gavin W. LD 780 17.7
Nuttall C. Ms. Con 690 15.7
Turnout 54.6 26.3
Preston East (9611)
vote share
Ellard K.* Lab 2,648 57.9
Johnson R. Con 1,105 24.2
Livingston L. Ms. LD 629 13.8
Yates R. Respect 190 4.2
Turnout 47.6 33.7
Preston North (8875)
vote share
Driver G. Con 2,852 47.9
Parkinson W. LD 2,003 33.6
Woods A. Lab 1,103 18.5
Turnout 67.1 14.2
Preston North East (9728)
vote share
Welsh M.* Con 2,301 39.9
Burke W. Lab 1,772 30.7
Hopkin R. LD 1,697 29.4
Turnout 59.3 9.2
Preston North West (8154)
vote share
Burns T. Lab 2,085 44.6
Jewell M. LD 1,410 30.1
Mullineaux J. Ms. Con 1,089 23.3
Greenwood E. Ms. Respect 96 2.1
Turnout 57.4 14.4
Preston Rural (8391)
vote share
Wilkins G. Con 3,538 63.5
Edmondson R. Ms. LD 1,126 20.2
Jackson P. Ms. Lab 910 16.3
Turnout 66.4 43.3
Preston South East (7083)
vote share
Mein D. Ms. Lab 1,849 52.5
Rizwan S. Ms. Respect 650 18.5
Valentine P. LD 516 14.7
Mulla H. Con 504 14.3
Turnout 49.7 34.1
Preston West (9460)
vote share
Abram N. LD 2,411 45.1
Jackson P. Lab 1,471 27.5
Hudson S. Ms. Con 1,469 27.5
Turnout 56.6 17.6
Clitheroe (11556)
vote share
Sutcliffe J.* LD 2,935 41.7
Sims S. Ms. Con 2,552 36.3
Bridge G. Lab 1,546 22.0
Turnout 60.9 5.4
Longridge With Bowland (10676)
vote share
Wilson M. Ms.* Con 3,854 55.8
Flitcroft J. LD 1,961 28.4
Lambert B. Ms. Lab 1,088 15.8
Turnout 64.7 27.4
Ribble Valley North East (11551)
vote share
Atkinson A.* Con 4,661 56.5
Sutcliffe M. Ms. LD 2,258 27.4
Field L. Ms. Lab 1,324 16.1
Turnout 71.4 29.2
Ribble Valley South West (10352)
vote share
Holtom C.* Con 4,212 59.0
Sowter G. LD 1,731 24.2
Hinder D. Lab 1,201 16.8
Turnout 69.0 34.7
Rossendale East (11446)
vote share
Eaton J. Con 2,828 41.7
Hancock D. Lab 2,661 39.2
Glendinning J. LD 1,300 19.1
Turnout 59.3 2.5
Rossendale North (10159)
vote share
Harding H. Ms.* Lab 2,899 44.4
Winder A. Con 2,856 43.7
Mahmood T. LD 779 11.9
Turnout 64.3 0.7
Rossendale South (11231)
vote share
Ruddick D. Con 2,627 37.3
Barnes A. Ms. Lab 2,593 36.8
Pilling J. LD 1,490 21.2
Hemsley L. Ms. Green 333 4.7
Turnout 62.7 0.5
Rossendale West (8834)
vote share
Wilkinson R.* Lab 2,615 50.6
Evans P. Con 2,558 49.4
Turnout 58.6 1.1
Whitworth (9383)
vote share
Serridge S. Lab 1,837 34.4
Barnes L. Ms. Con 1,528 28.6
Neal R. Ind 1,238 23.2
Lane R. LD 735 13.8
Turnout 56.9 5.8
Bamber Bridge & Walton-Le-Dale (9424)
vote share
Davies G.* Lab 2,321 42.2
Chisholm C. Ms. Con 1,720 31.3
Higgins J. Idle 741 13.5
Hartley A. LD 719 13.1
Turnout 58.4 10.9
Farington (8695)
vote share
Heyworth F. Lab 2,144 41.0
Beattie K. Ms. Con 1,613 30.9
Harrison C. Ms. LD 1,469 28.1
Turnout 60.1 10.2
Leyland Central (11459)
vote share
Tomlinson M.* Lab 3,441 47.8
Alcock M. LD 2,134 29.7
Otter J. Con 1,620 22.5
Turnout 62.8 18.2
Leyland South West (11537)
vote share
Brown A. Ms.* Lab 3,402 51.4
Green M. Con 1,975 29.8
Alcock W. Ms. LD 1,248 18.8
Turnout 57.4 21.5
Penwortham North (9383)
vote share
Pimblett A. LD 2,567 39.1
Robinson M. Ms. Con 2,176 33.1
Maier D. Ms. Lab 1,288 19.6
Bennett D. Ind 537 8.2
Turnout 70.0 6.0
Penwortham South (11322)
vote share
Gore H.* Lab 3,239 47.4
Gardner D. Ms. Con 2,316 33.9
Jones A. LD 1,272 18.6
Turnout 60.3 13.5
South Ribble Rural East (9771)
vote share
Sharratt T. Idle 2,619 44.3
Watts D. Lab 1,660 28.1
Ames P. Con 1,634 27.6
Turnout 60.5 16.2
South Ribble Rural West (11288)
vote share
Young K.* Con 4,169 53.9
Bennison A. Lab 2,004 25.9
Sumner N. LD 1,563 20.2
Turnout 68.5 28.0
Ormskirk West (9153)
vote share
Williams F.* Lab 2,453 43.6
Hopley V. Ms. Con 2,377 42.3
George M. Green 496 8.8
Walters K. Ind 298 5.3
Turnout 61.4 1.4
Skelmersdale Central (11332)
vote share
Aldridge T. Lab 3,610 73.8
Spears A. LD 738 15.1
Stephenson D. Ms. Con 542 11.1
Turnout 43.2 58.7
Skelmersdale East (11177)
vote share
Pendleton R. Lab 3,862 60.4
Evans C. Ms. Con 2,532 39.6
Turnout 57.2 20.8
Skelmersdale West (11361)
vote share
Cheetham C.* Lab 4,674 80.1
Owens A. Con 1,158 19.9
Turnout 51.3 60.3
West Lancashire East (10045)
vote share
Shepherd R.* Con 2,978 47.9
Citarella J. Ms. Lab 1,958 31.5
Reeves H. LD 1,281 20.6
Turnout 61.9 16.4
Ribble Valley
Rossendale
South Ribble
West Lancashire
Lancashire
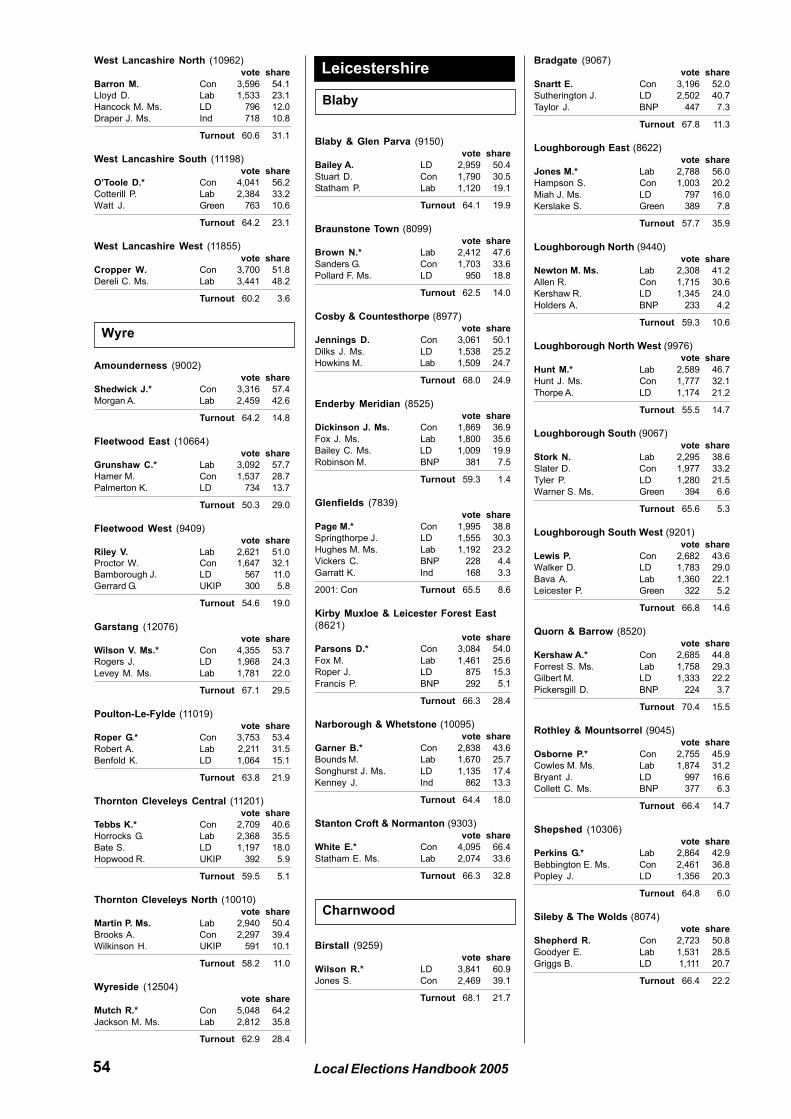
54 Local Elections Handbook 2005
West Lancashire North (10962)
vote share
Barron M. Con 3,596 54.1
Lloyd D. Lab 1,533 23.1
Hancock M. Ms. LD 796 12.0
Draper J. Ms. Ind 718 10.8
Turnout 60.6 31.1
West Lancashire South (11198)
vote share
O’Toole D.* Con 4,041 56.2
Cotterill P. Lab 2,384 33.2
Watt J. Green 763 10.6
Turnout 64.2 23.1
West Lancashire West (11855)
vote share
Cropper W. Con 3,700 51.8
Dereli C. Ms. Lab 3,441 48.2
Turnout 60.2 3.6
Amounderness (9002)
vote share
Shedwick J.* Con 3,316 57.4
Morgan A. Lab 2,459 42.6
Turnout 64.2 14.8
Fleetwood East (10664)
vote share
Grunshaw C.* Lab 3,092 57.7
Hamer M. Con 1,537 28.7
Palmerton K. LD 734 13.7
Turnout 50.3 29.0
Fleetwood West (9409)
vote share
Riley V. Lab 2,621 51.0
Proctor W. Con 1,647 32.1
Bamborough J. LD 567 11.0
Gerrard G. UKIP 300 5.8
Turnout 54.6 19.0
Garstang (12076)
vote share
Wilson V. Ms.* Con 4,355 53.7
Rogers J. LD 1,968 24.3
Levey M. Ms. Lab 1,781 22.0
Turnout 67.1 29.5
Poulton-Le-Fylde (11019)
vote share
Roper G.* Con 3,753 53.4
Robert A. Lab 2,211 31.5
Benfold K. LD 1,064 15.1
Turnout 63.8 21.9
Thornton Cleveleys Central (11201)
vote share
Tebbs K.* Con 2,709 40.6
Horrocks G. Lab 2,368 35.5
Bate S. LD 1,197 18.0
Hopwood R. UKIP 392 5.9
Turnout 59.5 5.1
Thornton Cleveleys North (10010)
vote share
Martin P. Ms. Lab 2,940 50.4
Brooks A. Con 2,297 39.4
Wilkinson H. UKIP 591 10.1
Turnout 58.2 11.0
Wyreside (12504)
vote share
Mutch R.* Con 5,048 64.2
Jackson M. Ms. Lab 2,812 35.8
Turnout 62.9 28.4
Blaby & Glen Parva (9150)
vote share
Bailey A. LD 2,959 50.4
Stuart D. Con 1,790 30.5
Statham P. Lab 1,120 19.1
Turnout 64.1 19.9
Braunstone Town (8099)
vote share
Brown N.* Lab 2,412 47.6
Sanders G. Con 1,703 33.6
Pollard F. Ms. LD 950 18.8
Turnout 62.5 14.0
Cosby & Countesthorpe (8977)
vote share
Jennings D. Con 3,061 50.1
Dilks J. Ms. LD 1,538 25.2
Howkins M. Lab 1,509 24.7
Turnout 68.0 24.9
Enderby Meridian (8525)
vote share
Dickinson J. Ms. Con 1,869 36.9
Fox J. Ms. Lab 1,800 35.6
Bailey C. Ms. LD 1,009 19.9
Robinson M. BNP 381 7.5
Turnout 59.3 1.4
Glenfields (7839)
vote share
Page M.* Con 1,995 38.8
Springthorpe J. LD 1,555 30.3
Hughes M. Ms. Lab 1,192 23.2
Vickers C. BNP 228 4.4
Garratt K. Ind 168 3.3
2001: Con Turnout 65.5 8.6
Kirby Muxloe & Leicester Forest East
(8621)
vote share
Parsons D.* Con 3,084 54.0
Fox M. Lab 1,461 25.6
Roper J. LD 875 15.3
Francis P. BNP 292 5.1
Turnout 66.3 28.4
Narborough & Whetstone (10095)
vote share
Garner B.* Con 2,838 43.6
Bounds M. Lab 1,670 25.7
Songhurst J. Ms. LD 1,135 17.4
Kenney J. Ind 862 13.3
Turnout 64.4 18.0
Stanton Croft & Normanton (9303)
vote share
White E.* Con 4,095 66.4
Statham E. Ms. Lab 2,074 33.6
Turnout 66.3 32.8
Birstall (9259)
vote share
Wilson R.* LD 3,841 60.9
Jones S. Con 2,469 39.1
Turnout 68.1 21.7
Bradgate (9067)
vote share
Snartt E. Con 3,196 52.0
Sutherington J. LD 2,502 40.7
Taylor J. BNP 447 7.3
Turnout 67.8 11.3
Loughborough East (8622)
vote share
Jones M.* Lab 2,788 56.0
Hampson S. Con 1,003 20.2
Miah J. Ms. LD 797 16.0
Kerslake S. Green 389 7.8
Turnout 57.7 35.9
Loughborough North (9440)
vote share
Newton M. Ms. Lab 2,308 41.2
Allen R. Con 1,715 30.6
Kershaw R. LD 1,345 24.0
Holders A. BNP 233 4.2
Turnout 59.3 10.6
Loughborough North West (9976)
vote share
Hunt M.* Lab 2,589 46.7
Hunt J. Ms. Con 1,777 32.1
Thorpe A. LD 1,174 21.2
Turnout 55.5 14.7
Loughborough South (9067)
vote share
Stork N. Lab 2,295 38.6
Slater D. Con 1,977 33.2
Tyler P. LD 1,280 21.5
Warner S. Ms. Green 394 6.6
Turnout 65.6 5.3
Loughborough South West (9201)
vote share
Lewis P. Con 2,682 43.6
Walker D. LD 1,783 29.0
Bava A. Lab 1,360 22.1
Leicester P. Green 322 5.2
Turnout 66.8 14.6
Quorn & Barrow (8520)
vote share
Kershaw A.* Con 2,685 44.8
Forrest S. Ms. Lab 1,758 29.3
Gilbert M. LD 1,333 22.2
Pickersgill D. BNP 224 3.7
Turnout 70.4 15.5
Rothley & Mountsorrel (9045)
vote share
Osborne P.* Con 2,755 45.9
Cowles M. Ms. Lab 1,874 31.2
Bryant J. LD 997 16.6
Collett C. Ms. BNP 377 6.3
Turnout 66.4 14.7
Shepshed (10306)
vote share
Perkins G.* Lab 2,864 42.9
Bebbington E. Ms. Con 2,461 36.8
Popley J. LD 1,356 20.3
Turnout 64.8 6.0
Sileby & The Wolds (8074)
vote share
Shepherd R. Con 2,723 50.8
Goodyer E. Lab 1,531 28.5
Griggs B. LD 1,111 20.7
Turnout 66.4 22.2
Wyre
Leicestershire
Blaby
Charnwood
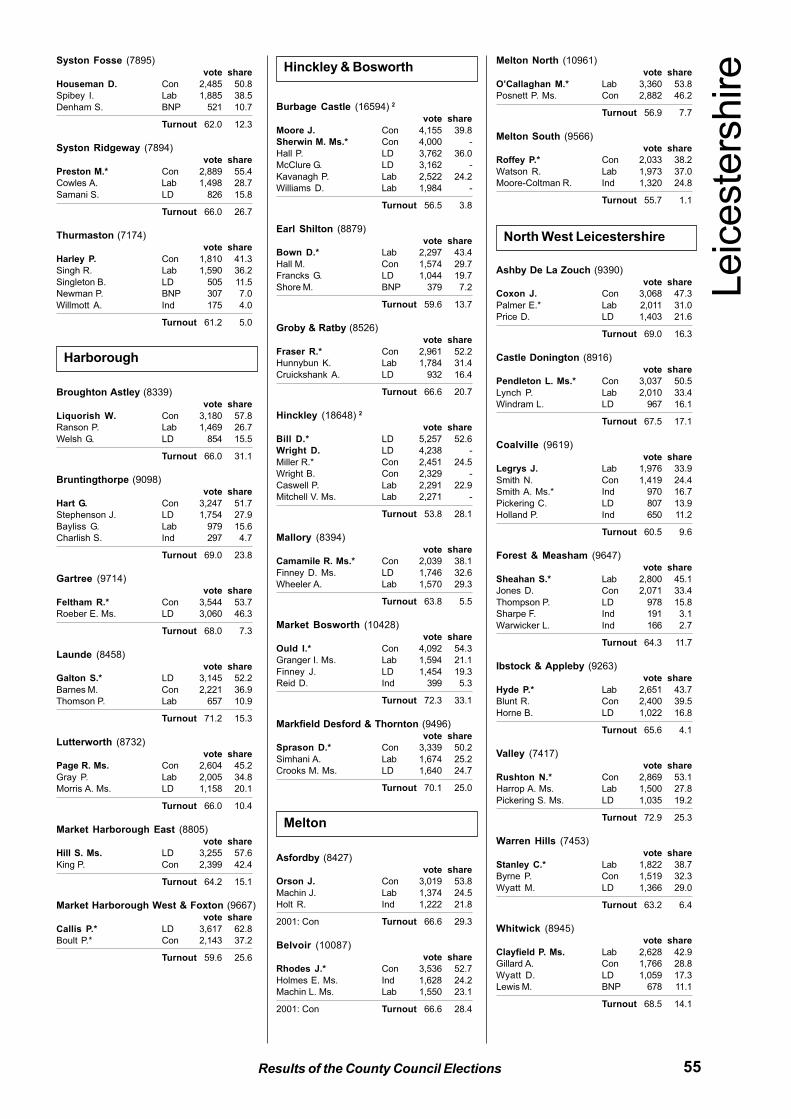
55Results of the County Council Elections
Syston Fosse (7895)
vote share
Houseman D. Con 2,485 50.8
Spibey I. Lab 1,885 38.5
Denham S. BNP 521 10.7
Turnout 62.0 12.3
Syston Ridgeway (7894)
vote share
Preston M.* Con 2,889 55.4
Cowles A. Lab 1,498 28.7
Samani S. LD 826 15.8
Turnout 66.0 26.7
Thurmaston (7174)
vote share
Harley P. Con 1,810 41.3
Singh R. Lab 1,590 36.2
Singleton B. LD 505 11.5
Newman P. BNP 307 7.0
Willmott A. Ind 175 4.0
Turnout 61.2 5.0
Broughton Astley (8339)
vote share
Liquorish W. Con 3,180 57.8
Ranson P. Lab 1,469 26.7
Welsh G. LD 854 15.5
Turnout 66.0 31.1
Bruntingthorpe (9098)
vote share
Hart G. Con 3,247 51.7
Stephenson J. LD 1,754 27.9
Bayliss G. Lab 979 15.6
Charlish S. Ind 297 4.7
Turnout 69.0 23.8
Gartree (9714)
vote share
Feltham R.* Con 3,544 53.7
Roeber E. Ms. LD 3,060 46.3
Turnout 68.0 7.3
Launde (8458)
vote share
Galton S.* LD 3,145 52.2
Barnes M. Con 2,221 36.9
Thomson P. Lab 657 10.9
Turnout 71.2 15.3
Lutterworth (8732)
vote share
Page R. Ms. Con 2,604 45.2
Gray P. Lab 2,005 34.8
Morris A. Ms. LD 1,158 20.1
Turnout 66.0 10.4
Market Harborough East (8805)
vote share
Hill S. Ms. LD 3,255 57.6
King P. Con 2,399 42.4
Turnout 64.2 15.1
Market Harborough West & Foxton (9667)
vote share
Callis P.* LD 3,617 62.8
Boult P.* Con 2,143 37.2
Turnout 59.6 25.6
Burbage Castle (16594) 2
vote share
Moore J. Con 4,155 39.8
Sherwin M. Ms.* Con 4,000 -
Hall P. LD 3,762 36.0
McClure G. LD 3,162 -
Kavanagh P. Lab 2,522 24.2
Williams D. Lab 1,984 -
Turnout 56.5 3.8
Earl Shilton (8879)
vote share
Bown D.* Lab 2,297 43.4
Hall M. Con 1,574 29.7
Francks G. LD 1,044 19.7
Shore M. BNP 379 7.2
Turnout 59.6 13.7
Groby & Ratby (8526)
vote share
Fraser R.* Con 2,961 52.2
Hunnybun K. Lab 1,784 31.4
Cruickshank A. LD 932 16.4
Turnout 66.6 20.7
Hinckley (18648) 2
vote share
Bill D.* LD 5,257 52.6
Wright D. LD 4,238 -
Miller R.* Con 2,451 24.5
Wright B. Con 2,329 -
Caswell P. Lab 2,291 22.9
Mitchell V. Ms. Lab 2,271 -
Turnout 53.8 28.1
Mallory (8394)
vote share
Camamile R. Ms.* Con 2,039 38.1
Finney D. Ms. LD 1,746 32.6
Wheeler A. Lab 1,570 29.3
Turnout 63.8 5.5
Market Bosworth (10428)
vote share
Ould I.* Con 4,092 54.3
Granger I. Ms. Lab 1,594 21.1
Finney J. LD 1,454 19.3
Reid D. Ind 399 5.3
Turnout 72.3 33.1
Markfield Desford & Thornton (9496)
vote share
Sprason D.* Con 3,339 50.2
Simhani A. Lab 1,674 25.2
Crooks M. Ms. LD 1,640 24.7
Turnout 70.1 25.0
Asfordby (8427)
vote share
Orson J. Con 3,019 53.8
Machin J. Lab 1,374 24.5
Holt R. Ind 1,222 21.8
2001: Con Turnout 66.6 29.3
Belvoir (10087)
vote share
Rhodes J.* Con 3,536 52.7
Holmes E. Ms. Ind 1,628 24.2
Machin L. Ms. Lab 1,550 23.1
2001: Con Turnout 66.6 28.4
Melton North (10961)
vote share
O’Callaghan M.* Lab 3,360 53.8
Posnett P. Ms. Con 2,882 46.2
Turnout 56.9 7.7
Melton South (9566)
vote share
Roffey P.* Con 2,033 38.2
Watson R. Lab 1,973 37.0
Moore-Coltman R. Ind 1,320 24.8
Turnout 55.7 1.1
Ashby De La Zouch (9390)
vote share
Coxon J. Con 3,068 47.3
Palmer E.* Lab 2,011 31.0
Price D. LD 1,403 21.6
Turnout 69.0 16.3
Castle Donington (8916)
vote share
Pendleton L. Ms.* Con 3,037 50.5
Lynch P. Lab 2,010 33.4
Windram L. LD 967 16.1
Turnout 67.5 17.1
Coalville (9619)
vote share
Legrys J. Lab 1,976 33.9
Smith N. Con 1,419 24.4
Smith A. Ms.* Ind 970 16.7
Pickering C. LD 807 13.9
Holland P. Ind 650 11.2
Turnout 60.5 9.6
Forest & Measham (9647)
vote share
Sheahan S.* Lab 2,800 45.1
Jones D. Con 2,071 33.4
Thompson P. LD 978 15.8
Sharpe F. Ind 191 3.1
Warwicker L. Ind 166 2.7
Turnout 64.3 11.7
Ibstock & Appleby (9263)
vote share
Hyde P.* Lab 2,651 43.7
Blunt R. Con 2,400 39.5
Horne B. LD 1,022 16.8
Turnout 65.6 4.1
Valley (7417)
vote share
Rushton N.* Con 2,869 53.1
Harrop A. Ms. Lab 1,500 27.8
Pickering S. Ms. LD 1,035 19.2
Turnout 72.9 25.3
Warren Hills (7453)
vote share
Stanley C.* Lab 1,822 38.7
Byrne P. Con 1,519 32.3
Wyatt M. LD 1,366 29.0
Turnout 63.2 6.4
Whitwick (8945)
vote share
Clayfield P. Ms. Lab 2,628 42.9
Gillard A. Con 1,766 28.8
Wyatt D. LD 1,059 17.3
Lewis M. BNP 678 11.1
Turnout 68.5 14.1
Harborough
Hinckley & Bosworth
Melton
Leic
este
rshire
North West Leicestershire
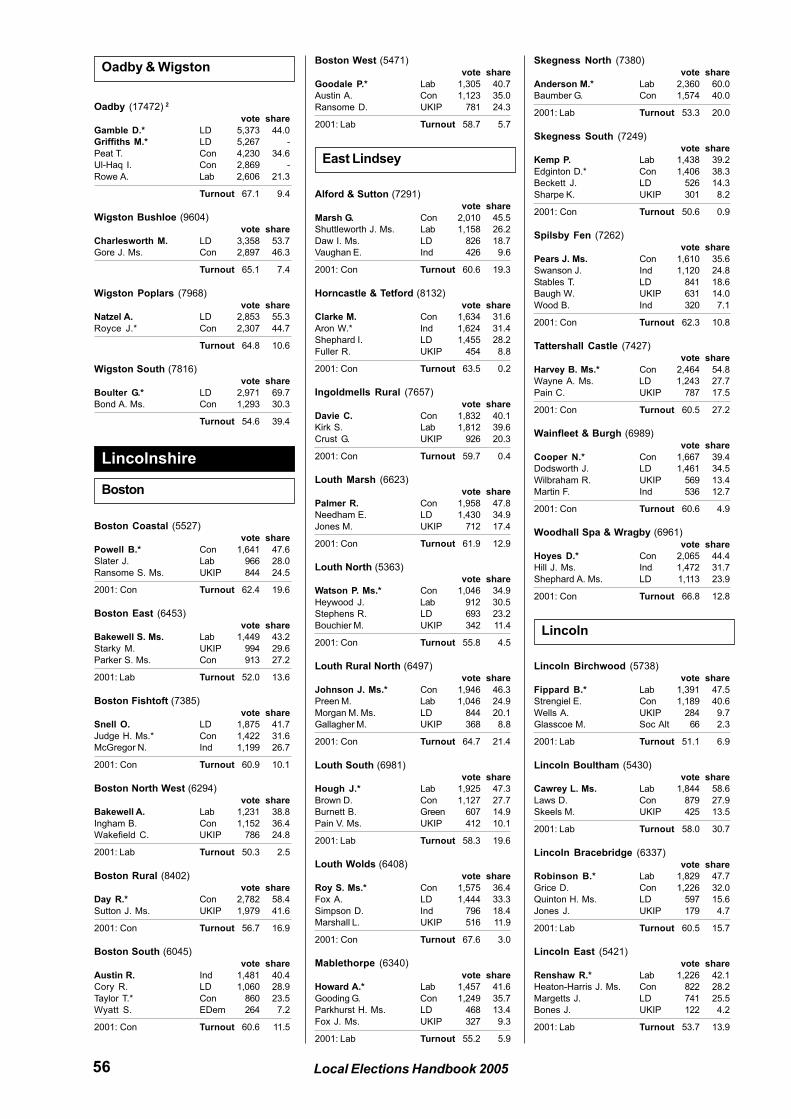
56 Local Elections Handbook 2005
Oadby (17472) 2
vote share
Gamble D.* LD 5,373 44.0
Griffiths M.* LD 5,267 -
Peat T. Con 4,230 34.6
Ul-Haq I. Con 2,869 -
Rowe A. Lab 2,606 21.3
Turnout 67.1 9.4
Wigston Bushloe (9604)
vote share
Charlesworth M. LD 3,358 53.7
Gore J. Ms. Con 2,897 46.3
Turnout 65.1 7.4
Wigston Poplars (7968)
vote share
Natzel A. LD 2,853 55.3
Royce J.* Con 2,307 44.7
Turnout 64.8 10.6
Wigston South (7816)
vote share
Boulter G.* LD 2,971 69.7
Bond A. Ms. Con 1,293 30.3
Turnout 54.6 39.4
Boston Coastal (5527)
vote share
Powell B.* Con 1,641 47.6
Slater J. Lab 966 28.0
Ransome S. Ms. UKIP 844 24.5
2001: Con Turnout 62.4 19.6
Boston East (6453)
vote share
Bakewell S. Ms. Lab 1,449 43.2
Starky M. UKIP 994 29.6
Parker S. Ms. Con 913 27.2
2001: Lab Turnout 52.0 13.6
Boston Fishtoft (7385)
vote share
Snell O. LD 1,875 41.7
Judge H. Ms.* Con 1,422 31.6
McGregor N. Ind 1,199 26.7
2001: Con Turnout 60.9 10.1
Boston North West (6294)
vote share
Bakewell A. Lab 1,231 38.8
Ingham B. Con 1,152 36.4
Wakefield C. UKIP 786 24.8
2001: Lab Turnout 50.3 2.5
Boston Rural (8402)
vote share
Day R.* Con 2,782 58.4
Sutton J. Ms. UKIP 1,979 41.6
2001: Con Turnout 56.7 16.9
Boston South (6045)
vote share
Austin R. Ind 1,481 40.4
Cory R. LD 1,060 28.9
Taylor T.* Con 860 23.5
Wyatt S. EDem 264 7.2
2001: Con Turnout 60.6 11.5
Boston West (5471)
vote share
Goodale P.* Lab 1,305 40.7
Austin A. Con 1,123 35.0
Ransome D. UKIP 781 24.3
2001: Lab Turnout 58.7 5.7
Alford & Sutton (7291)
vote share
Marsh G. Con 2,010 45.5
Shuttleworth J. Ms. Lab 1,158 26.2
Daw I. Ms. LD 826 18.7
Vaughan E. Ind 426 9.6
2001: Con Turnout 60.6 19.3
Horncastle & Tetford (8132)
vote share
Clarke M. Con 1,634 31.6
Aron W.* Ind 1,624 31.4
Shephard I. LD 1,455 28.2
Fuller R. UKIP 454 8.8
2001: Con Turnout 63.5 0.2
Ingoldmells Rural (7657)
vote share
Davie C. Con 1,832 40.1
Kirk S. Lab 1,812 39.6
Crust G. UKIP 926 20.3
2001: Con Turnout 59.7 0.4
Louth Marsh (6623)
vote share
Palmer R. Con 1,958 47.8
Needham E. LD 1,430 34.9
Jones M. UKIP 712 17.4
2001: Con Turnout 61.9 12.9
Louth North (5363)
vote share
Watson P. Ms.* Con 1,046 34.9
Heywood J. Lab 912 30.5
Stephens R. LD 693 23.2
Bouchier M. UKIP 342 11.4
2001: Con Turnout 55.8 4.5
Louth Rural North (6497)
vote share
Johnson J. Ms.* Con 1,946 46.3
Preen M. Lab 1,046 24.9
Morgan M. Ms. LD 844 20.1
Gallagher M. UKIP 368 8.8
2001: Con Turnout 64.7 21.4
Louth South (6981)
vote share
Hough J.* Lab 1,925 47.3
Brown D. Con 1,127 27.7
Burnett B. Green 607 14.9
Pain V. Ms. UKIP 412 10.1
2001: Lab Turnout 58.3 19.6
Louth Wolds (6408)
vote share
Roy S. Ms.* Con 1,575 36.4
Fox A. LD 1,444 33.3
Simpson D. Ind 796 18.4
Marshall L. UKIP 516 11.9
2001: Con Turnout 67.6 3.0
Mablethorpe (6340)
vote share
Howard A.* Lab 1,457 41.6
Gooding G. Con 1,249 35.7
Parkhurst H. Ms. LD 468 13.4
Fox J. Ms. UKIP 327 9.3
2001: Lab Turnout 55.2 5.9
Skegness North (7380)
vote share
Anderson M.* Lab 2,360 60.0
Baumber G. Con 1,574 40.0
2001: Lab Turnout 53.3 20.0
Skegness South (7249)
vote share
Kemp P. Lab 1,438 39.2
Edginton D.* Con 1,406 38.3
Beckett J. LD 526 14.3
Sharpe K. UKIP 301 8.2
2001: Con Turnout 50.6 0.9
Spilsby Fen (7262)
vote share
Pears J. Ms. Con 1,610 35.6
Swanson J. Ind 1,120 24.8
Stables T. LD 841 18.6
Baugh W. UKIP 631 14.0
Wood B. Ind 320 7.1
2001: Con Turnout 62.3 10.8
Tattershall Castle (7427)
vote share
Harvey B. Ms.* Con 2,464 54.8
Wayne A. Ms. LD 1,243 27.7
Pain C. UKIP 787 17.5
2001: Con Turnout 60.5 27.2
Wainfleet & Burgh (6989)
vote share
Cooper N.* Con 1,667 39.4
Dodsworth J. LD 1,461 34.5
Wilbraham R. UKIP 569 13.4
Martin F. Ind 536 12.7
2001: Con Turnout 60.6 4.9
Woodhall Spa & Wragby (6961)
vote share
Hoyes D.* Con 2,065 44.4
Hill J. Ms. Ind 1,472 31.7
Shephard A. Ms. LD 1,113 23.9
2001: Con Turnout 66.8 12.8
Lincoln Birchwood (5738)
vote share
Fippard B.* Lab 1,391 47.5
Strengiel E. Con 1,189 40.6
Wells A. UKIP 284 9.7
Glasscoe M. Soc Alt 66 2.3
2001: Lab Turnout 51.1 6.9
Lincoln Boultham (5430)
vote share
Cawrey L. Ms. Lab 1,844 58.6
Laws D. Con 879 27.9
Skeels M. UKIP 425 13.5
2001: Lab Turnout 58.0 30.7
Lincoln Bracebridge (6337)
vote share
Robinson B.* Lab 1,829 47.7
Grice D. Con 1,226 32.0
Quinton H. Ms. LD 597 15.6
Jones J. UKIP 179 4.7
2001: Lab Turnout 60.5 15.7
Lincoln East (5421)
vote share
Renshaw R.* Lab 1,226 42.1
Heaton-Harris J. Ms. Con 822 28.2
Margetts J. LD 741 25.5
Bones J. UKIP 122 4.2
2001: Lab Turnout 53.7 13.9
Oadby & Wigston
Lincolnshire
Boston
East Lindsey
Lincoln
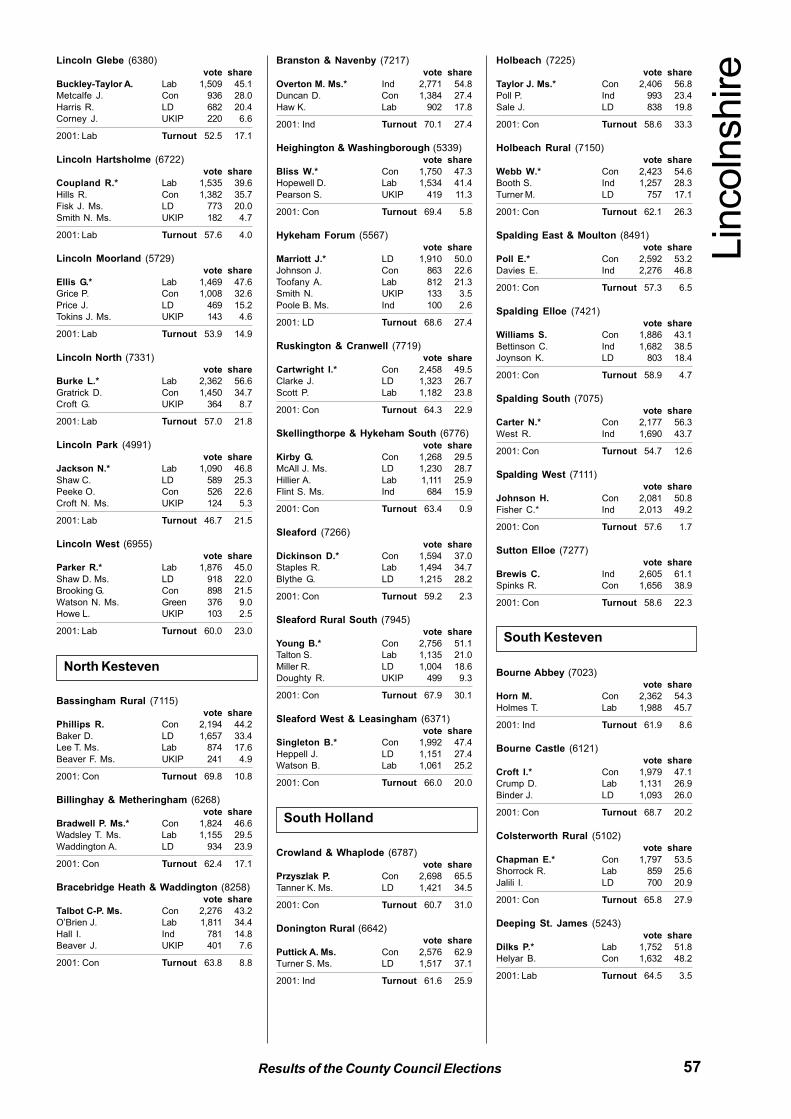
57Results of the County Council Elections
Lincoln Glebe (6380)
vote share
Buckley-Taylor A. Lab 1,509 45.1
Metcalfe J. Con 936 28.0
Harris R. LD 682 20.4
Corney J. UKIP 220 6.6
2001: Lab Turnout 52.5 17.1
Lincoln Hartsholme (6722)
vote share
Coupland R.* Lab 1,535 39.6
Hills R. Con 1,382 35.7
Fisk J. Ms. LD 773 20.0
Smith N. Ms. UKIP 182 4.7
2001: Lab Turnout 57.6 4.0
Lincoln Moorland (5729)
vote share
Ellis G.* Lab 1,469 47.6
Grice P. Con 1,008 32.6
Price J. LD 469 15.2
Tokins J. Ms. UKIP 143 4.6
2001: Lab Turnout 53.9 14.9
Lincoln North (7331)
vote share
Burke L.* Lab 2,362 56.6
Gratrick D. Con 1,450 34.7
Croft G. UKIP 364 8.7
2001: Lab Turnout 57.0 21.8
Lincoln Park (4991)
vote share
Jackson N.* Lab 1,090 46.8
Shaw C. LD 589 25.3
Peeke O. Con 526 22.6
Croft N. Ms. UKIP 124 5.3
2001: Lab Turnout 46.7 21.5
Lincoln West (6955)
vote share
Parker R.* Lab 1,876 45.0
Shaw D. Ms. LD 918 22.0
Brooking G. Con 898 21.5
Watson N. Ms. Green 376 9.0
Howe L. UKIP 103 2.5
2001: Lab Turnout 60.0 23.0
Bassingham Rural (7115)
vote share
Phillips R. Con 2,194 44.2
Baker D. LD 1,657 33.4
Lee T. Ms. Lab 874 17.6
Beaver F. Ms. UKIP 241 4.9
2001: Con Turnout 69.8 10.8
Billinghay & Metheringham (6268)
vote share
Bradwell P. Ms.* Con 1,824 46.6
Wadsley T. Ms. Lab 1,155 29.5
Waddington A. LD 934 23.9
2001: Con Turnout 62.4 17.1
Bracebridge Heath & Waddington (8258)
vote share
Talbot C-P. Ms. Con 2,276 43.2
O’Brien J. Lab 1,811 34.4
Hall I. Ind 781 14.8
Beaver J. UKIP 401 7.6
2001: Con Turnout 63.8 8.8
Branston & Navenby (7217)
vote share
Overton M. Ms.* Ind 2,771 54.8
Duncan D. Con 1,384 27.4
Haw K. Lab 902 17.8
2001: Ind Turnout 70.1 27.4
Heighington & Washingborough (5339)
vote share
Bliss W.* Con 1,750 47.3
Hopewell D. Lab 1,534 41.4
Pearson S. UKIP 419 11.3
2001: Con Turnout 69.4 5.8
Hykeham Forum (5567)
vote share
Marriott J.* LD 1,910 50.0
Johnson J. Con 863 22.6
Toofany A. Lab 812 21.3
Smith N. UKIP 133 3.5
Poole B. Ms. Ind 100 2.6
2001: LD Turnout 68.6 27.4
Ruskington & Cranwell (7719)
vote share
Cartwright I.* Con 2,458 49.5
Clarke J. LD 1,323 26.7
Scott P. Lab 1,182 23.8
2001: Con Turnout 64.3 22.9
Skellingthorpe & Hykeham South (6776)
vote share
Kirby G. Con 1,268 29.5
McAll J. Ms. LD 1,230 28.7
Hillier A. Lab 1,111 25.9
Flint S. Ms. Ind 684 15.9
2001: Con Turnout 63.4 0.9
Sleaford (7266)
vote share
Dickinson D.* Con 1,594 37.0
Staples R. Lab 1,494 34.7
Blythe G. LD 1,215 28.2
2001: Con Turnout 59.2 2.3
Sleaford Rural South (7945)
vote share
Young B.* Con 2,756 51.1
Talton S. Lab 1,135 21.0
Miller R. LD 1,004 18.6
Doughty R. UKIP 499 9.3
2001: Con Turnout 67.9 30.1
Sleaford West & Leasingham (6371)
vote share
Singleton B.* Con 1,992 47.4
Heppell J. LD 1,151 27.4
Watson B. Lab 1,061 25.2
2001: Con Turnout 66.0 20.0
Crowland & Whaplode (6787)
vote share
Przyszlak P. Con 2,698 65.5
Tanner K. Ms. LD 1,421 34.5
2001: Con Turnout 60.7 31.0
Donington Rural (6642)
vote share
Puttick A. Ms. Con 2,576 62.9
Turner S. Ms. LD 1,517 37.1
2001: Ind Turnout 61.6 25.9
Holbeach (7225)
vote share
Taylor J. Ms.* Con 2,406 56.8
Poll P. Ind 993 23.4
Sale J. LD 838 19.8
2001: Con Turnout 58.6 33.3
Holbeach Rural (7150)
vote share
Webb W.* Con 2,423 54.6
Booth S. Ind 1,257 28.3
Turner M. LD 757 17.1
2001: Con Turnout 62.1 26.3
Spalding East & Moulton (8491)
vote share
Poll E.* Con 2,592 53.2
Davies E. Ind 2,276 46.8
2001: Con Turnout 57.3 6.5
Spalding Elloe (7421)
vote share
Williams S. Con 1,886 43.1
Bettinson C. Ind 1,682 38.5
Joynson K. LD 803 18.4
2001: Con Turnout 58.9 4.7
Spalding South (7075)
vote share
Carter N.* Con 2,177 56.3
West R. Ind 1,690 43.7
2001: Con Turnout 54.7 12.6
Spalding West (7111)
vote share
Johnson H. Con 2,081 50.8
Fisher C.* Ind 2,013 49.2
2001: Con Turnout 57.6 1.7
Sutton Elloe (7277)
vote share
Brewis C. Ind 2,605 61.1
Spinks R. Con 1,656 38.9
2001: Con Turnout 58.6 22.3
Bourne Abbey (7023)
vote share
Horn M. Con 2,362 54.3
Holmes T. Lab 1,988 45.7
2001: Ind Turnout 61.9 8.6
Bourne Castle (6121)
vote share
Croft I.* Con 1,979 47.1
Crump D. Lab 1,131 26.9
Binder J. LD 1,093 26.0
2001: Con Turnout 68.7 20.2
Colsterworth Rural (5102)
vote share
Chapman E.* Con 1,797 53.5
Shorrock R. Lab 859 25.6
Jalili I. LD 700 20.9
2001: Con Turnout 65.8 27.9
Deeping St. James (5243)
vote share
Dilks P.* Lab 1,752 51.8
Helyar B. Con 1,632 48.2
2001: Lab Turnout 64.5 3.5
North Kesteven
South Holland
Lin
coln
shire
South Kesteven
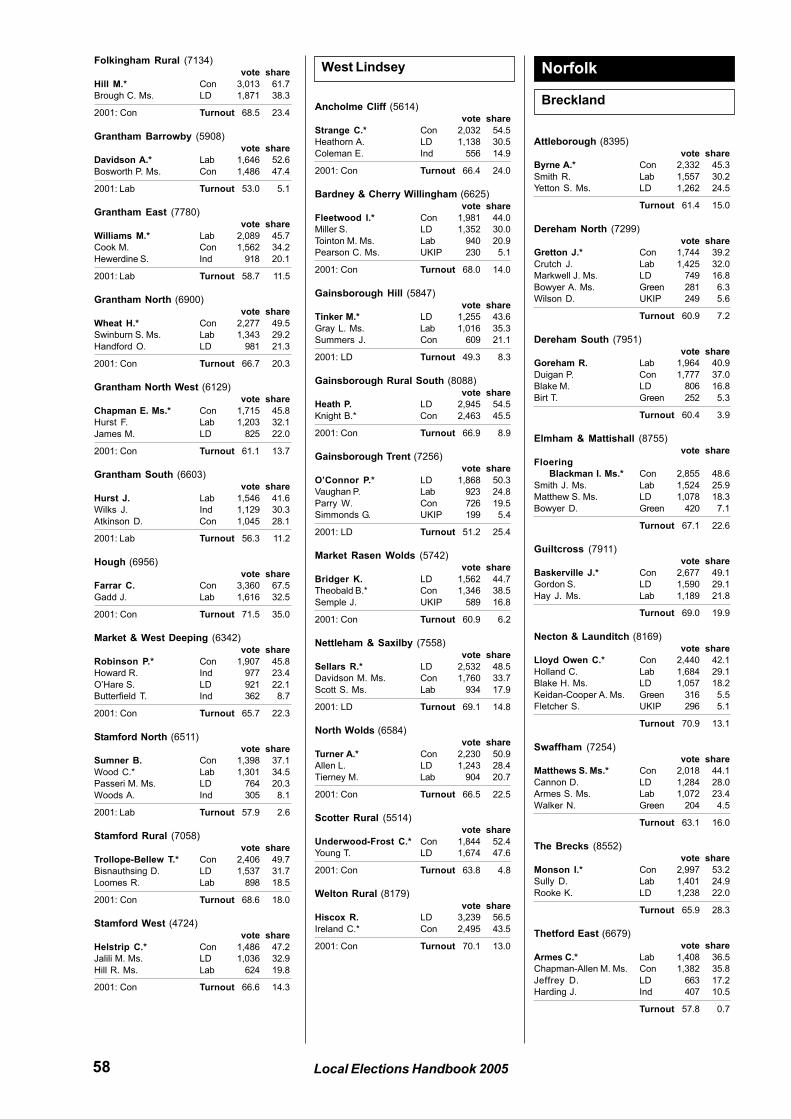
58 Local Elections Handbook 2005
Folkingham Rural (7134)
vote share
Hill M.* Con 3,013 61.7
Brough C. Ms. LD 1,871 38.3
2001: Con Turnout 68.5 23.4
Grantham Barrowby (5908)
vote share
Davidson A.* Lab 1,646 52.6
Bosworth P. Ms. Con 1,486 47.4
2001: Lab Turnout 53.0 5.1
Grantham East (7780)
vote share
Williams M.* Lab 2,089 45.7
Cook M. Con 1,562 34.2
Hewerdine S. Ind 918 20.1
2001: Lab Turnout 58.7 11.5
Grantham North (6900)
vote share
Wheat H.* Con 2,277 49.5
Swinburn S. Ms. Lab 1,343 29.2
Handford O. LD 981 21.3
2001: Con Turnout 66.7 20.3
Grantham North West (6129)
vote share
Chapman E. Ms.* Con 1,715 45.8
Hurst F. Lab 1,203 32.1
James M. LD 825 22.0
2001: Con Turnout 61.1 13.7
Grantham South (6603)
vote share
Hurst J. Lab 1,546 41.6
Wilks J. Ind 1,129 30.3
Atkinson D. Con 1,045 28.1
2001: Lab Turnout 56.3 11.2
Hough (6956)
vote share
Farrar C. Con 3,360 67.5
Gadd J. Lab 1,616 32.5
2001: Con Turnout 71.5 35.0
Market & West Deeping (6342)
vote share
Robinson P.* Con 1,907 45.8
Howard R. Ind 977 23.4
O’Hare S. LD 921 22.1
Butterfield T. Ind 362 8.7
2001: Con Turnout 65.7 22.3
Stamford North (6511)
vote share
Sumner B. Con 1,398 37.1
Wood C.* Lab 1,301 34.5
Passeri M. Ms. LD 764 20.3
Woods A. Ind 305 8.1
2001: Lab Turnout 57.9 2.6
Stamford Rural (7058)
vote share
Trollope-Bellew T.* Con 2,406 49.7
Bisnauthsing D. LD 1,537 31.7
Loomes R. Lab 898 18.5
2001: Con Turnout 68.6 18.0
Stamford West (4724)
vote share
Helstrip C.* Con 1,486 47.2
Jalili M. Ms. LD 1,036 32.9
Hill R. Ms. Lab 624 19.8
2001: Con Turnout 66.6 14.3
Ancholme Cliff (5614)
vote share
Strange C.* Con 2,032 54.5
Heathorn A. LD 1,138 30.5
Coleman E. Ind 556 14.9
2001: Con Turnout 66.4 24.0
Bardney & Cherry Willingham (6625)
vote share
Fleetwood I.* Con 1,981 44.0
Miller S. LD 1,352 30.0
Tointon M. Ms. Lab 940 20.9
Pearson C. Ms. UKIP 230 5.1
2001: Con Turnout 68.0 14.0
Gainsborough Hill (5847)
vote share
Tinker M.* LD 1,255 43.6
Gray L. Ms. Lab 1,016 35.3
Summers J. Con 609 21.1
2001: LD Turnout 49.3 8.3
Gainsborough Rural South (8088)
vote share
Heath P. LD 2,945 54.5
Knight B.* Con 2,463 45.5
2001: Con Turnout 66.9 8.9
Gainsborough Trent (7256)
vote share
O’Connor P.* LD 1,868 50.3
Vaughan P. Lab 923 24.8
Parry W. Con 726 19.5
Simmonds G. UKIP 199 5.4
2001: LD Turnout 51.2 25.4
Market Rasen Wolds (5742)
vote share
Bridger K. LD 1,562 44.7
Theobald B.* Con 1,346 38.5
Semple J. UKIP 589 16.8
2001: Con Turnout 60.9 6.2
Nettleham & Saxilby (7558)
vote share
Sellars R.* LD 2,532 48.5
Davidson M. Ms. Con 1,760 33.7
Scott S. Ms. Lab 934 17.9
2001: LD Turnout 69.1 14.8
North Wolds (6584)
vote share
Turner A.* Con 2,230 50.9
Allen L. LD 1,243 28.4
Tierney M. Lab 904 20.7
2001: Con Turnout 66.5 22.5
Scotter Rural (5514)
vote share
Underwood-Frost C.* Con 1,844 52.4
Young T. LD 1,674 47.6
2001: Con Turnout 63.8 4.8
Welton Rural (8179)
vote share
Hiscox R. LD 3,239 56.5
Ireland C.* Con 2,495 43.5
2001: Con Turnout 70.1 13.0
Attleborough (8395)
vote share
Byrne A.* Con 2,332 45.3
Smith R. Lab 1,557 30.2
Yetton S. Ms. LD 1,262 24.5
Turnout 61.4 15.0
Dereham North (7299)
vote share
Gretton J.* Con 1,744 39.2
Crutch J. Lab 1,425 32.0
Markwell J. Ms. LD 749 16.8
Bowyer A. Ms. Green 281 6.3
Wilson D. UKIP 249 5.6
Turnout 60.9 7.2
Dereham South (7951)
vote share
Goreham R. Lab 1,964 40.9
Duigan P. Con 1,777 37.0
Blake M. LD 806 16.8
Birt T. Green 252 5.3
Turnout 60.4 3.9
Elmham & Mattishall (8755)
vote share
Floering
Blackman I. Ms.* Con 2,855 48.6
Smith J. Ms. Lab 1,524 25.9
Matthew S. Ms. LD 1,078 18.3
Bowyer D. Green 420 7.1
Turnout 67.1 22.6
Guiltcross (7911)
vote share
Baskerville J.* Con 2,677 49.1
Gordon S. LD 1,590 29.1
Hay J. Ms. Lab 1,189 21.8
Turnout 69.0 19.9
Necton & Launditch (8169)
vote share
Lloyd Owen C.* Con 2,440 42.1
Holland C. Lab 1,684 29.1
Blake H. Ms. LD 1,057 18.2
Keidan-Cooper A. Ms. Green 316 5.5
Fletcher S. UKIP 296 5.1
Turnout 70.9 13.1
Swaffham (7254)
vote share
Matthews S. Ms.* Con 2,018 44.1
Cannon D. LD 1,284 28.0
Armes S. Ms. Lab 1,072 23.4
Walker N. Green 204 4.5
Turnout 63.1 16.0
The Brecks (8552)
vote share
Monson I.* Con 2,997 53.2
Sully D. Lab 1,401 24.9
Rooke K. LD 1,238 22.0
Turnout 65.9 28.3
Thetford East (6679)
vote share
Armes C.* Lab 1,408 36.5
Chapman-Allen M. Ms. Con 1,382 35.8
Jeffrey D. LD 663 17.2
Harding J. Ind 407 10.5
Turnout 57.8 0.7
West Lindsey Norfolk
Breckland
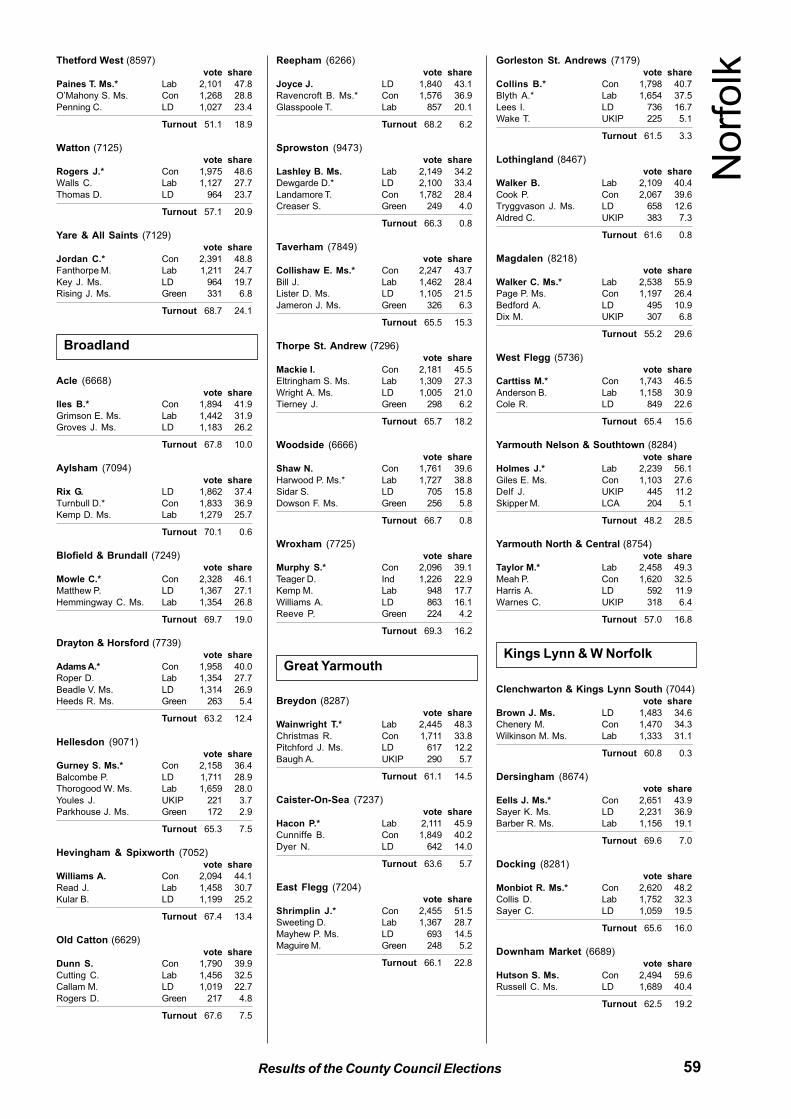
59Results of the County Council Elections
Thetford West (8597)
vote share
Paines T. Ms.* Lab 2,101 47.8
O’Mahony S. Ms. Con 1,268 28.8
Penning C. LD 1,027 23.4
Turnout 51.1 18.9
Watton (7125)
vote share
Rogers J.* Con 1,975 48.6
Walls C. Lab 1,127 27.7
Thomas D. LD 964 23.7
Turnout 57.1 20.9
Yare & All Saints (7129)
vote share
Jordan C.* Con 2,391 48.8
Fanthorpe M. Lab 1,211 24.7
Key J. Ms. LD 964 19.7
Rising J. Ms. Green 331 6.8
Turnout 68.7 24.1
Acle (6668)
vote share
Iles B.* Con 1,894 41.9
Grimson E. Ms. Lab 1,442 31.9
Groves J. Ms. LD 1,183 26.2
Turnout 67.8 10.0
Aylsham (7094)
vote share
Rix G. LD 1,862 37.4
Turnbull D.* Con 1,833 36.9
Kemp D. Ms. Lab 1,279 25.7
Turnout 70.1 0.6
Blofield & Brundall (7249)
vote share
Mowle C.* Con 2,328 46.1
Matthew P. LD 1,367 27.1
Hemmingway C. Ms. Lab 1,354 26.8
Turnout 69.7 19.0
Drayton & Horsford (7739)
vote share
Adams A.* Con 1,958 40.0
Roper D. Lab 1,354 27.7
Beadle V. Ms. LD 1,314 26.9
Heeds R. Ms. Green 263 5.4
Turnout 63.2 12.4
Hellesdon (9071)
vote share
Gurney S. Ms.* Con 2,158 36.4
Balcombe P. LD 1,711 28.9
Thorogood W. Ms. Lab 1,659 28.0
Youles J. UKIP 221 3.7
Parkhouse J. Ms. Green 172 2.9
Turnout 65.3 7.5
Hevingham & Spixworth (7052)
vote share
Williams A. Con 2,094 44.1
Read J. Lab 1,458 30.7
Kular B. LD 1,199 25.2
Turnout 67.4 13.4
Old Catton (6629)
vote share
Dunn S. Con 1,790 39.9
Cutting C. Lab 1,456 32.5
Callam M. LD 1,019 22.7
Rogers D. Green 217 4.8
Turnout 67.6 7.5
Reepham (6266)
vote share
Joyce J. LD 1,840 43.1
Ravencroft B. Ms.* Con 1,576 36.9
Glasspoole T. Lab 857 20.1
Turnout 68.2 6.2
Sprowston (9473)
vote share
Lashley B. Ms. Lab 2,149 34.2
Dewgarde D.* LD 2,100 33.4
Landamore T. Con 1,782 28.4
Creaser S. Green 249 4.0
Turnout 66.3 0.8
Taverham (7849)
vote share
Collishaw E. Ms.* Con 2,247 43.7
Bill J. Lab 1,462 28.4
Lister D. Ms. LD 1,105 21.5
Jameron J. Ms. Green 326 6.3
Turnout 65.5 15.3
Thorpe St. Andrew (7296)
vote share
Mackie I. Con 2,181 45.5
Eltringham S. Ms. Lab 1,309 27.3
Wright A. Ms. LD 1,005 21.0
Tierney J. Green 298 6.2
Turnout 65.7 18.2
Woodside (6666)
vote share
Shaw N. Con 1,761 39.6
Harwood P. Ms.* Lab 1,727 38.8
Sidar S. LD 705 15.8
Dowson F. Ms. Green 256 5.8
Turnout 66.7 0.8
Wroxham (7725)
vote share
Murphy S.* Con 2,096 39.1
Teager D. Ind 1,226 22.9
Kemp M. Lab 948 17.7
Williams A. LD 863 16.1
Reeve P. Green 224 4.2
Turnout 69.3 16.2
Breydon (8287)
vote share
Wainwright T.* Lab 2,445 48.3
Christmas R. Con 1,711 33.8
Pitchford J. Ms. LD 617 12.2
Baugh A. UKIP 290 5.7
Turnout 61.1 14.5
Caister-On-Sea (7237)
vote share
Hacon P.* Lab 2,111 45.9
Cunniffe B. Con 1,849 40.2
Dyer N. LD 642 14.0
Turnout 63.6 5.7
East Flegg (7204)
vote share
Shrimplin J.* Con 2,455 51.5
Sweeting D. Lab 1,367 28.7
Mayhew P. Ms. LD 693 14.5
Maguire M. Green 248 5.2
Turnout 66.1 22.8
Gorleston St. Andrews (7179)
vote share
Collins B.* Con 1,798 40.7
Blyth A.* Lab 1,654 37.5
Lees I. LD 736 16.7
Wake T. UKIP 225 5.1
Turnout 61.5 3.3
Lothingland (8467)
vote share
Walker B. Lab 2,109 40.4
Cook P. Con 2,067 39.6
Tryggvason J. Ms. LD 658 12.6
Aldred C. UKIP 383 7.3
Turnout 61.6 0.8
Magdalen (8218)
vote share
Walker C. Ms.* Lab 2,538 55.9
Page P. Ms. Con 1,197 26.4
Bedford A. LD 495 10.9
Dix M. UKIP 307 6.8
Turnout 55.2 29.6
West Flegg (5736)
vote share
Carttiss M.* Con 1,743 46.5
Anderson B. Lab 1,158 30.9
Cole R. LD 849 22.6
Turnout 65.4 15.6
Yarmouth Nelson & Southtown (8284)
vote share
Holmes J.* Lab 2,239 56.1
Giles E. Ms. Con 1,103 27.6
Delf J. UKIP 445 11.2
Skipper M. LCA 204 5.1
Turnout 48.2 28.5
Yarmouth North & Central (8754)
vote share
Taylor M.* Lab 2,458 49.3
Meah P. Con 1,620 32.5
Harris A. LD 592 11.9
Warnes C. UKIP 318 6.4
Turnout 57.0 16.8
Clenchwarton & Kings Lynn South (7044)
vote share
Brown J. Ms. LD 1,483 34.6
Chenery M. Con 1,470 34.3
Wilkinson M. Ms. Lab 1,333 31.1
Turnout 60.8 0.3
Dersingham (8674)
vote share
Eells J. Ms.* Con 2,651 43.9
Sayer K. Ms. LD 2,231 36.9
Barber R. Ms. Lab 1,156 19.1
Turnout 69.6 7.0
Docking (8281)
vote share
Monbiot R. Ms.* Con 2,620 48.2
Collis D. Lab 1,752 32.3
Sayer C. LD 1,059 19.5
Turnout 65.6 16.0
Downham Market (6689)
vote share
Hutson S. Ms. Con 2,494 59.6
Russell C. Ms. LD 1,689 40.4
Turnout 62.5 19.2
Norf
olk
Broadland
Great YarmouthKings Lynn & W Norfolk
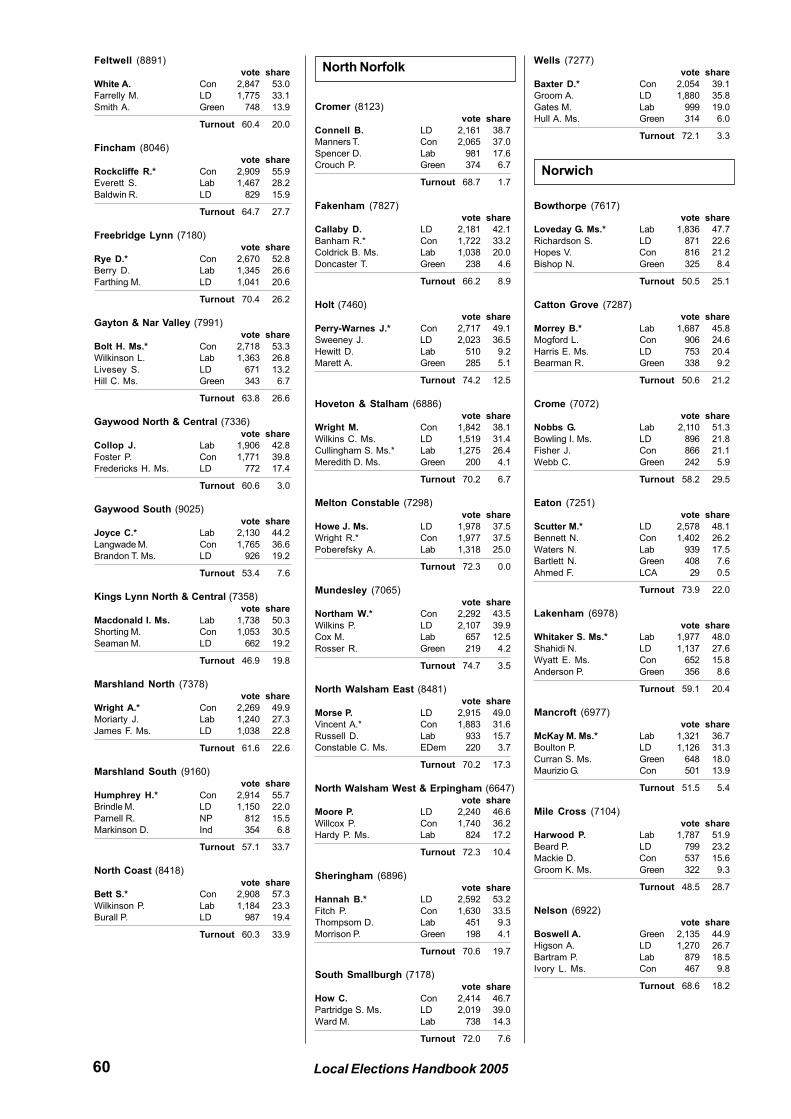
60 Local Elections Handbook 2005
Feltwell (8891)
vote share
White A. Con 2,847 53.0
Farrelly M. LD 1,775 33.1
Smith A. Green 748 13.9
Turnout 60.4 20.0
Fincham (8046)
vote share
Rockcliffe R.* Con 2,909 55.9
Everett S. Lab 1,467 28.2
Baldwin R. LD 829 15.9
Turnout 64.7 27.7
Freebridge Lynn (7180)
vote share
Rye D.* Con 2,670 52.8
Berry D. Lab 1,345 26.6
Farthing M. LD 1,041 20.6
Turnout 70.4 26.2
Gayton & Nar Valley (7991)
vote share
Bolt H. Ms.* Con 2,718 53.3
Wilkinson L. Lab 1,363 26.8
Livesey S. LD 671 13.2
Hill C. Ms. Green 343 6.7
Turnout 63.8 26.6
Gaywood North & Central (7336)
vote share
Collop J. Lab 1,906 42.8
Foster P. Con 1,771 39.8
Fredericks H. Ms. LD 772 17.4
Turnout 60.6 3.0
Gaywood South (9025)
vote share
Joyce C.* Lab 2,130 44.2
Langwade M. Con 1,765 36.6
Brandon T. Ms. LD 926 19.2
Turnout 53.4 7.6
Kings Lynn North & Central (7358)
vote share
Macdonald I. Ms. Lab 1,738 50.3
Shorting M. Con 1,053 30.5
Seaman M. LD 662 19.2
Turnout 46.9 19.8
Marshland North (7378)
vote share
Wright A.* Con 2,269 49.9
Moriarty J. Lab 1,240 27.3
James F. Ms. LD 1,038 22.8
Turnout 61.6 22.6
Marshland South (9160)
vote share
Humphrey H.* Con 2,914 55.7
Brindle M. LD 1,150 22.0
Parnell R. NP 812 15.5
Markinson D. Ind 354 6.8
Turnout 57.1 33.7
North Coast (8418)
vote share
Bett S.* Con 2,908 57.3
Wilkinson P. Lab 1,184 23.3
Burall P. LD 987 19.4
Turnout 60.3 33.9
Cromer (8123)
vote share
Connell B. LD 2,161 38.7
Manners T. Con 2,065 37.0
Spencer D. Lab 981 17.6
Crouch P. Green 374 6.7
Turnout 68.7 1.7
Fakenham (7827)
vote share
Callaby D. LD 2,181 42.1
Banham R.* Con 1,722 33.2
Coldrick B. Ms. Lab 1,038 20.0
Doncaster T. Green 238 4.6
Turnout 66.2 8.9
Holt (7460)
vote share
Perry-Warnes J.* Con 2,717 49.1
Sweeney J. LD 2,023 36.5
Hewitt D. Lab 510 9.2
Marett A. Green 285 5.1
Turnout 74.2 12.5
Hoveton & Stalham (6886)
vote share
Wright M. Con 1,842 38.1
Wilkins C. Ms. LD 1,519 31.4
Cullingham S. Ms.* Lab 1,275 26.4
Meredith D. Ms. Green 200 4.1
Turnout 70.2 6.7
Melton Constable (7298)
vote share
Howe J. Ms. LD 1,978 37.5
Wright R.* Con 1,977 37.5
Poberefsky A. Lab 1,318 25.0
Turnout 72.3 0.0
Mundesley (7065)
vote share
Northam W.* Con 2,292 43.5
Wilkins P. LD 2,107 39.9
Cox M. Lab 657 12.5
Rosser R. Green 219 4.2
Turnout 74.7 3.5
North Walsham East (8481)
vote share
Morse P. LD 2,915 49.0
Vincent A.* Con 1,883 31.6
Russell D. Lab 933 15.7
Constable C. Ms. EDem 220 3.7
Turnout 70.2 17.3
North Walsham West & Erpingham (6647)
vote share
Moore P. LD 2,240 46.6
Willcox P. Con 1,740 36.2
Hardy P. Ms. Lab 824 17.2
Turnout 72.3 10.4
Sheringham (6896)
vote share
Hannah B.* LD 2,592 53.2
Fitch P. Con 1,630 33.5
Thompsom D. Lab 451 9.3
Morrison P. Green 198 4.1
Turnout 70.6 19.7
South Smallburgh (7178)
vote share
How C. Con 2,414 46.7
Partridge S. Ms. LD 2,019 39.0
Ward M. Lab 738 14.3
Turnout 72.0 7.6
Wells (7277)
vote share
Baxter D.* Con 2,054 39.1
Groom A. LD 1,880 35.8
Gates M. Lab 999 19.0
Hull A. Ms. Green 314 6.0
Turnout 72.1 3.3
Bowthorpe (7617)
vote share
Loveday G. Ms.* Lab 1,836 47.7
Richardson S. LD 871 22.6
Hopes V. Con 816 21.2
Bishop N. Green 325 8.4
Turnout 50.5 25.1
Catton Grove (7287)
vote share
Morrey B.* Lab 1,687 45.8
Mogford L. Con 906 24.6
Harris E. Ms. LD 753 20.4
Bearman R. Green 338 9.2
Turnout 50.6 21.2
Crome (7072)
vote share
Nobbs G. Lab 2,110 51.3
Bowling I. Ms. LD 896 21.8
Fisher J. Con 866 21.1
Webb C. Green 242 5.9
Turnout 58.2 29.5
Eaton (7251)
vote share
Scutter M.* LD 2,578 48.1
Bennett N. Con 1,402 26.2
Waters N. Lab 939 17.5
Bartlett N. Green 408 7.6
Ahmed F. LCA 29 0.5
Turnout 73.9 22.0
Lakenham (6978)
vote share
Whitaker S. Ms.* Lab 1,977 48.0
Shahidi N. LD 1,137 27.6
Wyatt E. Ms. Con 652 15.8
Anderson P. Green 356 8.6
Turnout 59.1 20.4
Mancroft (6977)
vote share
McKay M. Ms.* Lab 1,321 36.7
Boulton P. LD 1,126 31.3
Curran S. Ms. Green 648 18.0
Maurizio G. Con 501 13.9
Turnout 51.5 5.4
Mile Cross (7104)
vote share
Harwood P. Lab 1,787 51.9
Beard P. LD 799 23.2
Mackie D. Con 537 15.6
Groom K. Ms. Green 322 9.3
Turnout 48.5 28.7
Nelson (6922)
vote share
Boswell A. Green 2,135 44.9
Higson A. LD 1,270 26.7
Bartram P. Lab 879 18.5
Ivory L. Ms. Con 467 9.8
Turnout 68.6 18.2
North Norfolk
Norwich
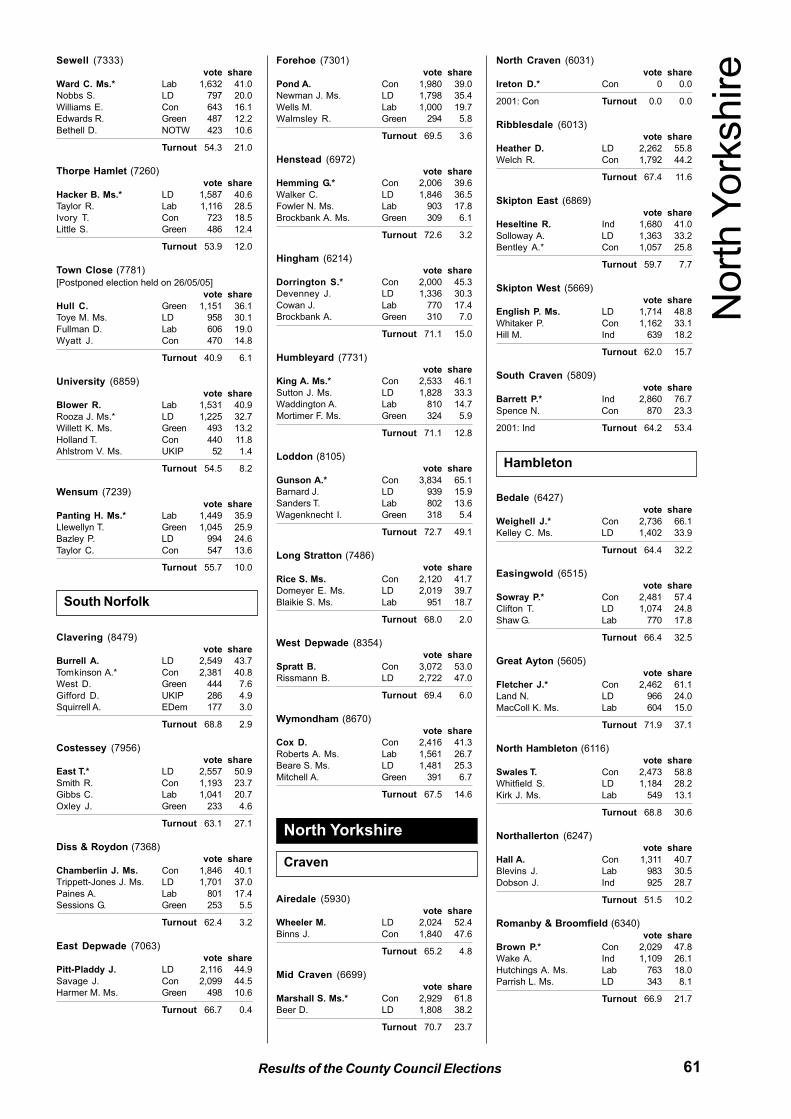
61Results of the County Council Elections
Sewell (7333)
vote share
Ward C. Ms.* Lab 1,632 41.0
Nobbs S. LD 797 20.0
Williams E. Con 643 16.1
Edwards R. Green 487 12.2
Bethell D. NOTW 423 10.6
Turnout 54.3 21.0
Thorpe Hamlet (7260)
vote share
Hacker B. Ms.* LD 1,587 40.6
Taylor R. Lab 1,116 28.5
Ivory T. Con 723 18.5
Little S. Green 486 12.4
Turnout 53.9 12.0
Town Close (7781)
[Postponed election held on 26/05/05]
vote share
Hull C. Green 1,151 36.1
Toye M. Ms. LD 958 30.1
Fullman D. Lab 606 19.0
Wyatt J. Con 470 14.8
Turnout 40.9 6.1
University (6859)
vote share
Blower R. Lab 1,531 40.9
Rooza J. Ms.* LD 1,225 32.7
Willett K. Ms. Green 493 13.2
Holland T. Con 440 11.8
Ahlstrom V. Ms. UKIP 52 1.4
Turnout 54.5 8.2
Wensum (7239)
vote share
Panting H. Ms.* Lab 1,449 35.9
Llewellyn T. Green 1,045 25.9
Bazley P. LD 994 24.6
Taylor C. Con 547 13.6
Turnout 55.7 10.0
Clavering (8479)
vote share
Burrell A. LD 2,549 43.7
Tomkinson A.* Con 2,381 40.8
West D. Green 444 7.6
Gifford D. UKIP 286 4.9
Squirrell A. EDem 177 3.0
Turnout 68.8 2.9
Costessey (7956)
vote share
East T.* LD 2,557 50.9
Smith R. Con 1,193 23.7
Gibbs C. Lab 1,041 20.7
Oxley J. Green 233 4.6
Turnout 63.1 27.1
Diss & Roydon (7368)
vote share
Chamberlin J. Ms. Con 1,846 40.1
Trippett-Jones J. Ms. LD 1,701 37.0
Paines A. Lab 801 17.4
Sessions G. Green 253 5.5
Turnout 62.4 3.2
East Depwade (7063)
vote share
Pitt-Pladdy J. LD 2,116 44.9
Savage J. Con 2,099 44.5
Harmer M. Ms. Green 498 10.6
Turnout 66.7 0.4
Forehoe (7301)
vote share
Pond A. Con 1,980 39.0
Newman J. Ms. LD 1,798 35.4
Wells M. Lab 1,000 19.7
Walmsley R. Green 294 5.8
Turnout 69.5 3.6
Henstead (6972)
vote share
Hemming G.* Con 2,006 39.6
Walker C. LD 1,846 36.5
Fowler N. Ms. Lab 903 17.8
Brockbank A. Ms. Green 309 6.1
Turnout 72.6 3.2
Hingham (6214)
vote share
Dorrington S.* Con 2,000 45.3
Devenney J. LD 1,336 30.3
Cowan J. Lab 770 17.4
Brockbank A. Green 310 7.0
Turnout 71.1 15.0
Humbleyard (7731)
vote share
King A. Ms.* Con 2,533 46.1
Sutton J. Ms. LD 1,828 33.3
Waddington A. Lab 810 14.7
Mortimer F. Ms. Green 324 5.9
Turnout 71.1 12.8
Loddon (8105)
vote share
Gunson A.* Con 3,834 65.1
Barnard J. LD 939 15.9
Sanders T. Lab 802 13.6
Wagenknecht I. Green 318 5.4
Turnout 72.7 49.1
Long Stratton (7486)
vote share
Rice S. Ms. Con 2,120 41.7
Domeyer E. Ms. LD 2,019 39.7
Blaikie S. Ms. Lab 951 18.7
Turnout 68.0 2.0
West Depwade (8354)
vote share
Spratt B. Con 3,072 53.0
Rissmann B. LD 2,722 47.0
Turnout 69.4 6.0
Wymondham (8670)
vote share
Cox D. Con 2,416 41.3
Roberts A. Ms. Lab 1,561 26.7
Beare S. Ms. LD 1,481 25.3
Mitchell A. Green 391 6.7
Turnout 67.5 14.6
Airedale (5930)
vote share
Wheeler M. LD 2,024 52.4
Binns J. Con 1,840 47.6
Turnout 65.2 4.8
Mid Craven (6699)
vote share
Marshall S. Ms.* Con 2,929 61.8
Beer D. LD 1,808 38.2
Turnout 70.7 23.7
North Craven (6031)
vote share
Ireton D.* Con 0 0.0
2001: Con Turnout 0.0 0.0
Ribblesdale (6013)
vote share
Heather D. LD 2,262 55.8
Welch R. Con 1,792 44.2
Turnout 67.4 11.6
Skipton East (6869)
vote share
Heseltine R. Ind 1,680 41.0
Solloway A. LD 1,363 33.2
Bentley A.* Con 1,057 25.8
Turnout 59.7 7.7
Skipton West (5669)
vote share
English P. Ms. LD 1,714 48.8
Whitaker P. Con 1,162 33.1
Hill M. Ind 639 18.2
Turnout 62.0 15.7
South Craven (5809)
vote share
Barrett P.* Ind 2,860 76.7
Spence N. Con 870 23.3
2001: Ind Turnout 64.2 53.4
Bedale (6427)
vote share
Weighell J.* Con 2,736 66.1
Kelley C. Ms. LD 1,402 33.9
Turnout 64.4 32.2
Easingwold (6515)
vote share
Sowray P.* Con 2,481 57.4
Clifton T. LD 1,074 24.8
Shaw G. Lab 770 17.8
Turnout 66.4 32.5
Great Ayton (5605)
vote share
Fletcher J.* Con 2,462 61.1
Land N. LD 966 24.0
MacColl K. Ms. Lab 604 15.0
Turnout 71.9 37.1
North Hambleton (6116)
vote share
Swales T. Con 2,473 58.8
Whitfield S. LD 1,184 28.2
Kirk J. Ms. Lab 549 13.1
Turnout 68.8 30.6
Northallerton (6247)
vote share
Hall A. Con 1,311 40.7
Blevins J. Lab 983 30.5
Dobson J. Ind 925 28.7
Turnout 51.5 10.2
Romanby & Broomfield (6340)
vote share
Brown P.* Con 2,029 47.8
Wake A. Ind 1,109 26.1
Hutchings A. Ms. Lab 763 18.0
Parrish L. Ms. LD 343 8.1
Turnout 66.9 21.7
South Norfolk
North Yorkshire
Craven
Hambleton
Nort
h Y
ork
shire
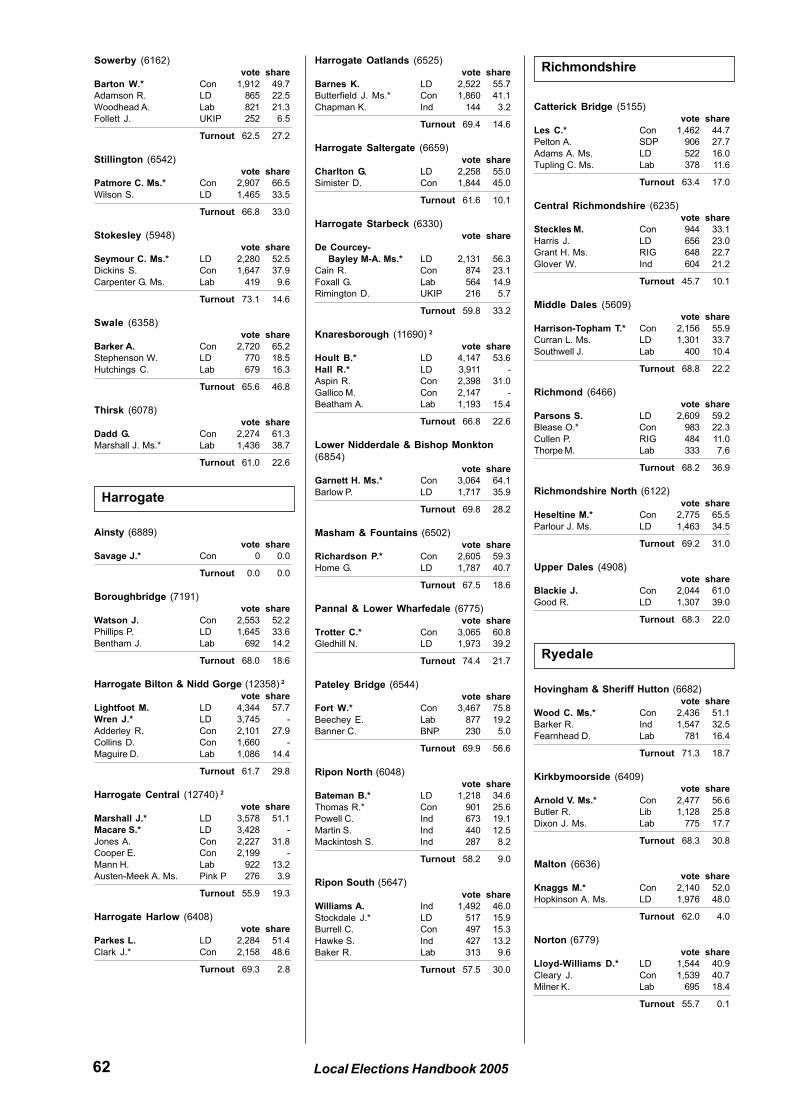
62 Local Elections Handbook 2005
Sowerby (6162)
vote share
Barton W.* Con 1,912 49.7
Adamson R. LD 865 22.5
Woodhead A. Lab 821 21.3
Follett J. UKIP 252 6.5
Turnout 62.5 27.2
Stillington (6542)
vote share
Patmore C. Ms.* Con 2,907 66.5
Wilson S. LD 1,465 33.5
Turnout 66.8 33.0
Stokesley (5948)
vote share
Seymour C. Ms.* LD 2,280 52.5
Dickins S. Con 1,647 37.9
Carpenter G. Ms. Lab 419 9.6
Turnout 73.1 14.6
Swale (6358)
vote share
Barker A. Con 2,720 65.2
Stephenson W. LD 770 18.5
Hutchings C. Lab 679 16.3
Turnout 65.6 46.8
Thirsk (6078)
vote share
Dadd G. Con 2,274 61.3
Marshall J. Ms.* Lab 1,436 38.7
Turnout 61.0 22.6
Ainsty (6889)
vote share
Savage J.* Con 0 0.0
Turnout 0.0 0.0
Boroughbridge (7191)
vote share
Watson J. Con 2,553 52.2
Phillips P. LD 1,645 33.6
Bentham J. Lab 692 14.2
Turnout 68.0 18.6
Harrogate Bilton & Nidd Gorge (12358) 2
vote share
Lightfoot M. LD 4,344 57.7
Wren J.* LD 3,745 -
Adderley R. Con 2,101 27.9
Collins D. Con 1,660 -
Maguire D. Lab 1,086 14.4
Turnout 61.7 29.8
Harrogate Central (12740) 2
vote share
Marshall J.* LD 3,578 51.1
Macare S.* LD 3,428 -
Jones A. Con 2,227 31.8
Cooper E. Con 2,199 -
Mann H. Lab 922 13.2
Austen-Meek A. Ms. Pink P 276 3.9
Turnout 55.9 19.3
Harrogate Harlow (6408)
vote share
Parkes L. LD 2,284 51.4
Clark J.* Con 2,158 48.6
Turnout 69.3 2.8
Harrogate Oatlands (6525)
vote share
Barnes K. LD 2,522 55.7
Butterfield J. Ms.* Con 1,860 41.1
Chapman K. Ind 144 3.2
Turnout 69.4 14.6
Harrogate Saltergate (6659)
vote share
Charlton G. LD 2,258 55.0
Simister D. Con 1,844 45.0
Turnout 61.6 10.1
Harrogate Starbeck (6330)
vote share
De Courcey-
Bayley M-A. Ms.* LD 2,131 56.3
Cain R. Con 874 23.1
Foxall G. Lab 564 14.9
Rimington D. UKIP 216 5.7
Turnout 59.8 33.2
Knaresborough (11690) 2
vote share
Hoult B.* LD 4,147 53.6
Hall R.* LD 3,911 -
Aspin R. Con 2,398 31.0
Gallico M. Con 2,147 -
Beatham A. Lab 1,193 15.4
Turnout 66.8 22.6
Lower Nidderdale & Bishop Monkton
(6854)
vote share
Garnett H. Ms.* Con 3,064 64.1
Barlow P. LD 1,717 35.9
Turnout 69.8 28.2
Masham & Fountains (6502)
vote share
Richardson P.* Con 2,605 59.3
Home G. LD 1,787 40.7
Turnout 67.5 18.6
Pannal & Lower Wharfedale (6775)
vote share
Trotter C.* Con 3,065 60.8
Gledhill N. LD 1,973 39.2
Turnout 74.4 21.7
Pateley Bridge (6544)
vote share
Fort W.* Con 3,467 75.8
Beechey E. Lab 877 19.2
Banner C. BNP 230 5.0
Turnout 69.9 56.6
Ripon North (6048)
vote share
Bateman B.* LD 1,218 34.6
Thomas R.* Con 901 25.6
Powell C. Ind 673 19.1
Martin S. Ind 440 12.5
Mackintosh S. Ind 287 8.2
Turnout 58.2 9.0
Ripon South (5647)
vote share
Williams A. Ind 1,492 46.0
Stockdale J.* LD 517 15.9
Burrell C. Con 497 15.3
Hawke S. Ind 427 13.2
Baker R. Lab 313 9.6
Turnout 57.5 30.0
Catterick Bridge (5155)
vote share
Les C.* Con 1,462 44.7
Pelton A. SDP 906 27.7
Adams A. Ms. LD 522 16.0
Tupling C. Ms. Lab 378 11.6
Turnout 63.4 17.0
Central Richmondshire (6235)
vote share
Steckles M. Con 944 33.1
Harris J. LD 656 23.0
Grant H. Ms. RIG 648 22.7
Glover W. Ind 604 21.2
Turnout 45.7 10.1
Middle Dales (5609)
vote share
Harrison-Topham T.* Con 2,156 55.9
Curran L. Ms. LD 1,301 33.7
Southwell J. Lab 400 10.4
Turnout 68.8 22.2
Richmond (6466)
vote share
Parsons S. LD 2,609 59.2
Blease O.* Con 983 22.3
Cullen P. RIG 484 11.0
Thorpe M. Lab 333 7.6
Turnout 68.2 36.9
Richmondshire North (6122)
vote share
Heseltine M.* Con 2,775 65.5
Parlour J. Ms. LD 1,463 34.5
Turnout 69.2 31.0
Upper Dales (4908)
vote share
Blackie J. Con 2,044 61.0
Good R. LD 1,307 39.0
Turnout 68.3 22.0
Hovingham & Sheriff Hutton (6682)
vote share
Wood C. Ms.* Con 2,436 51.1
Barker R. Ind 1,547 32.5
Fearnhead D. Lab 781 16.4
Turnout 71.3 18.7
Kirkbymoorside (6409)
vote share
Arnold V. Ms.* Con 2,477 56.6
Butler R. Lib 1,128 25.8
Dixon J. Ms. Lab 775 17.7
Turnout 68.3 30.8
Malton (6636)
vote share
Knaggs M.* Con 2,140 52.0
Hopkinson A. Ms. LD 1,976 48.0
Turnout 62.0 4.0
Norton (6779)
vote share
Lloyd-Williams D.* LD 1,544 40.9
Cleary J. Con 1,539 40.7
Milner K. Lab 695 18.4
Turnout 55.7 0.1
Harrogate
Richmondshire
Ryedale
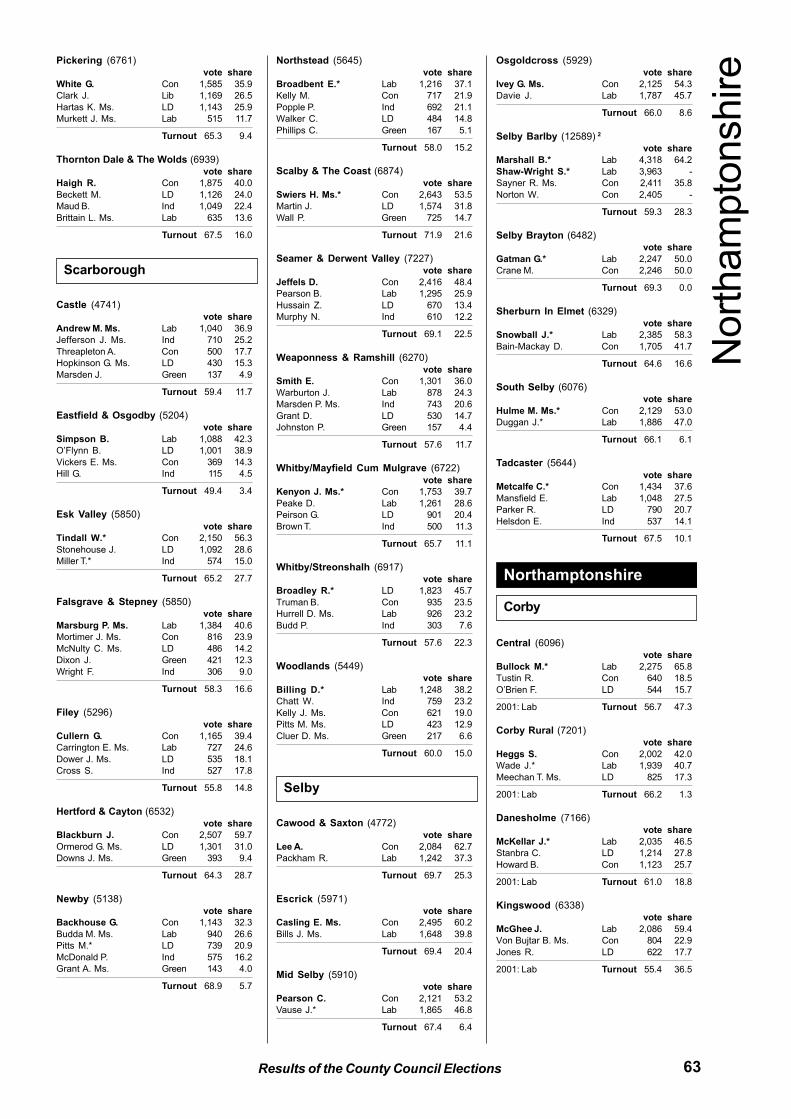
63Results of the County Council Elections
Pickering (6761)
vote share
White G. Con 1,585 35.9
Clark J. Lib 1,169 26.5
Hartas K. Ms. LD 1,143 25.9
Murkett J. Ms. Lab 515 11.7
Turnout 65.3 9.4
Thornton Dale & The Wolds (6939)
vote share
Haigh R. Con 1,875 40.0
Beckett M. LD 1,126 24.0
Maud B. Ind 1,049 22.4
Brittain L. Ms. Lab 635 13.6
Turnout 67.5 16.0
Castle (4741)
vote share
Andrew M. Ms. Lab 1,040 36.9
Jefferson J. Ms. Ind 710 25.2
Threapleton A. Con 500 17.7
Hopkinson G. Ms. LD 430 15.3
Marsden J. Green 137 4.9
Turnout 59.4 11.7
Eastfield & Osgodby (5204)
vote share
Simpson B. Lab 1,088 42.3
O’Flynn B. LD 1,001 38.9
Vickers E. Ms. Con 369 14.3
Hill G. Ind 115 4.5
Turnout 49.4 3.4
Esk Valley (5850)
vote share
Tindall W.* Con 2,150 56.3
Stonehouse J. LD 1,092 28.6
Miller T.* Ind 574 15.0
Turnout 65.2 27.7
Falsgrave & Stepney (5850)
vote share
Marsburg P. Ms. Lab 1,384 40.6
Mortimer J. Ms. Con 816 23.9
McNulty C. Ms. LD 486 14.2
Dixon J. Green 421 12.3
Wright F. Ind 306 9.0
Turnout 58.3 16.6
Filey (5296)
vote share
Cullern G. Con 1,165 39.4
Carrington E. Ms. Lab 727 24.6
Dower J. Ms. LD 535 18.1
Cross S. Ind 527 17.8
Turnout 55.8 14.8
Hertford & Cayton (6532)
vote share
Blackburn J. Con 2,507 59.7
Ormerod G. Ms. LD 1,301 31.0
Downs J. Ms. Green 393 9.4
Turnout 64.3 28.7
Newby (5138)
vote share
Backhouse G. Con 1,143 32.3
Budda M. Ms. Lab 940 26.6
Pitts M.* LD 739 20.9
McDonald P. Ind 575 16.2
Grant A. Ms. Green 143 4.0
Turnout 68.9 5.7
Northstead (5645)
vote share
Broadbent E.* Lab 1,216 37.1
Kelly M. Con 717 21.9
Popple P. Ind 692 21.1
Walker C. LD 484 14.8
Phillips C. Green 167 5.1
Turnout 58.0 15.2
Scalby & The Coast (6874)
vote share
Swiers H. Ms.* Con 2,643 53.5
Martin J. LD 1,574 31.8
Wall P. Green 725 14.7
Turnout 71.9 21.6
Seamer & Derwent Valley (7227)
vote share
Jeffels D. Con 2,416 48.4
Pearson B. Lab 1,295 25.9
Hussain Z. LD 670 13.4
Murphy N. Ind 610 12.2
Turnout 69.1 22.5
Weaponness & Ramshill (6270)
vote share
Smith E. Con 1,301 36.0
Warburton J. Lab 878 24.3
Marsden P. Ms. Ind 743 20.6
Grant D. LD 530 14.7
Johnston P. Green 157 4.4
Turnout 57.6 11.7
Whitby/Mayfield Cum Mulgrave (6722)
vote share
Kenyon J. Ms.* Con 1,753 39.7
Peake D. Lab 1,261 28.6
Peirson G. LD 901 20.4
Brown T. Ind 500 11.3
Turnout 65.7 11.1
Whitby/Streonshalh (6917)
vote share
Broadley R.* LD 1,823 45.7
Truman B. Con 935 23.5
Hurrell D. Ms. Lab 926 23.2
Budd P. Ind 303 7.6
Turnout 57.6 22.3
Woodlands (5449)
vote share
Billing D.* Lab 1,248 38.2
Chatt W. Ind 759 23.2
Kelly J. Ms. Con 621 19.0
Pitts M. Ms. LD 423 12.9
Cluer D. Ms. Green 217 6.6
Turnout 60.0 15.0
Cawood & Saxton (4772)
vote share
Lee A. Con 2,084 62.7
Packham R. Lab 1,242 37.3
Turnout 69.7 25.3
Escrick (5971)
vote share
Casling E. Ms. Con 2,495 60.2
Bills J. Ms. Lab 1,648 39.8
Turnout 69.4 20.4
Mid Selby (5910)
vote share
Pearson C. Con 2,121 53.2
Vause J.* Lab 1,865 46.8
Turnout 67.4 6.4
Osgoldcross (5929)
vote share
Ivey G. Ms. Con 2,125 54.3
Davie J. Lab 1,787 45.7
Turnout 66.0 8.6
Selby Barlby (12589) 2
vote share
Marshall B.* Lab 4,318 64.2
Shaw-Wright S.* Lab 3,963 -
Sayner R. Ms. Con 2,411 35.8
Norton W. Con 2,405 -
Turnout 59.3 28.3
Selby Brayton (6482)
vote share
Gatman G.* Lab 2,247 50.0
Crane M. Con 2,246 50.0
Turnout 69.3 0.0
Sherburn In Elmet (6329)
vote share
Snowball J.* Lab 2,385 58.3
Bain-Mackay D. Con 1,705 41.7
Turnout 64.6 16.6
South Selby (6076)
vote share
Hulme M. Ms.* Con 2,129 53.0
Duggan J.* Lab 1,886 47.0
Turnout 66.1 6.1
Tadcaster (5644)
vote share
Metcalfe C.* Con 1,434 37.6
Mansfield E. Lab 1,048 27.5
Parker R. LD 790 20.7
Helsdon E. Ind 537 14.1
Turnout 67.5 10.1
Central (6096)
vote share
Bullock M.* Lab 2,275 65.8
Tustin R. Con 640 18.5
O’Brien F. LD 544 15.7
2001: Lab Turnout 56.7 47.3
Corby Rural (7201)
vote share
Heggs S. Con 2,002 42.0
Wade J.* Lab 1,939 40.7
Meechan T. Ms. LD 825 17.3
2001: Lab Turnout 66.2 1.3
Danesholme (7166)
vote share
McKellar J.* Lab 2,035 46.5
Stanbra C. LD 1,214 27.8
Howard B. Con 1,123 25.7
2001: Lab Turnout 61.0 18.8
Kingswood (6338)
vote share
McGhee J. Lab 2,086 59.4
Von Bujtar B. Ms. Con 804 22.9
Jones R. LD 622 17.7
2001: Lab Turnout 55.4 36.5
Scarborough
Selby
Nort
ham
pto
nshire
Northamptonshire
Corby
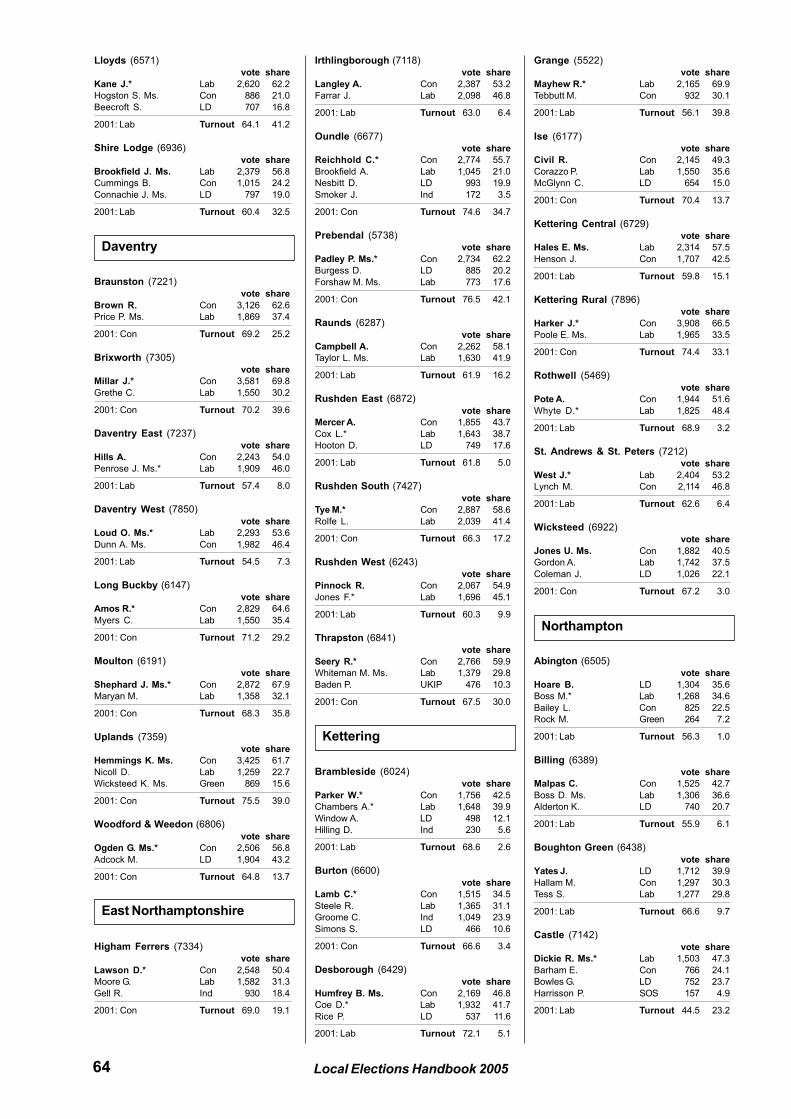
64 Local Elections Handbook 2005
Lloyds (6571)
vote share
Kane J.* Lab 2,620 62.2
Hogston S. Ms. Con 886 21.0
Beecroft S. LD 707 16.8
2001: Lab Turnout 64.1 41.2
Shire Lodge (6936)
vote share
Brookfield J. Ms. Lab 2,379 56.8
Cummings B. Con 1,015 24.2
Connachie J. Ms. LD 797 19.0
2001: Lab Turnout 60.4 32.5
Braunston (7221)
vote share
Brown R. Con 3,126 62.6
Price P. Ms. Lab 1,869 37.4
2001: Con Turnout 69.2 25.2
Brixworth (7305)
vote share
Millar J.* Con 3,581 69.8
Grethe C. Lab 1,550 30.2
2001: Con Turnout 70.2 39.6
Daventry East (7237)
vote share
Hills A. Con 2,243 54.0
Penrose J. Ms.* Lab 1,909 46.0
2001: Lab Turnout 57.4 8.0
Daventry West (7850)
vote share
Loud O. Ms.* Lab 2,293 53.6
Dunn A. Ms. Con 1,982 46.4
2001: Lab Turnout 54.5 7.3
Long Buckby (6147)
vote share
Amos R.* Con 2,829 64.6
Myers C. Lab 1,550 35.4
2001: Con Turnout 71.2 29.2
Moulton (6191)
vote share
Shephard J. Ms.* Con 2,872 67.9
Maryan M. Lab 1,358 32.1
2001: Con Turnout 68.3 35.8
Uplands (7359)
vote share
Hemmings K. Ms. Con 3,425 61.7
Nicoll D. Lab 1,259 22.7
Wicksteed K. Ms. Green 869 15.6
2001: Con Turnout 75.5 39.0
Woodford & Weedon (6806)
vote share
Ogden G. Ms.* Con 2,506 56.8
Adcock M. LD 1,904 43.2
2001: Con Turnout 64.8 13.7
Higham Ferrers (7334)
vote share
Lawson D.* Con 2,548 50.4
Moore G. Lab 1,582 31.3
Gell R. Ind 930 18.4
2001: Con Turnout 69.0 19.1
Irthlingborough (7118)
vote share
Langley A. Con 2,387 53.2
Farrar J. Lab 2,098 46.8
2001: Lab Turnout 63.0 6.4
Oundle (6677)
vote share
Reichhold C.* Con 2,774 55.7
Brookfield A. Lab 1,045 21.0
Nesbitt D. LD 993 19.9
Smoker J. Ind 172 3.5
2001: Con Turnout 74.6 34.7
Prebendal (5738)
vote share
Padley P. Ms.* Con 2,734 62.2
Burgess D. LD 885 20.2
Forshaw M. Ms. Lab 773 17.6
2001: Con Turnout 76.5 42.1
Raunds (6287)
vote share
Campbell A. Con 2,262 58.1
Taylor L. Ms. Lab 1,630 41.9
2001: Lab Turnout 61.9 16.2
Rushden East (6872)
vote share
Mercer A. Con 1,855 43.7
Cox L.* Lab 1,643 38.7
Hooton D. LD 749 17.6
2001: Lab Turnout 61.8 5.0
Rushden South (7427)
vote share
Tye M.* Con 2,887 58.6
Rolfe L. Lab 2,039 41.4
2001: Con Turnout 66.3 17.2
Rushden West (6243)
vote share
Pinnock R. Con 2,067 54.9
Jones F.* Lab 1,696 45.1
2001: Lab Turnout 60.3 9.9
Thrapston (6841)
vote share
Seery R.* Con 2,766 59.9
Whiteman M. Ms. Lab 1,379 29.8
Baden P. UKIP 476 10.3
2001: Con Turnout 67.5 30.0
Brambleside (6024)
vote share
Parker W.* Con 1,756 42.5
Chambers A.* Lab 1,648 39.9
Window A. LD 498 12.1
Hilling D. Ind 230 5.6
2001: Lab Turnout 68.6 2.6
Burton (6600)
vote share
Lamb C.* Con 1,515 34.5
Steele R. Lab 1,365 31.1
Groome C. Ind 1,049 23.9
Simons S. LD 466 10.6
2001: Con Turnout 66.6 3.4
Desborough (6429)
vote share
Humfrey B. Ms. Con 2,169 46.8
Coe D.* Lab 1,932 41.7
Rice P. LD 537 11.6
2001: Lab Turnout 72.1 5.1
Grange (5522)
vote share
Mayhew R.* Lab 2,165 69.9
Tebbutt M. Con 932 30.1
2001: Lab Turnout 56.1 39.8
Ise (6177)
vote share
Civil R. Con 2,145 49.3
Corazzo P. Lab 1,550 35.6
McGlynn C. LD 654 15.0
2001: Con Turnout 70.4 13.7
Kettering Central (6729)
vote share
Hales E. Ms. Lab 2,314 57.5
Henson J. Con 1,707 42.5
2001: Lab Turnout 59.8 15.1
Kettering Rural (7896)
vote share
Harker J.* Con 3,908 66.5
Poole E. Ms. Lab 1,965 33.5
2001: Con Turnout 74.4 33.1
Rothwell (5469)
vote share
Pote A. Con 1,944 51.6
Whyte D.* Lab 1,825 48.4
2001: Lab Turnout 68.9 3.2
St. Andrews & St. Peters (7212)
vote share
West J.* Lab 2,404 53.2
Lynch M. Con 2,114 46.8
2001: Lab Turnout 62.6 6.4
Wicksteed (6922)
vote share
Jones U. Ms. Con 1,882 40.5
Gordon A. Lab 1,742 37.5
Coleman J. LD 1,026 22.1
2001: Con Turnout 67.2 3.0
Abington (6505)
vote share
Hoare B. LD 1,304 35.6
Boss M.* Lab 1,268 34.6
Bailey L. Con 825 22.5
Rock M. Green 264 7.2
2001: Lab Turnout 56.3 1.0
Billing (6389)
vote share
Malpas C. Con 1,525 42.7
Boss D. Ms. Lab 1,306 36.6
Alderton K. LD 740 20.7
2001: Lab Turnout 55.9 6.1
Boughton Green (6438)
vote share
Yates J. LD 1,712 39.9
Hallam M. Con 1,297 30.3
Tess S. Lab 1,277 29.8
2001: Lab Turnout 66.6 9.7
Castle (7142)
vote share
Dickie R. Ms.* Lab 1,503 47.3
Barham E. Con 766 24.1
Bowles G. LD 752 23.7
Harrisson P. SOS 157 4.9
2001: Lab Turnout 44.5 23.2
Daventry
East Northamptonshire
Kettering
Northampton
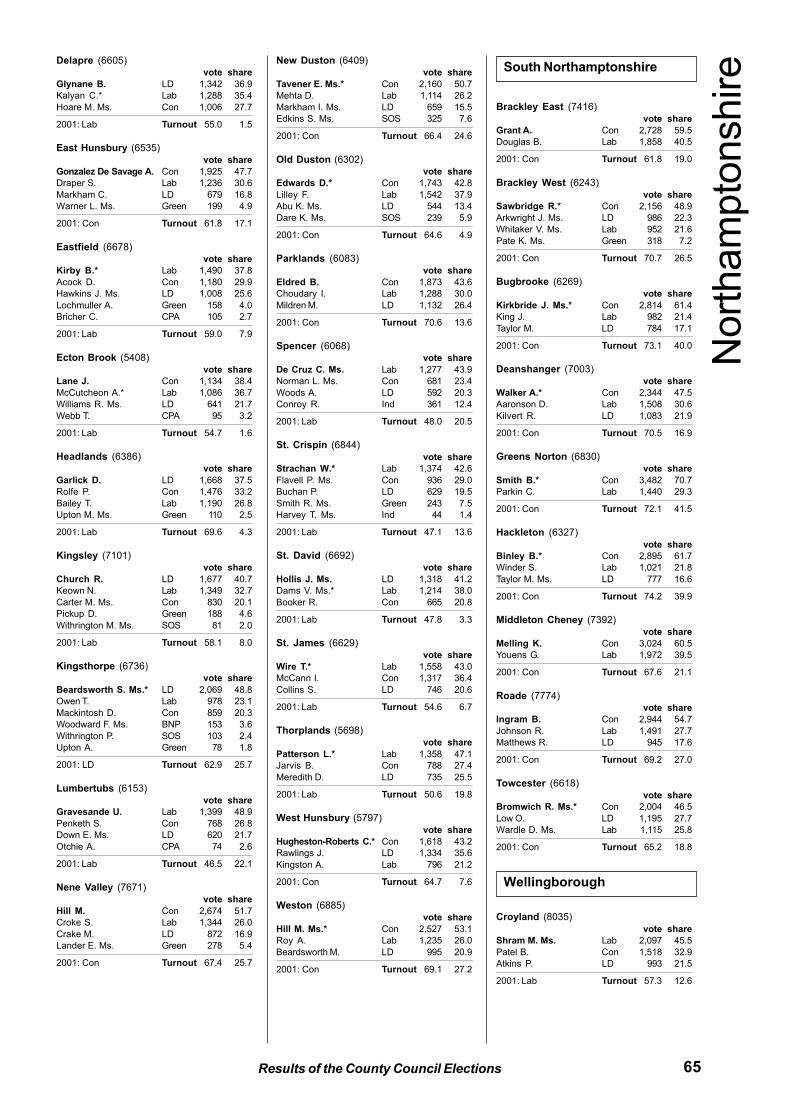
65Results of the County Council Elections
Delapre (6605)
vote share
Glynane B. LD 1,342 36.9
Kalyan C.* Lab 1,288 35.4
Hoare M. Ms. Con 1,006 27.7
2001: Lab Turnout 55.0 1.5
East Hunsbury (6535)
vote share
Gonzalez De Savage A. Con 1,925 47.7
Draper S. Lab 1,236 30.6
Markham C. LD 679 16.8
Warner L. Ms. Green 199 4.9
2001: Con Turnout 61.8 17.1
Eastfield (6678)
vote share
Kirby B.* Lab 1,490 37.8
Acock D. Con 1,180 29.9
Hawkins J. Ms. LD 1,008 25.6
Lochmuller A. Green 158 4.0
Bricher C. CPA 105 2.7
2001: Lab Turnout 59.0 7.9
Ecton Brook (5408)
vote share
Lane J. Con 1,134 38.4
McCutcheon A.* Lab 1,086 36.7
Williams R. Ms. LD 641 21.7
Webb T. CPA 95 3.2
2001: Lab Turnout 54.7 1.6
Headlands (6386)
vote share
Garlick D. LD 1,668 37.5
Rolfe P. Con 1,476 33.2
Bailey T. Lab 1,190 26.8
Upton M. Ms. Green 110 2.5
2001: Lab Turnout 69.6 4.3
Kingsley (7101)
vote share
Church R. LD 1,677 40.7
Keown N. Lab 1,349 32.7
Carter M. Ms. Con 830 20.1
Pickup D. Green 188 4.6
Withrington M. Ms. SOS 81 2.0
2001: Lab Turnout 58.1 8.0
Kingsthorpe (6736)
vote share
Beardsworth S. Ms.* LD 2,069 48.8
Owen T. Lab 978 23.1
Mackintosh D. Con 859 20.3
Woodward F. Ms. BNP 153 3.6
Withrington P. SOS 103 2.4
Upton A. Green 78 1.8
2001: LD Turnout 62.9 25.7
Lumbertubs (6153)
vote share
Gravesande U. Lab 1,399 48.9
Penketh S. Con 768 26.8
Down E. Ms. LD 620 21.7
Otchie A. CPA 74 2.6
2001: Lab Turnout 46.5 22.1
Nene Valley (7671)
vote share
Hill M. Con 2,674 51.7
Croke S. Lab 1,344 26.0
Crake M. LD 872 16.9
Lander E. Ms. Green 278 5.4
2001: Con Turnout 67.4 25.7
New Duston (6409)
vote share
Tavener E. Ms.* Con 2,160 50.7
Mehta D. Lab 1,114 26.2
Markham I. Ms. LD 659 15.5
Edkins S. Ms. SOS 325 7.6
2001: Con Turnout 66.4 24.6
Old Duston (6302)
vote share
Edwards D.* Con 1,743 42.8
Lilley F. Lab 1,542 37.9
Abu K. Ms. LD 544 13.4
Dare K. Ms. SOS 239 5.9
2001: Con Turnout 64.6 4.9
Parklands (6083)
vote share
Eldred B. Con 1,873 43.6
Choudary I. Lab 1,288 30.0
Mildren M. LD 1,132 26.4
2001: Con Turnout 70.6 13.6
Spencer (6068)
vote share
De Cruz C. Ms. Lab 1,277 43.9
Norman L. Ms. Con 681 23.4
Woods A. LD 592 20.3
Conroy R. Ind 361 12.4
2001: Lab Turnout 48.0 20.5
St. Crispin (6844)
vote share
Strachan W.* Lab 1,374 42.6
Flavell P. Ms. Con 936 29.0
Buchan P. LD 629 19.5
Smith R. Ms. Green 243 7.5
Harvey T. Ms. Ind 44 1.4
2001: Lab Turnout 47.1 13.6
St. David (6692)
vote share
Hollis J. Ms. LD 1,318 41.2
Dams V. Ms.* Lab 1,214 38.0
Booker R. Con 665 20.8
2001: Lab Turnout 47.8 3.3
St. James (6629)
vote share
Wire T.* Lab 1,558 43.0
McCann I. Con 1,317 36.4
Collins S. LD 746 20.6
2001: Lab Turnout 54.6 6.7
Thorplands (5698)
vote share
Patterson L.* Lab 1,358 47.1
Jarvis B. Con 788 27.4
Meredith D. LD 735 25.5
2001: Lab Turnout 50.6 19.8
West Hunsbury (5797)
vote share
Hugheston-Roberts C.* Con 1,618 43.2
Rawlings J. LD 1,334 35.6
Kingston A. Lab 796 21.2
2001: Con Turnout 64.7 7.6
Weston (6885)
vote share
Hill M. Ms.* Con 2,527 53.1
Roy A. Lab 1,235 26.0
Beardsworth M. LD 995 20.9
2001: Con Turnout 69.1 27.2
Brackley East (7416)
vote share
Grant A. Con 2,728 59.5
Douglas B. Lab 1,858 40.5
2001: Con Turnout 61.8 19.0
Brackley West (6243)
vote share
Sawbridge R.* Con 2,156 48.9
Arkwright J. Ms. LD 986 22.3
Whitaker V. Ms. Lab 952 21.6
Pate K. Ms. Green 318 7.2
2001: Con Turnout 70.7 26.5
Bugbrooke (6269)
vote share
Kirkbride J. Ms.* Con 2,814 61.4
King J. Lab 982 21.4
Taylor M. LD 784 17.1
2001: Con Turnout 73.1 40.0
Deanshanger (7003)
vote share
Walker A.* Con 2,344 47.5
Aaronson D. Lab 1,508 30.6
Kilvert R. LD 1,083 21.9
2001: Con Turnout 70.5 16.9
Greens Norton (6830)
vote share
Smith B.* Con 3,482 70.7
Parkin C. Lab 1,440 29.3
2001: Con Turnout 72.1 41.5
Hackleton (6327)
vote share
Binley B.* Con 2,895 61.7
Winder S. Lab 1,021 21.8
Taylor M. Ms. LD 777 16.6
2001: Con Turnout 74.2 39.9
Middleton Cheney (7392)
vote share
Melling K. Con 3,024 60.5
Youens G. Lab 1,972 39.5
2001: Con Turnout 67.6 21.1
Roade (7774)
vote share
Ingram B. Con 2,944 54.7
Johnson R. Lab 1,491 27.7
Matthews R. LD 945 17.6
2001: Con Turnout 69.2 27.0
Towcester (6618)
vote share
Bromwich R. Ms.* Con 2,004 46.5
Low O. LD 1,195 27.7
Wardle D. Ms. Lab 1,115 25.8
2001: Con Turnout 65.2 18.8
Croyland (8035)
vote share
Shram M. Ms. Lab 2,097 45.5
Patel B. Con 1,518 32.9
Atkins P. LD 993 21.5
2001: Lab Turnout 57.3 12.6
South Northamptonshire
Nort
ham
pto
nshire
Wellingborough
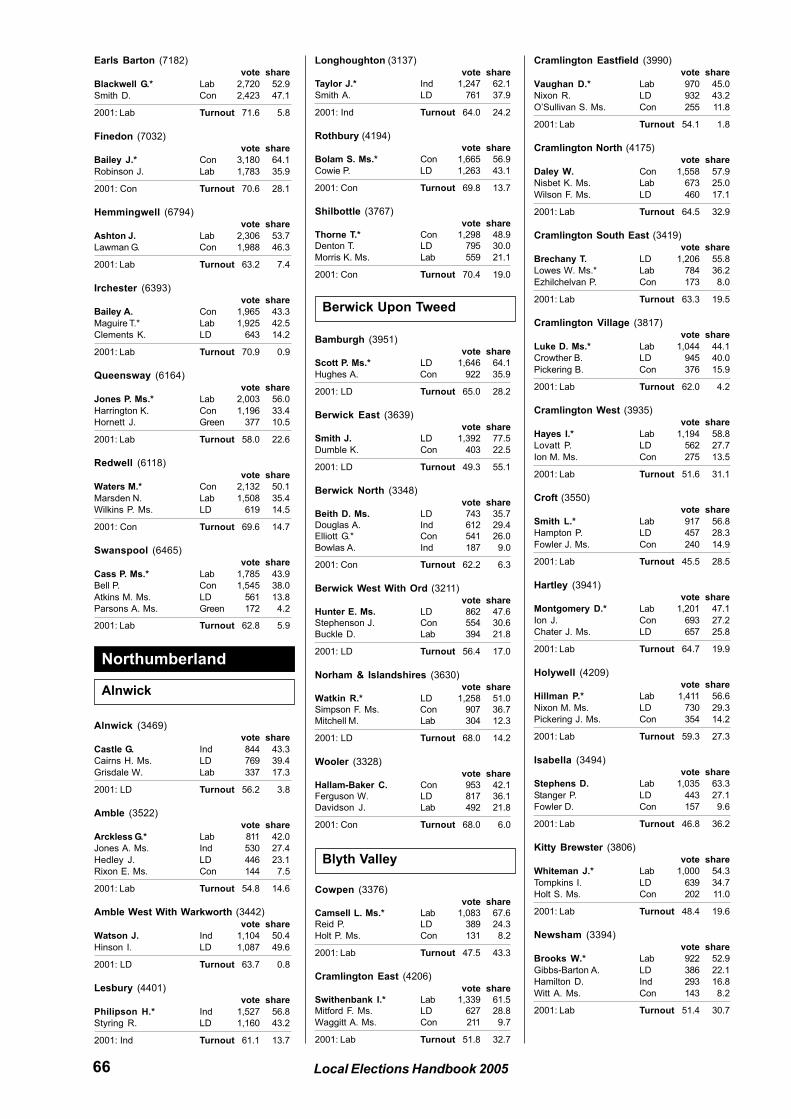
66 Local Elections Handbook 2005
Earls Barton (7182)
vote share
Blackwell G.* Lab 2,720 52.9
Smith D. Con 2,423 47.1
2001: Lab Turnout 71.6 5.8
Finedon (7032)
vote share
Bailey J.* Con 3,180 64.1
Robinson J. Lab 1,783 35.9
2001: Con Turnout 70.6 28.1
Hemmingwell (6794)
vote share
Ashton J. Lab 2,306 53.7
Lawman G. Con 1,988 46.3
2001: Lab Turnout 63.2 7.4
Irchester (6393)
vote share
Bailey A. Con 1,965 43.3
Maguire T.* Lab 1,925 42.5
Clements K. LD 643 14.2
2001: Lab Turnout 70.9 0.9
Queensway (6164)
vote share
Jones P. Ms.* Lab 2,003 56.0
Harrington K. Con 1,196 33.4
Hornett J. Green 377 10.5
2001: Lab Turnout 58.0 22.6
Redwell (6118)
vote share
Waters M.* Con 2,132 50.1
Marsden N. Lab 1,508 35.4
Wilkins P. Ms. LD 619 14.5
2001: Con Turnout 69.6 14.7
Swanspool (6465)
vote share
Cass P. Ms.* Lab 1,785 43.9
Bell P. Con 1,545 38.0
Atkins M. Ms. LD 561 13.8
Parsons A. Ms. Green 172 4.2
2001: Lab Turnout 62.8 5.9
Alnwick (3469)
vote share
Castle G. Ind 844 43.3
Cairns H. Ms. LD 769 39.4
Grisdale W. Lab 337 17.3
2001: LD Turnout 56.2 3.8
Amble (3522)
vote share
Arckless G.* Lab 811 42.0
Jones A. Ms. Ind 530 27.4
Hedley J. LD 446 23.1
Rixon E. Ms. Con 144 7.5
2001: Lab Turnout 54.8 14.6
Amble West With Warkworth (3442)
vote share
Watson J. Ind 1,104 50.4
Hinson I. LD 1,087 49.6
2001: LD Turnout 63.7 0.8
Lesbury (4401)
vote share
Philipson H.* Ind 1,527 56.8
Styring R. LD 1,160 43.2
2001: Ind Turnout 61.1 13.7
Longhoughton (3137)
vote share
Taylor J.* Ind 1,247 62.1
Smith A. LD 761 37.9
2001: Ind Turnout 64.0 24.2
Rothbury (4194)
vote share
Bolam S. Ms.* Con 1,665 56.9
Cowie P. LD 1,263 43.1
2001: Con Turnout 69.8 13.7
Shilbottle (3767)
vote share
Thorne T.* Con 1,298 48.9
Denton T. LD 795 30.0
Morris K. Ms. Lab 559 21.1
2001: Con Turnout 70.4 19.0
Bamburgh (3951)
vote share
Scott P. Ms.* LD 1,646 64.1
Hughes A. Con 922 35.9
2001: LD Turnout 65.0 28.2
Berwick East (3639)
vote share
Smith J. LD 1,392 77.5
Dumble K. Con 403 22.5
2001: LD Turnout 49.3 55.1
Berwick North (3348)
vote share
Beith D. Ms. LD 743 35.7
Douglas A. Ind 612 29.4
Elliott G.* Con 541 26.0
Bowlas A. Ind 187 9.0
2001: Con Turnout 62.2 6.3
Berwick West With Ord (3211)
vote share
Hunter E. Ms. LD 862 47.6
Stephenson J. Con 554 30.6
Buckle D. Lab 394 21.8
2001: LD Turnout 56.4 17.0
Norham & Islandshires (3630)
vote share
Watkin R.* LD 1,258 51.0
Simpson F. Ms. Con 907 36.7
Mitchell M. Lab 304 12.3
2001: LD Turnout 68.0 14.2
Wooler (3328)
vote share
Hallam-Baker C. Con 953 42.1
Ferguson W. LD 817 36.1
Davidson J. Lab 492 21.8
2001: Con Turnout 68.0 6.0
Cowpen (3376)
vote share
Camsell L. Ms.* Lab 1,083 67.6
Reid P. LD 389 24.3
Holt P. Ms. Con 131 8.2
2001: Lab Turnout 47.5 43.3
Cramlington East (4206)
vote share
Swithenbank I.* Lab 1,339 61.5
Mitford F. Ms. LD 627 28.8
Waggitt A. Ms. Con 211 9.7
2001: Lab Turnout 51.8 32.7
Cramlington Eastfield (3990)
vote share
Vaughan D.* Lab 970 45.0
Nixon R. LD 932 43.2
O’Sullivan S. Ms. Con 255 11.8
2001: Lab Turnout 54.1 1.8
Cramlington North (4175)
vote share
Daley W. Con 1,558 57.9
Nisbet K. Ms. Lab 673 25.0
Wilson F. Ms. LD 460 17.1
2001: Lab Turnout 64.5 32.9
Cramlington South East (3419)
vote share
Brechany T. LD 1,206 55.8
Lowes W. Ms.* Lab 784 36.2
Ezhilchelvan P. Con 173 8.0
2001: Lab Turnout 63.3 19.5
Cramlington Village (3817)
vote share
Luke D. Ms.* Lab 1,044 44.1
Crowther B. LD 945 40.0
Pickering B. Con 376 15.9
2001: Lab Turnout 62.0 4.2
Cramlington West (3935)
vote share
Hayes I.* Lab 1,194 58.8
Lovatt P. LD 562 27.7
Ion M. Ms. Con 275 13.5
2001: Lab Turnout 51.6 31.1
Croft (3550)
vote share
Smith L.* Lab 917 56.8
Hampton P. LD 457 28.3
Fowler J. Ms. Con 240 14.9
2001: Lab Turnout 45.5 28.5
Hartley (3941)
vote share
Montgomery D.* Lab 1,201 47.1
Ion J. Con 693 27.2
Chater J. Ms. LD 657 25.8
2001: Lab Turnout 64.7 19.9
Holywell (4209)
vote share
Hillman P.* Lab 1,411 56.6
Nixon M. Ms. LD 730 29.3
Pickering J. Ms. Con 354 14.2
2001: Lab Turnout 59.3 27.3
Isabella (3494)
vote share
Stephens D. Lab 1,035 63.3
Stanger P. LD 443 27.1
Fowler D. Con 157 9.6
2001: Lab Turnout 46.8 36.2
Kitty Brewster (3806)
vote share
Whiteman J.* Lab 1,000 54.3
Tompkins I. LD 639 34.7
Holt S. Ms. Con 202 11.0
2001: Lab Turnout 48.4 19.6
Newsham (3394)
vote share
Brooks W.* Lab 922 52.9
Gibbs-Barton A. LD 386 22.1
Hamilton D. Ind 293 16.8
Witt A. Ms. Con 143 8.2
2001: Lab Turnout 51.4 30.7
Alnwick
Northumberland
Berwick Upon Tweed
Blyth Valley
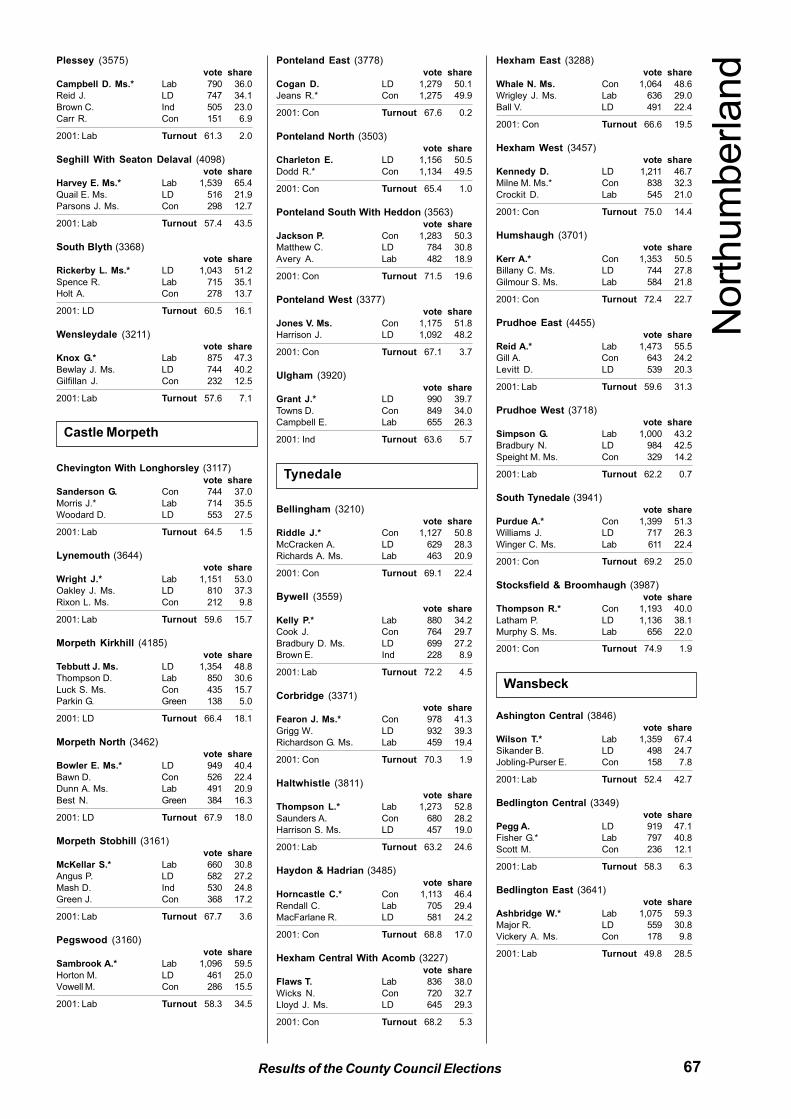
67Results of the County Council Elections
Plessey (3575)
vote share
Campbell D. Ms.* Lab 790 36.0
Reid J. LD 747 34.1
Brown C. Ind 505 23.0
Carr R. Con 151 6.9
2001: Lab Turnout 61.3 2.0
Seghill With Seaton Delaval (4098)
vote share
Harvey E. Ms.* Lab 1,539 65.4
Quail E. Ms. LD 516 21.9
Parsons J. Ms. Con 298 12.7
2001: Lab Turnout 57.4 43.5
South Blyth (3368)
vote share
Rickerby L. Ms.* LD 1,043 51.2
Spence R. Lab 715 35.1
Holt A. Con 278 13.7
2001: LD Turnout 60.5 16.1
Wensleydale (3211)
vote share
Knox G.* Lab 875 47.3
Bewlay J. Ms. LD 744 40.2
Gilfillan J. Con 232 12.5
2001: Lab Turnout 57.6 7.1
Chevington With Longhorsley (3117)
vote share
Sanderson G. Con 744 37.0
Morris J.* Lab 714 35.5
Woodard D. LD 553 27.5
2001: Lab Turnout 64.5 1.5
Lynemouth (3644)
vote share
Wright J.* Lab 1,151 53.0
Oakley J. Ms. LD 810 37.3
Rixon L. Ms. Con 212 9.8
2001: Lab Turnout 59.6 15.7
Morpeth Kirkhill (4185)
vote share
Tebbutt J. Ms. LD 1,354 48.8
Thompson D. Lab 850 30.6
Luck S. Ms. Con 435 15.7
Parkin G. Green 138 5.0
2001: LD Turnout 66.4 18.1
Morpeth North (3462)
vote share
Bowler E. Ms.* LD 949 40.4
Bawn D. Con 526 22.4
Dunn A. Ms. Lab 491 20.9
Best N. Green 384 16.3
2001: LD Turnout 67.9 18.0
Morpeth Stobhill (3161)
vote share
McKellar S.* Lab 660 30.8
Angus P. LD 582 27.2
Mash D. Ind 530 24.8
Green J. Con 368 17.2
2001: Lab Turnout 67.7 3.6
Pegswood (3160)
vote share
Sambrook A.* Lab 1,096 59.5
Horton M. LD 461 25.0
Vowell M. Con 286 15.5
2001: Lab Turnout 58.3 34.5
Ponteland East (3778)
vote share
Cogan D. LD 1,279 50.1
Jeans R.* Con 1,275 49.9
2001: Con Turnout 67.6 0.2
Ponteland North (3503)
vote share
Charleton E. LD 1,156 50.5
Dodd R.* Con 1,134 49.5
2001: Con Turnout 65.4 1.0
Ponteland South With Heddon (3563)
vote share
Jackson P. Con 1,283 50.3
Matthew C. LD 784 30.8
Avery A. Lab 482 18.9
2001: Con Turnout 71.5 19.6
Ponteland West (3377)
vote share
Jones V. Ms. Con 1,175 51.8
Harrison J. LD 1,092 48.2
2001: Con Turnout 67.1 3.7
Ulgham (3920)
vote share
Grant J.* LD 990 39.7
Towns D. Con 849 34.0
Campbell E. Lab 655 26.3
2001: Ind Turnout 63.6 5.7
Bellingham (3210)
vote share
Riddle J.* Con 1,127 50.8
McCracken A. LD 629 28.3
Richards A. Ms. Lab 463 20.9
2001: Con Turnout 69.1 22.4
Bywell (3559)
vote share
Kelly P.* Lab 880 34.2
Cook J. Con 764 29.7
Bradbury D. Ms. LD 699 27.2
Brown E. Ind 228 8.9
2001: Lab Turnout 72.2 4.5
Corbridge (3371)
vote share
Fearon J. Ms.* Con 978 41.3
Grigg W. LD 932 39.3
Richardson G. Ms. Lab 459 19.4
2001: Con Turnout 70.3 1.9
Haltwhistle (3811)
vote share
Thompson L.* Lab 1,273 52.8
Saunders A. Con 680 28.2
Harrison S. Ms. LD 457 19.0
2001: Lab Turnout 63.2 24.6
Haydon & Hadrian (3485)
vote share
Horncastle C.* Con 1,113 46.4
Rendall C. Lab 705 29.4
MacFarlane R. LD 581 24.2
2001: Con Turnout 68.8 17.0
Hexham Central With Acomb (3227)
vote share
Flaws T. Lab 836 38.0
Wicks N. Con 720 32.7
Lloyd J. Ms. LD 645 29.3
2001: Con Turnout 68.2 5.3
Hexham East (3288)
vote share
Whale N. Ms. Con 1,064 48.6
Wrigley J. Ms. Lab 636 29.0
Ball V. LD 491 22.4
2001: Con Turnout 66.6 19.5
Hexham West (3457)
vote share
Kennedy D. LD 1,211 46.7
Milne M. Ms.* Con 838 32.3
Crockit D. Lab 545 21.0
2001: Con Turnout 75.0 14.4
Humshaugh (3701)
vote share
Kerr A.* Con 1,353 50.5
Billany C. Ms. LD 744 27.8
Gilmour S. Ms. Lab 584 21.8
2001: Con Turnout 72.4 22.7
Prudhoe East (4455)
vote share
Reid A.* Lab 1,473 55.5
Gill A. Con 643 24.2
Levitt D. LD 539 20.3
2001: Lab Turnout 59.6 31.3
Prudhoe West (3718)
vote share
Simpson G. Lab 1,000 43.2
Bradbury N. LD 984 42.5
Speight M. Ms. Con 329 14.2
2001: Lab Turnout 62.2 0.7
South Tynedale (3941)
vote share
Purdue A.* Con 1,399 51.3
Williams J. LD 717 26.3
Winger C. Ms. Lab 611 22.4
2001: Con Turnout 69.2 25.0
Stocksfield & Broomhaugh (3987)
vote share
Thompson R.* Con 1,193 40.0
Latham P. LD 1,136 38.1
Murphy S. Ms. Lab 656 22.0
2001: Con Turnout 74.9 1.9
Ashington Central (3846)
vote share
Wilson T.* Lab 1,359 67.4
Sikander B. LD 498 24.7
Jobling-Purser E. Con 158 7.8
2001: Lab Turnout 52.4 42.7
Bedlington Central (3349)
vote share
Pegg A. LD 919 47.1
Fisher G.* Lab 797 40.8
Scott M. Con 236 12.1
2001: Lab Turnout 58.3 6.3
Bedlington East (3641)
vote share
Ashbridge W.* Lab 1,075 59.3
Major R. LD 559 30.8
Vickery A. Ms. Con 178 9.8
2001: Lab Turnout 49.8 28.5
Castle Morpeth
Tynedale
Wansbeck
Nort
hum
berland
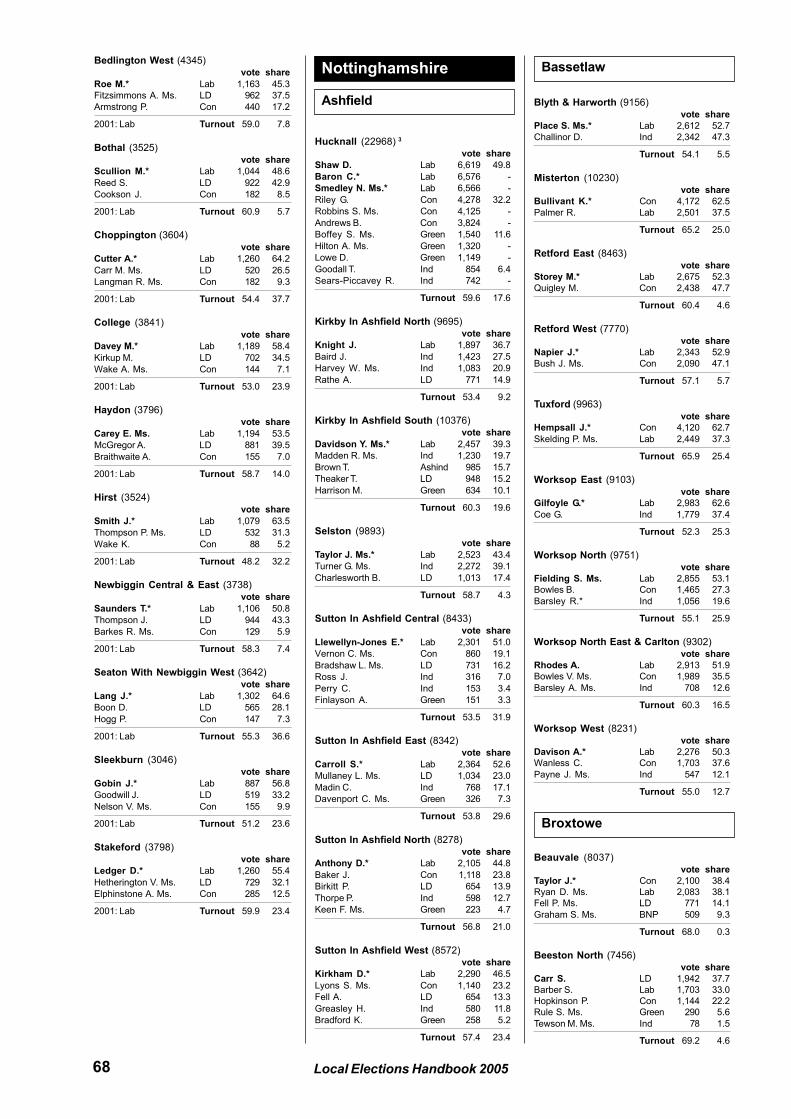
68 Local Elections Handbook 2005
Bedlington West (4345)
vote share
Roe M.* Lab 1,163 45.3
Fitzsimmons A. Ms. LD 962 37.5
Armstrong P. Con 440 17.2
2001: Lab Turnout 59.0 7.8
Bothal (3525)
vote share
Scullion M.* Lab 1,044 48.6
Reed S. LD 922 42.9
Cookson J. Con 182 8.5
2001: Lab Turnout 60.9 5.7
Choppington (3604)
vote share
Cutter A.* Lab 1,260 64.2
Carr M. Ms. LD 520 26.5
Langman R. Ms. Con 182 9.3
2001: Lab Turnout 54.4 37.7
College (3841)
vote share
Davey M.* Lab 1,189 58.4
Kirkup M. LD 702 34.5
Wake A. Ms. Con 144 7.1
2001: Lab Turnout 53.0 23.9
Haydon (3796)
vote share
Carey E. Ms. Lab 1,194 53.5
McGregor A. LD 881 39.5
Braithwaite A. Con 155 7.0
2001: Lab Turnout 58.7 14.0
Hirst (3524)
vote share
Smith J.* Lab 1,079 63.5
Thompson P. Ms. LD 532 31.3
Wake K. Con 88 5.2
2001: Lab Turnout 48.2 32.2
Newbiggin Central & East (3738)
vote share
Saunders T.* Lab 1,106 50.8
Thompson J. LD 944 43.3
Barkes R. Ms. Con 129 5.9
2001: Lab Turnout 58.3 7.4
Seaton With Newbiggin West (3642)
vote share
Lang J.* Lab 1,302 64.6
Boon D. LD 565 28.1
Hogg P. Con 147 7.3
2001: Lab Turnout 55.3 36.6
Sleekburn (3046)
vote share
Gobin J.* Lab 887 56.8
Goodwill J. LD 519 33.2
Nelson V. Ms. Con 155 9.9
2001: Lab Turnout 51.2 23.6
Stakeford (3798)
vote share
Ledger D.* Lab 1,260 55.4
Hetherington V. Ms. LD 729 32.1
Elphinstone A. Ms. Con 285 12.5
2001: Lab Turnout 59.9 23.4
Hucknall (22968) 3
vote share
Shaw D. Lab 6,619 49.8
Baron C.* Lab 6,576 -
Smedley N. Ms.* Lab 6,566 -
Riley G. Con 4,278 32.2
Robbins S. Ms. Con 4,125 -
Andrews B. Con 3,824 -
Boffey S. Ms. Green 1,540 11.6
Hilton A. Ms. Green 1,320 -
Lowe D. Green 1,149 -
Goodall T. Ind 854 6.4
Sears-Piccavey R. Ind 742 -
Turnout 59.6 17.6
Kirkby In Ashfield North (9695)
vote share
Knight J. Lab 1,897 36.7
Baird J. Ind 1,423 27.5
Harvey W. Ms. Ind 1,083 20.9
Rathe A. LD 771 14.9
Turnout 53.4 9.2
Kirkby In Ashfield South (10376)
vote share
Davidson Y. Ms.* Lab 2,457 39.3
Madden R. Ms. Ind 1,230 19.7
Brown T. Ashind 985 15.7
Theaker T. LD 948 15.2
Harrison M. Green 634 10.1
Turnout 60.3 19.6
Selston (9893)
vote share
Taylor J. Ms.* Lab 2,523 43.4
Turner G. Ms. Ind 2,272 39.1
Charlesworth B. LD 1,013 17.4
Turnout 58.7 4.3
Sutton In Ashfield Central (8433)
vote share
Llewellyn-Jones E.* Lab 2,301 51.0
Vernon C. Ms. Con 860 19.1
Bradshaw L. Ms. LD 731 16.2
Ross J. Ind 316 7.0
Perry C. Ind 153 3.4
Finlayson A. Green 151 3.3
Turnout 53.5 31.9
Sutton In Ashfield East (8342)
vote share
Carroll S.* Lab 2,364 52.6
Mullaney L. Ms. LD 1,034 23.0
Madin C. Ind 768 17.1
Davenport C. Ms. Green 326 7.3
Turnout 53.8 29.6
Sutton In Ashfield North (8278)
vote share
Anthony D.* Lab 2,105 44.8
Baker J. Con 1,118 23.8
Birkitt P. LD 654 13.9
Thorpe P. Ind 598 12.7
Keen F. Ms. Green 223 4.7
Turnout 56.8 21.0
Sutton In Ashfield West (8572)
vote share
Kirkham D.* Lab 2,290 46.5
Lyons S. Ms. Con 1,140 23.2
Fell A. LD 654 13.3
Greasley H. Ind 580 11.8
Bradford K. Green 258 5.2
Turnout 57.4 23.4
Blyth & Harworth (9156)
vote share
Place S. Ms.* Lab 2,612 52.7
Challinor D. Ind 2,342 47.3
Turnout 54.1 5.5
Misterton (10230)
vote share
Bullivant K.* Con 4,172 62.5
Palmer R. Lab 2,501 37.5
Turnout 65.2 25.0
Retford East (8463)
vote share
Storey M.* Lab 2,675 52.3
Quigley M. Con 2,438 47.7
Turnout 60.4 4.6
Retford West (7770)
vote share
Napier J.* Lab 2,343 52.9
Bush J. Ms. Con 2,090 47.1
Turnout 57.1 5.7
Tuxford (9963)
vote share
Hempsall J.* Con 4,120 62.7
Skelding P. Ms. Lab 2,449 37.3
Turnout 65.9 25.4
Worksop East (9103)
vote share
Gilfoyle G.* Lab 2,983 62.6
Coe G. Ind 1,779 37.4
Turnout 52.3 25.3
Worksop North (9751)
vote share
Fielding S. Ms. Lab 2,855 53.1
Bowles B. Con 1,465 27.3
Barsley R.* Ind 1,056 19.6
Turnout 55.1 25.9
Worksop North East & Carlton (9302)
vote share
Rhodes A. Lab 2,913 51.9
Bowles V. Ms. Con 1,989 35.5
Barsley A. Ms. Ind 708 12.6
Turnout 60.3 16.5
Worksop West (8231)
vote share
Davison A.* Lab 2,276 50.3
Wanless C. Con 1,703 37.6
Payne J. Ms. Ind 547 12.1
Turnout 55.0 12.7
Beauvale (8037)
vote share
Taylor J.* Con 2,100 38.4
Ryan D. Ms. Lab 2,083 38.1
Fell P. Ms. LD 771 14.1
Graham S. Ms. BNP 509 9.3
Turnout 68.0 0.3
Beeston North (7456)
vote share
Carr S. LD 1,942 37.7
Barber S. Lab 1,703 33.0
Hopkinson P. Con 1,144 22.2
Rule S. Ms. Green 290 5.6
Tewson M. Ms. Ind 78 1.5
Turnout 69.2 4.6
Ashfield
Nottinghamshire Bassetlaw
Broxtowe
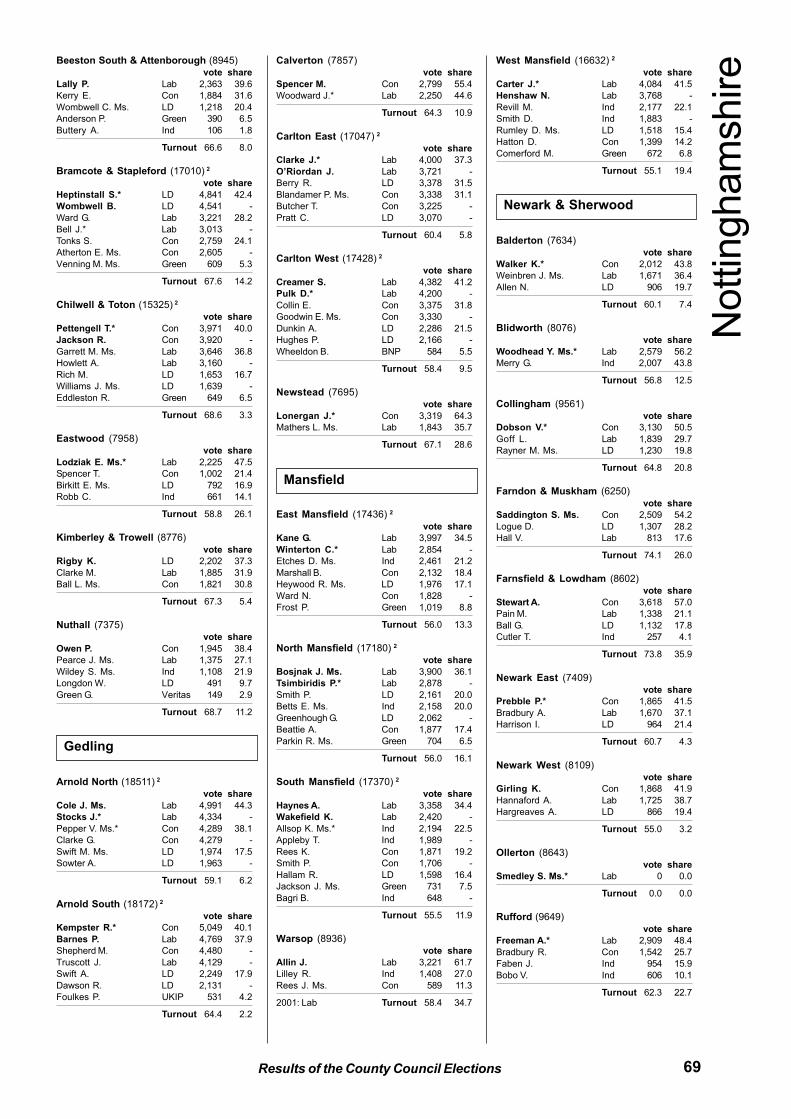
69Results of the County Council Elections
Beeston South & Attenborough (8945)
vote share
Lally P. Lab 2,363 39.6
Kerry E. Con 1,884 31.6
Wombwell C. Ms. LD 1,218 20.4
Anderson P. Green 390 6.5
Buttery A. Ind 106 1.8
Turnout 66.6 8.0
Bramcote & Stapleford (17010) 2
vote share
Heptinstall S.* LD 4,841 42.4
Wombwell B. LD 4,541 -
Ward G. Lab 3,221 28.2
Bell J.* Lab 3,013 -
Tonks S. Con 2,759 24.1
Atherton E. Ms. Con 2,605 -
Venning M. Ms. Green 609 5.3
Turnout 67.6 14.2
Chilwell & Toton (15325) 2
vote share
Pettengell T.* Con 3,971 40.0
Jackson R. Con 3,920 -
Garrett M. Ms. Lab 3,646 36.8
Howlett A. Lab 3,160 -
Rich M. LD 1,653 16.7
Williams J. Ms. LD 1,639 -
Eddleston R. Green 649 6.5
Turnout 68.6 3.3
Eastwood (7958)
vote share
Lodziak E. Ms.* Lab 2,225 47.5
Spencer T. Con 1,002 21.4
Birkitt E. Ms. LD 792 16.9
Robb C. Ind 661 14.1
Turnout 58.8 26.1
Kimberley & Trowell (8776)
vote share
Rigby K. LD 2,202 37.3
Clarke M. Lab 1,885 31.9
Ball L. Ms. Con 1,821 30.8
Turnout 67.3 5.4
Nuthall (7375)
vote share
Owen P. Con 1,945 38.4
Pearce J. Ms. Lab 1,375 27.1
Wildey S. Ms. Ind 1,108 21.9
Longdon W. LD 491 9.7
Green G. Veritas 149 2.9
Turnout 68.7 11.2
Arnold North (18511) 2
vote share
Cole J. Ms. Lab 4,991 44.3
Stocks J.* Lab 4,334 -
Pepper V. Ms.* Con 4,289 38.1
Clarke G. Con 4,279 -
Swift M. Ms. LD 1,974 17.5
Sowter A. LD 1,963 -
Turnout 59.1 6.2
Arnold South (18172) 2
vote share
Kempster R.* Con 5,049 40.1
Barnes P. Lab 4,769 37.9
Shepherd M. Con 4,480 -
Truscott J. Lab 4,129 -
Swift A. LD 2,249 17.9
Dawson R. LD 2,131 -
Foulkes P. UKIP 531 4.2
Turnout 64.4 2.2
Calverton (7857)
vote share
Spencer M. Con 2,799 55.4
Woodward J.* Lab 2,250 44.6
Turnout 64.3 10.9
Carlton East (17047) 2
vote share
Clarke J.* Lab 4,000 37.3
O’Riordan J. Lab 3,721 -
Berry R. LD 3,378 31.5
Blandamer P. Ms. Con 3,338 31.1
Butcher T. Con 3,225 -
Pratt C. LD 3,070 -
Turnout 60.4 5.8
Carlton West (17428) 2
vote share
Creamer S. Lab 4,382 41.2
Pulk D.* Lab 4,200 -
Collin E. Con 3,375 31.8
Goodwin E. Ms. Con 3,330 -
Dunkin A. LD 2,286 21.5
Hughes P. LD 2,166 -
Wheeldon B. BNP 584 5.5
Turnout 58.4 9.5
Newstead (7695)
vote share
Lonergan J.* Con 3,319 64.3
Mathers L. Ms. Lab 1,843 35.7
Turnout 67.1 28.6
East Mansfield (17436) 2
vote share
Kane G. Lab 3,997 34.5
Winterton C.* Lab 2,854 -
Etches D. Ms. Ind 2,461 21.2
Marshall B. Con 2,132 18.4
Heywood R. Ms. LD 1,976 17.1
Ward N. Con 1,828 -
Frost P. Green 1,019 8.8
Turnout 56.0 13.3
North Mansfield (17180) 2
vote share
Bosjnak J. Ms. Lab 3,900 36.1
Tsimbiridis P.* Lab 2,878 -
Smith P. LD 2,161 20.0
Betts E. Ms. Ind 2,158 20.0
Greenhough G. LD 2,062 -
Beattie A. Con 1,877 17.4
Parkin R. Ms. Green 704 6.5
Turnout 56.0 16.1
South Mansfield (17370) 2
vote share
Haynes A. Lab 3,358 34.4
Wakefield K. Lab 2,420 -
Allsop K. Ms.* Ind 2,194 22.5
Appleby T. Ind 1,989 -
Rees K. Con 1,871 19.2
Smith P. Con 1,706 -
Hallam R. LD 1,598 16.4
Jackson J. Ms. Green 731 7.5
Bagri B. Ind 648 -
Turnout 55.5 11.9
Warsop (8936)
vote share
Allin J. Lab 3,221 61.7
Lilley R. Ind 1,408 27.0
Rees J. Ms. Con 589 11.3
2001: Lab Turnout 58.4 34.7
West Mansfield (16632) 2
vote share
Carter J.* Lab 4,084 41.5
Henshaw N. Lab 3,768 -
Revill M. Ind 2,177 22.1
Smith D. Ind 1,883 -
Rumley D. Ms. LD 1,518 15.4
Hatton D. Con 1,399 14.2
Comerford M. Green 672 6.8
Turnout 55.1 19.4
Balderton (7634)
vote share
Walker K.* Con 2,012 43.8
Weinbren J. Ms. Lab 1,671 36.4
Allen N. LD 906 19.7
Turnout 60.1 7.4
Blidworth (8076)
vote share
Woodhead Y. Ms.* Lab 2,579 56.2
Merry G. Ind 2,007 43.8
Turnout 56.8 12.5
Collingham (9561)
vote share
Dobson V.* Con 3,130 50.5
Goff L. Lab 1,839 29.7
Rayner M. Ms. LD 1,230 19.8
Turnout 64.8 20.8
Farndon & Muskham (6250)
vote share
Saddington S. Ms. Con 2,509 54.2
Logue D. LD 1,307 28.2
Hall V. Lab 813 17.6
Turnout 74.1 26.0
Farnsfield & Lowdham (8602)
vote share
Stewart A. Con 3,618 57.0
Pain M. Lab 1,338 21.1
Ball G. LD 1,132 17.8
Cutler T. Ind 257 4.1
Turnout 73.8 35.9
Newark East (7409)
vote share
Prebble P.* Con 1,865 41.5
Bradbury A. Lab 1,670 37.1
Harrison I. LD 964 21.4
Turnout 60.7 4.3
Newark West (8109)
vote share
Girling K. Con 1,868 41.9
Hannaford A. Lab 1,725 38.7
Hargreaves A. LD 866 19.4
Turnout 55.0 3.2
Ollerton (8643)
vote share
Smedley S. Ms.* Lab 0 0.0
Turnout 0.0 0.0
Rufford (9649)
vote share
Freeman A.* Lab 2,909 48.4
Bradbury R. Con 1,542 25.7
Faben J. Ind 954 15.9
Bobo V. Ind 606 10.1
Turnout 62.3 22.7
GedlingN
ottin
gham
shire
Newark & Sherwood
Mansfield
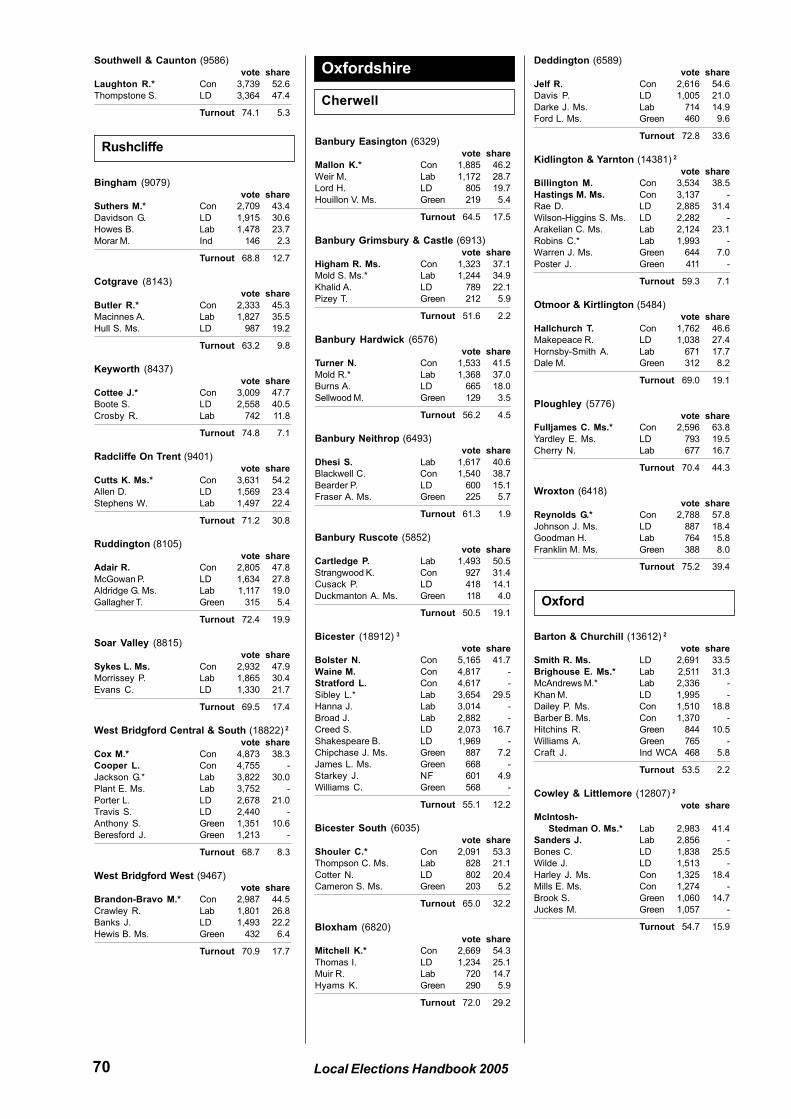
70 Local Elections Handbook 2005
Southwell & Caunton (9586)
vote share
Laughton R.* Con 3,739 52.6
Thompstone S. LD 3,364 47.4
Turnout 74.1 5.3
Bingham (9079)
vote share
Suthers M.* Con 2,709 43.4
Davidson G. LD 1,915 30.6
Howes B. Lab 1,478 23.7
Morar M. Ind 146 2.3
Turnout 68.8 12.7
Cotgrave (8143)
vote share
Butler R.* Con 2,333 45.3
Macinnes A. Lab 1,827 35.5
Hull S. Ms. LD 987 19.2
Turnout 63.2 9.8
Keyworth (8437)
vote share
Cottee J.* Con 3,009 47.7
Boote S. LD 2,558 40.5
Crosby R. Lab 742 11.8
Turnout 74.8 7.1
Radcliffe On Trent (9401)
vote share
Cutts K. Ms.* Con 3,631 54.2
Allen D. LD 1,569 23.4
Stephens W. Lab 1,497 22.4
Turnout 71.2 30.8
Ruddington (8105)
vote share
Adair R. Con 2,805 47.8
McGowan P. LD 1,634 27.8
Aldridge G. Ms. Lab 1,117 19.0
Gallagher T. Green 315 5.4
Turnout 72.4 19.9
Soar Valley (8815)
vote share
Sykes L. Ms. Con 2,932 47.9
Morrissey P. Lab 1,865 30.4
Evans C. LD 1,330 21.7
Turnout 69.5 17.4
West Bridgford Central & South (18822) 2
vote share
Cox M.* Con 4,873 38.3
Cooper L. Con 4,755 -
Jackson G.* Lab 3,822 30.0
Plant E. Ms. Lab 3,752 -
Porter L. LD 2,678 21.0
Travis S. LD 2,440 -
Anthony S. Green 1,351 10.6
Beresford J. Green 1,213 -
Turnout 68.7 8.3
West Bridgford West (9467)
vote share
Brandon-Bravo M.* Con 2,987 44.5
Crawley R. Lab 1,801 26.8
Banks J. LD 1,493 22.2
Hewis B. Ms. Green 432 6.4
Turnout 70.9 17.7
Banbury Easington (6329)
vote share
Mallon K.* Con 1,885 46.2
Weir M. Lab 1,172 28.7
Lord H. LD 805 19.7
Houillon V. Ms. Green 219 5.4
Turnout 64.5 17.5
Banbury Grimsbury & Castle (6913)
vote share
Higham R. Ms. Con 1,323 37.1
Mold S. Ms.* Lab 1,244 34.9
Khalid A. LD 789 22.1
Pizey T. Green 212 5.9
Turnout 51.6 2.2
Banbury Hardwick (6576)
vote share
Turner N. Con 1,533 41.5
Mold R.* Lab 1,368 37.0
Burns A. LD 665 18.0
Sellwood M. Green 129 3.5
Turnout 56.2 4.5
Banbury Neithrop (6493)
vote share
Dhesi S. Lab 1,617 40.6
Blackwell C. Con 1,540 38.7
Bearder P. LD 600 15.1
Fraser A. Ms. Green 225 5.7
Turnout 61.3 1.9
Banbury Ruscote (5852)
vote share
Cartledge P. Lab 1,493 50.5
Strangwood K. Con 927 31.4
Cusack P. LD 418 14.1
Duckmanton A. Ms. Green 118 4.0
Turnout 50.5 19.1
Bicester (18912) 3
vote share
Bolster N. Con 5,165 41.7
Waine M. Con 4,817 -
Stratford L. Con 4,617 -
Sibley L.* Lab 3,654 29.5
Hanna J. Lab 3,014 -
Broad J. Lab 2,882 -
Creed S. LD 2,073 16.7
Shakespeare B. LD 1,969 -
Chipchase J. Ms. Green 887 7.2
James L. Ms. Green 668 -
Starkey J. NF 601 4.9
Williams C. Green 568 -
Turnout 55.1 12.2
Bicester South (6035)
vote share
Shouler C.* Con 2,091 53.3
Thompson C. Ms. Lab 828 21.1
Cotter N. LD 802 20.4
Cameron S. Ms. Green 203 5.2
Turnout 65.0 32.2
Bloxham (6820)
vote share
Mitchell K.* Con 2,669 54.3
Thomas I. LD 1,234 25.1
Muir R. Lab 720 14.7
Hyams K. Green 290 5.9
Turnout 72.0 29.2
Deddington (6589)
vote share
Jelf R. Con 2,616 54.6
Davis P. LD 1,005 21.0
Darke J. Ms. Lab 714 14.9
Ford L. Ms. Green 460 9.6
Turnout 72.8 33.6
Kidlington & Yarnton (14381) 2
vote share
Billington M. Con 3,534 38.5
Hastings M. Ms. Con 3,137 -
Rae D. LD 2,885 31.4
Wilson-Higgins S. Ms. LD 2,282 -
Arakelian C. Ms. Lab 2,124 23.1
Robins C.* Lab 1,993 -
Warren J. Ms. Green 644 7.0
Poster J. Green 411 -
Turnout 59.3 7.1
Otmoor & Kirtlington (5484)
vote share
Hallchurch T. Con 1,762 46.6
Makepeace R. LD 1,038 27.4
Hornsby-Smith A. Lab 671 17.7
Dale M. Green 312 8.2
Turnout 69.0 19.1
Ploughley (5776)
vote share
Fulljames C. Ms.* Con 2,596 63.8
Yardley E. Ms. LD 793 19.5
Cherry N. Lab 677 16.7
Turnout 70.4 44.3
Wroxton (6418)
vote share
Reynolds G.* Con 2,788 57.8
Johnson J. Ms. LD 887 18.4
Goodman H. Lab 764 15.8
Franklin M. Ms. Green 388 8.0
Turnout 75.2 39.4
Barton & Churchill (13612) 2
vote share
Smith R. Ms. LD 2,691 33.5
Brighouse E. Ms.* Lab 2,511 31.3
McAndrews M.* Lab 2,336 -
Khan M. LD 1,995 -
Dailey P. Ms. Con 1,510 18.8
Barber B. Ms. Con 1,370 -
Hitchins R. Green 844 10.5
Williams A. Green 765 -
Craft J. Ind WCA 468 5.8
Turnout 53.5 2.2
Cowley & Littlemore (12807) 2
vote share
McIntosh-
Stedman O. Ms.* Lab 2,983 41.4
Sanders J. Lab 2,856 -
Bones C. LD 1,838 25.5
Wilde J. LD 1,513 -
Harley J. Ms. Con 1,325 18.4
Mills E. Ms. Con 1,274 -
Brook S. Green 1,060 14.7
Juckes M. Green 1,057 -
Turnout 54.7 15.9
Rushcliffe
Cherwell
Oxfordshire
Oxford
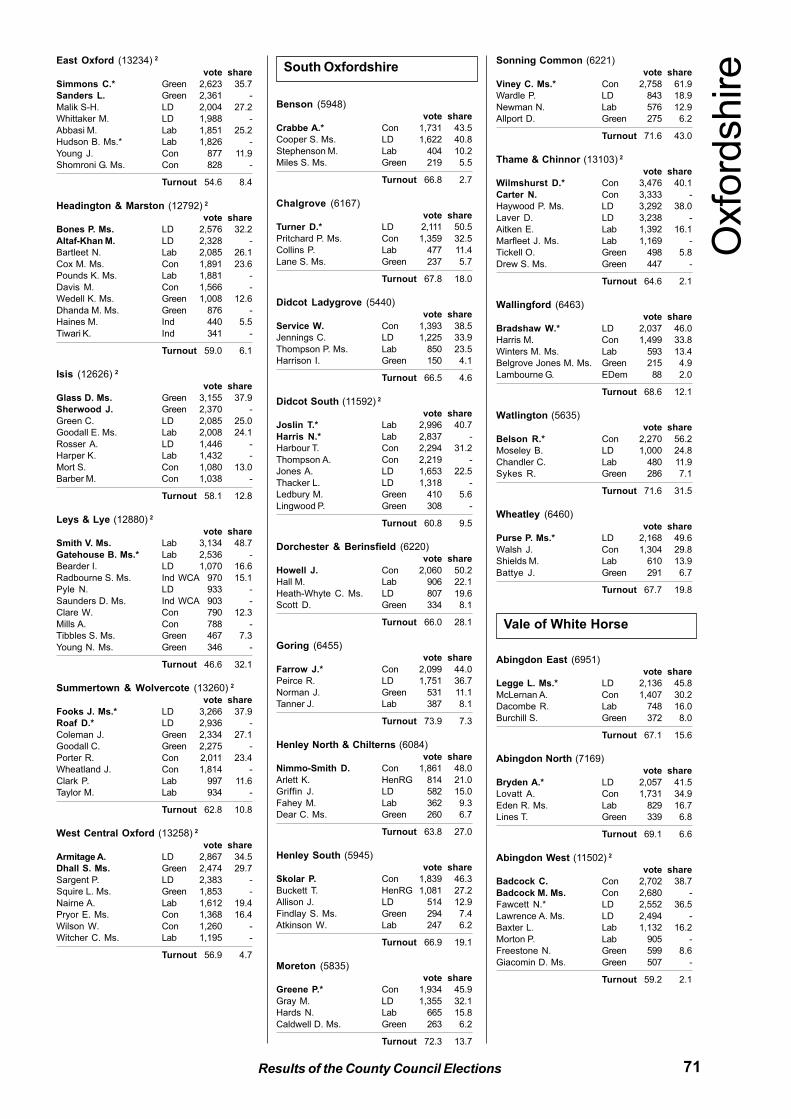
71Results of the County Council Elections
East Oxford (13234) 2
vote share
Simmons C.* Green 2,623 35.7
Sanders L. Green 2,361 -
Malik S-H. LD 2,004 27.2
Whittaker M. LD 1,988 -
Abbasi M. Lab 1,851 25.2
Hudson B. Ms.* Lab 1,826 -
Young J. Con 877 11.9
Shomroni G. Ms. Con 828 -
Turnout 54.6 8.4
Headington & Marston (12792) 2
vote share
Bones P. Ms. LD 2,576 32.2
Altaf-Khan M. LD 2,328 -
Bartleet N. Lab 2,085 26.1
Cox M. Ms. Con 1,891 23.6
Pounds K. Ms. Lab 1,881 -
Davis M. Con 1,566 -
Wedell K. Ms. Green 1,008 12.6
Dhanda M. Ms. Green 876 -
Haines M. Ind 440 5.5
Tiwari K. Ind 341 -
Turnout 59.0 6.1
Isis (12626) 2
vote share
Glass D. Ms. Green 3,155 37.9
Sherwood J. Green 2,370 -
Green C. LD 2,085 25.0
Goodall E. Ms. Lab 2,008 24.1
Rosser A. LD 1,446 -
Harper K. Lab 1,432 -
Mort S. Con 1,080 13.0
Barber M. Con 1,038 -
Turnout 58.1 12.8
Leys & Lye (12880) 2
vote share
Smith V. Ms. Lab 3,134 48.7
Gatehouse B. Ms.* Lab 2,536 -
Bearder I. LD 1,070 16.6
Radbourne S. Ms. Ind WCA 970 15.1
Pyle N. LD 933 -
Saunders D. Ms. Ind WCA 903 -
Clare W. Con 790 12.3
Mills A. Con 788 -
Tibbles S. Ms. Green 467 7.3
Young N. Ms. Green 346 -
Turnout 46.6 32.1
Summertown & Wolvercote (13260) 2
vote share
Fooks J. Ms.* LD 3,266 37.9
Roaf D.* LD 2,936 -
Coleman J. Green 2,334 27.1
Goodall C. Green 2,275 -
Porter R. Con 2,011 23.4
Wheatland J. Con 1,814 -
Clark P. Lab 997 11.6
Taylor M. Lab 934 -
Turnout 62.8 10.8
West Central Oxford (13258) 2
vote share
Armitage A. LD 2,867 34.5
Dhall S. Ms. Green 2,474 29.7
Sargent P. LD 2,383 -
Squire L. Ms. Green 1,853 -
Nairne A. Lab 1,612 19.4
Pryor E. Ms. Con 1,368 16.4
Wilson W. Con 1,260 -
Witcher C. Ms. Lab 1,195 -
Turnout 56.9 4.7
Benson (5948)
vote share
Crabbe A.* Con 1,731 43.5
Cooper S. Ms. LD 1,622 40.8
Stephenson M. Lab 404 10.2
Miles S. Ms. Green 219 5.5
Turnout 66.8 2.7
Chalgrove (6167)
vote share
Turner D.* LD 2,111 50.5
Pritchard P. Ms. Con 1,359 32.5
Collins P. Lab 477 11.4
Lane S. Ms. Green 237 5.7
Turnout 67.8 18.0
Didcot Ladygrove (5440)
vote share
Service W. Con 1,393 38.5
Jennings C. LD 1,225 33.9
Thompson P. Ms. Lab 850 23.5
Harrison I. Green 150 4.1
Turnout 66.5 4.6
Didcot South (11592) 2
vote share
Joslin T.* Lab 2,996 40.7
Harris N.* Lab 2,837 -
Harbour T. Con 2,294 31.2
Thompson A. Con 2,219 -
Jones A. LD 1,653 22.5
Thacker L. LD 1,318 -
Ledbury M. Green 410 5.6
Lingwood P. Green 308 -
Turnout 60.8 9.5
Dorchester & Berinsfield (6220)
vote share
Howell J. Con 2,060 50.2
Hall M. Lab 906 22.1
Heath-Whyte C. Ms. LD 807 19.6
Scott D. Green 334 8.1
Turnout 66.0 28.1
Goring (6455)
vote share
Farrow J.* Con 2,099 44.0
Peirce R. LD 1,751 36.7
Norman J. Green 531 11.1
Tanner J. Lab 387 8.1
Turnout 73.9 7.3
Henley North & Chilterns (6084)
vote share
Nimmo-Smith D. Con 1,861 48.0
Arlett K. HenRG 814 21.0
Griffin J. LD 582 15.0
Fahey M. Lab 362 9.3
Dear C. Ms. Green 260 6.7
Turnout 63.8 27.0
Henley South (5945)
vote share
Skolar P. Con 1,839 46.3
Buckett T. HenRG 1,081 27.2
Allison J. LD 514 12.9
Findlay S. Ms. Green 294 7.4
Atkinson W. Lab 247 6.2
Turnout 66.9 19.1
Moreton (5835)
vote share
Greene P.* Con 1,934 45.9
Gray M. LD 1,355 32.1
Hards N. Lab 665 15.8
Caldwell D. Ms. Green 263 6.2
Turnout 72.3 13.7
Sonning Common (6221)
vote share
Viney C. Ms.* Con 2,758 61.9
Wardle P. LD 843 18.9
Newman N. Lab 576 12.9
Allport D. Green 275 6.2
Turnout 71.6 43.0
Thame & Chinnor (13103) 2
vote share
Wilmshurst D.* Con 3,476 40.1
Carter N. Con 3,333 -
Haywood P. Ms. LD 3,292 38.0
Laver D. LD 3,238 -
Aitken E. Lab 1,392 16.1
Marfleet J. Ms. Lab 1,169 -
Tickell O. Green 498 5.8
Drew S. Ms. Green 447 -
Turnout 64.6 2.1
Wallingford (6463)
vote share
Bradshaw W.* LD 2,037 46.0
Harris M. Con 1,499 33.8
Winters M. Ms. Lab 593 13.4
Belgrove Jones M. Ms. Green 215 4.9
Lambourne G. EDem 88 2.0
Turnout 68.6 12.1
Watlington (5635)
vote share
Belson R.* Con 2,270 56.2
Moseley B. LD 1,000 24.8
Chandler C. Lab 480 11.9
Sykes R. Green 286 7.1
Turnout 71.6 31.5
Wheatley (6460)
vote share
Purse P. Ms.* LD 2,168 49.6
Walsh J. Con 1,304 29.8
Shields M. Lab 610 13.9
Battye J. Green 291 6.7
Turnout 67.7 19.8
Abingdon East (6951)
vote share
Legge L. Ms.* LD 2,136 45.8
McLernan A. Con 1,407 30.2
Dacombe R. Lab 748 16.0
Burchill S. Green 372 8.0
Turnout 67.1 15.6
Abingdon North (7169)
vote share
Bryden A.* LD 2,057 41.5
Lovatt A. Con 1,731 34.9
Eden R. Ms. Lab 829 16.7
Lines T. Green 339 6.8
Turnout 69.1 6.6
Abingdon West (11502) 2
vote share
Badcock C. Con 2,702 38.7
Badcock M. Ms. Con 2,680 -
Fawcett N.* LD 2,552 36.5
Lawrence A. Ms. LD 2,494 -
Baxter L. Lab 1,132 16.2
Morton P. Lab 905 -
Freestone N. Green 599 8.6
Giacomin D. Ms. Green 507 -
Turnout 59.2 2.1
Oxfo
rdshireSouth Oxfordshire
Vale of White Horse
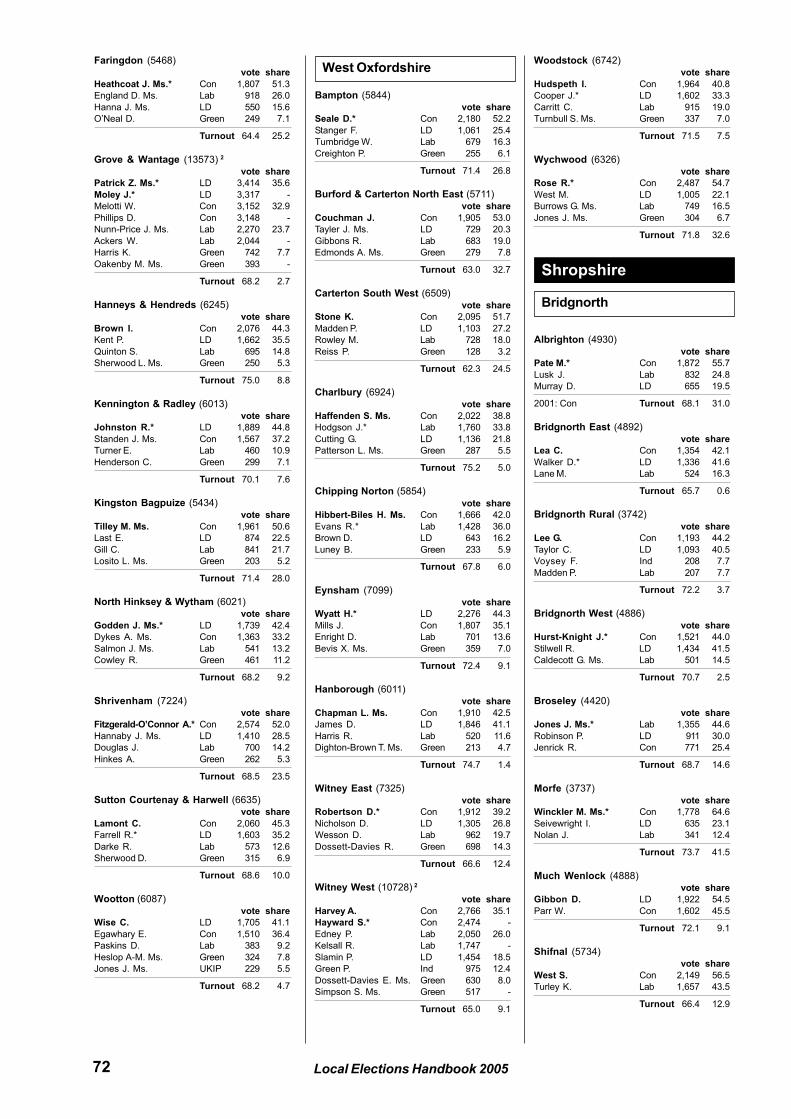
72 Local Elections Handbook 2005
Faringdon (5468)
vote share
Heathcoat J. Ms.* Con 1,807 51.3
England D. Ms. Lab 918 26.0
Hanna J. Ms. LD 550 15.6
O’Neal D. Green 249 7.1
Turnout 64.4 25.2
Grove & Wantage (13573) 2
vote share
Patrick Z. Ms.* LD 3,414 35.6
Moley J.* LD 3,317 -
Melotti W. Con 3,152 32.9
Phillips D. Con 3,148 -
Nunn-Price J. Ms. Lab 2,270 23.7
Ackers W. Lab 2,044 -
Harris K. Green 742 7.7
Oakenby M. Ms. Green 393 -
Turnout 68.2 2.7
Hanneys & Hendreds (6245)
vote share
Brown I. Con 2,076 44.3
Kent P. LD 1,662 35.5
Quinton S. Lab 695 14.8
Sherwood L. Ms. Green 250 5.3
Turnout 75.0 8.8
Kennington & Radley (6013)
vote share
Johnston R.* LD 1,889 44.8
Standen J. Ms. Con 1,567 37.2
Turner E. Lab 460 10.9
Henderson C. Green 299 7.1
Turnout 70.1 7.6
Kingston Bagpuize (5434)
vote share
Tilley M. Ms. Con 1,961 50.6
Last E. LD 874 22.5
Gill C. Lab 841 21.7
Losito L. Ms. Green 203 5.2
Turnout 71.4 28.0
North Hinksey & Wytham (6021)
vote share
Godden J. Ms.* LD 1,739 42.4
Dykes A. Ms. Con 1,363 33.2
Salmon J. Ms. Lab 541 13.2
Cowley R. Green 461 11.2
Turnout 68.2 9.2
Shrivenham (7224)
vote share
Fitzgerald-O’Connor A.* Con 2,574 52.0
Hannaby J. Ms. LD 1,410 28.5
Douglas J. Lab 700 14.2
Hinkes A. Green 262 5.3
Turnout 68.5 23.5
Sutton Courtenay & Harwell (6635)
vote share
Lamont C. Con 2,060 45.3
Farrell R.* LD 1,603 35.2
Darke R. Lab 573 12.6
Sherwood D. Green 315 6.9
Turnout 68.6 10.0
Wootton (6087)
vote share
Wise C. LD 1,705 41.1
Egawhary E. Con 1,510 36.4
Paskins D. Lab 383 9.2
Heslop A-M. Ms. Green 324 7.8
Jones J. Ms. UKIP 229 5.5
Turnout 68.2 4.7
Bampton (5844)
vote share
Seale D.* Con 2,180 52.2
Stanger F. LD 1,061 25.4
Tumbridge W. Lab 679 16.3
Creighton P. Green 255 6.1
Turnout 71.4 26.8
Burford & Carterton North East (5711)
vote share
Couchman J. Con 1,905 53.0
Tayler J. Ms. LD 729 20.3
Gibbons R. Lab 683 19.0
Edmonds A. Ms. Green 279 7.8
Turnout 63.0 32.7
Carterton South West (6509)
vote share
Stone K. Con 2,095 51.7
Madden P. LD 1,103 27.2
Rowley M. Lab 728 18.0
Reiss P. Green 128 3.2
Turnout 62.3 24.5
Charlbury (6924)
vote share
Haffenden S. Ms. Con 2,022 38.8
Hodgson J.* Lab 1,760 33.8
Cutting G. LD 1,136 21.8
Patterson L. Ms. Green 287 5.5
Turnout 75.2 5.0
Chipping Norton (5854)
vote share
Hibbert-Biles H. Ms. Con 1,666 42.0
Evans R.* Lab 1,428 36.0
Brown D. LD 643 16.2
Luney B. Green 233 5.9
Turnout 67.8 6.0
Eynsham (7099)
vote share
Wyatt H.* LD 2,276 44.3
Mills J. Con 1,807 35.1
Enright D. Lab 701 13.6
Bevis X. Ms. Green 359 7.0
Turnout 72.4 9.1
Hanborough (6011)
vote share
Chapman L. Ms. Con 1,910 42.5
James D. LD 1,846 41.1
Harris R. Lab 520 11.6
Dighton-Brown T. Ms. Green 213 4.7
Turnout 74.7 1.4
Witney East (7325)
vote share
Robertson D.* Con 1,912 39.2
Nicholson D. LD 1,305 26.8
Wesson D. Lab 962 19.7
Dossett-Davies R. Green 698 14.3
Turnout 66.6 12.4
Witney West (10728) 2
vote share
Harvey A. Con 2,766 35.1
Hayward S.* Con 2,474 -
Edney P. Lab 2,050 26.0
Kelsall R. Lab 1,747 -
Slamin P. LD 1,454 18.5
Green P. Ind 975 12.4
Dossett-Davies E. Ms. Green 630 8.0
Simpson S. Ms. Green 517 -
Turnout 65.0 9.1
Woodstock (6742)
vote share
Hudspeth I. Con 1,964 40.8
Cooper J.* LD 1,602 33.3
Carritt C. Lab 915 19.0
Turnbull S. Ms. Green 337 7.0
Turnout 71.5 7.5
Wychwood (6326)
vote share
Rose R.* Con 2,487 54.7
West M. LD 1,005 22.1
Burrows G. Ms. Lab 749 16.5
Jones J. Ms. Green 304 6.7
Turnout 71.8 32.6
Albrighton (4930)
vote share
Pate M.* Con 1,872 55.7
Lusk J. Lab 832 24.8
Murray D. LD 655 19.5
2001: Con Turnout 68.1 31.0
Bridgnorth East (4892)
vote share
Lea C. Con 1,354 42.1
Walker D.* LD 1,336 41.6
Lane M. Lab 524 16.3
Turnout 65.7 0.6
Bridgnorth Rural (3742)
vote share
Lee G. Con 1,193 44.2
Taylor C. LD 1,093 40.5
Voysey F. Ind 208 7.7
Madden P. Lab 207 7.7
Turnout 72.2 3.7
Bridgnorth West (4886)
vote share
Hurst-Knight J.* Con 1,521 44.0
Stilwell R. LD 1,434 41.5
Caldecott G. Ms. Lab 501 14.5
Turnout 70.7 2.5
Broseley (4420)
vote share
Jones J. Ms.* Lab 1,355 44.6
Robinson P. LD 911 30.0
Jenrick R. Con 771 25.4
Turnout 68.7 14.6
Morfe (3737)
vote share
Winckler M. Ms.* Con 1,778 64.6
Seivewright I. LD 635 23.1
Nolan J. Lab 341 12.4
Turnout 73.7 41.5
Much Wenlock (4888)
vote share
Gibbon D. LD 1,922 54.5
Parr W. Con 1,602 45.5
Turnout 72.1 9.1
Shifnal (5734)
vote share
West S. Con 2,149 56.5
Turley K. Lab 1,657 43.5
Turnout 66.4 12.9
West Oxfordshire
Bridgnorth
Shropshire
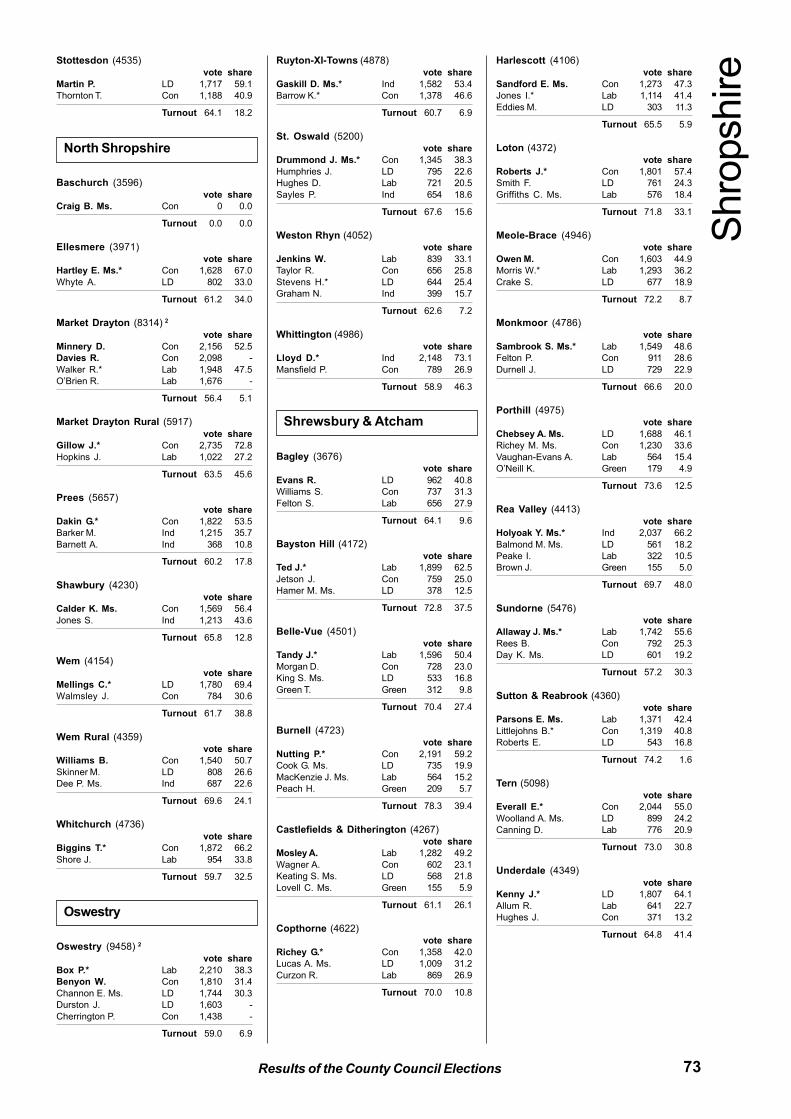
73Results of the County Council Elections
Stottesdon (4535)
vote share
Martin P. LD 1,717 59.1
Thornton T. Con 1,188 40.9
Turnout 64.1 18.2
Baschurch (3596)
vote share
Craig B. Ms. Con 0 0.0
Turnout 0.0 0.0
Ellesmere (3971)
vote share
Hartley E. Ms.* Con 1,628 67.0
Whyte A. LD 802 33.0
Turnout 61.2 34.0
Market Drayton (8314) 2
vote share
Minnery D. Con 2,156 52.5
Davies R. Con 2,098 -
Walker R.* Lab 1,948 47.5
O’Brien R. Lab 1,676 -
Turnout 56.4 5.1
Market Drayton Rural (5917)
vote share
Gillow J.* Con 2,735 72.8
Hopkins J. Lab 1,022 27.2
Turnout 63.5 45.6
Prees (5657)
vote share
Dakin G.* Con 1,822 53.5
Barker M. Ind 1,215 35.7
Barnett A. Ind 368 10.8
Turnout 60.2 17.8
Shawbury (4230)
vote share
Calder K. Ms. Con 1,569 56.4
Jones S. Ind 1,213 43.6
Turnout 65.8 12.8
Wem (4154)
vote share
Mellings C.* LD 1,780 69.4
Walmsley J. Con 784 30.6
Turnout 61.7 38.8
Wem Rural (4359)
vote share
Williams B. Con 1,540 50.7
Skinner M. LD 808 26.6
Dee P. Ms. Ind 687 22.6
Turnout 69.6 24.1
Whitchurch (4736)
vote share
Biggins T.* Con 1,872 66.2
Shore J. Lab 954 33.8
Turnout 59.7 32.5
Oswestry (9458) 2
vote share
Box P.* Lab 2,210 38.3
Benyon W. Con 1,810 31.4
Channon E. Ms. LD 1,744 30.3
Durston J. LD 1,603 -
Cherrington P. Con 1,438 -
Turnout 59.0 6.9
Ruyton-XI-Towns (4878)
vote share
Gaskill D. Ms.* Ind 1,582 53.4
Barrow K.* Con 1,378 46.6
Turnout 60.7 6.9
St. Oswald (5200)
vote share
Drummond J. Ms.* Con 1,345 38.3
Humphries J. LD 795 22.6
Hughes D. Lab 721 20.5
Sayles P. Ind 654 18.6
Turnout 67.6 15.6
Weston Rhyn (4052)
vote share
Jenkins W. Lab 839 33.1
Taylor R. Con 656 25.8
Stevens H.* LD 644 25.4
Graham N. Ind 399 15.7
Turnout 62.6 7.2
Whittington (4986)
vote share
Lloyd D.* Ind 2,148 73.1
Mansfield P. Con 789 26.9
Turnout 58.9 46.3
Bagley (3676)
vote share
Evans R. LD 962 40.8
Williams S. Con 737 31.3
Felton S. Lab 656 27.9
Turnout 64.1 9.6
Bayston Hill (4172)
vote share
Ted J.* Lab 1,899 62.5
Jetson J. Con 759 25.0
Hamer M. Ms. LD 378 12.5
Turnout 72.8 37.5
Belle-Vue (4501)
vote share
Tandy J.* Lab 1,596 50.4
Morgan D. Con 728 23.0
King S. Ms. LD 533 16.8
Green T. Green 312 9.8
Turnout 70.4 27.4
Burnell (4723)
vote share
Nutting P.* Con 2,191 59.2
Cook G. Ms. LD 735 19.9
MacKenzie J. Ms. Lab 564 15.2
Peach H. Green 209 5.7
Turnout 78.3 39.4
Castlefields & Ditherington (4267)
vote share
Mosley A. Lab 1,282 49.2
Wagner A. Con 602 23.1
Keating S. Ms. LD 568 21.8
Lovell C. Ms. Green 155 5.9
Turnout 61.1 26.1
Copthorne (4622)
vote share
Richey G.* Con 1,358 42.0
Lucas A. Ms. LD 1,009 31.2
Curzon R. Lab 869 26.9
Turnout 70.0 10.8
Harlescott (4106)
vote share
Sandford E. Ms. Con 1,273 47.3
Jones I.* Lab 1,114 41.4
Eddies M. LD 303 11.3
Turnout 65.5 5.9
Loton (4372)
vote share
Roberts J.* Con 1,801 57.4
Smith F. LD 761 24.3
Griffiths C. Ms. Lab 576 18.4
Turnout 71.8 33.1
Meole-Brace (4946)
vote share
Owen M. Con 1,603 44.9
Morris W.* Lab 1,293 36.2
Crake S. LD 677 18.9
Turnout 72.2 8.7
Monkmoor (4786)
vote share
Sambrook S. Ms.* Lab 1,549 48.6
Felton P. Con 911 28.6
Durnell J. LD 729 22.9
Turnout 66.6 20.0
Porthill (4975)
vote share
Chebsey A. Ms. LD 1,688 46.1
Richey M. Ms. Con 1,230 33.6
Vaughan-Evans A. Lab 564 15.4
O’Neill K. Green 179 4.9
Turnout 73.6 12.5
Rea Valley (4413)
vote share
Holyoak Y. Ms.* Ind 2,037 66.2
Balmond M. Ms. LD 561 18.2
Peake I. Lab 322 10.5
Brown J. Green 155 5.0
Turnout 69.7 48.0
Sundorne (5476)
vote share
Allaway J. Ms.* Lab 1,742 55.6
Rees B. Con 792 25.3
Day K. Ms. LD 601 19.2
Turnout 57.2 30.3
Sutton & Reabrook (4360)
vote share
Parsons E. Ms. Lab 1,371 42.4
Littlejohns B.* Con 1,319 40.8
Roberts E. LD 543 16.8
Turnout 74.2 1.6
Tern (5098)
vote share
Everall E.* Con 2,044 55.0
Woolland A. Ms. LD 899 24.2
Canning D. Lab 776 20.9
Turnout 73.0 30.8
Underdale (4349)
vote share
Kenny J.* LD 1,807 64.1
Allum R. Lab 641 22.7
Hughes J. Con 371 13.2
Turnout 64.8 41.4
North Shropshire
Oswestry
Shro
pshire
Shrewsbury & Atcham
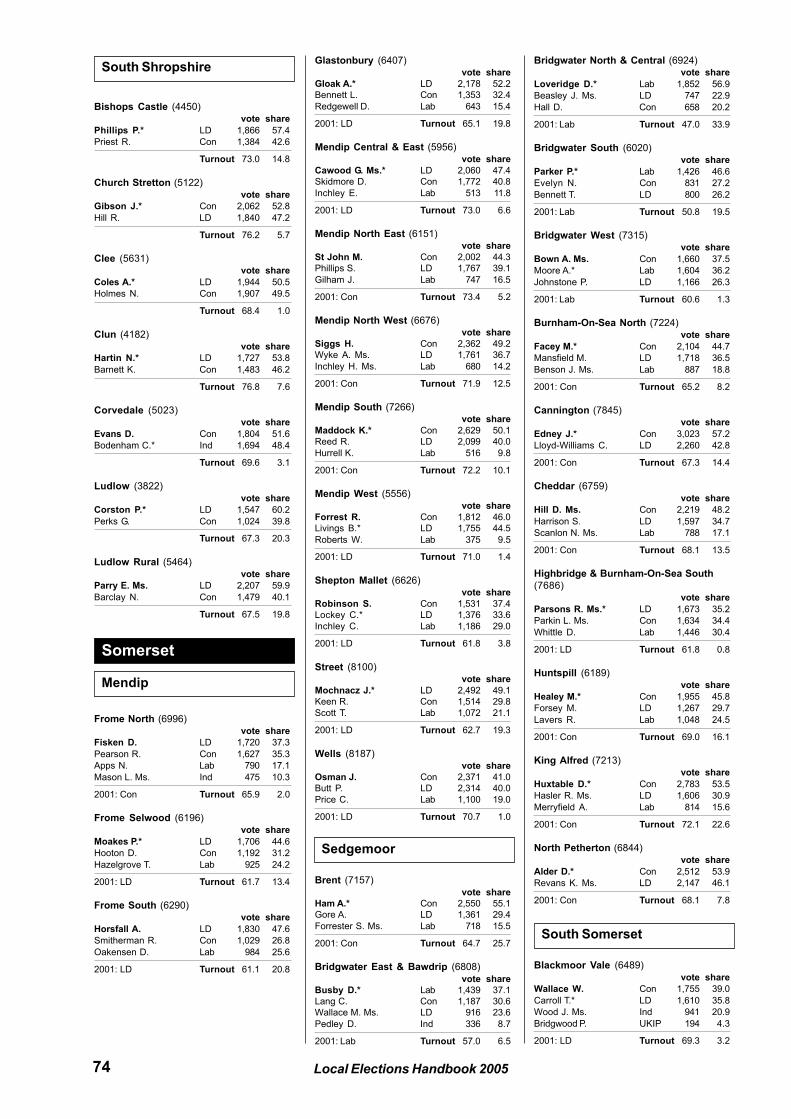
74 Local Elections Handbook 2005
Bishops Castle (4450)
vote share
Phillips P.* LD 1,866 57.4
Priest R. Con 1,384 42.6
Turnout 73.0 14.8
Church Stretton (5122)
vote share
Gibson J.* Con 2,062 52.8
Hill R. LD 1,840 47.2
Turnout 76.2 5.7
Clee (5631)
vote share
Coles A.* LD 1,944 50.5
Holmes N. Con 1,907 49.5
Turnout 68.4 1.0
Clun (4182)
vote share
Hartin N.* LD 1,727 53.8
Barnett K. Con 1,483 46.2
Turnout 76.8 7.6
Corvedale (5023)
vote share
Evans D. Con 1,804 51.6
Bodenham C.* Ind 1,694 48.4
Turnout 69.6 3.1
Ludlow (3822)
vote share
Corston P.* LD 1,547 60.2
Perks G. Con 1,024 39.8
Turnout 67.3 20.3
Ludlow Rural (5464)
vote share
Parry E. Ms. LD 2,207 59.9
Barclay N. Con 1,479 40.1
Turnout 67.5 19.8
Frome North (6996)
vote share
Fisken D. LD 1,720 37.3
Pearson R. Con 1,627 35.3
Apps N. Lab 790 17.1
Mason L. Ms. Ind 475 10.3
2001: Con Turnout 65.9 2.0
Frome Selwood (6196)
vote share
Moakes P.* LD 1,706 44.6
Hooton D. Con 1,192 31.2
Hazelgrove T. Lab 925 24.2
2001: LD Turnout 61.7 13.4
Frome South (6290)
vote share
Horsfall A. LD 1,830 47.6
Smitherman R. Con 1,029 26.8
Oakensen D. Lab 984 25.6
2001: LD Turnout 61.1 20.8
Glastonbury (6407)
vote share
Gloak A.* LD 2,178 52.2
Bennett L. Con 1,353 32.4
Redgewell D. Lab 643 15.4
2001: LD Turnout 65.1 19.8
Mendip Central & East (5956)
vote share
Cawood G. Ms.* LD 2,060 47.4
Skidmore D. Con 1,772 40.8
Inchley E. Lab 513 11.8
2001: LD Turnout 73.0 6.6
Mendip North East (6151)
vote share
St John M. Con 2,002 44.3
Phillips S. LD 1,767 39.1
Gilham J. Lab 747 16.5
2001: Con Turnout 73.4 5.2
Mendip North West (6676)
vote share
Siggs H. Con 2,362 49.2
Wyke A. Ms. LD 1,761 36.7
Inchley H. Ms. Lab 680 14.2
2001: Con Turnout 71.9 12.5
Mendip South (7266)
vote share
Maddock K.* Con 2,629 50.1
Reed R. LD 2,099 40.0
Hurrell K. Lab 516 9.8
2001: Con Turnout 72.2 10.1
Mendip West (5556)
vote share
Forrest R. Con 1,812 46.0
Livings B.* LD 1,755 44.5
Roberts W. Lab 375 9.5
2001: LD Turnout 71.0 1.4
Shepton Mallet (6626)
vote share
Robinson S. Con 1,531 37.4
Lockey C.* LD 1,376 33.6
Inchley C. Lab 1,186 29.0
2001: LD Turnout 61.8 3.8
Street (8100)
vote share
Mochnacz J.* LD 2,492 49.1
Keen R. Con 1,514 29.8
Scott T. Lab 1,072 21.1
2001: LD Turnout 62.7 19.3
Wells (8187)
vote share
Osman J. Con 2,371 41.0
Butt P. LD 2,314 40.0
Price C. Lab 1,100 19.0
2001: LD Turnout 70.7 1.0
Brent (7157)
vote share
Ham A.* Con 2,550 55.1
Gore A. LD 1,361 29.4
Forrester S. Ms. Lab 718 15.5
2001: Con Turnout 64.7 25.7
Bridgwater East & Bawdrip (6808)
vote share
Busby D.* Lab 1,439 37.1
Lang C. Con 1,187 30.6
Wallace M. Ms. LD 916 23.6
Pedley D. Ind 336 8.7
2001: Lab Turnout 57.0 6.5
Bridgwater North & Central (6924)
vote share
Loveridge D.* Lab 1,852 56.9
Beasley J. Ms. LD 747 22.9
Hall D. Con 658 20.2
2001: Lab Turnout 47.0 33.9
Bridgwater South (6020)
vote share
Parker P.* Lab 1,426 46.6
Evelyn N. Con 831 27.2
Bennett T. LD 800 26.2
2001: Lab Turnout 50.8 19.5
Bridgwater West (7315)
vote share
Bown A. Ms. Con 1,660 37.5
Moore A.* Lab 1,604 36.2
Johnstone P. LD 1,166 26.3
2001: Lab Turnout 60.6 1.3
Burnham-On-Sea North (7224)
vote share
Facey M.* Con 2,104 44.7
Mansfield M. LD 1,718 36.5
Benson J. Ms. Lab 887 18.8
2001: Con Turnout 65.2 8.2
Cannington (7845)
vote share
Edney J.* Con 3,023 57.2
Lloyd-Williams C. LD 2,260 42.8
2001: Con Turnout 67.3 14.4
Cheddar (6759)
vote share
Hill D. Ms. Con 2,219 48.2
Harrison S. LD 1,597 34.7
Scanlon N. Ms. Lab 788 17.1
2001: Con Turnout 68.1 13.5
Highbridge & Burnham-On-Sea South
(7686)
vote share
Parsons R. Ms.* LD 1,673 35.2
Parkin L. Ms. Con 1,634 34.4
Whittle D. Lab 1,446 30.4
2001: LD Turnout 61.8 0.8
Huntspill (6189)
vote share
Healey M.* Con 1,955 45.8
Forsey M. LD 1,267 29.7
Lavers R. Lab 1,048 24.5
2001: Con Turnout 69.0 16.1
King Alfred (7213)
vote share
Huxtable D.* Con 2,783 53.5
Hasler R. Ms. LD 1,606 30.9
Merryfield A. Lab 814 15.6
2001: Con Turnout 72.1 22.6
North Petherton (6844)
vote share
Alder D.* Con 2,512 53.9
Revans K. Ms. LD 2,147 46.1
2001: Con Turnout 68.1 7.8
Blackmoor Vale (6489)
vote share
Wallace W. Con 1,755 39.0
Carroll T.* LD 1,610 35.8
Wood J. Ms. Ind 941 20.9
Bridgwood P. UKIP 194 4.3
2001: LD Turnout 69.3 3.2
South Shropshire
Mendip
Somerset
Sedgemoor
South Somerset
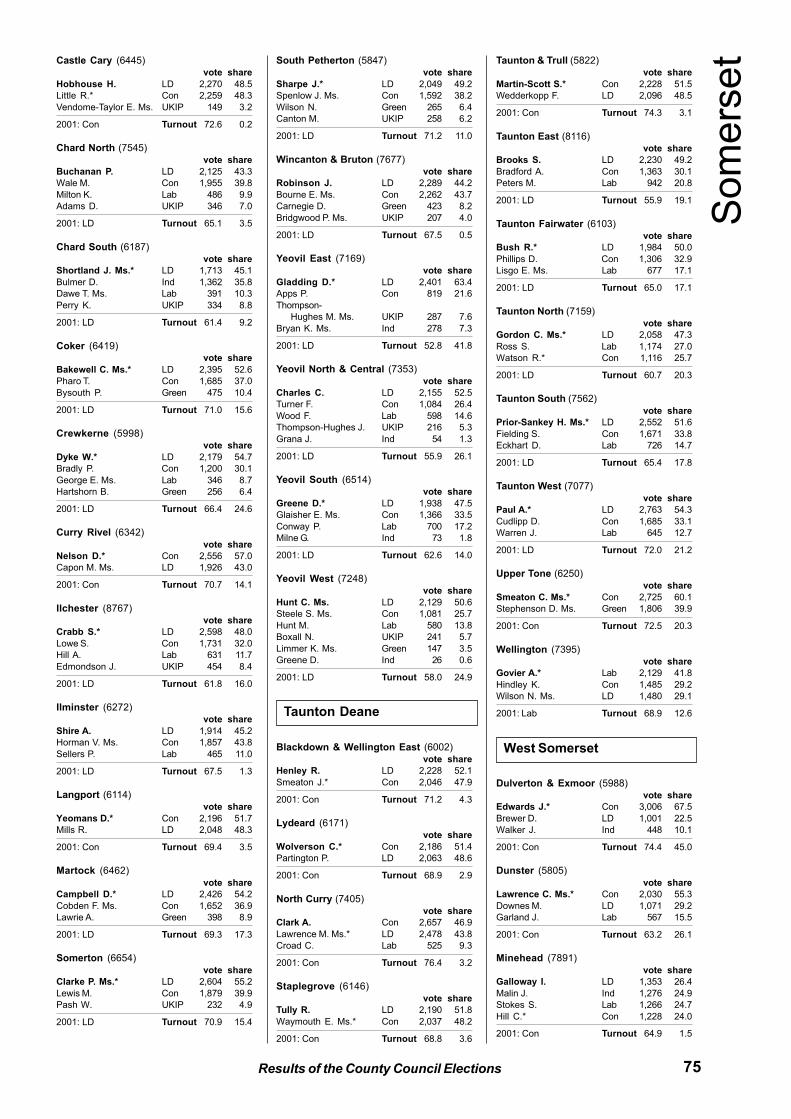
75Results of the County Council Elections
Castle Cary (6445)
vote share
Hobhouse H. LD 2,270 48.5
Little R.* Con 2,259 48.3
Vendome-Taylor E. Ms. UKIP 149 3.2
2001: Con Turnout 72.6 0.2
Chard North (7545)
vote share
Buchanan P. LD 2,125 43.3
Wale M. Con 1,955 39.8
Milton K. Lab 486 9.9
Adams D. UKIP 346 7.0
2001: LD Turnout 65.1 3.5
Chard South (6187)
vote share
Shortland J. Ms.* LD 1,713 45.1
Bulmer D. Ind 1,362 35.8
Dawe T. Ms. Lab 391 10.3
Perry K. UKIP 334 8.8
2001: LD Turnout 61.4 9.2
Coker (6419)
vote share
Bakewell C. Ms.* LD 2,395 52.6
Pharo T. Con 1,685 37.0
Bysouth P. Green 475 10.4
2001: LD Turnout 71.0 15.6
Crewkerne (5998)
vote share
Dyke W.* LD 2,179 54.7
Bradly P. Con 1,200 30.1
George E. Ms. Lab 346 8.7
Hartshorn B. Green 256 6.4
2001: LD Turnout 66.4 24.6
Curry Rivel (6342)
vote share
Nelson D.* Con 2,556 57.0
Capon M. Ms. LD 1,926 43.0
2001: Con Turnout 70.7 14.1
Ilchester (8767)
vote share
Crabb S.* LD 2,598 48.0
Lowe S. Con 1,731 32.0
Hill A. Lab 631 11.7
Edmondson J. UKIP 454 8.4
2001: LD Turnout 61.8 16.0
Ilminster (6272)
vote share
Shire A. LD 1,914 45.2
Horman V. Ms. Con 1,857 43.8
Sellers P. Lab 465 11.0
2001: LD Turnout 67.5 1.3
Langport (6114)
vote share
Yeomans D.* Con 2,196 51.7
Mills R. LD 2,048 48.3
2001: Con Turnout 69.4 3.5
Martock (6462)
vote share
Campbell D.* LD 2,426 54.2
Cobden F. Ms. Con 1,652 36.9
Lawrie A. Green 398 8.9
2001: LD Turnout 69.3 17.3
Somerton (6654)
vote share
Clarke P. Ms.* LD 2,604 55.2
Lewis M. Con 1,879 39.9
Pash W. UKIP 232 4.9
2001: LD Turnout 70.9 15.4
South Petherton (5847)
vote share
Sharpe J.* LD 2,049 49.2
Spenlow J. Ms. Con 1,592 38.2
Wilson N. Green 265 6.4
Canton M. UKIP 258 6.2
2001: LD Turnout 71.2 11.0
Wincanton & Bruton (7677)
vote share
Robinson J. LD 2,289 44.2
Bourne E. Ms. Con 2,262 43.7
Carnegie D. Green 423 8.2
Bridgwood P. Ms. UKIP 207 4.0
2001: LD Turnout 67.5 0.5
Yeovil East (7169)
vote share
Gladding D.* LD 2,401 63.4
Apps P. Con 819 21.6
Thompson-
Hughes M. Ms. UKIP 287 7.6
Bryan K. Ms. Ind 278 7.3
2001: LD Turnout 52.8 41.8
Yeovil North & Central (7353)
vote share
Charles C. LD 2,155 52.5
Turner F. Con 1,084 26.4
Wood F. Lab 598 14.6
Thompson-Hughes J. UKIP 216 5.3
Grana J. Ind 54 1.3
2001: LD Turnout 55.9 26.1
Yeovil South (6514)
vote share
Greene D.* LD 1,938 47.5
Glaisher E. Ms. Con 1,366 33.5
Conway P. Lab 700 17.2
Milne G. Ind 73 1.8
2001: LD Turnout 62.6 14.0
Yeovil West (7248)
vote share
Hunt C. Ms. LD 2,129 50.6
Steele S. Ms. Con 1,081 25.7
Hunt M. Lab 580 13.8
Boxall N. UKIP 241 5.7
Limmer K. Ms. Green 147 3.5
Greene D. Ind 26 0.6
2001: LD Turnout 58.0 24.9
Blackdown & Wellington East (6002)
vote share
Henley R. LD 2,228 52.1
Smeaton J.* Con 2,046 47.9
2001: Con Turnout 71.2 4.3
Lydeard (6171)
vote share
Wolverson C.* Con 2,186 51.4
Partington P. LD 2,063 48.6
2001: Con Turnout 68.9 2.9
North Curry (7405)
vote share
Clark A. Con 2,657 46.9
Lawrence M. Ms.* LD 2,478 43.8
Croad C. Lab 525 9.3
2001: Con Turnout 76.4 3.2
Staplegrove (6146)
vote share
Tully R. LD 2,190 51.8
Waymouth E. Ms.* Con 2,037 48.2
2001: Con Turnout 68.8 3.6
Taunton & Trull (5822)
vote share
Martin-Scott S.* Con 2,228 51.5
Wedderkopp F. LD 2,096 48.5
2001: Con Turnout 74.3 3.1
Taunton East (8116)
vote share
Brooks S. LD 2,230 49.2
Bradford A. Con 1,363 30.1
Peters M. Lab 942 20.8
2001: LD Turnout 55.9 19.1
Taunton Fairwater (6103)
vote share
Bush R.* LD 1,984 50.0
Phillips D. Con 1,306 32.9
Lisgo E. Ms. Lab 677 17.1
2001: LD Turnout 65.0 17.1
Taunton North (7159)
vote share
Gordon C. Ms.* LD 2,058 47.3
Ross S. Lab 1,174 27.0
Watson R.* Con 1,116 25.7
2001: LD Turnout 60.7 20.3
Taunton South (7562)
vote share
Prior-Sankey H. Ms.* LD 2,552 51.6
Fielding S. Con 1,671 33.8
Eckhart D. Lab 726 14.7
2001: LD Turnout 65.4 17.8
Taunton West (7077)
vote share
Paul A.* LD 2,763 54.3
Cudlipp D. Con 1,685 33.1
Warren J. Lab 645 12.7
2001: LD Turnout 72.0 21.2
Upper Tone (6250)
vote share
Smeaton C. Ms.* Con 2,725 60.1
Stephenson D. Ms. Green 1,806 39.9
2001: Con Turnout 72.5 20.3
Wellington (7395)
vote share
Govier A.* Lab 2,129 41.8
Hindley K. Con 1,485 29.2
Wilson N. Ms. LD 1,480 29.1
2001: Lab Turnout 68.9 12.6
Dulverton & Exmoor (5988)
vote share
Edwards J.* Con 3,006 67.5
Brewer D. LD 1,001 22.5
Walker J. Ind 448 10.1
2001: Con Turnout 74.4 45.0
Dunster (5805)
vote share
Lawrence C. Ms.* Con 2,030 55.3
Downes M. LD 1,071 29.2
Garland J. Lab 567 15.5
2001: Con Turnout 63.2 26.1
Minehead (7891)
vote share
Galloway I. LD 1,353 26.4
Malin J. Ind 1,276 24.9
Stokes S. Lab 1,266 24.7
Hill C.* Con 1,228 24.0
2001: Con Turnout 64.9 1.5
Som
ers
et
Taunton Deane
West Somerset
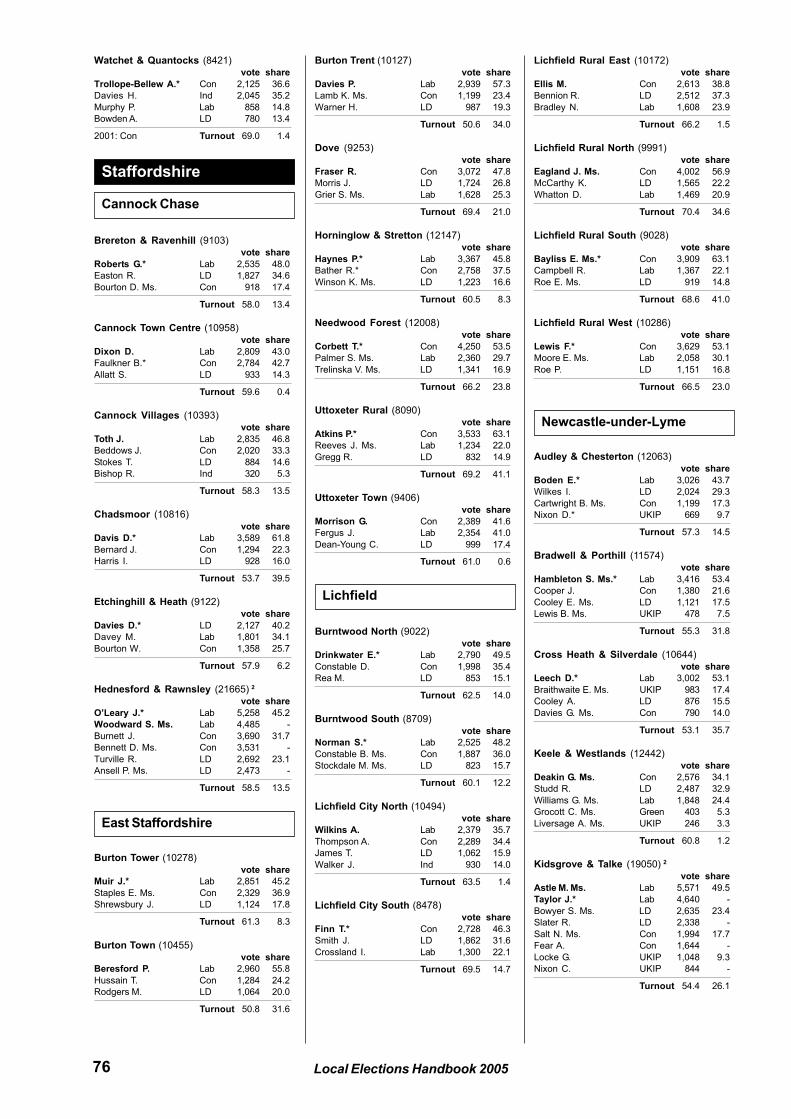
76 Local Elections Handbook 2005
Watchet & Quantocks (8421)
vote share
Trollope-Bellew A.* Con 2,125 36.6
Davies H. Ind 2,045 35.2
Murphy P. Lab 858 14.8
Bowden A. LD 780 13.4
2001: Con Turnout 69.0 1.4
Brereton & Ravenhill (9103)
vote share
Roberts G.* Lab 2,535 48.0
Easton R. LD 1,827 34.6
Bourton D. Ms. Con 918 17.4
Turnout 58.0 13.4
Cannock Town Centre (10958)
vote share
Dixon D. Lab 2,809 43.0
Faulkner B.* Con 2,784 42.7
Allatt S. LD 933 14.3
Turnout 59.6 0.4
Cannock Villages (10393)
vote share
Toth J. Lab 2,835 46.8
Beddows J. Con 2,020 33.3
Stokes T. LD 884 14.6
Bishop R. Ind 320 5.3
Turnout 58.3 13.5
Chadsmoor (10816)
vote share
Davis D.* Lab 3,589 61.8
Bernard J. Con 1,294 22.3
Harris I. LD 928 16.0
Turnout 53.7 39.5
Etchinghill & Heath (9122)
vote share
Davies D.* LD 2,127 40.2
Davey M. Lab 1,801 34.1
Bourton W. Con 1,358 25.7
Turnout 57.9 6.2
Hednesford & Rawnsley (21665) 2
vote share
O’Leary J.* Lab 5,258 45.2
Woodward S. Ms. Lab 4,485 -
Burnett J. Con 3,690 31.7
Bennett D. Ms. Con 3,531 -
Turville R. LD 2,692 23.1
Ansell P. Ms. LD 2,473 -
Turnout 58.5 13.5
Burton Tower (10278)
vote share
Muir J.* Lab 2,851 45.2
Staples E. Ms. Con 2,329 36.9
Shrewsbury J. LD 1,124 17.8
Turnout 61.3 8.3
Burton Town (10455)
vote share
Beresford P. Lab 2,960 55.8
Hussain T. Con 1,284 24.2
Rodgers M. LD 1,064 20.0
Turnout 50.8 31.6
Burton Trent (10127)
vote share
Davies P. Lab 2,939 57.3
Lamb K. Ms. Con 1,199 23.4
Warner H. LD 987 19.3
Turnout 50.6 34.0
Dove (9253)
vote share
Fraser R. Con 3,072 47.8
Morris J. LD 1,724 26.8
Grier S. Ms. Lab 1,628 25.3
Turnout 69.4 21.0
Horninglow & Stretton (12147)
vote share
Haynes P.* Lab 3,367 45.8
Bather R.* Con 2,758 37.5
Winson K. Ms. LD 1,223 16.6
Turnout 60.5 8.3
Needwood Forest (12008)
vote share
Corbett T.* Con 4,250 53.5
Palmer S. Ms. Lab 2,360 29.7
Trelinska V. Ms. LD 1,341 16.9
Turnout 66.2 23.8
Uttoxeter Rural (8090)
vote share
Atkins P.* Con 3,533 63.1
Reeves J. Ms. Lab 1,234 22.0
Gregg R. LD 832 14.9
Turnout 69.2 41.1
Uttoxeter Town (9406)
vote share
Morrison G. Con 2,389 41.6
Fergus J. Lab 2,354 41.0
Dean-Young C. LD 999 17.4
Turnout 61.0 0.6
Burntwood North (9022)
vote share
Drinkwater E.* Lab 2,790 49.5
Constable D. Con 1,998 35.4
Rea M. LD 853 15.1
Turnout 62.5 14.0
Burntwood South (8709)
vote share
Norman S.* Lab 2,525 48.2
Constable B. Ms. Con 1,887 36.0
Stockdale M. Ms. LD 823 15.7
Turnout 60.1 12.2
Lichfield City North (10494)
vote share
Wilkins A. Lab 2,379 35.7
Thompson A. Con 2,289 34.4
James T. LD 1,062 15.9
Walker J. Ind 930 14.0
Turnout 63.5 1.4
Lichfield City South (8478)
vote share
Finn T.* Con 2,728 46.3
Smith J. LD 1,862 31.6
Crossland I. Lab 1,300 22.1
Turnout 69.5 14.7
Lichfield Rural East (10172)
vote share
Ellis M. Con 2,613 38.8
Bennion R. LD 2,512 37.3
Bradley N. Lab 1,608 23.9
Turnout 66.2 1.5
Lichfield Rural North (9991)
vote share
Eagland J. Ms. Con 4,002 56.9
McCarthy K. LD 1,565 22.2
Whatton D. Lab 1,469 20.9
Turnout 70.4 34.6
Lichfield Rural South (9028)
vote share
Bayliss E. Ms.* Con 3,909 63.1
Campbell R. Lab 1,367 22.1
Roe E. Ms. LD 919 14.8
Turnout 68.6 41.0
Lichfield Rural West (10286)
vote share
Lewis F.* Con 3,629 53.1
Moore E. Ms. Lab 2,058 30.1
Roe P. LD 1,151 16.8
Turnout 66.5 23.0
Audley & Chesterton (12063)
vote share
Boden E.* Lab 3,026 43.7
Wilkes I. LD 2,024 29.3
Cartwright B. Ms. Con 1,199 17.3
Nixon D.* UKIP 669 9.7
Turnout 57.3 14.5
Bradwell & Porthill (11574)
vote share
Hambleton S. Ms.* Lab 3,416 53.4
Cooper J. Con 1,380 21.6
Cooley E. Ms. LD 1,121 17.5
Lewis B. Ms. UKIP 478 7.5
Turnout 55.3 31.8
Cross Heath & Silverdale (10644)
vote share
Leech D.* Lab 3,002 53.1
Braithwaite E. Ms. UKIP 983 17.4
Cooley A. LD 876 15.5
Davies G. Ms. Con 790 14.0
Turnout 53.1 35.7
Keele & Westlands (12442)
vote share
Deakin G. Ms. Con 2,576 34.1
Studd R. LD 2,487 32.9
Williams G. Ms. Lab 1,848 24.4
Grocott C. Ms. Green 403 5.3
Liversage A. Ms. UKIP 246 3.3
Turnout 60.8 1.2
Kidsgrove & Talke (19050) 2
vote share
Astle M. Ms. Lab 5,571 49.5
Taylor J.* Lab 4,640 -
Bowyer S. Ms. LD 2,635 23.4
Slater R. LD 2,338 -
Salt N. Ms. Con 1,994 17.7
Fear A. Con 1,644 -
Locke G. UKIP 1,048 9.3
Nixon C. UKIP 844 -
Turnout 54.4 26.1
Cannock Chase
Staffordshire
East Staffordshire
Lichfield
Newcastle-under-Lyme
77Results of the County Council Elections
Newcastle Rural (9998)
vote share
Edwards R. Con 3,085 46.5
Howells R. Lab 1,718 25.9
Becket D. LD 1,478 22.3
Bonfiglio J. UKIP 352 5.3
Turnout 66.3 20.6
Newcastle South (11467)
vote share
Gorton R.* Lab 2,798 40.3
Bosley G. Ms. Con 1,885 27.1
Clarke D. LD 1,779 25.6
Gregory P. UKIP 486 7.0
Turnout 60.6 13.1
Wolstanton (9433)
vote share
Clarke M.* Lab 2,383 41.2
Tagg S. Con 2,008 34.7
Shenton E. Ms. LD 979 16.9
Beirne A. Ms. Green 206 3.6
Barlow M. UKIP 205 3.5
Turnout 61.3 6.5
Brewood (8545)
vote share
Roberts R.* Con 3,156 62.7
Jones L. Ms. Lab 1,876 37.3
Turnout 58.9 25.4
Cheslyn Hay Essington & Great Wyrley
(22356) 2
vote share
Perry K. Ms. Con 4,815 44.0
Lawrence M. Con 4,797 -
Boyle T.* Lab 4,633 42.3
Bullock G.* Lab 4,470 -
O’Brien T. Ms. LD 1,492 13.6
Jones R. LD 1,077 -
Turnout 47.6 1.7
Codsall (10046)
vote share
Oatley S. Ms.* Con 3,098 60.5
Gregory J. Lab 1,317 25.7
Sadler I. LD 708 13.8
Turnout 51.0 34.8
Kinver (9320)
[Postponed election held on 23/06/05]
vote share
Edwards B.* Con 2,403 62.5
Simmons R. LD 1,051 27.4
McElduff K. Lab 388 10.1
Turnout 41.2 35.2
Penkridge (11604)
vote share
Downes V. Ms. Con 3,739 50.8
Downing T. Lab 2,568 34.9
Key D. Ms. LD 1,052 14.3
Turnout 63.4 15.9
Perton (10195)
vote share
Marshall R.* Con 2,937 57.1
Randle S. Ms. Lab 1,308 25.4
Smith A. LD 623 12.1
Hinde S. Green 275 5.3
Turnout 50.4 31.7
Wombourne (11966)
vote share
Timms P.* Con 2,441 37.9
Edwards S. Ms. FP 2,360 36.6
Brindle J. Lab 1,065 16.5
Fallon J. LD 583 9.0
Turnout 53.9 1.3
Eccleshall (8639)
vote share
Butter H.* Con 3,378 55.6
Kirby D. LD 1,360 22.4
Kennedy R. Ms. Lab 1,334 22.0
Turnout 70.3 33.2
Gnosall & Doxey (11471)
vote share
Winnington M. Con 3,757 45.8
Stamp B.* LD 2,696 32.8
Nixon A. Lab 1,756 21.4
Turnout 71.6 12.9
Stafford Central (10629)
vote share
Compton M. Ms. Lab 2,990 44.9
Baron C. Ms. LD 1,974 29.6
Stafford N. Con 1,702 25.5
Turnout 62.7 15.2
Stafford North (9331)
vote share
Simpson R.* Lab 3,202 53.1
Philip D. Con 1,690 28.0
Halliday C. Ms. LD 893 14.8
Whitney J. Ms. Green 245 4.1
Turnout 64.6 25.1
Stafford South East (12420)
vote share
Barber M.* Lab 3,741 42.7
Francis J. Con 3,550 40.5
Affleck J. LD 1,475 16.8
Turnout 70.6 2.2
Stafford Trent Valley (10046)
vote share
Bloomer L.* Con 3,273 46.8
McKeown B. LD 1,795 25.7
Kennedy J. Lab 1,629 23.3
Clarke E. Green 296 4.2
Turnout 69.6 21.1
Stafford West (11640)
vote share
Poulter M.* Lab 3,658 50.2
Houlton T. Con 2,171 29.8
James F. LD 1,459 20.0
Turnout 62.6 20.4
Stone Rural (9392)
vote share
Parry I.* Con 3,198 50.3
Wedgwood A. Ms. Lab 1,866 29.3
Russell J. LD 1,298 20.4
Turnout 67.7 20.9
Stone Urban (11739)
vote share
Wakefield V.* Lab 3,138 39.2
Jones P. Con 2,667 33.3
Stevens P. LD 2,210 27.6
Turnout 68.3 5.9
Biddulph North (9969)
vote share
Lovatt M. Ms.* Lab 2,862 43.5
Stone D. LD 1,891 28.7
Adams G. Ind 1,832 27.8
Turnout 66.1 14.7
Biddulph South & Endon (11276)
vote share
Jebb C. Ms.* LD 3,966 57.9
Jackson K. Lab 2,888 42.1
Turnout 60.8 15.7
Caverswall (11172)
vote share
Day W.* Con 3,309 46.7
Hanchard A. Lab 2,359 33.3
Whittaker B. LD 1,414 20.0
Turnout 63.4 13.4
Cheadle & Checkley (11312)
vote share
Perry E.* Con 3,462 50.5
James J. Ms. Lab 2,240 32.6
Silk P. LD 1,159 16.9
Turnout 60.7 17.8
Churnet Valley (10574)
vote share
Mycock R.* Con 3,149 47.6
Ahmad M. Lab 2,144 32.4
Whitfield M. LD 1,317 19.9
Turnout 62.5 15.2
Leek Rural (11347)
vote share
Heath C. Ms.* Con 3,787 48.7
Lovatt M. Ms.* Lab 1,924 24.7
Harrison S. LD 1,044 13.4
Povey S. UKIP 1,028 13.2
Turnout 68.6 23.9
Leek South (11867)
vote share
Podmore N. Con 2,589 33.0
Priestman C. Ms. Lab 2,010 25.6
Cozens M. LD 1,589 20.2
Harrison K. Rate 1,295 16.5
Gater M. Green 369 4.7
Turnout 66.2 7.4
Amington (10341)
vote share
McDermid R. Lab 2,962 48.2
Beale B. Con 2,049 33.4
Gilman A. LD 1,132 18.4
Turnout 59.4 14.9
Bolebridge (9039)
vote share
Smith R.* Lab 2,728 50.2
Lewin I. Con 1,726 31.8
Blake G. LD 982 18.1
Turnout 60.1 18.4
Perrycrofts (9328)
vote share
Garforth J. Lab 2,597 43.7
Gant K. Con 2,256 37.9
Blake J. Ms. LD 1,092 18.4
Turnout 63.7 5.7
South Staffordshire
Sta
fford
shire
Stafford
Staffordshire Moorlands
Tamworth
78 Local Elections Handbook 2005
Stonydelph (10034)
vote share
White P.* Lab 2,149 42.7
Cooke C. Ind 1,216 24.2
Taylor K. Con 1,095 21.8
Cousins P. LD 569 11.3
Turnout 50.1 18.6
Watling North (9004)
vote share
Dix T.* Lab 2,531 48.0
James A. Con 1,870 35.4
Bennion P. Ms. LD 877 16.6
Turnout 58.6 12.5
Watling South (9638)
vote share
Dean C. Ms.* Lab 2,609 43.6
Pritchard R. Con 2,345 39.2
Jones R. LD 1,024 17.1
Turnout 62.0 4.4
Belstead Brook (6590)
vote share
Pollard A. Ms.* LD 1,875 43.8
Cave J. Con 1,497 35.0
Norden J. Ms. Lab 909 21.2
Turnout 65.0 8.8
Cosford (6704)
vote share
Pembroke J.* Con 2,475 50.6
Munson M. Ms. LD 1,422 29.1
Bee R. Lab 996 20.4
Turnout 73.0 21.5
Great Cornard (6041)
vote share
Beer P. Con 1,470 40.2
Gibson W.* Lab 1,268 34.7
Press M. Ms. LD 921 25.2
Turnout 60.6 5.5
Hadleigh (6132)
vote share
Grutchfield D.* LD 1,894 46.2
Quinlan J. Lab 1,209 29.5
Fraulo C. Ms. Con 839 20.4
O’Shaughnessy R. UKIP 162 3.9
Turnout 66.9 16.7
Melford (7593)
vote share
Kemp R.* Ind 2,601 49.5
Burch D. Con 1,644 31.3
Wilson M. Ms. Lab 1,013 19.3
Turnout 69.2 18.2
Peninsula (7802)
vote share
Wood D.* LD 2,792 48.9
Chartier Y. Ms. Con 1,847 32.3
Rawlings K. Lab 1,074 18.8
Turnout 73.2 16.5
Samford (7718)
vote share
Yorke-Edwards W. Con 2,362 39.9
Mayer L. LD 2,175 36.7
Scott C. Lab 1,058 17.9
Smith J. UKIP 330 5.6
Turnout 76.8 3.2
Stour Valley (6142)
vote share
Pryor S.* Con 2,131 46.5
Hurren B. LD 1,699 37.0
Bishton E. Ms. Lab 756 16.5
Turnout 74.7 9.4
Sudbury (6373)
vote share
Owen J. Lab 1,383 35.9
Platt R. LD 1,146 29.7
Smith R. Con 1,019 26.4
Newman E. Ind 307 8.0
Turnout 60.5 6.1
Sudbury East & Waldingfield (6476)
vote share
Spence C. Con 1,633 38.7
Irwin N.* Lab 1,396 33.0
Welsh A. LD 880 20.8
Stedman L. UKIP 316 7.5
Turnout 65.2 5.6
Brandon (6477)
vote share
Bishop W.* Con 1,895 53.3
Brown P. Ms. Lab 964 27.1
Pilborough C. Ms. LD 464 13.0
French J. UKIP 233 6.6
Turnout 54.9 26.2
Exning & Newmarket (8494)
vote share
Sadler W.* Con 1,740 37.1
Dwane P. Lab 1,243 26.5
Radford I. LD 743 15.9
Mills T. WSIA 466 9.9
Levick D. Ind 263 5.6
Hudson D. UKIP 229 4.9
Turnout 55.1 10.6
Mildenhall (6492)
vote share
Pendleton P.* Con 1,638 43.1
Bowman D. Lab 910 23.9
Gunn . Ind 536 14.1
Minshall E. Ms. LD 507 13.3
Hitt H. UKIP 210 5.5
Turnout 58.5 19.2
Newmarket & Red Lodge (6321)
vote share
Chambers L. Ms. Con 1,582 43.7
Andrews-Smith J. Ms. LD 932 25.8
Uney V. Ms. Lab 883 24.4
Whitear D. UKIP 220 6.1
Turnout 57.2 18.0
Row Heath (7319)
vote share
Edwards M. Con 1,838 40.8
Brown C. Lab 993 22.1
Newman R. Ind 667 14.8
Huggan T. LD 587 13.0
Smith I. UKIP 417 9.3
Turnout 61.5 18.8
Bixley (5741)
vote share
Harsant R.* Con 1,972 48.8
Green M. Lab 1,051 26.0
Jones G. LD 1,022 25.3
2001: Con Turnout 70.5 22.8
Bridge (6172)
vote share
Mangar H.* Lab 1,567 47.8
Cenci N. Ms. Con 1,014 30.9
Richardson P. LD 698 21.3
Turnout 53.1 16.9
Chantry (16613) 2
vote share
Rawlingson K.* Lab 4,413 47.8
Rudkin B. Ms.* Lab 3,927 -
Hall R. Con 3,046 33.0
Kenna K. Ms. Con 2,750 -
Holmes O. LD 1,778 19.2
Whitear J. LD 1,450 -
Turnout 57.6 14.8
Gainsborough (7933)
vote share
Quinton W. Lab 2,225 48.2
Sibley J. Ms. Con 1,533 33.2
Chambers R. LD 856 18.6
Turnout 58.2 15.0
Priory Heath (5582)
vote share
Maguire S. Ms. Lab 1,593 51.7
Brown D. Con 865 28.1
Stafford C. Ms. LD 624 20.2
Turnout 55.2 23.6
Rushmere (6980)
vote share
Thomas S. Ms.* Lab 1,869 40.4
Smith E. Ms. Con 1,649 35.7
French C. Ms. LD 1,107 23.9
Turnout 66.3 4.8
St. Helens (6456)
vote share
Lim K. Lab 1,485 39.2
Green P. LD 1,302 34.4
Harsant E. Ms. Con 1,001 26.4
Turnout 58.7 4.8
St. Johns (6204)
vote share
Martin A.* Lab 1,721 43.3
Carnell J. Con 1,238 31.2
Zablok B. LD 1,013 25.5
Turnout 64.0 12.2
St. Margarets & Westgate (14055) 2
vote share
Cann A. LD 3,301 39.6
Lockington I. Ms.* LD 3,181 -
Schubert J. Ms. Con 2,684 32.2
Steed P. Ms. Con 2,681 -
Herod K. Lab 2,352 28.2
Tostevin N.* Lab 1,914 -
Turnout 62.5 7.4
Whitehouse & Whitton (14941) 2
vote share
Lewis A.* Lab 3,513 42.6
Manuel G.* Lab 3,388 -
Goldsmith D. Con 2,759 33.4
Wells S. Con 2,539 -
King G. LD 1,980 24.0
Williams S. LD 1,631 -
Turnout 57.7 9.1
Babergh
Suffolk
Ipswich
Forest Heath
79Results of the County Council Elections
Bosmere (7246)
vote share
Truelove J. Ms. LD 1,640 33.1
Pratt J. Con 1,453 29.4
Higgins J. Lab 779 15.7
Turner M. Ind 648 13.1
Mason I. Ind 428 8.6
Turnout 68.3 3.8
Gipping Valley (6665)
vote share
Field J.* LD 2,028 45.4
Damant M. Con 1,533 34.3
Curno N. Lab 907 20.3
Turnout 67.0 11.1
Hartismere (6926)
vote share
Michell C.* Con 2,627 54.2
Flower R. LD 1,147 23.6
Halton E. Ms. Lab 1,076 22.2
Turnout 70.0 30.5
Hoxne & Eye (6981)
vote share
McGregor G.* Con 2,525 50.4
Hammond C. LD 1,384 27.6
Soule C. Lab 1,104 22.0
Turnout 71.8 22.8
Stowmarket North & Stowupland (6826)
vote share
Ramsey E. Ms. Con 1,743 39.5
Macpherson D.* Lab 1,468 33.3
Groundsell C. LD 804 18.2
Matthissen J. Green 400 9.1
Turnout 64.7 6.2
Stowmarket South (7286)
vote share
Myers-Hewitt K. Con 1,576 34.1
Snell R.* Lab 1,446 31.3
Scarff K. LD 1,036 22.4
Davis B. Ms. Green 563 12.2
Turnout 63.4 2.8
Thedwastre North (7209)
vote share
Storey J. Ms. Con 2,365 47.1
Milward C. Ms. LD 1,708 34.0
Spore S. Ms. Lab 945 18.8
Turnout 69.6 13.1
Thedwastre South (6616)
vote share
Lockett S. Ms. Con 2,247 46.9
Otton P. Ms. LD 1,644 34.3
Britton S. Ms. Lab 898 18.8
Turnout 72.4 12.6
Thredling (7016)
vote share
Alcock E. Con 2,596 51.6
Whitworth H. Ms.* LD 2,431 48.4
Turnout 71.7 3.3
Upper Gipping (7141)
vote share
Clover J.* Con 2,212 42.8
Stringer A. Green 1,875 36.3
Ravenhill M. Ms. Lab 1,076 20.8
Turnout 72.3 6.5
Blackbourn (6745)
vote share
Spicer J. Ms.* Con 2,902 56.0
Fairgrieve A. Ms. Lab 1,132 21.8
Fossati M. Ms. LD 878 16.9
Huckett P. UKIP 273 5.3
Turnout 76.9 34.1
Clare (7449)
vote share
Midwood J. Ms.* Con 3,019 52.0
Warmington L.* LD 2,295 39.5
Lumley J. UKIP 489 8.4
Turnout 77.9 12.5
Eastgate & Moreton Hall (5424)
vote share
Warby F. Con 1,539 39.4
Beckwith T.* Ind 1,305 33.4
Bradbury D. LD 897 23.0
Kisko C. UKIP 166 4.2
Turnout 72.0 6.0
Hardwick (5795)
vote share
Oliver S.* Con 1,827 39.1
Jones A. LD 1,362 29.1
Corfe R. Lab 1,174 25.1
Brundle M. UKIP 312 6.7
Turnout 80.7 9.9
Haverhill Cangle (11226) 2
vote share
French P. Lab 2,411 37.1
Marks T. Con 2,395 36.8
Farthing J. Con 2,348 -
Thomas A. Ms. Lab 2,145 -
Graham M. LD 1,328 20.4
Robinson L. Ms. LD 1,198 -
Gregory D. UKIP 366 5.6
Rapsey F. UKIP 317 -
Turnout 59.9 0.2
Haverhill East & Kedington (6185)
vote share
Knight K. Ms. Con 1,370 35.6
Summers D. Lab 1,190 30.9
McNally T. LD 1,080 28.1
Lumley T. Ms. UKIP 205 5.3
Turnout 62.2 4.7
Thingoe North (6206)
vote share
Hopfensperger R. Ms. Con 2,538 51.8
Tidman C. LD 1,076 22.0
Dawson D. Lab 1,038 21.2
Chessell R. Ms. UKIP 248 5.1
Turnout 79.0 29.8
Thingoe South (6272)
vote share
Clements T. Con 2,571 52.1
Carmichael A. Lab 1,088 22.1
Bradbury C. LD 946 19.2
Attwood W. UKIP 327 6.6
Turnout 78.6 30.1
Tower (13857) 2
vote share
Lockwood D.* Lab 3,181 32.7
Hopfensperger P. Con 2,747 28.3
Nowak R.* Lab 2,720 -
Everitt R. Con 2,663 -
Chappell D. LD 1,738 17.9
Warren D. LD 1,266 -
Lockwood B. UKIP 801 8.2
Nettleton D. Ind 799 8.2
Cook I. UKIP 509 -
Nettleton M. Ms. Ind 498 -
Stacey A. Green 455 4.7
Hunt-Stacey S. Ms. Green 432 -
Turnout 68.6 4.5
Aldeburgh & Leiston (8164)
vote share
Ward R.* Con 2,091 41.1
Girling J. Ms. Lab 1,671 32.8
Hoad L. LD 1,325 26.0
Turnout 62.3 8.3
Blything (7217)
vote share
Leighton R. Con 1,807 38.1
Slater J. LD 1,539 32.4
Jeremy D. Lab 892 18.8
Tricker D. Ind 508 10.7
Turnout 65.8 5.6
Carlford (7009)
vote share
Bellfield P. Con 2,828 55.8
Barrett A. LD 1,324 26.1
Connelly S. Lab 916 18.1
Turnout 72.3 29.7
Felixstowe Coastal (15790) 2
vote share
Rodwell A. Ms. Con 3,757 38.8
Newman G. Con 3,714 -
Paddick D. Ms. LD 3,226 33.3
Ninnmey M. LD 3,087 -
Campbell M. Lab 2,692 27.8
Turnout 63.4 5.5
Felixstowe North & Trimley (7882)
vote share
Goodwin J. Con 1,960 38.8
Rowe D.* Lab 1,754 34.7
Sherratt R. LD 1,339 26.5
Turnout 64.1 4.1
Framlingham (7004)
vote share
Hart C. Con 2,355 48.8
Houseley A. LD 1,645 34.1
Salmon E. Ms. Lab 827 17.1
Turnout 68.9 14.7
Kesgrave & Rushmere St. Andrew (13072) 2
vote share
Klaschka J. Con 3,567 41.3
Hudson S.* Con 3,547 -
Briggs J. LD 2,731 31.6
Goodchild N. Ms. Lab 2,343 27.1
Else R. LD 2,055 -
Robinson S. Lab 1,936 -
Turnout 65.5 9.7
Martlesham (8661)
vote share
O’Brien P. Ms.* Con 2,622 43.1
Kelso J.* LD 2,359 38.7
Guest T. Lab 1,109 18.2
Turnout 70.3 4.3
Mid Suffolk St Edmundsbury
Suffolk
Suffolk Coastal
80 Local Elections Handbook 2005
Wickham (7431)
vote share
Aitchison C. Ms. Con 2,123 43.6
Halliday B. LD 1,590 32.6
Pizzey V. Ms. Lab 1,161 23.8
Turnout 65.6 10.9
Wilford (6371)
vote share
Clarke R. Ms. Con 2,171 50.3
Monk P.* LD 2,147 49.7
Turnout 67.8 0.6
Woodbridge (6438)
vote share
Redsell B. Con 1,720 40.0
Ball D. Ms. LD 1,698 39.5
Burgon R. Lab 884 20.5
Turnout 66.8 0.5
Beccles (11352) 2
vote share
Bee M. Con 3,104 39.0
Taylor J.* Lab 2,757 34.6
Thwaites A.* Lab 2,714 -
Sale K. Con 2,255 -
Mitchell F. Ms. LD 1,280 16.1
Mitchell P. LD 1,139 -
Elliott G. Green 822 10.3
Carroll L. Green 383 -
Turnout 63.7 4.4
Bungay (7212)
vote share
Rose M.* Con 2,061 41.5
Derges L. Ms. Lab 1,361 27.4
Curry W. Ms. LD 1,052 21.2
Kerrison L. Ms. Green 488 9.8
Turnout 68.8 14.1
Gunton (14429) 2
vote share
Patience K. Lab 3,574 41.9
Thomas D.* Lab 2,609 -
Cuss N. Ms. Con 2,256 26.4
Provan D. Con 1,948 -
Anderson P. Ms. LD 1,500 17.6
Guyton P. LD 1,372 -
Blenkinsopp D. Ms. Ind 621 7.3
Mason L. Ms. Green 580 6.8
Narburgh M. Ms. Green 498 -
Turnout 51.8 15.4
Halesworth (7282)
vote share
Mawer W. Ms. Con 2,368 46.4
Brown A. Lab 1,402 27.5
Pumer R. Ms. LD 833 16.3
Berry J. Ms. Green 500 9.8
Turnout 70.1 18.9
Kessingland & Southwold (7445)
vote share
Goldsmith J.* Con 2,341 45.1
Pickles M. Lab 1,566 30.1
Mackinnon C. LD 972 18.7
Windell J. Green 316 6.1
Turnout 69.8 14.9
Lowestoft South (14511) 2
vote share
Hore J. Ms.* Lab 3,550 43.0
Swainson J.* Lab 2,458 -
Mortimer F. Con 2,190 26.5
Shepherd A. LD 2,055 24.9
Baxter G. LD 1,995 -
Starling J. Con 1,845 -
Hilton G. Green 465 5.6
Goodings C. Green 431 -
Turnout 51.6 16.5
Oulton (14698) 2
vote share
Barron A. Ms. Lab 3,266 37.2
Cherry M.* Lab 3,217 -
Barnard M. Con 2,920 33.2
Burford J. Con 2,355 -
Batchelder L. LD 1,329 15.1
Tibbitt A. LD 1,188 -
Collecott P. Ind 808 9.2
Hinton J. Ms. Ind 656 -
Taylor K. Ms. Green 465 5.3
Sizer S. Green 413 -
Hawes G. Ind 403 -
Turnout 57.9 3.9
Pakefield (11101) 2
vote share
Barrett S. Lab 2,888 41.9
Bellham R.* Lab 2,689 -
Corbett J. Ms. Con 2,322 33.7
Keller B. Con 2,061 -
Batchelder B. Ms. LD 1,154 16.8
Tonge S. Ms. LD 958 -
Skipper A. Ms. Green 525 7.6
Waller E. Ms. Green 343 -
Turnout 58.3 8.2
Cobham (9898)
vote share
Mitchell D. Ms.* Con 3,854 64.6
Bellchamber D. LD 1,358 22.8
Threlkeld I. Ms. Lab 750 12.6
Turnout 60.2 41.9
East Molesey & Esher (9310)
vote share
Oliver T. Con 3,352 56.4
Banks M. LD 1,765 29.7
Moriarty M. Lab 824 13.9
Turnout 63.8 26.7
Hersham (9129)
vote share
Hicks M. Ms.* Con 2,280 40.0
Green C. HVS 1,655 29.0
Jepson P. Lab 904 15.8
Jackson A. LD 866 15.2
2001: Con Turnout 62.5 11.0
Hinchley Wood Claygate & Oxshott (10732)
vote share
Bennison M. Con 3,353 45.9
Pincham J.* LD 3,321 45.4
Dennett G. Lab 636 8.7
Turnout 68.1 0.4
The Dittons (11757)
vote share
Hickman P. Ind 3,033 38.6
Fairbank B. LD 2,192 27.9
Haworth J. Ms. Con 2,112 26.9
Westmore N. Lab 517 6.6
Turnout 66.8 10.7
Walton (10244)
vote share
Phelps-Penry T. WS 1,864 31.6
Lake R. Ms.* Con 1,774 30.1
Baldwin J. Lab 1,304 22.1
Martin-Kaye J. Ms. LD 948 16.1
Turnout 57.5 1.5
Walton South & Oatlands (11011)
vote share
Taylor R. Con 4,370 62.5
Kent U. Ms. LD 1,598 22.8
Hawkes M. Ms. Lab 1,027 14.7
Turnout 63.5 39.6
West Molesey (9338)
vote share
Mallett E. MolesRA 3,237 57.8
Myson P. Con 955 17.0
Hamilton I. Ms. Lab 843 15.0
Sturgis A. LD 568 10.1
Turnout 60.0 40.7
Weybridge (10588)
vote share
Lake I.* Con 3,044 47.7
Crowther T. LD 1,587 24.8
Refoy C. StGHI 1,024 16.0
Lappin M. Ms. Lab 732 11.5
Turnout 60.3 22.8
Epsom & Ewell North (11480)
vote share
Smith J. Ms.* RA E&E 3,535 46.6
Mountain C. Ms. Con 2,075 27.3
Gerrard M. Ms. Lab 1,085 14.3
Dixon S. LD 892 11.8
2001: Res Turnout 66.1 19.2
Epsom & Ewell North East (11028)
vote share
Petrie N.* Ind 3,176 42.1
Matier P. Con 2,289 30.3
Dapre J. LD 1,212 16.1
Boissiere M. Ms. Lab 870 11.5
2001: Res Turnout 68.4 11.8
Epsom & Ewell South East (9074)
vote share
Frost C. RA E&E 2,008 31.6
Everest C. Con 1,923 30.2
Murphy T. LD 1,847 29.1
Milne J. Lab 580 9.1
Turnout 70.1 1.3
Epsom & Ewell South West (10717)
vote share
Taylor J.* LD 2,521 39.1
Muller C. Con 2,187 33.9
Carlson S. Ms. Lab 1,452 22.5
Cane R. UKIP 286 4.4
Turnout 60.1 5.2
Epsom & Ewell West (10317)
vote share
Mason J. Ms. W&RRA 2,070 34.1
Romagnuolo V. Lab 1,651 27.2
Collins D. Con 1,491 24.6
Wood C. LD 859 14.1
Turnout 58.8 6.9
Waveney
Elmbridge
Surrey
Epsom & Ewell
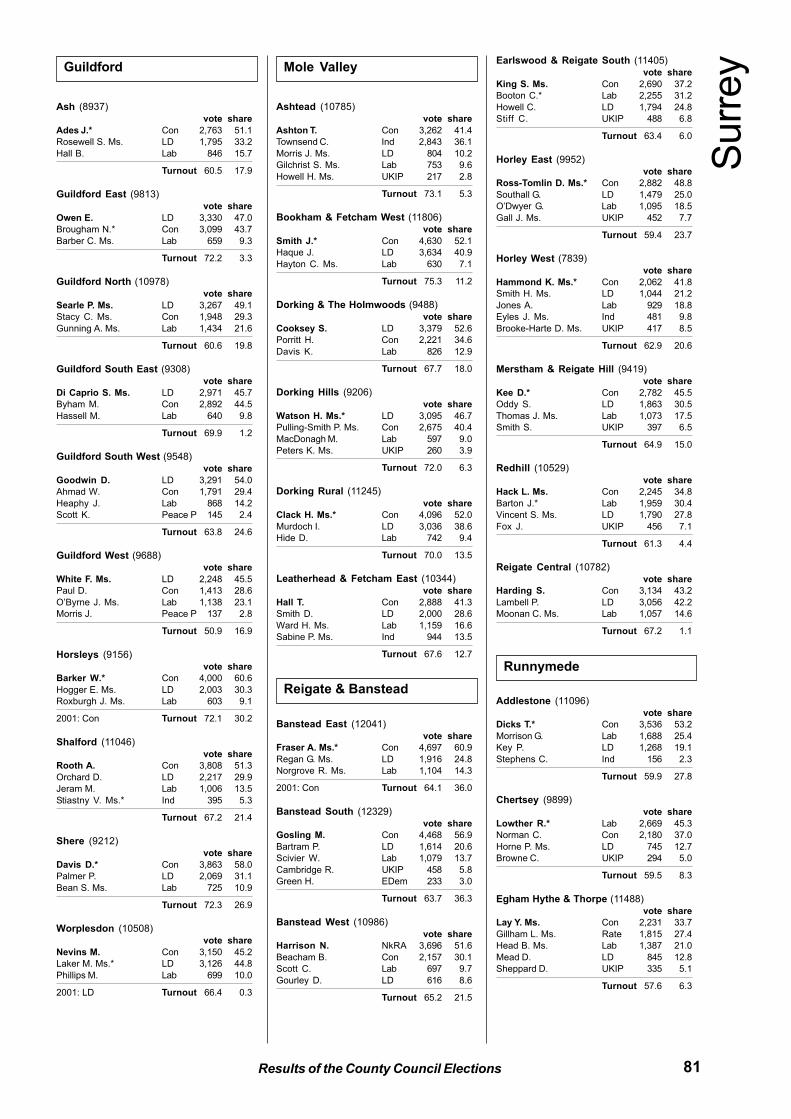
81Results of the County Council Elections
Ash (8937)
vote share
Ades J.* Con 2,763 51.1
Rosewell S. Ms. LD 1,795 33.2
Hall B. Lab 846 15.7
Turnout 60.5 17.9
Guildford East (9813)
vote share
Owen E. LD 3,330 47.0
Brougham N.* Con 3,099 43.7
Barber C. Ms. Lab 659 9.3
Turnout 72.2 3.3
Guildford North (10978)
vote share
Searle P. Ms. LD 3,267 49.1
Stacy C. Ms. Con 1,948 29.3
Gunning A. Ms. Lab 1,434 21.6
Turnout 60.6 19.8
Guildford South East (9308)
vote share
Di Caprio S. Ms. LD 2,971 45.7
Byham M. Con 2,892 44.5
Hassell M. Lab 640 9.8
Turnout 69.9 1.2
Guildford South West (9548)
vote share
Goodwin D. LD 3,291 54.0
Ahmad W. Con 1,791 29.4
Heaphy J. Lab 868 14.2
Scott K. Peace P 145 2.4
Turnout 63.8 24.6
Guildford West (9688)
vote share
White F. Ms. LD 2,248 45.5
Paul D. Con 1,413 28.6
O’Byrne J. Ms. Lab 1,138 23.1
Morris J. Peace P 137 2.8
Turnout 50.9 16.9
Horsleys (9156)
vote share
Barker W.* Con 4,000 60.6
Hogger E. Ms. LD 2,003 30.3
Roxburgh J. Ms. Lab 603 9.1
2001: Con Turnout 72.1 30.2
Shalford (11046)
vote share
Rooth A. Con 3,808 51.3
Orchard D. LD 2,217 29.9
Jeram M. Lab 1,006 13.5
Stiastny V. Ms.* Ind 395 5.3
Turnout 67.2 21.4
Shere (9212)
vote share
Davis D.* Con 3,863 58.0
Palmer P. LD 2,069 31.1
Bean S. Ms. Lab 725 10.9
Turnout 72.3 26.9
Worplesdon (10508)
vote share
Nevins M. Con 3,150 45.2
Laker M. Ms.* LD 3,126 44.8
Phillips M. Lab 699 10.0
2001: LD Turnout 66.4 0.3
Ashtead (10785)
vote share
Ashton T. Con 3,262 41.4
Townsend C. Ind 2,843 36.1
Morris J. Ms. LD 804 10.2
Gilchrist S. Ms. Lab 753 9.6
Howell H. Ms. UKIP 217 2.8
Turnout 73.1 5.3
Bookham & Fetcham West (11806)
vote share
Smith J.* Con 4,630 52.1
Haque J. LD 3,634 40.9
Hayton C. Ms. Lab 630 7.1
Turnout 75.3 11.2
Dorking & The Holmwoods (9488)
vote share
Cooksey S. LD 3,379 52.6
Porritt H. Con 2,221 34.6
Davis K. Lab 826 12.9
Turnout 67.7 18.0
Dorking Hills (9206)
vote share
Watson H. Ms.* LD 3,095 46.7
Pulling-Smith P. Ms. Con 2,675 40.4
MacDonagh M. Lab 597 9.0
Peters K. Ms. UKIP 260 3.9
Turnout 72.0 6.3
Dorking Rural (11245)
vote share
Clack H. Ms.* Con 4,096 52.0
Murdoch I. LD 3,036 38.6
Hide D. Lab 742 9.4
Turnout 70.0 13.5
Leatherhead & Fetcham East (10344)
vote share
Hall T. Con 2,888 41.3
Smith D. LD 2,000 28.6
Ward H. Ms. Lab 1,159 16.6
Sabine P. Ms. Ind 944 13.5
Turnout 67.6 12.7
Banstead East (12041)
vote share
Fraser A. Ms.* Con 4,697 60.9
Regan G. Ms. LD 1,916 24.8
Norgrove R. Ms. Lab 1,104 14.3
2001: Con Turnout 64.1 36.0
Banstead South (12329)
vote share
Gosling M. Con 4,468 56.9
Bartram P. LD 1,614 20.6
Scivier W. Lab 1,079 13.7
Cambridge R. UKIP 458 5.8
Green H. EDem 233 3.0
Turnout 63.7 36.3
Banstead West (10986)
vote share
Harrison N. NkRA 3,696 51.6
Beacham B. Con 2,157 30.1
Scott C. Lab 697 9.7
Gourley D. LD 616 8.6
Turnout 65.2 21.5
Earlswood & Reigate South (11405)
vote share
King S. Ms. Con 2,690 37.2
Booton C.* Lab 2,255 31.2
Howell C. LD 1,794 24.8
Stiff C. UKIP 488 6.8
Turnout 63.4 6.0
Horley East (9952)
vote share
Ross-Tomlin D. Ms.* Con 2,882 48.8
Southall G. LD 1,479 25.0
O’Dwyer G. Lab 1,095 18.5
Gall J. Ms. UKIP 452 7.7
Turnout 59.4 23.7
Horley West (7839)
vote share
Hammond K. Ms.* Con 2,062 41.8
Smith H. Ms. LD 1,044 21.2
Jones A. Lab 929 18.8
Eyles J. Ms. Ind 481 9.8
Brooke-Harte D. Ms. UKIP 417 8.5
Turnout 62.9 20.6
Merstham & Reigate Hill (9419)
vote share
Kee D.* Con 2,782 45.5
Oddy S. LD 1,863 30.5
Thomas J. Ms. Lab 1,073 17.5
Smith S. UKIP 397 6.5
Turnout 64.9 15.0
Redhill (10529)
vote share
Hack L. Ms. Con 2,245 34.8
Barton J.* Lab 1,959 30.4
Vincent S. Ms. LD 1,790 27.8
Fox J. UKIP 456 7.1
Turnout 61.3 4.4
Reigate Central (10782)
vote share
Harding S. Con 3,134 43.2
Lambell P. LD 3,056 42.2
Moonan C. Ms. Lab 1,057 14.6
Turnout 67.2 1.1
Addlestone (11096)
vote share
Dicks T.* Con 3,536 53.2
Morrison G. Lab 1,688 25.4
Key P. LD 1,268 19.1
Stephens C. Ind 156 2.3
Turnout 59.9 27.8
Chertsey (9899)
vote share
Lowther R.* Lab 2,669 45.3
Norman C. Con 2,180 37.0
Horne P. Ms. LD 745 12.7
Browne C. UKIP 294 5.0
Turnout 59.5 8.3
Egham Hythe & Thorpe (11488)
vote share
Lay Y. Ms. Con 2,231 33.7
Gillham L. Ms. Rate 1,815 27.4
Head B. Ms. Lab 1,387 21.0
Mead D. LD 845 12.8
Sheppard D. UKIP 335 5.1
Turnout 57.6 6.3
Guildford Mole Valley
Reigate & Banstead
Surr
ey
Runnymede
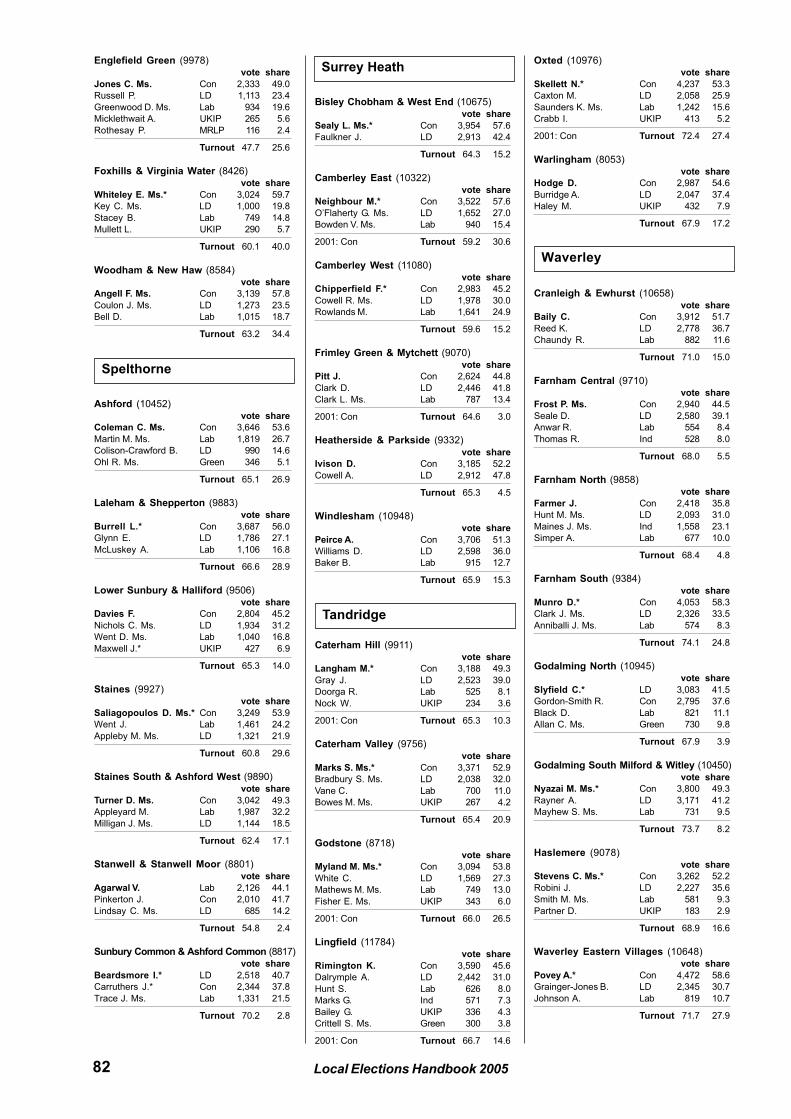
82 Local Elections Handbook 2005
Englefield Green (9978)
vote share
Jones C. Ms. Con 2,333 49.0
Russell P. LD 1,113 23.4
Greenwood D. Ms. Lab 934 19.6
Micklethwait A. UKIP 265 5.6
Rothesay P. MRLP 116 2.4
Turnout 47.7 25.6
Foxhills & Virginia Water (8426)
vote share
Whiteley E. Ms.* Con 3,024 59.7
Key C. Ms. LD 1,000 19.8
Stacey B. Lab 749 14.8
Mullett L. UKIP 290 5.7
Turnout 60.1 40.0
Woodham & New Haw (8584)
vote share
Angell F. Ms. Con 3,139 57.8
Coulon J. Ms. LD 1,273 23.5
Bell D. Lab 1,015 18.7
Turnout 63.2 34.4
Ashford (10452)
vote share
Coleman C. Ms. Con 3,646 53.6
Martin M. Ms. Lab 1,819 26.7
Colison-Crawford B. LD 990 14.6
Ohl R. Ms. Green 346 5.1
Turnout 65.1 26.9
Laleham & Shepperton (9883)
vote share
Burrell L.* Con 3,687 56.0
Glynn E. LD 1,786 27.1
McLuskey A. Lab 1,106 16.8
Turnout 66.6 28.9
Lower Sunbury & Halliford (9506)
vote share
Davies F. Con 2,804 45.2
Nichols C. Ms. LD 1,934 31.2
Went D. Ms. Lab 1,040 16.8
Maxwell J.* UKIP 427 6.9
Turnout 65.3 14.0
Staines (9927)
vote share
Saliagopoulos D. Ms.* Con 3,249 53.9
Went J. Lab 1,461 24.2
Appleby M. Ms. LD 1,321 21.9
Turnout 60.8 29.6
Staines South & Ashford West (9890)
vote share
Turner D. Ms. Con 3,042 49.3
Appleyard M. Lab 1,987 32.2
Milligan J. Ms. LD 1,144 18.5
Turnout 62.4 17.1
Stanwell & Stanwell Moor (8801)
vote share
Agarwal V. Lab 2,126 44.1
Pinkerton J. Con 2,010 41.7
Lindsay C. Ms. LD 685 14.2
Turnout 54.8 2.4
Sunbury Common & Ashford Common (8817)
vote share
Beardsmore I.* LD 2,518 40.7
Carruthers J.* Con 2,344 37.8
Trace J. Ms. Lab 1,331 21.5
Turnout 70.2 2.8
Bisley Chobham & West End (10675)
vote share
Sealy L. Ms.* Con 3,954 57.6
Faulkner J. LD 2,913 42.4
Turnout 64.3 15.2
Camberley East (10322)
vote share
Neighbour M.* Con 3,522 57.6
O’Flaherty G. Ms. LD 1,652 27.0
Bowden V. Ms. Lab 940 15.4
2001: Con Turnout 59.2 30.6
Camberley West (11080)
vote share
Chipperfield F.* Con 2,983 45.2
Cowell R. Ms. LD 1,978 30.0
Rowlands M. Lab 1,641 24.9
Turnout 59.6 15.2
Frimley Green & Mytchett (9070)
vote share
Pitt J. Con 2,624 44.8
Clark D. LD 2,446 41.8
Clark L. Ms. Lab 787 13.4
2001: Con Turnout 64.6 3.0
Heatherside & Parkside (9332)
vote share
Ivison D. Con 3,185 52.2
Cowell A. LD 2,912 47.8
Turnout 65.3 4.5
Windlesham (10948)
vote share
Peirce A. Con 3,706 51.3
Williams D. LD 2,598 36.0
Baker B. Lab 915 12.7
Turnout 65.9 15.3
Caterham Hill (9911)
vote share
Langham M.* Con 3,188 49.3
Gray J. LD 2,523 39.0
Doorga R. Lab 525 8.1
Nock W. UKIP 234 3.6
2001: Con Turnout 65.3 10.3
Caterham Valley (9756)
vote share
Marks S. Ms.* Con 3,371 52.9
Bradbury S. Ms. LD 2,038 32.0
Vane C. Lab 700 11.0
Bowes M. Ms. UKIP 267 4.2
Turnout 65.4 20.9
Godstone (8718)
vote share
Myland M. Ms.* Con 3,094 53.8
White C. LD 1,569 27.3
Mathews M. Ms. Lab 749 13.0
Fisher E. Ms. UKIP 343 6.0
2001: Con Turnout 66.0 26.5
Lingfield (11784)
vote share
Rimington K. Con 3,590 45.6
Dalrymple A. LD 2,442 31.0
Hunt S. Lab 626 8.0
Marks G. Ind 571 7.3
Bailey G. UKIP 336 4.3
Crittell S. Ms. Green 300 3.8
2001: Con Turnout 66.7 14.6
Oxted (10976)
vote share
Skellett N.* Con 4,237 53.3
Caxton M. LD 2,058 25.9
Saunders K. Ms. Lab 1,242 15.6
Crabb I. UKIP 413 5.2
2001: Con Turnout 72.4 27.4
Warlingham (8053)
vote share
Hodge D. Con 2,987 54.6
Burridge A. LD 2,047 37.4
Haley M. UKIP 432 7.9
Turnout 67.9 17.2
Cranleigh & Ewhurst (10658)
vote share
Baily C. Con 3,912 51.7
Reed K. LD 2,778 36.7
Chaundy R. Lab 882 11.6
Turnout 71.0 15.0
Farnham Central (9710)
vote share
Frost P. Ms. Con 2,940 44.5
Seale D. LD 2,580 39.1
Anwar R. Lab 554 8.4
Thomas R. Ind 528 8.0
Turnout 68.0 5.5
Farnham North (9858)
vote share
Farmer J. Con 2,418 35.8
Hunt M. Ms. LD 2,093 31.0
Maines J. Ms. Ind 1,558 23.1
Simper A. Lab 677 10.0
Turnout 68.4 4.8
Farnham South (9384)
vote share
Munro D.* Con 4,053 58.3
Clark J. Ms. LD 2,326 33.5
Anniballi J. Ms. Lab 574 8.3
Turnout 74.1 24.8
Godalming North (10945)
vote share
Slyfield C.* LD 3,083 41.5
Gordon-Smith R. Con 2,795 37.6
Black D. Lab 821 11.1
Allan C. Ms. Green 730 9.8
Turnout 67.9 3.9
Godalming South Milford & Witley (10450)
vote share
Nyazai M. Ms.* Con 3,800 49.3
Rayner A. LD 3,171 41.2
Mayhew S. Ms. Lab 731 9.5
Turnout 73.7 8.2
Haslemere (9078)
vote share
Stevens C. Ms.* Con 3,262 52.2
Robini J. LD 2,227 35.6
Smith M. Ms. Lab 581 9.3
Partner D. UKIP 183 2.9
Turnout 68.9 16.6
Waverley Eastern Villages (10648)
vote share
Povey A.* Con 4,472 58.6
Grainger-Jones B. LD 2,345 30.7
Johnson A. Lab 819 10.7
Turnout 71.7 27.9
Spelthorne
Surrey Heath
Waverley
Tandridge
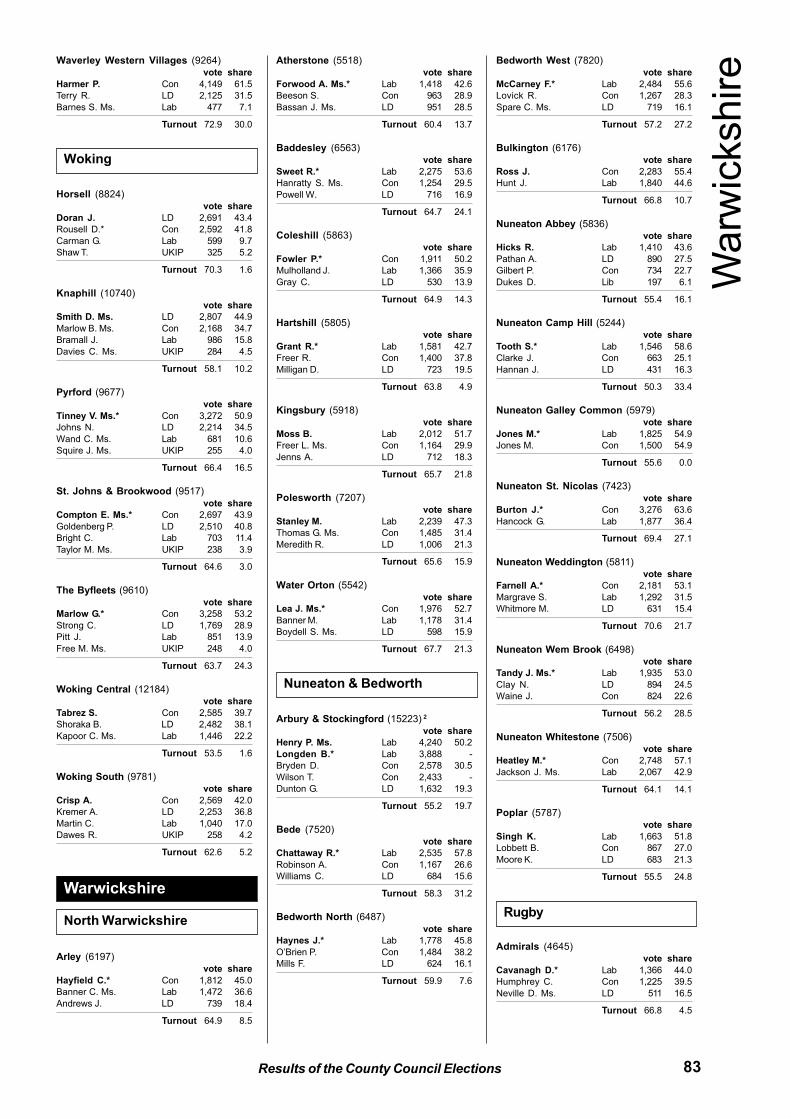
83Results of the County Council Elections
Waverley Western Villages (9264)
vote share
Harmer P. Con 4,149 61.5
Terry R. LD 2,125 31.5
Barnes S. Ms. Lab 477 7.1
Turnout 72.9 30.0
Horsell (8824)
vote share
Doran J. LD 2,691 43.4
Rousell D.* Con 2,592 41.8
Carman G. Lab 599 9.7
Shaw T. UKIP 325 5.2
Turnout 70.3 1.6
Knaphill (10740)
vote share
Smith D. Ms. LD 2,807 44.9
Marlow B. Ms. Con 2,168 34.7
Bramall J. Lab 986 15.8
Davies C. Ms. UKIP 284 4.5
Turnout 58.1 10.2
Pyrford (9677)
vote share
Tinney V. Ms.* Con 3,272 50.9
Johns N. LD 2,214 34.5
Wand C. Ms. Lab 681 10.6
Squire J. Ms. UKIP 255 4.0
Turnout 66.4 16.5
St. Johns & Brookwood (9517)
vote share
Compton E. Ms.* Con 2,697 43.9
Goldenberg P. LD 2,510 40.8
Bright C. Lab 703 11.4
Taylor M. Ms. UKIP 238 3.9
Turnout 64.6 3.0
The Byfleets (9610)
vote share
Marlow G.* Con 3,258 53.2
Strong C. LD 1,769 28.9
Pitt J. Lab 851 13.9
Free M. Ms. UKIP 248 4.0
Turnout 63.7 24.3
Woking Central (12184)
vote share
Tabrez S. Con 2,585 39.7
Shoraka B. LD 2,482 38.1
Kapoor C. Ms. Lab 1,446 22.2
Turnout 53.5 1.6
Woking South (9781)
vote share
Crisp A. Con 2,569 42.0
Kremer A. LD 2,253 36.8
Martin C. Lab 1,040 17.0
Dawes R. UKIP 258 4.2
Turnout 62.6 5.2
Arley (6197)
vote share
Hayfield C.* Con 1,812 45.0
Banner C. Ms. Lab 1,472 36.6
Andrews J. LD 739 18.4
Turnout 64.9 8.5
Atherstone (5518)
vote share
Forwood A. Ms.* Lab 1,418 42.6
Beeson S. Con 963 28.9
Bassan J. Ms. LD 951 28.5
Turnout 60.4 13.7
Baddesley (6563)
vote share
Sweet R.* Lab 2,275 53.6
Hanratty S. Ms. Con 1,254 29.5
Powell W. LD 716 16.9
Turnout 64.7 24.1
Coleshill (5863)
vote share
Fowler P.* Con 1,911 50.2
Mulholland J. Lab 1,366 35.9
Gray C. LD 530 13.9
Turnout 64.9 14.3
Hartshill (5805)
vote share
Grant R.* Lab 1,581 42.7
Freer R. Con 1,400 37.8
Milligan D. LD 723 19.5
Turnout 63.8 4.9
Kingsbury (5918)
vote share
Moss B. Lab 2,012 51.7
Freer L. Ms. Con 1,164 29.9
Jenns A. LD 712 18.3
Turnout 65.7 21.8
Polesworth (7207)
vote share
Stanley M. Lab 2,239 47.3
Thomas G. Ms. Con 1,485 31.4
Meredith R. LD 1,006 21.3
Turnout 65.6 15.9
Water Orton (5542)
vote share
Lea J. Ms.* Con 1,976 52.7
Banner M. Lab 1,178 31.4
Boydell S. Ms. LD 598 15.9
Turnout 67.7 21.3
Arbury & Stockingford (15223) 2
vote share
Henry P. Ms. Lab 4,240 50.2
Longden B.* Lab 3,888 -
Bryden D. Con 2,578 30.5
Wilson T. Con 2,433 -
Dunton G. LD 1,632 19.3
Turnout 55.2 19.7
Bede (7520)
vote share
Chattaway R.* Lab 2,535 57.8
Robinson A. Con 1,167 26.6
Williams C. LD 684 15.6
Turnout 58.3 31.2
Bedworth North (6487)
vote share
Haynes J.* Lab 1,778 45.8
O’Brien P. Con 1,484 38.2
Mills F. LD 624 16.1
Turnout 59.9 7.6
Bedworth West (7820)
vote share
McCarney F.* Lab 2,484 55.6
Lovick R. Con 1,267 28.3
Spare C. Ms. LD 719 16.1
Turnout 57.2 27.2
Bulkington (6176)
vote share
Ross J. Con 2,283 55.4
Hunt J. Lab 1,840 44.6
Turnout 66.8 10.7
Nuneaton Abbey (5836)
vote share
Hicks R. Lab 1,410 43.6
Pathan A. LD 890 27.5
Gilbert P. Con 734 22.7
Dukes D. Lib 197 6.1
Turnout 55.4 16.1
Nuneaton Camp Hill (5244)
vote share
Tooth S.* Lab 1,546 58.6
Clarke J. Con 663 25.1
Hannan J. LD 431 16.3
Turnout 50.3 33.4
Nuneaton Galley Common (5979)
vote share
Jones M.* Lab 1,825 54.9
Jones M. Con 1,500 54.9
Turnout 55.6 0.0
Nuneaton St. Nicolas (7423)
vote share
Burton J.* Con 3,276 63.6
Hancock G. Lab 1,877 36.4
Turnout 69.4 27.1
Nuneaton Weddington (5811)
vote share
Farnell A.* Con 2,181 53.1
Margrave S. Lab 1,292 31.5
Whitmore M. LD 631 15.4
Turnout 70.6 21.7
Nuneaton Wem Brook (6498)
vote share
Tandy J. Ms.* Lab 1,935 53.0
Clay N. LD 894 24.5
Waine J. Con 824 22.6
Turnout 56.2 28.5
Nuneaton Whitestone (7506)
vote share
Heatley M.* Con 2,748 57.1
Jackson J. Ms. Lab 2,067 42.9
Turnout 64.1 14.1
Poplar (5787)
vote share
Singh K. Lab 1,663 51.8
Lobbett B. Con 867 27.0
Moore K. LD 683 21.3
Turnout 55.5 24.8
Admirals (4645)
vote share
Cavanagh D.* Lab 1,366 44.0
Humphrey C. Con 1,225 39.5
Neville D. Ms. LD 511 16.5
Turnout 66.8 4.5
Woking
North Warwickshire
Warwickshire
Warw
ickshire
Nuneaton & Bedworth
Rugby
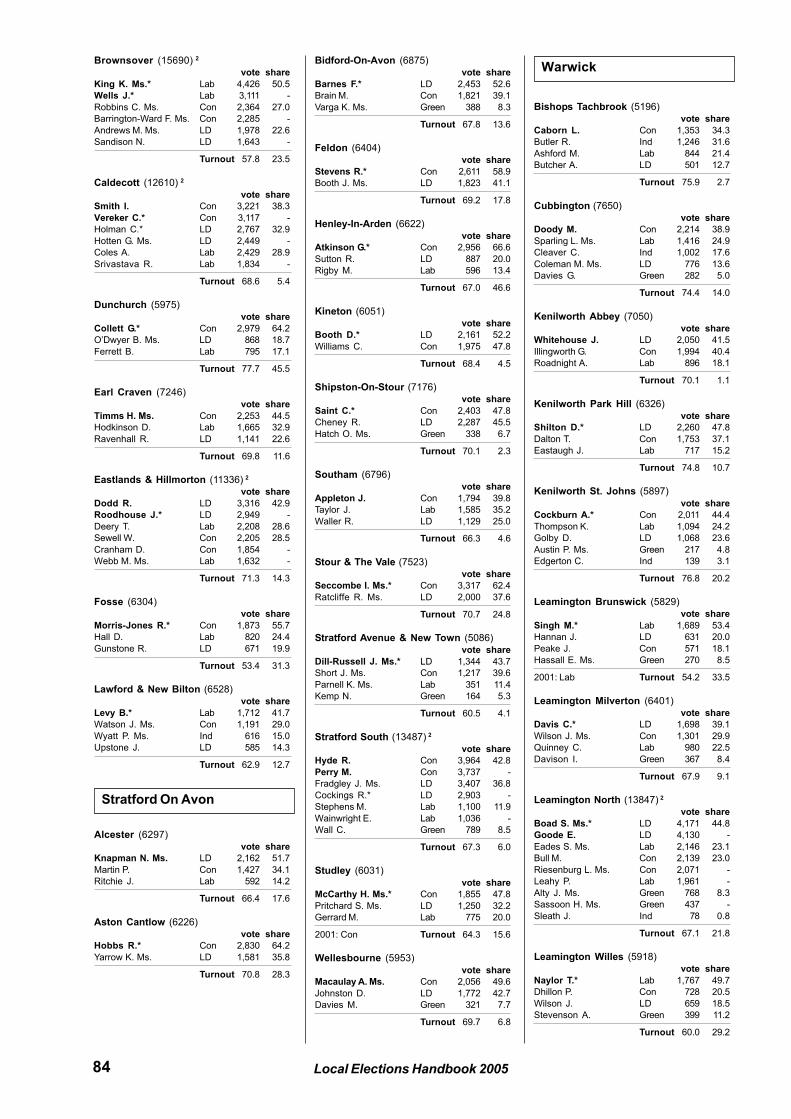
84 Local Elections Handbook 2005
Brownsover (15690) 2
vote share
King K. Ms.* Lab 4,426 50.5
Wells J.* Lab 3,111 -
Robbins C. Ms. Con 2,364 27.0
Barrington-Ward F. Ms. Con 2,285 -
Andrews M. Ms. LD 1,978 22.6
Sandison N. LD 1,643 -
Turnout 57.8 23.5
Caldecott (12610) 2
vote share
Smith I. Con 3,221 38.3
Vereker C.* Con 3,117 -
Holman C.* LD 2,767 32.9
Hotten G. Ms. LD 2,449 -
Coles A. Lab 2,429 28.9
Srivastava R. Lab 1,834 -
Turnout 68.6 5.4
Dunchurch (5975)
vote share
Collett G.* Con 2,979 64.2
O’Dwyer B. Ms. LD 868 18.7
Ferrett B. Lab 795 17.1
Turnout 77.7 45.5
Earl Craven (7246)
vote share
Timms H. Ms. Con 2,253 44.5
Hodkinson D. Lab 1,665 32.9
Ravenhall R. LD 1,141 22.6
Turnout 69.8 11.6
Eastlands & Hillmorton (11336) 2
vote share
Dodd R. LD 3,316 42.9
Roodhouse J.* LD 2,949 -
Deery T. Lab 2,208 28.6
Sewell W. Con 2,205 28.5
Cranham D. Con 1,854 -
Webb M. Ms. Lab 1,632 -
Turnout 71.3 14.3
Fosse (6304)
vote share
Morris-Jones R.* Con 1,873 55.7
Hall D. Lab 820 24.4
Gunstone R. LD 671 19.9
Turnout 53.4 31.3
Lawford & New Bilton (6528)
vote share
Levy B.* Lab 1,712 41.7
Watson J. Ms. Con 1,191 29.0
Wyatt P. Ms. Ind 616 15.0
Upstone J. LD 585 14.3
Turnout 62.9 12.7
Alcester (6297)
vote share
Knapman N. Ms. LD 2,162 51.7
Martin P. Con 1,427 34.1
Ritchie J. Lab 592 14.2
Turnout 66.4 17.6
Aston Cantlow (6226)
vote share
Hobbs R.* Con 2,830 64.2
Yarrow K. Ms. LD 1,581 35.8
Turnout 70.8 28.3
Bidford-On-Avon (6875)
vote share
Barnes F.* LD 2,453 52.6
Brain M. Con 1,821 39.1
Varga K. Ms. Green 388 8.3
Turnout 67.8 13.6
Feldon (6404)
vote share
Stevens R.* Con 2,611 58.9
Booth J. Ms. LD 1,823 41.1
Turnout 69.2 17.8
Henley-In-Arden (6622)
vote share
Atkinson G.* Con 2,956 66.6
Sutton R. LD 887 20.0
Rigby M. Lab 596 13.4
Turnout 67.0 46.6
Kineton (6051)
vote share
Booth D.* LD 2,161 52.2
Williams C. Con 1,975 47.8
Turnout 68.4 4.5
Shipston-On-Stour (7176)
vote share
Saint C.* Con 2,403 47.8
Cheney R. LD 2,287 45.5
Hatch O. Ms. Green 338 6.7
Turnout 70.1 2.3
Southam (6796)
vote share
Appleton J. Con 1,794 39.8
Taylor J. Lab 1,585 35.2
Waller R. LD 1,129 25.0
Turnout 66.3 4.6
Stour & The Vale (7523)
vote share
Seccombe I. Ms.* Con 3,317 62.4
Ratcliffe R. Ms. LD 2,000 37.6
Turnout 70.7 24.8
Stratford Avenue & New Town (5086)
vote share
Dill-Russell J. Ms.* LD 1,344 43.7
Short J. Ms. Con 1,217 39.6
Parnell K. Ms. Lab 351 11.4
Kemp N. Green 164 5.3
Turnout 60.5 4.1
Stratford South (13487) 2
vote share
Hyde R. Con 3,964 42.8
Perry M. Con 3,737 -
Fradgley J. Ms. LD 3,407 36.8
Cockings R.* LD 2,903 -
Stephens M. Lab 1,100 11.9
Wainwright E. Lab 1,036 -
Wall C. Green 789 8.5
Turnout 67.3 6.0
Studley (6031)
vote share
McCarthy H. Ms.* Con 1,855 47.8
Pritchard S. Ms. LD 1,250 32.2
Gerrard M. Lab 775 20.0
2001: Con Turnout 64.3 15.6
Wellesbourne (5953)
vote share
Macaulay A. Ms. Con 2,056 49.6
Johnston D. LD 1,772 42.7
Davies M. Green 321 7.7
Turnout 69.7 6.8
Bishops Tachbrook (5196)
vote share
Caborn L. Con 1,353 34.3
Butler R. Ind 1,246 31.6
Ashford M. Lab 844 21.4
Butcher A. LD 501 12.7
Turnout 75.9 2.7
Cubbington (7650)
vote share
Doody M. Con 2,214 38.9
Sparling L. Ms. Lab 1,416 24.9
Cleaver C. Ind 1,002 17.6
Coleman M. Ms. LD 776 13.6
Davies G. Green 282 5.0
Turnout 74.4 14.0
Kenilworth Abbey (7050)
vote share
Whitehouse J. LD 2,050 41.5
Illingworth G. Con 1,994 40.4
Roadnight A. Lab 896 18.1
Turnout 70.1 1.1
Kenilworth Park Hill (6326)
vote share
Shilton D.* LD 2,260 47.8
Dalton T. Con 1,753 37.1
Eastaugh J. Lab 717 15.2
Turnout 74.8 10.7
Kenilworth St. Johns (5897)
vote share
Cockburn A.* Con 2,011 44.4
Thompson K. Lab 1,094 24.2
Golby D. LD 1,068 23.6
Austin P. Ms. Green 217 4.8
Edgerton C. Ind 139 3.1
Turnout 76.8 20.2
Leamington Brunswick (5829)
vote share
Singh M.* Lab 1,689 53.4
Hannan J. LD 631 20.0
Peake J. Con 571 18.1
Hassall E. Ms. Green 270 8.5
2001: Lab Turnout 54.2 33.5
Leamington Milverton (6401)
vote share
Davis C.* LD 1,698 39.1
Wilson J. Ms. Con 1,301 29.9
Quinney C. Lab 980 22.5
Davison I. Green 367 8.4
Turnout 67.9 9.1
Leamington North (13847) 2
vote share
Boad S. Ms.* LD 4,171 44.8
Goode E. LD 4,130 -
Eades S. Ms. Lab 2,146 23.1
Bull M. Con 2,139 23.0
Riesenburg L. Ms. Con 2,071 -
Leahy P. Lab 1,961 -
Alty J. Ms. Green 768 8.3
Sassoon H. Ms. Green 437 -
Sleath J. Ind 78 0.8
Turnout 67.1 21.8
Leamington Willes (5918)
vote share
Naylor T.* Lab 1,767 49.7
Dhillon P. Con 728 20.5
Wilson J. LD 659 18.5
Stevenson A. Green 399 11.2
Turnout 60.0 29.2
Stratford On Avon
Warwick
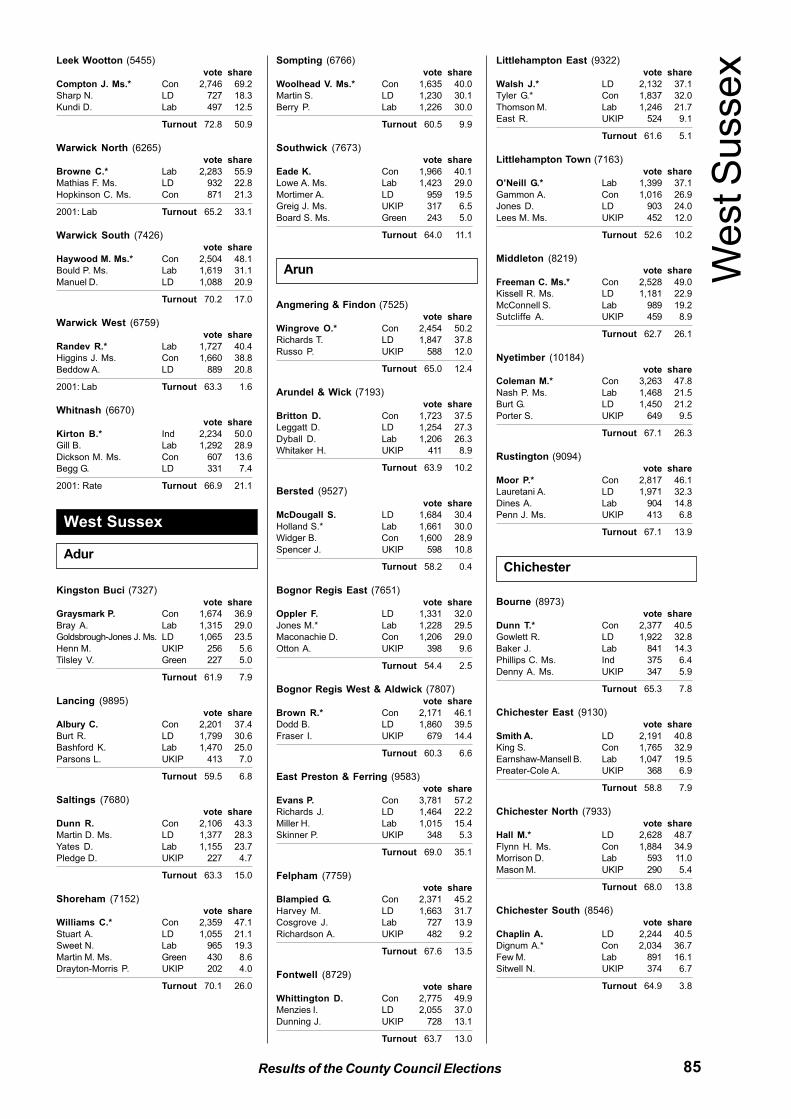
85Results of the County Council Elections
Leek Wootton (5455)
vote share
Compton J. Ms.* Con 2,746 69.2
Sharp N. LD 727 18.3
Kundi D. Lab 497 12.5
Turnout 72.8 50.9
Warwick North (6265)
vote share
Browne C.* Lab 2,283 55.9
Mathias F. Ms. LD 932 22.8
Hopkinson C. Ms. Con 871 21.3
2001: Lab Turnout 65.2 33.1
Warwick South (7426)
vote share
Haywood M. Ms.* Con 2,504 48.1
Bould P. Ms. Lab 1,619 31.1
Manuel D. LD 1,088 20.9
Turnout 70.2 17.0
Warwick West (6759)
vote share
Randev R.* Lab 1,727 40.4
Higgins J. Ms. Con 1,660 38.8
Beddow A. LD 889 20.8
2001: Lab Turnout 63.3 1.6
Whitnash (6670)
vote share
Kirton B.* Ind 2,234 50.0
Gill B. Lab 1,292 28.9
Dickson M. Ms. Con 607 13.6
Begg G. LD 331 7.4
2001: Rate Turnout 66.9 21.1
Kingston Buci (7327)
vote share
Graysmark P. Con 1,674 36.9
Bray A. Lab 1,315 29.0
Goldsbrough-Jones J. Ms. LD 1,065 23.5
Henn M. UKIP 256 5.6
Tilsley V. Green 227 5.0
Turnout 61.9 7.9
Lancing (9895)
vote share
Albury C. Con 2,201 37.4
Burt R. LD 1,799 30.6
Bashford K. Lab 1,470 25.0
Parsons L. UKIP 413 7.0
Turnout 59.5 6.8
Saltings (7680)
vote share
Dunn R. Con 2,106 43.3
Martin D. Ms. LD 1,377 28.3
Yates D. Lab 1,155 23.7
Pledge D. UKIP 227 4.7
Turnout 63.3 15.0
Shoreham (7152)
vote share
Williams C.* Con 2,359 47.1
Stuart A. LD 1,055 21.1
Sweet N. Lab 965 19.3
Martin M. Ms. Green 430 8.6
Drayton-Morris P. UKIP 202 4.0
Turnout 70.1 26.0
Sompting (6766)
vote share
Woolhead V. Ms.* Con 1,635 40.0
Martin S. LD 1,230 30.1
Berry P. Lab 1,226 30.0
Turnout 60.5 9.9
Southwick (7673)
vote share
Eade K. Con 1,966 40.1
Lowe A. Ms. Lab 1,423 29.0
Mortimer A. LD 959 19.5
Greig J. Ms. UKIP 317 6.5
Board S. Ms. Green 243 5.0
Turnout 64.0 11.1
Angmering & Findon (7525)
vote share
Wingrove O.* Con 2,454 50.2
Richards T. LD 1,847 37.8
Russo P. UKIP 588 12.0
Turnout 65.0 12.4
Arundel & Wick (7193)
vote share
Britton D. Con 1,723 37.5
Leggatt D. LD 1,254 27.3
Dyball D. Lab 1,206 26.3
Whitaker H. UKIP 411 8.9
Turnout 63.9 10.2
Bersted (9527)
vote share
McDougall S. LD 1,684 30.4
Holland S.* Lab 1,661 30.0
Widger B. Con 1,600 28.9
Spencer J. UKIP 598 10.8
Turnout 58.2 0.4
Bognor Regis East (7651)
vote share
Oppler F. LD 1,331 32.0
Jones M.* Lab 1,228 29.5
Maconachie D. Con 1,206 29.0
Otton A. UKIP 398 9.6
Turnout 54.4 2.5
Bognor Regis West & Aldwick (7807)
vote share
Brown R.* Con 2,171 46.1
Dodd B. LD 1,860 39.5
Fraser I. UKIP 679 14.4
Turnout 60.3 6.6
East Preston & Ferring (9583)
vote share
Evans P. Con 3,781 57.2
Richards J. LD 1,464 22.2
Miller H. Lab 1,015 15.4
Skinner P. UKIP 348 5.3
Turnout 69.0 35.1
Felpham (7759)
vote share
Blampied G. Con 2,371 45.2
Harvey M. LD 1,663 31.7
Cosgrove J. Lab 727 13.9
Richardson A. UKIP 482 9.2
Turnout 67.6 13.5
Fontwell (8729)
vote share
Whittington D. Con 2,775 49.9
Menzies I. LD 2,055 37.0
Dunning J. UKIP 728 13.1
Turnout 63.7 13.0
Littlehampton East (9322)
vote share
Walsh J.* LD 2,132 37.1
Tyler G.* Con 1,837 32.0
Thomson M. Lab 1,246 21.7
East R. UKIP 524 9.1
Turnout 61.6 5.1
Littlehampton Town (7163)
vote share
O’Neill G.* Lab 1,399 37.1
Gammon A. Con 1,016 26.9
Jones D. LD 903 24.0
Lees M. Ms. UKIP 452 12.0
Turnout 52.6 10.2
Middleton (8219)
vote share
Freeman C. Ms.* Con 2,528 49.0
Kissell R. Ms. LD 1,181 22.9
McConnell S. Lab 989 19.2
Sutcliffe A. UKIP 459 8.9
Turnout 62.7 26.1
Nyetimber (10184)
vote share
Coleman M.* Con 3,263 47.8
Nash P. Ms. Lab 1,468 21.5
Burt G. LD 1,450 21.2
Porter S. UKIP 649 9.5
Turnout 67.1 26.3
Rustington (9094)
vote share
Moor P.* Con 2,817 46.1
Lauretani A. LD 1,971 32.3
Dines A. Lab 904 14.8
Penn J. Ms. UKIP 413 6.8
Turnout 67.1 13.9
Bourne (8973)
vote share
Dunn T.* Con 2,377 40.5
Gowlett R. LD 1,922 32.8
Baker J. Lab 841 14.3
Phillips C. Ms. Ind 375 6.4
Denny A. Ms. UKIP 347 5.9
Turnout 65.3 7.8
Chichester East (9130)
vote share
Smith A. LD 2,191 40.8
King S. Con 1,765 32.9
Earnshaw-Mansell B. Lab 1,047 19.5
Preater-Cole A. UKIP 368 6.9
Turnout 58.8 7.9
Chichester North (7933)
vote share
Hall M.* LD 2,628 48.7
Flynn H. Ms. Con 1,884 34.9
Morrison D. Lab 593 11.0
Mason M. UKIP 290 5.4
Turnout 68.0 13.8
Chichester South (8546)
vote share
Chaplin A. LD 2,244 40.5
Dignum A.* Con 2,034 36.7
Few M. Lab 891 16.1
Sitwell N. UKIP 374 6.7
Turnout 64.9 3.8
Adur
West Sussex
Arun West S
ussex
Chichester
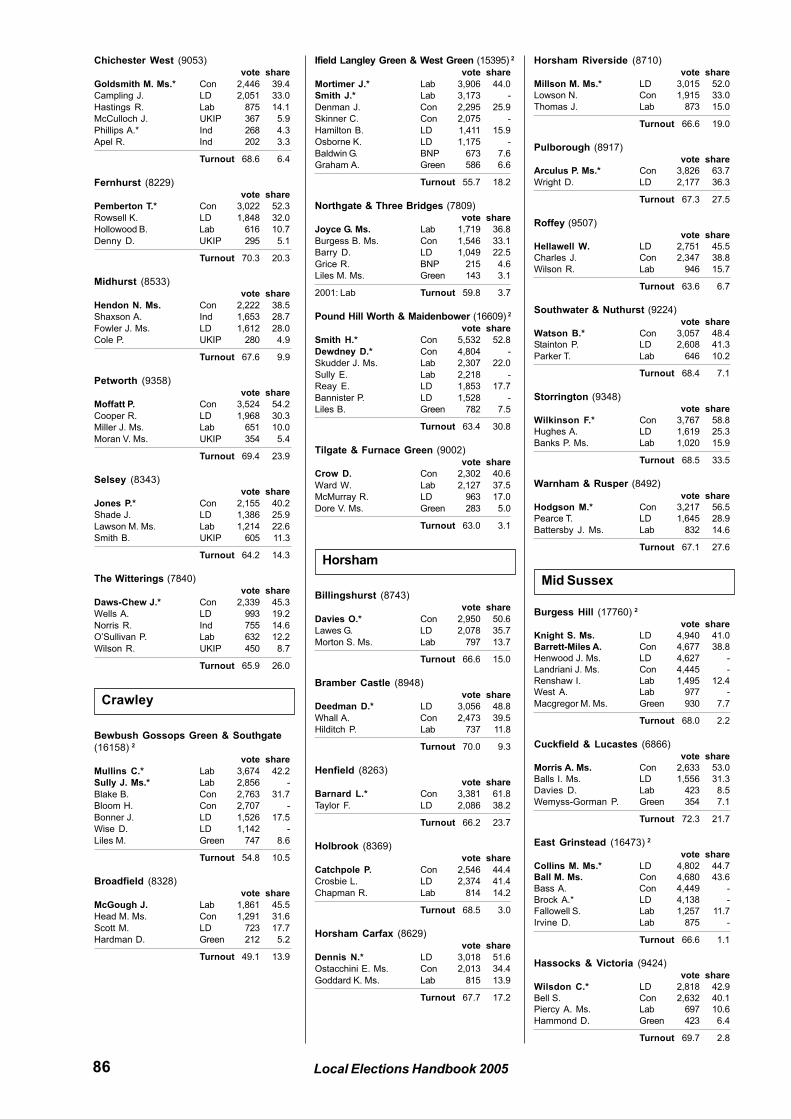
86 Local Elections Handbook 2005
Chichester West (9053)
vote share
Goldsmith M. Ms.* Con 2,446 39.4
Campling J. LD 2,051 33.0
Hastings R. Lab 875 14.1
McCulloch J. UKIP 367 5.9
Phillips A.* Ind 268 4.3
Apel R. Ind 202 3.3
Turnout 68.6 6.4
Fernhurst (8229)
vote share
Pemberton T.* Con 3,022 52.3
Rowsell K. LD 1,848 32.0
Hollowood B. Lab 616 10.7
Denny D. UKIP 295 5.1
Turnout 70.3 20.3
Midhurst (8533)
vote share
Hendon N. Ms. Con 2,222 38.5
Shaxson A. Ind 1,653 28.7
Fowler J. Ms. LD 1,612 28.0
Cole P. UKIP 280 4.9
Turnout 67.6 9.9
Petworth (9358)
vote share
Moffatt P. Con 3,524 54.2
Cooper R. LD 1,968 30.3
Miller J. Ms. Lab 651 10.0
Moran V. Ms. UKIP 354 5.4
Turnout 69.4 23.9
Selsey (8343)
vote share
Jones P.* Con 2,155 40.2
Shade J. LD 1,386 25.9
Lawson M. Ms. Lab 1,214 22.6
Smith B. UKIP 605 11.3
Turnout 64.2 14.3
The Witterings (7840)
vote share
Daws-Chew J.* Con 2,339 45.3
Wells A. LD 993 19.2
Norris R. Ind 755 14.6
O’Sullivan P. Lab 632 12.2
Wilson R. UKIP 450 8.7
Turnout 65.9 26.0
Bewbush Gossops Green & Southgate
(16158) 2
vote share
Mullins C.* Lab 3,674 42.2
Sully J. Ms.* Lab 2,856 -
Blake B. Con 2,763 31.7
Bloom H. Con 2,707 -
Bonner J. LD 1,526 17.5
Wise D. LD 1,142 -
Liles M. Green 747 8.6
Turnout 54.8 10.5
Broadfield (8328)
vote share
McGough J. Lab 1,861 45.5
Head M. Ms. Con 1,291 31.6
Scott M. LD 723 17.7
Hardman D. Green 212 5.2
Turnout 49.1 13.9
Ifield Langley Green & West Green (15395) 2
vote share
Mortimer J.* Lab 3,906 44.0
Smith J.* Lab 3,173 -
Denman J. Con 2,295 25.9
Skinner C. Con 2,075 -
Hamilton B. LD 1,411 15.9
Osborne K. LD 1,175 -
Baldwin G. BNP 673 7.6
Graham A. Green 586 6.6
Turnout 55.7 18.2
Northgate & Three Bridges (7809)
vote share
Joyce G. Ms. Lab 1,719 36.8
Burgess B. Ms. Con 1,546 33.1
Barry D. LD 1,049 22.5
Grice R. BNP 215 4.6
Liles M. Ms. Green 143 3.1
2001: Lab Turnout 59.8 3.7
Pound Hill Worth & Maidenbower (16609) 2
vote share
Smith H.* Con 5,532 52.8
Dewdney D.* Con 4,804 -
Skudder J. Ms. Lab 2,307 22.0
Sully E. Lab 2,218 -
Reay E. LD 1,853 17.7
Bannister P. LD 1,528 -
Liles B. Green 782 7.5
Turnout 63.4 30.8
Tilgate & Furnace Green (9002)
vote share
Crow D. Con 2,302 40.6
Ward W. Lab 2,127 37.5
McMurray R. LD 963 17.0
Dore V. Ms. Green 283 5.0
Turnout 63.0 3.1
Billingshurst (8743)
vote share
Davies O.* Con 2,950 50.6
Lawes G. LD 2,078 35.7
Morton S. Ms. Lab 797 13.7
Turnout 66.6 15.0
Bramber Castle (8948)
vote share
Deedman D.* LD 3,056 48.8
Whall A. Con 2,473 39.5
Hilditch P. Lab 737 11.8
Turnout 70.0 9.3
Henfield (8263)
vote share
Barnard L.* Con 3,381 61.8
Taylor F. LD 2,086 38.2
Turnout 66.2 23.7
Holbrook (8369)
vote share
Catchpole P. Con 2,546 44.4
Crosbie L. LD 2,374 41.4
Chapman R. Lab 814 14.2
Turnout 68.5 3.0
Horsham Carfax (8629)
vote share
Dennis N.* LD 3,018 51.6
Ostacchini E. Ms. Con 2,013 34.4
Goddard K. Ms. Lab 815 13.9
Turnout 67.7 17.2
Horsham Riverside (8710)
vote share
Millson M. Ms.* LD 3,015 52.0
Lowson N. Con 1,915 33.0
Thomas J. Lab 873 15.0
Turnout 66.6 19.0
Pulborough (8917)
vote share
Arculus P. Ms.* Con 3,826 63.7
Wright D. LD 2,177 36.3
Turnout 67.3 27.5
Roffey (9507)
vote share
Hellawell W. LD 2,751 45.5
Charles J. Con 2,347 38.8
Wilson R. Lab 946 15.7
Turnout 63.6 6.7
Southwater & Nuthurst (9224)
vote share
Watson B.* Con 3,057 48.4
Stainton P. LD 2,608 41.3
Parker T. Lab 646 10.2
Turnout 68.4 7.1
Storrington (9348)
vote share
Wilkinson F.* Con 3,767 58.8
Hughes A. LD 1,619 25.3
Banks P. Ms. Lab 1,020 15.9
Turnout 68.5 33.5
Warnham & Rusper (8492)
vote share
Hodgson M.* Con 3,217 56.5
Pearce T. LD 1,645 28.9
Battersby J. Ms. Lab 832 14.6
Turnout 67.1 27.6
Burgess Hill (17760) 2
vote share
Knight S. Ms. LD 4,940 41.0
Barrett-Miles A. Con 4,677 38.8
Henwood J. Ms. LD 4,627 -
Landriani J. Ms. Con 4,445 -
Renshaw I. Lab 1,495 12.4
West A. Lab 977 -
Macgregor M. Ms. Green 930 7.7
Turnout 68.0 2.2
Cuckfield & Lucastes (6866)
vote share
Morris A. Ms. Con 2,633 53.0
Balls I. Ms. LD 1,556 31.3
Davies D. Lab 423 8.5
Wemyss-Gorman P. Green 354 7.1
Turnout 72.3 21.7
East Grinstead (16473) 2
vote share
Collins M. Ms.* LD 4,802 44.7
Ball M. Ms. Con 4,680 43.6
Bass A. Con 4,449 -
Brock A.* LD 4,138 -
Fallowell S. Lab 1,257 11.7
Irvine D. Lab 875 -
Turnout 66.6 1.1
Hassocks & Victoria (9424)
vote share
Wilsdon C.* LD 2,818 42.9
Bell S. Con 2,632 40.1
Piercy A. Ms. Lab 697 10.6
Hammond D. Green 423 6.4
Turnout 69.7 2.8
Crawley
Horsham
Mid Sussex
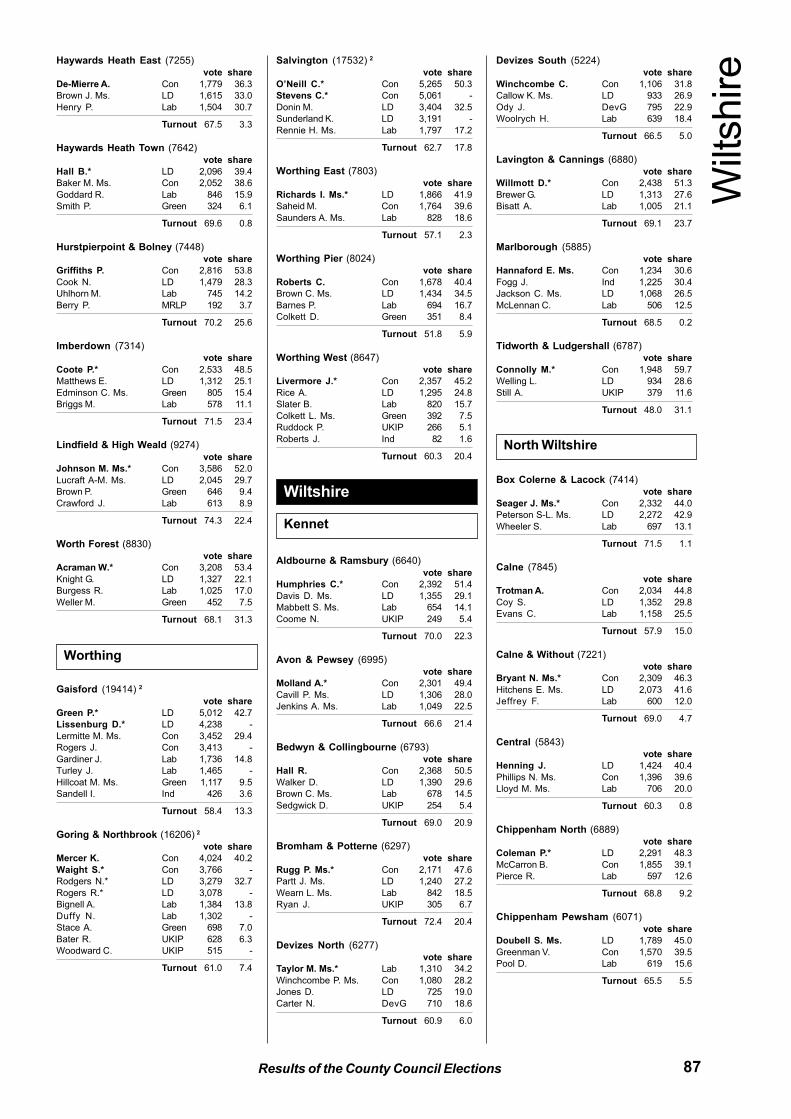
87Results of the County Council Elections
Haywards Heath East (7255)
vote share
De-Mierre A. Con 1,779 36.3
Brown J. Ms. LD 1,615 33.0
Henry P. Lab 1,504 30.7
Turnout 67.5 3.3
Haywards Heath Town (7642)
vote share
Hall B.* LD 2,096 39.4
Baker M. Ms. Con 2,052 38.6
Goddard R. Lab 846 15.9
Smith P. Green 324 6.1
Turnout 69.6 0.8
Hurstpierpoint & Bolney (7448)
vote share
Griffiths P. Con 2,816 53.8
Cook N. LD 1,479 28.3
Uhlhorn M. Lab 745 14.2
Berry P. MRLP 192 3.7
Turnout 70.2 25.6
Imberdown (7314)
vote share
Coote P.* Con 2,533 48.5
Matthews E. LD 1,312 25.1
Edminson C. Ms. Green 805 15.4
Briggs M. Lab 578 11.1
Turnout 71.5 23.4
Lindfield & High Weald (9274)
vote share
Johnson M. Ms.* Con 3,586 52.0
Lucraft A-M. Ms. LD 2,045 29.7
Brown P. Green 646 9.4
Crawford J. Lab 613 8.9
Turnout 74.3 22.4
Worth Forest (8830)
vote share
Acraman W.* Con 3,208 53.4
Knight G. LD 1,327 22.1
Burgess R. Lab 1,025 17.0
Weller M. Green 452 7.5
Turnout 68.1 31.3
Gaisford (19414) 2
vote share
Green P.* LD 5,012 42.7
Lissenburg D.* LD 4,238 -
Lermitte M. Ms. Con 3,452 29.4
Rogers J. Con 3,413 -
Gardiner J. Lab 1,736 14.8
Turley J. Lab 1,465 -
Hillcoat M. Ms. Green 1,117 9.5
Sandell I. Ind 426 3.6
Turnout 58.4 13.3
Goring & Northbrook (16206) 2
vote share
Mercer K. Con 4,024 40.2
Waight S.* Con 3,766 -
Rodgers N.* LD 3,279 32.7
Rogers R.* LD 3,078 -
Bignell A. Lab 1,384 13.8
Duffy N. Lab 1,302 -
Stace A. Green 698 7.0
Bater R. UKIP 628 6.3
Woodward C. UKIP 515 -
Turnout 61.0 7.4
Salvington (17532) 2
vote share
O’Neill C.* Con 5,265 50.3
Stevens C.* Con 5,061 -
Donin M. LD 3,404 32.5
Sunderland K. LD 3,191 -
Rennie H. Ms. Lab 1,797 17.2
Turnout 62.7 17.8
Worthing East (7803)
vote share
Richards I. Ms.* LD 1,866 41.9
Saheid M. Con 1,764 39.6
Saunders A. Ms. Lab 828 18.6
Turnout 57.1 2.3
Worthing Pier (8024)
vote share
Roberts C. Con 1,678 40.4
Brown C. Ms. LD 1,434 34.5
Barnes P. Lab 694 16.7
Colkett D. Green 351 8.4
Turnout 51.8 5.9
Worthing West (8647)
vote share
Livermore J.* Con 2,357 45.2
Rice A. LD 1,295 24.8
Slater B. Lab 820 15.7
Colkett L. Ms. Green 392 7.5
Ruddock P. UKIP 266 5.1
Roberts J. Ind 82 1.6
Turnout 60.3 20.4
Aldbourne & Ramsbury (6640)
vote share
Humphries C.* Con 2,392 51.4
Davis D. Ms. LD 1,355 29.1
Mabbett S. Ms. Lab 654 14.1
Coome N. UKIP 249 5.4
Turnout 70.0 22.3
Avon & Pewsey (6995)
vote share
Molland A.* Con 2,301 49.4
Cavill P. Ms. LD 1,306 28.0
Jenkins A. Ms. Lab 1,049 22.5
Turnout 66.6 21.4
Bedwyn & Collingbourne (6793)
vote share
Hall R. Con 2,368 50.5
Walker D. LD 1,390 29.6
Brown C. Ms. Lab 678 14.5
Sedgwick D. UKIP 254 5.4
Turnout 69.0 20.9
Bromham & Potterne (6297)
vote share
Rugg P. Ms.* Con 2,171 47.6
Partt J. Ms. LD 1,240 27.2
Wearn L. Ms. Lab 842 18.5
Ryan J. UKIP 305 6.7
Turnout 72.4 20.4
Devizes North (6277)
vote share
Taylor M. Ms.* Lab 1,310 34.2
Winchcombe P. Ms. Con 1,080 28.2
Jones D. LD 725 19.0
Carter N. DevG 710 18.6
Turnout 60.9 6.0
Devizes South (5224)
vote share
Winchcombe C. Con 1,106 31.8
Callow K. Ms. LD 933 26.9
Ody J. DevG 795 22.9
Woolrych H. Lab 639 18.4
Turnout 66.5 5.0
Lavington & Cannings (6880)
vote share
Willmott D.* Con 2,438 51.3
Brewer G. LD 1,313 27.6
Bisatt A. Lab 1,005 21.1
Turnout 69.1 23.7
Marlborough (5885)
vote share
Hannaford E. Ms. Con 1,234 30.6
Fogg J. Ind 1,225 30.4
Jackson C. Ms. LD 1,068 26.5
McLennan C. Lab 506 12.5
Turnout 68.5 0.2
Tidworth & Ludgershall (6787)
vote share
Connolly M.* Con 1,948 59.7
Welling L. LD 934 28.6
Still A. UKIP 379 11.6
Turnout 48.0 31.1
Box Colerne & Lacock (7414)
vote share
Seager J. Ms.* Con 2,332 44.0
Peterson S-L. Ms. LD 2,272 42.9
Wheeler S. Lab 697 13.1
Turnout 71.5 1.1
Calne (7845)
vote share
Trotman A. Con 2,034 44.8
Coy S. LD 1,352 29.8
Evans C. Lab 1,158 25.5
Turnout 57.9 15.0
Calne & Without (7221)
vote share
Bryant N. Ms.* Con 2,309 46.3
Hitchens E. Ms. LD 2,073 41.6
Jeffrey F. Lab 600 12.0
Turnout 69.0 4.7
Central (5843)
vote share
Henning J. LD 1,424 40.4
Phillips N. Ms. Con 1,396 39.6
Lloyd M. Ms. Lab 706 20.0
Turnout 60.3 0.8
Chippenham North (6889)
vote share
Coleman P.* LD 2,291 48.3
McCarron B. Con 1,855 39.1
Pierce R. Lab 597 12.6
Turnout 68.8 9.2
Chippenham Pewsham (6071)
vote share
Doubell S. Ms. LD 1,789 45.0
Greenman V. Con 1,570 39.5
Pool D. Lab 619 15.6
Turnout 65.5 5.5
Worthing
Wilt
shire
Kennet
Wiltshire
North Wiltshire
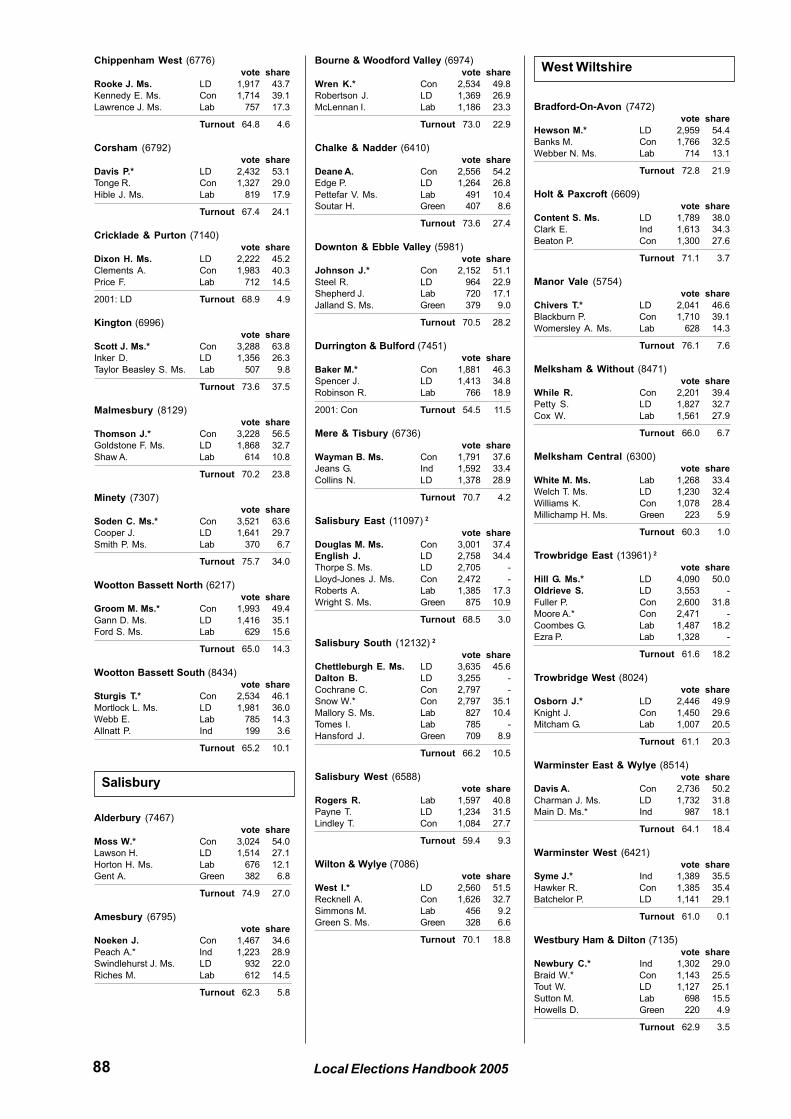
88 Local Elections Handbook 2005
Chippenham West (6776)
vote share
Rooke J. Ms. LD 1,917 43.7
Kennedy E. Ms. Con 1,714 39.1
Lawrence J. Ms. Lab 757 17.3
Turnout 64.8 4.6
Corsham (6792)
vote share
Davis P.* LD 2,432 53.1
Tonge R. Con 1,327 29.0
Hible J. Ms. Lab 819 17.9
Turnout 67.4 24.1
Cricklade & Purton (7140)
vote share
Dixon H. Ms. LD 2,222 45.2
Clements A. Con 1,983 40.3
Price F. Lab 712 14.5
2001: LD Turnout 68.9 4.9
Kington (6996)
vote share
Scott J. Ms.* Con 3,288 63.8
Inker D. LD 1,356 26.3
Taylor Beasley S. Ms. Lab 507 9.8
Turnout 73.6 37.5
Malmesbury (8129)
vote share
Thomson J.* Con 3,228 56.5
Goldstone F. Ms. LD 1,868 32.7
Shaw A. Lab 614 10.8
Turnout 70.2 23.8
Minety (7307)
vote share
Soden C. Ms.* Con 3,521 63.6
Cooper J. LD 1,641 29.7
Smith P. Ms. Lab 370 6.7
Turnout 75.7 34.0
Wootton Bassett North (6217)
vote share
Groom M. Ms.* Con 1,993 49.4
Gann D. Ms. LD 1,416 35.1
Ford S. Ms. Lab 629 15.6
Turnout 65.0 14.3
Wootton Bassett South (8434)
vote share
Sturgis T.* Con 2,534 46.1
Mortlock L. Ms. LD 1,981 36.0
Webb E. Lab 785 14.3
Allnatt P. Ind 199 3.6
Turnout 65.2 10.1
Alderbury (7467)
vote share
Moss W.* Con 3,024 54.0
Lawson H. LD 1,514 27.1
Horton H. Ms. Lab 676 12.1
Gent A. Green 382 6.8
Turnout 74.9 27.0
Amesbury (6795)
vote share
Noeken J. Con 1,467 34.6
Peach A.* Ind 1,223 28.9
Swindlehurst J. Ms. LD 932 22.0
Riches M. Lab 612 14.5
Turnout 62.3 5.8
Bourne & Woodford Valley (6974)
vote share
Wren K.* Con 2,534 49.8
Robertson J. LD 1,369 26.9
McLennan I. Lab 1,186 23.3
Turnout 73.0 22.9
Chalke & Nadder (6410)
vote share
Deane A. Con 2,556 54.2
Edge P. LD 1,264 26.8
Pettefar V. Ms. Lab 491 10.4
Soutar H. Green 407 8.6
Turnout 73.6 27.4
Downton & Ebble Valley (5981)
vote share
Johnson J.* Con 2,152 51.1
Steel R. LD 964 22.9
Shepherd J. Lab 720 17.1
Jalland S. Ms. Green 379 9.0
Turnout 70.5 28.2
Durrington & Bulford (7451)
vote share
Baker M.* Con 1,881 46.3
Spencer J. LD 1,413 34.8
Robinson R. Lab 766 18.9
2001: Con Turnout 54.5 11.5
Mere & Tisbury (6736)
vote share
Wayman B. Ms. Con 1,791 37.6
Jeans G. Ind 1,592 33.4
Collins N. LD 1,378 28.9
Turnout 70.7 4.2
Salisbury East (11097) 2
vote share
Douglas M. Ms. Con 3,001 37.4
English J. LD 2,758 34.4
Thorpe S. Ms. LD 2,705 -
Lloyd-Jones J. Ms. Con 2,472 -
Roberts A. Lab 1,385 17.3
Wright S. Ms. Green 875 10.9
Turnout 68.5 3.0
Salisbury South (12132) 2
vote share
Chettleburgh E. Ms. LD 3,635 45.6
Dalton B. LD 3,255 -
Cochrane C. Con 2,797 -
Snow W.* Con 2,797 35.1
Mallory S. Ms. Lab 827 10.4
Tomes I. Lab 785 -
Hansford J. Green 709 8.9
Turnout 66.2 10.5
Salisbury West (6588)
vote share
Rogers R. Lab 1,597 40.8
Payne T. LD 1,234 31.5
Lindley T. Con 1,084 27.7
Turnout 59.4 9.3
Wilton & Wylye (7086)
vote share
West I.* LD 2,560 51.5
Recknell A. Con 1,626 32.7
Simmons M. Lab 456 9.2
Green S. Ms. Green 328 6.6
Turnout 70.1 18.8
Bradford-On-Avon (7472)
vote share
Hewson M.* LD 2,959 54.4
Banks M. Con 1,766 32.5
Webber N. Ms. Lab 714 13.1
Turnout 72.8 21.9
Holt & Paxcroft (6609)
vote share
Content S. Ms. LD 1,789 38.0
Clark E. Ind 1,613 34.3
Beaton P. Con 1,300 27.6
Turnout 71.1 3.7
Manor Vale (5754)
vote share
Chivers T.* LD 2,041 46.6
Blackburn P. Con 1,710 39.1
Womersley A. Ms. Lab 628 14.3
Turnout 76.1 7.6
Melksham & Without (8471)
vote share
While R. Con 2,201 39.4
Petty S. LD 1,827 32.7
Cox W. Lab 1,561 27.9
Turnout 66.0 6.7
Melksham Central (6300)
vote share
White M. Ms. Lab 1,268 33.4
Welch T. Ms. LD 1,230 32.4
Williams K. Con 1,078 28.4
Millichamp H. Ms. Green 223 5.9
Turnout 60.3 1.0
Trowbridge East (13961) 2
vote share
Hill G. Ms.* LD 4,090 50.0
Oldrieve S. LD 3,553 -
Fuller P. Con 2,600 31.8
Moore A.* Con 2,471 -
Coombes G. Lab 1,487 18.2
Ezra P. Lab 1,328 -
Turnout 61.6 18.2
Trowbridge West (8024)
vote share
Osborn J.* LD 2,446 49.9
Knight J. Con 1,450 29.6
Mitcham G. Lab 1,007 20.5
Turnout 61.1 20.3
Warminster East & Wylye (8514)
vote share
Davis A. Con 2,736 50.2
Charman J. Ms. LD 1,732 31.8
Main D. Ms.* Ind 987 18.1
Turnout 64.1 18.4
Warminster West (6421)
vote share
Syme J.* Ind 1,389 35.5
Hawker R. Con 1,385 35.4
Batchelor P. LD 1,141 29.1
Turnout 61.0 0.1
Westbury Ham & Dilton (7135)
vote share
Newbury C.* Ind 1,302 29.0
Braid W.* Con 1,143 25.5
Tout W. LD 1,127 25.1
Sutton M. Lab 698 15.5
Howells D. Green 220 4.9
Turnout 62.9 3.5
Salisbury
West Wiltshire
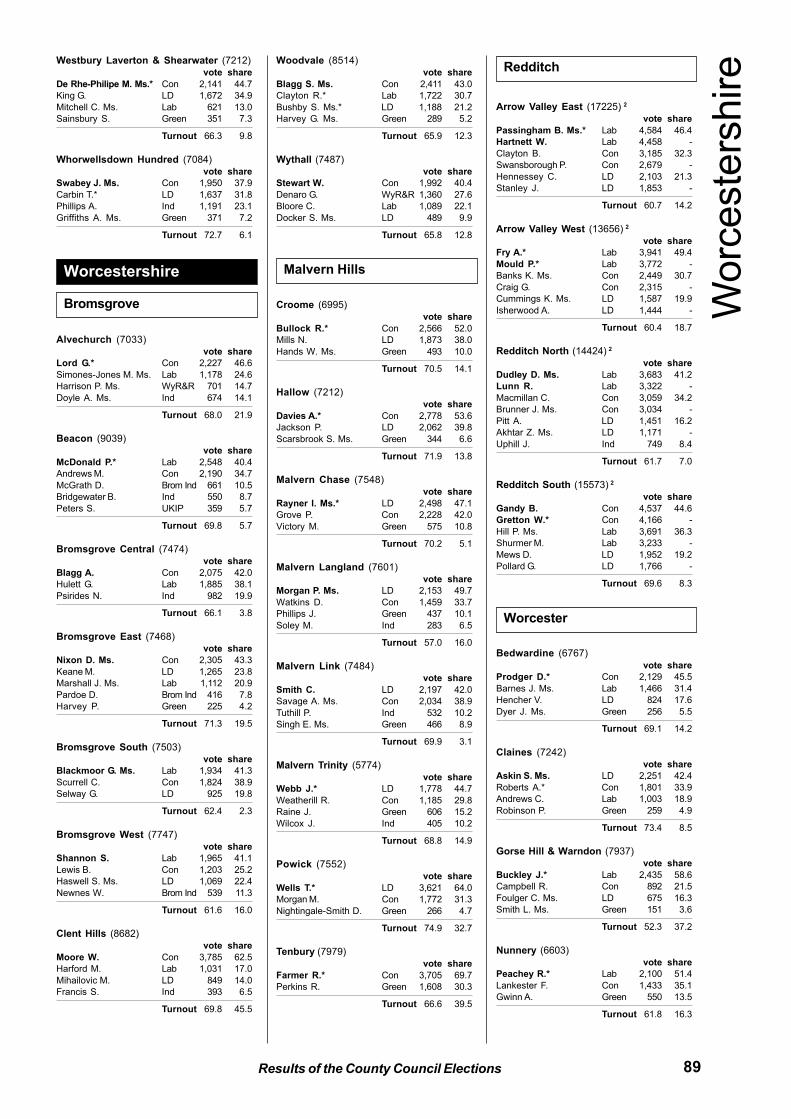
89Results of the County Council Elections
Westbury Laverton & Shearwater (7212)
vote share
De Rhe-Philipe M. Ms.* Con 2,141 44.7
King G. LD 1,672 34.9
Mitchell C. Ms. Lab 621 13.0
Sainsbury S. Green 351 7.3
Turnout 66.3 9.8
Whorwellsdown Hundred (7084)
vote share
Swabey J. Ms. Con 1,950 37.9
Carbin T.* LD 1,637 31.8
Phillips A. Ind 1,191 23.1
Griffiths A. Ms. Green 371 7.2
Turnout 72.7 6.1
Alvechurch (7033)
vote share
Lord G.* Con 2,227 46.6
Simones-Jones M. Ms. Lab 1,178 24.6
Harrison P. Ms. WyR&R 701 14.7
Doyle A. Ms. Ind 674 14.1
Turnout 68.0 21.9
Beacon (9039)
vote share
McDonald P.* Lab 2,548 40.4
Andrews M. Con 2,190 34.7
McGrath D. Brom Ind 661 10.5
Bridgewater B. Ind 550 8.7
Peters S. UKIP 359 5.7
Turnout 69.8 5.7
Bromsgrove Central (7474)
vote share
Blagg A. Con 2,075 42.0
Hulett G. Lab 1,885 38.1
Psirides N. Ind 982 19.9
Turnout 66.1 3.8
Bromsgrove East (7468)
vote share
Nixon D. Ms. Con 2,305 43.3
Keane M. LD 1,265 23.8
Marshall J. Ms. Lab 1,112 20.9
Pardoe D. Brom Ind 416 7.8
Harvey P. Green 225 4.2
Turnout 71.3 19.5
Bromsgrove South (7503)
vote share
Blackmoor G. Ms. Lab 1,934 41.3
Scurrell C. Con 1,824 38.9
Selway G. LD 925 19.8
Turnout 62.4 2.3
Bromsgrove West (7747)
vote share
Shannon S. Lab 1,965 41.1
Lewis B. Con 1,203 25.2
Haswell S. Ms. LD 1,069 22.4
Newnes W. Brom Ind 539 11.3
Turnout 61.6 16.0
Clent Hills (8682)
vote share
Moore W. Con 3,785 62.5
Harford M. Lab 1,031 17.0
Mihailovic M. LD 849 14.0
Francis S. Ind 393 6.5
Turnout 69.8 45.5
Woodvale (8514)
vote share
Blagg S. Ms. Con 2,411 43.0
Clayton R.* Lab 1,722 30.7
Bushby S. Ms.* LD 1,188 21.2
Harvey G. Ms. Green 289 5.2
Turnout 65.9 12.3
Wythall (7487)
vote share
Stewart W. Con 1,992 40.4
Denaro G. WyR&R 1,360 27.6
Bloore C. Lab 1,089 22.1
Docker S. Ms. LD 489 9.9
Turnout 65.8 12.8
Croome (6995)
vote share
Bullock R.* Con 2,566 52.0
Mills N. LD 1,873 38.0
Hands W. Ms. Green 493 10.0
Turnout 70.5 14.1
Hallow (7212)
vote share
Davies A.* Con 2,778 53.6
Jackson P. LD 2,062 39.8
Scarsbrook S. Ms. Green 344 6.6
Turnout 71.9 13.8
Malvern Chase (7548)
vote share
Rayner I. Ms.* LD 2,498 47.1
Grove P. Con 2,228 42.0
Victory M. Green 575 10.8
Turnout 70.2 5.1
Malvern Langland (7601)
vote share
Morgan P. Ms. LD 2,153 49.7
Watkins D. Con 1,459 33.7
Phillips J. Green 437 10.1
Soley M. Ind 283 6.5
Turnout 57.0 16.0
Malvern Link (7484)
vote share
Smith C. LD 2,197 42.0
Savage A. Ms. Con 2,034 38.9
Tuthill P. Ind 532 10.2
Singh E. Ms. Green 466 8.9
Turnout 69.9 3.1
Malvern Trinity (5774)
vote share
Webb J.* LD 1,778 44.7
Weatherill R. Con 1,185 29.8
Raine J. Green 606 15.2
Wilcox J. Ind 405 10.2
Turnout 68.8 14.9
Powick (7552)
vote share
Wells T.* LD 3,621 64.0
Morgan M. Con 1,772 31.3
Nightingale-Smith D. Green 266 4.7
Turnout 74.9 32.7
Tenbury (7979)
vote share
Farmer R.* Con 3,705 69.7
Perkins R. Green 1,608 30.3
Turnout 66.6 39.5
Arrow Valley East (17225) 2
vote share
Passingham B. Ms.* Lab 4,584 46.4
Hartnett W. Lab 4,458 -
Clayton B. Con 3,185 32.3
Swansborough P. Con 2,679 -
Hennessey C. LD 2,103 21.3
Stanley J. LD 1,853 -
Turnout 60.7 14.2
Arrow Valley West (13656) 2
vote share
Fry A.* Lab 3,941 49.4
Mould P.* Lab 3,772 -
Banks K. Ms. Con 2,449 30.7
Craig G. Con 2,315 -
Cummings K. Ms. LD 1,587 19.9
Isherwood A. LD 1,444 -
Turnout 60.4 18.7
Redditch North (14424) 2
vote share
Dudley D. Ms. Lab 3,683 41.2
Lunn R. Lab 3,322 -
Macmillan C. Con 3,059 34.2
Brunner J. Ms. Con 3,034 -
Pitt A. LD 1,451 16.2
Akhtar Z. Ms. LD 1,171 -
Uphill J. Ind 749 8.4
Turnout 61.7 7.0
Redditch South (15573) 2
vote share
Gandy B. Con 4,537 44.6
Gretton W.* Con 4,166 -
Hill P. Ms. Lab 3,691 36.3
Shurmer M. Lab 3,233 -
Mews D. LD 1,952 19.2
Pollard G. LD 1,766 -
Turnout 69.6 8.3
Bedwardine (6767)
vote share
Prodger D.* Con 2,129 45.5
Barnes J. Ms. Lab 1,466 31.4
Hencher V. LD 824 17.6
Dyer J. Ms. Green 256 5.5
Turnout 69.1 14.2
Claines (7242)
vote share
Askin S. Ms. LD 2,251 42.4
Roberts A.* Con 1,801 33.9
Andrews C. Lab 1,003 18.9
Robinson P. Green 259 4.9
Turnout 73.4 8.5
Gorse Hill & Warndon (7937)
vote share
Buckley J.* Lab 2,435 58.6
Campbell R. Con 892 21.5
Foulger C. Ms. LD 675 16.3
Smith L. Ms. Green 151 3.6
Turnout 52.3 37.2
Nunnery (6603)
vote share
Peachey R.* Lab 2,100 51.4
Lankester F. Con 1,433 35.1
Gwinn A. Green 550 13.5
Turnout 61.8 16.3
Bromsgrove
Worcestershire Malvern Hills
Worc
este
rshireRedditch
Worcester
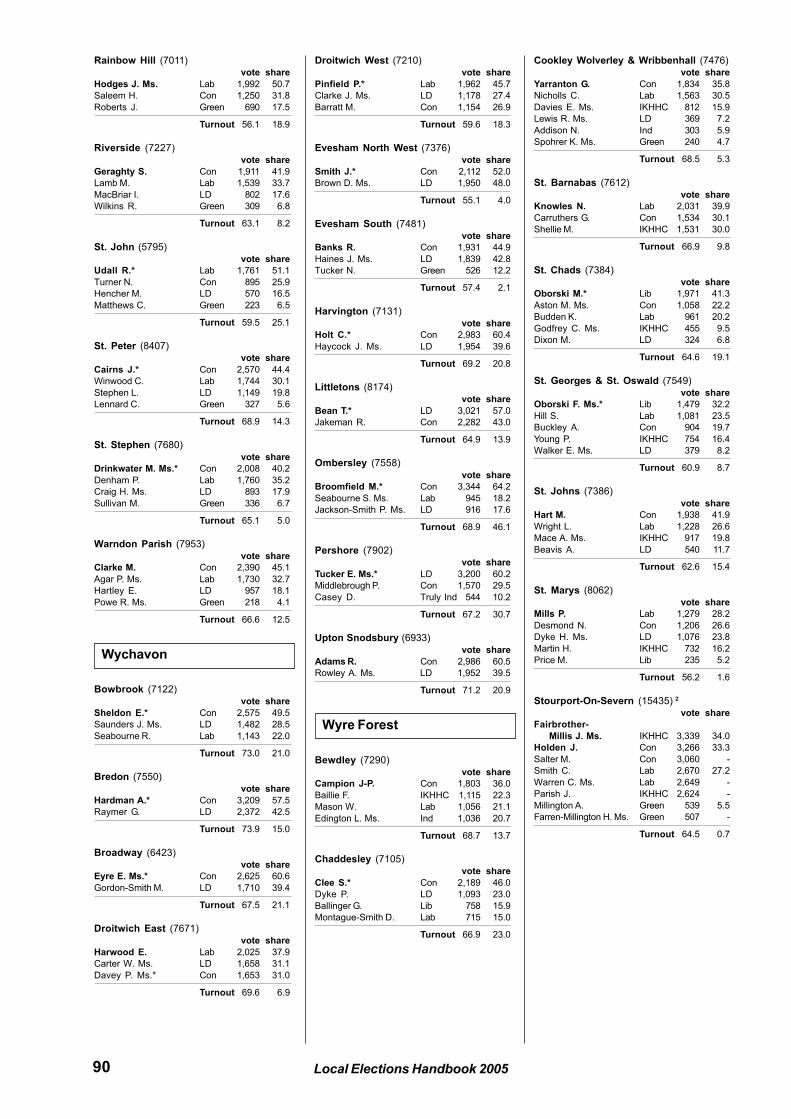
90 Local Elections Handbook 2005
Rainbow Hill (7011)
vote share
Hodges J. Ms. Lab 1,992 50.7
Saleem H. Con 1,250 31.8
Roberts J. Green 690 17.5
Turnout 56.1 18.9
Riverside (7227)
vote share
Geraghty S. Con 1,911 41.9
Lamb M. Lab 1,539 33.7
MacBriar I. LD 802 17.6
Wilkins R. Green 309 6.8
Turnout 63.1 8.2
St. John (5795)
vote share
Udall R.* Lab 1,761 51.1
Turner N. Con 895 25.9
Hencher M. LD 570 16.5
Matthews C. Green 223 6.5
Turnout 59.5 25.1
St. Peter (8407)
vote share
Cairns J.* Con 2,570 44.4
Winwood C. Lab 1,744 30.1
Stephen L. LD 1,149 19.8
Lennard C. Green 327 5.6
Turnout 68.9 14.3
St. Stephen (7680)
vote share
Drinkwater M. Ms.* Con 2,008 40.2
Denham P. Lab 1,760 35.2
Craig H. Ms. LD 893 17.9
Sullivan M. Green 336 6.7
Turnout 65.1 5.0
Warndon Parish (7953)
vote share
Clarke M. Con 2,390 45.1
Agar P. Ms. Lab 1,730 32.7
Hartley E. LD 957 18.1
Powe R. Ms. Green 218 4.1
Turnout 66.6 12.5
Bowbrook (7122)
vote share
Sheldon E.* Con 2,575 49.5
Saunders J. Ms. LD 1,482 28.5
Seabourne R. Lab 1,143 22.0
Turnout 73.0 21.0
Bredon (7550)
vote share
Hardman A.* Con 3,209 57.5
Raymer G. LD 2,372 42.5
Turnout 73.9 15.0
Broadway (6423)
vote share
Eyre E. Ms.* Con 2,625 60.6
Gordon-Smith M. LD 1,710 39.4
Turnout 67.5 21.1
Droitwich East (7671)
vote share
Harwood E. Lab 2,025 37.9
Carter W. Ms. LD 1,658 31.1
Davey P. Ms.* Con 1,653 31.0
Turnout 69.6 6.9
Droitwich West (7210)
vote share
Pinfield P.* Lab 1,962 45.7
Clarke J. Ms. LD 1,178 27.4
Barratt M. Con 1,154 26.9
Turnout 59.6 18.3
Evesham North West (7376)
vote share
Smith J.* Con 2,112 52.0
Brown D. Ms. LD 1,950 48.0
Turnout 55.1 4.0
Evesham South (7481)
vote share
Banks R. Con 1,931 44.9
Haines J. Ms. LD 1,839 42.8
Tucker N. Green 526 12.2
Turnout 57.4 2.1
Harvington (7131)
vote share
Holt C.* Con 2,983 60.4
Haycock J. Ms. LD 1,954 39.6
Turnout 69.2 20.8
Littletons (8174)
vote share
Bean T.* LD 3,021 57.0
Jakeman R. Con 2,282 43.0
Turnout 64.9 13.9
Ombersley (7558)
vote share
Broomfield M.* Con 3,344 64.2
Seabourne S. Ms. Lab 945 18.2
Jackson-Smith P. Ms. LD 916 17.6
Turnout 68.9 46.1
Pershore (7902)
vote share
Tucker E. Ms.* LD 3,200 60.2
Middlebrough P. Con 1,570 29.5
Casey D. Truly Ind 544 10.2
Turnout 67.2 30.7
Upton Snodsbury (6933)
vote share
Adams R. Con 2,986 60.5
Rowley A. Ms. LD 1,952 39.5
Turnout 71.2 20.9
Bewdley (7290)
vote share
Campion J-P. Con 1,803 36.0
Baillie F. IKHHC 1,115 22.3
Mason W. Lab 1,056 21.1
Edington L. Ms. Ind 1,036 20.7
Turnout 68.7 13.7
Chaddesley (7105)
vote share
Clee S.* Con 2,189 46.0
Dyke P. LD 1,093 23.0
Ballinger G. Lib 758 15.9
Montague-Smith D. Lab 715 15.0
Turnout 66.9 23.0
Cookley Wolverley & Wribbenhall (7476)
vote share
Yarranton G. Con 1,834 35.8
Nicholls C. Lab 1,563 30.5
Davies E. Ms. IKHHC 812 15.9
Lewis R. Ms. LD 369 7.2
Addison N. Ind 303 5.9
Spohrer K. Ms. Green 240 4.7
Turnout 68.5 5.3
St. Barnabas (7612)
vote share
Knowles N. Lab 2,031 39.9
Carruthers G. Con 1,534 30.1
Shellie M. IKHHC 1,531 30.0
Turnout 66.9 9.8
St. Chads (7384)
vote share
Oborski M.* Lib 1,971 41.3
Aston M. Ms. Con 1,058 22.2
Budden K. Lab 961 20.2
Godfrey C. Ms. IKHHC 455 9.5
Dixon M. LD 324 6.8
Turnout 64.6 19.1
St. Georges & St. Oswald (7549)
vote share
Oborski F. Ms.* Lib 1,479 32.2
Hill S. Lab 1,081 23.5
Buckley A. Con 904 19.7
Young P. IKHHC 754 16.4
Walker E. Ms. LD 379 8.2
Turnout 60.9 8.7
St. Johns (7386)
vote share
Hart M. Con 1,938 41.9
Wright L. Lab 1,228 26.6
Mace A. Ms. IKHHC 917 19.8
Beavis A. LD 540 11.7
Turnout 62.6 15.4
St. Marys (8062)
vote share
Mills P. Lab 1,279 28.2
Desmond N. Con 1,206 26.6
Dyke H. Ms. LD 1,076 23.8
Martin H. IKHHC 732 16.2
Price M. Lib 235 5.2
Turnout 56.2 1.6
Stourport-On-Severn (15435) 2
vote share
Fairbrother-
Millis J. Ms. IKHHC 3,339 34.0
Holden J. Con 3,266 33.3
Salter M. Con 3,060 -
Smith C. Lab 2,670 27.2
Warren C. Ms. Lab 2,649 -
Parish J. IKHHC 2,624 -
Millington A. Green 539 5.5
Farren-Millington H. Ms. Green 507 -
Turnout 64.5 0.7
Wychavon
Wyre Forest
Unitary Council
Election Results

2
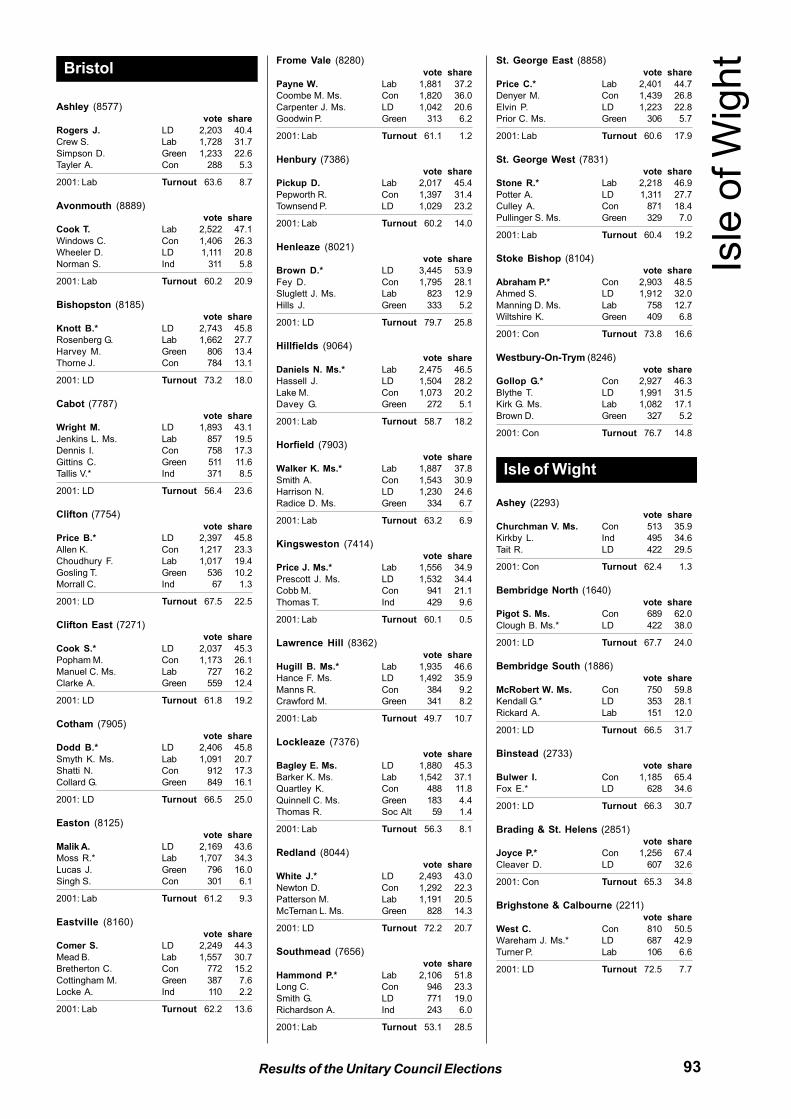
93Results of the Unitary Council Elections
Ashley (8577)
vote share
Rogers J. LD 2,203 40.4
Crew S. Lab 1,728 31.7
Simpson D. Green 1,233 22.6
Tayler A. Con 288 5.3
2001: Lab Turnout 63.6 8.7
Avonmouth (8889)
vote share
Cook T. Lab 2,522 47.1
Windows C. Con 1,406 26.3
Wheeler D. LD 1,111 20.8
Norman S. Ind 311 5.8
2001: Lab Turnout 60.2 20.9
Bishopston (8185)
vote share
Knott B.* LD 2,743 45.8
Rosenberg G. Lab 1,662 27.7
Harvey M. Green 806 13.4
Thorne J. Con 784 13.1
2001: LD Turnout 73.2 18.0
Cabot (7787)
vote share
Wright M. LD 1,893 43.1
Jenkins L. Ms. Lab 857 19.5
Dennis I. Con 758 17.3
Gittins C. Green 511 11.6
Tallis V.* Ind 371 8.5
2001: LD Turnout 56.4 23.6
Clifton (7754)
vote share
Price B.* LD 2,397 45.8
Allen K. Con 1,217 23.3
Choudhury F. Lab 1,017 19.4
Gosling T. Green 536 10.2
Morrall C. Ind 67 1.3
2001: LD Turnout 67.5 22.5
Clifton East (7271)
vote share
Cook S.* LD 2,037 45.3
Popham M. Con 1,173 26.1
Manuel C. Ms. Lab 727 16.2
Clarke A. Green 559 12.4
2001: LD Turnout 61.8 19.2
Cotham (7905)
vote share
Dodd B.* LD 2,406 45.8
Smyth K. Ms. Lab 1,091 20.7
Shatti N. Con 912 17.3
Collard G. Green 849 16.1
2001: LD Turnout 66.5 25.0
Easton (8125)
vote share
Malik A. LD 2,169 43.6
Moss R.* Lab 1,707 34.3
Lucas J. Green 796 16.0
Singh S. Con 301 6.1
2001: Lab Turnout 61.2 9.3
Eastville (8160)
vote share
Comer S. LD 2,249 44.3
Mead B. Lab 1,557 30.7
Bretherton C. Con 772 15.2
Cottingham M. Green 387 7.6
Locke A. Ind 110 2.2
2001: Lab Turnout 62.2 13.6
Frome Vale (8280)
vote share
Payne W. Lab 1,881 37.2
Coombe M. Ms. Con 1,820 36.0
Carpenter J. Ms. LD 1,042 20.6
Goodwin P. Green 313 6.2
2001: Lab Turnout 61.1 1.2
Henbury (7386)
vote share
Pickup D. Lab 2,017 45.4
Pepworth R. Con 1,397 31.4
Townsend P. LD 1,029 23.2
2001: Lab Turnout 60.2 14.0
Henleaze (8021)
vote share
Brown D.* LD 3,445 53.9
Fey D. Con 1,795 28.1
Sluglett J. Ms. Lab 823 12.9
Hills J. Green 333 5.2
2001: LD Turnout 79.7 25.8
Hillfields (9064)
vote share
Daniels N. Ms.* Lab 2,475 46.5
Hassell J. LD 1,504 28.2
Lake M. Con 1,073 20.2
Davey G. Green 272 5.1
2001: Lab Turnout 58.7 18.2
Horfield (7903)
vote share
Walker K. Ms.* Lab 1,887 37.8
Smith A. Con 1,543 30.9
Harrison N. LD 1,230 24.6
Radice D. Ms. Green 334 6.7
2001: Lab Turnout 63.2 6.9
Kingsweston (7414)
vote share
Price J. Ms.* Lab 1,556 34.9
Prescott J. Ms. LD 1,532 34.4
Cobb M. Con 941 21.1
Thomas T. Ind 429 9.6
2001: Lab Turnout 60.1 0.5
Lawrence Hill (8362)
vote share
Hugill B. Ms.* Lab 1,935 46.6
Hance F. Ms. LD 1,492 35.9
Manns R. Con 384 9.2
Crawford M. Green 341 8.2
2001: Lab Turnout 49.7 10.7
Lockleaze (7376)
vote share
Bagley E. Ms. LD 1,880 45.3
Barker K. Ms. Lab 1,542 37.1
Quartley K. Con 488 11.8
Quinnell C. Ms. Green 183 4.4
Thomas R. Soc Alt 59 1.4
2001: Lab Turnout 56.3 8.1
Redland (8044)
vote share
White J.* LD 2,493 43.0
Newton D. Con 1,292 22.3
Patterson M. Lab 1,191 20.5
McTernan L. Ms. Green 828 14.3
2001: LD Turnout 72.2 20.7
Southmead (7656)
vote share
Hammond P.* Lab 2,106 51.8
Long C. Con 946 23.3
Smith G. LD 771 19.0
Richardson A. Ind 243 6.0
2001: Lab Turnout 53.1 28.5
St. George East (8858)
vote share
Price C.* Lab 2,401 44.7
Denyer M. Con 1,439 26.8
Elvin P. LD 1,223 22.8
Prior C. Ms. Green 306 5.7
2001: Lab Turnout 60.6 17.9
St. George West (7831)
vote share
Stone R.* Lab 2,218 46.9
Potter A. LD 1,311 27.7
Culley A. Con 871 18.4
Pullinger S. Ms. Green 329 7.0
2001: Lab Turnout 60.4 19.2
Stoke Bishop (8104)
vote share
Abraham P.* Con 2,903 48.5
Ahmed S. LD 1,912 32.0
Manning D. Ms. Lab 758 12.7
Wiltshire K. Green 409 6.8
2001: Con Turnout 73.8 16.6
Westbury-On-Trym (8246)
vote share
Gollop G.* Con 2,927 46.3
Blythe T. LD 1,991 31.5
Kirk G. Ms. Lab 1,082 17.1
Brown D. Green 327 5.2
2001: Con Turnout 76.7 14.8
Ashey (2293)
vote share
Churchman V. Ms. Con 513 35.9
Kirkby L. Ind 495 34.6
Tait R. LD 422 29.5
2001: Con Turnout 62.4 1.3
Bembridge North (1640)
vote share
Pigot S. Ms. Con 689 62.0
Clough B. Ms.* LD 422 38.0
2001: LD Turnout 67.7 24.0
Bembridge South (1886)
vote share
McRobert W. Ms. Con 750 59.8
Kendall G.* LD 353 28.1
Rickard A. Lab 151 12.0
2001: LD Turnout 66.5 31.7
Binstead (2733)
vote share
Bulwer I. Con 1,185 65.4
Fox E.* LD 628 34.6
2001: LD Turnout 66.3 30.7
Brading & St. Helens (2851)
vote share
Joyce P.* Con 1,256 67.4
Cleaver D. LD 607 32.6
2001: Con Turnout 65.3 34.8
Brighstone & Calbourne (2211)
vote share
West C. Con 810 50.5
Wareham J. Ms.* LD 687 42.9
Turner P. Lab 106 6.6
2001: LD Turnout 72.5 7.7
Bristol
Isle of Wight
Isle
of W
ight
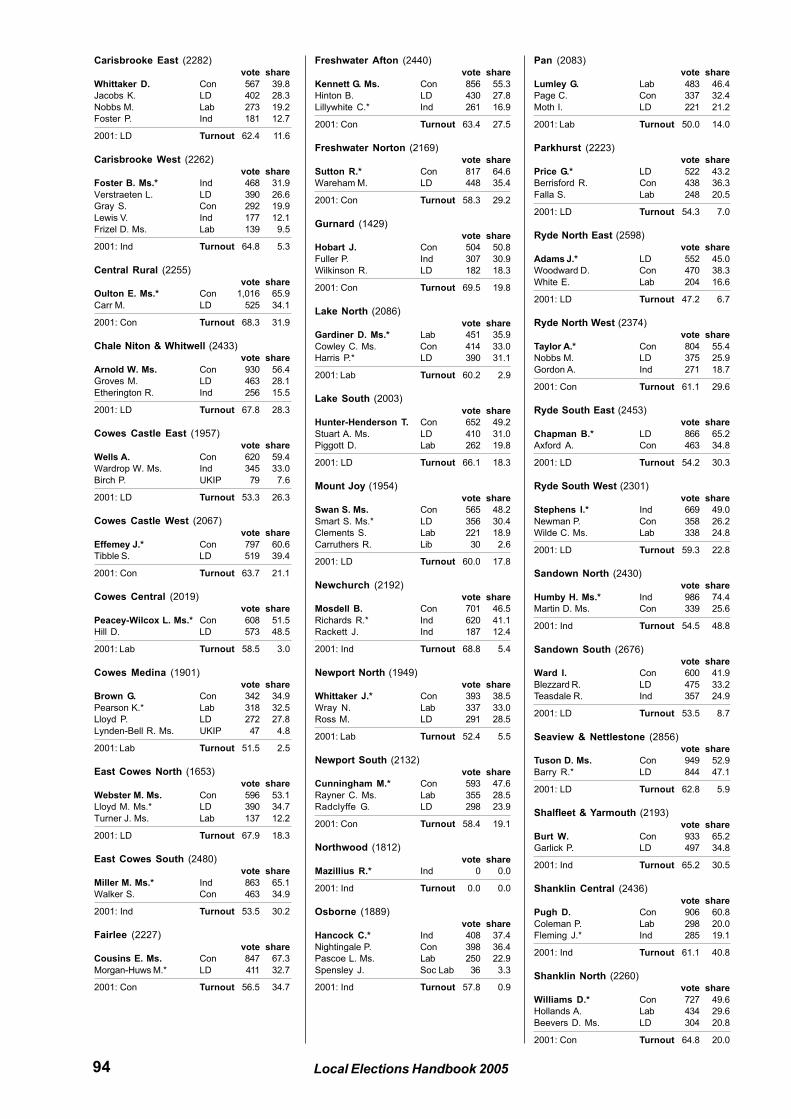
94 Local Elections Handbook 2005
Carisbrooke East (2282)
vote share
Whittaker D. Con 567 39.8
Jacobs K. LD 402 28.3
Nobbs M. Lab 273 19.2
Foster P. Ind 181 12.7
2001: LD Turnout 62.4 11.6
Carisbrooke West (2262)
vote share
Foster B. Ms.* Ind 468 31.9
Verstraeten L. LD 390 26.6
Gray S. Con 292 19.9
Lewis V. Ind 177 12.1
Frizel D. Ms. Lab 139 9.5
2001: Ind Turnout 64.8 5.3
Central Rural (2255)
vote share
Oulton E. Ms.* Con 1,016 65.9
Carr M. LD 525 34.1
2001: Con Turnout 68.3 31.9
Chale Niton & Whitwell (2433)
vote share
Arnold W. Ms. Con 930 56.4
Groves M. LD 463 28.1
Etherington R. Ind 256 15.5
2001: LD Turnout 67.8 28.3
Cowes Castle East (1957)
vote share
Wells A. Con 620 59.4
Wardrop W. Ms. Ind 345 33.0
Birch P. UKIP 79 7.6
2001: LD Turnout 53.3 26.3
Cowes Castle West (2067)
vote share
Effemey J.* Con 797 60.6
Tibble S. LD 519 39.4
2001: Con Turnout 63.7 21.1
Cowes Central (2019)
vote share
Peacey-Wilcox L. Ms.* Con 608 51.5
Hill D. LD 573 48.5
2001: Lab Turnout 58.5 3.0
Cowes Medina (1901)
vote share
Brown G. Con 342 34.9
Pearson K.* Lab 318 32.5
Lloyd P. LD 272 27.8
Lynden-Bell R. Ms. UKIP 47 4.8
2001: Lab Turnout 51.5 2.5
East Cowes North (1653)
vote share
Webster M. Ms. Con 596 53.1
Lloyd M. Ms.* LD 390 34.7
Turner J. Ms. Lab 137 12.2
2001: LD Turnout 67.9 18.3
East Cowes South (2480)
vote share
Miller M. Ms.* Ind 863 65.1
Walker S. Con 463 34.9
2001: Ind Turnout 53.5 30.2
Fairlee (2227)
vote share
Cousins E. Ms. Con 847 67.3
Morgan-Huws M.* LD 411 32.7
2001: Con Turnout 56.5 34.7
Freshwater Afton (2440)
vote share
Kennett G. Ms. Con 856 55.3
Hinton B. LD 430 27.8
Lillywhite C.* Ind 261 16.9
2001: Con Turnout 63.4 27.5
Freshwater Norton (2169)
vote share
Sutton R.* Con 817 64.6
Wareham M. LD 448 35.4
2001: Con Turnout 58.3 29.2
Gurnard (1429)
vote share
Hobart J. Con 504 50.8
Fuller P. Ind 307 30.9
Wilkinson R. LD 182 18.3
2001: Con Turnout 69.5 19.8
Lake North (2086)
vote share
Gardiner D. Ms.* Lab 451 35.9
Cowley C. Ms. Con 414 33.0
Harris P.* LD 390 31.1
2001: Lab Turnout 60.2 2.9
Lake South (2003)
vote share
Hunter-Henderson T. Con 652 49.2
Stuart A. Ms. LD 410 31.0
Piggott D. Lab 262 19.8
2001: LD Turnout 66.1 18.3
Mount Joy (1954)
vote share
Swan S. Ms. Con 565 48.2
Smart S. Ms.* LD 356 30.4
Clements S. Lab 221 18.9
Carruthers R. Lib 30 2.6
2001: LD Turnout 60.0 17.8
Newchurch (2192)
vote share
Mosdell B. Con 701 46.5
Richards R.* Ind 620 41.1
Rackett J. Ind 187 12.4
2001: Ind Turnout 68.8 5.4
Newport North (1949)
vote share
Whittaker J.* Con 393 38.5
Wray N. Lab 337 33.0
Ross M. LD 291 28.5
2001: Lab Turnout 52.4 5.5
Newport South (2132)
vote share
Cunningham M.* Con 593 47.6
Rayner C. Ms. Lab 355 28.5
Radclyffe G. LD 298 23.9
2001: Con Turnout 58.4 19.1
Northwood (1812)
vote share
Mazillius R.* Ind 0 0.0
2001: Ind Turnout 0.0 0.0
Osborne (1889)
vote share
Hancock C.* Ind 408 37.4
Nightingale P. Con 398 36.4
Pascoe L. Ms. Lab 250 22.9
Spensley J. Soc Lab 36 3.3
2001: Ind Turnout 57.8 0.9
Pan (2083)
vote share
Lumley G. Lab 483 46.4
Page C. Con 337 32.4
Moth I. LD 221 21.2
2001: Lab Turnout 50.0 14.0
Parkhurst (2223)
vote share
Price G.* LD 522 43.2
Berrisford R. Con 438 36.3
Falla S. Lab 248 20.5
2001: LD Turnout 54.3 7.0
Ryde North East (2598)
vote share
Adams J.* LD 552 45.0
Woodward D. Con 470 38.3
White E. Lab 204 16.6
2001: LD Turnout 47.2 6.7
Ryde North West (2374)
vote share
Taylor A.* Con 804 55.4
Nobbs M. LD 375 25.9
Gordon A. Ind 271 18.7
2001: Con Turnout 61.1 29.6
Ryde South East (2453)
vote share
Chapman B.* LD 866 65.2
Axford A. Con 463 34.8
2001: LD Turnout 54.2 30.3
Ryde South West (2301)
vote share
Stephens I.* Ind 669 49.0
Newman P. Con 358 26.2
Wilde C. Ms. Lab 338 24.8
2001: LD Turnout 59.3 22.8
Sandown North (2430)
vote share
Humby H. Ms.* Ind 986 74.4
Martin D. Ms. Con 339 25.6
2001: Ind Turnout 54.5 48.8
Sandown South (2676)
vote share
Ward I. Con 600 41.9
Blezzard R. LD 475 33.2
Teasdale R. Ind 357 24.9
2001: LD Turnout 53.5 8.7
Seaview & Nettlestone (2856)
vote share
Tuson D. Ms. Con 949 52.9
Barry R.* LD 844 47.1
2001: LD Turnout 62.8 5.9
Shalfleet & Yarmouth (2193)
vote share
Burt W. Con 933 65.2
Garlick P. LD 497 34.8
2001: Ind Turnout 65.2 30.5
Shanklin Central (2436)
vote share
Pugh D. Con 906 60.8
Coleman P. Lab 298 20.0
Fleming J.* Ind 285 19.1
2001: Ind Turnout 61.1 40.8
Shanklin North (2260)
vote share
Williams D.* Con 727 49.6
Hollands A. Lab 434 29.6
Beevers D. Ms. LD 304 20.8
2001: Con Turnout 64.8 20.0
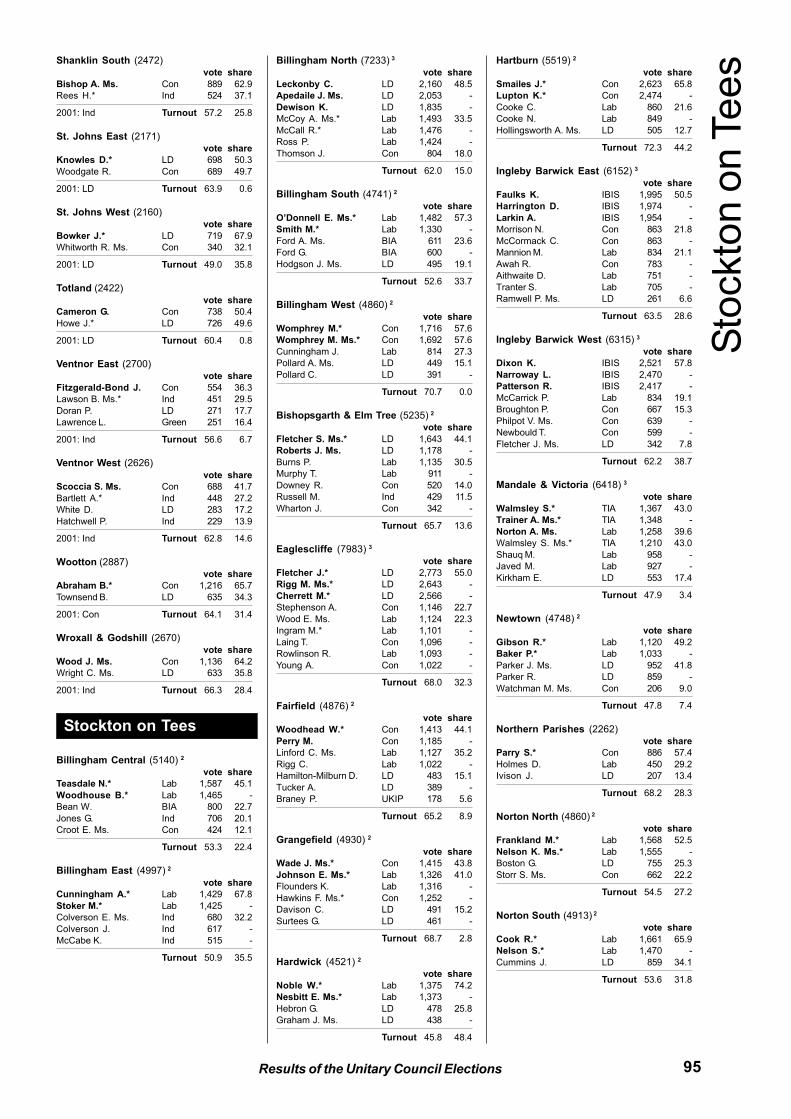
95Results of the Unitary Council Elections
Shanklin South (2472)
vote share
Bishop A. Ms. Con 889 62.9
Rees H.* Ind 524 37.1
2001: Ind Turnout 57.2 25.8
St. Johns East (2171)
vote share
Knowles D.* LD 698 50.3
Woodgate R. Con 689 49.7
2001: LD Turnout 63.9 0.6
St. Johns West (2160)
vote share
Bowker J.* LD 719 67.9
Whitworth R. Ms. Con 340 32.1
2001: LD Turnout 49.0 35.8
Totland (2422)
vote share
Cameron G. Con 738 50.4
Howe J.* LD 726 49.6
2001: LD Turnout 60.4 0.8
Ventnor East (2700)
vote share
Fitzgerald-Bond J. Con 554 36.3
Lawson B. Ms.* Ind 451 29.5
Doran P. LD 271 17.7
Lawrence L. Green 251 16.4
2001: Ind Turnout 56.6 6.7
Ventnor West (2626)
vote share
Scoccia S. Ms. Con 688 41.7
Bartlett A.* Ind 448 27.2
White D. LD 283 17.2
Hatchwell P. Ind 229 13.9
2001: Ind Turnout 62.8 14.6
Wootton (2887)
vote share
Abraham B.* Con 1,216 65.7
Townsend B. LD 635 34.3
2001: Con Turnout 64.1 31.4
Wroxall & Godshill (2670)
vote share
Wood J. Ms. Con 1,136 64.2
Wright C. Ms. LD 633 35.8
2001: Ind Turnout 66.3 28.4
Billingham Central (5140) 2
vote share
Teasdale N.* Lab 1,587 45.1
Woodhouse B.* Lab 1,465 -
Bean W. BIA 800 22.7
Jones G. Ind 706 20.1
Croot E. Ms. Con 424 12.1
Turnout 53.3 22.4
Billingham East (4997) 2
vote share
Cunningham A.* Lab 1,429 67.8
Stoker M.* Lab 1,425 -
Colverson E. Ms. Ind 680 32.2
Colverson J. Ind 617 -
McCabe K. Ind 515 -
Turnout 50.9 35.5
Billingham North (7233) 3
vote share
Leckonby C. LD 2,160 48.5
Apedaile J. Ms. LD 2,053 -
Dewison K. LD 1,835 -
McCoy A. Ms.* Lab 1,493 33.5
McCall R.* Lab 1,476 -
Ross P. Lab 1,424 -
Thomson J. Con 804 18.0
Turnout 62.0 15.0
Billingham South (4741) 2
vote share
O’Donnell E. Ms.* Lab 1,482 57.3
Smith M.* Lab 1,330 -
Ford A. Ms. BIA 611 23.6
Ford G. BIA 600 -
Hodgson J. Ms. LD 495 19.1
Turnout 52.6 33.7
Billingham West (4860) 2
vote share
Womphrey M.* Con 1,716 57.6
Womphrey M. Ms.* Con 1,692 57.6
Cunningham J. Lab 814 27.3
Pollard A. Ms. LD 449 15.1
Pollard C. LD 391 -
Turnout 70.7 0.0
Bishopsgarth & Elm Tree (5235) 2
vote share
Fletcher S. Ms.* LD 1,643 44.1
Roberts J. Ms. LD 1,178 -
Burns P. Lab 1,135 30.5
Murphy T. Lab 911 -
Downey R. Con 520 14.0
Russell M. Ind 429 11.5
Wharton J. Con 342 -
Turnout 65.7 13.6
Eaglescliffe (7983) 3
vote share
Fletcher J.* LD 2,773 55.0
Rigg M. Ms.* LD 2,643 -
Cherrett M.* LD 2,566 -
Stephenson A. Con 1,146 22.7
Wood E. Ms. Lab 1,124 22.3
Ingram M.* Lab 1,101 -
Laing T. Con 1,096 -
Rowlinson R. Lab 1,093 -
Young A. Con 1,022 -
Turnout 68.0 32.3
Fairfield (4876) 2
vote share
Woodhead W.* Con 1,413 44.1
Perry M. Con 1,185 -
Linford C. Ms. Lab 1,127 35.2
Rigg C. Lab 1,022 -
Hamilton-Milburn D. LD 483 15.1
Tucker A. LD 389 -
Braney P. UKIP 178 5.6
Turnout 65.2 8.9
Grangefield (4930) 2
vote share
Wade J. Ms.* Con 1,415 43.8
Johnson E. Ms.* Lab 1,326 41.0
Flounders K. Lab 1,316 -
Hawkins F. Ms.* Con 1,252 -
Davison C. LD 491 15.2
Surtees G. LD 461 -
Turnout 68.7 2.8
Hardwick (4521) 2
vote share
Noble W.* Lab 1,375 74.2
Nesbitt E. Ms.* Lab 1,373 -
Hebron G. LD 478 25.8
Graham J. Ms. LD 438 -
Turnout 45.8 48.4
Hartburn (5519) 2
vote share
Smailes J.* Con 2,623 65.8
Lupton K.* Con 2,474 -
Cooke C. Lab 860 21.6
Cooke N. Lab 849 -
Hollingsworth A. Ms. LD 505 12.7
Turnout 72.3 44.2
Ingleby Barwick East (6152) 3
vote share
Faulks K. IBIS 1,995 50.5
Harrington D. IBIS 1,974 -
Larkin A. IBIS 1,954 -
Morrison N. Con 863 21.8
McCormack C. Con 863 -
Mannion M. Lab 834 21.1
Awah R. Con 783 -
Aithwaite D. Lab 751 -
Tranter S. Lab 705 -
Ramwell P. Ms. LD 261 6.6
Turnout 63.5 28.6
Ingleby Barwick West (6315) 3
vote share
Dixon K. IBIS 2,521 57.8
Narroway L. IBIS 2,470 -
Patterson R. IBIS 2,417 -
McCarrick P. Lab 834 19.1
Broughton P. Con 667 15.3
Philpot V. Ms. Con 639 -
Newbould T. Con 599 -
Fletcher J. Ms. LD 342 7.8
Turnout 62.2 38.7
Mandale & Victoria (6418) 3
vote share
Walmsley S.* TIA 1,367 43.0
Trainer A. Ms.* TIA 1,348 -
Norton A. Ms. Lab 1,258 39.6
Walmsley S. Ms.* TIA 1,210 43.0
Shauq M. Lab 958 -
Javed M. Lab 927 -
Kirkham E. LD 553 17.4
Turnout 47.9 3.4
Newtown (4748) 2
vote share
Gibson R.* Lab 1,120 49.2
Baker P.* Lab 1,033 -
Parker J. Ms. LD 952 41.8
Parker R. LD 859 -
Watchman M. Ms. Con 206 9.0
Turnout 47.8 7.4
Northern Parishes (2262)
vote share
Parry S.* Con 886 57.4
Holmes D. Lab 450 29.2
Ivison J. LD 207 13.4
Turnout 68.2 28.3
Norton North (4860) 2
vote share
Frankland M.* Lab 1,568 52.5
Nelson K. Ms.* Lab 1,555 -
Boston G. LD 755 25.3
Storr S. Ms. Con 662 22.2
Turnout 54.5 27.2
Norton South (4913) 2
vote share
Cook R.* Lab 1,661 65.9
Nelson S.* Lab 1,470 -
Cummins J. LD 859 34.1
Turnout 53.6 31.8
Stockton on TeesS
tockto
n o
n T
ees
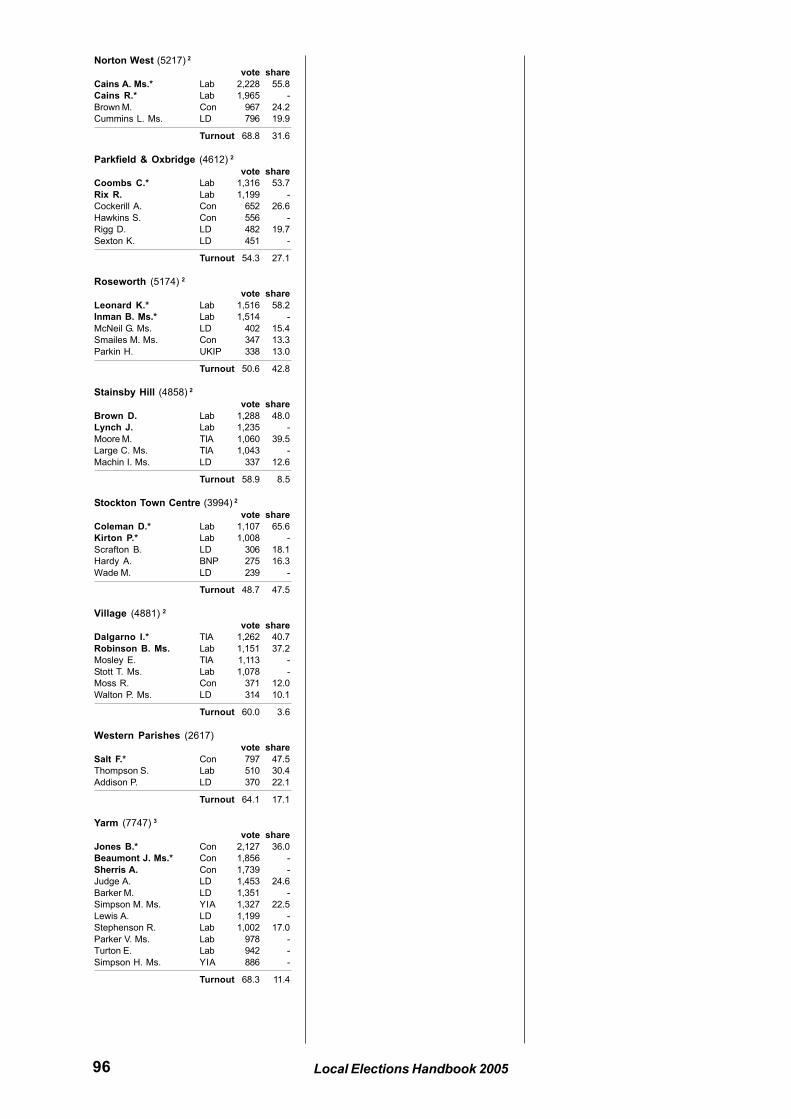
96 Local Elections Handbook 2005
Norton West (5217) 2
vote share
Cains A. Ms.* Lab 2,228 55.8
Cains R.* Lab 1,965 -
Brown M. Con 967 24.2
Cummins L. Ms. LD 796 19.9
Turnout 68.8 31.6
Parkfield & Oxbridge (4612) 2
vote share
Coombs C.* Lab 1,316 53.7
Rix R. Lab 1,199 -
Cockerill A. Con 652 26.6
Hawkins S. Con 556 -
Rigg D. LD 482 19.7
Sexton K. LD 451 -
Turnout 54.3 27.1
Roseworth (5174) 2
vote share
Leonard K.* Lab 1,516 58.2
Inman B. Ms.* Lab 1,514 -
McNeil G. Ms. LD 402 15.4
Smailes M. Ms. Con 347 13.3
Parkin H. UKIP 338 13.0
Turnout 50.6 42.8
Stainsby Hill (4858) 2
vote share
Brown D. Lab 1,288 48.0
Lynch J. Lab 1,235 -
Moore M. TIA 1,060 39.5
Large C. Ms. TIA 1,043 -
Machin I. Ms. LD 337 12.6
Turnout 58.9 8.5
Stockton Town Centre (3994) 2
vote share
Coleman D.* Lab 1,107 65.6
Kirton P.* Lab 1,008 -
Scrafton B. LD 306 18.1
Hardy A. BNP 275 16.3
Wade M. LD 239 -
Turnout 48.7 47.5
Village (4881) 2
vote share
Dalgarno I.* TIA 1,262 40.7
Robinson B. Ms. Lab 1,151 37.2
Mosley E. TIA 1,113 -
Stott T. Ms. Lab 1,078 -
Moss R. Con 371 12.0
Walton P. Ms. LD 314 10.1
Turnout 60.0 3.6
Western Parishes (2617)
vote share
Salt F.* Con 797 47.5
Thompson S. Lab 510 30.4
Addison P. LD 370 22.1
Turnout 64.1 17.1
Yarm (7747) 3
vote share
Jones B.* Con 2,127 36.0
Beaumont J. Ms.* Con 1,856 -
Sherris A. Con 1,739 -
Judge A. LD 1,453 24.6
Barker M. LD 1,351 -
Simpson M. Ms. YIA 1,327 22.5
Lewis A. LD 1,199 -
Stephenson R. Lab 1,002 17.0
Parker V. Ms. Lab 978 -
Turton E. Lab 942 -
Simpson H. Ms. YIA 886 -
Turnout 68.3 11.4
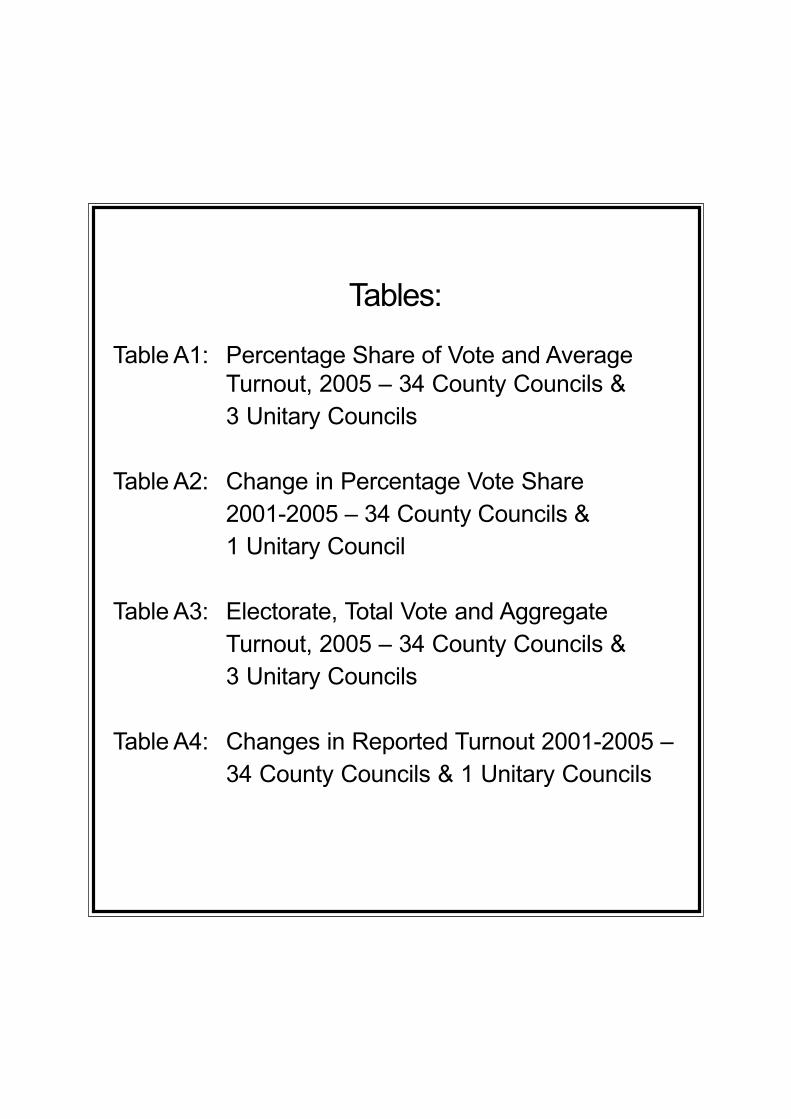
Tables:
Table A1: Percentage Share of Vote and Average
Turnout, 2005 – 34 County Councils &
3 Unitary Councils
Table A2: Change in Percentage Vote Share
2001-2005 – 34 County Councils &
1 Unitary Council
Table A3: Electorate, Total Vote and Aggregate
Turnout, 2005 – 34 County Councils &
3 Unitary Councils
Table A4: Changes in Reported Turnout 2001-2005 –
34 County Councils & 1 Unitary Councils

2
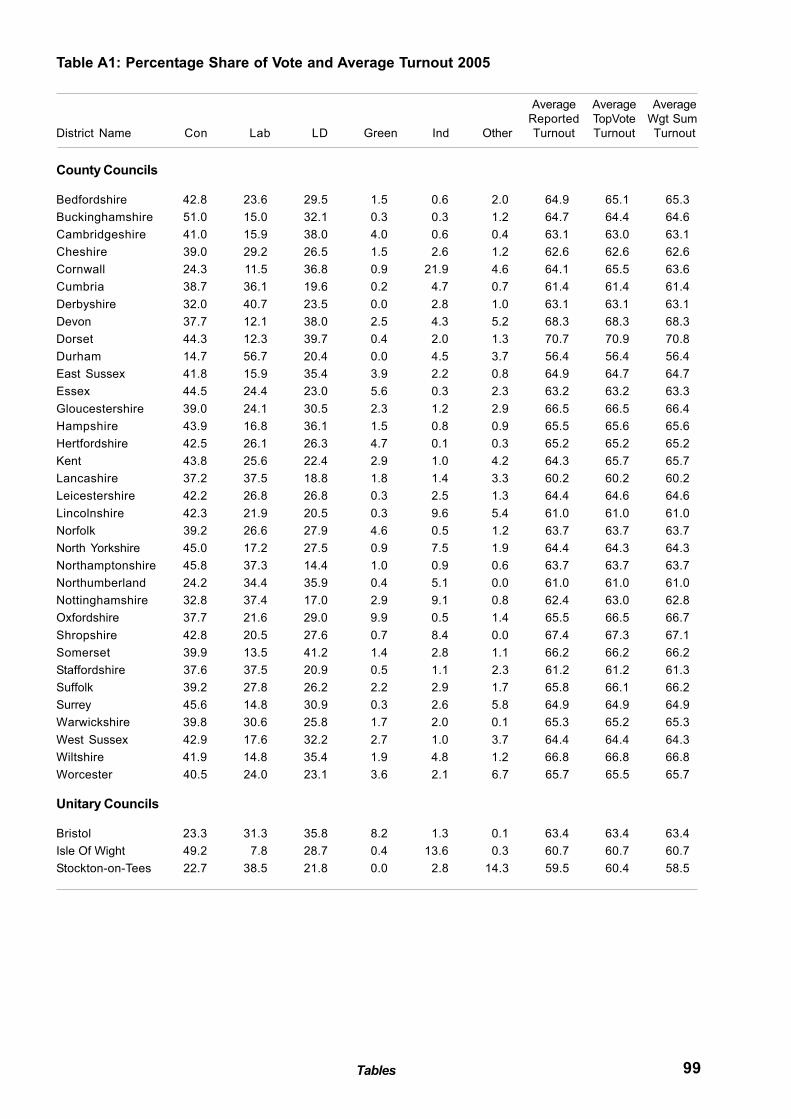
99Tables
Table A1: Percentage Share of Vote and Average Turnout 2005
Average Average Average
Reported TopVote Wgt Sum
District Name Con Lab LD Green Ind Other Turnout Turnout Turnout
County Councils
Bedfordshire 42.8 23.6 29.5 1.5 0.6 2.0 64.9 65.1 65.3
Buckinghamshire 51.0 15.0 32.1 0.3 0.3 1.2 64.7 64.4 64.6
Cambridgeshire 41.0 15.9 38.0 4.0 0.6 0.4 63.1 63.0 63.1
Cheshire 39.0 29.2 26.5 1.5 2.6 1.2 62.6 62.6 62.6
Cornwall 24.3 11.5 36.8 0.9 21.9 4.6 64.1 65.5 63.6
Cumbria 38.7 36.1 19.6 0.2 4.7 0.7 61.4 61.4 61.4
Derbyshire 32.0 40.7 23.5 0.0 2.8 1.0 63.1 63.1 63.1
Devon 37.7 12.1 38.0 2.5 4.3 5.2 68.3 68.3 68.3
Dorset 44.3 12.3 39.7 0.4 2.0 1.3 70.7 70.9 70.8
Durham 14.7 56.7 20.4 0.0 4.5 3.7 56.4 56.4 56.4
East Sussex 41.8 15.9 35.4 3.9 2.2 0.8 64.9 64.7 64.7
Essex 44.5 24.4 23.0 5.6 0.3 2.3 63.2 63.2 63.3
Gloucestershire 39.0 24.1 30.5 2.3 1.2 2.9 66.5 66.5 66.4
Hampshire 43.9 16.8 36.1 1.5 0.8 0.9 65.5 65.6 65.6
Hertfordshire 42.5 26.1 26.3 4.7 0.1 0.3 65.2 65.2 65.2
Kent 43.8 25.6 22.4 2.9 1.0 4.2 64.3 65.7 65.7
Lancashire 37.2 37.5 18.8 1.8 1.4 3.3 60.2 60.2 60.2
Leicestershire 42.2 26.8 26.8 0.3 2.5 1.3 64.4 64.6 64.6
Lincolnshire 42.3 21.9 20.5 0.3 9.6 5.4 61.0 61.0 61.0
Norfolk 39.2 26.6 27.9 4.6 0.5 1.2 63.7 63.7 63.7
North Yorkshire 45.0 17.2 27.5 0.9 7.5 1.9 64.4 64.3 64.3
Northamptonshire 45.8 37.3 14.4 1.0 0.9 0.6 63.7 63.7 63.7
Northumberland 24.2 34.4 35.9 0.4 5.1 0.0 61.0 61.0 61.0
Nottinghamshire 32.8 37.4 17.0 2.9 9.1 0.8 62.4 63.0 62.8
Oxfordshire 37.7 21.6 29.0 9.9 0.5 1.4 65.5 66.5 66.7
Shropshire 42.8 20.5 27.6 0.7 8.4 0.0 67.4 67.3 67.1
Somerset 39.9 13.5 41.2 1.4 2.8 1.1 66.2 66.2 66.2
Staffordshire 37.6 37.5 20.9 0.5 1.1 2.3 61.2 61.2 61.3
Suffolk 39.2 27.8 26.2 2.2 2.9 1.7 65.8 66.1 66.2
Surrey 45.6 14.8 30.9 0.3 2.6 5.8 64.9 64.9 64.9
Warwickshire 39.8 30.6 25.8 1.7 2.0 0.1 65.3 65.2 65.3
West Sussex 42.9 17.6 32.2 2.7 1.0 3.7 64.4 64.4 64.3
Wiltshire 41.9 14.8 35.4 1.9 4.8 1.2 66.8 66.8 66.8
Worcester 40.5 24.0 23.1 3.6 2.1 6.7 65.7 65.5 65.7
Unitary Councils
Bristol 23.3 31.3 35.8 8.2 1.3 0.1 63.4 63.4 63.4
Isle Of Wight 49.2 7.8 28.7 0.4 13.6 0.3 60.7 60.7 60.7
Stockton-on-Tees 22.7 38.5 21.8 0.0 2.8 14.3 59.5 60.4 58.5
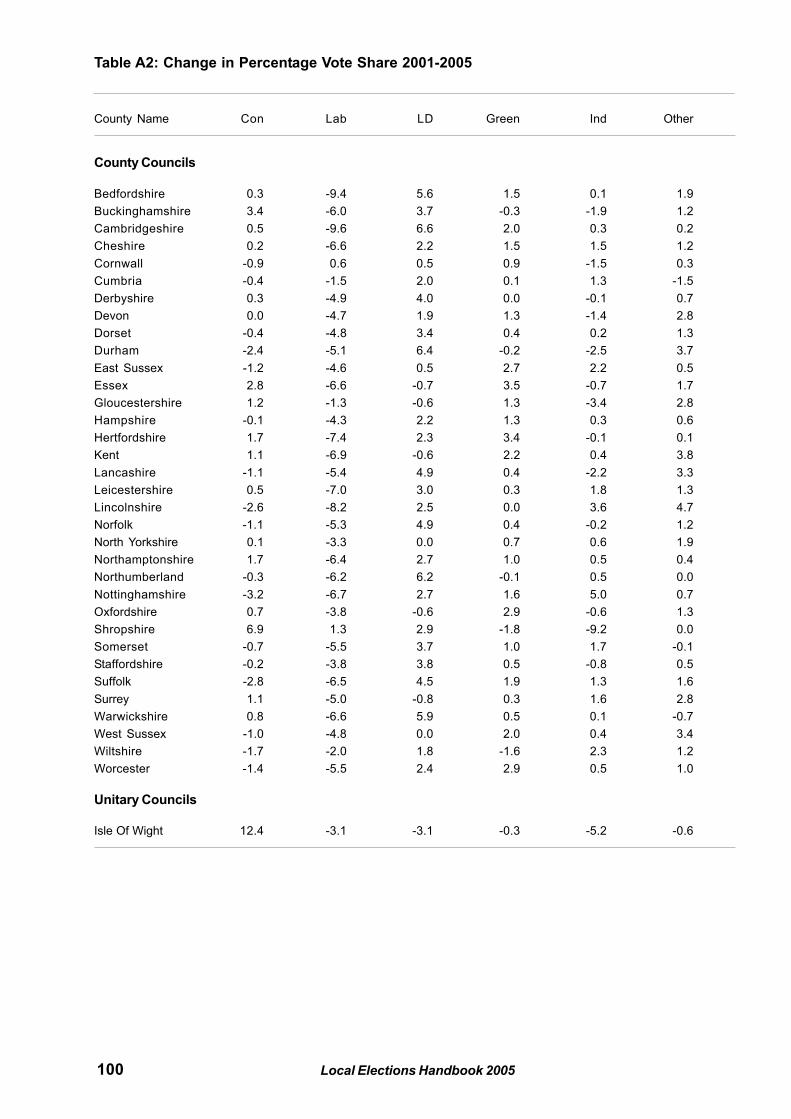
100 Local Elections Handbook 2005
Table A2: Change in Percentage Vote Share 2001-2005
County Name Con Lab LD Green Ind Other
County Councils
Bedfordshire 0.3 -9.4 5.6 1.5 0.1 1.9
Buckinghamshire 3.4 -6.0 3.7 -0.3 -1.9 1.2
Cambridgeshire 0.5 -9.6 6.6 2.0 0.3 0.2
Cheshire 0.2 -6.6 2.2 1.5 1.5 1.2
Cornwall -0.9 0.6 0.5 0.9 -1.5 0.3
Cumbria -0.4 -1.5 2.0 0.1 1.3 -1.5
Derbyshire 0.3 -4.9 4.0 0.0 -0.1 0.7
Devon 0.0 -4.7 1.9 1.3 -1.4 2.8
Dorset -0.4 -4.8 3.4 0.4 0.2 1.3
Durham -2.4 -5.1 6.4 -0.2 -2.5 3.7
East Sussex -1.2 -4.6 0.5 2.7 2.2 0.5
Essex 2.8 -6.6 -0.7 3.5 -0.7 1.7
Gloucestershire 1.2 -1.3 -0.6 1.3 -3.4 2.8
Hampshire -0.1 -4.3 2.2 1.3 0.3 0.6
Hertfordshire 1.7 -7.4 2.3 3.4 -0.1 0.1
Kent 1.1 -6.9 -0.6 2.2 0.4 3.8
Lancashire -1.1 -5.4 4.9 0.4 -2.2 3.3
Leicestershire 0.5 -7.0 3.0 0.3 1.8 1.3
Lincolnshire -2.6 -8.2 2.5 0.0 3.6 4.7
Norfolk -1.1 -5.3 4.9 0.4 -0.2 1.2
North Yorkshire 0.1 -3.3 0.0 0.7 0.6 1.9
Northamptonshire 1.7 -6.4 2.7 1.0 0.5 0.4
Northumberland -0.3 -6.2 6.2 -0.1 0.5 0.0
Nottinghamshire -3.2 -6.7 2.7 1.6 5.0 0.7
Oxfordshire 0.7 -3.8 -0.6 2.9 -0.6 1.3
Shropshire 6.9 1.3 2.9 -1.8 -9.2 0.0
Somerset -0.7 -5.5 3.7 1.0 1.7 -0.1
Staffordshire -0.2 -3.8 3.8 0.5 -0.8 0.5
Suffolk -2.8 -6.5 4.5 1.9 1.3 1.6
Surrey 1.1 -5.0 -0.8 0.3 1.6 2.8
Warwickshire 0.8 -6.6 5.9 0.5 0.1 -0.7
West Sussex -1.0 -4.8 0.0 2.0 0.4 3.4
Wiltshire -1.7 -2.0 1.8 -1.6 2.3 1.2
Worcester -1.4 -5.5 2.4 2.9 0.5 1.0
Unitary Councils
Isle Of Wight 12.4 -3.1 -3.1 -0.3 -5.2 -0.6
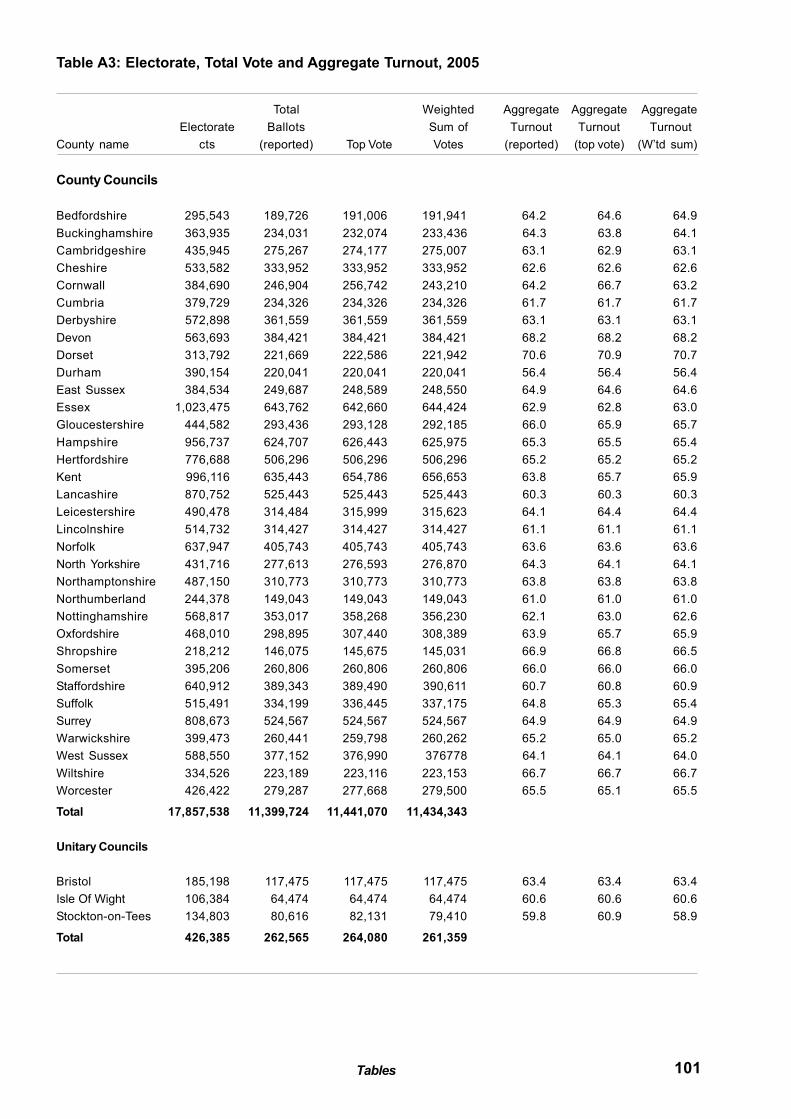
101Tables
Table A3: Electorate, Total Vote and Aggregate Turnout, 2005
Total Weighted Aggregate Aggregate Aggregate
Electorate Ballots Sum of Turnout Turnout Turnout
County name cts (reported) Top Vote Votes (reported) (top vote) (W’td sum)
County Councils
Bedfordshire 295,543 189,726 191,006 191,941 64.2 64.6 64.9
Buckinghamshire 363,935 234,031 232,074 233,436 64.3 63.8 64.1
Cambridgeshire 435,945 275,267 274,177 275,007 63.1 62.9 63.1
Cheshire 533,582 333,952 333,952 333,952 62.6 62.6 62.6
Cornwall 384,690 246,904 256,742 243,210 64.2 66.7 63.2
Cumbria 379,729 234,326 234,326 234,326 61.7 61.7 61.7
Derbyshire 572,898 361,559 361,559 361,559 63.1 63.1 63.1
Devon 563,693 384,421 384,421 384,421 68.2 68.2 68.2
Dorset 313,792 221,669 222,586 221,942 70.6 70.9 70.7
Durham 390,154 220,041 220,041 220,041 56.4 56.4 56.4
East Sussex 384,534 249,687 248,589 248,550 64.9 64.6 64.6
Essex 1,023,475 643,762 642,660 644,424 62.9 62.8 63.0
Gloucestershire 444,582 293,436 293,128 292,185 66.0 65.9 65.7
Hampshire 956,737 624,707 626,443 625,975 65.3 65.5 65.4
Hertfordshire 776,688 506,296 506,296 506,296 65.2 65.2 65.2
Kent 996,116 635,443 654,786 656,653 63.8 65.7 65.9
Lancashire 870,752 525,443 525,443 525,443 60.3 60.3 60.3
Leicestershire 490,478 314,484 315,999 315,623 64.1 64.4 64.4
Lincolnshire 514,732 314,427 314,427 314,427 61.1 61.1 61.1
Norfolk 637,947 405,743 405,743 405,743 63.6 63.6 63.6
North Yorkshire 431,716 277,613 276,593 276,870 64.3 64.1 64.1
Northamptonshire 487,150 310,773 310,773 310,773 63.8 63.8 63.8
Northumberland 244,378 149,043 149,043 149,043 61.0 61.0 61.0
Nottinghamshire 568,817 353,017 358,268 356,230 62.1 63.0 62.6
Oxfordshire 468,010 298,895 307,440 308,389 63.9 65.7 65.9
Shropshire 218,212 146,075 145,675 145,031 66.9 66.8 66.5
Somerset 395,206 260,806 260,806 260,806 66.0 66.0 66.0
Staffordshire 640,912 389,343 389,490 390,611 60.7 60.8 60.9
Suffolk 515,491 334,199 336,445 337,175 64.8 65.3 65.4
Surrey 808,673 524,567 524,567 524,567 64.9 64.9 64.9
Warwickshire 399,473 260,441 259,798 260,262 65.2 65.0 65.2
West Sussex 588,550 377,152 376,990 376778 64.1 64.1 64.0
Wiltshire 334,526 223,189 223,116 223,153 66.7 66.7 66.7
Worcester 426,422 279,287 277,668 279,500 65.5 65.1 65.5
Total 17,857,538 11,399,724 11,441,070 11,434,343
Unitary Councils
Bristol 185,198 117,475 117,475 117,475 63.4 63.4 63.4
Isle Of Wight 106,384 64,474 64,474 64,474 60.6 60.6 60.6
Stockton-on-Tees 134,803 80,616 82,131 79,410 59.8 60.9 58.9
Total 426,385 262,565 264,080 261,359
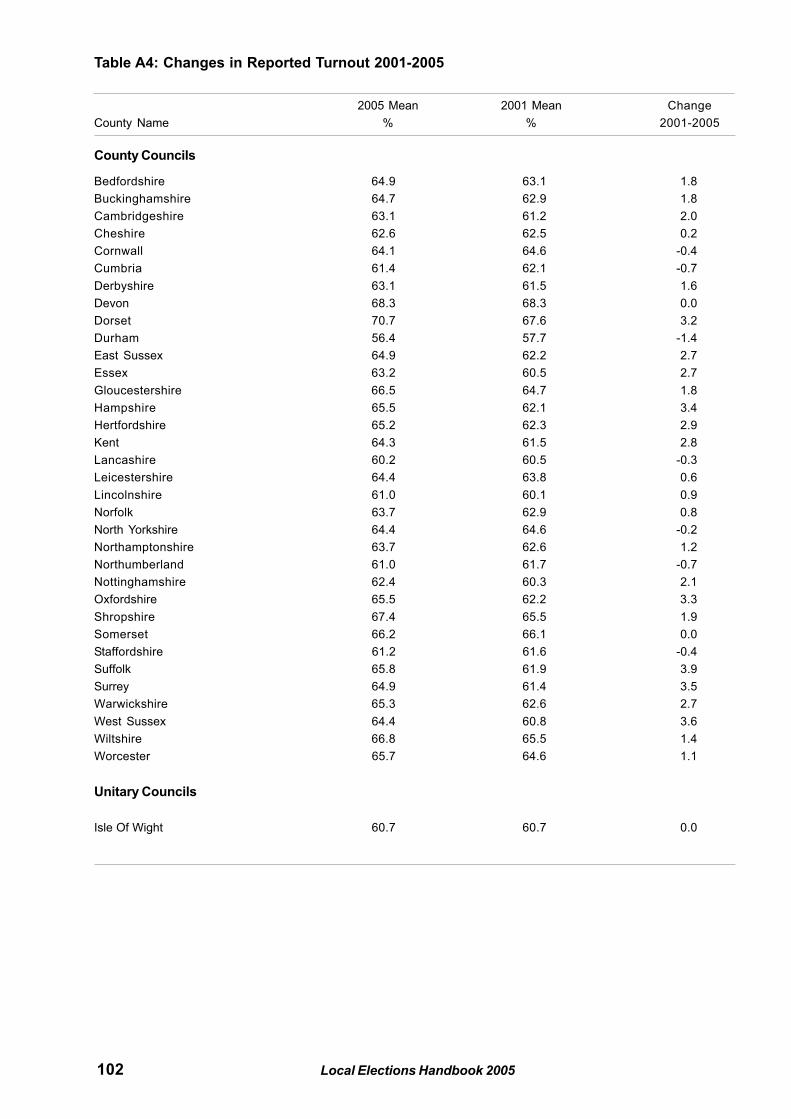
102 Local Elections Handbook 2005
Table A4: Changes in Reported Turnout 2001-2005
2005 Mean 2001 Mean Change
County Name % % 2001-2005
County Councils
Bedfordshire 64.9 63.1 1.8
Buckinghamshire 64.7 62.9 1.8
Cambridgeshire 63.1 61.2 2.0
Cheshire 62.6 62.5 0.2
Cornwall 64.1 64.6 -0.4
Cumbria 61.4 62.1 -0.7
Derbyshire 63.1 61.5 1.6
Devon 68.3 68.3 0.0
Dorset 70.7 67.6 3.2
Durham 56.4 57.7 -1.4
East Sussex 64.9 62.2 2.7
Essex 63.2 60.5 2.7
Gloucestershire 66.5 64.7 1.8
Hampshire 65.5 62.1 3.4
Hertfordshire 65.2 62.3 2.9
Kent 64.3 61.5 2.8
Lancashire 60.2 60.5 -0.3
Leicestershire 64.4 63.8 0.6
Lincolnshire 61.0 60.1 0.9
Norfolk 63.7 62.9 0.8
North Yorkshire 64.4 64.6 -0.2
Northamptonshire 63.7 62.6 1.2
Northumberland 61.0 61.7 -0.7
Nottinghamshire 62.4 60.3 2.1
Oxfordshire 65.5 62.2 3.3
Shropshire 67.4 65.5 1.9
Somerset 66.2 66.1 0.0
Staffordshire 61.2 61.6 -0.4
Suffolk 65.8 61.9 3.9
Surrey 64.9 61.4 3.5
Warwickshire 65.3 62.6 2.7
West Sussex 64.4 60.8 3.6
Wiltshire 66.8 65.5 1.4
Worcester 65.7 64.6 1.1
Unitary Councils
Isle Of Wight 60.7 60.7 0.0


