Embed Size (px)
Citation preview

Local Structure of CPO-27-Ni Metallorganic Framework uponDehydration and Coordination of NO
Francesca Bonino,† Sachin Chavan,† Jenny G. Vitillo,† Elena Groppo,† Giovanni Agostini,†
Carlo Lamberti,† Pascal D. C. Dietzel,‡ Carmelo Prestipino,§ and Silvia Bordiga*,†
Department of Inorganic, Physical and Materials Chemistry and NIS Centre of Excellence, UniVersita diTorino, Via P. Giuria 7, 10125 Torino, Italy, INSTM Centro di Riferimento, Department of HydrocarbonProcess Chemistry, SINTEF Materials and Chemistry, P.O. Box 124, Blindern, 031 Oslo, Norway, Centre
for Materials Science and Nanotechnology, Department of Chemistry, UniVersity of Oslo,Postboks 1033, Blindern N-0315, Oslo, Norway, and ESRF, 6 rue Jules Horowitz, BP220, F-38043,
Grenoble CEDEX, France
ReceiVed March 9, 2008. ReVised Manuscript ReceiVed April 20, 2008
Coordination polymer Ni2(dhtp)(H2O)2 ·8H2O is a 3D network that maintains crystallinity and porosityafter solvent removal. A mild thermal treatment in high vacuo at 393 K removes not only water physisorbedon the walls of the structure but also water directly coordinated to the Ni(II) sites. This procedure allowsus to obtain a MOF material with honeycomb structure able to strongly coordinate NO. In this contributionthe characterization of CPO-27-Ni in respect to structural (EXAFS compared to XRD), vibrational (IRand Raman) and electronic (UV, XANES, and luminescence) properties is described in the case of theas prepared sample, of the dehydrated sample and after NO interaction. NO is strongly bonded at theNi(II) sites, forming a 1:1 adduct; its presence causes large modification of the vibrational and electronicproperties of the material with respect to the dehydrated one. Quantitative data considering energeticaspects (microcalorimetric measurements) are also included. The ability of H2O molecules to slowlydisplace NO from the Ni(II) sites makes this material a promising candidate for NO delivery insidebiological tissues.
1. Introduction
Metallorganic frameworks (MOFs, also known as “coor-dination polymers”) are crystalline nanoporous materialscomprised of metal containing clusters connected three-dimensionally by polyfunctional organic ligands. The ligandsact as spacers, creating an open porous three-dimensionalstructure, with very high pore volume and surface area. Thishybrid architecture opens the possibility to design andsynthesize a great variety of new porous materials, whichare in principle able to display novel functionalities that arepotentially exploitable for a number of applications incatalysis, ion-exchange, nonlinear optics, as sensors, in gasseparation, and/or storage.1–14 In this respect, possessing verylow density accompanied by large surface area and accessiblevolume, they have been considered as very promisingmaterials for dihydrogen molecular adsorption.15–18
Inspired by these promising properties, Dietzel et al.19
synthesized a three-dimensional honeycomb-like metal-lorganic framework with Ni(II) as the metal component:Ni2(dhtp)(H2O)2 · 8H2O (dhtp ) 2,5-dihydroxyterephthalicacid). Only few Ni-based coordination polymers with ahigh specific surface area have been investigated up tonow, which are isostructural to framework materials withzinc and cobalt as metal component.20–27 This new
* Corresponding author. E-mail: [email protected]. Tel.: 39 011 6707140 Fax: 30 011 670 7855.
† Università di Torino.‡ SINTEF Materials and Chemistry.§ ESRF.
(1) Ferey, G. Chem. Mater. 2001, 13, 3084–3098.(2) Stein, A. AdV. Mater. 2003, 15, 763–775.(3) Stein, A.; Melde, B. J.; Schroden, R. C. AdV. Mater. 2000, 12, 1403–
1419.(4) Yaghi, O. M.; Davis, C. E.; Li, G. M.; Li, H. L. J. Am. Chem. Soc.
1997, 119, 2861–2868.(5) Yaghi, O. M.; Jernigan, R.; Li, H. L.; Davis, C. E.; Groy, T. L. J. Chem.
Soc., Dalton Trans. 1997, 2383–2384.(6) James, S. L. Chem. Soc. ReV. 2003, 32, 276–288.(7) Janiak, C. Dalton Trans. 2003, 2781–2804.(8) Kitagawa, S.; Kitaura, R.; Noro, S. Angew. Chem., Int. Ed. 2004, 43,
2334–2375.
(9) Schuth, F.; Sing, K. S. W.; Weitkamp, J., Handbook of Porous Solids;Wiley-VCH: Weinheim, Germany, 2002; Vol. 2.
(10) Bordiga, S.; Lamberti, C.; Ricchiardi, G.; Regli, L.; Bonino, F.; Damin,A.; Lillerud, K. P.; Bjorgen, M.; Zecchina, A. Chem. Commun. 2004,2300–2301.
(11) Bordiga, S.; Vitillo, J. G.; Ricchiardi, G.; Regli, L.; Cocina, D.;Zecchina, A.; Arstad, B.; Bjorgen, M.; Hafizovic, J.; Lillerud, K. P.J. Phys. Chem. B 2005, 109, 18237–18242.
(12) Szeto, K. C.; Lillerud, K. P.; Tilset, M.; Bjorgen, M.; Prestipino, C.;Zecchina, A.; Lamberti, C.; Bordiga, S. J. Phys. Chem. B 2006, 110,21509–21520.
(13) Szeto, K. C.; Prestipino, C.; Lamberti, C.; Zecchina, A.; Bordiga, S.;Bjorgen, M.; Tilset, M.; Lillerud, K. P. Chem. Mater. 2007, 19, 211–220.
(14) Hafizovic, J.; Bjorgen, M.; Olsbye, U.; Dietzel, P. D. C.; Bordiga, S.;Prestipino, C.; Lamberti, C.; Lillerud, K. P. J. Am. Chem. Soc. 2007,129, 3612–3620.
(15) Latroche, M.; Surble, S.; Serre, C.; Mellot-Draznieks, C.; Llewellyn,P. L.; Lee, J. H.; Chang, J. S.; Jhung, S. H.; Ferey, G. Angew. Chem.,Int. Ed. 2006, 45, 8227–8231.
(16) Wong-Foy, A. G.; Matzger, A. J.; Yaghi, O. M. J. Am. Chem. Soc.2006, 128, 3494–3495.
(17) Dinca, M.; Dailly, A.; Liu, Y.; Brown, C. M.; Neumann, D. A.; Long,J. R. J. Am. Chem. Soc. 2006, 128, 16876–16883.
(18) Chen, B. L.; Ockwig, N. W.; Millward, A. R.; Contreras, D. S.; Yaghi,O. M. Angew. Chem., Int. Ed. 2005, 44, 4745–4749.
(19) Dietzel, P. D. C.; Panella, B.; Hirscher, M.; Blom, R.; Fjellvag, H.Chem. Commun. 2006, 959–961.
4957Chem. Mater. 2008, 20, 4957–4968
10.1021/cm800686k CCC: $40.75 2008 American Chemical SocietyPublished on Web 07/02/2008

material, called CPO-27-Ni, contains one-dimensionalchannels, which are filled with water that can be removedby a mild thermal treatment. Upon dehydration thecrystalline structure is preserved and a material with ahigh surface area containing unsaturated metal sitesorganized in helicoidal chains is obtained. Figure 1 reportsdifferent magnification grades of dehydrated CPO-27-Nistructure: (a) reports the coordination sphere of Ni(II);(b) illustrates the inorganic nodes involving Ni(II); (c)shows a bidimensional view of the honeycomb structure(unit cell). All the oxygen atoms of the ligands areinvolved in the coordination of nickel atoms. This accountsfor five of the oxygen atoms coordinating each nickelatom, whereas the sixth coordinative bond is normallyoccupied by a water molecule that points toward thecavity. Because of the helical arrangement of the NiO5
units, the nearest Ni atoms are exposed in differentchannels: for this reason the smallest distance betweennearest Ni ions exposed in the same channel is of 6.8 Å.All the Ni(II) ions are identical with respect to the firstcoordination sphere, showing five oxygens that slightlydiffer one from the other (Figure 1a). In particular, thereare two Ocs (oxygens from two different carboxylate units,each of them shared with another Ni ion), one Ocu (oxygenfrom one of the previous carboxylate units, not sharedwith another Ni ion), and two OOHs (oxygens from thedeprotonated OH group of two other linkers, each of themshared with another Ni ion). It has been shown from abinitio calculations that among all the oxygens, Ocu is themost negative, followed by OOHs, while the other twooxygens (Ocs) are much less electronegative.28 Incomingmolecules would experience a positive electrostatic po-tential along the CPO-27-Ni channels with the exception
of the OOHs and the Ocu vicinities (see Figure S1 in theSupporting Information).
At the moment, this material has been tested in respect ofhydrogen storage capacity finding a result not exciting interm of amount of hydrogen stored (1.8 wt% at 77 K and45 bar)19 as compared with other microporous materialshaving a higher surface area,15–17 but very interesting interms of interaction energy (13.5 kJ/mol).28 This value isvery close to the value of 15.1 kJ/mol predicted by Bhatiaand Myers,29?xpp foot;3829ref29;10?>,30 to be the optimumadsorption enthalpy for ambient temperature storage ofhydrogen and delivery between 30 and 1.5 bar pressure. Thenice reactivity toward hydrogen encouraged us to explorethe adsorption properties of this material toward othermolecules and pushed the research to better understand theproperties of this material in both hydrated and dehydratedforms. It is known from XRD data that upon dehydration,the first coordination sphere of Ni(II) changes. Likely,significant modifications of geometric parameters related tothe Ni(II) sites imply some fundamental rearrangements thatmerit a specific investigation through the combined use ofdifferent spectroscopies. The present work is devoted to thedescription of the effect of dehydration on CPO-27-Ni interms of structural (EXAFS to be compared with XRDresults), vibrational (IR and Raman), and electronic (UV-vis,fluorescence and XANES) modifications and its responseupon nitric oxide (NO) interaction. High NO adsorption isof great interest for environmental applications in gasseparation and in NOx traps for lean burn engines. NO isalso an extremely important molecule in biology, and NO-storing solids have potential applications as antithrombosismaterials.31–33 Moreover, NO plays also an important rolein the cutaneous response to UV radiation and in cutaneous
(20) Rosi, N. L.; Kim, J.; Eddaoudi, M.; Chen, B. L.; O’Keeffe, M.; Yaghi,O. M. J. Am. Chem. Soc. 2005, 127, 1504–1518.
(21) Dietzel, P. D. C.; Morita, Y.; Blom, R.; Fjellvag, H. Angew. Chem.,Int. Ed. 2005, 44, 6354–6358.
(22) Dietzel, P. D. C.; Johnsen, R. E.; Blom, R.; Fjellvåg, H. Chem.sEur.J. 2008, 14, 2389–2397.
(23) Kaye, S. S.; Long, J. R. J. Am. Chem. Soc. 2005, 127, 6506–6507.(24) Lee, E. Y.; Suh, M. P. Angew. Chem., Int. Ed. 2004, 43, 2798–2801.(25) Zhao, X. B.; Xiao, B.; Fletcher, A. J.; Thomas, K. M.; Bradshaw, D.;
Rosseinsky, M. J. Science 2004, 306, 1012–1015.(26) Dinca, M.; Long, J. R. J. Am. Chem. Soc. 2007, 129, 11172–11176.(27) Forster, P. M.; Eckert, J.; Heiken, B. D.; Parise, J. B.; Yoon, J. W.;
Jhung, S. H.; Chang, J. S.; Cheetham, A. K. J. Am. Chem. Soc. 2006,128, 16846–16850.
(28) Vitillo, J. G.; Regli, L.; Chavan, S.; Ricchiardi, G.; Spoto, G.; Dietzel,P. D. C.; Bordiga, S.; Zecchina, A J. Am. Chem. Soc. 2008, 130, DOI:10.1021/ja8007159.
(29) Bhatia, S. K.; Myers, A. L. Langmuir 2006, 22, 1688–1700.(30) Gigras, A.; Bhatia, S. K.; Kumar, A. V. A.; Myers, A. L. Carbon
2007, 45, 1043–1050.(31) Wheatley, P. S.; Butler, A. R.; Crane, M. S.; Fox, S.; Xiao, B.; Rossi,
A. G.; Megson, I. L.; Morris, R. E. J. Am. Chem. Soc. 2006, 128,502–509.
(32) Xiao, B.; Wheatley, P. S.; Zhao, X. B.; Fletcher, A. J.; Fox, S.; Rossi,A. G.; Megson, I. L.; Bordiga, S.; Regli, L.; Thomas, K. M.; Morris,R. E. J. Am. Chem. Soc. 2007, 129, 1203–1209.
(33) McKinlay, A. C.; Xiao, B.; Wragg, D. S.; Wheatley, P. S.; Megson,I. L.; Morris, R. E. J. Am. Chem. Soc. 2008, 130, accepted.
Figure 1. Pictorial representation at different magnification grades of a dehydrated CPO-27-Ni sample. (a) Coordination sphere of Ni(II) (see the text for Olabels). (b) Inorganic nodes involving Ni(II). (c) Bidimensional view of the honeycomb structure. The C atoms are reported in gray, H atoms in white, Oin red, and Ni in green.
4958 Chem. Mater., Vol. 20, No. 15, 2008 Bonino et al.

inflammation,34 and is associated with diminished antioxi-dative capacity in skin cells, hindered wound healing,unbalanced inflammatory reactions, and disturbed immuno-logical responses.35 Use of topically applied NO donorsmight represent an auspicious new therapeutic approach inthe field of dermatology. Consequently, the delivery ofexogenous NO is an attractive therapy for many ailments,but it requires the development of materials that can storesignificant quantities of NO and then deliver it to specificsites in the body.
2. Experimental Section
The CPO-27-Ni material was prepared from a nickel(II) acetateand 2,5-dihydroxyterephthalic acid reaction in a THF-watermixture to yield an ochre substance, Ni2(dhtp)(H2O)2 ·8 H2O,following a recipe reported in the literature.19 X-ray powder datashowed the high crystallinity of the sample for which a BET of1200 m2 g-1 was evaluated (Langmuir surface area of 1315 m2
g-1). The sample was not much sensible to moisture, maintainingits high crystallinity and porosity. To induce dehydration, CPO-27-Ni samples were pretreated under high vacuum at 393 K for1 h. All the spectroscopic measurements were performed incontrolled atmosphere by using ad hoc cells that allow thermaltreatment in high vacuo, dosages, and in situ spectra collection.NO gas was carefully purified by distillation in order to removeother undesired nitrogen oxides and it was dosed, by means of avacuum line, on the samples at RT.
Parallel measurements were performed on powdered samples incase of DR-UV-vis-NIR (Cary 5 spectrophotometer, equippedwith a reflectance sphere) and Fluorescence (Fluorolog-3, HORIBAJOBIN YVON spectrofluorometer, equipped with a 450W xenonlamp as an excitation source) spectroscopies.
FTIR spectra were collected in transmission mode on self-supporting wafer or on a thin film on a silicon wafer, incontrolled atmosphere. The spectra were recorded at 2 cm-1
resolution on a Bruker IFS 66 FTIR spectrometer, equipped witha MCT detector. Raman spectra were recorded by using aRenishaw Raman Microscope spectrometer. An Ar+ laseremitting at 514 nm was used, in which the output power waslimited to 1% (100% power ) 8.2 mW at the sample) in orderto avoid sample damage. The photons scattered by the samplewere dispersed by a 1800 lines/mm grating monochromator andsimultaneously collected on a CCD camera; the collection opticwas set at 20X objective. The spectra were obtained by collecting10 acquisitions (each of 10 s) on a self-supporting wafer put ina homemade cell with a suprasil quartz cuvette that allowedmeasurements in a controlled atmosphere.
Volumetric and calorimetric isotherms of NO adsorption at 303K were carried out in a microcalorimeter (Tian-Calvet type bySetaram, France) equipped with a calibrated glass gas-volumetricapparatus, which enabled us to simultaneously determine theadsorbed amounts and the heat evolved at increasing equilibriumpressure for small increments of the adsorptive.36 The absolutepressures were measured by means of a transducer gauge (Barocell,Edwards, 0-100 mbar).
X-ray absorption experiments on Ni K-edge were performed atthe BM2937 beamline at the European Synchrotron Radiation
Facility (ESRF). The monochromator was equipped with twoSi(111) flat crystals and harmonic rejection was achieved using Rh-coated mirrors after monochromator. The following experimentalgeometry was adopted: (1) I0 (10% efficiency); (2) MOF sample;(3) I1 (50% efficiency); (4) reference Ni foil; (5) I2 (80% efficiency).This setup allows a direct energy/angle calibration for each spectrumavoiding any problem related to little energy shifts due to smallthermal instability of the monochromator crystals.38 For the XANESpart, a sampling step of 0.3 eV has been applied, whereas for theEXAFS part, a sampling step of 0.025 Å-1 has been consideredwith an integration time of 3 s/point. Samples, in form of self-supported pellets of optimized thickness, have been located insidean ad hoc conceived cell developed at ESRF (by Prestipino,Steinman, and Pasternack) that allows, evacuation, gas dosage andtemperature variation in the 100–800 K range. This experimentalsetup guarantees the same degrees of freedom of the cell describedin ref 39.
The extraction of the �(k) function has been performed usingKlementev’s programs.40 For each sample, four consecutive EXAFSspectra have been collected and corresponding �(k) functions havebeen averaged before data analysis. EXAFS data analysis has beenperformed using the Arthemis software.41 Phases and amplitudeshave been calculated by FEFF6 code42 using as input the structuresolved by powder X-ray diffraction.19 Phases and amplitudes havebeen successfully checked with NiO model compound.43,44 For eachsample, the averaged k3 �(k) function were Fourier Transformedin the ∆k ) 2.00-18.00 Å-1 interval. The fits were performed inR-space in the ∆R ) 1.00-5.00 Å range (2∆k∆R/π > 40).
3. Effect of Dehydration on CPO-27-Ni: SpectroscopicStudies
One of the most crucial points for MOFs is their behaviorupon removal of the solvent. Only sufficiently robustcoordination polymer frameworks that remain stable andshow permanent porosity upon solvent removal can findapplication in gas storage and separation. For this reason, abig effort has been devoted to characterize these materialswith respect to their changes upon solvent removal. Most ofthe studies refer just to structural determination performedwith diffraction methods.45,46 In some cases,19,22 materialswith similar topology showed different behaviors, that mightbe fully understood only by coupling the structural data with
(34) Mowbray, M.; Tan, X. J.; Wheatley, P. S.; Morris, R. E.; Weller, R. B.J. InVest. Dermatol. 2008, 128, 352–360.
(35) Kroncke, K. D.; Suschek, C. V. J. InVest. Dermatol. 2008, 128, 258–260.
(36) Bolis, V.; Cerrato, G.; Magnacca, G.; Morterra, C. Thermochim. Acta1998, 312, 63–77.
(37) Filipponi, A.; Borowski, M.; Bowron, D. T.; Ansell, S.; Di Cicco, A.;De Panfilis, S.; Itie, J. P. ReV. Sci. Instrum. 2000, 71, 2422–2432.
(38) Lamberti, C.; Bordiga, S.; Bonino, F.; Prestipino, C.; Berlier, G.;Capello, L.; D’Acapito, F.; Xamena, F. X. L. I.; Zecchina, A. Phys.Chem. Chem. Phys. 2003, 5, 4502–4509.
(39) Lamberti, C.; Prestipino, C.; Bordiga, S.; Berlier, G.; Spoto, G.;Zecchina, A.; Laloni, A.; La Manna, F.; D’Anca, F.; Felici, R.;D’Acapito, F.; Roy, P. Nucl. Instrum. Methods Phys. Res., Sect. B2003, 200, 196–201.
(40) Klementev, K. V. Nucl. Instrum. Methods Phys. Res., Sect. A 2000,448, 299–301.
(41) Ravel, B.; Newville, M. J. Synchrotron Radiat. 2005, 12, 537–541.(42) Ankudinov, A. L.; Ravel, B.; Rehr, J. J.; Conradson, S. D. Phys. ReV.
B. 1998, 58, 7565–7576.(43) Lamberti, C.; Groppo, E.; Prestipino, C.; Casassa, S.; Ferrari, A. M.;
Pisani, C.; Giovanardi, C.; Luches, P.; Valeri, S.; Boscherini, F. Phys.ReV. Lett. 2003, 91, 046101.
(44) Groppo, E.; Prestipino, C.; Lamberti, C.; Luches, P.; Giovanardi, C.;Boscherini, F. J. Phys. Chem. B 2003, 107, 4597–4606.
(45) Serre, C.; Mellot-Draznieks, C.; Surble, S.; Audebrand, N.; Filinchuk,Y.; Ferey, G. Science 2007, 315, 1828–1831.
(46) Serre, C.; Millange, F.; Thouvenot, C.; Nogues, M.; Marsolier, G.;Louer, D.; Ferey, G. J. Am. Chem. Soc. 2002, 124, 13519–13526.
4959Chem. Mater., Vol. 20, No. 15, 2008Coordination of NO on CPO-27-Ni MOF

spectroscopic investigation as already reported in fewcases.10–14,47,48
3.1. Structural Modifications: EXAFS Data. The effectof water removal from CPO-27-Ni significantly affects theX-ray absorption spectra of the material, in both its XANES(vide infra section 3.2) and EXAFS region, as appreciable fromFigure 2. In particular, the k3-weighted �(k) signal (Figure 2a)exhibits a frequency decrease (period increase) in k-space,reflecting a shortening of the average Ni-O bond length,according to XRD refinements.19 The main beats at 5.6 and8.3 Å-1 are slightly perturbed by the dehydration process, thatreflects a slight framework rearrangement maintaining anordered higher shells signal. The shortening of the average firstNi-O shell is directly visible in R-space (Figure 2b), wherethe phase-uncorrected Fourier Transform (FT) of the k3�(k)shown in part (a) exhibits a first shell peak, due to the firstNi-O shells contributions (see Figure 3, red curves), that movesfrom 1.64 to 1.58 Å (∆R ≈ -0.06 Å). Even more evident isthe shortening of the second shell peak, from 2.68 to 2.56 Å(∆R ≈ -0.08 Å). This second shell signal is mainly dominatedby the first Ni-Ni distance (vide infra, Figure 3, blue curve)that, according to XRD refinement,19 moves from 2.979 downto 2.904 Å (∆R ) -0.075 Å). A similar behavior upondehydration has been observed for the HKUST-1 system, a Cu-MOF.48 The signal at higher R (3.0 Å < R < 5.5 Å) undergoesan important increase in intensity upon dehydration, reflecting
either an increase of order in the short-range scale around Nior a rearrangement of the high R scattering paths in a moreconstructive way, or both.
3.1.1. EXAFS Analysis of the Dehydrated Material. Thedehydrated case has been chosen as starting data set for theEXAFS analysis. The presence of adsorbed molecules, infact, represents an increasing degree of complexity. Not-withstanding the knowledge of the structure from XRDrefinement, the data analysis was not straightforward becausean important number of different single and multiple scat-tering (SS and MS) paths contribute significantly to theoverall signal. By arbitrarily defining as 100 the amplitudeof the stronger signal (corresponding to the first neighborO), the FEFF code computed 52 paths having a relativeintensity higher than 20.
XRD refinement resulted in five different Ni-O first shelldistances at 1.885, 1.945, 1.991, 2.074, and 2.120 Å. It was,however, impossible to fit separately these five contributions,because the presence of 5 signals with almost the sameamplitude (100, 93, 89, 81, and 77) and slightly differentdistances resulted in fit instabilities. For this reason, a fit withonly one oxygen shell at an average starting distance (with adegeneration factor of 5) has been chosen (vide infra, Figure3, red curve). This accounts very well for the first shell peak inthe 0.85-2.10 Å region (phase uncorrected distances in Figure2b). Coming to the higher R range, the second shell peak(2.10-3.10 Å region in Figure 2b) is mainly due to thecontribution of the Ni-Ni signal (amplitude 78, degeneration2), vide infra Figure 3, blue curve. Unfortunately, the presenceof 10 additional significant paths (both SS paths of the C atomsof the carboxylate units and MS triangular paths involving Oand C atoms) with intensities ranging from 29 to 85 preventsto completely fit the 2.10-3.10 Å region with the unique Ni-Nicontribution. In the 3.10-4.20 Å region, an impressive numberof different paths contributes to the experimental signal. Finally,the 4.2-5.0 Å region is dominated by the second Ni neighbor(intensity 41, degeneration 2), vide infra Figure 3, green curve.
(47) Bordiga, S.; Regli, L.; Bonino, F.; Groppo, E.; Lamberti, C.; Xiao,B.; Wheatley, P. S.; Morris, R. E.; A., Z Phys. Chem. Chem. Phys.2007, 9, 2676.
(48) Prestipino, C.; Regli, L.; Vitillo, J. G.; Bonino, F.; Damin, A.;Lamberti, C.; Zecchina, A.; Solari, P. L.; Kongshaug, K. O.; Bordiga,S. Chem. Mater. 2006, 18, 1337–1346.
Figure 2. Comparison between hydrated (black curves) and dehydrated (graycurves) CPO-27-Ni observed from X-ray absorption spectroscopies. (a) k3-weighted �(k). (b) Corresponding FT in their modulus (full lines) andimaginary part (dotted lines). (c) Normalized XANES. Insets report a zoomon the dipole forbidden 1s f 3d (top) and on the dipole allowed 1s f 4p(bottom) electronic transitions.
Figure 3. Summary of results obtained from the EXAFS data analysisperformed on the dehydrated sample measured at low temperature (a) ink-space, and in R-space, both (b) modulus and (c) imaginary part. Eachpart reports from top to bottom: the experimental data (black scatteredsquares) superimposed to the best fit (gray curve); the 5-degenerate SScontribution of the oxygen (red); the SS contribution of the first Ni neighbor(blue); the SS contribution of the second Ni neighbor (green); the sum ofall other SS and MS contributions included in the fit (orange). Values ofthe optimized parameters are reported in the second column of Table 1.
4960 Chem. Mater., Vol. 20, No. 15, 2008 Bonino et al.

On the basis of these considerations, we performed the fit inR-space including all SS and MS paths with intensity higherthan 10 with an effective path length shorter than 5.00 Å,optimizing the following 10 independent parameters: an uniqueamplitude factor (S0
2) and an unique energy shift (∆E0) for allpaths; the distances (⟨RO⟩, RNi1, and RNi2) and the Debye-Wallerfactor [σ2(O), σ2(Ni1), and σ2(Ni2)] for the SS Ni-O, Ni-Ni,and Ni-Ni paths around 2.0, 2.9, and 4.7 Å, respectively; andfor all remaining paths an unique Debye-Waller factor (σ2)and distance enlargement factor (R), parametrizing the pathlength variation as ∆R ) R Reff.49 This fit resulted in anexcellent agreement with the experimental results (R-factor )0.043) showing physically meaningful values for the optimizedparameters S0
2, ∆E0, and Debye-Waller factors (see firstcolumn in Table 1). As for the optimized distances, they are ingood agreement with those obtained from XRD:19 the averageoxygen distance, ⟨RO⟩ ) 1.99 ( 0.01 Å, match the XRDaverage (2.003 Å), within one esd (estimated standard devia-tion); the first (RNi1 ) 2.892 ( 0.005 Å) and the second (RNi2
) 4.82 ( 0.02 Å), Ni-Ni distances within two esd. Concerningall remaining scattering paths, the EXAFS best fit suggests alattice contraction of 0.8%, a value that is within the standardincertitude of EXAFS technique. The validity of the fit istestified by the fact that only two couples of fitted parametershave significant correlations factors (S0
2/σ2(O) ) 0.80; ∆E0/⟨RO⟩ ) 0.78), whereas all the remaining couples show correla-tion parameters below 0.5 in absolute value.
To further check whether the obtained fit is the correctone or is just a mathematical one, we applied the sameapproach to the sample measured at liquid nitrogen temper-ature. The results are reported in the second column of Table1. The S0
2 and ∆E0 parameters do not change withinexperimental errors, while all Debye-Waller factors de-creased as expected. The further improvement of theexperimental data due to temperature lowering results in a
further decrease of all correlations among fitted variables.The validity of the fit results is thus confirmed.
Figure 3 reports in both k- (a) and R-spaces (b and c) thefit obtained on the dehydrated sample measured at lowtemperature, together with the different contributions to theoverall best fit signal. In k-space (Figure 3a), the quality ofthe fit is excellent until 15 Å-1, whereas in the 15-18 Å-1
k-interval, the amplitude of the EXAFS oscillations are onlypartially reproduced by the model. A similar fit performedon the reduced 2-15 Å-1 k-interval resulted, within experi-mental errors, in equivalent values for the optimized param-eters (data not reported for brevity). In R-space (Figure 3bc) the agreement is excellent in the regions 1.0-3.2 and4.1-5.0 Å. The less accuracy of the fit in the 3.2-4.1 Åregion is due to the fact that the experimental signal containscontribution from a very high number of paths, none of thembeing dominating, that have been optimized using only twoparameters (σ2 and R), being the ∆E0 and the S0
2 parameterssheared with all other paths.
3.1.2. EXAFS Analysis of the Hydrated Material. Also forthe hydrated material, the structure determined from powderXRD has been used as starting model19 for the amplitude andphase calculation of all scattering paths and for the startingvalues of the fits. In this case, the addition of a further Ni-Oscattering path in the first shell peak results in even more severecorrelation problems among fitted parameters. Any attempt toadd two further fitting parameters Ni-Owater distance (Radsorbate)and corresponding Debye-Waller factor (σ2(adsorbate)), resultsin non physical values of the optimized parameters and in hugeassociated errors. For this reason, the fit of the dehydratedmaterial has been used to fix as much parameters as possible.It has been assumed that water adsorption/desorption does notaffect appreciably the amplitude factor S0
2, as well as allframework Debye-Waller factors σ2(O), σ2(Ni1), σ2(Ni2), andσ2. Under those assumptions, a seven-parameter fit was run,see third column in Table 1. In the fit, the main correlationsconcern: ⟨RO⟩/σ2(adsorbate) ) 0.93; Radsorbate/σ2(adsorbate) )-0.76; ⟨RO⟩/Radsorbate )-0.71; R/RNi2 ) 0.66, all the remaining
(49) Reff is defined as one half of the path length. For SS paths, Reffcoincides consequently with the distance between the absorbing Niand the scattering atom.
Table 1. Summary of the Parameters Optimized by Fitting the EXAFS Data Collected at Temperature Ta
dehydrated + NO
sample condition dehydrated dehydrated hydrated Ni-N-O linear Ni-N-O 130°T (K) 300 77 300 300 300R-factor 0.043 0.033 0.027 0.045 0.052no. of independent points 40 40 40 40 40no. of variables 10 10 7 7 7∆E 0 (eV) -2.5 ( 1.0 -1.7 ( 1.0 0.5 ( 0.5 -2.5 ( 1.0 -0.5 ( 1.0S0
2 1.17 ( 0.09 1.20 ( 0.08 1.17 1.17 1.17⟨RO⟩ (Å) 1.99 ( 0.01 (2.003) 2.00 ( 0.01 2.03 ( 0.01 (2.045) 1.99 ( 0.01 2.00 ( 0.01σ2(O) (Å2) 0.0049 ( 0.0005 0.0042 ( 0.0004 0.0049 0.0049 0.0049RNi1 (Å) 2.892 ( 0.005 (2.904) 2.889 ( 0.005 2.980 ( 0.005 (2.980) 2.95 ( 0.01 2.94 ( 1.00σ2(Ni1) (Å2) 0.0055 ( 0.0006 0.0045 ( 0.0004 0.0055 0.0055 0.0055RNi2 (Å) 4.82 ( 0.02 (4.869) 4.87 ( 0.01 4.78 ( 0.03 (4.878) 4.79 ( 0.02 4.80 ( 2.00σ2(Ni2) (Å2) 0.0059 ( 0.0018 0.0052 ( 0.0014 0.0059 0.0059 0.0059R (all other paths) -0.008 ( 0.009 (0) -0.003 ( 0.007 -0.021 ( 0.005 (0) -0.024 ( 0.007 -0.021 ( 0.007σ2(all other paths) (Å2) 0.009 ( 0.004 0.007 ( 0.003 0.009 0.009 0.009Radsorbate (Å) 2.10 ( 0.04 (2.081) 1.85 ( 0.02 1.87 ( 0.01σ2(adsorbate) (Å2) 0.01 ( 0.01 0.0065 ( 0.002 0.009 ( 0.003a The fits were performed in R-space in the 1.0-5.0 Å range over k3-weighted FT of the �(k) functions performed in the 2.0-18.0 Å-1 interval. A
single ∆E0 and a single S02 have been optimized for all SS and MS paths. The Ni-O and Ni-Ni (first and second neighbor) SS paths have been
modeled with their own path length and Debye-Waller factors, whereas a unique σ2 and unique path length parameter R, common to all other SS andMS paths, have been optimized. Non optimized parameters are recognizable by the absence of corresponding error bars. When possible, comparisonwith the values obtained from powder XRD19 are reported in parentheses.
4961Chem. Mater., Vol. 20, No. 15, 2008Coordination of NO on CPO-27-Ni MOF

couples showing correlation parameters below 0.5 in absolutevalue. The adsorbed water molecule was located at Radsorbate )2.10 ( 0.04 Å, a value in perfect agreement with that obtainedfrom powder XRD (2.081 Å). Much less can be said for thecorresponding Debye-Waller factor, as the optimized σ2(ad-sorbate) value has the same magnitude as its associated error,as also testified by its high correlation with other parameters,vide supra. The presence of water strongly modifies alldistances: ⟨RO⟩, RNi1, and RNi2 increase by 0.04, 0.09, and 0.04Å, respectively. This picture is in fair agreement with the valuesobtained from powder XRD; see values reported in parenthesesin Table 1.
3.2. Electronic Spectroscopies. 3.2.1. DR-UV-Vis-NIR. CPO-27-Ni has a strong yellow-green color given bythe combination of electronic transitions associated with theorganic linker (H4dhtp) with those related to the presenceof Ni(II) cations. Figure 4a) compares the UV-vis DRspectra of CPO-27-Ni sample as synthesized (hydrated; blackcurve) with that obtained after dehydration (gray curve). Thespectrum of the hydrated sample is characterized by thepresence of three main features: a band at 1100 nm, a featureconstituted by a double peak at 655 and 750 nm and acomponent at about 500 nm. The last one is partially hiddenby the intense absorption with an edge at 460 nm, associatedwith the lowest π-π* energy transition due to the organiclinker (dashed line). The other three main bands can be easilyassigned by considering the UV-vis-NIR spectrum of aNi(II) aqueous solution as model, where Ni(II) has an Oh-like symmetry. In this case, the three components, observedat 1150, 690 and 425 nm, are assigned to spin-allowed d-dtransitions: 3A2g(3F) f 3T1g(3P), 3A2g(3F) f 3T1g(3F), and3A2g(3F) f 3T2g(3F), respectively. Similar features were
observed in the case of MgGa2O4 or phosphate glasses dopedwith Ni(II).50,51
The thermal treatment in vacuo at 393 K produces deepchanges in the optical spectrum: a blue shift for all thecomponents, and above all, the appearance of a new band at1780 nm. This profile is extremely similar to what Ciam-polini.52 observed in case of a five-coordinated Ni(II) speciesin a squared-pyramidal geometry; the assignment of theelectronic transitions is as it follows: 3B1(3F) f 3E(1)(3F),3B1(3F)f 3A2(3F), 3B1(3F)f 3B2(3F), 3B1(3F)f 3E(2)(3P),3B1(3F) f 3E(3P), 3B1(3F) f 3A2(3P). This result indicatesthat the removal of water molecules directly coordinated toNi(II) species causes a substantial modification of theelectronic structure of the metal. The change in symmetryand ligand field causes a rearrangement of the metal statesas reported above.
3.2.2. XANES. Similar symmetry changes are deducedfrom XANES spectra (Figure 2c). Upon water removal,several changes in the XANES spectra are observed, but noshift of the edge position occurs, testifying that the nickeloxidation state remains +2. The main changes can besummarized as it follows: (i) a decrease in the white lineintensity (first resonance after the edge, from 1.59 to 1.44)accompanied by a small blue shift (from 8350.6 to 8351.4eV); (ii) the appearance of a new electronic transition around8339.7 eV (0.22 in normalized intensity) (bottom inset inFigure 2c)); (iii) the increase in intensity (from 0.039 to0.051) and a red shift (from 8333.3 to 8332.9 eV) of thevery weak pre-edge feature (top inset in Figure 2c) due to1s f 3d electronic transition. The significant reduction ofthe white line intensity reflects the decrease of the averagecoordination of the absorbing atom.53–56 No 1sf 4p (bottominset Figure 2c) electronic transitions are observed for thehydrated sample, probably because too close to the edge tobe resolved. Water removal causes a symmetry change forNi(II) from octahedral-like to square-pyramidal-like, imply-ing the removal of the degeneration of p-levels (splittingbetween pz and px, py, being xy the pyramidal plane) and theloss of the inversion center. Consequently, a pre-edgecomponent appears upon dehydration at 8339.7 eV, whichis attributed to the 1sf 4pz electronic transition. The splittingof the 1s to p level transitions has already been observed inthe XANES spectra for other metal centers when the pdegeneration was removed by symmetry reduction.57–60
Finally, the very weak pre-edge feature around 8333 eV
(50) Ravikumar, R.; Yamauchi, J.; Chandrasekhar, A.; Reddy, Y. P.; Rao,P. S. J. Mol. Struct. 2005, 740, 169–173.
(51) Suzuki, T.; Murugan, G. S.; Ohishi, Y. J. Lumin. 2005, 113, 265–270.
(52) Ciampolini, M. Inorg. Chem. 1966, 5, 35–40.(53) Berlier, G.; Spoto, G.; Bordiga, S.; Ricchiardi, G.; Fisicaro, P.;
Zecchina, A.; Rossetti, I.; Selli, E.; Forni, L.; Giamello, E.; Lamberti,C. J. Catal. 2002, 208, 64–82.
(54) Bolis, V.; Bordiga, S.; Lamberti, C.; Zecchina, A.; Carati, A.; Rivetti,F.; Spano, G.; Petrini, G. Langmuir 1999, 15, 5753–5764.
(55) Bordiga, S.; Bonino, F.; Damin, A.; Lamberti, C. Phys. Chem. Chem.Phys. 2007, 9, 4854–4878.
(56) Groppo, E.; Prestipino, C.; Cesano, F.; Bonino, F.; Bordiga, S.;Lamberti, C.; Thune, P. C.; Niemantsverdriet, J. W.; Zecchina, A. J.Catal. 2005, 230, 98–108.
(57) Prestipino, C.; Berlier, G.; Llabres, i; Xamena, F. X.; Spoto, G.;Bordiga, S.; Zecchina, A.; Palomino, G. T.; Yamamoto, T.; Lamberti,C. Chem. Phys. Lett. 2002, 363, 389–396.
Figure 4. (a) UV-vis spectra of CPO-27-Ni and dhtp linker (solid anddashed lines, respectively). Black and gray curves are used for as synthesizedand dehydrated samples, respectively. (b, c) Photoluminescence of assynthesized (black curves) and dehydrated (gray curves) CPO-27-Ni,respectively. Solid and dotted curves are used to identify correspondingexcitation and emission spectra.
4962 Chem. Mater., Vol. 20, No. 15, 2008 Bonino et al.
increases in intensity upon dehydration because of loss ofinversion center. This change of symmetry also accounts forthe increase of the component due to 1s f 3d electronictransition, which is forbidden in a perfect Oh symmetry.
3.2.3. Photoluminescence. The combination of aromaticlinkers (2,5-dihydroxyterephthalic acid) with transition metalions suggests the possibility to observe also some relevantfeatures associated to electronic emissions, as already shownin the case of other MOFs,10,61,62 where the metal coordina-tion to luminescent organic ligands had been able to enhanceor quench and shift luminescent emission of the pure organicligands. Parts b) and c) of Figure 4 report photoluminescenceresults obtained on as synthesized (black curves) anddehydrated samples (gray curves), respectively. For both thesamples, excitation and emission spectra, obtained by fixingthe emission or the excitation wavelength respectively, arereported in the same graph. Fixed emission and excitationwavelengths are indicated for each spectrum. Different markstyles refer to the corresponding excitation-emission coupleof spectra.
Hydrated sample (Figure 4b) is characterized by strongluminescence in the visible region. The most favorableexcitation was found across the UV and visible regions(350-450 nm), where the lowest energy electronic transitionassociated to the linker and the strongest d-d transition ofNi(II) cations are present (see section 3.2.1 and Figure 4a).In particular, excitations at 380 and 430 nm give rise to anintense emission peak at 465 nm. An excitation at 350 nmcauses a two peaks emission spectrum with maxima at 465and 565 nm. By comparing the photoluminescence of CPO-27-Ni and H4dhtp linker (see the Supporting Information,Figure S2), it is observed that the linker is significantly morefluorescent than the MOF. The absence of a double emissionpeak for the linker excited at 350 nm implies that theemission peak observed for CPO-27-Ni at 565 nm can beassigned to a charge transfer from the ligand to the metal(LMCT). In the literature, many examples of emission spectradue to LMCTs and not aromatic ligands are reported.61,62
CPO-27-Ni luminescence is perturbed upon water removaland change of Ni(II) coordination sphere (see Figure 4c). Inparticular, upon dehydration (thermal treatment at 393 K),emission spectra shift at lower wavelengths and are split(maxima at 415 and 435 nm), because of degenerationremoval by symmetry reduction. Excitation both at 270 and370 nm cause the same type of emission.
3.3. Vibrational Spectroscopies: IR and Raman. Effectof dehydration on CPO-27-Ni has been investigated also byvibrational spectroscopies: both IR and Raman. Being thetwo techniques complementary, they permitted us to ap-preciate all the vibrational aspects of the phenomenon.
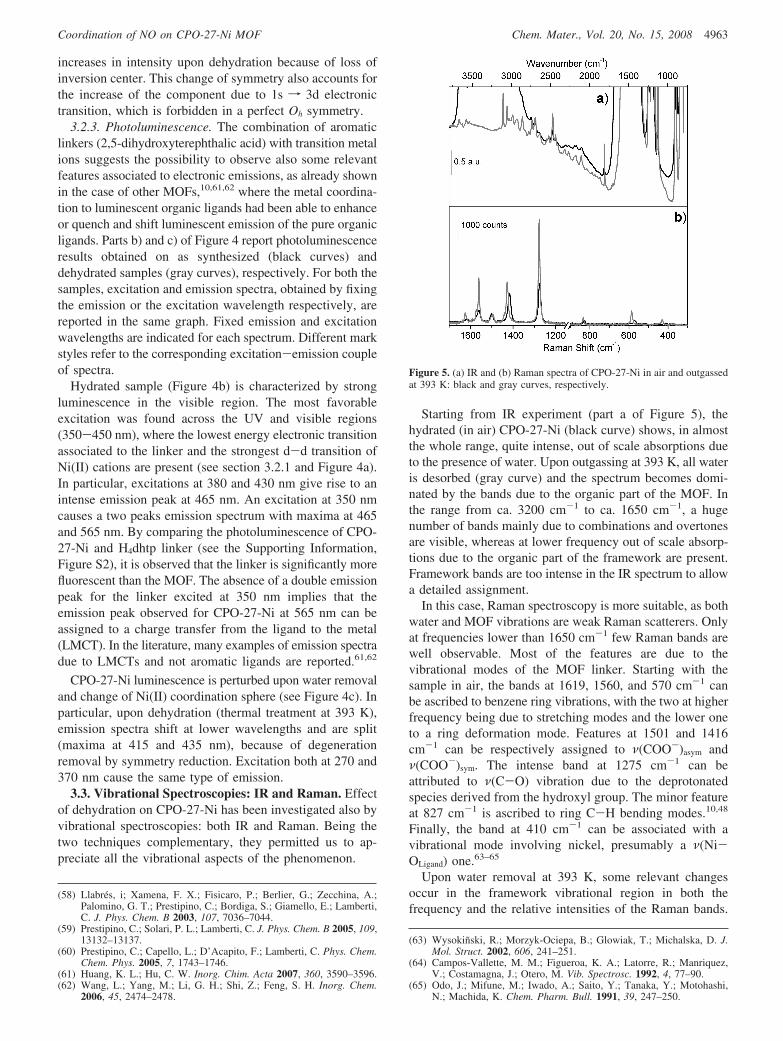
Starting from IR experiment (part a of Figure 5), thehydrated (in air) CPO-27-Ni (black curve) shows, in almostthe whole range, quite intense, out of scale absorptions dueto the presence of water. Upon outgassing at 393 K, all wateris desorbed (gray curve) and the spectrum becomes domi-nated by the bands due to the organic part of the MOF. Inthe range from ca. 3200 cm-1 to ca. 1650 cm-1, a hugenumber of bands mainly due to combinations and overtonesare visible, whereas at lower frequency out of scale absorp-tions due to the organic part of the framework are present.Framework bands are too intense in the IR spectrum to allowa detailed assignment.
In this case, Raman spectroscopy is more suitable, as bothwater and MOF vibrations are weak Raman scatterers. Onlyat frequencies lower than 1650 cm-1 few Raman bands arewell observable. Most of the features are due to thevibrational modes of the MOF linker. Starting with thesample in air, the bands at 1619, 1560, and 570 cm-1 canbe ascribed to benzene ring vibrations, with the two at higherfrequency being due to stretching modes and the lower oneto a ring deformation mode. Features at 1501 and 1416cm-1 can be respectively assigned to ν(COO-)asym andν(COO-)sym. The intense band at 1275 cm-1 can beattributed to ν(C-O) vibration due to the deprotonatedspecies derived from the hydroxyl group. The minor featureat 827 cm-1 is ascribed to ring C-H bending modes.10,48
Finally, the band at 410 cm-1 can be associated with avibrational mode involving nickel, presumably a ν(Ni-OLigand) one.63–65
Upon water removal at 393 K, some relevant changesoccur in the framework vibrational region in both thefrequency and the relative intensities of the Raman bands.
(58) Llabres, i; Xamena, F. X.; Fisicaro, P.; Berlier, G.; Zecchina, A.;Palomino, G. T.; Prestipino, C.; Bordiga, S.; Giamello, E.; Lamberti,C. J. Phys. Chem. B 2003, 107, 7036–7044.
(59) Prestipino, C.; Solari, P. L.; Lamberti, C. J. Phys. Chem. B 2005, 109,13132–13137.
(60) Prestipino, C.; Capello, L.; D’Acapito, F.; Lamberti, C. Phys. Chem.Chem. Phys. 2005, 7, 1743–1746.
(61) Huang, K. L.; Hu, C. W. Inorg. Chim. Acta 2007, 360, 3590–3596.(62) Wang, L.; Yang, M.; Li, G. H.; Shi, Z.; Feng, S. H. Inorg. Chem.
2006, 45, 2474–2478.
(63) Wysokinski, R.; Morzyk-Ociepa, B.; Glowiak, T.; Michalska, D. J.Mol. Struct. 2002, 606, 241–251.
(64) Campos-Vallette, M. M.; Figueroa, K. A.; Latorre, R.; Manriquez,V.; Costamagna, J.; Otero, M. Vib. Spectrosc. 1992, 4, 77–90.
(65) Odo, J.; Mifune, M.; Iwado, A.; Saito, Y.; Tanaka, Y.; Motohashi,N.; Machida, K. Chem. Pharm. Bull. 1991, 39, 247–250.
Figure 5. (a) IR and (b) Raman spectra of CPO-27-Ni in air and outgassedat 393 K: black and gray curves, respectively.
4963Chem. Mater., Vol. 20, No. 15, 2008Coordination of NO on CPO-27-Ni MOF

As far as the frequency shifts are concerned, most of thecomponents are sensibly red-shifted (the bands at 1625, 1561,1427, 1278, 833, 586, and 430 cm-1 move respectively to1618, 1558, 1415, 1273, 827, 570, and 410 cm-1). Anexception is made for the band around 1500 cm-1, thatremains almost unshifted. Coming to the band intensities,any direct comparison of the two spectra is not possible asthe measures have not been performed on the same focusedpoint. Assuming that the frequency invariance of the 1500cm-1 band reflects a negligible perturbation of the corre-sponding vibrational mode upon water desorption, the spectrareported in Figure 5b have been normalized to this compo-nent. Under this assumption, most of the bands decrease inintensity upon H2O removal. This global decrease in intensityof all the spectrum features can be justified by consideringthat upon dehydration the framework undergoes a loose oflocal symmetry.
4. Interaction with NO: Spectroscopic andCalorimetric Studies
NO gas is a relevant signaling molecule in mammals,acting both as a poison that competes with oxygen in thebreath cycle and as a beneficial agent able to lower the bloodpressure. Moreover, it is a very important intermediate inthe chemical industry. In the mean time, as NO is adangerous toxic air pollutant (produced by automobileengines and power plants) and participates in ozone layerdepletion, it must follow very strict emission legislationlimits. For these reasons, a large effort is devoted in the fieldof NO traps and sensors for bio- and green chemistryapplications.31,32 In the field of biomolecular systems, ironproteins are probably the most investigated. Nevertheless,an increasing effort has been devoted recently to findingalternative systems.66 In this area, MOFs seem to be verypromising, as transition metal ions are one of the maincomponents of the structure and very often offer a coordina-tion site vacancy.32
4.1. Electronic Properties of the Nitrosyl Adducts:DR-UV-vis-NIR and XANES Spectroscopies. Theinteraction of NO with CPO-27-Ni causes an evident colorchange of the sample: from yellow to olive color. Figure 6compares the DR-UV-vis-NIR spectra of the dehydratedCPO-27-Ni (gray curve) and of the sample in interaction withNO (black curve). The spectrum has been collected after contactwith 10 mbar of NO and sample equilibration. The spectrumdoes not substantially change upon pumping at room temper-ature for 30 min under dynamic vacuo (spectrum not reportedfor the sake of clearness). The most relevant changes upon NOinteraction consist in a red shift of the edge (that covers thehighest energy d-d transition) and the growth of an importantabsorption at about 650 nm, assigned to a LMCT from NO toNi(II). The frequency of this band is exceptionally low for acharge transfer and its intensity is too high for a d-d transition.However, similar features have been already found in systemscontaining Cr(II) interacting with NO molecule67 and with
inorganic complexes composed of ligands with a similarelectronic structure, namely CN- and O2
-, which differ fromNO by one or two electrons, respectively.68 In both cases, lowenergy absorptions were observed and assigned to LMCTinvolving these electron rich ligands. The new band overshad-ows the d-d component observed at 705 nm on the dehydratedsample. Finally, the d-d transition observed at 1780 nm appearsnow at 1740 nm, whereas the component at 1010 nm remainsnearly unperturbed. These spectroscopic evidences suggest thatNO is bonded to the Ni(II) sites, which, however, maintain alow local symmetry structure, as testified by the persistence ofthe band centered at 1740 nm, which is absent in the hydratedsample.
This general picture is confirmed by XANES data obtainedin a parallel experiment. NO coordination results in a smallincrease in the white line intensity, as expected when theaverage coordination of the absorbing atom increases (Figure6b). Furthermore, NO adsorption causes an intensity decreaseof the 1s f 4pz electronic transition at 8339.7 eV, andperturbs the d orbitals of Ni(II) as monitored by the blueshift of the 1s f 3d electronic transition from 8332.9 to8333.5 eV.
The perturbation of the XANES and UV-vis spectra upondosage of NO is less important than that observed uponhydration. This could suggests that H2O is a stronger ligandwith respect to NO and that the overlapping of Ni(II)molecular orbitals with those of the adsorbing molecule isless extended in the case of NO. However, it is also importantto consider that H2O molecules tend to give aggregatesthrough the formation of strong H-bonds, so amplifying theresponse of the structure. NO is a “selective” ligand towardNi(II), whereas H2O, besides interacting with Ni(II), com-pletely fills the MOF channels.
4.2. Vibrational Properties of the Nitrosyl Adducts:IR and Raman Spectroscopies. It is generally ascertainedthat NO coordinates to transition metal centers through thenitrogen atom. The character of the NO ligand can range
(66) Ford, P. C.; Lorkovic, I. M. Chem. ReV. 2002, 102, 993–1017.(67) Groppo, E.; Lamberti, C.; Bordiga, S.; Spoto, G.; Zecchina, A. Chem.
ReV. 2005, 105, 115–183.(68) Ghiotti, G.; Garrone, G.; Della Gatta, G.; Fubini, B.; Giamello, E. J.
Catal. 1983, 80, 249–262.
Figure 6. CPO-27-Ni in interaction with NO. (a) UV-vis-NIR spectra.(b) Normalized XANES. Insets report a zoom on the dipole forbidden 1sf 3d (top) and on the dipole allowed 1s f 4p (bottom) electronictransitions. Gray curves: dehydrated sample; black curves: after NO dosage.
4964 Chem. Mater., Vol. 20, No. 15, 2008 Bonino et al.
from that of a nitrosyl cation (NO+), which binds to the metalwith a M-N-O angle close to 180° (linear), to that of anitrosyl anion (NO-), for which a bond angle in the120-140° range (bent) might be generally anticipated. Inthe former case, considerable charge transfer to the metaloccurs, while in the latter, charge transfer is in the oppositedirection. The electron in the antibonding orbital of NO isdonated to the metal atom forming a σ-bond, whereas aπ-bond is then provided by the donation of the d electronsfrom metal to the antibonding orbital of nitric oxide.Vibrational spectra reflect the nature of the binding betweenNO and the metal showing a red shift with respect to thevibration of the free molecule (ν0(NO) ) 1876 cm-1), thatprogressively increases with increasing the fraction ofπ-bonding.66,69 The situation becomes slightly more complexin the case of NO adsorbed on a surface. When NO isadsorbed on a well defined surface, difference is madebetween linear and tilted adsorption geometries (both char-acterized by a Ni-N-O angle close to 180°), dependingwhether the Ni-N-O direction is perpendicular or not tothe surface. In case of (001) faces of microcrystalline NiO,it has been found that linear NO, formed at low coverages,is accompanied by tilted NO at medium/high coverages,which are characterized by a coverage dependent ν(NO)stretching frequency in the 1805-1799 cm-1 range due toboth static and dynamic dipole-dipole interactions (∆νdyn
) 32 cm-1 and ∆νst ) -26 cm-1).70–74 The Freund groupin Berlin investigated with high resolution EELS the adsorp-tion of NO on thin NiO(001) layers deposited on Ni(001)and on vacuum cleaved NiO(001) single crystal surfaces,72
finding a ν0(NO) of 1800 cm-1.The effect of NO interaction at room temperature on the
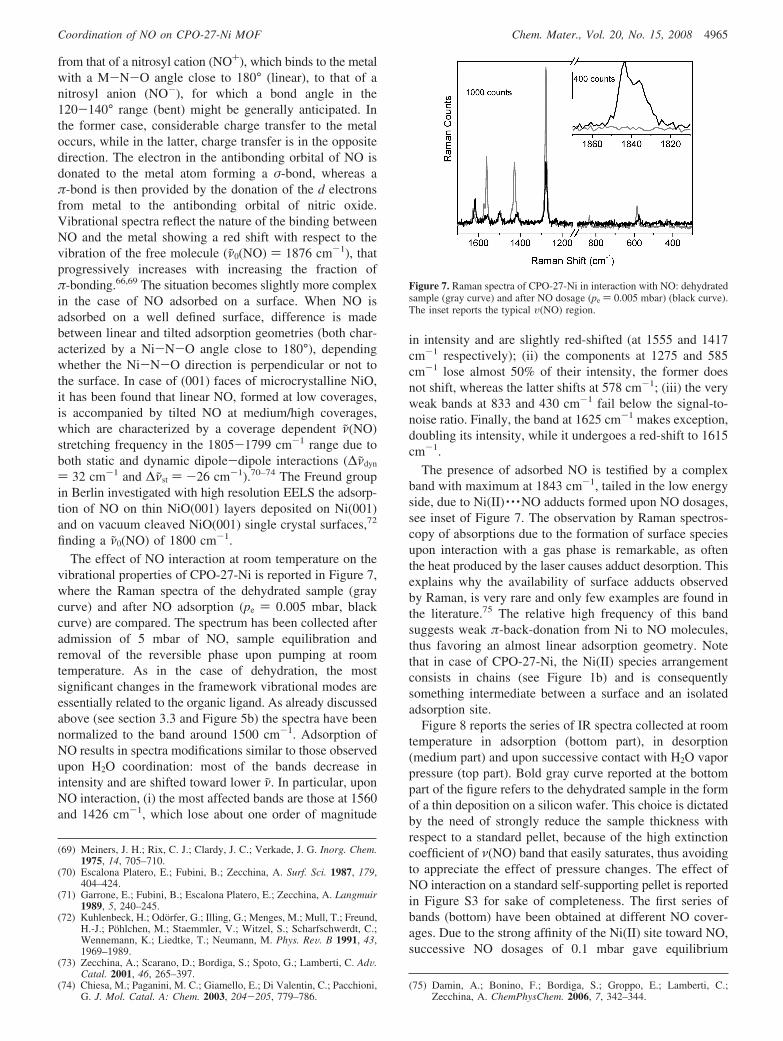
vibrational properties of CPO-27-Ni is reported in Figure 7,where the Raman spectra of the dehydrated sample (graycurve) and after NO adsorption (pe ) 0.005 mbar, blackcurve) are compared. The spectrum has been collected afteradmission of 5 mbar of NO, sample equilibration andremoval of the reversible phase upon pumping at roomtemperature. As in the case of dehydration, the mostsignificant changes in the framework vibrational modes areessentially related to the organic ligand. As already discussedabove (see section 3.3 and Figure 5b) the spectra have beennormalized to the band around 1500 cm-1. Adsorption ofNO results in spectra modifications similar to those observedupon H2O coordination: most of the bands decrease inintensity and are shifted toward lower ν. In particular, uponNO interaction, (i) the most affected bands are those at 1560and 1426 cm-1, which lose about one order of magnitude
in intensity and are slightly red-shifted (at 1555 and 1417cm-1 respectively); (ii) the components at 1275 and 585cm-1 lose almost 50% of their intensity, the former doesnot shift, whereas the latter shifts at 578 cm-1; (iii) the veryweak bands at 833 and 430 cm-1 fail below the signal-to-noise ratio. Finally, the band at 1625 cm-1 makes exception,doubling its intensity, while it undergoes a red-shift to 1615cm-1.
The presence of adsorbed NO is testified by a complexband with maximum at 1843 cm-1, tailed in the low energyside, due to Ni(II) · · ·NO adducts formed upon NO dosages,see inset of Figure 7. The observation by Raman spectros-copy of absorptions due to the formation of surface speciesupon interaction with a gas phase is remarkable, as oftenthe heat produced by the laser causes adduct desorption. Thisexplains why the availability of surface adducts observedby Raman, is very rare and only few examples are found inthe literature.75 The relative high frequency of this bandsuggests weak π-back-donation from Ni to NO molecules,thus favoring an almost linear adsorption geometry. Notethat in case of CPO-27-Ni, the Ni(II) species arrangementconsists in chains (see Figure 1b) and is consequentlysomething intermediate between a surface and an isolatedadsorption site.
Figure 8 reports the series of IR spectra collected at roomtemperature in adsorption (bottom part), in desorption(medium part) and upon successive contact with H2O vaporpressure (top part). Bold gray curve reported at the bottompart of the figure refers to the dehydrated sample in the formof a thin deposition on a silicon wafer. This choice is dictatedby the need of strongly reduce the sample thickness withrespect to a standard pellet, because of the high extinctioncoefficient of ν(NO) band that easily saturates, thus avoidingto appreciate the effect of pressure changes. The effect ofNO interaction on a standard self-supporting pellet is reportedin Figure S3 for sake of completeness. The first series ofbands (bottom) have been obtained at different NO cover-ages. Due to the strong affinity of the Ni(II) site toward NO,successive NO dosages of 0.1 mbar gave equilibrium
(69) Meiners, J. H.; Rix, C. J.; Clardy, J. C.; Verkade, J. G. Inorg. Chem.1975, 14, 705–710.
(70) Escalona Platero, E.; Fubini, B.; Zecchina, A. Surf. Sci. 1987, 179,404–424.
(71) Garrone, E.; Fubini, B.; Escalona Platero, E.; Zecchina, A. Langmuir1989, 5, 240–245.
(72) Kuhlenbeck, H.; Odorfer, G.; Illing, G.; Menges, M.; Mull, T.; Freund,H.-J.; Pohlchen, M.; Staemmler, V.; Witzel, S.; Scharfschwerdt, C.;Wennemann, K.; Liedtke, T.; Neumann, M. Phys. ReV. B 1991, 43,1969–1989.
(73) Zecchina, A.; Scarano, D.; Bordiga, S.; Spoto, G.; Lamberti, C. AdV.Catal. 2001, 46, 265–397.
(74) Chiesa, M.; Paganini, M. C.; Giamello, E.; Di Valentin, C.; Pacchioni,G. J. Mol. Catal. A: Chem. 2003, 204-205, 779–786.
(75) Damin, A.; Bonino, F.; Bordiga, S.; Groppo, E.; Lamberti, C.;Zecchina, A. ChemPhysChem. 2006, 7, 342–344.
Figure 7. Raman spectra of CPO-27-Ni in interaction with NO: dehydratedsample (gray curve) and after NO dosage (pe ) 0.005 mbar) (black curve).The inset reports the typical υ(NO) region.
4965Chem. Mater., Vol. 20, No. 15, 2008Coordination of NO on CPO-27-Ni MOF

pressure below 0.01 mbar. The final curve corresponds toan equilibrium pmax ) 0.1 mbar. At the lowest NO coverages,a band at 1845 cm-1, clearly tailed at lower frequencies, ispresent. This feature is assigned to the ν(NO) of Ni(II) · · ·NOadducts. The red shift of the adsorbed NO with respect tofree gaseous molecule (ν0 ) 1876 cm-1) indicates a stronginteraction involving some back-donation effect from themetal to the nitrosyl species.76 By increasing the coverage,a red shift up to 1838 cm-1 is observed, probably becauseof the filling of vicinal Ni(II) sites. The effect becomes evenmore strong at higher coverages where a condensed phaseis formed (see Figure S3 in the Supporting Information). Asalready observed by Raman spectroscopy, NO adsorptioninduces some changes in the vibrational modes of theframework. In this case the band at 1807 cm-1 blue shiftsprogressively to 1816 cm-1 because of some combinationmode of CPO-27-Ni. Desorption spectra (middle part ofFigure 8) confirm that NO interacts very strongly with Ni(II)and the interaction is not completely reversible at roomtemperature upon outgassing in dynamic vacuo.
To investigate the possible application of this material forprogressive NO release in biological media, the ability ofwater to displace the NO ligand has to be investigated. Thishas been done by dosing progressive amounts of water on aNO precontacted and evacuated sample and by monitoringthe spectra time evolution (top part of Figure 8). At verylow H2O dosages, no relevant changes are observed but anincrease in the NO band intensity (black curve in the toppart of Figure 8), because of the growth of the pressure insidethe cell. Then, by dosing the water vapor pressure, H2Openetrates inside the pores, modifying the local dielectricconstant as monitored by the small red shift undergone by
the N-O band (now at 1835 cm-1). Successively, uponincreasing water contact time the gradual removal of NO isclearly visible (gray curves in the top part of Figure 8). Nooxidation products have been observed. This behavior isoptimal for a slow NO release inside a biological medium.
4.3. Structural Properties of the Ni(II) · · ·NO Ad-ducts: EXAFS Spectroscopy. EXAFS spectroscopy hasbeen used to determine the structural properties of theNi(II) · · ·NO adduct and the structural modification of theCPO-27-Ni framework upon NO adsorption. As already donepreviously (see section 3.1), the structure of the dehydratedMOF19 was used as starting model for the refinement. Twoclusters were then constructed, by adding to the frameworkatoms a NO molecule (starting value for the Ni-N distance1.80 Å, and fixing N-O at 1.20 Å) either linearly absorbedon the central Ni atom or with a bent geometry, fixing theNi-N-O angle to 130°. In the case of EXAFS data analysis,the presence of tilted NO has not been considered as thisgeometry could have influence only on the MS pathsinvolving both the NO molecule and light elements of theframework, whose contributions are too weak to competewith the strong Ni-Ni ones.
To limit the number of fitting parameters, and theassociated correlation problems, we applied the same pro-cedure adopted for fitting the hydrated sample (vide suprasection 3.1.2.) here. So the amplitude factor S0
2 and allframework Debye-Waller factors σ2(O), σ2(Ni1), σ2(Ni2),and σ2 were fixed to the values optimized in the fit of thedehydrated sample measured at RT (see Table 1). Additionalparameters are the Ni-N distance (Radsorbate) and correspond-ing Debye-Waller factor (σ2(adsorbate)); the distance of theSS Ni-ONO; and the triangular (linear) MS path involvingthe NO molecule, which has been fixed by geometricalconstraints to be functions of Radsorbate. According to both IR(showing only mononitrosyl adducts) and microcalorimetry(volumetric data showing the formation of 95% of 1:1complexes, see below), the stoichiometry Ni(II) · · ·NO wasassumed, allowing us to fix the amplitude factor of the signalassociated to the NO molecule. Under those assumptions, aseven-parameter fit was run.
The results of the two fits are summarized in Table 1,whereas Figure 9 reports, for the linear model, the compari-son between experimental and theoretical curves in k- (a)and R-space (b). Both fits agree in the location of the NOmolecule: Ni-N distance being optimized at 1.85 ( 0.02and 1.87 ( 0.02 Å, in the linear and bent models,respectively. This insertion causes an almost negligiblemodification of the average Ni-O first shell distance thatdoes not undergo the stretching observed when water wascoordinated. The Ni-NO distance is determined with goodprecision in the 1.85-1.87 Å range because of the strongintensity of the Ni-N path (the most intense among all) andbecause of a significant difference in distance from theframework oxygen contributions, located at higher R values.Usually EXAFS is able to discriminate between linear orbent adsorption of a diatomic molecule on a metal center,because of the focusing effect that enhances the MScontributions in case of linear alignment of scattering(76) Mihaylov, M.; Hadjiivanov, K. Langmuir 2002, 18, 4376–4383.
Figure 8. Bottom: FTIR spectra of increasing NO equilibrium pressures(PNO) dosed at RT on CPO-27-Ni (equilibrium pmax ) 0.1 mbar). Boldgray curve, vertically translated for clarity, reports the spectrum collectedbefore NO dosage, showing the framework mode at 1807 cm-1. Middle:spectra obtained upon successive progressive outgassing. Top: Effect ofwater dosage on the irreversible NO (last spectrum of the middle part).Black curve reports the effect of 0.1 mbar H2O dosage. Gray curves furtherinteraction of water, at the vapor pressure as a function of increasing contacttimes (up to 10 min).
4966 Chem. Mater., Vol. 20, No. 15, 2008 Bonino et al.

atoms.60,77,78 Unfortunately, in this case, EXAFS is not ableto unambiguously discriminate between the two molecularorientations. This is due to the fact that the contribution ofthe O atom of the NO molecule falls around 3 Å, i.e., in theregion dominated by the strong Ni-Ni contribution at 2.9Å, see Figure 9b. The analysis performed using the linearmodel resulted in a slightly better numerical fit: R-factor )0.045 (see Table 1) with respect to 0.052. This difference(about 15%) is not huge but the numbers can be directlycompared as the two fits run on exactly the same fittingparameters. We can also conclude that EXAFS slightly favorsa Ni-N-O angle closer to 180° than to 130°. Note that agood fit (R-factor ) 0.043) was obtained also with a clusterhaving Ni-N-O angle ) 160° (not reported for brevity).
4.4. Calorimetry. In Figure 10, the primary and secondaryvolumetric isotherms for the NO adsorption on CPO-27-Nias function of the equilibrium pressure Pe are reported. Inthe inset of Figure 10 the corresponding calorimetricisotherms are also reported (integral heat Qint as function ofPe). The differential heat of adsorption qdiff (defined as ∆Qint/∆na) as function of the coverage is reported in Figure 11.The adsorbed NO amounts na have been normalized to themoles of Ni atoms present in the activated CPO-27-Nimaterial supposed stoichiometric and with all the Ni atomsavailable to the interaction (empirical formula of CPO-27-Ni: C4HO3Ni, 155.7401 g/mol) in order to make easier thecomparison with the spectroscopic data. For each NO dose
admitted on the sample, thermokinetic data have also beenrecorded. The evolution with time of the calorimetric peakwas in all cases typical of an instantaneous, nonactivated,molecular adsorption process. In fact, the thermogramrecorded during the adsorption step of each single dosereturned to the initial baseline in a time of ca. 45 min, i.e.,within the time response of the heat-flow calorimeter.36,54,79
Both the primary and the secondary isotherms show a typeI behavior in which the saturation is reached at low pressuresfollowed by a pseudoplateau at higher pressure of NO witha maximum uptake of 15.5 mass % (6.1 mmol/g) corre-sponding to the formation of 95% of 1:1 complexes. Theobserved sharp uptake of NO at lower pressure indicatesfavorable sorption interactions between the CPO-27-Niframework and NO molecules. Comparison with dataobtained previously on HKUST-132 (3 mmol/g) shows thepotentiality of this material for NO storage.
The reversible NO fraction obtained from the secondaryisotherm is of about 1/3 of the overall uptake. The compari-(77) Westre, T. E.; Dicicco, A.; Filipponi, A.; Natoli, C. R.; Hedman, B.;
Solomon, E. I.; Hodgson, K. O. J. Am. Chem. Soc. 1994, 116, 6757–6768.
(78) Lamberti, C.; Palomino, G. T.; Bordiga, S.; Berlier, G.; D’Acapito,F.; Zecchina, A. Angew. Chem., Int. Ed. 2000, 39, 2138–2141.
(79) Bolis, V.; Barbaglia, A.; Bordiga, S.; Lamberti, C.; Zecchina, A. J.Phys. Chem. B 2004, 108, 9970–9983.
Figure 9. X-ray absorption data collected at RT on dehydrated CPO-27-Niafter interaction with NO. (a): k3-weighted �(k), scattered squares, comparedwith the best fit (full line). Part (b): corresponding FT in their modulus andimaginary part. Vertically translated is the contribution of the NO moleculeoptimized in the fits using the linear cluster (both modulus and imaginaryparts are reported).
Figure 10. Plot of the primary (solid symbols) and secondary (open symbols)excess volumetric isotherms obtained for NO adsorption on CPO-27-Ni at303 K as a function of the equilibrium pressure Pe. The molar NO amountsna have been normalized to the moles of Ni atoms present in the MOFsample, supposing all the Ni atoms available to the interaction with NO. Inthe inset, the corresponding calorimetric isotherms are also shown.
Figure 11. Dependence of the differential molar adsorption heat qdiff oncoverage for NO adsorption on CPO-27-Ni at 303 K (filled circles, firstadsorption run; open circles, second adsorption run). The molar NO amountsna have been normalized to the moles of Ni atoms present in the CPO-27-Ni sample, supposing all the Ni atoms available to the interaction with NO.
4967Chem. Mater., Vol. 20, No. 15, 2008Coordination of NO on CPO-27-Ni MOF

son between the adsorbed amounts in the first and in thesecond run evidence that the interaction of NO with the CPO-27-Ni surface is largely irreversible upon evacuation (72%at Pe ) 42 mbar) and that, at equilibrium pressures higherthan 7 mbar, the adsorption of NO generates only speciescharacterized by a lower adsorption heat and easily desorbedupon degassing. For what concerns the species formed atpressure lower than 1 mbar (NO/Ni e 0.86), an almostconstant differential adsorption heat is observed as expectedon qualitative speculations. The qdiff obtained in this first partof the isotherm (90-92 kJ/mol) matches perfectly with themicrocalorimetric study of NO adsorbed on microcrystallineNiO(001) by Escalona Platero et al.70 The quoted workreports a constant molar heat of adsorption of 81 kJ mol-1
in the 0 < θ < 0.2 coverage range, whereas at highercoverages, adsorbate-adsorbate interactions progressivelyreduce the molar heat of adsorption down to 69 kJ mol-1.This latter value is on the same order of magnitude of thatfound by Wichtendahl et al.80 for NO adsorption on avacuum-cleaved single-crystal NiO(100) surface (54.9 kJ/mol) using thermal desorption spectroscopy (TDS).
The 86% of the theoretical number of nickel atoms arethen actually available to interact with NO, see Figure 11.This can be due to a not perfect evacuation of all the H2Omolecules or to the fact that the material is not perfectlycrystalline. The quite good resistance to aging in air of CPO-27-Ni has been demonstrated in a previous work.28 This firstpart of the isotherm can be related to the formation of the1:1 Ni · · ·NO complexes, confirming what observed in FTIRand Raman studies, where these species were found to bestrongly adsorbed and partially irreversible at room temper-ature (see Figure S3 in the Supporting Information). Acomplete desorption of NO can be obtained with an outgas-sing at 400 K in dynamic vacuo.
5. Conclusions
Structural modifications occurred upon dehydration ofCPO-27-Ni give rise to substantial changes in all thespectroscopic features of this material and make it suitableto strongly bound simple molecules such as NO. A mildthermal treatment in vacuo at 393 K is sufficient to removecompletely all the water present in the cavities keeping itshigh crystallinity and low concentration of defects. Structuraldata coming from EXAFS measurements of both as preparedand dehydrated sample are in very good agreement with thoseobtained by powder X-Ray diffraction, if the average valuesfor Ni-O distances are considered. Even if the frameworksymmetry does not change (the crystal structure remains inspace group R3j),19 water removal produces deep modifica-tions in the optical spectra: a blue shift for all the components
and the appearance of a new band at 1780 nm, indicatingthe transformation of an octahedral six-coordinated Ni(II)into a five-coordinated Ni(II) species in a square-pyramidalgeometry. Raman modes result sensible to the degree ofhydration and in the dehydrated sample the intensity ratioamong all the components changes. This behavior confirmsthat the whole framework of CPO-27-Ni “breathes” whenwater is removed. The coordination vacancy generated uponwater elimination seems to be a very favorable site for NOadsorption as testified by all the results obtained from allthe spectroscopic data. The formation of strongly bondedNi(II) mononitrosyls has been documented by the appearanceofnewfeatures in theoptical spectra. In theDR-UV-vis-NIRspectrum, the most evident effect is the new strong band atabout 650 nm, assigned to a LMCT from NO to Ni(II),whereas the XANES profile shows a small increase in whiteline intensity, an intensity decrease in the 1sf 4pz electronictransition at 8339.7 eV, and a blue shift of the 1s f 3delectronic transition from 8332.9 to 8333.5 eV. Vibrationaldata exclude the formation of Ni(II) · · · NO bent adducts. Inboth IR and Raman, the appearance of a very strong andresistant band at 1847 cm-1 indicates the formation of linear/tilted Ni(II) · · ·NO species. EXAFS shows that NO becomesthe closer Ni ligand, located at 1.85-1.87 Å from the metal.The evolution with time of the calorimetric peak is typicalof an instantaneous, nonactivated, molecular adsorptionprocess. Both the primary and the secondary isotherms showa type I behavior in which the saturation is followed by apseudoplateau at higher pressure of NO with a maximumuptake of 15.5 mass% (6.1 mmol/g) corresponding to theformation of 95% of 1:1 complexes. The observed sharpuptake of NO at lower pressure indicates favorable sorptioninteractions between the CPO-27-Ni framework and NOmolecules. Comparison with data obtained previously onHKUST-132 (3 mmol/g) show the potentiality of this materialfor NO storage. The ability of H2O molecules to slowlydisplace NO from the Ni(II) sites makes this material apromising candidate for NO delivery inside biological tissues.
Acknowledgment. Adriano Zecchina and Laura Regli arekindly acknowledged for fruitful discussion. L. R. is alsoacknowledged for having contributed to the data. The authorsare indebted to Russell Morris for giving them access tounpublished results on CPO-27-Ni.33 The authors thankCompagnia di San Paolo for financial support. This work is apart of the STREP project MOFCAT Contract number: NMP4-CT-2006-033335.
Supporting Information Available: Electrostatic potentialsurface of CPO-27-Ni; Luminescence spectra of CPO-27-Ni incomparison with the luminescence spectrum of the pure ligand;infrared isotherm of adsorption and desorption of NO on CPO-27-Ni.This material is available free of charge via the Internet athttp://pubs.acs.org.
CM800686K(80) Wichtendahl, R.; Rodriguez-Rodrigo, M.; Hartel, U.; Kuhlenbeck, H.;
Freund, H. J. Surf. Sci. 1999, 423, 90–98.
4968 Chem. Mater., Vol. 20, No. 15, 2008 Bonino et al.


