Embed Size (px)
Citation preview
University of KentuckyUKnowledge
University of Kentucky Doctoral Dissertations Graduate School
2008
LOLINE ALKALOID BIOSYNTHESIS GENEEXPRESSION IN EPICHLOE ENDOPHYTESOF GRASSESDONG-XIU ZHANGUniversity of Kentucky, [email protected]
This Dissertation is brought to you for free and open access by the Graduate School at UKnowledge. It has been accepted for inclusion in University ofKentucky Doctoral Dissertations by an authorized administrator of UKnowledge. For more information, please contact [email protected].
Recommended CitationZHANG, DONG-XIU, "LOLINE ALKALOID BIOSYNTHESIS GENE EXPRESSION IN EPICHLOE ENDOPHYTES OFGRASSES" (2008). University of Kentucky Doctoral Dissertations. Paper 592.http://uknowledge.uky.edu/gradschool_diss/592
ABSTRACT OF DISSERTATION
DONG-XIU ZHANG
THE GRADUATE SCHOOL
UNIVERSITY OF KENTUCKY
2008
LOLINE ALKALOID BIOSYNTHESIS GENE EXPRESSION IN EPICHLOË
ENDOPHYTES OF GRASSES
ABSTRACT OF DISSERTATION
A dissertation submitted in partial fulfillment of the requirements for the degree of Doctor of Philosophy in the College of Agriculture
at the University of Kentucky
By Dong-Xiu Zhang
Lexington, Kentucky
Director: Dr. Christopher L. Schardl, Professor of Plant Pathology
Lexington, Kentucky
2008
Copyright © Dong-Xiu Zhang 2008
ABSTRACT OF DISSERTATION
LOLINE ALKALOID BIOSYNTHESIS GENE EXPRESSION IN EPICHLOË
ENDOPHYTES OF GRASSES
Loline alkaloids (LA) are secondary metabolites produced by Epichloë (anamorph, Neotyphodium) grass endophytes. They are toxic and deterrent to a broad range of herbivorous insects but not to livestock. This protective bioactivity has spurred considerable research into the LA biosynthetic pathway. LOL, the gene cluster containing nine genes, is required for LA biosynthesis. The regulation of LOL genes during LA production in culture and in symbio is of interest.
In this study, coordinate regulation between LOL gene expression and LA production level was investigated in both MM culture and symbiota. Results showed that expression of LOL genes in N. uncinatum MM culture were tightly correlated with each other (p < 0.0005), and all presented a significant temporal quadratic pattern during LA production. Gene expression started before LA were detectable, and increased while LA accumulated. The highest gene expression level was reached before the highest amounts of LA were detected, and gene expression level declined to a very low level after amounts of LA plateaued. Observations suggested that the hierarchical clusters based on the correlation coefficient could help to predict the roles of LOL genes in the LA pathway.
In symbiota, coordinate coregulation of LOL gene expression with LA was found in E. festucae-meadow fescue inflorescences and stromata, whereby lower LOL gene expression corresponded with the lower LA level in stromata. In N. uncinatum (or N. siegelii)-meadow fescue vegetative tissues, dramatically higher LA levels were found in younger leaf tissue than in older leaf tissue, yet no evidence was found to relate this difference to LOL gene expression differences. Instead, substrate availability may regulate the LA level. In particular, asparagine was more than 10-fold higher in young leaf tissue than in old tissue, although proline was significantly lower in young tissue. Therefore, different regulatory mechanisms underlie LOL gene expression and LA production in different circumstances.
The GUS activity of Pro-lolC2-GUS and Pro-lolA2-GUS in Neotyphodium species was almost undetectable in culture, though the activity could be detected in symbiota. The mRNA of GUS did not exhibit the same pattern as lolC2 or lolA2 in
culture during LA production time course. A Pro-lolC2-cre transgene was expressed in complex medium, in which lolC2 mRNA was not detectable. These results suggest that proper regulation of LOL genes in culture or symbiota is dependent on the LOL cluster.
Keywords: Loline alkaloid, Epichloë, endophyte, gene expression, biosynthesis.
Dong-Xiu Zhang ____________________________________
Student’s Signature 1-23-2008
____________________________________ Date
LOLINE ALKALOID BIOSYNTHESIS GENE EXPRESSION IN EPICHOLOË
ENDOPHYTES OF GRASSES
By
Dong-Xiu Zhang
Christopher L. Schardl
Director of Dissertation
Lisa Vaillancourt
Director of Graduate Studies
1-23-2008

RULES FOR THE USE OF DISSERTATIONS
Unpublished dissertations submitted for the Doctors degree and deposited in the University of Kentucky Library are as a rule open for inspection, but are to be used only with due regard to the rights of the authors. Bibliographical references may be noted, but quotations or summaries of parts may be published only with permission of the author, and with the usual scholarly acknowledgments. Extensive copying or publication of the dissertation in whole or in part also requires the consent of the Dean of the Graduate School of the University of Kentucky. A library that borrows this dissertation for use by its patrons is expected to secure the signature of each user. Name Date
________________________________________________________________________
________________________________________________________________________
________________________________________________________________________
________________________________________________________________________
________________________________________________________________________
________________________________________________________________________
________________________________________________________________________
________________________________________________________________________
________________________________________________________________________
DISSERTATION
Dong-Xiu Zhang
The Graduate School
University of Kentucky
2008
LOLINE ALKALOID BIOSYNTHESIS GENE EXPRESSION IN EPICHLOË
ENDOPHYTES OF GRASSES
DISSERTATION
A dissertation submitted in partial fulfillment of the requirements for the degree of Doctor of Philosophy in the College of Agriculture
at the University of Kentucky
By Dong-Xiu Zhang
Lexington, Kentucky
Director: Dr. Christopher L. Schardl, Professor of Plant Pathology
Lexington, Kentucky
2008
Copyright by Dong-Xiu Zhang 2008

iii
ACKNOWLEDGEMENTS
First of all, I would like to express my sincere appreciation to my supervisor,
Christopher Schardl. It has been a wonderful experience and immeasurable benefit for me
to approach my goal with his tremendous time and efforts, constant guidance and
encouragement, appropriate motivation and debates, serious research attitude and friendly
communication style. I would like to present my deep gratitude to my committee
members Daniel Panaccione (West Virginia University), Peter Mirabito (Department of
Biology, University of Kentucky), Lisa Vaillancourt, and Michael Goodin for their
encouragement, suggestions, and support. I also want to thank my defense outside
examiner Bruce Downie (Horticulture Department, University of Kentucky) for his
valuable corrections and suggestions on my dissertation.
I would like to thank Arny Stromberg (Statistics Department, University of
Kentucky) for his guidance in statistical analysis, Timothy Phillips (Plant and Soil
Sciences Department, University of Kentucky) for his hard work collecting the field grass
samples for me, Padmaja Nagbhyru for her work on amino acid analysis, Louis Hersh
(Molecular and Cellular Biochemistry Department) and his lab members for training and
accommodating me to use their facilities, the greenhouse manager Jack Brown for
maintenance of my plants, Randy Dinkins (U.S.D.A. Agricultural Research Service) for
his patience and time in teaching me to set up RT-qPCR, Kuey-Chu Chen (Pharmacology
Department) for her valuable suggestions in RT-qPCR analysis, Mark Farman for his
very helpful insight on southern blot, undergraduate student Emily Gay for her hard labor
on my project during two summers, and Lowell Bush (Plant and Soil Sciences
Department) and his lab members for letting me use their facilities.
I also sincerely thank Walter Hollin for his constant support as lab manager, and I
appreciate all the help from the Dr. Schardl’s other lab members including previous
postdoc fellows Jimmy Blankenship and Caroline Machado, also for their enthusiasm and
friendship to make me feel very relaxed, focused, and happy working in the lab.

iv
I would like to personally thank Martin Spiering for his persistent, tremendous,
strong spiritual encouragement, support, and inspiration. I would like to express my deep
love and gratitude to my sweet daughter Shuqing Zhao (Qingqing) for her remarkable
understanding to my life, humorous guidance to my study, and immense sacrifices during
all the time when I have been so far away. Qinging, without your healthy growth,
delightful voice and laughter on the phone, and your excellent record in school, Mom
couldn’t have gained the strength to get to this stage; Mom has felt so proud of you that
you never let me feel guilty of being away. I really appreciate with heart and soul
Qingqing’s great father, Weimin Zhao, for his love, trust, support, and all the sacrifices,
and for taking over all the duties bringing up Qingqing alone. I cannot help my grateful
tears to thank my beloved parents, the most wonderful parents in the world, for their
unselfish, optimistic, persistent, and supportive spirit encouraging all their four children
to pursue dreams with full freedom, especially for supporting me and giving up their last
chance for a closer company no matter how lonely they have been in homeland. Many
deep thanks also go to my other family members for their great constant practical and
spiritual support and encouragement.
Finally I would like to thank AGTC people and all the other members in the
Department of Plant Pathology for the various direct or indirect support, help, and
encouragement.
v
TABLE OF CONTENTS
ACKNOWLEDGEMENTS ....................................................................................................... iii
TABLE OF CONTENTS............................................................................................................ v
LIST OF TABLES .................................................................................................................... ix
LIST OF FIGURES .................................................................................................................. xi
LIST OF FILES ..................................................................................................................... xvi
CHAPTER 1: INTRODUCTION
Bioactivity, Extraction, Structure, and Biosynthesis of Loline Alkaloids ......................... 1 Insecticidal activity ...................................................................................................... 1 Biosynthetic precursors and intermediates & discovery of LOL genes ...................... 2 Proposed biosynthetic pathway ................................................................................. 4
LOL gene expression and LA production......................................................................... 6 Coregulation of clustered genes involved in secondary metabolite pathways .......... 6 Observations of LOL genes coordinately regulated with LA production .................... 7
CHAPTER 2: COREGULATED LOL GENE EXPRESSION AND LA PRODUCTION IN NEOTYPHODIUM UNCINATUM CULTURE
INTRODUCTION ................................................................................................................. 12
MATERIALS AND METHODS .............................................................................................. 15 Fungal culture ............................................................................................................... 15 Sampling of fungal cultures .......................................................................................... 15 Loline alkaloid extraction .............................................................................................. 16 RNA extraction and quantitation .................................................................................. 16 TaqMan primer and probe design ................................................................................ 17 Real‐time quantitative PCR (RT‐qPCR) .......................................................................... 19 Relative comparative Ct (ΔΔCt) Method ...................................................................... 19 Estimation of RT‐qPCR error due to differences between target gene and normalizing gene amplification efficiency ........................................................................................ 20 Statistical analysis ......................................................................................................... 23 Transcription factor‐binding site quest in LOL gene promoters ................................... 24
RESULTS............................................................................................................................. 26 N. uncinatum LA production and RNA quantification .................................................. 26 Gene expression profiles .............................................................................................. 26 Gene expression correlations ....................................................................................... 28 Transcription factor binding sites in LOL promoters .................................................... 29
vi
DISCUSSION ....................................................................................................................... 31
CHAPTER 3: GUS REPORTER GENE EXPRESSION DRIVEN BY LOL GENE PROMOTERS IN NEOTYPHODIUM SPECIES
INTRODUCTION ................................................................................................................. 95
MATERIALS AND METHODS ............................................................................................. 99 Construction of Pro‐lolC2‐GUS, Pro‐lolA2‐GUS, Pro‐tubB‐GUS vectors ....................... 99 Insert fragment preparation ..................................................................................... 99 Vector pCB1004 preparation .................................................................................. 100 DNA cloning ............................................................................................................. 100 Screening and sequencing constructs .................................................................... 101
Transformation of N. uncinatum, N. coenophialum, and Lp1 .................................... 101 Screening transformants and checking copy number ................................................ 102 Southern blot test for GUS gene with tefA gene as a control ................................ 103 DNA blot membrane and probe preparation ..................................................... 103 Hybridization and membrane wash .................................................................... 104
GUS activity qualitative assay ..................................................................................... 104 GUS activity and mRNA quantitative assays for N. uncinatum transformants .......... 105 N. uncinatum transformants preparation .............................................................. 105 GUS protein activity quantitative assay .................................................................. 105 RT‐qPCR of GUS, lolC2, and lolA2 gene expression assay ....................................... 106
Inoculation of transformants to grasses ..................................................................... 106 Microscopic Imagene Green fluorescence assay of GUS transformants in planta ... 107
RESULTS........................................................................................................................... 108 Transformation of promoter‐GUS fusion constructs into N. uncinatum, N. coenophialum, and Lp1 ............................................................................................... 108 GUS qualitative X‐Gluc assay ...................................................................................... 109 GUS protein quantitative MUG assay ......................................................................... 109 GUS, lolC2, and lolA2 gene expression quantitative assay by RT‐qPCR .................... 111 Inoculation of transformants to grass seedlings and infection check ........................ 112 Microscopy check of GUS expression in planta .......................................................... 112
DISCUSSION ..................................................................................................................... 113
CHAPTER 4: VECTOR CONSTRUCTION FOR SELECTION OF FUNGAL TRANSFORMANTS FOLLOWED BY SELECTIVE MARKER DELETION
INTRODUCTION ............................................................................................................... 137
MATERIALS AND METHODS ............................................................................................ 139 Enzymes, primers, DNA quantification, and thermocycler machine .......................... 139
vii
Bacterial transformation by electroporation .............................................................. 139 Fungal DNA extraction ................................................................................................ 139 Construction of phleomycin resistance vector pKAES183 .......................................... 140 Three different Pro‐lolC2‐cre fragments and Pro‐dmaW2‐cre fragment cloned into pKAES183 .................................................................................................................... 140 Fungal species for transformation .............................................................................. 142 Plate preparation for transformation ......................................................................... 143 Fungal transformation ................................................................................................ 143 Screening transformants by PCR ................................................................................ 144 Screening for hph, ble, and cre loop‐outs ................................................................... 145 Inoculation of hph loop‐out transformant to meadow fescue ................................... 146
RESULTS........................................................................................................................... 147 Cre expression in bacterial cloning ............................................................................. 147 Phleomycin concentration for transformant selection .............................................. 147 Inoculation transformants to meadow fescue ........................................................... 148 PCR check for hph, cre, and ble loop‐outs .................................................................. 148 Amplification of the whole loxP‐cre‐ble‐loxP fragment ............................................. 149
DISCUSSION ..................................................................................................................... 150
CHAPTER 5: ANALYSIS OF LOL GENE EXPRESSION IN PLANTA
INTRODUCTION ............................................................................................................... 163
MATERIALS AND METHODS ............................................................................................ 166 Symbiotum material collection ................................................................................... 166 RNA extraction and quantification, LA extraction and quantitation .......................... 167 Taqman primer and probe design .............................................................................. 167 RT‐qPCR and relative comparative Ct (ΔΔCt) method ................................................ 168 Water content measurement ..................................................................................... 168 Amino acid analysis in planta by HPLC ....................................................................... 168
RESULTS........................................................................................................................... 170 Amplification efficiencies of RT‐qPCR for genes from different symbiotum RNA samples ....................................................................................................................... 170 LA and gene expression in N. coenophialum‐tall fescue inflorescence developmental stages .......................................................................................................................... 170 LA and gene expression in E. festucae‐meadow fescue inflorescences and stromata..................................................................................................................................... 171 LA and gene expression in symbiotum 955 (N. siegelii‐meadow fescue) .................. 171 In upper regrowth parts and basal parts after clipping .......................................... 171 In outer and center leaf blades without clipping treatment ................................172 Overall analysis in different tissues and treatments .............................................. 173
viii
LA and gene expression in symbiotum 4002 (N. uncinatum‐meadow fescue) .......... 174 Fungal biomass estimation by comparison of housekeeping gene (tefA and tubB) expression levels in symbiota tissues with dramatic LA differences .......................... 175 Water content in uncut control upper part tissues .................................................... 176 Amino acids in re‐growth part and uncut control upper part from 955 .................... 177
DISCUSSION ..................................................................................................................... 178
CHAPTER 6: CONCLUSTIONS AND DISCUSSION .............................................................. 211
REFERENCES .................................................................................................................... 214
VITA ................................................................................................................................. 220
ix
LIST OF TABLES
Table 2.1 Primer and probe sequences for RT‐qPCR. ....................................................... 34
Table 2.2. Slope and R2 of gene standard curves, and variance range from triplicate runs
in TaqMan one‐step reverse transcription real‐time quantitative PCR (RT‐qPCR)
of WT N. uncinatum MM culture RNA samples. ................................................ 36
Table 2.3. Gene expression 2‐ΔΔCT values* from WT N. uncinatum MM culture. ............. 37
Table 2.4. Gene expression 2‐ΔΔCT values* from N. uncinatum Pro‐lolA2‐GUS
transformant† (188b6N) MM culture. ............................................................... 38
Table 2.5. Parameters from “gene fit to day” analysis of gene temporal expression
pattern. .............................................................................................................. 39
Table 2.6. Gene expression correlations from WT N. uncinatum MM culture determined
by JMP multivariate analysis. ............................................................................. 40
Table 2.7. Pairwise correlations of gene expression from WT N. uncinatum MM culture
by JMP multivariate analysis, showing correlation values, p values, and plots of
correlation value ................................................................................................ 41
Table 2.8. Gene expression correlations from N. uncinatum Pro‐lolA2‐GUS transformant
(188b6N) in MM culture determined by JMP multivariate analysis. ................ 43
Table 2.9. Pairwise correlations of gene expression from N. uncinatum Pro‐lolA2‐GUS
transformant (188b6N) MM culture by JMP multivariate analysis, showing
correlation values, p values, and plots of correlation value .............................. 44
Table 2.10. Transcription factor‐binding sites in lolC2 promoter region identified by
Match search. .................................................................................................... 46
Table 2.11. Transcription factor‐binding sites in the lolD2 promoter region identified by
Match search ..................................................................................................... 47
Table 2.12. Transcription factor‐binding sites in shared promoter region of lolA2 and
lolO2 genes identified by Match search ............................................................ 48
x
Table 2.13 Transcription factor‐binding sites in shared promoter region of lolU2 and
lolP2 genes identified by Match search ............................................................. 49
Table 2.14. Transcription factor‐binding sites in shared promoter region of lolT2 and
lolE2 genes identified by Match search ............................................................. 50
Table 2.15. Summary results of transcription factor‐binding sites in five promoter
regions in N. uncinatum LOL2 cluster identified in Match search. .................... 51
Table 2.16. Match search results for transcription factor‐binding sites in the high‐
identity regions among putative LOL2 gene promoters. ................................... 52
Table 3.1 Primer sequences. ........................................................................................... 116
Table 3.2 Promoter‐reporter gene constructs, fungal species transformed, and
transformant designations. ............................................................................. 117
Table 3.3 Summary of Southern blot and PCR analysis results for N. uncinatum
transformants. ................................................................................................. 118
Table 3.4 Results of inoculation of transformants to grass seedlings. ........................... 119
Table 4.1 Primer sequences ............................................................................................ 152
Table 5.1 Plant (955 and 4002) treatment and tissues sampled, by day. ...................... 183
Table 5.2 Primer and probe sequences .......................................................................... 184
Table 5.3 Gene standard curve slope and R2. ................................................................ 185
Table 5.4 p values from Student’s t‐test for LA in different tissues and treatments of N.
siegelii‐meadow fescue symbiotum 955. ........................................................ 186
Table 5.5 p values from Student’s t‐test for gene expression in different tissues and
treatments of N. siegelii‐meadow fescue symbiotum 955. ............................ 186
Table 5.6 p values from Student’s t‐test for gene expression in different tissues and
treatments of N. uncinatum‐meadow fescue symbiotum 4002. .................... 187
Table 5.7 p values from Student’s t‐test for LA in different tissues and treatments of N.
uncinatum‐meadow fescue symbiotum 4002. ................................................ 187
Table 5.8 Amino acid and LA amounts in upper regrowth parts (post clipping) and upper
parts (prior to clipping) of N. siegelii‐meadow fescue symbiotum 955. ......... 188
xi
LIST OF FIGURES
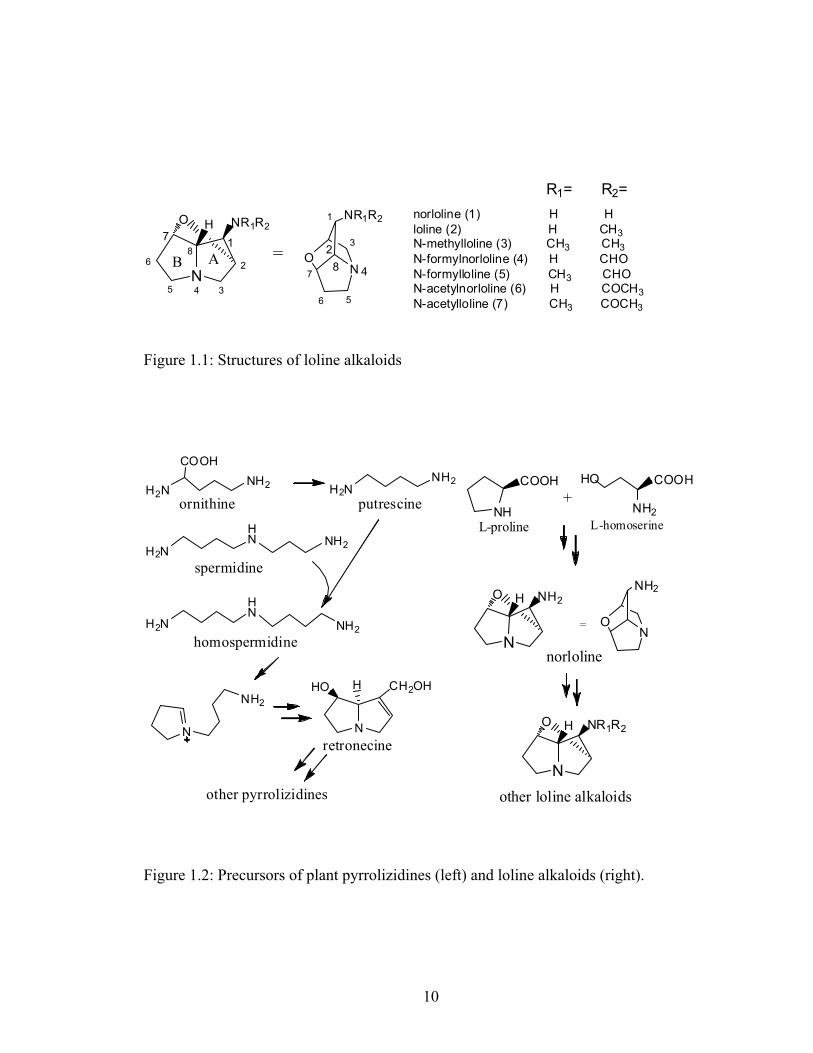
Figure 1.1: Structures of loline alkaloids........................................................................... 10
Figure 1.2: Precursors of plant pyrrolizidines (left) and loline alkaloids (right). .............. 10
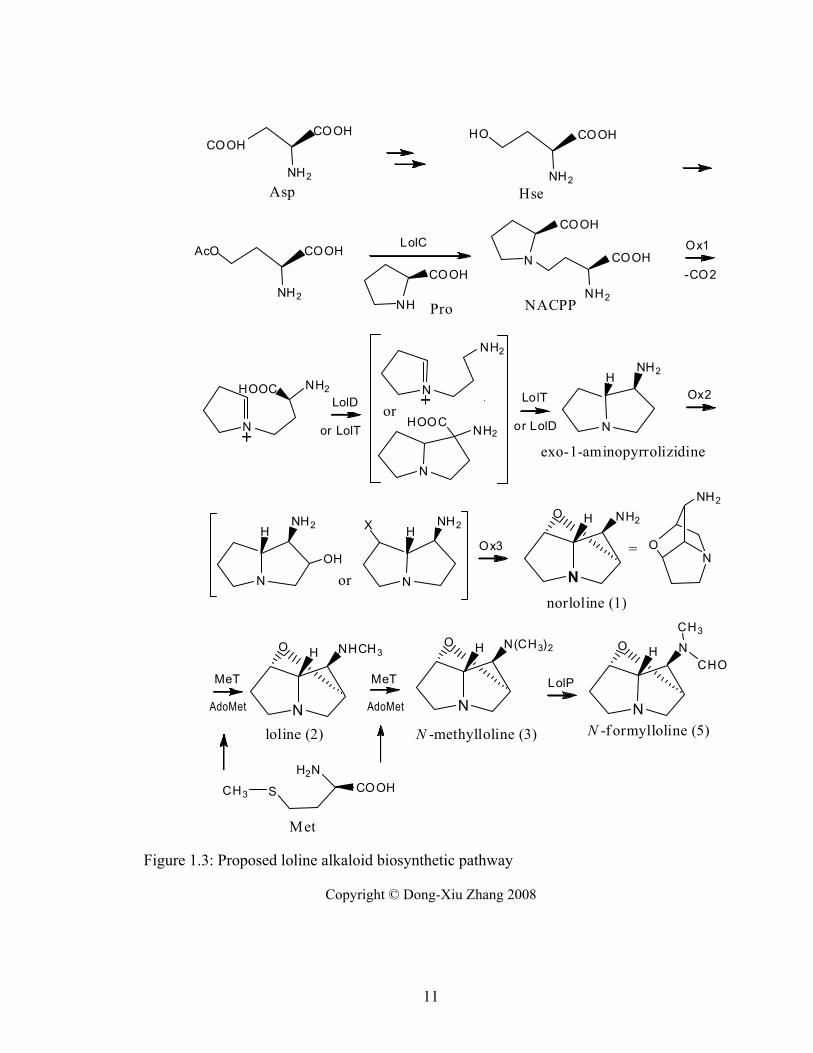
Figure 1.3: Proposed loline alkaloid biosynthetic pathway .............................................. 11
Figure 2.1. LA production in WT N. uncinatum MM culture. ........................................... 53
Figure 2.2. LA production from N. uncinatum Pro‐lolA2‐GUS transformant (188b6N) in
MM culture. .......................................................................................................... 53
Figure 2.3. A representative gel of RNA electrophoresed in 1% agarose. ....................... 54
Figure 2.4. RNA quantification standard curve generated from fluorescence readings of
serial dilutions of RNA standard on Gemini XS. .................................................... 54
Figure 2.5. Time course of gene expression in WT N. uncinatum MM culture. ............... 55
Figure 2.6. Time course of gene expression in N. uncinatum Pro‐lolA2‐GUS transformant
(188b6N) in MM culture ....................................................................................... 56
Figure 2.7A‐M. JMP bivariate analysis of gene temporal expression quadratic function
pattern for WT N. uncinatum in MM culture. ...................................................... 57
Figure 2.8 A‐N. JMP bivariate analysis of gene temporal expression quadratic function
for N. uncinatum Pro‐lolA2‐GUS transformant (188b6N) in MM culture. ........... 70
Figure 2.9 Scatterplot matrix of multivariate analysis by JMP, showing correlation values
of gene expression from WT N. uncinatum MM culture. ..................................... 84
Figure 2.10 Dendrogram of hierarchical clustering by Ward method (non‐standardized),
implemented in JMP, showing gene expression correlation distances of tested
genes from WT N. uncinatum MM culture. .......................................................... 85
Figure 2.11 Dendrogram of hierarchical clustering by Ward non‐standardized method
implemented in JMP, showing gene expression correlation distances of tested
genes from N. uncinatum Pro‐lolA2‐GUS transformant (188b6N) in MM culture.
............................................................................................................................... 86
Figure 2.12 Dendrogram of hierarchical clustering by Ward (non‐standardized) method
implemented in JMP. Gene expression correlation distances of tested genes from
xii
combined data from both WT N. uncinatum and N. uncinatum Pro‐lolA2‐GUS
transformant (188b6N) in MM culture. ................................................................ 87
Figure 2.13. Transcription factor binding sites in lolC2 promoter region identified by
Match search. ....................................................................................................... 88
Figure 2.14. Transcription factor binding sites in lolD2 promoter region identified by
Match search. ....................................................................................................... 89
Figure 2.15. Transcription factor binding sites in shared promoter region of lolA2 and
lolO2 genes identified by Match search ............................................................... 90
Figure 2.16. Transcription factor binding sites in shared promoter region of lolU2 and
lolP2 genes identified by Match search ................................................................ 91
Figure 2.17. Transcription factor binding sites in shared promoter region of lolT2 and
lolU2 genes identified by Match search ............................................................... 92
Figure 2.18A. Visual comparison in Artemis Comparison Tool (ACT Release 6) ............. 93
Figure 2.18B. Magnified view of Figure 2.18A ................................................................. 94
Figure 3.1 Plasmid map of pKAES187 ............................................................................. 120
Figure 3.2 Plasmid map of pKAES188 ............................................................................. 121
Figure 3.3 Plasmid map of pKAES189 ............................................................................. 122
Figure 3.4 PCR confirmation of transformants ............................................................... 123
Figure 3.5 GUS‐X‐Gluc qualitative assay on solid medium plates. ................................. 124
Figure 3.6 Southern blot analysis of XbaI and XhoI digested DNA from N. uncinatum
transformants. .................................................................................................... 125
Figure 3.7 Standard curve of Quant‐it protein assay readings from Gemini XS. ............ 126
Figure 3.8 MU standard curve from fluorescence readings from Gemini XS. ................ 126
Figure 3.9 LA production from N. uncinatum transformants used for GUS activity (MU)
assay. ................................................................................................................... 127
Figure 3.10 GUS protein activity expressed as MU (nmol/µg protein), from 10
transformants of 187b (Pro‐lolC2‐GUS in N. uncinatum) in MM culture compared
with WT N. uncinatum and GUS positive expression control transformant
189b2N (Pro‐tubB‐GUS in N. uncinatum) ........................................................... 128
xiii
Figure 3.11 GUS protein activity expressed as MU (nmol/µg protein), from 10
transformants of 188b (Pro‐lolA2‐GUS in N. uncinatum) compared with WT N.
uncinatum and GUS positive expression control transformant 189b2N (Pro‐tubB‐
GUS in N. uncinatum) .......................................................................................... 129
Figure 3.12 Average of LA production and GUS activity (nmol MU/µg protein) from
duplicate cultures. .............................................................................................. 130
Figure 3.13 Transformant 187b1N LA production, lolC2 and GUS gene expression. ..... 131
Figure 3.14 Transformant 187b10N LA production, lolC2, lolA2, lolD2, and GUS gene
expression. .......................................................................................................... 132
Figure 3.15 Transformant 188b3N LA production, lolA2 and GUS gene expression. ..... 133
Figure 3.16 Transformant 188b6N LA production, lolA2 and GUS gene expression. .... 134
Figure 3.17 Comparison of GUS gene expression level from 188b6N and 189b2N by RT‐
qPCR .................................................................................................................... 135
Figure 3.18 Imagene Green fluorescence of GUS expression in tall fescue leaf blade. . 136
Figure 4.1 Plasmid map of pKAES183 ............................................................................. 154
Figure 4.2 Overlapping PCR of Pro‐lolC2 and cre ........................................................... 155
Figure 4.3 Plasmid map of pKAES186 ............................................................................. 156
Figure 4.4 Fragment loxP‐hph‐loxP map in lolP1ko. ....................................................... 157
Figure 4.5 PCR screening for creblelox transformants in N. uncinatum lolP1ko and
lolP1ec. ................................................................................................................ 158
Figure 4.6 XbaI and NcoI digestion for potential creblelox clones. ................................ 159
Figure 4.8 PCR for hph loop‐out (A) and cre gene (B) check for the transformants from
PDA, RE medium, or symbiotum. ........................................................................ 161
Figure 4.9 Assay for the intact loxP‐cre‐ble‐loxP fragment in pKAES186 transformants by
PCR with primers outloxp1fwd and outloxP2rev. .............................................. 162
Figure 5.1 Tissues clipped and sampled from endophyte‐meadow fescue symbiota. .. 189
Figure 5.2 Amplification plots of the genes without standard curve runs from the
symbiotum RNA samples. ................................................................................... 190
xiv
Figure 5.3 Gene expression (top) and LA concentration (bottom) from N. coenophialum‐
tall fescue developmental stages of the inflorescence heads ............................ 193
Figure 5.4 Gene expression (top) and LA amount (bottom) from E. festucae‐meadow
fescue inflorescences and stromata. .................................................................. 194
Figure 5.5 Gene expression from 955 (N. siegelii‐meadow fescue) basal and upper
regrowth parts post clipping (PC) or unclipped controls (uncut) ....................... 195
Figure 5.6 LA in different tissues and treatments of N. siegelii‐meadow fescue
symbiotum 955: top, basal part post clipping (PC); middle, regrowth part post
clipping (PC); bottom, total amount in each plant ............................................ 196
Figure 5.7 Gene expression from N. siegelii‐meadow fescue symbiotum 955 upper part:
outer and center leaf blade prior to clipping ...................................................... 197
Figure 5.8 LA in N.siegelii‐meadow fescue symbiotum 955, upper parts: outer and center
leaf blade prior to clipping. ................................................................................. 199
Figure 5.9 Average levels of LA from different tissues and treatments of N. siegelii‐
meadow fescue symbiotum 955. PC, post clipping ............................................ 199
Figure 5.10 LA in N. uncinatum‐meadow fescue symbiotum 4002 basal part post clipping
(PC) (top), upper regrowth part (middle), and total amount in each plant
(bottom). ............................................................................................................. 200
Figure 5.11 Gene expression in N. uncinatum‐meadow fescue symbiotum 4002 upper
regrowth part PC. ................................................................................................ 201
Figure 5.12 Gene expression in N. uncinatum‐meadow fescue symbiotum 4002 upper
parts: outer and center leaf blade prior clipping ................................................ 202
Figure 5.13 LA in N. uncinatum‐meadow fescue symbiotum 4002 upper parts: outer and
center leaf blade prior to clipping. ..................................................................... 204
Figure 5.14 Average levels of LA in different tissues and treatments of N. uncinatum‐
meadow fescue symbiotum 4002 ....................................................................... 204
Figure 5.15 Fungal housekeeping gene tefA and tubB expression in regrowth upper part
normalized with plant EF1‐α and tub2 genes in N. siegelii‐meadow fescue
symbiotum 955. .................................................................................................. 205
xv
Figure 5.16 Fungal tefA and tubB gene expression normalized with plant EF1‐α and tub2
genes for outer and center leaf blades in N. siegelii‐meadow fescue symbiotum
955 ...................................................................................................................... 206
Figure 5.17 Fungal tefA and tubB gene expression normalized with plant EF1‐α and tub2
genes for outer and center leaf blades in N. uncinatum‐meadow fescue
symbiotum 4002 ................................................................................................. 207
Figure 5.18 Dry and fresh tissue weight ratio from N. uncinatum‐meadow fescue
symbiotum 4002 upper parts: outer and center leaf blades. ............................. 208
Figure 5.19 Dry and fresh tissue weight ratio from N. siegelii‐meadow fescue symbiotum
955 upper parts: outer and center leaf blades. .................................................. 209
Figure 5.20 Average levels of amino acids from symbiotum 955 upper regrowth part 3
day post clipping (PC) (plant No.3 and 4) and uncut control plant upper part prior
to clipping (plant No.1 and 2). ............................................................................ 210

xvi
LIST OF FILES
DX_Zhang_2008.pdf……………………………………………….……….6.1 megabytes
1
CHAPTER 1
Introduction
Bioactivity, Extraction, Structure, and Biosynthesis of Loline Alkaloids
Insecticidal activity
Loline alkaloids (LA) are the secondary metabolites first reported from the study
of the plant Lolium temulentum L. (Hofmeister 1892), a species that typically bears the
endophyte Neotyphodium occultans (Moon et al 2000). Since then, lolines have been
found in a broad range of genera and tribes of endophyte-infected cool-season grasses
(Siegel et al 1990; Tepaske, Powell et al. 1993; Spiering, Moon et al. 2005). To date,
there is no evidence that lolines are involved in livestock toxicosis. However, they are
feeding deterrent and potent insecticides against a broad range of insects, including large
milkweed bug (Oncopeltus faciatus; Hemiptera) (Yates 1989), Japanese beetle (Popilla
japonica, Coleoptera) (Patterson 1991), European corn borer (Ostrinia nubilalis;
Lepidoptera), fall armyworm (Spodoptera frugiperda; Lepidoptera), bird cherry oat aphid
(Rhopalosiphum padi; Homoptera), and greenbug aphid (Schizapus graminum) (Riedell
et al 1991; Wilkinson et al 2000). A recent review by (Schardl et al 2007) presents a
detailed view on the history of LA and their biological activities. Because of their
bioprotective activities against insects, LA have attracted great interest, and have been
patented (U.S. patent number 7183098), as natural plant protectants.
Since loline molecules are small, highly water-soluble, and mobile in the plant,
they can even be found in roots despite the inability of the endophyte to grow in that
tissue. For many decades it remained undetermined whether the grass or the endophyte
was the loline producer. Recently, minimal medium (MM) culture conditions have been
found to induce loline production in Neotyphodium uncinatum cultures, which indicates
that the endophyte is the sole loline-producing symbiont (Blankenship et al 2001).
Several species in two related genera, Neotyphodium (asexual) and Epichloë (sexual),
produce LA when symbiotic with grass hosts (Schardl et al 2007). These fungal species
belong to family Clavicipitaceae, order Hypocreales in the phylum Ascomycota.
2
Biosynthetic precursors and intermediates & discovery of LOL genes
Lolines are saturated exo-1-aminopyrrolizidines with an ether bridge between C-2
and C-7 linking the bridgeheads of the two pyrrolizidine rings (Bush et al 1993; Schardl
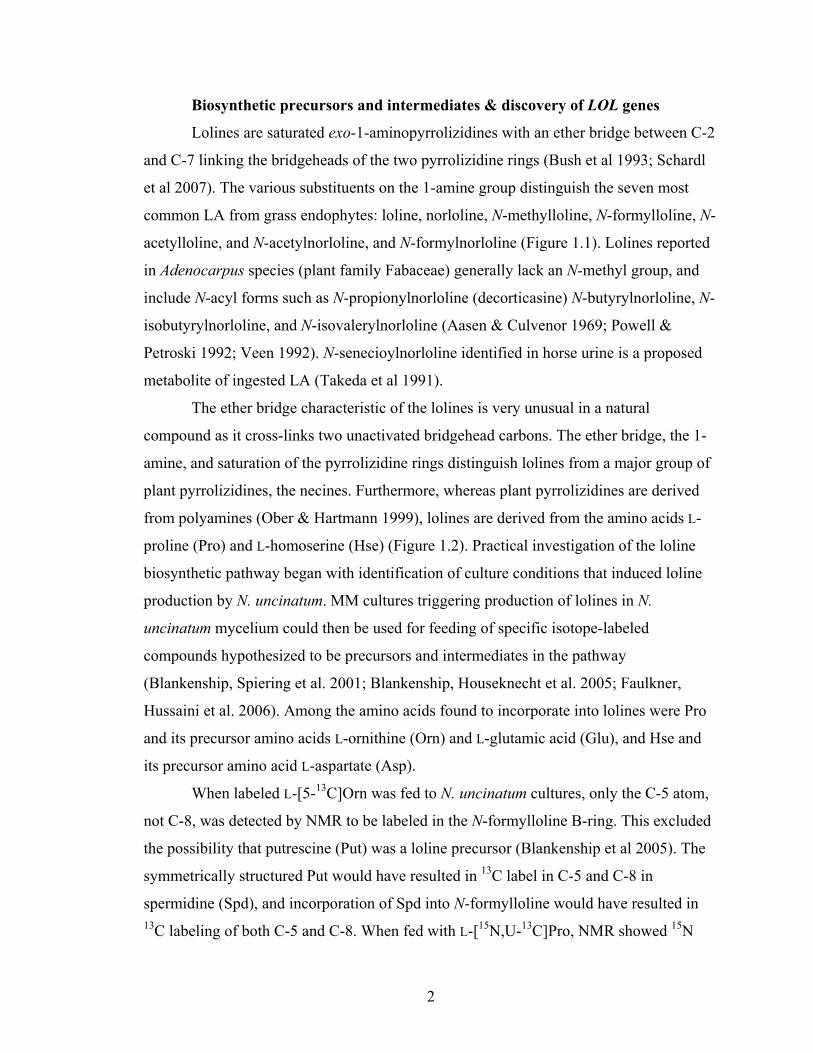
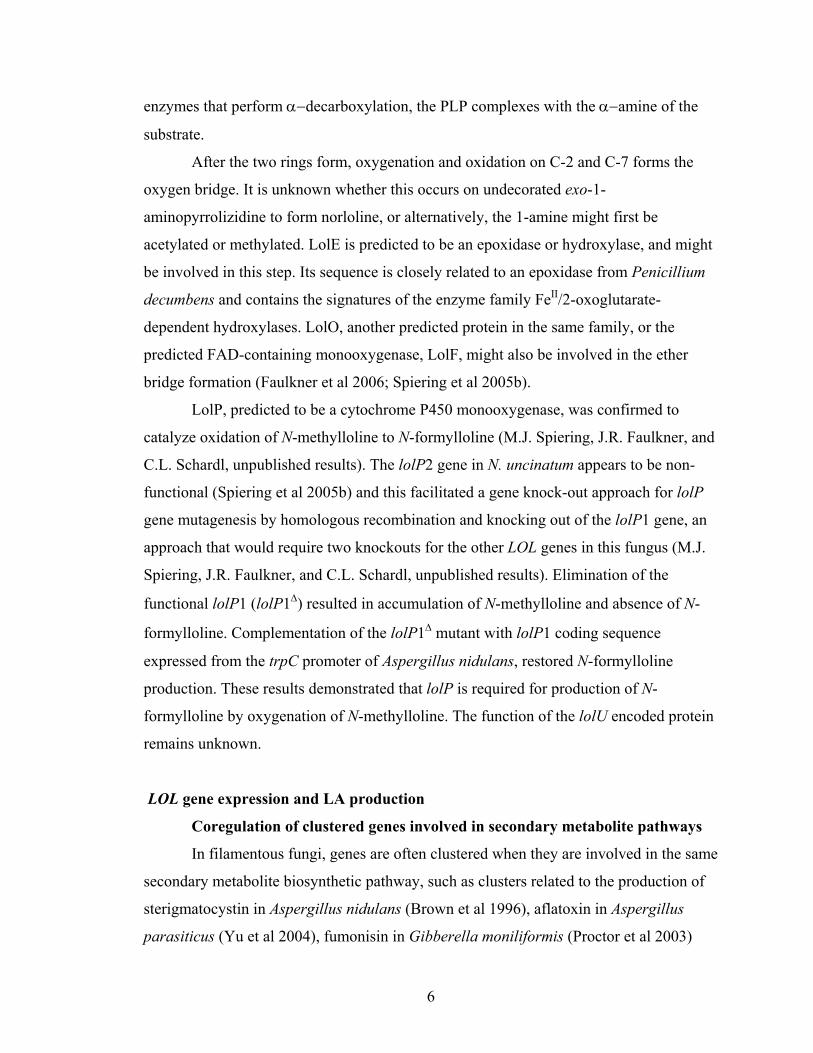
et al 2007). The various substituents on the 1-amine group distinguish the seven most
common LA from grass endophytes: loline, norloline, N-methylloline, N-formylloline, N-
acetylloline, and N-acetylnorloline, and N-formylnorloline (Figure 1.1). Lolines reported
in Adenocarpus species (plant family Fabaceae) generally lack an N-methyl group, and
include N-acyl forms such as N-propionylnorloline (decorticasine) N-butyrylnorloline, N-
isobutyrylnorloline, and N-isovalerylnorloline (Aasen & Culvenor 1969; Powell &
Petroski 1992; Veen 1992). N-senecioylnorloline identified in horse urine is a proposed
metabolite of ingested LA (Takeda et al 1991).
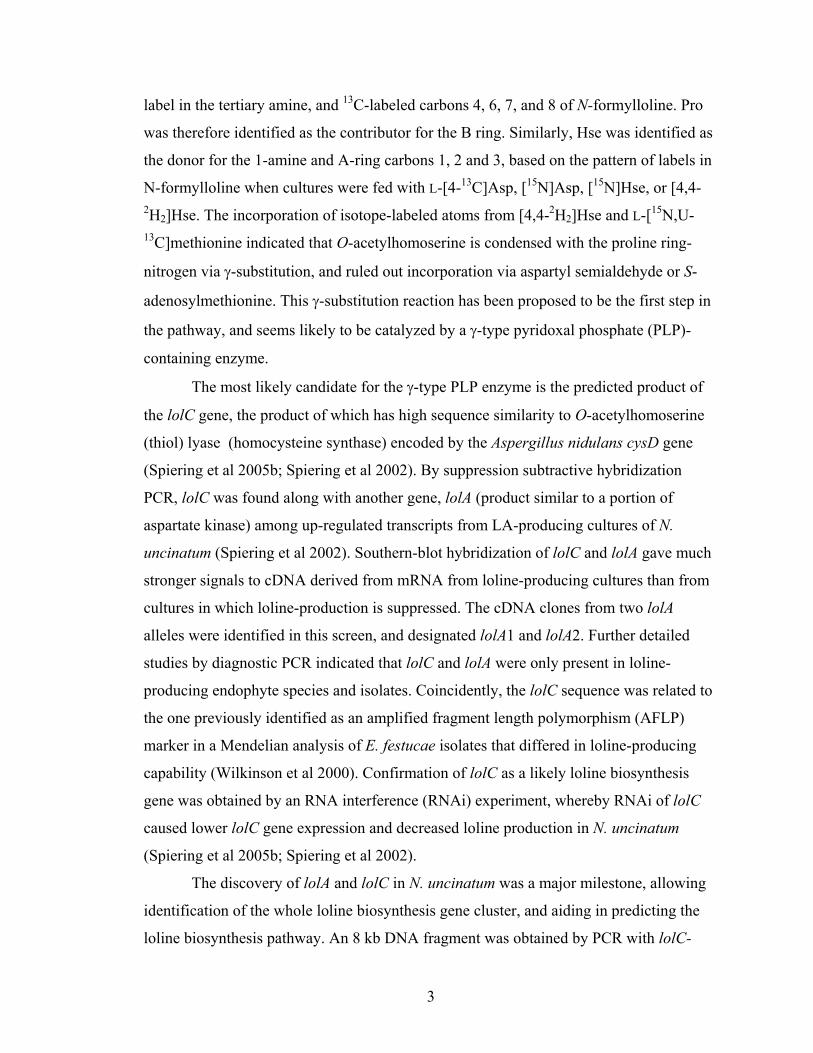
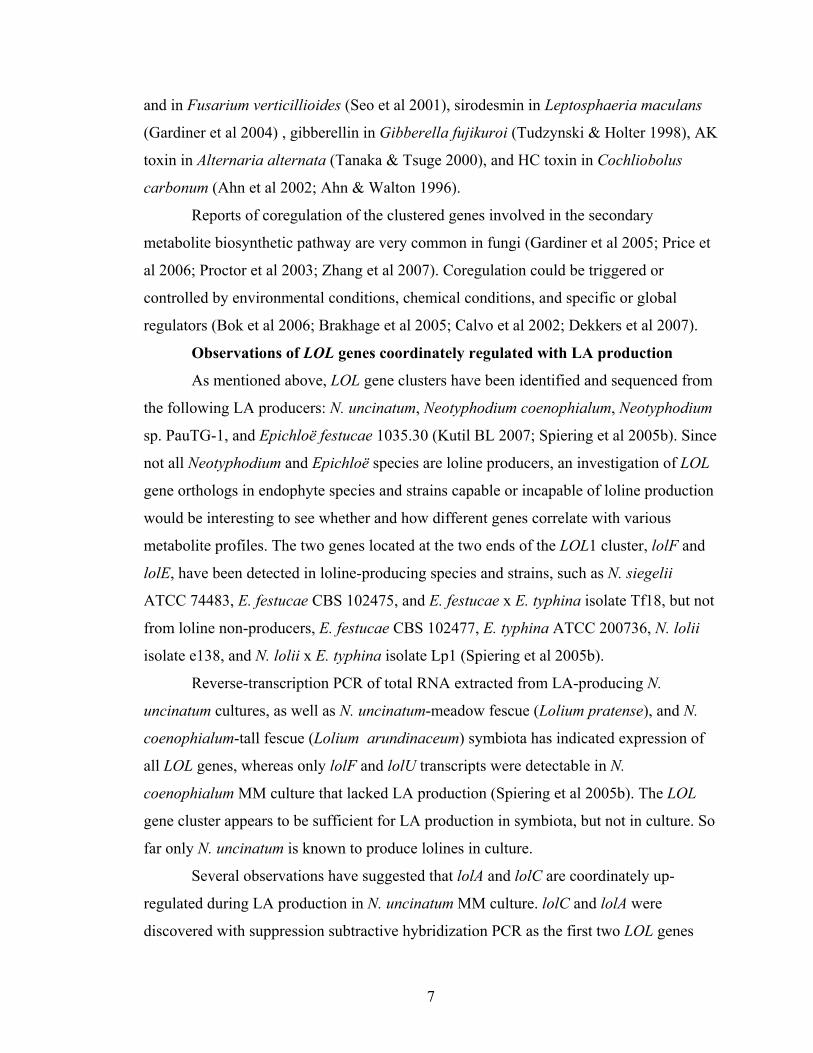
The ether bridge characteristic of the lolines is very unusual in a natural
compound as it cross-links two unactivated bridgehead carbons. The ether bridge, the 1-
amine, and saturation of the pyrrolizidine rings distinguish lolines from a major group of
plant pyrrolizidines, the necines. Furthermore, whereas plant pyrrolizidines are derived
from polyamines (Ober & Hartmann 1999), lolines are derived from the amino acids L-
proline (Pro) and L-homoserine (Hse) (Figure 1.2). Practical investigation of the loline
biosynthetic pathway began with identification of culture conditions that induced loline
production by N. uncinatum. MM cultures triggering production of lolines in N.
uncinatum mycelium could then be used for feeding of specific isotope-labeled
compounds hypothesized to be precursors and intermediates in the pathway
(Blankenship, Spiering et al. 2001; Blankenship, Houseknecht et al. 2005; Faulkner,
Hussaini et al. 2006). Among the amino acids found to incorporate into lolines were Pro
and its precursor amino acids L-ornithine (Orn) and L-glutamic acid (Glu), and Hse and
its precursor amino acid L-aspartate (Asp).
When labeled L-[5-13C]Orn was fed to N. uncinatum cultures, only the C-5 atom,
not C-8, was detected by NMR to be labeled in the N-formylloline B-ring. This excluded
the possibility that putrescine (Put) was a loline precursor (Blankenship et al 2005). The
symmetrically structured Put would have resulted in 13C label in C-5 and C-8 in
spermidine (Spd), and incorporation of Spd into N-formylloline would have resulted in 13C labeling of both C-5 and C-8. When fed with L-[15N,U-13C]Pro, NMR showed 15N
3
label in the tertiary amine, and 13C-labeled carbons 4, 6, 7, and 8 of N-formylloline. Pro
was therefore identified as the contributor for the B ring. Similarly, Hse was identified as
the donor for the 1-amine and A-ring carbons 1, 2 and 3, based on the pattern of labels in
N-formylloline when cultures were fed with L-[4-13C]Asp, [15N]Asp, [15N]Hse, or [4,4-2H2]Hse. The incorporation of isotope-labeled atoms from [4,4-2H2]Hse and L-[15N,U-13C]methionine indicated that O-acetylhomoserine is condensed with the proline ring-
nitrogen via γ-substitution, and ruled out incorporation via aspartyl semialdehyde or S-
adenosylmethionine. This γ-substitution reaction has been proposed to be the first step in
the pathway, and seems likely to be catalyzed by a γ-type pyridoxal phosphate (PLP)-
containing enzyme.
The most likely candidate for the γ-type PLP enzyme is the predicted product of
the lolC gene, the product of which has high sequence similarity to O-acetylhomoserine
(thiol) lyase (homocysteine synthase) encoded by the Aspergillus nidulans cysD gene
(Spiering et al 2005b; Spiering et al 2002). By suppression subtractive hybridization
PCR, lolC was found along with another gene, lolA (product similar to a portion of
aspartate kinase) among up-regulated transcripts from LA-producing cultures of N.
uncinatum (Spiering et al 2002). Southern-blot hybridization of lolC and lolA gave much
stronger signals to cDNA derived from mRNA from loline-producing cultures than from
cultures in which loline-production is suppressed. The cDNA clones from two lolA
alleles were identified in this screen, and designated lolA1 and lolA2. Further detailed
studies by diagnostic PCR indicated that lolC and lolA were only present in loline-
producing endophyte species and isolates. Coincidently, the lolC sequence was related to
the one previously identified as an amplified fragment length polymorphism (AFLP)
marker in a Mendelian analysis of E. festucae isolates that differed in loline-producing
capability (Wilkinson et al 2000). Confirmation of lolC as a likely loline biosynthesis
gene was obtained by an RNA interference (RNAi) experiment, whereby RNAi of lolC
caused lower lolC gene expression and decreased loline production in N. uncinatum
(Spiering et al 2005b; Spiering et al 2002).
The discovery of lolA and lolC in N. uncinatum was a major milestone, allowing
identification of the whole loline biosynthesis gene cluster, and aiding in predicting the
loline biosynthesis pathway. An 8 kb DNA fragment was obtained by PCR with lolC-
4
and lolA-specific primers, and sequencing of this fragment revealed two genes, lolD and
lolO, to be located between lolA and lolC (Spiering et al 2005b). This finding strongly
suggested that genes responsible for loline production are arranged in a gene cluster,
consistent with the observation that fungal genes for steps in secondary metabolite
pathways are often clustered (Tudzynski et al 1999). Homologous gene clusters
associated with loline production, LOL1 and LOL2 in N. uncinatum, a LOL cluster in
Neotyphodium coenophialum or Neotyphodium sp. PauTG-1 closely related to LOL2, and
a LOL cluster in Epichloë festucae 1035.30, were discovered by genome walking and by
screening and sequencing of endophyte genome libraries (Spiering, Moon et al. 2005;
Kutil, Greenwald et al. 2007). The LOL gene orthologs have been identified in the
recently completed genome sequence of E. festucae E2368, an isolate that produces N-
formylloline and N-acetylloline.
There are nine genes in the N. uncinatum LOL1 cluster in a 25 kb region of the
genome and arranged in the following order: lolF1, lolC1, lolD1, lolO1, lolA1, lolU1,
lolP1, lolT1, and lolE1, based on open reading frame searches with FGENESH program,
and the predicted protein and function searches with BLASTP, Prosite or Pfam pattern
searches (Kutil et al 2007; Spiering et al 2005b). The same homologs lolC2 to lolE2
arranged in the same order were found in the LOL2 cluster in N. uncinatum; the linkage
of lolF2 to either of the two clusters has not been established. In E. festucae 1035.30, the
LOL gene cluster showed the same order and a closer relationship to LOL1; however, a
19-kb intergenic region exists between the genes lolC and lolD in E. festucae (Kutil et al
2007; Spiering et al 2005b).
Proposed biosynthetic pathway
The likely enzyme functions inferred from bioinformatic analysis of genes in the
LOL clusters, together with results of precursor feeding experiments (Blankenship et al
2005; Faulkner et al 2006), have helped elucidate the LA biosynthesis pathway.
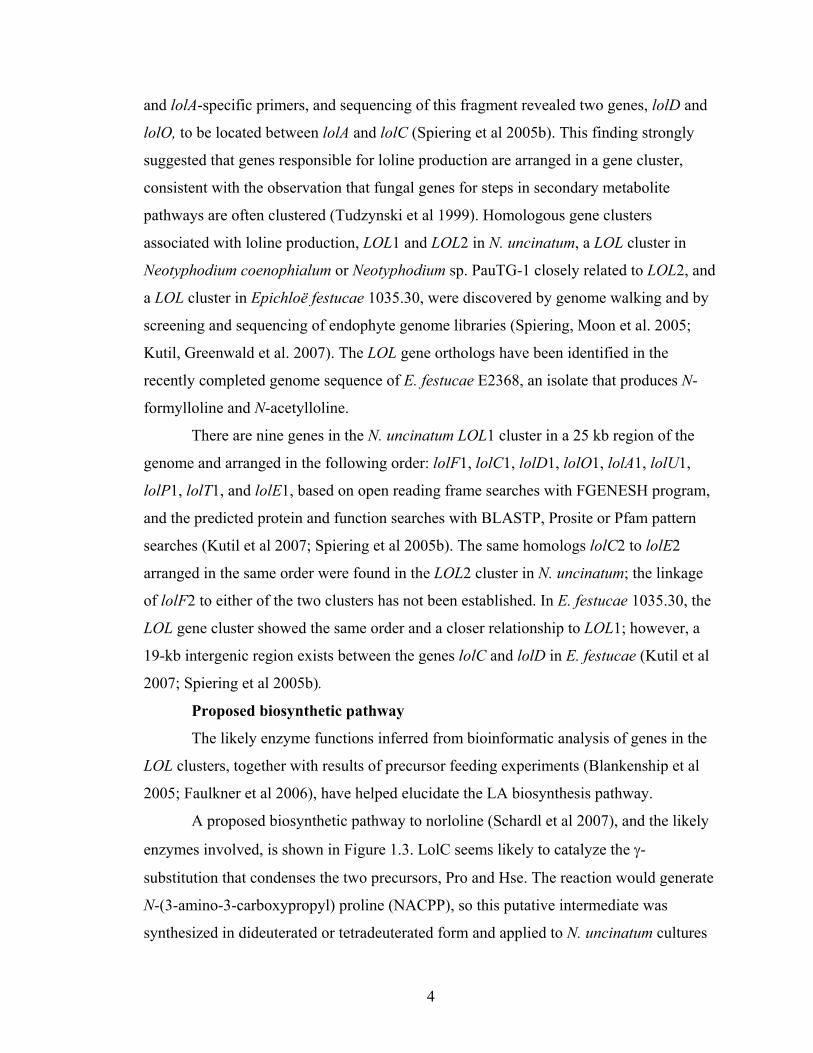
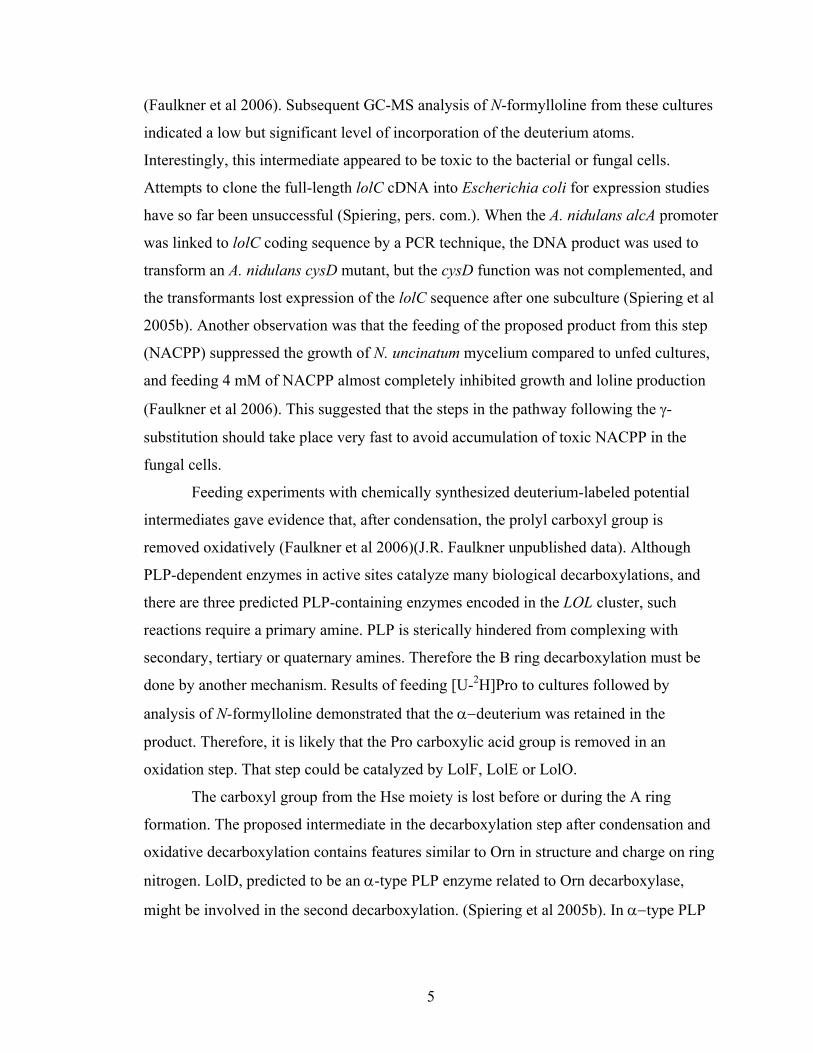
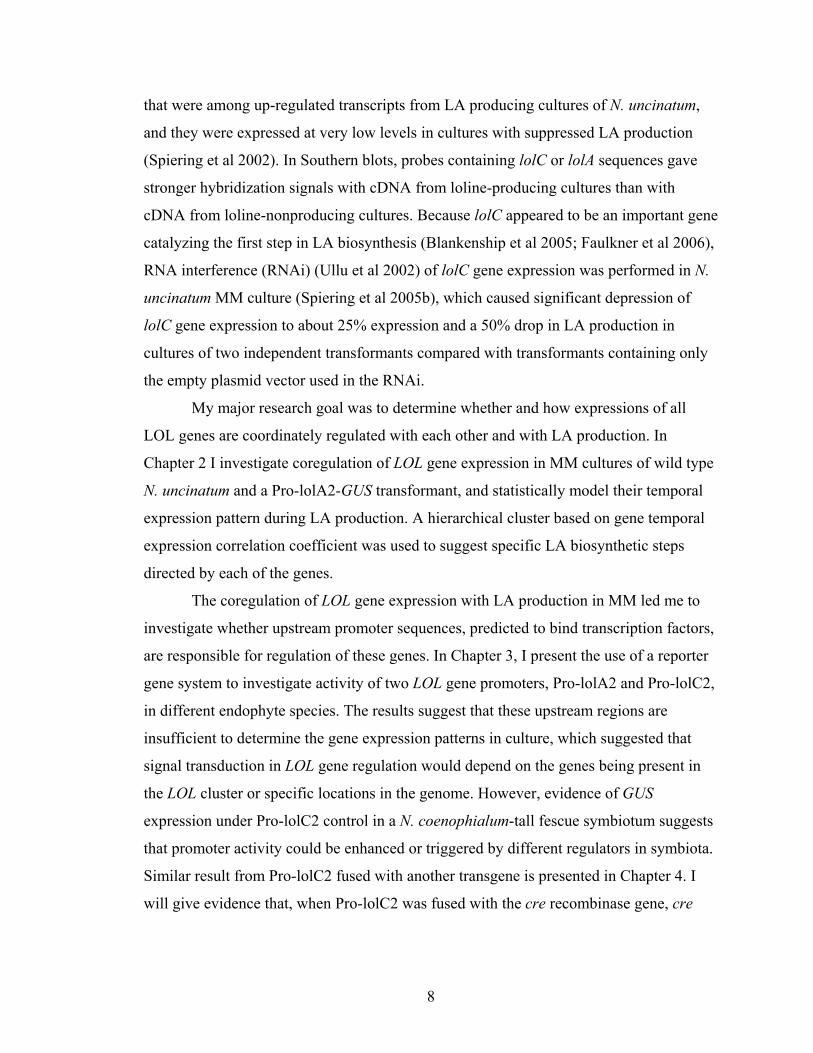
A proposed biosynthetic pathway to norloline (Schardl et al 2007), and the likely
enzymes involved, is shown in Figure 1.3. LolC seems likely to catalyze the γ-
substitution that condenses the two precursors, Pro and Hse. The reaction would generate
N-(3-amino-3-carboxypropyl) proline (NACPP), so this putative intermediate was
synthesized in dideuterated or tetradeuterated form and applied to N. uncinatum cultures
5
(Faulkner et al 2006). Subsequent GC-MS analysis of N-formylloline from these cultures
indicated a low but significant level of incorporation of the deuterium atoms.
Interestingly, this intermediate appeared to be toxic to the bacterial or fungal cells.
Attempts to clone the full-length lolC cDNA into Escherichia coli for expression studies
have so far been unsuccessful (Spiering, pers. com.). When the A. nidulans alcA promoter
was linked to lolC coding sequence by a PCR technique, the DNA product was used to
transform an A. nidulans cysD mutant, but the cysD function was not complemented, and
the transformants lost expression of the lolC sequence after one subculture (Spiering et al
2005b). Another observation was that the feeding of the proposed product from this step
(NACPP) suppressed the growth of N. uncinatum mycelium compared to unfed cultures,
and feeding 4 mM of NACPP almost completely inhibited growth and loline production
(Faulkner et al 2006). This suggested that the steps in the pathway following the γ-
substitution should take place very fast to avoid accumulation of toxic NACPP in the
fungal cells.
Feeding experiments with chemically synthesized deuterium-labeled potential
intermediates gave evidence that, after condensation, the prolyl carboxyl group is
removed oxidatively (Faulkner et al 2006)(J.R. Faulkner unpublished data). Although
PLP-dependent enzymes in active sites catalyze many biological decarboxylations, and
there are three predicted PLP-containing enzymes encoded in the LOL cluster, such
reactions require a primary amine. PLP is sterically hindered from complexing with
secondary, tertiary or quaternary amines. Therefore the B ring decarboxylation must be
done by another mechanism. Results of feeding [U-2H]Pro to cultures followed by
analysis of N-formylloline demonstrated that the α−deuterium was retained in the
product. Therefore, it is likely that the Pro carboxylic acid group is removed in an
oxidation step. That step could be catalyzed by LolF, LolE or LolO.
The carboxyl group from the Hse moiety is lost before or during the A ring
formation. The proposed intermediate in the decarboxylation step after condensation and
oxidative decarboxylation contains features similar to Orn in structure and charge on ring
nitrogen. LolD, predicted to be an α-type PLP enzyme related to Orn decarboxylase,
might be involved in the second decarboxylation. (Spiering et al 2005b). In α−type PLP
6
enzymes that perform α−decarboxylation, the PLP complexes with the α−amine of the
substrate.
After the two rings form, oxygenation and oxidation on C-2 and C-7 forms the
oxygen bridge. It is unknown whether this occurs on undecorated exo-1-
aminopyrrolizidine to form norloline, or alternatively, the 1-amine might first be
acetylated or methylated. LolE is predicted to be an epoxidase or hydroxylase, and might
be involved in this step. Its sequence is closely related to an epoxidase from Penicillium
decumbens and contains the signatures of the enzyme family FeII/2-oxoglutarate-
dependent hydroxylases. LolO, another predicted protein in the same family, or the
predicted FAD-containing monooxygenase, LolF, might also be involved in the ether
bridge formation (Faulkner et al 2006; Spiering et al 2005b).
LolP, predicted to be a cytochrome P450 monooxygenase, was confirmed to
catalyze oxidation of N-methylloline to N-formylloline (M.J. Spiering, J.R. Faulkner, and
C.L. Schardl, unpublished results). The lolP2 gene in N. uncinatum appears to be non-
functional (Spiering et al 2005b) and this facilitated a gene knock-out approach for lolP
gene mutagenesis by homologous recombination and knocking out of the lolP1 gene, an
approach that would require two knockouts for the other LOL genes in this fungus (M.J.
Spiering, J.R. Faulkner, and C.L. Schardl, unpublished results). Elimination of the
functional lolP1 (lolP1Δ) resulted in accumulation of N-methylloline and absence of N-
formylloline. Complementation of the lolP1Δ mutant with lolP1 coding sequence
expressed from the trpC promoter of Aspergillus nidulans, restored N-formylloline
production. These results demonstrated that lolP is required for production of N-
formylloline by oxygenation of N-methylloline. The function of the lolU encoded protein
remains unknown.
LOL gene expression and LA production
Coregulation of clustered genes involved in secondary metabolite pathways
In filamentous fungi, genes are often clustered when they are involved in the same
secondary metabolite biosynthetic pathway, such as clusters related to the production of
sterigmatocystin in Aspergillus nidulans (Brown et al 1996), aflatoxin in Aspergillus
parasiticus (Yu et al 2004), fumonisin in Gibberella moniliformis (Proctor et al 2003)
7
and in Fusarium verticillioides (Seo et al 2001), sirodesmin in Leptosphaeria maculans
(Gardiner et al 2004) , gibberellin in Gibberella fujikuroi (Tudzynski & Holter 1998), AK
toxin in Alternaria alternata (Tanaka & Tsuge 2000), and HC toxin in Cochliobolus
carbonum (Ahn et al 2002; Ahn & Walton 1996).
Reports of coregulation of the clustered genes involved in the secondary
metabolite biosynthetic pathway are very common in fungi (Gardiner et al 2005; Price et
al 2006; Proctor et al 2003; Zhang et al 2007). Coregulation could be triggered or
controlled by environmental conditions, chemical conditions, and specific or global
regulators (Bok et al 2006; Brakhage et al 2005; Calvo et al 2002; Dekkers et al 2007).
Observations of LOL genes coordinately regulated with LA production
As mentioned above, LOL gene clusters have been identified and sequenced from
the following LA producers: N. uncinatum, Neotyphodium coenophialum, Neotyphodium
sp. PauTG-1, and Epichloë festucae 1035.30 (Kutil BL 2007; Spiering et al 2005b). Since
not all Neotyphodium and Epichloë species are loline producers, an investigation of LOL
gene orthologs in endophyte species and strains capable or incapable of loline production
would be interesting to see whether and how different genes correlate with various
metabolite profiles. The two genes located at the two ends of the LOL1 cluster, lolF and
lolE, have been detected in loline-producing species and strains, such as N. siegelii
ATCC 74483, E. festucae CBS 102475, and E. festucae x E. typhina isolate Tf18, but not
from loline non-producers, E. festucae CBS 102477, E. typhina ATCC 200736, N. lolii
isolate e138, and N. lolii x E. typhina isolate Lp1 (Spiering et al 2005b).
Reverse-transcription PCR of total RNA extracted from LA-producing N.
uncinatum cultures, as well as N. uncinatum-meadow fescue (Lolium pratense), and N.
coenophialum-tall fescue (Lolium arundinaceum) symbiota has indicated expression of
all LOL genes, whereas only lolF and lolU transcripts were detectable in N.
coenophialum MM culture that lacked LA production (Spiering et al 2005b). The LOL
gene cluster appears to be sufficient for LA production in symbiota, but not in culture. So
far only N. uncinatum is known to produce lolines in culture.
Several observations have suggested that lolA and lolC are coordinately up-
regulated during LA production in N. uncinatum MM culture. lolC and lolA were
discovered with suppression subtractive hybridization PCR as the first two LOL genes
8
that were among up-regulated transcripts from LA producing cultures of N. uncinatum,
and they were expressed at very low levels in cultures with suppressed LA production
(Spiering et al 2002). In Southern blots, probes containing lolC or lolA sequences gave
stronger hybridization signals with cDNA from loline-producing cultures than with
cDNA from loline-nonproducing cultures. Because lolC appeared to be an important gene
catalyzing the first step in LA biosynthesis (Blankenship et al 2005; Faulkner et al 2006),
RNA interference (RNAi) (Ullu et al 2002) of lolC gene expression was performed in N.
uncinatum MM culture (Spiering et al 2005b), which caused significant depression of
lolC gene expression to about 25% expression and a 50% drop in LA production in
cultures of two independent transformants compared with transformants containing only
the empty plasmid vector used in the RNAi.
My major research goal was to determine whether and how expressions of all
LOL genes are coordinately regulated with each other and with LA production. In
Chapter 2 I investigate coregulation of LOL gene expression in MM cultures of wild type
N. uncinatum and a Pro-lolA2-GUS transformant, and statistically model their temporal
expression pattern during LA production. A hierarchical cluster based on gene temporal
expression correlation coefficient was used to suggest specific LA biosynthetic steps
directed by each of the genes.
The coregulation of LOL gene expression with LA production in MM led me to
investigate whether upstream promoter sequences, predicted to bind transcription factors,
are responsible for regulation of these genes. In Chapter 3, I present the use of a reporter
gene system to investigate activity of two LOL gene promoters, Pro-lolA2 and Pro-lolC2,
in different endophyte species. The results suggest that these upstream regions are
insufficient to determine the gene expression patterns in culture, which suggested that
signal transduction in LOL gene regulation would depend on the genes being present in
the LOL cluster or specific locations in the genome. However, evidence of GUS
expression under Pro-lolC2 control in a N. coenophialum-tall fescue symbiotum suggests
that promoter activity could be enhanced or triggered by different regulators in symbiota.
Similar result from Pro-lolC2 fused with another transgene is presented in Chapter 4. I
will give evidence that, when Pro-lolC2 was fused with the cre recombinase gene, cre
9
gene expression did not follow the native lolC2 gene expression patterns either in culture
or in symbiota.
In Chapter 5, I investigate LOL gene expression together with LA levels in
different tissues and treatments of four different symbiota: vegetative tissues of N.
uncinatum-meadow fescue and N. siegelii-meadow fescue before and after clipping,
inflorescence heads and stromata in E. festucae-meadow fescue, and inflorescence heads
at four developmental stages of N. coenophialum-tall fescue. I present evidence that LOL
gene regulation is involved in regulating LA production in inflorescences and stromata in
E. festucae-meadow fescue symbiota. However, I will also present evidence that other
mechanisms, perhaps involving substrate availability, may regulate LA level change in
different vegetative tissues.
Therefore, my study reveals new insights on regulation of a natural product
biosynthesis gene cluster both in fungal culture and in symbiota, the role of the genome
context in that regulation, and how production of the metabolite can be regulated in
different ways under different circumstances, including changes in gene expression and
changes in substrate availability.
10
2
7
6
5N4 3
NR1R2H1
8
O
6 5
N 487O
32
1 NR1R2
=
norloline (1) H Hloline (2) H CH3N-methylloline (3) CH3 CH3N-formylnorloline (4) H CHON-formylloline (5) CH3 CHON-acetylnorloline (6) H COCH3N-acetylloline (7) CH3 COCH3
R1= R2=
AB
Figure 1.1: Structures of loline alkaloids
NH2H2N
COOH
ornithine
NH2H2N
putrescineHN
H2NNH2
spermidine
HN
H2N NH2homospermidine
N
NH2
N
CH2OHHHO
retronecine
other pyrrolizidines
NH
COOH
L-prolineNH2
HO
L-homoserine
COOH
N
NH2HO
=N
O
NH2
+
norloline
other loline alkaloidsN
NR1R2HO
Figure 1.2: Precursors of plant pyrrolizidines (left) and loline alkaloids (right).
11
COOH
NH2 NH2
HO
NH2
AcOLolC
NH
Asp Hse
Pro
N
NH2
Ox1
-CO2
N
NH2LolD
N
NH2
LolT
N
HNH2
COOH
HOOC Ox2
N
HNH2
OH
or N
HNH2X
Ox3
N
NH2HO
norloline (1)
=N
O
NH2
AdoMet
MeT
N
HO
loline (2)
NHCH3
AdoMet
MeT
N
HO
N -methylloline (3)
N(CH3)2
LolP
N
HO N
CH3
CHO
S
H2N
CH3
Met
N -f ormylloline (5)
COOH
NACPP
exo-1-aminopyrrolizidine
COOH COOH
COOH
COOH
COOH
N
NH2HOOC
oror LolT or LolD
Figure 1.3: Proposed loline alkaloid biosynthetic pathway
Copyright © Dong-Xiu Zhang 2008
12
CHAPTER 2
Coregulated LOL Gene Expression and LA Production
in Neotyphodium uncinatum Culture
INTRODUCTION
Coregulation of the clustered genes involved in secondary metabolite biosynthetic
pathways in fungi has been very commonly reported (Gardiner et al 2005; Price et al
2006; Proctor et al 2003; Zhang et al 2007). Coregulation could be triggered or controlled
by environmental conditions, chemical conditions, and specific or global regulators (Bok
et al 2006; Brakhage et al 2005; Calvo et al 2002; Dekkers et al 2007).
Genes responsible for loline alkaloid (LA) production are clustered (LOL gene
cluster) (Kutil et al 2007; Spiering et al 2005b) in fungal endophytes: Epichloë (sexual)
and Neotyphodium (asexual) species that infect grasses in the family Poaceae (Schardl et
al 2004). LOL gene clusters have been identified and sequenced from the following LA
producers (Kutil BL 2007; Spiering et al 2005b): Neotyphodium uncinatum,
Neotyphodium coenophialum, Neotyphodium sp. PauTG-1, and Epichloë festucae
1035.30 and 2368. Among them, N. uncinatum contains two homologs of LOL gene
clusters, named LOL1 and LOL2, whereas in each of the other species only a single gene
cluster has been discovered (Kutil et al 2007; Spiering et al 2005b). There are nine genes
in the N. uncinatum LOL1 cluster, in a 25 kb region of the genome, that are arranged in
the following order: lolF1, lolC1, lolD1, lolO1, lolA1, lolU1, lolP1, lolT1, and lolE1
(Spiering et al 2005b). The homologs lolC2 to lolE2 are in the same order in the LOL2
cluster, but the linkage of lolF2 to either of the two clusters has not been established.
In all LOL gene clusters mapped to date, three pairs of genes share 5’ common
regions corresponding to the promoter regions: lolO with lolA, lolU with lolP, and lolT
with lolE (Kutil et al 2007; Spiering et al 2005b). This may suggest that each gene pair
would show very similar patterns of co-regulation. Comparative analysis of these putative
promoter regions in five LOL gene clusters with the program PhyloCon has identified
four highly conserved motifs in each promoter region (Kutil et al 2007). These motifs
show significant matches to sequences that are known binding sites for fungal
13
transcription factors listed as ADR1, NIT2, STRE, and PHO4 in the TRANSFAC
database.
Most of the LOL genes are believed to play specific roles in the LA biosynthetic
pathway (Schardl et al 2007). The pathway is almost completely elucidated from the
insight of the likely enzyme functions encoded by the LOL genes (Spiering et al 2005b),
the phenotype resulting from knocking out a gene (M.J. Spiering, J.R. Faulkner and C. L.
Schardl unpublished data), and by feeding isotope-labeled putative LA precursors and
intermediates to N. uncinatum minimal medium (MM) culture (Blankenship et al 2005;
Faulkner et al 2006; Spiering et al 2005b). Neotyphodium uncinatum, the only Epichloë
endophyte known to produce LA in culture, synthesizes LA with very reproducible
kinetics over 45 days in a defined MM culture at 21°C (Blankenship et al 2001). A
reasonable explanation of the reproducible kinetics would be the LOL gene coded
enzymes remained reproducible activity pattern along the LA production time course.
This reproducible enzyme activity (protein level gene expression) pattern might be
regulated at translational or transcriptional level, or both. My hypothesis is that the genes
involved in LA synthesis might be coordinately regulated at transcriptional level in N.
uncinatum MM culture in a manner reflected in the LA production kinetic curve.
Reverse-transcription PCR of total RNA extracted from LA-producing N.
uncinatum cultures indicated expression of all of the LOL genes, whereas only lolF and
lolU were detectable and no LA was produced in N. coenophialum MM culture (Spiering
et al 2005b). Several observations suggest that lolA and lolC are coordinately regulated
with LA production in N. uncinatum MM culture. LolC and lolA were discovered with
suppression subtractive hybridization PCR and confirmed to be up-regulated in LA-
producing cultures, and expressed at very low levels in cultures with low level LA
production (Spiering et al 2002). RNA interference (RNAi) (Ullu et al 2002) of lolC gene
expression was performed in N. uncinatum MM culture (Spiering et al 2005b), which
caused significant depression to about 25% lolC gene expression and 50% LA
production. These results strongly suggest LOL genes are coordinately regulated.
However, these previous studies did not quantify and resolve the exact temporal pattern
of LOL gene expression during the LA production time course in N. unciantum MM
culture.
14
Reverse transcription quantitative real-time PCR (RT-qPCR) has been widely
applied as a method for transcription quantification in fungi (Desmond et al 2006; Pathan
et al 2007; Semighini et al 2002; Zhang et al 2007). The N. uncinatum MM system is
ideal for the study of LOL gene dynamic expression during the LA production time
course, since RNA can be obtained from cultures at designated time points and the
kinetics of LA production are reproducible (Blankenship et al 2001). Knowledge
obtained from such experiments may help guide strategies to identify transcription factors
that regulate expression of the LOL genes, and contribute to insight into the sequence of
expression of the LA biosynthesis pathway.
The experiments in this study were designed to test the hypothesis that the
temporal regulation of most or all of the LOL genes is coordinate with each other and
with LA production. To test this, gene expression and LA production were
simultaneously and quantitatively measured in wild type (WT) N. uncinatum and a Pro-
lolA2-GUS reporter gene N. uncinatum transformant (see Chapter 3 for information on
construction of GUS vectors and transformation) in MM cultures over time. In N.
uncinatum gene expression from the LOL1 or LOL2 cluster is similar, generally
exhibiting induction in MM culture and repression in complex media (Spiering et al
2005b). The studies described in this chapter focus on expression of the eight functional
genes of the LOL2 cluster, plus lolP1 (lolP2 is non-functional; M.J. Spiering, C.L.Schardl
unpublished data). Also analyzed were key genes for biosynthesis of two probable loline
precursors, proC for L-proline (Pro), and metX for O-acetylhomoserine, as well as a gene
tentatively designated C2H2, which is predicted to encode a C2H2-type transcription
factor, and was previously found in the suppression subtractive PCR as being up-
regulated in LA producing N. uncinatum MM culture (Spiering et al 2002).
15
MATERIALS AND METHODS
Fungal culture
Wild-type (WT) N. uncinatum E167 (= CBS 102646) was isolated from an
infected plant of Lolium pratense from our plant stock with the method described by
(Blankenship et al 2001). Subcultures were generated by streaking on fresh potato
dextrose agar (PDA) plates. The N. uncinatum transformant 188b6N, which carries the
Pro-lolA2-GUS reporter, was also used in this study, and had been single-spore isolated
three times on PDA plates with hygromycin (80 μg/ml). Subcultured colonies (each 0.5-1
cm2) were then ground in sterile water in pre-autoclaved 1.5-ml microcentrifuge tubes,
then drop-inoculated and spread on cellophane-covered PDA plates. After 15 days of
growth, four plates of mycelium was collected and homogenized in 50 ml minimal
medium (MM), and 0.5 ml of the homogenate was used to inoculate a 29.5 ml MM liquid
plate culture. MM was prepared as described previously to optimally induce loline
alkaloid production (Blankenship et al 2001; Faulkner et al 2006). Culture plates were
sealed with parafilm and stacked as 5-plate-high columns on a rotary shaker, and shaken
(100 rpm) at room temperature (RT; approx. 24°C).
Sampling of fungal cultures
For WT N. uncinatum, from day 5-27 of culture, the cultures were randomly
sampled daily for loline alkaloid (LA) extraction and analysis. Thereafter, the cultures
were sampled on days, 30, 35, and 40. Every sampling day, three individual samples
from three plates were taken. On early sampling dates, due to the slow fungal growth, the
amount of mycelium in each plate was insufficient for RNA extraction; therefore on days
5 and 6 mycelium from three culture plates was pooled for each sample (in total 9 plates
were collected on each day as three individual samples), on day 7 and 8 two plates were
pooled for each sample, and from day 9 on each of the three daily samples was from one
plate. For transformant188b6N, sampling supernatant and harvesting mycelia started
from day 6 (3 plates per sample), then 2 plates per sample on day 7, and from day 8 on,
one plate per sample each day till day 24; thereafter the culture was sampled on days 30
and 35.
16
The sampled MM cultures were then centrifuged to immediately harvest the
mycelial pellet, which was flash-frozen in liquid nitrogen, and stored at –80°C for later
RNA extraction. For later LA extraction, 1 ml of the culture supernatant was freeze-dried
in a 1.7 ml microcentrifuge tube. Each of the three samples each day was arbitrarily
assigned number 1, 2, or 3 for both RNA and LA analysis, so that the relationship
between LA and mRNA levels could be assessed on an individual sample basis.
Loline alkaloid extraction
LA extraction and quantification with gas chromatography (GC) was as described
by Blankenship et al. (2001) with slight modifications. One-tenth volume of 1 N NaOH
(instead of saturated sodium bicarbonate) was added to the freeze-dried supernatant.
After CHCl3 was added, tubes were shaken by hand till milky, then set at RT for 1 hr. The
CHCl3 layer was pipetted into a glass vial for GC analysis. The LA amount reported is the
sum of all detected loline alkaloids in culture, namely loline, N-acetylnorloline, N-
formylloline, and N-acetylloline.
RNA extraction and quantitation
Total RNA was extracted from approx. 100 mg mycelium (fresh weight) with the
RNeasy Plant Minikit (Qiagen, Valencia, CA, USA). Removal of contaminating DNA by
DNase treatment of RNA extracts was done as described by Spiering et al. (2002).
Integrity of the RNA was routinely checked by electrophoresing 2 µl of RNA solution in
1% agarose gels and visualizing of the RNA after ethidium bromide staining. From each
RNA sample, 25 µl was diluted with 75 µl RNase-free sterile water, and 1 µl of the
diluted RNA was used to quantify RNA concentration. Quantitation of RNA was set up
on 96-well 300 µl black polystyrene microplates (Whatman Inc., NJ, USA) by following
the instructions of Quant-iTTM RNA Assay Kit (5-100 ng range) (Invitrogen, USA). Each
sample (1 µl) or RNA standard (10 µl; included in the kit) was set up in triplicate, and
each plate was read three times. The plate was read on a Spectra Max Gemini XS
microplate spectrofluorometer systems reader (Molecular Devices Corp., Downingtown,
PA, USA) with fluorescence excitation/emission at 644/673 nm. Readings were saved as
SoftMax Pro files, and exported to Microsoft Excel. The average fluorescence value for
17
each sample was used to calculate the RNA concentration based on the RNA standard
curve. According to the RNA concentration, the appropriate amount of each sample was
diluted with RNase-free sterile water to a final concentration of 5 ng/µl, and stored in 96-
well PCR plates at –20°C before use.
TaqMan primer and probe design
Primers and probes for lolC1, lolC2, and tubB were the same as used by Spiering
et al (2005b). All other TaqMan (TQM) primers and probes were designed in this study
and ordered from IDT (Integrated DNA Tech., IA, USA). All probes had been 5′-labeled
with a 6-fluorescein (6-FAM) reporter and 3′-labeled with black hole quencher 1 (BHQ-
1) except the TQM tefA probe, which was 5′-labeled with a TET reporter. Primer and
probe sequences are listed in Table 2.1. The cDNA sequence of each gene in the LOL2
cluster (NCBI Genbank accession number AY723750) was aligned with that of the LOL1
cluster (AY723749) using NCBI’s BLAST 2 sequences tool to identify single nucleotide
polymorphisms (SNPs) that could be used for primer and probe design to specifically
detect and quantify expression of LOL2 cluster genes. Selected cDNA fragments (< 300
bp) containing SNPs were input to PrimerQuestSM under IDT SciTools on the IDT
website (http://www.idtdna.com). Primer/probe search parameters were set to real-time
PCR, primer and probe quest, and optimum settings of primer size to 24 nt, primer Tm 60
°C, primer GC% of 50%, product range 80-200 bp, probe size 25 nt, probe Tm 65 °C,
probe GC% of 50%. Primer/probe sets were chosen based on these criteria: product size
less than 150 bp if possible; forward and reverse primer Tm difference within 1 °C; probe
Tm at least 1°C higher than primer Tm; containing LOL2-specific SNPs and no matches
to other genomic regions when the primer or probe sequences were BLAST searched in
NCBI nr database (http://www.ncbi.nlm.nih.gov/blast/Blast.cgi) with the organism set to
Neotyphodium. In addition, whenever possible, the two primers were designed so that the
product crossed an intron boundary, to identify potential genomic DNA contamination in
RNA samples as a larger product. Ideally, the probe or one primer was designed to cross
over an intron region to entirely eliminate potential for any genomic DNA to yield a
product in RT-PCR. Primers were diluted into H2O to 5 µM working solution, and probes
to 25 µM. Each primer pair was tested with reverse transcription PCR; cDNA was
18
synthesized from total RNA with Monster Script 1st-Strand cDNA Synthesis kit
(Epicentre Biotech., USA), following the manufacturer’s protocol. The cDNA (0.5 µl)
was then used in a 25-µl reaction containing 0.2 µM of each primer, and 2.5 units
AmpliTaq Gold, AmpliTaq Gold PCR buffer with MgCl2 (1.5 mM final conc.) supplied
by the manufacturer (Applied Biosystems, Foster City, CA, USA), 200 µM of each
dATP, dCTP, dGTP, and dTTP, and cycling at 95 °C for 9 min, 40 cycles of 95 °C for 25
sec, 62 °C for 30 sec, and 72 °C for 30 sec to check that only the desired single fragment
was obtained. For reverse transcription quantitative real time PCR (RT-qPCR), cDNA
was synthesized from total RNA with Monster Script 1st-Strand cDNA Synthesis kit as
described above. The cDNA sequences of N. uncinatum E167 tefA (translation elongation
factor 1- gene) and C2H2 were accessed from NCBI GenBank (AF308131 &
AY789054), and the β-glucuronidase gene (uidA = GUS) sequence was obtained from β-
glucuronidase expression vector pNOM102 (Genbank Z32701) (Roberts et al 1989).
Similar scenarios as described above were applied to design their TQM primers and
probes, except some standards were not applicable because they were not genes from
LOL clusters, and GUS lacks introns.
Since the sequences of N. uncinatum proC (encoding pyrroline-5-carboxylate
reductase) and metX (encoding homoserine O-acetyl transferase) were unknown, the
exons of gene orthologs predicted by gene prediction program FGENSH
(http://linux1.softberry.com/berry.phtml?topic=fgenesh&group=programs&subgroup=gfi
nd) in the E. festucae E2368 genome were used to design primers for amplification and
sequencing of proC ( ProC Efes fwd & ProC Efes rev) and metX (MetX Efes fwd &
MetX Efes rev) cDNA fragments from N. uncinatum RNA. PCR was performed under
thermal cycling conditions of 95 °C for 9 min, 40 cycles of 95 °C for 25 sec, 62 °C for 30
sec, and 72 °C for 1 min in a 25-µl reaction as described above. One μl PCR product was
added to a 7 μl sequencing reaction with the BigDye Version 3 Terminator cycle
sequence kit (Applied Biosystems, Foster City, CA) under thermal cycling conditions 94
°C for 5 min, 60 cycles of 95 °C for 15 sec, 50 °C for 10 sec, and 60 °C for 4 min., and
product was purified and submitted for sequencing. Based on the sequences, primer and
probe sets for RT-qPCR of proC and metX were designed as described above.
19
Real-time quantitative PCR (RT-qPCR)
Real-time PCR was carried out using TaqMan One-Step RT-PCR Master Mix
reagents kit (Applied Biosystems) in 96-well PCR plates on PRISM 7900HT (Applied
Biosystems) with same cycling conditions as previously described (Spiering et al 2005b),
except that 25 ng total fungal RNA was used in each reaction (concentration of each
primer was 400 nM and of the probe 200 nM). For each gene primer and probe set,
amplification efficiencies were determined from a standard curve slope obtained with a 2-
fold sequential five-step dilution series (within range 2-35 ng) of an N. uncinatum RNA
sample used as template. Each sample was run in triplicate on a plate for standard curves,
and as duplicates for relative quantification of the gene transcript. For RT-qPCR tests,
RNA samples were chosen based on their LA production curves from WT N. uncinatum
cultured for 6, 9, 13, 21, 25, 30, 35, and 40 days, and from the N. uncinatum Pro-lolA2-
GUS transformant 188b6N cultured for 7, 11, 15, 17, 21, 24, 30, 35 days. Three samples
from each day generated three sets of RNA within the testing period. The whole set of
RNA samples covering testing day points was set up for both target gene(s) and the
endogenous control gene tefA on the same plate to correct for plate to plate variation. Not
all tested genes could be accommodated on one plate; therefore tefA control reactions
were set up on each plate for different gene analyses with the same set of RNA samples.
Ct (cycle threshold) values were automatically calculated by SDS 2.3 software of the
PRISM 7900HT, whereby the default baseline setting (cycles 3-15) was used. All genes
in the LOL2 cluster were tested. However, instead of lolP2, lolP1 was included for this
study, since lolP2 is truncated and nonfunctional (Spiering et al. 2005).
Relative comparative Ct (ΔΔCt) Method
Expression of all tested genes was calculated in Microsoft Excel with the
comparative Ct method (ΔΔCt) [= Normalized Ct as ΔCt (Ct, target gene-Ct, tefA) – calibrator
(median of ΔCt)] (PRISM 2007), using tefA as the endogenous control gene to which each
target gene expression was normalized. The relative level of gene expression was then
converted into a fold differences to the calibrator (which was the median Ct of all genes
on a plate) as 2- ΔΔCt. Relative expression obtained from the three sets of RNA samples
was calculated separately, but each gene in one set of samples was investigated equally
20
from one plate. Graphs showing temporal expression of each gene were created with the
2- ΔΔCt values for each day tested. The standard errors were calculated from standard
deviations of the mean of the three 2- ΔΔCt value sets for each gene.
Estimation of RT-qPCR error due to differences between target gene and
normalizing gene amplification efficiency
TaqMan one step RT-qPCR was run for 15 genes. Standard curves of
amplification were generated by using incremental changes of the amount of RNA in the
qPCR; the slopes, implying the efficiency of amplification for each primer-probe set, and
R2 of the standard curves are shown in Table 2.2. The slopes were in the range of -3.37 to
-3.91, (range of R2: 0.976 to 0.997). The slope for the normalizing gene, tefA, used as
endogenous control, was –3.55 (R2 = 0.986). In a standard curve, y-axis shows the Ct
values, and the x-axis shows the fold change of template as log10 (X). According to
Applied Biosystems real-time PCR manual, the relative comparative method (ΔΔCt)
requires the slope difference of standard curves to be within 0.1 between the target gene
and the endogenous control gene, for relative quantification of target gene expression.
However, slopes for lolU2, lolE2, C2H2, and metX differed from the slope for tefA by
more than 0.1; in the case of lolU2 the slope was –3.91 (0.36 less than the tefA slope).
Finding a primer-probe set that fulfills all requirements (SNP-guided specificity to LOL2
cluster genes and acceptable high amplification efficiency) is inherently difficult.
Therefore, a mathematical algorithm was developed to estimate the error that could result
from the observed slope differences (amplification efficiency differences) between the
target and endogenous genes, and determine whether the error is acceptable.
An amplification efficiency of 100% in the exponential stage of PCR doubles (2 1) the product at each cycle, so a 10-fold increase of product is reached at 3.32 cycles (2 3.32=10). If the amplification efficiency is 97%, a 10-fold product increase is reached after
3.47 PCR cycles: (2 * 0.97)3.47=10. The goal of RT-qPCR is to determine the template
amount. Hence, a 10-fold increase in template will result in a reduction by 3.32 cycles
(ΔCt = -3.32) when the amplification efficiency is 100%, and 3.47 cycles (ΔCt = -3.47) if
the efficiency is 97%. This can be expressed with the following formula:
template fold change (X) =(2 * efficiency %) -ΔCt (1)
21
Because the standard curve is plotted on the log10 (X) of the template amount, the log10 is
taken of both sides of the equation:
log10 (X) = -ΔCt * log10 (2 * efficiency %) same as: (2)
ΔCt = [-1/log10 (2*efficiency %)] * [ log10 (X)] (3)
In the above formulas, when efficiency% =1, X=10, then ΔCt =-1/ log102 = -3.32,
indicating the reduction by 3.32 cycles that will be observed when the template is
increased 10 fold, and amplification efficiency is 100%.
Since in the standard curve the Ct values are plotted on the y axis and fold
change, log10 (X) on the x axis. The slope = ΔCt / log10 (X), that is:
ΔCt =slope * log10 (X) (4)
Comparing equation (4) to (3), it follows that:
Slope= -1/[log10 (2 *efficiency %)] (5)
So, lolU2 slope = –3.91, corresponding to an amplification efficiency of approx.
90%; and the tefA slope = –3.55 implies efficiency of approx. 95.8%. (While an 80%
efficiency refers to a slope of –4.9, incorrectly shown in the Applied Biosystems manual
as –3.39). Formula (4) shows how the Ct change corresponds to fold change of template.
Since normalization ignores the differences between target gene and endogenous control
gene amplification efficiency, the judgment of target gene expression fold change is
based on the Ct change obtained from target gene amplification, but referred to as tefA Ct
change in normalization and calculation. To estimate the error in relative expression due
to the difference in slope or amplification efficiency between endogenous control and
target gene, lolU2 and tefA were used in this example. Assuming that lolU2 expression
fold change in the sample is the same as tefA, then the true difference of cycle change
between them would be as given in formula (6) which is derived from formula (4):
ΔCt(lolU2)-ΔCt (tefA)=[slope(lolU2)-slope(tefA)] * log10(X) (6)
If both gene amplifications had the same slope, then the difference of the cycle
change between them will always be zero and independent of changes in X, that is
ΔCt(lolU2)-ΔCt (tefA)=[slope(lolU2)-slope(tefA)] * log10(X)=0 * log10(X)=0, and the fold
comparison of them is 20 = 1. To take into account the observed difference in slope
between lolU2 and tefA amplification efficiency:
ΔCt(lolU2)-ΔCt (tefA)= [slope(lolU2)-slope(tefA)] * log10(X)
22
= [(-3.91)-(-3.55)] * log10(X)
= –0.36 * log10(X)
Therefore, when X = 10, ΔCt residue = ΔCt(lolU2)-ΔCt (tefA) = –0.36. This indicates
lolU2 would show –0.36 cycles residue after normalization to expression of tefA, when a
true 10-fold change in lolU2 template is being referred to a 10-fold change of tefA. This
residue would then be calculated as fold change, 2-(-0.36) = 1.28, of lolU2 template
normalized to tefA based on formula (1) in which 100% efficient amplification is
assumed. Thus,
Target gene fold error = 2 –Δslope (target-endogene)*log10
X -1 (7)
If a lolU2 1/10 (or 10) fold change (X) is considered as the same fold change of
tefA in normalization, the calculated fold change of lolU2 would result in 2-0.36-1 = –0.22
(or 20.36-1 = 0.28) fold misjudgement due to actual slope difference based on formula (7).
Therefore, with a 10- fold template change, lolU2 normalization to tefA would give the
fold change error range (-0.22, 0.28) when lolU2 slope is ignored in the calculation.
Similarly, assuming a 100-fold template change, lolU2 normalized to tefA would give (2-
0.72, 20.72) = (0.61, 1.65) to actual 1, and the fold error range due to the slope difference is
between -0.39 and 0.65 fold during 2-ΔΔCt normalization and calculation.
Standard curve slope of lolU2 differs the most with that of the endogenous control
gene tefA among all genes tested. The technical variation from different runs or triplicates
of the same sample was observed to be 0–5% in TaqMan PCR according to the review by
(Bustin 2000).When variance is 5%, the maximum cycle difference of 0.548 in triplicate
runs of the same sample could be calculated from the variance formula:
σ2 (variance) = 1/N*∑(Ct-mean of Ct)2 (8)
For triplicate run, N = 3; When one Ct (Ct3) of the three Cts (Ct1, Ct2, Ct3) equals
the mean of the three Cts and does not contribute to the variance, that is: (Ct1 + Ct2 )/2 =
mean of Ct (same as: Ct2 = 2*mean of Ct – Ct1), then the maximum variation will be
between the other two Cts as calculated below:
5%=(1/3) *[(Ct1 – mean of Ct)2 + (Ct2-mean of Ct)2 + (Ct3-mean of Ct)2]
= (1/3) *[( Ct1 – mean of Ct)2 + (Ct2-mean of Ct)2 + 0]
=(1/3) *[(Ct1 – mean of Ct)2 + ( 2 * mean of Ct – Ct1 – mean of Ct)2] =(1/3) *[(Ct1 – mean of Ct)2 + ( mean of Ct -Ct1) 2]
23
=(1/3) *2 *(Ct1 – mean of Ct)2, so
|Ct1 – mean of Ct| = 0.274, then
|Ct1 – Ct2|max =|Ct1 – (2 *mean of Ct-Ct1)|
=2 * | Ct1 – mean of Ct|
=0.548
Therefore, when variance is 5%, the maximum cycle difference among triplicates
is 0.548. Cycle variance at 0.548 could cause (0.68,1.46) fold difference based on
formula (1), which implies fold error (-0.32, 0.46) based on formula (7). This is larger
than the slope error (-0.22, 0.28) between lolU2 and tefA when 10-fold template change
occurs, and would be equal to the slope error caused by lolU2 at 33.3 fold template
change by formula (6). Or, the other way around, the error from a slope difference of
0.548 in a 10-fold template change would equal that from a 5% variance in amplification.
From our result of the standard triplicates run in one step RT-qPCR, the variation range
for each gene is shown in Table 2.2. The overall variation of all genes is observed
between 0.02% and 6.1%. The maximum cycle difference from 6.1% variation would be
0.6. Similar calculation would discover the error from the slope difference below 45-fold
template change would be smaller than the maximum error in technical variance. Hence,
all the gene expression measurement will be performed in a ΔΔCt comparative method
despite of the slope difference exceeding 0.1 between the target gene and the endogenous
control.
Statistical analysis
JMP 7.0 (SAS Institute Inc. NC, USA) was used in statistical analysis. Due to the
large range of the fold differences in expression, all statistical analyses were performed
based on log10 (2- ΔΔCt) values to obtain a more normal distribution of the data. Bivariate
fit analysis of ‘Gene fit Day’ was used to identify temporal expression patterns for each
gene. The general quadratic equation is:
gene = a + b*day +c* day^2 , where a, b, c are the coefficients, and c≠ 0.
Each analysis is presented in five parts in the temporal expression pattern
analysis. First is the temporal expression curve, which shows fit to the model; second, the
polynomial model formula; and third, the “Summary of Fit”, in which R2 indicates how
24
the variations around the mean could be interpreted by the model. The fourth part,
“Analysis of Variance,” gives the opportunity to judge if this model significantly affects
the variance. The higher the F ratio, the larger the effect. In general, Prob > F (p) < 0.05
is considered significant. The fifth part, “Parameter Estimates,” offers a detailed
investigation of how the model parameters count toward the variance. Normally the
absolute t ratio > 2, and Prob > |t| (p) < 0.05 is considered significant. That means, this
parameter plays an important role in the model or, conversely, when it is not significant,
that parameter can be ignored or considered close to zero in the model. Thus, if the p
value of day^2 is not significant, the quadratic coefficient value c in the equation above
could be considered zero, and the pattern fits a linear instead of a quadratic model; while
the p value of the day does not change the quadratic model type once c ≠ 0, even if the p
value of the day is not significant and could be ignored as b = 0 in the equation.
Expression correlation coefficients were tested with a multivariate platform. A
scatterplot matrix was chosen with multivariate display options to visualize the
correlations. Pairwise correlations were generated from the multivariate ‘Density Ellipse’
option (set at default 0.95). Dendrograms of gene expression correlation coefficients
were drawn by the Ward method of hierarchical clustering under the non-standardized
option.
Transcription factor-binding site quest in LOL gene promoters
To generate BLAST comparison files between two genomic DNA sequences of
interest, WebACT (http://www.webact.org/WebACT/generate) was used. The
comparison file along with the two sequences under comparison was then loaded into the
Artemis Comparison Tool (ACT; Release 6; Genome Research LTD., The Sanger
Institute, Cambridge, UK; http://www.sanger.ac.uk/Software) to visualize sequence
alignments on an interactive map. Artemis Release 9 was then used to annotate sequence
features, such as regions of similarity between the two sequences. This method is facile
for similarity searching within promoter regions in N. uncinatum LOL gene clusters to
quickly identify and localize short sequence motifs that are conserved among the LOL
gene promoters. MATCH (http://www.gene-regulation.com/cgi-
bin/pub/programs/match/bin/match.cgi? ) was used for searching transcription factor (TF)
25
binding sites in individual LOL promoter sequences, and also in sequences identified as
having similarities between LOL promoters. TF results from the MATCH search could be
directed to TRANSFAC databases (http://www.gene-regulation.com/cgi-
bin/pub/databases/transfac/search.cgi) automatically to view function information. The
search was restricted by settings of “groups to fungi” and cut-offs as “minimize false
negative matches.” When the cut-offs were set as “minimize false positive matches,”
normally no TF binding sites were found. The reason might be the database had
insufficient information of TF from organisms closely related to Neotyphodium species.
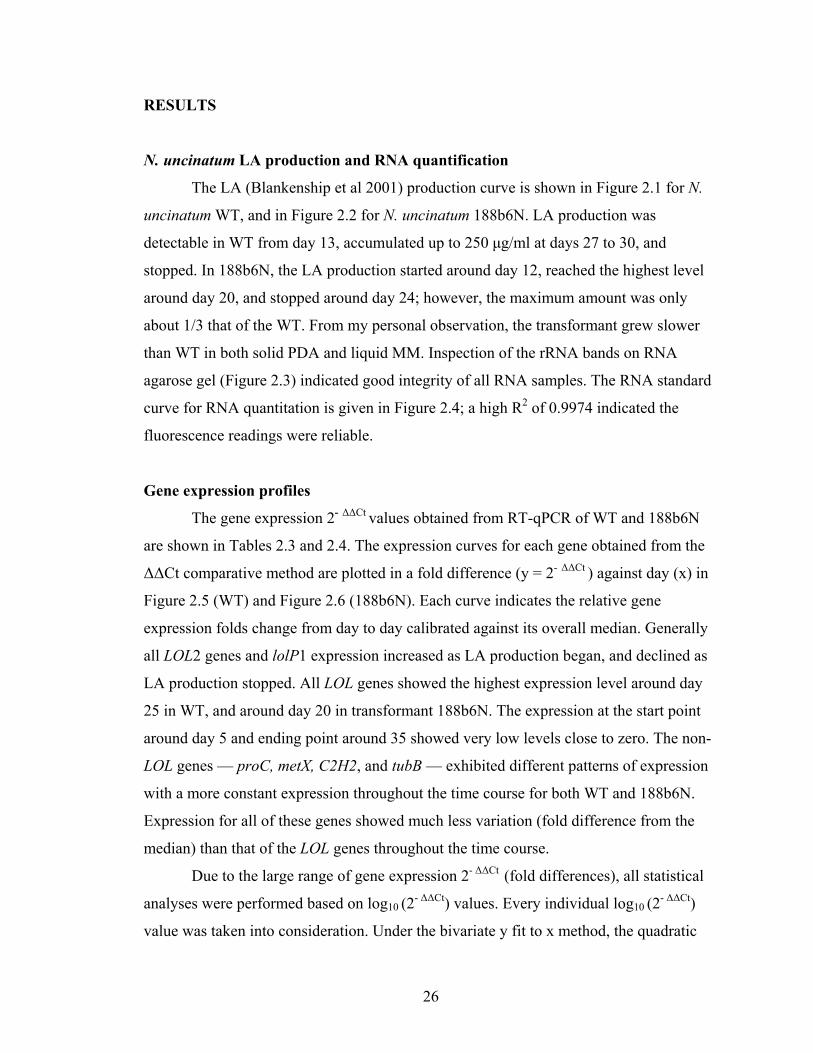
26
RESULTS
N. uncinatum LA production and RNA quantification
The LA (Blankenship et al 2001) production curve is shown in Figure 2.1 for N.
uncinatum WT, and in Figure 2.2 for N. uncinatum 188b6N. LA production was
detectable in WT from day 13, accumulated up to 250 μg/ml at days 27 to 30, and
stopped. In 188b6N, the LA production started around day 12, reached the highest level
around day 20, and stopped around day 24; however, the maximum amount was only
about 1/3 that of the WT. From my personal observation, the transformant grew slower
than WT in both solid PDA and liquid MM. Inspection of the rRNA bands on RNA
agarose gel (Figure 2.3) indicated good integrity of all RNA samples. The RNA standard
curve for RNA quantitation is given in Figure 2.4; a high R2 of 0.9974 indicated the
fluorescence readings were reliable.
Gene expression profiles
The gene expression 2- ΔΔCt values obtained from RT-qPCR of WT and 188b6N
are shown in Tables 2.3 and 2.4. The expression curves for each gene obtained from the
ΔΔCt comparative method are plotted in a fold difference (y = 2- ΔΔCt ) against day (x) in
Figure 2.5 (WT) and Figure 2.6 (188b6N). Each curve indicates the relative gene
expression folds change from day to day calibrated against its overall median. Generally
all LOL2 genes and lolP1 expression increased as LA production began, and declined as
LA production stopped. All LOL genes showed the highest expression level around day
25 in WT, and around day 20 in transformant 188b6N. The expression at the start point
around day 5 and ending point around 35 showed very low levels close to zero. The non-
LOL genes — proC, metX, C2H2, and tubB — exhibited different patterns of expression
with a more constant expression throughout the time course for both WT and 188b6N.
Expression for all of these genes showed much less variation (fold difference from the
median) than that of the LOL genes throughout the time course.
Due to the large range of gene expression 2- ΔΔCt (fold differences), all statistical
analyses were performed based on log10 (2- ΔΔCt) values. Every individual log10 (2- ΔΔCt)
value was taken into consideration. Under the bivariate y fit to x method, the quadratic
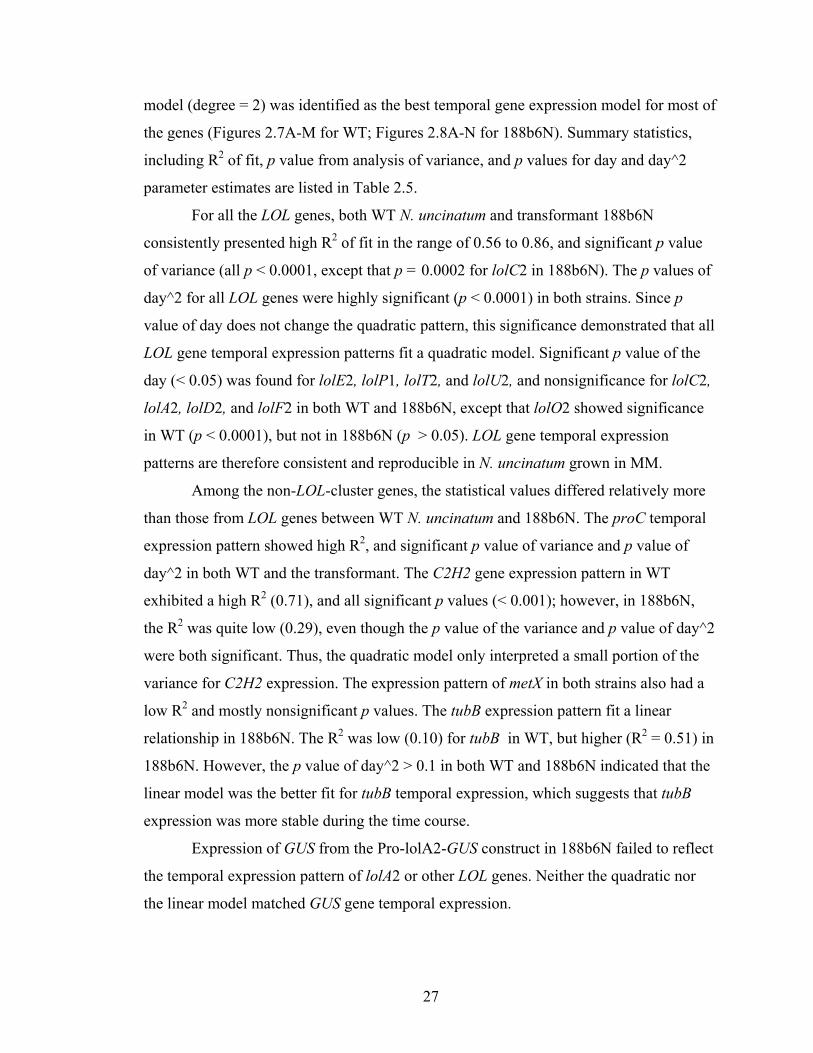
27
model (degree = 2) was identified as the best temporal gene expression model for most of
the genes (Figures 2.7A-M for WT; Figures 2.8A-N for 188b6N). Summary statistics,
including R2 of fit, p value from analysis of variance, and p values for day and day^2
parameter estimates are listed in Table 2.5.
For all the LOL genes, both WT N. uncinatum and transformant 188b6N
consistently presented high R2 of fit in the range of 0.56 to 0.86, and significant p value
of variance (all p < 0.0001, except that p = 0.0002 for lolC2 in 188b6N). The p values of
day^2 for all LOL genes were highly significant (p < 0.0001) in both strains. Since p
value of day does not change the quadratic pattern, this significance demonstrated that all
LOL gene temporal expression patterns fit a quadratic model. Significant p value of the
day (< 0.05) was found for lolE2, lolP1, lolT2, and lolU2, and nonsignificance for lolC2,
lolA2, lolD2, and lolF2 in both WT and 188b6N, except that lolO2 showed significance
in WT (p < 0.0001), but not in 188b6N (p > 0.05). LOL gene temporal expression
patterns are therefore consistent and reproducible in N. uncinatum grown in MM.
Among the non-LOL-cluster genes, the statistical values differed relatively more
than those from LOL genes between WT N. uncinatum and 188b6N. The proC temporal
expression pattern showed high R2, and significant p value of variance and p value of
day^2 in both WT and the transformant. The C2H2 gene expression pattern in WT
exhibited a high R2 (0.71), and all significant p values (< 0.001); however, in 188b6N,
the R2 was quite low (0.29), even though the p value of the variance and p value of day^2
were both significant. Thus, the quadratic model only interpreted a small portion of the
variance for C2H2 expression. The expression pattern of metX in both strains also had a
low R2 and mostly nonsignificant p values. The tubB expression pattern fit a linear
relationship in 188b6N. The R2 was low (0.10) for tubB in WT, but higher (R2 = 0.51) in
188b6N. However, the p value of day^2 > 0.1 in both WT and 188b6N indicated that the
linear model was the better fit for tubB temporal expression, which suggests that tubB
expression was more stable during the time course.
Expression of GUS from the Pro-lolA2-GUS construct in 188b6N failed to reflect
the temporal expression pattern of lolA2 or other LOL genes. Neither the quadratic nor
the linear model matched GUS gene temporal expression.
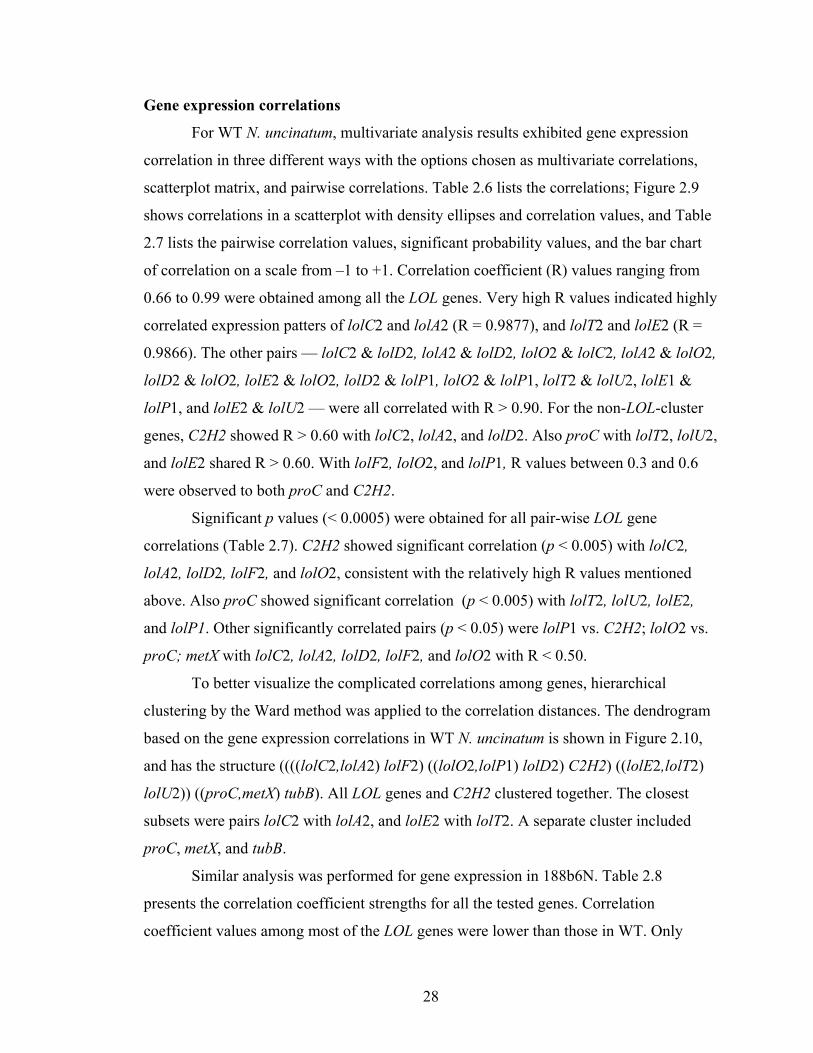
28
Gene expression correlations
For WT N. uncinatum, multivariate analysis results exhibited gene expression
correlation in three different ways with the options chosen as multivariate correlations,
scatterplot matrix, and pairwise correlations. Table 2.6 lists the correlations; Figure 2.9
shows correlations in a scatterplot with density ellipses and correlation values, and Table
2.7 lists the pairwise correlation values, significant probability values, and the bar chart
of correlation on a scale from –1 to +1. Correlation coefficient (R) values ranging from
0.66 to 0.99 were obtained among all the LOL genes. Very high R values indicated highly
correlated expression patters of lolC2 and lolA2 (R = 0.9877), and lolT2 and lolE2 (R =
0.9866). The other pairs — lolC2 & lolD2, lolA2 & lolD2, lolO2 & lolC2, lolA2 & lolO2,
lolD2 & lolO2, lolE2 & lolO2, lolD2 & lolP1, lolO2 & lolP1, lolT2 & lolU2, lolE1 &
lolP1, and lolE2 & lolU2 — were all correlated with R > 0.90. For the non-LOL-cluster
genes, C2H2 showed R > 0.60 with lolC2, lolA2, and lolD2. Also proC with lolT2, lolU2,
and lolE2 shared R > 0.60. With lolF2, lolO2, and lolP1, R values between 0.3 and 0.6
were observed to both proC and C2H2.
Significant p values (< 0.0005) were obtained for all pair-wise LOL gene
correlations (Table 2.7). C2H2 showed significant correlation (p < 0.005) with lolC2,
lolA2, lolD2, lolF2, and lolO2, consistent with the relatively high R values mentioned
above. Also proC showed significant correlation (p < 0.005) with lolT2, lolU2, lolE2,
and lolP1. Other significantly correlated pairs (p < 0.05) were lolP1 vs. C2H2; lolO2 vs.
proC; metX with lolC2, lolA2, lolD2, lolF2, and lolO2 with R < 0.50.
To better visualize the complicated correlations among genes, hierarchical
clustering by the Ward method was applied to the correlation distances. The dendrogram
based on the gene expression correlations in WT N. uncinatum is shown in Figure 2.10,
and has the structure ((((lolC2,lolA2) lolF2) ((lolO2,lolP1) lolD2) C2H2) ((lolE2,lolT2)
lolU2)) ((proC,metX) tubB). All LOL genes and C2H2 clustered together. The closest
subsets were pairs lolC2 with lolA2, and lolE2 with lolT2. A separate cluster included
proC, metX, and tubB.
Similar analysis was performed for gene expression in 188b6N. Table 2.8
presents the correlation coefficient strengths for all the tested genes. Correlation
coefficient values among most of the LOL genes were lower than those in WT. Only
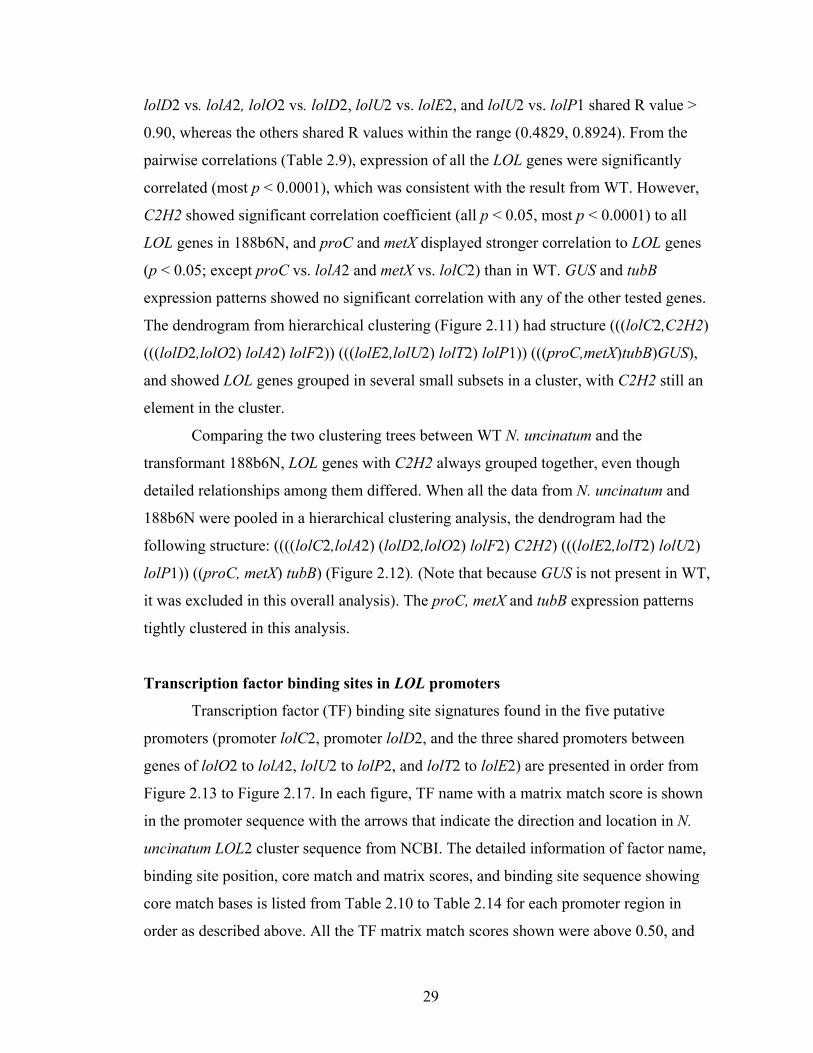
29
lolD2 vs. lolA2, lolO2 vs. lolD2, lolU2 vs. lolE2, and lolU2 vs. lolP1 shared R value >
0.90, whereas the others shared R values within the range (0.4829, 0.8924). From the
pairwise correlations (Table 2.9), expression of all the LOL genes were significantly
correlated (most p < 0.0001), which was consistent with the result from WT. However,
C2H2 showed significant correlation coefficient (all p < 0.05, most p < 0.0001) to all
LOL genes in 188b6N, and proC and metX displayed stronger correlation to LOL genes
(p < 0.05; except proC vs. lolA2 and metX vs. lolC2) than in WT. GUS and tubB
expression patterns showed no significant correlation with any of the other tested genes.
The dendrogram from hierarchical clustering (Figure 2.11) had structure (((lolC2,C2H2)
(((lolD2,lolO2) lolA2) lolF2)) (((lolE2,lolU2) lolT2) lolP1)) (((proC,metX)tubB)GUS),
and showed LOL genes grouped in several small subsets in a cluster, with C2H2 still an
element in the cluster.
Comparing the two clustering trees between WT N. uncinatum and the
transformant 188b6N, LOL genes with C2H2 always grouped together, even though
detailed relationships among them differed. When all the data from N. uncinatum and
188b6N were pooled in a hierarchical clustering analysis, the dendrogram had the
following structure: ((((lolC2,lolA2) (lolD2,lolO2) lolF2) C2H2) (((lolE2,lolT2) lolU2)
lolP1)) ((proC, metX) tubB) (Figure 2.12). (Note that because GUS is not present in WT,
it was excluded in this overall analysis). The proC, metX and tubB expression patterns
tightly clustered in this analysis.
Transcription factor binding sites in LOL promoters
Transcription factor (TF) binding site signatures found in the five putative
promoters (promoter lolC2, promoter lolD2, and the three shared promoters between
genes of lolO2 to lolA2, lolU2 to lolP2, and lolT2 to lolE2) are presented in order from
Figure 2.13 to Figure 2.17. In each figure, TF name with a matrix match score is shown
in the promoter sequence with the arrows that indicate the direction and location in N.
uncinatum LOL2 cluster sequence from NCBI. The detailed information of factor name,
binding site position, core match and matrix scores, and binding site sequence showing
core match bases is listed from Table 2.10 to Table 2.14 for each promoter region in
order as described above. All the TF matrix match scores shown were above 0.50, and
30
core match scores above 0.80. In total, canonical binding sites were identified in LOL
promoters for 15 TFs: AbaA, ABF1, GCN4, GCR1, HAP2/3/4, HSP, MATa1, Mat1-Mc,
MCM1, MIG1, PacC, RAP1, and repressors CAR1, STRE, and StuAP. Among these
binding sites, many were identified in several promoter regions (Table 2.15). Mat1-Mc
and HSF sites were found in all five promoter regions. Based on TRANSFAC databases,
Mat1-Mc is recognized as a TF for fungal genes related to sexual and cell differentiation,
and HSF, as a heat shock TF. Sites for PacC, HAP, and GCR1 were found in all promoter
regions except the shared lolU2 to lolP2 promoter, Pro-lolD2, and Pro-lolC2. TF PacC
was reported in Aspergillus as an activator for genes expressing in alkaline conditions,
but as a suppressor for acidic dependent genes (Orejas et al 1995; Tilburn et al 1995).
HAPs are known as transcriptional activators, and GCR1 as a coactivator of RAP1 and a
regulator of glycolysis genes. MATa1 sites were found in promoter lolD2, lolU2 to lolP2,
and lolT2 to lolE2 regions; Sites for the repressor CAR1 were identified matched in
lolC2, lolD2, lolU2 to lolP2 promoter regions. Sites for GCN4 were present in lolU2 to
lolP2, and lolT2 to lolE2 promoter regions. Sites for STRE were present in Pro-lolD2 and
the shared lolT2 to lolE2 promoter. Sites for StuAP (a cell growth regulator) were found
in promoters of lolA2 to lolO2, and lolU2 to lolP2. Sites for MIG1 (regulating glucose
synthesis), ABF1, and AbaA (regulating spore differentiation) were found in one
promoter each: lolU2 to lolP2, Pro-lolC2, and lolO2 to lolA2 respectively.
Comparisons of promoter regions from N. uncinatum LOL2 cluster in ACT
generated five high identity (> 70%) regions that contained TF sites. A comparison image
generated by ACT is shown in Figure 2.18. The detail information of promoter regions
with percentage of identity, and TF names with binding sites and their sequences, is listed
in Table 2.16. Most of the similarity regions contained Mat1-Mc or HSF binding sites.
31
DISCUSSION
The results of this study indicated that expression of all LOL genes are tightly
correlated with each other during LA production in MM culture. Expression of all tested
LOL genes in MM cultures of WT N. uncinatum and the Pro-lolA2-GUS transformant
188b6N showed a significant temporal quadratic pattern during the process of LA
production, which indicates a relationship between LOL gene expression and LA
production. Gene expression was detectable before LA production was detected, and
increased as LA accumulated. The highest expression level was reached before the
highest LA level was detected in culture, and gene expression level went gradually down
to a very low level after LA level reached a plateau indicating the stop of production.
During the temporal expression, LOL genes were tightly correlated (p < 0.0005) with
each other in both WT and transformant 188b6N. Particularly in WT, lolC, hypothesized
to encode the enzyme catalyzing the first step in loline biosynthesis, and lolA, a gene
putatively involved in recruiting amino acid precursors to the loline pathway, showed
very strong correlation (R = 0.9877; p < 0.0001), as did lolT and lolE, two genes sharing
their promoter regions (R = 0.9866; p < 0.0001).
Expression of the non-LOL-cluster genes, proC (a gene involved in the
biosynthesis of the amino acid, L-proline), C2H2 (a C2H2 transcription factor like gene),
and metX (a gene for synthesis of O-acetylhomoserine, which is involved in the
biosynthesis of lolines as well as the amino acids L-threonine and L-methionine) were
significantly correlated (p < 0.05) with expression of LOL genes in 188b6N with only a
few exceptions, even though overall they showed relatively looser correlation to LOL
gene expression in WT and not all of them showed a significantly similar temporal
expression pattern.
The overall cluster of gene expression correlation coefficients generated from
both WT and 188b6N, ((((lolC2,lolA2) (lolD2,lolO2) lolF2) C2H2) (((lolE2,lolT2) lolU2)
lolP1)) ((proC, metX) tubB), indicated that gene regulation might differ among subsets of
LOL genes. Several interesting observations emerge from this cluster analysis. Deeply
rooted in one cluster is lolP1, which is a gene in the LOL1 cluster and is known to encode
an oxygenation enzyme for converting N-methylloline into N-formylloline (M. J.
32
Spiering, C. L. Schardl, unpublished data) at the end of loline biosynthesis pathway.
Also, C2H2 expression correlated with LOL gene expression, in keeping with the
previous observation that it is also upregulated by culture conditions that induce LA
production and expression of lolC and lolA (Spiering et al 2002). Although the C2H2
gene is not associated with LOL clusters (but preliminary data indicate it is linked to
another secondary metabolism gene), it is conceivable that it plays a role in regulating
LOL gene expression in N. uncinatum under MM culture conditions. Adjacent to lolP1
and C2H2, being rooted relatively deeper than the other LOL genes, are lolU2 and lolF2
respectively. They were actually the only two genes whose expression was detectable in
N. coenophialum MM culture according to previous work (Spiering et al 2005b).
Therefore lolU2 and lolF2 expression might be under different coregulation control from
the other LOL genes. These observations suggest that the hierarchical cluster based on
correlation coefficients from temporal gene expression could help to discover coregulated
subsets and predict sequences involved in the regulation of the LA pathway.
The two other biosynthesis genes analyzed, proC and metX were not tightly
coregulated with LOL genes. Although these genes are involved in LA biosynthesis by
directing synthesis of the proximal LA precursors, those precursors are also involved in
other cellular processes such as synthesis of protein and several other amino acids.
Clusters of LOL genes with correlated expression patterns may provide clues to functions
of the individual genes. For example, it is conceivable that lolA2 might be involved in
early precursor conversions, since it correlates with lolC2, the gene predicted to be
responsible for the first step of the pathway (Schardl et al 2007). Correlation of lolT2
with lolE2 may indicate their involvement in successive steps. The same may be true of
lolO2 and lolD2. Such relationships actually fit well with the previously proposed
involvement of these genes in the pathway, particularly if LolO undertakes the first of the
oxidation steps (Schardl et al 2007). Interestingly, lolT2 and lolE2 are arranged near each
other and transcribed divergently from their common intergenic region. Their tight
correlation may be a direct result of a shared 5’-regulatory region.
The coregulation of LOL gene expression strongly suggests that common
transcription factors among these promoters are important. The common motifs for
ADR1, NIT2, STRE, and PHO4 previously found with PhyloCon (Kutil et al 2007) were
33
rarely found in MATCH search. Possible explanations for this discrepancy may include
the different search algorithms and promoter sequences used. The motifs of these four
TF-binding sites are relatively short, having the potential of false-positive identification.
A MATCH search for the canonical motifs for each of the four factors identified by Kutil
et al (2007) returned NIT2 only after relaxing the MATCH search parameters
(unchecking search for high-quality matrices). Kutil et al (2007) failed to identify longer
high-quality (i.e., containing more informative characters) motifs, such as for PacC found
here. For PhyloCon analysis, the authors placed emphasis on conservation among the five
LOL clusters in the endophyte species analyzed. They performed ClustalW alignments of
LOL promoter sequences by excluding insertion repeats and deletions and those of low
complexity (Kutil et al 2007), possibly causing removal from the analysis of longer and
potentially more variable motifs. In this study, two new common binding sites for
transcription factors, HSF and Mat1-Mc, were found in all five LOL gene promoter
regions. It is intriguing to consider that a homolog of Mat1-Mc, a sexual differentiation
regulator, might play different regulation roles in asexual N. uncinatum. Such a situation
may have precedence in the VeA regulator related to sexual and asexual development in
A. nidulans, which has been found to regulate sterigmatocystin and penicillin
biosynthesis (Kato et al 2003).
Since fungal regulatory genes often are not part of the gene cluster, and global
regulators could be involved in both primary and secondary metabolite gene regulation,
the global regulator could potentially control the clustered gene expression and become a
more powerful gene expression manipulation tool. Thus, it has been reported that
modification of LaeA, a global regulator in A. fumigatus (Bok & Keller 2004), changed
secondary metabolite diversity due to the transcriptional regulation of metabolite genes
(Perrin et al 2007). Therefore, finding global regulators is an appealing avenue for
research. A BLASTX search of the E. festucae E2368 genome sequence revealed a laeA
ortholog with an E value of 1.31e-40, score 434, 106 residues identical over 299 amino
acids. Whether N. uncinatum or other endophyte species also contain LaeA needs to be
tested. Future investigation of the potential global TF, LaeA, as well as C2H2, would be
of great interest.
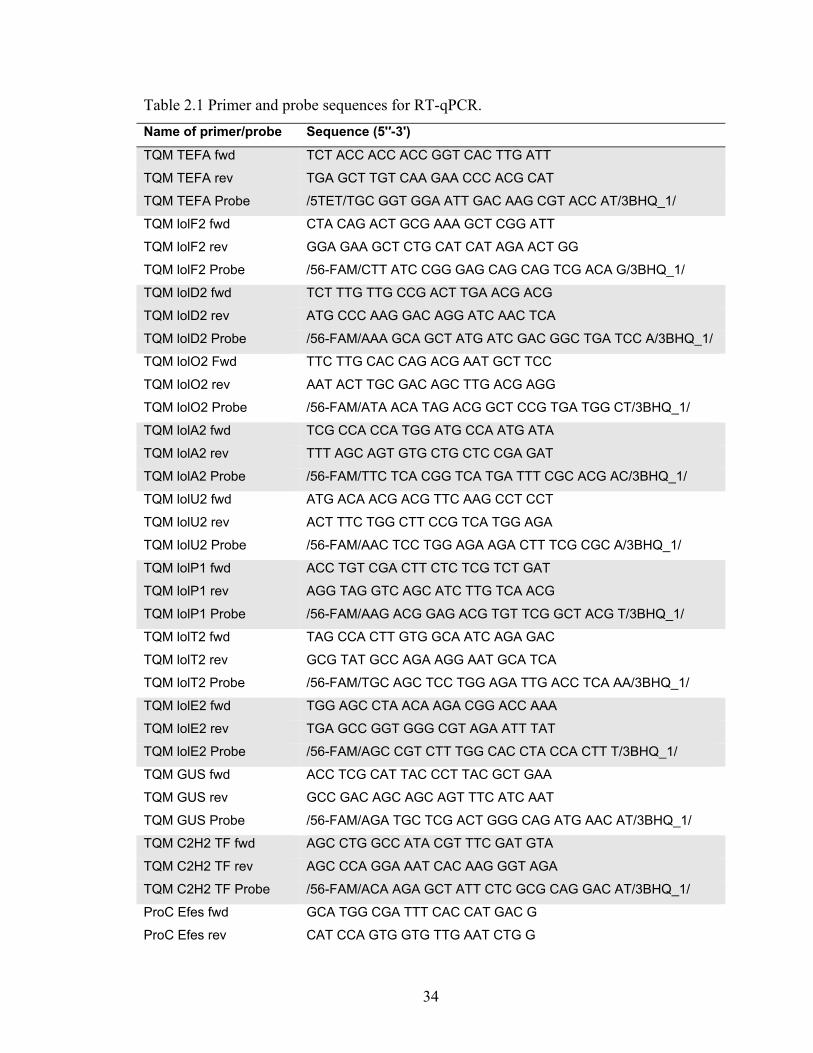
34
Table 2.1 Primer and probe sequences for RT-qPCR. Name of primer/probe Sequence (5'′-3')
TQM TEFA fwd TCT ACC ACC ACC GGT CAC TTG ATT
TQM TEFA rev TGA GCT TGT CAA GAA CCC ACG CAT
TQM TEFA Probe /5TET/TGC GGT GGA ATT GAC AAG CGT ACC AT/3BHQ_1/
TQM lolF2 fwd CTA CAG ACT GCG AAA GCT CGG ATT
TQM lolF2 rev GGA GAA GCT CTG CAT CAT AGA ACT GG TQM lolF2 Probe /56-FAM/CTT ATC CGG GAG CAG CAG TCG ACA G/3BHQ_1/
TQM lolD2 fwd TCT TTG TTG CCG ACT TGA ACG ACG
TQM lolD2 rev ATG CCC AAG GAC AGG ATC AAC TCA
TQM lolD2 Probe /56-FAM/AAA GCA GCT ATG ATC GAC GGC TGA TCC A/3BHQ_1/
TQM lolO2 Fwd TTC TTG CAC CAG ACG AAT GCT TCC
TQM lolO2 rev AAT ACT TGC GAC AGC TTG ACG AGG
TQM lolO2 Probe /56-FAM/ATA ACA TAG ACG GCT CCG TGA TGG CT/3BHQ_1/
TQM lolA2 fwd TCG CCA CCA TGG ATG CCA ATG ATA
TQM lolA2 rev TTT AGC AGT GTG CTG CTC CGA GAT
TQM lolA2 Probe /56-FAM/TTC TCA CGG TCA TGA TTT CGC ACG AC/3BHQ_1/
TQM lolU2 fwd ATG ACA ACG ACG TTC AAG CCT CCT
TQM lolU2 rev ACT TTC TGG CTT CCG TCA TGG AGA
TQM lolU2 Probe /56-FAM/AAC TCC TGG AGA AGA CTT TCG CGC A/3BHQ_1/
TQM lolP1 fwd ACC TGT CGA CTT CTC TCG TCT GAT
TQM lolP1 rev AGG TAG GTC AGC ATC TTG TCA ACG
TQM lolP1 Probe /56-FAM/AAG ACG GAG ACG TGT TCG GCT ACG T/3BHQ_1/
TQM lolT2 fwd TAG CCA CTT GTG GCA ATC AGA GAC
TQM lolT2 rev GCG TAT GCC AGA AGG AAT GCA TCA
TQM lolT2 Probe /56-FAM/TGC AGC TCC TGG AGA TTG ACC TCA AA/3BHQ_1/
TQM lolE2 fwd TGG AGC CTA ACA AGA CGG ACC AAA
TQM lolE2 rev TGA GCC GGT GGG CGT AGA ATT TAT
TQM lolE2 Probe /56-FAM/AGC CGT CTT TGG CAC CTA CCA CTT T/3BHQ_1/
TQM GUS fwd ACC TCG CAT TAC CCT TAC GCT GAA
TQM GUS rev GCC GAC AGC AGC AGT TTC ATC AAT
TQM GUS Probe /56-FAM/AGA TGC TCG ACT GGG CAG ATG AAC AT/3BHQ_1/
TQM C2H2 TF fwd AGC CTG GCC ATA CGT TTC GAT GTA
TQM C2H2 TF rev AGC CCA GGA AAT CAC AAG GGT AGA
TQM C2H2 TF Probe /56-FAM/ACA AGA GCT ATT CTC GCG CAG GAC AT/3BHQ_1/
ProC Efes fwd GCA TGG CGA TTT CAC CAT GAC G
ProC Efes rev CAT CCA GTG GTG TTG AAT CTG G
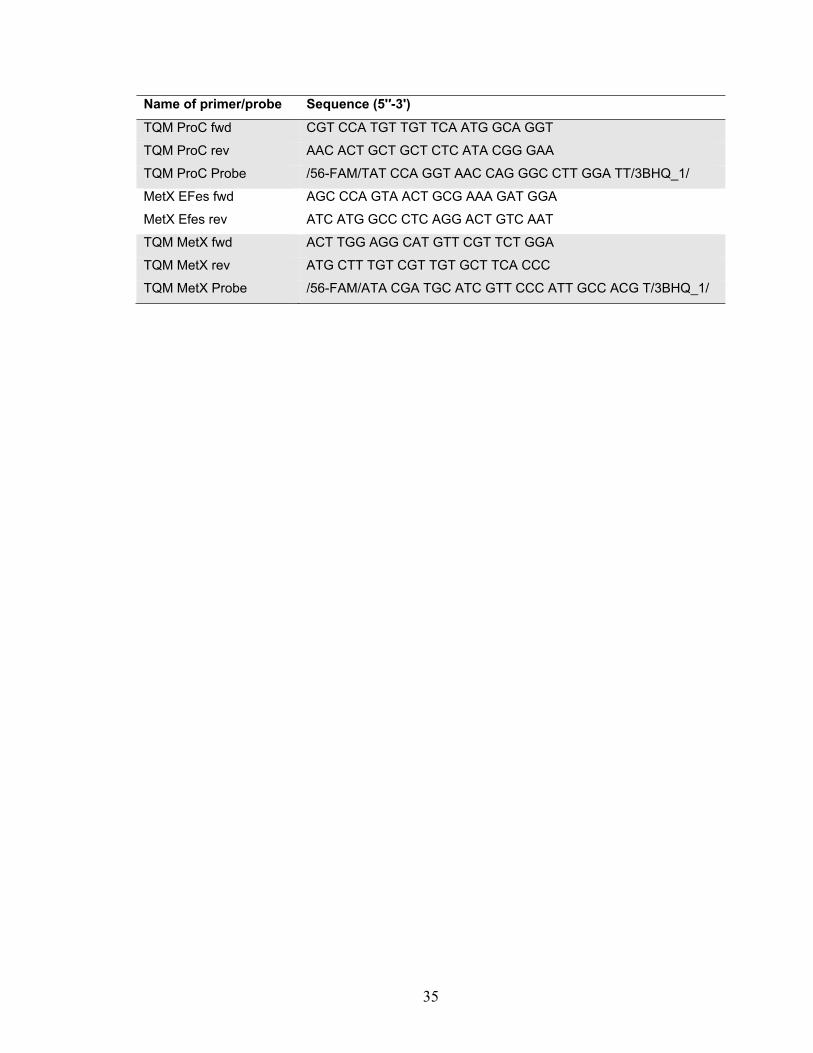
35
Name of primer/probe Sequence (5'′-3')
TQM ProC fwd CGT CCA TGT TGT TCA ATG GCA GGT
TQM ProC rev AAC ACT GCT GCT CTC ATA CGG GAA
TQM ProC Probe /56-FAM/TAT CCA GGT AAC CAG GGC CTT GGA TT/3BHQ_1/
MetX EFes fwd AGC CCA GTA ACT GCG AAA GAT GGA
MetX Efes rev ATC ATG GCC CTC AGG ACT GTC AAT
TQM MetX fwd ACT TGG AGG CAT GTT CGT TCT GGA
TQM MetX rev ATG CTT TGT CGT TGT GCT TCA CCC
TQM MetX Probe /56-FAM/ATA CGA TGC ATC GTT CCC ATT GCC ACG T/3BHQ_1/
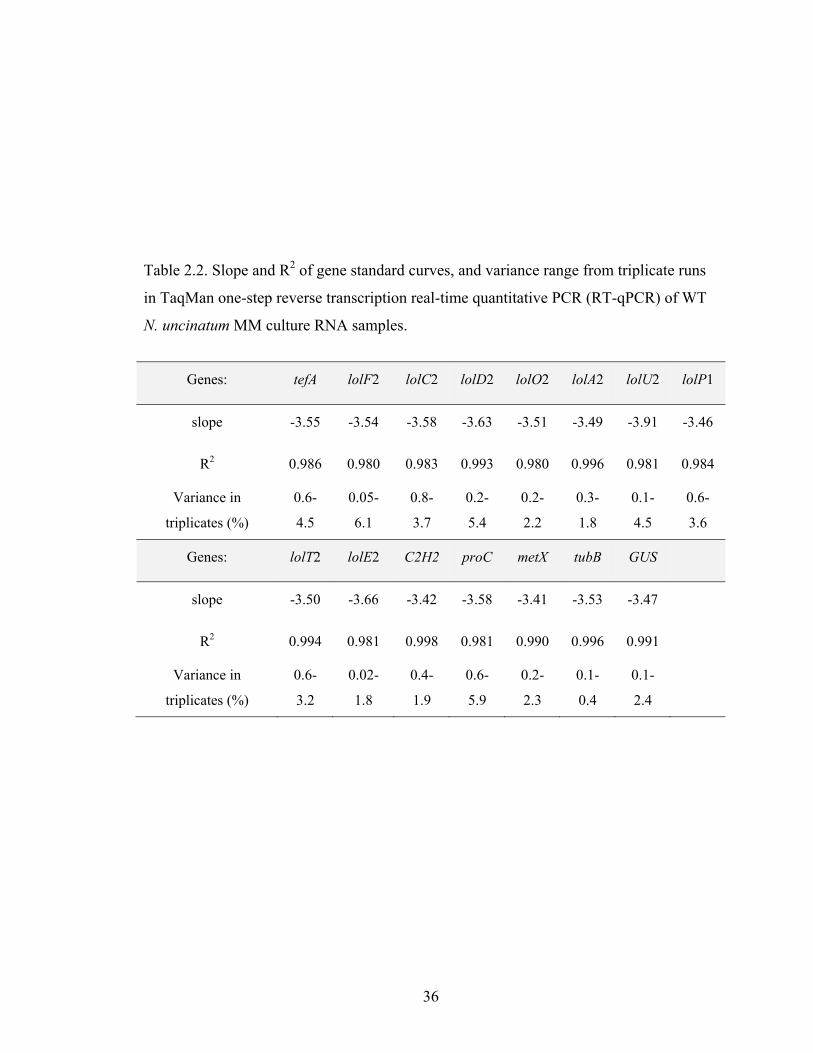
36
Table 2.2. Slope and R2 of gene standard curves, and variance range from triplicate runs
in TaqMan one-step reverse transcription real-time quantitative PCR (RT-qPCR) of WT
N. uncinatum MM culture RNA samples.
Genes: tefA lolF2 lolC2 lolD2 lolO2 lolA2 lolU2 lolP1
slope -3.55 -3.54 -3.58 -3.63 -3.51 -3.49 -3.91 -3.46
R2 0.986 0.980 0.983 0.993 0.980 0.996 0.981 0.984
Variance in
triplicates (%)
0.6-
4.5
0.05-
6.1
0.8-
3.7
0.2-
5.4
0.2-
2.2
0.3-
1.8
0.1-
4.5
0.6-
3.6
Genes: lolT2 lolE2 C2H2 proC metX tubB GUS
slope -3.50 -3.66 -3.42 -3.58 -3.41 -3.53 -3.47
R2 0.994 0.981 0.998 0.981 0.990 0.996 0.991
Variance in
triplicates (%)
0.6-
3.2
0.02-
1.8
0.4-
1.9
0.6-
5.9
0.2-
2.3
0.1-
0.4
0.1-
2.4
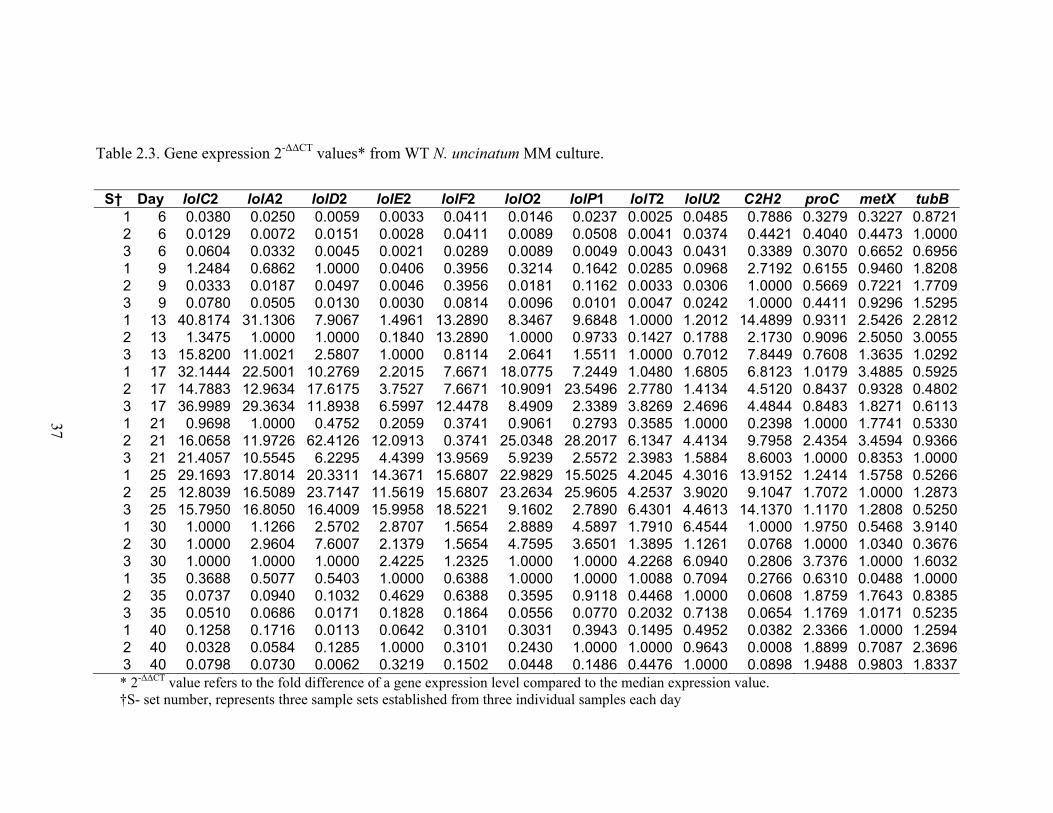
37
Table 2.3. Gene expression 2-ΔΔCT values* from WT N. uncinatum MM culture.
S† Day lolC2 lolA2 lolD2 lolE2 lolF2 lolO2 lolP1 lolT2 lolU2 C2H2 proC metX tubB
1 6 0.0380 0.0250 0.0059 0.0033 0.0411 0.0146 0.0237 0.0025 0.0485 0.7886 0.3279 0.3227 0.87212 6 0.0129 0.0072 0.0151 0.0028 0.0411 0.0089 0.0508 0.0041 0.0374 0.4421 0.4040 0.4473 1.00003 6 0.0604 0.0332 0.0045 0.0021 0.0289 0.0089 0.0049 0.0043 0.0431 0.3389 0.3070 0.6652 0.69561 9 1.2484 0.6862 1.0000 0.0406 0.3956 0.3214 0.1642 0.0285 0.0968 2.7192 0.6155 0.9460 1.82082 9 0.0333 0.0187 0.0497 0.0046 0.3956 0.0181 0.1162 0.0033 0.0306 1.0000 0.5669 0.7221 1.77093 9 0.0780 0.0505 0.0130 0.0030 0.0814 0.0096 0.0101 0.0047 0.0242 1.0000 0.4411 0.9296 1.52951 13 40.8174 31.1306 7.9067 1.4961 13.2890 8.3467 9.6848 1.0000 1.2012 14.4899 0.9311 2.5426 2.28122 13 1.3475 1.0000 1.0000 0.1840 13.2890 1.0000 0.9733 0.1427 0.1788 2.1730 0.9096 2.5050 3.00553 13 15.8200 11.0021 2.5807 1.0000 0.8114 2.0641 1.5511 1.0000 0.7012 7.8449 0.7608 1.3635 1.02921 17 32.1444 22.5001 10.2769 2.2015 7.6671 18.0775 7.2449 1.0480 1.6805 6.8123 1.0179 3.4885 0.59252 17 14.7883 12.9634 17.6175 3.7527 7.6671 10.9091 23.5496 2.7780 1.4134 4.5120 0.8437 0.9328 0.48023 17 36.9989 29.3634 11.8938 6.5997 12.4478 8.4909 2.3389 3.8269 2.4696 4.4844 0.8483 1.8271 0.61131 21 0.9698 1.0000 0.4752 0.2059 0.3741 0.9061 0.2793 0.3585 1.0000 0.2398 1.0000 1.7741 0.53302 21 16.0658 11.9726 62.4126 12.0913 0.3741 25.0348 28.2017 6.1347 4.4134 9.7958 2.4354 3.4594 0.93663 21 21.4057 10.5545 6.2295 4.4399 13.9569 5.9239 2.5572 2.3983 1.5884 8.6003 1.0000 0.8353 1.00001 25 29.1693 17.8014 20.3311 14.3671 15.6807 22.9829 15.5025 4.2045 4.3016 13.9152 1.2414 1.5758 0.52662 25 12.8039 16.5089 23.7147 11.5619 15.6807 23.2634 25.9605 4.2537 3.9020 9.1047 1.7072 1.0000 1.28733 25 15.7950 16.8050 16.4009 15.9958 18.5221 9.1602 2.7890 6.4301 4.4613 14.1370 1.1170 1.2808 0.52501 30 1.0000 1.1266 2.5702 2.8707 1.5654 2.8889 4.5897 1.7910 6.4544 1.0000 1.9750 0.5468 3.91402 30 1.0000 2.9604 7.6007 2.1379 1.5654 4.7595 3.6501 1.3895 1.1261 0.0768 1.0000 1.0340 0.36763 30 1.0000 1.0000 1.0000 2.4225 1.2325 1.0000 1.0000 4.2268 6.0940 0.2806 3.7376 1.0000 1.60321 35 0.3688 0.5077 0.5403 1.0000 0.6388 1.0000 1.0000 1.0088 0.7094 0.2766 0.6310 0.0488 1.00002 35 0.0737 0.0940 0.1032 0.4629 0.6388 0.3595 0.9118 0.4468 1.0000 0.0608 1.8759 1.7643 0.83853 35 0.0510 0.0686 0.0171 0.1828 0.1864 0.0556 0.0770 0.2032 0.7138 0.0654 1.1769 1.0171 0.52351 40 0.1258 0.1716 0.0113 0.0642 0.3101 0.3031 0.3943 0.1495 0.4952 0.0382 2.3366 1.0000 1.25942 40 0.0328 0.0584 0.1285 1.0000 0.3101 0.2430 1.0000 1.0000 0.9643 0.0008 1.8899 0.7087 2.36963 40 0.0798 0.0730 0.0062 0.3219 0.1502 0.0448 0.1486 0.4476 1.0000 0.0898 1.9488 0.9803 1.8337* 2-ΔΔCT value refers to the fold difference of a gene expression level compared to the median expression value. †S- set number, represents three sample sets established from three individual samples each day
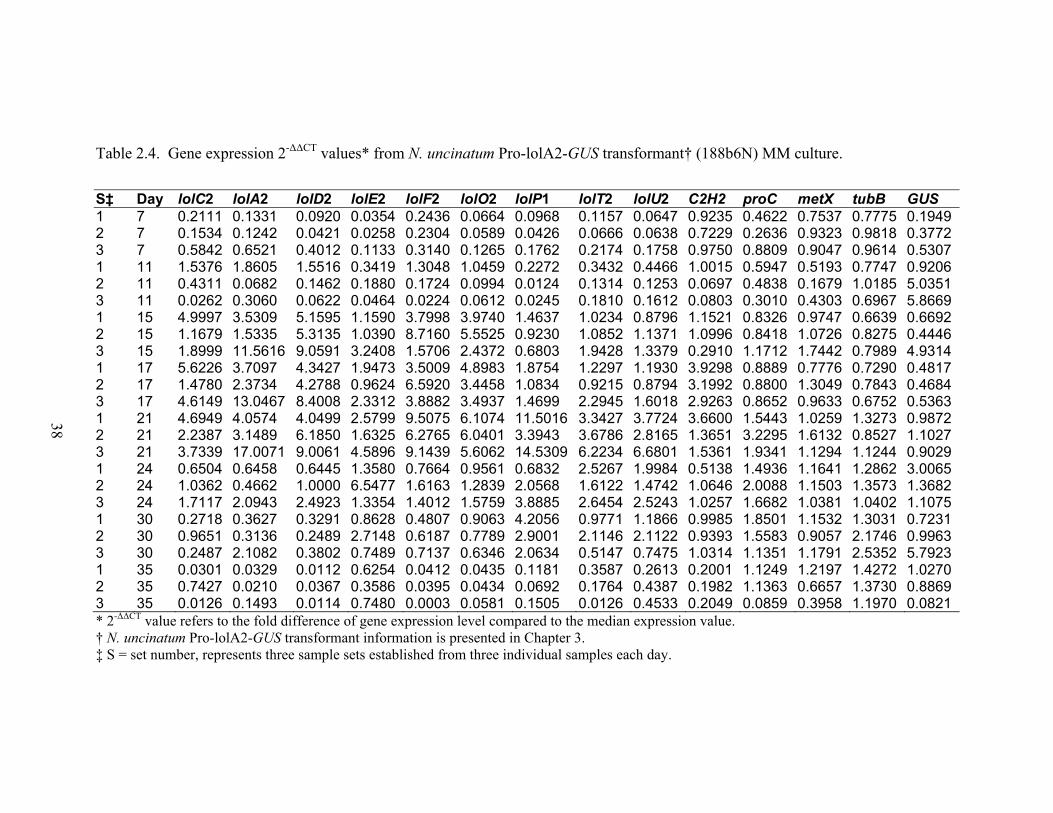
38
Table 2.4. Gene expression 2-ΔΔCT values* from N. uncinatum Pro-lolA2-GUS transformant† (188b6N) MM culture.
S‡ Day lolC2 lolA2 lolD2 lolE2 lolF2 lolO2 lolP1 lolT2 lolU2 C2H2 proC metX tubB GUS 1 7 0.2111 0.1331 0.0920 0.0354 0.2436 0.0664 0.0968 0.1157 0.0647 0.9235 0.4622 0.7537 0.7775 0.19492 7 0.1534 0.1242 0.0421 0.0258 0.2304 0.0589 0.0426 0.0666 0.0638 0.7229 0.2636 0.9323 0.9818 0.37723 7 0.5842 0.6521 0.4012 0.1133 0.3140 0.1265 0.1762 0.2174 0.1758 0.9750 0.8809 0.9047 0.9614 0.53071 11 1.5376 1.8605 1.5516 0.3419 1.3048 1.0459 0.2272 0.3432 0.4466 1.0015 0.5947 0.5193 0.7747 0.92062 11 0.4311 0.0682 0.1462 0.1880 0.1724 0.0994 0.0124 0.1314 0.1253 0.0697 0.4838 0.1679 1.0185 5.03513 11 0.0262 0.3060 0.0622 0.0464 0.0224 0.0612 0.0245 0.1810 0.1612 0.0803 0.3010 0.4303 0.6967 5.86691 15 4.9997 3.5309 5.1595 1.1590 3.7998 3.9740 1.4637 1.0234 0.8796 1.1521 0.8326 0.9747 0.6639 0.66922 15 1.1679 1.5335 5.3135 1.0390 8.7160 5.5525 0.9230 1.0852 1.1371 1.0996 0.8418 1.0726 0.8275 0.44463 15 1.8999 11.5616 9.0591 3.2408 1.5706 2.4372 0.6803 1.9428 1.3379 0.2910 1.1712 1.7442 0.7989 4.93141 17 5.6226 3.7097 4.3427 1.9473 3.5009 4.8983 1.8754 1.2297 1.1930 3.9298 0.8889 0.7776 0.7290 0.48172 17 1.4780 2.3734 4.2788 0.9624 6.5920 3.4458 1.0834 0.9215 0.8794 3.1992 0.8800 1.3049 0.7843 0.46843 17 4.6149 13.0467 8.4008 2.3312 3.8882 3.4937 1.4699 2.2945 1.6018 2.9263 0.8652 0.9633 0.6752 0.53631 21 4.6949 4.0574 4.0499 2.5799 9.5075 6.1074 11.5016 3.3427 3.7724 3.6600 1.5443 1.0259 1.3273 0.98722 21 2.2387 3.1489 6.1850 1.6325 6.2765 6.0401 3.3943 3.6786 2.8165 1.3651 3.2295 1.6132 0.8527 1.10273 21 3.7339 17.0071 9.0061 4.5896 9.1439 5.6062 14.5309 6.2234 6.6801 1.5361 1.9341 1.1294 1.1244 0.90291 24 0.6504 0.6458 0.6445 1.3580 0.7664 0.9561 0.6832 2.5267 1.9984 0.5138 1.4936 1.1641 1.2862 3.00652 24 1.0362 0.4662 1.0000 6.5477 1.6163 1.2839 2.0568 1.6122 1.4742 1.0646 2.0088 1.1503 1.3573 1.36823 24 1.7117 2.0943 2.4923 1.3354 1.4012 1.5759 3.8885 2.6454 2.5243 1.0257 1.6682 1.0381 1.0402 1.10751 30 0.2718 0.3627 0.3291 0.8628 0.4807 0.9063 4.2056 0.9771 1.1866 0.9985 1.8501 1.1532 1.3031 0.72312 30 0.9651 0.3136 0.2489 2.7148 0.6187 0.7789 2.9001 2.1146 2.1122 0.9393 1.5583 0.9057 2.1746 0.99633 30 0.2487 2.1082 0.3802 0.7489 0.7137 0.6346 2.0634 0.5147 0.7475 1.0314 1.1351 1.1791 2.5352 5.79231 35 0.0301 0.0329 0.0112 0.6254 0.0412 0.0435 0.1181 0.3587 0.2613 0.2001 1.1249 1.2197 1.4272 1.02702 35 0.7427 0.0210 0.0367 0.3586 0.0395 0.0434 0.0692 0.1764 0.4387 0.1982 1.1363 0.6657 1.3730 0.88693 35 0.0126 0.1493 0.0114 0.7480 0.0003 0.0581 0.1505 0.0126 0.4533 0.2049 0.0859 0.3958 1.1970 0.0821* 2-ΔΔCT value refers to the fold difference of gene expression level compared to the median expression value. † N. uncinatum Pro-lolA2-GUS transformant information is presented in Chapter 3. ‡ S = set number, represents three sample sets established from three individual samples each day.
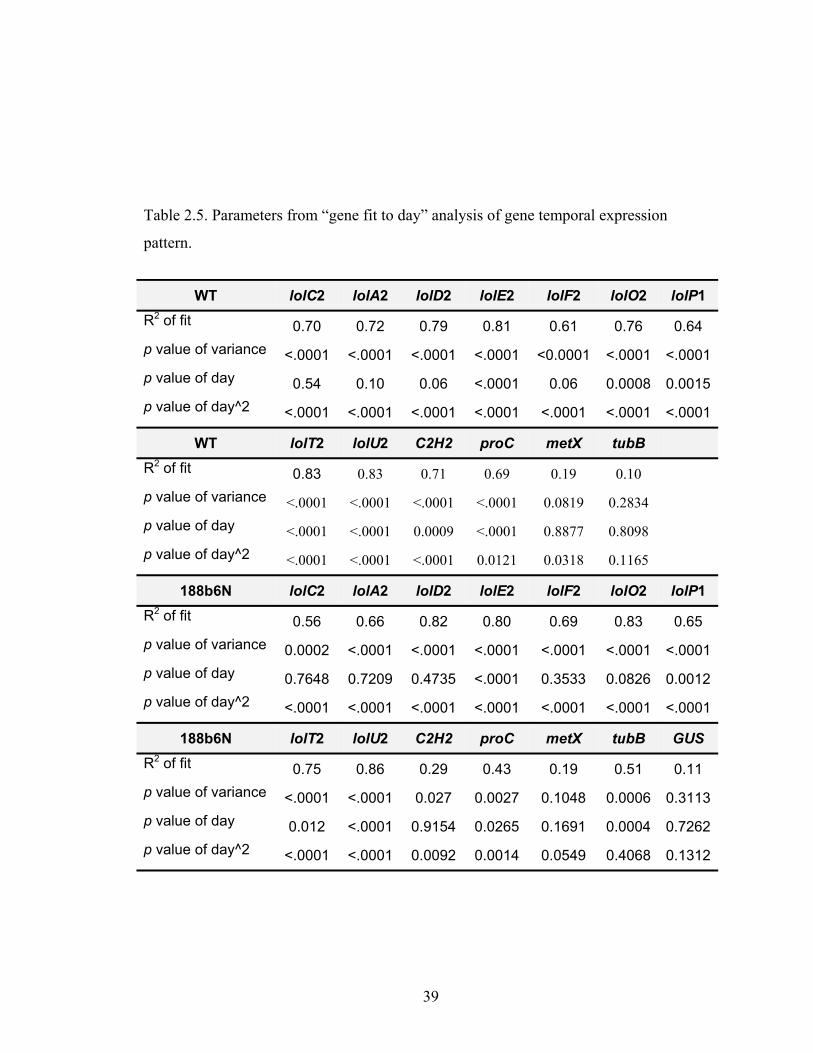
39
Table 2.5. Parameters from “gene fit to day” analysis of gene temporal expression
pattern.
WT lolC2 lolA2 lolD2 lolE2 lolF2 lolO2 lolP1
R2 of fit 0.70 0.72 0.79 0.81 0.61 0.76 0.64 p value of variance <.0001 <.0001 <.0001 <.0001 <0.0001 <.0001 <.0001p value of day 0.54 0.10 0.06 <.0001 0.06 0.0008 0.0015p value of day^2 <.0001 <.0001 <.0001 <.0001 <.0001 <.0001 <.0001
WT lolT2 lolU2 C2H2 proC metX tubB R2 of fit 0.83 0.83 0.71 0.69 0.19 0.10 p value of variance <.0001 <.0001 <.0001 <.0001 0.0819 0.2834 p value of day <.0001 <.0001 0.0009 <.0001 0.8877 0.8098 p value of day^2 <.0001 <.0001 <.0001 0.0121 0.0318 0.1165
188b6N lolC2 lolA2 lolD2 lolE2 lolF2 lolO2 lolP1 R2 of fit 0.56 0.66 0.82 0.80 0.69 0.83 0.65 p value of variance 0.0002 <.0001 <.0001 <.0001 <.0001 <.0001 <.0001p value of day 0.7648 0.7209 0.4735 <.0001 0.3533 0.0826 0.0012p value of day^2 <.0001 <.0001 <.0001 <.0001 <.0001 <.0001 <.0001
188b6N lolT2 lolU2 C2H2 proC metX tubB GUS R2 of fit 0.75 0.86 0.29 0.43 0.19 0.51 0.11 p value of variance <.0001 <.0001 0.027 0.0027 0.1048 0.0006 0.3113p value of day 0.012 <.0001 0.9154 0.0265 0.1691 0.0004 0.7262p value of day^2 <.0001 <.0001 0.0092 0.0014 0.0549 0.4068 0.1312
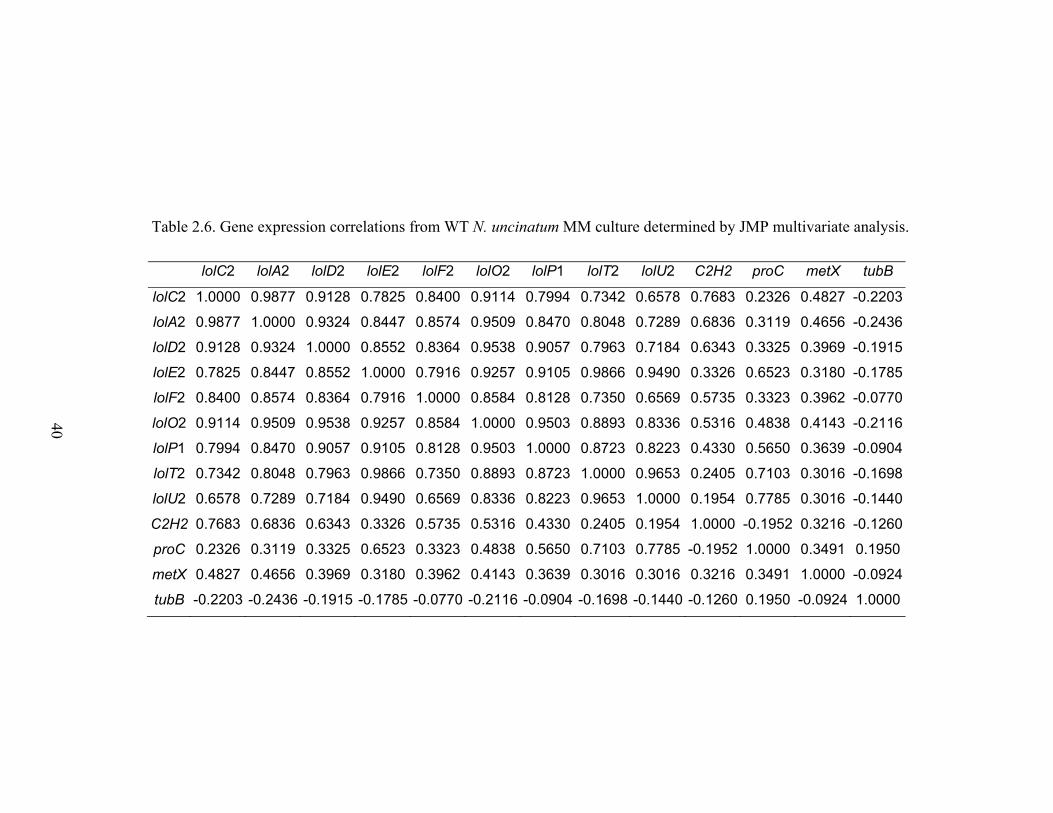
40
Table 2.6. Gene expression correlations from WT N. uncinatum MM culture determined by JMP multivariate analysis.
lolC2 lolA2 lolD2 lolE2 lolF2 lolO2 lolP1 lolT2 lolU2 C2H2 proC metX tubB
lolC2 1.0000 0.9877 0.9128 0.7825 0.8400 0.9114 0.7994 0.7342 0.6578 0.7683 0.2326 0.4827 -0.2203
lolA2 0.9877 1.0000 0.9324 0.8447 0.8574 0.9509 0.8470 0.8048 0.7289 0.6836 0.3119 0.4656 -0.2436
lolD2 0.9128 0.9324 1.0000 0.8552 0.8364 0.9538 0.9057 0.7963 0.7184 0.6343 0.3325 0.3969 -0.1915
lolE2 0.7825 0.8447 0.8552 1.0000 0.7916 0.9257 0.9105 0.9866 0.9490 0.3326 0.6523 0.3180 -0.1785
lolF2 0.8400 0.8574 0.8364 0.7916 1.0000 0.8584 0.8128 0.7350 0.6569 0.5735 0.3323 0.3962 -0.0770
lolO2 0.9114 0.9509 0.9538 0.9257 0.8584 1.0000 0.9503 0.8893 0.8336 0.5316 0.4838 0.4143 -0.2116
lolP1 0.7994 0.8470 0.9057 0.9105 0.8128 0.9503 1.0000 0.8723 0.8223 0.4330 0.5650 0.3639 -0.0904
lolT2 0.7342 0.8048 0.7963 0.9866 0.7350 0.8893 0.8723 1.0000 0.9653 0.2405 0.7103 0.3016 -0.1698
lolU2 0.6578 0.7289 0.7184 0.9490 0.6569 0.8336 0.8223 0.9653 1.0000 0.1954 0.7785 0.3016 -0.1440
C2H2 0.7683 0.6836 0.6343 0.3326 0.5735 0.5316 0.4330 0.2405 0.1954 1.0000 -0.1952 0.3216 -0.1260
proC 0.2326 0.3119 0.3325 0.6523 0.3323 0.4838 0.5650 0.7103 0.7785 -0.1952 1.0000 0.3491 0.1950
metX 0.4827 0.4656 0.3969 0.3180 0.3962 0.4143 0.3639 0.3016 0.3016 0.3216 0.3491 1.0000 -0.0924
tubB -0.2203 -0.2436 -0.1915 -0.1785 -0.0770 -0.2116 -0.0904 -0.1698 -0.1440 -0.1260 0.1950 -0.0924 1.0000
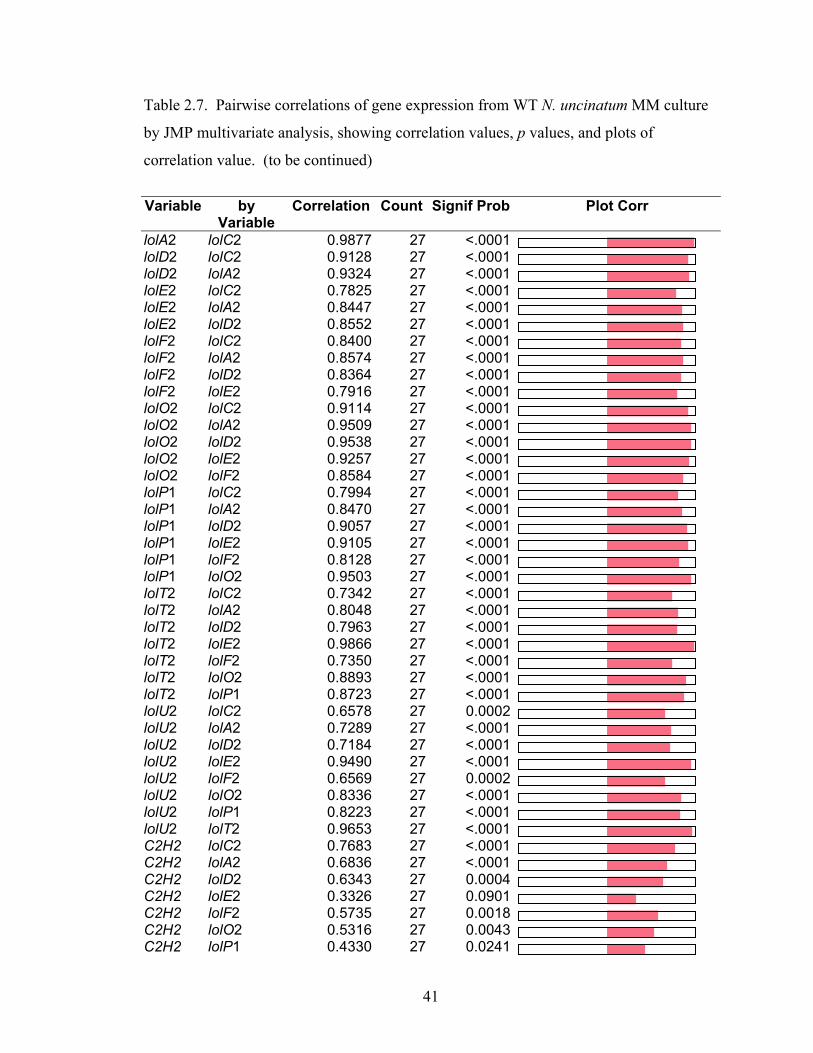
41
Table 2.7. Pairwise correlations of gene expression from WT N. uncinatum MM culture
by JMP multivariate analysis, showing correlation values, p values, and plots of
correlation value. (to be continued)
Variable by
Variable Correlation Count Signif Prob Plot Corr
lolA2 lolC2 0.9877 27 <.0001lolD2 lolC2 0.9128 27 <.0001lolD2 lolA2 0.9324 27 <.0001lolE2 lolC2 0.7825 27 <.0001lolE2 lolA2 0.8447 27 <.0001lolE2 lolD2 0.8552 27 <.0001lolF2 lolC2 0.8400 27 <.0001lolF2 lolA2 0.8574 27 <.0001lolF2 lolD2 0.8364 27 <.0001lolF2 lolE2 0.7916 27 <.0001lolO2 lolC2 0.9114 27 <.0001lolO2 lolA2 0.9509 27 <.0001lolO2 lolD2 0.9538 27 <.0001lolO2 lolE2 0.9257 27 <.0001lolO2 lolF2 0.8584 27 <.0001lolP1 lolC2 0.7994 27 <.0001lolP1 lolA2 0.8470 27 <.0001lolP1 lolD2 0.9057 27 <.0001lolP1 lolE2 0.9105 27 <.0001lolP1 lolF2 0.8128 27 <.0001lolP1 lolO2 0.9503 27 <.0001lolT2 lolC2 0.7342 27 <.0001lolT2 lolA2 0.8048 27 <.0001lolT2 lolD2 0.7963 27 <.0001lolT2 lolE2 0.9866 27 <.0001lolT2 lolF2 0.7350 27 <.0001lolT2 lolO2 0.8893 27 <.0001lolT2 lolP1 0.8723 27 <.0001lolU2 lolC2 0.6578 27 0.0002lolU2 lolA2 0.7289 27 <.0001lolU2 lolD2 0.7184 27 <.0001lolU2 lolE2 0.9490 27 <.0001lolU2 lolF2 0.6569 27 0.0002lolU2 lolO2 0.8336 27 <.0001lolU2 lolP1 0.8223 27 <.0001lolU2 lolT2 0.9653 27 <.0001C2H2 lolC2 0.7683 27 <.0001C2H2 lolA2 0.6836 27 <.0001C2H2 lolD2 0.6343 27 0.0004C2H2 lolE2 0.3326 27 0.0901C2H2 lolF2 0.5735 27 0.0018C2H2 lolO2 0.5316 27 0.0043C2H2 lolP1 0.4330 27 0.0241
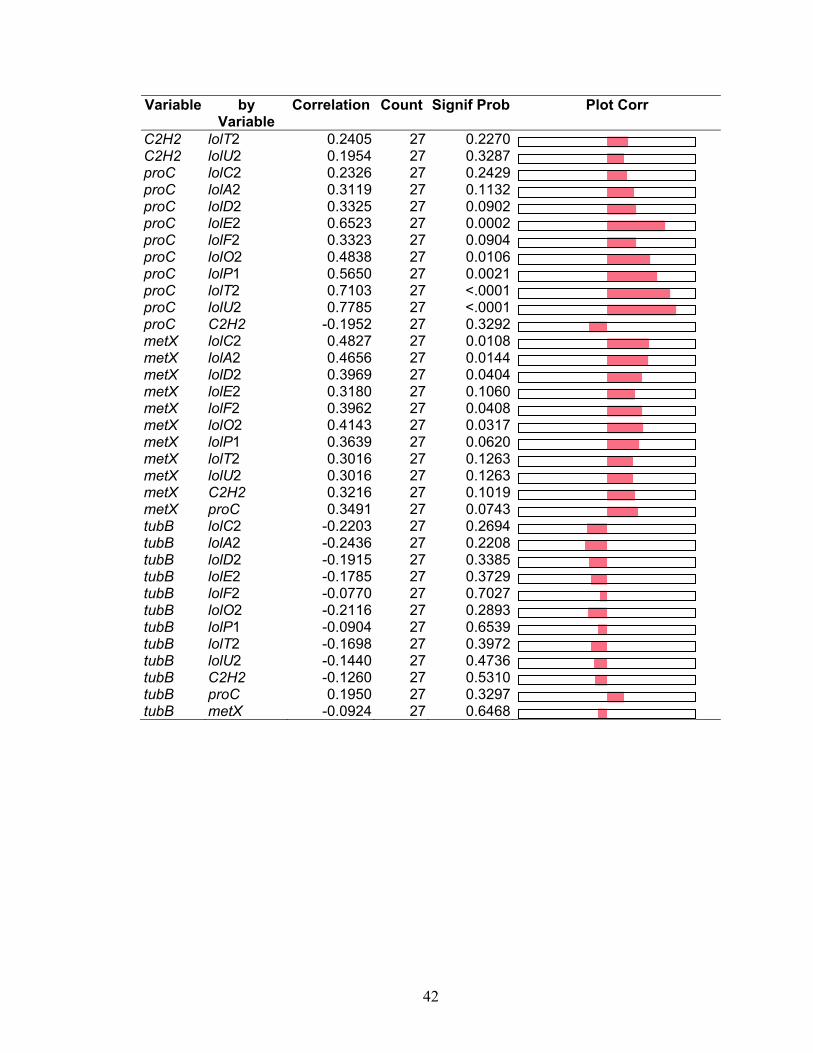
42
Variable by Variable
Correlation Count Signif Prob Plot Corr
C2H2 lolT2 0.2405 27 0.2270C2H2 lolU2 0.1954 27 0.3287proC lolC2 0.2326 27 0.2429proC lolA2 0.3119 27 0.1132proC lolD2 0.3325 27 0.0902proC lolE2 0.6523 27 0.0002proC lolF2 0.3323 27 0.0904proC lolO2 0.4838 27 0.0106proC lolP1 0.5650 27 0.0021proC lolT2 0.7103 27 <.0001proC lolU2 0.7785 27 <.0001proC C2H2 -0.1952 27 0.3292metX lolC2 0.4827 27 0.0108metX lolA2 0.4656 27 0.0144metX lolD2 0.3969 27 0.0404metX lolE2 0.3180 27 0.1060metX lolF2 0.3962 27 0.0408metX lolO2 0.4143 27 0.0317metX lolP1 0.3639 27 0.0620metX lolT2 0.3016 27 0.1263metX lolU2 0.3016 27 0.1263metX C2H2 0.3216 27 0.1019metX proC 0.3491 27 0.0743tubB lolC2 -0.2203 27 0.2694tubB lolA2 -0.2436 27 0.2208tubB lolD2 -0.1915 27 0.3385tubB lolE2 -0.1785 27 0.3729tubB lolF2 -0.0770 27 0.7027tubB lolO2 -0.2116 27 0.2893tubB lolP1 -0.0904 27 0.6539tubB lolT2 -0.1698 27 0.3972tubB lolU2 -0.1440 27 0.4736tubB C2H2 -0.1260 27 0.5310tubB proC 0.1950 27 0.3297tubB metX -0.0924 27 0.6468
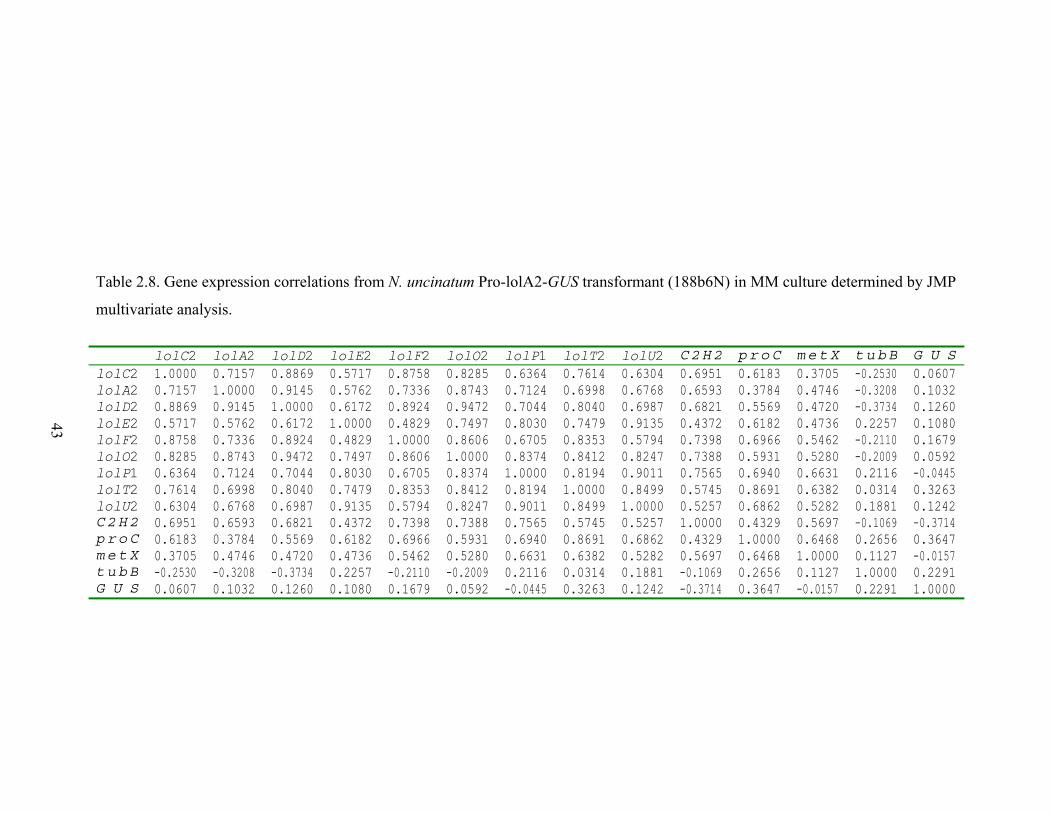
43
Table 2.8. Gene expression correlations from N. uncinatum Pro-lolA2-GUS transformant (188b6N) in MM culture determined by JMP
multivariate analysis.
lolC2 lolA2 lolD2 lolE2 lolF2 lolO2 lolP1 lolT2 lolU2 C2H2 proC metX tubB G U SlolC2 1.0000 0.7157 0.8869 0.5717 0.8758 0.8285 0.6364 0.7614 0.6304 0.6951 0.6183 0.3705 -0.2530 0.0607lolA2 0.7157 1.0000 0.9145 0.5762 0.7336 0.8743 0.7124 0.6998 0.6768 0.6593 0.3784 0.4746 -0.3208 0.1032lolD2 0.8869 0.9145 1.0000 0.6172 0.8924 0.9472 0.7044 0.8040 0.6987 0.6821 0.5569 0.4720 -0.3734 0.1260lolE2 0.5717 0.5762 0.6172 1.0000 0.4829 0.7497 0.8030 0.7479 0.9135 0.4372 0.6182 0.4736 0.2257 0.1080lolF2 0.8758 0.7336 0.8924 0.4829 1.0000 0.8606 0.6705 0.8353 0.5794 0.7398 0.6966 0.5462 -0.2110 0.1679lolO2 0.8285 0.8743 0.9472 0.7497 0.8606 1.0000 0.8374 0.8412 0.8247 0.7388 0.5931 0.5280 -0.2009 0.0592lolP1 0.6364 0.7124 0.7044 0.8030 0.6705 0.8374 1.0000 0.8194 0.9011 0.7565 0.6940 0.6631 0.2116 -0.0445lolT2 0.7614 0.6998 0.8040 0.7479 0.8353 0.8412 0.8194 1.0000 0.8499 0.5745 0.8691 0.6382 0.0314 0.3263lolU2 0.6304 0.6768 0.6987 0.9135 0.5794 0.8247 0.9011 0.8499 1.0000 0.5257 0.6862 0.5282 0.1881 0.1242C2H2 0.6951 0.6593 0.6821 0.4372 0.7398 0.7388 0.7565 0.5745 0.5257 1.0000 0.4329 0.5697 -0.1069 -0.3714proC 0.6183 0.3784 0.5569 0.6182 0.6966 0.5931 0.6940 0.8691 0.6862 0.4329 1.0000 0.6468 0.2656 0.3647metX 0.3705 0.4746 0.4720 0.4736 0.5462 0.5280 0.6631 0.6382 0.5282 0.5697 0.6468 1.0000 0.1127 -0.0157tubB -0.2530 -0.3208 -0.3734 0.2257 -0.2110 -0.2009 0.2116 0.0314 0.1881 -0.1069 0.2656 0.1127 1.0000 0.2291G U S 0.0607 0.1032 0.1260 0.1080 0.1679 0.0592 -0.0445 0.3263 0.1242 -0.3714 0.3647 -0.0157 0.2291 1.0000
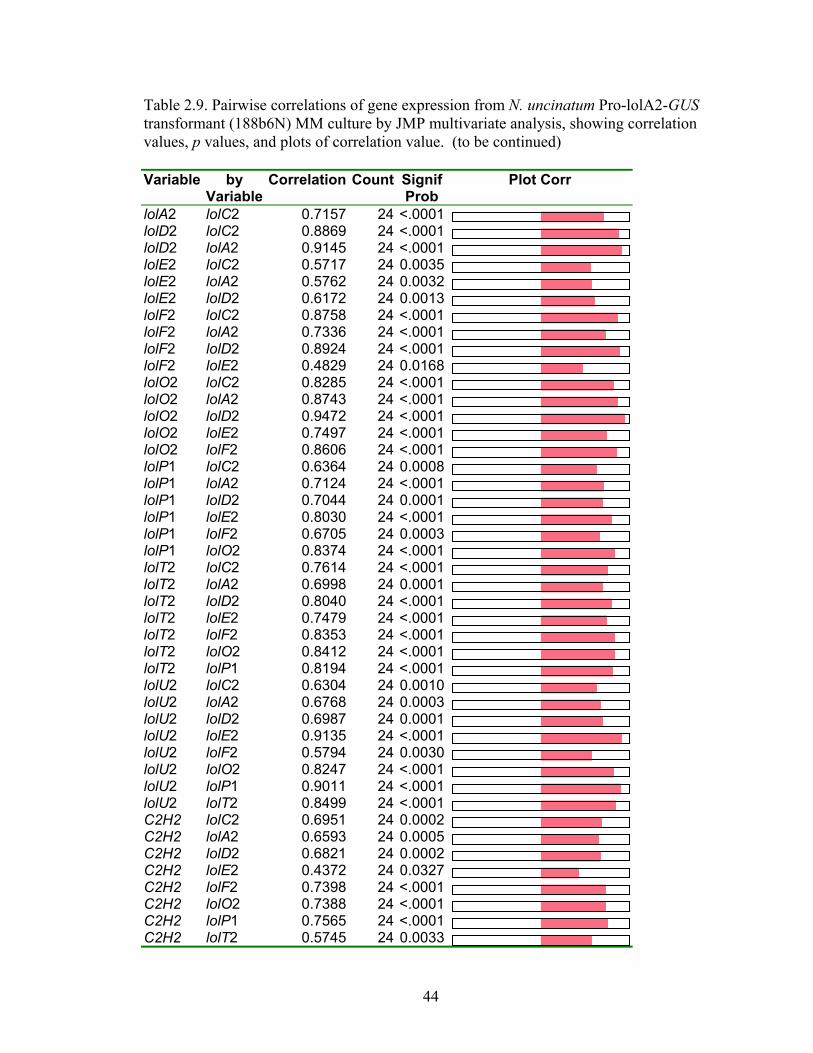
44
Table 2.9. Pairwise correlations of gene expression from N. uncinatum Pro-lolA2-GUS transformant (188b6N) MM culture by JMP multivariate analysis, showing correlation values, p values, and plots of correlation value. (to be continued) Variable by
Variable Correlation Count Signif
Prob Plot Corr
lolA2 lolC2 0.7157 24 <.0001 lolD2 lolC2 0.8869 24 <.0001 lolD2 lolA2 0.9145 24 <.0001 lolE2 lolC2 0.5717 24 0.0035 lolE2 lolA2 0.5762 24 0.0032 lolE2 lolD2 0.6172 24 0.0013 lolF2 lolC2 0.8758 24 <.0001 lolF2 lolA2 0.7336 24 <.0001 lolF2 lolD2 0.8924 24 <.0001 lolF2 lolE2 0.4829 24 0.0168 lolO2 lolC2 0.8285 24 <.0001 lolO2 lolA2 0.8743 24 <.0001 lolO2 lolD2 0.9472 24 <.0001 lolO2 lolE2 0.7497 24 <.0001 lolO2 lolF2 0.8606 24 <.0001 lolP1 lolC2 0.6364 24 0.0008 lolP1 lolA2 0.7124 24 <.0001 lolP1 lolD2 0.7044 24 0.0001 lolP1 lolE2 0.8030 24 <.0001 lolP1 lolF2 0.6705 24 0.0003 lolP1 lolO2 0.8374 24 <.0001 lolT2 lolC2 0.7614 24 <.0001 lolT2 lolA2 0.6998 24 0.0001 lolT2 lolD2 0.8040 24 <.0001 lolT2 lolE2 0.7479 24 <.0001 lolT2 lolF2 0.8353 24 <.0001 lolT2 lolO2 0.8412 24 <.0001 lolT2 lolP1 0.8194 24 <.0001 lolU2 lolC2 0.6304 24 0.0010 lolU2 lolA2 0.6768 24 0.0003 lolU2 lolD2 0.6987 24 0.0001 lolU2 lolE2 0.9135 24 <.0001 lolU2 lolF2 0.5794 24 0.0030 lolU2 lolO2 0.8247 24 <.0001 lolU2 lolP1 0.9011 24 <.0001 lolU2 lolT2 0.8499 24 <.0001 C2H2 lolC2 0.6951 24 0.0002 C2H2 lolA2 0.6593 24 0.0005 C2H2 lolD2 0.6821 24 0.0002 C2H2 lolE2 0.4372 24 0.0327 C2H2 lolF2 0.7398 24 <.0001 C2H2 lolO2 0.7388 24 <.0001 C2H2 lolP1 0.7565 24 <.0001 C2H2 lolT2 0.5745 24 0.0033
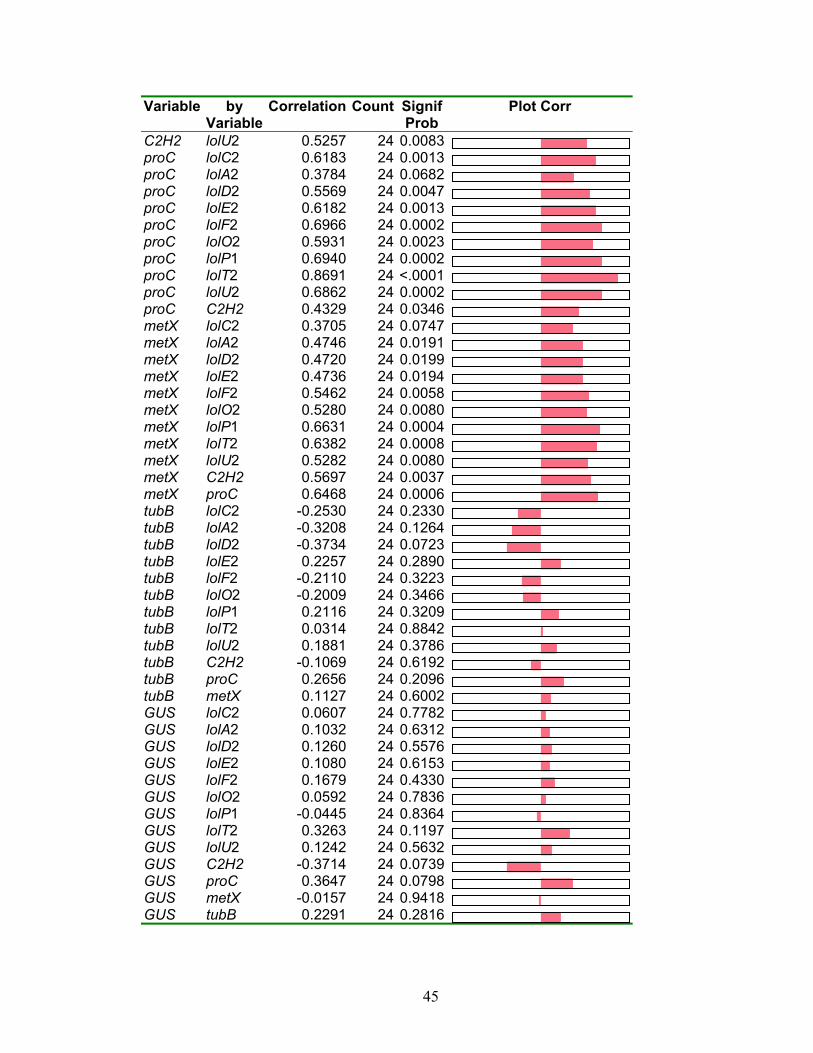
45
Variable by Variable
Correlation Count Signif Prob
Plot Corr
C2H2 lolU2 0.5257 24 0.0083 proC lolC2 0.6183 24 0.0013 proC lolA2 0.3784 24 0.0682 proC lolD2 0.5569 24 0.0047 proC lolE2 0.6182 24 0.0013 proC lolF2 0.6966 24 0.0002 proC lolO2 0.5931 24 0.0023 proC lolP1 0.6940 24 0.0002 proC lolT2 0.8691 24 <.0001 proC lolU2 0.6862 24 0.0002 proC C2H2 0.4329 24 0.0346 metX lolC2 0.3705 24 0.0747 metX lolA2 0.4746 24 0.0191 metX lolD2 0.4720 24 0.0199 metX lolE2 0.4736 24 0.0194 metX lolF2 0.5462 24 0.0058 metX lolO2 0.5280 24 0.0080 metX lolP1 0.6631 24 0.0004 metX lolT2 0.6382 24 0.0008 metX lolU2 0.5282 24 0.0080 metX C2H2 0.5697 24 0.0037 metX proC 0.6468 24 0.0006 tubB lolC2 -0.2530 24 0.2330 tubB lolA2 -0.3208 24 0.1264 tubB lolD2 -0.3734 24 0.0723 tubB lolE2 0.2257 24 0.2890 tubB lolF2 -0.2110 24 0.3223 tubB lolO2 -0.2009 24 0.3466 tubB lolP1 0.2116 24 0.3209 tubB lolT2 0.0314 24 0.8842 tubB lolU2 0.1881 24 0.3786 tubB C2H2 -0.1069 24 0.6192 tubB proC 0.2656 24 0.2096 tubB metX 0.1127 24 0.6002 GUS lolC2 0.0607 24 0.7782 GUS lolA2 0.1032 24 0.6312 GUS lolD2 0.1260 24 0.5576 GUS lolE2 0.1080 24 0.6153 GUS lolF2 0.1679 24 0.4330 GUS lolO2 0.0592 24 0.7836 GUS lolP1 -0.0445 24 0.8364 GUS lolT2 0.3263 24 0.1197 GUS lolU2 0.1242 24 0.5632 GUS C2H2 -0.3714 24 0.0739 GUS proC 0.3647 24 0.0798 GUS metX -0.0157 24 0.9418 GUS tubB 0.2291 24 0.2816
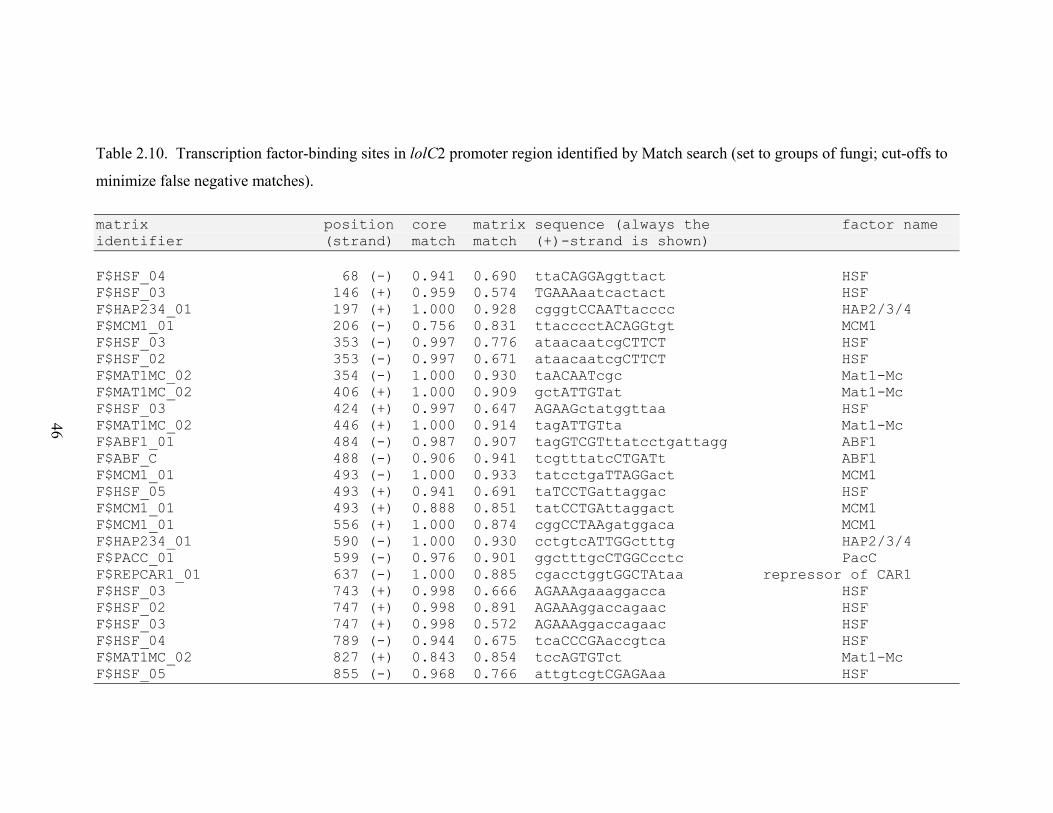
46
Table 2.10. Transcription factor-binding sites in lolC2 promoter region identified by Match search (set to groups of fungi; cut-offs to
minimize false negative matches). matrix position core matrix sequence (always the factor name identifier (strand) match match (+)-strand is shown) F$HSF_04 68 (-) 0.941 0.690 ttaCAGGAggttact HSF F$HSF_03 146 (+) 0.959 0.574 TGAAAaatcactact HSF F$HAP234_01 197 (+) 1.000 0.928 cgggtCCAATtacccc HAP2/3/4 F$MCM1_01 206 (-) 0.756 0.831 ttacccctACAGGtgt MCM1 F$HSF_03 353 (-) 0.997 0.776 ataacaatcgCTTCT HSF F$HSF_02 353 (-) 0.997 0.671 ataacaatcgCTTCT HSF F$MAT1MC_02 354 (-) 1.000 0.930 taACAATcgc Mat1-Mc F$MAT1MC_02 406 (+) 1.000 0.909 gctATTGTat Mat1-Mc F$HSF_03 424 (+) 0.997 0.647 AGAAGctatggttaa HSF F$MAT1MC_02 446 (+) 1.000 0.914 tagATTGTta Mat1-Mc F$ABF1_01 484 (-) 0.987 0.907 tagGTCGTttatcctgattagg ABF1 F$ABF_C 488 (-) 0.906 0.941 tcgtttatcCTGATt ABF1 F$MCM1_01 493 (-) 1.000 0.933 tatcctgaTTAGGact MCM1 F$HSF_05 493 (+) 0.941 0.691 taTCCTGattaggac HSF F$MCM1_01 493 (+) 0.888 0.851 tatCCTGAttaggact MCM1 F$MCM1_01 556 (+) 1.000 0.874 cggCCTAAgatggaca MCM1 F$HAP234_01 590 (-) 1.000 0.930 cctgtcATTGGctttg HAP2/3/4 F$PACC_01 599 (-) 0.976 0.901 ggctttgcCTGGCcctc PacC F$REPCAR1_01 637 (-) 1.000 0.885 cgacctggtGGCTAtaa repressor of CAR1 F$HSF_03 743 (+) 0.998 0.666 AGAAAgaaaggacca HSF F$HSF_02 747 (+) 0.998 0.891 AGAAAggaccagaac HSF F$HSF_03 747 (+) 0.998 0.572 AGAAAggaccagaac HSF F$HSF_04 789 (-) 0.944 0.675 tcaCCCGAaccgtca HSF F$MAT1MC_02 827 (+) 0.843 0.854 tccAGTGTct Mat1-Mc F$HSF_05 855 (-) 0.968 0.766 attgtcgtCGAGAaa HSF
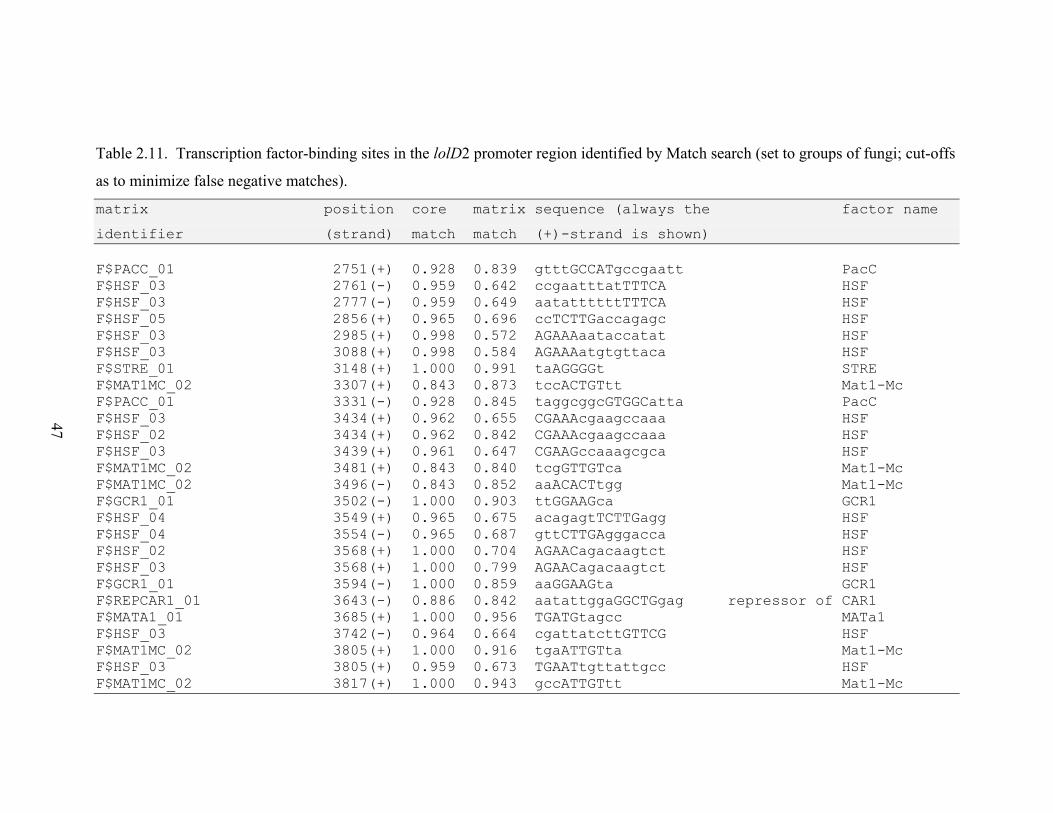
47
Table 2.11. Transcription factor-binding sites in the lolD2 promoter region identified by Match search (set to groups of fungi; cut-offs
as to minimize false negative matches).
matrix position core matrix sequence (always the factor name
identifier (strand) match match (+)-strand is shown) F$PACC_01 2751(+) 0.928 0.839 gtttGCCATgccgaatt PacC F$HSF_03 2761(-) 0.959 0.642 ccgaatttatTTTCA HSF F$HSF_03 2777(-) 0.959 0.649 aatattttttTTTCA HSF F$HSF_05 2856(+) 0.965 0.696 ccTCTTGaccagagc HSF F$HSF_03 2985(+) 0.998 0.572 AGAAAaataccatat HSF F$HSF_03 3088(+) 0.998 0.584 AGAAAatgtgttaca HSF F$STRE_01 3148(+) 1.000 0.991 taAGGGGt STRE F$MAT1MC_02 3307(+) 0.843 0.873 tccACTGTtt Mat1-Mc F$PACC_01 3331(-) 0.928 0.845 taggcggcGTGGCatta PacC F$HSF_03 3434(+) 0.962 0.655 CGAAAcgaagccaaa HSF F$HSF_02 3434(+) 0.962 0.842 CGAAAcgaagccaaa HSF F$HSF_03 3439(+) 0.961 0.647 CGAAGccaaagcgca HSF F$MAT1MC_02 3481(+) 0.843 0.840 tcgGTTGTca Mat1-Mc F$MAT1MC_02 3496(-) 0.843 0.852 aaACACTtgg Mat1-Mc F$GCR1_01 3502(-) 1.000 0.903 ttGGAAGca GCR1 F$HSF_04 3549(+) 0.965 0.675 acagagtTCTTGagg HSF F$HSF_04 3554(-) 0.965 0.687 gttCTTGAgggacca HSF F$HSF_02 3568(+) 1.000 0.704 AGAACagacaagtct HSF F$HSF_03 3568(+) 1.000 0.799 AGAACagacaagtct HSF F$GCR1_01 3594(-) 1.000 0.859 aaGGAAGta GCR1 F$REPCAR1_01 3643(-) 0.886 0.842 aatattggaGGCTGgag repressor of CAR1 F$MATA1_01 3685(+) 1.000 0.956 TGATGtagcc MATa1 F$HSF_03 3742(-) 0.964 0.664 cgattatcttGTTCG HSF F$MAT1MC_02 3805(+) 1.000 0.916 tgaATTGTta Mat1-Mc F$HSF_03 3805(+) 0.959 0.673 TGAATtgttattgcc HSF F$MAT1MC_02 3817(+) 1.000 0.943 gccATTGTtt Mat1-Mc
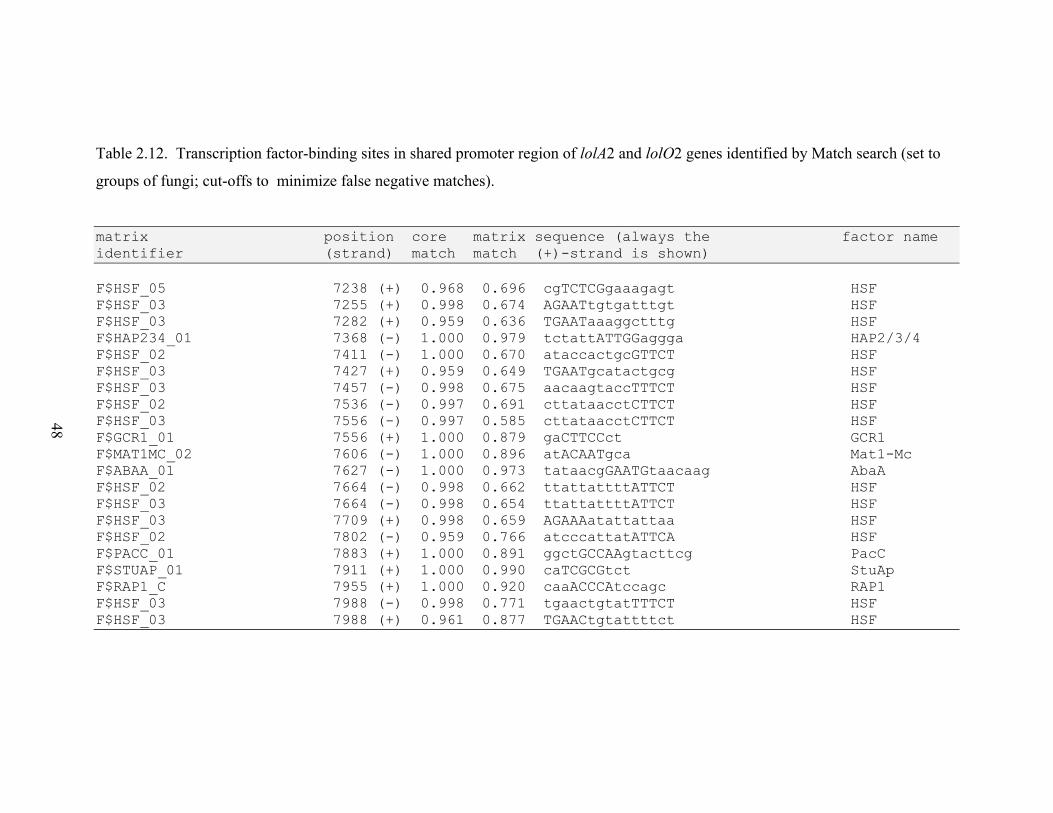
48
Table 2.12. Transcription factor-binding sites in shared promoter region of lolA2 and lolO2 genes identified by Match search (set to
groups of fungi; cut-offs to minimize false negative matches).
matrix position core matrix sequence (always the factor name identifier (strand) match match (+)-strand is shown) F$HSF_05 7238 (+) 0.968 0.696 cgTCTCGgaaagagt HSF F$HSF_03 7255 (+) 0.998 0.674 AGAATtgtgatttgt HSF F$HSF_03 7282 (+) 0.959 0.636 TGAATaaaggctttg HSF F$HAP234_01 7368 (-) 1.000 0.979 tctattATTGGaggga HAP2/3/4 F$HSF_02 7411 (-) 1.000 0.670 ataccactgcGTTCT HSF F$HSF_03 7427 (+) 0.959 0.649 TGAATgcatactgcg HSF F$HSF_03 7457 (-) 0.998 0.675 aacaagtaccTTTCT HSF F$HSF_02 7536 (-) 0.997 0.691 cttataacctCTTCT HSF F$HSF_03 7556 (-) 0.997 0.585 cttataacctCTTCT HSF F$GCR1_01 7556 (+) 1.000 0.879 gaCTTCCct GCR1 F$MAT1MC_02 7606 (-) 1.000 0.896 atACAATgca Mat1-Mc F$ABAA_01 7627 (-) 1.000 0.973 tataacgGAATGtaacaag AbaA F$HSF_02 7664 (-) 0.998 0.662 ttattattttATTCT HSF F$HSF_03 7664 (-) 0.998 0.654 ttattattttATTCT HSF F$HSF_03 7709 (+) 0.998 0.659 AGAAAatattattaa HSF F$HSF_02 7802 (-) 0.959 0.766 atcccattatATTCA HSF F$PACC_01 7883 (+) 1.000 0.891 ggctGCCAAgtacttcg PacC F$STUAP_01 7911 (+) 1.000 0.990 caTCGCGtct StuAp F$RAP1_C 7955 (+) 1.000 0.920 caaACCCAtccagc RAP1 F$HSF_03 7988 (-) 0.998 0.771 tgaactgtatTTTCT HSF F$HSF_03 7988 (+) 0.961 0.877 TGAACtgtattttct HSF
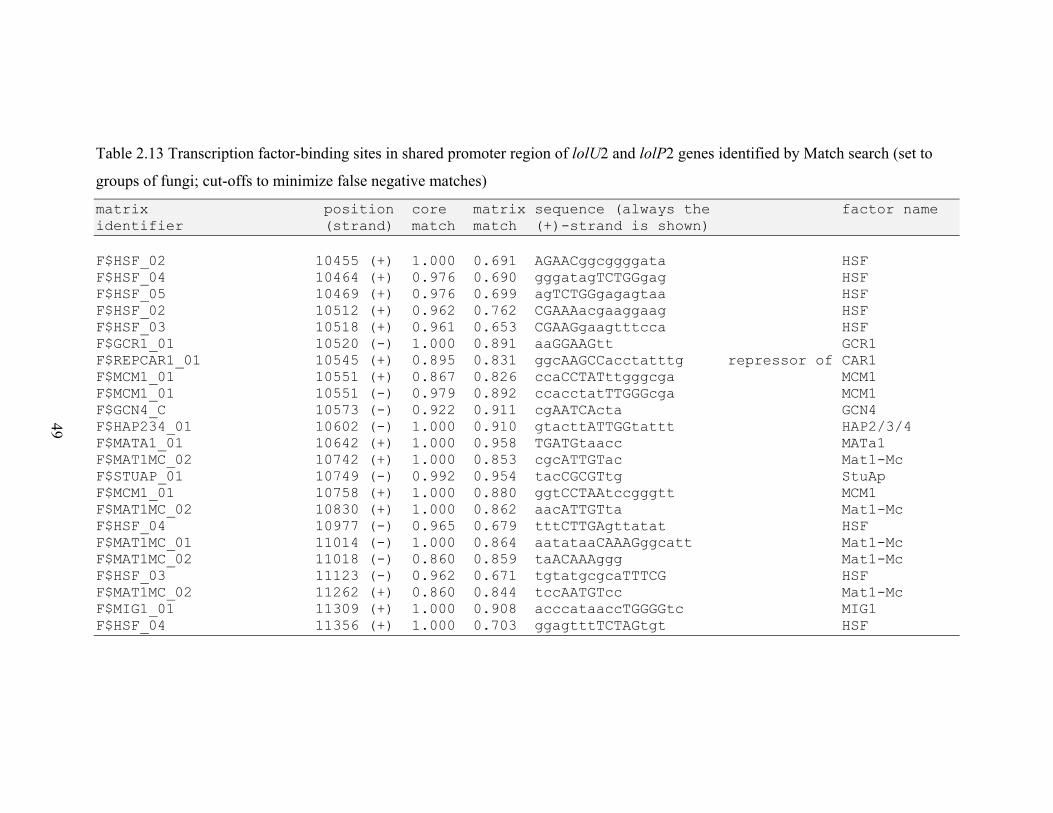
49
Table 2.13 Transcription factor-binding sites in shared promoter region of lolU2 and lolP2 genes identified by Match search (set to
groups of fungi; cut-offs to minimize false negative matches)
matrix position core matrix sequence (always the factor name identifier (strand) match match (+)-strand is shown) F$HSF_02 10455 (+) 1.000 0.691 AGAACggcggggata HSF F$HSF_04 10464 (+) 0.976 0.690 gggatagTCTGGgag HSF F$HSF_05 10469 (+) 0.976 0.699 agTCTGGgagagtaa HSF F$HSF_02 10512 (+) 0.962 0.762 CGAAAacgaaggaag HSF F$HSF_03 10518 (+) 0.961 0.653 CGAAGgaagtttcca HSF F$GCR1_01 10520 (-) 1.000 0.891 aaGGAAGtt GCR1 F$REPCAR1_01 10545 (+) 0.895 0.831 ggcAAGCCacctatttg repressor of CAR1 F$MCM1_01 10551 (+) 0.867 0.826 ccaCCTATttgggcga MCM1 F$MCM1_01 10551 (-) 0.979 0.892 ccacctatTTGGGcga MCM1 F$GCN4_C 10573 (-) 0.922 0.911 cgAATCActa GCN4 F$HAP234_01 10602 (-) 1.000 0.910 gtacttATTGGtattt HAP2/3/4 F$MATA1_01 10642 (+) 1.000 0.958 TGATGtaacc MATa1 F$MAT1MC_02 10742 (+) 1.000 0.853 cgcATTGTac Mat1-Mc F$STUAP_01 10749 (-) 0.992 0.954 tacCGCGTtg StuAp F$MCM1_01 10758 (+) 1.000 0.880 ggtCCTAAtccgggtt MCM1 F$MAT1MC_02 10830 (+) 1.000 0.862 aacATTGTta Mat1-Mc F$HSF_04 10977 (-) 0.965 0.679 tttCTTGAgttatat HSF F$MAT1MC_01 11014 (-) 1.000 0.864 aatataaCAAAGggcatt Mat1-Mc F$MAT1MC_02 11018 (-) 0.860 0.859 taACAAAggg Mat1-Mc F$HSF_03 11123 (-) 0.962 0.671 tgtatgcgcaTTTCG HSF F$MAT1MC_02 11262 (+) 0.860 0.844 tccAATGTcc Mat1-Mc F$MIG1_01 11309 (+) 1.000 0.908 acccataaccTGGGGtc MIG1 F$HSF_04 11356 (+) 1.000 0.703 ggagtttTCTAGtgt HSF
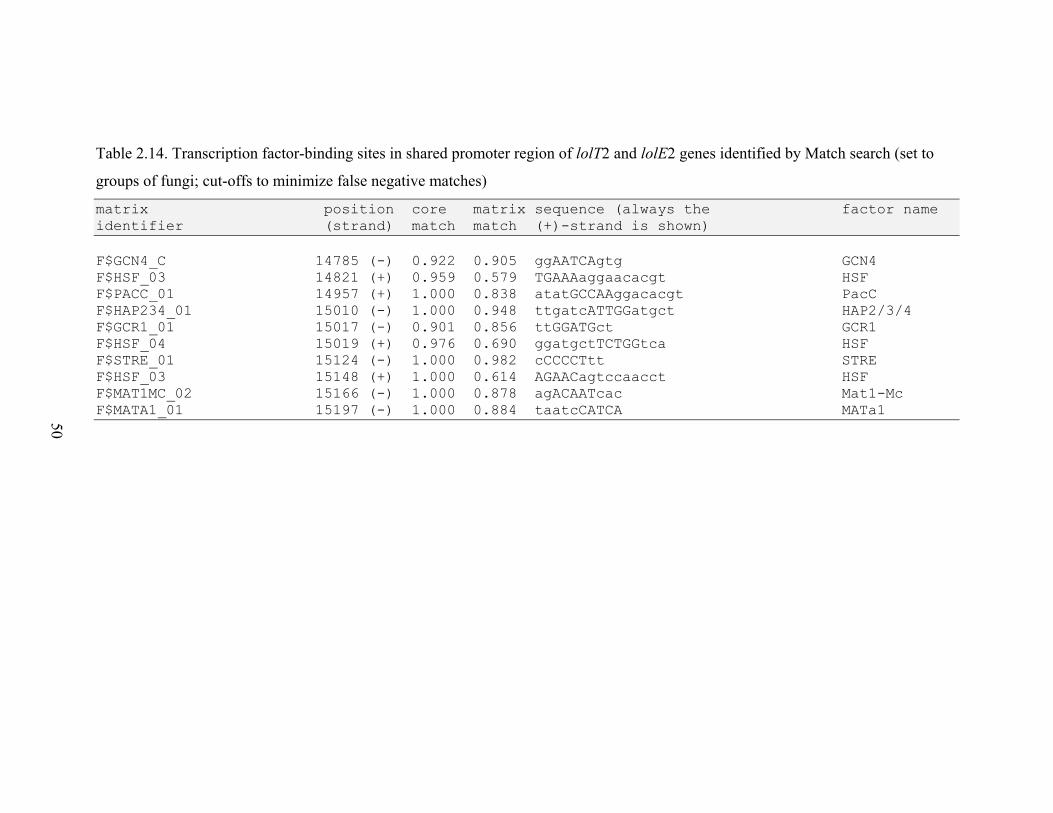
50
Table 2.14. Transcription factor-binding sites in shared promoter region of lolT2 and lolE2 genes identified by Match search (set to
groups of fungi; cut-offs to minimize false negative matches)
matrix position core matrix sequence (always the factor name identifier (strand) match match (+)-strand is shown) F$GCN4_C 14785 (-) 0.922 0.905 ggAATCAgtg GCN4 F$HSF_03 14821 (+) 0.959 0.579 TGAAAaggaacacgt HSF F$PACC_01 14957 (+) 1.000 0.838 atatGCCAAggacacgt PacC F$HAP234_01 15010 (-) 1.000 0.948 ttgatcATTGGatgct HAP2/3/4 F$GCR1_01 15017 (-) 0.901 0.856 ttGGATGct GCR1 F$HSF_04 15019 (+) 0.976 0.690 ggatgctTCTGGtca HSF F$STRE_01 15124 (-) 1.000 0.982 cCCCCTtt STRE F$HSF_03 15148 (+) 1.000 0.614 AGAACagtccaacct HSF F$MAT1MC_02 15166 (-) 1.000 0.878 agACAATcac Mat1-Mc F$MATA1_01 15197 (-) 1.000 0.884 taatcCATCA MATa1
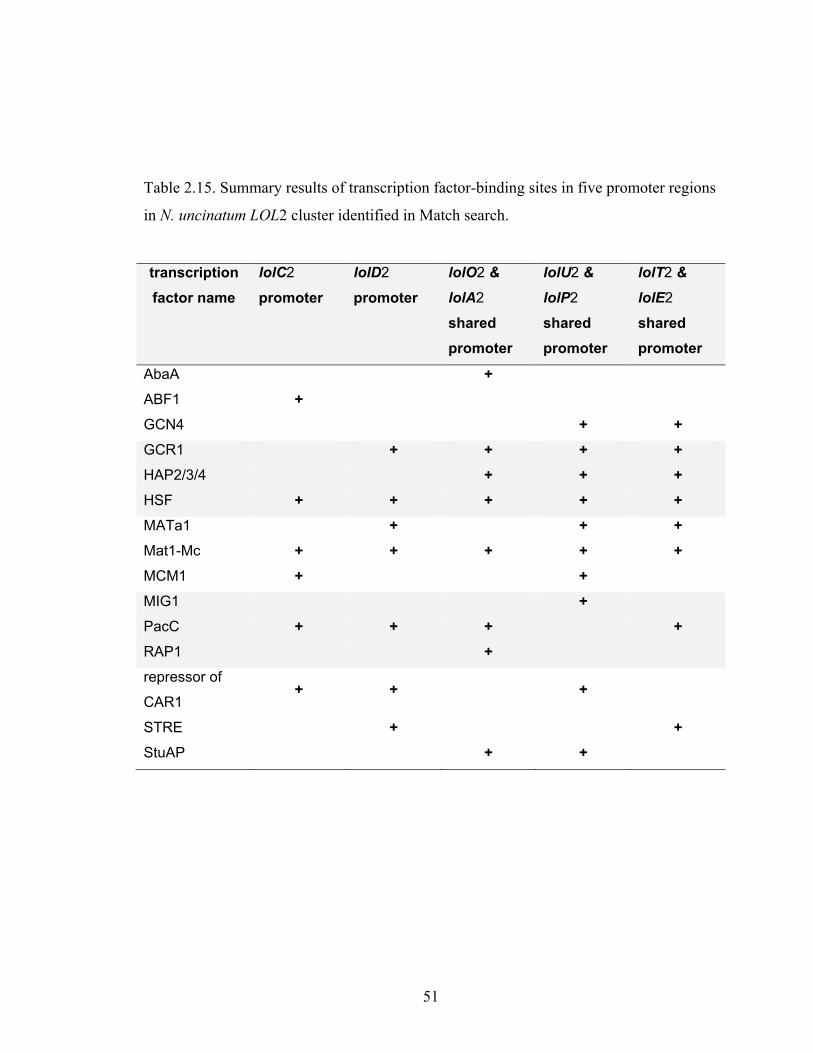
51
Table 2.15. Summary results of transcription factor-binding sites in five promoter regions
in N. uncinatum LOL2 cluster identified in Match search.
transcription factor name
lolC2
promoter
lolD2
promoter
lolO2 &
lolA2 shared promoter
lolU2 &
lolP2 shared promoter
lolT2 &
lolE2 shared promoter
AbaA + ABF1 + GCN4 + + GCR1 + + + + HAP2/3/4 + + + HSF + + + + + MATa1 + + + Mat1-Mc + + + + + MCM1 + + MIG1 + PacC + + + + RAP1 + repressor of
CAR1 + + +
STRE + + StuAP + +
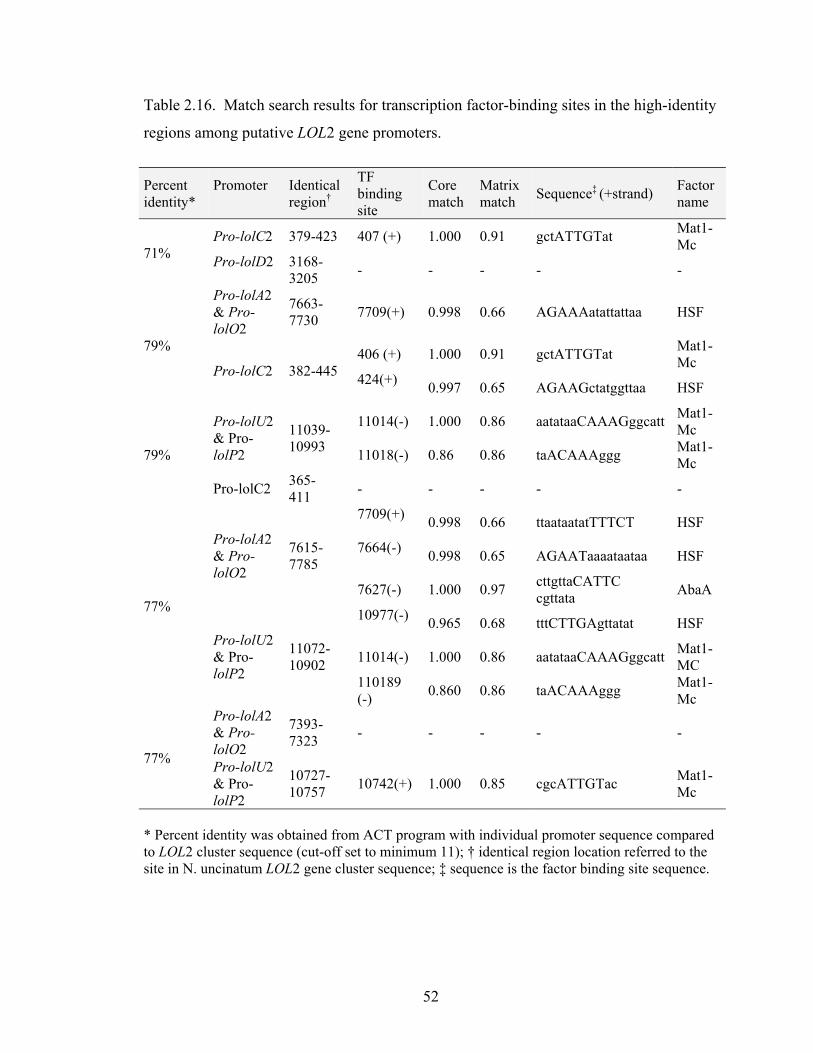
52
Table 2.16. Match search results for transcription factor-binding sites in the high-identity
regions among putative LOL2 gene promoters.
Percent identity*
Promoter
Identical region†
TF binding site
Core match
Matrix match Sequence‡ (+strand) Factor
name
71% Pro-lolC2 379-423 407 (+) 1.000 0.91 gctATTGTat Mat1-
Mc Pro-lolD2
3168-3205 - - - - -
79%
Pro-lolA2 & Pro-lolO2
7663-7730 7709(+) 0.998 0.66 AGAAAatattattaa HSF
Pro-lolC2 382-445 406 (+) 1.000 0.91 gctATTGTat Mat1-
Mc 424(+) 0.997 0.65 AGAAGctatggttaa HSF
79%
Pro-lolU2 & Pro-lolP2
11039-10993
11014(-) 1.000 0.86 aatataaCAAAGggcatt Mat1-Mc
11018(-) 0.86 0.86 taACAAAggg Mat1-Mc
Pro-lolC2 365- 411 - - - - -
77%
Pro-lolA2 & Pro-lolO2
7615-7785
7709(+) 0.998 0.66 ttaataatatTTTCT HSF
7664(-) 0.998 0.65 AGAATaaaataataa HSF
7627(-) 1.000 0.97 cttgttaCATTC cgttata AbaA
Pro-lolU2 & Pro-lolP2
11072-10902
10977(-) 0.965 0.68 tttCTTGAgttatat HSF
11014(-) 1.000 0.86 aatataaCAAAGggcatt Mat1-MC
110189 (-) 0.860 0.86 taACAAAggg Mat1-
Mc
77%
Pro-lolA2 & Pro-lolO2
7393-7323 - - - - -
Pro-lolU2 & Pro-lolP2
10727-10757 10742(+) 1.000 0.85 cgcATTGTac Mat1-
Mc
* Percent identity was obtained from ACT program with individual promoter sequence compared to LOL2 cluster sequence (cut-off set to minimum 11); † identical region location referred to the site in N. uncinatum LOL2 gene cluster sequence; ‡ sequence is the factor binding site sequence.
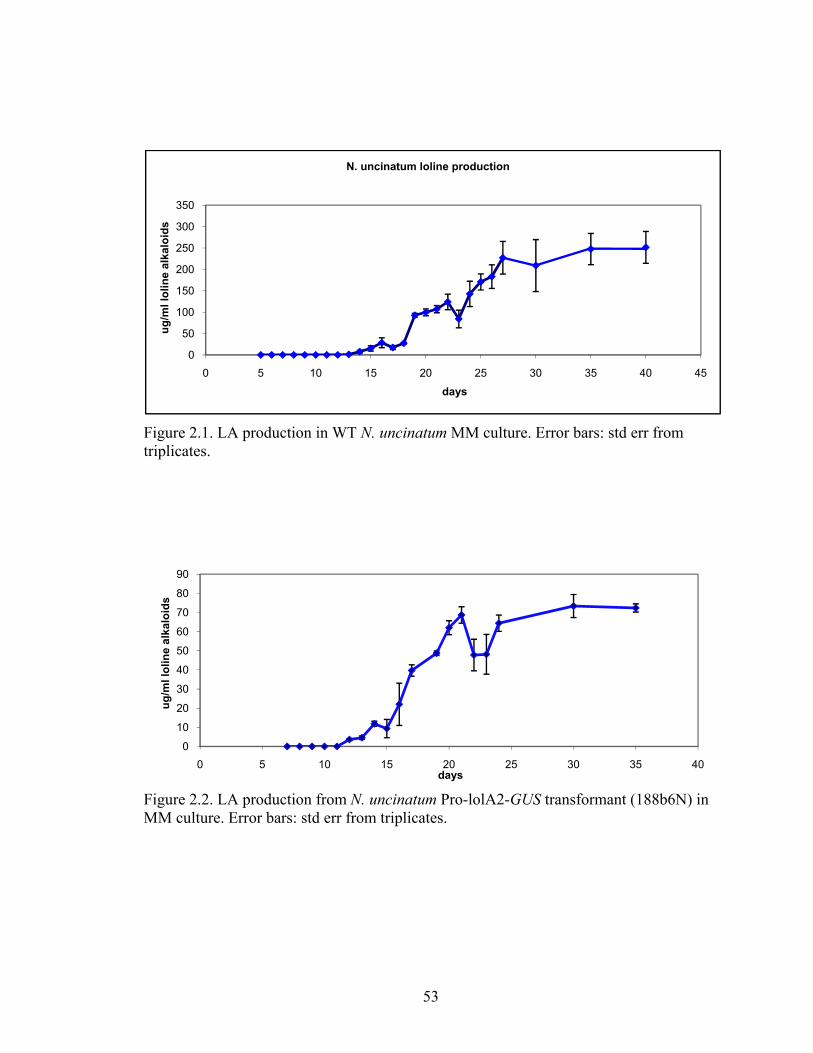
53
Figure 2.1. LA production in WT N. uncinatum MM culture. Error bars: std err from triplicates.
Figure 2.2. LA production from N. uncinatum Pro-lolA2-GUS transformant (188b6N) in MM culture. Error bars: std err from triplicates.
0
50
100
150
200
250
300
350
0 5 10 15 20 25 30 35 40 45
ug/m
l lol
ine
alka
loid
s
days
N. uncinatum loline production
0
10
20
30
40
50
60
70
80
90
0 5 10 15 20 25 30 35 40
ug/m
l lol
ine
alka
loid
s
days
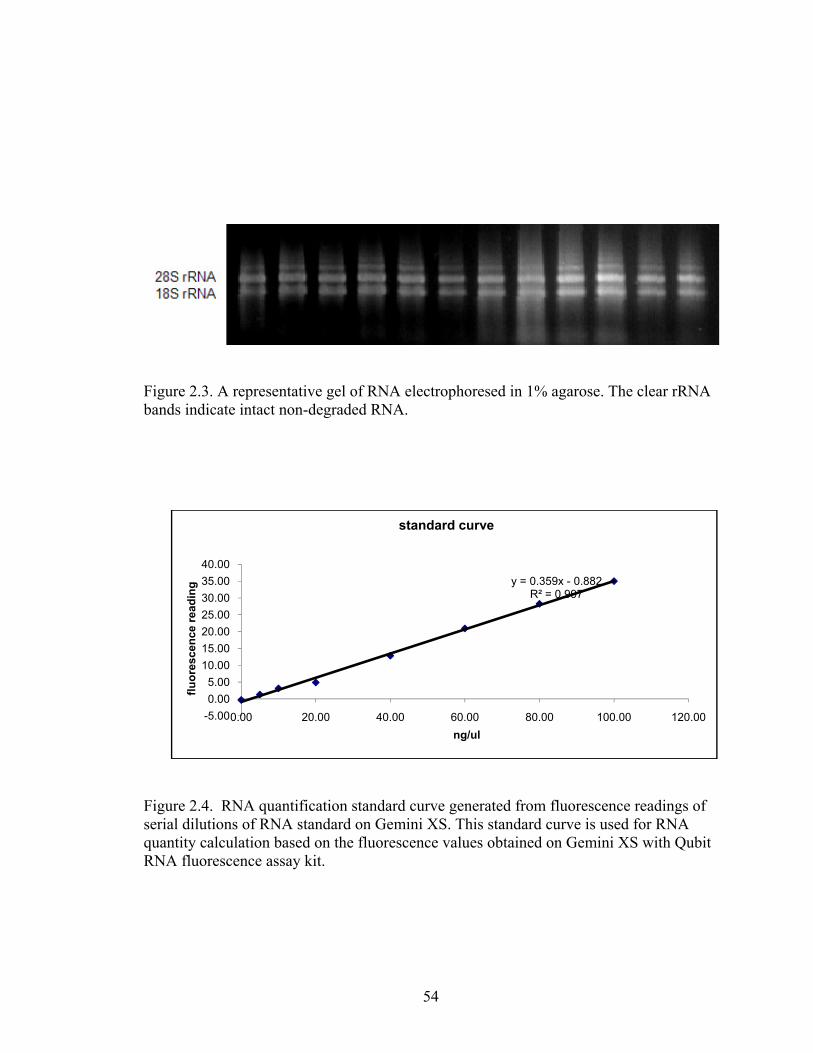
54
Figure 2.3. A representative gel of RNA electrophoresed in 1% agarose. The clear rRNA bands indicate intact non-degraded RNA.
Figure 2.4. RNA quantification standard curve generated from fluorescence readings of serial dilutions of RNA standard on Gemini XS. This standard curve is used for RNA quantity calculation based on the fluorescence values obtained on Gemini XS with Qubit RNA fluorescence assay kit.
y = 0.359x - 0.882R² = 0.997
-5.000.005.00
10.0015.0020.0025.0030.0035.0040.00
0.00 20.00 40.00 60.00 80.00 100.00 120.00
fluor
esce
nce
read
ing
ng/ul
standard curve
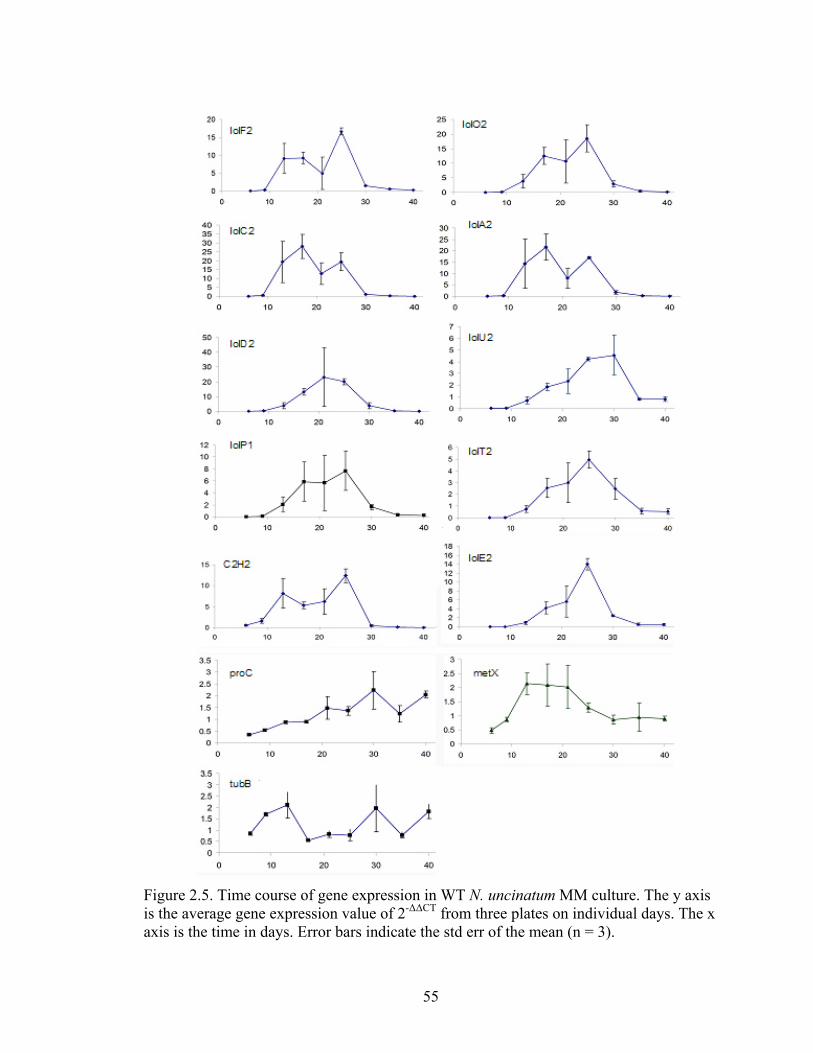
55
Figure 2.5. Time course of gene expression in WT N. uncinatum MM culture. The y axis is the average gene expression value of 2-ΔΔCT from three plates on individual days. The x axis is the time in days. Error bars indicate the std err of the mean (n = 3).
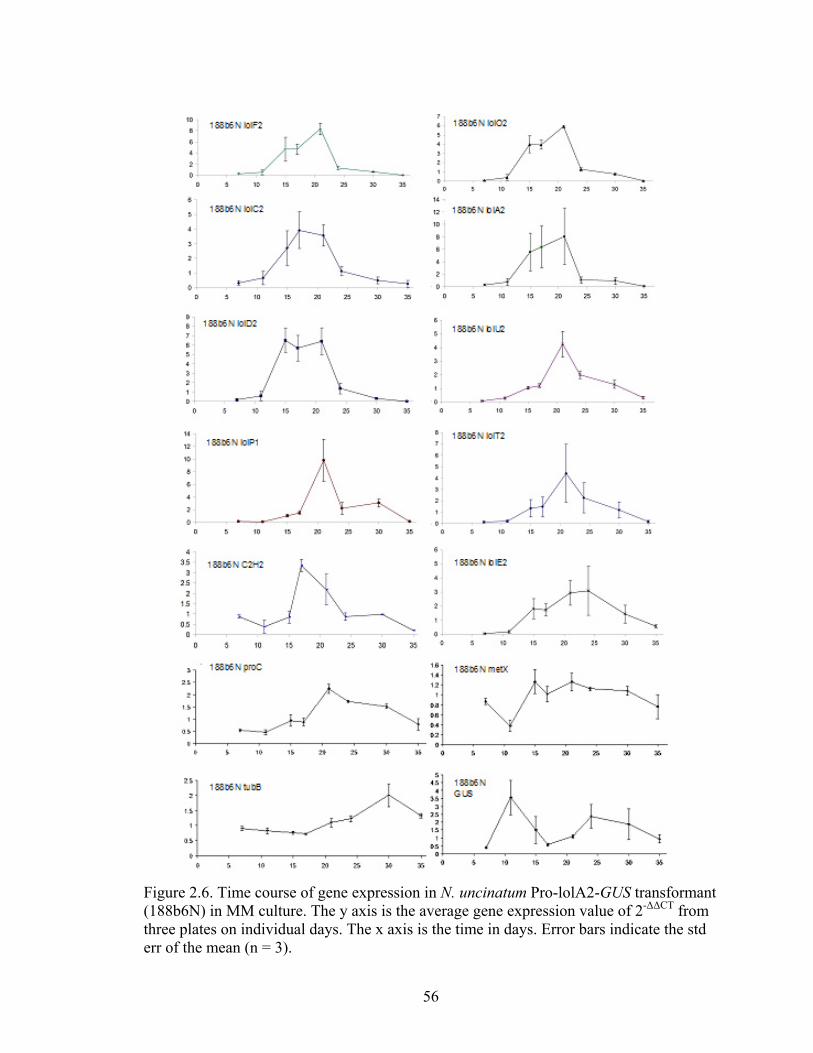
56
Figure 2.6. Time course of gene expression in N. uncinatum Pro-lolA2-GUS transformant (188b6N) in MM culture. The y axis is the average gene expression value of 2-ΔΔCT from three plates on individual days. The x axis is the time in days. Error bars indicate the std err of the mean (n = 3).
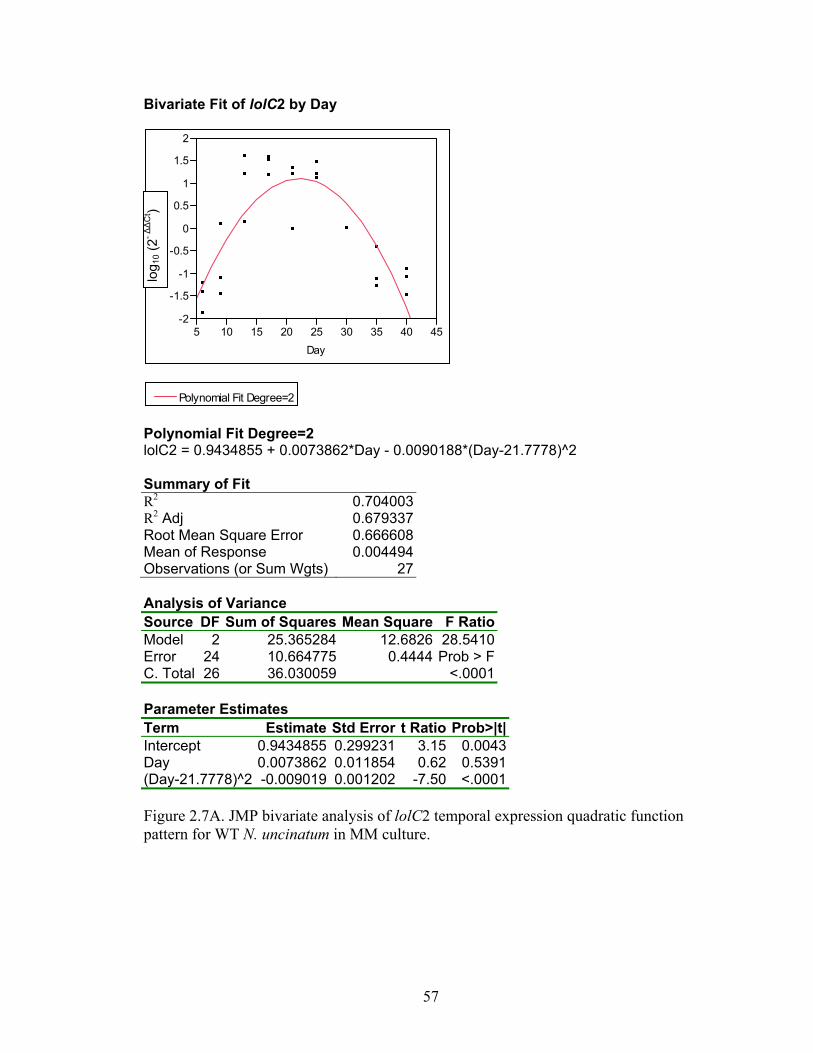
57
Bivariate Fit of lolC2 by Day
Polynomial Fit Degree=2 lolC2 = 0.9434855 + 0.0073862*Day - 0.0090188*(Day-21.7778)^2 Summary of Fit R2 0.704003R2 Adj 0.679337Root Mean Square Error 0.666608Mean of Response 0.004494Observations (or Sum Wgts) 27 Analysis of Variance Source DF Sum of Squares Mean Square F RatioModel 2 25.365284 12.6826 28.5410Error 24 10.664775 0.4444 Prob > FC. Total 26 36.030059 <.0001 Parameter Estimates Term Estimate Std Error t Ratio Prob>|t|Intercept 0.9434855 0.299231 3.15 0.0043Day 0.0073862 0.011854 0.62 0.5391(Day-21.7778)^2 -0.009019 0.001202 -7.50 <.0001 Figure 2.7A. JMP bivariate analysis of lolC2 temporal expression quadratic function pattern for WT N. uncinatum in MM culture.
-2
-1.5
-1
-0.5
0
0.5
1
1.5
2
lolC
2
5 10 15 20 25 30 35 40 45Day
Polynomial Fit Degree=2
log 1
0 (2- Δ
ΔC
t )
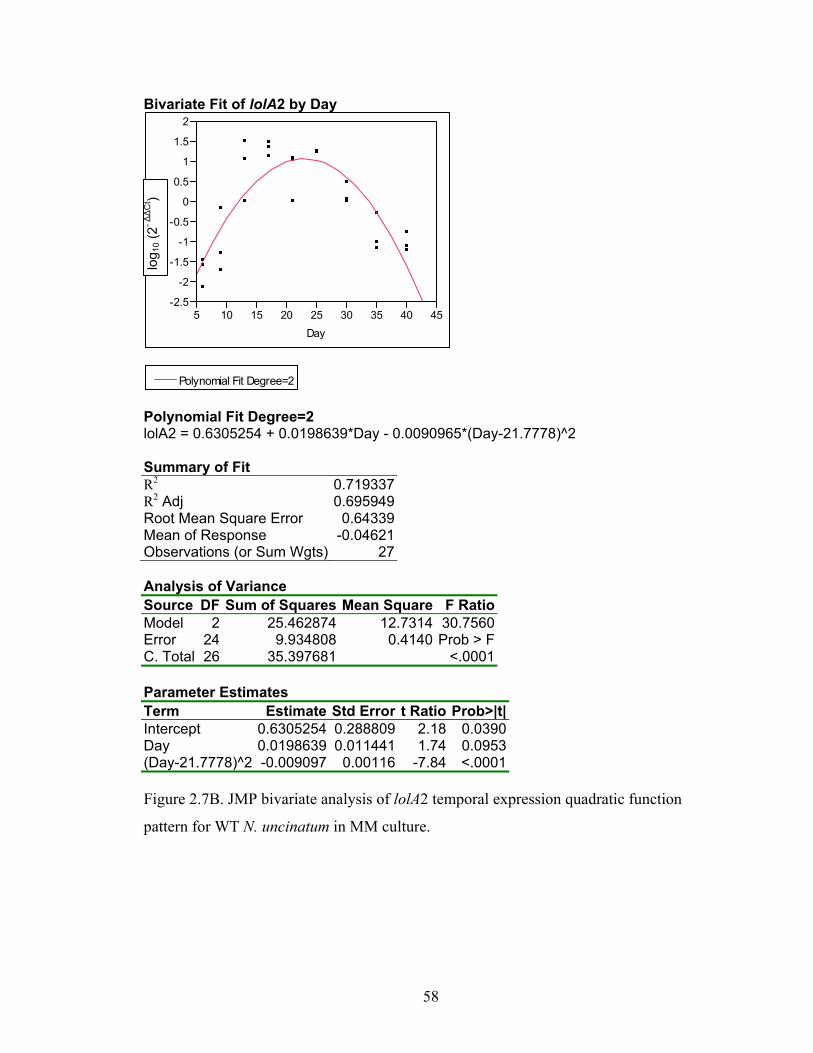
58
Bivariate Fit of lolA2 by Day
Polynomial Fit Degree=2 lolA2 = 0.6305254 + 0.0198639*Day - 0.0090965*(Day-21.7778)^2 Summary of Fit R2 0.719337R2 Adj 0.695949Root Mean Square Error 0.64339Mean of Response -0.04621Observations (or Sum Wgts) 27 Analysis of Variance Source DF Sum of Squares Mean Square F RatioModel 2 25.462874 12.7314 30.7560Error 24 9.934808 0.4140 Prob > FC. Total 26 35.397681 <.0001 Parameter Estimates Term Estimate Std Error t Ratio Prob>|t|Intercept 0.6305254 0.288809 2.18 0.0390Day 0.0198639 0.011441 1.74 0.0953(Day-21.7778)^2 -0.009097 0.00116 -7.84 <.0001 Figure 2.7B. JMP bivariate analysis of lolA2 temporal expression quadratic function
pattern for WT N. uncinatum in MM culture.
-2.5
-2
-1.5
-1
-0.5
0
0.5
1
1.5
2
lolA
2
5 10 15 20 25 30 35 40 45Day
Polynomial Fit Degree=2
log 1
0 (2- Δ
ΔC
t )
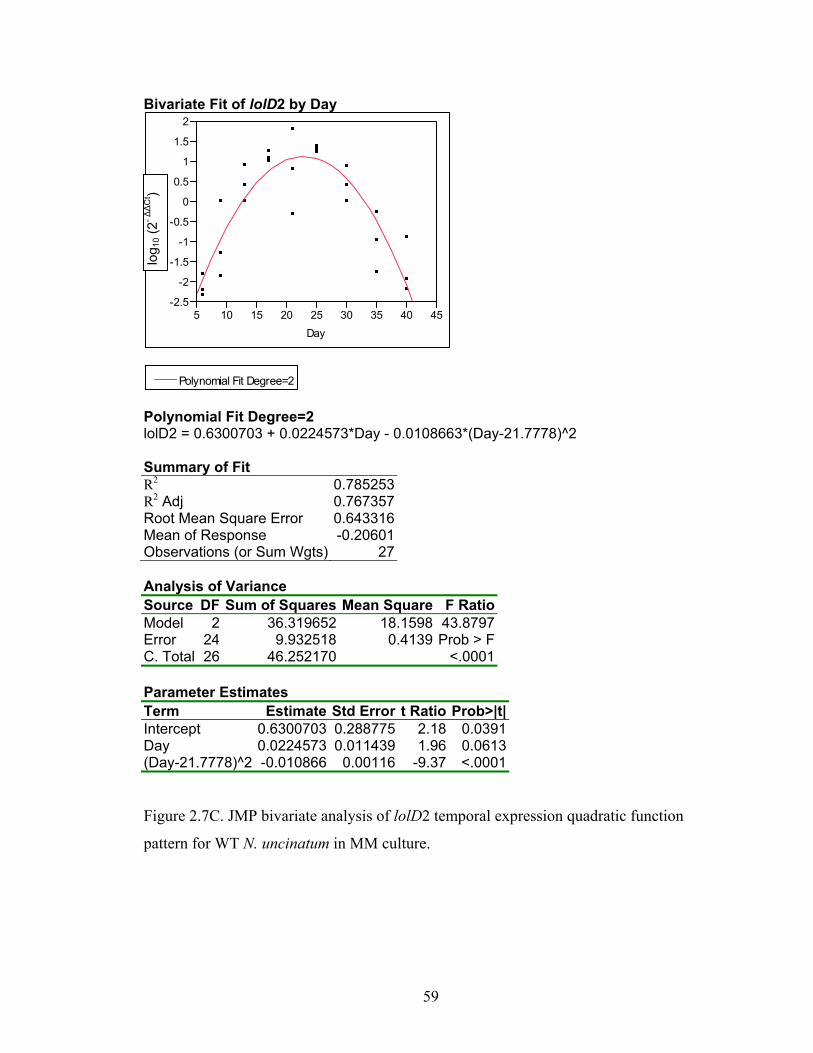
59
Bivariate Fit of lolD2 by Day
Polynomial Fit Degree=2 lolD2 = 0.6300703 + 0.0224573*Day - 0.0108663*(Day-21.7778)^2 Summary of Fit R2 0.785253R2 Adj 0.767357Root Mean Square Error 0.643316Mean of Response -0.20601Observations (or Sum Wgts) 27 Analysis of Variance Source DF Sum of Squares Mean Square F RatioModel 2 36.319652 18.1598 43.8797Error 24 9.932518 0.4139 Prob > FC. Total 26 46.252170 <.0001 Parameter Estimates Term Estimate Std Error t Ratio Prob>|t|Intercept 0.6300703 0.288775 2.18 0.0391Day 0.0224573 0.011439 1.96 0.0613(Day-21.7778)^2 -0.010866 0.00116 -9.37 <.0001 Figure 2.7C. JMP bivariate analysis of lolD2 temporal expression quadratic function
pattern for WT N. uncinatum in MM culture.
-2.5
-2
-1.5
-1
-0.5
0
0.5
1
1.5
2
lolD
2
5 10 15 20 25 30 35 40 45Day
Polynomial Fit Degree=2
log 1
0 (2- Δ
ΔC
t )
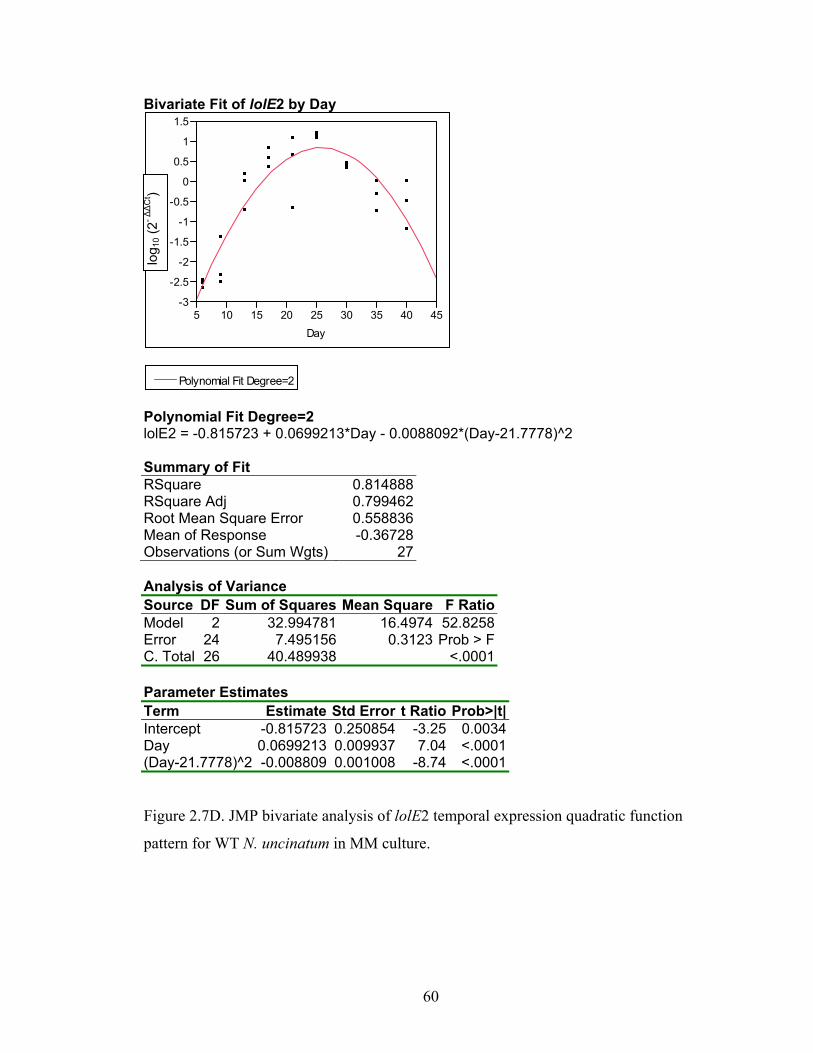
60
Bivariate Fit of lolE2 by Day
Polynomial Fit Degree=2 lolE2 = -0.815723 + 0.0699213*Day - 0.0088092*(Day-21.7778)^2 Summary of Fit RSquare 0.814888RSquare Adj 0.799462Root Mean Square Error 0.558836Mean of Response -0.36728Observations (or Sum Wgts) 27 Analysis of Variance Source DF Sum of Squares Mean Square F RatioModel 2 32.994781 16.4974 52.8258Error 24 7.495156 0.3123 Prob > FC. Total 26 40.489938 <.0001 Parameter Estimates Term Estimate Std Error t Ratio Prob>|t|Intercept -0.815723 0.250854 -3.25 0.0034Day 0.0699213 0.009937 7.04 <.0001(Day-21.7778)^2 -0.008809 0.001008 -8.74 <.0001 Figure 2.7D. JMP bivariate analysis of lolE2 temporal expression quadratic function
pattern for WT N. uncinatum in MM culture.
-3
-2.5
-2
-1.5
-1
-0.5
0
0.5
1
1.5
lolE
2
5 10 15 20 25 30 35 40 45Day
Polynomial Fit Degree=2
log 1
0 (2- Δ
ΔC
t )
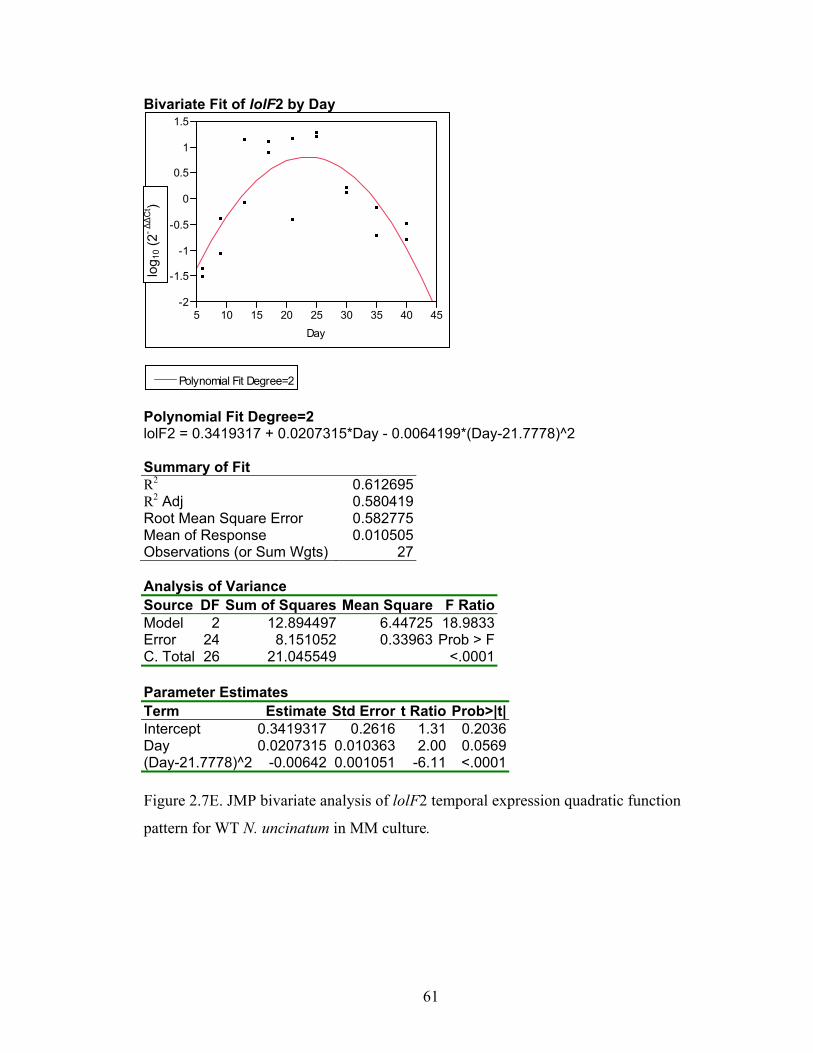
61
Bivariate Fit of lolF2 by Day
Polynomial Fit Degree=2 lolF2 = 0.3419317 + 0.0207315*Day - 0.0064199*(Day-21.7778)^2 Summary of Fit R2 0.612695R2 Adj 0.580419Root Mean Square Error 0.582775Mean of Response 0.010505Observations (or Sum Wgts) 27 Analysis of Variance Source DF Sum of Squares Mean Square F RatioModel 2 12.894497 6.44725 18.9833Error 24 8.151052 0.33963 Prob > FC. Total 26 21.045549 <.0001 Parameter Estimates Term Estimate Std Error t Ratio Prob>|t|Intercept 0.3419317 0.2616 1.31 0.2036Day 0.0207315 0.010363 2.00 0.0569(Day-21.7778)^2 -0.00642 0.001051 -6.11 <.0001 Figure 2.7E. JMP bivariate analysis of lolF2 temporal expression quadratic function
pattern for WT N. uncinatum in MM culture.
-2
-1.5
-1
-0.5
0
0.5
1
1.5
lolF
2
5 10 15 20 25 30 35 40 45Day
Polynomial Fit Degree=2
log 1
0 (2- Δ
ΔC
t )
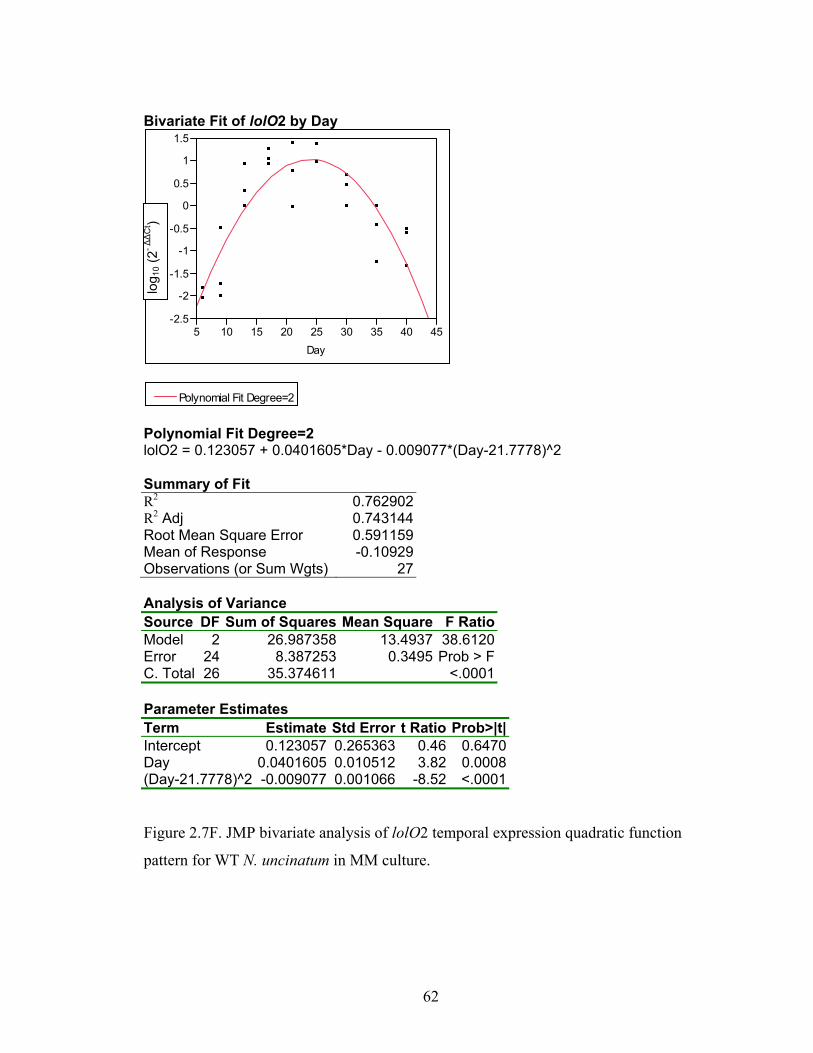
62
Bivariate Fit of lolO2 by Day
Polynomial Fit Degree=2 lolO2 = 0.123057 + 0.0401605*Day - 0.009077*(Day-21.7778)^2 Summary of Fit R2 0.762902R2 Adj 0.743144Root Mean Square Error 0.591159Mean of Response -0.10929Observations (or Sum Wgts) 27 Analysis of Variance Source DF Sum of Squares Mean Square F RatioModel 2 26.987358 13.4937 38.6120Error 24 8.387253 0.3495 Prob > FC. Total 26 35.374611 <.0001 Parameter Estimates Term Estimate Std Error t Ratio Prob>|t|Intercept 0.123057 0.265363 0.46 0.6470Day 0.0401605 0.010512 3.82 0.0008(Day-21.7778)^2 -0.009077 0.001066 -8.52 <.0001 Figure 2.7F. JMP bivariate analysis of lolO2 temporal expression quadratic function
pattern for WT N. uncinatum in MM culture.
-2.5
-2
-1.5
-1
-0.5
0
0.5
1
1.5
lolO
2
5 10 15 20 25 30 35 40 45Day
Polynomial Fit Degree=2
log 1
0 (2- Δ
ΔC
t )
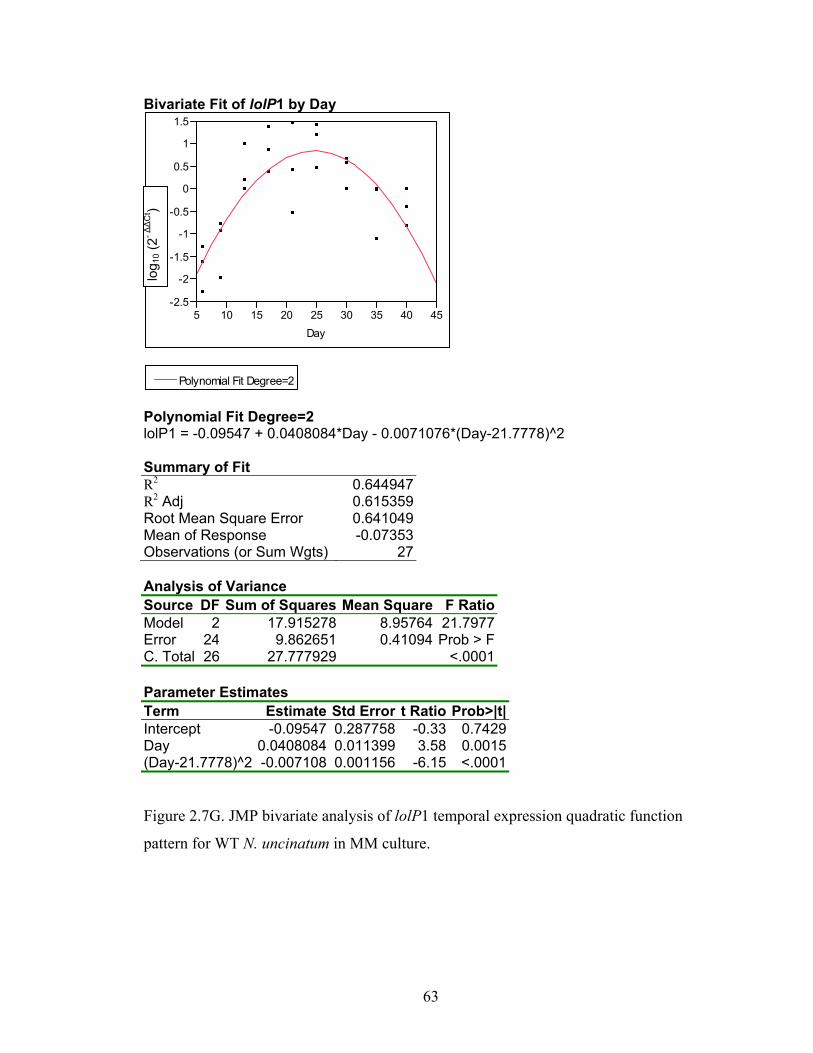
63
Bivariate Fit of lolP1 by Day
Polynomial Fit Degree=2 lolP1 = -0.09547 + 0.0408084*Day - 0.0071076*(Day-21.7778)^2 Summary of Fit R2 0.644947R2 Adj 0.615359Root Mean Square Error 0.641049Mean of Response -0.07353Observations (or Sum Wgts) 27 Analysis of Variance Source DF Sum of Squares Mean Square F RatioModel 2 17.915278 8.95764 21.7977Error 24 9.862651 0.41094 Prob > FC. Total 26 27.777929 <.0001 Parameter Estimates Term Estimate Std Error t Ratio Prob>|t|Intercept -0.09547 0.287758 -0.33 0.7429Day 0.0408084 0.011399 3.58 0.0015(Day-21.7778)^2 -0.007108 0.001156 -6.15 <.0001 Figure 2.7G. JMP bivariate analysis of lolP1 temporal expression quadratic function
pattern for WT N. uncinatum in MM culture.
-2.5
-2
-1.5
-1
-0.5
0
0.5
1
1.5
lolP
1
5 10 15 20 25 30 35 40 45Day
Polynomial Fit Degree=2
log 1
0 (2- Δ
ΔC
t )
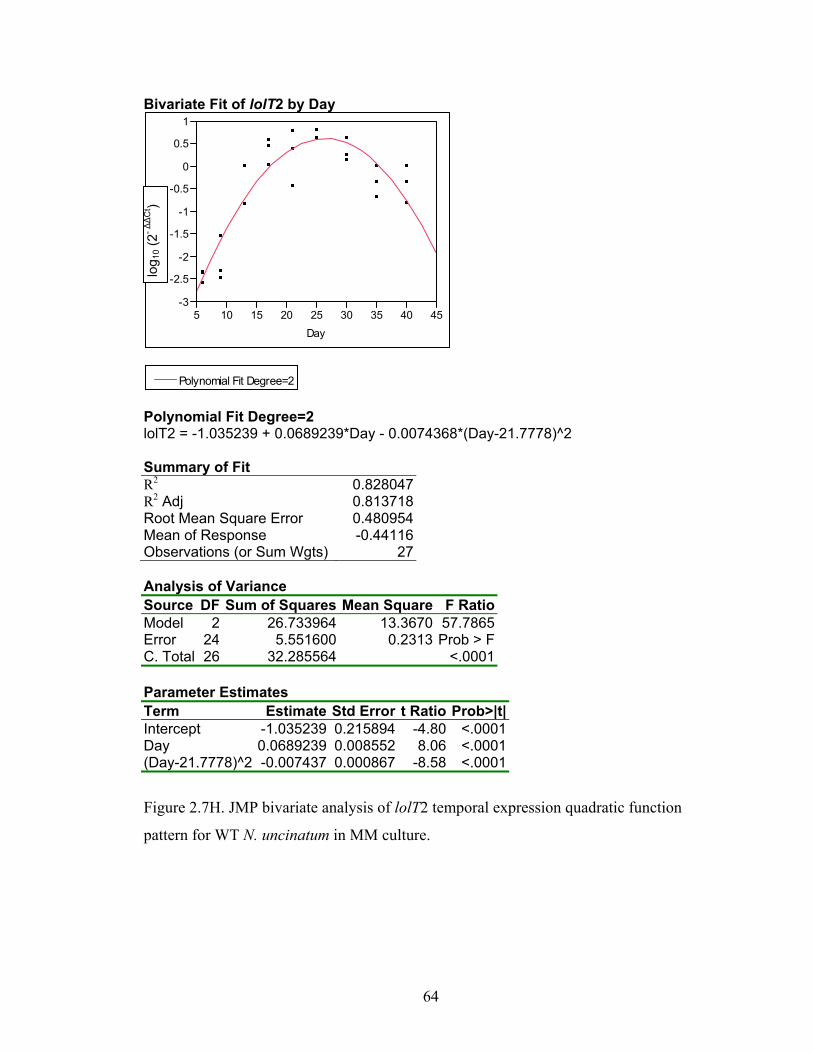
64
Bivariate Fit of lolT2 by Day
Polynomial Fit Degree=2 lolT2 = -1.035239 + 0.0689239*Day - 0.0074368*(Day-21.7778)^2 Summary of Fit R2 0.828047R2 Adj 0.813718Root Mean Square Error 0.480954Mean of Response -0.44116Observations (or Sum Wgts) 27 Analysis of Variance Source DF Sum of Squares Mean Square F RatioModel 2 26.733964 13.3670 57.7865Error 24 5.551600 0.2313 Prob > FC. Total 26 32.285564 <.0001 Parameter Estimates Term Estimate Std Error t Ratio Prob>|t|Intercept -1.035239 0.215894 -4.80 <.0001Day 0.0689239 0.008552 8.06 <.0001(Day-21.7778)^2 -0.007437 0.000867 -8.58 <.0001
Figure 2.7H. JMP bivariate analysis of lolT2 temporal expression quadratic function
pattern for WT N. uncinatum in MM culture.
-3
-2.5
-2
-1.5
-1
-0.5
0
0.5
1
lolT
2
5 10 15 20 25 30 35 40 45Day
Polynomial Fit Degree=2
log 1
0 (2- Δ
ΔC
t )
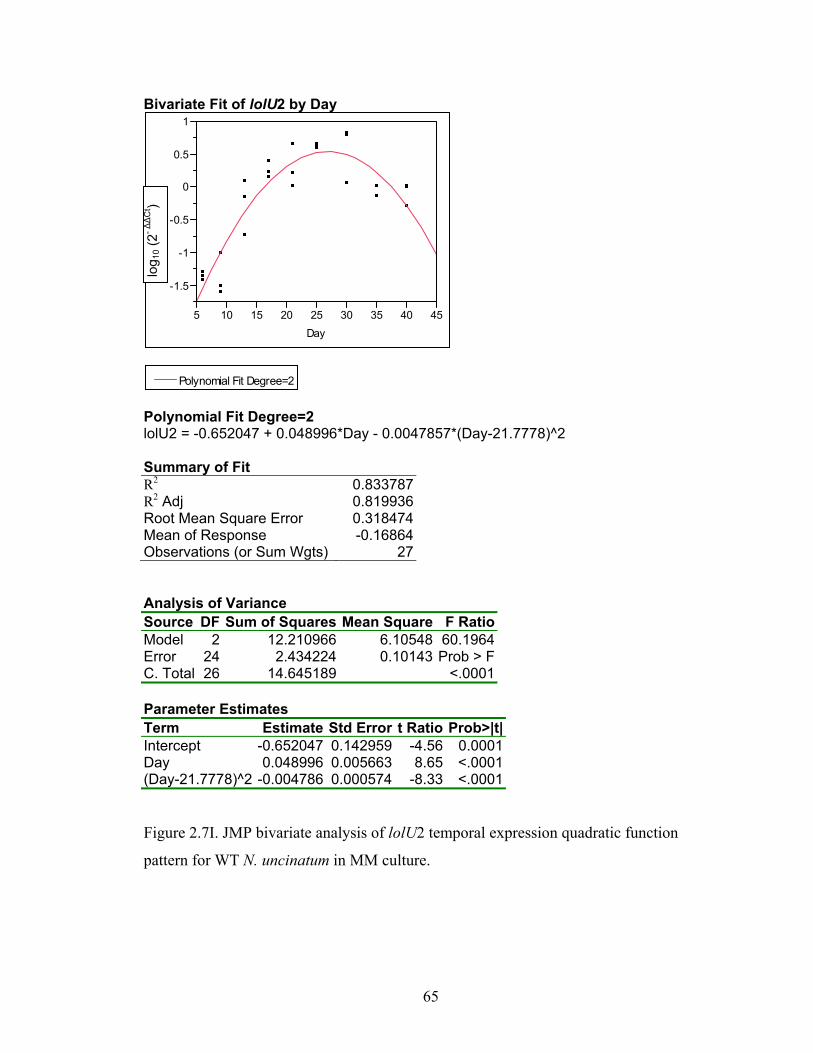
65
Bivariate Fit of lolU2 by Day
Polynomial Fit Degree=2 lolU2 = -0.652047 + 0.048996*Day - 0.0047857*(Day-21.7778)^2 Summary of Fit R2 0.833787R2 Adj 0.819936Root Mean Square Error 0.318474Mean of Response -0.16864Observations (or Sum Wgts) 27 Analysis of Variance Source DF Sum of Squares Mean Square F RatioModel 2 12.210966 6.10548 60.1964Error 24 2.434224 0.10143 Prob > FC. Total 26 14.645189 <.0001 Parameter Estimates Term Estimate Std Error t Ratio Prob>|t|Intercept -0.652047 0.142959 -4.56 0.0001Day 0.048996 0.005663 8.65 <.0001(Day-21.7778)^2 -0.004786 0.000574 -8.33 <.0001 Figure 2.7I. JMP bivariate analysis of lolU2 temporal expression quadratic function
pattern for WT N. uncinatum in MM culture.
-1.5
-1
-0.5
0
0.5
1
lolU
2
5 10 15 20 25 30 35 40 45Day
Polynomial Fit Degree=2
log 1
0 (2- Δ
ΔC
t )
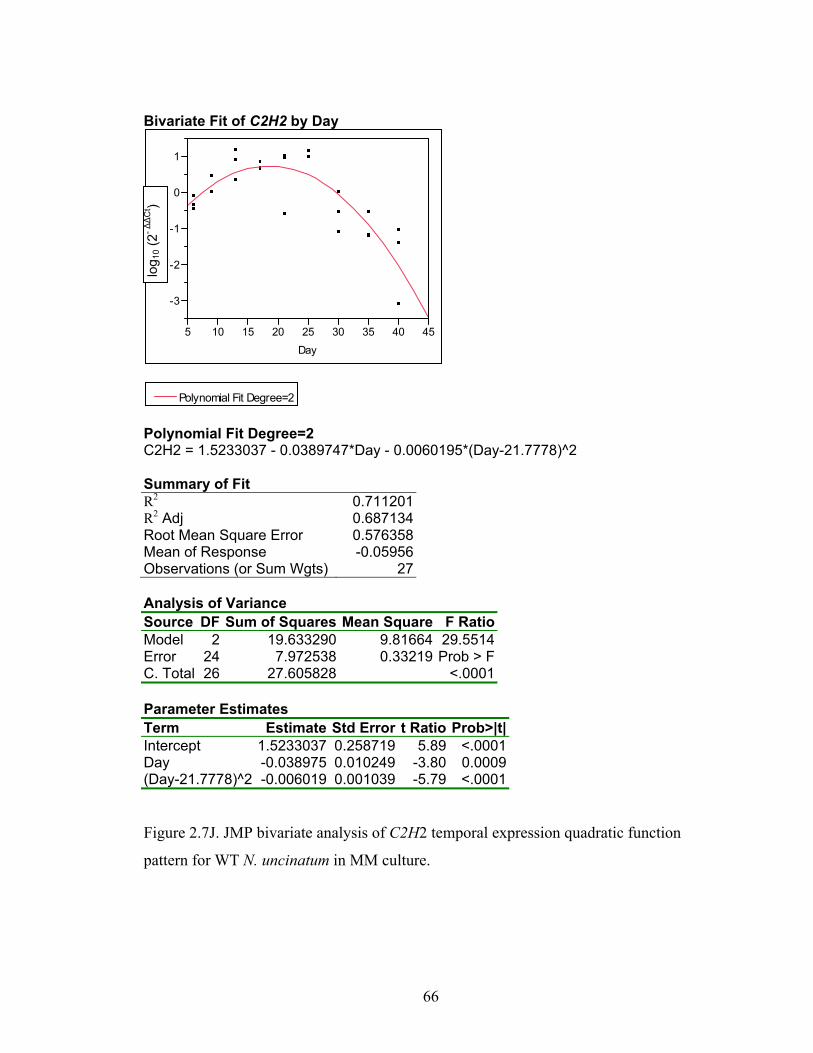
66
Bivariate Fit of C2H2 by Day
Polynomial Fit Degree=2 C2H2 = 1.5233037 - 0.0389747*Day - 0.0060195*(Day-21.7778)^2 Summary of Fit R2 0.711201R2 Adj 0.687134Root Mean Square Error 0.576358Mean of Response -0.05956Observations (or Sum Wgts) 27 Analysis of Variance Source DF Sum of Squares Mean Square F RatioModel 2 19.633290 9.81664 29.5514Error 24 7.972538 0.33219 Prob > FC. Total 26 27.605828 <.0001 Parameter Estimates Term Estimate Std Error t Ratio Prob>|t|Intercept 1.5233037 0.258719 5.89 <.0001Day -0.038975 0.010249 -3.80 0.0009(Day-21.7778)^2 -0.006019 0.001039 -5.79 <.0001 Figure 2.7J. JMP bivariate analysis of C2H2 temporal expression quadratic function
pattern for WT N. uncinatum in MM culture.
-3
-2
-1
0
1C
2H2
5 10 15 20 25 30 35 40 45Day
Polynomial Fit Degree=2
log 1
0 (2- Δ
ΔC
t )

67
Bivariate Fit of proC by Day
Polynomial Fit Degree=2 proC = -0.339162 + 0.0202548*Day - 0.0007825*(Day-21.7778)^2 Summary of Fit R2 0.686295R2 Adj 0.660153Root Mean Square Error 0.15989Mean of Response 0.006514Observations (or Sum Wgts) 27 Analysis of Variance Source DF Sum of Squares Mean Square F RatioModel 2 1.3422758 0.671138 26.2525Error 24 0.6135527 0.025565 Prob > FC. Total 26 1.9558285 <.0001 Parameter Estimates Term Estimate Std Error t Ratio Prob>|t|Intercept -0.339162 0.071772 -4.73 <.0001Day 0.0202548 0.002843 7.12 <.0001(Day-21.7778)^2 -0.000783 0.000288 -2.71 0.0121 Figure 2.7K. JMP bivariate analysis of proC temporal expression quadratic function
pattern for WT N. uncinatum in MM culture.
-0.4
-0.2
0
0.2
0.4
0.6
proC
5 10 15 20 25 30 35 40 45Day
Polynomial Fit Degree=2
log 1
0 (2- Δ
ΔC
t )
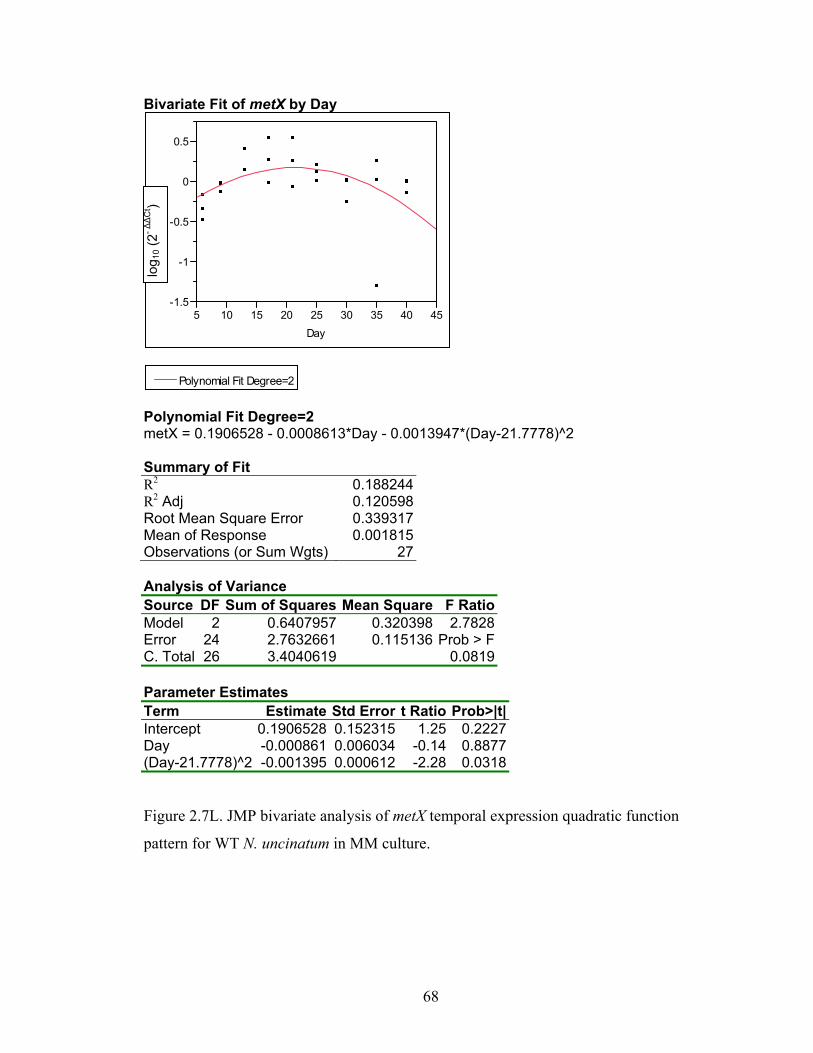
68
Bivariate Fit of metX by Day
Polynomial Fit Degree=2 metX = 0.1906528 - 0.0008613*Day - 0.0013947*(Day-21.7778)^2 Summary of Fit R2 0.188244R2 Adj 0.120598Root Mean Square Error 0.339317Mean of Response 0.001815Observations (or Sum Wgts) 27 Analysis of Variance Source DF Sum of Squares Mean Square F RatioModel 2 0.6407957 0.320398 2.7828Error 24 2.7632661 0.115136 Prob > FC. Total 26 3.4040619 0.0819 Parameter Estimates Term Estimate Std Error t Ratio Prob>|t|Intercept 0.1906528 0.152315 1.25 0.2227Day -0.000861 0.006034 -0.14 0.8877(Day-21.7778)^2 -0.001395 0.000612 -2.28 0.0318 Figure 2.7L. JMP bivariate analysis of metX temporal expression quadratic function
pattern for WT N. uncinatum in MM culture.
-1.5
-1
-0.5
0
0.5m
etX
5 10 15 20 25 30 35 40 45Day
Polynomial Fit Degree=2
log 1
0 (2- Δ
ΔC
t )
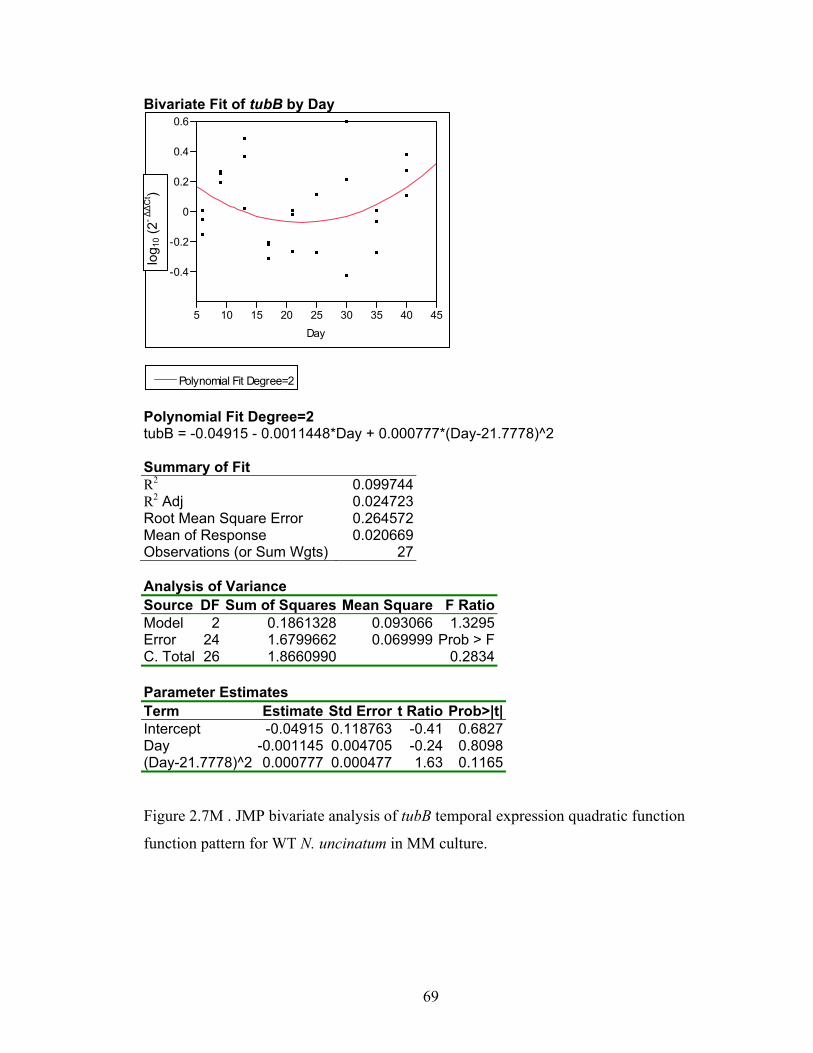
69
Bivariate Fit of tubB by Day
Polynomial Fit Degree=2 tubB = -0.04915 - 0.0011448*Day + 0.000777*(Day-21.7778)^2 Summary of Fit R2 0.099744R2 Adj 0.024723Root Mean Square Error 0.264572Mean of Response 0.020669Observations (or Sum Wgts) 27 Analysis of Variance Source DF Sum of Squares Mean Square F RatioModel 2 0.1861328 0.093066 1.3295Error 24 1.6799662 0.069999 Prob > FC. Total 26 1.8660990 0.2834 Parameter Estimates Term Estimate Std Error t Ratio Prob>|t|Intercept -0.04915 0.118763 -0.41 0.6827Day -0.001145 0.004705 -0.24 0.8098(Day-21.7778)^2 0.000777 0.000477 1.63 0.1165 Figure 2.7M . JMP bivariate analysis of tubB temporal expression quadratic function
function pattern for WT N. uncinatum in MM culture.
-0.4
-0.2
0
0.2
0.4
0.6
tub2
5 10 15 20 25 30 35 40 45Day
Polynomial Fit Degree=2
tubB
lo
g 10 (
2- ΔΔ
Ct )
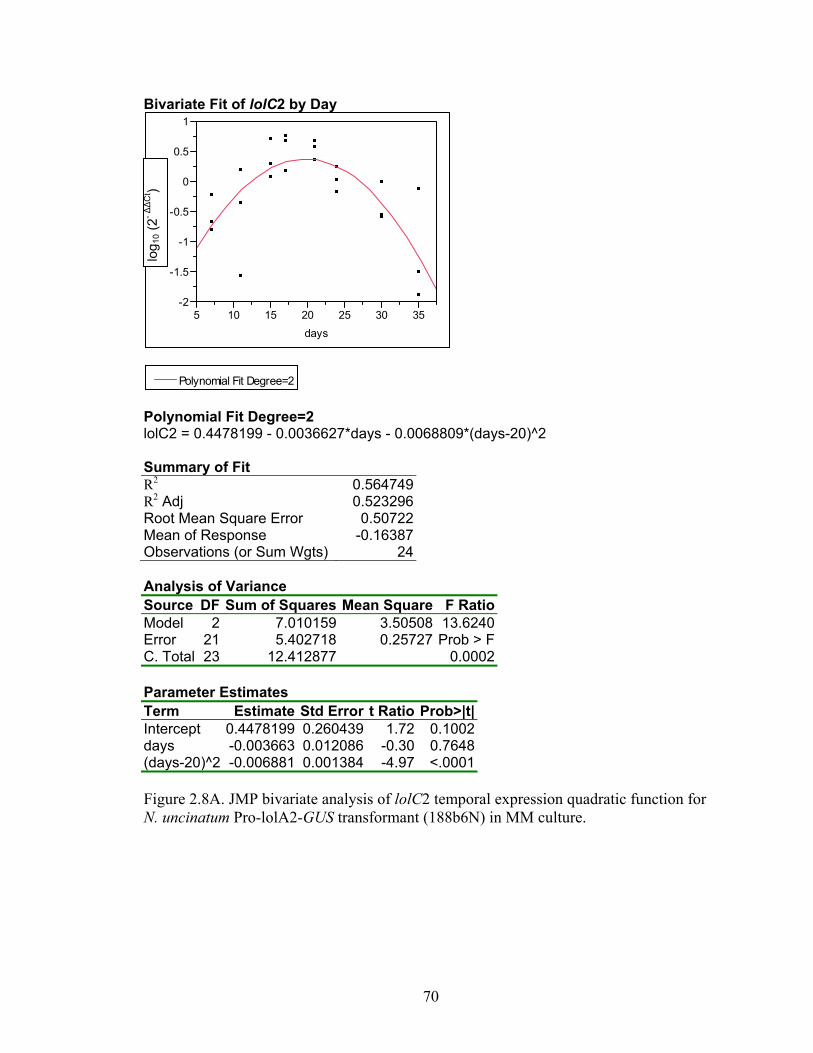
70
Bivariate Fit of lolC2 by Day
Polynomial Fit Degree=2 lolC2 = 0.4478199 - 0.0036627*days - 0.0068809*(days-20)^2 Summary of Fit R2 0.564749R2 Adj 0.523296Root Mean Square Error 0.50722Mean of Response -0.16387Observations (or Sum Wgts) 24 Analysis of Variance Source DF Sum of Squares Mean Square F RatioModel 2 7.010159 3.50508 13.6240Error 21 5.402718 0.25727 Prob > FC. Total 23 12.412877 0.0002 Parameter Estimates Term Estimate Std Error t Ratio Prob>|t|Intercept 0.4478199 0.260439 1.72 0.1002days -0.003663 0.012086 -0.30 0.7648(days-20)^2 -0.006881 0.001384 -4.97 <.0001 Figure 2.8A. JMP bivariate analysis of lolC2 temporal expression quadratic function for N. uncinatum Pro-lolA2-GUS transformant (188b6N) in MM culture.
-2
-1.5
-1
-0.5
0
0.5
1
lolC
2
5 10 15 20 25 30 35days
Polynomial Fit Degree=2
log 1
0 (2- Δ
ΔC
t )

71
Bivariate Fit of lolA2 by Day
Polynomial Fit Degree=2 lolA2 = 0.6413561 - 0.0042431*days - 0.0081723*(days-20)^2 Summary of Fit R2 0.660412R2 Adj 0.62807Root Mean Square Error 0.491839Mean of Response -0.08299Observations (or Sum Wgts) 24 Analysis of Variance Source DF Sum of Squares Mean Square F RatioModel 2 9.879330 4.93967 20.4198Error 21 5.080020 0.24191 Prob > FC. Total 23 14.959350 <.0001 Parameter Estimates Term Estimate Std Error t Ratio Prob>|t|Intercept 0.6413561 0.252541 2.54 0.0191days -0.004243 0.011719 -0.36 0.7209(days-20)^2 -0.008172 0.001342 -6.09 <.0001 Figure 2.8B. JMP bivariate analysis of lolA2 temporal expression quadratic function for
N. uncinatum Pro-lolA2-GUS transformant (188b6N) in MM culture.
-1.5
-1
-0.5
0
0.5
1
lolA
2
5 10 15 20 25 30 35days
Polynomial Fit Degree=2
log 1
0 (2- Δ
ΔC
t )
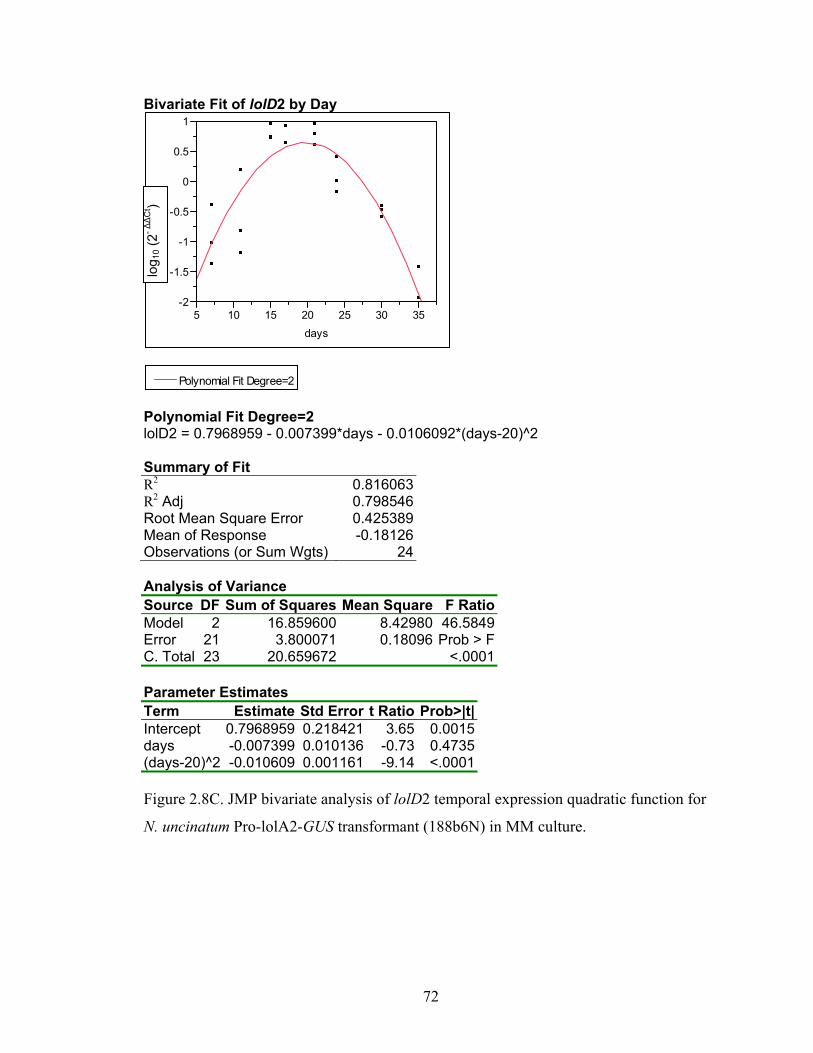
72
Bivariate Fit of lolD2 by Day
Polynomial Fit Degree=2 lolD2 = 0.7968959 - 0.007399*days - 0.0106092*(days-20)^2 Summary of Fit R2 0.816063R2 Adj 0.798546Root Mean Square Error 0.425389Mean of Response -0.18126Observations (or Sum Wgts) 24 Analysis of Variance Source DF Sum of Squares Mean Square F RatioModel 2 16.859600 8.42980 46.5849Error 21 3.800071 0.18096 Prob > FC. Total 23 20.659672 <.0001 Parameter Estimates Term Estimate Std Error t Ratio Prob>|t|Intercept 0.7968959 0.218421 3.65 0.0015days -0.007399 0.010136 -0.73 0.4735(days-20)^2 -0.010609 0.001161 -9.14 <.0001 Figure 2.8C. JMP bivariate analysis of lolD2 temporal expression quadratic function for
N. uncinatum Pro-lolA2-GUS transformant (188b6N) in MM culture.
-2
-1.5
-1
-0.5
0
0.5
1
lolD
2
5 10 15 20 25 30 35days
Polynomial Fit Degree=2
log 1
0 (2- Δ
ΔC
t )
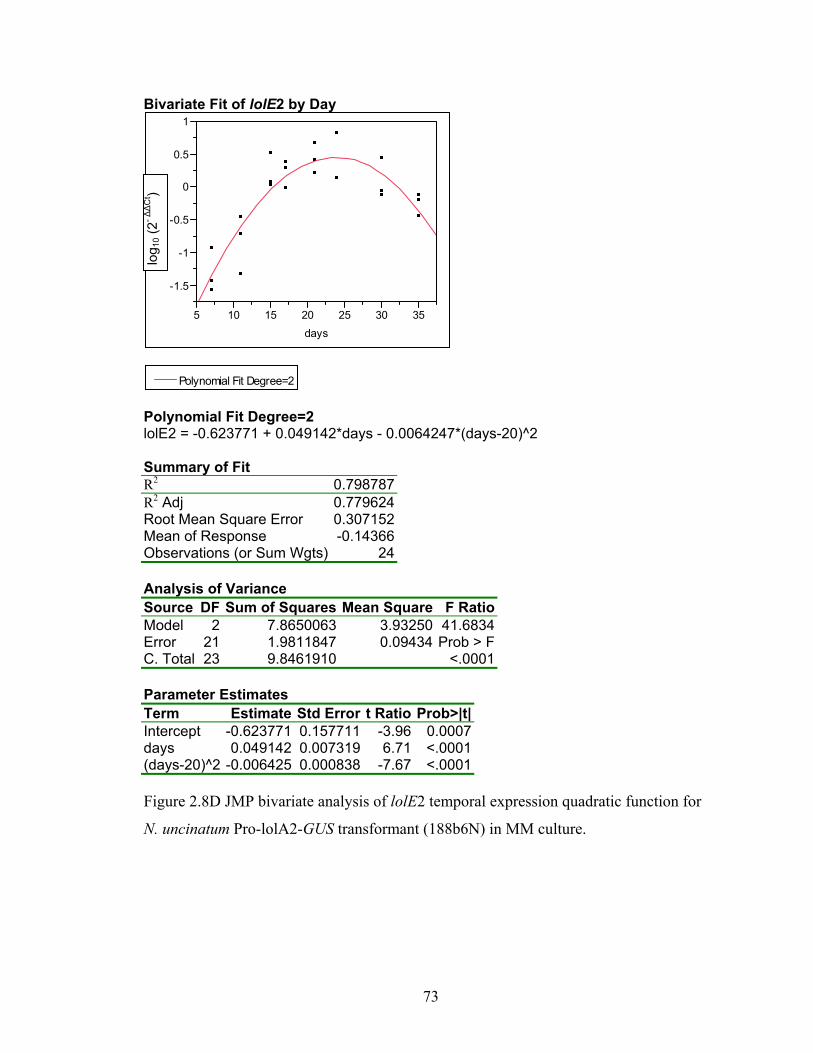
73
Bivariate Fit of lolE2 by Day
Polynomial Fit Degree=2 lolE2 = -0.623771 + 0.049142*days - 0.0064247*(days-20)^2 Summary of Fit R2 0.798787R2 Adj 0.779624Root Mean Square Error 0.307152Mean of Response -0.14366Observations (or Sum Wgts) 24 Analysis of Variance Source DF Sum of Squares Mean Square F RatioModel 2 7.8650063 3.93250 41.6834Error 21 1.9811847 0.09434 Prob > FC. Total 23 9.8461910 <.0001 Parameter Estimates Term Estimate Std Error t Ratio Prob>|t|Intercept -0.623771 0.157711 -3.96 0.0007days 0.049142 0.007319 6.71 <.0001(days-20)^2 -0.006425 0.000838 -7.67 <.0001 Figure 2.8D JMP bivariate analysis of lolE2 temporal expression quadratic function for
N. uncinatum Pro-lolA2-GUS transformant (188b6N) in MM culture.
-1.5
-1
-0.5
0
0.5
1
lolE
2
5 10 15 20 25 30 35days
Polynomial Fit Degree=2
log 1
0 (2- Δ
ΔC
t )

74
Bivariate Fit of lolF2 by Day
Polynomial Fit Degree=2 lolF2 = 0.9184276 - 0.013945*days - 0.0105296*(days-20)^2 Summary of Fit R2 0.685972R2 Adj 0.656065Root Mean Square Error 0.61658Mean of Response -0.18442Observations (or Sum Wgts) 24 Analysis of Variance Source DF Sum of Squares Mean Square F RatioModel 2 17.439610 8.71981 22.9365Error 21 7.983595 0.38017 Prob > FC. Total 23 25.423206 <.0001 Parameter Estimates Term Estimate Std Error t Ratio Prob>|t|Intercept 0.9184276 0.316591 2.90 0.0085days -0.013945 0.014691 -0.95 0.3533(days-20)^2 -0.01053 0.001683 -6.26 <.0001
Figure 2.8E. JMP bivariate analysis of lolF2 temporal expression quadratic function for
N. uncinatum Pro-lolA2-GUS transformant (188b6N) in MM culture.
-4
-3
-2
-1
0
1
lolF
2
5 10 15 20 25 30 35days
Polynomial Fit Degree=2
log 1
0 (2- Δ
ΔC
t )
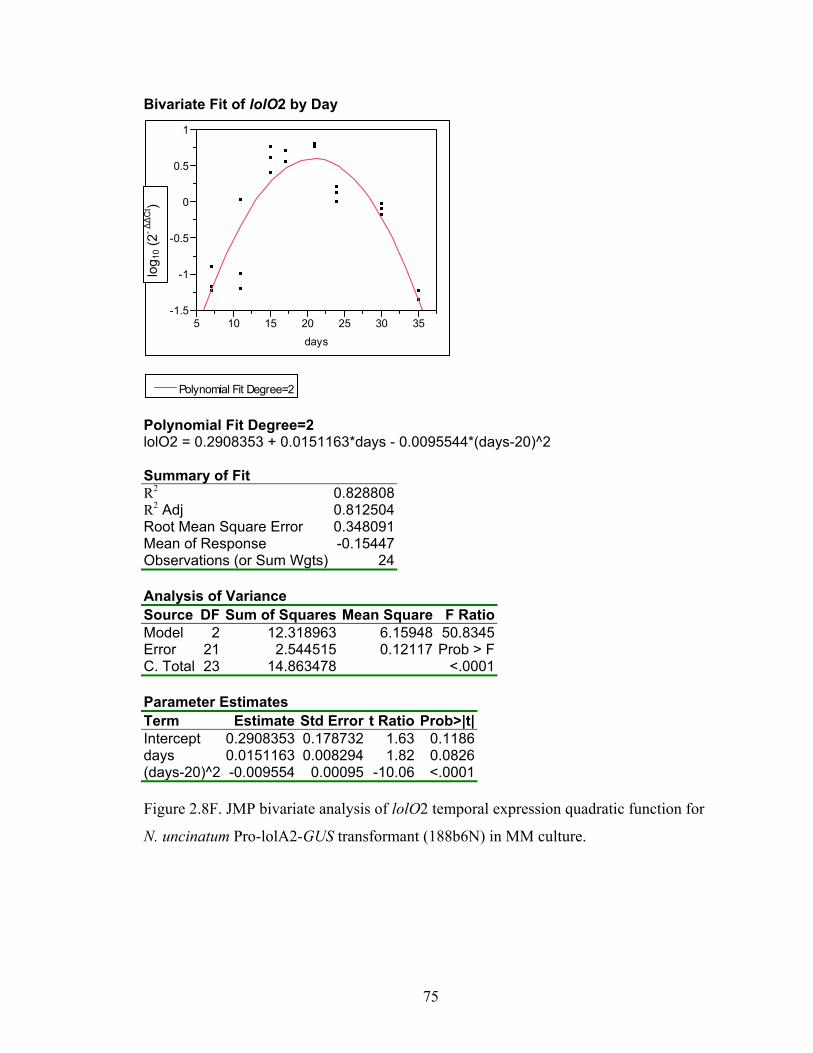
75
Bivariate Fit of lolO2 by Day
Polynomial Fit Degree=2 lolO2 = 0.2908353 + 0.0151163*days - 0.0095544*(days-20)^2 Summary of Fit R2 0.828808R2 Adj 0.812504Root Mean Square Error 0.348091Mean of Response -0.15447Observations (or Sum Wgts) 24 Analysis of Variance Source DF Sum of Squares Mean Square F RatioModel 2 12.318963 6.15948 50.8345Error 21 2.544515 0.12117 Prob > FC. Total 23 14.863478 <.0001 Parameter Estimates Term Estimate Std Error t Ratio Prob>|t|Intercept 0.2908353 0.178732 1.63 0.1186days 0.0151163 0.008294 1.82 0.0826(days-20)^2 -0.009554 0.00095 -10.06 <.0001 Figure 2.8F. JMP bivariate analysis of lolO2 temporal expression quadratic function for
N. uncinatum Pro-lolA2-GUS transformant (188b6N) in MM culture.
-1.5
-1
-0.5
0
0.5
1
lolO
2
5 10 15 20 25 30 35days
Polynomial Fit Degree=2
log 1
0 (2- Δ
ΔC
t )
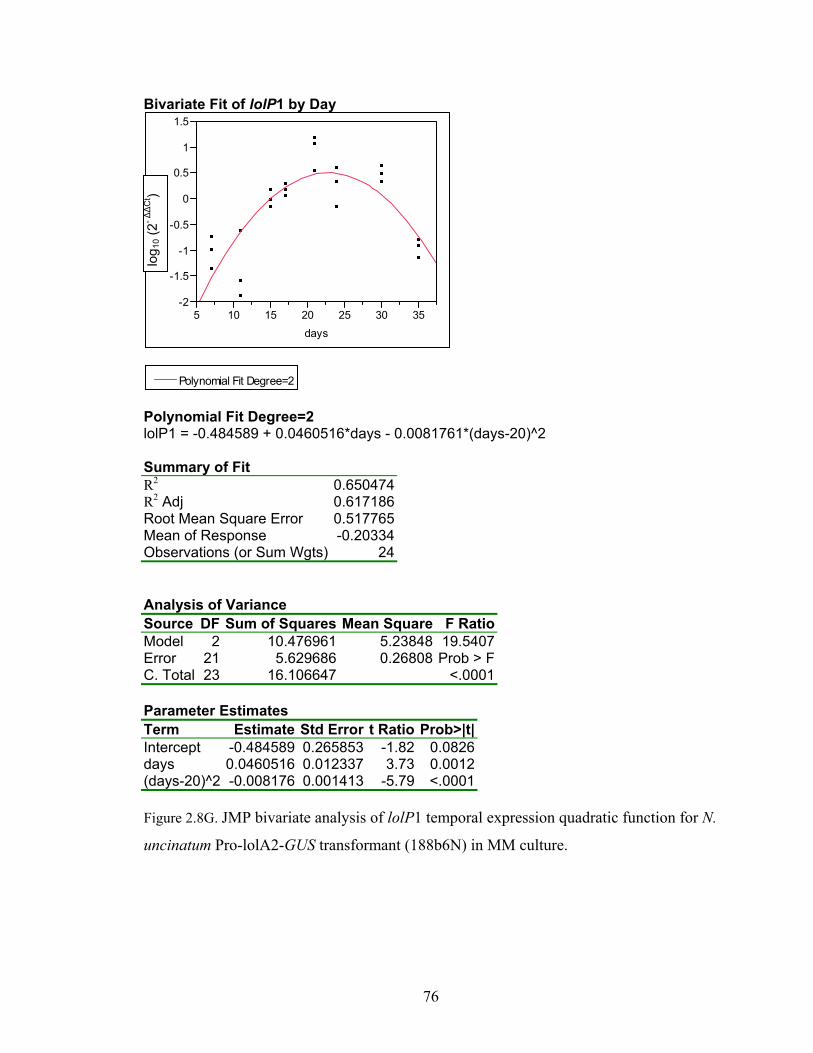
76
Bivariate Fit of lolP1 by Day
Polynomial Fit Degree=2 lolP1 = -0.484589 + 0.0460516*days - 0.0081761*(days-20)^2 Summary of Fit R2 0.650474R2 Adj 0.617186Root Mean Square Error 0.517765Mean of Response -0.20334Observations (or Sum Wgts) 24 Analysis of Variance Source DF Sum of Squares Mean Square F RatioModel 2 10.476961 5.23848 19.5407Error 21 5.629686 0.26808 Prob > FC. Total 23 16.106647 <.0001 Parameter Estimates Term Estimate Std Error t Ratio Prob>|t|Intercept -0.484589 0.265853 -1.82 0.0826days 0.0460516 0.012337 3.73 0.0012(days-20)^2 -0.008176 0.001413 -5.79 <.0001 Figure 2.8G. JMP bivariate analysis of lolP1 temporal expression quadratic function for N.
uncinatum Pro-lolA2-GUS transformant (188b6N) in MM culture.
-2
-1.5
-1
-0.5
0
0.5
1
1.5
lolP
1
5 10 15 20 25 30 35days
Polynomial Fit Degree=2
log 1
0 (2- Δ
ΔC
t )

77
Bivariate Fit of lolT2 by Day
Polynomial Fit Degree=2 lolT2 = -0.046533 + 0.0223795*days - 0.0073986*(days-20)^2 Summary of Fit R2 0.7518R2 Adj 0.728162Root Mean Square Error 0.341651Mean of Response -0.17788Observations (or Sum Wgts) 24 Analysis of Variance Source DF Sum of Squares Mean Square F RatioModel 2 7.4248346 3.71242 31.8046Error 21 2.4512407 0.11673 Prob > FC. Total 23 9.8760752 <.0001 Parameter Estimates Term Estimate Std Error t Ratio Prob>|t|Intercept -0.046533 0.175425 -0.27 0.7934days 0.0223795 0.008141 2.75 0.0120(days-20)^2 -0.007399 0.000932 -7.94 <.0001 Figure 2.8H. JMP bivariate analysis of lolT2 temporal expression quadratic function for
N. uncinatum Pro-lolA2-GUS transformant (188b6N) in MM culture.
-2
-1.5
-1
-0.5
0
0.5
1
lolT
2
5 10 15 20 25 30 35days
Polynomial Fit Degree=2
log 1
0 (2- Δ
ΔC
t )

78
Bivariate Fit of lolU2 by Day
Polynomial Fit Degree=2 lolU2 = -0.421985 + 0.0377373*days - 0.0059145*(days-20)^2 Summary of Fit R2 0.855048R2 Adj 0.841243Root Mean Square Error 0.21748Mean of Response -0.13005Observations (or Sum Wgts) 24 Analysis of Variance Source DF Sum of Squares Mean Square F RatioModel 2 5.8589763 2.92949 61.9377Error 21 0.9932443 0.04730 Prob > FC. Total 23 6.8522206 <.0001 Parameter Estimates Term Estimate Std Error t Ratio Prob>|t|Intercept -0.421985 0.111668 -3.78 0.0011days 0.0377373 0.005182 7.28 <.0001(days-20)^2 -0.005914 0.000593 -9.97 <.0001 Figure 2.8I. JMP bivariate analysis of lolU2 temporal expression quadratic function for
N. uncinatum Pro-lolA2-GUS transformant (188b6N) in MM culture.
-1
-0.5
0
0.5
1
lolU
2
5 10 15 20 25 30 35days
Polynomial Fit Degree=2
log 1
0 (2- Δ
ΔC
t )
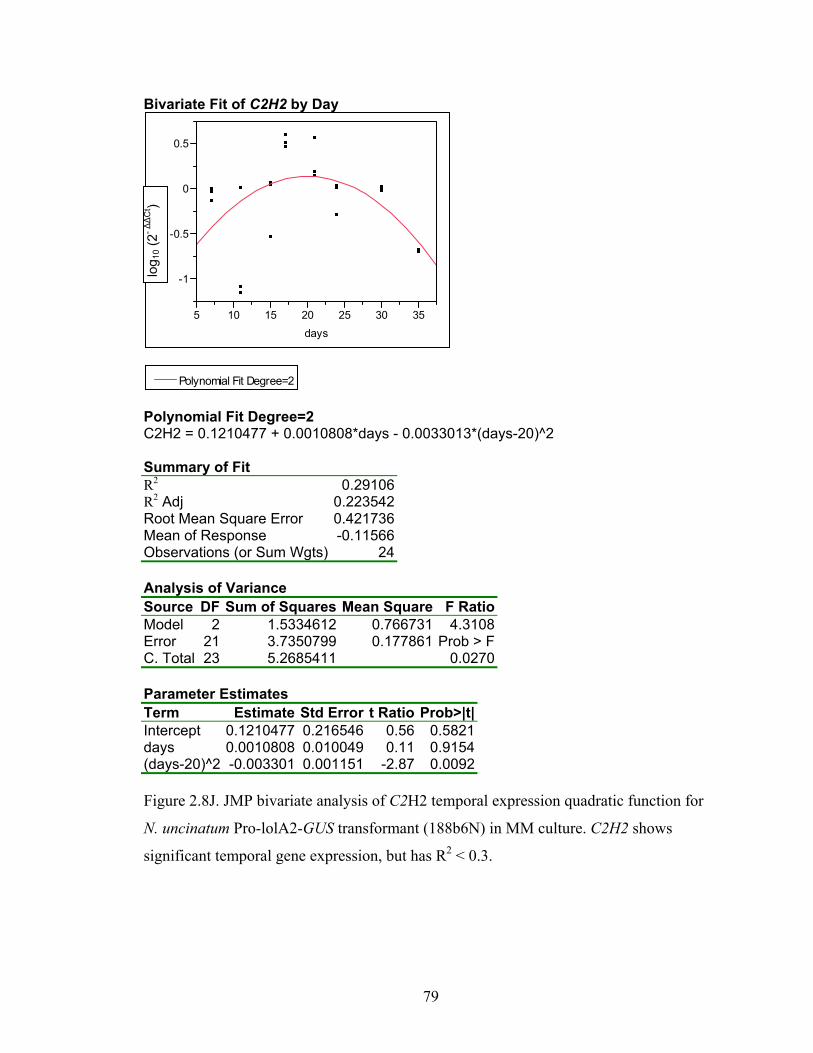
79
Bivariate Fit of C2H2 by Day
Polynomial Fit Degree=2 C2H2 = 0.1210477 + 0.0010808*days - 0.0033013*(days-20)^2 Summary of Fit R2 0.29106R2 Adj 0.223542Root Mean Square Error 0.421736Mean of Response -0.11566Observations (or Sum Wgts) 24 Analysis of Variance Source DF Sum of Squares Mean Square F RatioModel 2 1.5334612 0.766731 4.3108Error 21 3.7350799 0.177861 Prob > FC. Total 23 5.2685411 0.0270 Parameter Estimates Term Estimate Std Error t Ratio Prob>|t|Intercept 0.1210477 0.216546 0.56 0.5821days 0.0010808 0.010049 0.11 0.9154(days-20)^2 -0.003301 0.001151 -2.87 0.0092 Figure 2.8J. JMP bivariate analysis of C2H2 temporal expression quadratic function for
N. uncinatum Pro-lolA2-GUS transformant (188b6N) in MM culture. C2H2 shows
significant temporal gene expression, but has R2 < 0.3.
-1
-0.5
0
0.5C
2H2
5 10 15 20 25 30 35days
Polynomial Fit Degree=2
log 1
0 (2- Δ
ΔC
t )
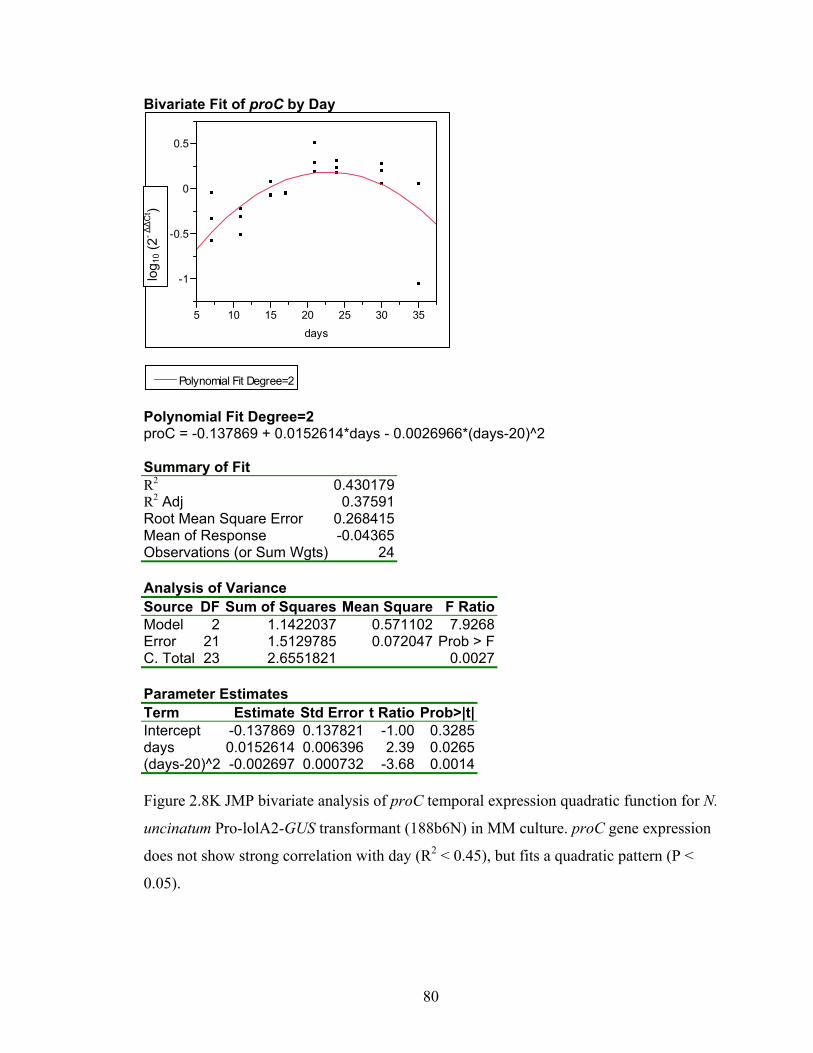
80
Bivariate Fit of proC by Day
Polynomial Fit Degree=2 proC = -0.137869 + 0.0152614*days - 0.0026966*(days-20)^2 Summary of Fit R2 0.430179R2 Adj 0.37591Root Mean Square Error 0.268415Mean of Response -0.04365Observations (or Sum Wgts) 24 Analysis of Variance Source DF Sum of Squares Mean Square F RatioModel 2 1.1422037 0.571102 7.9268Error 21 1.5129785 0.072047 Prob > FC. Total 23 2.6551821 0.0027 Parameter Estimates Term Estimate Std Error t Ratio Prob>|t|Intercept -0.137869 0.137821 -1.00 0.3285days 0.0152614 0.006396 2.39 0.0265(days-20)^2 -0.002697 0.000732 -3.68 0.0014 Figure 2.8K JMP bivariate analysis of proC temporal expression quadratic function for N.
uncinatum Pro-lolA2-GUS transformant (188b6N) in MM culture. proC gene expression
does not show strong correlation with day (R2 < 0.45), but fits a quadratic pattern (P <
0.05).
-1
-0.5
0
0.5Pr
oC
5 10 15 20 25 30 35days
Polynomial Fit Degree=2
log 1
0 (2- Δ
ΔC
t )
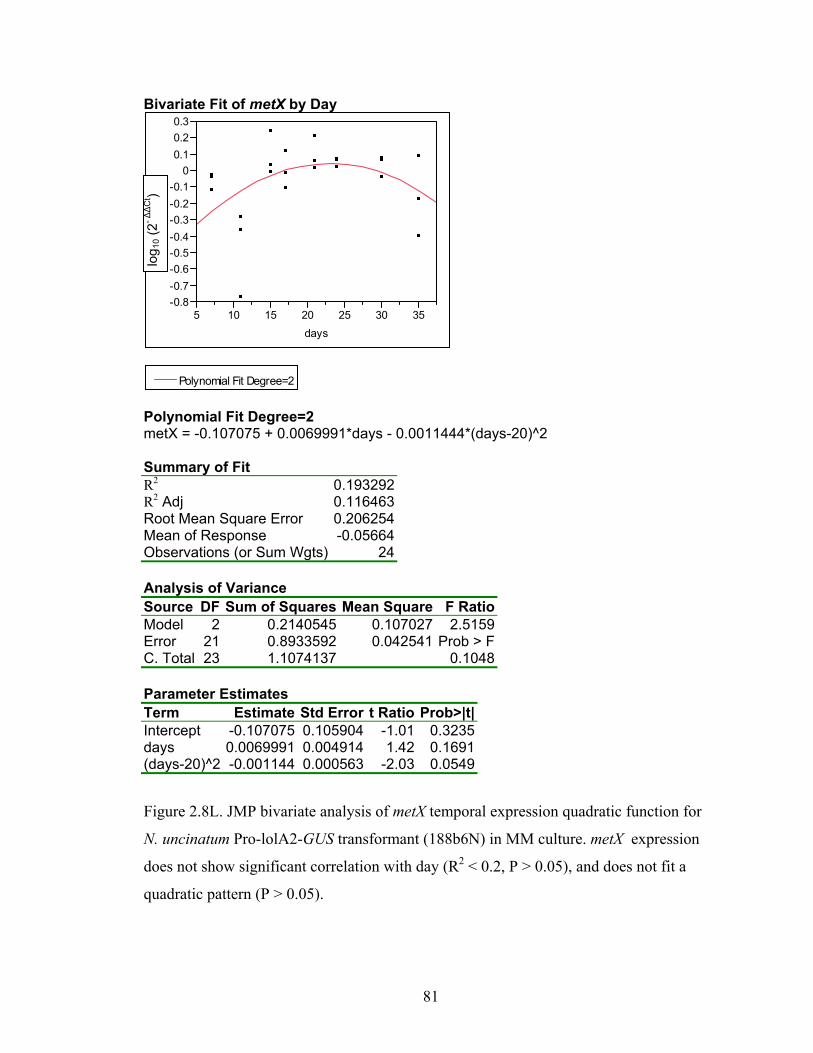
81
Bivariate Fit of metX by Day
Polynomial Fit Degree=2 metX = -0.107075 + 0.0069991*days - 0.0011444*(days-20)^2 Summary of Fit R2 0.193292R2 Adj 0.116463Root Mean Square Error 0.206254Mean of Response -0.05664Observations (or Sum Wgts) 24 Analysis of Variance Source DF Sum of Squares Mean Square F RatioModel 2 0.2140545 0.107027 2.5159Error 21 0.8933592 0.042541 Prob > FC. Total 23 1.1074137 0.1048 Parameter Estimates Term Estimate Std Error t Ratio Prob>|t|Intercept -0.107075 0.105904 -1.01 0.3235days 0.0069991 0.004914 1.42 0.1691(days-20)^2 -0.001144 0.000563 -2.03 0.0549
Figure 2.8L. JMP bivariate analysis of metX temporal expression quadratic function for
N. uncinatum Pro-lolA2-GUS transformant (188b6N) in MM culture. metX expression
does not show significant correlation with day (R2 < 0.2, P > 0.05), and does not fit a
quadratic pattern (P > 0.05).
-0.8-0.7-0.6-0.5-0.4-0.3-0.2-0.1
00.10.20.3
Met
X
5 10 15 20 25 30 35days
Polynomial Fit Degree=2
log 1
0 (2- Δ
ΔC
t )
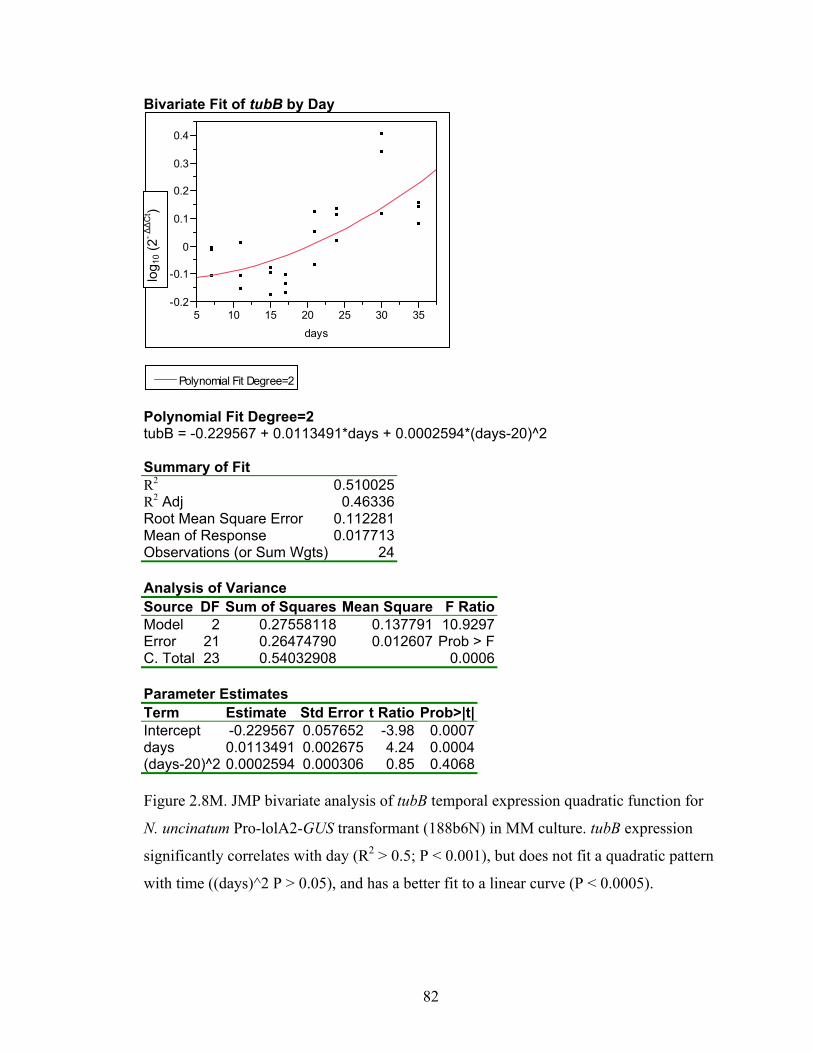
82
Bivariate Fit of tubB by Day
Polynomial Fit Degree=2 tubB = -0.229567 + 0.0113491*days + 0.0002594*(days-20)^2 Summary of Fit R2 0.510025R2 Adj 0.46336Root Mean Square Error 0.112281Mean of Response 0.017713Observations (or Sum Wgts) 24 Analysis of Variance Source DF Sum of Squares Mean Square F RatioModel 2 0.27558118 0.137791 10.9297Error 21 0.26474790 0.012607 Prob > FC. Total 23 0.54032908 0.0006 Parameter Estimates Term Estimate Std Error t Ratio Prob>|t|Intercept -0.229567 0.057652 -3.98 0.0007days 0.0113491 0.002675 4.24 0.0004(days-20)^2 0.0002594 0.000306 0.85 0.4068 Figure 2.8M. JMP bivariate analysis of tubB temporal expression quadratic function for
N. uncinatum Pro-lolA2-GUS transformant (188b6N) in MM culture. tubB expression
significantly correlates with day (R2 > 0.5; P < 0.001), but does not fit a quadratic pattern
with time ((days)^2 P > 0.05), and has a better fit to a linear curve (P < 0.0005).
-0.2
-0.1
0
0.1
0.2
0.3
0.4
tubB
5 10 15 20 25 30 35days
Polynomial Fit Degree=2
log 1
0 (2- Δ
ΔC
t )
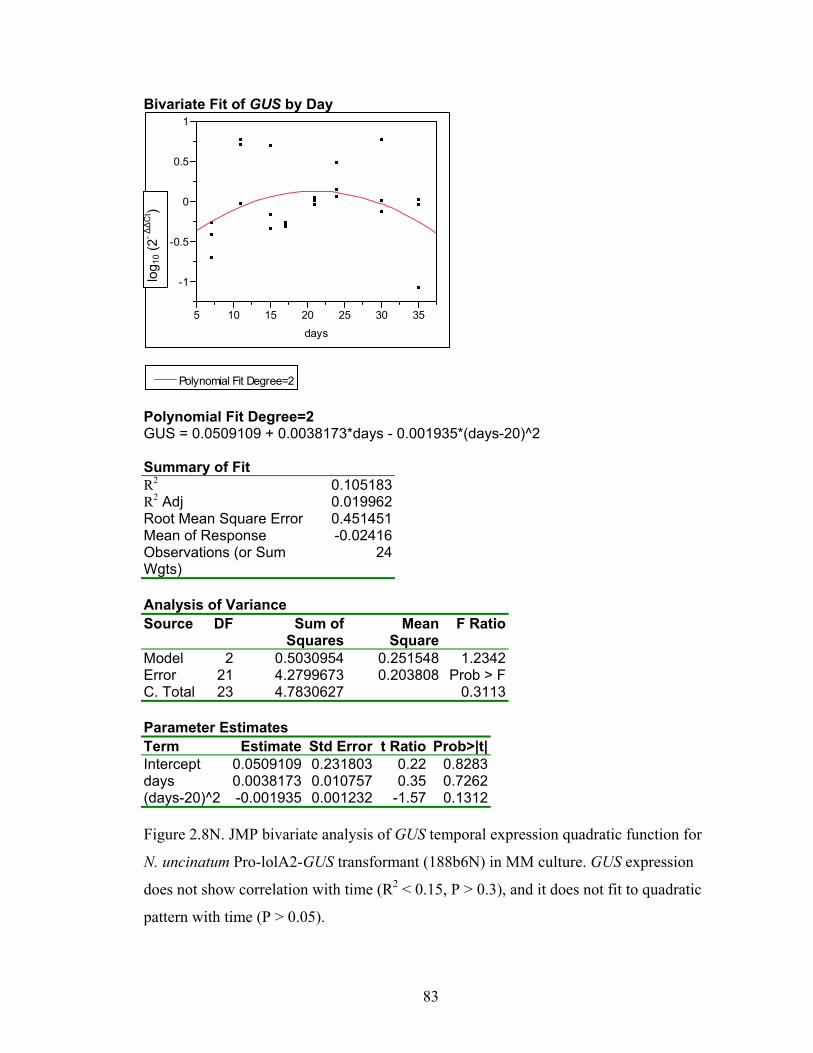
83
Bivariate Fit of GUS by Day
Polynomial Fit Degree=2 GUS = 0.0509109 + 0.0038173*days - 0.001935*(days-20)^2 Summary of Fit R2 0.105183R2 Adj 0.019962Root Mean Square Error 0.451451Mean of Response -0.02416Observations (or Sum Wgts)
24
Analysis of Variance Source DF Sum of
SquaresMean
SquareF Ratio
Model 2 0.5030954 0.251548 1.2342Error 21 4.2799673 0.203808 Prob > FC. Total 23 4.7830627 0.3113 Parameter Estimates Term Estimate Std Error t Ratio Prob>|t|Intercept 0.0509109 0.231803 0.22 0.8283days 0.0038173 0.010757 0.35 0.7262(days-20)^2 -0.001935 0.001232 -1.57 0.1312 Figure 2.8N. JMP bivariate analysis of GUS temporal expression quadratic function for
N. uncinatum Pro-lolA2-GUS transformant (188b6N) in MM culture. GUS expression
does not show correlation with time (R2 < 0.15, P > 0.3), and it does not fit to quadratic
pattern with time (P > 0.05).
-1
-0.5
0
0.5
1
GU
S
5 10 15 20 25 30 35days
Polynomial Fit Degree=2
log 1
0 (2- Δ
ΔC
t )
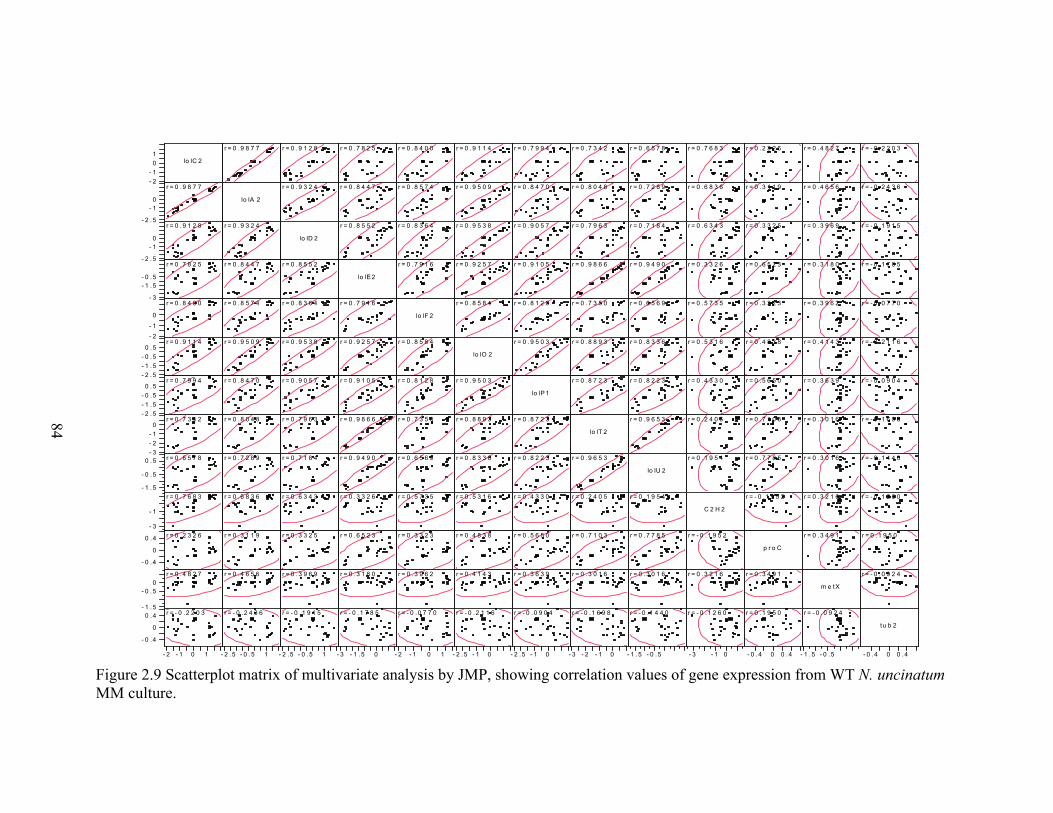
84
Figure 2.9 Scatterplot matrix of multivariate analysis by JMP, showing correlation values of gene expression from WT N. uncinatum MM culture.
- 2- 101
- 2 .5
- 10
- 2 .5
- 10
- 3
- 1 .5- 0 .5
- 2- 1
0
- 2 .5- 1 .5- 0 .50 . 5
- 2 .5- 1 .5- 0 .50 . 5
- 3- 2- 10
- 1 .5
- 0 .5
0 . 5
- 3
- 1
- 0 .4
0
0 . 4
- 1 .5
- 0 .50
- 0 .4
0
0 . 4
lo lC 2
r = 0 .9 8 7 7
r = 0 .9 1 2 8
r = 0 .7 8 2 5
r = 0 .8 4 0 0
r = 0 .9 1 1 4
r = 0 .7 9 9 4
r = 0 .7 3 4 2
r = 0 .6 5 7 8
r = 0 .7 6 8 3
r = 0 .2 3 2 6
r = 0 .4 8 2 7
r = - 0 .2 2 0 3
- 2 - 1 0 1
r = 0 .9 8 7 7
lo lA 2
r = 0 .9 3 2 4
r = 0 .8 4 4 7
r = 0 .8 5 7 4
r = 0 .9 5 0 9
r = 0 .8 4 7 0
r = 0 .8 0 4 8
r = 0 .7 2 8 9
r = 0 .6 8 3 6
r = 0 .3 1 1 9
r = 0 .4 6 5 6
r = - 0 .2 4 3 6
- 2 .5 - 0 .5 1
r = 0 .9 1 2 8
r = 0 .9 3 2 4
lo lD 2
r = 0 .8 5 5 2
r = 0 .8 3 6 4
r = 0 .9 5 3 8
r = 0 .9 0 5 7
r = 0 .7 9 6 3
r = 0 .7 1 8 4
r = 0 .6 3 4 3
r = 0 .3 3 2 5
r = 0 .3 9 6 9
r = - 0 . 1 9 1 5
- 2 .5 - 0 .5 1
r = 0 .7 8 2 5
r = 0 .8 4 4 7
r = 0 .8 5 5 2
lo lE 2
r = 0 .7 9 1 6
r = 0 .9 2 5 7
r = 0 .9 1 0 5
r = 0 .9 8 6 6
r = 0 .9 4 9 0
r = 0 .3 3 2 6
r = 0 .6 5 2 3
r = 0 .3 1 8 0
r = - 0 .1 7 8 5
- 3 - 1 .5 0
r = 0 .8 4 0 0
r = 0 .8 5 7 4
r = 0 .8 3 6 4
r = 0 .7 9 1 6
lo lF 2
r = 0 .8 5 8 4
r = 0 .8 1 2 8
r = 0 .7 3 5 0
r = 0 .6 5 6 9
r = 0 .5 7 3 5
r = 0 .3 3 2 3
r = 0 .3 9 6 2
r = - 0 .0 7 7 0
- 2 - 1 0 1
r = 0 .9 1 1 4
r = 0 .9 5 0 9
r = 0 .9 5 3 8
r = 0 .9 2 5 7
r = 0 .8 5 8 4
lo lO 2
r = 0 .9 5 0 3
r = 0 .8 8 9 3
r = 0 .8 3 3 6
r = 0 .5 3 1 6
r = 0 .4 8 3 8
r = 0 .4 1 4 3
r = - 0 .2 1 1 6
- 2 .5 - 1 0
r = 0 .7 9 9 4
r = 0 .8 4 7 0
r = 0 .9 0 5 7
r = 0 .9 1 0 5
r = 0 .8 1 2 8
r = 0 .9 5 0 3
lo lP 1
r = 0 .8 7 2 3
r = 0 .8 2 2 3
r = 0 .4 3 3 0
r = 0 .5 6 5 0
r = 0 .3 6 3 9
r = - 0 .0 9 0 4
- 2 .5 - 1 0
r = 0 .7 3 4 2
r = 0 .8 0 4 8
r = 0 .7 9 6 3
r = 0 .9 8 6 6
r = 0 .7 3 5 0
r = 0 .8 8 9 3
r = 0 .8 7 2 3
lo lT 2
r = 0 .9 6 5 3
r = 0 .2 4 0 5
r = 0 .7 1 0 3
r = 0 .3 0 1 6
r = - 0 .1 6 9 8
- 3 - 2 - 1 0
r = 0 .6 5 7 8
r = 0 .7 2 8 9
r = 0 .7 1 8 4
r = 0 .9 4 9 0
r = 0 .6 5 6 9
r = 0 .8 3 3 6
r = 0 .8 2 2 3
r = 0 .9 6 5 3
lo lU 2
r = 0 .1 9 5 4
r = 0 .7 7 8 5
r = 0 .3 0 1 6
r = - 0 .1 4 4 0
- 1 .5 - 0 .5
r = 0 .7 6 8 3
r = 0 .6 8 3 6
r = 0 .6 3 4 3
r = 0 .3 3 2 6
r = 0 .5 7 3 5
r = 0 .5 3 1 6
r = 0 .4 3 3 0
r = 0 .2 4 0 5
r = 0 .1 9 5 4
C 2 H 2
r = - 0 .1 9 5 2
r = 0 .3 2 1 6
r = - 0 .1 2 6 0
- 3 - 1 0
r = 0 .2 3 2 6
r = 0 .3 1 1 9
r = 0 .3 3 2 5
r = 0 .6 5 2 3
r = 0 .3 3 2 3
r = 0 .4 8 3 8
r = 0 .5 6 5 0
r = 0 .7 1 0 3
r = 0 .7 7 8 5
r = - 0 .1 9 5 2
p r o C
r = 0 .3 4 9 1
r = 0 .1 9 5 0
- 0 .4 0 0 .4
r = 0 .4 8 2 7
r = 0 .4 6 5 6
r = 0 .3 9 6 9
r = 0 .3 1 8 0
r = 0 .3 9 6 2
r = 0 .4 1 4 3
r = 0 .3 6 3 9
r = 0 .3 0 1 6
r = 0 .3 0 1 6
r = 0 .3 2 1 6
r = 0 .3 4 9 1
m e tX
r = - 0 .0 9 2 4
- 1 .5 - 0 .5
r = - 0 .2 2 0 3
r = - 0 .2 4 3 6
r = - 0 .1 9 1 5
r = - 0 .1 7 8 5
r = - 0 .0 7 7 0
r = - 0 .2 1 1 6
r = - 0 .0 9 0 4
r = - 0 .1 6 9 8
r = - 0 .1 4 4 0
r = - 0 .1 2 6 0
r = 0 .1 9 5 0
r = - 0 .0 9 2 4
tu b 2
- 0 .4 0 0 .4
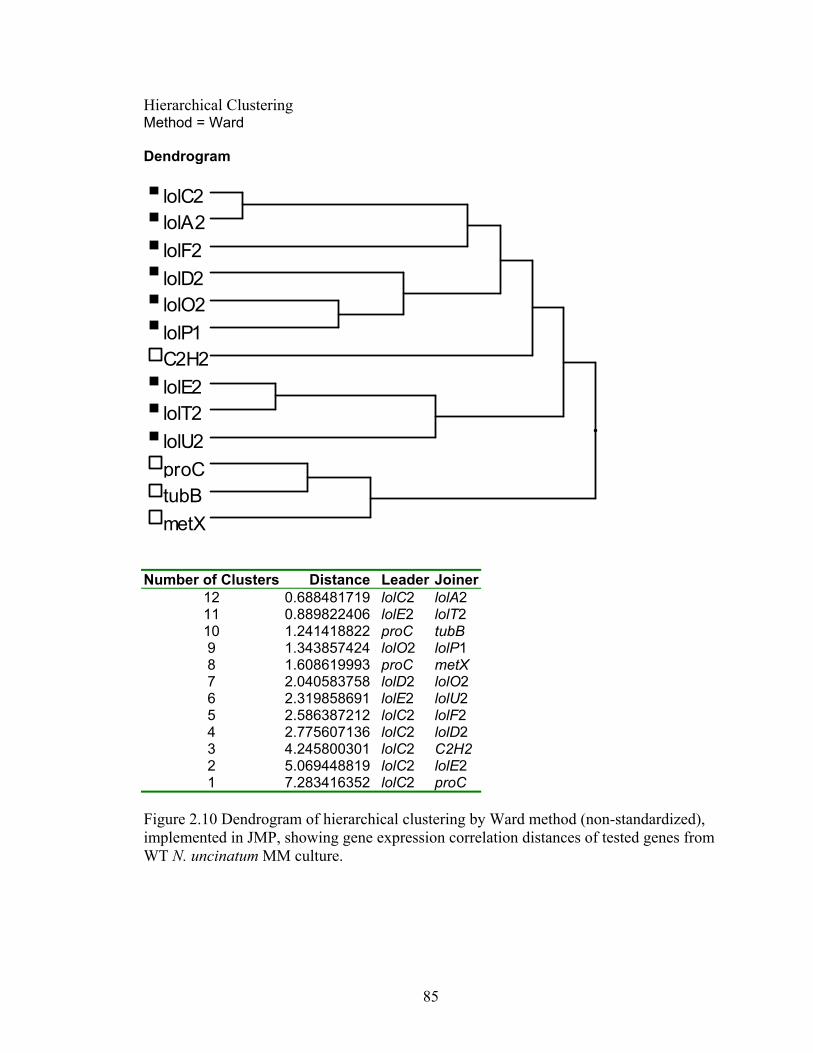
85
Hierarchical Clustering Method = Ward Dendrogram
Number of Clusters Distance Leader Joiner
12 0.688481719 lolC2 lolA2 11 0.889822406 lolE2 lolT2 10 1.241418822 proC tubB 9 1.343857424 lolO2 lolP1 8 1.608619993 proC metX 7 2.040583758 lolD2 lolO2 6 2.319858691 lolE2 lolU2 5 2.586387212 lolC2 lolF2 4 2.775607136 lolC2 lolD2 3 4.245800301 lolC2 C2H2 2 5.069448819 lolC2 lolE2 1 7.283416352 lolC2 proC
Figure 2.10 Dendrogram of hierarchical clustering by Ward method (non-standardized), implemented in JMP, showing gene expression correlation distances of tested genes from WT N. uncinatum MM culture.
lolC2lolA2
lolD2
lolE2
lolF2
lolO2lolP1
lolT2lolU2
C2H2
proC
metXtubB
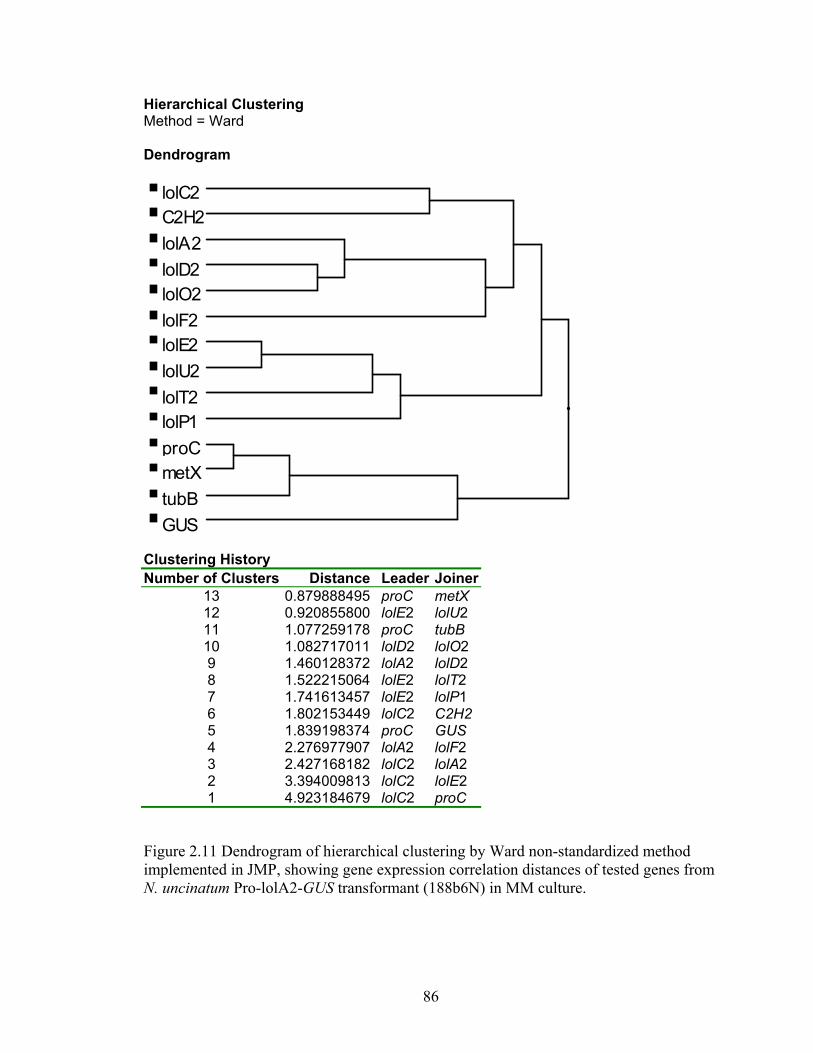
86
Hierarchical Clustering Method = Ward Dendrogram
Clustering History Number of Clusters Distance Leader Joiner
13 0.879888495 proC metX 12 0.920855800 lolE2 lolU2 11 1.077259178 proC tubB 10 1.082717011 lolD2 lolO2 9 1.460128372 lolA2 lolD2 8 1.522215064 lolE2 lolT2 7 1.741613457 lolE2 lolP1 6 1.802153449 lolC2 C2H2 5 1.839198374 proC GUS 4 2.276977907 lolA2 lolF2 3 2.427168182 lolC2 lolA2 2 3.394009813 lolC2 lolE2 1 4.923184679 lolC2 proC
Figure 2.11 Dendrogram of hierarchical clustering by Ward non-standardized method implemented in JMP, showing gene expression correlation distances of tested genes from N. uncinatum Pro-lolA2-GUS transformant (188b6N) in MM culture.
lolC2
lolA2lolD2
lolE2lolF2lolO2
lolP1lolT2lolU2
C2H2
proCmetXtubBGUS
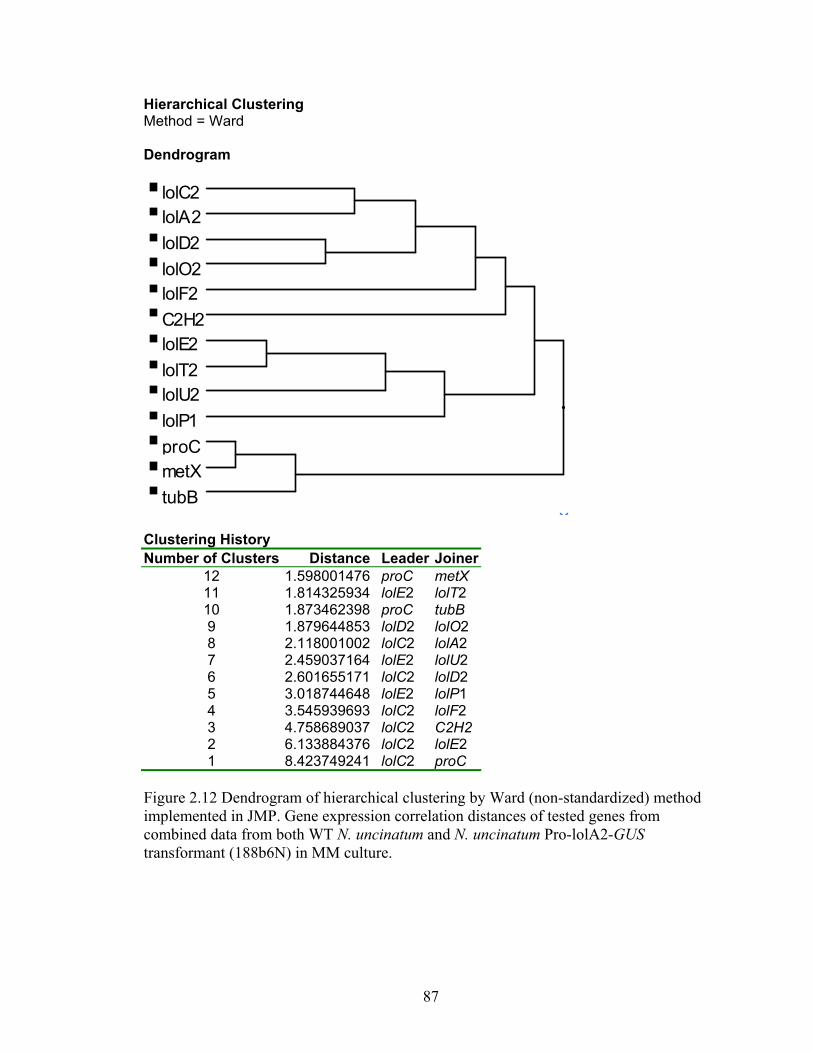
87
Hierarchical Clustering Method = Ward Dendrogram
Clustering History Number of Clusters Distance Leader Joiner
12 1.598001476 proC metX 11 1.814325934 lolE2 lolT2 10 1.873462398 proC tubB 9 1.879644853 lolD2 lolO2 8 2.118001002 lolC2 lolA2 7 2.459037164 lolE2 lolU2 6 2.601655171 lolC2 lolD2 5 3.018744648 lolE2 lolP1 4 3.545939693 lolC2 lolF2 3 4.758689037 lolC2 C2H2 2 6.133884376 lolC2 lolE2 1 8.423749241 lolC2 proC
Figure 2.12 Dendrogram of hierarchical clustering by Ward (non-standardized) method implemented in JMP. Gene expression correlation distances of tested genes from combined data from both WT N. uncinatum and N. uncinatum Pro-lolA2-GUS transformant (188b6N) in MM culture.
lolC2lolA2lolD2
lolE2
lolF2lolO2
lolP1
lolT2lolU2
C2H2
proCmetXtubB
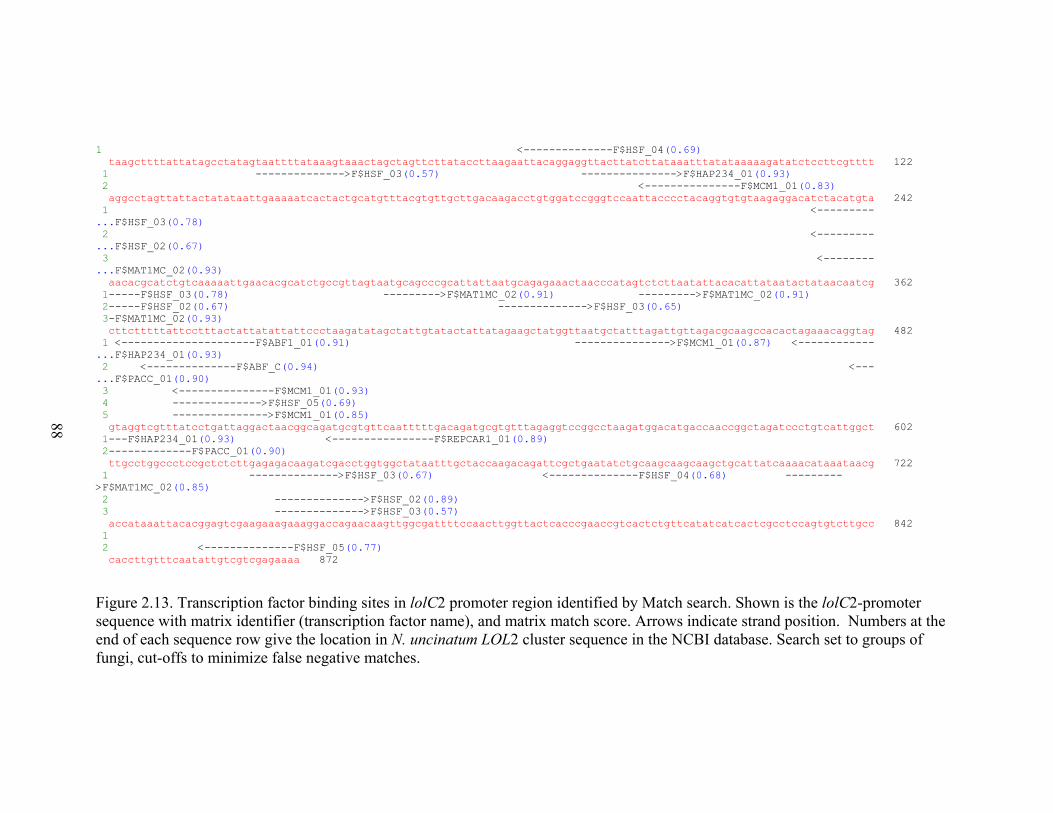
88
1 <--------------F$HSF_04(0.69) taagcttttattatagcctatagtaattttataaagtaaactagctagttcttataccttaagaattacaggaggttacttatcttataaatttatataaaaagatatctccttcgtttt 122 1 -------------->F$HSF_03(0.57) --------------->F$HAP234_01(0.93) 2 <---------------F$MCM1_01(0.83) aggcctagttattactatataattgaaaaatcactactgcatgtttacgtgttgcttgacaagacctgtggatccgggtccaattacccctacaggtgtgtaagaggacatctacatgta 242 1 <---------...F$HSF_03(0.78) 2 <---------...F$HSF_02(0.67) 3 <--------...F$MAT1MC_02(0.93) aacacgcatctgtcaaaaattgaacacgcatctgccgttagtaatgcagcccgcattattaatgcagagaaactaacccatagtctcttaatattacacattataatactataacaatcg 362 1-----F$HSF_03(0.78) --------->F$MAT1MC_02(0.91) --------->F$MAT1MC_02(0.91) 2-----F$HSF_02(0.67) -------------->F$HSF_03(0.65) 3-F$MAT1MC_02(0.93) cttctttttattcctttactattatattattccctaagatatagctattgtatactattatagaagctatggttaatgctatttagattgttagacgcaagccacactagaaacaggtag 482 1 <---------------------F$ABF1_01(0.91) --------------->F$MCM1_01(0.87) <------------...F$HAP234_01(0.93) 2 <--------------F$ABF_C(0.94) <---...F$PACC_01(0.90) 3 <---------------F$MCM1_01(0.93) 4 -------------->F$HSF_05(0.69) 5 --------------->F$MCM1_01(0.85) gtaggtcgtttatcctgattaggactaacggcagatgcgtgttcaatttttgacagatgcgtgtttagaggtccggcctaagatggacatgaccaaccggctagatccctgtcattggct 602 1---F$HAP234_01(0.93) <----------------F$REPCAR1_01(0.89) 2-------------F$PACC_01(0.90) ttgcctggccctccgctctcttgagagacaagatcgacctggtggctataatttgctaccaagacagattcgctgaatatctgcaagcaagcaagctgcattatcaaaacataaataacg 722 1 -------------->F$HSF_03(0.67) <--------------F$HSF_04(0.68) --------->F$MAT1MC_02(0.85) 2 -------------->F$HSF_02(0.89) 3 -------------->F$HSF_03(0.57) accataaattacacggagtcgaagaaagaaaggaccagaacaagttggcgattttccaacttggttactcacccgaaccgtcactctgttcatatcatcactcgcctccagtgtcttgcc 842 1 2 <--------------F$HSF_05(0.77) caccttgtttcaatattgtcgtcgagaaaa 872
Figure 2.13. Transcription factor binding sites in lolC2 promoter region identified by Match search. Shown is the lolC2-promoter sequence with matrix identifier (transcription factor name), and matrix match score. Arrows indicate strand position. Numbers at the end of each sequence row give the location in N. uncinatum LOL2 cluster sequence in the NCBI database. Search set to groups of fungi, cut-offs to minimize false negative matches.
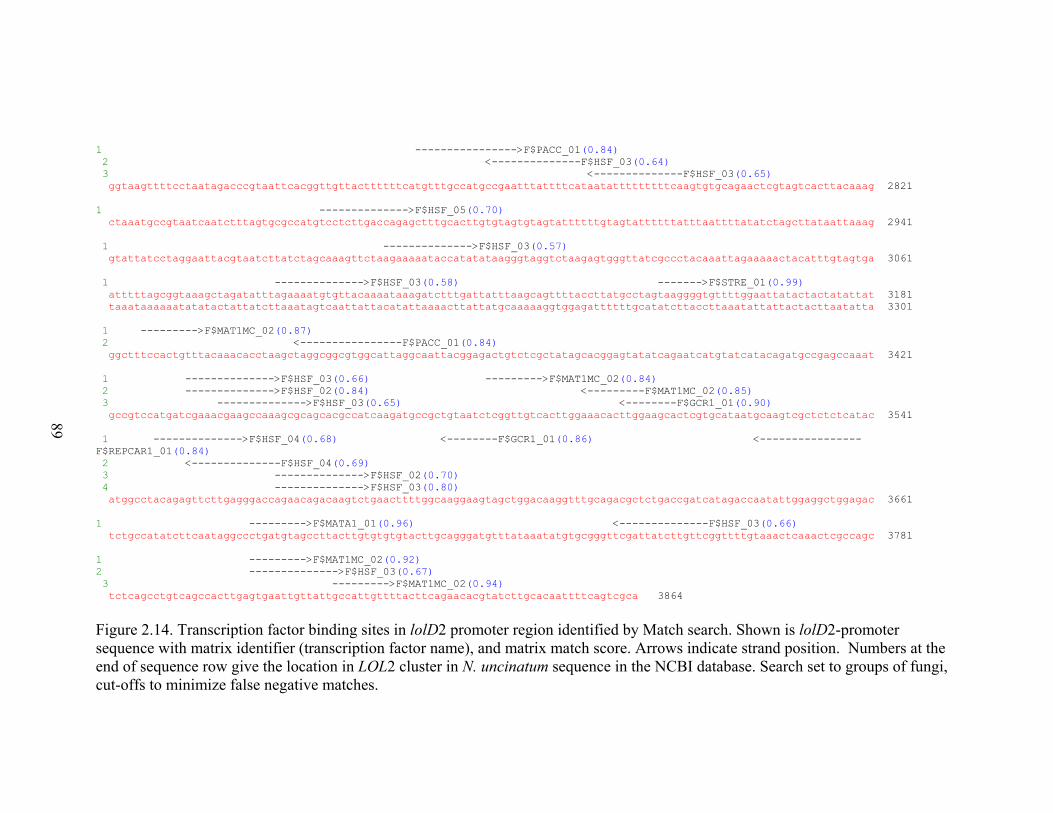
89
1 ---------------->F$PACC_01(0.84) 2 <--------------F$HSF_03(0.64) 3 <--------------F$HSF_03(0.65) ggtaagttttcctaatagacccgtaattcacggttgttacttttttcatgtttgccatgccgaatttattttcataatatttttttttcaagtgtgcagaactcgtagtcacttacaaag 2821 1 -------------->F$HSF_05(0.70) ctaaatgccgtaatcaatctttagtgcgccatgtcctcttgaccagagctttgcacttgtgtagtgtagtattttttgtagtattttttatttaattttatatctagcttataattaaag 2941 1 -------------->F$HSF_03(0.57) gtattatcctaggaattacgtaatcttatctagcaaagttctaagaaaaataccatatataagggtaggtctaagagtgggttatcgccctacaaattagaaaaactacatttgtagtga 3061 1 -------------->F$HSF_03(0.58) ------->F$STRE_01(0.99) atttttagcggtaaagctagatatttagaaaatgtgttacaaaataaagatctttgattatttaagcagttttaccttatgcctagtaaggggtgttttggaattatactactatattat 3181 taaataaaaaatatatactattatcttaaatagtcaattattacatattaaaacttattatgcaaaaaggtggagattttttgcatatcttaccttaaatattattactacttaatatta 3301 1 --------->F$MAT1MC_02(0.87) 2 <----------------F$PACC_01(0.84) ggctttccactgtttacaaacacctaagctaggcggcgtggcattaggcaattacggagactgtctcgctatagcacggagtatatcagaatcatgtatcatacagatgccgagccaaat 3421 1 -------------->F$HSF_03(0.66) --------->F$MAT1MC_02(0.84) 2 -------------->F$HSF_02(0.84) <---------F$MAT1MC_02(0.85) 3 -------------->F$HSF_03(0.65) <--------F$GCR1_01(0.90) gccgtccatgatcgaaacgaagccaaagcgcagcacgccatcaagatgccgctgtaatctcggttgtcacttggaaacacttggaagcactcgtgcataatgcaagtcgctctctcatac 3541 1 -------------->F$HSF_04(0.68) <--------F$GCR1_01(0.86) <----------------F$REPCAR1_01(0.84) 2 <--------------F$HSF_04(0.69) 3 -------------->F$HSF_02(0.70) 4 -------------->F$HSF_03(0.80) atggcctacagagttcttgagggaccagaacagacaagtctgaacttttggcaaggaagtagctggacaaggtttgcagacgctctgaccgatcatagaccaatattggaggctggagac 3661 1 --------->F$MATA1_01(0.96) <--------------F$HSF_03(0.66) tctgccatatcttcaataggccctgatgtagccttacttgtgtgtgtacttgcagggatgtttataaatatgtgcgggttcgattatcttgttcggttttgtaaactcaaactcgccagc 3781 1 --------->F$MAT1MC_02(0.92) 2 -------------->F$HSF_03(0.67) 3 --------->F$MAT1MC_02(0.94) tctcagcctgtcagccacttgagtgaattgttattgccattgttttacttcagaacacgtatcttgcacaattttcagtcgca 3864 Figure 2.14. Transcription factor binding sites in lolD2 promoter region identified by Match search. Shown is lolD2-promoter sequence with matrix identifier (transcription factor name), and matrix match score. Arrows indicate strand position. Numbers at the end of sequence row give the location in LOL2 cluster in N. uncinatum sequence in the NCBI database. Search set to groups of fungi, cut-offs to minimize false negative matches.
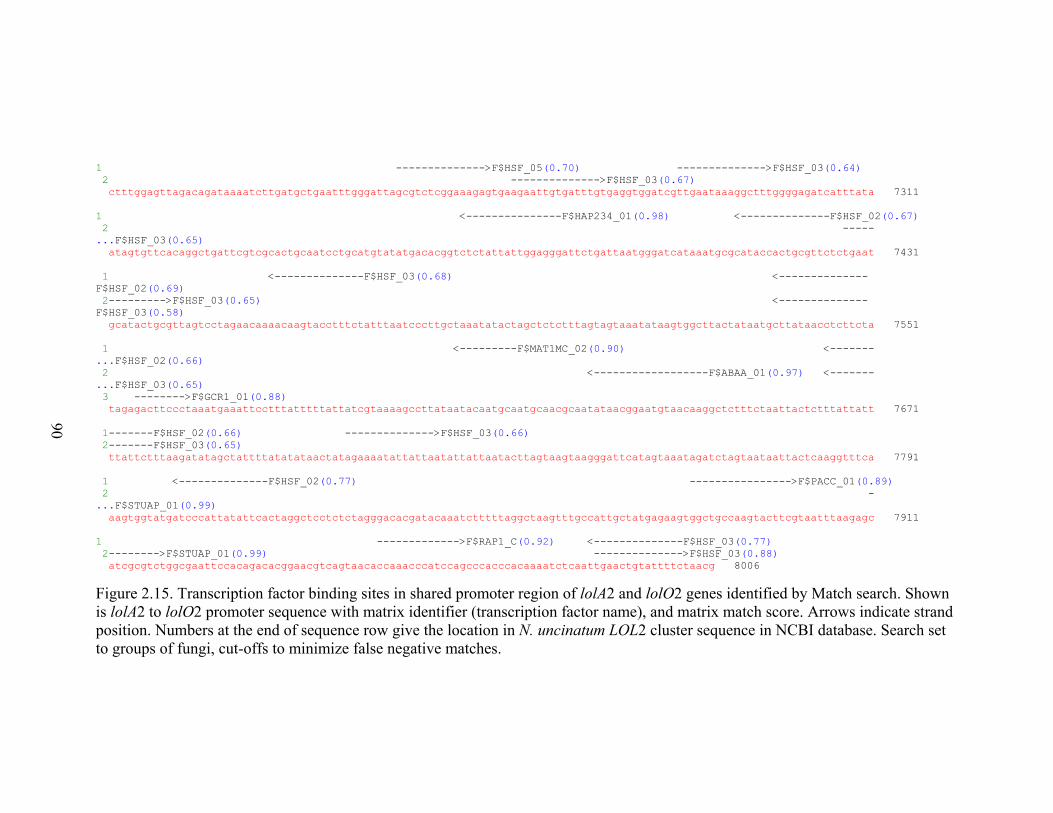
90
1 -------------->F$HSF_05(0.70) -------------->F$HSF_03(0.64) 2 -------------->F$HSF_03(0.67) ctttggagttagacagataaaatcttgatgctgaatttgggattagcgtctcggaaagagtgaagaattgtgatttgtgaggtggatcgttgaataaaggctttggggagatcatttata 7311 1 <---------------F$HAP234_01(0.98) <--------------F$HSF_02(0.67) 2 -----...F$HSF_03(0.65) atagtgttcacaggctgattcgtcgcactgcaatcctgcatgtatatgacacggtctctattattggagggattctgattaatgggatcataaatgcgcataccactgcgttctctgaat 7431 1 <--------------F$HSF_03(0.68) <--------------F$HSF_02(0.69) 2--------->F$HSF_03(0.65) <--------------F$HSF_03(0.58) gcatactgcgttagtcctagaacaaaacaagtacctttctatttaatcccttgctaaatatactagctctctttagtagtaaatataagtggcttactataatgcttataacctcttcta 7551 1 <---------F$MAT1MC_02(0.90) <-------...F$HSF_02(0.66) 2 <------------------F$ABAA_01(0.97) <-------...F$HSF_03(0.65) 3 -------->F$GCR1_01(0.88) tagagacttccctaaatgaaattcctttatttttattatcgtaaaagccttataatacaatgcaatgcaacgcaatataacggaatgtaacaaggctctttctaattactctttattatt 7671 1-------F$HSF_02(0.66) -------------->F$HSF_03(0.66) 2-------F$HSF_03(0.65) ttattctttaagatatagctattttatatataactatagaaaatattattaatattattaatacttagtaagtaagggattcatagtaaatagatctagtaataattactcaaggtttca 7791 1 <--------------F$HSF_02(0.77) ---------------->F$PACC_01(0.89) 2 -...F$STUAP_01(0.99) aagtggtatgatcccattatattcactaggctcctctctagggacacgatacaaatctttttaggctaagtttgccattgctatgagaagtggctgccaagtacttcgtaatttaagagc 7911 1 ------------->F$RAP1_C(0.92) <--------------F$HSF_03(0.77) 2-------->F$STUAP_01(0.99) -------------->F$HSF_03(0.88) atcgcgtctggcgaattccacagacacggaacgtcagtaacaccaaacccatccagcccacccacaaaatctcaattgaactgtattttctaacg 8006 Figure 2.15. Transcription factor binding sites in shared promoter region of lolA2 and lolO2 genes identified by Match search. Shown is lolA2 to lolO2 promoter sequence with matrix identifier (transcription factor name), and matrix match score. Arrows indicate strand position. Numbers at the end of sequence row give the location in N. uncinatum LOL2 cluster sequence in NCBI database. Search set to groups of fungi, cut-offs to minimize false negative matches.
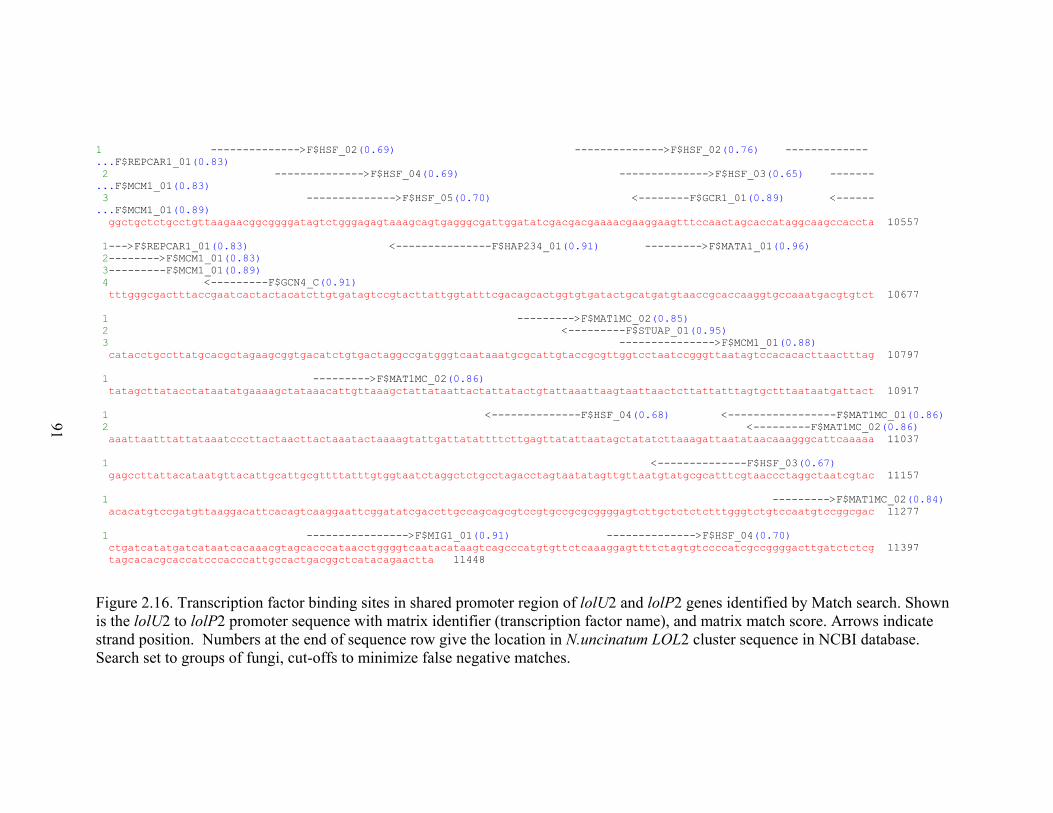
91
1 -------------->F$HSF_02(0.69) -------------->F$HSF_02(0.76) -------------...F$REPCAR1_01(0.83) 2 -------------->F$HSF_04(0.69) -------------->F$HSF_03(0.65) -------...F$MCM1_01(0.83) 3 -------------->F$HSF_05(0.70) <--------F$GCR1_01(0.89) <------...F$MCM1_01(0.89) ggctgctctgcctgttaagaacggcggggatagtctgggagagtaaagcagtgagggcgattggatatcgacgacgaaaacgaaggaagtttccaactagcaccataggcaagccaccta 10557 1--->F$REPCAR1_01(0.83) <---------------F$HAP234_01(0.91) --------->F$MATA1_01(0.96) 2-------->F$MCM1_01(0.83) 3---------F$MCM1_01(0.89) 4 <---------F$GCN4_C(0.91) tttgggcgactttaccgaatcactactacatcttgtgatagtccgtacttattggtatttcgacagcactggtgtgatactgcatgatgtaaccgcaccaaggtgccaaatgacgtgtct 10677 1 --------->F$MAT1MC_02(0.85) 2 <---------F$STUAP_01(0.95) 3 --------------->F$MCM1_01(0.88) catacctgccttatgcacgctagaagcggtgacatctgtgactaggccgatgggtcaataaatgcgcattgtaccgcgttggtcctaatccgggttaatagtccacacacttaactttag 10797 1 --------->F$MAT1MC_02(0.86) tatagcttatacctataatatgaaaagctataaacattgttaaagctattataattactattatactgtattaaattaagtaattaactcttattatttagtgctttaataatgattact 10917 1 <--------------F$HSF_04(0.68) <-----------------F$MAT1MC_01(0.86) 2 <---------F$MAT1MC_02(0.86) aaattaatttattataaatcccttactaacttactaaatactaaaagtattgattatattttcttgagttatattaatagctatatcttaaagattaatataacaaagggcattcaaaaa 11037 1 <--------------F$HSF_03(0.67) gagccttattacataatgttacattgcattgcgttttatttgtggtaatctaggctctgcctagacctagtaatatagttgttaatgtatgcgcatttcgtaaccctaggctaatcgtac 11157 1 --------->F$MAT1MC_02(0.84) acacatgtccgatgttaaggacattcacagtcaaggaattcggatatcgaccttgccagcagcgtccgtgccgcgcggggagtcttgctctctctttgggtctgtccaatgtccggcgac 11277 1 ---------------->F$MIG1_01(0.91) -------------->F$HSF_04(0.70) ctgatcatatgatcataatcacaaacgtagcacccataacctggggtcaatacataagtcagcccatgtgttctcaaaggagttttctagtgtccccatcgccggggacttgatctctcg 11397 tagcacacgcaccatcccacccattgccactgacggctcatacagaactta 11448
Figure 2.16. Transcription factor binding sites in shared promoter region of lolU2 and lolP2 genes identified by Match search. Shown is the lolU2 to lolP2 promoter sequence with matrix identifier (transcription factor name), and matrix match score. Arrows indicate strand position. Numbers at the end of sequence row give the location in N.uncinatum LOL2 cluster sequence in NCBI database. Search set to groups of fungi, cut-offs to minimize false negative matches.
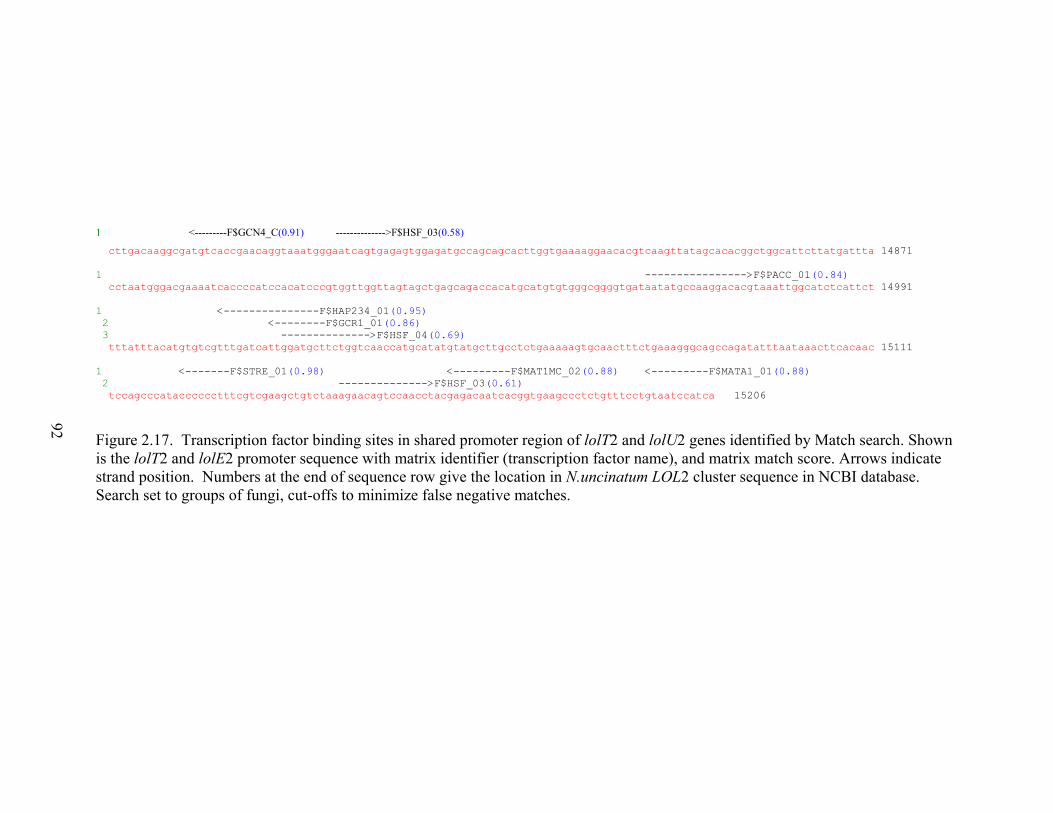
92
1 <---------F$GCN4_C(0.91) -------------->F$HSF_03(0.58)
cttgacaaggcgatgtcaccgaacaggtaaatgggaatcagtgagagtggagatgccagcagcacttggtgaaaaggaacacgtcaagttatagcacacggctggcattcttatgattta 14871 1 ---------------->F$PACC_01(0.84) cctaatgggacgaaaatcaccccatccacatcccgtggttggttagtagctgagcagaccacatgcatgtgtgggcggggtgataatatgccaaggacacgtaaattggcatctcattct 14991 1 <---------------F$HAP234_01(0.95) 2 <--------F$GCR1_01(0.86) 3 -------------->F$HSF_04(0.69) tttatttacatgtgtcgtttgatcattggatgcttctggtcaaccatgcatatgtatgcttgcctctgaaaaagtgcaactttctgaaagggcagccagatatttaataaacttcacaac 15111 1 <-------F$STRE_01(0.98) <---------F$MAT1MC_02(0.88) <---------F$MATA1_01(0.88) 2 -------------->F$HSF_03(0.61) tccagcccatacccccctttcgtcgaagctgtctaaagaacagtccaacctacgagacaatcacggtgaagccctctgtttcctgtaatccatca 15206 Figure 2.17. Transcription factor binding sites in shared promoter region of lolT2 and lolU2 genes identified by Match search. Shown is the lolT2 and lolE2 promoter sequence with matrix identifier (transcription factor name), and matrix match score. Arrows indicate strand position. Numbers at the end of sequence row give the location in N.uncinatum LOL2 cluster sequence in NCBI database. Search set to groups of fungi, cut-offs to minimize false negative matches.
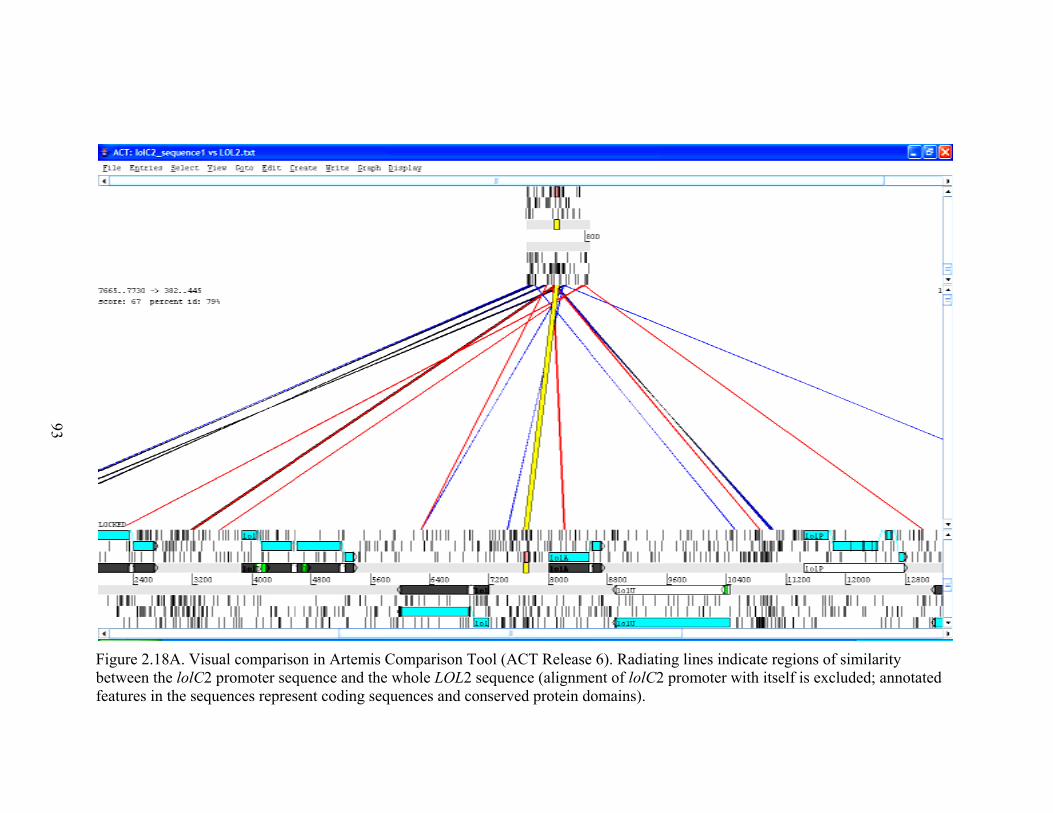
93
Fbf
Figure 2.18A. Vbetween the lolCfeatures in the s
Visual comparisoC2 promoter seqequences repres
on in Artemis Cquence and the wsent coding sequ
Comparison Toowhole LOL2 sequences and cons
l (ACT Releasequence (alignmeserved protein d
e 6). Radiating lient of lolC2 pro
domains).
ines indicate regomoter with itsel
gions of similarilf is excluded; a
ity
annotated
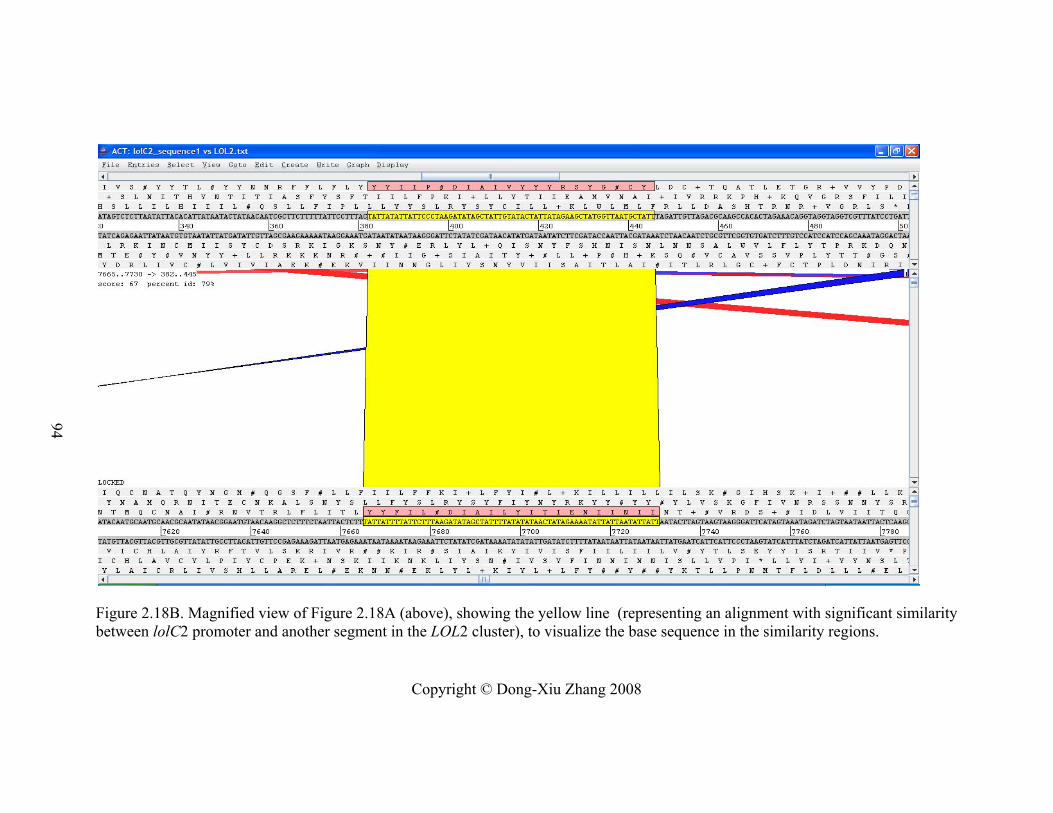
94
Figure 2.18B. Magnified view of Figure 2.18A (above), showing the yellow line (representing an alignment with significant similarity between lolC2 promoter and another segment in the LOL2 cluster), to visualize the base sequence in the similarity regions.
Copyright © Dong-Xiu Zhang 2008
95
CHAPTER 3
GUS Reporter Gene Expression Driven by LOL Gene Promoters
in Neotyphodium Species
INTRODUCTION
Fungal species of genera Epichloë (sexual) and Neotyphodium (asexual) in
Ascomycota are well-known mutualistic endophytes growing in the intercellular space of
the cool-season grasses (subfamily Pooideae) in the family Poaceae (Schardl et al 2007).
These endophytes often produce bioprotective loline alkaloids (LA), which provide
natural feeding deterrence and are toxic to various herbivorous insects, but have little or
no toxicity to mammalian livestock (Blankenship et al 2001; Schardl et al 2007).
Investigation of LA production in symbiota identified several LA producers, for example,
Neotyphodium uncinatum in Lolium pratense (meadow fescue), Neotyphodium
coenophialum in Lolium arundinaceum (tall fescue), Neotyphodium siegelii in L.
pratense (Schardl et al 2007), and Epichloë festucae in Lolium giganteum (Spiering et al
2002).
The genes encoding the proteins responsible for LA production are clustered in
the genomes of the endophytes which produce them (Kutil et al 2007; Spiering et al
2005b), and they are believed or confirmed to play important roles in LA biosynthesis
based on observational evidence from three aspects (Schardl et al 2007): prediction of the
putative enzyme function encoded by the LA genes by bioinformatic tools (Spiering et al
2005b), feeding putative LA precursors or intermediates to fungal culture (Faulkner et al
2006), and knockout or knockdown of expression of selected LA genes (Spiering et al
2005b); Spiering, Faulkner, Schardl, unpublished data).
Each LOL cluster contains nine genes: lolF, lolC, lolD, lolO, lolA, lolU, lolP,
lolT, and lolE. There are two homologous clusters found in Neotyphodium uncinatum,
LOL1 and LOL2, in which all the genes are arranged in the same order and orientation in
the genome. However, the relative genomic position of lolF2 has not been determined
yet, because of AT-rich regions that have caused sequencing difficulties in both lolC2
96
and lolF2 upstream regions (Spiering et al 2005b). A single LOL gene cluster exists in N.
coenophialum, and its sequence is highly similar to N. uncinatum LOL2 and
Neotyphodium sp. PauTG-1 (Kutil et al 2007; Spiering et al 2005b). Additional LA-
producing endophytes also contain one LOL cluster (Kutil et al 2007).
All LOL genes are expressed in LA-producing N. uncinatum minimal medium
(MM) culture, and in N. uncinatum-meadow fescue, and N. coenophialum-tall fescue
symbiota, whereas only lolF and lolU expression was detected in N. coenophialum MM
culture with no LA production (Spiering et al 2005b). This suggests that the expression of
most of the LOL genes is coregulated and inducible by culture conditions and in planta.
The RT-qPCR results in Chapter 2 confirmed that transcription of almost all LOL genes
is highly coregulated in N. uncinatum MM culture. However, similar to previous
observations (Spiering et al 2005b), expression of the lolF and lolU genes was somewhat
different from expression of the other LOL genes when analyzed by clustering tree
algorithms (Figure 2.11). All of the LOL genes gave a similar expression pattern in a time
course and in keeping with the observed kinetics of LA production (Chapter 2).
Several pairs of LOL genes (lolC1 with lolF1, lolO with lolA, lolU with lolP, and
lolT with lolE) share common upstream regions from which they are divergently
transcribed. Four conserved regulatory motifs were found in all putative promoter regions
from five LOL clusters in different species (Kutil et al 2007; Spiering et al 2005b). A
search of the TRANSFAC database revealed that these motifs show high similarity to
known fungal transcription factor binding sites. In addition, global transcription factors
have recently been identified in other filamentous fungi, such as a putative histone
methyltransferase encoded by the global secondary metabolite regulator gene, laeA (Bok
& Keller 2004), which may also indicate a reasonable mechanism for regulation of LOL
gene expression. A deeper insight into the activities of a couple of LOL gene promoters
would be very valuable to find crucial cis-elements and give clues to transcriptional
regulation mechanisms.
lolA and lolC do not share any promoter regions since there are two other genes,
lolD and lolO, between them (Spiering et al 2005b). However, both lolA and lolC showed
high expression (indicated by PCR-based subtractive hybridization of cDNAs) in LA-
producing cultures of N. uncinatum (Spiering et al 2002). RT-qPCR using RNA from
97
mycelia of N. uncinatum from MM culture confirmed that lolA2 and lolC2 expression is
highly correlated (R > 0.98, p < 0.0001) (Chapter 2). lolC is believed to be an essential
LOL gene, encoding a γ-type pyridoxal phosphate (PLP) enzyme that has been proposed
to catalyze the first step of the LA biosynthetic pathway. lolA is predicted to be an amino-
acid binding protein or enzyme, but its role in the LA-biosynthetic pathway is still
unknown (Schardl et al 2007; Spiering et al 2005b; Spiering et al 2002).
The GUS (= uidA gene from Escherichia coli, encoding the enzyme, β-
glucuronidase = GUS) reporter gene system (Jefferson 1987; Roberts et al 1989) has been
commonly used in fungi to visualize biological and cellular processes or to analyze
promoter activity (Hisada et al 2006; Snoeijers et al 2003). In a recent study, GUS was
used as a novel tool to monitor the activation of a high-osmolarity glycerol response
(HOG) pathway in Aspergillus nidulans (Furukawa et al 2007). The GUS reporter system
has already been applied to endophyte species Neotyphodium lolii in perennial ryegrass
(Lolium perenne) for examining hyphal metabolic activity and its relationship with
hyphal growth (Tan et al 1997; Tan et al 2001) and hyphal distribution in grass tissues
(Spiering et al 2005a). Use of GUS was also attempted to determine the 3-hydroxy-3-
methylglutaryl-CoA reductase (HMG CoA reductase) gene expression pattern in N. lolii.
when transformed with the promoter of HMG CoA reductace fused to GUS (Zhang et al
2006).
In the study described in this chapter, the lolC2 and lolA2 upstream sequences
were fused to the GUS reporter gene to measure their activities as promoters, to test the
hypothesis that the upstream regions determine the expression pattern of these LOL genes
in different media and species. Pro-lolA2-GUS, Pro-lolC2-GUS and Pro-tubB-GUS (as a
control) were transformed into N. uncinatum, N. coenophialum, and N. lolii x E. typhina
Lp1, and activity of the GUS enzyme and expression of the GUS gene were measured by
qualitative assays, protein quantitation, and RT-qPCR in culture; the transformants were
also inoculated into grass plants to check GUS expression from the different promoters in
planta. The results showed very low Pro-lolA2-GUS or Pro-lolC2-GUS activity under
cultural conditions; and the GUS mRNA curve in N. uncinatum MM culture along a time
course was not similar to that of native gene lolA2 or lolC2 mRNA. This result suggested
the promoter regions fused to GUS were not sufficient to determine gene expression;

98
location of gene within LOL cluster might be required for appropriate regulation of gene
expression.
99
MATERIALS AND METHODS
Construction of Pro-lolC2-GUS, Pro-lolA2-GUS, Pro-tubB-GUS vectors
Insert fragment preparation
Primer pairs were designed specifically for Pro-lolC2 or Pro-lolA2 containing
nucleotide polymorphisms based on comparison with Pro-lolC1 or Pro-lolA1 sequences.
To amplify Pro-lolC2 with primer pair SacIprololC2(d)A and prololC2(GUS)(u)2 and
Pro-lolA2 with primer pair SacIprololA(d)A and prololA(GUS)(u), 5 ng N. uncinatum
167 genomic DNA was used in 50-μl PCR reactions containing 0.4 μM of each primer, 5
units AmpliTaq Gold (Applied Biosystems, Foster City, CA, USA), AmpliTaq Gold PCR
buffer with MgCl2 (1.5 mM final conc.) (Applied Biosystems), 400 µM each of dATP,
dCTP, dGTP, and dTTP, with the following thermal cycling conditions: 94°C 9 min, 35
cycles of 94°C 1 min, 58 °C 30 sec, and 72°C 1 min. The PCR reaction conditions will
apply to all PCR in this chapter unless otherwise indicated. The Pro-lolC2 product
contained 816 bp before the ATG start codon of the lolC2 ORF including the 5’-
untranslated regions of the mRNA. Pro-lolA2 (821 bp upstream of lolA2 start codon
ATG) consisted of the entire putative promoter region shared by divergently transcribed
lolA2 and lolO2. The upstream primers contained approx. 15 bp GUS gene 5’
complementary sequence for later overlapping PCR to fuse each promoter to the GUS
gene. All primers used in this chapter are listed in Table 3.1.
GUS DNA was obtained by PCR (94°C 9 min, 35 cycles of 94°C 30 sec, 58 °C 30
sec, and 72°C 2 min) from the β-glucuronidase expression vector pNOM102 (Genbank
accession Z32701) (Roberts et al 1989), using primers GUS(d) and XhoIGUS(u)2. The
PCR products of Pro-lolC2 (or Pro-lolA2) and GUS (5 μl each) were then used in
overlapping PCR by 2BD advantage 2 PCR kit (Clontech BD Biosciences, USA) with
primer pairs SacIprololC2(d)A and XhoIGUS(u)2 for Pro-lolC2-GUS (or
SacIprololA(d)A and XhoIGUS(u)2 for Pro-lolA2-GUS) in a 25-μl reaction with a
thermal cycling program of 95 °C for 1 min, and 45 cycles of 95 °C for 30 sec and 70 °C
for 4 min.
The tubB promoter (Pro-tubB), as a putative constitutive promoter, was used to
construct a positive control for GUS expression. Pro-tubB was amplified from plasmid
100
pKAES183 (see Chapter 5) with primer pair SacIprotubB(pGL3)(d) and
protubBSacII(GUS)(u). Between Pro-tubB and the GUS gene, there was a SacII site built
in for future potential promoter replacement. As for Pro-lolC2 and Pro-lolA2, the Pro-
tubB upstream primer protubBSacII(GUS)(u) also contained an overlapping sequence
with the GUS gene. The GUS gene was amplified from pNOM102 with primer pair
SacIIGUS(protubB)(d) and XhoIGUS(u)2 using the same PCR program and conditions as
for Pro-tubB amplification. The overlap PCR procedure to generate the Pro-tubB-GUS
fusion was performed as described above for Pro-lolC2-GUS and Pro-lolA2-GUS, but
with primer pair SacIprotub2(pGL3)(d) and XhoIGUS(u)2.
The overlapped PCR products were purified with the QIAquick PCR purification
kit (QIAGEN, Valencia, CA) and digested with SacI and XhoI (sites built into the primers
for the promoter upstream and GUS downstream ends, respectively). The digested
products were gel purified by QIAquick gel purification kit and then quantified (Hoefer
DyNA Quant 200 Fluorometer, San Francisco, CA, USA).
Vector pCB1004 preparation
The plasmid vector pCB1004 (Carroll et al 1994) contains the fungal selectable
marker hygromycin B phosphotransferase gene (hph) under control of the constitutive
promoter of the trpC gene from Aspergillus nidulans. pCB1004 was transformed into
Escherichia coli strain XL1-Blue competent cells (Stratagene, La Jolla, CA, USA) by
electroporation (17 kV/cm, 200 Ω, 25 μF) and incubated in SOC media 1 hr at 37 °C, and
then spread on LB agar (1 g Bacto-tryptone, 0.5 g Bacto-yeast extract, 1 g NaCl, 1.5 g
Bacto agar in 100 ml water) with 30 μg/ml chloramphenicol, and grown overnight. Single
bacterial colonies were picked and grown with shaking (200 rpm) in LB broth with 30
μg/ml chloramphenicol for approx. 16 hr at 37 °C. Plasmid DNA was extracted by
Qiaprep Spin Miniprep Kit (Qiagen, Valencia, California), according to the
manufacturer’s protocol, and then digested with SacI and XhoI. The digested product was
gel purified with the QIAquick gel purification kit (Qiagen) and quantified by
fluorometry.
DNA cloning
After SacI and XhoI digestion and gel purification, each of Pro-lolC2-GUS, Pro-
lolA2-GUS, and Pro-tubB-GUS was ligated into pCB1004 vector digested with the same
101
enzymes at an insert:vector molar ratio of 2:1, with the Fast-Link ligation kit (Epicentre,
Madison, WI, USA) in 10-μl reactions following kit instructions. Then 1 μl of the ligation
product was used in electroporation of 50 μl XL1-Blue competent cells. Bacterial
culturing and plasmid DNA extraction was the same as described above for pCB1004.
Screening and sequencing constructs
The plasmids with larger than 2 kb difference when compared with the pCB1004
vector on agarose gels were selected for further screening by SacI and XhoI digestion.
When the insert fragment approx. 2.7 kb of Pro-lolC2-GUS (or Pro-lolA2-GUS), or
approx. 2.2 kb of the Pro-tubB-GUS was distinguished on gel, the plasmid was
sequenced. Common primers used in sequencing for all three constructs are:
seqGUS(u)prololC, seqGUS(d1), seqGUS(d2), seqGUS(d3), seqGUS(d4),
seqGUS(d5)pCB1004, XhoIGUS(u)2. Extra specific sequencing primers were used for
three different constructs respectively as seqprololC-pCB1004(u); seqprololA-
pCB1004(u); SacIprotubB(pGL3)(d), and (SacII)GUS(protubB)(d).
Sequencing reactions were set up with the BigDye Version 3 Terminator cycle
sequence kit (Applied Biosystems, Foster City, CA) in a 7 μl reaction containing 10 ng
plasmid DNA using the following thermal cycling conditions: 94 °C for 5 min, 60 cycles
of 95 °C for 15 s, 50 °C for 10 s, and 60 °C for 4 min. Products were ethanol precipitated
and submitted to the Advanced Genetic Technology Center (AGTC) at the University of
Kentucky for sequencing.
The constructs were named pKAES187 for Pro-lolC2-GUS, pKAES188 for Pro-
lolA2-GUS, and pKAES189 for Pro-tubB-GUS. Plasmid maps were established in
Invitrogen Vector NTI in which the sequences were stored (Figures 3.1-3.3).
Transformation of N. uncinatum, N. coenophialum, and Lp1
For fungal transformation, mycelia from N. uncinatum e167, N. coenophialum
e19, and Lp1 were prepared from 5-12 day cultures in 50 ml PDB medium (shaking at
200 rpm at 22 °C). The mycelia were used to make protoplasts by the procedure of
(Murray et al 1992) with modifications. Fungal mycelium of each species was pelleted by
centrifugation (20 min, 5 °C, 5530 RCF), and the pellet was resuspended in 10 ml filter-
sterilized osmotic medium (1.2 M MgSO4, 50 mM sodium citrate, pH 5.8) containing 80
102
mg β-D-glucanase (InterSpex Products, San Meteo, CA), 80 mg Driselase (InterSpex), 12
mg Zymicase I (InterSpex), 60 mg Glucanax (Novo Industri AS, Bagsvaerd, Denmark),
and 40 mg bovine serum albumin (Sigma, St Louis, MO). The suspension was incubated
for 3-4 hr at 30 °C with shaking at 60 rpm. The protoplasts obtained were isolated by
centrifugation, washed, and transformed by electroporation with linearized plasmids (3-5
µg) as previously described (Tsai et al 1992). Plasmids pKAES187, pKAES188, and
pKES189 were linearized by SacI digestion for N. coenophialum and Lp1 transformation,
and were digested by SapI for N. uncinatum transformation. (The SacI site is the
upstream cloning site used for the insertion, and SapI site is further away from the
insertion site in the vectors.) Electroporated protoplasts were suspended in 4 ml
regeneration medium (Panaccione et al 2001) containing 0.7% low melting temperature
agarose (Seakem LE, FMC Bioproduct, Rockland, ME) without antibiotic, then spread
on two-layered plates comprising the following: a bottom layer of 20 ml PDA including
hygromycin B at the target concentration of 80, 54, or 300 µg/ml depending on the
fungus (see below), and a 6 ml middle layer of regeneration medium with hygromicin B
at 1.67-times the target concentration. The target hygromycin B concentration in the
whole plate for transformant selection was: 80 µg/ml for N. uncinatum, 54 µg/ml for N.
coenophialum, and 300 µg/ml for Lp1.
After approx. 3 week-growth at 21 °C, fungal colonies were subcultured and
single-spore isolated three times on PDA plates containing hygromycin B at the target
concentration given above. A small part of each colony was used for DNA extraction
with QIAGEN DNeasy 96 Plant kit by following the manufacture’s instructions.
Screening transformants and checking copy number
PCR with primer pair seqGUS(d3) and XhoIGUS(u)2 was used to detect a portion
of the GUS gene in transformants of all three species by the production of an 840 bp
fragment. PCR conditions were as follows: 94 °C for 9 min, 35 cycles of 94 °C for 1 min,
56 °C for 30 s, and 72 °C for 1 min 20 sec. PCR for the entire insert fragment was also
performed for some transformants containing pKAES187 and pKAES189 of
N.uncinatum with the primer pairs used in the overlapping PCR during cloning. The PCR
test for the entire insert was performed with PCR cycling of 95 °C for 9 min, 35 cycles of
103
95 °C for 30s, 56 °C for 30s, and 72 °C for 4 min. The expected fragment size for
pKAES187 insert would be 2693 bp, and for pKAES189 be 2219 bp (Figure 3.4).
Southern blot was carried out to confirm genomic integration and determine the copy
number for some transformants of N. uncinatum, for later selection for RT-qPCR assays.
Southern blot test for GUS gene with tefA gene as a control
DNA blot membrane and probe preparation
Genomic DNA of putative N. uncinatum GUS transformants was extracted by the
method of (Al-Samarrai & Schmid 2000) with modifications: 300 mg fresh mycelium
collected from a cellophane surface on PDA plates was ground in liquid nitrogen with
mortar and pestle. After transfer to 2-ml microcentrifuge tubes and addition of 1 ml lysis
buffer and 2 μl of 10 mg/ml RNase A, followed by vigorous pipetting, the mycelial
suspension was incubated at 65 °C in a waterbath for 30-45 min. Then, 330 μl 5 M NaCl
was added and the suspension was centrifuged 10 min at > 13,000 x g. The supernatant
was removed, and DNA precipitated with 2 vol 100% ethanol, and taken up in TE (10
mM Tris-HCl, 1 mM EDTA, pH 7.5). The extracted DNA was analyzed by
electrophoresis in 0.8 % agarose gel to check its quality, and was quantitated by using
Qubit fluorometer (Invitrogen, Molecular Probes) per manufacturer’s instructions.
Approx. 500 ng of genomic DNA was digested with XbaI (for which the GUS gene lacks
a cutting site) and 200 ng DNA from the reaction was analyzed by electrophoresis in 0.8
% agarose gel to check for completion of digestion, then the remaining 300 ng digested
DNA was electrophoresed in 0.8 % agarose gel and transferred from the gel to Hybond
N+-nylon membranes (GE Healthcare, Chalfont St. Giles, United Kingdom) according to
the manufacturer’s instructions.
To prepare probes for the blot, a fragment of the GUS gene was amplified from
pKAES187 with primer pair seqGUS(d2) and XhoIGUS(u)2 (95 °C 9 min, 35 cycles of
95 °C 30 s, 58 °C 30 s, and 72 °C for 2 min), which gives a 1370 bp product. The tefA
fragment was amplified from N. uncinatum genomic DNA (40 ng) with primers Tef1-
exon-1d and Tef1-exon-6u (Moon et al 2002) using PCR conditions of 95 °C for 9 min,
35 cycles of 95 °C for 30 s, 56 °C for 30 s, and 72 °C for 1 min. The PCR products were
gel purified by QiaQuick Gel Extraction kit (Qiagen). Probe-labelling mix was prepared
from the following A, B, C solutions at a ratio of A:B:C = 370 : 925 : 555 and stored at –
104
20 °C . Solution A was the mixture of 1 ml 0.13 M MgCl2 in 1.25 M Tris-HCl (pH 8.0,
autoclaved), 18 μl 2-mercaptoethanol, 5 μl each of dATP, dGTP, and dTTP stock
solutions (100 mM each), and 135 μl sterile water. Solution B contained 2.0 M HEPES
(pH adjusted to 6.6 with NaOH). Solution C was the hexanucleotide mixture (50 A260
units dissolved in 555 μl TE). Five μl probe DNA was added to 31 μl H2O, boiled for 15
min and chilled on ice immediately. Then, 12 μl probe-labelling mix (described above)
and 1 μl of Klenow DNA polymerase (Epicentre Biotech, Madison, WI, USA) was added
and mixed by pipetting; 2 μl (20 μCi) of [α-32P]dCTP was added, and the mixture was
incubated 1 h at 37 °C. The probe was denatured by 50 μl dye stop solution (10 mM
EDTA pH 8, 1% bromophenol blue, and 0.02% orange G), 10 μl NaOH (2N), and 11 μl
TE (pH 8.0) and purified by spinning through a MicrospinTM Illustra G-50 column (GE
healthcare) for 15 sec.
Hybridization and membrane wash
The Southern blot membrane was wetted with 5-20 ml of pre-heated (65 °C)
hybridization solution (0.124 M Na2HPO4, pH 7.2, 7% SDS and 0.5 M sodium EDTA,
pH 8) and incubated in 5 ml hybridization solution for 1.5 hr at 65 °C in a hybridization
oven in a rotating glass cylinder. The radiolabeled probe was added to the solution and
the cyclinder was kept rotating overnight at 65 °C. The membrane was washed twice with
50 ml 2 x SSC solution and one time with 0.5% SDS solution, each for 20 min and
rotating at 65 °C. The membrane was then covered with transparent plastic wrapper and
exposed to a phosphorimaging screen for two days. Scanning was done using a Typhoon
9400 Variable Mode Imager (GE Healthcare). Three weeks after GUS hybridization, the
same membrane was used for tefA hybridization. Band densities were analyzed and
integration copy numbers were determined from the band density ratio between GUS and
tefA hybridization of the same membrane.
GUS activity qualitative assay
Transformants of N. uncinatum, N. coenophialum, and Lp1 were cultured on 20
ml MM agar (2% agarose in MM media) or PDA plates each with 20 μg/ml of the GUS
substrate X-Gluc. Blue color of the colony indicated GUS enzymatic activity. The color
of the colony was recorded after one-month growth. Transformants were also cultured in
105
PDB and MM liquid media, and small mycelial balls were transferred daily to microtiter
plate wells containing 90 μl sodium phosphate buffer (pH 7.0) and 10 μl X-Gluc
(400μg/ml stock in phosphate buffer). The microtiter plate was incubated at 37 °C
overnight, and blue color colonies compared with the color of untransformed fungal
colonies were scored as GUS positive. Dilutions of pure β-glucuronidase (Sigma, USA)
from 10–5 to 10–7 were used as a positive control.
GUS activity and mRNA quantitative assays for N. uncinatum transformants
N. uncinatum transformants preparation
The N. uncinatum transformants chosen for GUS quantitative assay (protein or
RNA extraction) were grown in MM at RT while shaking at 100 rpm during the testing
period. Mycelium from MM culture was harvested daily, and centrifuge at 5530 RCF for
20 min at 4 °C, and immediately frozen in liquid nitrogen and stored at –80 °C. The
supernatant (1 ml) was used for later LA quantitation by gas chromatography (GC) as
described in Chapter 2. In the first two days, two plates were mixed to obtain sufficient
amounts of mycelium unless otherwise specified. In the duplicate 187b day 1-11
experiment, 6 plates were mixed on the 1st day, 4 plates on the second day, 3 plates on the
3rd day, and 2 plates on 4th day, then one plate was used for sampling on each subsequent
day. The 188b6N (Pro-lolA2-GUS transformed in N. uncinatum) culture for RT-qPCR
was set up in triplicate.
GUS protein activity quantitative assay
Protein extraction for the GUS quantitative activity assay was carried out using 4-
methylumbelliferyl β–D-glucuronide (MUG) as the GUS substrate, and protein extraction
from fungal mycelium was performed as described by (Papadopoulou et al 2005). The
protein concentration of each extract was quantified with the Quant-iTTM Protein Assay
kit (Invitrogen, Molecular Probes, USA) and measurements carried out in a Spectra Max
Gemini XS microplate spectrofluorometer systems reader (Molecular Devices Corp.,
Downingtown, PA, USA) at excitation/emission maxima 470/570 nm. Protein standards
supplied by the Quant-iT kit ranging between 0-500 ng per reaction were used to create a
standard curve (R2 = 0.9824) of protein concentration versus fluorescence readings. The
Bradford method (Bradford 1976) for protein measurements was also performed for the
106
same extracts, but readings were less reproducible compared to the Quant-it method.
According to the protein concentrations determined with the Quant-it method, each
protein extract was diluted to 400 ng/μl with sodium phosphate buffer (pH 7.0) before
GUS measurements.
Each reaction for GUS assay contained 10 μl of 7 mM MUG in sodium phosphate
buffer (pH 7.0) and 40 μl extract (containing 16 μg total protein). Duplicate
measurements were made for each time point and terminated with 150 μl 0.2 M Na2CO3
stop buffer. GUS activity was measured on a Spectra Max Gemini XS at 455 nm
(excitation 365 nm) for two time points, 0 time point and overnight incubation at 37 °C.
The 0 time point reading was set as the baseline reading and subtracted from the
overnight reading. Each time point was read in duplicate or triplicate for each plate. A
MU (4-methylumbelliferone) standard curve (R2 = 0.999) was created with fluorescence
readings versus MU serial dilutions at 0, 7.5, 10, 15, 17.5, 20, at 22.5 nM. GUS activity
was then calculated as nM of product MU generated from per μg of protein in each
overnight (approx. 16 hours) reaction.
RT-qPCR of GUS, lolC2, and lolA2 gene expression assay
All information related to 188b6N transformant is given in Chapter 2 for
comparison with wild type N. uncinatum. For the other transformants, mycelia were
harvested as described above for RNA extraction, and RNA extracted with the RNeasy
Plant Minikit (Qiagen, Valencia, CA, USA) and DNase treated as described in Chapter 2.
LA extraction and measurement, the RT-qPCR program, primer and probe sets, and
relative comparative method were as described in Chapter 2.
Inoculation of transformants to grasses
Several transformants of each endophyte species were inoculated into grass
seedlings as described by (Latch & Christensen 1985), whereby N. coenophialum e19
transformants were inoculated into tall fescue (L. arundinaceum; cultivar Kentucky 31),
N. uncinatum transformants into meadow fescue (L pratense, cultivar Predix), and Lp1
transformants into perennial ryegrass (L. perenne; cultivar Rosalin). Tissue-print-
immunoblot (Gwinn & Gavin 1992) was carried out to test for endophyte infection at the
3-5 tiller stage as described by (An et al 1993). Endophyte mycelia were isolated from the
107
pseudostem of the infected plants as previously described (Blankenship et al 2001). DNA
was extracted from the fungal colonies as described above and PCR with primer pair
seqGUS(d3) and XhoIGUS(u) was performed to check for presence of the GUS gene.
Microscopic Imagene Green fluorescence assay of GUS transformants in planta
After confirmation of transformant infection, GUS expression in tall fescue and
perennial ryegrass was examined with Imagene GreenTM C12FDGlcU GUS expression kit
(Molecular Probes, Eugene, OR, USA) by following manufacture’s instructions. Imagene
Green C12FDGlcU was used as GUS substrate, giving the fluorescein derivative, 5-(N-
dodecanoyl)aminofluorescein (Abs/Em at 495/518 nm), as a fluorescent product
indicating GUS reporter activity. The leaf blade or the internal thin layer of a pseudostem
basal part was peeled off by a scalpel, and incubated overnight at RT in a reaction
containing fresh 50 μM C12FDGlcU substrate in GUS extraction buffer without 2-
mercaptoethanol (50 mM NaHPO4 at pH 7.0, 10 mM EDTA, 0.1% sodium
laurylsarcosine, and 0.1% Triton X-100). The reaction was inhibited with 200 μM D-
glucaric acid 1,4-lactone (provided in the kit). The plant tissue was then mounted on a
glass slide for fluorescence microscopy.
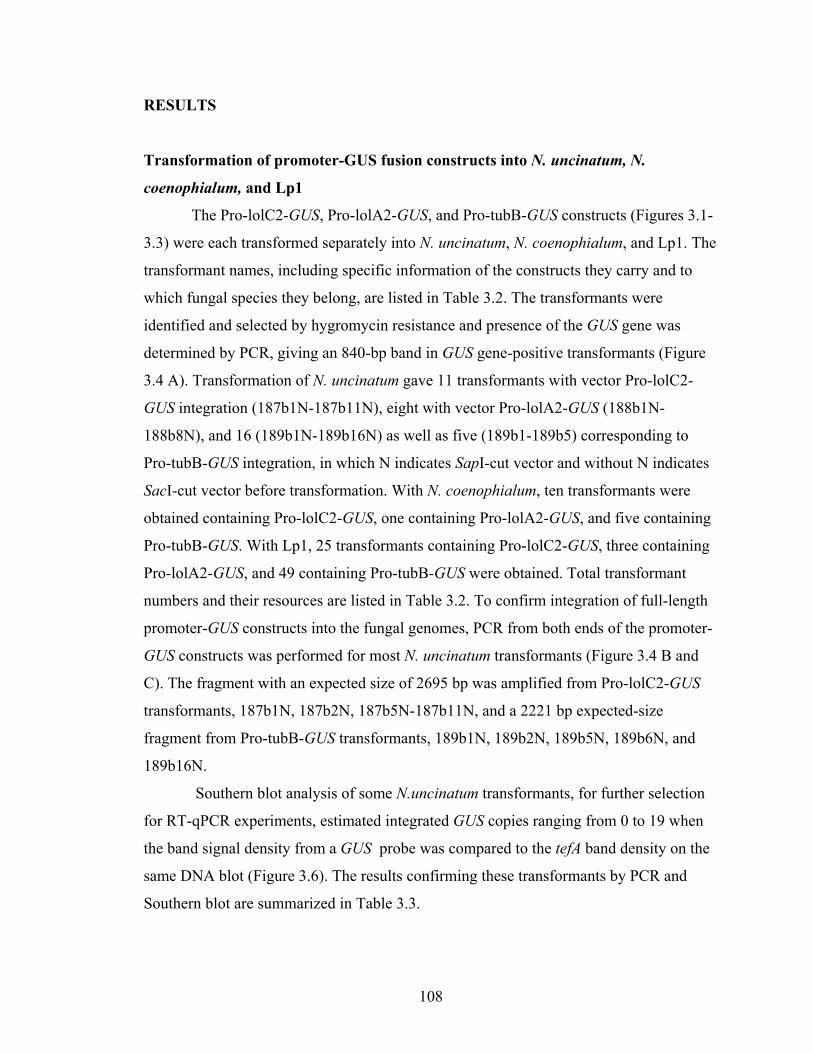
108
RESULTS
Transformation of promoter-GUS fusion constructs into N. uncinatum, N.
coenophialum, and Lp1
The Pro-lolC2-GUS, Pro-lolA2-GUS, and Pro-tubB-GUS constructs (Figures 3.1-
3.3) were each transformed separately into N. uncinatum, N. coenophialum, and Lp1. The
transformant names, including specific information of the constructs they carry and to
which fungal species they belong, are listed in Table 3.2. The transformants were
identified and selected by hygromycin resistance and presence of the GUS gene was
determined by PCR, giving an 840-bp band in GUS gene-positive transformants (Figure
3.4 A). Transformation of N. uncinatum gave 11 transformants with vector Pro-lolC2-
GUS integration (187b1N-187b11N), eight with vector Pro-lolA2-GUS (188b1N-
188b8N), and 16 (189b1N-189b16N) as well as five (189b1-189b5) corresponding to
Pro-tubB-GUS integration, in which N indicates SapI-cut vector and without N indicates
SacI-cut vector before transformation. With N. coenophialum, ten transformants were
obtained containing Pro-lolC2-GUS, one containing Pro-lolA2-GUS, and five containing
Pro-tubB-GUS. With Lp1, 25 transformants containing Pro-lolC2-GUS, three containing
Pro-lolA2-GUS, and 49 containing Pro-tubB-GUS were obtained. Total transformant
numbers and their resources are listed in Table 3.2. To confirm integration of full-length
promoter-GUS constructs into the fungal genomes, PCR from both ends of the promoter-
GUS constructs was performed for most N. uncinatum transformants (Figure 3.4 B and
C). The fragment with an expected size of 2695 bp was amplified from Pro-lolC2-GUS
transformants, 187b1N, 187b2N, 187b5N-187b11N, and a 2221 bp expected-size
fragment from Pro-tubB-GUS transformants, 189b1N, 189b2N, 189b5N, 189b6N, and
189b16N.
Southern blot analysis of some N.uncinatum transformants, for further selection
for RT-qPCR experiments, estimated integrated GUS copies ranging from 0 to 19 when
the band signal density from a GUS probe was compared to the tefA band density on the
same DNA blot (Figure 3.6). The results confirming these transformants by PCR and
Southern blot are summarized in Table 3.3.
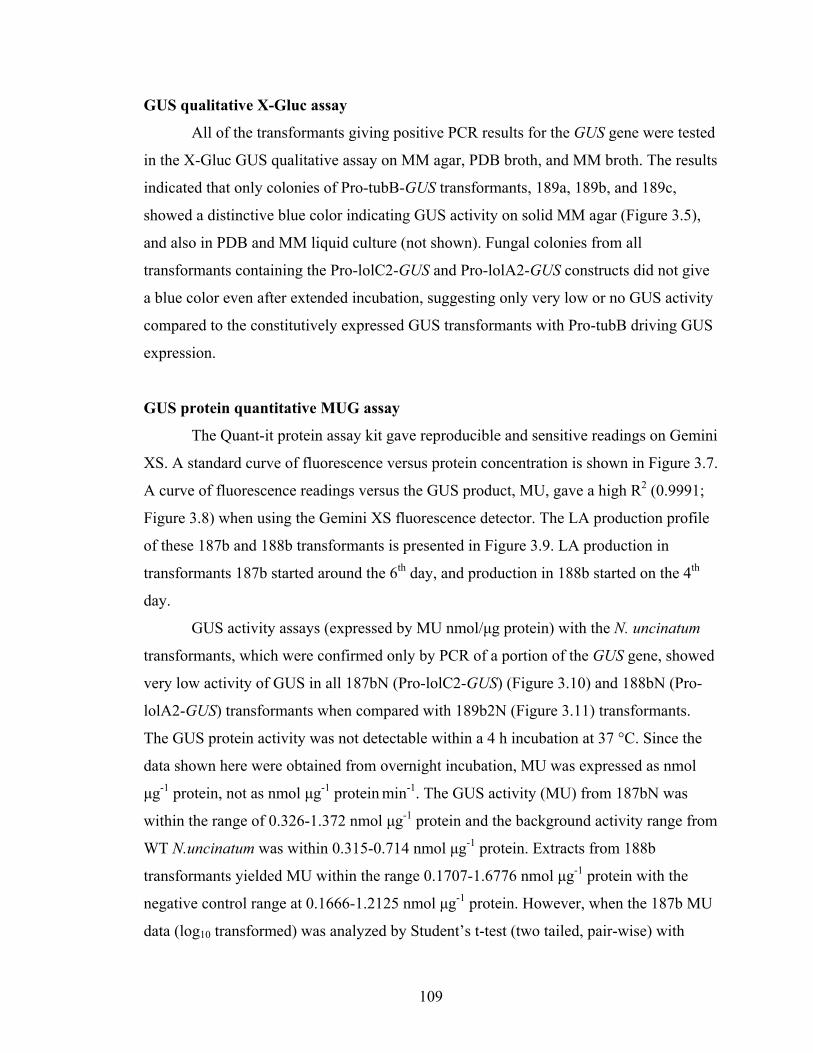
109
GUS qualitative X-Gluc assay
All of the transformants giving positive PCR results for the GUS gene were tested
in the X-Gluc GUS qualitative assay on MM agar, PDB broth, and MM broth. The results
indicated that only colonies of Pro-tubB-GUS transformants, 189a, 189b, and 189c,
showed a distinctive blue color indicating GUS activity on solid MM agar (Figure 3.5),
and also in PDB and MM liquid culture (not shown). Fungal colonies from all
transformants containing the Pro-lolC2-GUS and Pro-lolA2-GUS constructs did not give
a blue color even after extended incubation, suggesting only very low or no GUS activity
compared to the constitutively expressed GUS transformants with Pro-tubB driving GUS
expression.
GUS protein quantitative MUG assay
The Quant-it protein assay kit gave reproducible and sensitive readings on Gemini
XS. A standard curve of fluorescence versus protein concentration is shown in Figure 3.7.
A curve of fluorescence readings versus the GUS product, MU, gave a high R2 (0.9991;
Figure 3.8) when using the Gemini XS fluorescence detector. The LA production profile
of these 187b and 188b transformants is presented in Figure 3.9. LA production in
transformants 187b started around the 6th day, and production in 188b started on the 4th
day.
GUS activity assays (expressed by MU nmol/μg protein) with the N. uncinatum
transformants, which were confirmed only by PCR of a portion of the GUS gene, showed
very low activity of GUS in all 187bN (Pro-lolC2-GUS) (Figure 3.10) and 188bN (Pro-
lolA2-GUS) transformants when compared with 189b2N (Figure 3.11) transformants.
The GUS protein activity was not detectable within a 4 h incubation at 37 °C. Since the
data shown here were obtained from overnight incubation, MU was expressed as nmol
μg-1 protein, not as nmol μg-1 protein min-1. The GUS activity (MU) from 187bN was
within the range of 0.326-1.372 nmol μg-1 protein and the background activity range from
WT N.uncinatum was within 0.315-0.714 nmol μg-1 protein. Extracts from 188b
transformants yielded MU within the range 0.1707-1.6776 nmol μg-1 protein with the
negative control range at 0.1666-1.2125 nmol μg-1 protein. However, when the 187b MU
data (log10 transformed) was analyzed by Student’s t-test (two tailed, pair-wise) with
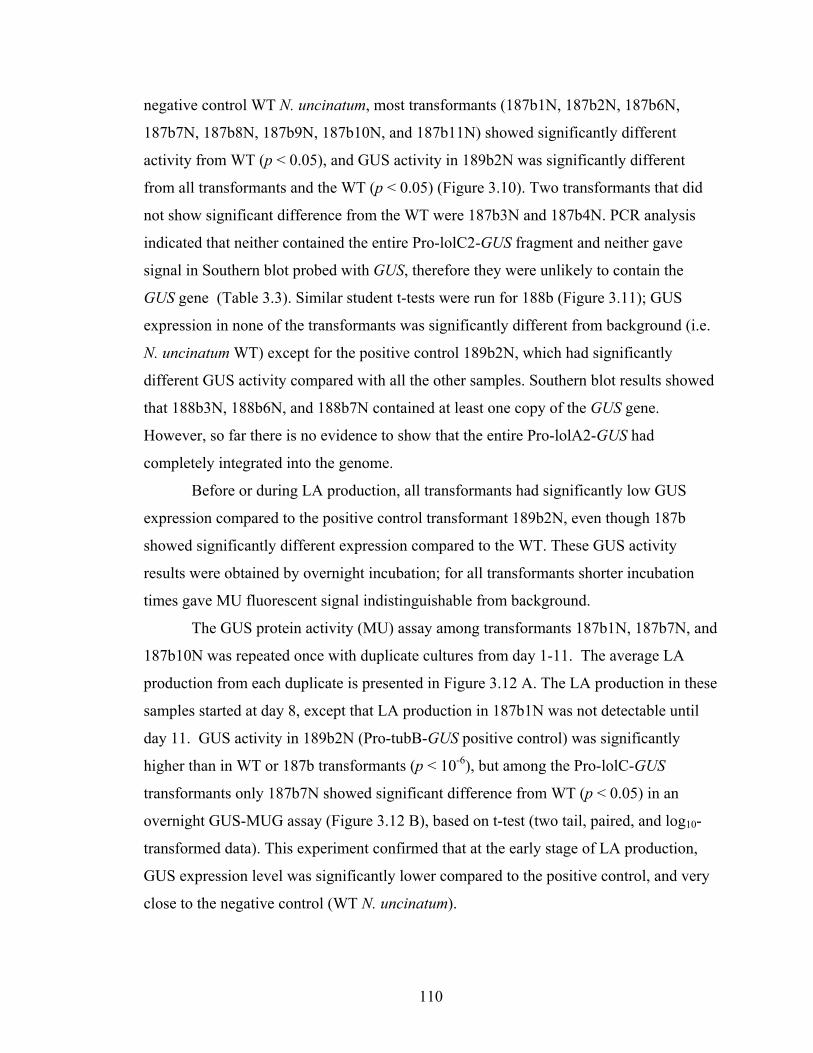
110
negative control WT N. uncinatum, most transformants (187b1N, 187b2N, 187b6N,
187b7N, 187b8N, 187b9N, 187b10N, and 187b11N) showed significantly different
activity from WT (p < 0.05), and GUS activity in 189b2N was significantly different
from all transformants and the WT (p < 0.05) (Figure 3.10). Two transformants that did
not show significant difference from the WT were 187b3N and 187b4N. PCR analysis
indicated that neither contained the entire Pro-lolC2-GUS fragment and neither gave
signal in Southern blot probed with GUS, therefore they were unlikely to contain the
GUS gene (Table 3.3). Similar student t-tests were run for 188b (Figure 3.11); GUS
expression in none of the transformants was significantly different from background (i.e.
N. uncinatum WT) except for the positive control 189b2N, which had significantly
different GUS activity compared with all the other samples. Southern blot results showed
that 188b3N, 188b6N, and 188b7N contained at least one copy of the GUS gene.
However, so far there is no evidence to show that the entire Pro-lolA2-GUS had
completely integrated into the genome.
Before or during LA production, all transformants had significantly low GUS
expression compared to the positive control transformant 189b2N, even though 187b
showed significantly different expression compared to the WT. These GUS activity
results were obtained by overnight incubation; for all transformants shorter incubation
times gave MU fluorescent signal indistinguishable from background.
The GUS protein activity (MU) assay among transformants 187b1N, 187b7N, and
187b10N was repeated once with duplicate cultures from day 1-11. The average LA
production from each duplicate is presented in Figure 3.12 A. The LA production in these
samples started at day 8, except that LA production in 187b1N was not detectable until
day 11. GUS activity in 189b2N (Pro-tubB-GUS positive control) was significantly
higher than in WT or 187b transformants (p < 10-6), but among the Pro-lolC-GUS
transformants only 187b7N showed significant difference from WT (p < 0.05) in an
overnight GUS-MUG assay (Figure 3.12 B), based on t-test (two tail, paired, and log10-
transformed data). This experiment confirmed that at the early stage of LA production,
GUS expression level was significantly lower compared to the positive control, and very
close to the negative control (WT N. uncinatum).
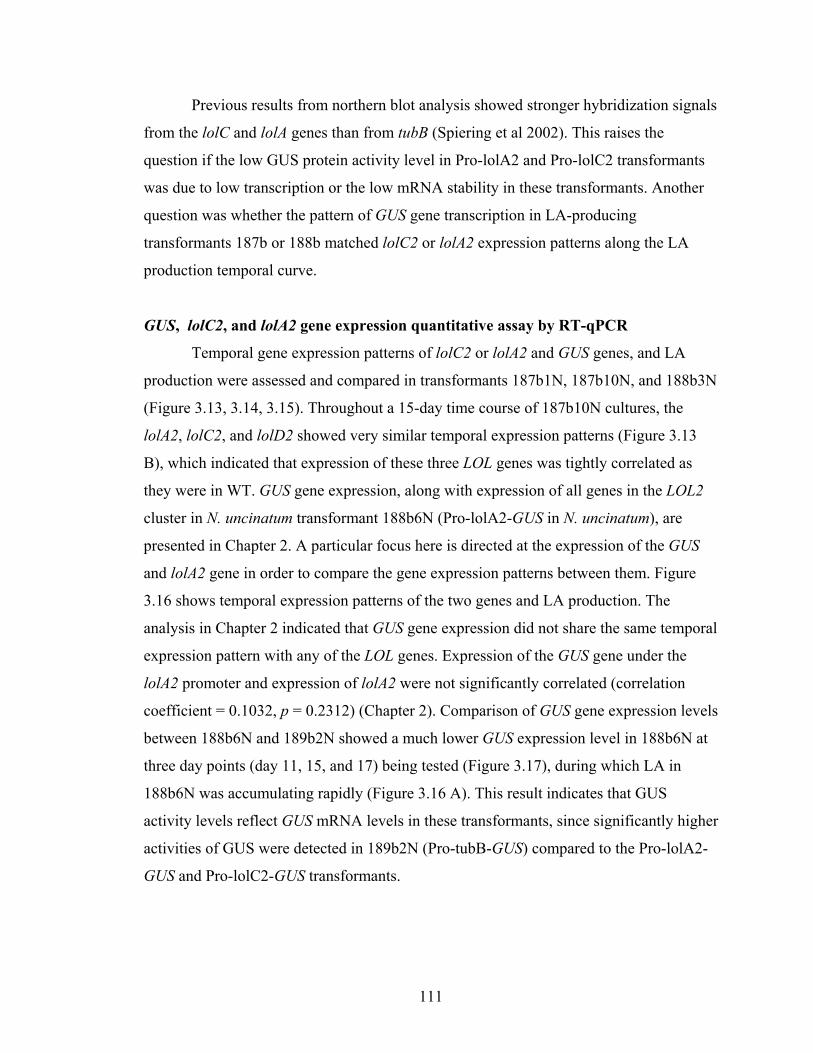
111
Previous results from northern blot analysis showed stronger hybridization signals
from the lolC and lolA genes than from tubB (Spiering et al 2002). This raises the
question if the low GUS protein activity level in Pro-lolA2 and Pro-lolC2 transformants
was due to low transcription or the low mRNA stability in these transformants. Another
question was whether the pattern of GUS gene transcription in LA-producing
transformants 187b or 188b matched lolC2 or lolA2 expression patterns along the LA
production temporal curve.
GUS, lolC2, and lolA2 gene expression quantitative assay by RT-qPCR
Temporal gene expression patterns of lolC2 or lolA2 and GUS genes, and LA
production were assessed and compared in transformants 187b1N, 187b10N, and 188b3N
(Figure 3.13, 3.14, 3.15). Throughout a 15-day time course of 187b10N cultures, the
lolA2, lolC2, and lolD2 showed very similar temporal expression patterns (Figure 3.13
B), which indicated that expression of these three LOL genes was tightly correlated as
they were in WT. GUS gene expression, along with expression of all genes in the LOL2
cluster in N. uncinatum transformant 188b6N (Pro-lolA2-GUS in N. uncinatum), are
presented in Chapter 2. A particular focus here is directed at the expression of the GUS
and lolA2 gene in order to compare the gene expression patterns between them. Figure
3.16 shows temporal expression patterns of the two genes and LA production. The
analysis in Chapter 2 indicated that GUS gene expression did not share the same temporal
expression pattern with any of the LOL genes. Expression of the GUS gene under the
lolA2 promoter and expression of lolA2 were not significantly correlated (correlation
coefficient = 0.1032, p = 0.2312) (Chapter 2). Comparison of GUS gene expression levels
between 188b6N and 189b2N showed a much lower GUS expression level in 188b6N at
three day points (day 11, 15, and 17) being tested (Figure 3.17), during which LA in
188b6N was accumulating rapidly (Figure 3.16 A). This result indicates that GUS
activity levels reflect GUS mRNA levels in these transformants, since significantly higher
activities of GUS were detected in 189b2N (Pro-tubB-GUS) compared to the Pro-lolA2-
GUS and Pro-lolC2-GUS transformants.
112
Inoculation of transformants to grass seedlings and infection check
Although LOL genes are expressed by N. uncinatum or N. coenophialum in
symbio, most LOL genes are undetectable in N. coenophialum cultures (Spiering et al
2005b). To compare the effects of Pro-lolA2 and Pro-lolC2 on GUS expression patterns
in symbiota and in cultures, the transformants were inoculated into seedlings of their
corresponding host grasses. The infection frequencies differed among combinations of
fungal and grass species. Inoculation of N. coenophialum transformants into tall fescue
gave 8% infection rate based on tissue-print immunoblot (Table 3.4). However, no
successful infection of meadow fescue with N. uncinatum was obtained from 120
inoculations. The N. uncinatum transformant’s slow and waxy growth might be one
reason for this poor infection rate. Lp1 transformants readily infected perennial ryegrass
seedlings, giving 28% infection frequency based on immunoblot check. PCR check of the
fungus isolated from the plant revealed that most were positive for the GUS gene.
Microscopy check of GUS expression in planta
After Imagene GreenTM C12FDGlcU treatment with tissues from tall fescue plants
infected by GUS transformants of N. coenophialum (187a9, 187a11, 187a14, 188a1,
189a3, and 189a5), and negative control plant tissues of E- and WT N. coenophialum,
microscopic examination revealed leaf blades from two plants that exhibited fluorescence
in hyphae, indicating GUS gene expression (Figure 3.18). These plants had N.
coenophialum transformant 187a11 with Pro-lolC2-GUS, and 189a5 was the positive
control Pro-tubB-GUS. This showed that GUS could be expressed in the N. coenophialum
transformant in symbiota, even if its activity in culture was almost undetectable.
However, this experiment needs to be repeated for the transformants that showed no
fluorescence. It is possible the tested leaf blade did not contain fungal hyphae. Also, more
plants that were successfully infected with transformants (including GUS transformants
of Lp1) should be tested.
113
DISCUSSION
In this study, results indicated that each promoter region (816 bp upstream of Pro-
lolC2, or 821 bp upstream of Pro-lolA2) itself was not able to control the GUS gene
expression pattern in the same way as expression of the corresponding LOL genes in the
LOL cluster in MM culture. Evidence of Pro-lolC2-GUS expression in N. coenophialum-
tall fescue strongly suggests that regulators in planta would trigger or enhance the
promoter activity to drive GUS expression in symbiota.
Previous work (Spiering et al 2005b) has shown that growth in MM induces lolA
and lolC in N. uncinatum but not in N. coenophialum. The lack of GUS activity in N.
coenophialum in culture was therefore not surprising, and likewise, lack of GUS activity
in Lp1 may be explained by the lack of transcriptional regulators for LA production in
this fungus, as it does not possess the LOL genes. However, in the N. uncinatum
transformants carrying GUS under control of lolA or lolC promoters, one would expect
temporal expression of the GUS gene similar to the expression of lolA and lolC genes if
the promoter alone was sufficient to determine gene expression.
There has been a report that transformation of N. loii with the GUS gene under the
promoter of HMG CoA reductase gene caused the changes in endophyte-plant interaction
and in planta fungal morphology (Zhang et al 2000). The comparison of lolC2 (or lolA2)
with GUS gene expression pattern was done after ensuring that the GUS transgene with
Pro-lolC2 (or Pro-lolA2) did not change the native lolC2, lolA2, and lolD2 gene
expression pattern in transformants compared to that in WT. GUS mRNA was detectable
by RT-qPCR in N. uncinatum transformants in MM culture, but showed very low-level
expression when compared with Pro-tubB-GUS. Results showed that the temporal pattern
of GUS gene expression varied from transformant to transformant, and was not correlated
with LOL gene expression pattern during LA production. Therefore, the tested promoter
region did not determine the GUS gene expression pattern.
It was not possible to reliably compare absolute levels of expression of the GUS
gene with those of the LOL genes because of possible differences in reverse transcription
efficiency from the LOL and GUS gene mRNAs, even though it was observed that Ct for
the GUS gene in RT-qPCR was always higher than the corresponding LOL gene Ct
114
values, and the GUS gene primers gave a better standard curve (R2 = 0.991, slope = –
3.47) and lower triplicate variance (0.1-2.4) than most of the LOL genes. Furthermore,
since the comparative method only calculated fold differences of gene expression level
change, the absolute amounts of LOL gene and GUS transcripts remain unknown. This
prevents any comparision of the activity of a promoter driving the GUS gene to that of a
promoter driving native LOL gene expression.
The random integration site of Pro-lolC2-GUS and Pro-lolA2-GUS into the fungal
genome in these transformants might be a reason for the variation in GUS gene
expression. Even though the absolute activity level is unknown for both promoter and
gene expression, it is evident that the promoter itself could not determine the gene
expression pattern in random integration transformants. One possible way to check the
proper promoter activity would be to target integration of a LOL promoter-GUS gene into
the LOL cluster region to test if this leads to GUS expression patterns similar to
expression of the native LOL genes, which could suggest that coregulation in the cluster
is important for proper LOL gene expression. GUS gene expression dependent on
integration site in the genome was reported in A. parasiticus (Malonek et al 2005). In
their studies, some GUS transformants showed no expression in the plate assay even
though the integrated construct was intact in the genome; and the promoter activity of
ver1 and nor1, two aflatoxin biosynthesis genes, decreased 500-fold when compared to
that of single-copy GUS integration in the corresponding homologous sites.
A future approach would be to integrate the GUS gene into a specific LOL gene
site in the LOL cluster without affecting the basic LA biosynthetic pathway. The N.
uncinatum lolP1 knock out (Spiering et al, in preparation) should be ideal for this
purpose. LolP1 is in the LOL cluster, likely encoding an enzyme catalyzing the oxidation
of N-methylloline to N-formylloline. The N. uncinatum lolP1 knockout still produces LA
in MM but with no N-formylloline. Therefore, the coregulation, transcription, and
translation of the LOL genes in different media or species could be monitored with GUS
if the GUS gene with the lolP1 promoter takes the lolP1 seat in the cluster. If GUS is
fused with another LOL gene promoter, the promoter activity driving GUS expression
also should mimic the native promoter activity in the cluster.
115
One N. coenophialum transformant, 187a11 (Pro-lolC2-GUS), in tall fescue
showed detectable GUS expression when examined by fluorescence microscopy using
the GUS-specific stain, Imagene Green as substrate. This is consistent with the
observation that LOL cluster-containing endophytes are able to produce LA in planta
even though they are not able either to express LOL genes or produce LA in culture.
Clearly, regulation in MM culture, in complex media, or in planta is different among
these endophyte species. N. uncinatum might possess a specific regulator of LOL gene
expression to make LA in culture, such as C2H2, a transcription-factor like gene
(Spiering et al 2002), which had a temporal expression pattern significantly similar to the
LOL genes and was grouped into the LOL gene expression correlation cluster (Chapter
2); in complex media, C2H2 expression is inhibited and in keeping with lack of LOL
gene expression and LA production. In planta, there might be different regulators
involved in LOL cluster gene expression, so the specific regulator for N. uncinatum in
MM culture is not dominant or necessary for in planta LA production by N.
coenophialum. A future interest for investigation would be what kind of regulators are
involved in the coregulation of LOL cluster genes in N. uncinatum culture; whether LOL
genes are coregulated in planta; and whether there are specific regulators for LOL gene
clusters in planta.
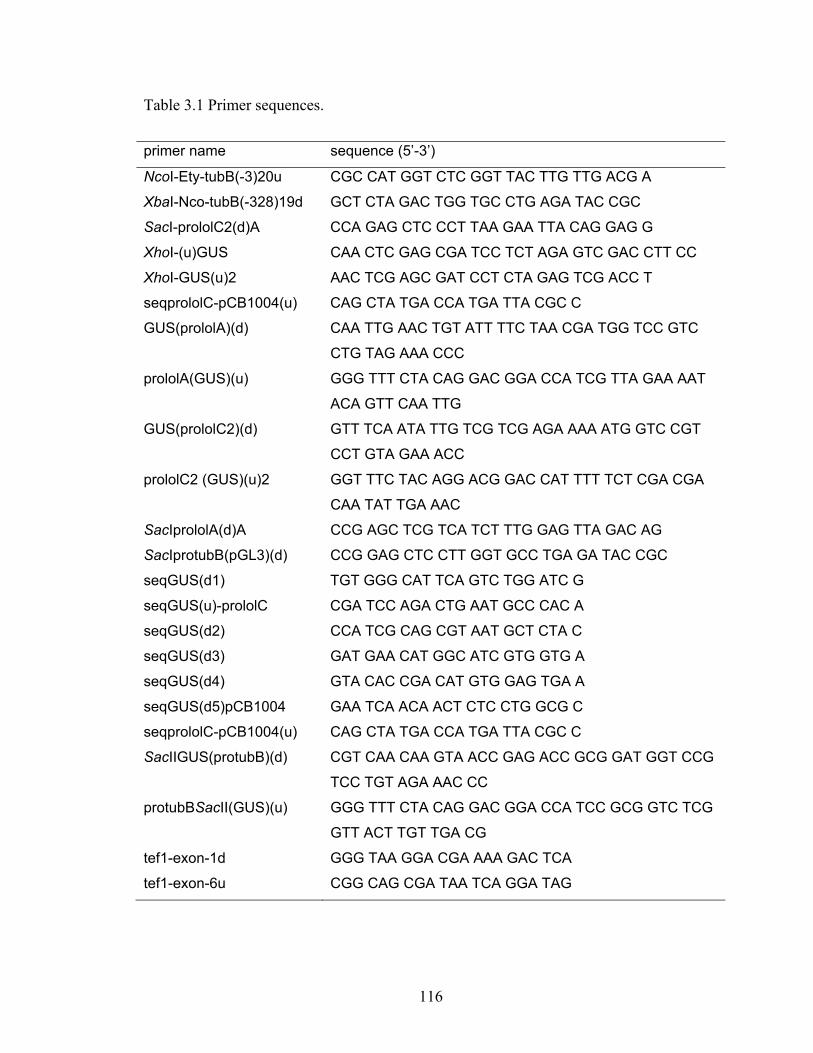
116
Table 3.1 Primer sequences.
primer name sequence (5’-3’)
NcoI-Ety-tubB(-3)20u CGC CAT GGT CTC GGT TAC TTG TTG ACG A
XbaI-Nco-tubB(-328)19d GCT CTA GAC TGG TGC CTG AGA TAC CGC
SacI-prololC2(d)A CCA GAG CTC CCT TAA GAA TTA CAG GAG G
XhoI-(u)GUS CAA CTC GAG CGA TCC TCT AGA GTC GAC CTT CC
XhoI-GUS(u)2 AAC TCG AGC GAT CCT CTA GAG TCG ACC T
seqprololC-pCB1004(u) CAG CTA TGA CCA TGA TTA CGC C
GUS(prololA)(d) CAA TTG AAC TGT ATT TTC TAA CGA TGG TCC GTC
CTG TAG AAA CCC
prololA(GUS)(u) GGG TTT CTA CAG GAC GGA CCA TCG TTA GAA AAT
ACA GTT CAA TTG
GUS(prololC2)(d) GTT TCA ATA TTG TCG TCG AGA AAA ATG GTC CGT
CCT GTA GAA ACC
prololC2 (GUS)(u)2 GGT TTC TAC AGG ACG GAC CAT TTT TCT CGA CGA
CAA TAT TGA AAC
SacIprololA(d)A CCG AGC TCG TCA TCT TTG GAG TTA GAC AG
SacIprotubB(pGL3)(d) CCG GAG CTC CTT GGT GCC TGA GA TAC CGC
seqGUS(d1) TGT GGG CAT TCA GTC TGG ATC G
seqGUS(u)-prololC CGA TCC AGA CTG AAT GCC CAC A
seqGUS(d2) CCA TCG CAG CGT AAT GCT CTA C
seqGUS(d3) GAT GAA CAT GGC ATC GTG GTG A
seqGUS(d4) GTA CAC CGA CAT GTG GAG TGA A
seqGUS(d5)pCB1004 GAA TCA ACA ACT CTC CTG GCG C
seqprololC-pCB1004(u) CAG CTA TGA CCA TGA TTA CGC C
SacIIGUS(protubB)(d) CGT CAA CAA GTA ACC GAG ACC GCG GAT GGT CCG
TCC TGT AGA AAC CC
protubBSacII(GUS)(u) GGG TTT CTA CAG GAC GGA CCA TCC GCG GTC TCG
GTT ACT TGT TGA CG
tef1-exon-1d GGG TAA GGA CGA AAA GAC TCA
tef1-exon-6u CGG CAG CGA TAA TCA GGA TAG
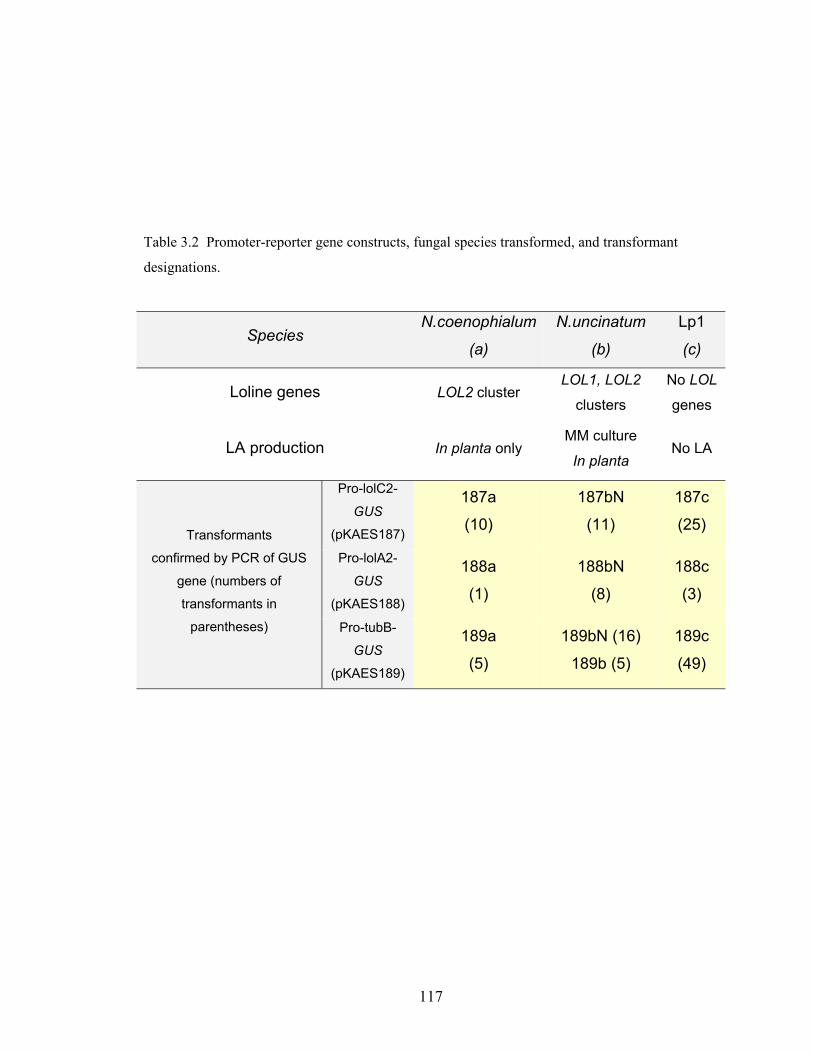
117
Table 3.2 Promoter-reporter gene constructs, fungal species transformed, and transformant
designations.
Species N.coenophialum
(a)
N.uncinatum
(b)
Lp1
(c)
Loline genes LOL2 cluster LOL1, LOL2
clusters
No LOL
genes
LA production In planta only MM culture
In planta No LA
Transformants
confirmed by PCR of GUS
gene (numbers of
transformants in
parentheses)
Pro-lolC2-
GUS
(pKAES187)
187a
(10)
187bN
(11)
187c
(25)
Pro-lolA2-
GUS
(pKAES188)
188a
(1)
188bN
(8)
188c
(3)
Pro-tubB-
GUS
(pKAES189)
189a
(5)
189bN (16)
189b (5)
189c
(49)
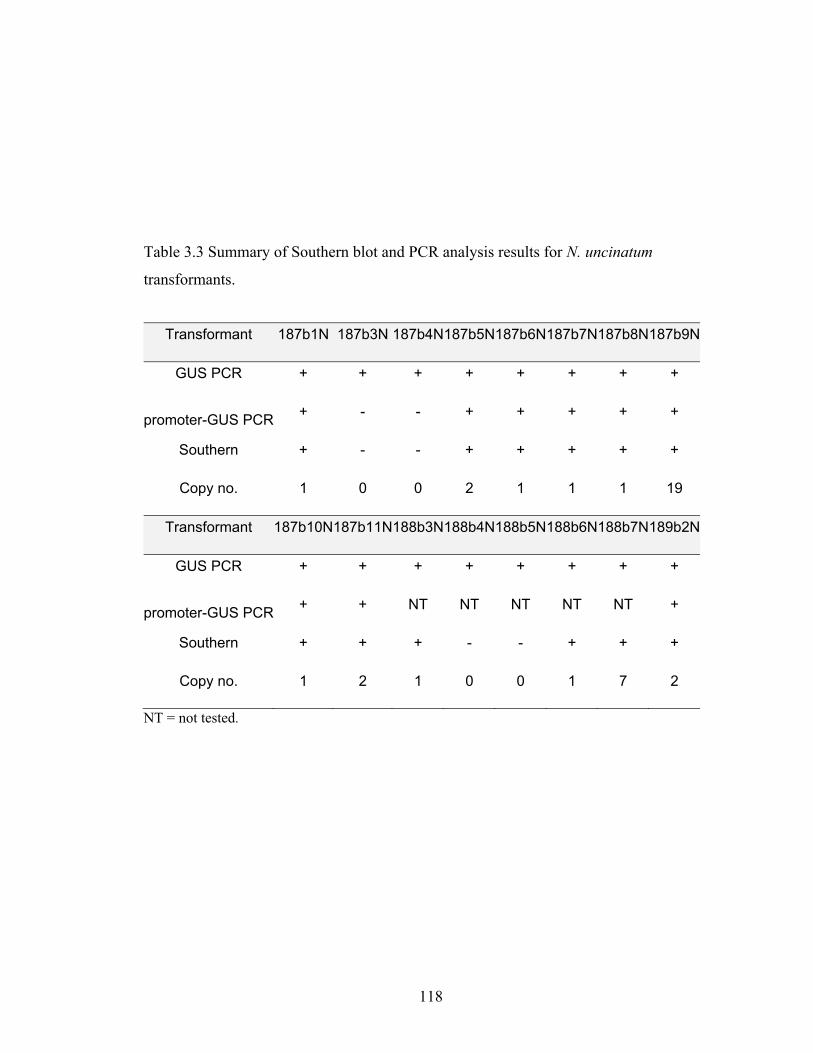
118
Table 3.3 Summary of Southern blot and PCR analysis results for N. uncinatum
transformants.
Transformant 187b1N 187b3N 187b4N187b5N187b6N187b7N187b8N 187b9N
GUS PCR + + + + + + + +
promoter-GUS PCR + - - + + + + +
Southern + - - + + + + +
Copy no. 1 0 0 2 1 1 1 19
Transformant 187b10N187b11N188b3N188b4N188b5N188b6N188b7N 189b2N
GUS PCR + + + + + + + +
promoter-GUS PCR + + NT NT NT NT NT +
Southern + + + - - + + +
Copy no. 1 2 1 0 0 1 7 2
NT = not tested.
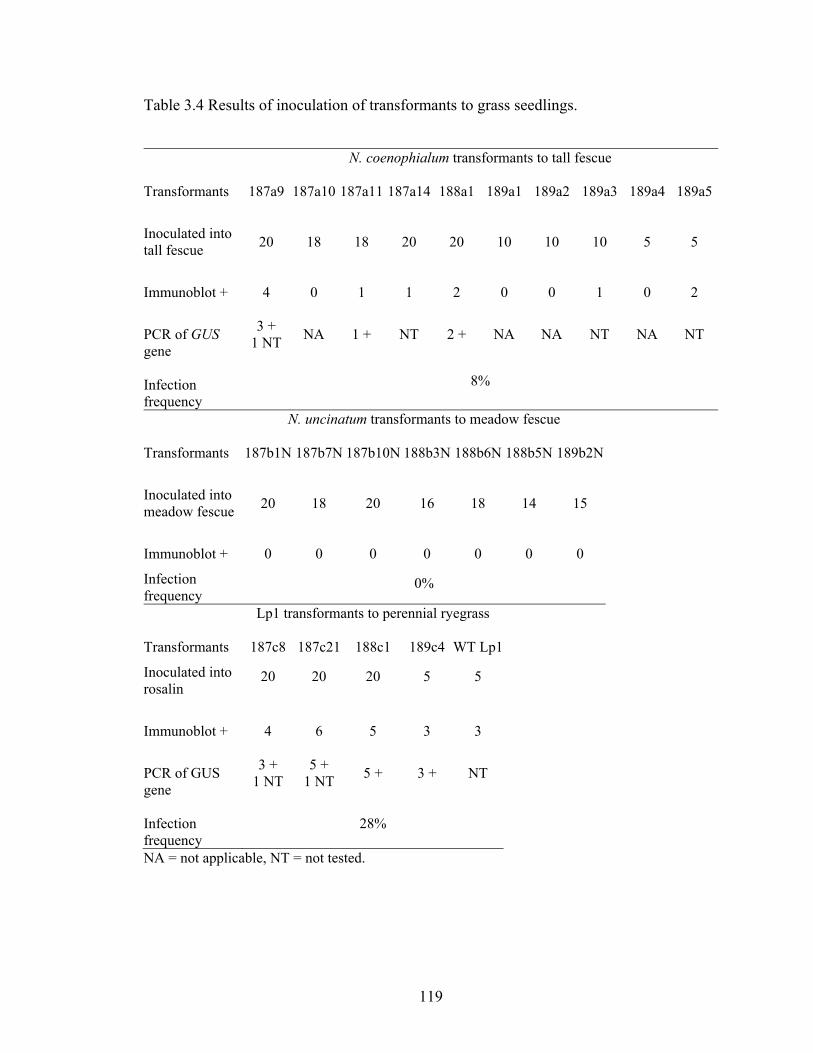
119
Table 3.4 Results of inoculation of transformants to grass seedlings.
N. coenophialum transformants to tall fescue
Transformants 187a9 187a10 187a11 187a14 188a1 189a1 189a2 189a3 189a4 189a5
Inoculated into tall fescue 20 18 18 20 20 10 10 10 5 5
Immunoblot + 4 0 1 1 2 0 0 1 0 2
PCR of GUS gene
3 + 1 NT NA 1 + NT 2 + NA NA NT NA NT
Infection frequency
8%
N. uncinatum transformants to meadow fescue
Transformants 187b1N 187b7N 187b10N 188b3N 188b6N 188b5N 189b2N
Inoculated into meadow fescue 20 18 20 16 18 14 15
Immunoblot + 0 0 0 0 0 0 0
Infection frequency
0%
Lp1 transformants to perennial ryegrass
Transformants 187c8 187c21 188c1 189c4 WT Lp1
Inoculated into rosalin
20 20 20 5 5
Immunoblot + 4 6 5 3 3
PCR of GUS gene
3 + 1 NT
5 + 1 NT 5 + 3 + NT
Infection frequency
28%
NA = not applicable, NT = not tested.
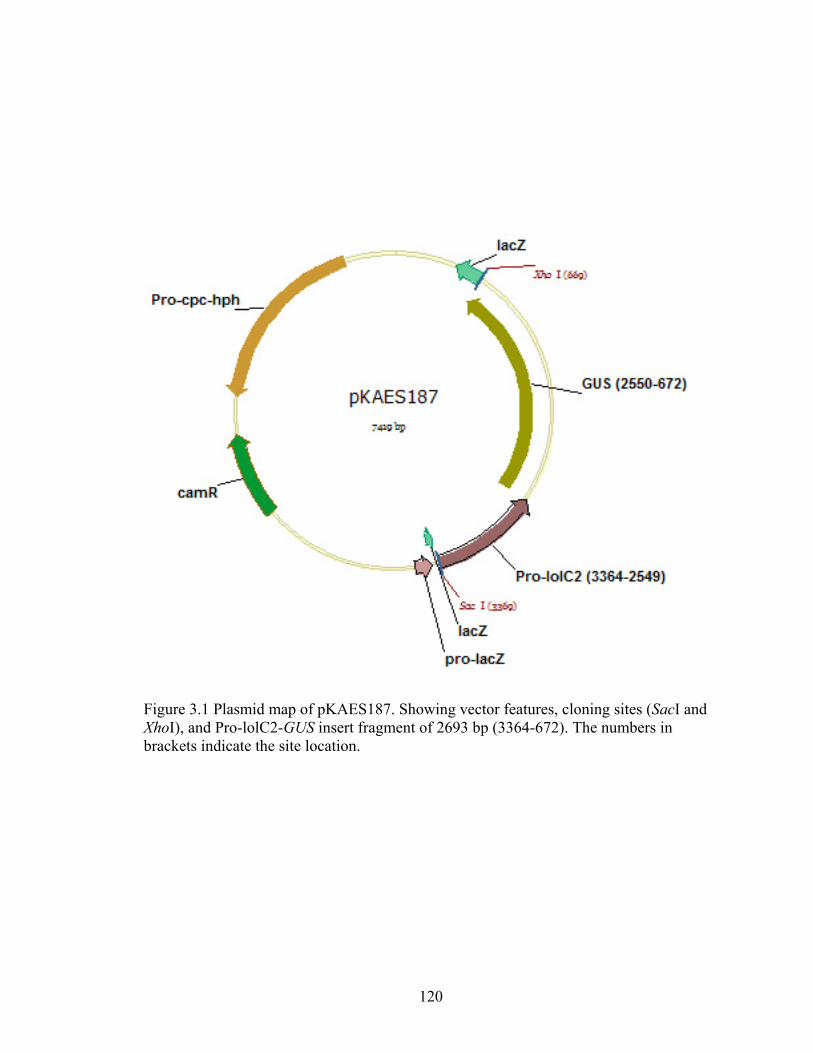
120
Figure 3.1 Plasmid map of pKAES187. Showing vector features, cloning sites (SacI and XhoI), and Pro-lolC2-GUS insert fragment of 2693 bp (3364-672). The numbers in brackets indicate the site location.
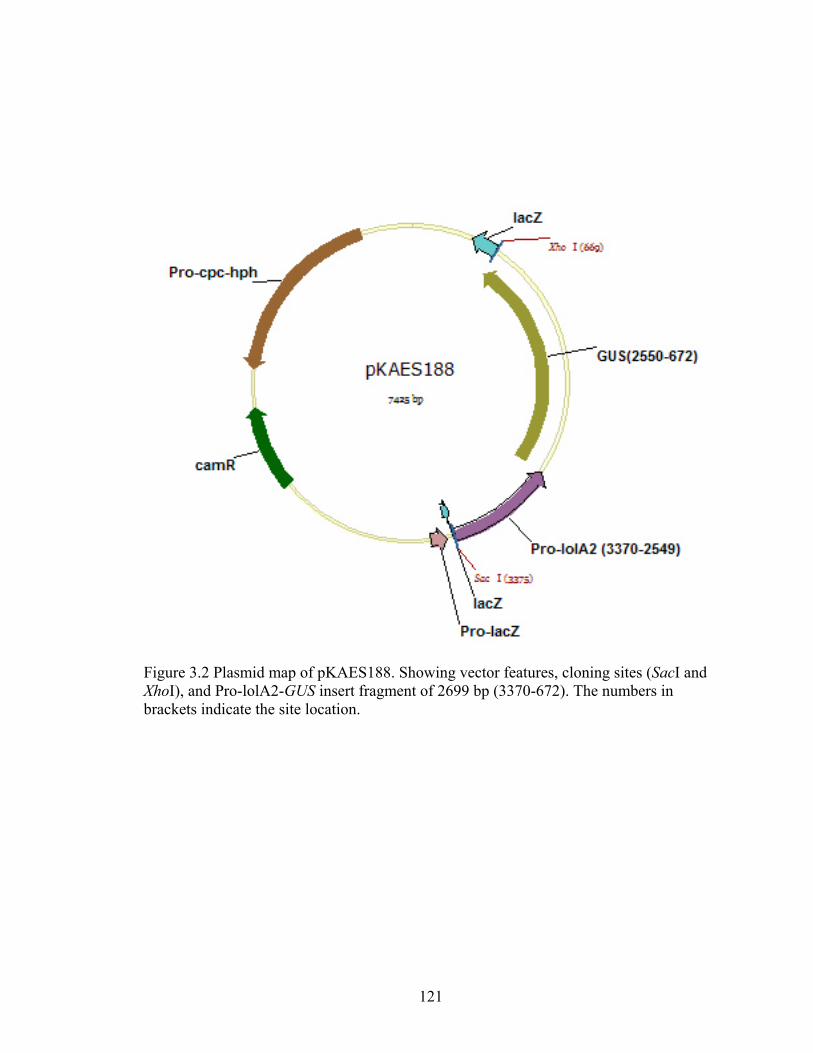
121
Figure 3.2 Plasmid map of pKAES188. Showing vector features, cloning sites (SacI and XhoI), and Pro-lolA2-GUS insert fragment of 2699 bp (3370-672). The numbers in brackets indicate the site location.
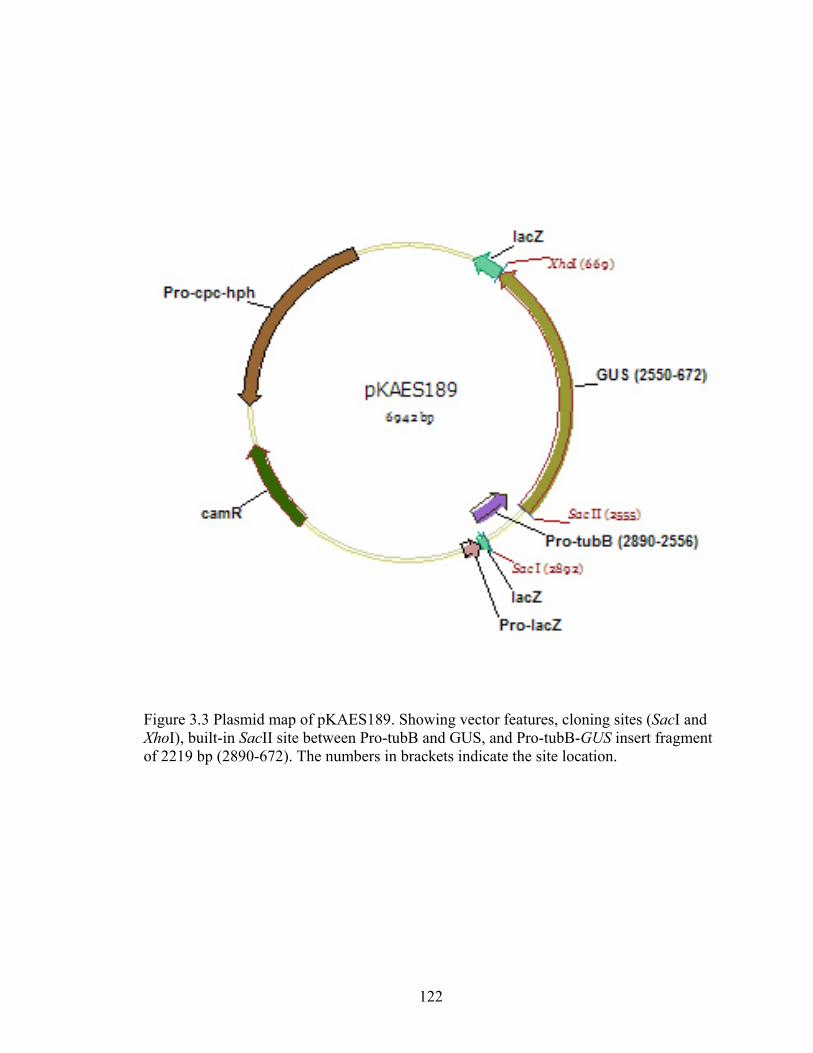
122
Figure 3.3 Plasmid map of pKAES189. Showing vector features, cloning sites (SacI and XhoI), built-in SacII site between Pro-tubB and GUS, and Pro-tubB-GUS insert fragment of 2219 bp (2890-672). The numbers in brackets indicate the site location.
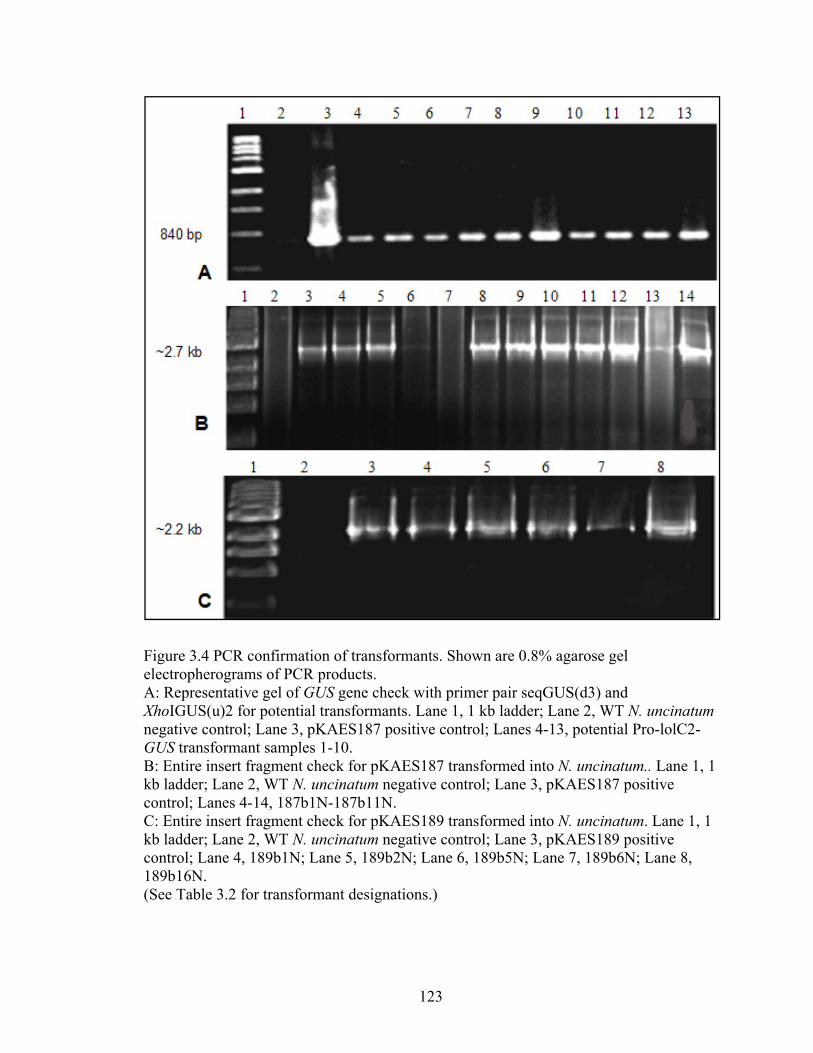
123
Figure 3.4 PCR confirmation of transformants. Shown are 0.8% agarose gel electropherograms of PCR products. A: Representative gel of GUS gene check with primer pair seqGUS(d3) and XhoIGUS(u)2 for potential transformants. Lane 1, 1 kb ladder; Lane 2, WT N. uncinatum negative control; Lane 3, pKAES187 positive control; Lanes 4-13, potential Pro-lolC2-GUS transformant samples 1-10. B: Entire insert fragment check for pKAES187 transformed into N. uncinatum.. Lane 1, 1 kb ladder; Lane 2, WT N. uncinatum negative control; Lane 3, pKAES187 positive control; Lanes 4-14, 187b1N-187b11N. C: Entire insert fragment check for pKAES189 transformed into N. uncinatum. Lane 1, 1 kb ladder; Lane 2, WT N. uncinatum negative control; Lane 3, pKAES189 positive control; Lane 4, 189b1N; Lane 5, 189b2N; Lane 6, 189b5N; Lane 7, 189b6N; Lane 8, 189b16N. (See Table 3.2 for transformant designations.)
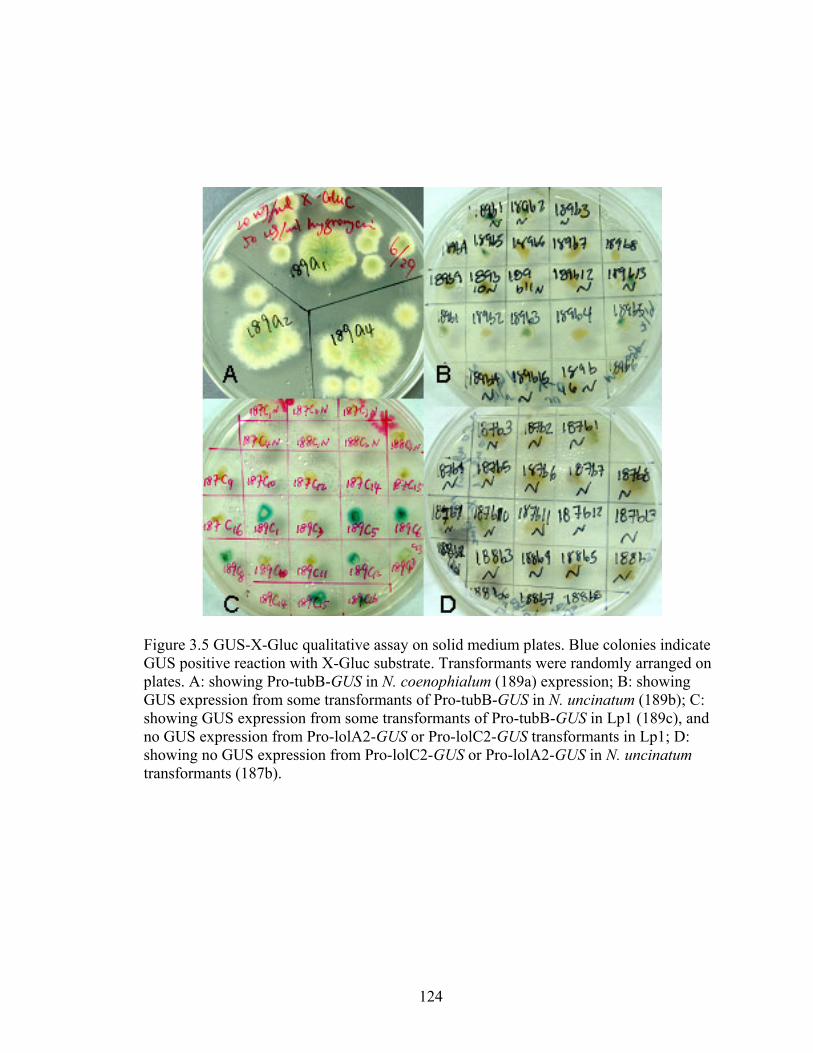
124
Figure 3.5 GUS-X-Gluc qualitative assay on solid medium plates. Blue colonies indicate GUS positive reaction with X-Gluc substrate. Transformants were randomly arranged on plates. A: showing Pro-tubB-GUS in N. coenophialum (189a) expression; B: showing GUS expression from some transformants of Pro-tubB-GUS in N. uncinatum (189b); C: showing GUS expression from some transformants of Pro-tubB-GUS in Lp1 (189c), and no GUS expression from Pro-lolA2-GUS or Pro-lolC2-GUS transformants in Lp1; D: showing no GUS expression from Pro-lolC2-GUS or Pro-lolA2-GUS in N. uncinatum transformants (187b).
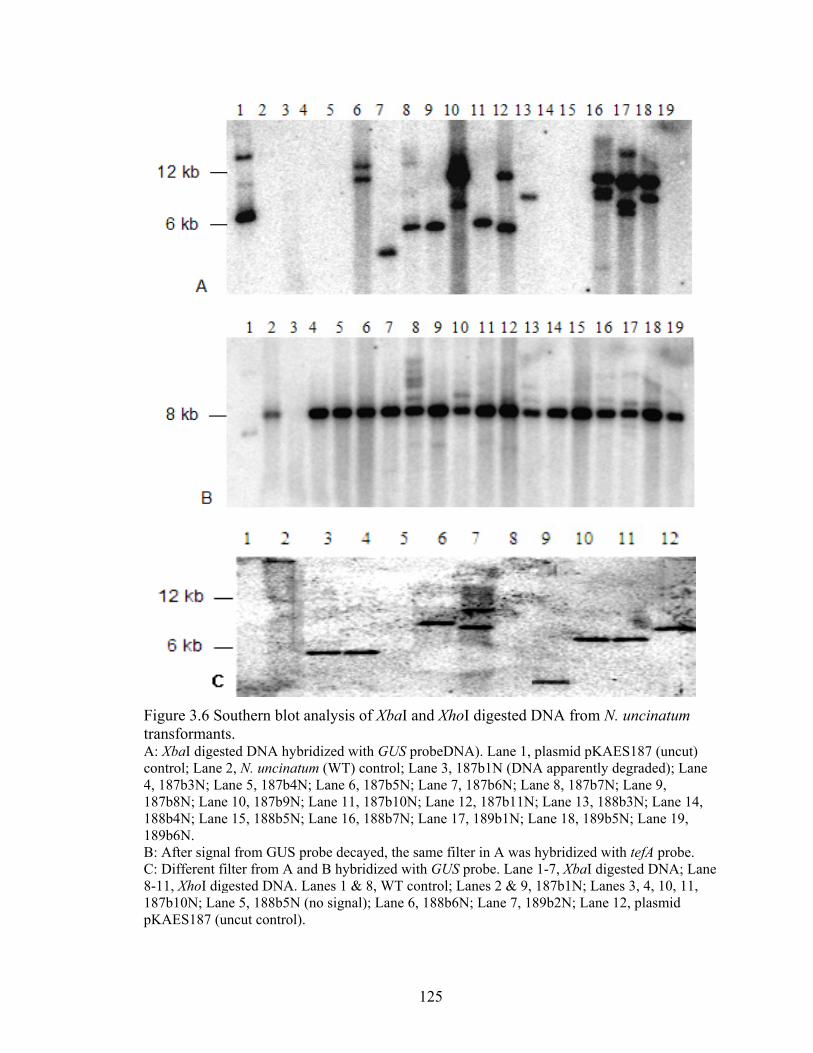
FtrAco4,181818BC8-18pK
igure 3.6 Soransformants
A: XbaI digestontrol; Lane 2, 187b3N; La87b8N; Lane 88b4N; Lane 89b6N.
B: After signalC: Different fil
-11, XhoI dig87b10N; LanKAES187 (un
outhern blot s. ted DNA hybr2, N. uncinatuane 5, 187b4N
10, 187b9N;15, 188b5N;
l from GUS plter from A an
gested DNA. Lne 5, 188b5N ncut control).
analysis of X
ridized with Gum (WT) cont
N; Lane 6, 187 Lane 11, 187 Lane 16, 188
probe decayednd B hybridizLanes 1 & 8, (no signal); L.
125
XbaI and Xh
GUS probeDNtrol; Lane 3, 7b5N; Lane 77b10N; Lane 8b7N; Lane 1
d, the same filzed with GUSWT control;
Lane 6, 188b6
oI digested D
NA). Lane 1, 187b1N (DN
7, 187b6N; La12, 187b11N
17, 189b1N; L
lter in A was S probe. LaneLanes 2 & 9,
6N; Lane 7, 1
DNA from N
plasmid pKAA apparentlyane 8, 187b7N
N; Lane 13, 18Lane 18, 189b
hybridized we 1-7, XbaI dig
187b1N; Lan89b2N; Lane
N. uncinatum
AES187 (uncu degraded); L
N; Lane 9, 88b3N; Lane b5N; Lane 19
with tefA probgested DNA; nes 3, 4, 10, 1e 12, plasmid
m
ut) Lane
14, ,
e. Lane
11,
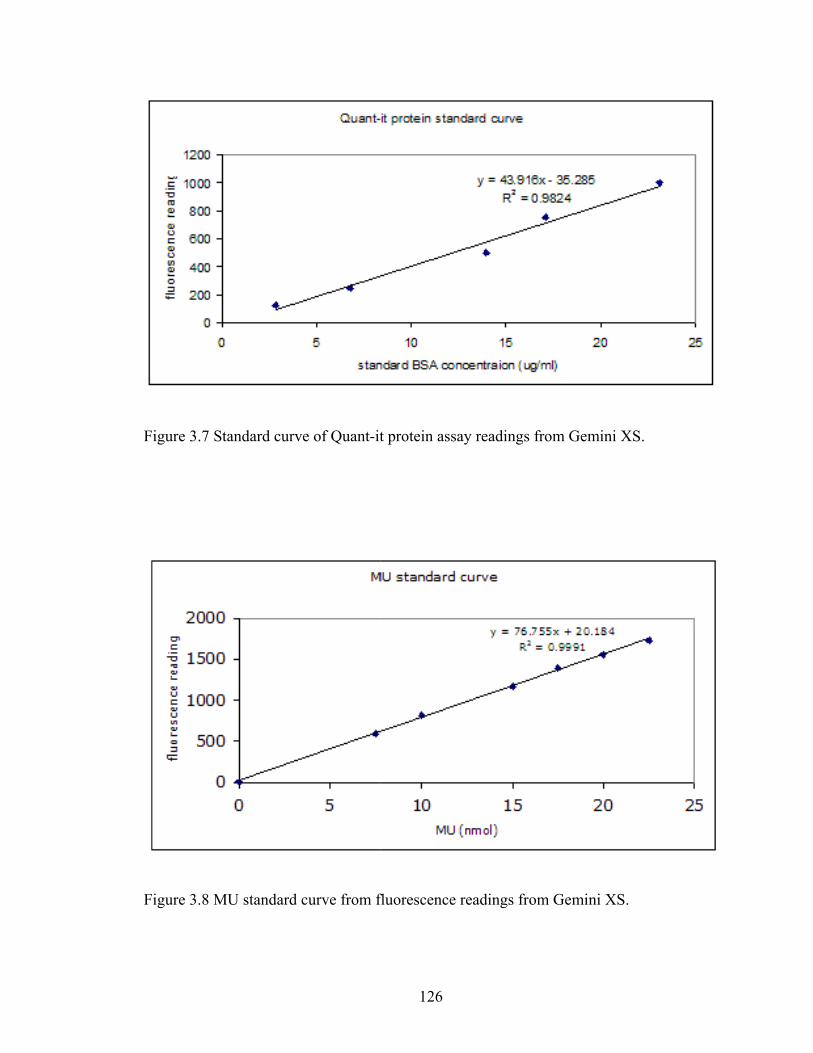
F
F
igure 3.7 Sta
igure 3.8 MU
andard curve
U standard c
e of Quant-it
curve from f
126
t protein ass
fluorescence
ay readings
readings fro
from Gemin
om Gemini X
ni XS.
XS.
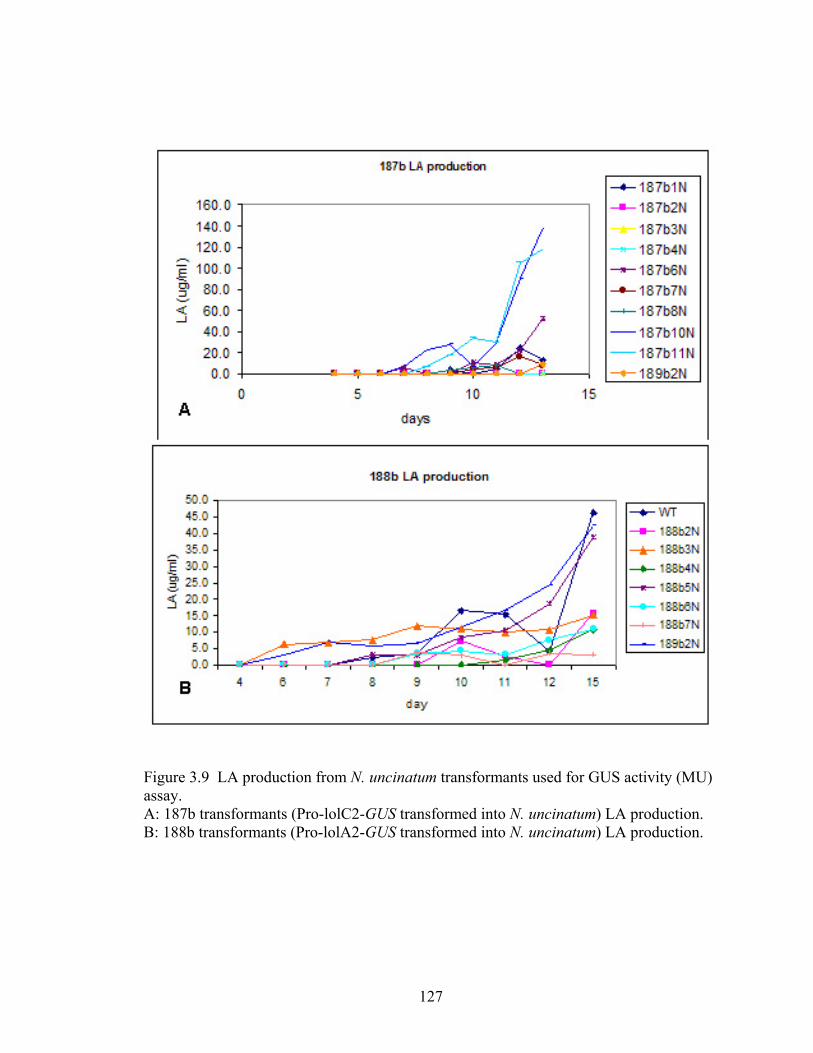
127
Figure 3.9 LA production from N. uncinatum transformants used for GUS activity (MU) assay. A: 187b transformants (Pro-lolC2-GUS transformed into N. uncinatum) LA production. B: 188b transformants (Pro-lolA2-GUS transformed into N. uncinatum) LA production.
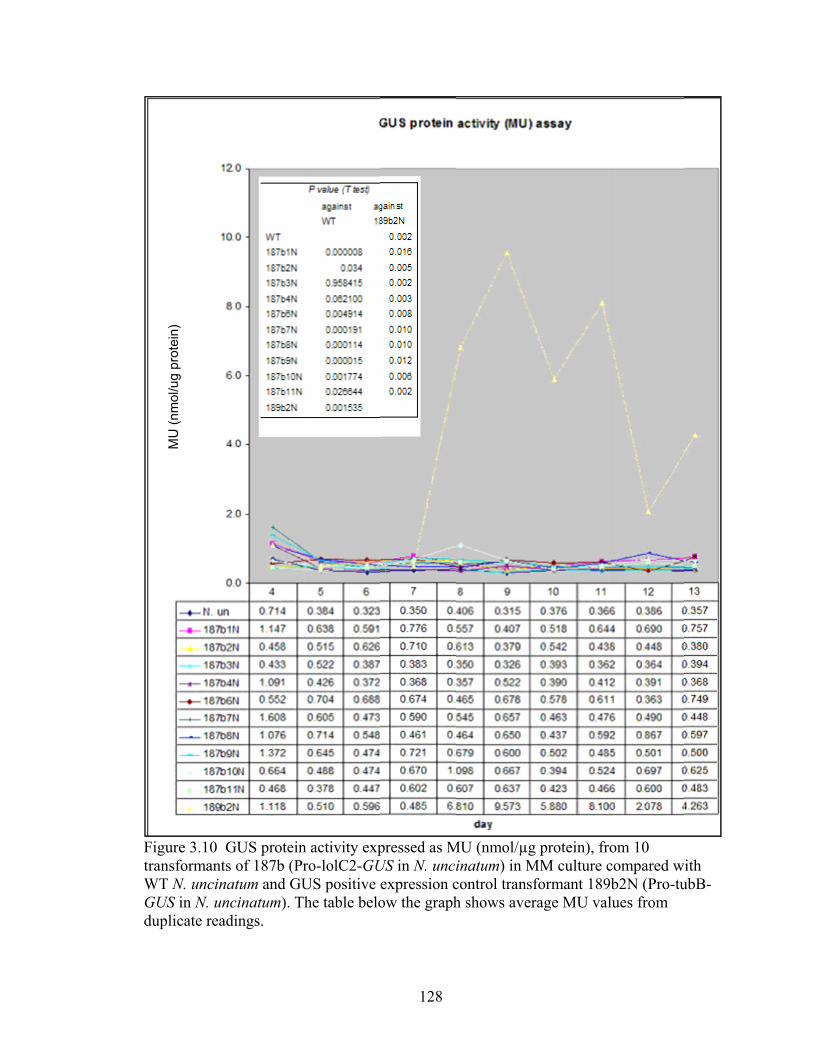
FtrWGdu
igure 3.10 Gransformants
WT N. uncinaGUS in N. un
uplicate read
MU
(nm
ol/u
g pr
otei
n)
GUS proteins of 187b (Pratum and GU
ncinatum). Tdings.
n activity expro-lolC2-GUUS positive he table belo
128
pressed as MUS in N. unciexpression cow the graph
MU (nmol/µginatum) in Mcontrol transh shows aver
g protein), frMM culture cformant 189rage MU val
rom 10 compared w9b2N (Pro-tulues from
ith ubB-
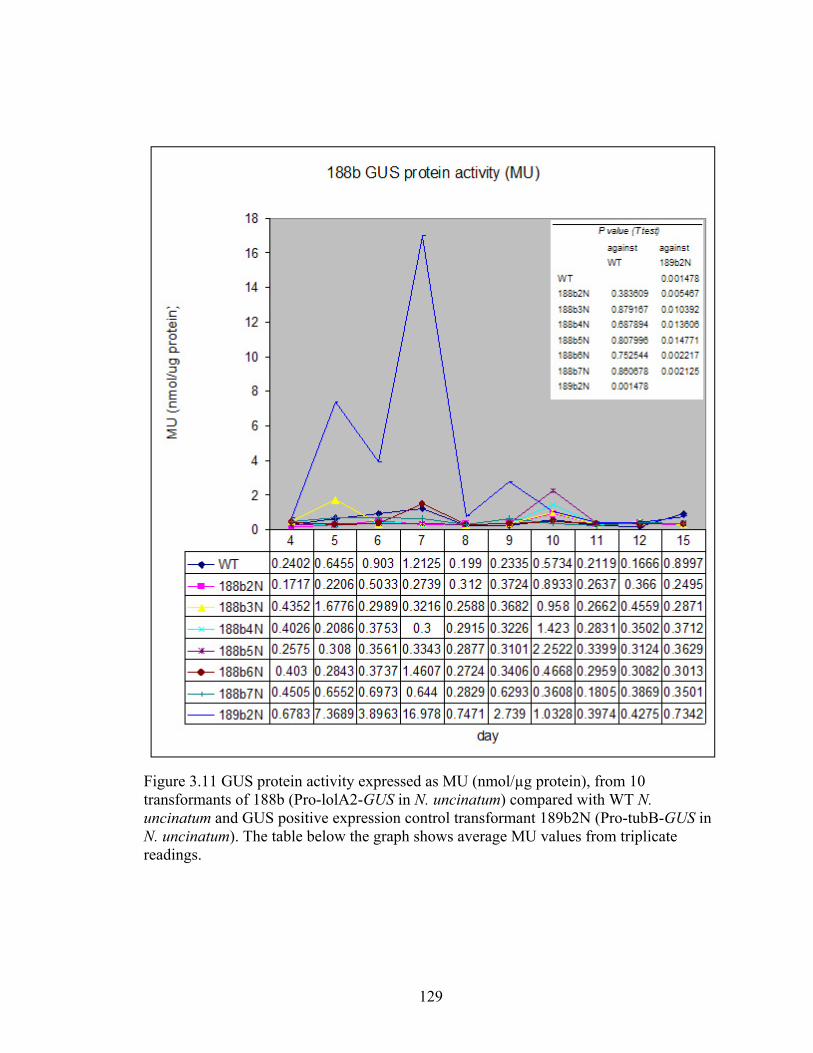
129
Figure 3.11 GUS protein activity expressed as MU (nmol/µg protein), from 10 transformants of 188b (Pro-lolA2-GUS in N. uncinatum) compared with WT N. uncinatum and GUS positive expression control transformant 189b2N (Pro-tubB-GUS in N. uncinatum). The table below the graph shows average MU values from triplicate readings.
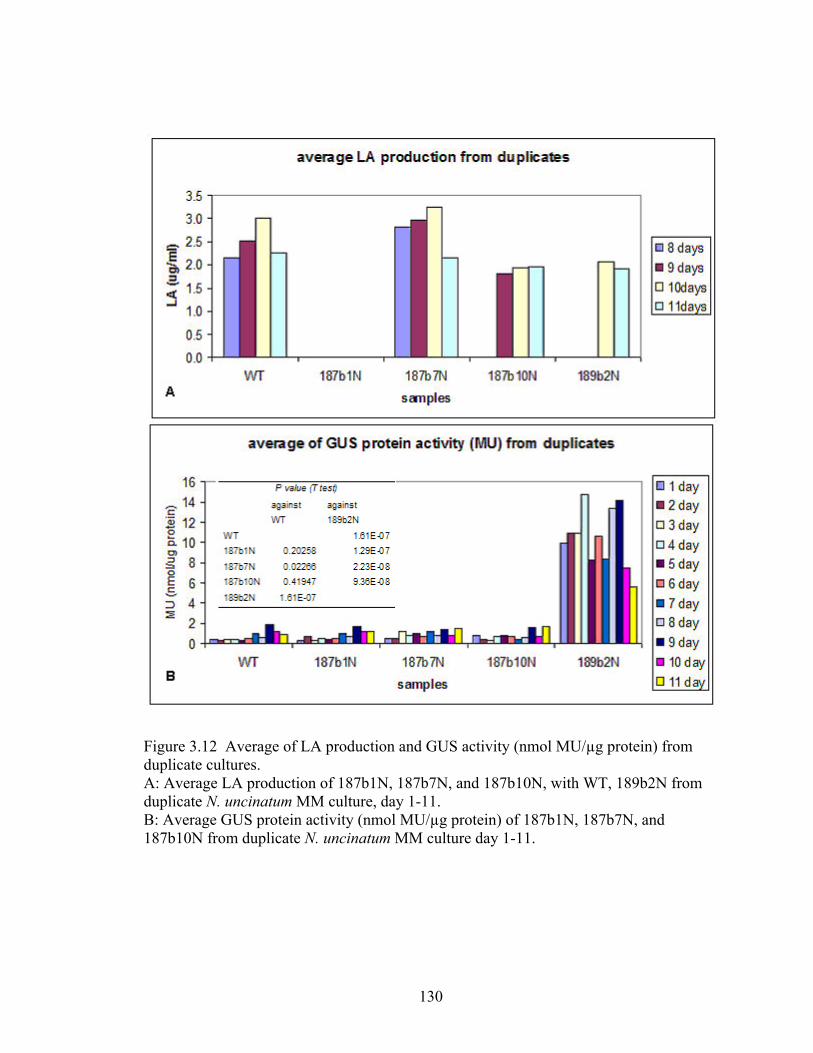
130
Figure 3.12 Average of LA production and GUS activity (nmol MU/µg protein) from duplicate cultures. A: Average LA production of 187b1N, 187b7N, and 187b10N, with WT, 189b2N from duplicate N. uncinatum MM culture, day 1-11. B: Average GUS protein activity (nmol MU/µg protein) of 187b1N, 187b7N, and 187b10N from duplicate N. uncinatum MM culture day 1-11.
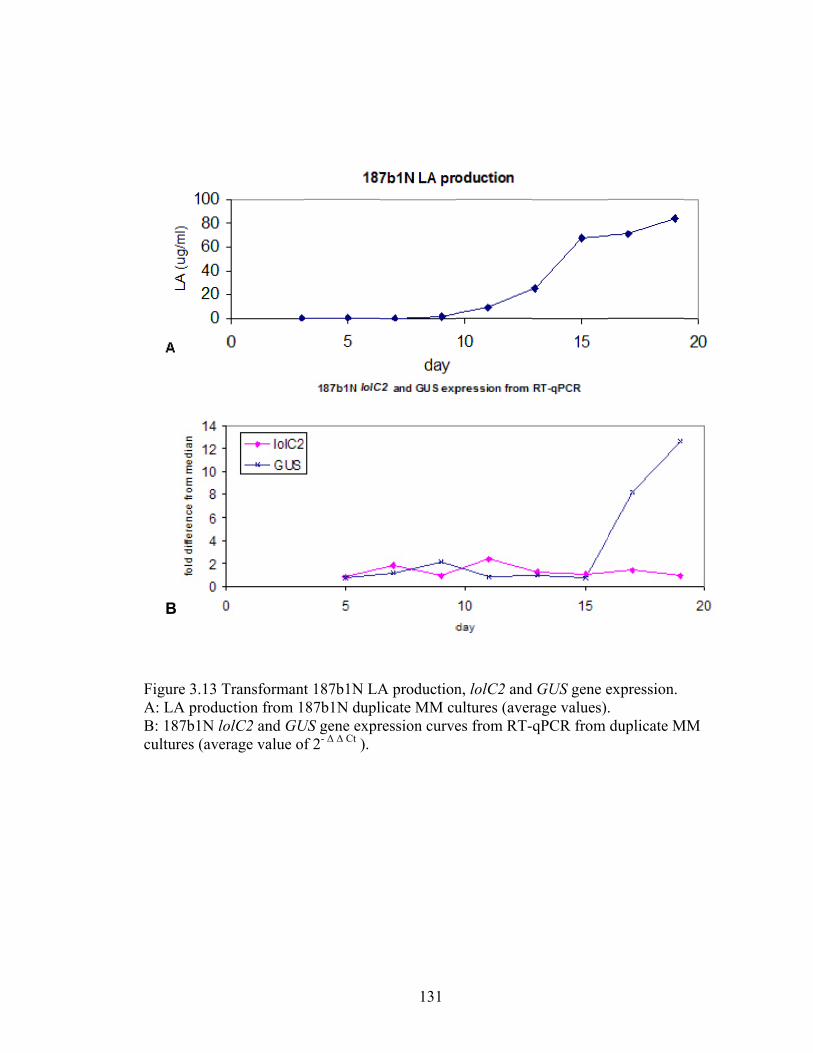
FABcu
igure 3.13 TA: LA producB: 187b1N loultures (aver
B
Transformantction from 1olC2 and GUrage value of
t 187b1N LA87b1N dupl
US gene exprf 2- Δ Δ Ct ).
131
A productionlicate MM curession curve
n, lolC2 and ultures (averes from RT-
d GUS gene erage values).qPCR from
expression. . duplicate M
MM
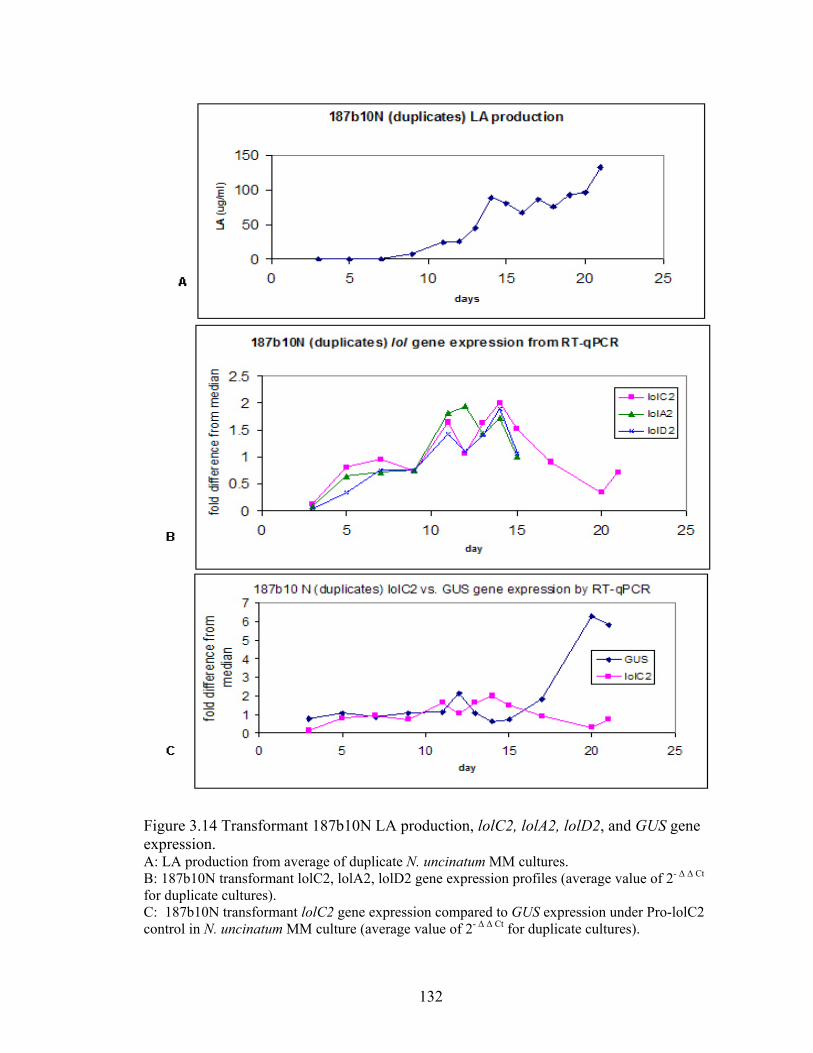
132
Figure 3.14 Transformant 187b10N LA production, lolC2, lolA2, lolD2, and GUS gene expression. A: LA production from average of duplicate N. uncinatum MM cultures. B: 187b10N transformant lolC2, lolA2, lolD2 gene expression profiles (average value of 2- Δ Δ Ct for duplicate cultures). C: 187b10N transformant lolC2 gene expression compared to GUS expression under Pro-lolC2 control in N. uncinatum MM culture (average value of 2- Δ Δ Ct for duplicate cultures).
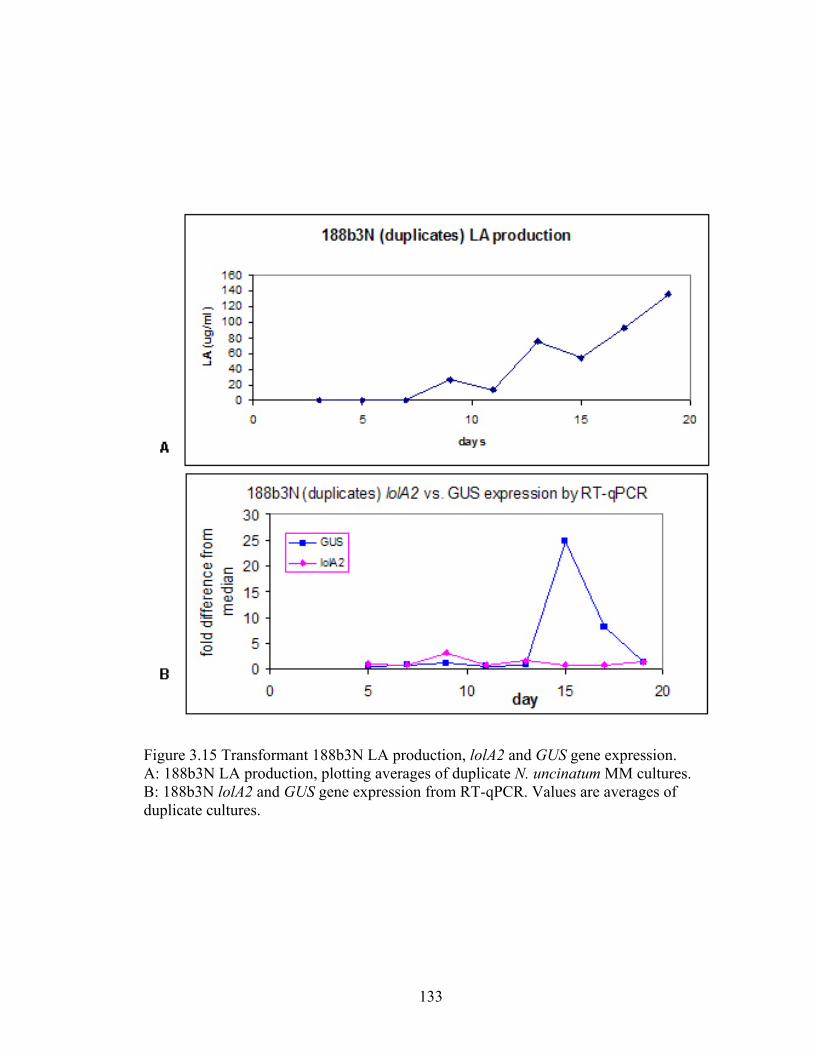
133
Figure 3.15 Transformant 188b3N LA production, lolA2 and GUS gene expression. A: 188b3N LA production, plotting averages of duplicate N. uncinatum MM cultures. B: 188b3N lolA2 and GUS gene expression from RT-qPCR. Values are averages of duplicate cultures.
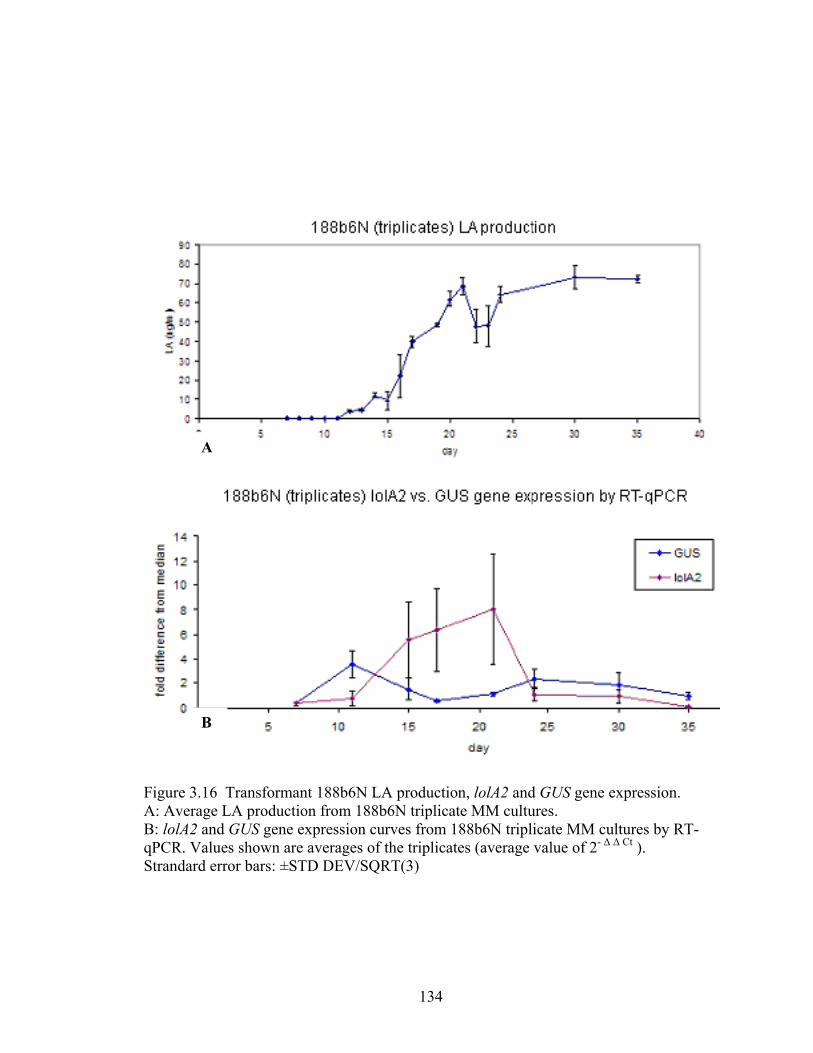
FABqPS
igure 3.16 TA: Average LB: lolA2 and
PCR. Valuetrandard erro
A
B
TransformanLA productioGUS gene es shown are or bars: ±ST
nt 188b6N Lon from 188bxpression cuaverages of
TD DEV/SQ
134
LA productiob6N triplicaturves from 1f the triplicatRT(3)
on, lolA2 andte MM cultu88b6N tripl
tes (average
d GUS gene ures. icate MM cuvalue of 2- Δ
expression.
ultures by RΔ Δ Ct ).
T-
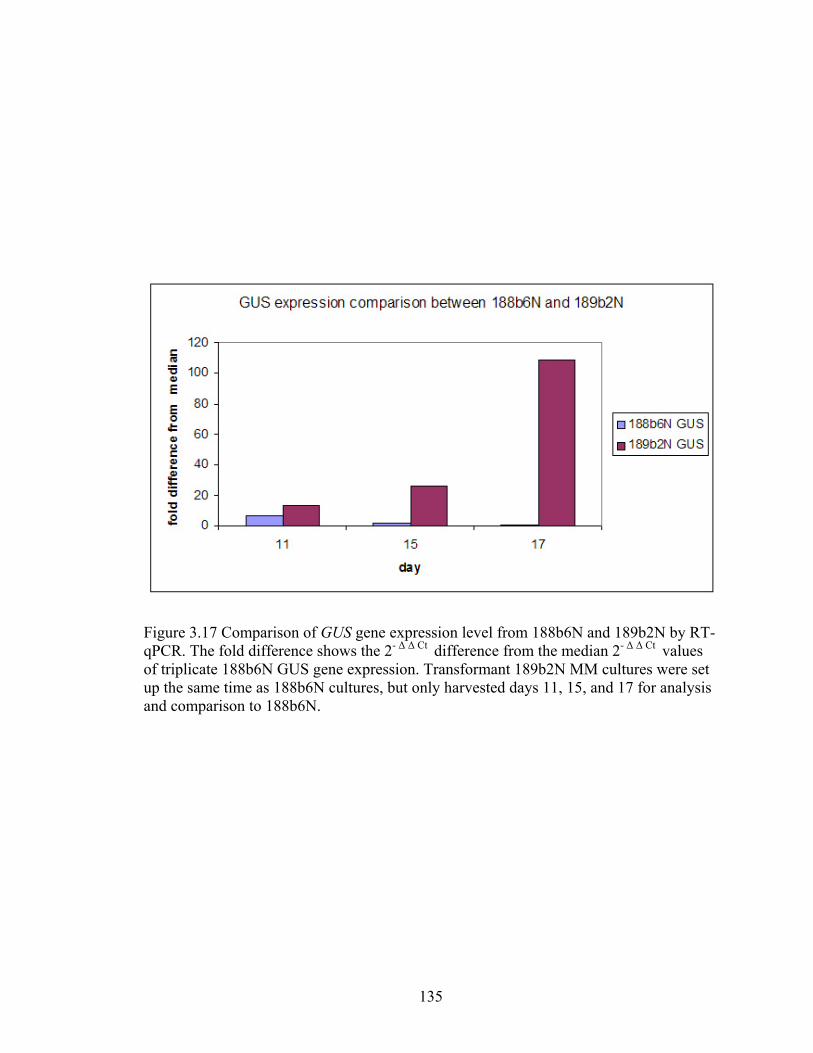
135
Figure 3.17 Comparison of GUS gene expression level from 188b6N and 189b2N by RT-qPCR. The fold difference shows the 2- Δ Δ Ct difference from the median 2- Δ Δ Ct values of triplicate 188b6N GUS gene expression. Transformant 189b2N MM cultures were set up the same time as 188b6N cultures, but only harvested days 11, 15, and 17 for analysis and comparison to 188b6N.
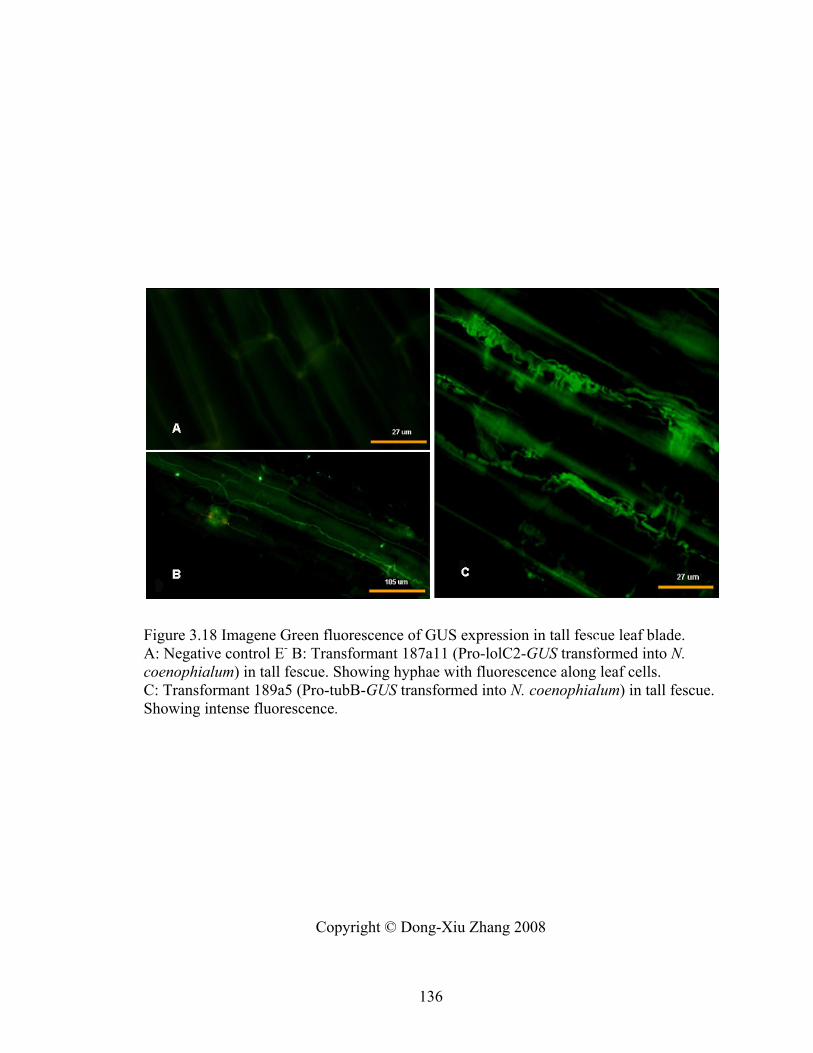
136
Figure 3.18 Imagene Green fluorescence of GUS expression in tall fescue leaf blade. A: Negative control E- B: Transformant 187a11 (Pro-lolC2-GUS transformed into N. coenophialum) in tall fescue. Showing hyphae with fluorescence along leaf cells. C: Transformant 189a5 (Pro-tubB-GUS transformed into N. coenophialum) in tall fescue. Showing intense fluorescence.
Copyright © Dong-Xiu Zhang 2008
27um
137
CHAPTER 4
Vector Construction for Selection of Fungal Transformants
Followed by Selective Marker Deletion
INTRODUCTION
Neotyphodium species are fungal endophytes of grasses, many of which produce
alkaloids (e.g., loline and ergot alkaloids) that are toxic to insects or livestock. To test the
function of genes predicted to be responsible for alkaloid production or generate toxin-
free endophytes for agricultural application, these genes may be experimentally deleted
(“knocked out”) (Wang et al 2004); (Tanaka et al 2005). For these genetic tests with
Neotyphodium endophytes, after successfully knocking out a gene, it may be desirable to
eliminate the marker gene conferring antibiotic resistance used to select for fungal
transformants. This may be required to address environmental biosafety concerns of the
use of toxin-free endophytes carrying an antibiotic-resistance gene, such as hygromycin
B phosphotransferase (Wang et al 2004) in its genome, or to be able to use the same
marker in serial gene knockouts to delete genes that have several copies in the endophyte
genome, such as the loline genes (Spiering et al 2005b). In this chapter, I describe
construction of a cassette called “creblelox” for this purpose. This cassette contains two
genes, cre and ble, flanked with loxP sites; cre encodes a recombinase that binds to the
loxP sites and excises sequences flanked by these loxP sites (Gueldener et al 2002), and
ble is a phleomycin-resistance marker for fungal transformant selection. A constitutive
fungal promoter (Pro-tubB) drives expression of ble, and cre was cloned downstream of
the N. uncinatum lolC2 promoter.
The lolC gene is involved in loline alkaloid biosynthesis, and expressed in
symbiota or minimal medium (MM), but not in complex medium cultures (Spiering et al
2005b). The lolC2 promoter (Pro-lolC2) has been used successfully to drive expression
of a lolC RNAi construct transformed into N. uncinatum, resulting in reduced lolC
mRNA (Spiering et al 2005b). When the GUS reporter gene was fused downstream of
Pro-lolC2 and transformed into N. uncinatum, GUS transcripts were detectable in MM
138
culture even though GUS activity was very low; in addition, an N. coenophialum
transformant with the Pro-lolC2-GUS transgene showed GUS expression in its host, tall
fescue (Chapter 3). Therefore, I hypothesized that Pro-lolC2 would be an inducible
promoter to drive gene expression outside the LOL clusters of N. uncinatum in MM
culture and symbiota, or of N. coenophialum in symbiota.
The hypothesis is that Pro-lolC2 would drive cre in the creblelox cassette under
inducible conditions. creblelox N. uncinatum transformants were expected to express Cre
from the lolC promoter only in MM or in symbiota, and N. coenophialum transformants
would express Cre only in symbiota. An N. uncinatum lolP1 knockout (lolP1ko)
transformant or lolP1 ectopic (lolP1ec) transformant, both of which contain a loxP-
flanked hygromycin-resistance gene (hph) in the genome (Spiering, Schardl et al,
unpublished data), would be transformed with creblelox and selected with phleomycin on
complex medium. The prediction is that Cre will excise the three exogenous genes, hph,
ble, and cre, when the transformants are cultured in MM or inoculated into plant inducing
Cre expression from the Pro-lolC2 inducible promoter.
139
MATERIALS AND METHODS
Enzymes, primers, DNA quantification, and thermocycler machine
All restriction enzymes were from New England BioLabs Inc. Primers were
bought from IDT (Coraville, IA, USA) and are listed in table 4.1. Hoefer DyNA Quant
200 (Amersham Pharmacia Biotech) or Qubit fluorometer (Kingston, ON, Canada) was
used for DNA concentration measurement. PCR was performed on GeneAmp PCR
System 2400 thermocycler (Perkin-Elmer, Boston, USA) with the same reaction
conditions as described in chapter 2.
Bacterial transformation by electroporation
Escherichia coli XL1-Blue competent cells (Stratagene, La Jolla, USA) (50 µl) or
DH 10B ElectroMax competent cells (20 µl) (Invitrogen), and 1 µl solution of of plasmid
or ligated DNA was used in each electroporation transformation under conditions of 17-
20 kV/cm, 200 Ω, 25 µF capacitance. SOC medium (950 µl) at room temperature (RT) or
preheated to 37°C was added to the transformed cells immediately after electroporation,
and cells were incubated for 1 h at 37°C. Cells were then spread on LB agar with 50
µg/ml ampicillin, and cultured at 37°C overnight. Single colonies were selected and
cultured in LB broth (1 g Bacto-tryptone, 0.5g Bacto-yeast extract, 1 g NaCl, in 100 ml
water, pH 7.0 with 1N NaOH) with 50 µg/ml ampicillin and shaken ~200 rpm at 37 °C
for less than 16 h. Plasmid DNA was extracted from the E. coli cell culture by using the
Qiaprep Spin Miniprep Kit (Qiagen Inc, Valencia, CA, USA) according to the
manufacture’s protocol.
Fungal DNA extraction
Fungal DNA extraction was carried out by the method described by Al-Samarrai
& Schmid (2000) with modifications: A small piece of fungal colony (approx. 3 mm2)
was placed into a 1.5 ml microcentrifuge tube, to which was added 300 µl 1x lysis buffer
and the colony ground with a micropestle. The suspension was incubated at 65°C for 30-
45 min, after which 100 µl 5 M NaCl was added and the solution briefly vortexed. After
centrifugation at 13,000 x g for 10 min, the supernatant was removed to a new 1.5-ml
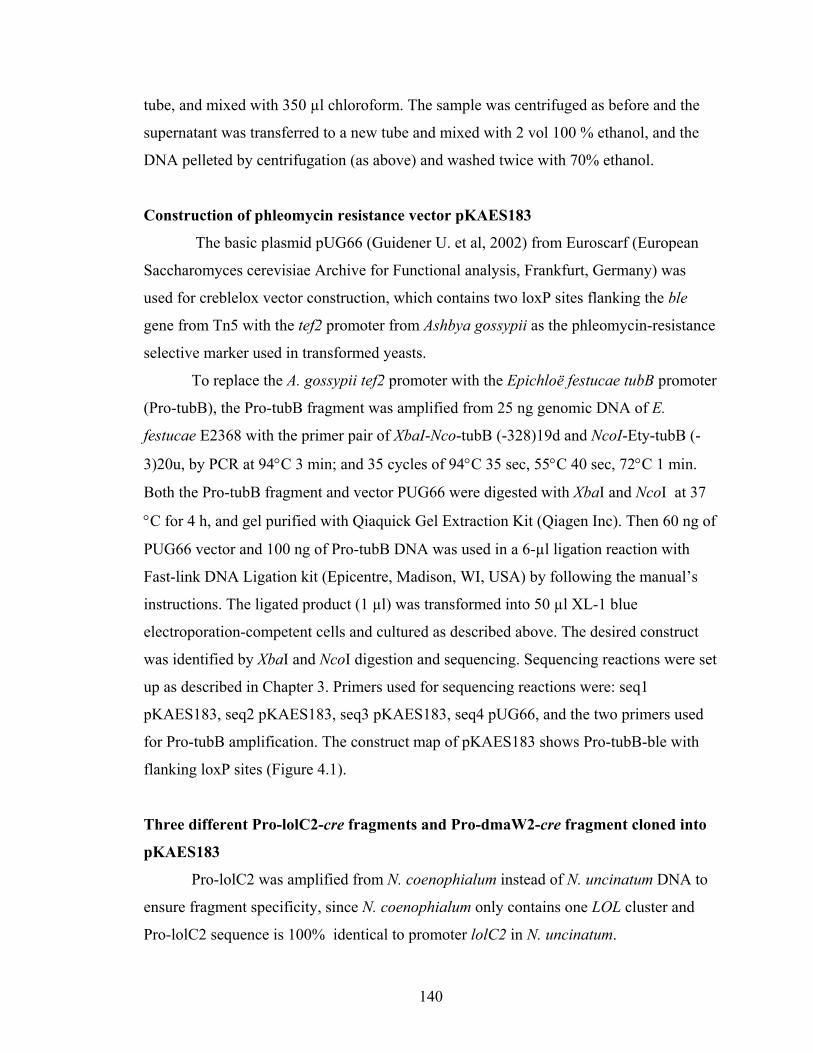
140
tube, and mixed with 350 µl chloroform. The sample was centrifuged as before and the
supernatant was transferred to a new tube and mixed with 2 vol 100 % ethanol, and the
DNA pelleted by centrifugation (as above) and washed twice with 70% ethanol.
Construction of phleomycin resistance vector pKAES183
The basic plasmid pUG66 (Guidener U. et al, 2002) from Euroscarf (European
Saccharomyces cerevisiae Archive for Functional analysis, Frankfurt, Germany) was
used for creblelox vector construction, which contains two loxP sites flanking the ble
gene from Tn5 with the tef2 promoter from Ashbya gossypii as the phleomycin-resistance
selective marker used in transformed yeasts.
To replace the A. gossypii tef2 promoter with the Epichloë festucae tubB promoter
(Pro-tubB), the Pro-tubB fragment was amplified from 25 ng genomic DNA of E.
festucae E2368 with the primer pair of XbaI-Nco-tubB (-328)19d and NcoI-Ety-tubB (-
3)20u, by PCR at 94°C 3 min; and 35 cycles of 94°C 35 sec, 55°C 40 sec, 72°C 1 min.
Both the Pro-tubB fragment and vector PUG66 were digested with XbaI and NcoI at 37
°C for 4 h, and gel purified with Qiaquick Gel Extraction Kit (Qiagen Inc). Then 60 ng of
PUG66 vector and 100 ng of Pro-tubB DNA was used in a 6-µl ligation reaction with
Fast-link DNA Ligation kit (Epicentre, Madison, WI, USA) by following the manual’s
instructions. The ligated product (1 µl) was transformed into 50 µl XL-1 blue
electroporation-competent cells and cultured as described above. The desired construct
was identified by XbaI and NcoI digestion and sequencing. Sequencing reactions were set
up as described in Chapter 3. Primers used for sequencing reactions were: seq1
pKAES183, seq2 pKAES183, seq3 pKAES183, seq4 pUG66, and the two primers used
for Pro-tubB amplification. The construct map of pKAES183 shows Pro-tubB-ble with
flanking loxP sites (Figure 4.1).
Three different Pro-lolC2-cre fragments and Pro-dmaW2-cre fragment cloned into
pKAES183
Pro-lolC2 was amplified from N. coenophialum instead of N. uncinatum DNA to
ensure fragment specificity, since N. coenophialum only contains one LOL cluster and
Pro-lolC2 sequence is 100% identical to promoter lolC2 in N. uncinatum.
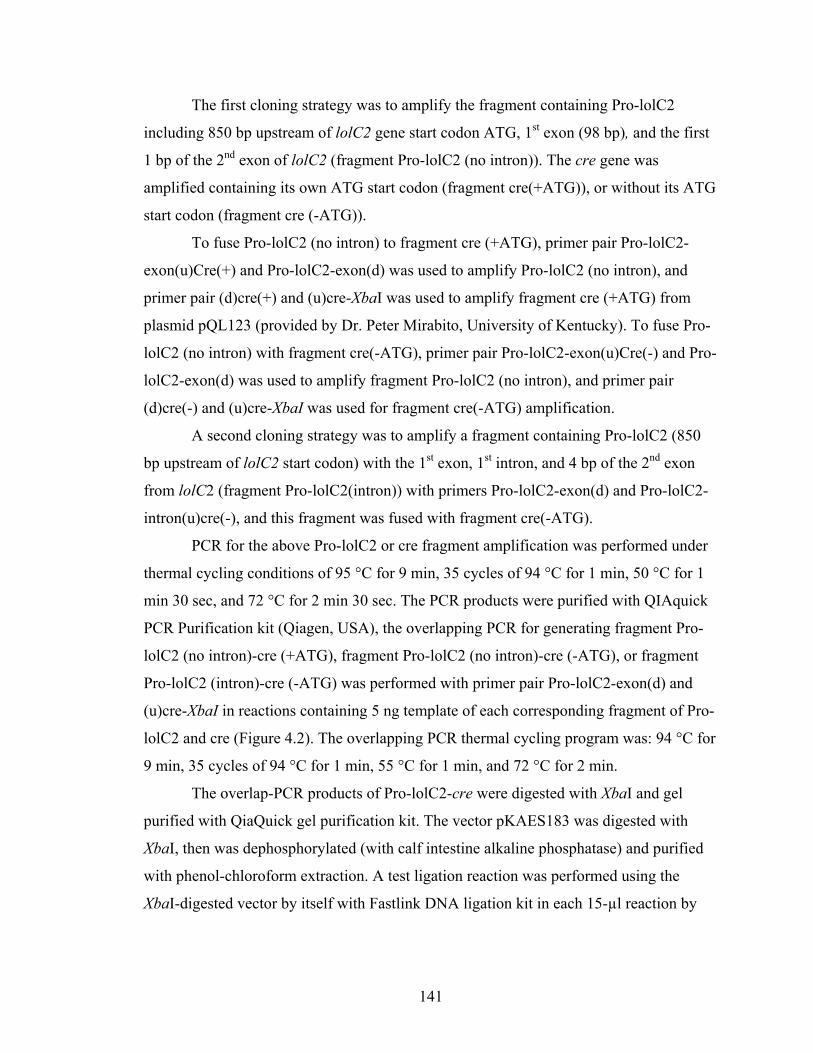
141
The first cloning strategy was to amplify the fragment containing Pro-lolC2
including 850 bp upstream of lolC2 gene start codon ATG, 1st exon (98 bp), and the first
1 bp of the 2nd exon of lolC2 (fragment Pro-lolC2 (no intron)). The cre gene was
amplified containing its own ATG start codon (fragment cre(+ATG)), or without its ATG
start codon (fragment cre (-ATG)).
To fuse Pro-lolC2 (no intron) to fragment cre (+ATG), primer pair Pro-lolC2-
exon(u)Cre(+) and Pro-lolC2-exon(d) was used to amplify Pro-lolC2 (no intron), and
primer pair (d)cre(+) and (u)cre-XbaI was used to amplify fragment cre (+ATG) from
plasmid pQL123 (provided by Dr. Peter Mirabito, University of Kentucky). To fuse Pro-
lolC2 (no intron) with fragment cre(-ATG), primer pair Pro-lolC2-exon(u)Cre(-) and Pro-
lolC2-exon(d) was used to amplify fragment Pro-lolC2 (no intron), and primer pair
(d)cre(-) and (u)cre-XbaI was used for fragment cre(-ATG) amplification.
A second cloning strategy was to amplify a fragment containing Pro-lolC2 (850
bp upstream of lolC2 start codon) with the 1st exon, 1st intron, and 4 bp of the 2nd exon
from lolC2 (fragment Pro-lolC2(intron)) with primers Pro-lolC2-exon(d) and Pro-lolC2-
intron(u)cre(-), and this fragment was fused with fragment cre(-ATG).
PCR for the above Pro-lolC2 or cre fragment amplification was performed under
thermal cycling conditions of 95 °C for 9 min, 35 cycles of 94 °C for 1 min, 50 °C for 1
min 30 sec, and 72 °C for 2 min 30 sec. The PCR products were purified with QIAquick
PCR Purification kit (Qiagen, USA), the overlapping PCR for generating fragment Pro-
lolC2 (no intron)-cre (+ATG), fragment Pro-lolC2 (no intron)-cre (-ATG), or fragment
Pro-lolC2 (intron)-cre (-ATG) was performed with primer pair Pro-lolC2-exon(d) and
(u)cre-XbaI in reactions containing 5 ng template of each corresponding fragment of Pro-
lolC2 and cre (Figure 4.2). The overlapping PCR thermal cycling program was: 94 °C for
9 min, 35 cycles of 94 °C for 1 min, 55 °C for 1 min, and 72 °C for 2 min.
The overlap-PCR products of Pro-lolC2-cre were digested with XbaI and gel
purified with QiaQuick gel purification kit. The vector pKAES183 was digested with
XbaI, then was dephosphorylated (with calf intestine alkaline phosphatase) and purified
with phenol-chloroform extraction. A test ligation reaction was performed using the
XbaI-digested vector by itself with Fastlink DNA ligation kit in each 15-µl reaction by
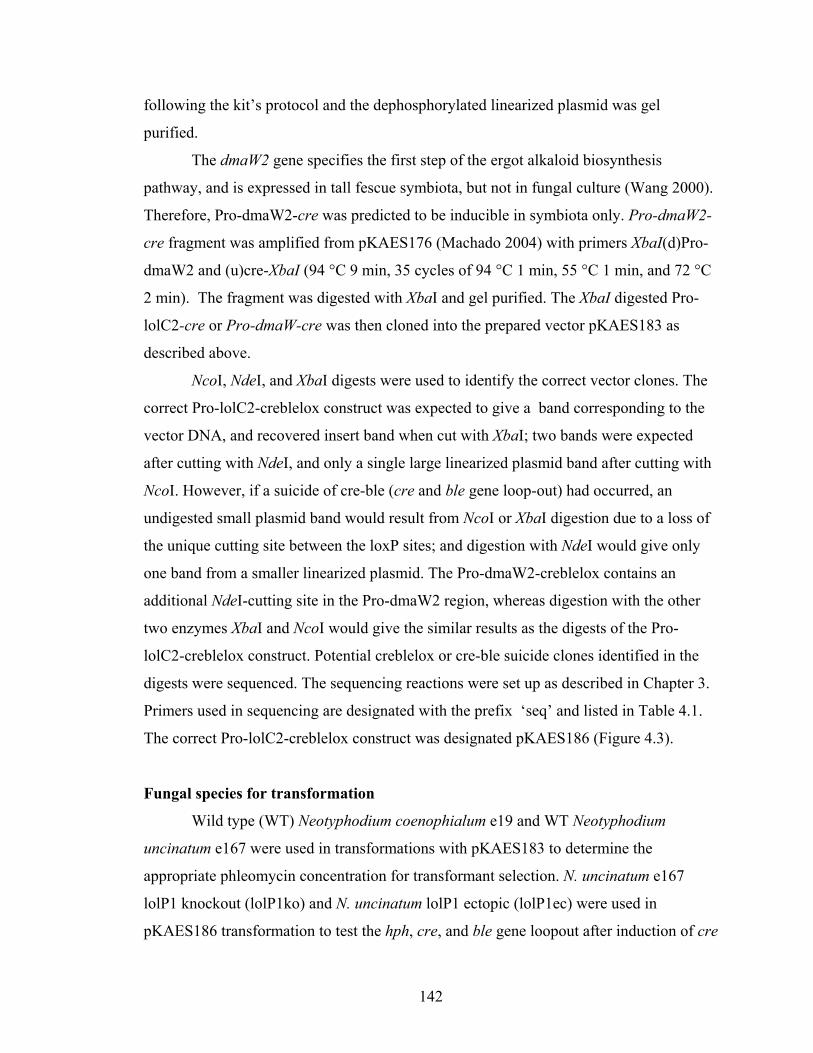
142
following the kit’s protocol and the dephosphorylated linearized plasmid was gel
purified.
The dmaW2 gene specifies the first step of the ergot alkaloid biosynthesis
pathway, and is expressed in tall fescue symbiota, but not in fungal culture (Wang 2000).
Therefore, Pro-dmaW2-cre was predicted to be inducible in symbiota only. Pro-dmaW2-
cre fragment was amplified from pKAES176 (Machado 2004) with primers XbaI(d)Pro-
dmaW2 and (u)cre-XbaI (94 °C 9 min, 35 cycles of 94 °C 1 min, 55 °C 1 min, and 72 °C
2 min). The fragment was digested with XbaI and gel purified. The XbaI digested Pro-
lolC2-cre or Pro-dmaW-cre was then cloned into the prepared vector pKAES183 as
described above.
NcoI, NdeI, and XbaI digests were used to identify the correct vector clones. The
correct Pro-lolC2-creblelox construct was expected to give a band corresponding to the
vector DNA, and recovered insert band when cut with XbaI; two bands were expected
after cutting with NdeI, and only a single large linearized plasmid band after cutting with
NcoI. However, if a suicide of cre-ble (cre and ble gene loop-out) had occurred, an
undigested small plasmid band would result from NcoI or XbaI digestion due to a loss of
the unique cutting site between the loxP sites; and digestion with NdeI would give only
one band from a smaller linearized plasmid. The Pro-dmaW2-creblelox contains an
additional NdeI-cutting site in the Pro-dmaW2 region, whereas digestion with the other
two enzymes XbaI and NcoI would give the similar results as the digests of the Pro-
lolC2-creblelox construct. Potential creblelox or cre-ble suicide clones identified in the
digests were sequenced. The sequencing reactions were set up as described in Chapter 3.
Primers used in sequencing are designated with the prefix ‘seq’ and listed in Table 4.1.
The correct Pro-lolC2-creblelox construct was designated pKAES186 (Figure 4.3).
Fungal species for transformation
Wild type (WT) Neotyphodium coenophialum e19 and WT Neotyphodium
uncinatum e167 were used in transformations with pKAES183 to determine the
appropriate phleomycin concentration for transformant selection. N. uncinatum e167
lolP1 knockout (lolP1ko) and N. uncinatum lolP1 ectopic (lolP1ec) were used in
pKAES186 transformation to test the hph, cre, and ble gene loopout after induction of cre
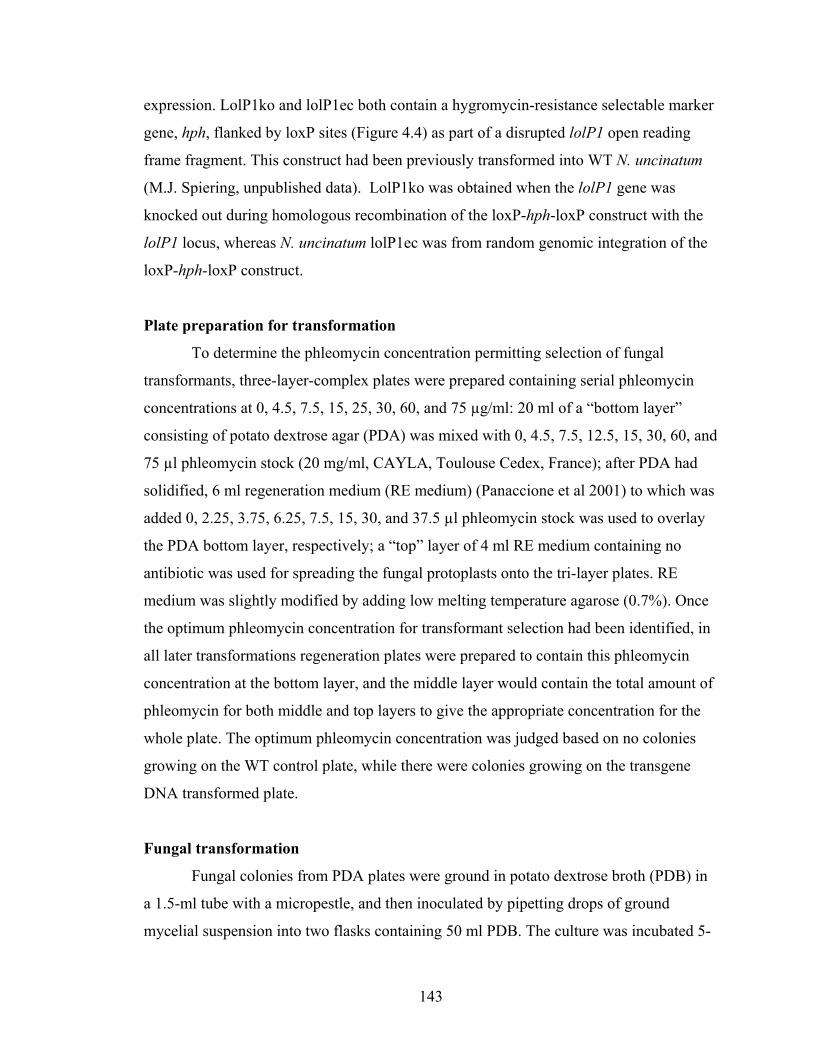
143
expression. LolP1ko and lolP1ec both contain a hygromycin-resistance selectable marker
gene, hph, flanked by loxP sites (Figure 4.4) as part of a disrupted lolP1 open reading
frame fragment. This construct had been previously transformed into WT N. uncinatum
(M.J. Spiering, unpublished data). LolP1ko was obtained when the lolP1 gene was
knocked out during homologous recombination of the loxP-hph-loxP construct with the
lolP1 locus, whereas N. uncinatum lolP1ec was from random genomic integration of the
loxP-hph-loxP construct.
Plate preparation for transformation
To determine the phleomycin concentration permitting selection of fungal
transformants, three-layer-complex plates were prepared containing serial phleomycin
concentrations at 0, 4.5, 7.5, 15, 25, 30, 60, and 75 µg/ml: 20 ml of a “bottom layer”
consisting of potato dextrose agar (PDA) was mixed with 0, 4.5, 7.5, 12.5, 15, 30, 60, and
75 µl phleomycin stock (20 mg/ml, CAYLA, Toulouse Cedex, France); after PDA had
solidified, 6 ml regeneration medium (RE medium) (Panaccione et al 2001) to which was
added 0, 2.25, 3.75, 6.25, 7.5, 15, 30, and 37.5 µl phleomycin stock was used to overlay
the PDA bottom layer, respectively; a “top” layer of 4 ml RE medium containing no
antibiotic was used for spreading the fungal protoplasts onto the tri-layer plates. RE
medium was slightly modified by adding low melting temperature agarose (0.7%). Once
the optimum phleomycin concentration for transformant selection had been identified, in
all later transformations regeneration plates were prepared to contain this phleomycin
concentration at the bottom layer, and the middle layer would contain the total amount of
phleomycin for both middle and top layers to give the appropriate concentration for the
whole plate. The optimum phleomycin concentration was judged based on no colonies
growing on the WT control plate, while there were colonies growing on the transgene
DNA transformed plate.
Fungal transformation
Fungal colonies from PDA plates were ground in potato dextrose broth (PDB) in
a 1.5-ml tube with a micropestle, and then inoculated by pipetting drops of ground
mycelial suspension into two flasks containing 50 ml PDB. The culture was incubated 5-
144
15 days with shaking 200 rpm at 22°C. The mycelia were harvested in 50 ml sterile
plastic tubes by centrifugation at 5530 x g for 20 min. Osmotic medium was filter-
sterilized through 22 µm sterile flip filter and was mixed with the following enzymes
(Novo Industri AS, Bagsvaerd, Denmark) in 15 ml milliQ purified H2O: 100 mg β-D-
glucanase, 75 mg Glucanex, 100 mg Driselase, 15 mg Zymicase I, and 50 mg bovine
serum albumin. The mycelial pellet was then treated with 15 ml osmotic medium
containing the above enzymes for 2-3 hours at 30°C on a 45-100 rpm horizontal shaker to
digest the fungal cell wall. The protoplast isolation procedure was performed as described
by (Murray et al 1992). The protoplasts were re-suspended in a volume of STC (1M
sorbitol, 0.1M Tris-Cl pH 7.4, and 50 mM CaCl2) to obtain the optimum protoplast
concentration of more than 5x10⁶ protoplasts in 100 µl. Each 80 µl protoplast suspension
was transformed by electroporation (Tsai et al 1992) with plasmid DNA (3-8 µg), and
then spread with 4 ml regeneration medium on the regeneration plates as described
above.
The plates were kept upside down at 20 °C for approx. 3 weeks to allow
transformants to grow into colonies. The colonies were then single-spore isolated for
three times onto new PDA plates with phleomycin. Transformants of pKAES183 into N.
coenophialum e19 and wild type N. coenophialum e19 were both cultured on PDA plates
containing 7.5, 15, 25, 30, 40, 50, 60, and 70 µg/ml phleomycin to assess the difference
in survival. Otherwise, normally the new PDA plate for transformants contained the same
selective concentration of phleomycin as that used in RE medium for transformation.
Screening transformants by PCR
PCR analysis of Pro-tubB and the ble gene was used to screen pKAES183
transformants. The Pro-tubB DNA fragment was amplified with the same set of primers
used in cloning, and ble gene was amplified with primers seq1 pKAES183 and seq15 out
ble(u). pKAES186 transformants were confirmed by cre gene amplification with primer
pair (d)cre(-) and (u)cre-XbaI. PCR was performed with the following conditions: 94 °C
for 9 min, then 35 cycles of 94 °C for 1 min, 56 °C for 30 sec, and 72 °C for 1 min 20
sec. Amplification of a tubB gene fragment with primer pair Ety-tubB(-6+)20d and Ety-
145
tubB(969-19)20u was applied as positive control PCR for transformant DNA (Figure
4.5).
Screening for hph, ble, and cre loop-outs
Each single spore-isolated colony of lolP1ko or lolP1ec creblelox transformants
(186bk or 186be) was first cultured in MM (Blankenship et al 2001) for more than 20
days with 100 rpm shaking at RT. Then small mycelial balls or 2-5 µl of MM culture was
transferred onto PDA plates. After growth for approx. one month, each colony was
divided into four pieces and cultured on four different antibiotic PDA plates: one with
only phleomycin at the selective concentration; one with hygromycin; another one with
both antibiotics; and one without any antibiotics. After one month incubation at 22 °C,
differential fungal growth on the antibiotic-containing or antibiotic-free plates was used
to screen for potential gene loop outs.
Genomic DNA was extracted as before (see above) from the fungal colonies on
antibiotic-free PDA plates and used in PCR with primers lolP1 5-3 check loop2 and lolP1
3-5 check loop2 to screen potential hph gene loop-outs with PCR conditions of 95 °C for
9 min, then 35 cycles of 95 °C for 30 sec, 56 °C for 30 sec, and 72 °C for 2 min. The
expected PCR hph-loop-out fragment would be 576 bp long compared to a non-loop-out
band of 1945 bp. The presence of hph was checked further by PCR with primers hph5-
3seq and hph3-5seq.
PCR with primer pair outloxp1fwd and outloxp2rev was used to amplify the
creblelox cassette or cre-ble loop-out fragments from pKAES186 transformants. PCR
was performed with Takara La PCR kit (Takara Bio USA Inc.) under thermal cycling
conditions: 94 °C for 1 min, then 40 cycles of 94 °C for 30 sec, 58 °C for 20 sec, and 72
°C for 4 min. The PCR products were all sequenced. The creblelox cassette fragment was
gel purified and sequenced after first cloning into PCR 2.1-TOPO vector (Invitrogen,
USA) by following the manufacture’s instructions. The gel-purified fragment (approx. 3
kb) was also used as DNA template in PCR reactions to check for the two loxP sites
(loxP1 and loxP2) sites, cre, and Pro-lolC2, by using primer pairs (d)cre(-) with
outloxp1fwd, outloxp2rev with seq16p183protubB(d), (d)cre(-) with (u)cre(-)XbaI, and
Pro-lolC2-intron(u)Cre(-) with Pro-lolC2-exon(d), respectively, using thermocycling
146
conditions of 95 °C 9 min, 35 cycles of 95 °C 30 sec, 56 °C 30 sec, and 72 °C 1 min 20
sec. The PCR product sizes were analyzed by agarose gel electrophoresis, and the PCR
products were gel purified and sequenced as described (Chapter 2) with each of the
primers used for the fragment amplification.
Inoculation of hph loop-out transformant to meadow fescue
Inoculation of grass seedlings with fungal mycelium was carried as described in
Chapter 3. After immunoblot check for endophyte infection, total plant and fungal DNA
was extracted from plant tissues (approx. 100 mg) by using the same protocol as used for
fungal DNA colony extraction as described above. PCR for hph gene, hph loopout, and
cre gene was performed to check the status of selection marker gene or cre gene loop out.
147
RESULTS
Cre expression in bacterial cloning
During bacterial cloning, when a Pro-lolC2 (no intron) fragment was fused with
cre (+ATG) and introduced into loxP sites in pKAES183, the cre and ble gene was
looped out, and only one loxP site remained. Similar results were obtained with a loxP-
Pro-dmaW2-cre fragment in pKAES183. XbaI and NcoI digestion of both plasmids
clones gave only uncut bands (Figure 4.6) and looping out cre-ble was confirmed by
sequencing several of the plasmids (S1, S3, and S4) as shown in Figure 4.6. It is not
known whether Pro-lolC2 (no intron)-cre (-ATG) fusion also would cause cre-ble loss in
bacterial cloning since no appropriate clone or cre-ble loss was found. S5 and S6 in
Figure 4.6 were sequenced, but they were found not to be the expected constructs. No
cre-ble loss was observed during bacterial cloning of pKAES186, in which the fragment
Pro-lolC2 (with intron) was fused to cre (-ATG) and cloned into loxP sites in pKAES183.
However, when the entire loxP-cre-ble-loxP fragment was PCR amplified and used for
cloning into TOPO vector, sequencing data from eight bacterial clones showed cre-ble
loss in all of them.
Phleomycin concentration for transformant selection
The optimum phleomycin concentration for transformant selection on
regeneration medium was identified at 15 µg/ml for N. coenophialum transformation by
transforming pKAES183 into N. coenophialum. The optimum concentration for N.
uncinatum transformant selection was established during pKAES186 transformation at 25
µg/ml. However, in single-spore isolation subcultures, both transformants could grow at
75 µg/ml, whereas the respective wild types barely survived above 25 µg/ml. In total, 20
pKAES183 N. coenophialum transformants were obtained; 28 transformants were from
pKAES186 transformed into N.uncinatum lolP1ec (186be1-28); and one was recovered
from pKAES186 transformed into N. uncinatum lolP1ko (186bk1).
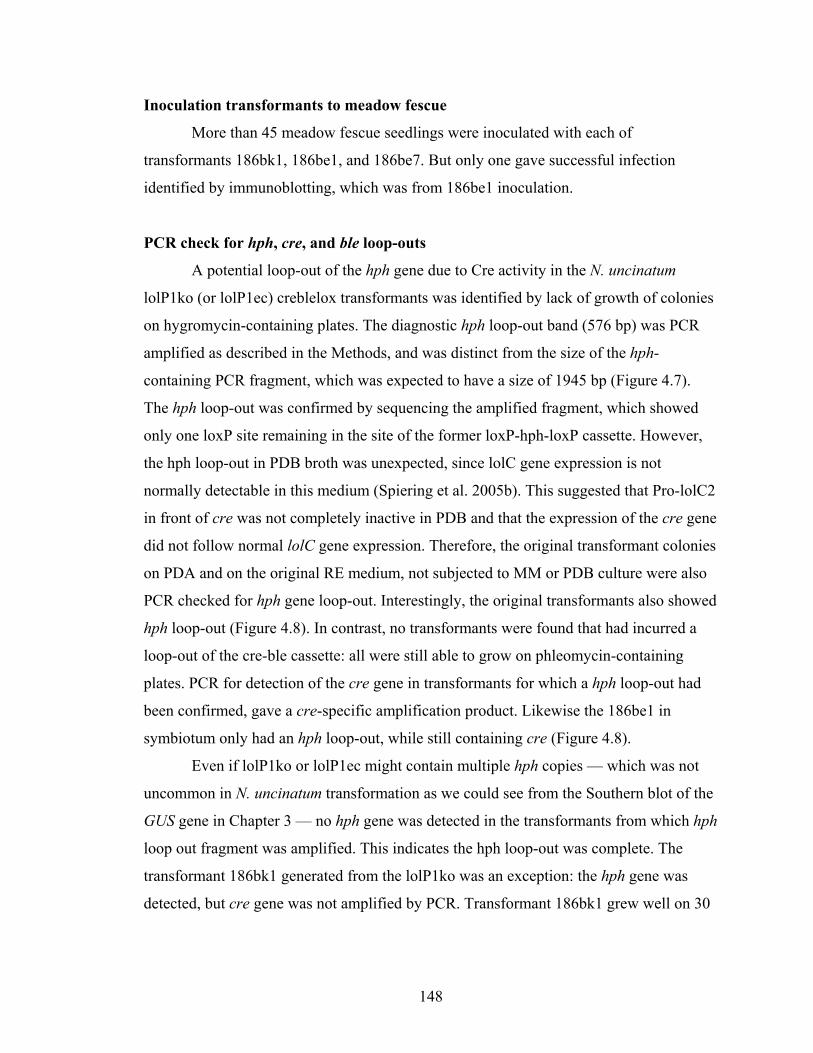
148
Inoculation transformants to meadow fescue
More than 45 meadow fescue seedlings were inoculated with each of
transformants 186bk1, 186be1, and 186be7. But only one gave successful infection
identified by immunoblotting, which was from 186be1 inoculation.
PCR check for hph, cre, and ble loop-outs
A potential loop-out of the hph gene due to Cre activity in the N. uncinatum
lolP1ko (or lolP1ec) creblelox transformants was identified by lack of growth of colonies
on hygromycin-containing plates. The diagnostic hph loop-out band (576 bp) was PCR
amplified as described in the Methods, and was distinct from the size of the hph-
containing PCR fragment, which was expected to have a size of 1945 bp (Figure 4.7).
The hph loop-out was confirmed by sequencing the amplified fragment, which showed
only one loxP site remaining in the site of the former loxP-hph-loxP cassette. However,
the hph loop-out in PDB broth was unexpected, since lolC gene expression is not
normally detectable in this medium (Spiering et al. 2005b). This suggested that Pro-lolC2
in front of cre was not completely inactive in PDB and that the expression of the cre gene
did not follow normal lolC gene expression. Therefore, the original transformant colonies
on PDA and on the original RE medium, not subjected to MM or PDB culture were also
PCR checked for hph gene loop-out. Interestingly, the original transformants also showed
hph loop-out (Figure 4.8). In contrast, no transformants were found that had incurred a
loop-out of the cre-ble cassette: all were still able to grow on phleomycin-containing
plates. PCR for detection of the cre gene in transformants for which a hph loop-out had
been confirmed, gave a cre-specific amplification product. Likewise the 186be1 in
symbiotum only had an hph loop-out, while still containing cre (Figure 4.8).
Even if lolP1ko or lolP1ec might contain multiple hph copies — which was not
uncommon in N. uncinatum transformation as we could see from the Southern blot of the
GUS gene in Chapter 3 — no hph gene was detected in the transformants from which hph
loop out fragment was amplified. This indicates the hph loop-out was complete. The
transformant 186bk1 generated from the lolP1ko was an exception: the hph gene was
detected, but cre gene was not amplified by PCR. Transformant 186bk1 grew well on 30
149
µg/ml phleomycin (and 80 µg/ml hygromycin), suggesting ble gene activity in this
transformant.
Amplification of the whole loxP-cre-ble-loxP fragment
The entire loxP-cre-ble-loxP (approx. 3 kb) was amplifiable by PCR from only
one transformant, 186be1 containing an hph loop out, out of 8 tested transformants
(Figure 4.9). The two loxP sites, cre, and Pro-lolC2 could be amplified when this
fragment was used as template. The PCR products, which were expected to contain loxP
site1 and site2, were sequenced, and the result showed intact and correct loxP sequences.
The cre gene fragment was also confirmed by sequencing the PCR product.
150
DISCUSSION
These experiments showed that the loxP-flanked hph gene in creblelox
(pKAES186)-transformed N. uncinatum lolP1ec transformants was successfully looped
out in culture, although it was unknown at which subculture step the loop out occurred.
However, a successful cre-ble loop out was not found in any of the transformants tested,
even after introduction into plants. On PDA plates, similar results of hph loop out but
lacking cre-ble loop out were also obtained from N. coenophialum dmaW2 gene knock
out (dmaW2ko) with a loxP-flanked hph gene (Florea et al 2007) after transformation
with pKAES186.
The transformant 186bk1 (pKAES186 transformed into lolP1ko) contained the
hph gene and no detectable cre gene after extended culture. However, this transformant
remained resistant to phleomycin and also hygromycin. One possible reason is that this
transformant had acquired only a partial cre-ble fragment permitting ble gene expression
with only part of or no cre in its genome. Further checks would be needed to confirm this
idea, which is consistent with the observation that only one transformant tested, 186be1,
contained the entire cre-ble-lox cassette in its genome. Nevertheless, 186be1 also failed
to loop out cre and ble in culture or symbiosis. It is possible that cre-ble loop out will
take a long time till Cre accumulates to a certain level, and that my check for cre-ble loop
out was too early. However, hph was looped out quite quickly.
cre was placed downstream of pro-lolC2 sequence in hope that it would be
expressed similarly to lolC2. The observation that hph was looped out in cultures
growing on complex media indicated that cre was expressed in those cultural conditions;
however, lolC2 is poorly or not expressed in complex media (Spiering et al. 2002;
2005b). These results and observations described in Chapter 3 indicate that cre-ble
expression under the control of Pro-lolC2 differs from lolC gene expression in various
media. This contradicted to my original hypothesis that Pro-lolC2 should be an inducible
promoter in MM and in symbiota and a suppressible promoter in complex media (PDB or
PDA). Instead, cre seemed to be active in RE medium already and hph was already
looped out before transformants were subcultured to other media.
151
It remains a puzzle why Cre activity failed to loop out cre-ble between the loxP
sites. One possible interpretation is that all the transformants were selected based on
phleomycin resistance, requiring stable maintenance of cre-ble for growth and viability of
the transformants. This may select for clones deficient in looping out cre-ble or the ones
containing several and possibly partial cre-ble copies. cre-ble loop-out deficiency might
be due to various reasons, such as the integration site in the fungal genome, or other
epigenetic effects. For transformants with several cre-ble copies, even if there were some
cre-ble loop-outs, the cre gene would still be detectable from the remaining genomic
copies, and fungal transformants would still grow on phleomycin plates. Another
possibility is that the hph was looped out in RE medium very early on; possible cre
expression from the cre-ble construct in the fungal cell before incorporation into the
fungal genome may have led to high enough levels of Cre enzyme for looping out hph.
Then, genomic incorporation of the cre-ble into regions of low gene expression gave
stable phleomycin resistance. However, at this point there is no clear evidence for any of
these scenarios, and extensive further work, going beyond the aims of this study, would
be required to determine the exact sequence of events.
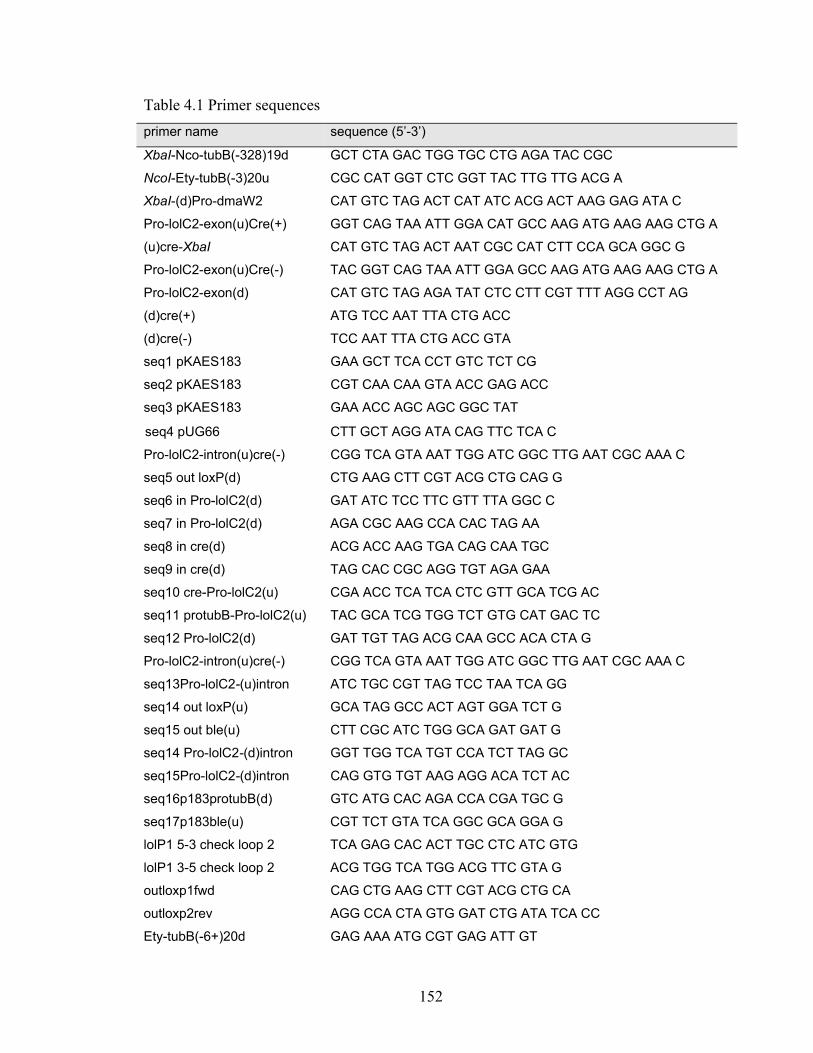
152
Table 4.1 Primer sequences primer name sequence (5’-3’)
XbaI-Nco-tubB(-328)19d GCT CTA GAC TGG TGC CTG AGA TAC CGC
NcoI-Ety-tubB(-3)20u CGC CAT GGT CTC GGT TAC TTG TTG ACG A
XbaI-(d)Pro-dmaW2 CAT GTC TAG ACT CAT ATC ACG ACT AAG GAG ATA C
Pro-lolC2-exon(u)Cre(+) GGT CAG TAA ATT GGA CAT GCC AAG ATG AAG AAG CTG A
(u)cre-XbaI CAT GTC TAG ACT AAT CGC CAT CTT CCA GCA GGC G
Pro-lolC2-exon(u)Cre(-) TAC GGT CAG TAA ATT GGA GCC AAG ATG AAG AAG CTG A
Pro-lolC2-exon(d) CAT GTC TAG AGA TAT CTC CTT CGT TTT AGG CCT AG
(d)cre(+) ATG TCC AAT TTA CTG ACC
(d)cre(-) TCC AAT TTA CTG ACC GTA
seq1 pKAES183 GAA GCT TCA CCT GTC TCT CG
seq2 pKAES183 CGT CAA CAA GTA ACC GAG ACC
seq3 pKAES183 GAA ACC AGC AGC GGC TAT
seq4 pUG66
CTT GCT AGG ATA CAG TTC TCA C
Pro-lolC2-intron(u)cre(-) CGG TCA GTA AAT TGG ATC GGC TTG AAT CGC AAA C
seq5 out loxP(d) CTG AAG CTT CGT ACG CTG CAG G
seq6 in Pro-lolC2(d) GAT ATC TCC TTC GTT TTA GGC C
seq7 in Pro-lolC2(d) AGA CGC AAG CCA CAC TAG AA
seq8 in cre(d) ACG ACC AAG TGA CAG CAA TGC
seq9 in cre(d) TAG CAC CGC AGG TGT AGA GAA
seq10 cre-Pro-lolC2(u) CGA ACC TCA TCA CTC GTT GCA TCG AC
seq11 protubB-Pro-lolC2(u) TAC GCA TCG TGG TCT GTG CAT GAC TC
seq12 Pro-lolC2(d) GAT TGT TAG ACG CAA GCC ACA CTA G
Pro-lolC2-intron(u)cre(-) CGG TCA GTA AAT TGG ATC GGC TTG AAT CGC AAA C
seq13Pro-lolC2-(u)intron ATC TGC CGT TAG TCC TAA TCA GG
seq14 out loxP(u) GCA TAG GCC ACT AGT GGA TCT G
seq15 out ble(u) CTT CGC ATC TGG GCA GAT GAT G
seq14 Pro-lolC2-(d)intron GGT TGG TCA TGT CCA TCT TAG GC
seq15Pro-lolC2-(d)intron CAG GTG TGT AAG AGG ACA TCT AC
seq16p183protubB(d) GTC ATG CAC AGA CCA CGA TGC G
seq17p183ble(u) CGT TCT GTA TCA GGC GCA GGA G
lolP1 5-3 check loop 2 TCA GAG CAC ACT TGC CTC ATC GTG
lolP1 3-5 check loop 2 ACG TGG TCA TGG ACG TTC GTA G
outloxp1fwd CAG CTG AAG CTT CGT ACG CTG CA
outloxp2rev AGG CCA CTA GTG GAT CTG ATA TCA CC
Ety-tubB(-6+)20d GAG AAA ATG CGT GAG ATT GT

153
primer name sequence (5’-3’)
Ety-tubB(969-19)20u GTT TCG TCC GAG TTC TCG AC
hph5-3seq GTT CAC CGC CAG ACT TG
hph3-5seq GGC AAA GGA ATA GGA TCG A
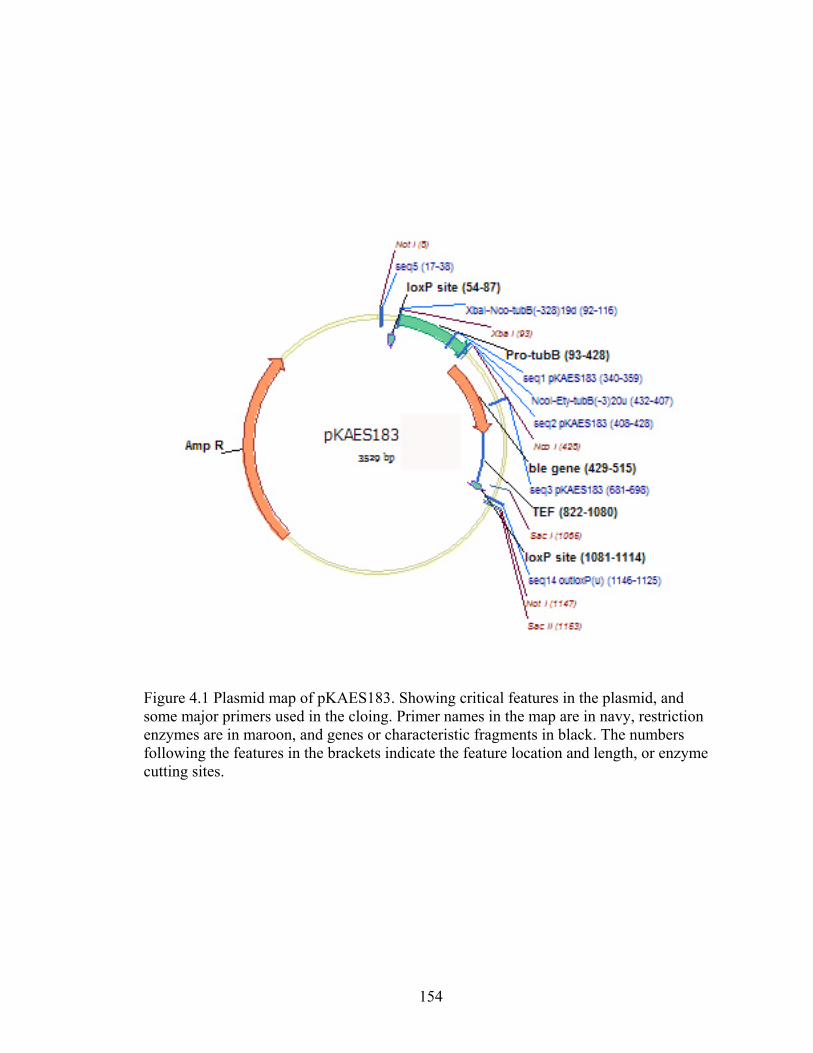
154
Figure 4.1 Plasmid map of pKAES183. Showing critical features in the plasmid, and some major primers used in the cloing. Primer names in the map are in navy, restriction enzymes are in maroon, and genes or characteristic fragments in black. The numbers following the features in the brackets indicate the feature location and length, or enzyme cutting sites.
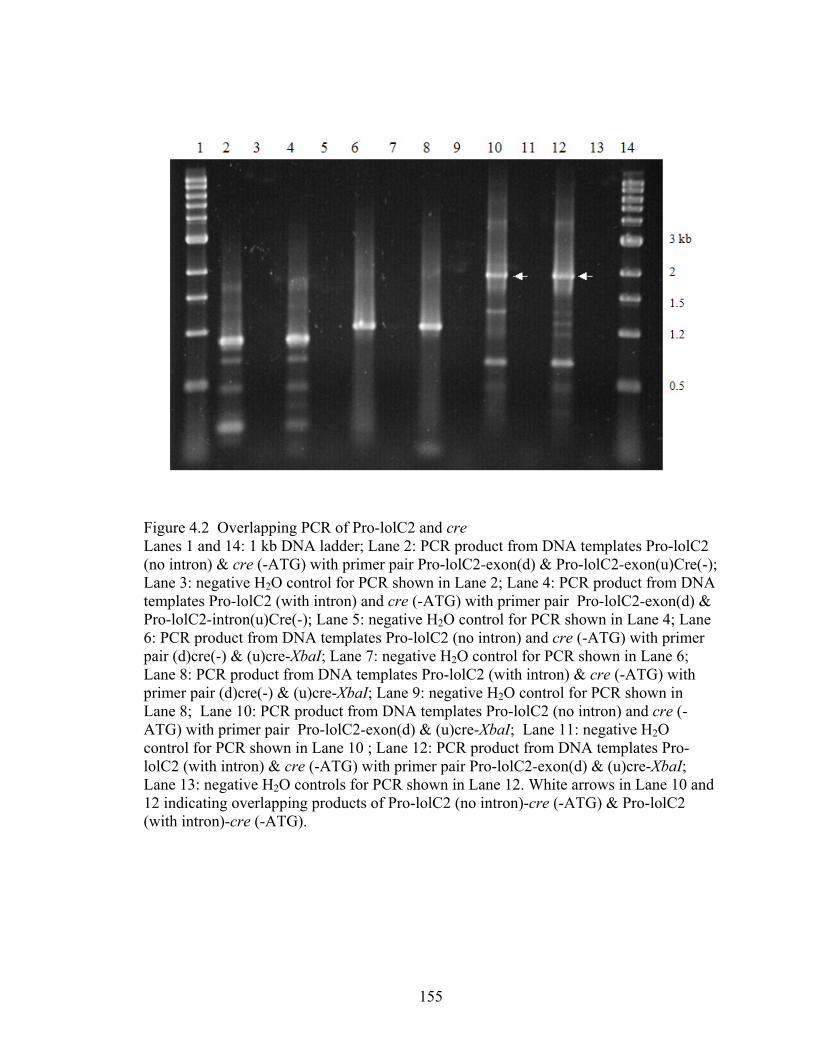
155
Figure 4.2 Overlapping PCR of Pro-lolC2 and cre Lanes 1 and 14: 1 kb DNA ladder; Lane 2: PCR product from DNA templates Pro-lolC2 (no intron) & cre (-ATG) with primer pair Pro-lolC2-exon(d) & Pro-lolC2-exon(u)Cre(-); Lane 3: negative H2O control for PCR shown in Lane 2; Lane 4: PCR product from DNA templates Pro-lolC2 (with intron) and cre (-ATG) with primer pair Pro-lolC2-exon(d) & Pro-lolC2-intron(u)Cre(-); Lane 5: negative H2O control for PCR shown in Lane 4; Lane 6: PCR product from DNA templates Pro-lolC2 (no intron) and cre (-ATG) with primer pair (d)cre(-) & (u)cre-XbaI; Lane 7: negative H2O control for PCR shown in Lane 6; Lane 8: PCR product from DNA templates Pro-lolC2 (with intron) & cre (-ATG) with primer pair (d)cre(-) & (u)cre-XbaI; Lane 9: negative H2O control for PCR shown in Lane 8; Lane 10: PCR product from DNA templates Pro-lolC2 (no intron) and cre (-ATG) with primer pair Pro-lolC2-exon(d) & (u)cre-XbaI; Lane 11: negative H2O control for PCR shown in Lane 10 ; Lane 12: PCR product from DNA templates Pro-lolC2 (with intron) & cre (-ATG) with primer pair Pro-lolC2-exon(d) & (u)cre-XbaI; Lane 13: negative H2O controls for PCR shown in Lane 12. White arrows in Lane 10 and 12 indicating overlapping products of Pro-lolC2 (no intron)-cre (-ATG) & Pro-lolC2 (with intron)-cre (-ATG).
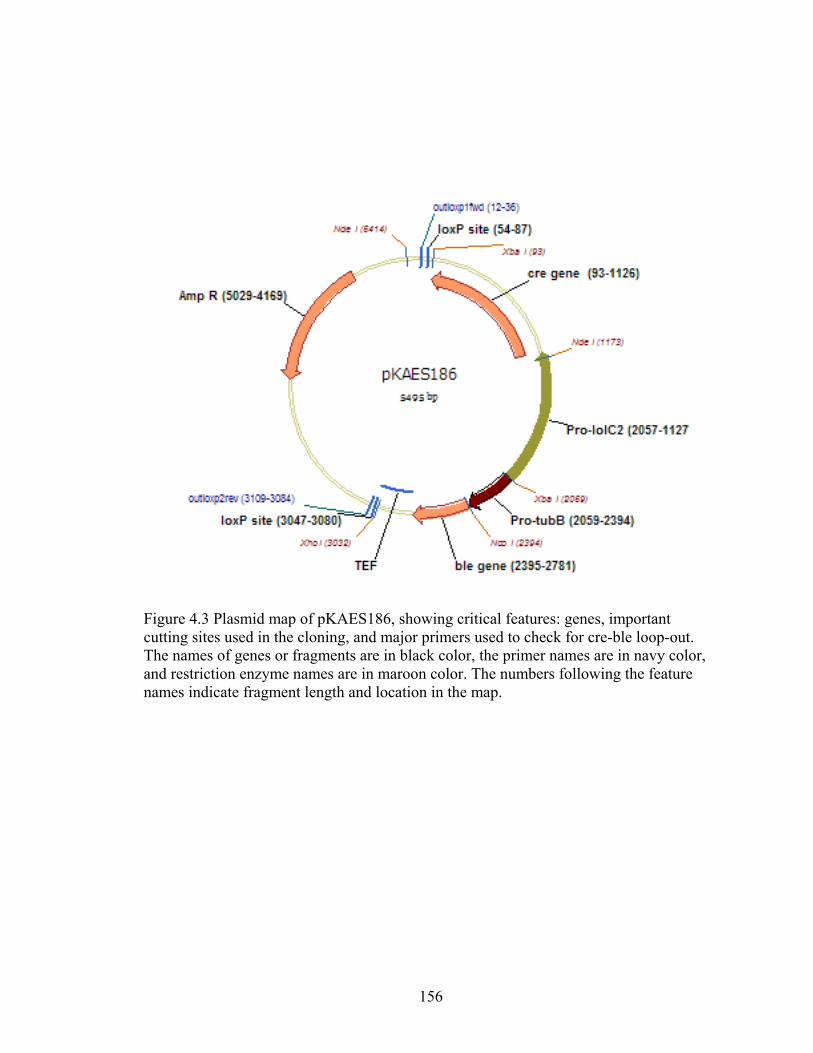
156
Figure 4.3 Plasmid map of pKAES186, showing critical features: genes, important cutting sites used in the cloning, and major primers used to check for cre-ble loop-out. The names of genes or fragments are in black color, the primer names are in navy color, and restriction enzyme names are in maroon color. The numbers following the feature names indicate fragment length and location in the map.
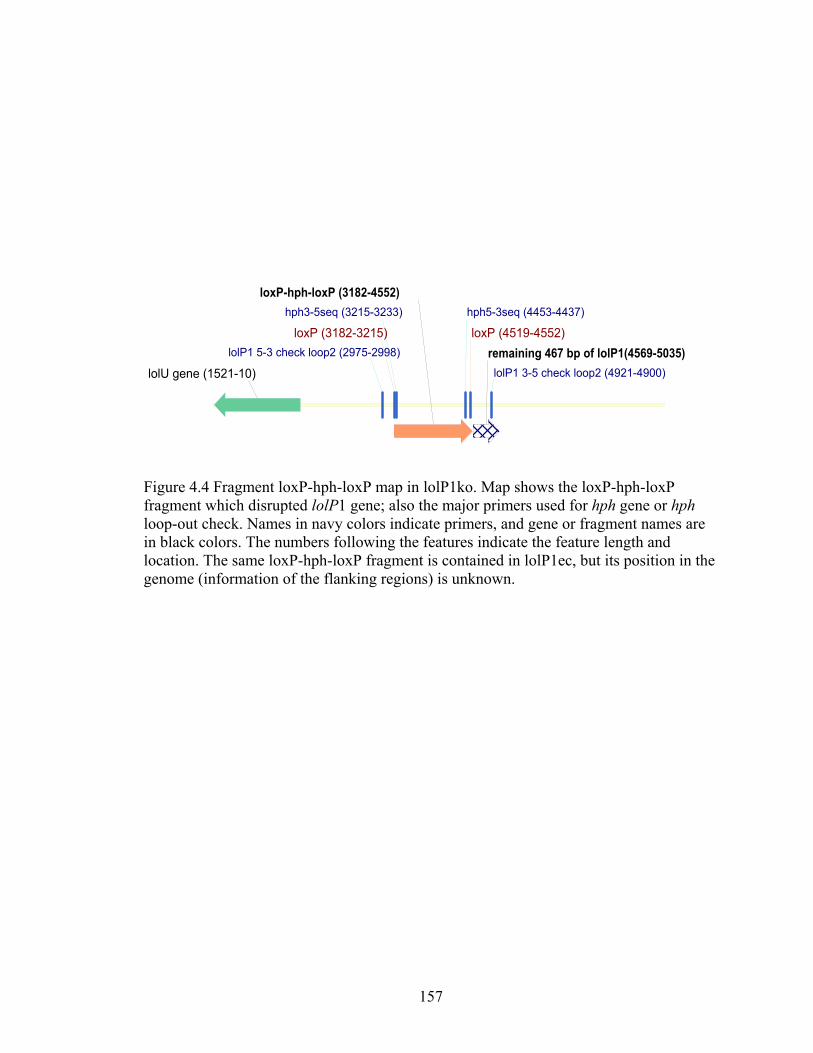
157
Figure 4.4 Fragment loxP-hph-loxP map in lolP1ko. Map shows the loxP-hph-loxP fragment which disrupted lolP1 gene; also the major primers used for hph gene or hph loop-out check. Names in navy colors indicate primers, and gene or fragment names are in black colors. The numbers following the features indicate the feature length and location. The same loxP-hph-loxP fragment is contained in lolP1ec, but its position in the genome (information of the flanking regions) is unknown.
loxP (3182-3215) loxP (4519-4552)lolP1 5-3 check loop2 (2975-2998)
lolP1 3-5 check loop2 (4921-4900)
hph5-3seq (4453-4437)hph3-5seq (3215-3233)loxP-hph-loxP (3182-4552)
remaining 467 bp of lolP1(4569-5035)lolU gene (1521-10)
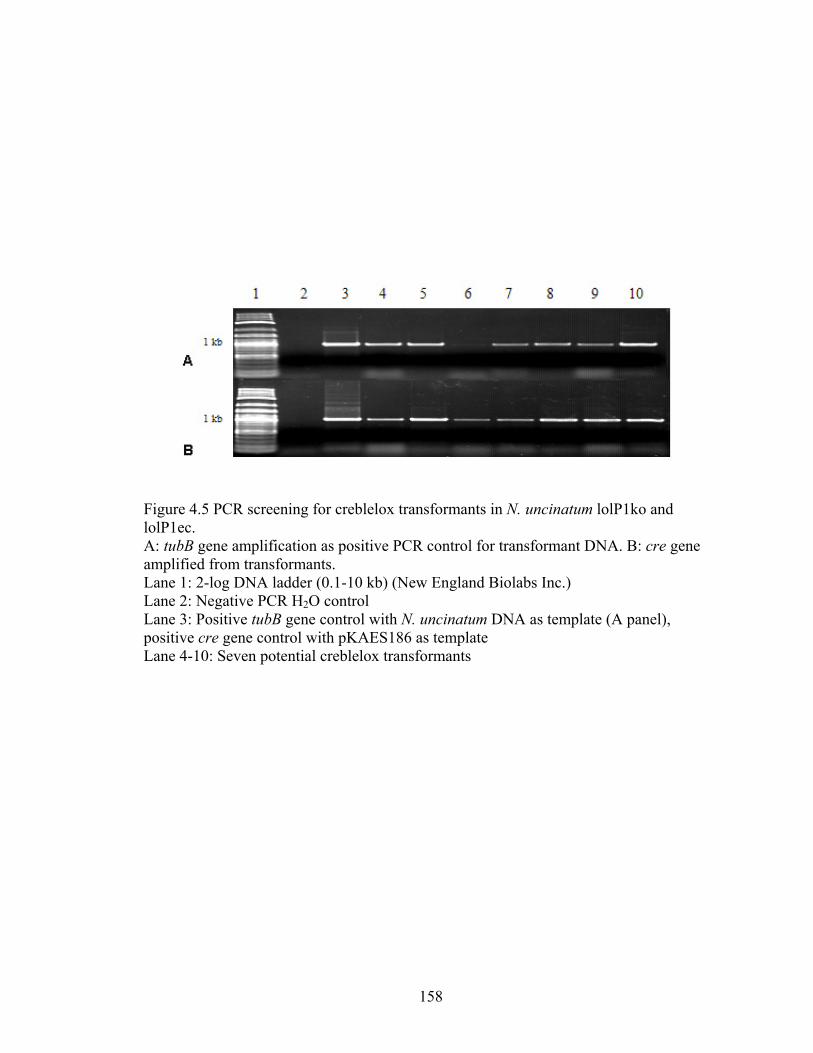
158
Figure 4.5 PCR screening for creblelox transformants in N. uncinatum lolP1ko and lolP1ec. A: tubB gene amplification as positive PCR control for transformant DNA. B: cre gene amplified from transformants. Lane 1: 2-log DNA ladder (0.1-10 kb) (New England Biolabs Inc.) Lane 2: Negative PCR H2O control Lane 3: Positive tubB gene control with N. uncinatum DNA as template (A panel), positive cre gene control with pKAES186 as template Lane 4-10: Seven potential creblelox transformants
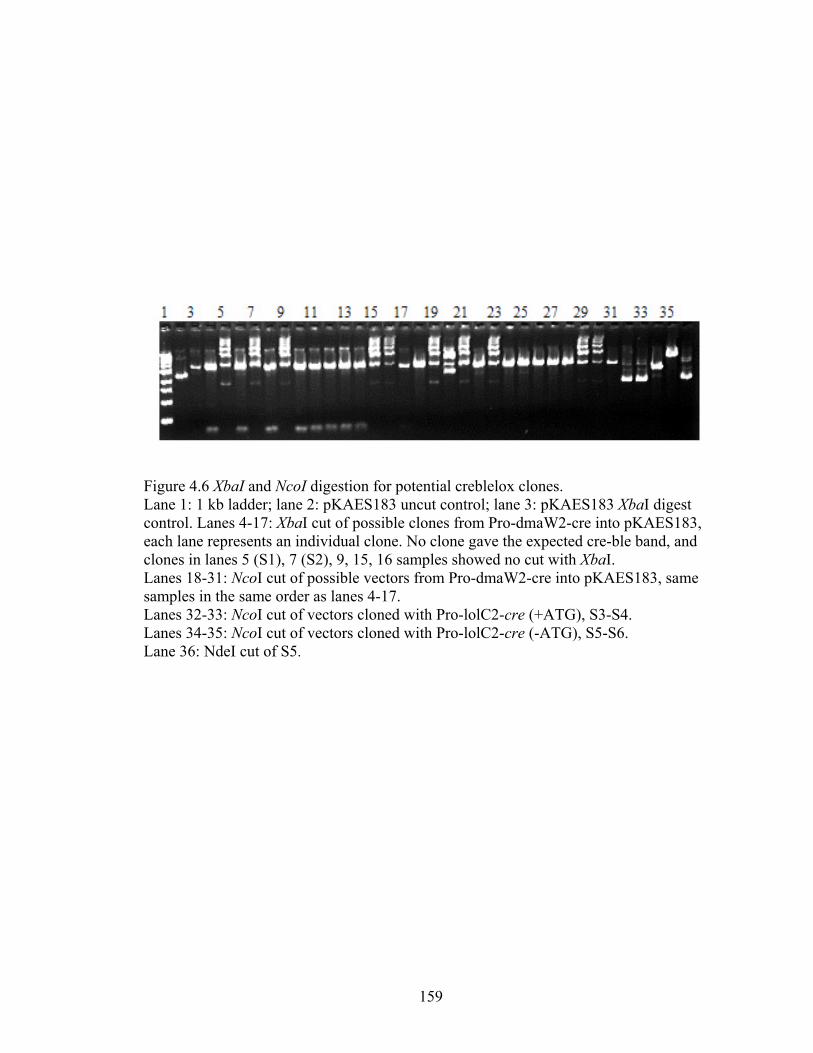
159
Figure 4.6 XbaI and NcoI digestion for potential creblelox clones. Lane 1: 1 kb ladder; lane 2: pKAES183 uncut control; lane 3: pKAES183 XbaI digest control. Lanes 4-17: XbaI cut of possible clones from Pro-dmaW2-cre into pKAES183, each lane represents an individual clone. No clone gave the expected cre-ble band, and clones in lanes 5 (S1), 7 (S2), 9, 15, 16 samples showed no cut with XbaI. Lanes 18-31: NcoI cut of possible vectors from Pro-dmaW2-cre into pKAES183, same samples in the same order as lanes 4-17. Lanes 32-33: NcoI cut of vectors cloned with Pro-lolC2-cre (+ATG), S3-S4. Lanes 34-35: NcoI cut of vectors cloned with Pro-lolC2-cre (-ATG), S5-S6. Lane 36: NdeI cut of S5.
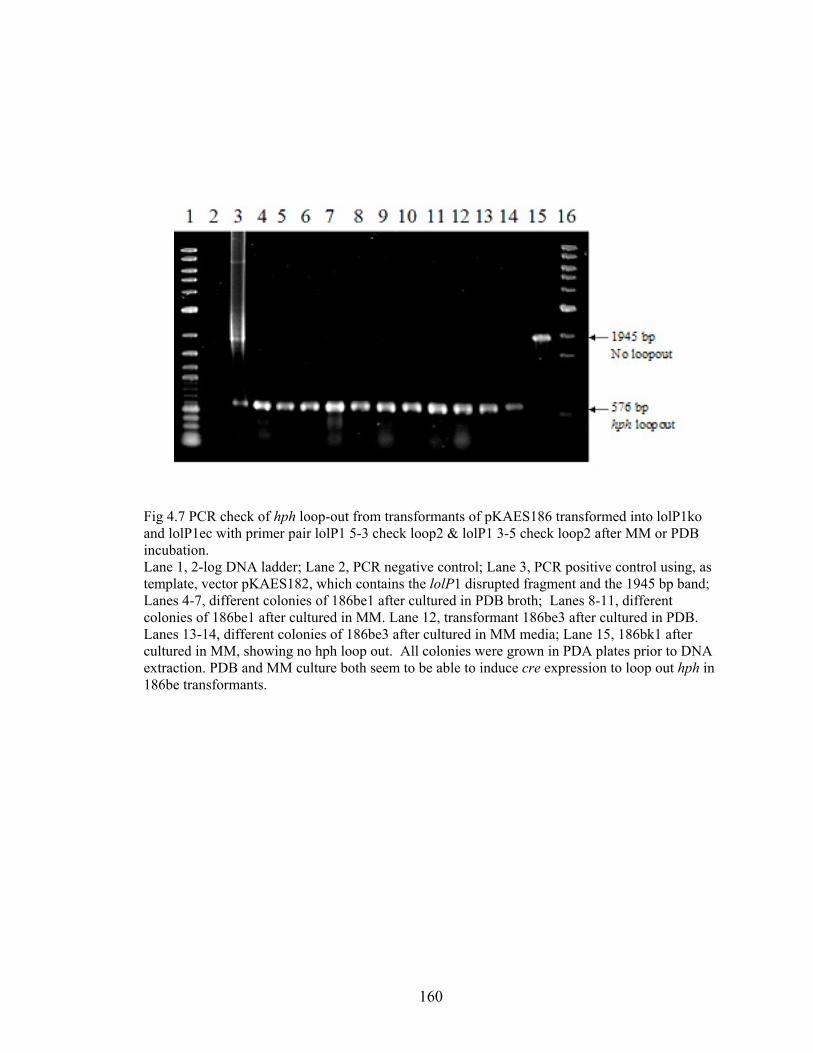
160
Fig 4.7 PCR check of hph loop-out from transformants of pKAES186 transformed into lolP1ko and lolP1ec with primer pair lolP1 5-3 check loop2 & lolP1 3-5 check loop2 after MM or PDB incubation. Lane 1, 2-log DNA ladder; Lane 2, PCR negative control; Lane 3, PCR positive control using, as template, vector pKAES182, which contains the lolP1 disrupted fragment and the 1945 bp band; Lanes 4-7, different colonies of 186be1 after cultured in PDB broth; Lanes 8-11, different colonies of 186be1 after cultured in MM. Lane 12, transformant 186be3 after cultured in PDB. Lanes 13-14, different colonies of 186be3 after cultured in MM media; Lane 15, 186bk1 after cultured in MM, showing no hph loop out. All colonies were grown in PDA plates prior to DNA extraction. PDB and MM culture both seem to be able to induce cre expression to loop out hph in 186be transformants.
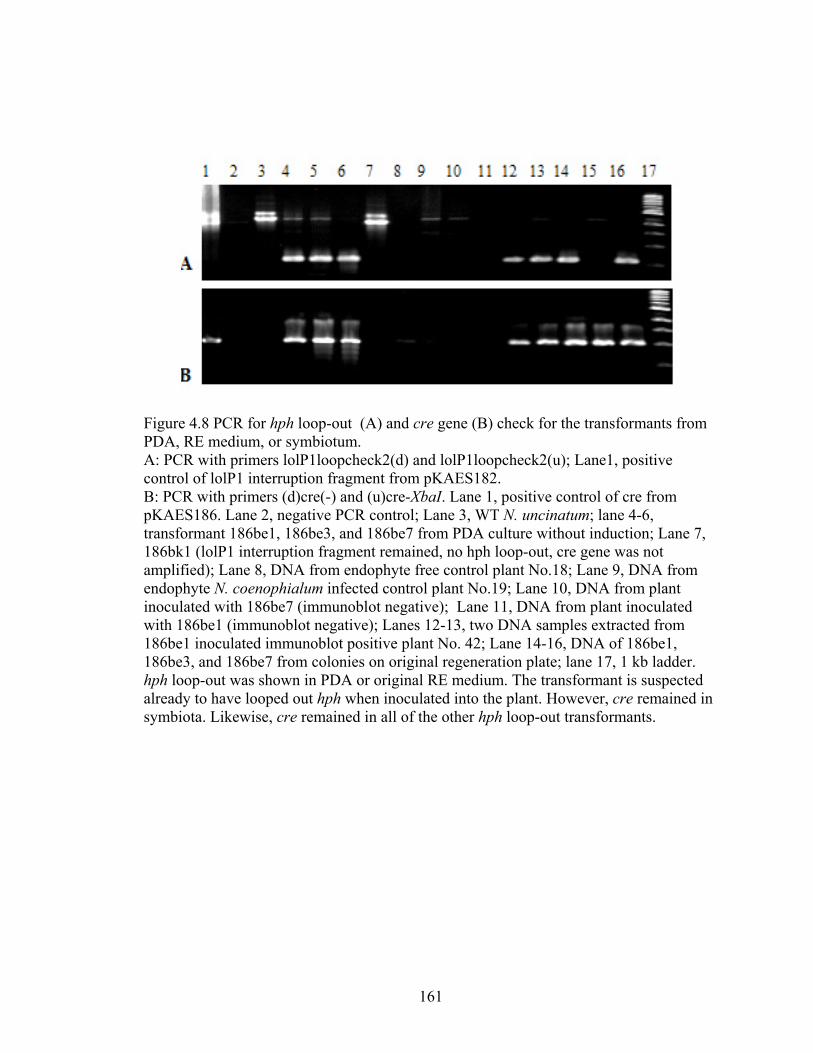
161
Figure 4.8 PCR for hph loop-out (A) and cre gene (B) check for the transformants from PDA, RE medium, or symbiotum. A: PCR with primers lolP1loopcheck2(d) and lolP1loopcheck2(u); Lane1, positive control of lolP1 interruption fragment from pKAES182. B: PCR with primers (d)cre(-) and (u)cre-XbaI. Lane 1, positive control of cre from pKAES186. Lane 2, negative PCR control; Lane 3, WT N. uncinatum; lane 4-6, transformant 186be1, 186be3, and 186be7 from PDA culture without induction; Lane 7, 186bk1 (lolP1 interruption fragment remained, no hph loop-out, cre gene was not amplified); Lane 8, DNA from endophyte free control plant No.18; Lane 9, DNA from endophyte N. coenophialum infected control plant No.19; Lane 10, DNA from plant inoculated with 186be7 (immunoblot negative); Lane 11, DNA from plant inoculated with 186be1 (immunoblot negative); Lanes 12-13, two DNA samples extracted from 186be1 inoculated immunoblot positive plant No. 42; Lane 14-16, DNA of 186be1, 186be3, and 186be7 from colonies on original regeneration plate; lane 17, 1 kb ladder. hph loop-out was shown in PDA or original RE medium. The transformant is suspected already to have looped out hph when inoculated into the plant. However, cre remained in symbiota. Likewise, cre remained in all of the other hph loop-out transformants.
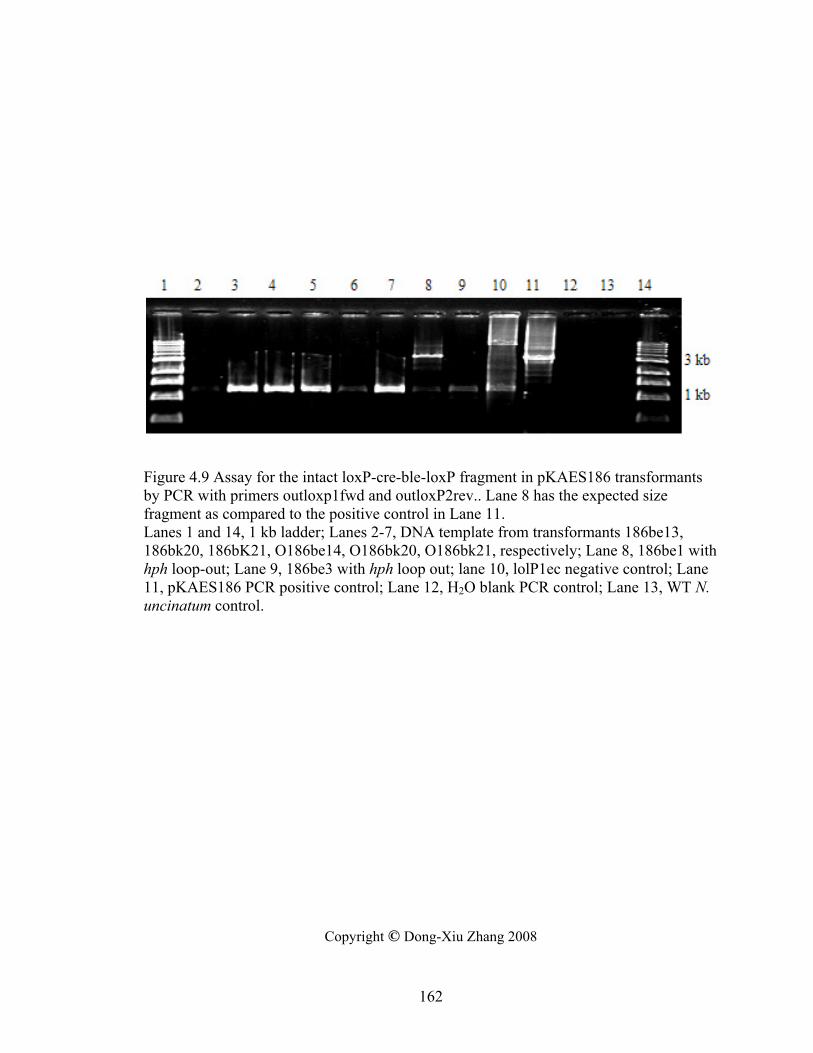
162
Figure 4.9 Assay for the intact loxP-cre-ble-loxP fragment in pKAES186 transformants by PCR with primers outloxp1fwd and outloxP2rev.. Lane 8 has the expected size fragment as compared to the positive control in Lane 11. Lanes 1 and 14, 1 kb ladder; Lanes 2-7, DNA template from transformants 186be13, 186bk20, 186bK21, O186be14, O186bk20, O186bk21, respectively; Lane 8, 186be1 with hph loop-out; Lane 9, 186be3 with hph loop out; lane 10, lolP1ec negative control; Lane 11, pKAES186 PCR positive control; Lane 12, H2O blank PCR control; Lane 13, WT N. uncinatum control.
Copyright © Dong-Xiu Zhang 2008
163
CHAPTER 5
Analysis of LOL Gene Expression in Planta
INTRODUCTION
The identification of the LOL cluster (Spiering et al 2005b) in the genomes of
Neotyphodium (asexual species) (Glenn et al 1996)) and Epichloë (sexual species)
(Leuchtmann 1994) endophytes has been made possible by genetic and molecular
approaches. Genetic analysis, using a cross between E. festucae strains differing in loline
alkaloid (LA) production, has revealed an amplified fragment length polymorphism
(AFLP) that co-segregates among LA-producing progeny, but not among LA non-
producing progeny (Wilkinson et al 2000). Sequencing of the E. festucae AFLP DNA
fragment revealed that it contained part of lolC, a gene that, along with lolA, was
originally identified by its up-regulated expression in LA-producing cultures of N.
uncinatum (Spiering et al 2002). Detection by PCR of lolA and lolC genes in several
endophyte species and isolates revealed their strict association with LA production in
these endophytes, and genome walking and sequencing of bacterial artificial chromosome
(BAC) genomic DNA libraries identified seven additional genes forming a gene cluster in
N. uncinatum and E. festucae (Kutil et al 2007; Spiering et al 2005b). The two genes
located at each end of the LOL cluster, lolF and lolE, have been detected in loline-
producing species and strains, such as N. siegelii ATCC 74483, E. festucae CBS 102475,
and E. festucae x E. typhina isolate Tf18, but not from loline non-producers, E. festucae
CBS 102477, E. typhina ATCC 200736, N. lolii isolate e138, and N. lolii x E. typhina
Lp1 (Spiering et al 2005b). These observations all suggest that LOL genes are responsible
for LA production and reverse transcription (RT) PCR has further suggested that the LOL
genes are coordinately expressed during LA production in cultures or symbiota (Spiering
et al 2005b).
There are nine genes in the LOL cluster, and most or all of them are believed to
play roles in the almost completely elucidated LA-biosynthetic pathway (Blankenship et
al 2005; Faulkner et al 2006; Schardl et al 2007; Spiering et al 2005b). The LOL genes
164
show co-regulated expression during the kinetic LA-production phase in N. uncinatum
MM culture (Chapter 2). When expression of an exogenous gene, the E. coli GUS gene,
was under control of LOL gene promoters in N. uncinatum, the pattern of GUS gene
expression was different from the expression of those LOL genes whose expression was
under control of the same promoters (Chapter 3-4). This suggests that proper expression
of the LOL genes requires the genetic context of the LOL cluster. These findings and little
knowledge about the temporal pattern of LOL gene expression triggered the questions,
how closely are the LOL cluster genes coregulated with LA production in culture and
symbiota, and how do LOL gene expression and LA production respond to physiological
changes within the host?
LA production in planta likely differs from production in the fungal fermentation
cultures, being influenced by the interaction with the plant imposed by physiological
conditions within different plant tissues, developmental stages, and nutritional states
under various environmental growth conditions. The amount and distribution of the LA
in the plant is very changeable from tissue to tissue or plant to plant in tall fescue
(Belesky et al 1987; Bond et al 1984; Jones et al 1983; 1985; Kennedy & Bush 1983),
and also variable in meadow fescue (Lolium pratense) embryo, seed, leaves,
pseudostems, crowns, and roots over the growing season (Justus et al 1997; Tong et al
2006). Many factors affecting LA production have been observed in planta (Schardl et al
2007). The complexity of the interaction with irregular LA production and distribution
presents difficulties in investigating the relationship between LA production and gene
expression in planta. However, several remarkable observations related to LA production
lighten up the trail.
In N. coenophialum-infected tall fescue plants, the highest LA concentration has
been found in green leaves, with lower concentrations in senescing leaves, and the lowest
in brown leaves, while aphids preferred senescing leaves (Eichenseer et al 1991). In
mock-herbivory (clipping) experiments, higher LA and protein level was detected at day
14 after clipping N. coenophialum-infected tall fescue (Lolium arundinaceum) (Bultman
et al 2004), and LA levels were dramatically increased from 0.1% to 1.9% of plant dry
weight at 0 and 11 days after clipping, respectively, in both N. uncinatum and N. siegelii-
meadow fescue symbiota (Craven et al 2001). However, tissue-damage treatment (cut, or
165
fed upon by the herbivore Spodoptera frugiperda) elicits only minor effects on
expression of lolC in N. coenophialum-tall fescue Kentucky 31. (Sullivan et al 2007)
reported that lolC expression was not very significantly (p = 0.052) affected at 10 and 24
days post damage compared to non-treated control plants. Though levels of LA were not
measured, a significantly higher number of dead aphids (Rhopalosiphum padi) was found
on damaged plants (Sullivan et al 2007). So far no study has addressed the question of
whether endophyte LOL gene expression patterns correlate with LA production in
endophytic symbiota. Based on the findings of coregulation of LOL genes with LA
production in N. uncinatum MM culture described in Chapter 2, I hypothesize that LA
production in planta also is regulated by LOL gene expression, and expression of LOL
genes in planta also would be correlated with one another.
In the study described in this chapter, tissue samples from endophyte-infected
grasses collected at distinct developmental stages in the field, and endophyte-plant
associations under well-controlled growth conditions in the greenhouse, were used to
investigate whether the levels of LA and LOL gene expression would show significant
correlation. Furthermore, a clipping experiment simulating herbivory was carried out in
the greenhouse to test the hypothesis that LOL gene expression is coordinately up-
regulated with LA up-regulation in N. uncinatum or N. siegelii-infected meadow fescue
symbiota in response to the clipping.
166
MATERIALS AND METHODS
Symbiotum material collection
Inflorescence heads of N. coenophialum-infected tall fescue (Lolium
arundinaceum) cultivar Kentucy-31 at pre-anthesis, anthesis, post-anthesis, and dough
developmental stages were collected from different plants in the field during May to June
by T.D. Phillips (University of Kentucky). Stromata and inflorescence heads of E.
festucae-meadow fescue symbiota were collected by U. Hesse (University of Kentucky).
All samples were flash-frozen in liquid nitrogen immediately after collection, and
stored at –80°C prior to use. Four individual inflorescence heads at each developmental
stage were randomly chosen for LA and RNA extraction. Each individual head was
ground in liquid nitrogen with pestle and mortar, and approx. 100 mg of fresh tissue was
immediately used for RNA extraction. The other part of the ground tissue was freeze-
dried and 100 mg (dry weight) was used for LA extraction (as described above).
For clipping experiments, details of plant tissue sampling are given in Table 5.1
and Figure 5.1. The N. uncinatum-meadow fescue symbiotum designated 4002 was
derived from cv. Predix seedlings inoculated with N. uncinatum CBS 102646. The N.
siegelii-meadow fescue symbiotum 955 was cloned from a single cv. Predix plant that
had been inoculated with N. siegelii ATCC 74483. Plants were grown in the greenhouse
until each contained more than six tillers. For symbiotum 955, 16 plants were randomly
allocated to treatments. Six plants were used as control plants that were left uncut. For
symbiotum 4002, four plants were used as control plants out of total 13 plants. The
remaining plants were clipped at the base of the leaf blade directly above the pseudostem,
giving the “upper part” sample. Other tissues sampled were the “basal part” (leaf sheaths
surrounding the emerging leaf tissues), and “regrowth tissue” above the site of the initial
clipping. Where indicated, upper part tissues were separated into “outer” mature leaf
blades and “center” young emerging leaf blades.
At day zero, 10 plants of 955 and 9 plants of 4002 (excluding uncut control
plants) were clipped (upper part samples). Also at day zero, both upper and basal part
samples were harvested from two uncut control plants of each symbiotum. Regrowth and
basal parts were then sampled from two plants per day on days 3, 6, 9, 12, and 15 (for
167
4002, day 9 only had one plant). The upper parts and basal parts of the other four uncut
control plants of 955 were sampled on days 6 and 12; and the other two uncut control
plants for 4002 were sampled on day 12. The center and outer leaf blades from the zero
day upper parts, along with unclipped control plant tissues (upper and basal parts),
established a baseline of LA levels and gene expression before clipping. All samples
were flash-frozen in liquid nitrogen immediately after collection. Each type of tissue
from each plant was ground in liquid nitrogen to fine powder with mortar and pestle
immediately before use.
RNA extraction and quantification, LA extraction and quantitation
Details of the methods used for RNA extraction and quantification of gene
expression by real-time reverse transcription quantitative PCR (RT-qPCR) and LA
extraction can be found in Chapter 2. Approx. 100 mg fresh, frozen, and ground plant
material was used for RNA extraction, and 40-100 mg freeze-dried plant tissues in LA
extraction. All RNA samples were diluted to 10 ng/μl prior to use. The LA measurements
from E. festucae-meadow fescue inflorescence and stroma samples were done by J.D.
Blankenship (University of Kentucky) in 2001.
Taqman primer and probe design
Taqman primer and probe design was as described in Chapter 2. The LOL cluster
in N. coenophialum is very similar to LOL2 in N. uncinatum, so all the primers and
probes used in Chapter 2 were used in these experiments as well. However, N. siegelii
contained a LOL cluster closer to LOL1; therefore, Taqman primer and probe sets specific
to the LOL1 genes (based on LOL1 sequence in N. uncinatum; NCBI accession number:
AY723749) were designed. The E. festucae LOL cluster (EF012267) differs from both
LOL1 and LOL2, necessitating the design of additional primers for E. festucae lolC1,
lolU1, lolO1, and lolE1; probes designed for these four LOL1 genes in N. uncinatum
matched 100% to E. festucae sequence. Primer and probe sets for the plant housekeeping
genes tub2 and EF1-α were designed as follows: EST sequencing of the normalized
cDNA libraries from stromata and inforescences of E. festucae made available 77,000
plant sequence reads (data provided by U. Hesse), and the cDNA sequences of plant tub2
168
and EF1-α were submitted for BLASTn in NCBI with restriction to the genus Lolium,
and appropriate primer-probe sequences were designed from the 100% match regions.
The sequences of primers and probes for LOL2 genes, and for proC, metX, C2H2, and the
fungal housekeeping gene tefA are listed in Chapter 2; primers and probes for tubB and
lolC2 were described in previous work (Spiering et al 2005b). All primer and probe
sequences designed in this study are listed in Table 5.2.
RT-qPCR and relative comparative Ct (ΔΔCt) method
RT-qPCR was performed and relative quantification of gene expression was
calculated (tefA as the endogenous control) as described in Chapters 2 and 3 with slight
modifications: each 25-μl reaction contained 50 ng RNA and 400 nM probe, and was run
for 45 cycles instead of 40 cycles. All standard curves were run at 5 serial dilutions
(range of 6.25–100 ng per reaction) in triplicates for: all LOL1 genes, metX, and proC in
N. siegelii-meadow fescue RNA samples; lolA2, lolC2, and lolD2 genes in N.
coenophialum-tall fescue RNA samples; and for all LOL2 genes, proC, and metX and
C2H2 in N. uncinatum-meadow fescue RNA samples. Standard curves were not run for
fungal genes tubB, plant genes tub2 and EF1-α, and E. festucae genes tefA, lolU, lolC,
lolO, and lolE, because of limited RNA amounts available from the symbiota.
Water content measurement
The 0 day outer and center leaf blades sampled from 10 plants for 955 and 9
plants for 4002 (Table 5.1) were used for water content measurement. A portion of each
frozen ground sample was weighed as fresh weight, then freeze dried, and the dry weight
was recorded. Water content in the other tissue types were not measured; however, fresh
and dry weight of the uncut upper part tissue could be obtained from those of outer and
center leaf blades, since uncut upper part contains both outer and center leaf blades.
Amino acid analysis in planta by HPLC
These analyses were carried out by P. Nagabhyru (University of Kentucky).
Amino-acid (AA) analysis of plant tissue was performed with liquid
chromatography/mass spectrometry (LCMS) with a dual pump ProStar 210 HPLC with
169
1200L Quadrupole MS-MS (Varian, Inc. CA, USA). Fresh tissue (100 mg) was extracted
with 0.5 ml of 86% ethanol, and 100 µl of the supernatant was then used for cleaning up
and derivatization with EZ: faast kit LC (Phenomenex Inc, Torrance, CA, USA) together
with 100 µl internal standard (containing the mixture of 0.2 M each of homoarginine,
methionine-d3, and homophenylalanine, provided by the kit). The amount of each AA
was converted to µmol per gram dry weight tissue based on the average weight ratio of
dry to fresh tissue from all measured plants. For calculation of the dry-to-fresh weight
ratio of each plant upper part (including outer and center) tissue, the total dry weight from
both outer and center parts was divided by its total fresh weight before freeze-drying.
170
RESULTS
Amplification efficiencies of RT-qPCR for genes from different symbiotum RNA
samples
RT-qPCR was performed for all the tested genes to get standard curves so that
amplification efficiency and slopes of the standard curves of the target gene and
endogenous control gene, tefA, were compared. This is required for making the decision
whether the ΔΔCt relative quantitative method can be applied for quantification of gene
expression. The standard curve slope and R2 for RT-qPCR of each gene is given in Table
5.3. Based on the error estimation from amplification efficiency differences between the
endogenous control and the target gene in the relative comparative method (ΔΔCt) (see
Chapter 2), almost all of the gene standard curve slopes indicated that relative
comparative method (ΔΔCt) was appropriate to compare gene expression. The exception
was lolF1 in N. siegelii-meadow fescue, for which the slope of -4.33 (R2 = 0.962) was
quite different from the tefA endogenous control gene (slope = –3.41, R2 = 0.983). It is
possible that the lolF1 primer and probe designed based on the lolF1 cDNA sequences of
N. uncinatum have some mismatches to the N. siegelii lolF sequence. However, lolF
expression in N. siegelii was still calculated with the ΔΔCt method, since limiting RNA
amounts prohibited running serially diluted RNA for lolF determination on each plate. So
lolF expression data are to be interpreted with caution. Due to the limited amounts of
symbiota RNA, standard curves were not run for tubB and C2H2, plant genes tub2 and
EF1-α, and E. festucae genes tefA, lolU, lolC, lolO, and lolE. However, for all of these
genes, the amplification plots from tested unknown RNA samples showed good
geometric phases (Figure 5.2), which suggested efficient amplification.
LA and gene expression in N. coenophialum-tall fescue inflorescence developmental
stages
LA from four different developmental stages — pre-anthesis, anthesis, post-
anthesis, and dough stage — of N. coenophialum-infected tall fescue inflorescences was
measured by GC; gene expression level was tested by RT-qPCR from the same samples.
No direct correlation was found between LOL gene expression and LA levels among the
171
developmental stages (Figure 5.3). The lowest LA amount was found at anthesis (approx.
4 μmol/g dry weight). At pre-anthesis, LA level was approx 10 μmol/g dry weight (dw),
and post-anthesis stage at 8 μmol/g dw and dough stage at 7.5 μmol/g dw. Student’s t-test
indicated only one p value approaching significance at 0.05 between pre-anthesis stage
and anthesis stage (Figure 5.3 bottom). Expression of three LOL genes, lolA2, lolC2, and
lolD2, did not show significant correlation of expression among the four different
developmental stages or with LA levels (Figure 5.3 top). Gene lolD2 showed approx. 2-3
fold higher level at both anthesis and dough stages, and lolA2 showed approx. 3-fold
higher expression at dough stage. However, most of the gene expression levels at the four
different stages were near the median expression level.
LA and gene expression in E. festucae-meadow fescue inflorescences and stromata
From the LA-producing E. festucae-meadow fescue symbiota — samples 2194-2
and 2359-2 — gene expression of lolU, lolE, lolC, and lolO was found to range between
1.2-3.2-fold in inflorescences (relative to median expression), whereas their expression
was less than 0.9-fold in stromata. The housekeeping gene, tubB, showed relatively stable
expression (0.9-1.2 fold) when it was also normalized to tefA and calibrated to its ΔCt
median (Figure 5.4 top). Comparison of inflorescences and stromata of E. festucae-
meadow fescue 2048-1 and 2102-4 indicated a 2-3 fold higher LA concentration in the
inflorescences (0.84-1.03 µmol/g dw) compared to stromata (0.33-0.36 µmol/g dw)
(Figure 5.4 bottom).
LA and gene expression in symbiotum 955 (N. siegelii-meadow fescue)
In upper regrowth parts and basal parts after clipping
LOL1 gene expression in the pseudostem tissue and the upper regrowth tissue
within 3 to 15 days after mock herbivory by manual clipping did not show any significant
differences when compared to the uncut basal pseudostem tissue used as control (Figure
5.5). Of the five tested genes, lolA1, lolC1, lolE1, lolT1, and lolO1, on day 3 and day 6
post clipping (PC), the majority showed expression levels in the plant basal part that were
similar to, or even lower than, the uncut 0-day and uncut 6-day pseudostem controls. At
day 9 PC, lolC1 seemed to show higher expression (around 2.3 fold); however, in the
172
uncut control, lolC1 also showed quite high expression (around 1.5 fold) on day 6.
Similar LOL gene expression patterns lacking defined direction could be seen from the
regrowth part post clipping. Expression of proC (a gene involved in the biosynthesis of
the amino acid, L-proline), metX (a gene involved in the biosynthesis of the amino acids
threonine and L-methionine), tubB, and all nine LOL genes was measured in regrowth
RNA samples, and overall changes in gene expression were quite minor, within a range
of 0.5-1.5 fold. Changes in gene expression were quite variable from plant to plant,
possibly obscuring potential small patterns. So the plant injury by clipping did not seem
to cause any obvious effects on LOL gene expression.
LA concentrations in clipped plants and controls are shown in Figure 5.6. LA
concentration in the basal plant tissues from days 3 to 15 PC did not show defined
differences from the uncut controls. LA concentrations ranged between 20-34 μmol/g dw,
except in one uncut control at day 12, which was as low as 16 μmol/g dw. No obvious
increase after clipping was detectable in the basal pseudostem part (Figure 5.6 top).
However, a substantial increase in LA concentration was measured in upper re-growth
tissues PC (Figure 5.6 middle). In the 3rd and 6th-day PC plants, LA levels in the upper
regrowth part, ranging from 36-61 μmol/g dw, were 4.5-7.5 fold more than the
concentration in the 0-day uncut control upper parts (8 μmol/g dw). The average LA
concentration from the four tested regrowth tissues 3 to 6 day PC were more than 4.5-fold
higher compared to the average from upper parts of all uncut control plants. On days 9,
12, and 15 PC, LA levels in upper tissues went down gradually from approx. 30 μmol/g
dw to close to the uncut control level (13 μmol/g dw). Since no LA change was observed
in pseudostem, the total LA amounts (summed levels in upper and basal parts) appeared
to have had an approx. 2-fold increase at days 3-6 PC. After peaking at days 3-6, total
LA amount PC in each plant slowly dropped down back close to the level in uncut plants
(Figure 5.6, bottom).
In outer and center leaf blades without clipping treatment
LA concentration and expression of all LOL1 genes, metX, and proC were
assayed for the upper part outer and center leaf blade samples from day 0. Consistently
higher LOL1 gene expression was observed in the outer leaf blades than in center leaf
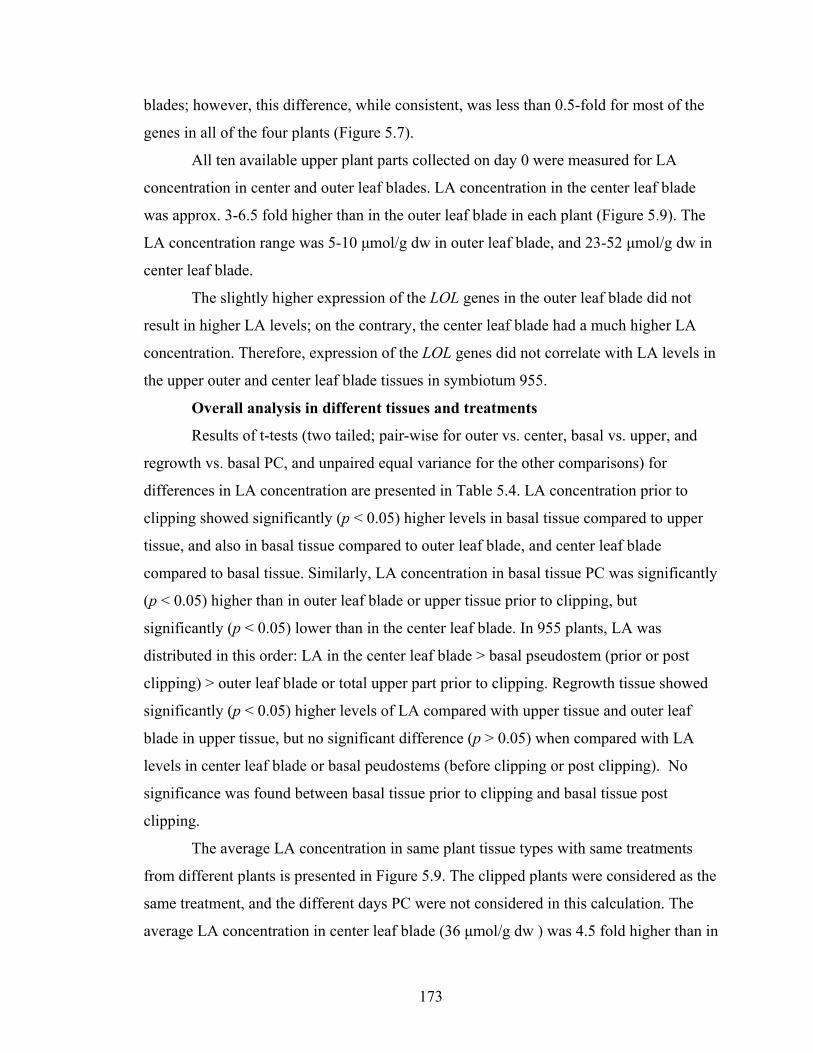
173
blades; however, this difference, while consistent, was less than 0.5-fold for most of the
genes in all of the four plants (Figure 5.7).
All ten available upper plant parts collected on day 0 were measured for LA
concentration in center and outer leaf blades. LA concentration in the center leaf blade
was approx. 3-6.5 fold higher than in the outer leaf blade in each plant (Figure 5.9). The
LA concentration range was 5-10 μmol/g dw in outer leaf blade, and 23-52 μmol/g dw in
center leaf blade.
The slightly higher expression of the LOL genes in the outer leaf blade did not
result in higher LA levels; on the contrary, the center leaf blade had a much higher LA
concentration. Therefore, expression of the LOL genes did not correlate with LA levels in
the upper outer and center leaf blade tissues in symbiotum 955.
Overall analysis in different tissues and treatments
Results of t-tests (two tailed; pair-wise for outer vs. center, basal vs. upper, and
regrowth vs. basal PC, and unpaired equal variance for the other comparisons) for
differences in LA concentration are presented in Table 5.4. LA concentration prior to
clipping showed significantly (p < 0.05) higher levels in basal tissue compared to upper
tissue, and also in basal tissue compared to outer leaf blade, and center leaf blade
compared to basal tissue. Similarly, LA concentration in basal tissue PC was significantly
(p < 0.05) higher than in outer leaf blade or upper tissue prior to clipping, but
significantly (p < 0.05) lower than in the center leaf blade. In 955 plants, LA was
distributed in this order: LA in the center leaf blade > basal pseudostem (prior or post
clipping) > outer leaf blade or total upper part prior to clipping. Regrowth tissue showed
significantly (p < 0.05) higher levels of LA compared with upper tissue and outer leaf
blade in upper tissue, but no significant difference (p > 0.05) when compared with LA
levels in center leaf blade or basal peudostems (before clipping or post clipping). No
significance was found between basal tissue prior to clipping and basal tissue post
clipping.
The average LA concentration in same plant tissue types with same treatments
from different plants is presented in Figure 5.9. The clipped plants were considered as the
same treatment, and the different days PC were not considered in this calculation. The
average LA concentration in center leaf blade (36 μmol/g dw ) was 4.5 fold higher than in
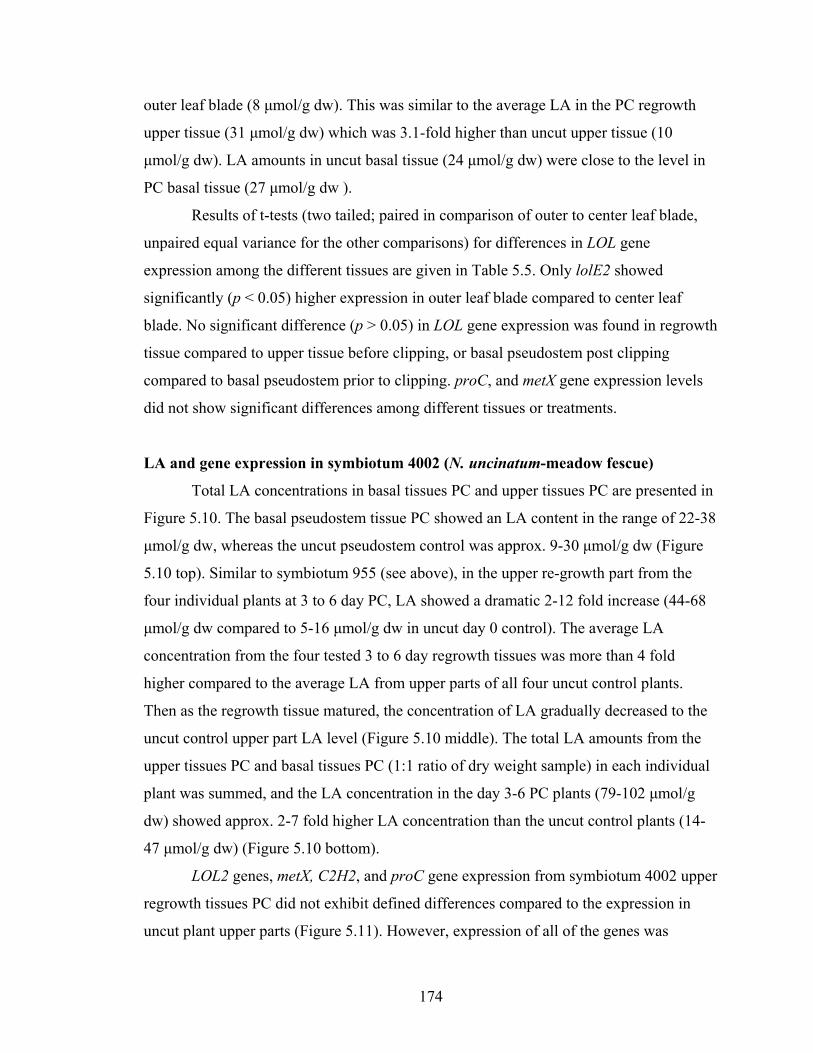
174
outer leaf blade (8 μmol/g dw). This was similar to the average LA in the PC regrowth
upper tissue (31 μmol/g dw) which was 3.1-fold higher than uncut upper tissue (10
μmol/g dw). LA amounts in uncut basal tissue (24 μmol/g dw) were close to the level in
PC basal tissue (27 μmol/g dw ).
Results of t-tests (two tailed; paired in comparison of outer to center leaf blade,
unpaired equal variance for the other comparisons) for differences in LOL gene
expression among the different tissues are given in Table 5.5. Only lolE2 showed
significantly (p < 0.05) higher expression in outer leaf blade compared to center leaf
blade. No significant difference (p > 0.05) in LOL gene expression was found in regrowth
tissue compared to upper tissue before clipping, or basal pseudostem post clipping
compared to basal pseudostem prior to clipping. proC, and metX gene expression levels
did not show significant differences among different tissues or treatments.
LA and gene expression in symbiotum 4002 (N. uncinatum-meadow fescue)
Total LA concentrations in basal tissues PC and upper tissues PC are presented in
Figure 5.10. The basal pseudostem tissue PC showed an LA content in the range of 22-38
μmol/g dw, whereas the uncut pseudostem control was approx. 9-30 μmol/g dw (Figure
5.10 top). Similar to symbiotum 955 (see above), in the upper re-growth part from the
four individual plants at 3 to 6 day PC, LA showed a dramatic 2-12 fold increase (44-68
μmol/g dw compared to 5-16 μmol/g dw in uncut day 0 control). The average LA
concentration from the four tested 3 to 6 day regrowth tissues was more than 4 fold
higher compared to the average LA from upper parts of all four uncut control plants.
Then as the regrowth tissue matured, the concentration of LA gradually decreased to the
uncut control upper part LA level (Figure 5.10 middle). The total LA amounts from the
upper tissues PC and basal tissues PC (1:1 ratio of dry weight sample) in each individual
plant was summed, and the LA concentration in the day 3-6 PC plants (79-102 μmol/g
dw) showed approx. 2-7 fold higher LA concentration than the uncut control plants (14-
47 μmol/g dw) (Figure 5.10 bottom).
LOL2 genes, metX, C2H2, and proC gene expression from symbiotum 4002 upper
regrowth tissues PC did not exhibit defined differences compared to the expression in
uncut plant upper parts (Figure 5.11). However, expression of all of the genes was
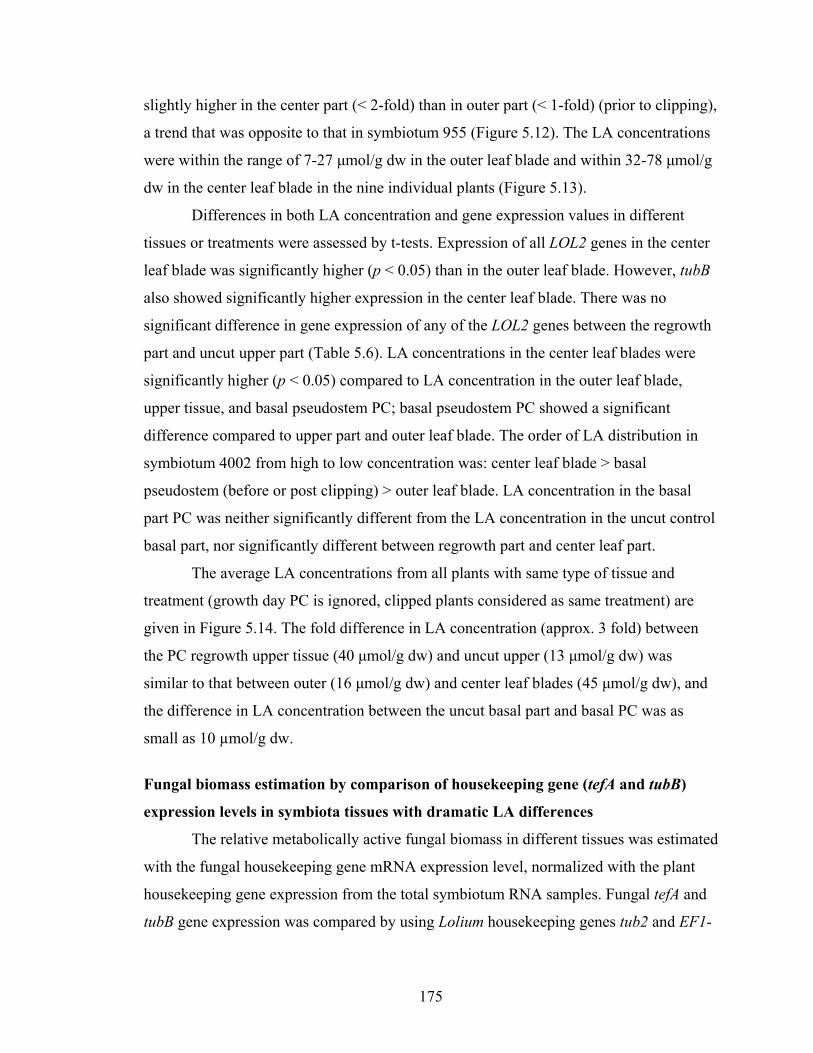
175
slightly higher in the center part (< 2-fold) than in outer part (< 1-fold) (prior to clipping),
a trend that was opposite to that in symbiotum 955 (Figure 5.12). The LA concentrations
were within the range of 7-27 μmol/g dw in the outer leaf blade and within 32-78 μmol/g
dw in the center leaf blade in the nine individual plants (Figure 5.13).
Differences in both LA concentration and gene expression values in different
tissues or treatments were assessed by t-tests. Expression of all LOL2 genes in the center
leaf blade was significantly higher (p < 0.05) than in the outer leaf blade. However, tubB
also showed significantly higher expression in the center leaf blade. There was no
significant difference in gene expression of any of the LOL2 genes between the regrowth
part and uncut upper part (Table 5.6). LA concentrations in the center leaf blades were
significantly higher (p < 0.05) compared to LA concentration in the outer leaf blade,
upper tissue, and basal pseudostem PC; basal pseudostem PC showed a significant
difference compared to upper part and outer leaf blade. The order of LA distribution in
symbiotum 4002 from high to low concentration was: center leaf blade > basal
pseudostem (before or post clipping) > outer leaf blade. LA concentration in the basal
part PC was neither significantly different from the LA concentration in the uncut control
basal part, nor significantly different between regrowth part and center leaf part.
The average LA concentrations from all plants with same type of tissue and
treatment (growth day PC is ignored, clipped plants considered as same treatment) are
given in Figure 5.14. The fold difference in LA concentration (approx. 3 fold) between
the PC regrowth upper tissue (40 μmol/g dw) and uncut upper (13 μmol/g dw) was
similar to that between outer (16 μmol/g dw) and center leaf blades (45 μmol/g dw), and
the difference in LA concentration between the uncut basal part and basal PC was as
small as 10 µmol/g dw.
Fungal biomass estimation by comparison of housekeeping gene (tefA and tubB)
expression levels in symbiota tissues with dramatic LA differences
The relative metabolically active fungal biomass in different tissues was estimated
with the fungal housekeeping gene mRNA expression level, normalized with the plant
housekeeping gene expression from the total symbiotum RNA samples. Fungal tefA and
tubB gene expression was compared by using Lolium housekeeping genes tub2 and EF1-
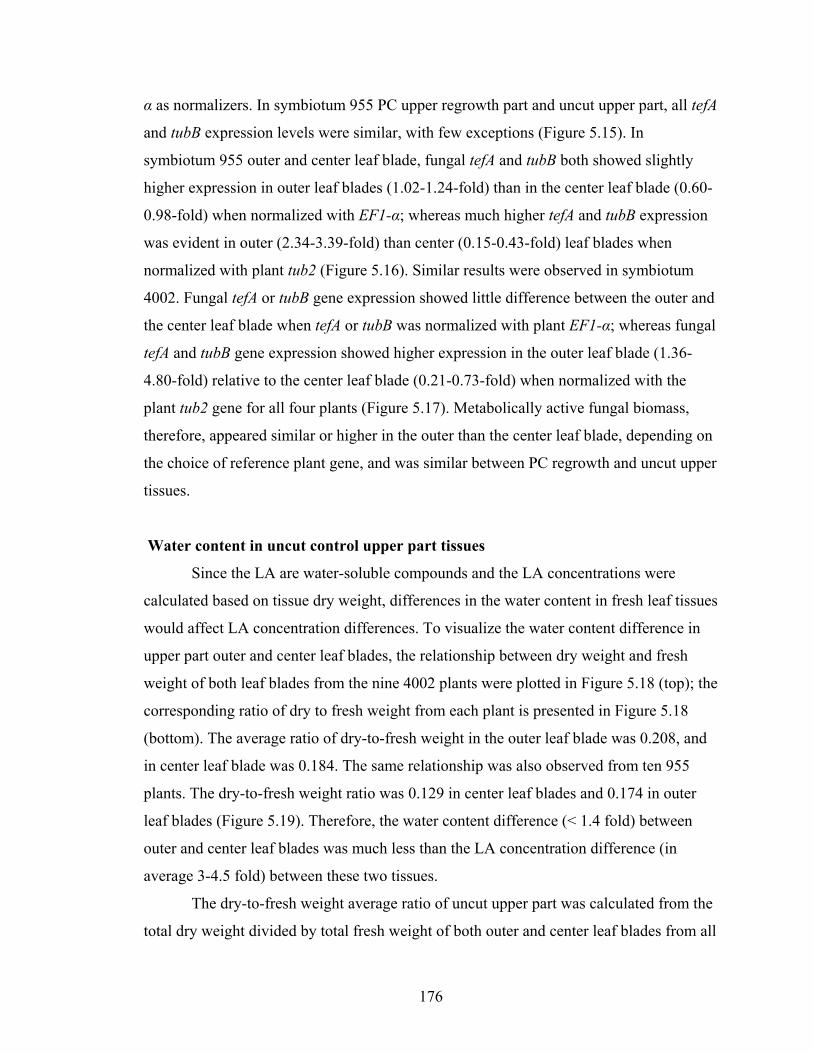
176
α as normalizers. In symbiotum 955 PC upper regrowth part and uncut upper part, all tefA
and tubB expression levels were similar, with few exceptions (Figure 5.15). In
symbiotum 955 outer and center leaf blade, fungal tefA and tubB both showed slightly
higher expression in outer leaf blades (1.02-1.24-fold) than in the center leaf blade (0.60-
0.98-fold) when normalized with EF1-α; whereas much higher tefA and tubB expression
was evident in outer (2.34-3.39-fold) than center (0.15-0.43-fold) leaf blades when
normalized with plant tub2 (Figure 5.16). Similar results were observed in symbiotum
4002. Fungal tefA or tubB gene expression showed little difference between the outer and
the center leaf blade when tefA or tubB was normalized with plant EF1-α; whereas fungal
tefA and tubB gene expression showed higher expression in the outer leaf blade (1.36-
4.80-fold) relative to the center leaf blade (0.21-0.73-fold) when normalized with the
plant tub2 gene for all four plants (Figure 5.17). Metabolically active fungal biomass,
therefore, appeared similar or higher in the outer than the center leaf blade, depending on
the choice of reference plant gene, and was similar between PC regrowth and uncut upper
tissues.
Water content in uncut control upper part tissues
Since the LA are water-soluble compounds and the LA concentrations were
calculated based on tissue dry weight, differences in the water content in fresh leaf tissues
would affect LA concentration differences. To visualize the water content difference in
upper part outer and center leaf blades, the relationship between dry weight and fresh
weight of both leaf blades from the nine 4002 plants were plotted in Figure 5.18 (top); the
corresponding ratio of dry to fresh weight from each plant is presented in Figure 5.18
(bottom). The average ratio of dry-to-fresh weight in the outer leaf blade was 0.208, and
in center leaf blade was 0.184. The same relationship was also observed from ten 955
plants. The dry-to-fresh weight ratio was 0.129 in center leaf blades and 0.174 in outer
leaf blades (Figure 5.19). Therefore, the water content difference (< 1.4 fold) between
outer and center leaf blades was much less than the LA concentration difference (in
average 3-4.5 fold) between these two tissues.
The dry-to-fresh weight average ratio of uncut upper part was calculated from the
total dry weight divided by total fresh weight of both outer and center leaf blades from all
177
the plants. Dry-to-fresh weight ratio of uncut upper part in 955 was 0.156, and in 4002
was 0.198. These ratios were used to convert per gram fresh weight to dry weight in
amino acid assays.
Amino acids in re-growth part and uncut control upper part from 955
Duplicate samples of two tissues from symbiotum 955 were chosen for amino-
acid (AA) analysis: upper parts of uncut plants (day 0), and upper regrowth parts day 3
PC. In total, 13 different AAs were analyzed. L-Serine (Ser), L-aspargine (Asn), L-
threonine (Thr), L-proline (Pro), L-valine (Val), and L-trptophan (Trp) showed significant
differences between uncut and clipped plants. Among these, Asn concentrations were
significantly higher in the regrowth part than in the uncut upper part (9.52-9.57 μmol/g
dw vs. 0.41-1.02 μmol/g dw) (log10 transformed t-test, two –tailed, two-sample equal
variation; p < 0.05), Ser, Thr, Pro, Val, and Trp were significantly lower in the regrowth
part compared to the uncut control upper part. L-Glutamine (Gln), L-glycine (Gly), L-
methionine (Met), L-aspartic acid (Asp), L-glutamic acid (Glu), L-phenylalanine (Phe),
and L-tyrosine (Tyr) did not show any significant differences between the regrowth tissue
and the uncut upper tissue (Table 5.8). LA concentration was significantly higher in the
regrowth tissue against uncut control tissue (51 μmol/g dw vs. 8 μmol/g dw). The
average amount of AA between regrowth and uncut upper part is compared in Figure
5.20. Asn was on average more than 13-fold higher in the PC regrowth upper tissue (9.5
μmol/g dw) than in the uncut upper tissue (0.7 μmol/g dw), Glu averaged 2-fold lower
(4.1 vs. 8.3 μmol/g dw), Ser was almost 3-fold lower (1.9 vs. 5.6 μmol/g dw), and Pro
was 4-fold lower (0.4 vs. 1.6 μmol/g dw). All the other tested AAs were also lower in the
re-growth tissue, and Met was undetectable in both tissues.
178
DISCUSSION
One interesting finding in this study is that clipping treatment did not directly
increase LA in N. uncinatum (or N. siegelii)-meadow fescue symbiota. The fact that LA
levels were 3-4.5-fold higher in the young post clipping (PC) regrowth leaf tissues than
the uncut upper tissues actually was due to much higher LA levels in younger leaf tissues
blades than in older leaf blades. The distribution of LA in different plant tissues was in
the order: uncut center (young) leaf blade or early PC regrowth upper tissue > basal
pseudostem or late PC regrowth upper tissue > uncut upper or outer (older) leaf blade or
later PC regrowth upper part. The important observation was that the LA level in early
PC regrowth leaf tissues was very similar to the LA level in uncut center (young) leaf
blade, and dropped down gradually back to the LA level in uncut upper part as the leaf
blades grew older. This observation suggested that high LA level in young regrowth
tissue was not a direct response to wounding, but due to the high net LA production in
young leaf tissues. This effect might have been misinterpreted in previous studies as a
direct response to clipping in N. coenophialum-tall fescue symbiota (Bultman et al 2004),
and also in N. uncinatum- or N. siegelii-meadow fescue symbiota (Craven et al 2001).
Previous reports have suggested that young leaves contain more LA. In age-
controlled N. coenophialum-infected tall fescue plants, green leaves contained highest LA
compared to senescing leaves and brown leaves (Eichenseer et al 1991). In N.uncinatum-
meadow fescue the highest LA concentrations were observed in young leaves in early
spring, or in panicles and vegetative pseudostems during the year (Justus et al 1997).
Also, in a recent study, lolC mRNA expression in N. coenophialum-tall fescue Kentucky-
31 was not significantly different in clipped compared to non-treated control plants, and
was significantly but not dramatically increased 10 days after damage by an herbivorous
insect (Spodoptera frugiperda) (Sullivan et al 2007) (LA levels were not assayed in that
study.)
The study described herein is the most thorough investigation to date of LA levels
in different plant tissues before and after clipping, and including gene expression
analysis. However, no evidence was shown that LOL gene expression could account for
the high LA production in the center leaf blade or regrowth young leaf tissue PC in N.
179
uncinatum (or N. siegelii)-meadow fescue symbiota. Also, the key fungal genes (metX
and proC) for LA precursor production were not up-regulated with high LA production.
Several possibilities were considered to address this LA increase without up-regulation of
LOL gene expression.
One reasonable assumption is that more fungal biomass might lead to higher LA
production. However, the surprising finding is that in outer leaf blade, in which the least
LA was detected, actually appeared to contain at least a similar amount if not more fungal
biomass compared to the center leaf blade. The growth model for fungal endophytes in
expanding plant leaves (Christensen et al 2008) and previous estimates of hyphal
densities (Spiering et al 2005a) suggest that relative endophyte biomass does not vary
greatly with age of the leaf tissue. This is consistent with the result obtained from this
study when the fungal housekeeping genes tefA and tubB were normalized with plant EF-
1α. Relative to this plant reference gene, the fungal housekeeping genes had only slightly
higher expression in outer leaf blade than in center leaf blade, which implies similar
fungal biomass content in the two tissues. However, the fungal genes appeared much
more highly expressed when normalized against the plant tub2 gene in outer leaf blade.
This difference in fungal housekeeping gene expression measurements depending on the
plant reference gene did not affect the conclusion that tissues with high LA levels did not
seem to contain more metabolically active fungal biomass.
Why did fungal tefA and tubB mRNA appear to be much more abundant when
normalized with the plant tub2 gene than with the plant EF-1α gene? Possibly, the plant
tub2 was expressed at a much higher level in the center than the outer leaf blade. The
transcript abundance of β-tubulin genes tub1 and tub8 in Arabidopsis thaliana have been
reported to vary considerably between plant tissues (Chu et al 1998). Furthermore, cDNA
from transcripts of the plant EF-1α gene was observed to be a more stable reference
compared to those from the β-tubulin gene in rice; and in rice shoots, EF-1α showed the
most stable expression over housekeeping genes ACT, ACT1, TUB, EF, TIP41, and CYC
(Caldana et al 2007). Therefore, fungal biomass is probably better judged based on tefA
and tubB gene expression normalized with plant EF-1α mRNA. Thus, fungal biomass in
most cases was estimated to be similar in upper regrowth tissue compared to uncut
control upper tissue in symbiotum 955, and also slightly lower in center leaf blade
180
compared to outer leaf blade in both symbiota 955 and 4002, whereas the regrowth and
center leaf blade tissues actually showed higher LA production. Other complementary
methods, such as microscopic examination of fungal hyphal ratio in plant tissue, should
be further applied to confirm whether this biomass amount judgement based on plant EF-
1α normalization is more accurate than that from the plant tub2 gene normalization.
Neverthless, the high LA level was not related to high amount of fungal biomass.
Water content did not show much difference among outer and center leaf blades,
and should not differ too much in the other tissues based the previous study in perennial
ryegrass (Spiering 2000). Thus, water content difference would not have caused dramatic
LA changes in different tissues.
Substrate and precursor availability is a potential factor affecting LA production
when LOL genes were not shown to be regulated by treatment. Two groups of amino
acids are precursors of lolines: Pro contributes C5 through C8 and the ring N, and L-
homoserine (Hse) contributes the 1-N and C1 through C3 (Blankenship et al 2005). The
LA precursor Hse is derived from Asp, which can be derived from deamidation of Asn.
Among the 13 AAs analyzed, Asn was found to be dramatically higher (more than 13-
fold) in young regrowth leaf tissue. with a 6.5-fold higher LA level compared to uncut
upper tissue. Therefore, the dramatic increase in Asn in young regrowth tissue may be an
important determinant of elevated LA in these tissues. In contrast, there was not much
difference in Asp, and Hse was not detectable, though it is important to note that Hse
appears toxic to N. uncinatum when applied in mM concentrations to MM cultures (J.R.
Faulkner’s personal observations). Asn can also serve as the AA N-source in LA
synthesizing cultures (Blankenship et al 2001), and the high levels of Asn suggest it
serves as a major N source in the young regrowth tissues of the plant. It seems
reasonable to hypothesize that deamidation Asn in young leaf tissues gives NH3 (as a
major plant nitrogen source) and Asp, which could be used as precursor for fungal LA
synthesis. If the increase of LA was due to the availability of Asp, the consequence
would be the decrease of the other necessary LA precursor Pro. This was suggested from
the result that Pro showed a significant decrease in young regrowth tissues.
Dynamic correlations among AAs and alkaloids have been reported in plants.
High levels of quinolizidine alkaloids (QA) in lupin seeds (bitter) is accompanied with
181
low basic AA levels, whereas sweet seeds have a low level of QA and a high level of AA
(Aniszewski et al 2001). (Park et al 2002) have recently demonstrated antisense
suppression of the berberine bridge enzyme in poppy cells, reducing the amount of
benzophenanthridine alkaloids but increasing the levels of several AAs. Observations
described herein are in keeping with such a dynamic flow in which a high level of
alkaloids may result in a low level of certain precursor AAs. In my study, most of the
AAs in the young regrowth tissue trended to lower levels than those in uncut control
upper tissue, though in most cases differences were insignificant. A notable significant
difference was the lower level of Pro, which (along with Hse) is an immediate precursor
of LA. Also significant was the lower level of Thr, synthesis of which competes with LA
biosynthesis. Considering that the endophyte-grass symbiotum is a dynamic interacting
system, a reasonable hypothesis is that the primary substrate levels in specific tissues
result from, or cause changes in, LA biosynthesis rates. However, more information is
required about the dynamics of these AAs in endophyte-free plants or in symbiota with
non-LA producing endophytes, and degradation of LA in different plant tissues, to
further test the hypothesis that substrate availability drives LA levels.
This astonishing result from the AA analysis between the PC young regrowth
upper and uncut upper tissues strongly suggests that LA substrate availability is the main
factor affecting LA production level in symbiotic vegetative tissues.
For the other instance, results revealed that in E. festucae-meadow fescue higher
LOL gene expression coincides with higher LA concentration in inflorescences and lower
LOL gene expression coincides with lower LA in the stromata, which therefore supports
the hypothesis that regulation of LOL gene expression affected LA production. This study
was limited by sample availability, and comparison of LOL gene expression and LA
concentration could not be performed for identical genotypes. Nevertheless, The finding
of down regulation in LOL gene expression levels in stromata is consistent with the
observation of LOL gene expression levels inferred from sequence reads from
inflorescence cDNA and stromata cDNA obtained with pyrosequencing of the E.
festucae-meadow fescue inflorescence and stromata cDNA (U. Hesse, and C.L. Schardl
personal communication). The down regulation of LA production makes teleological
sense since LA is an insect deterrent, whereas an anthimyid fly is responsible for
182
transferring spermatia between stromata to initiate the E. festucae sexual cycle, and is
also dependent upon the developing ascomata as its larval food source (Schardl 1996).
These two different regulation mechanisms in LA production suggest that in
endophyte-grass symbiotic system, signal transduction affecting LOL gene regulation
might not always be a factor in determining the differences in LA levels, and different
mechanisms might be involved in regulating LA production in different tissue types.
However, even if the gene regulation does not seem to account for LA level changes in
the vegetative tissues, the evidence that N. siegelii and E. festucae are unable to produce
LA in culture and capable of producing LA in symbiota (Spiering et al 2005b), suggests
that certain regulator signals from the plant are required to switch on the LA biosynthetic
pathway in N. siegelii or E. festucae. Furthermore, the different regulation mechanisms
remain beneficial aspects for the symbiotic system, either more LA production in young
leaves for protection from insects, or less LA production in stromata for fungal sexual
cycle maintenance.
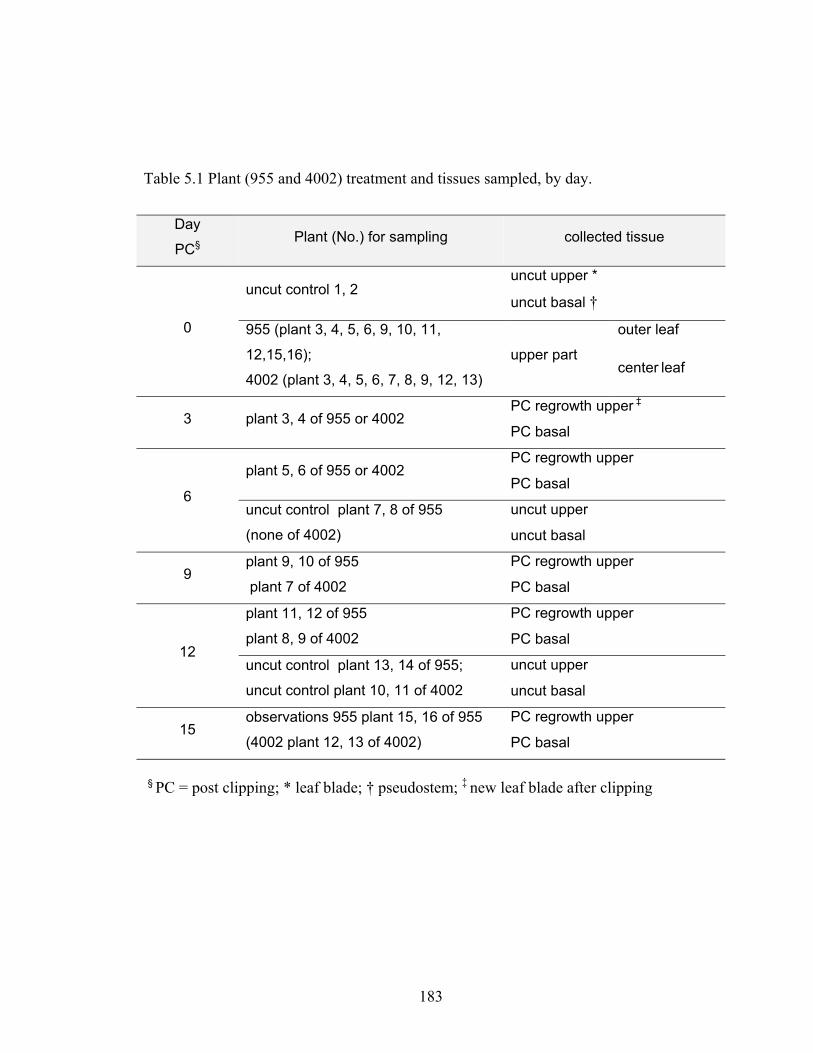
183
Table 5.1 Plant (955 and 4002) treatment and tissues sampled, by day.
Day
PC§ Plant (No.) for sampling collected tissue
0
uncut control 1, 2 uncut upper *
uncut basal †
955 (plant 3, 4, 5, 6, 9, 10, 11,
12,15,16);
4002 (plant 3, 4, 5, 6, 7, 8, 9, 12, 13)
upper part
outer leaf
center leaf
3 plant 3, 4 of 955 or 4002 PC regrowth upper ‡
PC basal
6
plant 5, 6 of 955 or 4002 PC regrowth upper
PC basal
uncut control plant 7, 8 of 955
(none of 4002)
uncut upper
uncut basal
9 plant 9, 10 of 955
plant 7 of 4002
PC regrowth upper
PC basal
12
plant 11, 12 of 955
plant 8, 9 of 4002
PC regrowth upper
PC basal
uncut control plant 13, 14 of 955;
uncut control plant 10, 11 of 4002
uncut upper
uncut basal
15 observations 955 plant 15, 16 of 955
(4002 plant 12, 13 of 4002)
PC regrowth upper
PC basal
§ PC = post clipping; * leaf blade; † pseudostem; ‡ new leaf blade after clipping
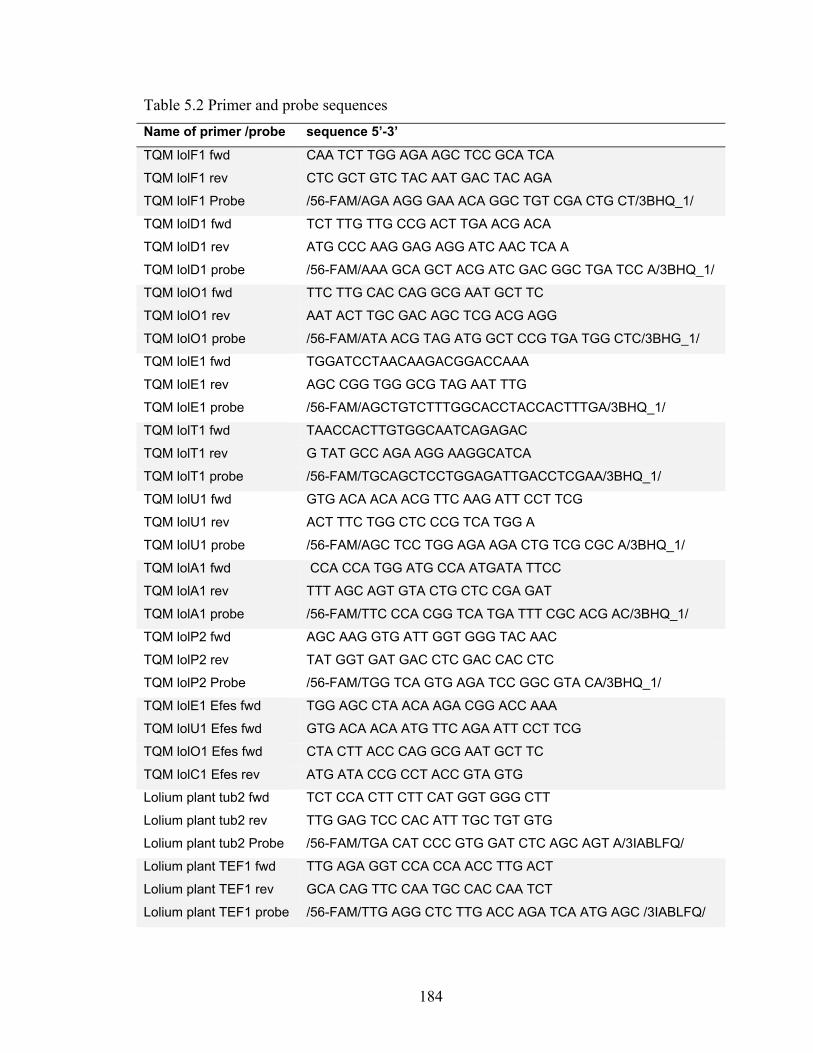
184
Table 5.2 Primer and probe sequences Name of primer /probe sequence 5’-3’
TQM lolF1 fwd CAA TCT TGG AGA AGC TCC GCA TCA
TQM lolF1 rev CTC GCT GTC TAC AAT GAC TAC AGA
TQM lolF1 Probe /56-FAM/AGA AGG GAA ACA GGC TGT CGA CTG CT/3BHQ_1/
TQM lolD1 fwd TCT TTG TTG CCG ACT TGA ACG ACA
TQM lolD1 rev ATG CCC AAG GAG AGG ATC AAC TCA A
TQM lolD1 probe /56-FAM/AAA GCA GCT ACG ATC GAC GGC TGA TCC A/3BHQ_1/
TQM lolO1 fwd TTC TTG CAC CAG GCG AAT GCT TC
TQM lolO1 rev AAT ACT TGC GAC AGC TCG ACG AGG
TQM lolO1 probe /56-FAM/ATA ACG TAG ATG GCT CCG TGA TGG CTC/3BHG_1/
TQM lolE1 fwd TGGATCCTAACAAGACGGACCAAA
TQM lolE1 rev AGC CGG TGG GCG TAG AAT TTG
TQM lolE1 probe /56-FAM/AGCTGTCTTTGGCACCTACCACTTTGA/3BHQ_1/
TQM lolT1 fwd TAACCACTTGTGGCAATCAGAGAC
TQM lolT1 rev G TAT GCC AGA AGG AAGGCATCA
TQM lolT1 probe /56-FAM/TGCAGCTCCTGGAGATTGACCTCGAA/3BHQ_1/
TQM lolU1 fwd GTG ACA ACA ACG TTC AAG ATT CCT TCG
TQM lolU1 rev ACT TTC TGG CTC CCG TCA TGG A
TQM lolU1 probe /56-FAM/AGC TCC TGG AGA AGA CTG TCG CGC A/3BHQ_1/
TQM lolA1 fwd CCA CCA TGG ATG CCA ATGATA TTCC
TQM lolA1 rev TTT AGC AGT GTA CTG CTC CGA GAT
TQM lolA1 probe /56-FAM/TTC CCA CGG TCA TGA TTT CGC ACG AC/3BHQ_1/
TQM lolP2 fwd AGC AAG GTG ATT GGT GGG TAC AAC
TQM lolP2 rev TAT GGT GAT GAC CTC GAC CAC CTC
TQM lolP2 Probe /56-FAM/TGG TCA GTG AGA TCC GGC GTA CA/3BHQ_1/
TQM lolE1 Efes fwd TGG AGC CTA ACA AGA CGG ACC AAA
TQM lolU1 Efes fwd GTG ACA ACA ATG TTC AGA ATT CCT TCG
TQM lolO1 Efes fwd CTA CTT ACC CAG GCG AAT GCT TC
TQM lolC1 Efes rev ATG ATA CCG CCT ACC GTA GTG
Lolium plant tub2 fwd TCT CCA CTT CTT CAT GGT GGG CTT
Lolium plant tub2 rev TTG GAG TCC CAC ATT TGC TGT GTG
Lolium plant tub2 Probe /56-FAM/TGA CAT CCC GTG GAT CTC AGC AGT A/3IABLFQ/
Lolium plant TEF1 fwd TTG AGA GGT CCA CCA ACC TTG ACT
Lolium plant TEF1 rev GCA CAG TTC CAA TGC CAC CAA TCT
Lolium plant TEF1 probe /56-FAM/TTG AGG CTC TTG ACC AGA TCA ATG AGC /3IABLFQ/
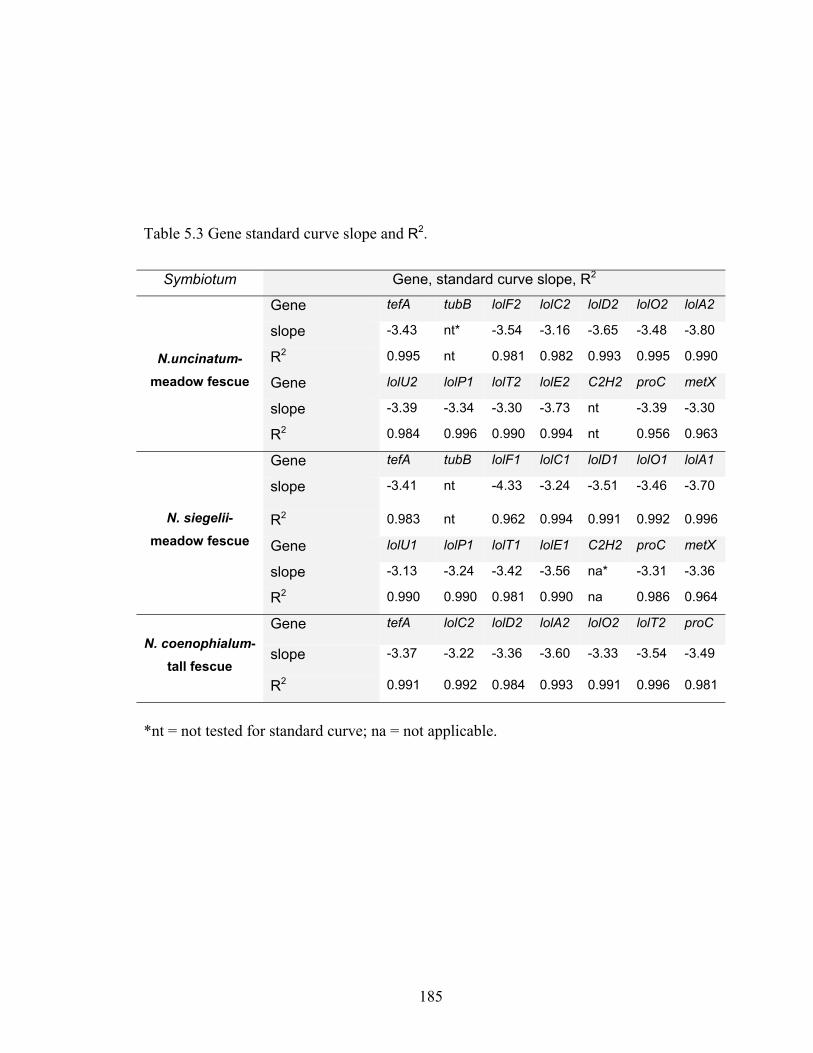
185
Table 5.3 Gene standard curve slope and R2.
Symbiotum Gene, standard curve slope, R2
N.uncinatum-meadow fescue
Gene tefA tubB lolF2 lolC2 lolD2 lolO2 lolA2
slope -3.43 nt* -3.54 -3.16 -3.65 -3.48 -3.80
R2 0.995 nt 0.981 0.982 0.993 0.995 0.990
Gene lolU2 lolP1 lolT2 lolE2 C2H2 proC metX
slope -3.39 -3.34 -3.30 -3.73 nt -3.39 -3.30
R2 0.984 0.996 0.990 0.994 nt 0.956 0.963
N. siegelii-meadow fescue
Gene tefA tubB lolF1 lolC1 lolD1 lolO1 lolA1
slope -3.41 nt -4.33 -3.24 -3.51 -3.46 -3.70
R2 0.983 nt 0.962 0.994 0.991 0.992 0.996
Gene lolU1 lolP1 lolT1 lolE1 C2H2 proC metX
slope -3.13 -3.24 -3.42 -3.56 na* -3.31 -3.36
R2 0.990 0.990 0.981 0.990 na 0.986 0.964
N. coenophialum-tall fescue
Gene tefA lolC2 lolD2 lolA2 lolO2 lolT2 proC
slope -3.37 -3.22 -3.36 -3.60 -3.33 -3.54 -3.49
R2 0.991 0.992 0.984 0.993 0.991 0.996 0.981
*nt = not tested for standard curve; na = not applicable.
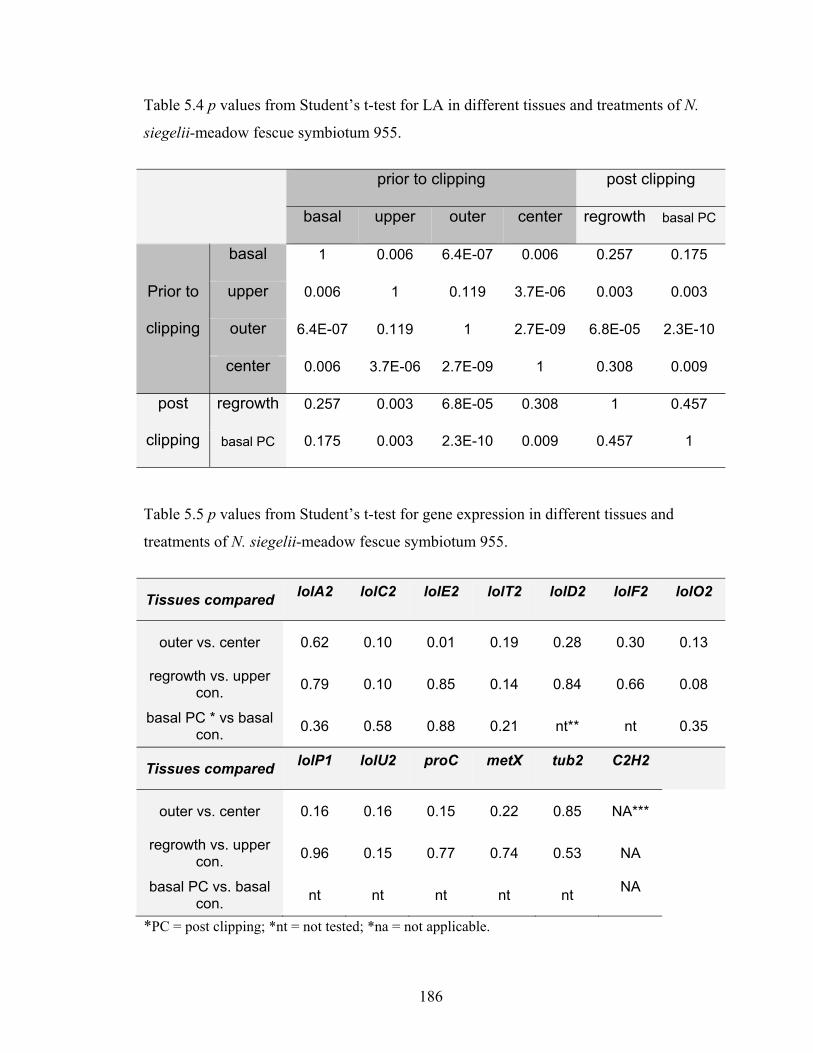
186
Table 5.4 p values from Student’s t-test for LA in different tissues and treatments of N.
siegelii-meadow fescue symbiotum 955.
prior to clipping post clipping
basal upper outer center regrowth basal PC
Prior to
clipping
basal 1 0.006 6.4E-07 0.006 0.257 0.175
upper 0.006 1 0.119 3.7E-06 0.003 0.003
outer 6.4E-07 0.119 1 2.7E-09 6.8E-05 2.3E-10
center 0.006 3.7E-06 2.7E-09 1 0.308 0.009
post
clipping
regrowth 0.257 0.003 6.8E-05 0.308 1 0.457
basal PC 0.175 0.003 2.3E-10 0.009 0.457 1
Table 5.5 p values from Student’s t-test for gene expression in different tissues and
treatments of N. siegelii-meadow fescue symbiotum 955.
Tissues compared lolA2 lolC2 lolE2 lolT2 lolD2 lolF2 lolO2
outer vs. center 0.62 0.10 0.01 0.19 0.28 0.30 0.13
regrowth vs. upper con. 0.79 0.10 0.85 0.14 0.84 0.66 0.08
basal PC * vs basal con. 0.36 0.58 0.88 0.21 nt** nt 0.35
Tissues compared lolP1 lolU2 proC metX tub2 C2H2
outer vs. center 0.16 0.16 0.15 0.22 0.85 NA***
regrowth vs. upper con. 0.96 0.15 0.77 0.74 0.53 NA
basal PC vs. basal con. nt nt nt nt nt NA
*PC = post clipping; *nt = not tested; *na = not applicable.
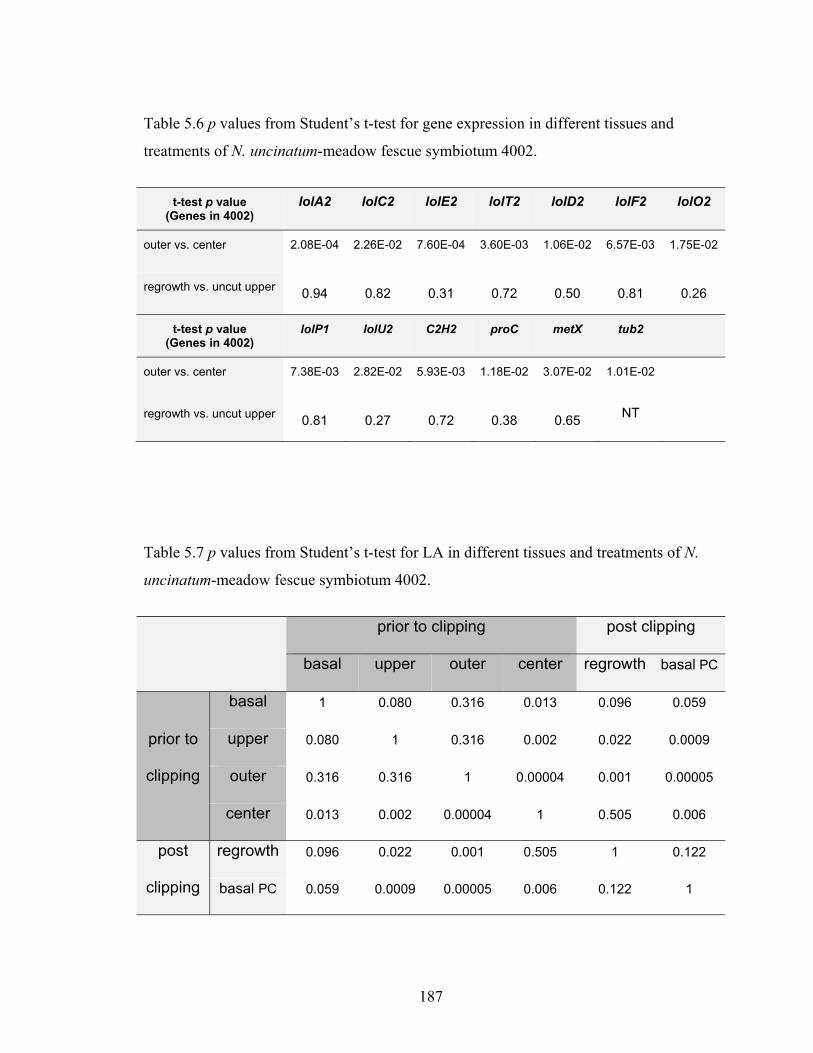
187
Table 5.6 p values from Student’s t-test for gene expression in different tissues and
treatments of N. uncinatum-meadow fescue symbiotum 4002.
t-test p value
(Genes in 4002) lolA2 lolC2 lolE2 lolT2 lolD2 lolF2 lolO2
outer vs. center 2.08E-04 2.26E-02 7.60E-04 3.60E-03 1.06E-02 6.57E-03 1.75E-02
regrowth vs. uncut upper 0.94 0.82 0.31 0.72 0.50 0.81 0.26
t-test p value (Genes in 4002)
lolP1 lolU2 C2H2 proC metX tub2
outer vs. center 7.38E-03 2.82E-02 5.93E-03 1.18E-02 3.07E-02 1.01E-02
regrowth vs. uncut upper 0.81 0.27 0.72 0.38 0.65 NT
Table 5.7 p values from Student’s t-test for LA in different tissues and treatments of N.
uncinatum-meadow fescue symbiotum 4002.
prior to clipping post clipping
basal upper outer center regrowth basal PC
prior to
clipping
basal 1 0.080 0.316 0.013 0.096 0.059
upper 0.080 1 0.316 0.002 0.022 0.0009
outer 0.316 0.316 1 0.00004 0.001 0.00005
center 0.013 0.002 0.00004 1 0.505 0.006
post
clipping
regrowth 0.096 0.022 0.001 0.505 1 0.122
basal PC 0.059 0.0009 0.00005 0.006 0.122 1
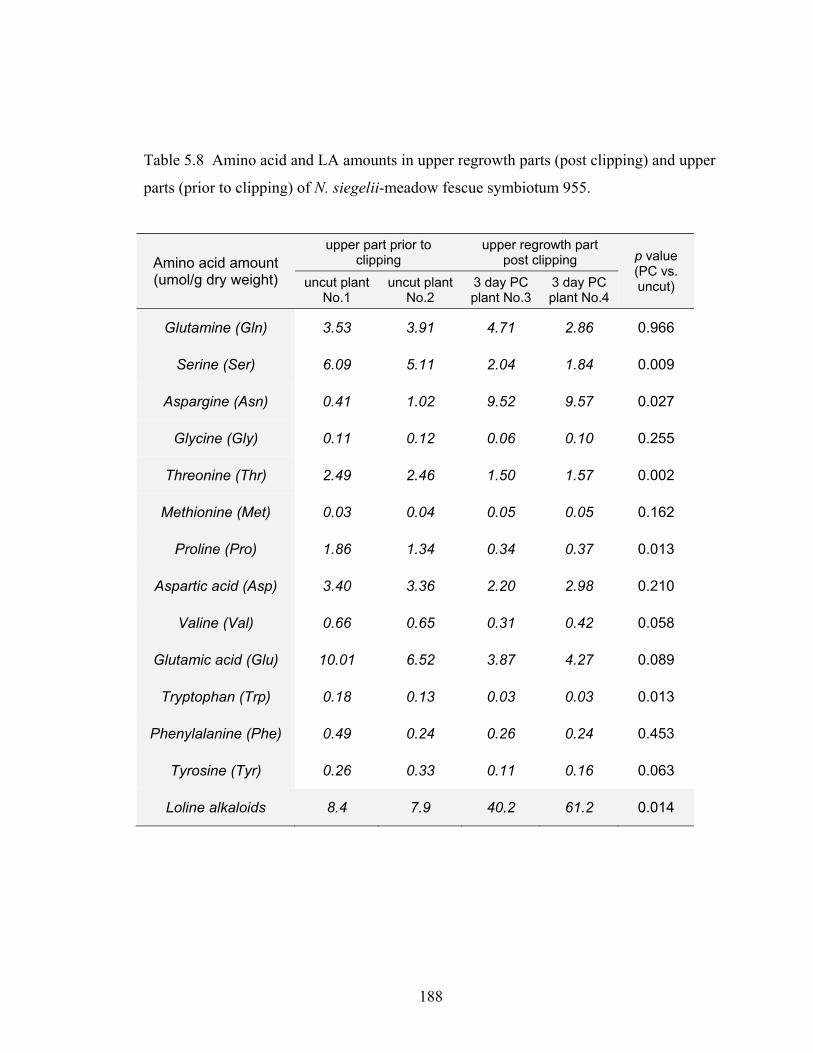
188
Table 5.8 Amino acid and LA amounts in upper regrowth parts (post clipping) and upper
parts (prior to clipping) of N. siegelii-meadow fescue symbiotum 955.
Amino acid amount (umol/g dry weight)
upper part prior to clipping
upper regrowth part post clipping p value
(PC vs. uncut) uncut plant
No.1 uncut plant
No.2 3 day PC plant No.3
3 day PC plant No.4
Glutamine (Gln) 3.53 3.91 4.71 2.86 0.966
Serine (Ser) 6.09 5.11 2.04 1.84 0.009
Aspargine (Asn) 0.41 1.02 9.52 9.57 0.027
Glycine (Gly) 0.11 0.12 0.06 0.10 0.255
Threonine (Thr) 2.49 2.46 1.50 1.57 0.002
Methionine (Met) 0.03 0.04 0.05 0.05 0.162
Proline (Pro) 1.86 1.34 0.34 0.37 0.013
Aspartic acid (Asp) 3.40 3.36 2.20 2.98 0.210
Valine (Val) 0.66 0.65 0.31 0.42 0.058
Glutamic acid (Glu) 10.01 6.52 3.87 4.27 0.089
Tryptophan (Trp) 0.18 0.13 0.03 0.03 0.013
Phenylalanine (Phe) 0.49 0.24 0.26 0.24 0.453
Tyrosine (Tyr) 0.26 0.33 0.11 0.16 0.063
Loline alkaloids 8.4 7.9 40.2 61.2 0.014

189
Figure 5.1 Tissues clipped and sampled from endophyte-meadow fescue symbiota. A-D: N. uncinatum-meadow fescue symbiotum 4002; E-H: N. siegelii-meadow fescue symbiotum 955. A and E: clipping site; B and F: upper part (showing some outer independent leaf blades without center leaf); C and G: basal part; D and H: separating center leaf (solid arrow) and outer leaf (dashed arrow) from the upper part, the outer leaf blade would be pooled together with the independent outer part shown in B or F.
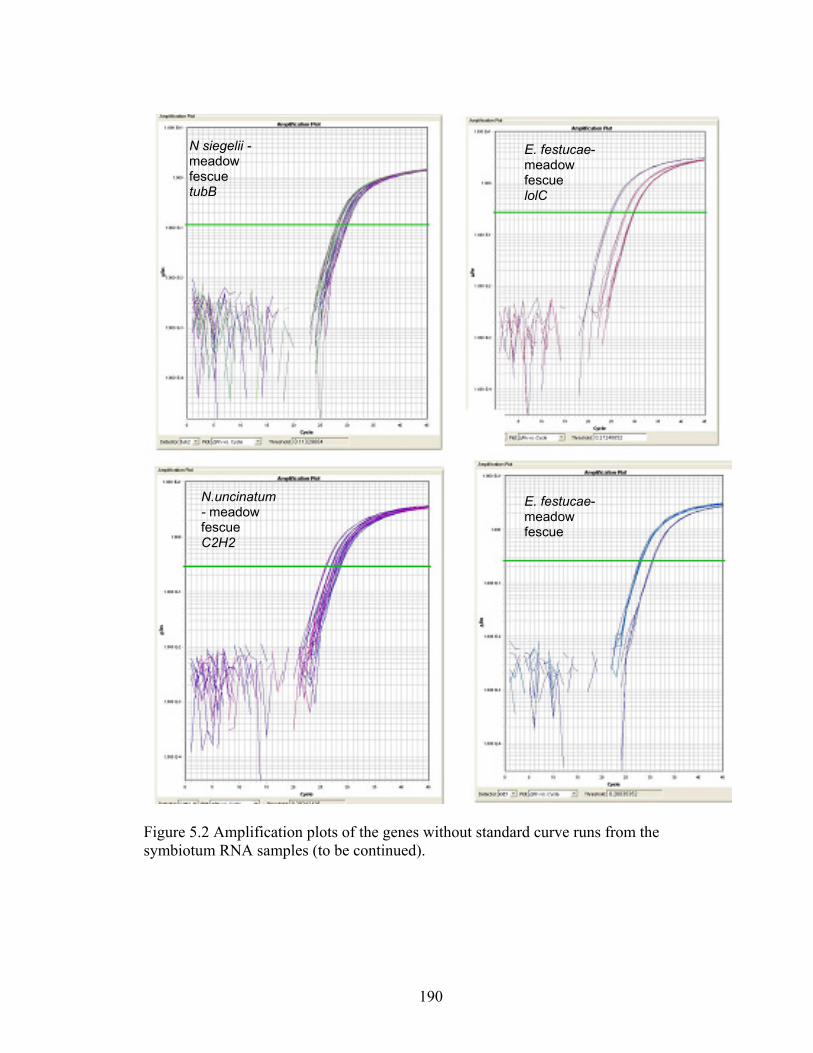
190
Figure 5.2 Amplification plots of the genes without standard curve runs from the symbiotum RNA samples (to be continued).
N siegelii -meadow fescue tubB
N.uncinatum- meadow fescue C2H2
E. festucae- meadow fescue lolC E. festucae- meadow fescue
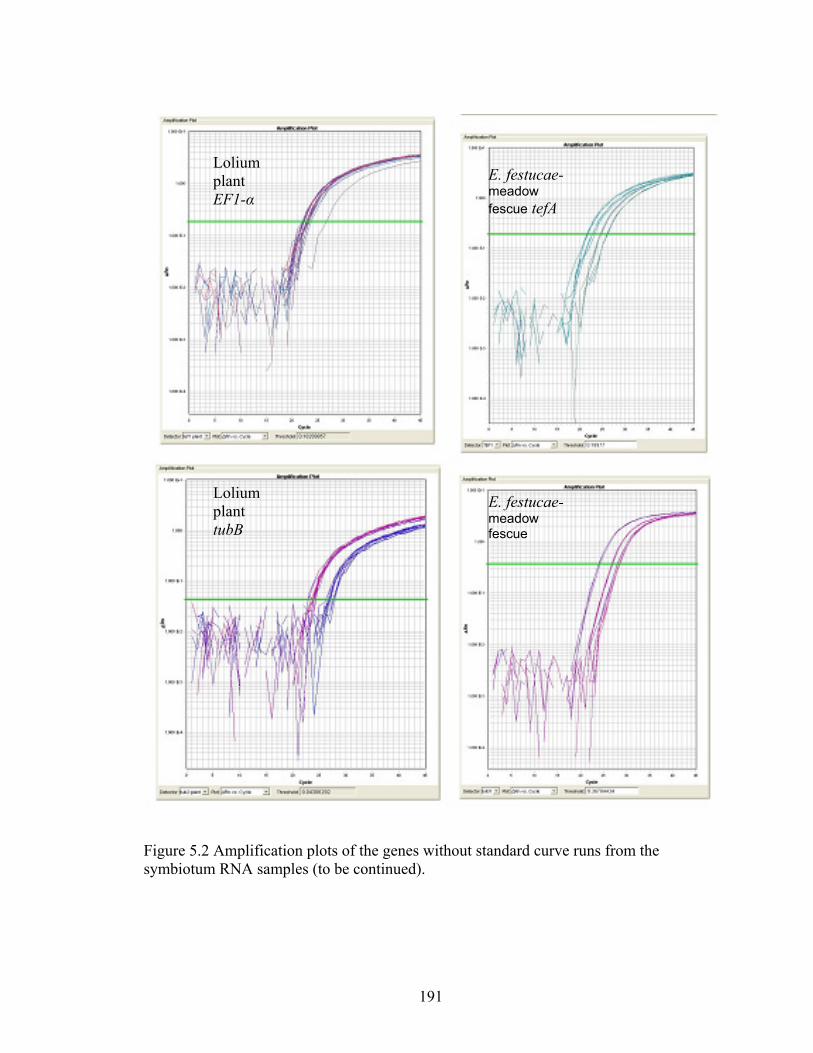
191
Figure 5.2 Amplification plots of the genes without standard curve runs from the symbiotum RNA samples (to be continued).
Lolium plant EF1-α Lolium plant tubB
E. festucae- meadow fescue tefA E. festucae- meadow fescue
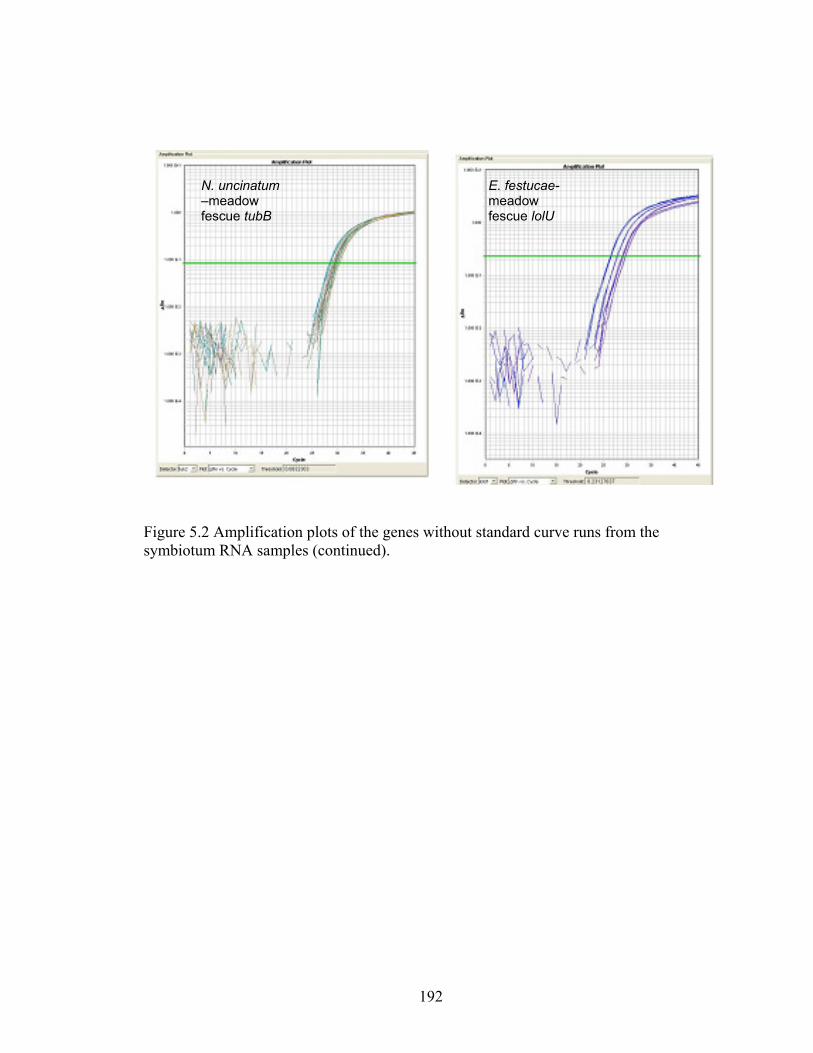
192
Figure 5.2 Amplification plots of the genes without standard curve runs from the symbiotum RNA samples (continued).
N. uncinatum –meadow fescue tubB
E. festucae- meadow fescue lolU
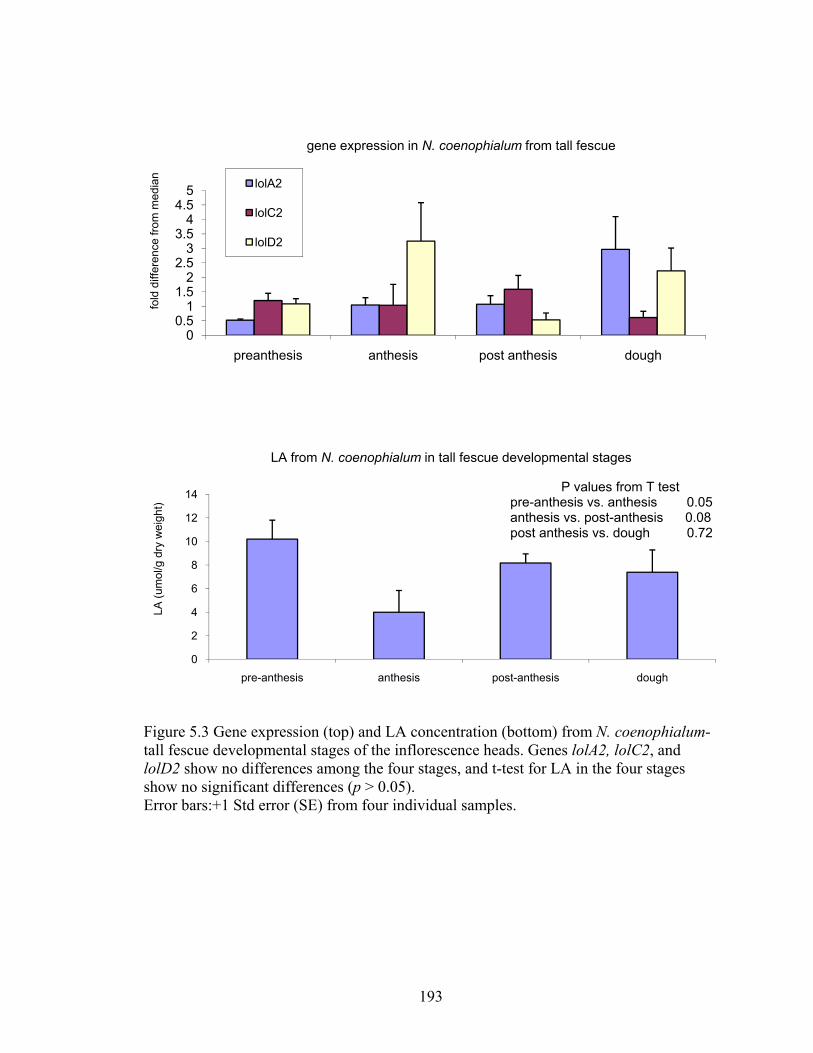
193
Figure 5.3 Gene expression (top) and LA concentration (bottom) from N. coenophialum-tall fescue developmental stages of the inflorescence heads. Genes lolA2, lolC2, and lolD2 show no differences among the four stages, and t-test for LA in the four stages show no significant differences (p > 0.05). Error bars:+1 Std error (SE) from four individual samples.
00.5
11.5
22.5
33.5
44.5
5
preanthesis anthesis post anthesis dough
fold
diff
eren
ce fr
om m
edia
ngene expression in N. coenophialum from tall fescue
lolA2
lolC2
lolD2
0
2
4
6
8
10
12
14
pre-anthesis anthesis post-anthesis dough
LA (u
mol
/g d
ry w
eigh
t)
LA from N. coenophialum in tall fescue developmental stages
P values from T test pre-anthesis vs. anthesis 0.05 anthesis vs. post-anthesis 0.08 post anthesis vs. dough 0.72
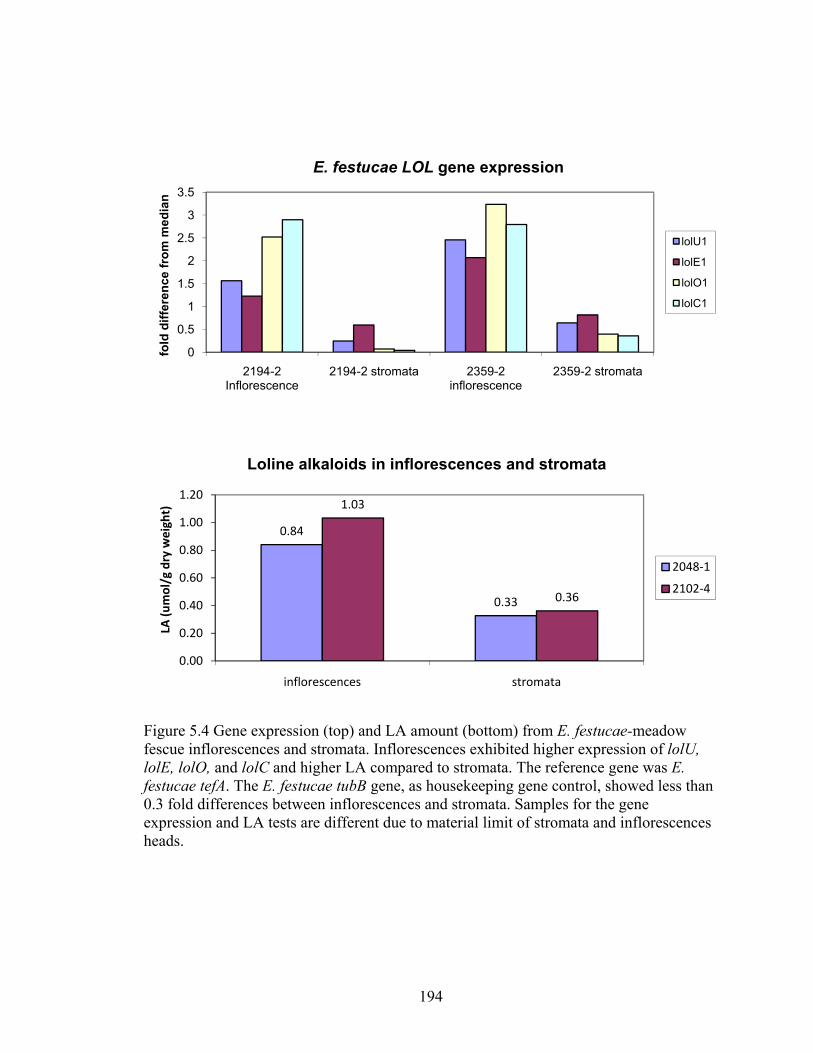
194
Figure 5.4 Gene expression (top) and LA amount (bottom) from E. festucae-meadow fescue inflorescences and stromata. Inflorescences exhibited higher expression of lolU, lolE, lolO, and lolC and higher LA compared to stromata. The reference gene was E. festucae tefA. The E. festucae tubB gene, as housekeeping gene control, showed less than 0.3 fold differences between inflorescences and stromata. Samples for the gene expression and LA tests are different due to material limit of stromata and inflorescences heads.
0
0.5
1
1.5
2
2.5
3
3.5
2194-2 Inflorescence
2194-2 stromata 2359-2 inflorescence
2359-2 stromata
fold
diff
eren
ce fr
om m
edia
nE. festucae LOL gene expression
lolU1
lolE1
lolO1
lolC1
0.84
0.33
1.03
0.36
0.00
0.20
0.40
0.60
0.80
1.00
1.20
inflorescences stromata
LA (u
mol/g dry weight)
Loline alkaloids in inflorescences and stromata
2048‐1
2102‐4
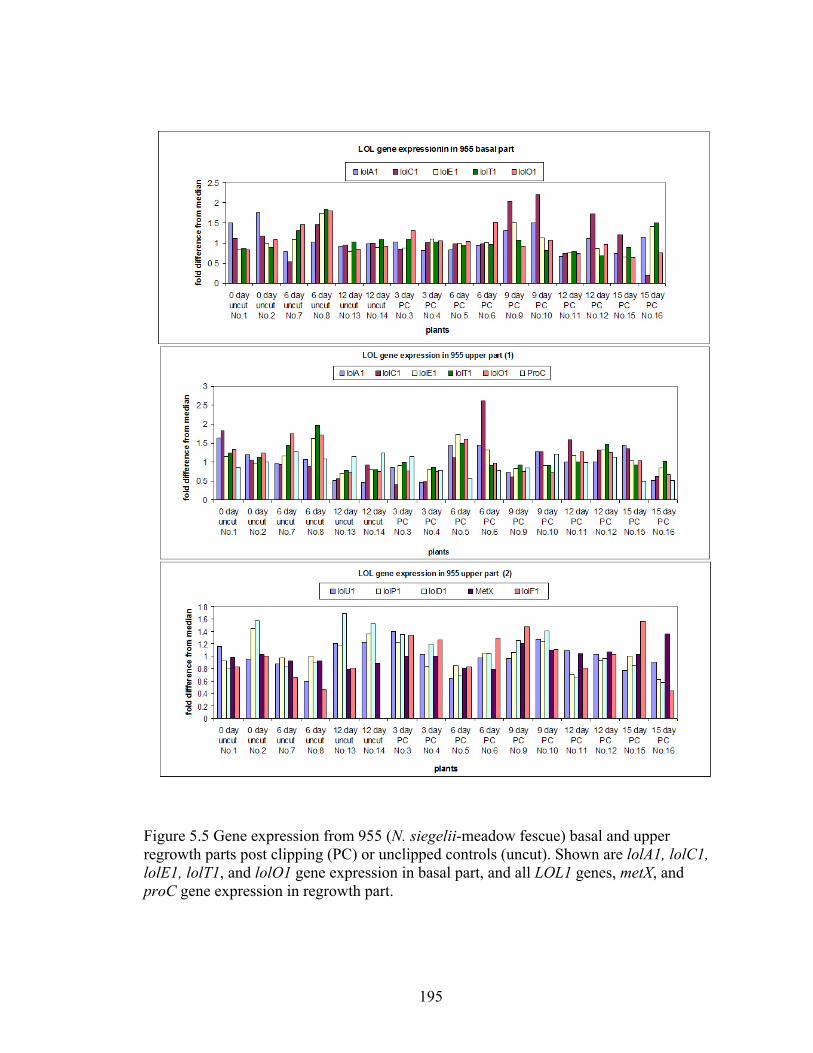
195
Figure 5.5 Gene expression from 955 (N. siegelii-meadow fescue) basal and upper regrowth parts post clipping (PC) or unclipped controls (uncut). Shown are lolA1, lolC1, lolE1, lolT1, and lolO1 gene expression in basal part, and all LOL1 genes, metX, and proC gene expression in regrowth part.
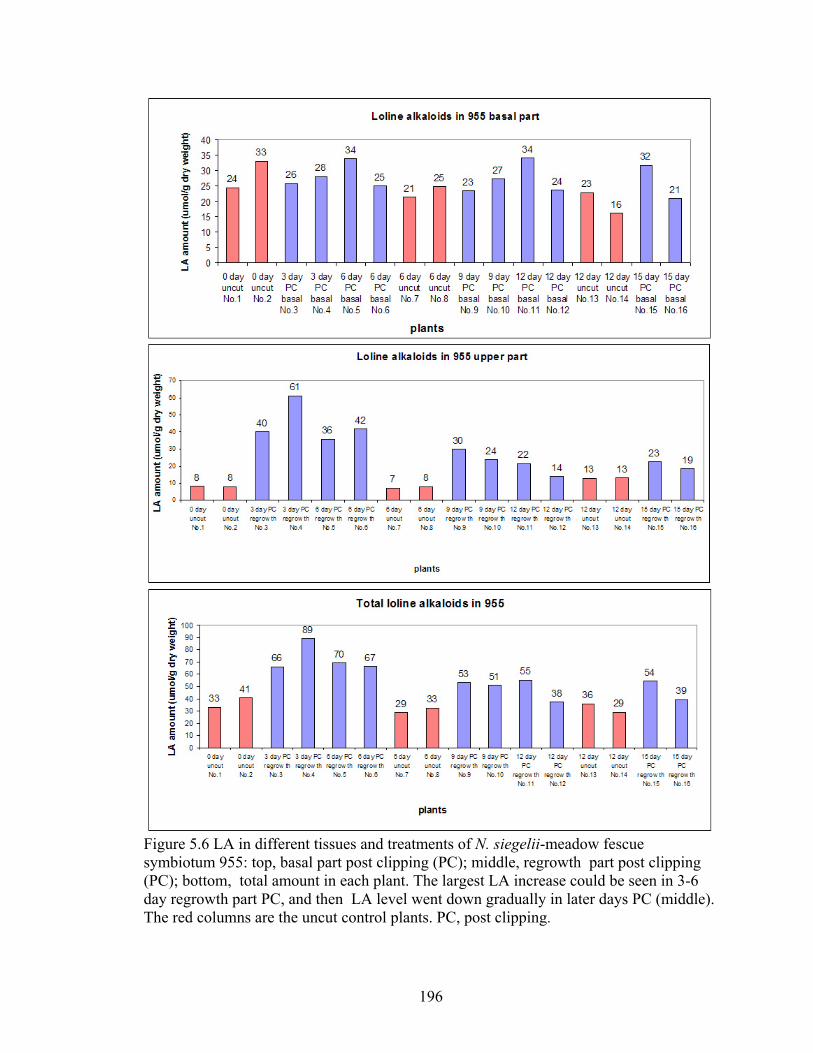
196
Figure 5.6 LA in different tissues and treatments of N. siegelii-meadow fescue symbiotum 955: top, basal part post clipping (PC); middle, regrowth part post clipping (PC); bottom, total amount in each plant. The largest LA increase could be seen in 3-6 day regrowth part PC, and then LA level went down gradually in later days PC (middle). The red columns are the uncut control plants. PC, post clipping.
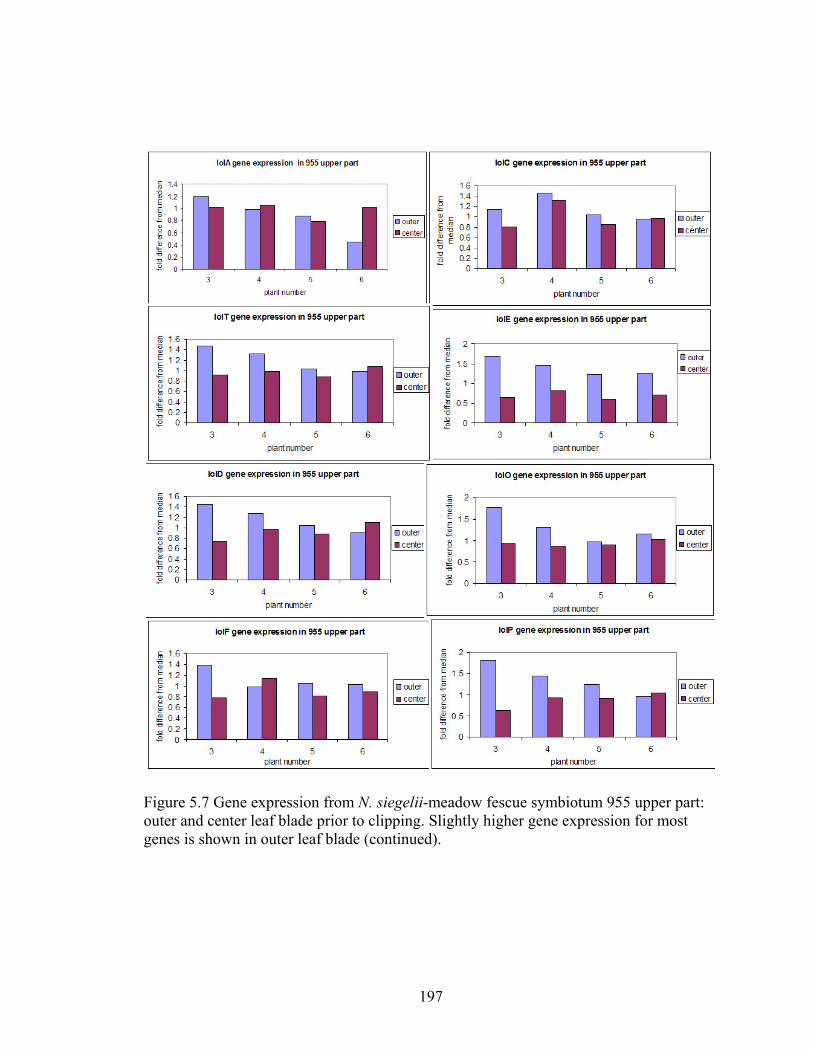
197
Figure 5.7 Gene expression from N. siegelii-meadow fescue symbiotum 955 upper part: outer and center leaf blade prior to clipping. Slightly higher gene expression for most genes is shown in outer leaf blade (continued).
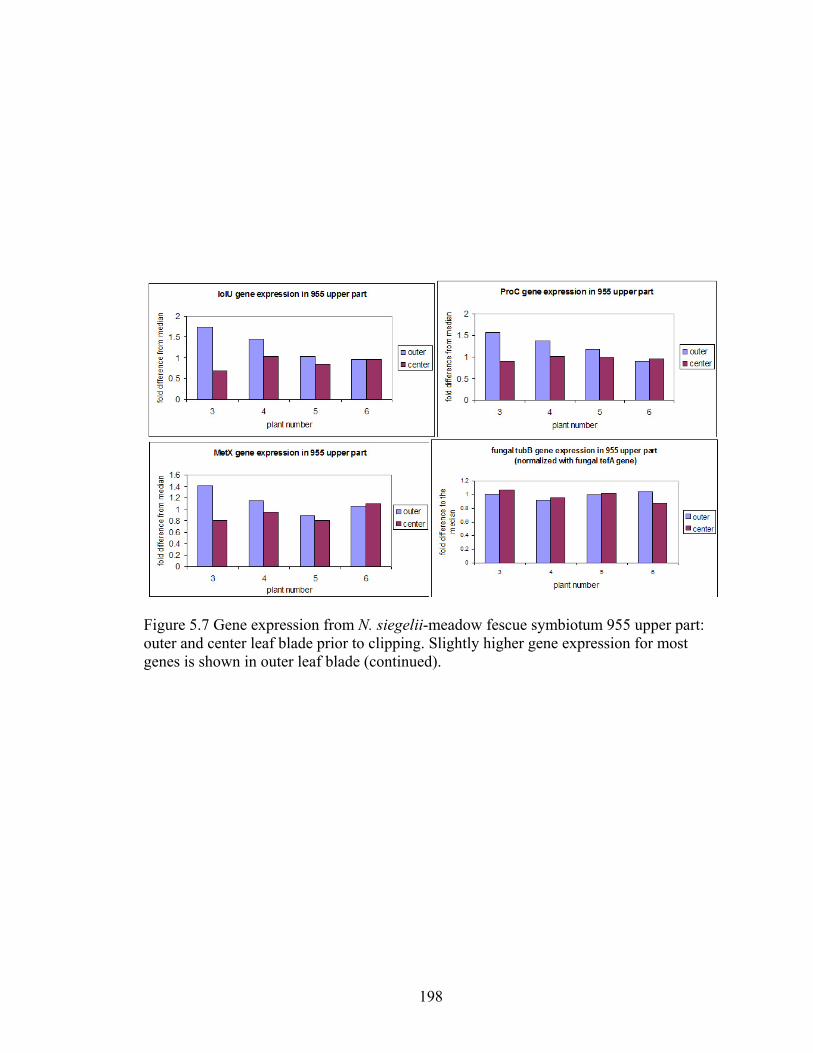
198
Figure 5.7 Gene expression from N. siegelii-meadow fescue symbiotum 955 upper part: outer and center leaf blade prior to clipping. Slightly higher gene expression for most genes is shown in outer leaf blade (continued).
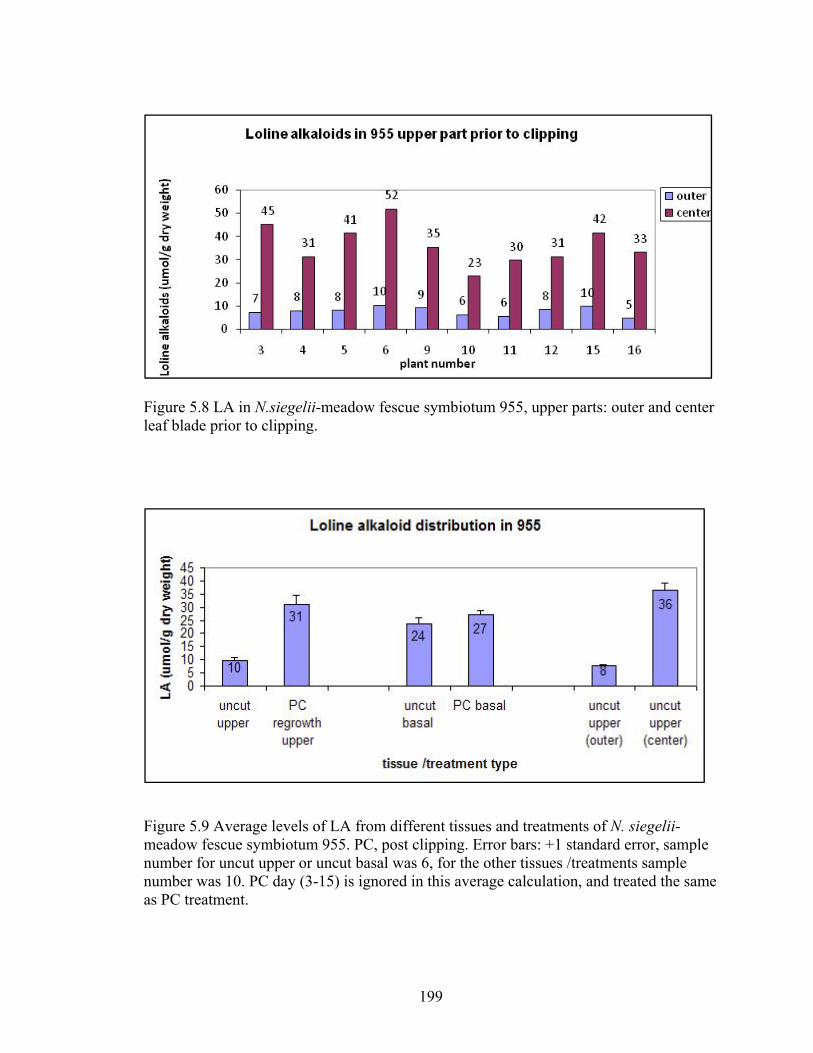
199
Figure 5.8 LA in N.siegelii-meadow fescue symbiotum 955, upper parts: outer and center leaf blade prior to clipping.
Figure 5.9 Average levels of LA from different tissues and treatments of N. siegelii-meadow fescue symbiotum 955. PC, post clipping. Error bars: +1 standard error, sample number for uncut upper or uncut basal was 6, for the other tissues /treatments sample number was 10. PC day (3-15) is ignored in this average calculation, and treated the same as PC treatment.
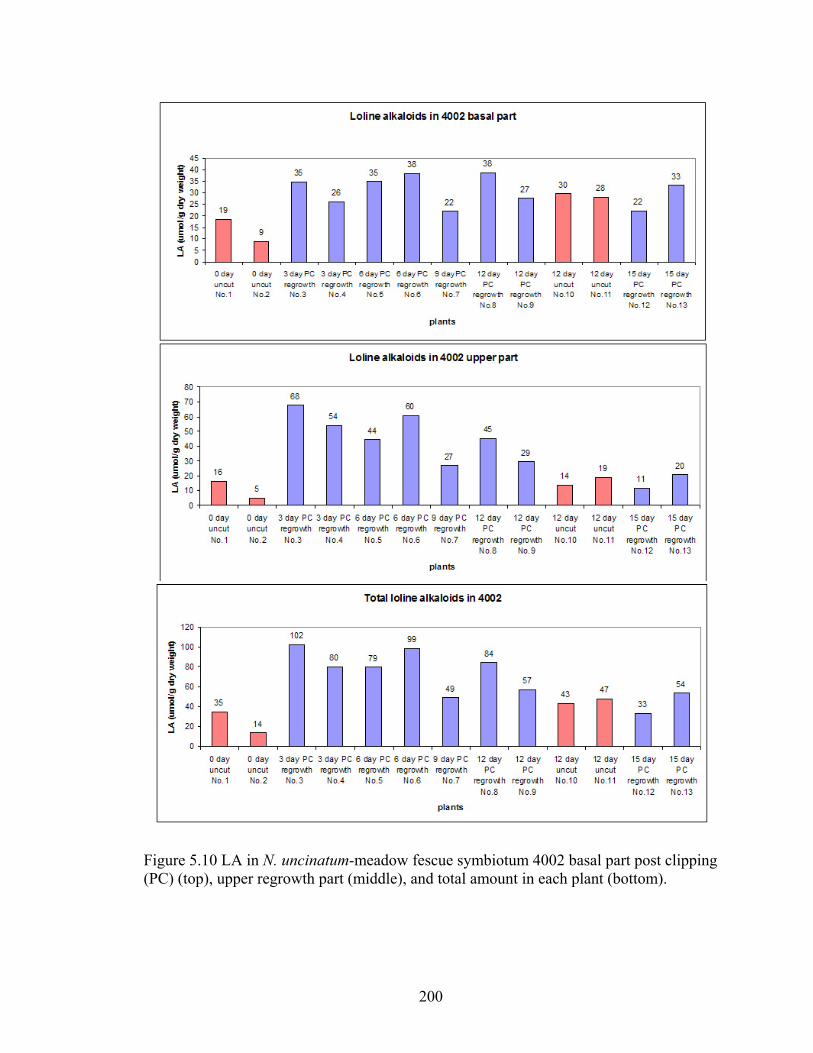
200
Figure 5.10 LA in N. uncinatum-meadow fescue symbiotum 4002 basal part post clipping (PC) (top), upper regrowth part (middle), and total amount in each plant (bottom).
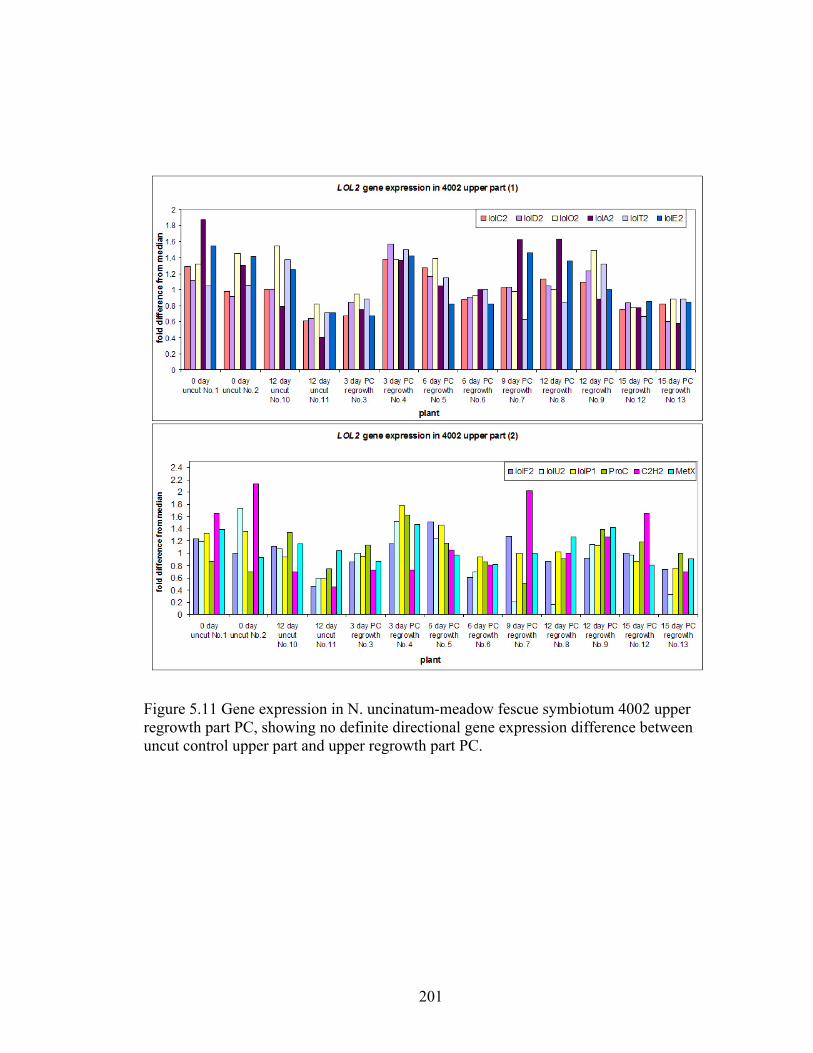
201
Figure 5.11 Gene expression in N. uncinatum-meadow fescue symbiotum 4002 upper regrowth part PC, showing no definite directional gene expression difference between uncut control upper part and upper regrowth part PC.
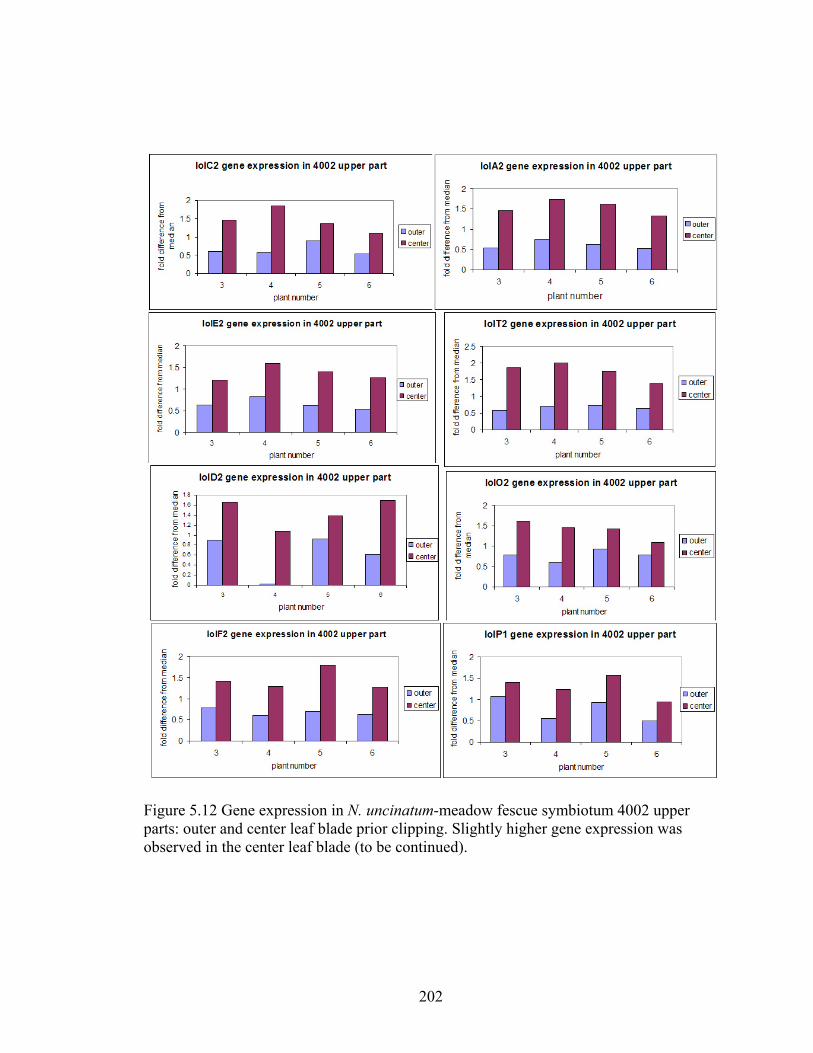
202
Figure 5.12 Gene expression in N. uncinatum-meadow fescue symbiotum 4002 upper parts: outer and center leaf blade prior clipping. Slightly higher gene expression was observed in the center leaf blade (to be continued).
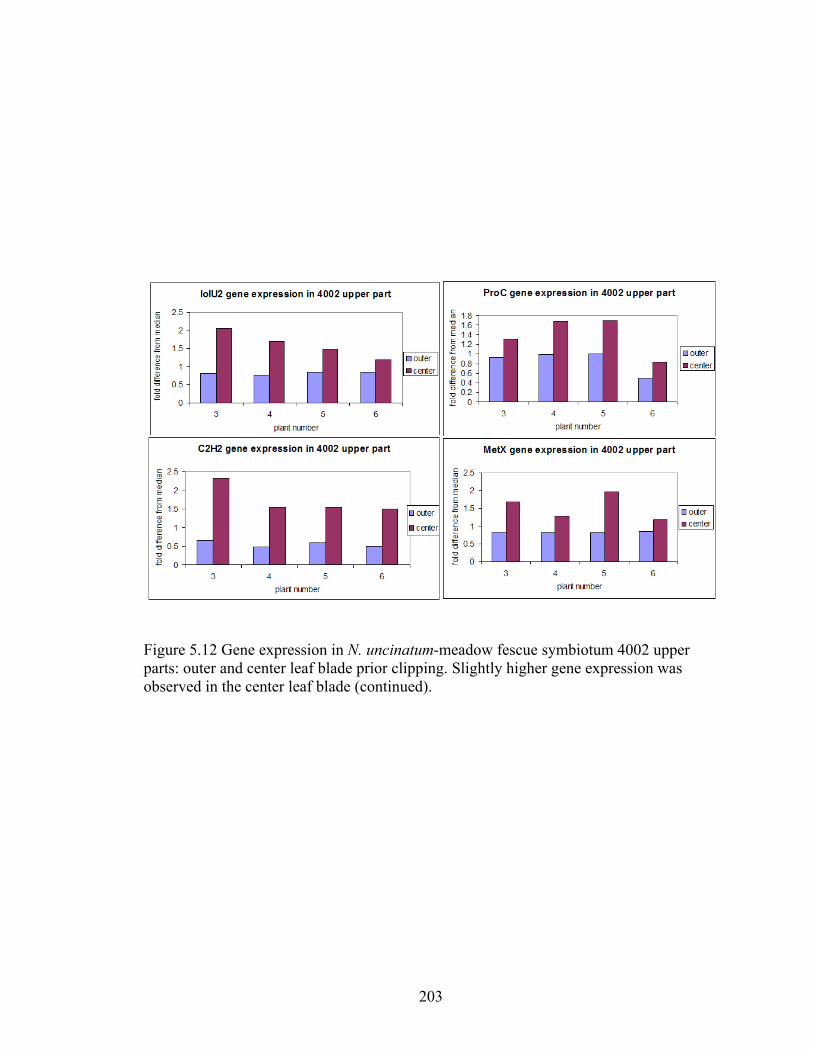
203
Figure 5.12 Gene expression in N. uncinatum-meadow fescue symbiotum 4002 upper parts: outer and center leaf blade prior clipping. Slightly higher gene expression was observed in the center leaf blade (continued).
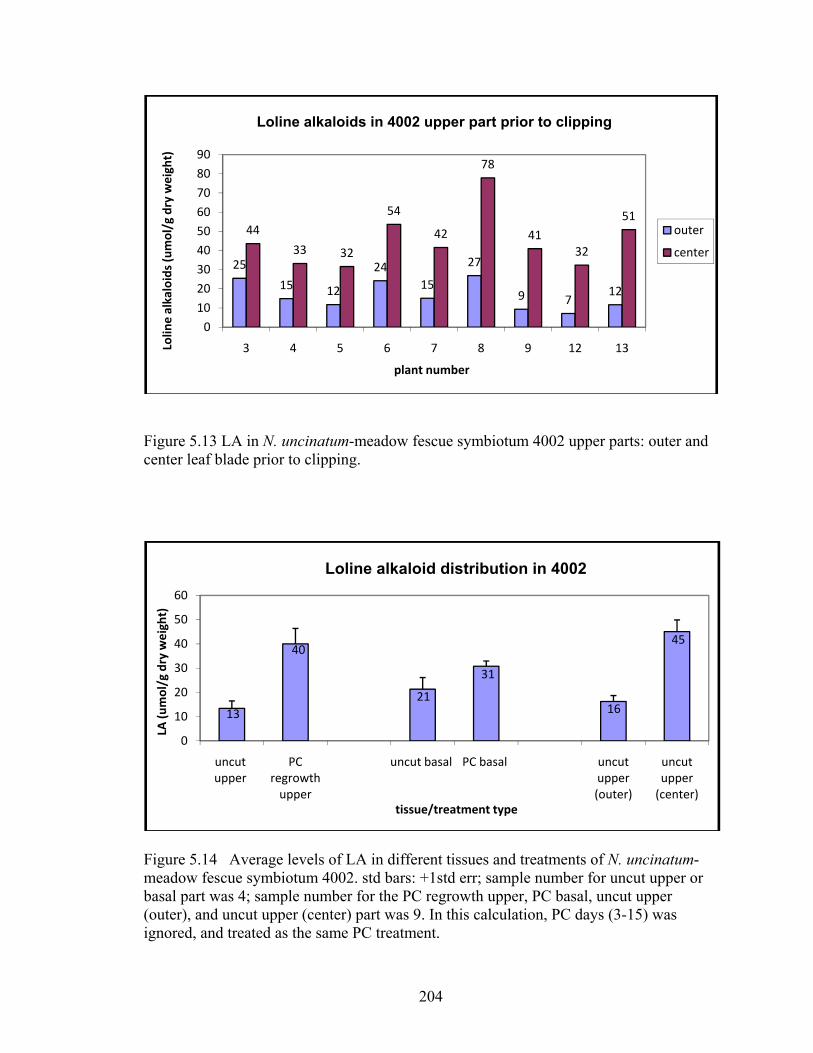
204
Figure 5.13 LA in N. uncinatum-meadow fescue symbiotum 4002 upper parts: outer and center leaf blade prior to clipping.
Figure 5.14 Average levels of LA in different tissues and treatments of N. uncinatum-meadow fescue symbiotum 4002. std bars: +1std err; sample number for uncut upper or basal part was 4; sample number for the PC regrowth upper, PC basal, uncut upper (outer), and uncut upper (center) part was 9. In this calculation, PC days (3-15) was ignored, and treated as the same PC treatment.
25
15 12
2415
27
9 712
44
33 32
54
42
78
4132
51
0
10
20
30
40
50
60
70
80
90
3 4 5 6 7 8 9 12 13Lolin
e alkaloids (umol/g dry weight)
plant number
Loline alkaloids in 4002 upper part prior to clipping
outer
center
13
40
21
31
16
45
0
10
20
30
40
50
60
uncut upper
PC regrowth upper
uncut basal PC basal uncut upper (outer)
uncut upper (center)
LA (u
mol/g dry weight)
tissue/treatment type
Loline alkaloid distribution in 4002
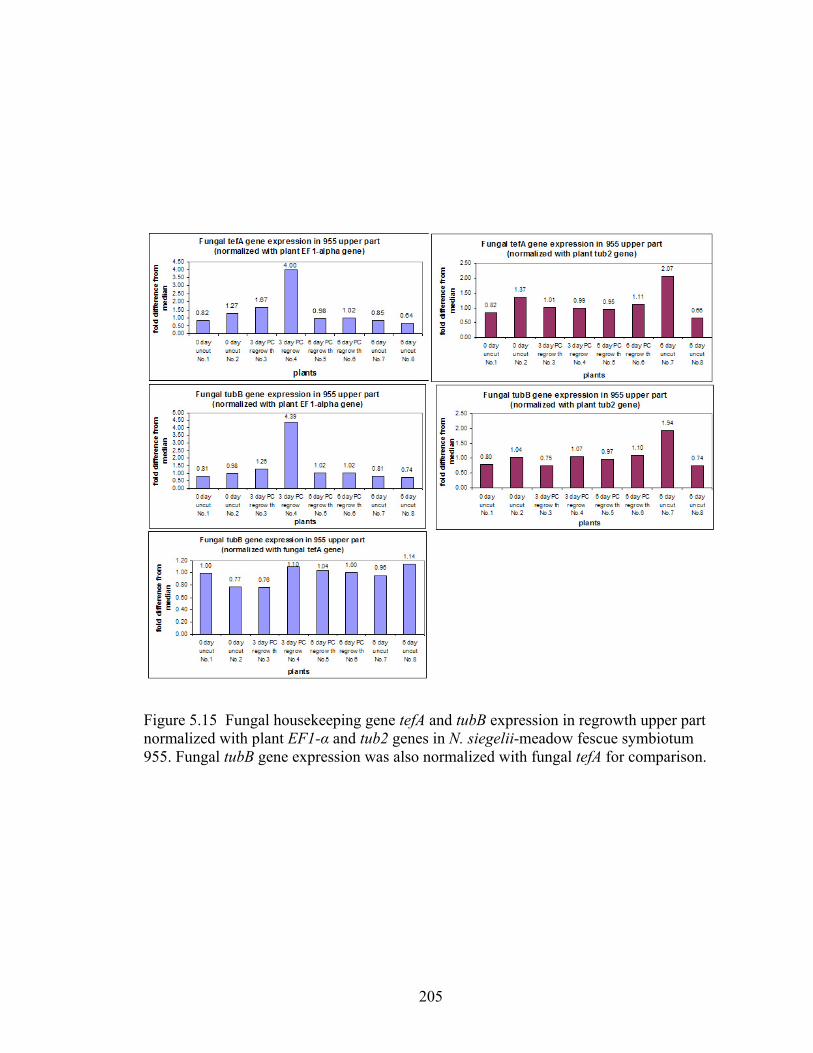
205
Figure 5.15 Fungal housekeeping gene tefA and tubB expression in regrowth upper part normalized with plant EF1-α and tub2 genes in N. siegelii-meadow fescue symbiotum 955. Fungal tubB gene expression was also normalized with fungal tefA for comparison.
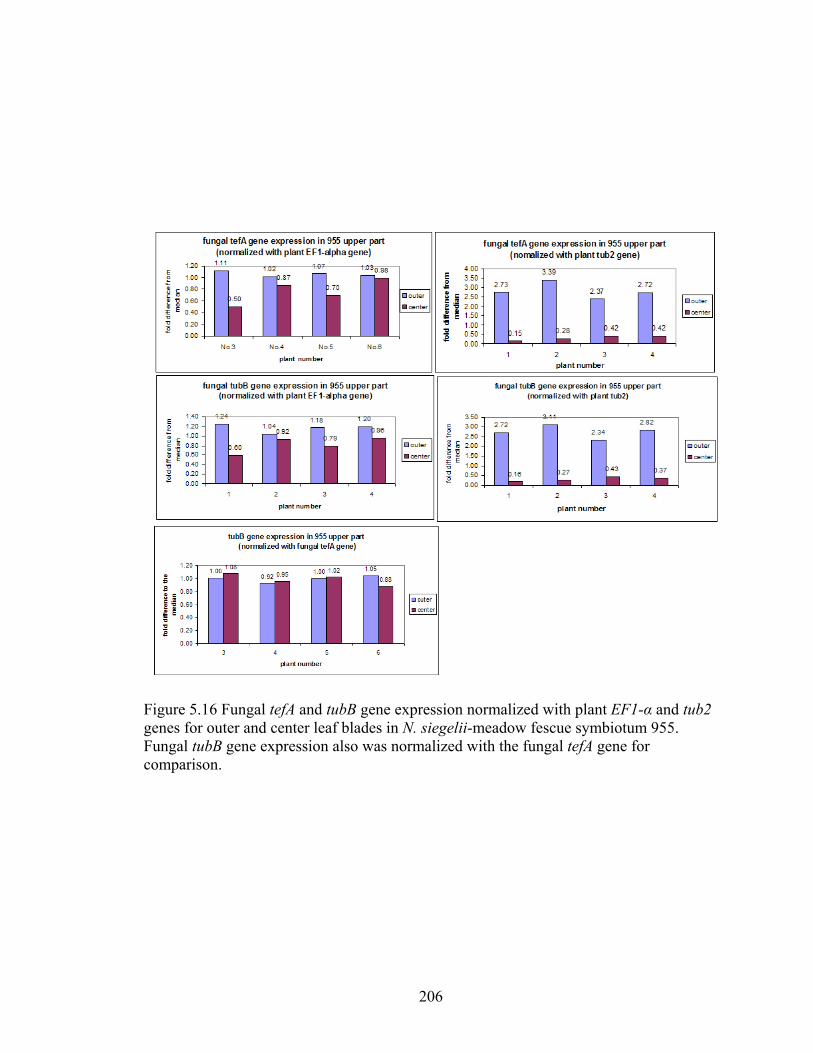
206
Figure 5.16 Fungal tefA and tubB gene expression normalized with plant EF1-α and tub2 genes for outer and center leaf blades in N. siegelii-meadow fescue symbiotum 955. Fungal tubB gene expression also was normalized with the fungal tefA gene for comparison.
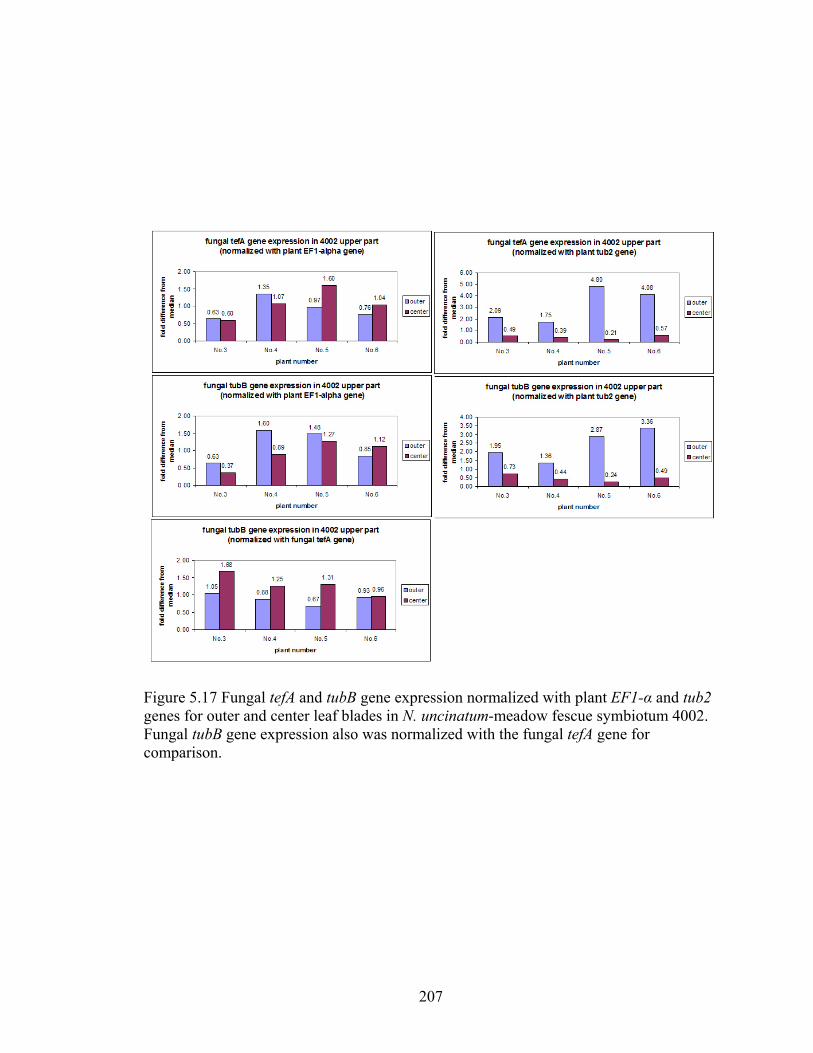
207
Figure 5.17 Fungal tefA and tubB gene expression normalized with plant EF1-α and tub2 genes for outer and center leaf blades in N. uncinatum-meadow fescue symbiotum 4002. Fungal tubB gene expression also was normalized with the fungal tefA gene for comparison.
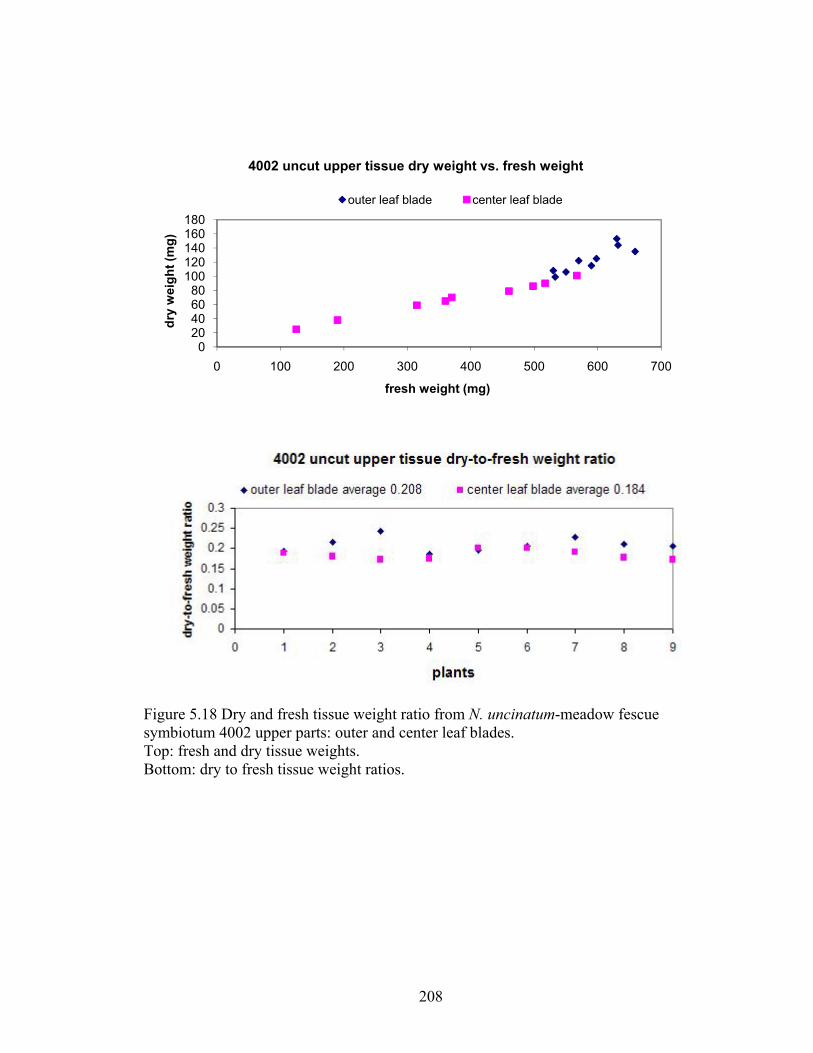
208
Figure 5.18 Dry and fresh tissue weight ratio from N. uncinatum-meadow fescue symbiotum 4002 upper parts: outer and center leaf blades. Top: fresh and dry tissue weights. Bottom: dry to fresh tissue weight ratios.
020406080
100120140160180
0 100 200 300 400 500 600 700
dry
wei
ght (
mg)
fresh weight (mg)
4002 uncut upper tissue dry weight vs. fresh weight
outer leaf blade center leaf blade
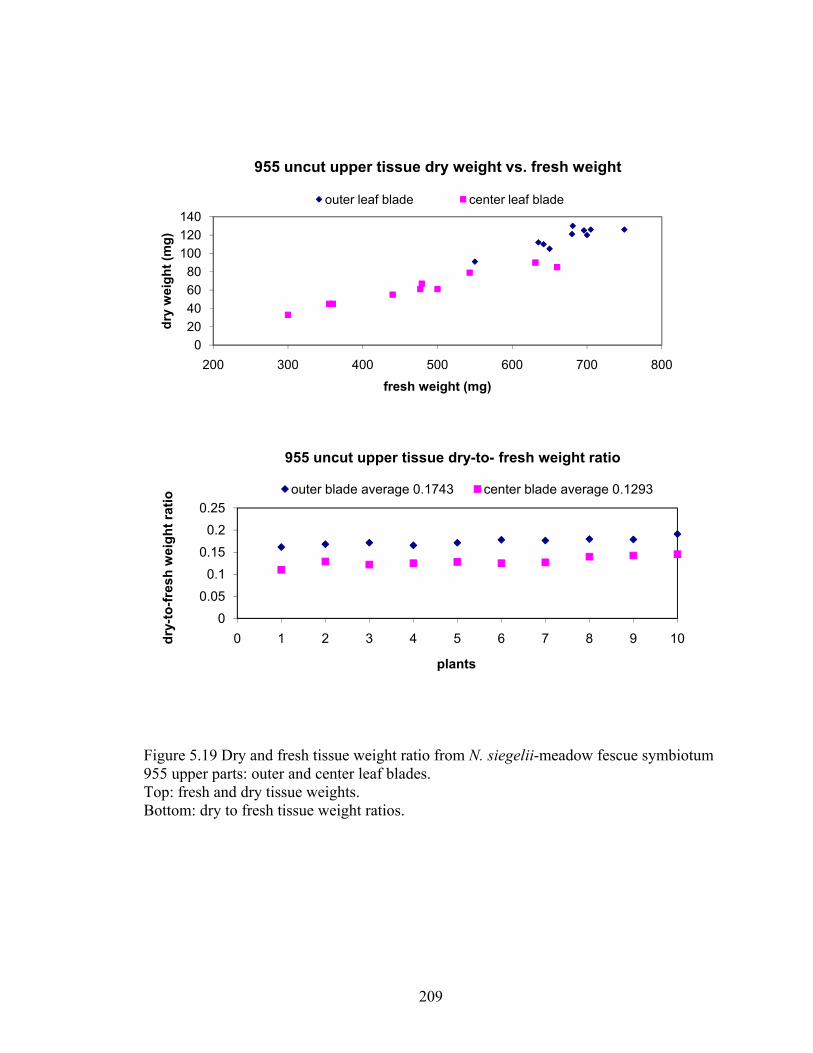
209
Figure 5.19 Dry and fresh tissue weight ratio from N. siegelii-meadow fescue symbiotum 955 upper parts: outer and center leaf blades. Top: fresh and dry tissue weights. Bottom: dry to fresh tissue weight ratios.
020406080
100120140
200 300 400 500 600 700 800
dry
wei
ght (
mg)
fresh weight (mg)
955 uncut upper tissue dry weight vs. fresh weight
outer leaf blade center leaf blade
00.05
0.10.15
0.20.25
0 1 2 3 4 5 6 7 8 9 10dry-
to-fr
esh
wei
ght r
atio
plants
955 uncut upper tissue dry-to- fresh weight ratio
outer blade average 0.1743 center blade average 0.1293
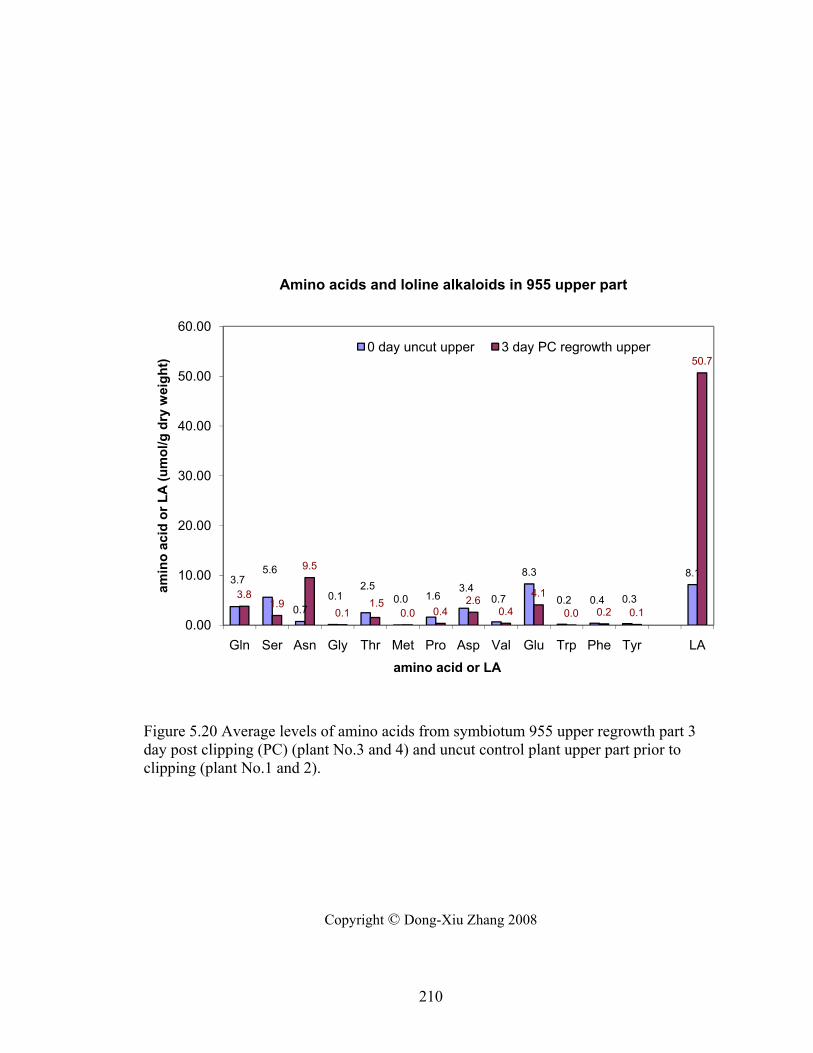
210
Figure 5.20 Average levels of amino acids from symbiotum 955 upper regrowth part 3 day post clipping (PC) (plant No.3 and 4) and uncut control plant upper part prior to clipping (plant No.1 and 2).
Copyright © Dong-Xiu Zhang 2008
3.75.6
0.70.1
2.50.0 1.6
3.40.7
8.3
0.2 0.4 0.3
8.1
3.81.9
9.5
0.11.5
0.0 0.42.6
0.4
4.1
0.0 0.2 0.1
50.7
0.00
10.00
20.00
30.00
40.00
50.00
60.00
Gln Ser Asn Gly Thr Met Pro Asp Val Glu Trp Phe Tyr LA
amin
o ac
id o
r LA
(um
ol/g
dry
wei
ght)
amino acid or LA
Amino acids and loline alkaloids in 955 upper part
0 day uncut upper 3 day PC regrowth upper
211
CHAPTER 6
Conclusions and Discussion
LA are secondary metabolites produced by Epichloë endophytes in a broad range
of cool-season grasses. LA do no harm to livestock, but instead have been reported as
feeding deterrent and toxic to various herbivorous insects. This specific bioprotective
activity of LA has therefore attracted great interest in researchers. Much attention has
been drawn to where LA are, how LA are produced, and how LA level is controlled.
In my study, expression profiles of LOL-2 genes in WT N.uncinatum and the Pro-
lolA2-GUS tranformant, 188b6N, were tightly coregulated with each other (p < 0.0005)
during LA production in MM culture. Expression of all tested LOL genes showed a
significant temporal quadratic pattern during the process of LA production, which
indicates a relationship between LOL gene expression and LA production. Gene
expression was detectable before LA production, and increased as LA accumulated. The
highest expression level was reached before the highest LA level was detected in culture,
and gene expression level gradually declined to a very low level after LA level reached a
plateau indicating the stop of production.
Some subsets of LOL genes showed very closely correlated expression patterns.
Particularly in WT, lolC, hypothesized to encode the enzyme catalyzing the first step in
loline biosynthesis, and lolA, a gene putatively involved in recruiting amino acid
precursors to the loline pathway, showed very strong correlation (R = 0.9877; P <
0.0001), as did lolT and lolE, two genes sharing their promoter regions (R = 0.9866; P <
0.0001). The hierarchical cluster based on correlation coefficients from temporal gene
expression was observed to predict coregulated subsets and sequences involved in the
regulation of the LA pathway. Specific steps of roles are predicted for the enzymes
encoded by genes lolT2, lolE2, lolF2, and lolO2 based on the gene temporal expression
cluster analysis. During the same time course, two genes (proC and metX) for
biosynthesis of LA-precursor amino acids, and the tubB gene for β-tubulin, showed less
212
correlation with LOL gene expression, whereas the gene for a putative C2H2
transcription factor correlated with LOL gene expression.
In dramatic contrast to the results in culture, no evidence indicated that LOL genes
were coregulated with LA production level in vegetative tissues in planta (N. uncinatum-
meadow fescue, or N. siegelii-meadow fescue). Dramatically high LA level was detected
in young emerging leaf blades (before or after clipping) and declined as the leaf grew
older, so clipping did not directly result in LA increase. This observation suggests that
LA may be produced in young leaves more quickly than in old leaves. Despite this, there
was no obvious LOL gene expression level difference in young versus old leaves.
However, availability of LA substrates in old and young leaf tissues showed significant
differences in several critical amino acids that could serve as LA precursors. Asn showed
more than 10-fold higher levels in young leaf tissue than in old tissue, whereas Pro
showed significantly lower levels in young tissue. Therefore, it is reasonable to propose
that substrate resource regulates LA production level in vegetative tissues.
On the other hand, in E. festucae inflorescences and stromata, LOL genes showed
coordinate regulation with LA level, whereby lower LOL gene expression was correlated
with lower LA level in stromata, and higher LOL gene expression with higher LA level in
inflorescence.
In N. uncinatum MM culture, the regulation seems to be very well controlled with
all the gene temporal expression tightly correlated with each other along with LA
production. In contrast, the other LA-producing species have so far failed to produce LA
in culture (Spiering et al 2005b); J.D. Blankenship, J.R. Faulkner, and M.R. Spiering,
unpublished data). It is reasonable to assume there are specific regulators in planta
initiate LOL gene expression for LA production by N. coenophialum, N. siegelii, and E.
festucae. My finding of coordinate regulation of LOL gene expression with LA level in E.
festucae inflorescences and stromata, suggests that the plant may directly or indirectly
signal the fungus to regulating LOL gene expression, thereby modulating LA production
in symbiota. But I obtained evidence suggesting another way to regulate LA levels in
symbiota; namely, by substrate availability in N. siegelii (or N. uncinatum)-meadow
fescue vegetative tissues. It seems, therefore, that different regulators are involved in the
213
mechanisms underlying LOL gene expression and LA production levels in different
circumstances.
Evidence from this study suggested that proper regulation in culture requires
native promoters with genes in the context of a LOL cluster. In transformants with Pro-
lolA2 and Pro-lolC2 fusion with reporter gene GUS, or Pro-lolC2 fusion with cre
recombinase, both GUS and cre failed to show the same expression pattern as the native
LOL genes showed in culture. GUS activity was very low in all transformants, and GUS
gene expression did not correlate with lolC2 or lolA2 gene expression patterns in culture.
The cre gene was expressed in complex media where lolC2 expression was normally low.
The lolC2 promoter itself was not sufficient to determine the gene expression pattern in
culture, which strongly suggested that regulation in culture was dependent on the LOL
cluster or the location in the genome.
Results also showed that the GUS transgene under Pro-lolC2 in N. coenophialum
was expressed in symbiota. However, the cre transgene under Pro-lolC2 in N. uncinatum
might have be suppressed in symbiota since cre-ble loop-out was never obtained in
symbiota. This again supported the finding that different regulators from symbiota are
involved in LOL gene expression, to enhance, trigger, or suppress LOL gene promoter
activity.
Finding regulators involved in culture or symbiota, therefore is of great interest.
A likely ortholog for the global secondary metabolite regulator, LaeA, was found in E.
festucae 2368 genome. The LaeA ortholog could be a potential global regulator for LA
production and other fungal metabolites in symbiota. Testing its functions would be
worthwhile, along with testing C2H2, the putative transcription regulator in N. uncinatum
MM culture. Two common TF binding sites, Mat1-Mc and HSF, were found in all the
promoter regions in LOL2 cluster. Investigation of corresponding TFs and their roles in
LOL gene expression would be expected for future work. Likewise, the influence of
substrate availability, particularly in young tissues, on LA production, will be important
to investigate further.
Copyright © Dong-Xiu Zhang 2008
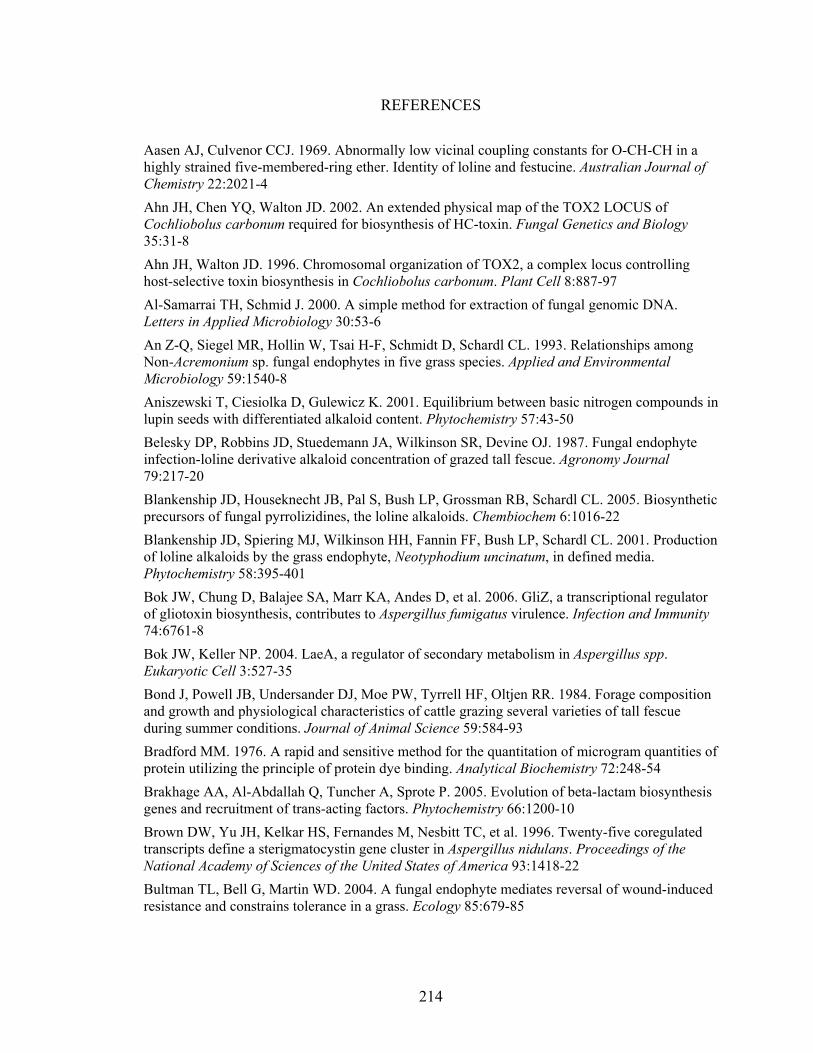
214
REFERENCES
Aasen AJ, Culvenor CCJ. 1969. Abnormally low vicinal coupling constants for O-CH-CH in a highly strained five-membered-ring ether. Identity of loline and festucine. Australian Journal of Chemistry 22:2021-4 Ahn JH, Chen YQ, Walton JD. 2002. An extended physical map of the TOX2 LOCUS of Cochliobolus carbonum required for biosynthesis of HC-toxin. Fungal Genetics and Biology 35:31-8 Ahn JH, Walton JD. 1996. Chromosomal organization of TOX2, a complex locus controlling host-selective toxin biosynthesis in Cochliobolus carbonum. Plant Cell 8:887-97 Al-Samarrai TH, Schmid J. 2000. A simple method for extraction of fungal genomic DNA. Letters in Applied Microbiology 30:53-6 An Z-Q, Siegel MR, Hollin W, Tsai H-F, Schmidt D, Schardl CL. 1993. Relationships among Non-Acremonium sp. fungal endophytes in five grass species. Applied and Environmental Microbiology 59:1540-8 Aniszewski T, Ciesiolka D, Gulewicz K. 2001. Equilibrium between basic nitrogen compounds in lupin seeds with differentiated alkaloid content. Phytochemistry 57:43-50 Belesky DP, Robbins JD, Stuedemann JA, Wilkinson SR, Devine OJ. 1987. Fungal endophyte infection-loline derivative alkaloid concentration of grazed tall fescue. Agronomy Journal 79:217-20 Blankenship JD, Houseknecht JB, Pal S, Bush LP, Grossman RB, Schardl CL. 2005. Biosynthetic precursors of fungal pyrrolizidines, the loline alkaloids. Chembiochem 6:1016-22 Blankenship JD, Spiering MJ, Wilkinson HH, Fannin FF, Bush LP, Schardl CL. 2001. Production of loline alkaloids by the grass endophyte, Neotyphodium uncinatum, in defined media. Phytochemistry 58:395-401 Bok JW, Chung D, Balajee SA, Marr KA, Andes D, et al. 2006. GliZ, a transcriptional regulator of gliotoxin biosynthesis, contributes to Aspergillus fumigatus virulence. Infection and Immunity 74:6761-8 Bok JW, Keller NP. 2004. LaeA, a regulator of secondary metabolism in Aspergillus spp. Eukaryotic Cell 3:527-35 Bond J, Powell JB, Undersander DJ, Moe PW, Tyrrell HF, Oltjen RR. 1984. Forage composition and growth and physiological characteristics of cattle grazing several varieties of tall fescue during summer conditions. Journal of Animal Science 59:584-93 Bradford MM. 1976. A rapid and sensitive method for the quantitation of microgram quantities of protein utilizing the principle of protein dye binding. Analytical Biochemistry 72:248-54 Brakhage AA, Al-Abdallah Q, Tuncher A, Sprote P. 2005. Evolution of beta-lactam biosynthesis genes and recruitment of trans-acting factors. Phytochemistry 66:1200-10 Brown DW, Yu JH, Kelkar HS, Fernandes M, Nesbitt TC, et al. 1996. Twenty-five coregulated transcripts define a sterigmatocystin gene cluster in Aspergillus nidulans. Proceedings of the National Academy of Sciences of the United States of America 93:1418-22 Bultman TL, Bell G, Martin WD. 2004. A fungal endophyte mediates reversal of wound-induced resistance and constrains tolerance in a grass. Ecology 85:679-85
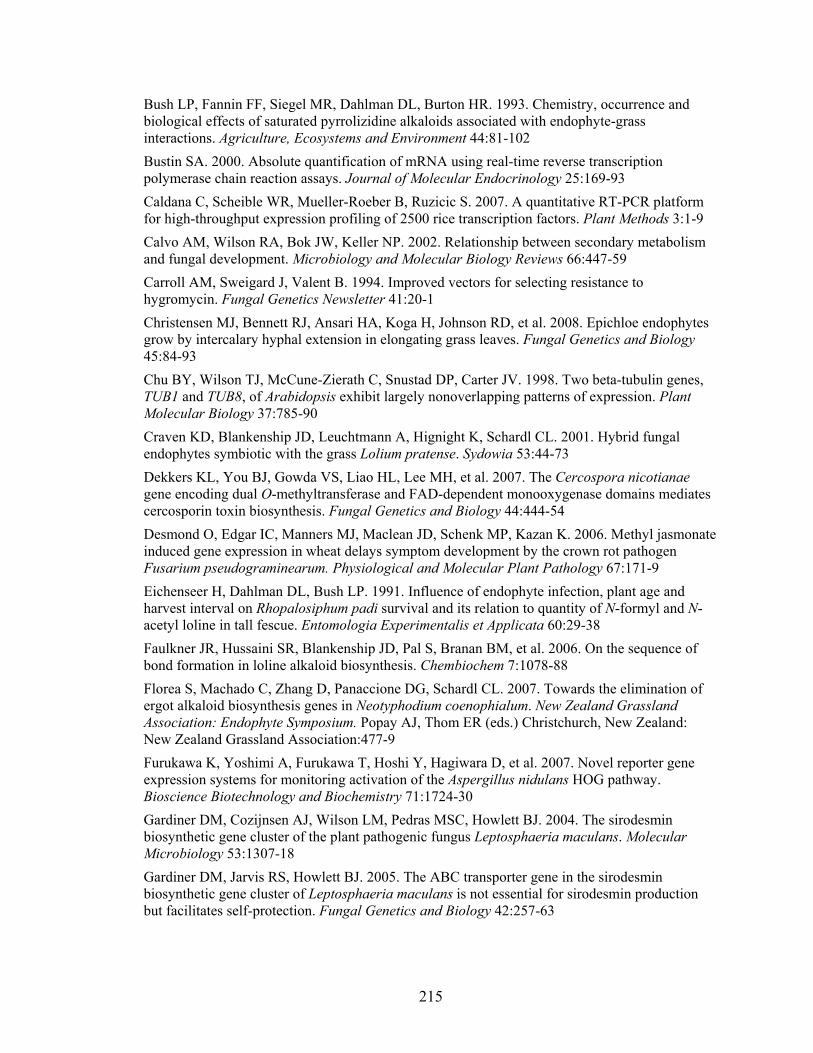
215
Bush LP, Fannin FF, Siegel MR, Dahlman DL, Burton HR. 1993. Chemistry, occurrence and biological effects of saturated pyrrolizidine alkaloids associated with endophyte-grass interactions. Agriculture, Ecosystems and Environment 44:81-102 Bustin SA. 2000. Absolute quantification of mRNA using real-time reverse transcription polymerase chain reaction assays. Journal of Molecular Endocrinology 25:169-93 Caldana C, Scheible WR, Mueller-Roeber B, Ruzicic S. 2007. A quantitative RT-PCR platform for high-throughput expression profiling of 2500 rice transcription factors. Plant Methods 3:1-9 Calvo AM, Wilson RA, Bok JW, Keller NP. 2002. Relationship between secondary metabolism and fungal development. Microbiology and Molecular Biology Reviews 66:447-59 Carroll AM, Sweigard J, Valent B. 1994. Improved vectors for selecting resistance to hygromycin. Fungal Genetics Newsletter 41:20-1 Christensen MJ, Bennett RJ, Ansari HA, Koga H, Johnson RD, et al. 2008. Epichloe endophytes grow by intercalary hyphal extension in elongating grass leaves. Fungal Genetics and Biology 45:84-93 Chu BY, Wilson TJ, McCune-Zierath C, Snustad DP, Carter JV. 1998. Two beta-tubulin genes, TUB1 and TUB8, of Arabidopsis exhibit largely nonoverlapping patterns of expression. Plant Molecular Biology 37:785-90 Craven KD, Blankenship JD, Leuchtmann A, Hignight K, Schardl CL. 2001. Hybrid fungal endophytes symbiotic with the grass Lolium pratense. Sydowia 53:44-73 Dekkers KL, You BJ, Gowda VS, Liao HL, Lee MH, et al. 2007. The Cercospora nicotianae gene encoding dual O-methyltransferase and FAD-dependent monooxygenase domains mediates cercosporin toxin biosynthesis. Fungal Genetics and Biology 44:444-54 Desmond O, Edgar IC, Manners MJ, Maclean JD, Schenk MP, Kazan K. 2006. Methyl jasmonate induced gene expression in wheat delays symptom development by the crown rot pathogen Fusarium pseudograminearum. Physiological and Molecular Plant Pathology 67:171-9 Eichenseer H, Dahlman DL, Bush LP. 1991. Influence of endophyte infection, plant age and harvest interval on Rhopalosiphum padi survival and its relation to quantity of N-formyl and N-acetyl loline in tall fescue. Entomologia Experimentalis et Applicata 60:29-38 Faulkner JR, Hussaini SR, Blankenship JD, Pal S, Branan BM, et al. 2006. On the sequence of bond formation in loline alkaloid biosynthesis. Chembiochem 7:1078-88 Florea S, Machado C, Zhang D, Panaccione DG, Schardl CL. 2007. Towards the elimination of ergot alkaloid biosynthesis genes in Neotyphodium coenophialum. New Zealand Grassland Association: Endophyte Symposium. Popay AJ, Thom ER (eds.) Christchurch, New Zealand: New Zealand Grassland Association:477-9 Furukawa K, Yoshimi A, Furukawa T, Hoshi Y, Hagiwara D, et al. 2007. Novel reporter gene expression systems for monitoring activation of the Aspergillus nidulans HOG pathway. Bioscience Biotechnology and Biochemistry 71:1724-30 Gardiner DM, Cozijnsen AJ, Wilson LM, Pedras MSC, Howlett BJ. 2004. The sirodesmin biosynthetic gene cluster of the plant pathogenic fungus Leptosphaeria maculans. Molecular Microbiology 53:1307-18 Gardiner DM, Jarvis RS, Howlett BJ. 2005. The ABC transporter gene in the sirodesmin biosynthetic gene cluster of Leptosphaeria maculans is not essential for sirodesmin production but facilitates self-protection. Fungal Genetics and Biology 42:257-63
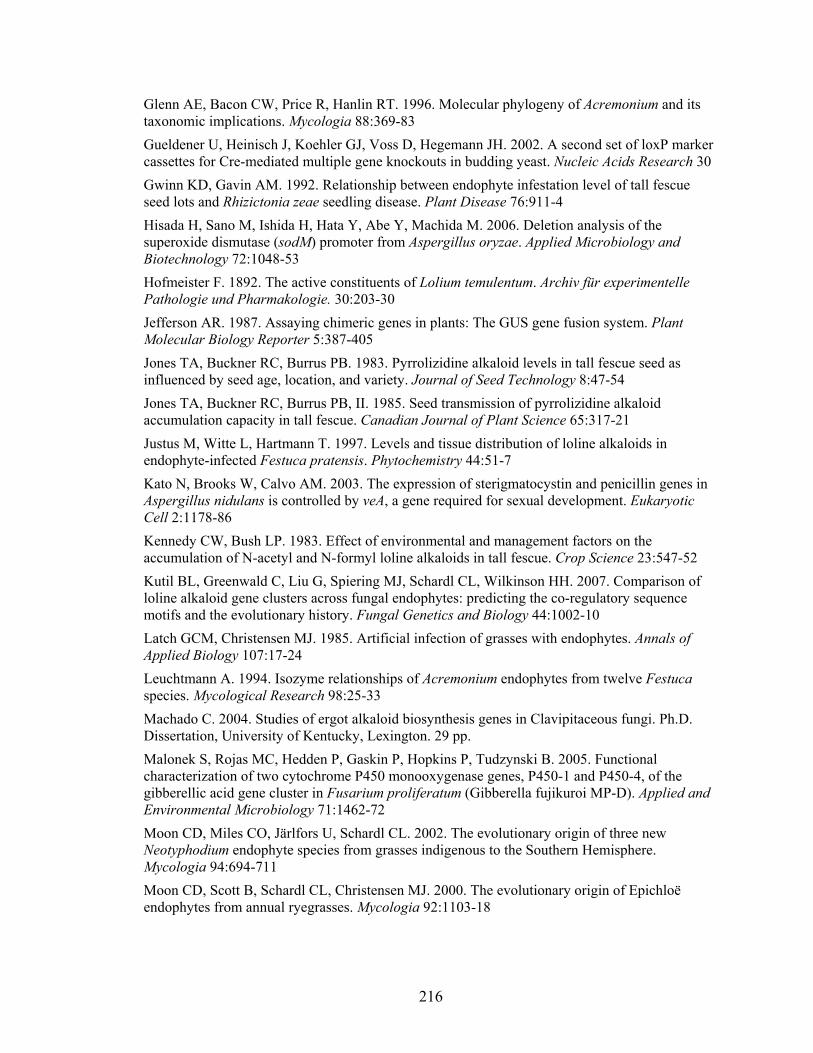
216
Glenn AE, Bacon CW, Price R, Hanlin RT. 1996. Molecular phylogeny of Acremonium and its taxonomic implications. Mycologia 88:369-83 Gueldener U, Heinisch J, Koehler GJ, Voss D, Hegemann JH. 2002. A second set of loxP marker cassettes for Cre-mediated multiple gene knockouts in budding yeast. Nucleic Acids Research 30 Gwinn KD, Gavin AM. 1992. Relationship between endophyte infestation level of tall fescue seed lots and Rhizictonia zeae seedling disease. Plant Disease 76:911-4 Hisada H, Sano M, Ishida H, Hata Y, Abe Y, Machida M. 2006. Deletion analysis of the superoxide dismutase (sodM) promoter from Aspergillus oryzae. Applied Microbiology and Biotechnology 72:1048-53 Hofmeister F. 1892. The active constituents of Lolium temulentum. Archiv für experimentelle Pathologie und Pharmakologie. 30:203-30 Jefferson AR. 1987. Assaying chimeric genes in plants: The GUS gene fusion system. Plant Molecular Biology Reporter 5:387-405 Jones TA, Buckner RC, Burrus PB. 1983. Pyrrolizidine alkaloid levels in tall fescue seed as influenced by seed age, location, and variety. Journal of Seed Technology 8:47-54 Jones TA, Buckner RC, Burrus PB, II. 1985. Seed transmission of pyrrolizidine alkaloid accumulation capacity in tall fescue. Canadian Journal of Plant Science 65:317-21 Justus M, Witte L, Hartmann T. 1997. Levels and tissue distribution of loline alkaloids in endophyte-infected Festuca pratensis. Phytochemistry 44:51-7 Kato N, Brooks W, Calvo AM. 2003. The expression of sterigmatocystin and penicillin genes in Aspergillus nidulans is controlled by veA, a gene required for sexual development. Eukaryotic Cell 2:1178-86 Kennedy CW, Bush LP. 1983. Effect of environmental and management factors on the accumulation of N-acetyl and N-formyl loline alkaloids in tall fescue. Crop Science 23:547-52 Kutil BL, Greenwald C, Liu G, Spiering MJ, Schardl CL, Wilkinson HH. 2007. Comparison of loline alkaloid gene clusters across fungal endophytes: predicting the co-regulatory sequence motifs and the evolutionary history. Fungal Genetics and Biology 44:1002-10 Latch GCM, Christensen MJ. 1985. Artificial infection of grasses with endophytes. Annals of Applied Biology 107:17-24 Leuchtmann A. 1994. Isozyme relationships of Acremonium endophytes from twelve Festuca species. Mycological Research 98:25-33 Machado C. 2004. Studies of ergot alkaloid biosynthesis genes in Clavipitaceous fungi. Ph.D. Dissertation, University of Kentucky, Lexington. 29 pp. Malonek S, Rojas MC, Hedden P, Gaskin P, Hopkins P, Tudzynski B. 2005. Functional characterization of two cytochrome P450 monooxygenase genes, P450-1 and P450-4, of the gibberellic acid gene cluster in Fusarium proliferatum (Gibberella fujikuroi MP-D). Applied and Environmental Microbiology 71:1462-72 Moon CD, Miles CO, Järlfors U, Schardl CL. 2002. The evolutionary origin of three new Neotyphodium endophyte species from grasses indigenous to the Southern Hemisphere. Mycologia 94:694-711 Moon CD, Scott B, Schardl CL, Christensen MJ. 2000. The evolutionary origin of Epichloë endophytes from annual ryegrasses. Mycologia 92:1103-18
217
Murray FR, Latch GCM, Scott D.B. 1992. Surrogate transformation of perennial ryegrass, Lolium perenne, using genetically modified Acremonium endophyte. Molecular and General Genetics 233:1-9 Ober D, Hartmann T. 1999. Homospermidine synthase, the first pathway-specific enzyme of pyrrolizidine alkaloid biosynthesis, evolved from deoxyhypusine synthase. Proceedings of the National Academy of Sciences of the United States of America 96:14777-82 Orejas M, Espeso EA, Tilburn J, Sarkar S, Arst HN, Penalva MA. 1995. Activation of the Aspergillus PacC transcription factor in response to alkaline ambient pH requires proteolysis of the carboxy-terminal moiety. Genes & Development 9:1622-32 Panaccione DG, Johnson RD, Wang JH, Young CA, Damrongkool P, et al. 2001. Elimination of ergovaline from a grass-Neotyphodium endophyte symbiosis by genetic modification of the endophyte. Proceedings in the National Academy of Science of the United States of America 98:12820-5 Papadopoulou KK, Kavroulakis N, Tourn M, Aggelou I. 2005. Use of beta-glucuronidase activity to quantify the growth of Fusarium oxysporum f. sp radicis-lycopersici during infection of tomato. Journal of Phytopathology 153:325-32 Park SU, Yu M, Facchini PJ. 2002. Antisense RNA-mediated suppression of benzophenanthridine alkaloid biosynthesis in transgenic cell cultures of California poppy. Plant Physiology 128:696-706 Pathan AAK, Devi KU, Vogel H, Reineke A. 2007. Analysis of differential gene expression in the generalist entomophathogenic fungus Beauveria bassiana (Bals.) Vuillemin grown on different insect cuticular extracts an synthetic medium through cDNA-AFLPs. Fungal Genetics and Biology 44:1231-41 Patterson CG, Potter, D. A., Fannin, F. F. 1991. Feeding deterrency of alkaloids from endophyte-infected grasses to Japanese beetle grubs. Entomol. Exp. Appl. :285-9 Perrin RM, Fedorova ND, Bok JW, Cramer RA, Wortman JR, et al. 2007. Transcriptional regulation of chemical diversity in Aspergillus fumigatus by LaeA. Plos Pathogens 3:508-17 Powell RG, Petroski RJ. 1992. The loline group of pyrrolizidine alkaloids. Alkaloids: Chemical and Biological Perspectives 8:320-38 Price MS, Yu JJ, Nierman WC, Kim HS, Pritchard B, et al. 2006. The aflatoxin pathway regulator AfIR induces gene transcription inside and outside of the aflatoxin biosynthetic cluster. Fems Microbiology Letters 255:275-9 PRISM A. 2007. PRISM ABI 7900 sequence detection system user guide. Proctor RH, Brown DW, Plattner RD, Desjardins AE. 2003. Co-expression of 15 contiguous genes delineates a fumonisin biosynthetic gene cluster in Gibberella moniliformis. Fungal Genetics and Biology 38:237-49 Riedell WE, Kieckhefer RE, Petroski RJ, Powell RG. 1991. Naturally occurring and synthetic loline alkaloid derivatives: insect feeding behavior modification and toxicity. Journal of Entomological Science 26:122-9 Roberts I, Oliver R, Punt P, Van den Hondel C. 1989. Expression of the Escherichia coli beta-glucuronidase gene in industrial and phytopathogenic filamentous fungi. Current Genetics 15:177-80 Schardl CL. 1996. Epichloë species: Fungal symbionts of grasses. Annual Reviews in Phytopathology 34:109-30
218
Schardl CL, Grossman RB, Nagabhyru P, Faulkner JR, Mallik UP. 2007. Loline alkaloids: Currencies of mutualism. Phytochemistry 68:980-96 Schardl CL, Leuchtmann A, Spiering MJ. 2004. Symbioses of grasses with seedborne fungal endophytes. Annual Review of Plant Biology 55:315-40 Semighini CP, de Camargo ZP, Puccia R, Goldman MHS, Goldman GH. 2002. Molecular identification of Paracoccidioides brasiliensis by 5 ' nuclease assay. Diagnostic Microbiology and Infectious Disease 44:383-6 Seo J-A, Proctor RH, Plattner RD. 2001. Characterization of four clustered and coregulated genes associated with fumonisin biosynthesis in Fusarium verticillioides. Fungal Genetics and Biology 34:155-65 Siegel MR, Latch GCM, Bush LP, Fannin FF, Rowan DD, et al. 1990. Fungal endophyte-infected grasses: alkaloid accumulation and aphid response. Journal of Chemical Ecology 16:3301-15 Snoeijers SS, Perez-Garcia A, Goosen T, De Wit P. 2003. Promoter analysis of the avirulence gene Avr9 of the fungal tomato pathogen Cladosporium fulvum in the model filamentous fungus Aspergillus nidulans. Current Genetics 43:96-102 Spiering MJ. 2000. Distribution of Neotyphodium lolii-endophyte metabolic activity in perennial ryegrass (Lolium perenne L.) and its implications for alkaloid distribution and photosynthesis. Ph.D. Massey University, Palmerston North, New Zealand. 208 pp. Spiering MJ, Lane GA, Christensen MJ, Schmid J. 2005a. Distribution of the fungal endophyte Neotyphodium lolii is not a major determinant of the distribution of fungal alkaloids in Lolium perenne plants. Phytochemistry 66:195-202 Spiering MJ, Moon CD, Wilkinson HH, Schardl CL. 2005b. Gene clusters for insecticidal loline alkaloids in the grass-endophytic fungus Neotyphodium uncinatum. Genetics 169:1403-14 Spiering MJ, Wilkinson HH, Blankenship JD, Schardl CL. 2002. Expressed sequence tags and genes associated with loline alkaloid production in the grass endophyte Neotyphodium uncinatum. Fungal Genetics and Biology 36:242-54 Sullivan TJ, Rodstrom J, Vandop J, Librizzi J, Graham C, et al. 2007. Symbiont-mediated changes in Lolium arundinaceum inducible defenses: evidence from changes in gene expression and leaf composition. New Phytologist 176:673-9 Takeda A, Suzuki E, Kamei K, Nakata H. 1991. Detection and identification of loline and its analogs in horse urine. Chemical & Pharmaceutical Bulletin 39:964-8 Tan YY, Spiering MJ, Christensen MJ, Saunders K, Schmid J. 1997. In planta metabolic state of Neotyphodium endophyte mycelium assessed through use of the GUS reporter gene in combination with hyphal enumeration. In Neotyphodium/Grass Interactions, ed. CW Bacon, NS Hill, pp. 85-7. New York: Plenum Press Tan YY, Spiering MJ, Scott V, Lane GA, Christensen MJ, Schmid J. 2001. In planta regulation of extension of an endophytic fungus and maintenance of high metabolic rates in its mycelium in the absence of apical extension. Applied and Environmental Microbiology 67:5377-83 Tanaka A, Tapper BA, Popay A, Parker EJ, Scott B. 2005. A symbiosis expressed non-ribosomal peptide synthetase from a mutualistic fungal endophyte of perennial ryegrass confers protection to the symbiotum from insect herbivory. Molecular Microbiology 57:1036-50 Tanaka A, Tsuge T. 2000. Structural and functional complexity of the genomic region controlling AK-toxin biosynthesis and pathogenicity in the Japanese pear pathotype of Alternaria alternata. Molecular Plant-Microbe Interactions 13:975-86
219
Tilburn J, Sarkar S, Widdick DA, Espeso EA, Orejas M, et al. 1995. The Aspergillus PacC zinc-finger transcription factor mediates regulation of both acid-expressed and alkaline-expressed genes by ambient pH. EMBO Journal 14:779-90 Tong D-w, Wang J-y, Brain P, Gooneratne R. 2006. Seasonal change of loline alkaloids in endophyte-infected meadow fescue. Agricultural Sciences in China 5:793-7 Tsai H-F, Siegel MR, Schardl CL. 1992. Transformation of Acremonium coenophialum, a protective fungal symbiont of the grass Festuca arundinacea. Current Genetics 22:399-406 Tudzynski B, Holter K. 1998. Gibberellin biosynthetic pathway in Gibberella fujikuroi: Evidence for a gene cluster. Fungal Genetics and Biology 25:157-70 Tudzynski P, Hölter K, Correia T, Arntz C, Grammel N, Keller U. 1999. Evidence for an ergot alkaloid gene cluster in Claviceps purpurea. Molecular and General Genetics 261:133-41 Ullu E, Djikeng A, Shi H, Tschudi C. 2002. RNA interference: advances and questions. Philosophical Transactions of the Royal Society of London, Series B 357:65-70 Veen G, Greinwald, R., Canto, P., Witte, L., Czygan, F.C. 1992. Alkaloids of Adenocarpus hispanicus (Lam.) DC varieties. Zeitschrift für Naturforschung C-A Journal of Biosciences C47:341-5 Wang J. 2000. dmaW encoding tryptophan dimethylallyltransferase in ergot alkaloid biosynthesis from clavicipitaceous fungi. Ph.D. Dissertation, University of Kentucky, Lexington. 164 pp. Wang JH, Machado C, Panaccione DG, Tsai HF, Schardl CL. 2004. The determinant step in ergot alkaloid biosynthesis by an endophyte of perennial ryegrass. Fungal Genetics and Biology 41:189-98 Wilkinson HH, Siegel MR, Blankenship JD, Mallory AC, Bush LP, Schardl CL. 2000. Contribution of fungal loline production to protection from aphids in a grass-fungus mutualism. Molecular Plant-Microbe Interactions 13:1027-33 Yates SG, Fenster, J.C., Bartelt, R.J. 1989. Assay of tall fescue seed extracts, fractions, and alkaloids using the large milkweed bug. Journal of Agricultural and Food Chemistry 37:354-7 Yu JJ, Bhatnagar D, Cleveland TE. 2004. Completed sequence of aflatoxin pathway gene cluster in Aspergillus parasiticus. FEBS Letters 564:126-30 Zhang N, Scott V, Al Samarrai TH, Tan YY, Spiering MJ, et al. 2000. Transformation of Neotyphodium lolii with plasmids containing a native promoter disturbs the symbiotic interaction with its host. In 4th International Neotyphodium/Grass Symposium, ed. VH Paul, PD Dapprich, pp. 325-31. Fachbereich Agrarwissenschaften, Universität Paderborn, Soest, Germany Zhang NX, Scott V, Al-Samarrai TH, Tan YY, Spiering MJ, et al. 2006. Transformation of the ryegrass endophyte Neotyphodium lolii can alter its in planta mycelial morphology. Mycological Research 110:601-11 Zhang S, Schewelm A, Jin H, Collins L, Bradshaw ER. 2007. A fragmented aflatoxin-like gene cluster in the forest pathogen Dothistroma septosporum. Fungal Genetics and Biology 44:1342-54
220
VITA
Date and place of birth: 10/10/1970, Zhejiang, China
Educational institutions attended:
06/2004-01/2008: Dept. of Plant Pathology, University of Kentucky, USA.
PhD final defense on January 23, 2008
09/2001-05/2004: Dept. of Plant Science, South Dakota State University, USA.
Thesis: Molecular identification and population variability of Diaporthe phaseolorum from
soybeans.
M.S. (M.Sc.) in Plant Science
09/1987- 07/1991: Shanghai Univ. of Traditional Chinese Medicine, China.
Thesis: Extraction and identification of natural products from Carthamus tinctorius.
Bachelor of Medicine
Professional positions held:
09/1993- 08/2001: Manager of the QA Dept. of Songhua Pharmaceutical Co. & Licensed
Pharmacist, Shanghai, China
08/1991-08/1993, Dept. of Tech., Zhejiang Pharmaceutical Works, China.
Scholastic and professional honors:
• Research Challenge Trust Fund I Fellowship, 2005-2008, University of Kentucky, USA.
• Graduate School Travel Award for International Conferences. 2006, University of Kentucky, USA
• Twentieth Annual Scholarship, 2003, Plant Science Dept., South Dakota State University, USA.
Professional Publications:
• Schardl C. L., Scott B., Florea S., and Zhang D.-X. (accepted). Epichloë endophytes: clavicipitaceous symbionts of grasses. in The Mycota, vol. V, 2nd ed. Springer, Heidelberg, Germany.
• Zhang D.-X. and Schardl C. Coordinated expression of loline alkaloid genes in fungal grass endophytes, oral presentation, January 11-16, 2008. Plant and Animal Genome XVI conference, San Diego, California, USA.
• Hesse U., Roe A. B., Farman L. M., Zhang D.-X., Jaromaczyk W. J., and Schardl C. 2008. Epichloë festucae, A mutualistic endophyte of grasses-genome and gene
221
expression, Poster, January 11-16, 2008. Plant and Animal Genome XVI conference, San Diego, California, USA.
• Zhang D.-X. and Schardl C. The loline alkaloids: insecticidal products of endophyte metabolism, Invited Oral Presentations, June 26-July 11, 2007, Institute of Plant Physiology and Ecology, Shanghai Institutes for Biological Sciences, Chinese Academy of Sciences; Shanghai Biotechnology Research Institute, Shanghai Academy of Agricultural Sciences; Zhejiang University of Science and Technology, China.
• Florea S, Machado C, Zhang D.-X., Panaccione DG, Schardl CL. 2007. Towards the elimination of ergot alkaloid biosynthesis genes in Neotyphodium coenophialum. New Zealand Grassland Association: Endophyte Symposium. Popay AJ, Thom ER (eds.) Christchurch, New Zealand: New Zealand Grassland Association:477-9
• Zhang D.-X. and Schardl C. 2006. Construction of selectable markers for endophyte transformation followed by controlled marker deletion, Poster, July 29-Aug 2, 2006. APS.CPS.MSA. Joint Meeting. Quebec City, Canada.
• Zhang D.-X. and Chase T. 2004. Molecular and genetic variability of Diaporthe phaseolorum var. caulivora isolates from South Dakota, Phytopathology 94, S114.
• Zhang D.-X. and Chase T. 2003. Molecular identification of pathogens from soybean stem canker epiphytotics in South Dakota, Phytopathology 93(6), S94.
• Zhang D.-X. and Han X. 2001. Utilizing biotechnology to develop Chinese traditional medicine, Chinese Pharmaceutical Affairs (Chinese Journal), 15(3), 169-171
Dong-Xiu Zhang 1-23-2008


