Embed Size (px)
Citation preview
1
Strategy TitleSUBTITLE
Date
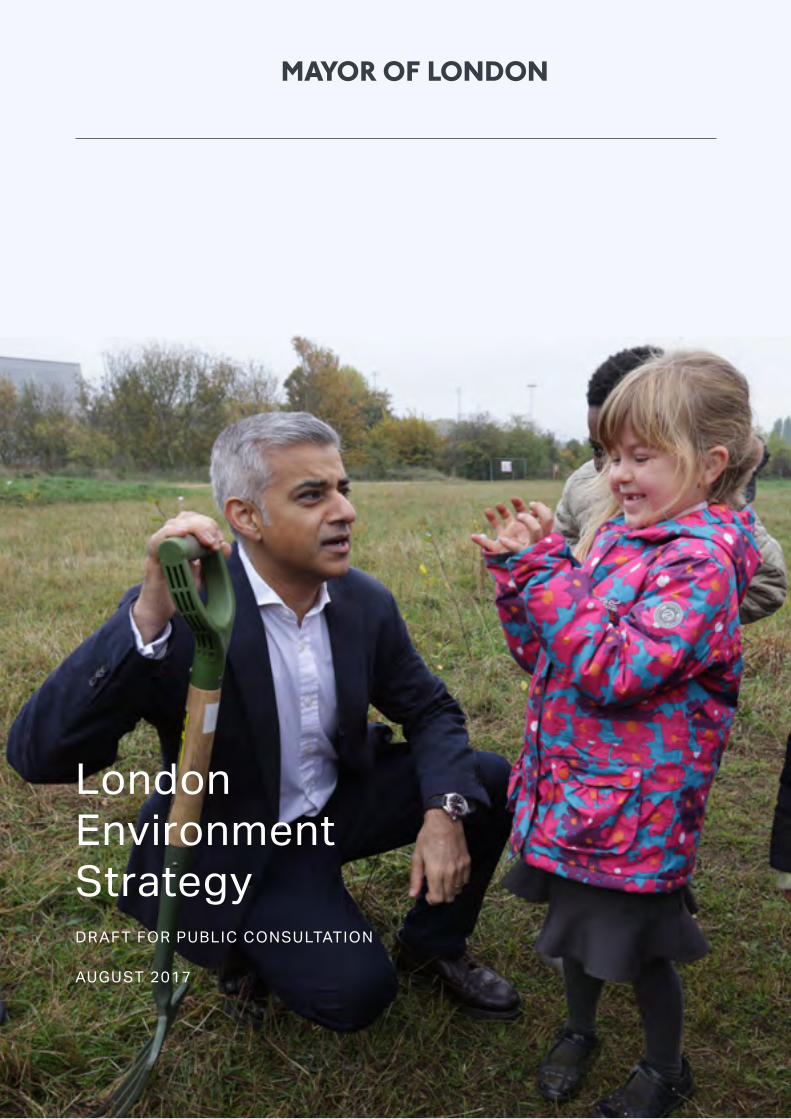
London Environment StrategyDR AFT FOR PUBLIC CONSULTATION
AUGUST 2017
3
Copyright
Greater London Authority August 2017
Greater London Authority City Hall The Queen’s Walk More London London SE1 2AA
www.london.gov.uk enquiries 020 7983 4000
Contents
Mayor’s foreword 4
Chapter 1: London’s environment today 10
Chapter 2: Transforming London’s environment 14
Chapter 3: New approaches 28
Chapter 4: Air quality 36
Chapter 5: Green infrastructure 122
Chapter 6: Climate change mitigation and energy 182
Chapter 7: Waste 252
Chapter 8: Adapting to climate change 294
Chapter 9: Ambient noise 344
Chapter 10: Transition to a low carbon circular economy 368
Chapter 11: GLA group operations – leading by example 378
Glossary 386
5L O N D O N E N V I R O N M E N T S T R A T E G Y
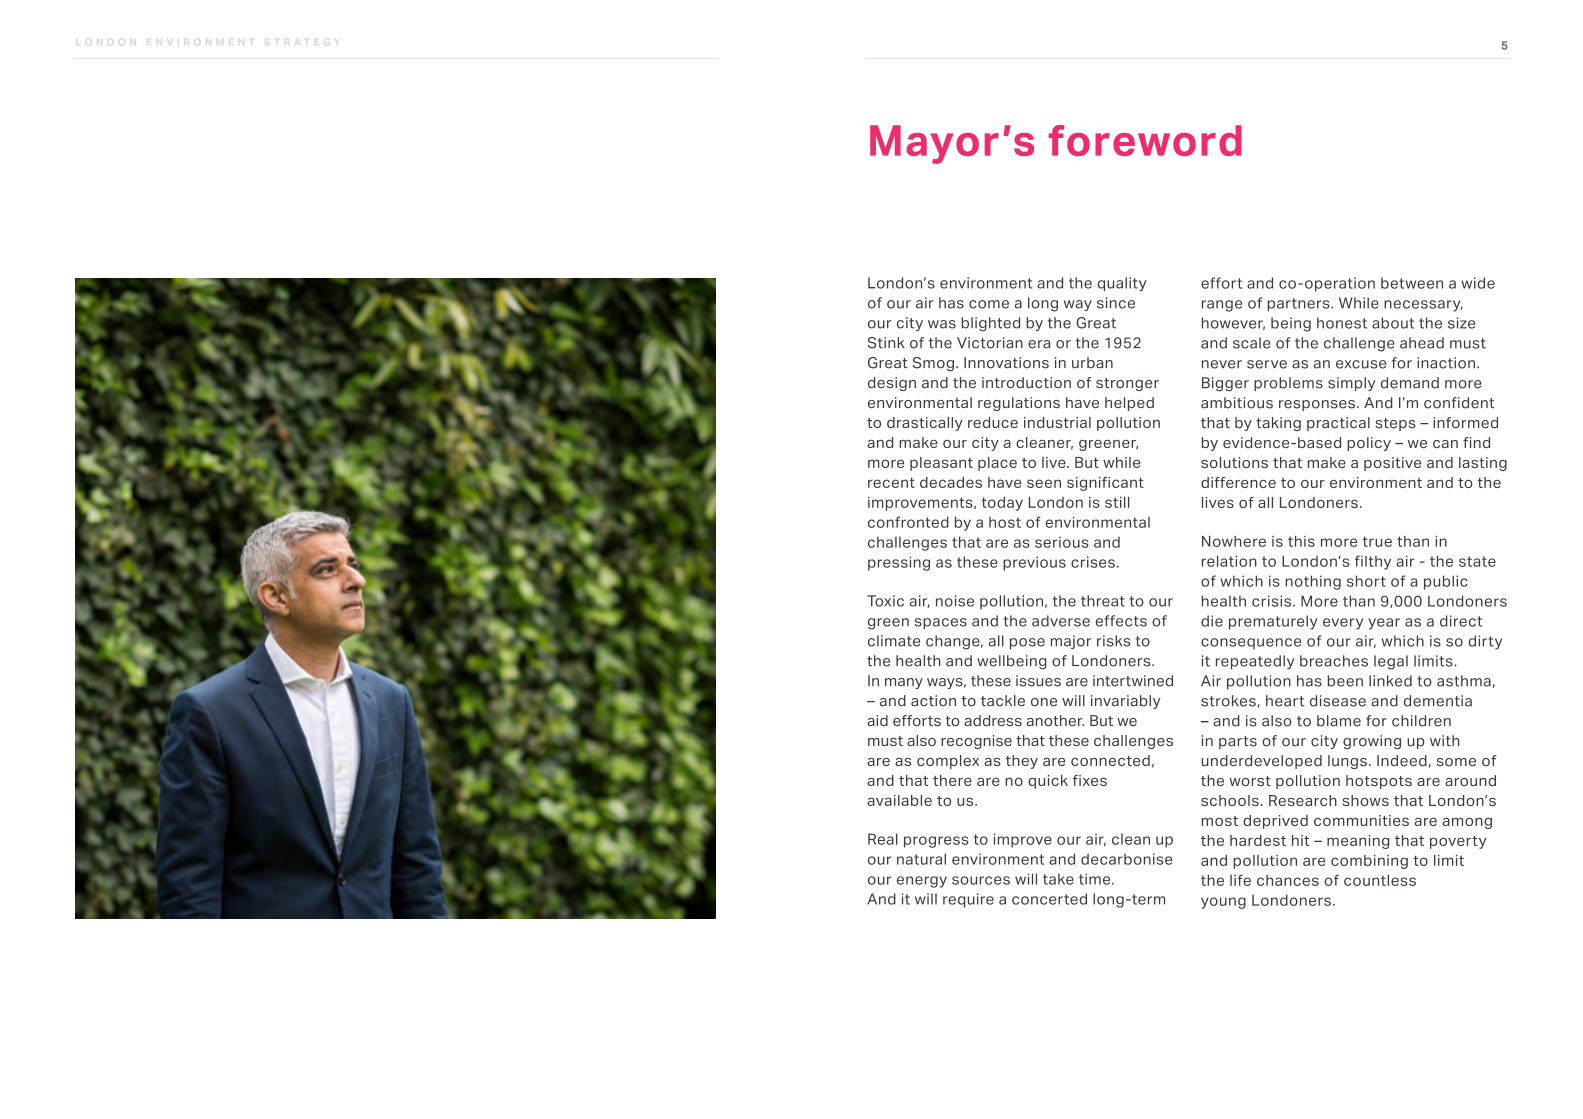
London’s environment and the quality of our air has come a long way since our city was blighted by the Great Stink of the Victorian era or the 1952 Great Smog. Innovations in urban design and the introduction of stronger environmental regulations have helped to drastically reduce industrial pollution and make our city a cleaner, greener, more pleasant place to live. But while recent decades have seen significant improvements, today London is still confronted by a host of environmental challenges that are as serious and pressing as these previous crises.
Toxic air, noise pollution, the threat to our green spaces and the adverse effects of climate change, all pose major risks to the health and wellbeing of Londoners. In many ways, these issues are intertwined – and action to tackle one will invariably aid efforts to address another. But we must also recognise that these challenges are as complex as they are connected, and that there are no quick fixes available to us.
Real progress to improve our air, clean up our natural environment and decarbonise our energy sources will take time. And it will require a concerted long-term
Mayor’s foreword
effort and co-operation between a wide range of partners. While necessary, however, being honest about the size and scale of the challenge ahead must never serve as an excuse for inaction. Bigger problems simply demand more ambitious responses. And I’m confident that by taking practical steps – informed by evidence-based policy – we can find solutions that make a positive and lasting difference to our environment and to the lives of all Londoners.
Nowhere is this more true than in relation to London’s filthy air - the state of which is nothing short of a public health crisis. More than 9,000 Londoners die prematurely every year as a direct consequence of our air, which is so dirty it repeatedly breaches legal limits. Air pollution has been linked to asthma, strokes, heart disease and dementia – and is also to blame for children in parts of our city growing up with underdeveloped lungs. Indeed, some of the worst pollution hotspots are around schools. Research shows that London’s most deprived communities are among the hardest hit – meaning that poverty and pollution are combining to limit the life chances of countless young Londoners.
7L O N D O N E N V I R O N M E N T S T R A T E G Y
tackle the most urgent environmental challenges facing our city immediately. But they also illustrate that I’m prepared to do what’s necessary to safeguard London’s environment over the longer term. And this is vital because not only do we owe it to today’s Londoners to create a clean healthy environment, where everyone can fulfil their potential, but we also owe it to the next generation of Londoners.
I hope that Londoners from all backgrounds will get involved in this strategy and I look forward to hearing your views and receiving your comments.
Sadiq Khan Mayor of London
7
by 2050. I’m committed to working with national government, local boroughs, London’s businesses, NGOs, our European neighbours and individual Londoners to achieve this goal – and to cut harmful emissions, protect our green spaces and Green Belt, and prepare London to respond to the changing climate.
But I’m also passionate about taking the lead and using the powers at my disposal to boost London’s green economy and deliver sustainable growth. We have already embedded the latest green thinking at the heart of our new transport strategy, set ourselves a target of making London a zero waste city and started work on establishing Energy for Londoners, which will soon be helping London generate more of its own low carbon energy, make its buildings even more energy efficient and help Londoners get a better deal on their energy bills. Our action in London can be the template for the most ambitious action at the national level too.
London is already the greatest city in the world – now I want it to become the greenest city in the world. The measures outlined in this strategy show that I’m determined to take meaningful action to
In the 21st century – in a city as rich as ours – this situation is unacceptable. As Mayor, I have a responsibility and a duty to act. In order to match the scale of the challenge we face, we need to implement big, bold and sometimes difficult policies. These might not always be popular, but when the health of all Londoners is at stake we can’t shirk these challenges or shy away from doing the right thing.
That’s why I’m putting in place the most ambitious plan to reduce air pollution anywhere in the world and it’s why I’ve instructed the Greater London Authority and Transport for London to lead by example and begin by putting our own house in order. We are doing this by investing record sums in public transport, by making walking and cycling easier for Londoners, and by phasing out dirty diesel buses and replacing them with brand new lower and zero emission models. We’re also investing heavily in green infrastructure and calling for EU environmental regulations to be maintained post-Brexit.
All of us have a role to play if we are to clean up our air and meet our aspiration of turning London into a zero carbon city
9
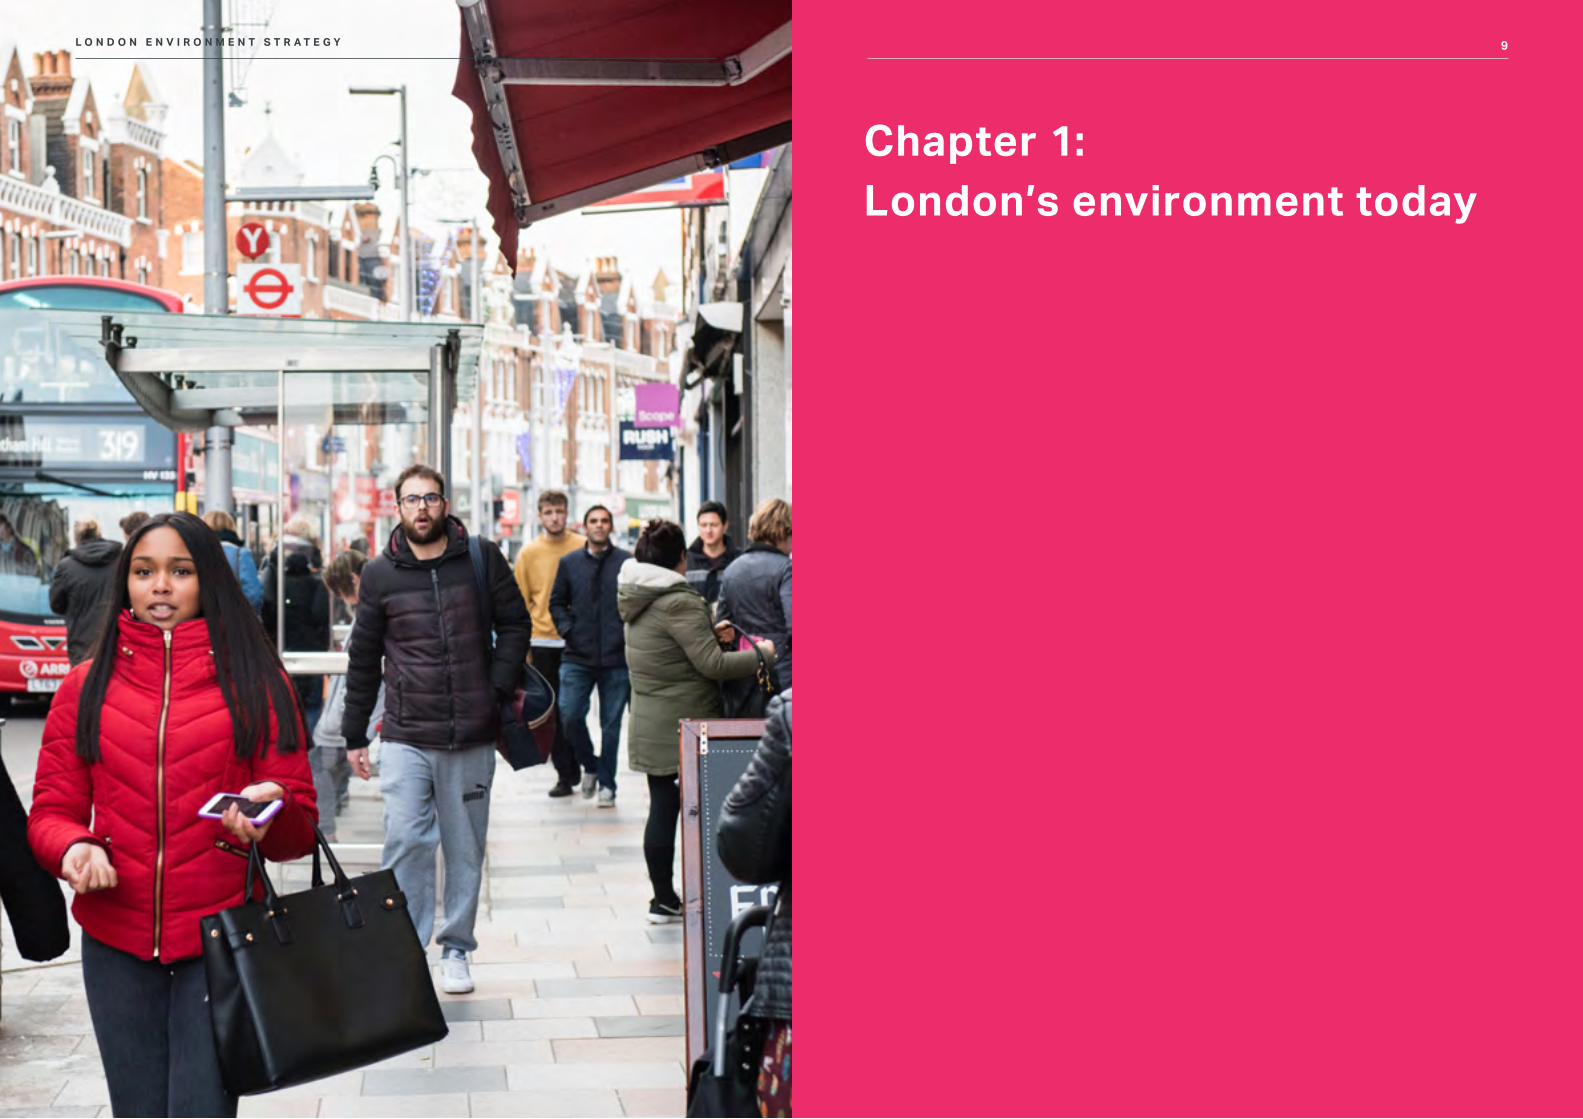
Chapter 1: London’s environment today
9L O N D O N E N V I R O N M E N T S T R A T E G Y
1 1L O N D O N E N V I R O N M E N T S T R A T E G Y
ENVIRONMENTAL CHALLENGES
In many ways, London’s environment is improving. The city’s air and water have recovered from the worst impacts of industrial pollution. Greenhouse gas emissions, which cause climate change, are reducing. The city is well-defended against the worst forms of flooding. But London also faces a range of environmental challenges that threaten the future of the city.
Air qualityThe quality of London’s air is dangerously – and illegally – poor. High levels of damaging pollutants harm human health and quality of life, limiting lung development in childhood and reducing life expectancy. Over 9,000 Londoners’ lives end sooner than they should each year because of air pollution, and around a quarter of primary schools are located in parts of London that breach legal air pollution limits. Air quality is the most pressing environmental threat to the future health of London.
Green space As development encroaches on open space and gardens have increasingly been paved over, there has been a gradual loss of green space across
London in recent years. Some parts of London have more green spaces than others, but almost half of Londoners have poor access to parks. Councils now have less money to spend on maintaining parks, so their quality has declined in some places. Access to good quality green space and living in greener neighbourhoods can have a big impact on people’s health and quality of life, and on how attractive a place London is to live, visit and do business.
BiodiversityAs green space has been lost and what remains has in some cases reduced in quality, the range of plants and animals that live in London has decreased. With careful attention, London can be home to a wide range of animal and plant species, but without it, the number and diversity of bird, wildflower and bee species will continue to decline.
Greenhouse gas emissionsAlthough London’s greenhouse gas emissions are falling, the city remains over-reliant on the fossil fuels that are a major contributor to global warming and climate change. London is not yet on track to reduce its emissions quickly enough to avoid the worst impacts of climate change, or to meet national and international climate aims.
LONDONERS AND THEIR ENVIRONMENT
London’s environment connects every aspect of life in the city. It is the air Londoners breathe, the water they drink and the parks where they meet and spend time. The state of London’s environment affects everyone who lives in and visits the city – it helps Londoners to stay healthy, allows businesses to thrive and keeps London functioning from day to day.
Proper care for the environment can help London to operate well every day, now and into the future. It can ensure the city produces enough energy in the right way, reduce waste so the city has the resources it needs and keep London’s infrastructure operating smoothly.
Improving the environment can protect Londoners’ health, make their homes warmer and more comfortable to live in and defend the city from future changes. It can clean up the city’s air, reduce the health impacts of noise and provide shade and shelter from the elements. It can protect the city from flooding and reduce the damaging impacts of climate change.
At its best, the environment can enhance Londoners’ interaction with their city and each other, making the city a better place
to live and improving quality of life. It can make streets and places greener, more pleasant and more engaging. It can provide open spaces where people can relax and interact with each other. It can connect people with nature and the places around them.
Many of these impacts are interconnected, and environmental improvements can have even wider benefits. For example, cleaner air can be achieved by reducing car use, which will also improve health by increasing walking and cycling levels and reducing noise. Reduced traffic dominance will make streets more pleasant places to spend time, and streets can be further enhanced by trees and other greenery. When a holistic view is taken and connections to the rest of London life are considered, the opportunities London’s environment provides to make the city a better place are huge.
The importance of the environment to a city like London can sometimes be overlooked, but the environment can shape the city in ways that affect everyone. It is vital that the right approach is taken to help create the city Londoners need now and in the future.
1 3L O N D O N E N V I R O N M E N T S T R A T E G Y
River water qualityYears of pollution from road run-off and water treatment work, sewer infrastructure problems, and poorly managed river maintenance and modification work have left London’s rivers in a poor state. Under an EU framework, only two of London’s 47 river water bodies are classed as ‘good’ – 31 are ‘moderate’, nine are ‘poor’ and the rest are ‘bad’.
Ambient noiseNoise is part of a vibrant city, but excessive noise can damage people’s health. Noise can contribute towards a range of physical and mental health problems, disturb sleep and affect people’s hearing, communication and learning. Almost 2.4 million people in London are already exposed to noise levels that exceed international guidelines, and the proposed expansion of Heathrow would expose an additional 200,000 people to significant aircraft noise.
Many of these problems are interconnected, and together they pose a threat to the future of the city. With the effects of climate change likely to exacerbate environmental challenges in a growing city, London must act now to avoid further problems in the future. Making London a better city to live in
must involve a holistic approach to the city’s environment that addresses all these pressing issues.
roofs and pavements and a Victorian drainage system that wasn’t designed to cope with the demands of the current and future population leave London exposed to the risk of flooding. As climate change brings a rise in sea level and more intense rainfall, flooding will become increasingly likely.
Heat riskClimate change is set to lead to heatwave conditions every summer by the middle of the century, and the Urban Heat Island effect makes the centre of London up to 10°C warmer than the rural areas around the city. Increasing heat risk could make homes, workplaces and public transport uncomfortable for all and dangerous for the most vulnerable. Increasing demand for cooling may put stress on power supply networks, threatening London’s sustainability and increasing emissions.
Water scarcity London’s water supply is under pressure – by 2025, demand is expected to outstrip supply by ten per cent, and by 2040 the gap will increase to 21 per cent. London already gets a large proportion of its water from groundwater and surrounding rivers, which damages the health of rivers and threatens the city’s future water supply.
Energy useNearly three quarters of the energy used in London’s homes is for heating and hot water, and the overwhelming majority of this demand is met using gas-fired boilers. Already one in ten electricity substations are approaching full capacity and the redevelopment of large parts of the city will increase demand for energy and the infrastructure required to distribute it. One in ten households in the city currently lives in fuel poverty, sometimes meaning they have to choose between heating their home or eating.
Waste Waste has a big impact on the environment both locally and globally. Only half of the 7m tonnes of waste London’s homes and businesses produce each year is currently recycled, and landfill capacity is set to run out by 2026. Plastic packaging not only litters London streets, but often finds its way into waterways and oceans, releasing toxic chemicals before breaking down – a process that can take centuries. London needs to reduce, reuse and recycle more, to see waste as the valuable resource that it is and to reduce London’s increasing waste bill as the city grows.
Flood riskThe loss of green space, the expansion of impermeable surfaces used for roads,
GENERAL ASSESSMENT OF LONDON’S ENVIRONMENT
Accompanying this strategy is a General Assessment of London’s Environment. This evaluates the current condition of London’s environment at a city-wide level, using high-level indicators. Environmental issues are the negative impacts of our demands on environmental resources and/or the consequences of their poor management. The main environmental issues identified in the General Assessment have informed the development of this strategy.
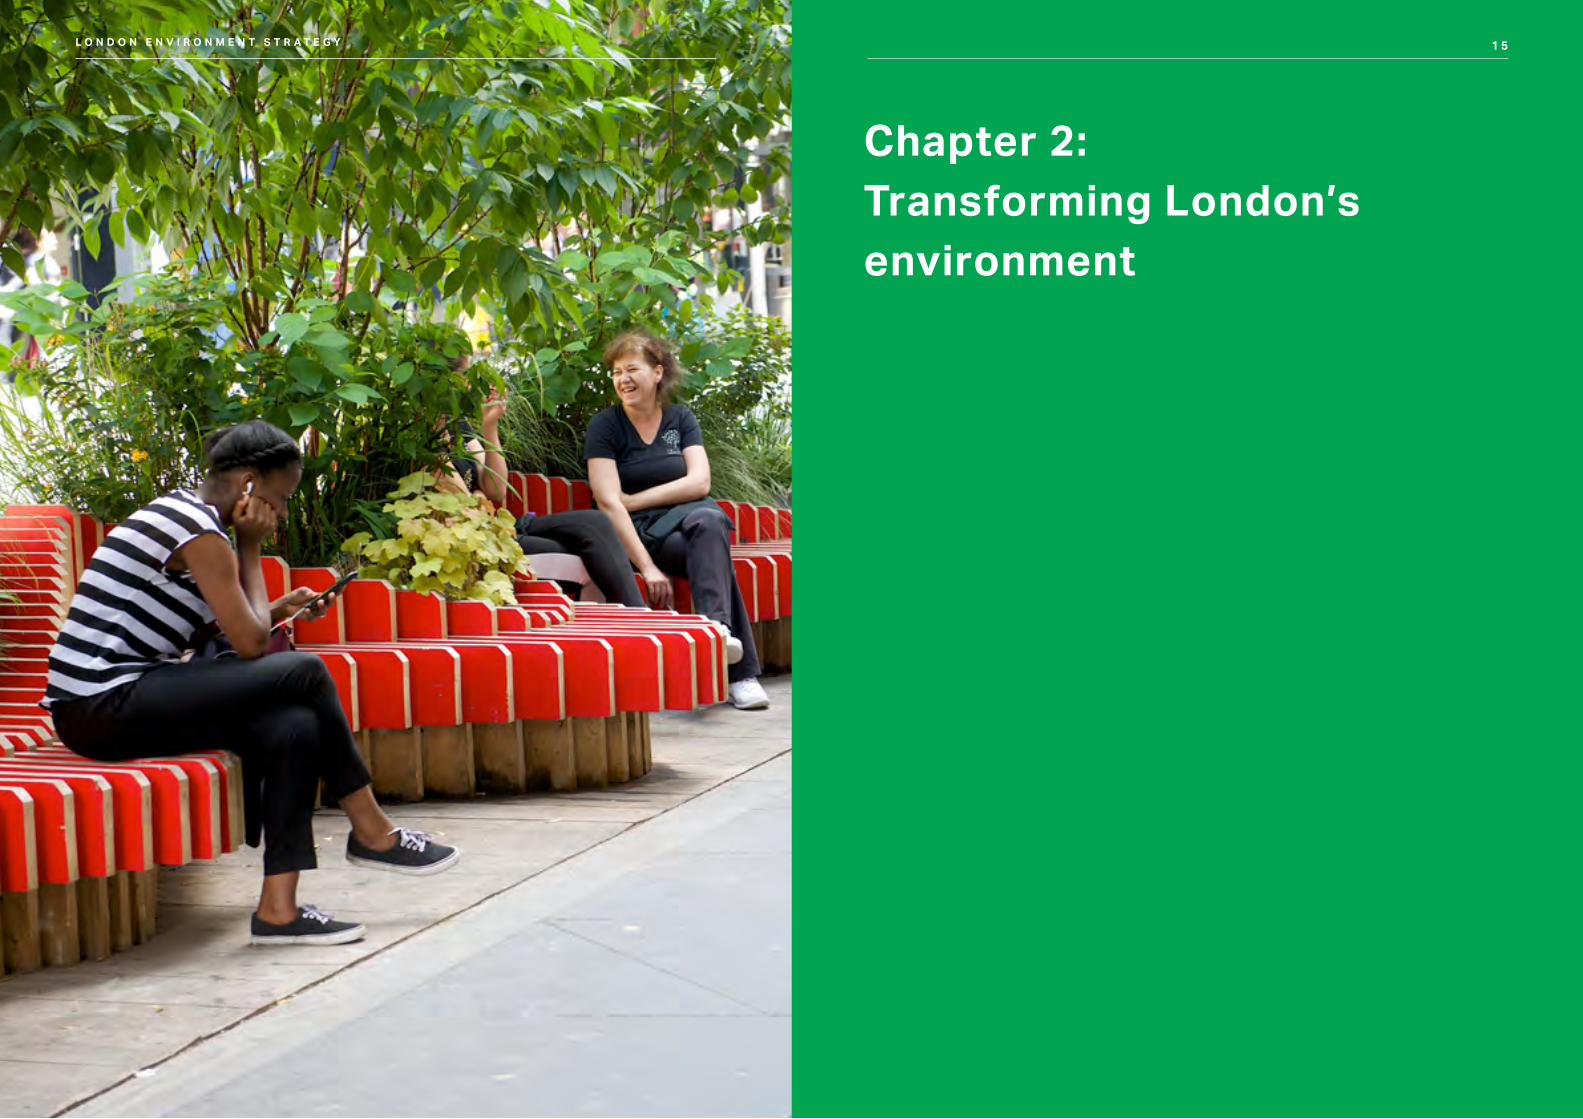
1 5
Chapter 2: Transforming London’s environment
1 5L O N D O N E N V I R O N M E N T S T R A T E G Y
1 7L O N D O N E N V I R O N M E N T S T R A T E G Y
For the first time, this strategy brings together approaches to every aspect of London’s environment, kick starting action that will improve the city’s environment right away, while taking the most ambitious view of what is possible in the future. It makes new connections between the environment and the rest of life in London. Recognising that the environment has a big influence on the quality of Londoners’ lives, it has people and their experience of living, working and spending time in the city at its heart.
By 2050, London is expected to be home to 11.1 million people, compared to around 8.7 million people today. The city’s population and economic growth will pose environmental challenges, but with new thinking and careful planning they can also provide the solution to many of the threats the city now faces. Realising the Mayor’s vision for environmentally good growth – growth that allows London to remain resilient to the changing climate and is green and healthy – will entail building environmental improvements into every aspect of London’s development.
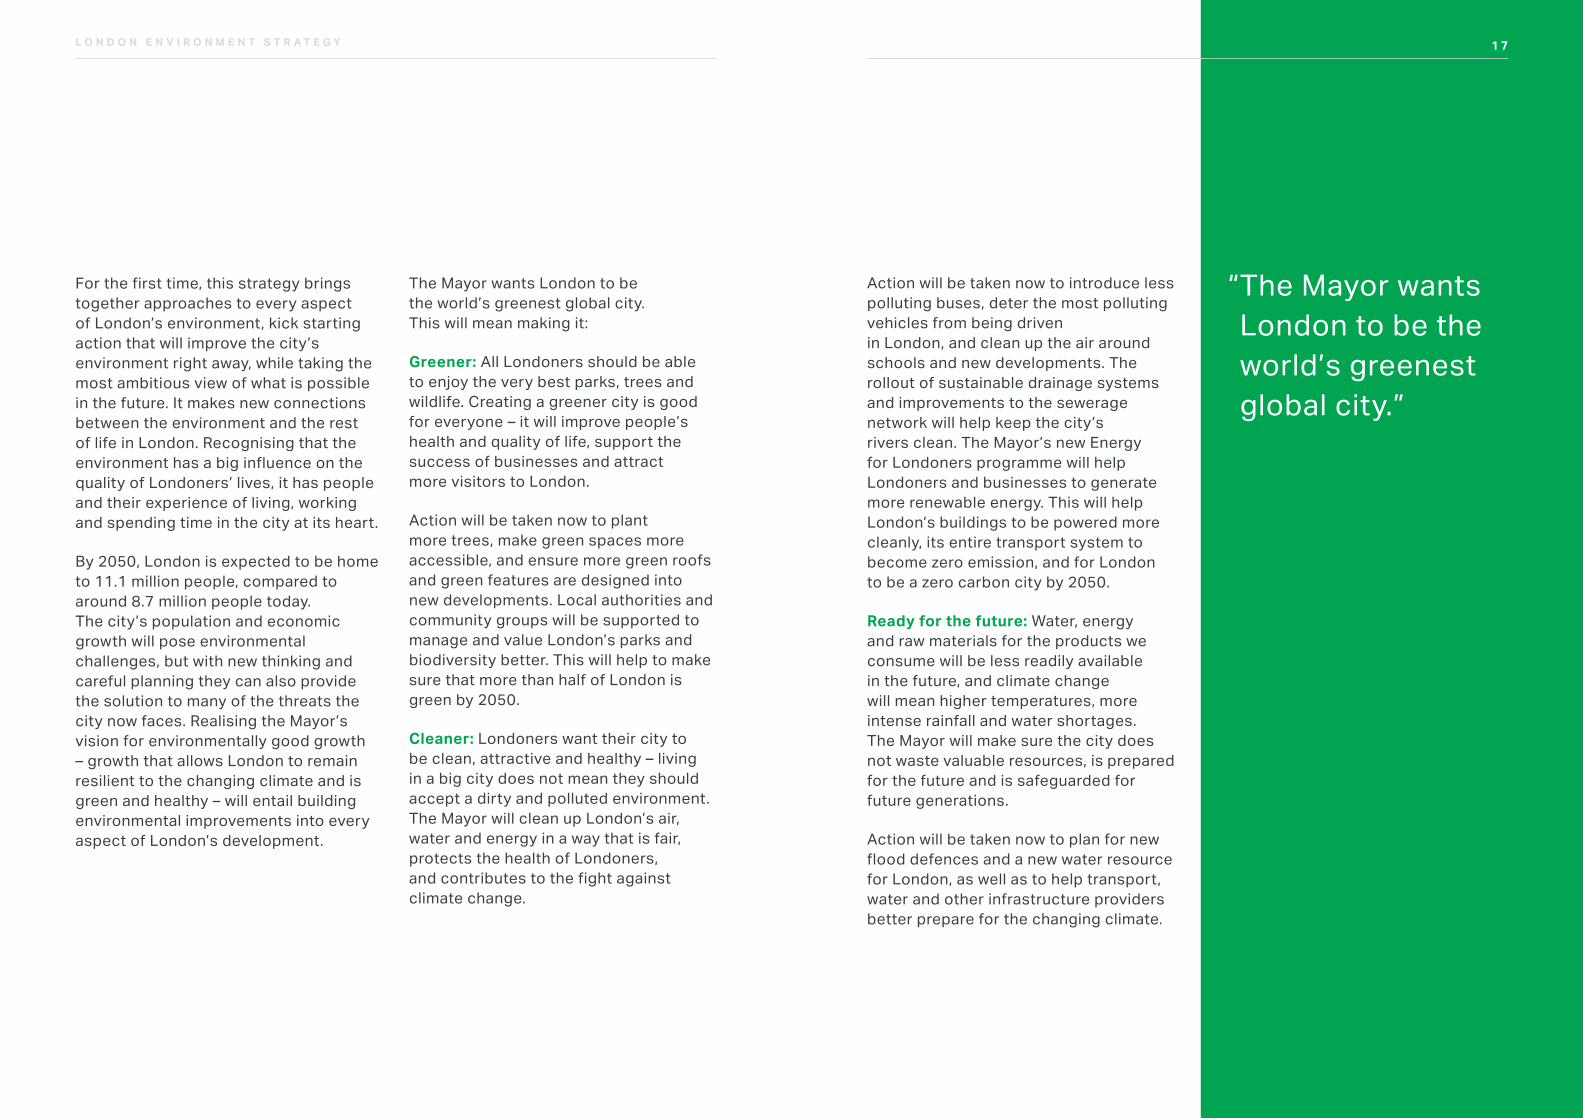
The Mayor wants London to be the world’s greenest global city. This will mean making it:
Greener: All Londoners should be able to enjoy the very best parks, trees and wildlife. Creating a greener city is good for everyone – it will improve people’s health and quality of life, support the success of businesses and attract more visitors to London.
Action will be taken now to plant more trees, make green spaces more accessible, and ensure more green roofs and green features are designed into new developments. Local authorities and community groups will be supported to manage and value London’s parks and biodiversity better. This will help to make sure that more than half of London is green by 2050.
Cleaner: Londoners want their city to be clean, attractive and healthy – living in a big city does not mean they should accept a dirty and polluted environment. The Mayor will clean up London’s air, water and energy in a way that is fair, protects the health of Londoners, and contributes to the fight against climate change.
Action will be taken now to introduce less polluting buses, deter the most polluting vehicles from being driven in London, and clean up the air around schools and new developments. The rollout of sustainable drainage systems and improvements to the sewerage network will help keep the city’s rivers clean. The Mayor’s new Energy for Londoners programme will help Londoners and businesses to generate more renewable energy. This will help London’s buildings to be powered more cleanly, its entire transport system to become zero emission, and for London to be a zero carbon city by 2050.
Ready for the future: Water, energy and raw materials for the products we consume will be less readily available in the future, and climate change will mean higher temperatures, more intense rainfall and water shortages. The Mayor will make sure the city does not waste valuable resources, is prepared for the future and is safeguarded for future generations.
Action will be taken now to plan for new flood defences and a new water resource for London, as well as to help transport, water and other infrastructure providers better prepare for the changing climate.
“ The Mayor wants London to be the world’s greenest global city.”
1 7
1 9L O N D O N E N V I R O N M E N T S T R A T E G Y
New smart meters will be rolled out to help Londoners use less energy and water, higher recycling standards will cut waste, and Londoners will be helped to use less packaging. This will help London send zero waste to landfill by 2026 and recycle 65 per cent of its waste by 2030.
The London Environment Strategy sets out bold policies and proposals in six policy areas and the transition to a low carbon circular economy to make this vision a reality. It provides, for the first time, an integrated framework for all the people and organisations whose actions, activities and policies have an impact on London’s environment.
PRINCIPLES
London’s environmental problems cannot be solved overnight, and creating the environment Londoners deserve will require everyone to work together over many years. This strategy sets out a vision for London in 2050, that will realise the potential of London’s environment to support good health and quality of life and to make the city a better place to live, work and do business.
But the city’s most pressing environmental challenges are harming Londoners’ health and the city’s economy right now, and the current pace of change is too slow. So the Mayor is taking a range of immediate actions to improve the environment now, setting London on the path to creating a better future.
• moving beyond business as usual – rather than just minimising the worst impacts of future change, this strategy aims to protect and improve London’s environment.
These principles will ensure not only that the Mayor’s bold ambition for the future of London’s environment can be realised in practice, but that the measures that are needed to improve London’s environment are implemented in a way that meets the needs of Londoners themselves. By keeping people at the heart of London’s first holistic and integrated strategy for the environment, the Mayor’s vision of making London the world’s greenest global city can be achieved in a way that improves the lives of all Londoners.
The solutions to London’s environmental challenges set out in this document have been developed in the context of current national and local policies, and the powers the Mayor currently has to act.
To ensure that in doing so this strategy remains realistic and people-focused, the following principles inform the approaches taken throughout:
• improving lives and reducing inequalities – action is required across different policy areas to provide solutions to environmental challenges. This strategy makes connections with other Mayoral strategies to prioritise fairness in the access and use of the environment.
• leading by example – the Mayor and wider GLA group should lead by example. Organisations like Transport for London (TfL), as well as organisations the Mayor has oversight of, such as the Metropolitan Police, can set examples and use new technologies.
• avoiding negative impacts on other policy areas – a single focus on one policy concern shouldn’t lead to a negative impact on another.
• learning from international best practice – London should be a global leader on the environment. This will require collaboration with leading climate change and environmental institutions and other world cities, sharing ideas and learning from best practice.
“ The Mayor is taking a range of immediate actions to improve the environment now, setting London on the path to creating a better future.”
L O N D O N E N V I R O N M E N T S T R A T E G Y
2 1L O N D O N E N V I R O N M E N T S T R A T E G Y
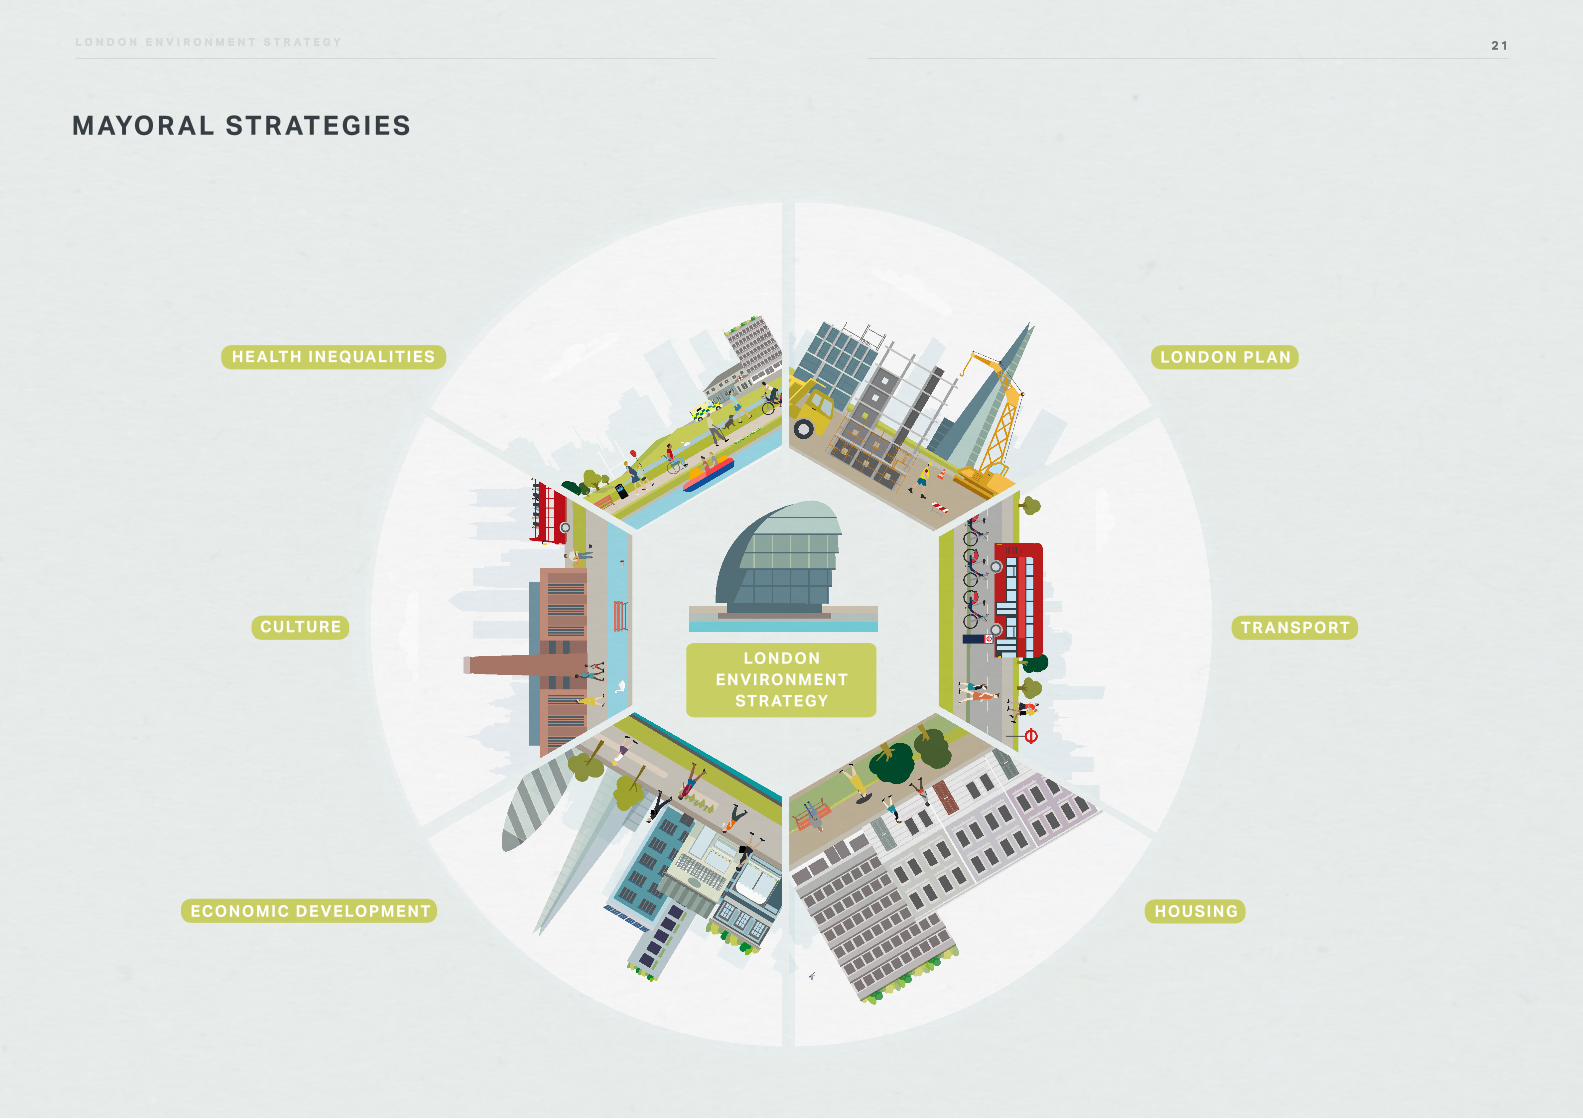
HOUSINGECONOMIC DE VELOPMENT
TR ANSPORTCULTURE
LONDON PL ANHE ALTH INEQUALITIES
MAYOR AL STR ATEGIES
2 1L O N D O N E N V I R O N M E N T S T R A T E G Y
LONDONENVIRONMENT
STR ATEGY
2 3L O N D O N E N V I R O N M E N T S T R A T E G Y
AIMS
To make the Mayor’s vision of transforming the city’s environment a reality, this strategy establishes some key aims for London.
The Mayor aims:
• for London to have the best air quality of any major world city by 2050, going beyond the legal requirements to protect human health and minimise inequalities
• for more than half of London’s area to be green and for tree canopy cover to increase by ten per cent by 2050
• for London to be a zero carbon city by 2050, with energy efficient buildings, clean transport and clean energy
• to make London a zero waste city. By 2026 no biodegradable or recyclable waste will be sent to landfill, and by 2030 65 per cent of London’s municipal waste will be recycled
• for London and Londoners to be resilient to severe weather and longer-term climate change impacts. This will include flooding, heat risk and drought
• to improve Londoners’ quality of life by reducing the number of people adversely affected by noise and promoting more quiet and tranquil spaces
The Mayor’s responsibilities and powers vary across the different environmental issues covered in this strategy. The Mayor has powers to supervise local authority air quality management functions and to require local authorities to act in general conformity with this strategy on municipal waste. The Mayor also has the power to guide London’s spatial development through the London Plan, and to manage London’s transport through Transport for London. Where direct powers to act are held by others, the Mayor can use leadership, influence and funding to ensure that the right action is taken for London.
This strategy has also been developed in the context of national policy. This includes the result of the 2016
referendum on the UK’s membership of the European Union (EU). With large sections of the UK’s environmental policy and regulation having been developed and implemented within the EU, the UK’s vote to leave the EU could result in uncertainty and potentially significant changes to national policy across the range of environmental issues covered in this strategy. The Mayor has published London’s position on environmental priorities as the UK exits the EU.1
This strategy has been developed to provide leadership on the environment. The challenges and approaches covered here should also be pursued at national level.
THE CONTE XT FOR THE DE VELOPMENT OF THE LONDON ENVIRONMENT STR ATEGY
1 Mayor of London (2017), London’s Global and European Future. Accessed from: https://www.london.gov.uk/sites/default/files/londons_global_and_european_future.pdf
INTEGRATED SOLUTIONS
This strategy brings together thinking on all of London’s environmental issues to take an integrated approach to solving the city’s environmental challenges. Many environmental problems are linked, and they often have complex causes, so developing holistic solutions can provide bigger environmental improvements in a more cost-effective way than looking at issues in isolation.
2 5L O N D O N E N V I R O N M E N T S T R A T E G Y
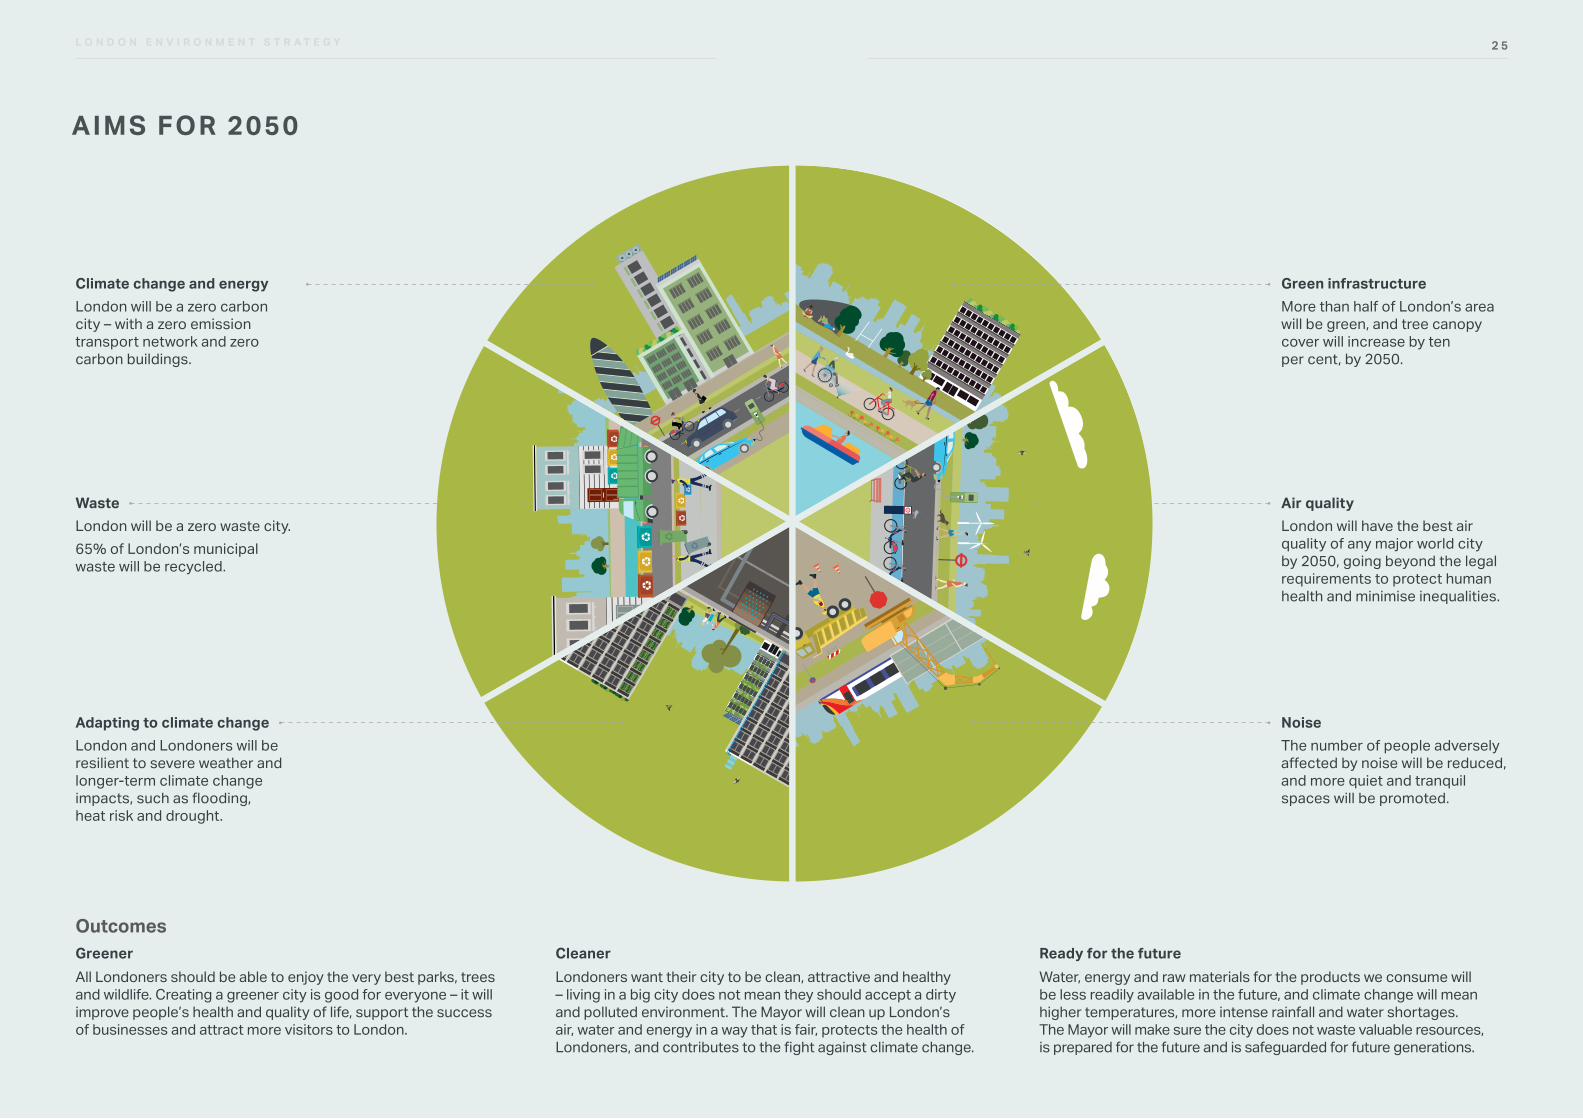
AIMS FOR 2050
2 5L O N D O N E N V I R O N M E N T S T R A T E G Y
All Londoners should be able to enjoy the very best parks, trees and wildlife. Creating a greener city is good for everyone – it will improve people’s health and quality of life, support the success of businesses and attract more visitors to London.
Londoners want their city to be clean, attractive and healthy – living in a big city does not mean they should accept a dirty and polluted environment. The Mayor will clean up London’s air, water and energy in a way that is fair, protects the health of Londoners, and contributes to the fight against climate change.
Water, energy and raw materials for the products we consume will be less readily available in the future, and climate change will mean higher temperatures, more intense rainfall and water shortages. The Mayor will make sure the city does not waste valuable resources, is prepared for the future and is safeguarded for future generations.
Greener Cleaner Ready for the futureOutcomes
Climate change and energyLondon will be a zero carbon city – with a zero emission transport network and zero carbon buildings.
Green infrastructureMore than half of London’s area will be green, and tree canopy cover will increase by ten per cent, by 2050.
WasteLondon will be a zero waste city.65% of London’s municipal waste will be recycled.
Air qualityLondon will have the best air quality of any major world city by 2050, going beyond the legal requirements to protect human health and minimise inequalities.
Adapting to climate changeLondon and Londoners will be resilient to severe weather and longer-term climate change impacts, such as flooding, heat risk and drought.
NoiseThe number of people adversely affected by noise will be reduced, and more quiet and tranquil spaces will be promoted.
2 7L O N D O N E N V I R O N M E N T S T R A T E G Y
CONSULTATION
The publication of this document starts a three month period of statutory consultation with the public, during which the Mayor would like to receive Londoners’ views about the issues raised in the draft strategy and the Mayor’s plans for addressing them. Consultation ends on 17 November 2017.
The strategy will then be revised in the light of comments received from the public and, following its submission to the London Assembly, a statutory London Environment Strategy will be published.
How to respond to this consultationThe Mayor wants to hear what everyone who has a stake in London thinks about the proposals outlined in this strategy. To have your say on the ideas and proposals in this strategy please visit www.london.gov.uk/environment-strategy and complete one of our surveys.
Alternatively, please email your comments to [email protected] or send your written comments to:
Draft London Environment StrategyCity HallThe Queen’s WalkLondonSE1 2AA
All information in responses, including personal information, may be subject to publication or disclosure under Freedom of Information legislation.
This document can be downloaded from www.london.gov.uk
QCONSULTATION QUESTIONS:
1. Do you agree with the overall vision and principles of this draft London Environment Strategy?
2. To achieve the policies and proposals in this strategy, which organisations should the Mayor call upon to do more (for example central and local government and business) and what should the priorities be?
3. Do you agree that this draft Lonon Environment Strategy covers all the
major environmental issues facing London?
4. There are a number of targets and milestones in this draft London Environment Strategy, what do you think are the main key performance indicators that would demonstrate progress against this integrated strategy?
5. What are the most important changes Londoners may need to make to achieve the outcomes and ambition for this strategy? What are the best ways to support them to do this?
london.gov.uk/environment-strategy

2 92 9L O N D O N E N V I R O N M E N T S T R A T E G Y 2 9L O N D O N E N V I R O N M E N T S T R A T E G Y
Chapter 3: New approaches
3 1L O N D O N E N V I R O N M E N T S T R A T E G Y
To make this vision a reality, London needs to approach how it thinks and acts on its environment in new ways. New solutions are required, making the most of all that London’s environment has to offer, and seeing the opportunities that change can bring.
STRATEGIC APPROACHES
This document uses four strategic approaches to make the most of environmental opportunities now and in the future. They inform every aspect of the strategy, providing links between each of them to reinforce the holistic approach that must be taken to tackle London’s environmental challenges. They also provide links between this and the Mayor’s other strategies, to ensure that environmental concerns are factored into decision making across London. They are:
• low carbon circular economy
• smart digital city
• green infrastructure and natural capital accounting
• the Healthy Streets Approach
There are four strategic approaches to make the most of environmental opportunities now and in the future:
• low carbon circular economy
• smart digital city
• green infrastructure and natural capital accounting
• the Healthy Streets Approach
L O N D O N E N V I R O N M E N T S T R A T E G Y
The low carbon circular economy The prevailing economic model has delivered huge growth and opportunity in the areas of wealth, education and life expectancy over the last century. But there has been an environmental and social cost to pay.
The pursuit of growth without a deeper consideration of the range of benefits it can bring has led to many of the environmental issues London faces today. Reliance on cars to transport ever-increasing numbers of people, industrial growth that has relied on fossil fuels and a disposable economy have all led to pollution, increasing emissions and the inefficient use of resources. An uneven distribution of the benefits of growth has exacerbated the effect of environmental problems on the groups of people who are likely to be the worst affected by fuel poverty, poor air quality and the effects of climate change.
London is already reversing many of these negative trends, but to do more, a continuously-evolving approach to economic development is required. This approach will help London to thrive by adopting more sustainable and inclusive business models that value
and reward low carbon initiatives and environmental sustainability, and create wider social benefits.
A low carbon circular economy is one in which as much value as possible is extracted from resources, through their use and reuse, before they become waste. As London grows, it must invest in low carbon infrastructure and services to achieve a healthier, zero emission, resource efficient growth. This can be achieved by manufacturing goods that are made to last, rather than be disposed of, and by creating systems that allow existing goods to be reused and recycled.
This new model is not only an environmental imperative, required to preserve the planet’s scarce resources and limit the impacts of climate change and overconsumption – it is also a huge opportunity for London’s businesses. In 2014/15, London’s low carbon and environmental goods and services sector generated around £30.4bn in sales and its 10,900 businesses employed around 192,000 people. Between now and 2020, this sector is expected to grow by over six per cent a year.
3 3L O N D O N E N V I R O N M E N T S T R A T E G Y
London is especially strong in the clean tech sector, with the largest concentration of clean tech businesses in the country.2 Around 42 per cent of clean tech sales are made in London and the south east, so the low carbon circular economy promises to provide huge opportunities for the city.
The smart digital cityA smart digital London is one that looks to use new technologies and increased connectivity to make better use of infrastructure and provide more efficient services.
Smart technologies can help address environmental challenges. They can make environmental systems, such as energy, water or waste more efficient, and can enable Londoners to make better informed, environmentally-sound decisions. Smart energy meters can help people reduce their energy use. Smart heat networks can increase the efficiency of heat production and use. Smart lampposts can charge electric vehicles and supply Wi-Fi and local information. Digital connectivity including the roll out of 5G can be an enabler of technologies and working patterns that can contribute to environmental improvements.
More widely, a ‘digital first’ approach can support the low carbon circular economy by keeping resources in full use for as long as possible. It can make the most of available infrastructure through efficiency and integration and ensure that new infrastructure investment is resilient, flexible and future-proofed. The Mayor wants London’s entrepreneurial talent to be able to use the data available to solve London’s environmental challenges, which is particularly important in energy and transport. Better data use can also allow city services to be designed and used in the way that people want them to be, and that they find most useful.
Green infrastructure and natural capital accountingLondon’s green infrastructure - its parks, green spaces, trees, wetlands and green roofs – can reduce the impacts of climate change and help to store carbon. They can improve air quality and water quality. They can promote healthier lives, reduce car dependency and encourage more walking and cycling. They can improve biodiversity and ecological resilience. These benefits are economically valuable, but are not widely understood.
Most organisations assess the value of their assets through conventional financial accounting, in which the economic benefits of green infrastructure are rarely assessed. If green infrastructure does appear in financial accounts, it is often as a liability – accounting for the cost of maintaining a local park, rather than also taking into account the benefits the park provides to the local community and economy. This ignores the huge range of benefits green infrastructure can provide – from better physical and mental health and increased property prices to reduced flood and heat risk.
Natural capital accounting addresses this by bringing together the full benefits of green infrastructure and presenting them in a similar way to other capital assets, like buildings.
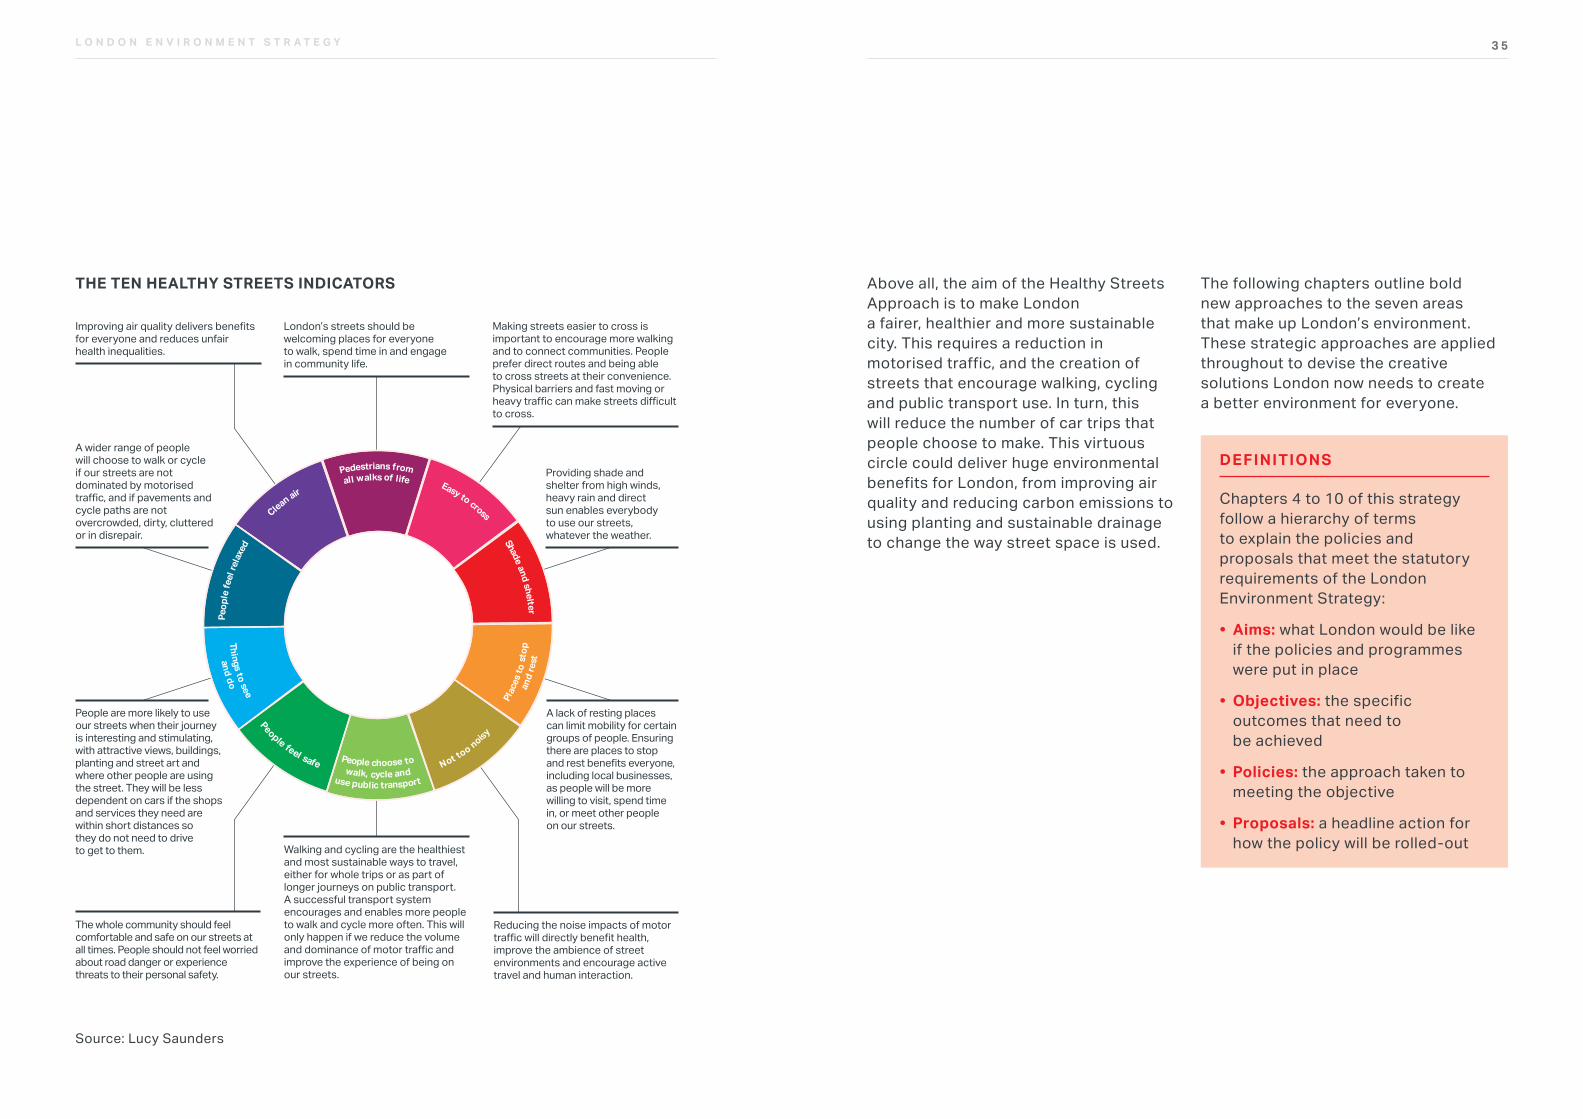
The Healthy Streets ApproachThe Healthy Streets Approach provides a framework for putting human health and experience at the heart of planning the city. Environmental factors have a big impact on the way people interact with the places around them, so improving the environment is a big feature of this new way of thinking. Good performance against each of the ten evidence-based Healthy Streets Indicators means that individual streets are fair, inclusive and sustainable environments. Improvements against all the indicators across the city’s streets will radically transform the day-to-day experience of living in London, helping to create a better city for everyone.
2 Cleantech usually refers to technology for low carbon and resource efficient technologies. In this strategy, the term is used to cover technologies that address the causes and effects of climate change
3 5L O N D O N E N V I R O N M E N T S T R A T E G Y
Providing shade and shelter from high winds, heavy rain and direct sun enables everybody to use our streets, whatever the weather.
London’s streets should be welcoming places for everyone to walk, spend time in and engage in community life.
Walking and cycling are the healthiest and most sustainable ways to travel, either for whole trips or as part of longer journeys on public transport. A successful transport system encourages and enables more people to walk and cycle more often. This will only happen if we reduce the volume
improve the experience of being on our streets.
for everyone and reduces unfair health inequalities.
The whole community should feel comfortable and safe on our streets at all times. People should not feel worried about road danger or experience threats to their personal safety.
Reducing the noise impacts of motor
improve the ambience of street environments and encourage active travel and human interaction.
Making streets easier to cross is important to encourage more walking and to connect communities. People prefer direct routes and being ableto cross streets at their convenience. Physical barriers and fast moving or
to cross.
A lack of resting places can limit mobility for certain groups of people. Ensuring there are places to stop
including local businesses, as people will be more willing to visit, spend time in, or meet other people on our streets.
A wider range of people will choose to walk or cycle if our streets are not dominated by motorised
cycle paths are not overcrowded, dirty, cluttered or in disrepair.
People are more likely to use our streets when their journey is interesting and stimulating, with attractive views, buildings, planting and street art and where other people are using the street. They will be less dependent on cars if the shops and services they need are within short distances so they do not need to drive to get to them.
Clean air
Peop
le fe
el re
laxe
d Shade and shelter
Easy to cross
Pedestrians fromall walks of life
and doThings to see
People feel safe Not too noisy
use public transport walk, cycle and
People choose to
Plac
es t o
stop
and
rest
THE TEN HEALTHY STREETS INDICATORS
Source: Lucy Saunders
THE TEN HEALTHY STREETS INDICATORS
Source: Lucy Saunders
THE TEN HEALTHY STREETS INDICATORS Above all, the aim of the Healthy Streets Approach is to make London a fairer, healthier and more sustainable city. This requires a reduction in motorised traffic, and the creation of streets that encourage walking, cycling and public transport use. In turn, this will reduce the number of car trips that people choose to make. This virtuous circle could deliver huge environmental benefits for London, from improving air quality and reducing carbon emissions to using planting and sustainable drainage to change the way street space is used.
DEFINITIONS
Chapters 4 to 10 of this strategy follow a hierarchy of terms to explain the policies and proposals that meet the statutory requirements of the London Environment Strategy:
• Aims: what London would be like if the policies and programmes were put in place
• Objectives: the specific outcomes that need to be achieved
• Policies: the approach taken to meeting the objective
• Proposals: a headline action for how the policy will be rolled-out
The following chapters outline bold new approaches to the seven areas that make up London’s environment. These strategic approaches are applied throughout to devise the creative solutions London now needs to create a better environment for everyone.
3 73 7L O N D O N E N V I R O N M E N T S T R A T E G Y
Chapter 4: Air quality
3 9L O N D O N E N V I R O N M E N T S T R A T E G Y
INTRODUCTION
Since the passage of the Clean Air Act over sixty years ago, there has been huge progress in improving air quality in London. The city now meets legal limits set by the national Air Quality Regulations3 for most pollutants. There have been historic reductions in the levels of benzene, lead and sulphur dioxide pollution, which has greatly improved health and quality of life. This underlines the ability of effective and coordinated action to improve the air we breathe if we are bold enough to take strong action.
While the Great Smogs of the 1950s and 1960s are thankfully a thing of the past, this does not mean the problem has gone away. There is still much to be done to improve London’s toxic air.
AIM London will have the best air quality of any major world city by 2050, going beyond the legal requirements to protect human health and minimise inequalities.
L O N D O N E N V I R O N M E N T S T R A T E G Y
Two pollutants remain a specific concern. These are particulate matter (PM10, PM2.5 and black carbon) and nitrogen dioxide (NO2). London is failing to meet the legal limit for NO2. Particulate matter is damaging to health at any level and must be reduced.
Improving London’s air quality requires the following actions:
• reducing exposure of Londoners to harmful pollution across London – especially at priority locations like schools – and tackling health inequality
• achieving legal compliance with UK and EU limits as soon as possible, including by mobilising action from the London boroughs, government and other partners
• establishing and achieving new, tighter air quality targets for a cleaner London, meeting World Health Organisation (WHO) health-based guidelines by 2030 by transitioning to a zero emission London
These actions reflect the importance of taking immediate action to protect public health and of raising awareness amongst Londoners. A City Hall commissioned report estimated that over 9,000 Londoners died prematurely from long-term exposure to air pollution in 2010.4 The Mayor is committed to improving air quality as soon as possible, but recognises pollution will still be unacceptably high for a number of years due to historic policy failure and inaction, which have contributed to the scale of the problem. It is therefore necessary to reduce exposure (for example at schools) as far as possible and address the unacceptable health inequality caused by the unequal exposure to pollution by different groups.
In parallel to reducing exposure, the Mayor will take urgent action to tackle pollution to achieve legal compliance with UK and EU limits as soon as possible and in the most effective manner. This includes signature measures like introducing the Ultra Low Emission Zone (ULEZ) and transforming the bus and taxi fleets to be zero emission. This strategy
3 Air Quality Standards Regulations 2010, SI number 2010/1001: http://www.legislation.gov.uk/uksi/2010/1001/contents/made 4 Walton, H., Dajnak, D., Beevers, S., Williams, M. & Hunt, A. (2015), Understanding the Health Impacts of Air Pollution in London. Accessed from: http://www.kcl.ac.uk/lsm/research/divisions/aes/research/ERG/research-projects/HIAinLondonKingsReport14072015final.pdf or on the website: https://www.london.gov.uk/sites/default/files/hiainlondon_kingsreport_14072015_final.pdf
4 1L O N D O N E N V I R O N M E N T S T R A T E G Y
will set out a roadmap to compliance. However, this can only be achieved as quickly as possible if the London boroughs, government and others play their full part. Where available, the Mayor will use statutory powers to ensure this.
This strategy also recognises the need to go beyond legal limits, as these reflect political and economic considerations as well as health impacts. These should therefore be treated as a starting rather than an end point. WHO guidelines, meanwhile, were driven solely by the available health evidence and as a result are set much tighter for PM10 and PM2.5. Achieving these more ambitious targets would provide many extra health benefits for Londoners. This strategy sets out the timescale, and the changes needed, to achieve these tighter targets.
Improving air quality also offers an opportunity to address climate change. In the past policy makers have focused on reducing carbon emissions which has resulted in unintended consequences like encouraging the use of diesel, the promotion of biomass boilers and gas engine combined heat and power systems being installed in areas of poor air quality. Instead in this strategy we are seeking to design integrated policies which deliver multiple benefits.
4 3L O N D O N E N V I R O N M E N T S T R A T E G Y
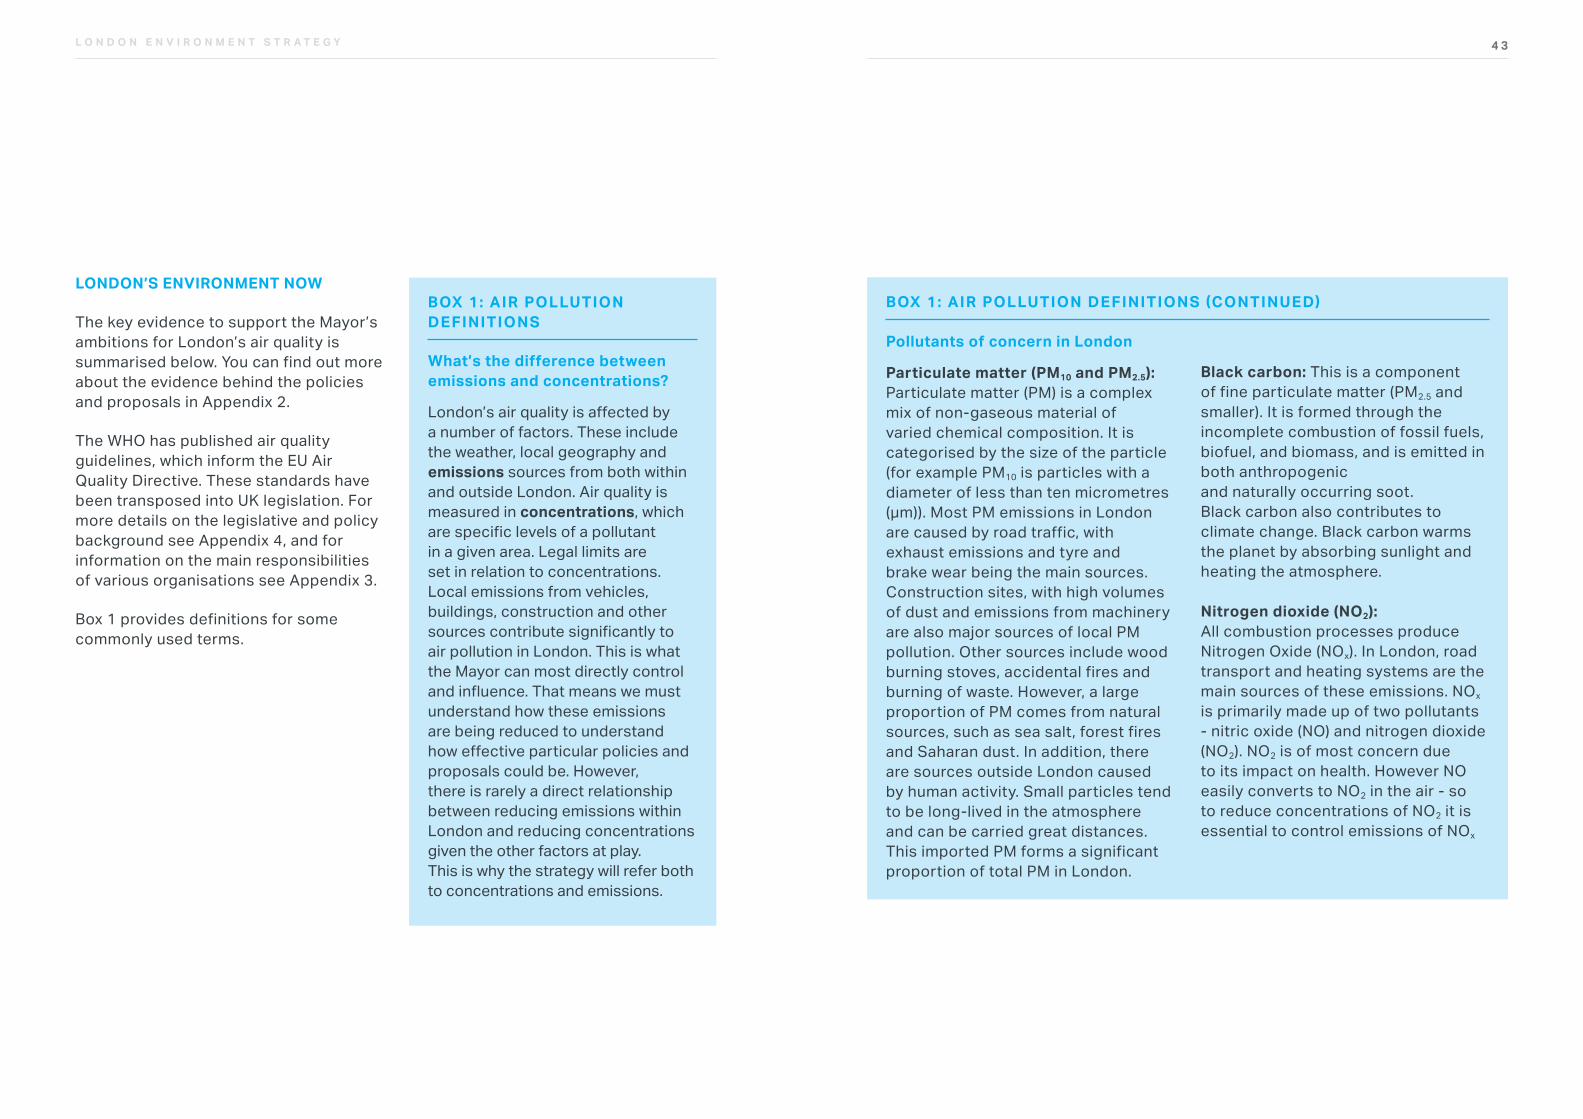
BOX 1: AIR POLLUTION DEFINITIONS
What’s the difference between emissions and concentrations?
London’s air quality is affected by a number of factors. These include the weather, local geography and emissions sources from both within and outside London. Air quality is measured in concentrations, which are specific levels of a pollutant in a given area. Legal limits are set in relation to concentrations. Local emissions from vehicles, buildings, construction and other sources contribute significantly to air pollution in London. This is what the Mayor can most directly control and influence. That means we must understand how these emissions are being reduced to understand how effective particular policies and proposals could be. However, there is rarely a direct relationship between reducing emissions within London and reducing concentrations given the other factors at play. This is why the strategy will refer both to concentrations and emissions.
Pollutants of concern in London
Particulate matter (PM10 and PM2.5): Particulate matter (PM) is a complex mix of non-gaseous material of varied chemical composition. It is categorised by the size of the particle (for example PM10 is particles with a diameter of less than ten micrometres (µm)). Most PM emissions in London are caused by road traffic, with exhaust emissions and tyre and brake wear being the main sources. Construction sites, with high volumes of dust and emissions from machinery are also major sources of local PM pollution. Other sources include wood burning stoves, accidental fires and burning of waste. However, a large proportion of PM comes from natural sources, such as sea salt, forest fires and Saharan dust. In addition, there are sources outside London caused by human activity. Small particles tend to be long-lived in the atmosphere and can be carried great distances. This imported PM forms a significant proportion of total PM in London.
Black carbon: This is a component of fine particulate matter (PM2.5 and smaller). It is formed through the incomplete combustion of fossil fuels, biofuel, and biomass, and is emitted in both anthropogenic and naturally occurring soot. Black carbon also contributes to climate change. Black carbon warms the planet by absorbing sunlight and heating the atmosphere. Nitrogen dioxide (NO2): All combustion processes produce Nitrogen Oxide (NOx). In London, road transport and heating systems are the main sources of these emissions. NOx is primarily made up of two pollutants - nitric oxide (NO) and nitrogen dioxide (NO2). NO2 is of most concern due to its impact on health. However NO easily converts to NO2 in the air - so to reduce concentrations of NO2 it is essential to control emissions of NOx
BOX 1: AIR POLLUTION DEFINITIONS (CONTINUED)LONDON’S ENVIRONMENT NOW
The key evidence to support the Mayor’s ambitions for London’s air quality is summarised below. You can find out more about the evidence behind the policies and proposals in Appendix 2.
The WHO has published air quality guidelines, which inform the EU Air Quality Directive. These standards have been transposed into UK legislation. For more details on the legislative and policy background see Appendix 4, and for information on the main responsibilities of various organisations see Appendix 3.
Box 1 provides definitions for some commonly used terms.
4 5L O N D O N E N V I R O N M E N T S T R A T E G Y
Figure 1: Trends in NO2 in London – 2000 to 2016
2000 2002 2004 2006 2008 2010 2012 2014 2016
0
20
40
60
80
Figure xxx: Trends in NO2 concentrations in London – 2000 to 2016
NO
2(μg
m33 )
Source: GLA (2016), London Atmospheric Emissions Inventory (LAEI) 2013.
Accessed from: data.london.gov.uk/dataset/london-atmspheric-emissions-inventory-2013
Background OuterLondon
Background InnerLondon
Roadside OuterLondon
Roadside InnerLondon
Source: the London Air Quality Network and analysis by King’s College London
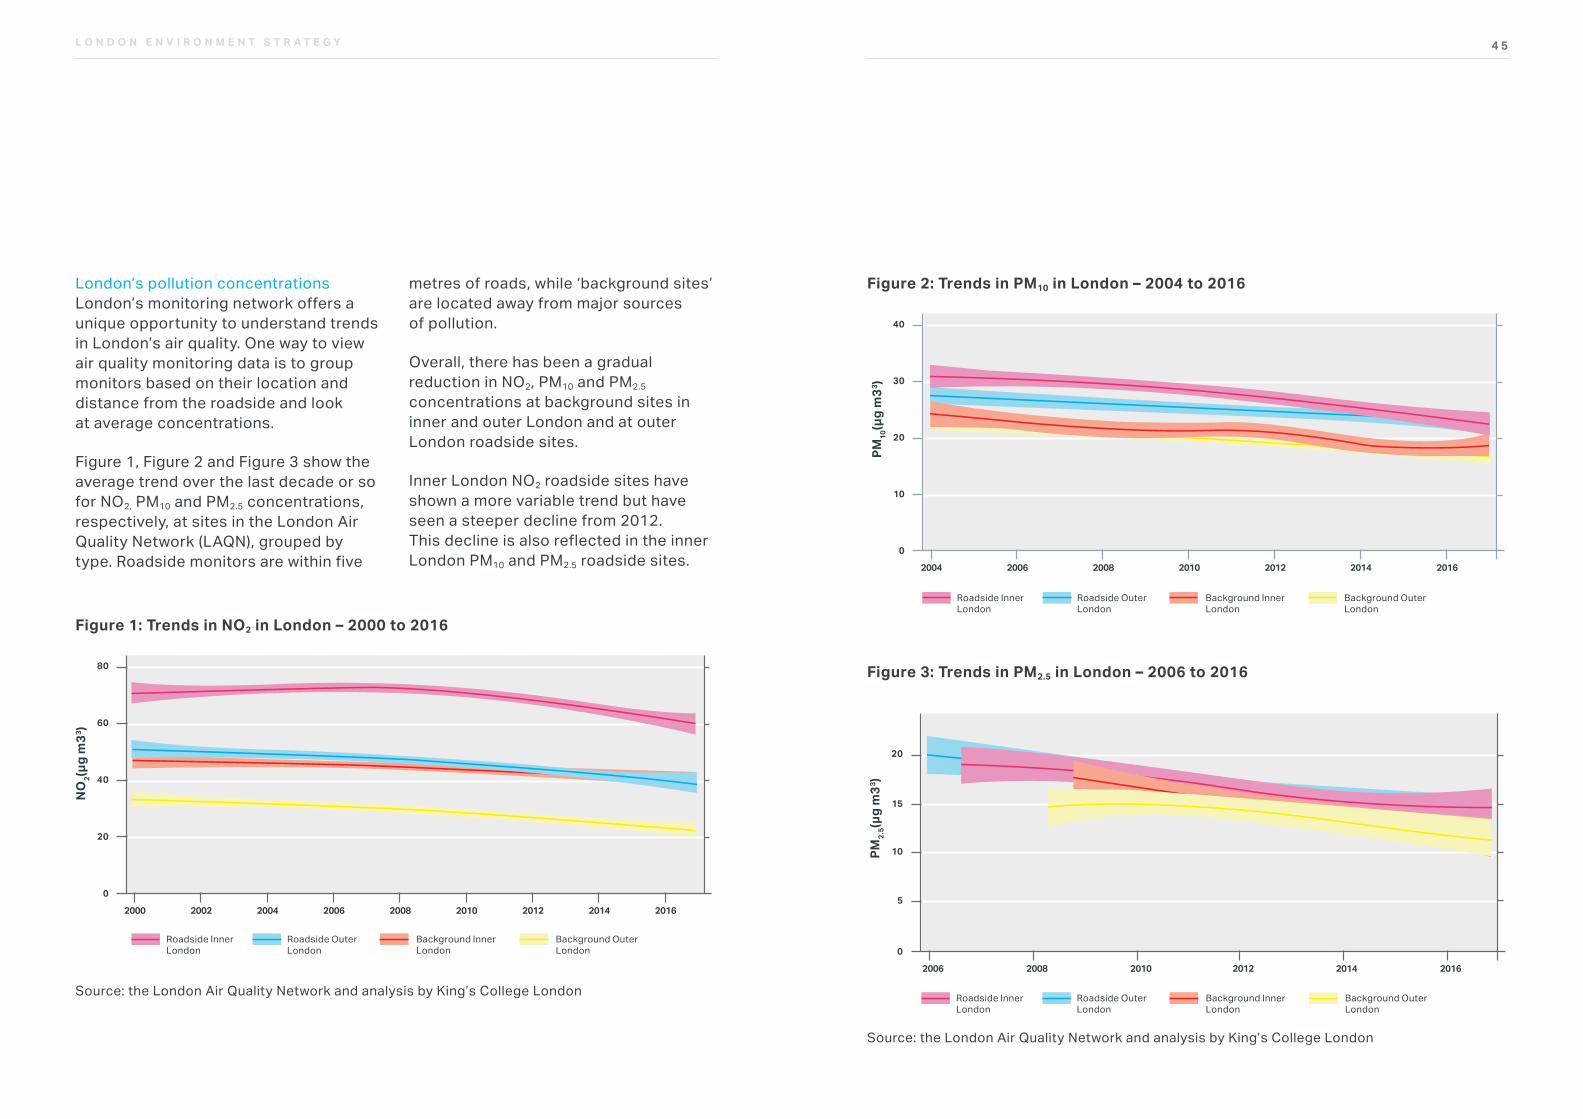
London’s pollution concentrationsLondon’s monitoring network offers a unique opportunity to understand trends in London’s air quality. One way to view air quality monitoring data is to group monitors based on their location and distance from the roadside and look at average concentrations.
Figure 1, Figure 2 and Figure 3 show the average trend over the last decade or so for NO2, PM10 and PM2.5 concentrations, respectively, at sites in the London Air Quality Network (LAQN), grouped by type. Roadside monitors are within five
metres of roads, while ‘background sites’ are located away from major sources of pollution.
Overall, there has been a gradual reduction in NO2, PM10 and PM2.5 concentrations at background sites in inner and outer London and at outer London roadside sites.
Inner London NO2 roadside sites have shown a more variable trend but have seen a steeper decline from 2012. This decline is also reflected in the inner London PM10 and PM2.5 roadside sites.
Figure 2: Trends in PM10 in London – 2004 to 2016
TYPE OF GRAPH: AIR QUALITY
Reference
Fig 2: Trends in PM10 concentrations in London – 2004 to 2016
Source: GLA (2016), London Atmospheric Emissions Inventory (LAEI) 2013. Available at: data.london.gov.uk/dataset/london-atmspheric-emissions-inventory-2013
2004 2006 2008 2010 2012 2014 2016
0
10
20
30
40
PM10
(μg
m33 )
Background OuterLondon
Background InnerLondon
Roadside OuterLondon
Roadside InnerLondon
Figure 3: Trends in PM2.5 in London – 2006 to 2016
Source: the London Air Quality Network and analysis by King’s College London
TYPE OF GRAPH: AIR QUALITY
Reference
Fig 3: Trends in PM2.5 concentrations in London – 2004 to 2016
Source: GLA (2016), London Atmospheric Emissions Inventory (LAEI) 2013. Available at: data.london.gov.uk/dataset/london-atmspheric-emissions-inventory-2013
2006 2008 20122010 2014 2016
0
5
10
15
20
PM2.
5(μg
m33 )
Background OuterLondon
Background InnerLondon
Roadside OuterLondon
Roadside InnerLondon
4 7L O N D O N E N V I R O N M E N T S T R A T E G Y
These reductions are important as they show, overall, that air quality is improving in London. However, the NO2 EU annual mean limit value of 40 μg m3 is being exceeded in many places and the PM health based guidelines are far from being met.
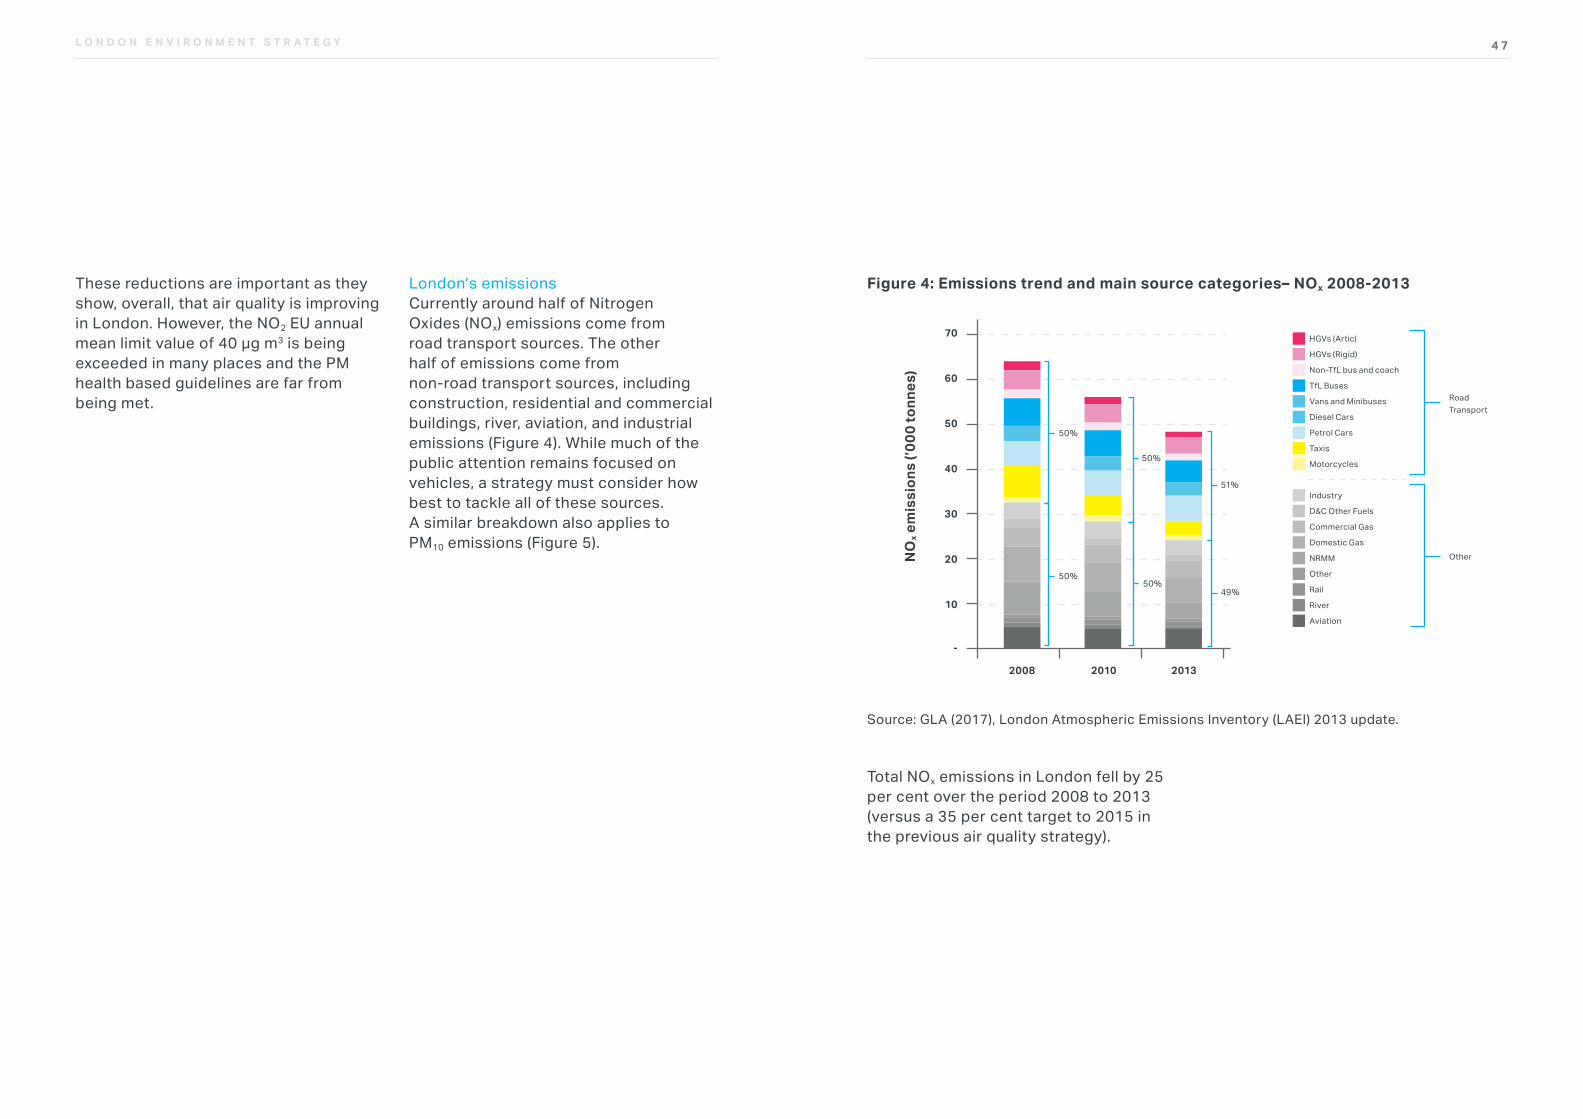
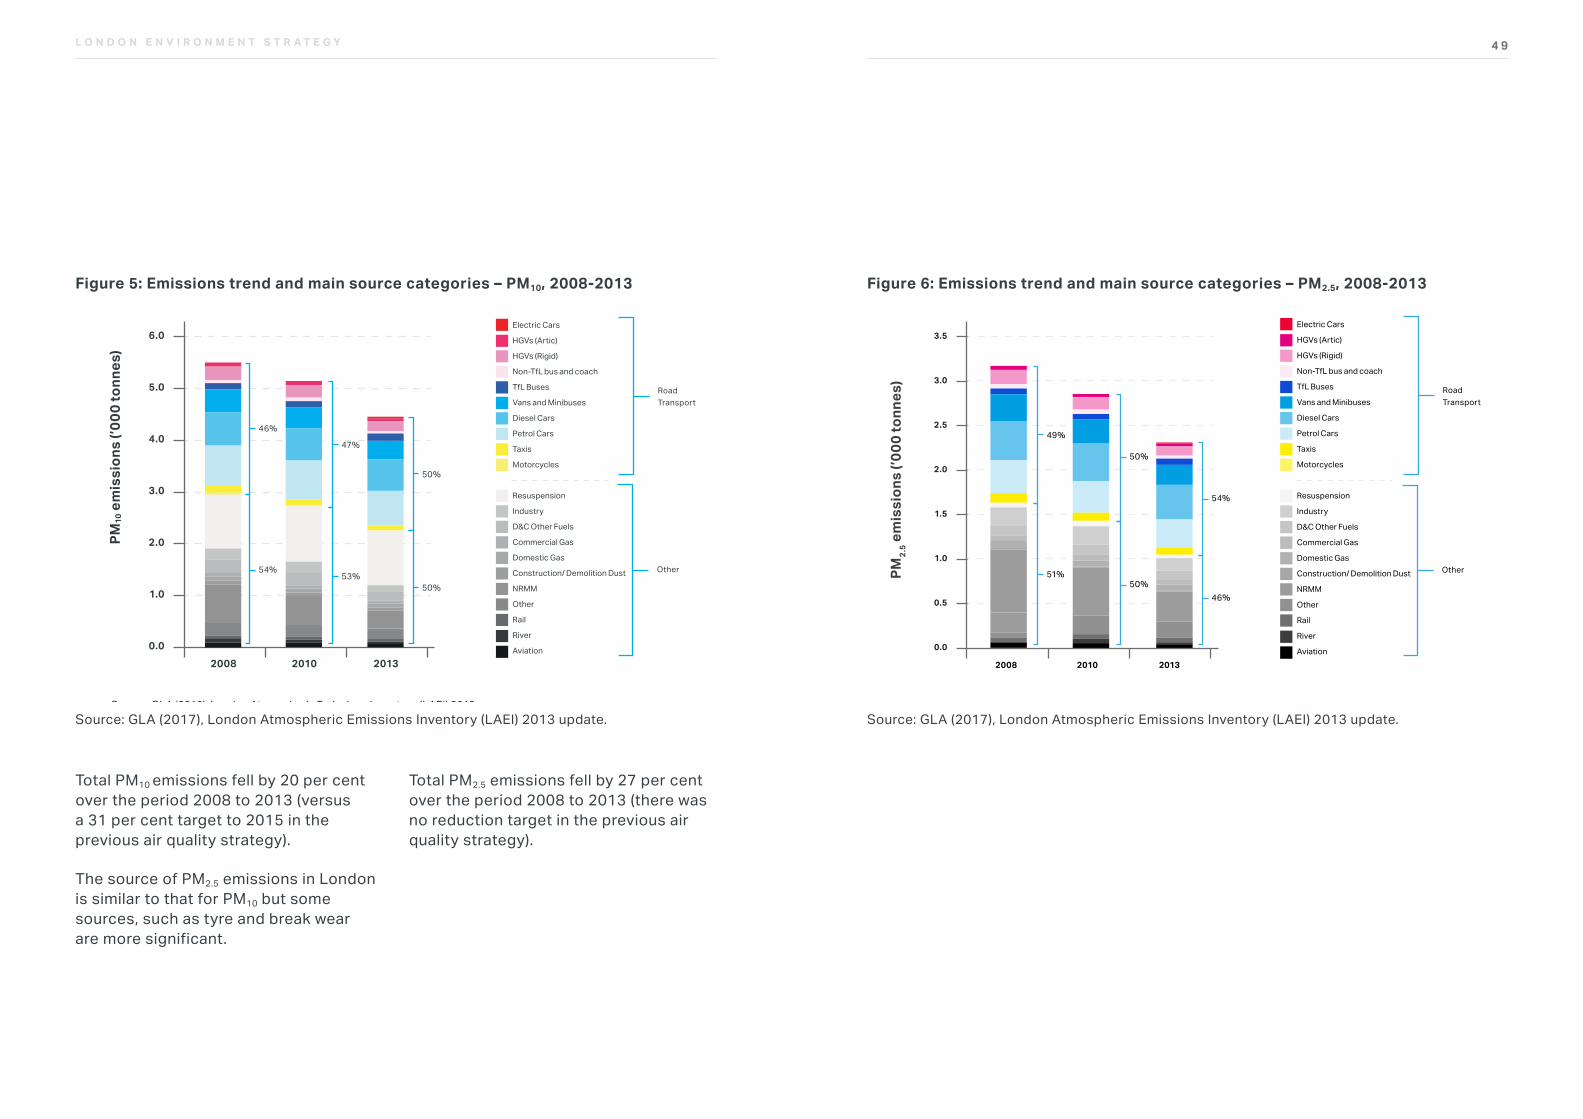
London’s emissionsCurrently around half of Nitrogen Oxides (NOx) emissions come from road transport sources. The other half of emissions come from non-road transport sources, including construction, residential and commercial buildings, river, aviation, and industrial emissions (Figure 4). While much of the public attention remains focused on vehicles, a strategy must consider how best to tackle all of these sources. A similar breakdown also applies to PM10 emissions (Figure 5).
Figure 4: Emissions trend and main source categories– NOx 2008-2013
TYPE OF GRAPH: AIR QUALITY
Reference
Fig 4: Emissions trend and main source categories – NOx 2008-2013
Source: GLA (2016), London Atmospheric Emissions Inventory (LAEI) 2013. Available at: data.london.gov.uk/dataset/london-atmspheric-emissions-inventory-2013
NO
x em
issi
ons
(’000
tonn
es)
70
60
50
40
30
20
10
-
2008 2010 2013
HGVs (Artic)
HGVs (Rigid)
Non-TfL bus and coach
TfL Buses
Vans and Minibuses
Diesel Cars
Petrol Cars
Taxis
Motorcycles
Industry
D&C Other Fuels
Commercial Gas
Domestic Gas
NRMM
Other
Rail
River
Aviation
RoadTransport
51%
49%
50%
50%
50%50%
Other
Source: GLA (2017), London Atmospheric Emissions Inventory (LAEI) 2013 update.
Total NOx emissions in London fell by 25 per cent over the period 2008 to 2013 (versus a 35 per cent target to 2015 in the previous air quality strategy).
4 9L O N D O N E N V I R O N M E N T S T R A T E G Y
Figure 5: Emissions trend and main source categories – PM10, 2008-2013
TYPE OF GRAPH: AIR QUALITY
Reference
Fig 5: Emissions trend and main source categories – PM10 2008-2013
Source: GLA (2016), London Atmospheric Emissions Inventory (LAEI) 2013. Available at: data.london.gov.uk/dataset/london-atmspheric-emissions-inventory-2013
2010 2013
PM10
em
issi
ons
(’000
tonn
es)
6.0
5.0
4.0
3.0
2.0
1.0
0.02008 2010 2013
Electric Cars
HGVs (Artic)
HGVs (Rigid)
Non-TfL bus and coach
TfL Buses
Vans and Minibuses
Diesel Cars
Petrol Cars
Taxis
Motorcycles
Resuspension
Industry
D&C Other Fuels
Commercial Gas
Domestic Gas
Construction/ Demolition Dust
NRMM
Other
Rail
River
Aviation
RoadTransport
46%
54%53%
47%
50%
50%
Other
Total PM10 emissions fell by 20 per cent over the period 2008 to 2013 (versus a 31 per cent target to 2015 in the previous air quality strategy).
The source of PM2.5 emissions in London is similar to that for PM10 but some sources, such as tyre and break wear are more significant.
Total PM2.5 emissions fell by 27 per cent over the period 2008 to 2013 (there was no reduction target in the previous air quality strategy).
Source: GLA (2017), London Atmospheric Emissions Inventory (LAEI) 2013 update. Source: GLA (2017), London Atmospheric Emissions Inventory (LAEI) 2013 update.
Figure 6: Emissions trend and main source categories – PM2.5, 2008-2013
TYPE OF GRAPH: AIR QUALITY
Reference
Fig 6: Emissions trend and main source categories – PM2.5 2008-2013
Source: GLA (2016), London Atmospheric Emissions Inventory (LAEI) 2013. Available at: data.london.gov.uk/dataset/london-atmspheric-emissions-inventory-2013
PM2.
5 em
issi
ons
(’000
tonn
es) 3.0
3.5
2.5
2.0
1.5
1.0
0.5
0.0
2008 2010 2013
Electric Cars
HGVs (Artic)
HGVs (Rigid)
Non-TfL bus and coach
TfL Buses
Vans and Minibuses
Diesel Cars
Petrol Cars
Taxis
Motorcycles
Resuspension
Industry
D&C Other Fuels
Commercial Gas
Domestic Gas
Construction/ Demolition Dust
NRMM
Other
Rail
River
Aviation
RoadTransport
49%
50%
50%
54%
46%
51% Other
5 1L O N D O N E N V I R O N M E N T S T R A T E G Y
Figure 7: 2013 - Annual mean NO2 concentrations
Source: GLA (2017), London Atmospheric Emissions Inventory (LAEI) 2013 Update.
LegendNO2 (µg/m3)
<16
16 - 19
19 - 22
22 - 25
25 - 28
28 - 31
31 - 34
34 - 37
37 - 40
40 - 43
43 - 55
55 - 58
58 - 73
73 - 76
76 - 97
>97
´
0 105
Kilometres
post LAEI 2013Greater London - Annual Mean NO2 concentrations 2013
m Limit
Figure 8: 2013 - Annual mean PM10 concentrations
Figure 9: 2013 - Annual mean PM2.5 concentrations
Source: GLA (2017), London Atmospheric Emissions Inventory (LAEI) 2013 Update.
LegendPM10 (µg/m3)
<16
16 - 19
19 - 22
22 - 25
25 - 28
28 - 31
31 - 34
34 - 37
37 - 40
40 - 43
43 - 55
55 - 58
58 - 73
73 - 76
76 - 97
>97
´
0 105
Kilometres
post LAEI 2013Greater London - Annual Mean PM10 concentrations 2013
m Limit
LegendPM2.5 (µg/m3)
< 12
12 - 13
13 - 15
15 - 17
17 - 19
19 - 21
21 - 23
23 - 25
25 - 27
27 - 33
> 33
´
0 105
Kilometres
post LAEI 2013Greater London - Annual Mean PM2.5 concentrations 2013
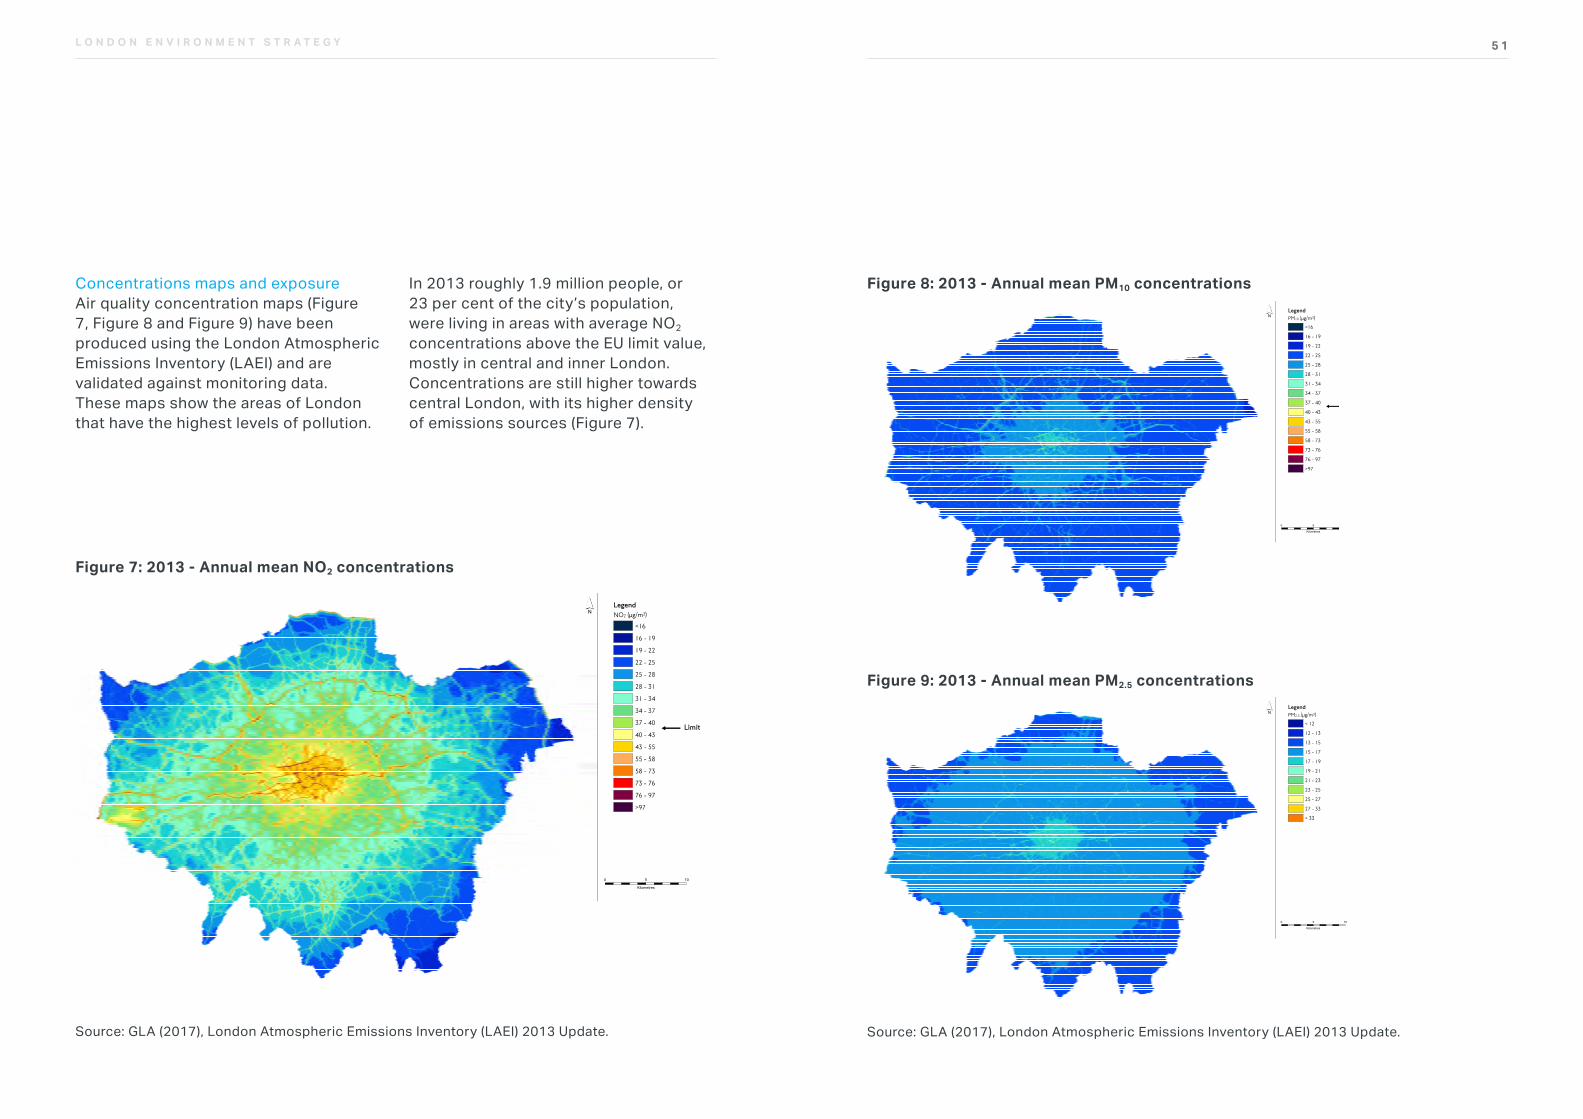
Concentrations maps and exposureAir quality concentration maps (Figure 7, Figure 8 and Figure 9) have been produced using the London Atmospheric Emissions Inventory (LAEI) and are validated against monitoring data. These maps show the areas of London that have the highest levels of pollution.
In 2013 roughly 1.9 million people, or 23 per cent of the city’s population, were living in areas with average NO2 concentrations above the EU limit value, mostly in central and inner London. Concentrations are still higher towards central London, with its higher density of emissions sources (Figure 7).
5 3L O N D O N E N V I R O N M E N T S T R A T E G Y
Transboundary pollutionThe challenge of cleaning London’s air is made more difficult because a large amount of the pollution sources are not within London. The most recent analysis shows that sources outside London make the largest contribution to the estimated death risk from long-term exposure to PM2.5 in London as a whole. This is also responsible for the majority of health effects associated with short-term exposure.
For example, 75 per cent of the cardiovascular hospital admissions associated with PM2.5 result from pollution sources outside London, including industrial, agricultural and transport emissions from other countries. In addition, external sources are responsible for just under half of the mortality risk associated with NO2.5
Even if all local emissions sources were removed, over half the health effects linked to London’s air pollution would be felt. This is why, even as the UK leaves the EU, working closely with European partners is vital to reduce emissions across the continent.
The EU National Emissions Ceiling Directive must incorporate tighter emission limits for countries across Europe to address transboundary pollution on a quicker timescale. It is also why international action coordinated by the United Nations, including the Convention on Long-range Transboundary Air Pollution and its associated protocols, is needed to improve air quality in London.
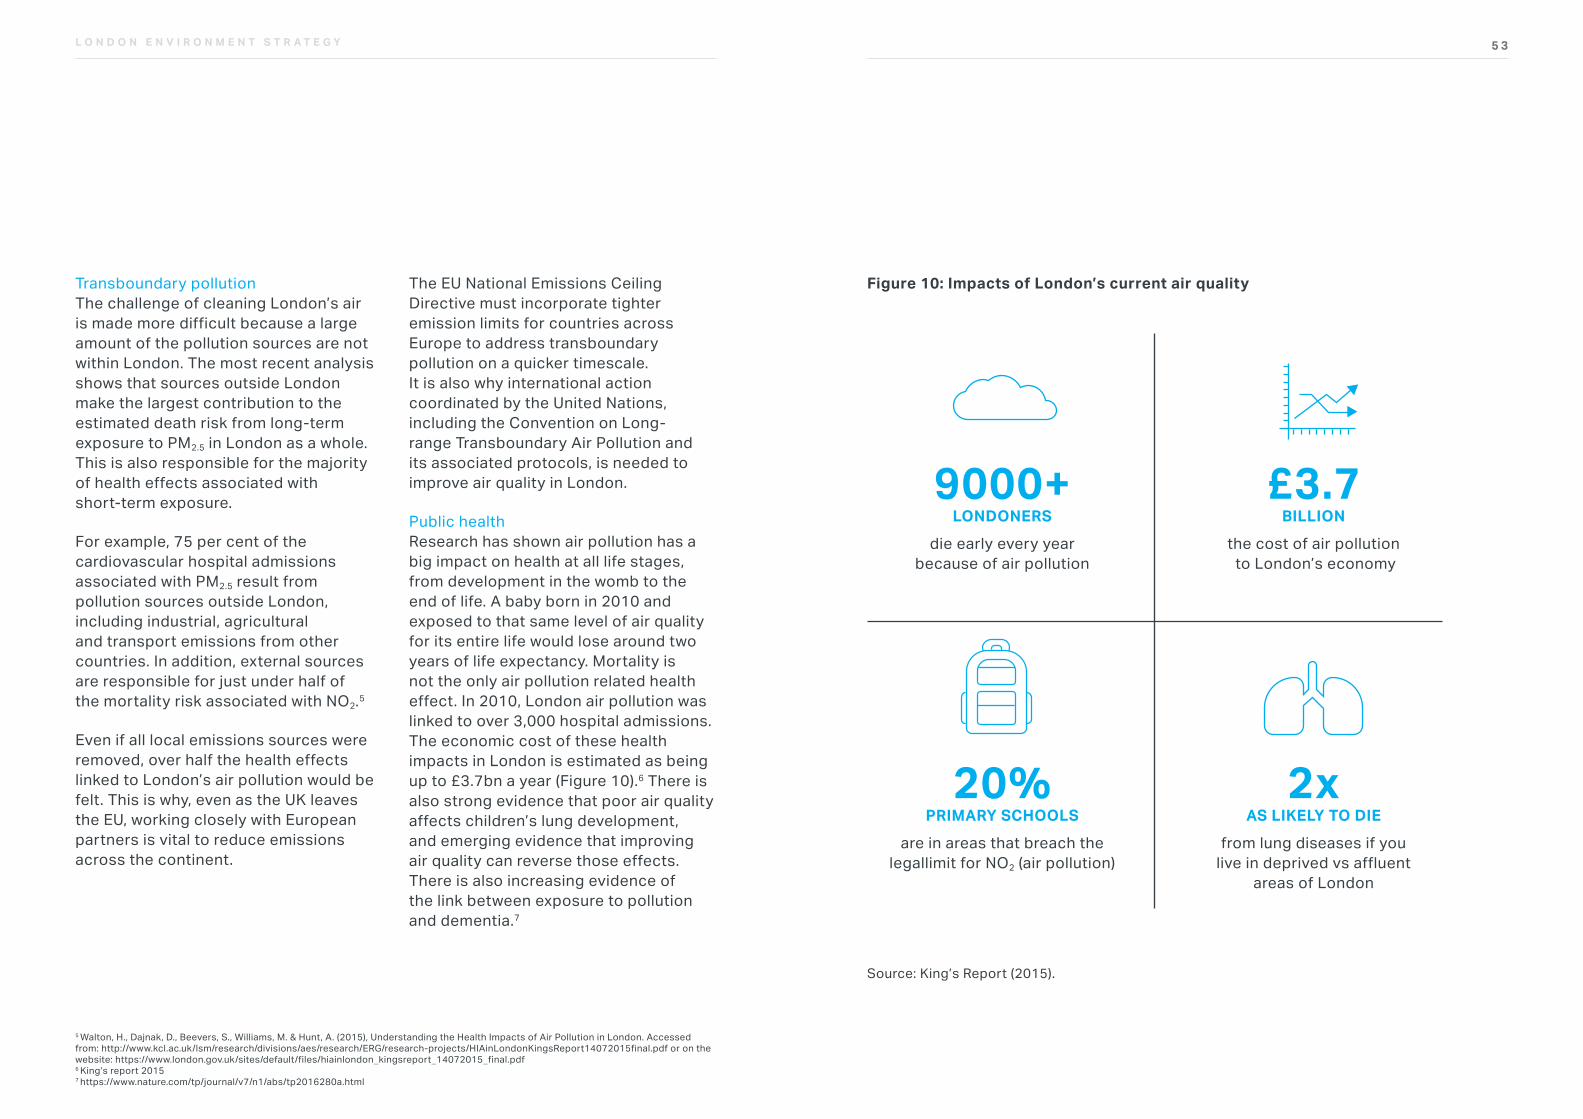
Public health Research has shown air pollution has a big impact on health at all life stages, from development in the womb to the end of life. A baby born in 2010 and exposed to that same level of air quality for its entire life would lose around two years of life expectancy. Mortality is not the only air pollution related health effect. In 2010, London air pollution was linked to over 3,000 hospital admissions. The economic cost of these health impacts in London is estimated as being up to £3.7bn a year (Figure 10).6 There is also strong evidence that poor air quality affects children’s lung development, and emerging evidence that improving air quality can reverse those effects. There is also increasing evidence of the link between exposure to pollution and dementia.7
5 Walton, H., Dajnak, D., Beevers, S., Williams, M. & Hunt, A. (2015), Understanding the Health Impacts of Air Pollution in London. Accessed from: http://www.kcl.ac.uk/lsm/research/divisions/aes/research/ERG/research-projects/HIAinLondonKingsReport14072015final.pdf or on the website: https://www.london.gov.uk/sites/default/files/hiainlondon_kingsreport_14072015_final.pdf6 King’s report 20157 https://www.nature.com/tp/journal/v7/n1/abs/tp2016280a.html
Figure 10: Impacts of London’s current air quality
Source: King’s Report (2015).
9000+ LONDONERS
die early every year because of air pollution
20% PRIMARY SCHOOLS
are in areas that breach the legal limit for NO2 (air pollution)
£3.7 BILLION
the cost of air pollution to London’s economy
2x AS LIKELY TO DIE
from lung diseases if you live in deprived vs affluent
areas of London
5 5L O N D O N E N V I R O N M E N T S T R A T E G Y
Social inequalityThese health impacts fall disproportionally on the most vulnerable communities, affecting the poorest, the youngest, the oldest, those with pre-existing health conditions and those from minority ethnic groups the most. Perhaps most worryingly, over 438 schools and 364 other educational institutions in London are located in areas exceeding safe legal pollution levels. People living in the most deprived areas are, on average, more likely to be exposed to poor air quality than those in less deprived areas.8
Tackling air pollution is not, therefore, just about the environment or about protecting public health. It is also about social justice. There is an urgent need to do more to tackle the public health inequalities associated with air pollution in London.
Climate changeImproving air quality also offers an opportunity to address climate change. In the past, policy makers have mainly focused on reducing carbon dioxide (CO2) emissions. This has resulted in unintended consequences, like encouraging the use of diesel, and promoting biomass boilers and combined heat and power systems installation in areas of poor air quality.
In this strategy, the Mayor seeks to design integrated policies that offer multiple benefits.
One example of this is that black carbon has a higher global warming potential than CO2. It is however possible to deliver quick wins to improve both air quality and prevent climate change. This can be done by adopting tighter PM2.5 limits, promoting a switch to zero emission vehicles, replacing old, inefficient boilers, increasing energy efficiency of buildings, and creating a zero carbon city where energy mainly comes from renewable sources.
A review of the previous strategy, baseline and other evidence highlights several key issues to be addressed in the strategy.
Achieving legal compliance as quickly as possibleThe last strategy did not reach the expected emission reductions. In part, this was due to the underperformance of Euro engine emissions standards. Targets in this strategy will need to reflect the latest evidence on vehicle emissions performance. It must set out appropriate steps by all levels of government to ensure a roadmap to compliance as quickly as possible.
8 King, K. & Healy, S. (2013), Analysing Air Pollution Exposure in London. Accessed from: https://www.london.gov.uk/sites/default/files/analysing_air_pollution_exposure_in_london_-_technical_report_-_2013.pdf (51 per cent of Lower Layer Super Output Areas (LSOAs) within the most deprived 10 per cent of London have concentrations above the NO2 EU limit value. This contrasts with 1 per cent above the NO2 EU limit value in the 10 per cent least deprived areas.)
Diesel vehicles, especially cars and vansThese remain the main source of road transport pollution. A comprehensive approach is required to phase out their use. Rather than a return to petrol, mode shift to sustainable forms of transport like walking and cycling wherever possible should be encouraged. Any vehicles that remain will need to transition to zero emission technology.
Tackling all sources of pollutionTo achieve legal compliance as quickly as possible, all sources of pollution must be addressed. That means significantly increasing efforts in relation to non-transport sources. This is vital as the proportion of total emissions from non-transport sources is expected to increase over the lifetime of this strategy as our efforts on transport start to have an effect.
Government actionThe government controls some of the most powerful policy levers to influence air quality, including fiscal incentives such as vehicle excise duty. It alone can legislate to provide new powers to tackle non-transport emission sources. Achieving legal compliance is dependent on further government action and leadership.
Maximising co-benefits between air quality and climate change policiesThere is a risk that unintended consequences can arise if climate and air quality policies are developed in isolation, for example, in relation to energy and planning policy. Conversely, integrated policy design can bring benefits for both air quality and climate change, for example, by reducing black carbon emissions by switching to zero emission vehicles.
Further reductions are needed in PM10 and PM2.5, particularly from transboundary pollution, tyre and brake wear and wood burningProgress in dealing with PM emissions will stall in 2020 once exhaust emissions are significantly reduced. London is currently far from achieving WHO health-based limits for PM2.5. One of the best ways to do this would be to reduce the number of vehicle kilometres by supporting a mode shift to walking, cycling and public transport. It will also be necessary to address wood burning-related emissions, which evidence suggests are a significant source of emissions, particularly on some of the most polluted days.

5 7L O N D O N E N V I R O N M E N T S T R A T E G Y
ROLES AND LEGAL DUTIES
The MayorThe Mayor has a legal duty to set out policies and proposals in this strategy to achieve compliance with the legally required air quality standards as quickly as possible.
The Mayor will act to improve air quality, where the Mayor or bodies within the control of the Mayor have relevant powers or resources. However, the Mayor does not have all the powers needed to improve London’s air quality alone. This strategy sets out the responsibilities of all the organisations with a role to play in improving London’s air quality, including the government, London boroughs and the Environment Agency.
The Mayor will help the boroughs in exercising their statutory duties to improve air quality. Where needed, the Mayor can use powers of direction to require boroughs to take steps to meet air quality objectives. These reserve powers can only be used following consultation. To support the boroughs
the Mayor will operate the reformed London Local Air Quality Management (LLAQM) framework, which sets out clearly the action boroughs should be taking (Box 2).
The governmentThe ultimate responsibility for achieving compliance with the legally required air quality standards “as quickly as possible” lies with the government. The government is required to have an Air Quality Plan that will achieve this.
The government has unique tools available to it, such as control over fiscal incentives or the ability to legislate, which can accelerate compliance. Without a clear national plan to tackle emissions, especially from vehicles, the air in UK cities will not improve.
The government needs to give local authorities across the country extra powers to address non-transport pollution sources, to help scrap older polluting vehicles, and use fiscal and other incentives to encourage use of clean vehicles.
5 9L O N D O N E N V I R O N M E N T S T R A T E G Y
The London boroughs and public sectorLondon’s boroughs have a duty to work towards achieving legal limits. They have an important role to play in addressing local pollution which is underpinned by the statutory LLAQM framework (Box 2). There are a number of levers they can use to help. These include:
• emissions-based parking charges
• reducing pollution from new developments through planning (especially those not referred to the Mayor),
• improving the public realm for walking and cycling
• targeted measures at pollution hotspots such as vehicle restrictions and green infrastructure
• supporting installation of infrastructure to fuel zero emission vehicles
The statutory powers of the London boroughs are also important to continue to discourage antisocial burning of waste and the illegal use of wood-burning stoves. Finally, the boroughs have extensive public health duties and can play an important role in mainstreaming air quality into health-related activities.
The public sector has a wider duty to lead by example to reduce emissions and exposure to pollution, particularly in relation to its vehicle fleets, as well as to raise awareness.
Local Air Quality Management (LAQM) is the statutory process by which a local authority is required to review the air quality within its area. This system aims to determine if air quality objectives set within the Air Quality Regulations 2000 and the Air Quality (Amendment) Regulations 2010 are likely to be met in a certain area. It also drives improvements to achieve those objectives. The London system used to be part of a national framework managed by Defra. However, in May 2016 the Mayor launched a bespoke system for the capital - London Local Air Quality Management (LLAQM).
This scheme was designed to encourage close working to help address this vital issue. This renewed focus on LAQM in London should help ensure that local authority air quality resources are protected, or where possible increased.
The basic statutory framework for local air quality management is via national Air Quality Regulations and Part IV of the Environment Act 1995. This remains in place and applies to
London’s 32 boroughs and the City of London. However, it was agreed with Defra that the relevant LAQM guidance for London should differ from the rest of the UK in recognition of the particular challenges the capital faces. London now has its own bespoke statutory policy and technical documents.
The key LLAQM requirements for boroughs are:
• to continue to monitor and assess air pollution in their areas
• to ensure an Air Quality Management Area (AQMA) is declared and in place for any locations that are exceeding air quality objectives and EU Limit Values
• to ensure that a current and relevant Air Quality Action Plan is in place for all AQMAs. The Action Plan should be updated every five years at a minimum, and progress against this should be reported annually
• to complete the annual monitoring and Action Plan update reports
BOX 2: THE LONDON LOCAL AIR QUALIT Y MANAGEMENT FR AME WORK (LL AQM)
6 1L O N D O N E N V I R O N M E N T S T R A T E G Y
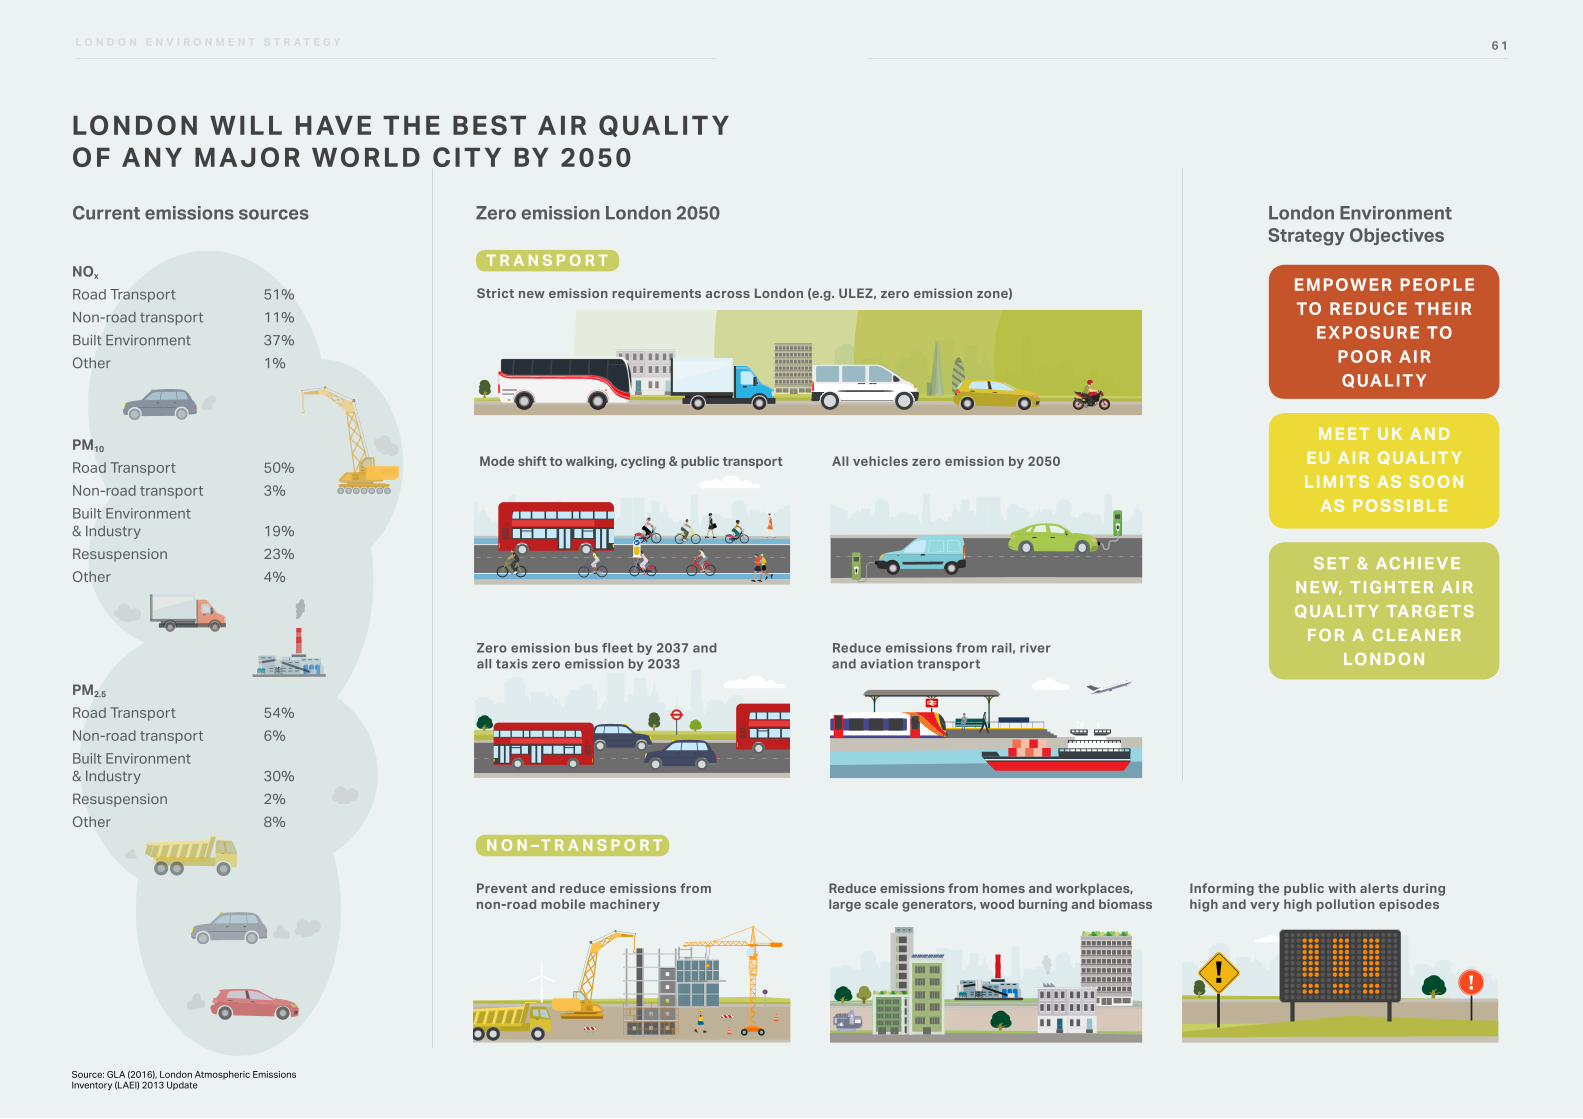
LONDON WILL HAVE THE BEST AIR QUALIT Y OF ANY MAJOR WORLD CIT Y BY 2050
Mode shift to walking, cycling & public transport
Zero emission bus fleet by 2037 and all taxis zero emission by 2033
All vehicles zero emission by 2050
Prevent and reduce emissions from non-road mobile machinery
PM10
Road Transport 50%Non-road transport 3%Built Environment & Industry 19%Resuspension 23%Other 4%
NOx Road Transport 51%Non-road transport 11%Built Environment 37%Other 1%
PM2.5
Road Transport 54%Non-road transport 6%Built Environment & Industry 30%Resuspension 2%Other 8%
Current emissions sources Zero emission London 2050
T R A N S P O R T
N O N –T R A N S P O R T
Source: GLA (2016), London Atmospheric Emissions Inventory (LAEI) 2013 Update
6 1L O N D O N E N V I R O N M E N T S T R A T E G Y
Reduce emissions from rail, river and aviation transport
Informing the public with alerts during high and very high pollution episodes
Reduce emissions from homes and workplaces, large scale generators, wood burning and biomass
EMPOWER PEOPLE TO REDUCE THEIR
E XPOSURE TO POOR AIR QUALIT Y
MEET UK AND EU AIR QUALIT Y LIMITS AS SOON
AS POSSIBLE
SET & ACHIE VE NE W, TIGHTER AIR QUALIT Y TARGETS
FOR A CLE ANER LONDON
London Environment Strategy Objectives
Strict new emission requirements across London (e.g. ULEZ, zero emission zone)
6 3L O N D O N E N V I R O N M E N T S T R A T E G Y
OBJECTIVE 4.1 SUPPORT LONDON AND ITS COMMUNITIES, PARTICULARLY THE MOST VULNERABLE AND THOSE IN PRIORITY LOCATIONS, TO HELP EMPOWER PEOPLE TO REDUCE THEIR EXPOSURE TO POOR AIR QUALITY
Protecting public health is at the heart of the Mayor’s efforts to improve air quality. It requires reducing exposure, including by raising awareness of the impacts of pollution and when air quality is particularly poor. The Mayor’s long-term aim is to ensure concentrations are reduced to levels that are both safe and compliant. However, it is recognised that until further measures like the ULEZ are put in place there will remain times where pollution can be very poor due to historic policy failure and inaction that have contributed to the scale of the problem.
The Mayor wants to ensure that Londoners have access to the right information and, if appropriate, emergency action is taken to minimise public exposure. This objective also seeks to address the health inequality caused by the unequal exposure to pollution by different groups.
Objectives, policies and proposals
“ Protecting public health is at the heart of the Mayor’s efforts to improve air quality.”
L O N D O N E N V I R O N M E N T S T R A T E G Y
Policy 4.1.1 Make sure that London and its communities, particularly the most vulnerable and those in priority locations, are empowered to reduce their exposure to poor air quality
Proposal 4.1.1a The Mayor will provide better information about air quality, especially during high and very high pollution episodes, and use emergency measures where appropriate
Human health is affected by poor air quality. This is particularly true for vulnerable people like children, older people and those with pre-existing health conditions.
Timely air pollution information gives vulnerable people a chance to act to protect themselves, for example by reducing their exposure, or simply by carrying their medication. Schools, hospitals, GP surgeries, and care homes are places where those most vulnerable to the health impacts of air pollution episodes spend time and
visit. The current air quality information system will be improved so that it targets these organisations and provides tailored advice. This will ensure that decision-makers have information on current pollution levels and upcoming episodes, as well as evidence-based advice on how to respond.
London-wide episodes of high pollution happen a few times each year. Very high pollution episodes are even more rare – occurring only every few years. On such occasions, it is important that Londoners are kept fully informed and can respond accordingly to minimise health impacts. The Mayor will continue to provide real time alerts during high or very high air pollution episodes by broadcasting information on bus shelters, Tube stations and on roadside signs. There will be a particular focus on reducing unnecessary private car use and other activities that contribute to pollution (Figure 11).
Figure 11: Air pollution forecast announcement
6 5L O N D O N E N V I R O N M E N T S T R A T E G Y
The Mayor will work with government to ensure that London has the powers needed to implement emergency measures such as short-term road closures or vehicle restrictions, where appropriate, during high pollution episodes.
Proposal 4.1.1b The Mayor will aim to do more to protect London’s schoolchildren by reducing their exposure to poor air quality at school and on their journey to and from school
Reducing the exposure of schoolchildren to pollution is a priority because younger children are among the most vulnerable to its health impacts. Eight and nine-year-olds living in cities with high levels of fumes from diesel cars have up to ten per cent less lung capacity than normal.9 More must be done to reduce exposure at schools wherever possible, and also at colleges, universities, and other educational establishments.
The Mayor will actively encourage London boroughs to use the funding available to them through TfL for Local Implementation Plans to improve air quality and reduce exposure, especially around schools and on journeys to and from school. To support this, City Hall will implement a schools audit programme to identify steps London boroughs can take to reduce exposure.
Proposal 4.1.1c Through the London Plan the Mayor will consider policies that mean new developments are suitable for use and for their particular location, taking into account local air quality
Through the new London Plan, the Mayor will consider policies that seek to reduce exposure to existing poor air quality through design or mitigation strategies. These are vital where new development will be used by large numbers of people who are particularly vulnerable to poor air quality, like children or older people.
In addition, a requirement to consider the overall suitability of a site (and its design layout) for the proposed end use in terms of exposure to pollution will be considered in the new London Plan.
Policy 4.1.2 Improve the understanding of air quality health impacts to better target policies and action
Proposal 4.1.2a The Mayor will produce and maintain the London Atmospheric Emissions Inventory (LAEI) to better understand pollution sources in London
To tackle air pollution effectively, it is necessary to understand its sources. The Mayor will produce and maintain the LAEI. This will help us understand the key emissions sources and how they contribute to poor air quality, both now and projected into the future. It will be used to calculate health impacts, exposure and health inequalities.
9 https://www.kcl.ac.uk/lsm/research/divisions/aes/research/ERG/research-projects/EXHALE.aspx
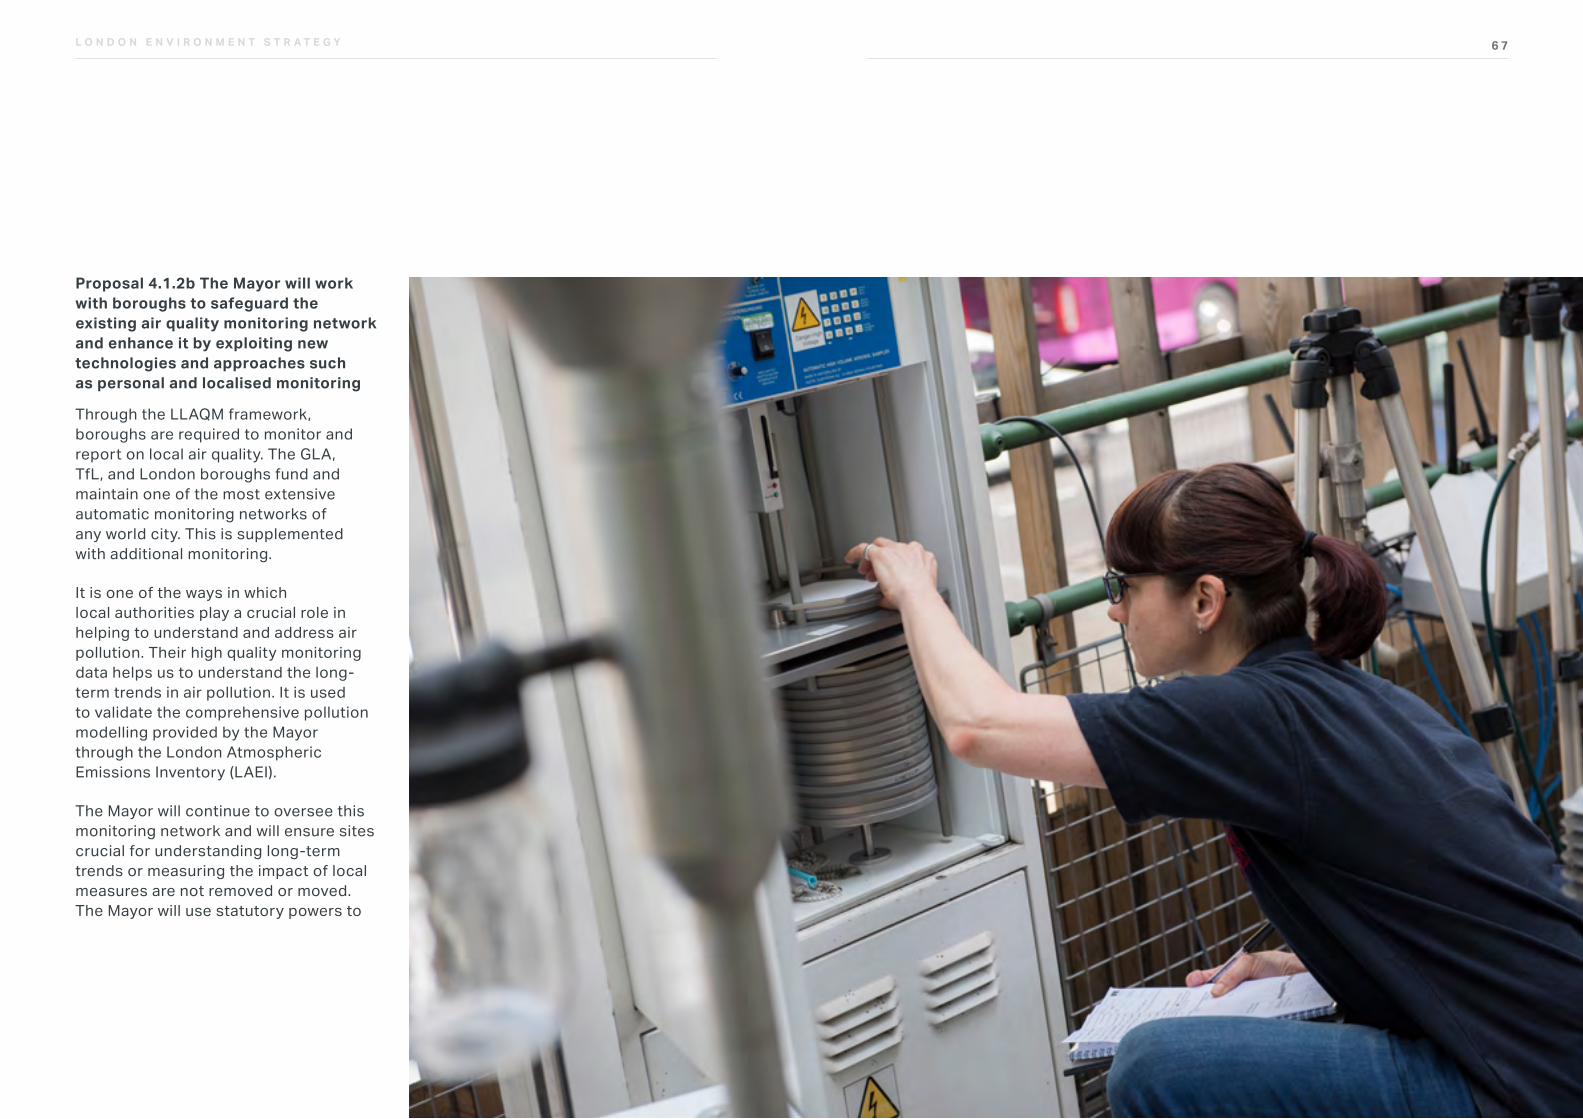
6 7L O N D O N E N V I R O N M E N T S T R A T E G Y
Proposal 4.1.2b The Mayor will work with boroughs to safeguard the existing air quality monitoring network and enhance it by exploiting new technologies and approaches such as personal and localised monitoring
Through the LLAQM framework, boroughs are required to monitor and report on local air quality. The GLA, TfL, and London boroughs fund and maintain one of the most extensive automatic monitoring networks of any world city. This is supplemented with additional monitoring.
It is one of the ways in which local authorities play a crucial role in helping to understand and address air pollution. Their high quality monitoring data helps us to understand the long-term trends in air pollution. It is used to validate the comprehensive pollution modelling provided by the Mayor through the London Atmospheric Emissions Inventory (LAEI).
The Mayor will continue to oversee this monitoring network and will ensure sites crucial for understanding long-term trends or measuring the impact of local measures are not removed or moved. The Mayor will use statutory powers to
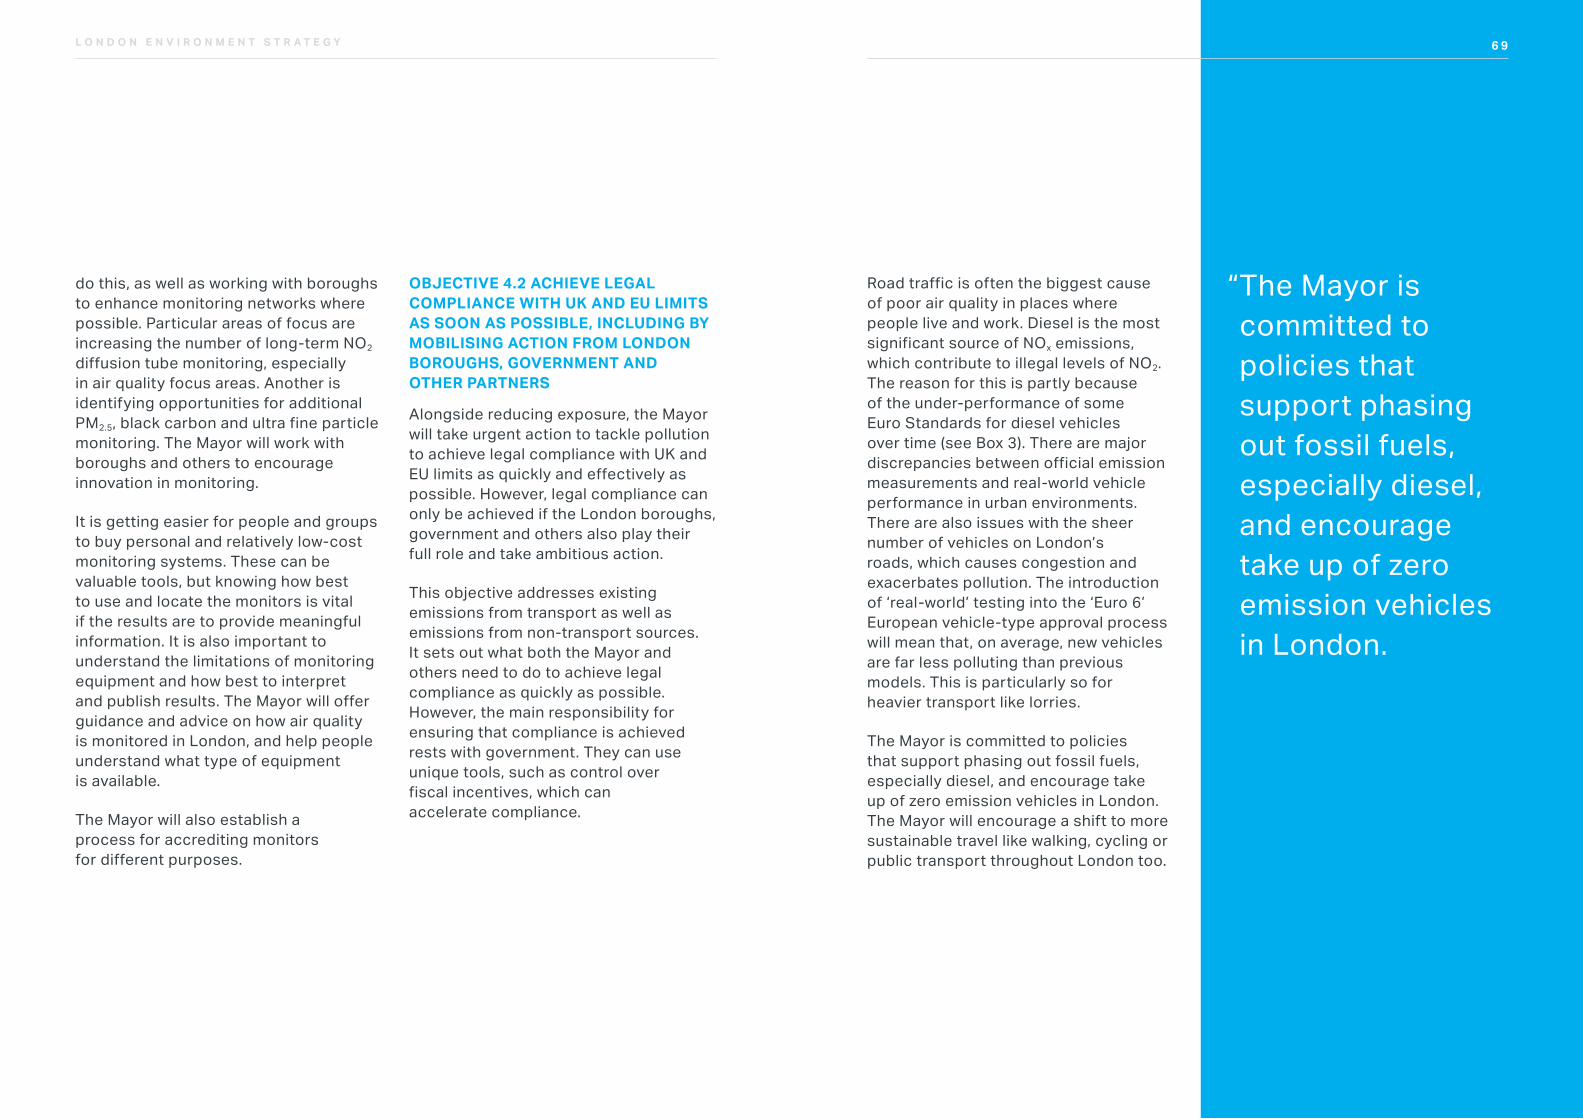
6 9L O N D O N E N V I R O N M E N T S T R A T E G Y
do this, as well as working with boroughs to enhance monitoring networks where possible. Particular areas of focus are increasing the number of long-term NO2 diffusion tube monitoring, especially in air quality focus areas. Another is identifying opportunities for additional PM2.5, black carbon and ultra fine particle monitoring. The Mayor will work with boroughs and others to encourage innovation in monitoring.
It is getting easier for people and groups to buy personal and relatively low-cost monitoring systems. These can be valuable tools, but knowing how best to use and locate the monitors is vital if the results are to provide meaningful information. It is also important to understand the limitations of monitoring equipment and how best to interpret and publish results. The Mayor will offer guidance and advice on how air quality is monitored in London, and help people understand what type of equipment is available.
The Mayor will also establish a process for accrediting monitors for different purposes.
OBJECTIVE 4.2 ACHIEVE LEGAL COMPLIANCE WITH UK AND EU LIMITS AS SOON AS POSSIBLE, INCLUDING BY MOBILISING ACTION FROM LONDON BOROUGHS, GOVERNMENT AND OTHER PARTNERS
Alongside reducing exposure, the Mayor will take urgent action to tackle pollution to achieve legal compliance with UK and EU limits as quickly and effectively as possible. However, legal compliance can only be achieved if the London boroughs, government and others also play their full role and take ambitious action.
This objective addresses existing emissions from transport as well as emissions from non-transport sources. It sets out what both the Mayor and others need to do to achieve legal compliance as quickly as possible. However, the main responsibility for ensuring that compliance is achieved rests with government. They can use unique tools, such as control over fiscal incentives, which can accelerate compliance.
Road traffic is often the biggest cause of poor air quality in places where people live and work. Diesel is the most significant source of NOx emissions, which contribute to illegal levels of NO2. The reason for this is partly because of the under-performance of some Euro Standards for diesel vehicles over time (see Box 3). There are major discrepancies between official emission measurements and real-world vehicle performance in urban environments. There are also issues with the sheer number of vehicles on London’s roads, which causes congestion and exacerbates pollution. The introduction of ‘real-world’ testing into the ‘Euro 6’ European vehicle-type approval process will mean that, on average, new vehicles are far less polluting than previous models. This is particularly so for heavier transport like lorries.
The Mayor is committed to policies that support phasing out fossil fuels, especially diesel, and encourage take up of zero emission vehicles in London. The Mayor will encourage a shift to more sustainable travel like walking, cycling or public transport throughout London too.
“ The Mayor is committed to policies that support phasing out fossil fuels, especially diesel, and encourage take up of zero emission vehicles in London.
6 9
7 1L O N D O N E N V I R O N M E N T S T R A T E G Y
This also contributes to the Mayor’s wider ambitions including:
• all taxis and private hire vehicles to be zero emission capable by 2033
• all TfL buses to be zero emission by 2037
• all newly registered road vehicles driven in London to be zero emission by 2040
• London’s entire transport system to be zero emission by 2050
These efforts are supported by the wider policy framework in the draft Mayor’s Transport Strategy which promotes further mode shift, tackles congestion and encourages freight consolidation. This section should be read alongside the draft Mayor’s Transport Strategy.
The section also looks at non-road transport sources, including construction, buildings, the river and aviation, before setting out the action that needs to be taken by others – especially government – to achieve full compliance as quickly as possible.
BOX 3: WHY PRIORITISE THE PHASING OUT OF DIESEL VEHICLES ?
Diesel vehicles are the single biggest cause of NOx emissions. Any strategy to improve air quality must consider how to address these.
Rapid dieselisation of the fleet was caused by previous government policy which incentivised low CO2 emitting vehicles through the vehicle excise duty and company car tax regimes. These powerful levers encouraged manufacturers to invest in the development of diesel technology – an attractive solution for consumers, which has historically delivered better fuel economy and improved durability when compared to petrol.
However, it is widely acknowledged that the real world emissions performance of diesel vehicles did not match that achieved in laboratory tests. This problem is in part a failure in the legislation to make the type-approval emissions test rigorous enough and a poor response by regulators who were aware of the issue for some time.
This has also been compounded by the revelations that at least one manufacturer has deliberately
used test beating software on their diesel vehicles, whilst others may be taking steps to ‘bend the rules’.
A landmark study by the International Council for Clean Transportation demonstrated that technologies exist to reduce emissions from vehicles but they are not being employed consistently by manufacturers. Although EU legislation lowered NOx permitted emissions for diesel cars by 85 per cent between 2000 (Euro 3) and 2014 (Euro 6), average on-road emission levels only decreased about 40 per cent over the same period.
In general, diesel vehicles emit more NOx than petrol equivalents and the capital still has a legacy fleet of older diesel vehicles capable of emitting high levels of PM emissions (prior to the EU mandating diesel particulate filters from 2011). It is therefore unsurprising that diesel cars are currently the highest contributor to road transport NOx and PM2.5 emissions in London.
The latest emissions standard for heavy duty engines (Euro VI), which includes on-highway verification, has started to alleviate these shortcomings. For example, TfL has seen a 90 per cent reduction in NOx emissions between Euro V and Euro VI buses.
Unfortunately, similar on-road verification introduced for cars and vans, known as ‘real driving emissions’ is yet to be seen. The introduction of real driving emissions has potential to create parity between petrol and diesel vehicles. However, it has been plagued by delays and for many this is seen as too little too late, with legislation not taking full effect until 2021. Even then, overly generous conformity factors have been introduced to allow for error margins.
This means some of the newest trucks on the road are expected to have emissions of NOx and PM better than some family cars. The introduction of independent testing, such as the Mayor’s Cleaner Vehicle Checker, will help to alleviate this issue by creating transparency and improving consumer confidence.
In all, the Mayor strongly believes that government must deliver effective national incentives exclusively under their control (such as taxation and scrappage) to discourage diesel while these vehicles remain more polluting. Longer-term, the Mayor is committed to policies that support phasing out all fossil fuels and accelerating the uptake of zero emission vehicles in London to deliver further improvements in air quality.
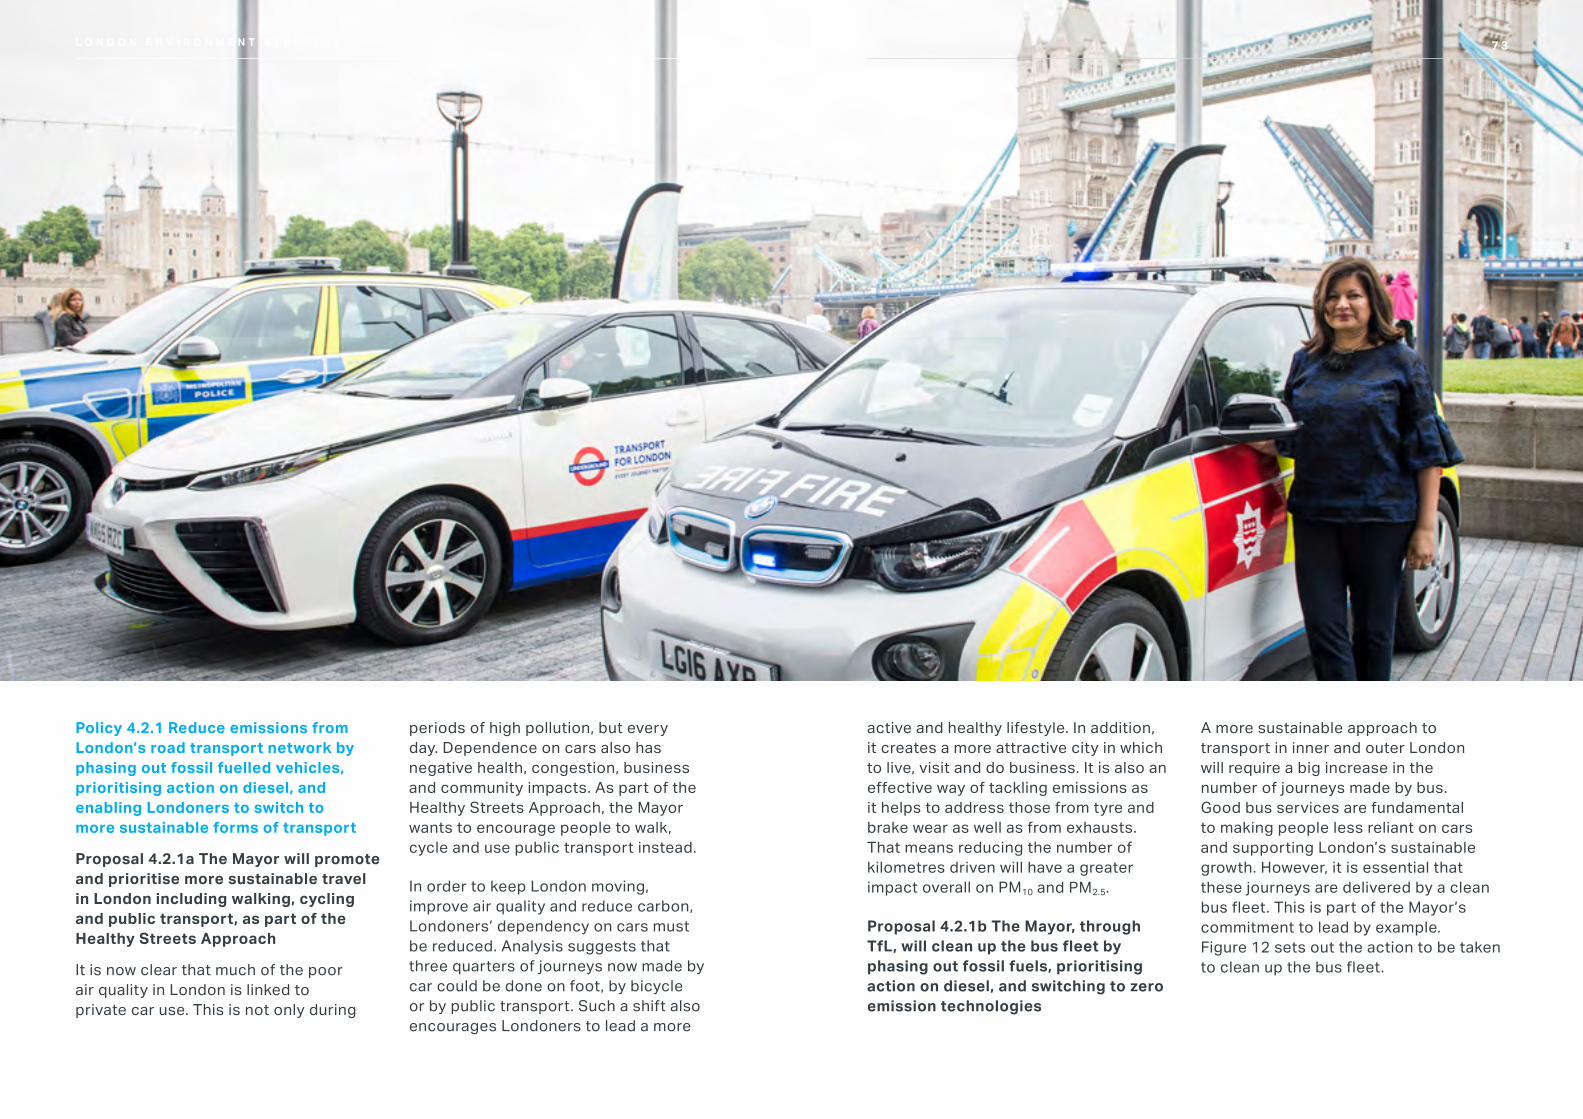
7 3L O N D O N E N V I R O N M E N T S T R A T E G Y
Policy 4.2.1 Reduce emissions from London’s road transport network by phasing out fossil fuelled vehicles, prioritising action on diesel, and enabling Londoners to switch to more sustainable forms of transport
Proposal 4.2.1a The Mayor will promote and prioritise more sustainable travel in London including walking, cycling and public transport, as part of the Healthy Streets Approach
It is now clear that much of the poor air quality in London is linked to private car use. This is not only during
periods of high pollution, but every day. Dependence on cars also has negative health, congestion, business and community impacts. As part of the Healthy Streets Approach, the Mayor wants to encourage people to walk, cycle and use public transport instead.
In order to keep London moving, improve air quality and reduce carbon, Londoners’ dependency on cars must be reduced. Analysis suggests that three quarters of journeys now made by car could be done on foot, by bicycle or by public transport. Such a shift also encourages Londoners to lead a more
7 3L O N D O N E N V I R O N M E N T S T R A T E G Y
A more sustainable approach to transport in inner and outer London will require a big increase in the number of journeys made by bus. Good bus services are fundamental to making people less reliant on cars and supporting London’s sustainable growth. However, it is essential that these journeys are delivered by a clean bus fleet. This is part of the Mayor’s commitment to lead by example. Figure 12 sets out the action to be taken to clean up the bus fleet.
active and healthy lifestyle. In addition, it creates a more attractive city in which to live, visit and do business. It is also an effective way of tackling emissions as it helps to address those from tyre and brake wear as well as from exhausts. That means reducing the number of kilometres driven will have a greater impact overall on PM10 and PM2.5.
Proposal 4.2.1b The Mayor, through TfL, will clean up the bus fleet by phasing out fossil fuels, prioritising action on diesel, and switching to zero emission technologies
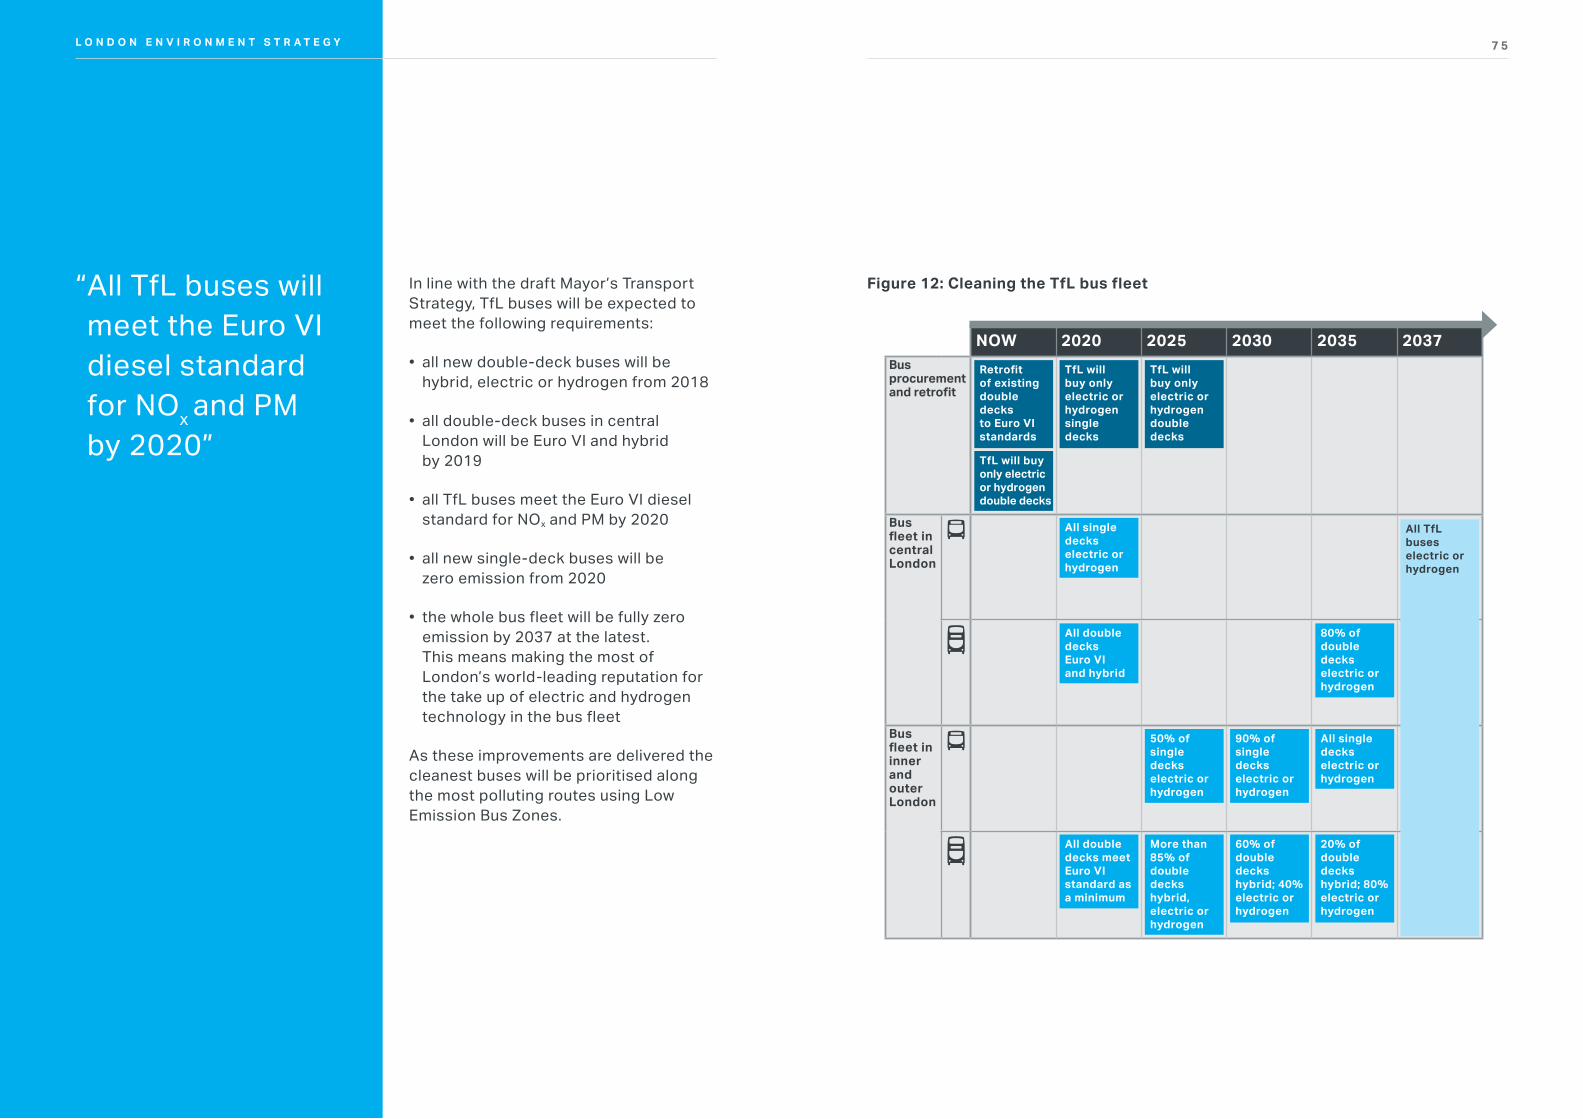
7 5L O N D O N E N V I R O N M E N T S T R A T E G Y
In line with the draft Mayor’s Transport Strategy, TfL buses will be expected to meet the following requirements:
• all new double-deck buses will be hybrid, electric or hydrogen from 2018
• all double-deck buses in central London will be Euro VI and hybrid by 2019
• all TfL buses meet the Euro VI diesel standard for NOx and PM by 2020
• all new single-deck buses will be zero emission from 2020
• the whole bus fleet will be fully zero emission by 2037 at the latest. This means making the most of London’s world-leading reputation for the take up of electric and hydrogen technology in the bus fleet
As these improvements are delivered the cleanest buses will be prioritised along the most polluting routes using Low Emission Bus Zones.
“ Fectorbi factodis. Apestra vocul vivil ventid se etrest atus tem, ponsuli ntique reis nem me ad C. Decupio ratuam potio, sentiur bitati sturniu qui sum postia nuncepoenam.”
Eexeris molores recto optas Et eic to bercia cuptas a aut
“ All TfL buses will meet the Euro VI diesel standard for NOx and PM by 2020”
L O N D O N E N V I R O N M E N T S T R A T E G Y
Figure 12: Cleaning the TfL bus fleet
NOW 2020 2025 2030 2035 2037Bus procurement
Retrofit of existing double decks to Euro VI standards
TfL will buy only electricor hydrogendouble decks
TfL will buy only electric or hydrogen single decks
TfL will buy only electric or hydrogen double decks
Bus fleet in central London
All single decks electric or hydrogen
All double decks Euro VI and hybrid
80% of double decks electric or hydrogen
Bus fleet in inner and outer London
50% of single decks electric or hydrogen
90% of single decks electric or hydrogen
All single decks electric or hydrogen
All double decks meet Euro VI standard as a minimum
More than 85% of double decks hybrid, electric or hydrogen
60% of double decks hybrid; 40% electric or hydrogen
20% of double decks hybrid; 80% electric or hydrogen
All TfL buses electric or hydrogen
7 7L O N D O N E N V I R O N M E N T S T R A T E G Y
Proposal 4.2.1c The Mayor, through TfL, will reduce emissions in the taxi and private hire fleet by phasing out fossil fuels, prioritising action on diesel, and switching to zero emission technologies
For too long, the taxi trade has been restricted to diesel vehicles. The Mayor wants the capital’s taxi fleet to be the greenest in the world. To phase out diesel, all newly licensed taxis will be required to be zero emission capable from 2018.
The recent sharp increase in private hire vehicles means they must take a lead and accelerate the uptake of Ultra Low Emission Vehicles (ULEVs). However, policies affecting the taxi and private hire vehicles industries must take into consideration the costs and operating models of each industry. The Mayor will encourage and quicken the take up of zero emission capable taxis by working with the trade to create an action plan. The Mayor will provide a mixture of financial incentives, infrastructure and regulation (including maintaining a taxi age limit, currently set at 15 years). The aim is to achieve a minimum of 9,000 such vehicles in the fleet by 2020.
The Mayor will also require all new private hire vehicles to meet continually improving minimum emission standards as set out in the draft Mayor’s Transport Strategy. When combined, this will achieve an entirely zero emission capable taxi and private-hire fleet by 2033 at the latest.
Proposal 4.2.1d The Mayor aims to reduce emissions from private and commercial vehicles by phasing out and restricting the use of fossil fuels, prioritising action on diesel
The Mayor will further accelerate the uptake of cleaner vehicles in London by bringing forward and expanding the ULEZ.
The Mayor alone does not have the legal power to ban diesel vehicles (or any other vehicles) across London. The Mayor can, however, apply charges to vehicles on a number of grounds, including addressing congestion and emissions. Charging has been shown to be very effective at influencing behaviour. This includes promoting a shift to more sustainable modes of travel via the Congestion Charge and reducing the number of polluting vehicles in London via the Low Emission Zone.
The Mayor, through TfL, will keep under review existing and planned road user charging schemes, including the Congestion Charge, Low Emission Zone, ULEZ and the Silvertown Tunnel schemes, to ensure they prove effective in furthering or delivering the policies and proposals of the draft Mayor’s Transport Strategy.
The Mayor will also consider the development of the next generation of road user charging systems. These could replace schemes such as the Congestion Charge, Low Emission Zone and ULEZ. More sophisticated road user charging and/or workplace parking levy schemes could be used to contribute to achieving the policies and proposals in the draft Mayor’s Transport Strategy, including mode share, road danger reduction, environmental objectives, reducing congestion on the road network, and supporting efficient traffic movement. In doing so, the Mayor will consider the appropriate technology for any future schemes, and the potential for a future scheme that reflects distance, time, emissions, road danger and other factors in an integrated way.
Road user charging schemes will include (subject to the development of detailed proposals and consultation) introducing the central London ULEZ standards and charges in 2019. There will also be an Emissions Surcharge on the Congestion Charge from October 2017 until the introduction of the ULEZ.10
The Mayor proposes (subject to the development of detailed proposals and consultation) that the ULEZ is expanded to Inner London by 2021 for light vehicles (cars, vans, minibuses and motorbikes), covering an area up to the North / South Circular. It is also proposed that by 2020 the ULEZ is expanded London-wide for heavy vehicles, which will result in only an estimated one per cent of road length in Outer London remaining in exceedance of the NO2 limit values in 2025: primarily on the North Circular and around Heathrow (which is a matter for national policy).
10 There are slightly different arrangements for residents of the central London area, who will remain subject to the T-charge while the ULEZ resident sunset period is in effect.
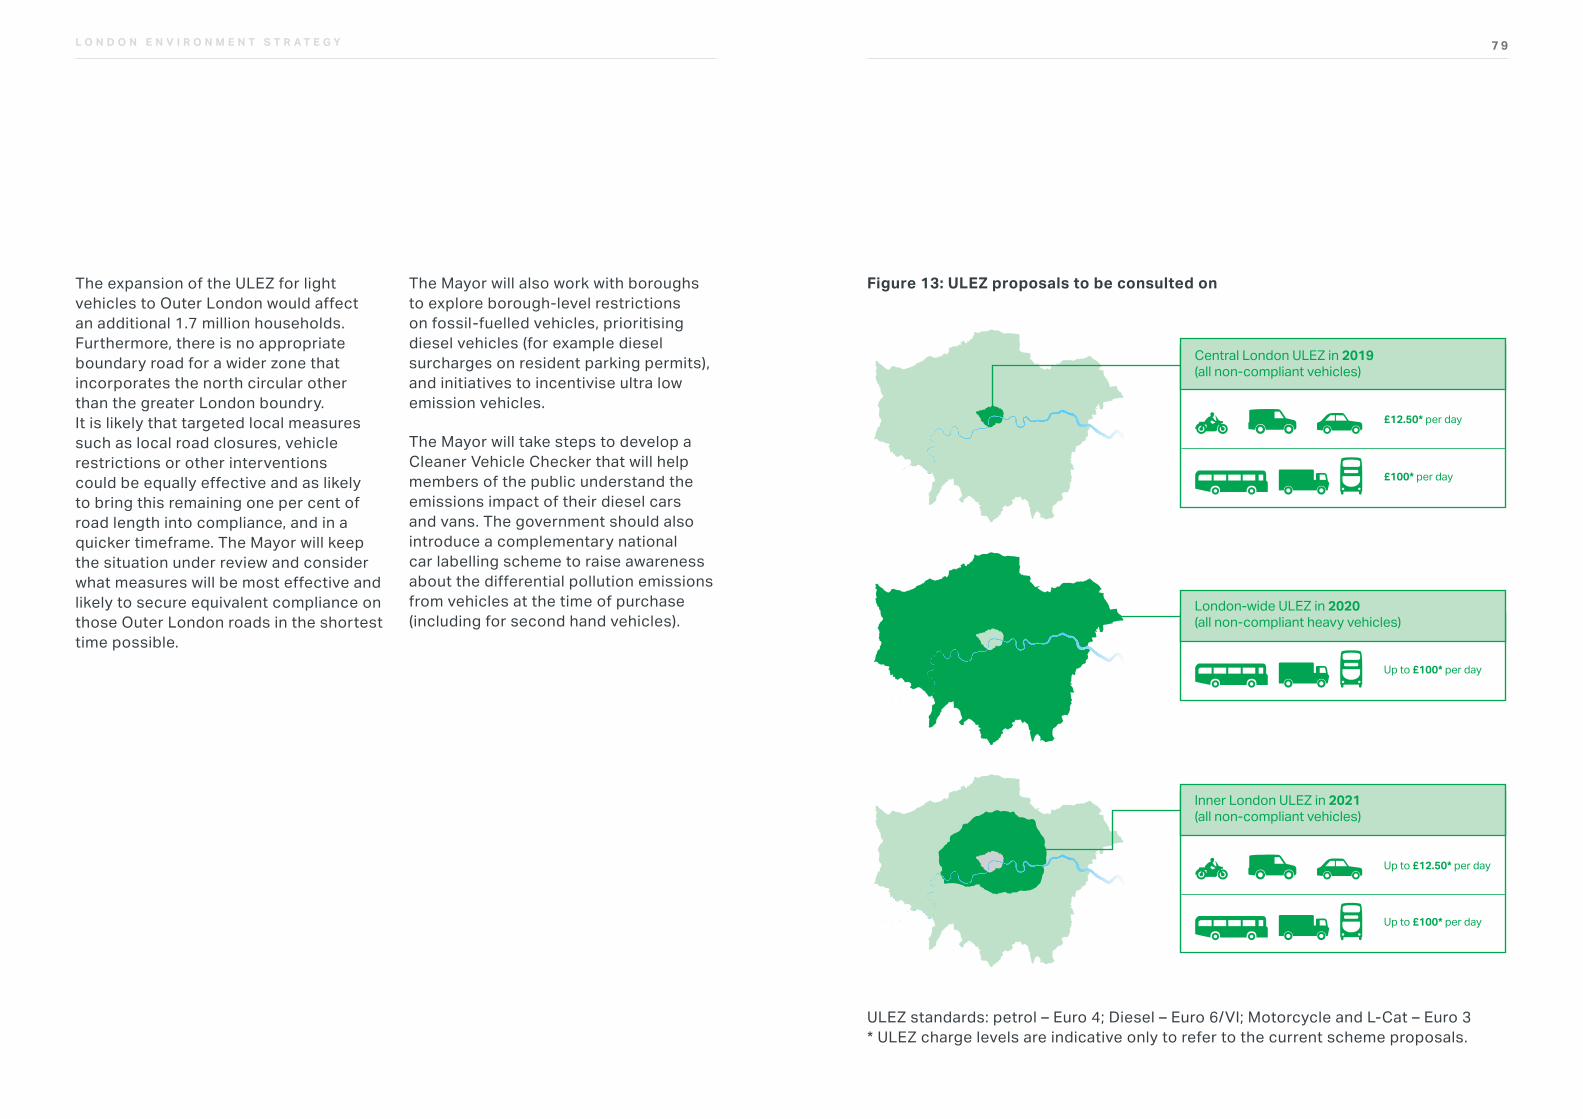
7 9L O N D O N E N V I R O N M E N T S T R A T E G Y
The expansion of the ULEZ for light vehicles to Outer London would affect an additional 1.7 million households. Furthermore, there is no appropriate boundary road for a wider zone that incorporates the north circular other than the greater London boundry. It is likely that targeted local measures such as local road closures, vehicle restrictions or other interventions could be equally effective and as likely to bring this remaining one per cent of road length into compliance, and in a quicker timeframe. The Mayor will keep the situation under review and consider what measures will be most effective and likely to secure equivalent compliance on those Outer London roads in the shortest time possible.
The Mayor will also work with boroughs to explore borough-level restrictions on fossil-fuelled vehicles, prioritising diesel vehicles (for example diesel surcharges on resident parking permits), and initiatives to incentivise ultra low emission vehicles.
The Mayor will take steps to develop a Cleaner Vehicle Checker that will help members of the public understand the emissions impact of their diesel cars and vans. The government should also introduce a complementary national car labelling scheme to raise awareness about the differential pollution emissions from vehicles at the time of purchase (including for second hand vehicles).
Figure 13: ULEZ proposals to be consulted onULEZ PROPOSALS
ULEZ standards: Petrol – Euro 4; Diesel – Euro 6/Vl; Motorcycle and L-Cat – Euro 3 *ULEZ charge levels are indicative only and refer to the current scheme proposals
£12.50* per day
£100* per day
Central London ULEZ in 2019 (all non-compliant vehicles)
Up to £100* per day
Up to £12.50* per day
Inner London ULEZ in 2021 (all non-compliant vehicles)
Up to £100* per day
London-wide ULEZ in 2020 (all non-compliant heavy vehicles)
ULEZ standards: petrol – Euro 4; Diesel – Euro 6/VI; Motorcycle and L-Cat – Euro 3 * ULEZ charge levels are indicative only to refer to the current scheme proposals.
8 1L O N D O N E N V I R O N M E N T S T R A T E G Y
Proposal 4.2.1e The Mayor aims to reduce emissions from freight through encouraging a switch to lower emission vehicles, adopting smarter practices and reducing freight movements through better use of consolidated trips
Almost all of London’s freight is carried by road, using diesel vehicles. This activity accounts for over ten per cent of PM2.5 emissions11 and around a fifth of traffic in the capital.12 In the morning peak, freight traffic is around a third of the total traffic in central London.
London’s freight movement is also growing in an inefficient way. Many deliveries of non-time critical goods are unnecessarily made at congested times of the day. Lorries and vans are often less than half full. It is estimated as many as two in every three delivery slots are missed.13 This means repeat trips, which cause even more congestion and emissions. The Mayor will work with London Councils on possible changes to the London Lorry Control Scheme, which controls the movement of heavy goods vehicles at night and at weekends, so that the scheme can reduce emissions of air quality pollutants and CO2, as well as minimising noise and encouraging safer vehicle design.
“ Fectorbi factodis. Apestra vocul vivil ventid se etrest atus tem, ponsuli ntique reis nem me ad C. Decupio ratuam potio, sentiur bitati sturniu qui sum postia nuncepoenam.”
Eexeris molores recto optas Et eic to bercia cuptas a aut
“ London’s freight accounts for over ten per cent of PM2.5 emissions and around a fifth of traffic in the capital.”
L O N D O N E N V I R O N M E N T S T R A T E G Y
The Mayor will take steps to develop a Cleaner Vehicle Checker to help fleet operators understand the emissions of their diesel cars and vans, and will work with industry to set out a clear plan to phase out fossil fuels. This is vital, especially amongst heavier specialist vehicles, which are often more challenging to switch to cleaner alternatives. The plan will help better understand alternative fuels, and how they can be used to bridge the transition towards zero emission technologies.
The Mayor has set a number of targets to cut emissions and reduce the amount of freight movement in central London. This includes reducing construction traffic by five per cent by 2020, and reducing the number of freight trips during the morning peak by ten per cent by 2026.
11 Transport statistics Great Britain 201312 NOx emissions in Greater London LAEI 201013 Online Shopping Report conducted by ICM on behalf of the GLA in August 2015
This can be achieved by:
• stimulating the supply, and increasing the take up, of low emission commercial vehicles through regulatory, procurement and pricing incentives
• making the most efficient use of vehicles by developing a strategic consolidation and distribution network to protect industrial land and reduce the impact of freight and servicing trips on London’s streets (Box 5 describes a low emission freight pilot)
• examining other ways in which freight can be delivered and moved around. For example, using cargo bikes and motorbikes for shorter, smaller deliveries in central London and town centres, and making better use of river and rail services.
8 3L O N D O N E N V I R O N M E N T S T R A T E G Y
London’s West End is a very popular shopping area and is home to many household name brands. However, research revealed that 73 per cent of consumers found the experience exhausting and overwhelming, while 63 per cent complained of being jostled. A delivery solution was required that helped reduce traffic but drive footfall, and that would allow retail staff to return their focus to selling.
The retailers on Regent Street and in the West End have worked with Clipper Services to bring together deliveries despatched from a single consolidation centre. The centre
brings together consumables from all suppliers to one easily accessible point, combining deliveries with other West End companies to streamline a previously complex and inefficient system into a simple and effective one. It also releases extra in-store floor space for retail.
As a result, there has been a 77 per cent reduction in vehicle movements in the area. There has also been an improvement in air quality, with 8 kg less particulate matter emitted each year within central London; the equivalent of an average car driving more than 6,200 times around the M25.
BOX 4: CROWN ESTATE REGENT STREET CONSOLIDATION
The GLA and Gnewt Cargo (a leading SME with a proven logistics operator who specialises in electric vehicles), have secured circa £1.1m from Innovate UK to run a low-emission freight and logistics trial for larger commercial freight vehicles from April 2017 to 2019. This will trial freight collections using large zero emission vehicles and test their commercial viability with the aim of encouraging
the widespread introduction of low and zero emission vehicles to other commercial fleets operating in London and across the UK.
Through TfL’s LoCITY initiative, the Mayor is increasing the supply and uptake of low emission commercial vehicles and associated infrastructure which will help businesses transition to cleaner vehicles.
BOX 5: GL A AND GNE W T LOW EMISSION FREIGHT PILOT AND TFL’S LOCIT Y INITIATIVE
Proposal 4.2.1f The Mayor will work with stakeholders to understand the barriers to deploying ultra low emission auxiliary power units on vehicles and encourage further take up in London
Secondary engines or, auxiliary power units, are used on some vehicles mostly to provide refrigeration for cool or frozen food deliveries.
Although they are generally small, these engines commonly run on ‘red diesel’14 and are regulated to a much lower standard than the main vehicle engine. There are ultra low emission alternatives available, but they are not widely used. The Mayor will work with stakeholders to understand the barriers to deployment, and promote the use of cleaner auxiliary power units when possible. This will include considering the appropriate tax treatment of ‘red diesel’, so that a switch to ultra low emission technologies can be financially incentivised.
Policy 4.2.2 Reduce emissions from non-road transport sources, including by phasing out fossil fuels
Proposal 4.2.2a The Mayor will work with government and relevant groups to reduce emissions from activity on London’s waterways
London’s waterways are multifunctional assets and the Mayor will work to promote their protection and water-related use, benefitting the environment as well as the health and well-being of Londoners. The term ‘waterways’ does not only refer to the River Thames, its tributary rivers and canals, but also to other water spaces including docks, lakes and reservoirs (Figure 14). This network of linked waterways is of cross cutting and strategic importance for London. Every London borough contains some waterways – 17 border the Thames and 15 contain canals.
14 Red diesel is a dyed fuel that incurs a lower tax than ordinary transport diesel
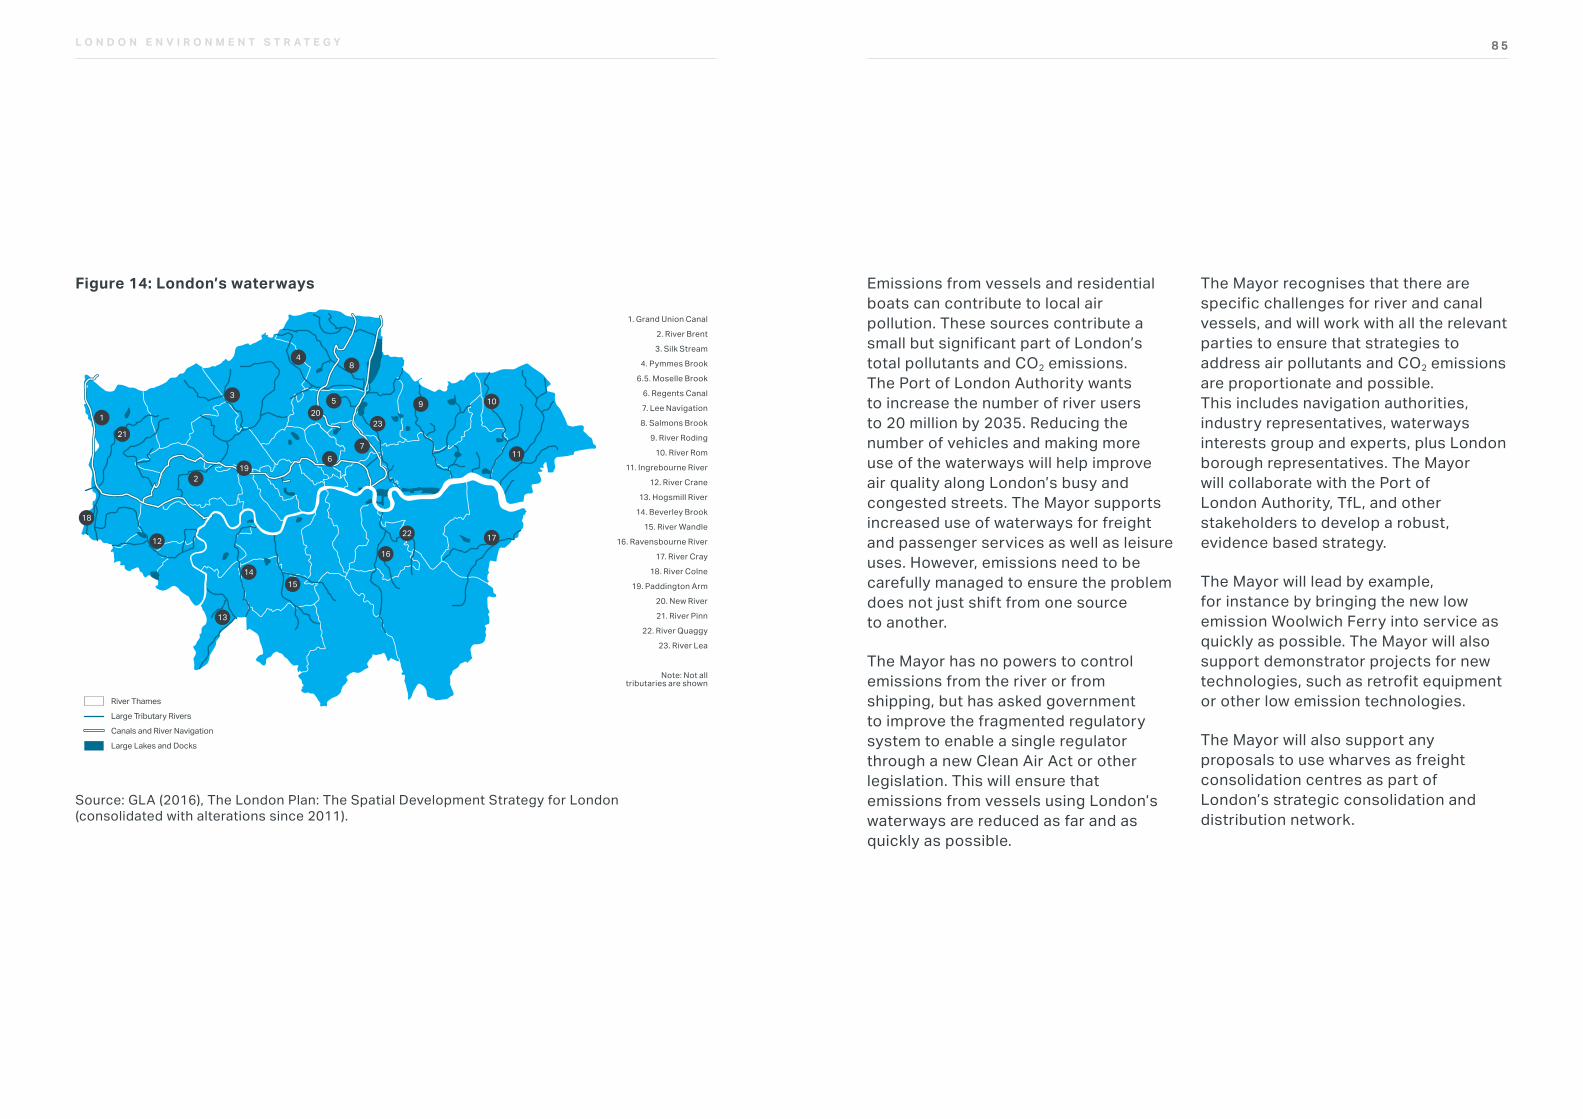
8 5L O N D O N E N V I R O N M E N T S T R A T E G Y
Figure 14: London’s waterways
TYPE OF GRAPH: AIR QUALITY
Reference
Fig 29: Blue Ribbon Network
Source: GLA (2016), The London Plan: The Spatial Development Strategy for London (consolidated with alterations since 2011). Available at: www.london.gov.uk/what-we-do/planning/london-plan/current-london-plan/london-plan-chapter-seven-londons-living-space-4
1. Grand Union Canal
2. River Brent
3. Silk Stream
4. Pymmes Brook
6.5. Moselle Brook
6. Regents Canal
7. Lee Navigation
8. Salmons Brook
9. River Roding
10. River Rom
11. Ingrebourne River
12. River Crane
13. Hogsmill River
14. Beverley Brook
15. River Wandle
16. Ravensbourne River
17. River Cray
18. River Colne
19. Paddington Arm
20. New River
21. River Pinn
22. River Quaggy
23. River Lea
Note: Not alltributaries are shown
1514
13
12
2
4
1
River Thames
Large Tributary Rivers
Canals and River Navigation
Large Lakes and Docks
17
20
196
7
23
22
16
11
1095
8
3
21
18
Source: GLA (2016), The London Plan: The Spatial Development Strategy for London (consolidated with alterations since 2011).
Emissions from vessels and residential boats can contribute to local air pollution. These sources contribute a small but significant part of London’s total pollutants and CO2 emissions. The Port of London Authority wants to increase the number of river users to 20 million by 2035. Reducing the number of vehicles and making more use of the waterways will help improve air quality along London’s busy and congested streets. The Mayor supports increased use of waterways for freight and passenger services as well as leisure uses. However, emissions need to be carefully managed to ensure the problem does not just shift from one source to another.
The Mayor has no powers to control emissions from the river or from shipping, but has asked government to improve the fragmented regulatory system to enable a single regulator through a new Clean Air Act or other legislation. This will ensure that emissions from vessels using London’s waterways are reduced as far and as quickly as possible.
The Mayor recognises that there are specific challenges for river and canal vessels, and will work with all the relevant parties to ensure that strategies to address air pollutants and CO2 emissions are proportionate and possible. This includes navigation authorities, industry representatives, waterways interests group and experts, plus London borough representatives. The Mayor will collaborate with the Port of London Authority, TfL, and other stakeholders to develop a robust, evidence based strategy.
The Mayor will lead by example, for instance by bringing the new low emission Woolwich Ferry into service as quickly as possible. The Mayor will also support demonstrator projects for new technologies, such as retrofit equipment or other low emission technologies.
The Mayor will also support any proposals to use wharves as freight consolidation centres as part of London’s strategic consolidation and distribution network.
8 7L O N D O N E N V I R O N M E N T S T R A T E G Y
To enable cleaner vessels to use the waterways, the Mayor will encourage new and refurbished wharves, piers and canal moorings to generate renewable power onsite. Where appropriate, shore power or refuelling facilities for low emission fuels should be provided for all vessels moored onsite. Provision of shore power will be most encouraged at residential moorings. The Mayor will also work with wharf and pier operators to help introduce tiered fees for the cleanest vessels, similar to the Port of London Authority’s Green Tariff scheme.
Proposal 4.2.2b The Mayor will work with government and other partners to seek reductions in emissions from aviation activity in London and the south east particularly from Heathrow
Adequate airport capacity serving a wide range of destinations is vital to helping London stay competitive in a global economy. At the same time, the aviation industry must play its part in improving the health and quality of life for those living and working near London’s airports.
Aviation contributes around 2.5 per cent of London’s monitored greenhouse gas (GHG) emissions.15 If this sector fails to decarbonise, by 2050 these emissions would make up over 20 per cent of London’s total. If unmanaged, emissions from the proposed Heathrow expansion are likely to increase by around a third.
The Mayor opposes any airport expansion in London unless it can show that there is no unacceptable impact on air quality and that GHG emissions are minimised. This will include:
• demonstrating airport expansion will not cause new exceedances of the UK air quality standards or increase of existing areas of exceedance
• demonstrating airport expansion will not increase exposure to pollution where improvements in local or regional air quality have been, or will be, secured by other Mayoral, local or national policies
• demonstrating airport development or expansion has incorporated Air Quality Positive principles and other Mayoral policies to minimise the impact of development, including impacts during the construction phase
15 Defined as emissions from aviation sources up to 1km above the ground
• demonstrating that any airport expansion ensures that London’s contribution to aviation emissions reduce in line with recommendations to meet national GHG emission targets.
• the Mayor working with airports in London to develop their climate action plans and determine how they will minimise net emissions. It may be possible to establish an offsetting fund where reductions in GHG emissions cannot be met onsite
Airports that are not proposing to expand, or are only proposing to increase passenger numbers without expanding their infrastructure, should continue to review their operations. They must identify options to reduce their impact on air quality both on and offsite, and take these steps to do so as soon as possible.
The impacts of expansion of Heathrow Airport on ambient noise are covered in Chapter 9.
Proposal 4.2.2c The Mayor will work with government and other partners to seek reductions in emissions from rail transport and at stations
London’s rail network is a huge consumer of electricity. Therefore, making rail more efficient and electrifying lines will be essential for meeting the Mayor’s zero carbon ambition. It will also replace diesel transport and the associated harmful air pollution emissions. By 2050, all rail lines in London should be electrified as part of Network Rail’s investment programme. Electrification of more of the network (for example connections to the Gospel Oak line and services to Marylebone) is also needed to provide the necessary capacity increase in London.
The Mayor, through TfL, will investigate opportunities to decarbonise TfL-controlled rail services, with the aim of achieving a zero carbon network by 2030. This will include pursuing options to power services through local renewable generation in London and using procurement options to increase the provision of renewable energy.
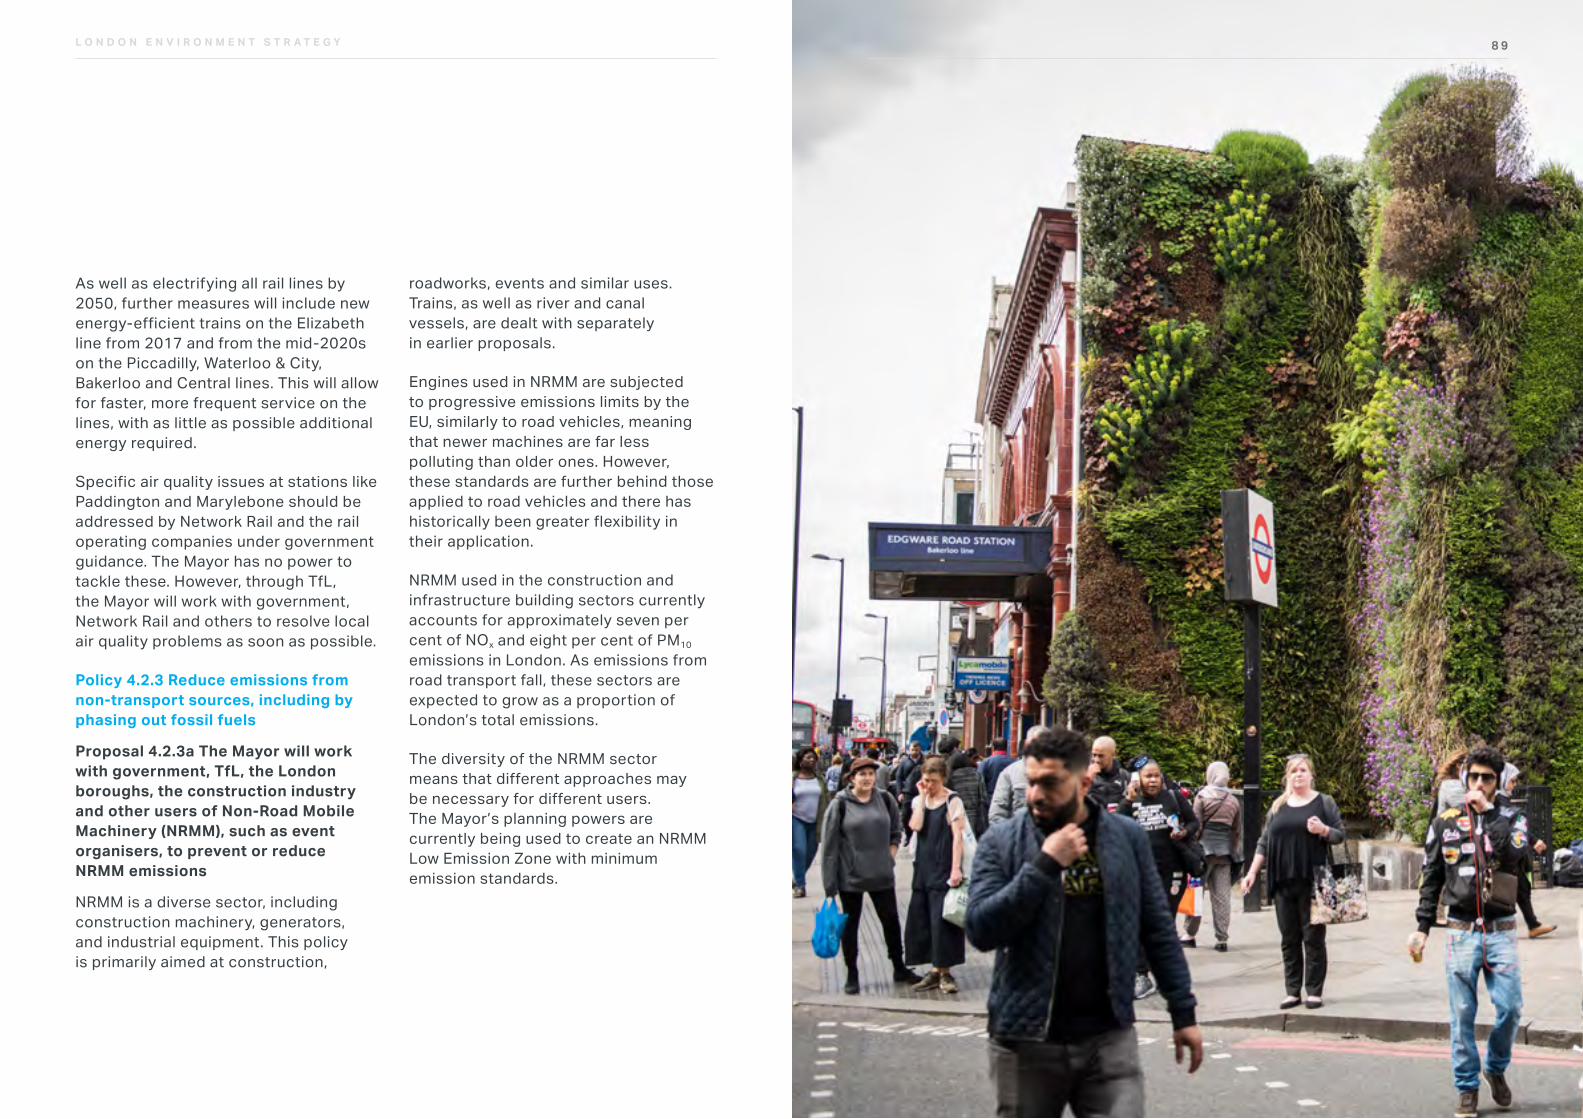
8 9L O N D O N E N V I R O N M E N T S T R A T E G Y
As well as electrifying all rail lines by 2050, further measures will include new energy-efficient trains on the Elizabeth line from 2017 and from the mid-2020s on the Piccadilly, Waterloo & City, Bakerloo and Central lines. This will allow for faster, more frequent service on the lines, with as little as possible additional energy required.
Specific air quality issues at stations like Paddington and Marylebone should be addressed by Network Rail and the rail operating companies under government guidance. The Mayor has no power to tackle these. However, through TfL, the Mayor will work with government, Network Rail and others to resolve local air quality problems as soon as possible.
Policy 4.2.3 Reduce emissions from non-transport sources, including by phasing out fossil fuels
Proposal 4.2.3a The Mayor will work with government, TfL, the London boroughs, the construction industry and other users of Non-Road Mobile Machinery (NRMM), such as event organisers, to prevent or reduce NRMM emissions
NRMM is a diverse sector, including construction machinery, generators, and industrial equipment. This policy is primarily aimed at construction,
roadworks, events and similar uses. Trains, as well as river and canal vessels, are dealt with separately in earlier proposals.
Engines used in NRMM are subjected to progressive emissions limits by the EU, similarly to road vehicles, meaning that newer machines are far less polluting than older ones. However, these standards are further behind those applied to road vehicles and there has historically been greater flexibility in their application.
NRMM used in the construction and infrastructure building sectors currently accounts for approximately seven per cent of NOx and eight per cent of PM10 emissions in London. As emissions from road transport fall, these sectors are expected to grow as a proportion of London’s total emissions.
The diversity of the NRMM sector means that different approaches may be necessary for different users. The Mayor’s planning powers are currently being used to create an NRMM Low Emission Zone with minimum emission standards.
8 9
9 1L O N D O N E N V I R O N M E N T S T R A T E G Y
These are based on European ‘stages’, which are similar to emission standards for vehicles. The applicable standards are stage IIIB on construction sites in central London, and stage IIIA in the rest of London currently. These will tighten to stage IV and IIIB respectively in 2020. The Mayor will review the NRMM Low Emission Zone standards to ensure that they deliver the largest possible improvements. The Mayor wants stronger enforcement powers to ensure that these standards are consistently met across London, and has asked the government to legislate to provide these.
The Mayor will lead by example through the GLA group. Emissions from NRMM construction and maintenance activities will, where appropriate, meet or exceed the standards set out by the NRMM Low Emission Zone. The Mayor will also work with other major infrastructure developers, such as Network Rail, Thames Water, National Grid and High Speed 2 (HS2), so they incorporate these as minimum emissions standards. Working with the Environment Agency, Defra and the London boroughs, the Mayor will seek to incorporate NRMM emissions standards into environmental permits. The Mayor will also promote the use of zero and ultra low emission technology, such as fuel cell, hybrid or electric machines to reduce emissions and carbon impacts from NRMM.
“ Non-road mobile machinery used in the construction and infrastructure building sectors currently accounts for approximately seven per cent of NOx and eight per cent of PM10 emissions in London.”
L O N D O N E N V I R O N M E N T S T R A T E G Y
As well as setting requirements for minimum emissions standards, the Mayor will develop a new enhanced website to make participation in the NRMM Low Emission Zone as straightforward as possible and set up a Green Machines NRMM positive recognition scheme to promote best practice in reducing emissions and encourage innovation.
Proposal 4.2.3b The Mayor will work with industry and other partners to seek reductions in emissions from construction and demolition sites
Construction and demolition sites, including roadworks, can be a significant contributor to local particulate levels if they are not well managed. These projects can last a long time and many can happen in the same area. This means these emissions can significantly affect the health of local residents, unless they are properly controlled and managed.
It is important to develop and share best practice to support and improve the measures the construction sector already puts in place. Similarly, the understanding of how monitoring can be used on construction sites to inform the operators when additional measures are required must be improved.
To do this, the Mayor will maintain guidance on managing dust and other emissions on construction sites, as well as using planning powers. The Mayor will continue to support the London Low Emissions Construction Partnership and similar projects to research and develop the best dust-control techniques for construction sites. Voluntary approaches will be promoted to control the problem at sites or in areas where the Mayor has no statutory powers.
Proposal 4.2.3c The Mayor aims to improve London’s air quality by reducing emissions from homes and workplaces, including through energy efficiency programmes
Over 70 per cent of the energy used in homes and workplaces is for space and hot water heating, some 90 per cent of which is currently met using gas-fired boilers which emit harmful NOx emissions and contribute to air pollution in London. NOx emissions from commercial gas use are expected to grow significantly as a proportion of London’s emissions. In central London NOx emissions will increase from 30 per cent in 2013 to 38 per cent in 2020.
9 3L O N D O N E N V I R O N M E N T S T R A T E G Y
Installing an efficient boiler or renewable heating technology can be a cost-effective way to cut NOx emissions, CO2 emissions and energy bills. The Mayor’s Energy for Londoners programme will support the transition from old inefficient gas boilers to ultra low NOx gas boilers and low carbon (and low-pollution) heating alternatives such as heat pumps. This will help make London’s air cleaner.
Following the London Boiler Cashback Scheme, the Mayor will deliver a new three-year (2017-2020) commercial boiler scrappage initiative to help provide incentives to install more efficient gas and renewable heating systems. The Mayor will evaluate this scheme and the London Boiler Cashback and Better Boilers schemes. This will help inform the development of future initiatives to provide more efficient and low NOx boiler replacements. The Mayor’s energy efficiency programmes, such as RE:NEW and RE:FIT, will also help to removing inefficiency heating systems which contribute to poor air quality.
Proposal 4.2.3d The Mayor will work with government to seek reductions in emissions from large scale generators producing power for commercial buildings in London
There is evidence that diesel generators installed as emergency backup power sources in offices and other buildings are increasingly being used to meet peak electricity demand from the grid. This is because the grid now struggles to match supply with demand. The government does not impose any controls on the emissions from most of these generators. However, they have the potential for significant negative impacts if their use continues to grow.
Even where they are used only for short amounts of time, old or poorly located generators can have a major impact on local air quality.
Current Defra proposals to introduce emissions limits for generators over one megawatt in capacity will not affect existing generators until at least the mid-2020s. Generators that run for less than 500 hours a year will not be affected. These new controls do not go far enough or fast enough to protect the health of Londoners.
The Mayor will use planning powers to prevent the creation of new diesel powered ‘generator farms’ in London and ensure the impacts of any new emergency generators in buildings are minimised. To help this the Mayor will work with health authorities and others to raise awareness of the impacts of the use of diesel generators on air quality.
The Mayor will work with the Department for Business, Energy and Industrial Strategy and Defra to seek market reforms and discourage the use of emergency generators in the Short-Term Operating Reserve and capacity markets. The Mayor will encourage Defra to apply more robust standards, and give the Mayor the powers to regulate this sector in London.
The Mayor will also work with the retrofit industry and generator owners to develop effective and install effective retrofit solutions for existing generators as soon as possible. Where applicable, retrofit for emergency generators could be supported by the Mayor’s retrofit programmes.
Proposal 4.2.3e Through the London Plan the Mayor will consider policies to reduce the impact of new industrial and waste sites on local air quality. The Mayor will also work with regulators and industry to reduce emissions from existing sites and will address the antisocial burning of waste and the inappropriate use of bonfires
The Environment Agency is responsible for licensing, inspecting and enforcing heavy industrial processes (known as ‘Part A’) and waste sites in London. It will be a crucial partner in managing emissions from these installations. London boroughs lead on licensing, inspecting and enforcing ‘Part B’ sites.
Some waste and industrial activities have the potential to cause local dust and particulate pollution by the nature of the work that they undertake.
The potential for these sites to cause pollution can be greatly reduced by moving dusty activities indoors. Working indoors can also have other benefits, such as reducing the amount of water used for dust suppression.
Through the London Plan, the Mayor will consider developing a policy supporting appropriate enclosure of polluting (or dusty) activities on waste sites to mitigate and avoid adverse effects on human health including poor air quality and noise pollution.

9 5L O N D O N E N V I R O N M E N T S T R A T E G Y
The Mayor will work with the Environment Agency and the London boroughs to seek reductions in emissions from existing potentially polluting industrial and waste sites on GLA or TfL-owned land by encouraging them to be enclosed as soon as possible. The Mayor will also work with the regulators to support and promote the enclosure of existing sites, especially where there are existing problems with pollution.
Policy 4.2.4 The Mayor will work with the government, the London boroughs and other partners to accelerate the achievement of legal limits in Greater London and improve air quality
Proposal 4.2.4a The Mayor will use the London Local Air Quality Management (LLAQM) framework to assist and require boroughs to exercise their statutory duties to improve air quality and will exercise statutory powers as required
London’s boroughs have an important role to play in addressing local pollution. The statutory basis for local authority air quality obligations is Part IV of the Environment Act 1995. This requires that London boroughs monitor and review pollution. Where they exceed standards, they must declare an Air Quality Management Area and put in place an action plan detailing how they will tackle the problem.
The levers under the control of the London boroughs include:
• emissions-based parking charges
• reducing pollution from new developments through the planning system (especially those that are not referred to the Mayor)
• improving public realm for walking and cycling
• rolling-out targeted measures at pollution hotspots
• integrating air quality into their public health duties
• supporting new infrastructure for fuelling zero emission vehicles
As set out in the draft Mayor’s Transport Strategy, TfL will offer boroughs support, including for the development and administration of traffic demand management schemes and through Local Implementation Plans (LIPs) to support the delivery of the Healthy Streets Approach.
Borough statutory powers can be used to continue to discourage the anti-social burning and illegal use of wood-burning stoves to reduce smoke annoyance and health impacts.
9 5
9 7L O N D O N E N V I R O N M E N T S T R A T E G Y
The Mayor will help boroughs in carrying out the exercise of their statutory duties to improve air quality. Through the reformed LLAQM framework there are clearer requirements for the boroughs. The Mayor will continue to provide coordination, tools, templates, support and funding. The Mayor will also improve information sharing and promote best practice by publishing an annual report on borough achievements and provide advice, information and workshops.
The Mayor will recognise borough efforts to improve air quality through awarding Cleaner Air Borough status. This will be reviewed annually, together with criteria that reflect the increased ambition of this strategy. The Mayor will also support boroughs and businesses to deliver local projects through the Mayor’s Air Quality Fund, including at least five borough Low Emission Neighbourhoods and five business Low Emission Neighbourhoods.
Under the LLAQM framework the Mayor can direct boroughs and require them to take steps to meet the air quality objectives. These reserve powers can be used following consultation.
Proposal 4.2.4b The Mayor will work with the government to achieve full legal compliance with UK and EU limits as soon as possible
Comprehensive and coordinated action is needed at a national level to achieve legal limits as quickly as possible. The government has unique tools available to do this – the ability to promote legislation, change fiscal incentives, raise revenue and take national action. The measures set out below would help accelerate compliance.
The Mayor calls on the government to take the following action:
• introduce a powerful new twenty-first century Clean Air Act to entrench the right to breathe clean air and tackle pollution in London once and for all. This legislation could provide the framework for action, bringing the law up to date to cope with the massive air quality challenges that London faces today. In the context of the UK’s intention to leave the EU it should provide a legally enforceable right to clean air and the government could introduce new powers to better regulate all emissions sources, not just road transport, and empower local authorities
• diesel is the biggest and most problematic source of NOx emissions. A credible national air quality plan needs to accelerate the pace at which this fuel is no longer used, both in transport and non-transport uses. A national vehicle scrappage fund is essential if compliance costs to people and businesses of such action is to be minimised. It is only right that the government provides this help, given that national fiscal policy has encouraged dieselisation over many years, meaning many people bought polluting vehicles in good faith
• a national retrofit certification scheme to further reduce compliance costs to businesses to meet new emission standards and build on the work that has been done with London’s bus fleet
• a targeted retrofit fund for HGVs, buses, coaches and other specialist vehicles (such as ambulances, fire brigade vehicles and refuse vehicles)
• vehicle excise duty, capital allowances and other fiscal reforms are also needed to reduce emissions and promote the uptake of zero emission vehicles
• fiscal reform should be complemented by a national car labelling scheme to raise awareness about the differential pollution emissions from vehicles at the time of purchase (including for second hand vehicles)
• more electric vehicles and charging infrastructure needs to be unlocked by addressing structural power grid barriers and providing additional funding through the Office for Low Emission Vehicles
• a commitment to providing the necessary funding to convert all UK black taxis to zero emission capable models by 2025 at the latest and scrapping older diesel taxis. Higher rate vehicle excise duty on taxis must also be removed so as not to make it harder for taxi drivers to purchase zero emission capable models
• preventing the illegal removal of diesel particulate filters through enhanced MOT testing and spot checks
• the Mayor is already contributing more resources to improve air quality in London, but it must be recognised that this comes at a high cost in terms of other priorities. government should recognise that London’s air quality challenges are linked to a national problem and provide financial support for the Mayor
9 9L O N D O N E N V I R O N M E N T S T R A T E G Y
• additional funding for other local authorities should also be made available. The current £3m available as part of Defra’s air quality grants programme is supposed to support measures across the UK and is woefully insufficient both nationally and for London, given the scale of the challenge
• government is also uniquely place to provide enhanced public information, especially during air pollution episodes by utilising national communication infrastructure and working closely with the media, e.g. pollution updates on weather bulletins
• allow London planning policy to take precedence over national planning policy. Changes that resulted from the government’s Housing Standards Review could potentially complicate London’s ability to enforce existing emission standards on residential developments. Taking into account London’s growth, this could offset emissions reduction delivered by schemes such as the ULEZ. It is essential the Department for Communities and Local Government (DCLG) protect regional and local authorities’ ability to set appropriate air pollutant emission standards for new
developments, such as the ‘Air Quality Neutral’ requirements included in the London Plan or new approaches like ‘Air Quality Positive’, which is explained in more detail under the following objective
• provide new powers for construction, including stronger enforcement powers against Non Road Mobile Machinery (NRMM) both on and off construction sites
• provide new powers and improved coordination for river and maritime vessels, including having a single regulatory authority for the Thames and London tributaries and introduce minimum emissions standards
• deliver a national boiler scrappage scheme to tackle emissions from residential and commercial properties particularly targeted at those on low incomes (to tackle fuel poverty) and for the premises of Small and Medium-sized Enterprises
• revitalise smoke control zones and address wood burners through a new fit-for-purpose testing regime and information on appropriate technology/fuels for smoke control zones at point of sale
Proposal 4.2.4c The Mayor will work with European institutions, other European cities and city networks on efforts to minimise transboundary pollutions
As noted above, the challenge of cleaning London’s air is made tougher because over half of the pollution experienced is not created here.
This is why, even as the UK leaves the EU, close working with European partners through sharing best practice and coordinated action is required. This will help drive reductions in emissions across the continent and accelerate delivery of the National Emissions Ceiling Directive.
To do this the Mayor will work with European institutions, other European cities and city networks to ensure that transboundary pollution affecting London is minimised and ensuring strong source control measures and regulations are adopted at EU-level.
“ The challenge of cleaning London’s air is made tougher because over half of the pollution experienced is not created here.”
9 9
1 0 1L O N D O N E N V I R O N M E N T S T R A T E G Y
Policy 4.2.5 The Mayor will work with other cities (here and internationally), global city and industry networks to share best practice, lead action and support evidence-based steps to improve air quality
While London is a leader in many environmental fields, it does not have a monopoly on wisdom. The Mayor is open to sharing best practice with other cities. Maintaining existing international partnerships will be crucial to doing this. One practical example of this work is the reductions achieved in price premiums for hybrid buses by hosting an International Zero Emission Bus Summit and coordinating a Clean Bus Declaration. This was signed by 26 global cities.
OBJECTIVE 4.3 ESTABLISH AND ACHIEVE NEW, TIGHTER AIR QUALITY TARGETS FOR A CLEANER LONDON BY TRANSITIONING TO A ZERO EMISSION LONDON BY 2050, MEETING WORLD HEALTH ORGANISATION HEALTH-BASED GUIDELINES FOR AIR QUALITY
The Mayor recognises that cleaning up London’s air is about more than just meeting legal compliance. It is about making London a leading global city and an attractive place to live, visit and do business. The Mayor is therefore setting a course to achieve new ambitious targets, in line with current WHO health-based guidelines, particularly for PM2.5.
“ The Mayor is setting a course to achieve new ambitious targets, in line with current WHO health-based guidelines, particularly for PM2.5.”
L O N D O N E N V I R O N M E N T S T R A T E G Y
Achieving this will require action beyond London. As set out above, transboundary pollution from outside London is currently responsible for the majority of the health effects associated with PM2.5. Clearly any route map to meeting current WHO guidelines will require considerable coordinated European-wide action. The EU National Emissions Ceiling Directive sets a legally binding requirement for a 49 per cent reduction in PM2.5 levels by 2030 compared to 2005 levels across Europe. This will be a significant ‘down payment’ on achieving the WHO guidelines and gives an important context for the action set out below.
Policy 4.3.1 The Mayor will establish new targets for PM2.5 and other pollutants where needed. The Mayor will seek to meet these targets as soon as possible, working with government and other partners
Proposal 4.3.1a The Mayor will set new concentration targets for PM2.5, with the aim of meeting World Health Organisation guidelines by 2030
Legal limits in the UK for some pollutants are unambitious, especially for ultra fine particulate matter, black carbon and PM2.5. There is significant evidence for the health impacts of PM2.5 as a part of PM10 and evidence also shows negative impacts on health, even below legal EU limits. Setting bold, achievable
concentration limits for London, and a pathway to meeting these, will ensure that London is aligned with the latest WHO recommendations. It will also have a positive effect on the health of Londoners. The measures set out elsewhere, while they will help achieve legal compliance, will not be enough to achieve these tighter limits. That is why further action is proposed below.
Using the latest evidence the Mayor will set new emission limits for full compliance with WHO for PM2.5 to be achieved by 2030. This will continue to drive improvement in air quality after legal standards are met, protecting public health and supporting the Mayor’s wider vision for a zero carbon London. The understanding of the relationships between pollution and health is constantly evolving and this may require new targets for other pollutants to be set in the future.
As part of the Mayor’s commitment to achieving the WHO guidelines by 2030, the Mayor will also join the Breathe Life consortium, led by the WHO and United Nations Environment Programme, so that London can work with other cities and countries around the world needed to develop the technologies and tackle the transboundary contribution needed to ensure that these exacting guidelines are met.
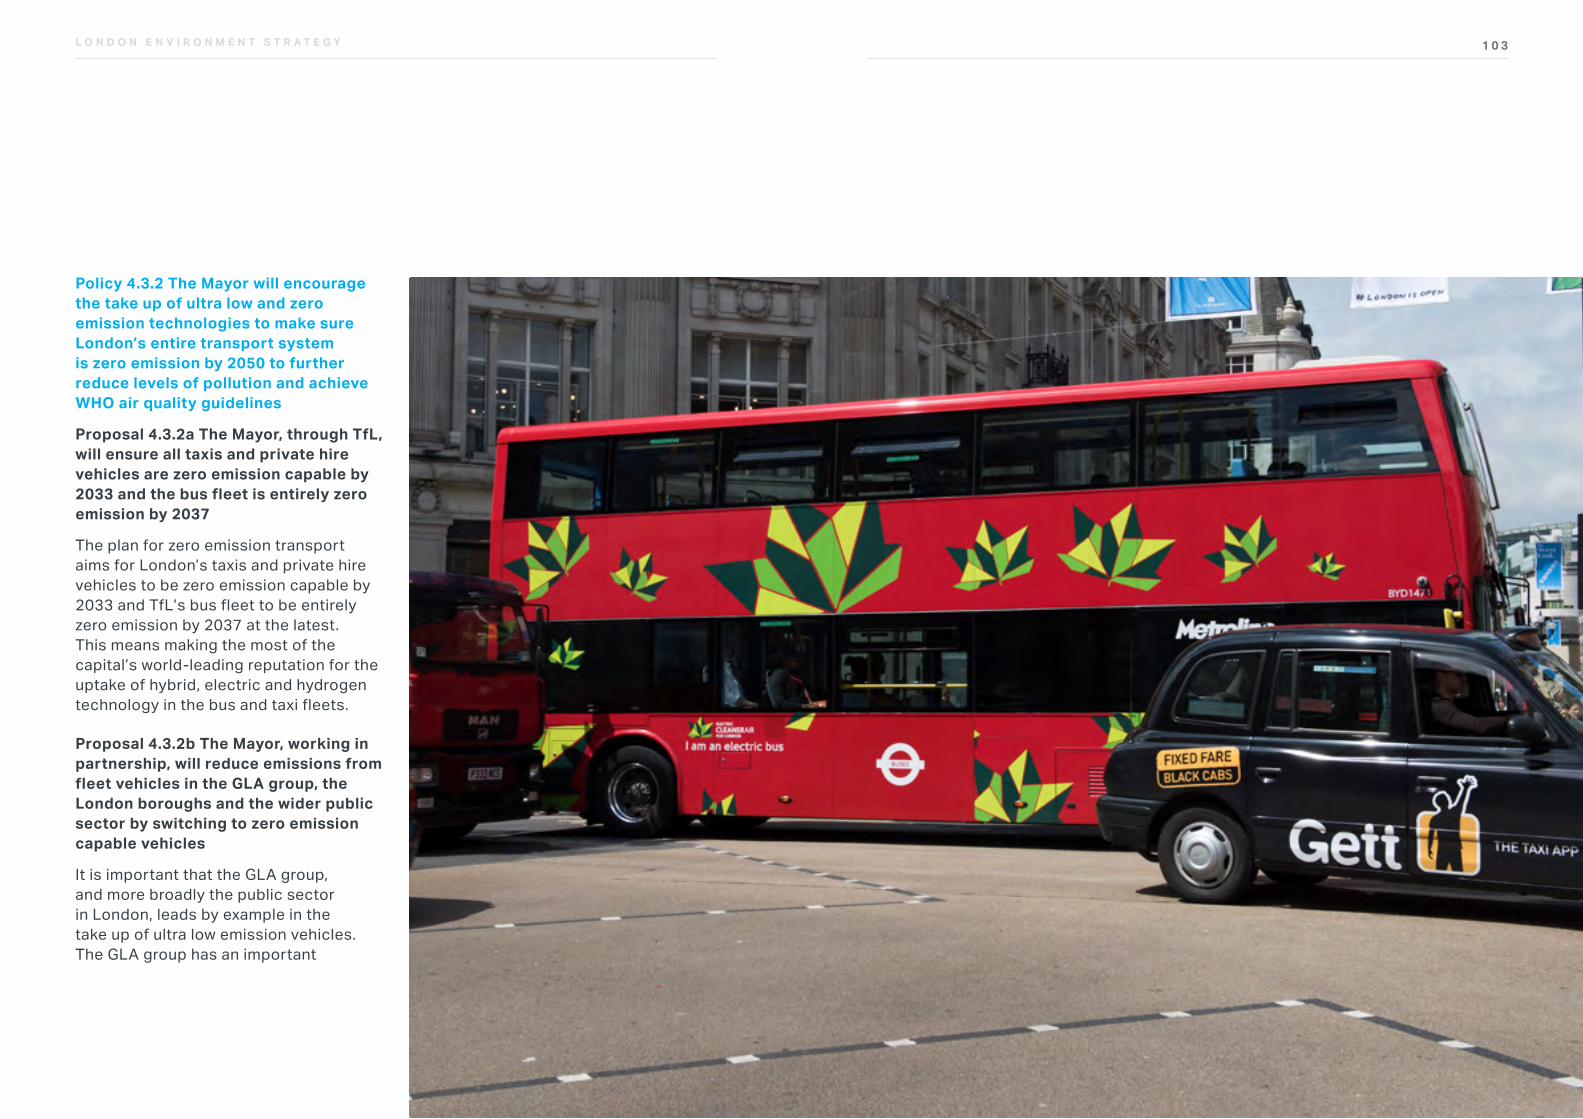
1 0 3L O N D O N E N V I R O N M E N T S T R A T E G Y
Policy 4.3.2 The Mayor will encourage the take up of ultra low and zero emission technologies to make sure London’s entire transport system is zero emission by 2050 to further reduce levels of pollution and achieve WHO air quality guidelines
Proposal 4.3.2a The Mayor, through TfL, will ensure all taxis and private hire vehicles are zero emission capable by 2033 and the bus fleet is entirely zero emission by 2037
The plan for zero emission transport aims for London’s taxis and private hire vehicles to be zero emission capable by 2033 and TfL’s bus fleet to be entirely zero emission by 2037 at the latest. This means making the most of the capital’s world-leading reputation for the uptake of hybrid, electric and hydrogen technology in the bus and taxi fleets.
Proposal 4.3.2b The Mayor, working in partnership, will reduce emissions from fleet vehicles in the GLA group, the London boroughs and the wider public sector by switching to zero emission capable vehicles
It is important that the GLA group, and more broadly the public sector in London, leads by example in the take up of ultra low emission vehicles. The GLA group has an important
1 0 5L O N D O N E N V I R O N M E N T S T R A T E G Y
role in demonstrating the viability of technologies on a broader scale and influencing the market. For example, the London Fire Brigade has an all-electric support car fleet. It also has a number of ultra low emission cars to attend emergency incidents and other brigade business across the capital.
Across the world, cities have started to set dates after which their operational fleets will not be allowed to procure or lease vehicles which are not zero exhaust emission (either electric or hydrogen).
The Mayor will work with TfL, the Metropolitan Police Service and the London Fire Brigade to achieve compliance with the ULEZ and work towards:
• all cars in GLA group support fleets being zero emission capable by 2025
• all new cars and vans (less than 3.5 tonnes) in GLA group fleets, including response vehicles, being zero emission capable from 2025
• all heavy vehicles (greater than 3.5 tonnes) in GLA group fleets being fossil fuel-free from 2030
• zero emission GLA group fleets by 2050
The wider public sector, including London boroughs and the NHS, will also be expected to lead by example and adopt similar dates.
Proposal 4.3.2c The Mayor, working with government, TfL, the London boroughs and industry will aim for London’s entire transport system to be zero emission by 2050
It will only be possible to achieve WHO air quality guidelines, deliver further improvements in public health and bring about a zero carbon city by 2050 if all vehicles are zero emission by that date. TfL must take significant steps to achieve zero emission transport and encourage uptake of ultra low and zero emission technologies, with public fleets taking a lead.
The government’s approach of incentivising the use of diesel vehicles to achieve CO2 savings has meant that local air quality has suffered. Rather than simply seeking to reverse this dieselisation, air quality and climate change must be considered together. This means a clear direction towards ULEVs to avert the adverse impacts of a rush back to petrol.
ULEVs include battery electric vehicles, plug-in hybrid vehicles, range-extended electric vehicles, and hydrogen fuel cell electric vehicles. For heavier vehicles, alternative fuels that show clear reductions in air pollutant and CO2 emissions may be used as a bridging technology to zero emissions by 2050.
The Mayor will help ensure ULEVs are the best choice for any Londoner or London business needing to use a car or a van. The aim is that all new cars and vans being driven in London should be zero emission by 2040 at the latest. Freight activity in London also contributes towards poor air quality and carbon emissions. Through programmes like LoCITY, TfL will work with the freight industry to overcome the barriers to adopting cleaner vans and HGVs.
To succeed in making the transition to ULEVs, a major expansion in electric charging and hydrogen infrastructure is required. This includes meeting the need for rapid charging to support zero emission capable taxis, private hire vehicles and commercial vehicles, and working with boroughs and private operators to provide on-street residential charging. TfL and City Hall will work with
“ London’s entire transport system to be zero emission by 2050.”
1 0 5
1 0 7L O N D O N E N V I R O N M E N T S T R A T E G Y
boroughs and industry to understand the long-term need for residential charging. As well as standalone stations, hydrogen refuelling systems and charging infrastructure can, and should, be integrated into existing refuelling stations.
Where fleets such as buses or waste trucks provide their own refuelling systems they should consider how this could also be made available to the public or other businesses. This can either be through local agreements or via publicly accessible facilities at the site perimeter. The GLA group will lead by example in doing this for example at fire station forecourts.
Bringing in ULEVs will require a significant change to London’s energy systems. We must ensure the supporting supply infrastructure is in place, while maximising CO2 benefits. The Mayor will work with TfL, government and stakeholders to ensure systems are upgraded. Plans will be put in place to manage the energy demand associated with the transition to ULEVs. This will help London’s energy system accommodate and manage the increased
demand associated with this transition.
To facilitate this, government must invest to ensure the grid and energy network is capable of hosting large numbers electric vehicles. Robust planning regulations at a national level would also strengthen local requirements for infrastructure in new developments, making electric vehicles a convenient choice for residents and businesses.
To progress hydrogen alternatives to existing internal combustion engine vehicles, the Mayor has worked with industry, academics and other stakeholders through the Hydrogen London Partnership which has demonstrated both transport (refuelling infrastructure, cars, vans, buses) and non-transport applications of the technology (energy for buildings and mobile generators) through a number of projects.
Going forward the Mayor will seek to integrate hydrogen technology into the zero and alternative fuels plan for London transport infrastructure, alongside electric. This is a normalisation phase which will support the development of mechanisms towards mass introduction and use of hydrogen fuel cell technologies.
Proposal 4.3.2d The Mayor, through TfL and the boroughs, and working with government, will implement local zero emission zones in town centres and aim to deliver a central London zero emission zone from 2025, as well as broader congestion reduction measures, to pave the way to larger zero emission zones in inner London by 2040 and then London-wide by 2050 at the latest
As well as incentives and supporting infrastructure to encourage a move to ULEVs, it will also be necessary to use disincentives to phase out fossil fuel vehicles altogether. In addition to the proposed earlier introduction and expansion of ULEZ, tightening emission standards by implementing a network of zero emission zones would help reduce total CO2, NOx and PM2.5 emissions. This would send a clear signal that the city is moving towards a fossil fuel-free future.
A zero emission zone is likely to subject non zero emission vehicles driven within it to road user charges (similar to ULEZ or LEZ) and/ or other vehicle prohibitions or restrictions. Creating zero emission zones will be an essential part of the move towards zero emission transport. The Mayor wants to start this transition where pollution and exposure is worst so
will seek to deliver central London and town centre zero emission zones from 2025, before creating a zero emission zone in inner London by 2040 and a London-wide zone by 2050 (Figure 15).
This proposal, including the vehicles and area it applies to, charge levels and hours of operation, discounts and exemptions or other restrictions, will be developed in the next few years. Schemes will be subject to statutory consultation before being introduced.
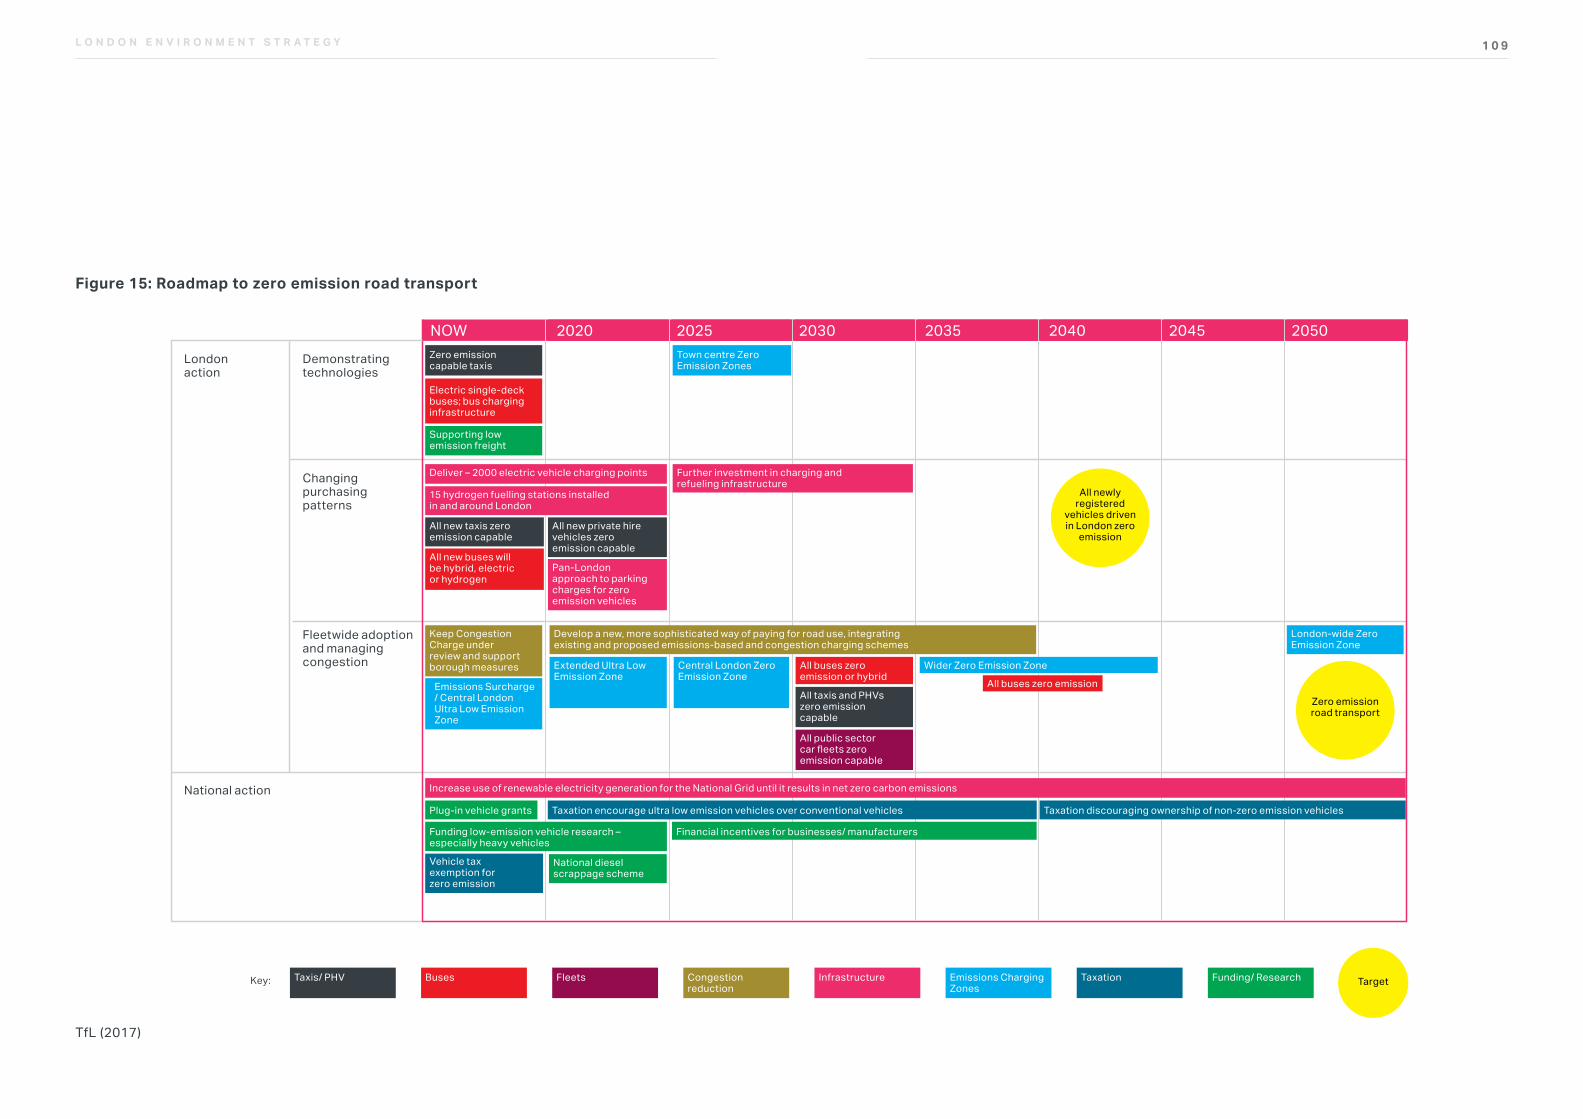
1 0 9L O N D O N E N V I R O N M E N T S T R A T E G Y
Figure 15: Roadmap to zero emission road transport
TYPE OF GRAPH: AIR QUALITY
Reference
Fig 30: Roadmap to zero emission road transport
Source: TfL (2017), Draft Mayor's Transport Strategy. Available at: www.london.gov.uk/what-we-do/transport/our-vision-transport/draft-mayors-transport-strategy-2017
NOW 2020 2025 2030 2035 2040 2045 2050
Londonaction
National action
Zero emissioncapable taxis
Town centre ZeroEmission Zones
Electric single-deckbuses; bus charginginfrastructure
Supporting lowemission freight
Deliver – 2000 electric vehicle charging points
Increase use of renewable electricity generation for the National Grid until it results in net zero carbon emissions
Further investment in charging and refueling infrastructure
15 hydrogen fuelling stations installedin and around London
All new taxis zeroemission capable
Plug-in vehicle grants
Funding low-emission vehicle research –especially heavy vehicles
Vehicle taxexemption forzero emission
National dieselscrappage scheme
Financial incentives for businesses/ manufacturers
Taxation encourage ultra low emission vehicles over conventional vehicles Taxation discouraging ownership of non-zero emission vehicles
All new buses willbe hybrid, electricor hydrogen
Keep CongestionCharge under review and supportborough measures
Emissions Surcharge/ Central London Ultra Low EmissionZone
Develop a new, more sophisticated way of paying for road use, integrating existing and proposed emissions-based and congestion charging schemes
London-wide ZeroEmission Zone
Extended Ultra LowEmission Zone
Central London ZeroEmission Zone
All buses zeroemission or hybrid
Wider Zero Emission Zone
All buses zero emissionAll taxis and PHVszero emissioncapable
All public sector car fleets zeroemission capable
All new private hirevehicles zeroemission capable
Pan-London approach to parkingcharges for zeroemission vehicles
Demonstratingtechnologies
Changingpurchasingpatterns
Fleetwide adoptionand managingcongestion
All newlyregistered
vehicles drivenin London zero
emission
Zero emissionroad transport
Key: Taxis/ PHV Buses Fleets Congestionreduction
Infrastructure Emissions ChargingZones
Taxation Funding/ Research Target
TfL (2017)
1 1 1L O N D O N E N V I R O N M E N T S T R A T E G Y
Proposal 4.3.2e The Mayor will work with the industry and other partners to seek solutions to reduce emissions from tyre and brake wear
By 2030, an estimated 90 per cent of PM emissions from road transport will be from tyre and brake wear.16 If PM2.5 levels are to be improved, this needs to be significantly reduced.
The first step to achieving this will be a reduction in total vehicle kilometres by supporting a shift to walking, cycling and public transport and more efficient delivery and servicing. Promoting more efficient eco-driving can also help. New technologies, including the use of properly designed regenerative braking have the potential to reduce emissions. The Mayor, working with government, manufacturers and other partners will support and accelerate research into the development and uptake of technologies to tackle tyre and brake wear. This includes regenerative braking, and providing advice on more efficient driving.
Policy 4.3.3 Phase out the use of fossil fuels to heat, cool and maintain London’s buildings, homes and urban spaces and reduce the impact of building emissions on air quality
Proposal 4.3.3a Through the new London Plan, the Mayor will consider policies so that all new large-scale developments in London are ‘Air Quality Positive’, and maintain Air Quality Neutral requirements for all other developments
London’s growth and redevelopment should contribute to delivering improvements in air quality now and into the future.
All major developments are already, and will continue to be, required to be Air Quality Neutral. Emission benchmarks have been produced for buildings’ operations and transport requirements based on the latest technology (including its effectiveness and viability). Developments that meet or improve on these benchmarks are considered to avoid any increase in NOx and PM
16 London Atmospheric Emissions Inventory 2013
emissions across London as a whole and are therefore ‘Air Quality Neutral’. By ensuring major developments meet this minimum requirement London’s growth can be accommodated without undoing other improvements in air quality. The Mayor will continue to keep these benchmarks under review to ensure that they remain fit for purpose.
Larger developments have the potential to go further and boost local air quality by effective design and integration into the surrounding area. For instance by the provision of low or zero emission heating and energy, or improvements to public transport, walking and cycling infrastructure, Air Quality Positive developments will make sure that emissions and exposure to pollution are reduced.
The Mayor will provide guidance for developers on the most effective approach to take to ensure a development is Air Quality Positive and will review and update the guidance as required. This will ensure the best approaches to Air Quality Positive development are used in London.
Proposal 4.3.3b Through the new London Plan, the Mayor will consider new policies on heat and power provision to make sure CO2 and pollution targets are achieved in a coordinated way with no air quality disbenefits
The Mayor has set ambitious long-term targets to both reduce harmful pollution emissions and to become a zero carbon city. In the past, some policies have had the result of addressing one of these issues to the detriment of the other. The Mayor’s energy policies will take a holistic approach to overall emissions while ensuring no air quality disbenefits.
Through the London Plan the Mayor will consider a hierarchy for energy systems that contributes towards improving air quality. In particular, while combined heat and power systems (CHP) can have benefits in terms of carbon emissions, gas engine CHP plant usually gives rise to higher emissions of NOx and/or PM10 emissions than ultra-low NOx gas boilers, even when abatement equipment is used.
1 1 3L O N D O N E N V I R O N M E N T S T R A T E G Y
Therefore in preparing his London Plan, the Mayor will consider whether, in areas which exceed legal air quality limits, the policy should prevent emissions from energy production plant, including from CHP, that would exceed those of an ultra-low NOx gas boiler. Energy production plant used in other areas should meet all relevant emission standards (which may require abatement equipment) as considered by the new London Plan, as well as not causing unacceptable local impacts on air quality.
To better understand the pollution impact of existing CHP systems in London the Mayor will develop a new CHP register which will be reflected in future versions of the London Atmospheric Emissions Inventory.
Proposal 4.3.3c The Mayor, working with London’s boroughs and other partners, will seek to reduce emissions from wood and other solid fuel burning in London
Wood burning stoves have become increasingly popular in recent years. These small stoves are not generally subject to planning controls. Wood burning in urban areas can contribute significantly to local pollution. Nearly all London boroughs have declared their whole areas to be Smoke Control Zones, under the Clean Air Act 1993. Wood and
coal are not allowed to be burnt as a fuel in these areas, unless the appliance being used has been tested to ensure that it can burn wood without creating smoke. Defra maintains a register of ‘exempt’ appliances on its website, but it is thought that many Londoners are unaware that they live in a Smoke Control Zone and are installing non-exempt appliances.
The Mayor will work with manufacturers and suppliers to ensure the right information is given to Londoners at the point of sale to ensure only the cleanest appliances and fuels are used. At the same time borough councils will be encouraged to enforce the existing rules on the use and sale of smokeless fuels and exempt appliances. The Mayor will work with Defra to ensure that the rules are kept up to date and as simple as possible to comply with. This could include banning the sale of non-smokeless fuels in London or improved labelling.
The Mayor will also continue to work with Defra to improve the standards and testing for smokeless fuels and exempt appliances to make sure they are effective at reducing emissions of particulate matter. Where new standards, such as ‘ecolabel ready’ come into force the Mayor will seek to make sure that they are introduced as rapidly as possible in London.
Policy 4.3.4 Work to reduce exposure to indoor air pollutants in the home, schools, workplace and other enclosed spaces
Proposal 4.3.4a The Mayor, through educational materials, campaigns and the planning system will raise awareness about indoor air quality
People spend a large part of their life at homes, offices, schools, day care centres, public buildings, health care facilities or other private and public buildings. That is why the quality of indoor air is an essential factor of healthy life and people’s wellbeing. Anyone can potentially be affected by poor indoor air quality but some groups are more vulnerable to the health effects of that exposure, for example, the elderly or children or those with pre-existing health conditions.
The statutory air quality standards cover only outdoor (ambient) air quality. However, outdoor air pollution enters the buildings through the building envelope (including windows and doors) or via the ventilation system. Many studies showed that there is a link between the outdoor concentrations of NO2 and PM and indoor air quality, especially in areas with poor air quality. There are also indoor sources of pollution which contribute to poor indoor air quality.
The Mayor will work with partners to develop protocols and tools for planners and the building design industry to improve indoor air quality in existing buildings. The Mayor will also work with partners to develop understanding and raise awareness about the issues of indoor air quality in London.
Proposal 4.3.4b The Mayor, through TfL, will conduct further research into the health risks of particulate matter on the London Underground network and take appropriate measures to mitigate the adverse effects of any risks found where practicable
Improving London’s air quality extends to the London Underground network. Comprehensive research has concluded that concentrations of particulate matter (PM) – caused in part by train wheel and brake wear – are high in some parts of the Tube network. This PM is, however, of a very different composition to the air above ground. The increasing use of electric braking systems and regular cleaning on the network help to reduce concentration levels.
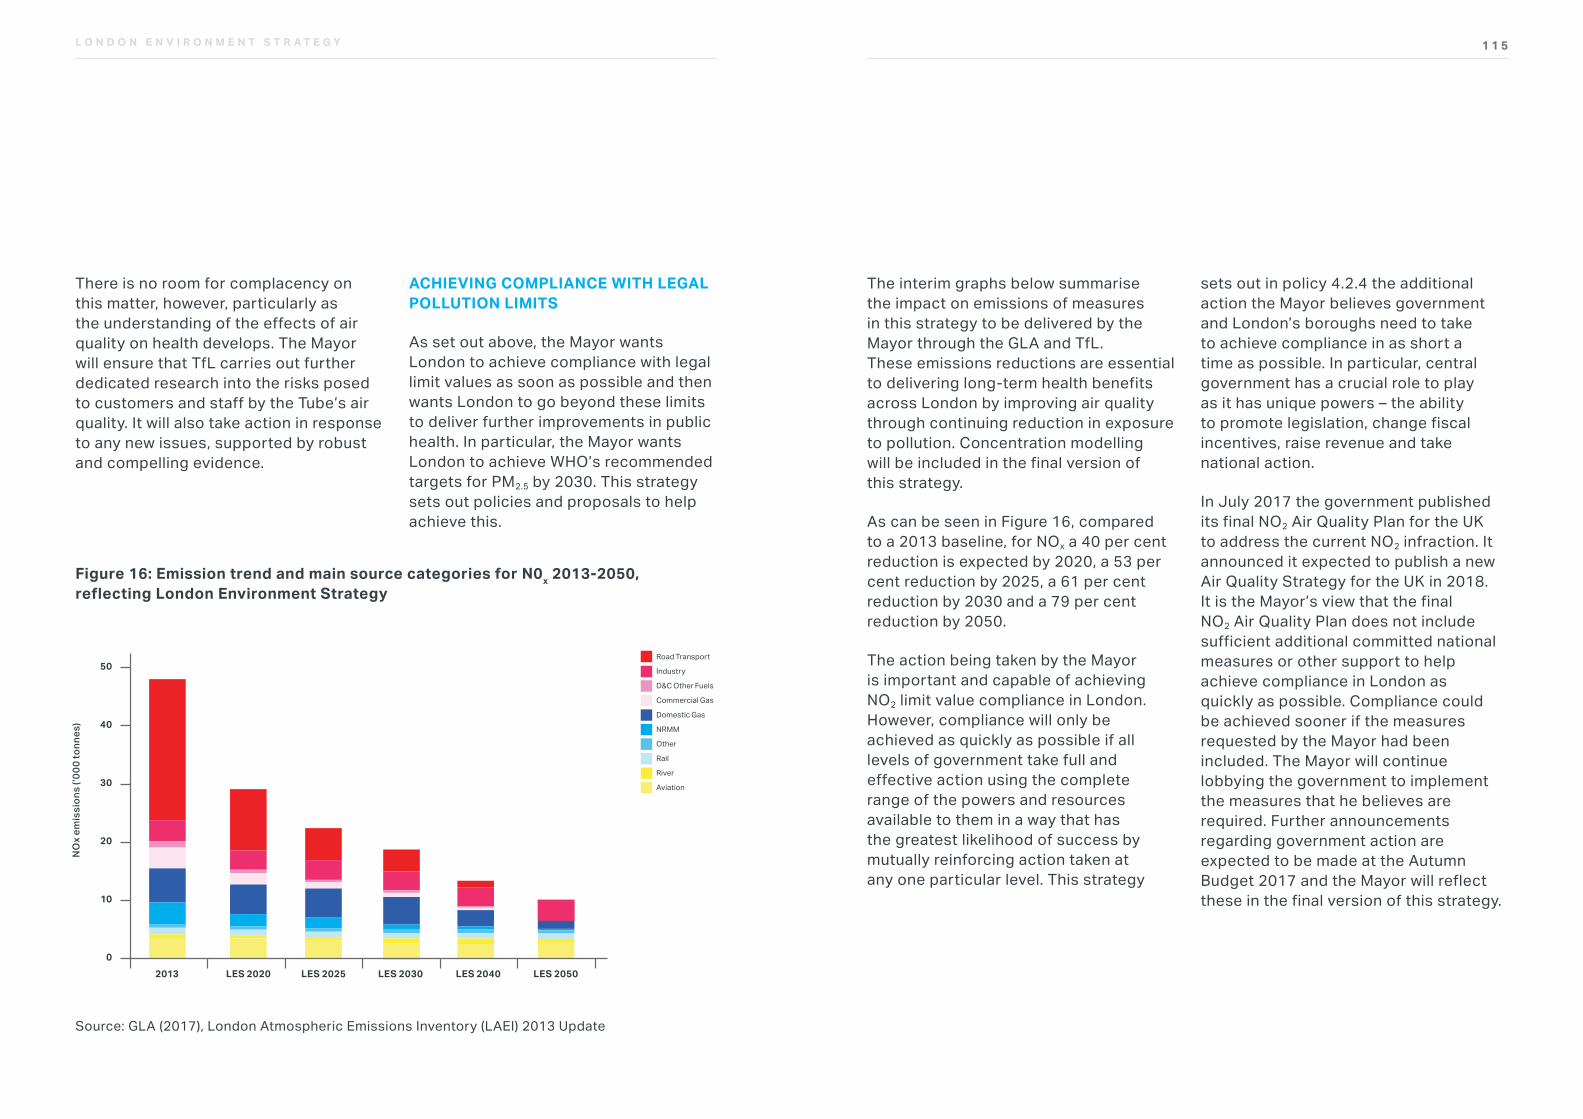
1 1 5L O N D O N E N V I R O N M E N T S T R A T E G Y
There is no room for complacency on this matter, however, particularly as the understanding of the effects of air quality on health develops. The Mayor will ensure that TfL carries out further dedicated research into the risks posed to customers and staff by the Tube’s air quality. It will also take action in response to any new issues, supported by robust and compelling evidence.
ACHIEVING COMPLIANCE WITH LEGAL POLLUTION LIMITS
As set out above, the Mayor wants London to achieve compliance with legal limit values as soon as possible and then wants London to go beyond these limits to deliver further improvements in public health. In particular, the Mayor wants London to achieve WHO’s recommended targets for PM2.5 by 2030. This strategy sets out policies and proposals to help achieve this.
Figure 16: Emission trend and main source categories for N0x 2013-2050, reflecting London Environment Strategy
TYPE OF GRAPH: AIR QUALITY
Reference
Fig xx: xx
Source: GLA (2016), London Atmospheric Emissions Inventory (LAEI) 2013. Available at: data.london.gov.uk/dataset/london-atmspheric-emissions-inventory-2013
Road Transport
Industry
D&C Other Fuels
Commercial Gas
Domestic Gas
NRMM
Other
Rail
River
Aviation
50
40
30
20
10
02013 LES 2020 LES 2025 LES 2030 LES 2040 LES 2050
NO
x em
issi
ons
(’000
tonn
es)
Source: GLA (2017), London Atmospheric Emissions Inventory (LAEI) 2013 Update
The interim graphs below summarise the impact on emissions of measures in this strategy to be delivered by the Mayor through the GLA and TfL. These emissions reductions are essential to delivering long-term health benefits across London by improving air quality through continuing reduction in exposure to pollution. Concentration modelling will be included in the final version of this strategy.
As can be seen in Figure 16, compared to a 2013 baseline, for NOx a 40 per cent reduction is expected by 2020, a 53 per cent reduction by 2025, a 61 per cent reduction by 2030 and a 79 per cent reduction by 2050.
The action being taken by the Mayor is important and capable of achieving NO2 limit value compliance in London. However, compliance will only be achieved as quickly as possible if all levels of government take full and effective action using the complete range of the powers and resources available to them in a way that has the greatest likelihood of success by mutually reinforcing action taken at any one particular level. This strategy
sets out in policy 4.2.4 the additional action the Mayor believes government and London’s boroughs need to take to achieve compliance in as short a time as possible. In particular, central government has a crucial role to play as it has unique powers – the ability to promote legislation, change fiscal incentives, raise revenue and take national action.
In July 2017 the government published its final NO2 Air Quality Plan for the UK to address the current NO2 infraction. It announced it expected to publish a new Air Quality Strategy for the UK in 2018. It is the Mayor’s view that the final NO2 Air Quality Plan does not include sufficient additional committed national measures or other support to help achieve compliance in London as quickly as possible. Compliance could be achieved sooner if the measures requested by the Mayor had been included. The Mayor will continue lobbying the government to implement the measures that he believes are required. Further announcements regarding government action are expected to be made at the Autumn Budget 2017 and the Mayor will reflect these in the final version of this strategy.
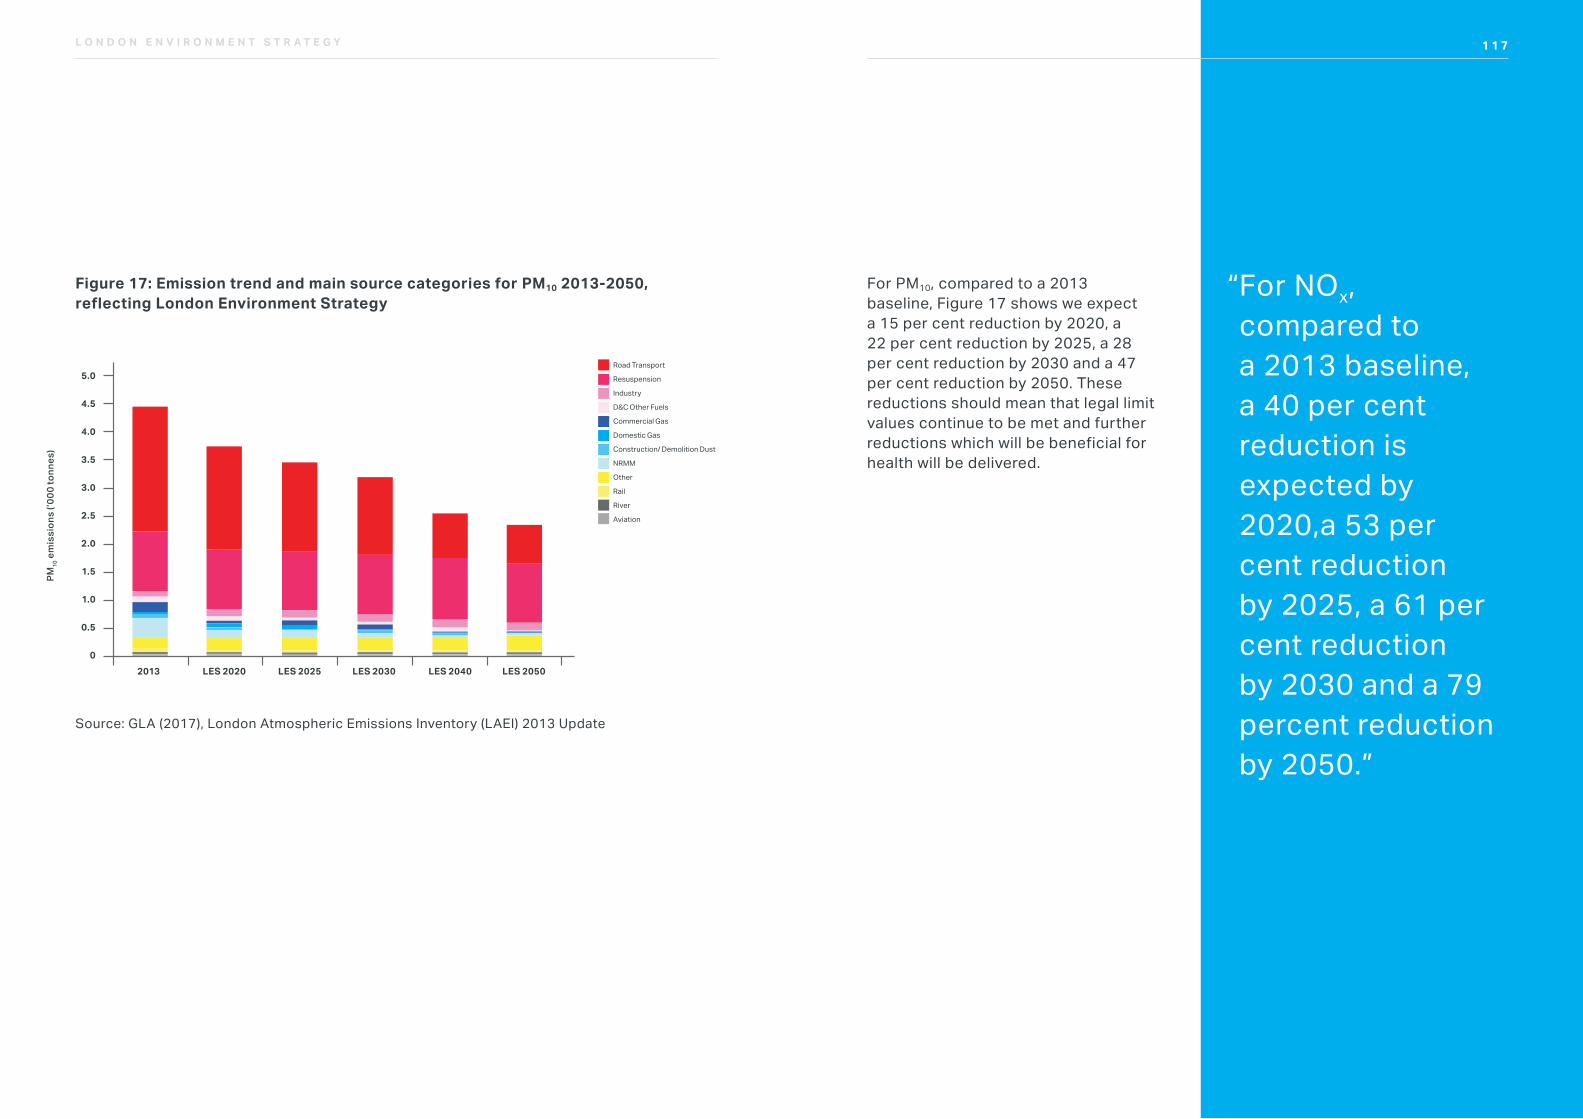
1 1 7L O N D O N E N V I R O N M E N T S T R A T E G Y
Figure 17: Emission trend and main source categories for PM10 2013-2050, reflecting London Environment Strategy
For PM10, compared to a 2013 baseline, Figure 17 shows we expect a 15 per cent reduction by 2020, a 22 per cent reduction by 2025, a 28 per cent reduction by 2030 and a 47 per cent reduction by 2050. These reductions should mean that legal limit values continue to be met and further reductions which will be beneficial for health will be delivered.
“ For NOx, compared to a 2013 baseline, a 40 per cent reduction is expected by 2020,a 53 per cent reduction by 2025, a 61 per cent reduction by 2030 and a 79 percent reduction by 2050.”
1 1 7
Source: GLA (2017), London Atmospheric Emissions Inventory (LAEI) 2013 Update
5.0
4.5
3.0
2.5
2.0
1.5
1.0
0.5
4.0
3.5
02013 LES 2020 LES 2025 LES 2030 LES 2040 LES 2050
PM10
em
issi
ons
(’000
tonn
es)
TYPE OF GRAPH: AIR QUALITY
Reference
Fig xx: xxv
Source: GLA (2016), London Atmospheric Emissions Inventory (LAEI) 2013. Available at: data.london.gov.uk/dataset/london-atmspheric-emissions-inventory-2013
Road Transport
Resuspension
Industry
D&C Other Fuels
Commercial Gas
Domestic Gas
Construction/ Demolition Dust
NRMM
Other
Rail
River
Aviation
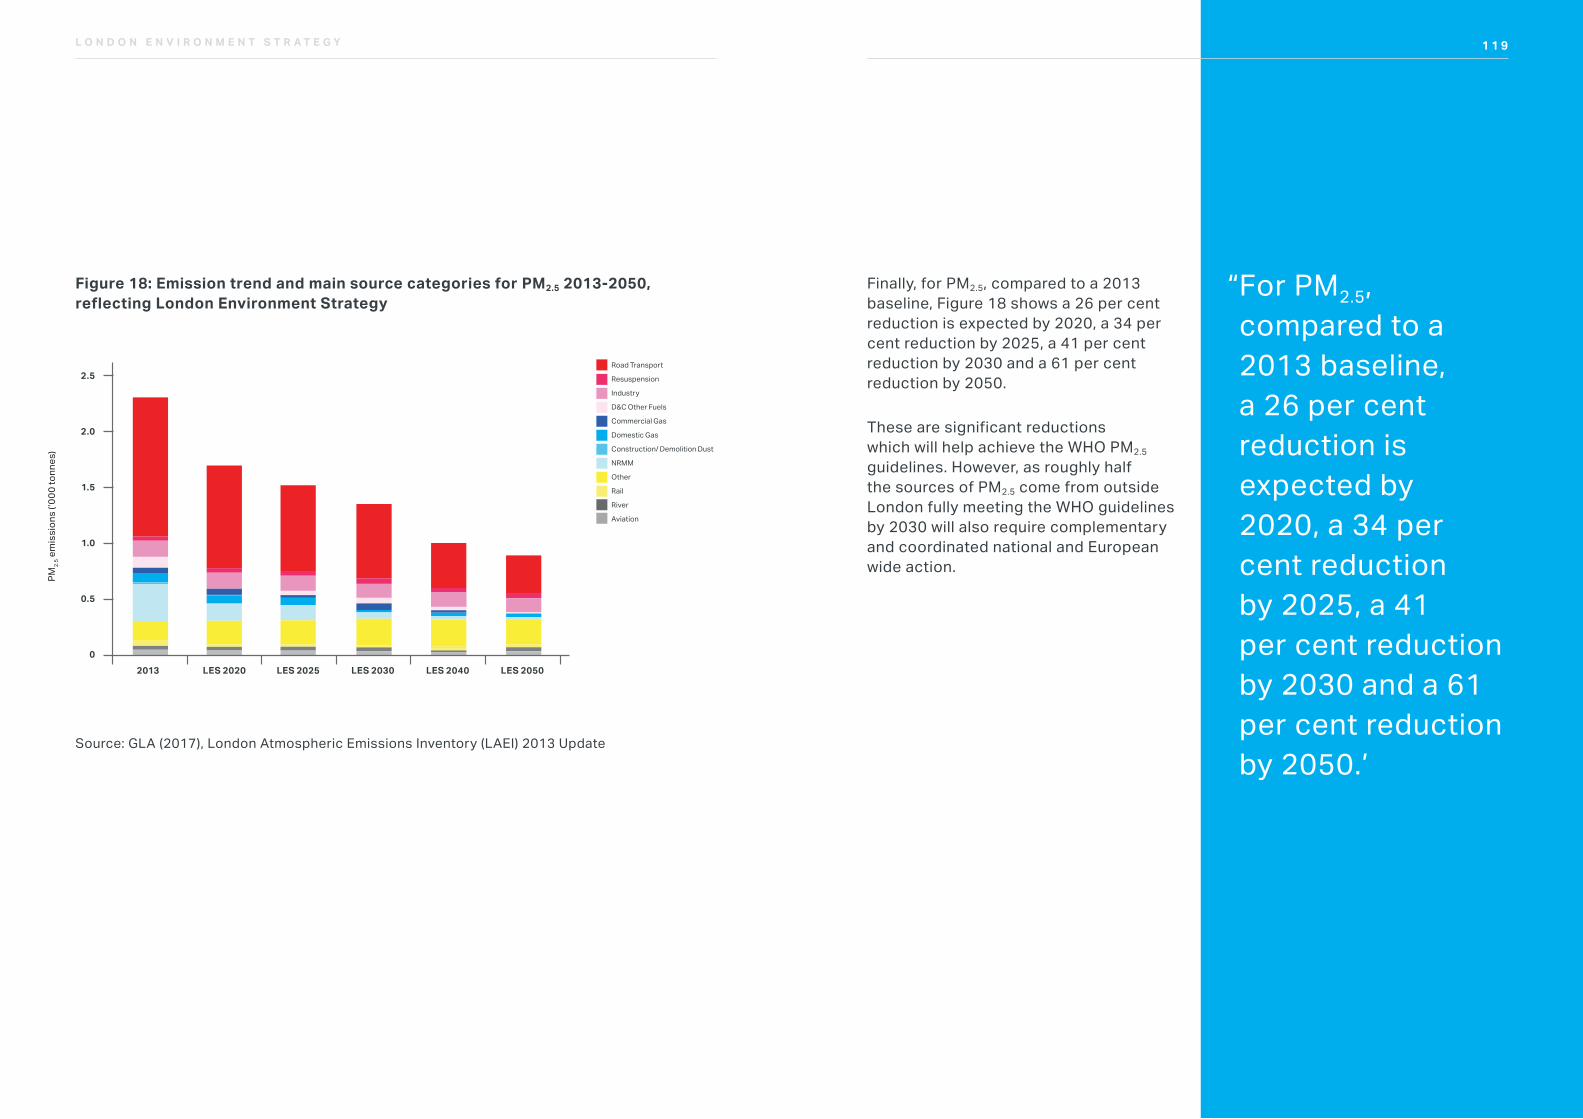
1 1 9L O N D O N E N V I R O N M E N T S T R A T E G Y
Figure 18: Emission trend and main source categories for PM2.5 2013-2050, reflecting London Environment Strategy
Finally, for PM2.5, compared to a 2013 baseline, Figure 18 shows a 26 per cent reduction is expected by 2020, a 34 per cent reduction by 2025, a 41 per cent reduction by 2030 and a 61 per cent reduction by 2050.
These are significant reductions which will help achieve the WHO PM2.5 guidelines. However, as roughly half the sources of PM2.5 come from outside London fully meeting the WHO guidelines by 2030 will also require complementary and coordinated national and European wide action.
“ For PM2.5, compared to a 2013 baseline, a 26 per cent reduction is expected by 2020, a 34 per cent reduction by 2025, a 41 per cent reduction by 2030 and a 61 per cent reduction by 2050.’
1 1 9
Source: GLA (2017), London Atmospheric Emissions Inventory (LAEI) 2013 Update
TYPE OF GRAPH: AIR QUALITY
Reference
Fig xx: xxv
PM2.
5 em
issi
ons
(’000
tonn
es)
Source: GLA (2016), London Atmospheric Emissions Inventory (LAEI) 2013. Available at: data.london.gov.uk/dataset/london-atmspheric-emissions-inventory-2013
Road Transport
Resuspension
Industry
D&C Other Fuels
Commercial Gas
Domestic Gas
Construction/ Demolition Dust
NRMM
Other
Rail
River
Aviation
2.5
2.0
1.5
1.0
0.5
02013 LES 2020 LES 2025 LES 2030 LES 2040 LES 2050

1 2 1L O N D O N E N V I R O N M E N T S T R A T E G YL O N D O N E N V I R O N M E N T S T R A T E G Y
QCONSULTATION QUESTIONS: AIR QUALITY
1. Do you agree that the policies and proposals outlined will meet the Mayor’s ambitions for air quality in London and zero emission transport by 2050? Is the proposed approach and pace realistic and achievable, and what further powers might be required?
2. Do you agree with the Mayor’s policies and proposals to raise Londoners’ awareness of the impacts of poor air quality?
3. Do you agree with the Mayor’s policies and proposals to safeguard the most vulnerable from poor air quality?
4. Would you support emergency measures, such as short-term road closures or vehicle restriction, during the periods of worst air pollution (normally once or twice a year)?
5. Do you agree with the proposed approach to reducing emissions from non-transport sources (including new buildings, construction equipment, rail and river vehicles and solid fuel burning)?
6. Please provide any further comments on the policies and programmes mentioned in this chapter.
london.gov.uk/environment-strategy
1 2 3L O N D O N E N V I R O N M E N T S T R A T E G Y
Chapter 5: Green infrastructure
1 2 3
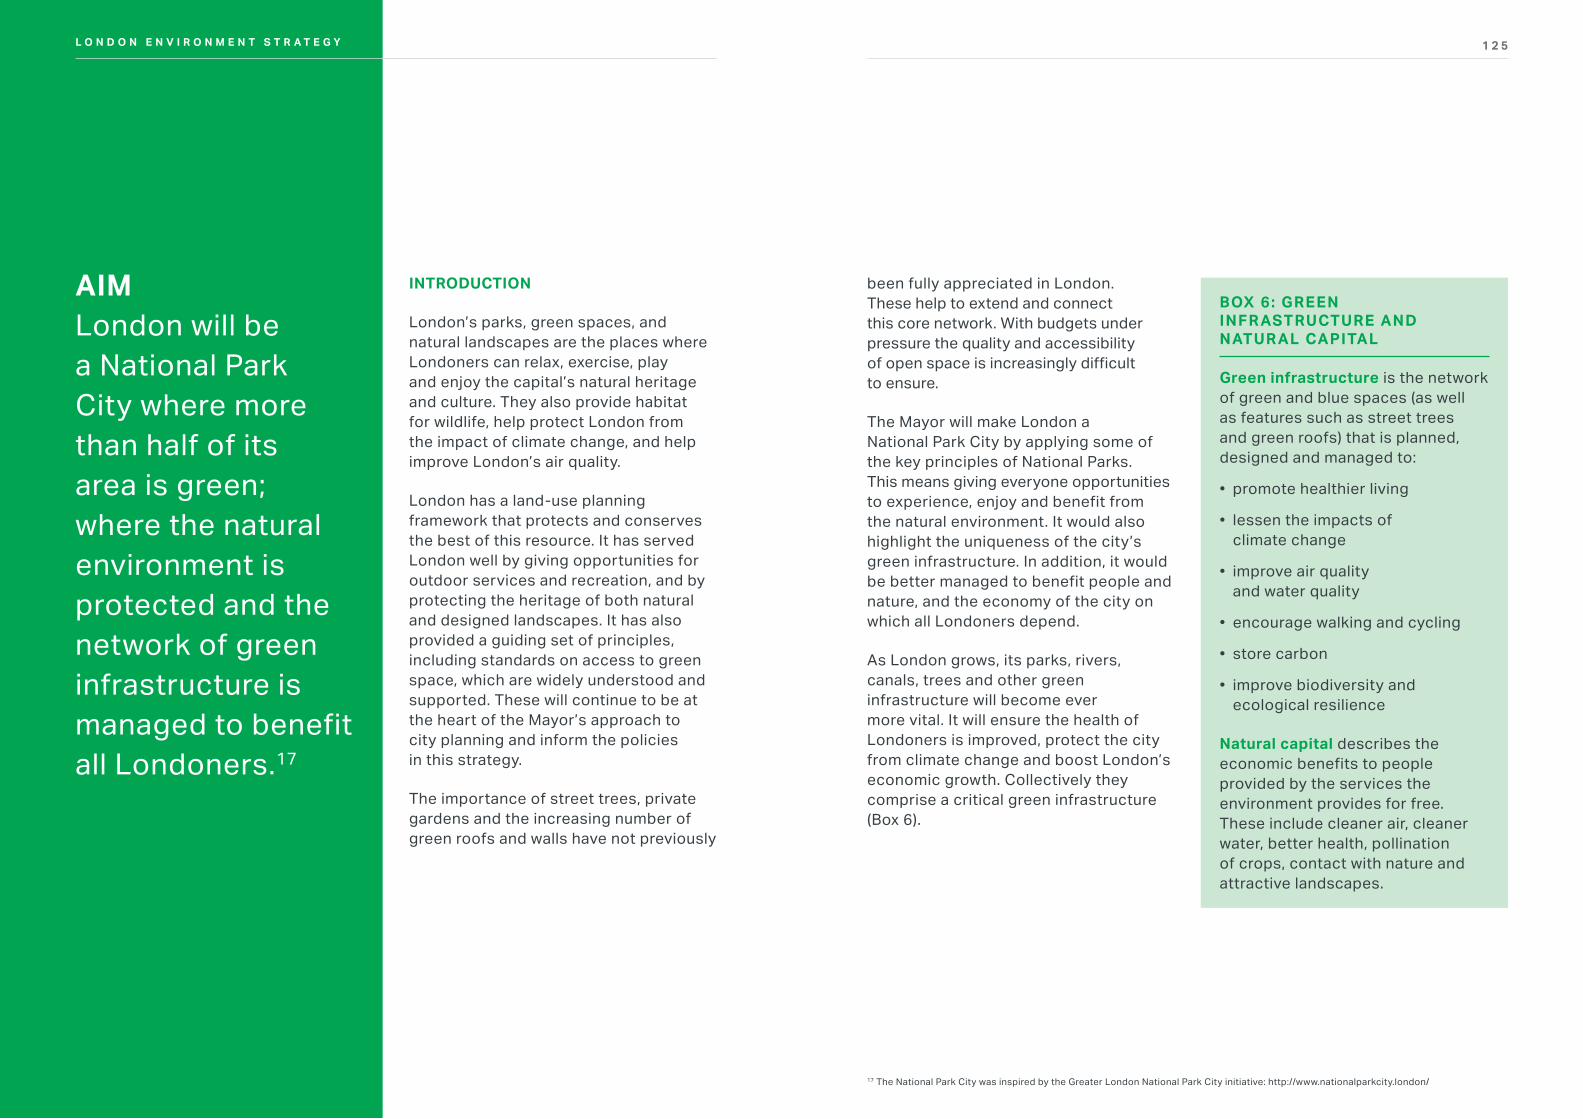
1 2 5L O N D O N E N V I R O N M E N T S T R A T E G Y
INTRODUCTION
London’s parks, green spaces, and natural landscapes are the places where Londoners can relax, exercise, play and enjoy the capital’s natural heritage and culture. They also provide habitat for wildlife, help protect London from the impact of climate change, and help improve London’s air quality.
London has a land-use planning framework that protects and conserves the best of this resource. It has served London well by giving opportunities for outdoor services and recreation, and by protecting the heritage of both natural and designed landscapes. It has also provided a guiding set of principles, including standards on access to green space, which are widely understood and supported. These will continue to be at the heart of the Mayor’s approach to city planning and inform the policies in this strategy.
The importance of street trees, private gardens and the increasing number of green roofs and walls have not previously
AIM London will be a National Park City where more than half of its area is green; where the natural environment is protected and the network of green infrastructure is managed to benefit all Londoners.17
L O N D O N E N V I R O N M E N T S T R A T E G Y
been fully appreciated in London. These help to extend and connect this core network. With budgets under pressure the quality and accessibility of open space is increasingly difficult to ensure.
The Mayor will make London a National Park City by applying some of the key principles of National Parks. This means giving everyone opportunities to experience, enjoy and benefit from the natural environment. It would also highlight the uniqueness of the city’s green infrastructure. In addition, it would be better managed to benefit people and nature, and the economy of the city on which all Londoners depend.
As London grows, its parks, rivers, canals, trees and other green infrastructure will become ever more vital. It will ensure the health of Londoners is improved, protect the city from climate change and boost London’s economic growth. Collectively they comprise a critical green infrastructure (Box 6).
17 The National Park City was inspired by the Greater London National Park City initiative: http://www.nationalparkcity.london/
BOX 6: GREEN INFR ASTRUCTURE AND NATUR AL CAPITAL
Green infrastructure is the network of green and blue spaces (as well as features such as street trees and green roofs) that is planned, designed and managed to:
• promote healthier living
• lessen the impacts of climate change
• improve air quality and water quality
• encourage walking and cycling
• store carbon
• improve biodiversity and ecological resilience
Natural capital describes the economic benefits to people provided by the services the environment provides for free. These include cleaner air, cleaner water, better health, pollination of crops, contact with nature and attractive landscapes.
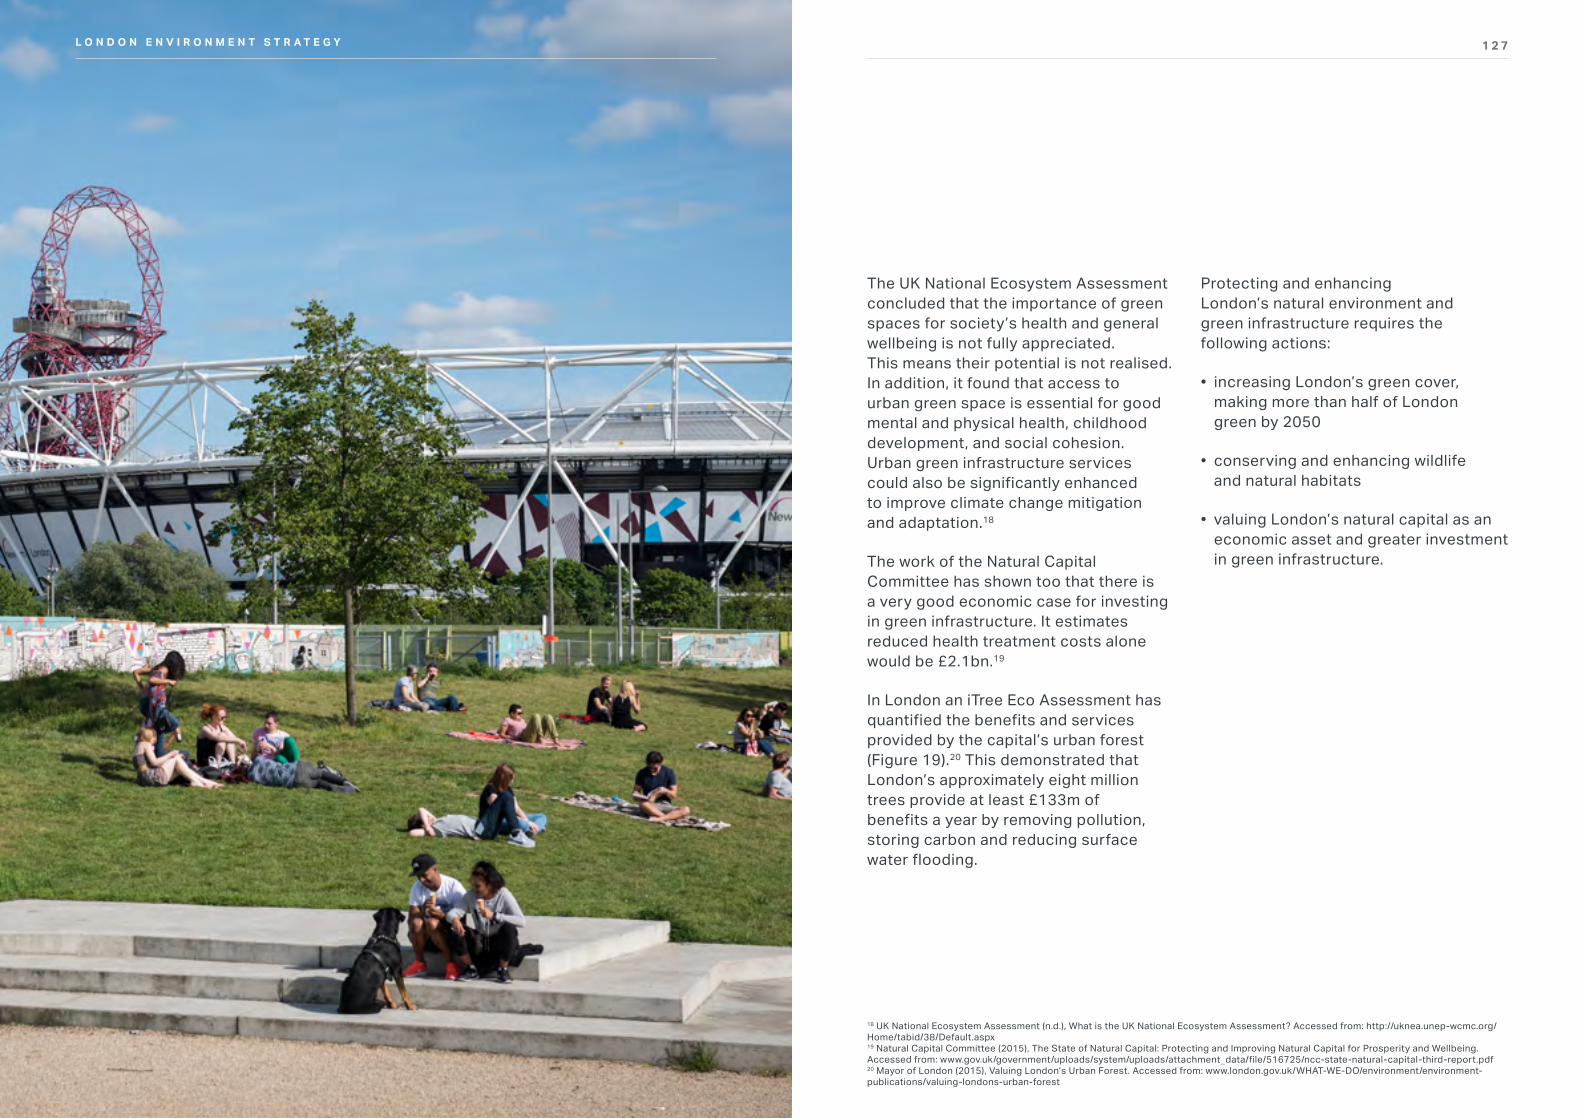
1 2 7L O N D O N E N V I R O N M E N T S T R A T E G YL O N D O N E N V I R O N M E N T S T R A T E G Y
18 UK National Ecosystem Assessment (n.d.), What is the UK National Ecosystem Assessment? Accessed from: http://uknea.unep-wcmc.org/Home/tabid/38/Default.aspx19 Natural Capital Committee (2015), The State of Natural Capital: Protecting and Improving Natural Capital for Prosperity and Wellbeing. Accessed from: www.gov.uk/government/uploads/system/uploads/attachment_data/file/516725/ncc-state-natural-capital-third-report.pdf20 Mayor of London (2015), Valuing London’s Urban Forest. Accessed from: www.london.gov.uk/WHAT-WE-DO/environment/environment-publications/valuing-londons-urban-forest
The UK National Ecosystem Assessment concluded that the importance of green spaces for society’s health and general wellbeing is not fully appreciated. This means their potential is not realised. In addition, it found that access to urban green space is essential for good mental and physical health, childhood development, and social cohesion. Urban green infrastructure services could also be significantly enhanced to improve climate change mitigation and adaptation.18
The work of the Natural Capital Committee has shown too that there is a very good economic case for investing in green infrastructure. It estimates reduced health treatment costs alone would be £2.1bn.19
In London an iTree Eco Assessment has quantified the benefits and services provided by the capital’s urban forest (Figure 19).20 This demonstrated that London’s approximately eight million trees provide at least £133m of benefits a year by removing pollution, storing carbon and reducing surface water flooding.
Protecting and enhancing London’s natural environment and green infrastructure requires the following actions:
• increasing London’s green cover, making more than half of London green by 2050
• conserving and enhancing wildlife and natural habitats
• valuing London’s natural capital as an economic asset and greater investment in green infrastructure.
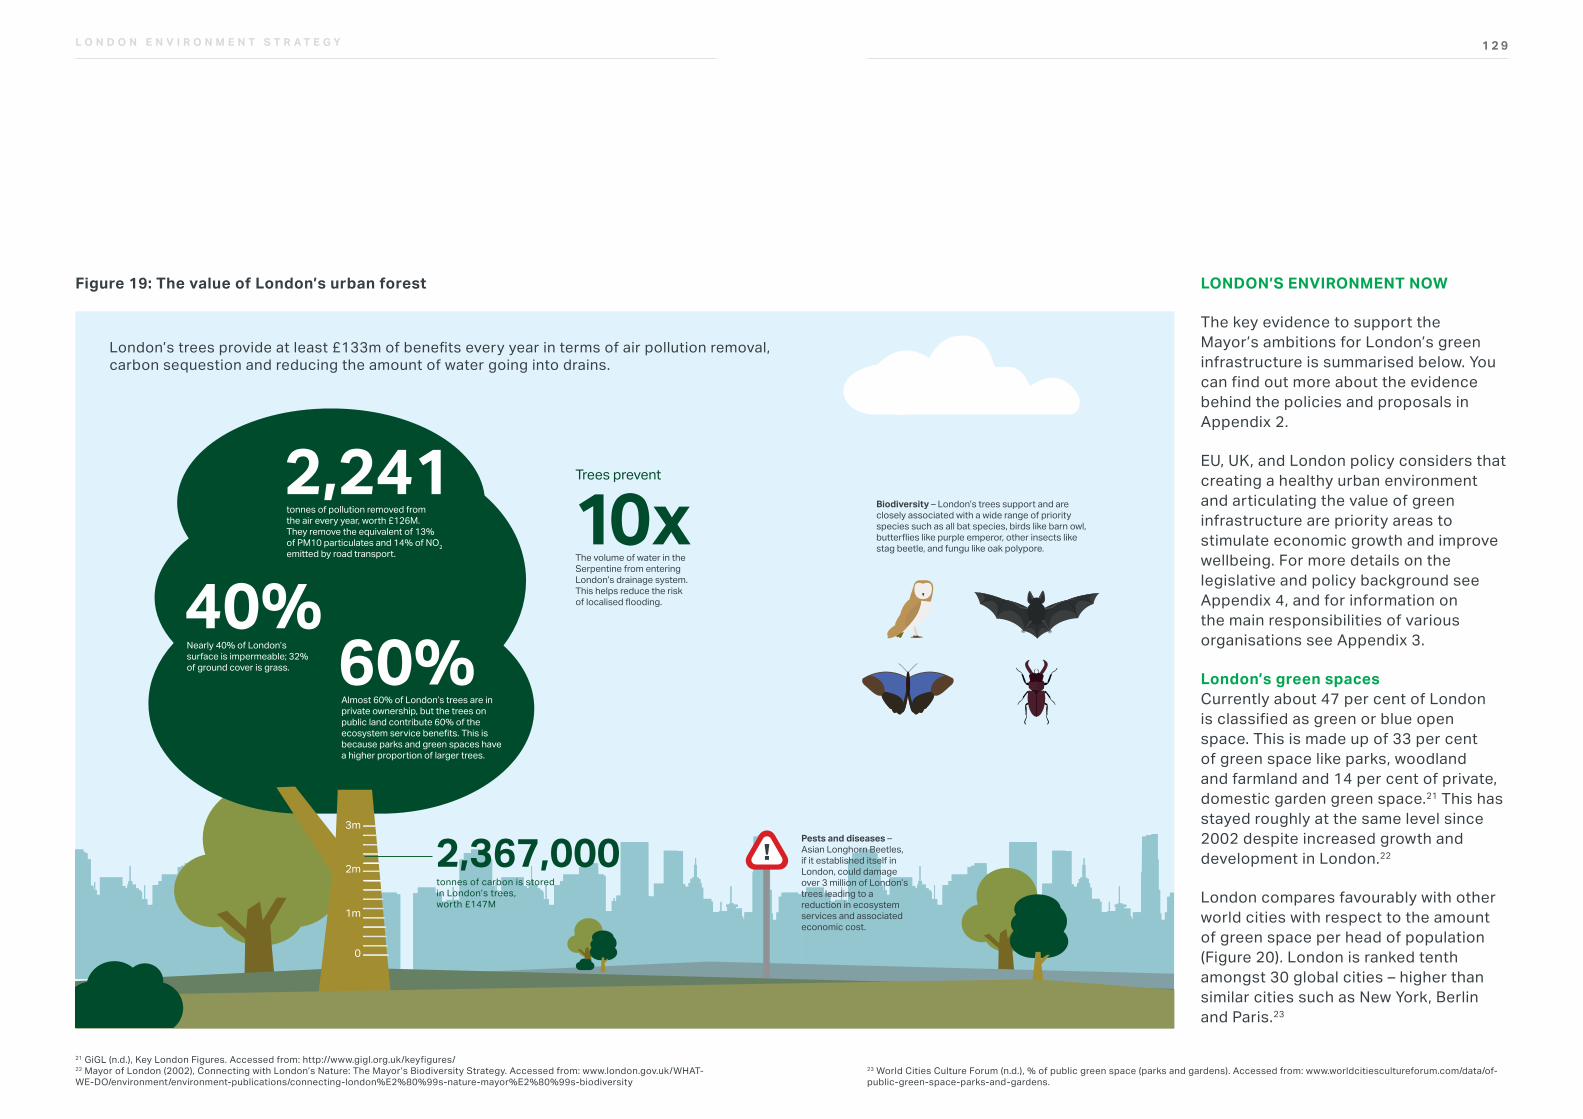
1 2 9L O N D O N E N V I R O N M E N T S T R A T E G Y
Figure 19: The value of London’s urban forest
21 GiGL (n.d.), Key London Figures. Accessed from: http://www.gigl.org.uk/keyfigures/ 22 Mayor of London (2002), Connecting with London’s Nature: The Mayor’s Biodiversity Strategy. Accessed from: www.london.gov.uk/WHAT-WE-DO/environment/environment-publications/connecting-london%E2%80%99s-nature-mayor%E2%80%99s-biodiversity
London’s trees provide at least £133m of benefits every year in terms of air pollution removal,carbon sequestion and reducing the amount of water going into drains.
60%
2,367,000
2,241
40%Almost 60% of London’s trees are inprivate ownership, but the trees on public land contribute 60% of theecosystem service benefits. This isbecause parks and green spaces havea higher proportion of larger trees.
tonnes of pollution removed fromthe air every year, worth £126M.They remove the equivalent of 13%of PM10 particulates and 14% of NO2emitted by road transport.
Nearly 40% of London’s surface is impermeable; 32%of ground cover is grass.
tonnes of carbon is stored in London’s trees,worth £147M
10xTrees prevent
The volume of water in the Serpentine from enteringLondon’s drainage system.This helps reduce the riskof localised flooding.
Biodiversity – London’s trees support and areclosely associated with a wide range of priorityspecies such as all bat species, birds like barn owl,butterflies like purple emperor, other insects likestag beetle, and fungu like oak polypore.
Pests and diseases –Asian Longhorn Beetles,if it established itself inLondon, could damageover 3 million of London’strees leading to a reduction in ecosystemservices and associated economic cost.
3m
0
1m
2m
LONDON’S ENVIRONMENT NOW
The key evidence to support the Mayor’s ambitions for London’s green infrastructure is summarised below. You can find out more about the evidence behind the policies and proposals in Appendix 2.
EU, UK, and London policy considers that creating a healthy urban environment and articulating the value of green infrastructure are priority areas to stimulate economic growth and improve wellbeing. For more details on the legislative and policy background see Appendix 4, and for information on the main responsibilities of various organisations see Appendix 3.
London’s green spacesCurrently about 47 per cent of London is classified as green or blue open space. This is made up of 33 per cent of green space like parks, woodland and farmland and 14 per cent of private, domestic garden green space.21 This has stayed roughly at the same level since 2002 despite increased growth and development in London.22
London compares favourably with other world cities with respect to the amount of green space per head of population (Figure 20). London is ranked tenth amongst 30 global cities – higher than similar cities such as New York, Berlin and Paris.23
23 World Cities Culture Forum (n.d.), % of public green space (parks and gardens). Accessed from: www.worldcitiescultureforum.com/data/of-public-green-space-parks-and-gardens.
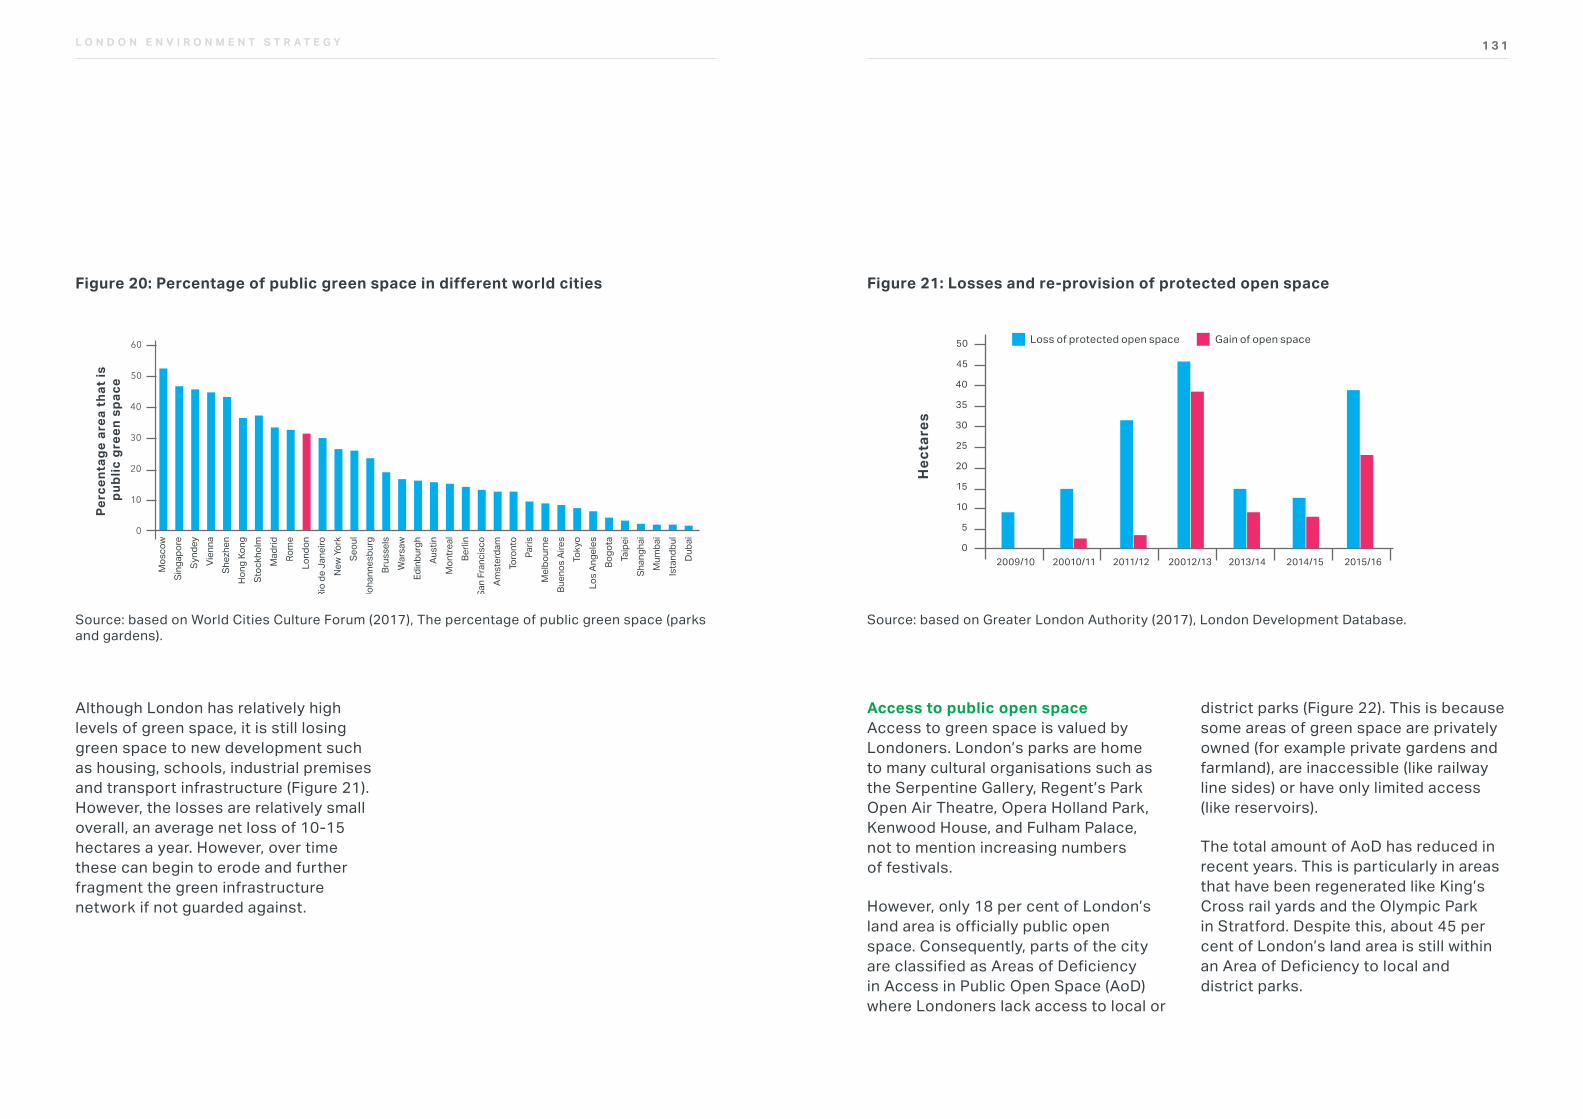
1 3 1L O N D O N E N V I R O N M E N T S T R A T E G Y
Although London has relatively high levels of green space, it is still losing green space to new development such as housing, schools, industrial premises and transport infrastructure (Figure 21). However, the losses are relatively small overall, an average net loss of 10-15 hectares a year. However, over time these can begin to erode and further fragment the green infrastructure network if not guarded against.
Figure 20: Percentage of public green space in different world citiesFig 3: The percentage of public green space in cities across the world
Source: based on World Cities Culture Forum (2017), The percentage of public green space (parks and gardens).
Available at: worldcitiescultureforum.com/data/of-public-green-space-parks-and-gardens
TYPE OF GRAPH: GREEN INFRASTRUCTURE
Reference
Perc
enta
ge a
rea
that
is
publ
ic g
reen
spa
ce
Mos
cow
Sing
apor
eSy
ndey
Vien
naSh
ezhe
nHo
ng K
ong
Stoc
khol
mM
adrid
Rom
eLo
ndon
Rio
de J
anei
roNe
w Yo
rkSe
oul
Joha
nnes
burg
Brus
sels
War
saw
Edin
burg
hAu
stin
Mon
treal
Berli
nSa
n Fr
anci
sco
Amst
erda
mTo
ront
oPa
risM
elbo
urne
Buen
os A
ires
Toky
oLo
s An
gele
sBo
gota
Taip
eiSh
angh
aiM
umba
iIs
tand
bul
Duba
i
10
30
20
40
50
60
0
Source: based on World Cities Culture Forum (2017), The percentage of public green space (parks and gardens).
Access to public open spaceAccess to green space is valued by Londoners. London’s parks are home to many cultural organisations such as the Serpentine Gallery, Regent’s Park Open Air Theatre, Opera Holland Park, Kenwood House, and Fulham Palace, not to mention increasing numbers of festivals.
However, only 18 per cent of London’s land area is officially public open space. Consequently, parts of the city are classified as Areas of Deficiency in Access in Public Open Space (AoD) where Londoners lack access to local or
district parks (Figure 22). This is because some areas of green space are privately owned (for example private gardens and farmland), are inaccessible (like railway line sides) or have only limited access (like reservoirs).
The total amount of AoD has reduced in recent years. This is particularly in areas that have been regenerated like King’s Cross rail yards and the Olympic Park in Stratford. Despite this, about 45 per cent of London’s land area is still within an Area of Deficiency to local and district parks.
Figure 21: Losses and re-provision of protected open spaceFig 4: The amount of open space lost and gained as a result of development in London
Source: based on Greater London Authority (2017), London Development Database.
Available at: london.gov.uk/what-we-do/planning/london-plan/london-development-database
TYPE OF GRAPH: GREEN INFRASTRUCTURE
Reference
Loss of protected open space Gain of open space
Hec
tare
s
10
30
20
40
50
5
25
15
35
45
02009/10 20010/11 2011/12 20012/13 2013/14 2014/15 2015/16
Source: based on Greater London Authority (2017), London Development Database.
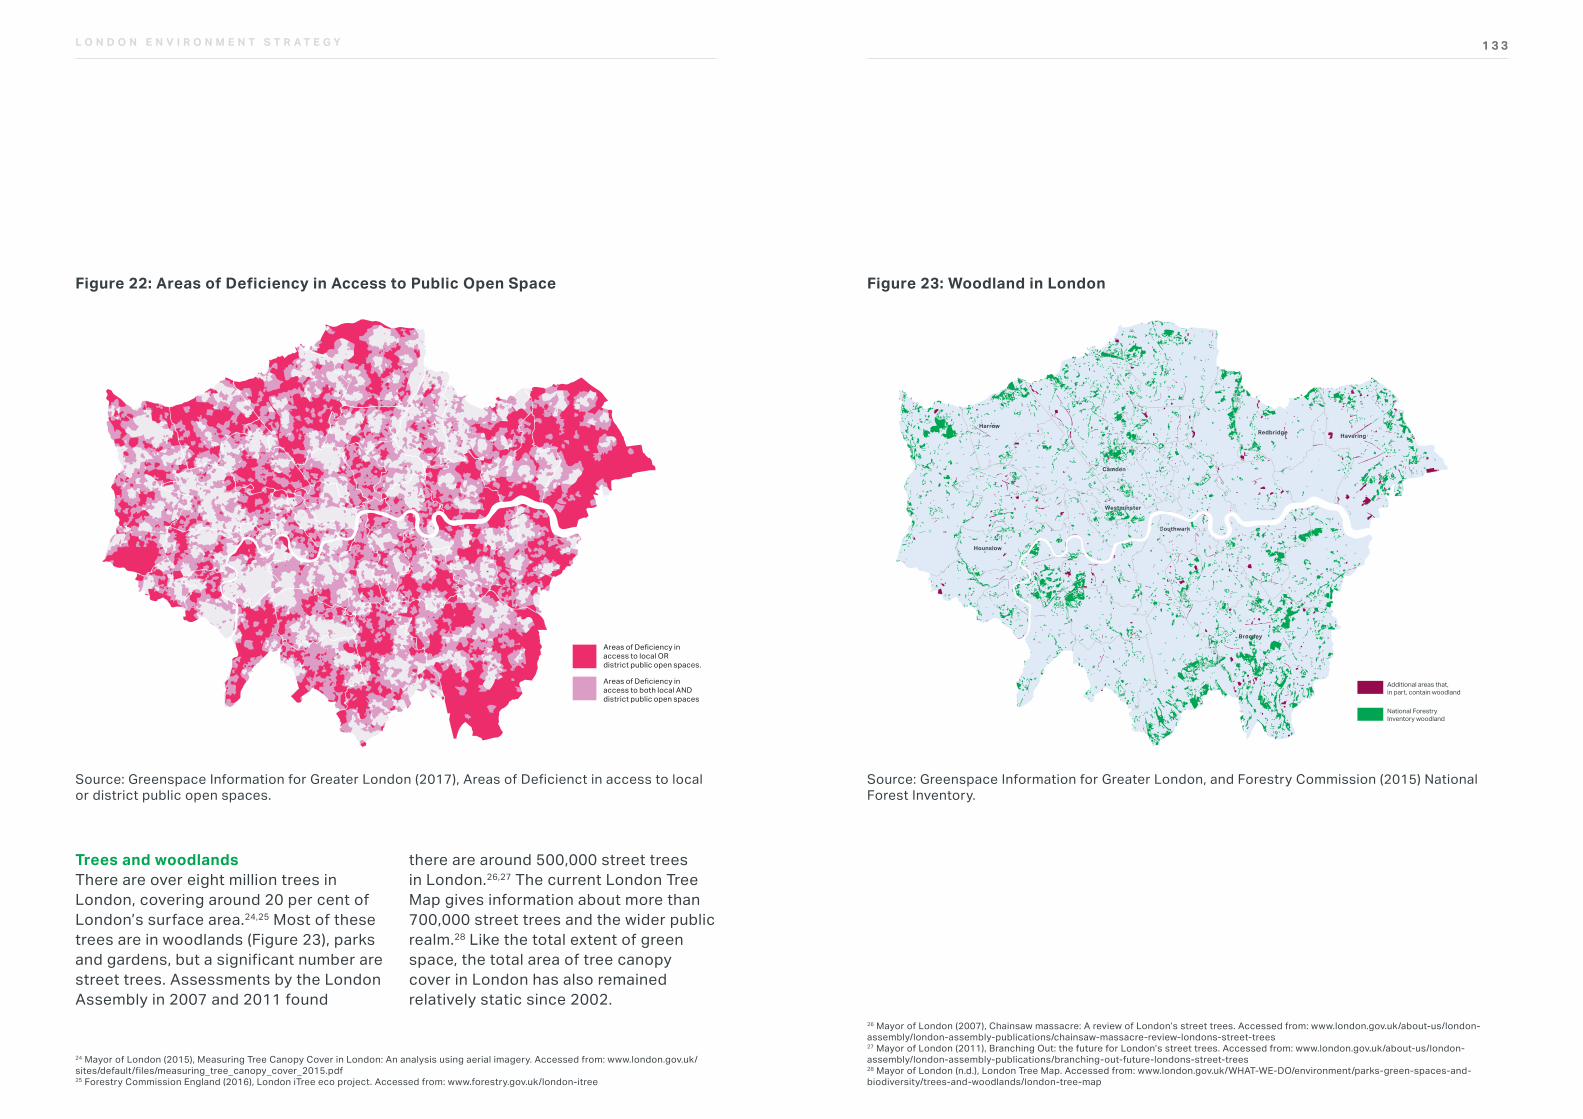
1 3 3L O N D O N E N V I R O N M E N T S T R A T E G Y
Figure 22: Areas of Deficiency in Access to Public Open SpaceFig 5: Areas of Defiency in Access to Open Space
Source: Greenspace Information for Greater London (2017), Areas of Deficienct in access to local or district public open spaces
TYPE OF GRAPH: GREEN INFRASTRUCTURE
Reference
Areas of Deficiency in access to local OR district public open spaces.
Areas of Deficiency inaccess to both local AND district public open spaces
Source: Greenspace Information for Greater London (2017), Areas of Deficienct in access to local or district public open spaces.
24 Mayor of London (2015), Measuring Tree Canopy Cover in London: An analysis using aerial imagery. Accessed from: www.london.gov.uk/sites/default/files/measuring_tree_canopy_cover_2015.pdf25 Forestry Commission England (2016), London iTree eco project. Accessed from: www.forestry.gov.uk/london-itree
Trees and woodlandsThere are over eight million trees in London, covering around 20 per cent of London’s surface area.24,25 Most of these trees are in woodlands (Figure 23), parks and gardens, but a significant number are street trees. Assessments by the London Assembly in 2007 and 2011 found
there are around 500,000 street trees in London.26,27 The current London Tree Map gives information about more than 700,000 street trees and the wider public realm.28 Like the total extent of green space, the total area of tree canopy cover in London has also remained relatively static since 2002.
Figure 23: Woodland in London
Source: Greenspace Information for Greater London, and Forestry Commission (2015) National Forest Inventory.
Fig 15: Woodland in London
TYPE OF GRAPH: GREEN INFRASTRUCTURE
Reference
Source: Greenspace Information for Greater London, and Forestry Commission (2015) National Forest Inventory.
Available at: www.forestry.gov.uk/inventory. This information is licensed under the Open Government Licence v3.0. To view this licence, visit http://www.nationalarchives.gov.uk/doc/open-government-licence/
Additional areas that, in part, contain woodland
National Forestry Inventory woodland
Bromley
Southwark
Camden
HaveringRedbridge
Hounslow
Harrow
Westminster
26 Mayor of London (2007), Chainsaw massacre: A review of London’s street trees. Accessed from: www.london.gov.uk/about-us/london-assembly/london-assembly-publications/chainsaw-massacre-review-londons-street-trees27 Mayor of London (2011), Branching Out: the future for London’s street trees. Accessed from: www.london.gov.uk/about-us/london-assembly/london-assembly-publications/branching-out-future-londons-street-trees 28 Mayor of London (n.d.), London Tree Map. Accessed from: www.london.gov.uk/WHAT-WE-DO/environment/parks-green-spaces-and-biodiversity/trees-and-woodlands/london-tree-map
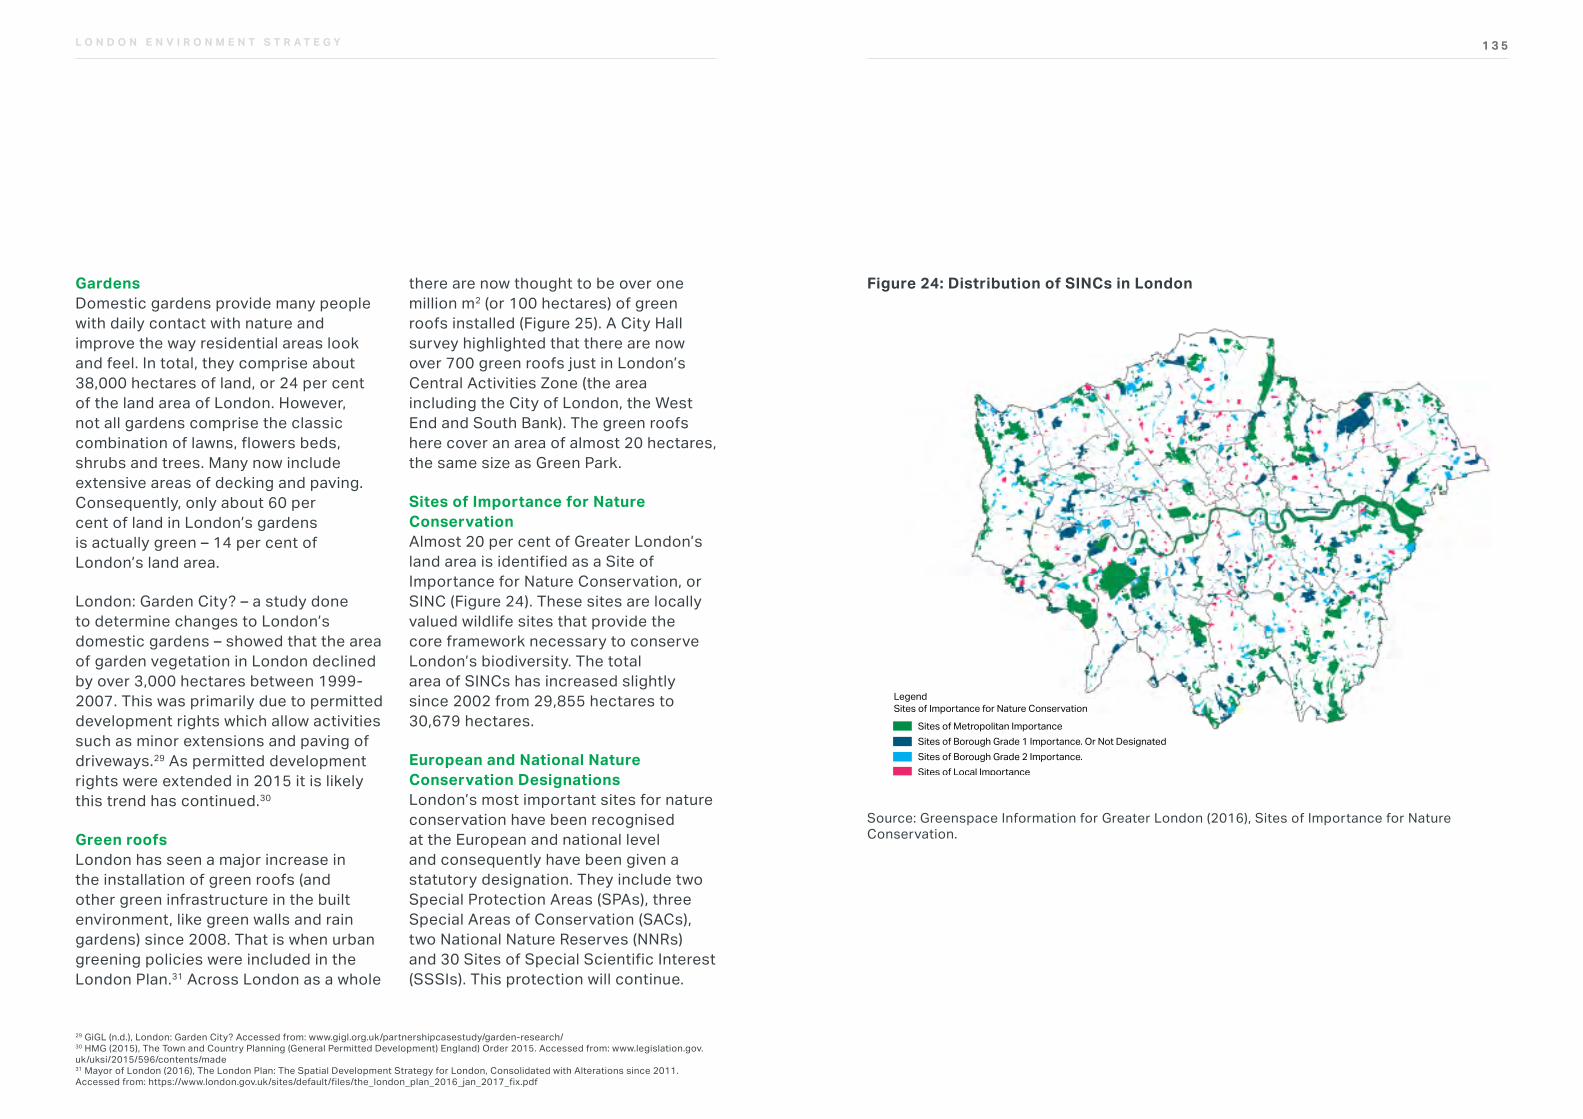
1 3 5L O N D O N E N V I R O N M E N T S T R A T E G Y
29 GiGL (n.d.), London: Garden City? Accessed from: www.gigl.org.uk/partnershipcasestudy/garden-research/30 HMG (2015), The Town and Country Planning (General Permitted Development) England) Order 2015. Accessed from: www.legislation.gov.uk/uksi/2015/596/contents/made31 Mayor of London (2016), The London Plan: The Spatial Development Strategy for London, Consolidated with Alterations since 2011. Accessed from: https://www.london.gov.uk/sites/default/files/the_london_plan_2016_jan_2017_fix.pdf
Figure 24: Distribution of SINCs in LondonFig 6: Sites of Imprtance for Nature Conservation
TYPE OF GRAPH: GREEN INFRASTRUCTURE
Reference
LegendSites of Importance for Nature Conservation
Sites of Metropolitan ImportanceSites of Borough Grade 1 Importance. Or Not DesignatedSites of Borough Grade 2 Importance.Sites of Local Importance
Source: Greenspace Information for Greater London (2016), Sites of Importance for Nature Conservation
Source: Greenspace Information for Greater London (2016), Sites of Importance for Nature Conservation.
GardensDomestic gardens provide many people with daily contact with nature and improve the way residential areas look and feel. In total, they comprise about 38,000 hectares of land, or 24 per cent of the land area of London. However, not all gardens comprise the classic combination of lawns, flowers beds, shrubs and trees. Many now include extensive areas of decking and paving. Consequently, only about 60 per cent of land in London’s gardens is actually green – 14 per cent of London’s land area.
London: Garden City? – a study done to determine changes to London’s domestic gardens – showed that the area of garden vegetation in London declined by over 3,000 hectares between 1999-2007. This was primarily due to permitted development rights which allow activities such as minor extensions and paving of driveways.29 As permitted development rights were extended in 2015 it is likely this trend has continued.30
Green roofs London has seen a major increase in the installation of green roofs (and other green infrastructure in the built environment, like green walls and rain gardens) since 2008. That is when urban greening policies were included in the London Plan.31 Across London as a whole
there are now thought to be over one million m2 (or 100 hectares) of green roofs installed (Figure 25). A City Hall survey highlighted that there are now over 700 green roofs just in London’s Central Activities Zone (the area including the City of London, the West End and South Bank). The green roofs here cover an area of almost 20 hectares, the same size as Green Park.
Sites of Importance for Nature ConservationAlmost 20 per cent of Greater London’s land area is identified as a Site of Importance for Nature Conservation, or SINC (Figure 24). These sites are locally valued wildlife sites that provide the core framework necessary to conserve London’s biodiversity. The total area of SINCs has increased slightly since 2002 from 29,855 hectares to 30,679 hectares.
European and National Nature Conservation Designations London’s most important sites for nature conservation have been recognised at the European and national level and consequently have been given a statutory designation. They include two Special Protection Areas (SPAs), three Special Areas of Conservation (SACs), two National Nature Reserves (NNRs) and 30 Sites of Special Scientific Interest (SSSIs). This protection will continue.
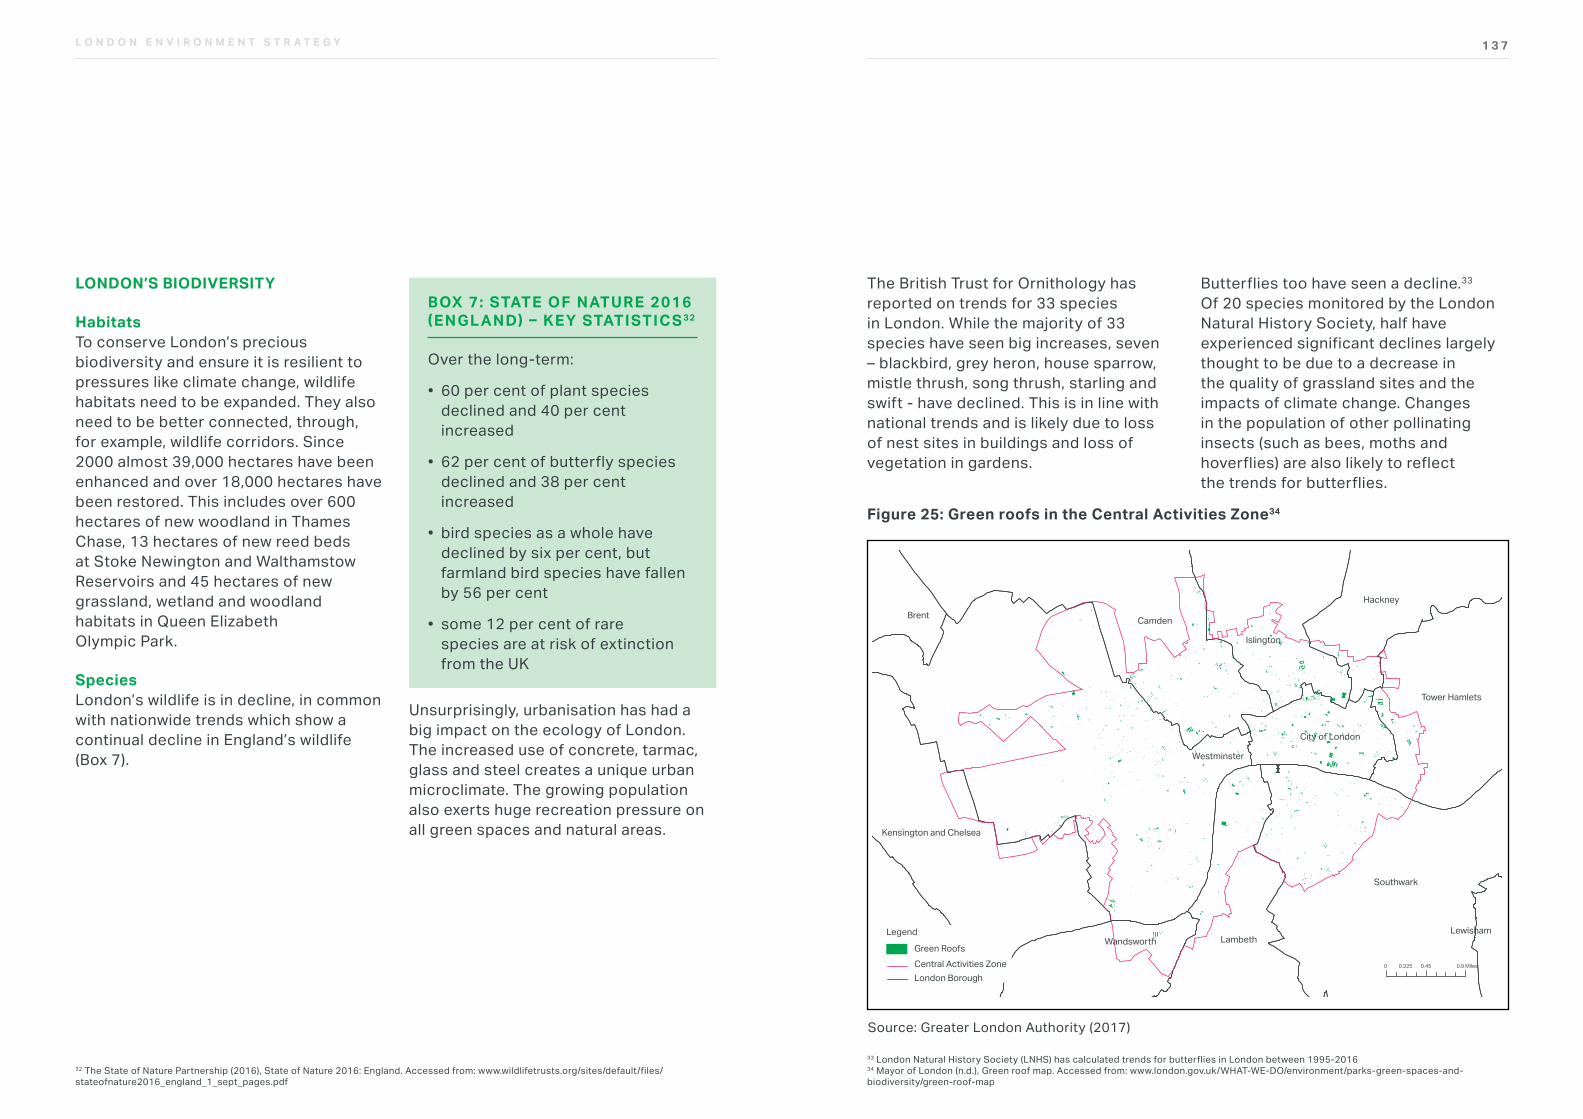
1 3 7L O N D O N E N V I R O N M E N T S T R A T E G Y
Figure 25: Green roofs in the Central Activities Zone34
Source: Greater London Authority (2017)
33 London Natural History Society (LNHS) has calculated trends for butterflies in London between 1995-2016 34 Mayor of London (n.d.), Green roof map. Accessed from: www.london.gov.uk/WHAT-WE-DO/environment/parks-green-spaces-and-biodiversity/green-roof-map
32 The State of Nature Partnership (2016), State of Nature 2016: England. Accessed from: www.wildlifetrusts.org/sites/default/files/stateofnature2016_england_1_sept_pages.pdf
LONDON’S BIODIVERSITY
HabitatsTo conserve London’s precious biodiversity and ensure it is resilient to pressures like climate change, wildlife habitats need to be expanded. They also need to be better connected, through, for example, wildlife corridors. Since 2000 almost 39,000 hectares have been enhanced and over 18,000 hectares have been restored. This includes over 600 hectares of new woodland in Thames Chase, 13 hectares of new reed beds at Stoke Newington and Walthamstow Reservoirs and 45 hectares of new grassland, wetland and woodland habitats in Queen Elizabeth Olympic Park.
SpeciesLondon’s wildlife is in decline, in common with nationwide trends which show a continual decline in England’s wildlife (Box 7).
Unsurprisingly, urbanisation has had a big impact on the ecology of London. The increased use of concrete, tarmac, glass and steel creates a unique urban microclimate. The growing population also exerts huge recreation pressure on all green spaces and natural areas.
BOX 7: STATE OF NATURE 2016 (ENGL AND) – KEY STATISTIC S 32
Over the long-term:
• 60 per cent of plant species declined and 40 per cent increased
• 62 per cent of butterfly species declined and 38 per cent increased
• bird species as a whole have declined by six per cent, but farmland bird species have fallen by 56 per cent
• some 12 per cent of rare species are at risk of extinction from the UK
The British Trust for Ornithology has reported on trends for 33 species in London. While the majority of 33 species have seen big increases, seven – blackbird, grey heron, house sparrow, mistle thrush, song thrush, starling and swift - have declined. This is in line with national trends and is likely due to loss of nest sites in buildings and loss of vegetation in gardens.Fig 7: Location of green roofs within the Central Activities Zone
TYPE OF GRAPH: GREEN INFRASTRUCTURE
Reference
Source: Greater London Authority (2017)
Southwark
0 0.225 0.45 0.9 Miles
Tower Hamlets
Hackney
Islington
Camden
LambethLewisham
WandsworthLegend
Green RoofsCentral Activities ZoneLondon Borough
Brent
Westminster
City of London
Kensington and Chelsea
Butterflies too have seen a decline.33 Of 20 species monitored by the London Natural History Society, half have experienced significant declines largely thought to be due to a decrease in the quality of grassland sites and the impacts of climate change. Changes in the population of other pollinating insects (such as bees, moths and hoverflies) are also likely to reflect the trends for butterflies.
1 3 9L O N D O N E N V I R O N M E N T S T R A T E G Y
ROLES AND LEGAL DUTIES
The Mayor of London has a legal duty to set out policies and proposals in this strategy relating to the natural environment and biodiversity. However, as the GLA is not a major landowner, the Mayor does not have any significant responsibility for the day-to-day management of parks and green spaces in London.
However, the Mayor has influence over green infrastructure and the natural environment through the activities of:
• ensuring that green infrastructure policies are included in other relevant Mayoral strategies, such as the London Plan and the draft Mayor’s Transport Strategy
• key departments within the GLA, such as those responsible for housing and land and regeneration
• bodies over which the Mayor has direct influence, such as TfL and Old Oak Park Royal Development Corporation
The Mayor has a significant leadership role and can act as a powerful advocate to highlight issues that require a pan-London approach in order to stimulate effective and coordinated action. The other organisations that have a role to play in protecting and enhancing London’s green infrastructure are described in Appendix 3.
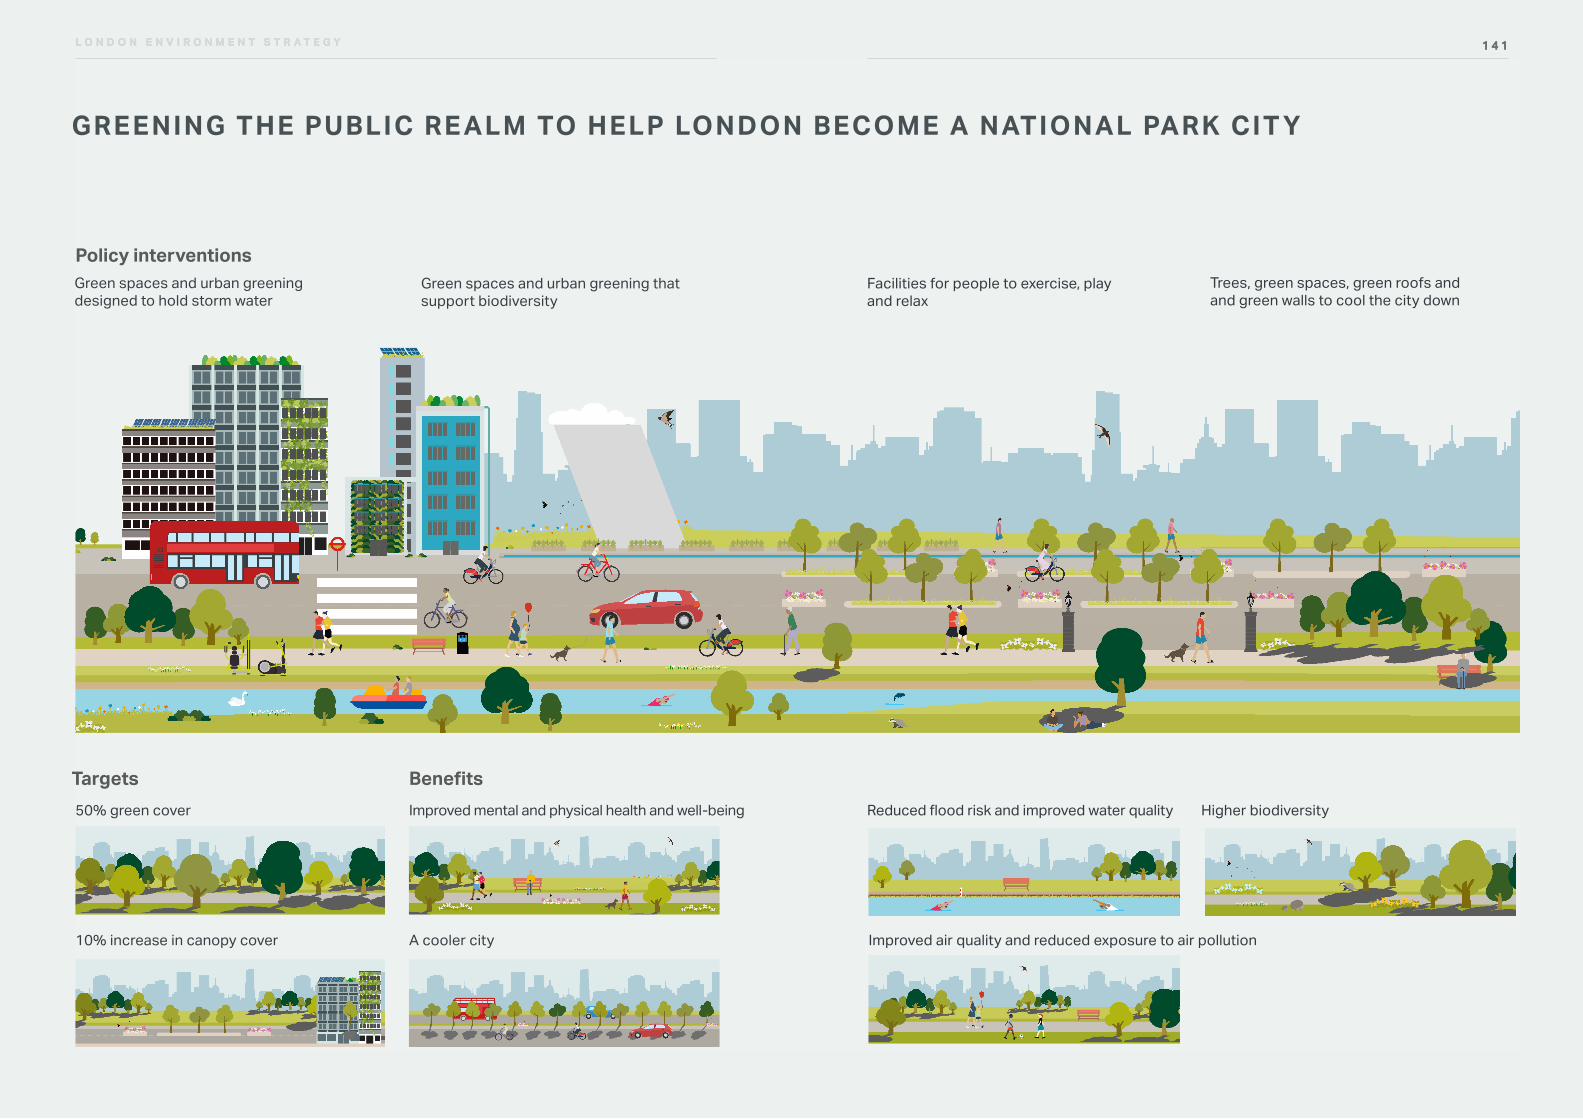
1 4 1L O N D O N E N V I R O N M E N T S T R A T E G Y
Facilities for people to exercise, play and relax
Trees, green spaces, green roofs and and green walls to cool the city down
Improved air quality and reduced exposure to air pollution
Reduced flood risk and improved water quality Higher biodiversity
GREENING THE PUBLIC RE ALM TO HELP LONDON BECOME A NATIONAL PARK CIT Y
1 4 1L O N D O N E N V I R O N M E N T S T R A T E G Y
Policy interventions
BenefitsTargets50% green cover
10% increase in canopy cover
Green spaces and urban greening designed to hold storm water
Green spaces and urban greening that support biodiversity
Improved mental and physical health and well-being
A cooler city
1 4 3L O N D O N E N V I R O N M E N T S T R A T E G Y
also work with boroughs, land managers and environmental organisations to identify the incentives needed to improve the quality and function of this strategically important asset.
The London Plan has been effective at protecting the core green space resource and containing sprawl and London’s green space must be protected to provide the foundations for a greener city. This promotes a more compact city that helps to minimise London’s overall environmental footprint.
As the city grows, it becomes ever more important to protect and improve green spaces in order to secure the benefits provided by green infrastructure. Planning policy for the Green Belt and Metropolitan Open Land can help protect the space from development. However, it does not help to improve the quality or function of green spaces such as, for example, using the Green Belt for creating new woodland. This will be considered as part of valuing London’s natural capital which is outlined further in objective 4.3.
Proposal 5.1.1b Through the new London Plan the Mayor will consider policies that ensure any development outside the protected green space network does not lead to an unacceptable loss of the benefits of existing local green infrastructure; the Mayor will also provide advice to householders about how gardens contribute to improving green infrastructure at a local level
The Mayor recognises that much of London’s existing green infrastructure lies outside of the protected open and green space network. Areas of amenity green space around housing estates; extensive areas of private garden and the street trees which line so many of London’s streets provide many Londoners with significant benefits at the local level.
Consequently, new development proposals should avoid reducing the overall amount of green cover and the benefits this provides. Thoughtful planning and design of new developments should aim to: avoid fragmentation of existing green space; reduce storm water run-off rates by using sustainable drainage and include new tree planting or features such as green roofs to mitigate any unavoidable loss.
OBJECTIVE 5.1 MAKE MORE THAN HALF OF LONDON’S AREA GREEN BY 2050
All cities now recognise that the green infrastructure of parks, green spaces, natural areas, street trees, green roofs and walls are an essential part of city life. This green infrastructure helps to make the city healthy, liveable and economically sustainable. The Mayor wants to increase the area of London’s green cover and make sure that it is designed and managed to optimise the services it provides.
Policy 5.1.1 Protect, enhance and increase green areas in the city to provide green infrastructure services and benefits London needs now and in the future
Proposal 5.1.1a Through the new London Plan, the Mayor will protect the Green Belt, Metropolitan Open Land and publicly accessible green space
The Mayor will resist development that results in the loss of Green Belt and Metropolitan Open Land. This will help fulfil their potential as strategic green infrastructure for London. The Mayor will
Objectives, policies and proposals
“ The Mayor will resist development that results in the loss of Green Belt and Metropolitan Open Land.”
L O N D O N E N V I R O N M E N T S T R A T E G Y
1 4 5L O N D O N E N V I R O N M E N T S T R A T E G Y
The Royal Horticultural Society working with the Universities of Reading and Sheffield reviewed academic evidence to consider the potential impacts of domestic gardens on urban quality of life35. These include:
• urban garden plants and trees help cool the air in towns and cities, combating heat waves
• garden plants and trees intercept pollutants in the air, reducing exposure to poor air quality
• garden plants and trees intercept intense rain, slowing run-off and so reducing the pressure on urban drains
• soil in gardens naturally absorbs rainwater, reducing the risk of flooding
• some animal species are now more common in cities, and particularly domestic gardens, than in rural areas
• the presence of gardens eases stress and improves psychological wellbeing
• access to gardens encourages sustained exercise and promotes physical health
• some 12 per cent of rare species are at risk of extinction from the UK
BOX 8: THE IMPORTANCE OF DOMESTIC GARDENS AS PART OF LONDON’S GREEN INFR ASTRUCTURE NET WORK
35 Royal Horticultural Society (2011), Gardening matters: Urban gardens. Accessed from: www.rhs.org.uk/science/pdf/climate-and-sustainability/urban-greening/gardening-matters-urban-greening.pdf 36 The Nature of Cities (n.d.), Can cities save bees? How can urban habitats be made to serve pollinator conservation? How can that story be better told? Accessed from: www.thenatureofcities.com/2016/01/20/can-cities-save-bees-how-can-urban-habitats-be-made-to-serve-pollinator-conservation-how-can-that-story-be-better-told/ 37 Royal Horticultural Society (n.d.), Greening Grey Britain – Community Action. Accessed from: www.rhs.org.uk/communities/campaigns/greening-grey-britain
Private gardens make up 24 per cent of London’s land area, though only about 60 per cent of their area is green. Nevertheless, the total amount of green space in private gardens is equivalent to the total area of public green space in London (some 30,000 hectares). Private gardens not only create leafier neighbourhoods that are good for health but they also provide habitat for wildlife, and increase resilience to climate change. Consequently any reduction will have wider environmental impacts.
The environmental performance of gardens must be improved. For example, by reducing the amount of storm water being discharged to the sewer network, helping to reduce exposure to poor air quality, or creating stepping stones for wildlife to move between areas of semi-natural habitat.35 Flowery gardens in particular can provide important foraging areas for bees and other pollinators.36 Box 8 sets out some of the benefits of urban gardens based on research by the Royal Horticultural Society (RHS). The RHS also provides advice to householders on how they can green their front gardens whilst still providing functions such as parking through the Greening Grey Britain campaign.37
“ Private gardens make up 24 per cent of London’s land area, though only about 60 per cent of their area is green.”
L O N D O N E N V I R O N M E N T S T R A T E G Y
1 4 7L O N D O N E N V I R O N M E N T S T R A T E G Y
To make sure that all Londoners live in greener neighbourhoods the Mayor will develop a new ‘greenness’ index. This will identify those areas where green infrastructure and urban greening is most needed. The Mayor will work with TfL, the boroughs and civil society and community organisations to create greener public spaces and healthier streets.
Existing mapping of open space is based on access to parks and green spaces that are formally declared as public open space.38 The public open space data set is important for land-use planning purpose. However, it does not highlight the more pressing problem of lack of access to green space in parts of London where people lack gardens or where tree cover is below average. New methodologies and mapping can spotlight this issue and help to target action where required. Figure 26 and Figure 27 show an example of a greenness map for London and how the new approach can help target interventions.
“ The Mayor’s Greener City Fund will invest in strategically important green infrastructure projects.”
1 4 7
Proposal 5.1.1c The Mayor aims to improve access to green space and nature by identifying those areas of the city which should be greener and developing green infrastructure programmes and projects especially in major regeneration areas
Despite London’s extensive network of parks and open spaces there are parts of the city where local people lack access to green space and the natural environment. These areas tend to be where development is densest, or in areas of deprivation. These are also areas where households are less likely to have access to private gardens. The Mayor aims to improve access to green space and nature for all Londoners, especially children.
Box 9 describes the Mayor’s programme for improving access to green space and nature.
38 It therefore excludes countryside and farmland in the Green Belt accessible by public footpaths, other private green space, and other types of green space (such as golf courses and sports fields) that may be accessible but are outside the public open space categories within the London Plan
BOX 9: THE MAYOR’S PROGR AMME FOR IMPROVING ACCESS TO GREEN SPACE AND NATURE
The Mayor’s programme will comprise the following elements:
• community grants for creating greener space – investment in small and medium scale greening projects in green spaces across London
• a Greener City Fund – investment in strategically important green infrastructure projects
• developing a ‘greenness index’ to target investment in areas that need it most (see below)
• strengthened policy in the new London Plan to ensure an increase in urban greening
• working with urban designers, developers and planners to promote and communicate the benefits of a greener built environment including gardens
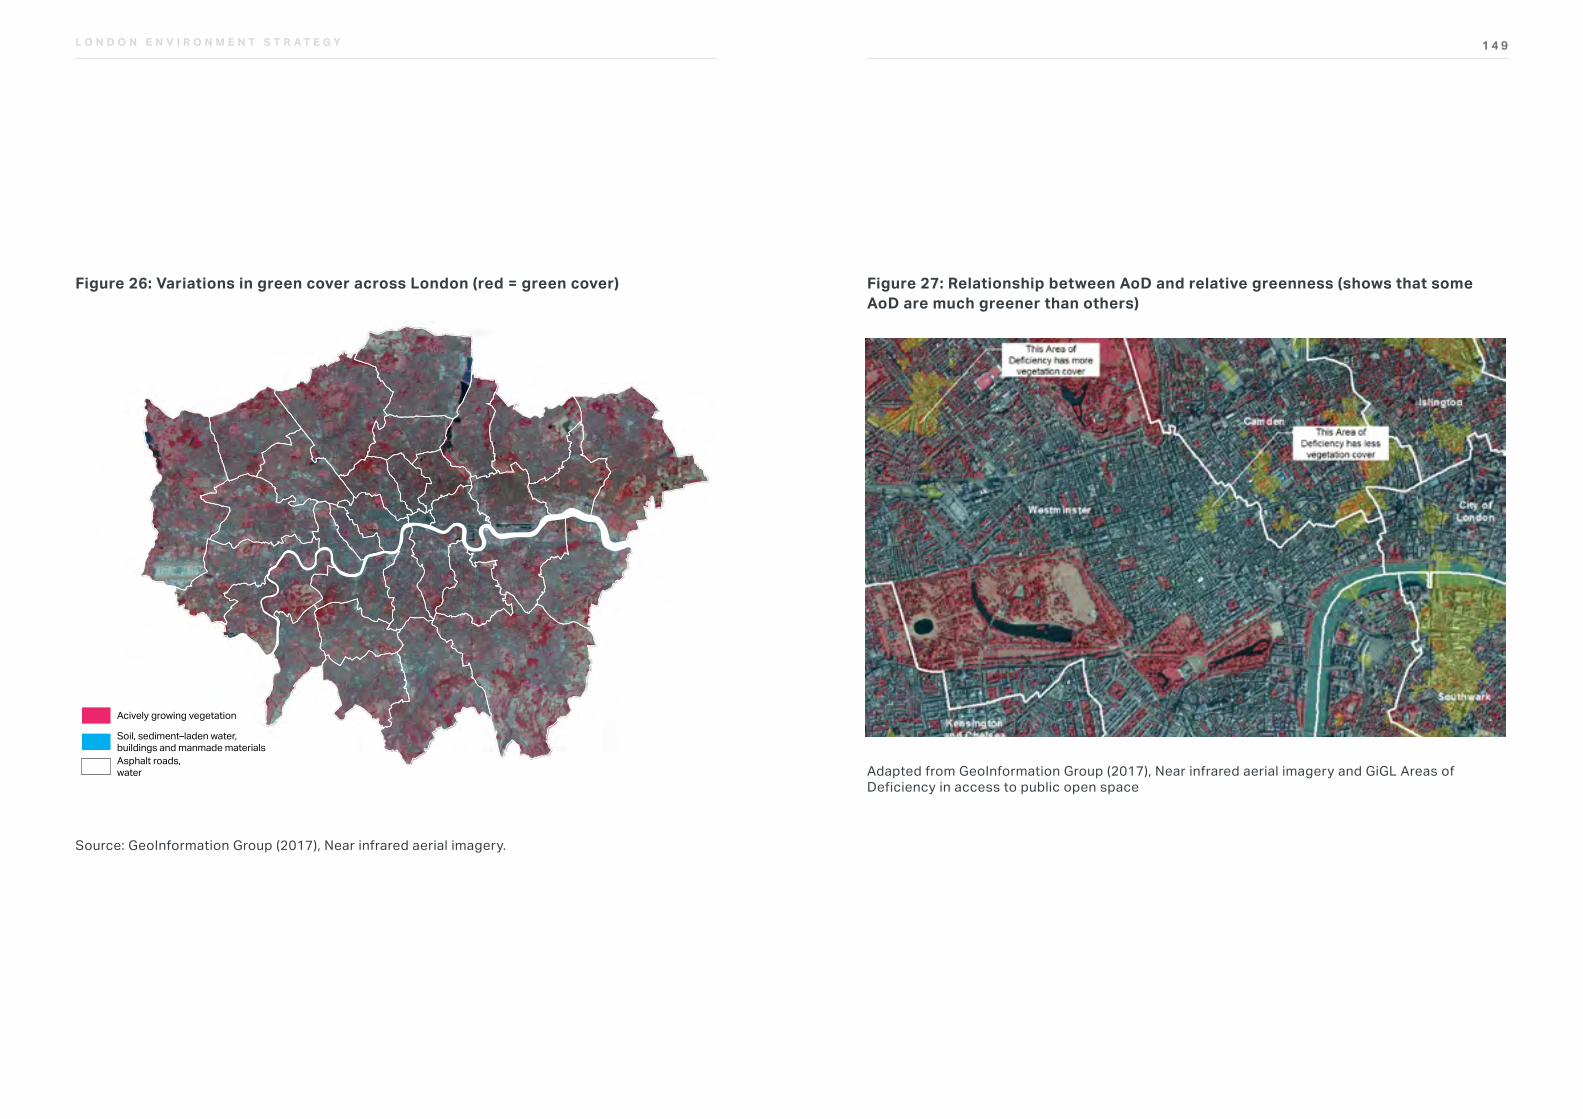
1 4 9L O N D O N E N V I R O N M E N T S T R A T E G Y
Figure 27: Relationship between AoD and relative greenness (shows that some AoD are much greener than others)
Adapted from GeoInformation Group (2017), Near infrared aerial imagery and GiGL Areas of Deficiency in access to public open space
Figure 26: Variations in green cover across London (red = green cover)Fig 9: Variations in green cover across London.
TYPE OF GRAPH: GREEN INFRASTRUCTURE
Reference
Source: GeoInformation Group (2017), Near infrared aerial imagery.
Acively growing vegetation
Soil, sediment–laden water,buildings and manmade materialsAsphalt roads,water
Source: GeoInformation Group (2017), Near infrared aerial imagery.
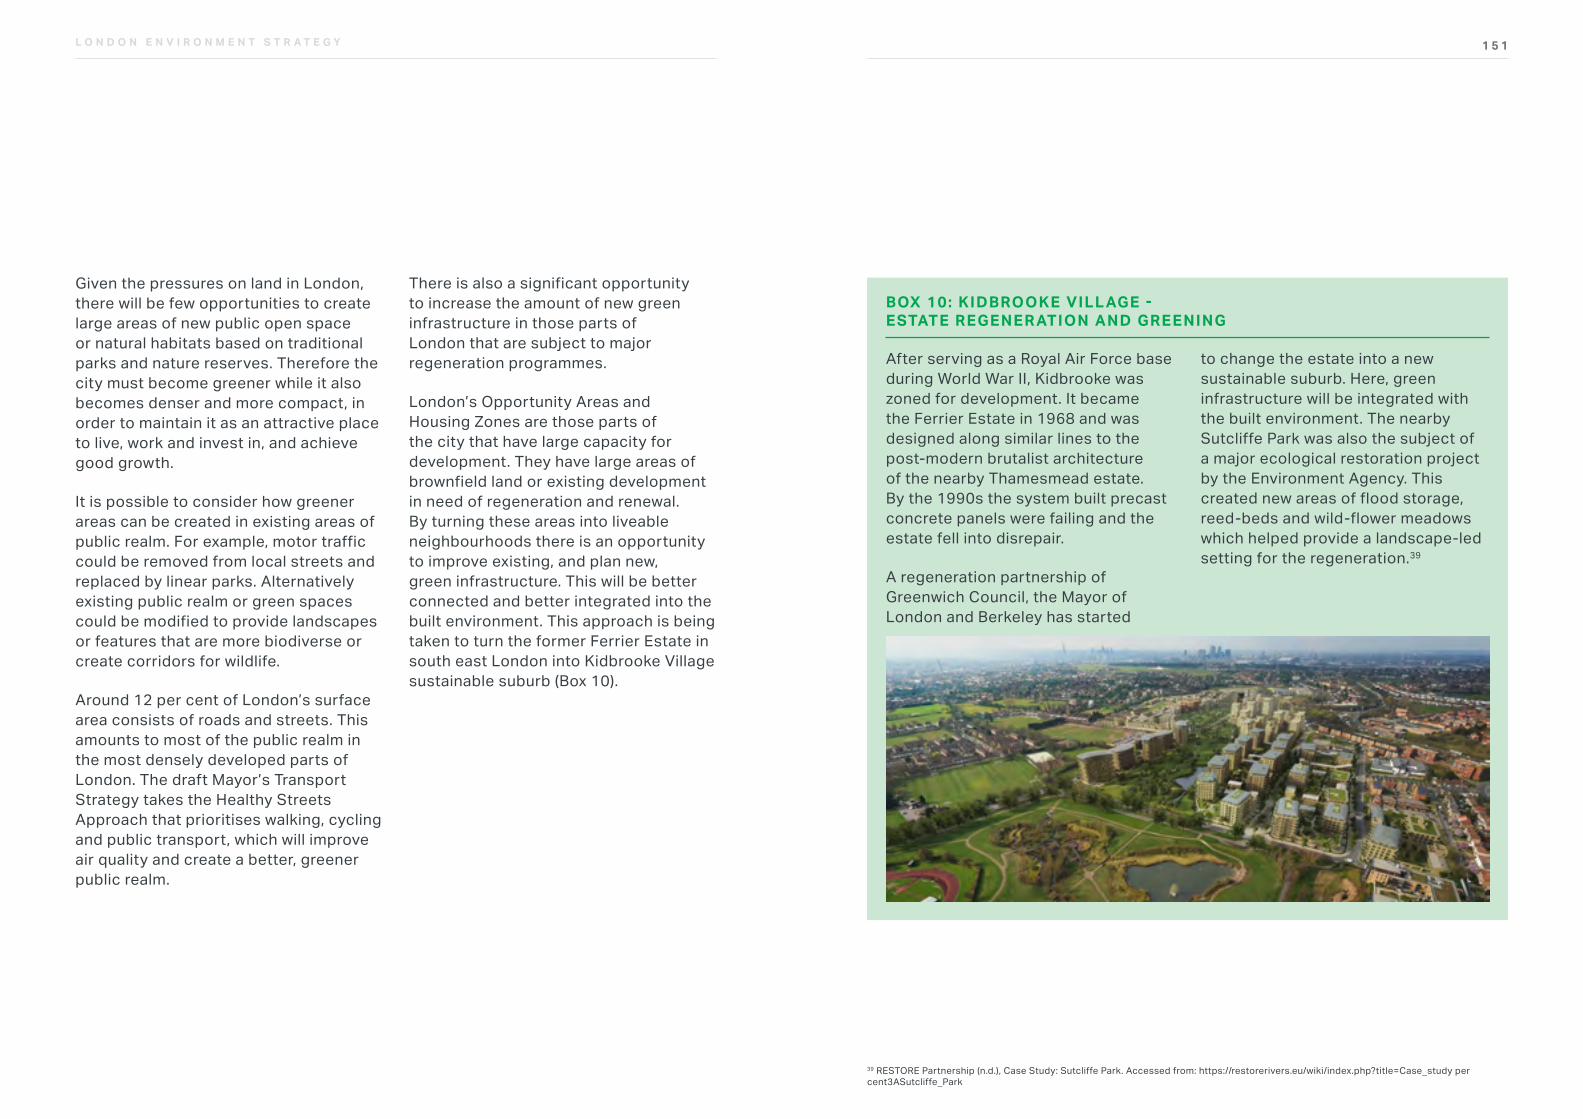
1 5 1L O N D O N E N V I R O N M E N T S T R A T E G Y
39 RESTORE Partnership (n.d.), Case Study: Sutcliffe Park. Accessed from: https://restorerivers.eu/wiki/index.php?title=Case_study per cent3ASutcliffe_Park
After serving as a Royal Air Force base during World War II, Kidbrooke was zoned for development. It became the Ferrier Estate in 1968 and was designed along similar lines to the post-modern brutalist architecture of the nearby Thamesmead estate. By the 1990s the system built precast concrete panels were failing and the estate fell into disrepair.
A regeneration partnership of Greenwich Council, the Mayor of London and Berkeley has started
to change the estate into a new sustainable suburb. Here, green infrastructure will be integrated with the built environment. The nearby Sutcliffe Park was also the subject of a major ecological restoration project by the Environment Agency. This created new areas of flood storage, reed-beds and wild-flower meadows which helped provide a landscape-led setting for the regeneration.39
BOX 10: KIDBROOKE VILL AGE - ESTATE REGENER ATION AND GREENING
Given the pressures on land in London, there will be few opportunities to create large areas of new public open space or natural habitats based on traditional parks and nature reserves. Therefore the city must become greener while it also becomes denser and more compact, in order to maintain it as an attractive place to live, work and invest in, and achieve good growth.
It is possible to consider how greener areas can be created in existing areas of public realm. For example, motor traffic could be removed from local streets and replaced by linear parks. Alternatively existing public realm or green spaces could be modified to provide landscapes or features that are more biodiverse or create corridors for wildlife.
Around 12 per cent of London’s surface area consists of roads and streets. This amounts to most of the public realm in the most densely developed parts of London. The draft Mayor’s Transport Strategy takes the Healthy Streets Approach that prioritises walking, cycling and public transport, which will improve air quality and create a better, greener public realm.
There is also a significant opportunity to increase the amount of new green infrastructure in those parts of London that are subject to major regeneration programmes.
London’s Opportunity Areas and Housing Zones are those parts of the city that have large capacity for development. They have large areas of brownfield land or existing development in need of regeneration and renewal. By turning these areas into liveable neighbourhoods there is an opportunity to improve existing, and plan new, green infrastructure. This will be better connected and better integrated into the built environment. This approach is being taken to turn the former Ferrier Estate in south east London into Kidbrooke Village sustainable suburb (Box 10).
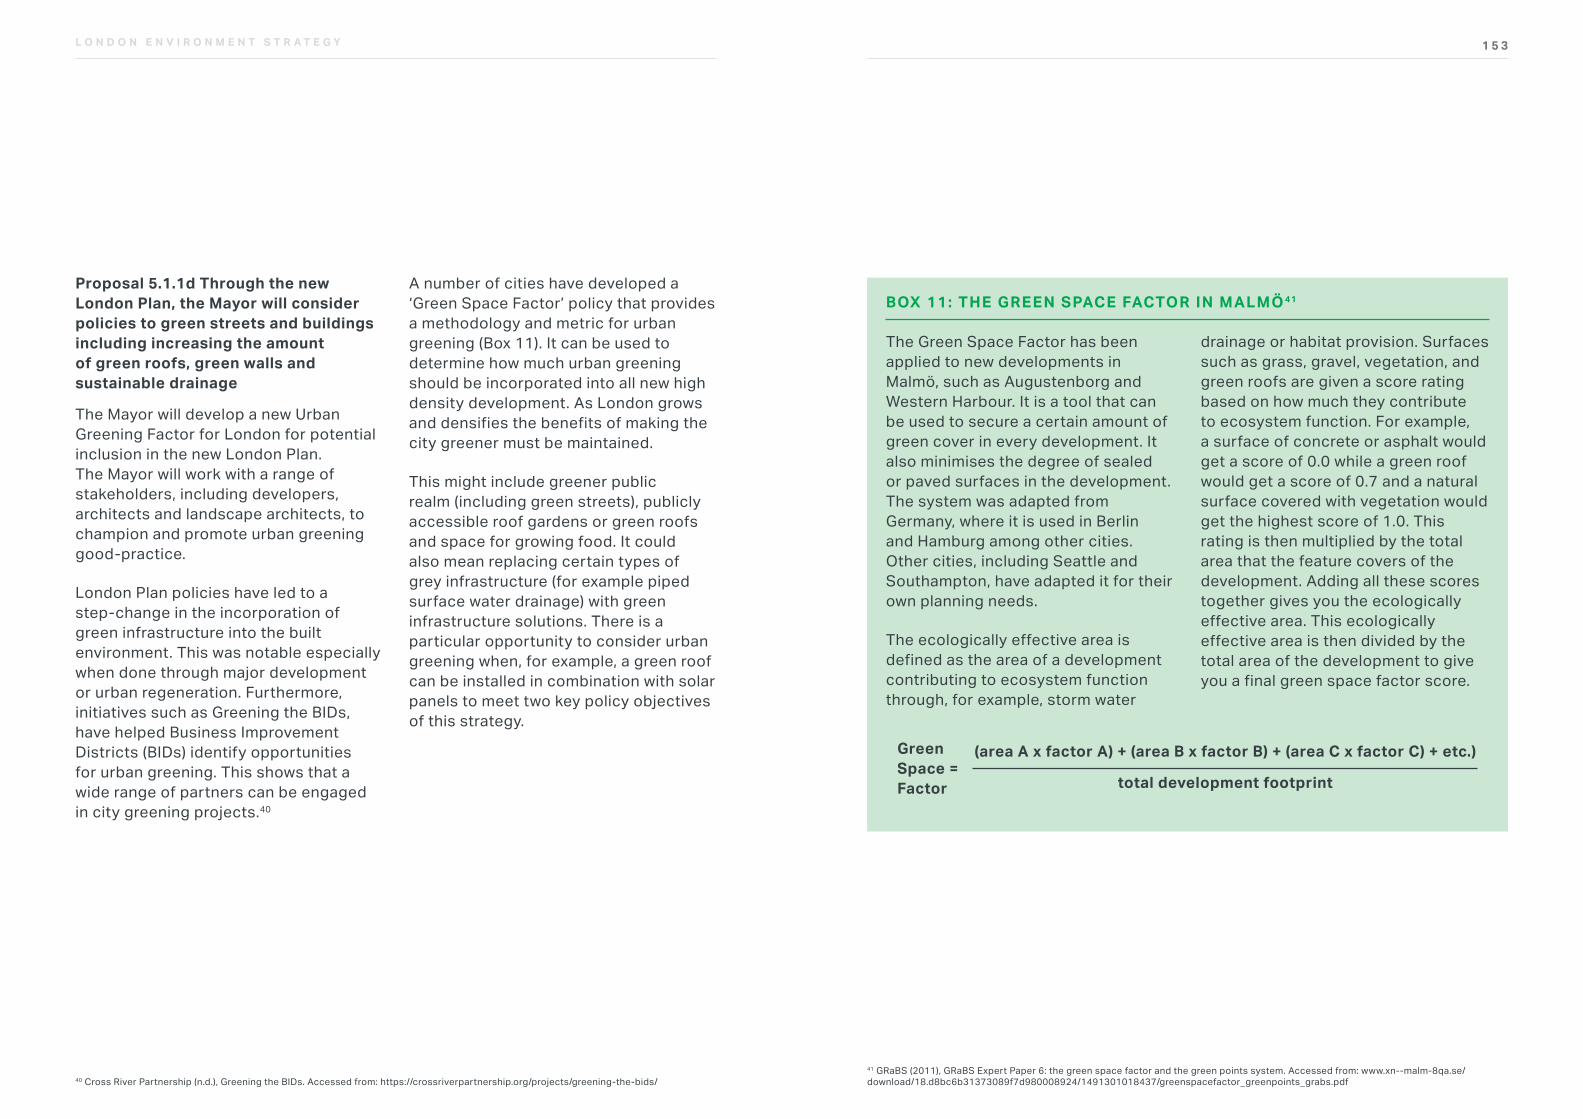
1 5 3L O N D O N E N V I R O N M E N T S T R A T E G Y
The Green Space Factor has been applied to new developments in Malmö, such as Augustenborg and Western Harbour. It is a tool that can be used to secure a certain amount of green cover in every development. It also minimises the degree of sealed or paved surfaces in the development. The system was adapted from Germany, where it is used in Berlin and Hamburg among other cities. Other cities, including Seattle and Southampton, have adapted it for their own planning needs.
The ecologically effective area is defined as the area of a development contributing to ecosystem function through, for example, storm water
drainage or habitat provision. Surfaces such as grass, gravel, vegetation, and green roofs are given a score rating based on how much they contribute to ecosystem function. For example, a surface of concrete or asphalt would get a score of 0.0 while a green roof would get a score of 0.7 and a natural surface covered with vegetation would get the highest score of 1.0. This rating is then multiplied by the total area that the feature covers of the development. Adding all these scores together gives you the ecologically effective area. This ecologically effective area is then divided by the total area of the development to give you a final green space factor score.
BOX 11: THE GREEN SPACE FACTOR IN MALMÖ 41
(area A x factor A) + (area B x factor B) + (area C x factor C) + etc.)
total development footprint
Green Space = Factor
41 GRaBS (2011), GRaBS Expert Paper 6: the green space factor and the green points system. Accessed from: www.xn--malm-8qa.se/download/18.d8bc6b31373089f7d980008924/1491301018437/greenspacefactor_greenpoints_grabs.pdf
Proposal 5.1.1d Through the new London Plan, the Mayor will consider policies to green streets and buildings including increasing the amount of green roofs, green walls and sustainable drainage
The Mayor will develop a new Urban Greening Factor for London for potential inclusion in the new London Plan. The Mayor will work with a range of stakeholders, including developers, architects and landscape architects, to champion and promote urban greening good-practice.
London Plan policies have led to a step-change in the incorporation of green infrastructure into the built environment. This was notable especially when done through major development or urban regeneration. Furthermore, initiatives such as Greening the BIDs, have helped Business Improvement Districts (BIDs) identify opportunities for urban greening. This shows that a wide range of partners can be engaged in city greening projects.40
A number of cities have developed a ‘Green Space Factor’ policy that provides a methodology and metric for urban greening (Box 11). It can be used to determine how much urban greening should be incorporated into all new high density development. As London grows and densifies the benefits of making the city greener must be maintained.
This might include greener public realm (including green streets), publicly accessible roof gardens or green roofs and space for growing food. It could also mean replacing certain types of grey infrastructure (for example piped surface water drainage) with green infrastructure solutions. There is a particular opportunity to consider urban greening when, for example, a green roof can be installed in combination with solar panels to meet two key policy objectives of this strategy.
40 Cross River Partnership (n.d.), Greening the BIDs. Accessed from: https://crossriverpartnership.org/projects/greening-the-bids/

1 5 5L O N D O N E N V I R O N M E N T S T R A T E G Y
Proposal 5.1.1e The Mayor will develop programmes and deliver projects including a major tree planting programme to ensure that London’s urban forest is maintained and expanded
The Mayor will do this by:
• running a major programme of tree planting to supplement tree planting by boroughs, environmental organisations and other land-managers (Box 12)
• improving the data required to monitor tree canopy cover and to identify locations for tree planting
• supporting and promoting the work of the boroughs, for example through the London Tree Officers Association and the Trees and Design Action Group to promote best practice in managing and planting trees in the urban environment
BOX 12: THE MAYOR’S PROGR AMME FOR E XPANDING LONDON’S ‘URBAN FOREST ’
The Mayor’s programme will consist of the following parts:
• community grants for tree planting – investment in small and medium scale tree planting projects in green spaces across London
• Woodlands for London – support for large woodland creation projects working with partner organisations
• Street Tree Sponsorship – developing a new online map to enable Londoners and businesses to sponsor street tree planting in their area
• convening a London Tree Partnership to coordinate research and guidance, data sharing and communicating the benefits of trees
1 5 7L O N D O N E N V I R O N M E N T S T R A T E G Y
Proposal 5.1.1f The Mayor will back greater community involvement in the improvement and management of London’s green spaces and natural environment
The Mayor will work with boroughs, Parks for London and civil society organisations such as Groundwork London, London Wildlife Trust, and Trees for Cities to provide advice and guidance to local communities.
Local people are the main users of most of the smaller green spaces across London – local parks, pocket parks and amenity green space. It is these spaces that are often given the lowest priority by those charged with managing and maintaining a network of sites.
The State of UK Public Parks published by the Heritage Lottery Fund in 2016 provides an assessment of the funding and investment in the UK’s public parks and green spaces.45 It shows there have been year-on-year reductions to local authority parks budgets since 2010. Three quarters of London boroughs expect further reductions on between 10-20 per cent (or more) up to 2020.
As a result, people and communities increasingly want to take local action to enhance these spaces and the wider natural environment. There are over 600 Friends of Parks Groups across London and over half of the London boroughs have formal Parks Forums. Initiatives to promote food growing and community-managed pocket parks have spawned a number of local projects to make better use of underused or neglected local green spaces. There are now, for example, 2,553 food growing spaces across London.46
Traditional models of local council funding are no longer likely to provide enough resources to maintain and enhance the public realm. The Association for Public Service Excellence published a report about this called Park Life, Street Life: Managing demand in the public realm.47 It explored how local people, businesses and community groups can become more powerful actors within the public realm. They can help to secure not just volunteer hours but access to funding, and play an active role in managing local spaces.
42 The ‘urban forest’ currently covers around 20 per cent of London’s land area. A ten per cent increase will take this to around 22 per cent by 205043 Gill et al (2007), Adapting Cities for Climate Change: The Role of Green Infrastructure 44 Doick et al (2016), The impact of greenspace size on the extent of local nocturnal air temperature cooling in London. Urban Forestry and Greening 16: 160-169 45 Heritage Lottery Fund (2016), State of UK Public Parks 2016. Accessed from: www.hlf.org.uk/state-uk-public-parks-2016 46 Capital Growth (n.d.) Capital growth: London’s food growing network. Accessed from: www.capitalgrowth.org/ 47 Association for Public Service Excellence (2015), Nudge and budge your citizens to reduce demand o hard pressed council services. Accessed from: www.apse.org.uk/apse/index.cfm/news/2015/press-release-nudge-and-budge-your-citizens-to-reduce-demand-on-hard-pressed-council-services/
The ‘urban forest’ is all the trees in London. There are around eight million of them covering around 20 per cent of London’s land area. It consists of street trees, garden trees, trees in parks and open spaces, copses, woodlands and extensive areas of semi-natural forest. The Mayor wants to increase this by ten per cent by 2050.42 As well as protecting the existing resource the rate of tree planting must be increased to create new woodlands for recreation and wildlife habitat.
Increasing London’s canopy cover can add to the benefits that London’s open spaces and urban forest already provide. Research by the University of Manchester has shown that increasing canopy cover by ten per cent in city areas with the highest density of buildings can help reduce temperatures.43 The distance over which this cooling is effective increases where tree canopy coverage is most extensive.44 The planting of trees in streets and parks will also help improve air quality over the long-term.
“ There are around eight million trees covering around 20 per cent of London’s land area.”
L O N D O N E N V I R O N M E N T S T R A T E G Y
1 5 9L O N D O N E N V I R O N M E N T S T R A T E G Y
OBJECTIVE 5.2 CONSERVING AND ENHANCING WILDLIFE AND NATURAL HABITATS
London’s network of parks and green spaces has resulted in a city that is not just green but also relatively rich in wildlife and natural spaces. London’s geography helps. The city’s wildlife habitats include areas as diverse as chalk grassland, grazing marsh, ancient woodland and heath, and a variety of urban habitats including reservoirs, gardens and parks.
However, in common with nationwide trends which show a continual decline in England’s biodiversity, London’s ecological health has worsened, caused by urbanisation.
Many Londoners play an important role in maintaining and enhancing the ecology of the city. Gardens are a valuable supplementary habitat for a wide range of wild plants and animals. Gardens and other private green spaces can be managed to improve their value to wildlife, for example through the provision of ponds, nectar rich plants or trees.
“ Many Londoners play an important role in maintaining and enhancing the ecology of the city.”
1 5 9
48 Havering Borough Council (n.d.) Friends of parks in Havering. Accessed from: www.havering.gov.uk/info/20037/parks/215/friends_of_parks_in_havering49 Arlington Association (n.d.), Home. Accessed from: www.arlingtonassociation.org.uk50 Friends of Barnsbury Square Gardens (n.d.), Welcome to the Friends of Barnsbury Square Gardens website. Accessed from: friendsofbarnsburysqgardens.com/51 Lambeth Borough Council (2013), Lambeth Cooperative Parks Programme Information Booklet. Accessed from: www.lambeth.gov.uk/sites/default/files/CoopParksInformationBooklet.pdf52 Streatham Common Cooperative (n.d.), What is The Streatham Common Co-operative? Accessed from: https://www.sccoop.org.uk/
Many local councils now support and encourage local community groups and civil society organisations to take more responsibility for these locally important spaces (Box 13). A wide range of civil society organisations (including Parks for London, Groundwork London, London
Wildlife Trust and the National Trust) can offer local communities support and expertise. However, additional capacity is needed to ensure that locally-based groups have the practical and administrative skills necessary to take ‘ownership’ of local green spaces.
A number of different approaches have been taken by London boroughs to get communities more engaged in local green spaces. Some examples are below.
Havering actively supports a Friends of Parks48 network that ensures local communities are actively engaged in decisions about managing the borough’s parks. This supplements the work of the borough’s grounds maintenance team.
Islington has devolved parks maintenance budgets to formally constituted residents associations and friends groups at Arlington Square49 and Barnsbury Square50.
Lambeth embarked on its Co-operative Parks51 initiative in order to identify social enterprise organisations such as Streatham Common Co-operative (SCoop)52 that could be responsible for not-for-profit led management of borough parks.
BOX 13: COMMUNIT Y PARTICIPATION MODELS
1 6 1L O N D O N E N V I R O N M E N T S T R A T E G Y
Policy 5.2.1 Protect a core network of nature conservation sites and ensure a net gain in biodiversity
Proposal 5.2.1a The Mayor will include policies on the protection of Sites of Importance for Nature Conservation (SINCs) and the promotion of wildlife-friendly landscaping in the new London Plan
The land-use planning system provides the primary mechanism for protecting land of ecological value in London. A robust policy framework in the London Plan can ensure land of particular nature conservation value is safeguarded. This can support the enhancement of biodiversity by requiring new development to include new wildlife habitat, nesting and roosting sites and ecologically appropriate landscaping.
The establishment of a SINC network is designed to protect valuable habitats (those which are rare, threatened, fragile or richest in wildlife) from development. By doing this, most of the rarest or most vulnerable species are also likely to be conserved.
With access to nature included in the criteria, the SINC network also ensures as many Londoners as possible can access wildlife rich spaces close to where they live and work.
The procedures in Appendix 5 of this strategy set out the methodology and process by which boroughs should identify SINCs in their Local Plans.
Proposal 5.2.1b The Mayor will seek to implement an approach for London to biodiversity offsetting
The Mayor will work with boroughs, statutory agencies and wildlife organisations to explore the opportunities to establish a new biodiversity offsetting metric for London.
Biodiversity offsets are measurable conservation outcomes resulting from actions designed to compensate for residual adverse biodiversity impacts arising from a development.
Where there is risk of damage to a SINC or harm to a protected or priority species, appropriate planning conditions or obligations can be used to negate or minimise that impact. Where loss is unavoidable, mitigation or compensation should be used. This can lead to the creation, restoration and enhancement of natural habitats, or improved breeding or foraging areas for protected or priority species on the site or elsewhere.
53 Defra (2014), Evaluation of the Biodiversity Offsetting pilot phase. Accessed from: http://randd.defra.gov.uk/Default.aspx?Menu=Menu&Module=More&Location=None&ProjectID=18229&FromSearch=Y&Publisher=1&SearchText=WC1051&SortString=ProjectCode&SortOrder=Asc&Paging=10#Description.
1 6 3L O N D O N E N V I R O N M E N T S T R A T E G Y
Proposal 5.2.1c The Mayor will provide guidance and support to secure better management of existing habitats across London, the creation of new habitats and conserve key species
Working with London boroughs, the statutory environmental agencies and others the Mayor will ensure managers of public land in London can get the best advice on the management or enhancement of land or buildings for nature conservation. New models of delivery will also be explored and recommended.
Planning policy to protect or create areas of nature conservation value is ultimately ineffective if the habitats protected or created are not properly managed. Most habitats will change or deteriorate over time without appropriate management. For some habitats, such as woodland, this is a slow, almost imperceptible process. For others, such as grassland or heathland, changes can be rapid and dramatic.
Many London boroughs and other land managers have access to their own in-house advice on ecology and natural environment issues. But in recent years, particularly as public sector budgets have been prioritised to fund core statutory services, the amount expert advice at the borough level has fallen. Consequently, London-wide forums and advisory services are increasingly needed to share expertise, knowledge and experience.
Despite the extent of green space in London, the existing SINC network is fragmented. Therefore, to further improve ecological resilience more habitats should be created to:
• strengthen wildlife corridors and augment fragile or threatened habitats
• create new landscapes that deliver the most valuable green infrastructure services in a London context. These include flood management, air quality improvement, prevention of water pollution and enhancement of amenity in public parks and green spaces.
Defra and Natural England ran six biodiversity offsetting pilot areas from 2012 to 2014 to test various methodologies.53 The government has not yet translated the results of these pilots into a standard, approved methodology for biodiversity offsetting. It does, however, recognise that biodiversity offsetting is an option available to
developers to fulfil their obligations under the planning system’s mitigation hierarchy. It therefore encourages local authorities and others to develop appropriate bespoke methodologies.
In London, the Thameslink Programme has conducted a trial of a biodiversity offsetting methodology (Box 14).
The Thameslink Programme is a £4.6bn rail infrastructure enhancement project running from Bedford to Brighton through central London. It is Network Rail’s first project to commit to delivering a net gain in biodiversity. This means the mitigation hierarchy (avoiding and minimising impacts on biodiversity and, as a last resort, compensating for any unavoidable loss) was closely followed. All the sites were assessed using a Defra metric to establish the biodiversity baseline and compensation units. Forty two units requiring compensation were identified as unavoidable losses. These are being addressed through both onsite enhancements and biodiversity offsetting. Thameslink, supported by Parsons Brinckerhoff,
and partners London Wildlife Trust and Lambeth Council are delivering its biodiversity offset at Streatham Common, a Local Nature Reserve in South London. The offset involves new woodland planting and improving existing woodlands. It has been mainly designed to compensate for the greatest biodiversity impact (loss of a railway-locked two hectare area of trees in south London). It will also restore parts of the Great North Wood: a forest that once grew across south London. The offset achieves a net biodiversity gain and adds value for both wildlife and local communities. The Thameslink biodiversity offset has been named by Defra as a UK demonstration project.
BOX 14: THAMESLINK PROGR AMME: A NET POSITIVE BIODIVERSIT Y OFFSET TING SCHEME
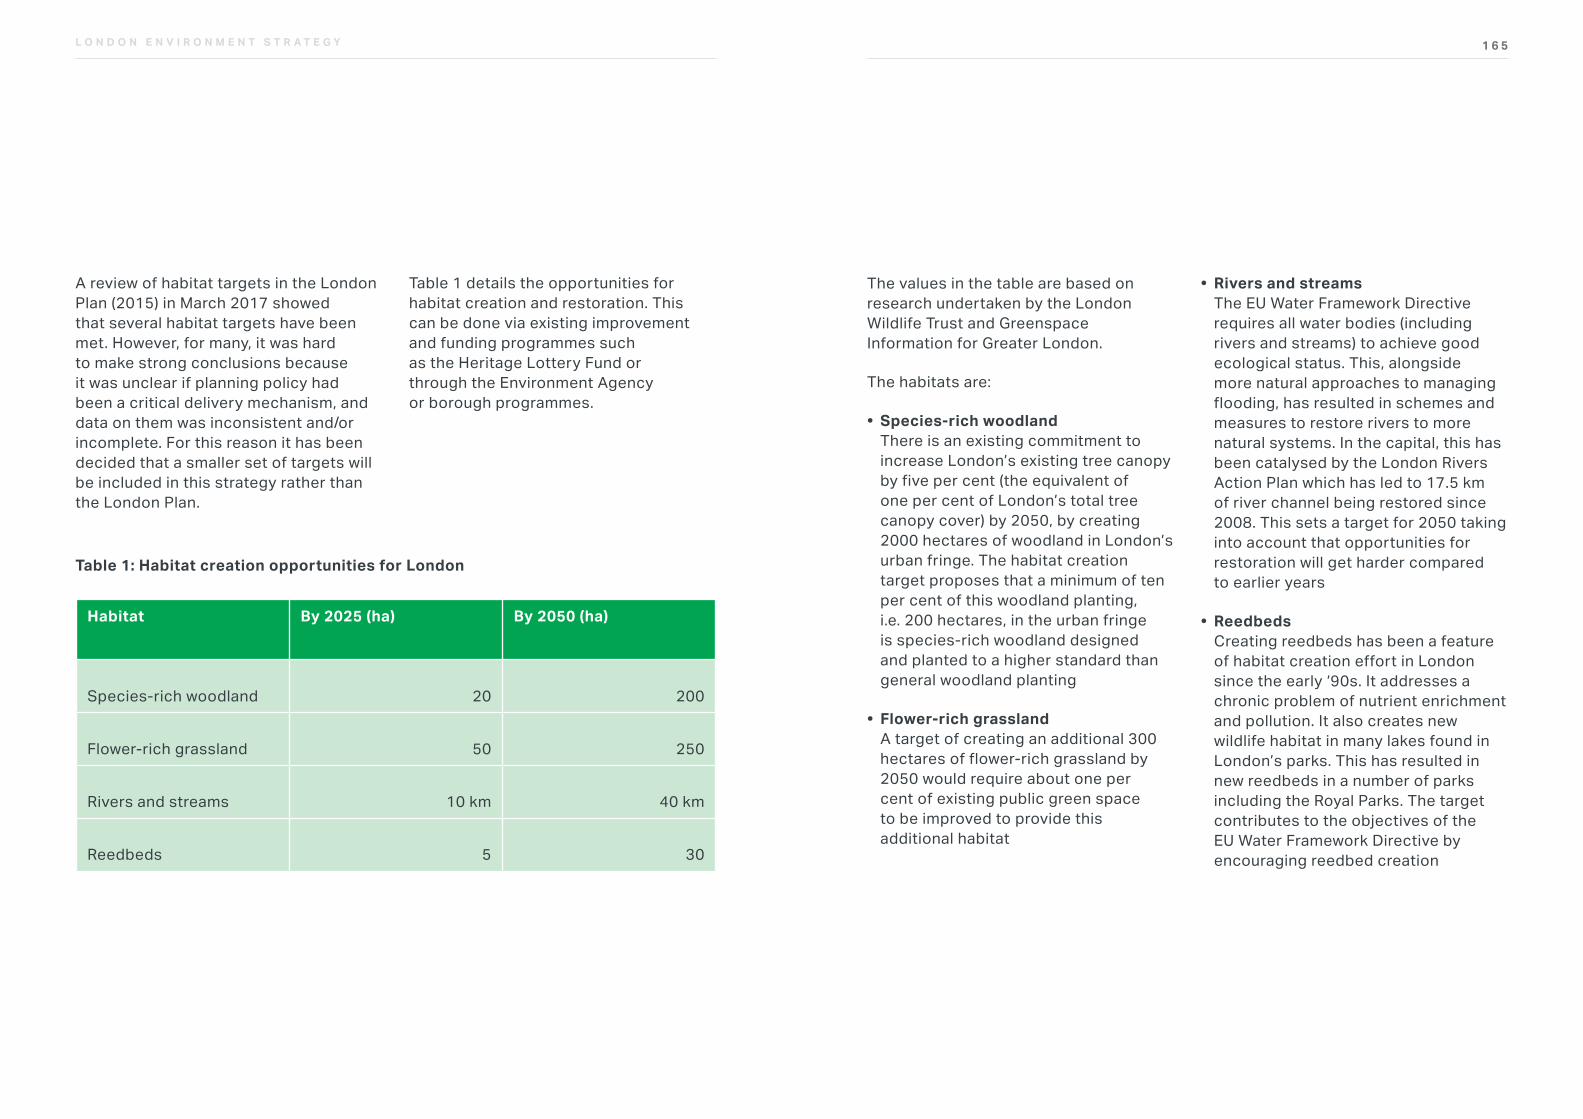
1 6 5L O N D O N E N V I R O N M E N T S T R A T E G Y
The values in the table are based on research undertaken by the London Wildlife Trust and Greenspace Information for Greater London.
The habitats are:
• Species-rich woodland There is an existing commitment to increase London’s existing tree canopy by five per cent (the equivalent of one per cent of London’s total tree canopy cover) by 2050, by creating 2000 hectares of woodland in London’s urban fringe. The habitat creation target proposes that a minimum of ten per cent of this woodland planting, i.e. 200 hectares, in the urban fringe is species-rich woodland designed and planted to a higher standard than general woodland planting
• Flower-rich grassland A target of creating an additional 300 hectares of flower-rich grassland by 2050 would require about one per cent of existing public green space to be improved to provide this additional habitat
• Rivers and streams The EU Water Framework Directive requires all water bodies (including rivers and streams) to achieve good ecological status. This, alongside more natural approaches to managing flooding, has resulted in schemes and measures to restore rivers to more natural systems. In the capital, this has been catalysed by the London Rivers Action Plan which has led to 17.5 km of river channel being restored since 2008. This sets a target for 2050 taking into account that opportunities for restoration will get harder compared to earlier years
• Reedbeds Creating reedbeds has been a feature of habitat creation effort in London since the early ‘90s. It addresses a chronic problem of nutrient enrichment and pollution. It also creates new wildlife habitat in many lakes found in London’s parks. This has resulted in new reedbeds in a number of parks including the Royal Parks. The target contributes to the objectives of the EU Water Framework Directive by encouraging reedbed creation
A review of habitat targets in the London Plan (2015) in March 2017 showed that several habitat targets have been met. However, for many, it was hard to make strong conclusions because it was unclear if planning policy had been a critical delivery mechanism, and data on them was inconsistent and/or incomplete. For this reason it has been decided that a smaller set of targets will be included in this strategy rather than the London Plan.
Table 1 details the opportunities for habitat creation and restoration. This can be done via existing improvement and funding programmes such as the Heritage Lottery Fund or through the Environment Agency or borough programmes.
Table 1: Habitat creation opportunities for London
Habitat By 2025 (ha) By 2050 (ha)
Species-rich woodland 20 200
Flower-rich grassland 50 250
Rivers and streams 10 km 40 km
Reedbeds 5 30

1 6 7L O N D O N E N V I R O N M E N T S T R A T E G Y
There needs to be more ecological connectivity and wildlife corridors between designated Sites of Nature Conservation Interest and rare or threatened habitats need to be expanded. To do this, opportunities should be sought to create or restore UK Biodiversity Action Plan habitats (‘priority habitats’) near these designated sites where these habitats are found (Figure 28).
In London these priority habitats are:
• acid grassland
• chalk grassland
• fen, marsh and swamp
• lowland meadows
• coastal and floodplain grazing marsh
• open mosaic habitats on previously developed land
• orchards
L O N D O N E N V I R O N M E N T S T R A T E G Y
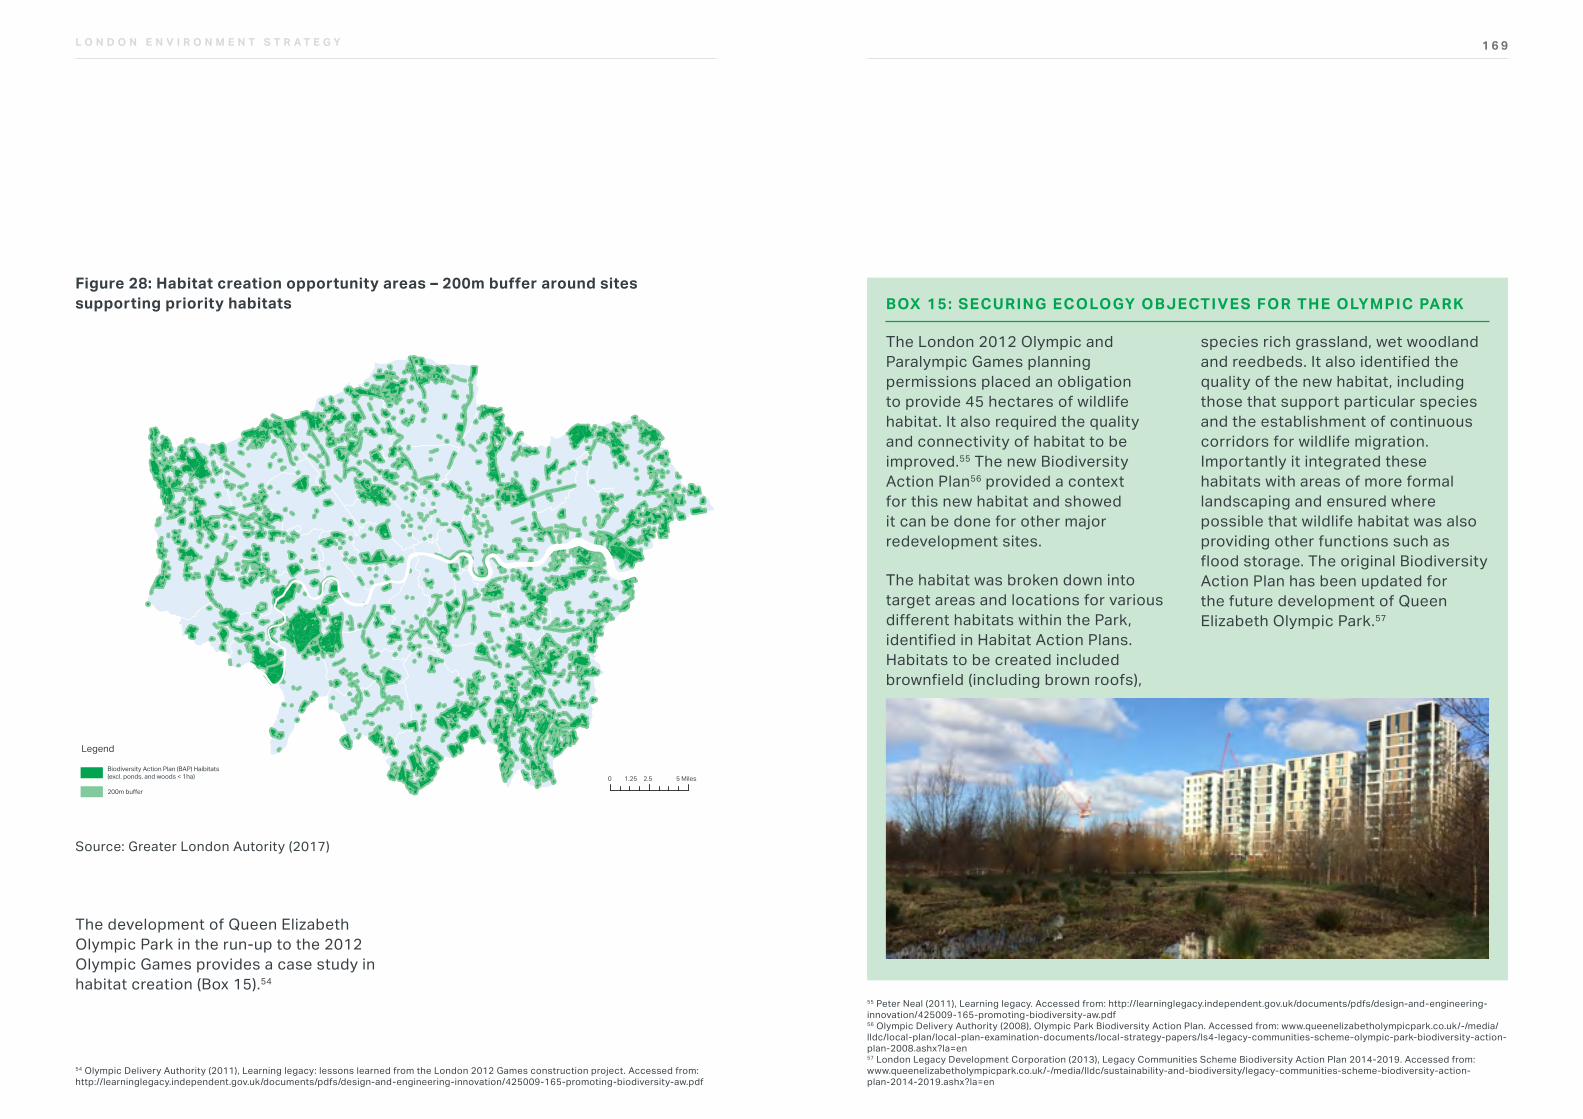
1 6 9L O N D O N E N V I R O N M E N T S T R A T E G Y
55 Peter Neal (2011), Learning legacy. Accessed from: http://learninglegacy.independent.gov.uk/documents/pdfs/design-and-engineering-innovation/425009-165-promoting-biodiversity-aw.pdf 56 Olympic Delivery Authority (2008), Olympic Park Biodiversity Action Plan. Accessed from: www.queenelizabetholympicpark.co.uk/-/media/lldc/local-plan/local-plan-examination-documents/local-strategy-papers/ls4-legacy-communities-scheme-olympic-park-biodiversity-action-plan-2008.ashx?la=en57 London Legacy Development Corporation (2013), Legacy Communities Scheme Biodiversity Action Plan 2014-2019. Accessed from: www.queenelizabetholympicpark.co.uk/-/media/lldc/sustainability-and-biodiversity/legacy-communities-scheme-biodiversity-action-plan-2014-2019.ashx?la=en
The London 2012 Olympic and Paralympic Games planning permissions placed an obligation to provide 45 hectares of wildlife habitat. It also required the quality and connectivity of habitat to be improved.55 The new Biodiversity Action Plan56 provided a context for this new habitat and showed it can be done for other major redevelopment sites.
The habitat was broken down into target areas and locations for various different habitats within the Park, identified in Habitat Action Plans. Habitats to be created included brownfield (including brown roofs),
species rich grassland, wet woodland and reedbeds. It also identified the quality of the new habitat, including those that support particular species and the establishment of continuous corridors for wildlife migration. Importantly it integrated these habitats with areas of more formal landscaping and ensured where possible that wildlife habitat was also providing other functions such as flood storage. The original Biodiversity Action Plan has been updated for the future development of Queen Elizabeth Olympic Park.57
BOX 15: SECURING ECOLOGY OBJECTIVES FOR THE OLYMPIC PARKFigure 28: Habitat creation opportunity areas – 200m buffer around sites supporting priority habitats
Fig 11: Habitat creation opportunity areas - a 200m buffer around sites supporting priority habitats
TYPE OF GRAPH: GREEN INFRASTRUCTURE
Reference
Legend
Biodiversity Action Plan (BAP) Haibitats(excl. ponds, and woods < 1ha)
200m buffer
0 1.25 2.5 5 Miles
Source: Greater London Autority (2017)
Source: Greater London Autority (2017)
The development of Queen Elizabeth Olympic Park in the run-up to the 2012 Olympic Games provides a case study in habitat creation (Box 15).54
54 Olympic Delivery Authority (2011), Learning legacy: lessons learned from the London 2012 Games construction project. Accessed from: http://learninglegacy.independent.gov.uk/documents/pdfs/design-and-engineering-innovation/425009-165-promoting-biodiversity-aw.pdf
1 7 1L O N D O N E N V I R O N M E N T S T R A T E G Y
Proposal 5.2.1d The Mayor will work with key partners to establish a cost-effective monitoring framework to ensure important natural environment data is collected consistently to inform future decision making
Key data on London’s ecology and natural environment will be collected, collated, managed and shared. This will be to monitor ecological trends and to make evidence-based decisions on the use and management of land.
The health of London’s natural environment can be measured using variables ranging from the extent and quality of habitats, to the presence and population size of species. It also includes the accessibility of green space and water quality of rivers and water bodies. The 2002 Biodiversity Strategy recommended a ten-year rolling survey of all London’s green spaces and habitats. The data to support the monitoring of these indicators is held by a number of bodies including London boroughs, statutory agencies
and environmental organisations. Volunteers and citizen scientists also contribute to the collection of this data. The result is a disparate approach that does not provide a strategic view of the state of London’s natural environment. It also demonstrates the need for a robust natural environment monitoring framework. This should identify the most relevant data required to monitor key indicators of the health of London’s environment and how to collect it in the most cost-effective way.
The 2002 Strategy also recognised the importance of collating, managing and sharing natural environment data. Consequently, a records centre was created in the form of Greenspace Information for Greater London (GiGL). This monitors the effectiveness and impact of the policies in this strategy by collecting and collating data on a London-wide basis. It also provides a cost-effective mechanism for boroughs and others to maintain their own data.
The Mayor will work with wildlife organisations to produce an updated list of priority species which are of particular conservation importance in London. All land-managers and landowners should take this into account. This should include, for example, tailoring the management of land to create habitat or features (for example, nesting and roosting sites) which support their conservation.
The ecological resilience of London cannot be maintained simply by the protection of SINCS or using other legal protections. Some species such as bats are legally protected under the Wildlife and Countryside Act 1981.58 They may also be dependent upon supplementary habitat provided by ecological features
(such as gardens and street trees, for example) that are not safeguarded by being part of the SINC network.
The Natural Environment and Rural Communities Act 2006 lists species that are of principal importance for the conservation of biodiversity (‘priority species’). The conservation status of these species must be taken into account by public bodies when making decisions about the use and management of land.59
Appendix 2 provides a list of the priority species identified in London. It has information about the types of habitats and features on which they depend and the boroughs where they have been recorded.60
58 JNCC (n.d.) Species protection and legislation. Accessed from: http://jncc.defra.gov.uk/page-1747 59 Natural England (n.d.), Habitats and species of principal importance in England. Accessed from: http://webarchive.nationalarchives.gov.uk/20140605090108/http:/www.naturalengland.org.uk/ourwork/conservation/biodiversity/protectandmanage/habsandspeciesimportance.aspx60 GiGL (n.d.) London’s BAP Priority Species. Accessed from: www.gigl.org.uk/london-bap-priority-species/
1 7 3L O N D O N E N V I R O N M E N T S T R A T E G Y
physical and mental health. This will in turn reduce health expenditures and improve labour productivity.
Policy 5.3.1 To address under-investment and improve the management of London’s green infrastructure through new business models and improved awareness of the benefits of London’s green infrastructure
Proposal 5.3.1a The Mayor will establish a London Green Spaces Commission to develop new models for the delivery and management of London’s green infrastructure
The Mayor will work with London Councils, GLA group and civil society organisations to establish a time limited London Green Spaces Commission to explore the best options for the following:
• developing financing frameworks that identify a range of models to generate resources. Also, an investor and fundraising plan to include options for private and voluntary sector contributions and from other sources of public sector finance (for example health)
• organisational models including service transformation variations oncharitable trusts, social enterprise models or other option, which improve the existing institutional landscape for managing parks and green spaces
The functions of green infrastructure are usually optimised by managing these at a location and scale that fits the service provided. For example, flood prevention and management is best done at the river catchment scale, as interventions upstream can have a profound impact (positive or negative) lower down the catchment.
The political boundaries of the city are rarely aligned to the appropriate landscape scale. However, there have been recent examples through sub-regional partnerships such as Wandle Valley Regional Park Trust and the Colne Valley Regional Park Community Interest Company which are based on the geography of London’s river valleys. These are starting to illustrate the benefits of planning and working across administrative boundaries.61,62
61 Wandle Valley (n.d.), Welcome to the Wandle Valley Regional Park. Accessed from: http://wandlevalleypark.co.uk// 62 Colne Valley Regional Park (n.d.), Colne Valley Regional Park. Accessed from: www.colnevalleypark.org.uk/
OBJECTIVE 5.3 VALUE LONDON’S NATURAL CAPITAL AS AN ECONOMIC ASSET AND SUPPORT GREATER INVESTMENT IN GREEN INFRASTRUCTURE
Making London a National Park City brings opportunities to engage Londoners to create a common vision of the environmental, social and economic benefits of London’s green infrastructure. It provides a framework to promote investment in London’s natural capital and green infrastructure. This will ensure effective coordination, better valuation and more innovation from all those involved in protecting and enhancing London’s environment.
The Natural Capital Committee’s third report to government showed that carefully planned investments in natural capital, targeted at the best locations, will provide huge value for money and generate large economic returns. These are competitive with the returns from more traditional infrastructure investments. In particular, urban green spaces offer significant potential for improvements in
“ Making London a National Park City brings opportunities to engage Londoners to create a common vision of the environmental, social and economic benefits of London’s green infrastructure.”
L O N D O N E N V I R O N M E N T S T R A T E G Y
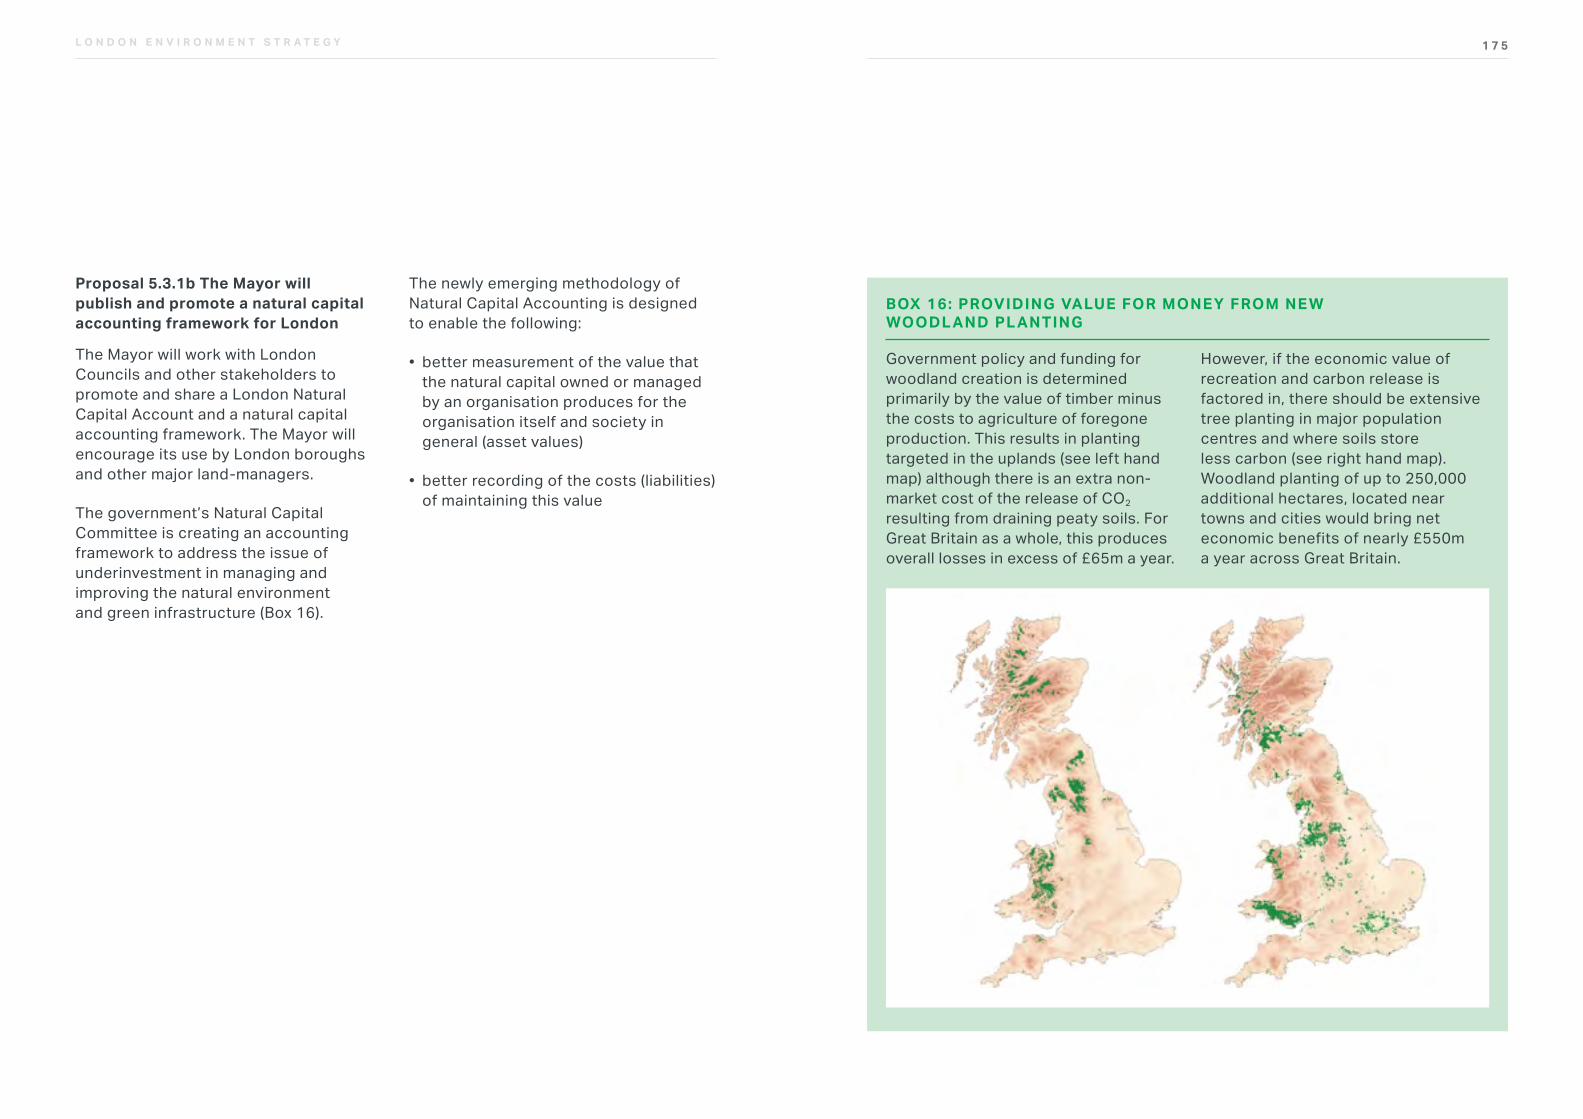
1 7 5L O N D O N E N V I R O N M E N T S T R A T E G Y
Government policy and funding for woodland creation is determined primarily by the value of timber minus the costs to agriculture of foregone production. This results in planting targeted in the uplands (see left hand map) although there is an extra non-market cost of the release of CO2 resulting from draining peaty soils. For Great Britain as a whole, this produces overall losses in excess of £65m a year.
However, if the economic value of recreation and carbon release is factored in, there should be extensive tree planting in major population centres and where soils store less carbon (see right hand map). Woodland planting of up to 250,000 additional hectares, located near towns and cities would bring net economic benefits of nearly £550m a year across Great Britain.
BOX 16: PROVIDING VALUE FOR MONEY FROM NE W WOODL AND PL ANTING
Proposal 5.3.1b The Mayor will publish and promote a natural capital accounting framework for London
The Mayor will work with London Councils and other stakeholders to promote and share a London Natural Capital Account and a natural capital accounting framework. The Mayor will encourage its use by London boroughs and other major land-managers.
The government’s Natural Capital Committee is creating an accounting framework to address the issue of underinvestment in managing and improving the natural environment and green infrastructure (Box 16).
The newly emerging methodology of Natural Capital Accounting is designed to enable the following:
• better measurement of the value that the natural capital owned or managed by an organisation produces for the organisation itself and society in general (asset values)
• better recording of the costs (liabilities) of maintaining this value

1 7 7L O N D O N E N V I R O N M E N T S T R A T E G Y
This approach is particularly relevant to informing policy and funding requirements for London’s green infrastructure. A Natural Capital Account for London’s public parks and green spaces will be published alongside the final version of this strategy. It will reveal the economic value of public parks and green spaces. It will support the business case for investment in these spaces by contrast this with the significant reduction in spending in these vital assets in recent years as a consequence of constraints in sector public funding. Initial conclusions are that London’s public green space has a combined asset value in the order of tens of billions.
1 7 9L O N D O N E N V I R O N M E N T S T R A T E G Y
63 EcoWatch (2016), Paris Becomes One of the Most Garden-Friendly Cities in the World. Accessed from: www.ecowatch.com/paris-urban-gardening-2039785049.html 64 Mairie de Paris (n.d.), Le permis de végétaliser. Accessed from: www.paris.fr/permisdevegetaliser
This will include:
• alignment of funding streams and objectives of a wide range of partners, including pooling of funding at sub-regional level or across borough boundaries
• using new resources that have not traditionally been accessible to those delivering green infrastructure projects (for example philanthropic funding)
• resourcing model demonstration projects to showcase best practice and set the standards and practices for future interventions
Proposal 5.3.1e The Mayor will work with civil society organisations to develop a series of campaigns that engage Londoners and enable them to enjoy, participate in and contribute to London becoming a National Park City
The Mayor will support campaigns by civil society organisations that provide information to Londoners on how they can contribute to improving London’s green infrastructure.
It is vital that the public engage with and participate in the idea of London as a National Park City. Many of the activities needed to meet National Park City objectives require action by Londoners in and around the places in which they live and work. This is supported by information and guidance like Groundwork London’s Climate Proofing Housing Landscapes project (Box 17) and the Royal Horticultural Society’s Greening Grey Britain campaign.
The Mayor will work with partners to develop specific campaigns that are likely to resonate with a wide range of Londoners. For example, guidance and advice on how Londoners can reduce their own risk of exposure to poor air quality by appropriate planting in front gardens, or promoting a ‘licence to green’ which gives residents permission to garden public spaces as has been trialled in Paris.63,64
Proposal 5.3.1c The Mayor will work with a range of stakeholders to help provide a stronger evidence base for green infrastructure programmes, projects and interventions to identify priority areas for green infrastructure
The Mayor will work with stakeholders to review and update the framework provided by the All London Green Grid. An All London Green Grid ‘challenge map’ will be developed to identify priority areas for green infrastructure investment.
The All London Green Grid is a green infrastructure policy framework set out in Supplementary Planning Guidance (SPG) to the London Plan. It identified the various functions and benefits of green infrastructure. However, it did not prioritise projects and interventions based on what function might be of particular benefit in each location. Since its publication in 2012, more fine-grain digitised spatial and geographic data has become available. This allows a more sophisticated assessment of which green infrastructure interventions might be best suited to particular locations.
Proposal 5.3.1d The Mayor will explore new approaches to investment to make sure that there is financial support for strategic green infrastructure projects
To develop new or improved funding streams the Mayor will work with others to determine how best to access funding. This includes major sources of philanthropic funding, new resources from environmental levies, and charges from further fiscal devolution. The Mayor will also convene annual strategy meetings involving major funding bodies. This will ensure better coordination and targeting of available funding.
There is increasing recognition of the potential economic benefit of investment in green infrastructure. Yet the funding of strategic green infrastructure projects still falls largely to those parts of the public sector and their civil society partners that work on environmental outcomes. An increase in green infrastructure investment will require access to new funding sources, including funding from the private sector, and better use and coordination of existing public and charitable funding streams.
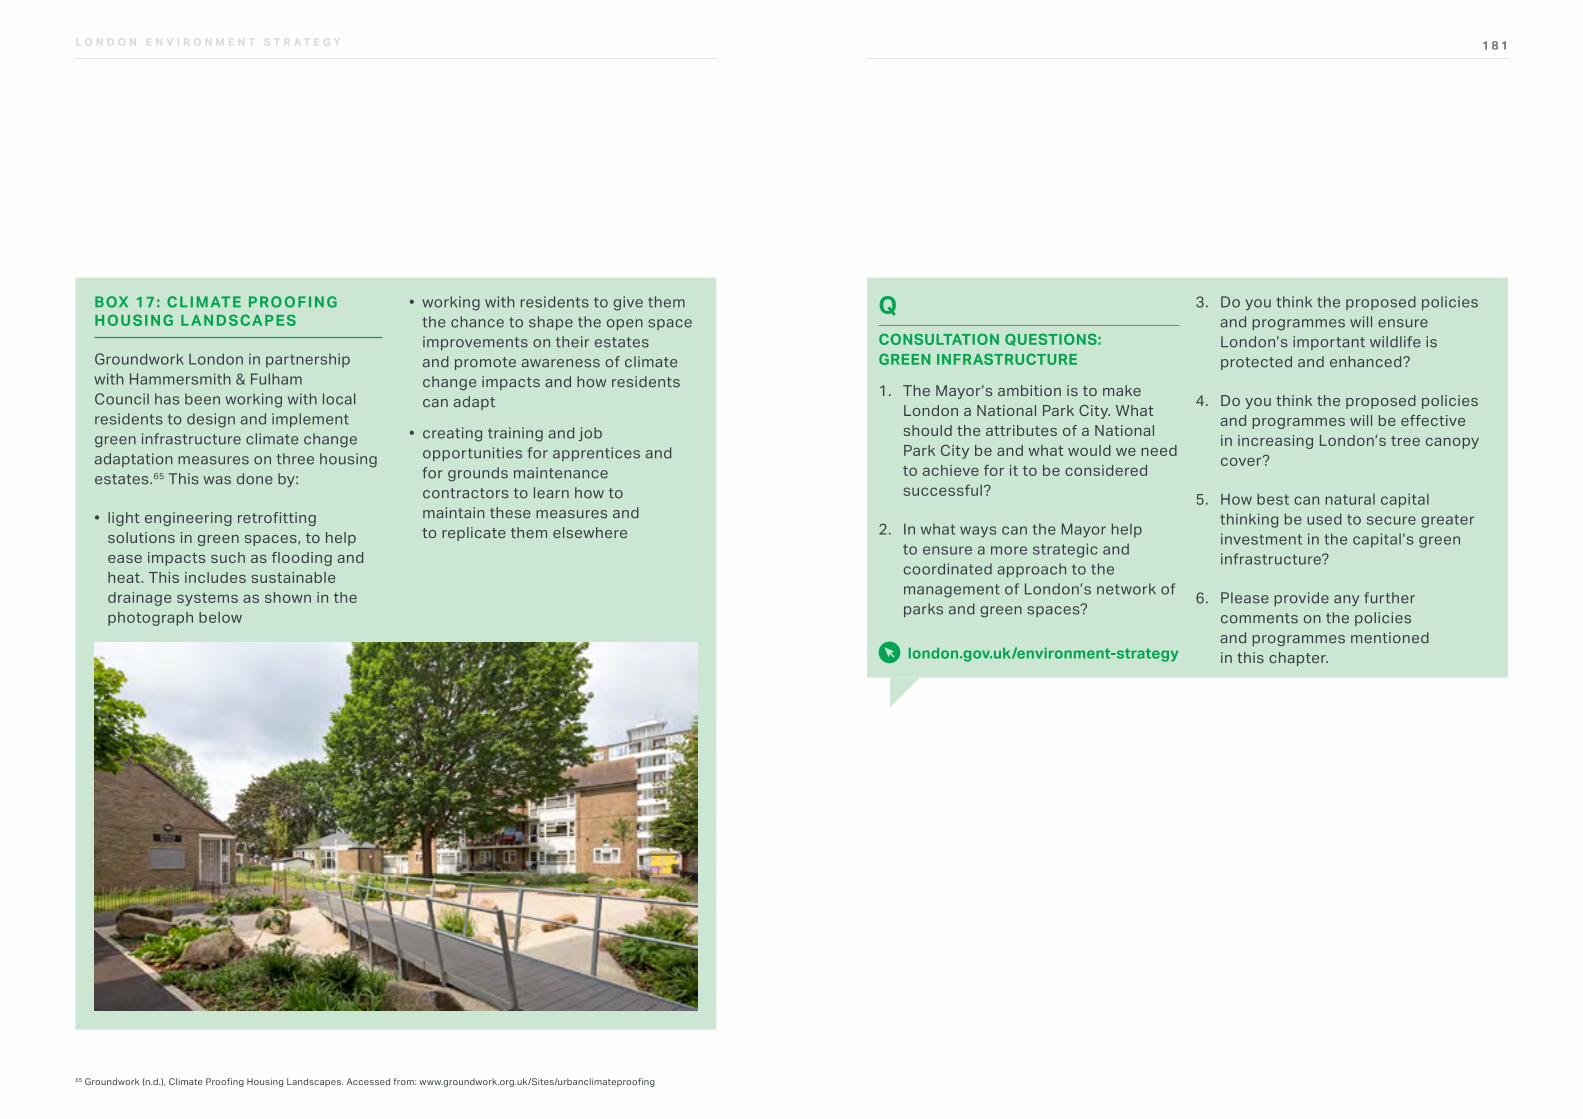
1 8 1L O N D O N E N V I R O N M E N T S T R A T E G Y
QCONSULTATION QUESTIONS: GREEN INFRASTRUCTURE
1. The Mayor’s ambition is to make London a National Park City. What should the attributes of a National Park City be and what would we need to achieve for it to be considered successful?
2. In what ways can the Mayor help to ensure a more strategic and coordinated approach to the management of London’s network of parks and green spaces?
3. Do you think the proposed policies and programmes will ensure London’s important wildlife is protected and enhanced?
4. Do you think the proposed policies and programmes will be effective in increasing London’s tree canopy cover?
5. How best can natural capital thinking be used to secure greater investment in the capital’s green infrastructure?
6. Please provide any further comments on the policies and programmes mentioned in this chapter. london.gov.uk/environment-strategy
BOX 17: CLIMATE PROOFING HOUSING L ANDSCAPES
Groundwork London in partnership with Hammersmith & Fulham Council has been working with local residents to design and implement green infrastructure climate change adaptation measures on three housing estates.65 This was done by:
• light engineering retrofitting solutions in green spaces, to help ease impacts such as flooding and heat. This includes sustainable drainage systems as shown in the photograph below
• working with residents to give them the chance to shape the open space improvements on their estates and promote awareness of climate change impacts and how residents can adapt
• creating training and job opportunities for apprentices and for grounds maintenance contractors to learn how to maintain these measures and to replicate them elsewhere
65 Groundwork (n.d.), Climate Proofing Housing Landscapes. Accessed from: www.groundwork.org.uk/Sites/urbanclimateproofing
1 8 3
Chapter 6: Climate change mitigation and energy
1 8 3L O N D O N E N V I R O N M E N T S T R A T E G Y
1 8 5L O N D O N E N V I R O N M E N T S T R A T E G Y
Making London zero carbon can ensure long-term economic growth and new business opportunities, alongside wider environmental benefits, such as improved air quality and a healthier society. The Mayor’s Energy for Londoners programme aims to transform London’s energy system by reducing energy demand and improving the security of supply by ensuring more local energy is produced. This will help keep energy bills fairer, thus protecting the most vulnerable, and reducing carbon emissions.
This change will not be without its challenges. Many of the technologies and fuels needed to achieve this goal already exist, however, more energy infrastructure will be needed to support London’s growing population and this must be low carbon. National government, London boroughs, communities and Londoners themselves must play a part in leading this change.
To fully decarbonise London, GHG emissions will need to be reduced from around 38 megatons today to near zero by 2050. To make this happen, London will require careful but far reaching reforms, which are underpinned by three high-level objectives:
• decarbonise London’s homes and workplaces while protecting the most vulnerable by tackling fuel poverty
• develop clean and smart, integrated energy systems using local and renewable energy resources
• deliver a zero emission transport network by 2050.
LONDON’S ENVIRONMENT NOW
The key evidence to support the Mayor’s ambitions for a zero carbon London by 2050 is summarised below. You can find out more about the evidence behind the policies and proposals in Appendix 2.
The UN Paris Climate Agreement commits to keeping global warming below 2°C. This agreement has shown that cities can work together to plot a path to a lower carbon future. In addition, the 2008 Climate Change Act requires an at least 80 per cent reduction in CO2 emissions (compared to 1990 levels) for the whole of the UK. For more details on the legislative and policy background see Appendix 4, and for information on the main responsibilities of a range of organisations see Appendix 3.
66 IPCC AR5 range for BaU is 2.6 to 4.8 by 2100: https://www.ipcc.ch/report/ar5/
INTRODUCTION
If the world continues emitting greenhouse gases (GHGs) at today’s levels, average global temperatures could rise by up to five degrees Celsius by the end of this century.66 London, among other global cities, must play a leading role in helping to reduce these emissions.
The Mayor will re-establish London’s position as a leader in tackling climate change by setting a target for London to become zero carbon by 2050. Making London zero carbon will require economy-wide decarbonisation. This will involve changes to the way in which Londoners travel, work and live, including how energy is sourced and generated. Energy efficiency will have to increase dramatically, leading to homes and workplaces being highly insulated. The fossil fuels used for heating and powering buildings, transport, and industry will have to be replaced by renewable electricity and gas. London’s grids will need to become smarter at balancing energy demand with available supply, and low carbon travel will be the default option.
AIM London will be a zero carbon city by 2050, with energy efficient buildings, clean transport and clean energy.
L O N D O N E N V I R O N M E N T S T R A T E G Y
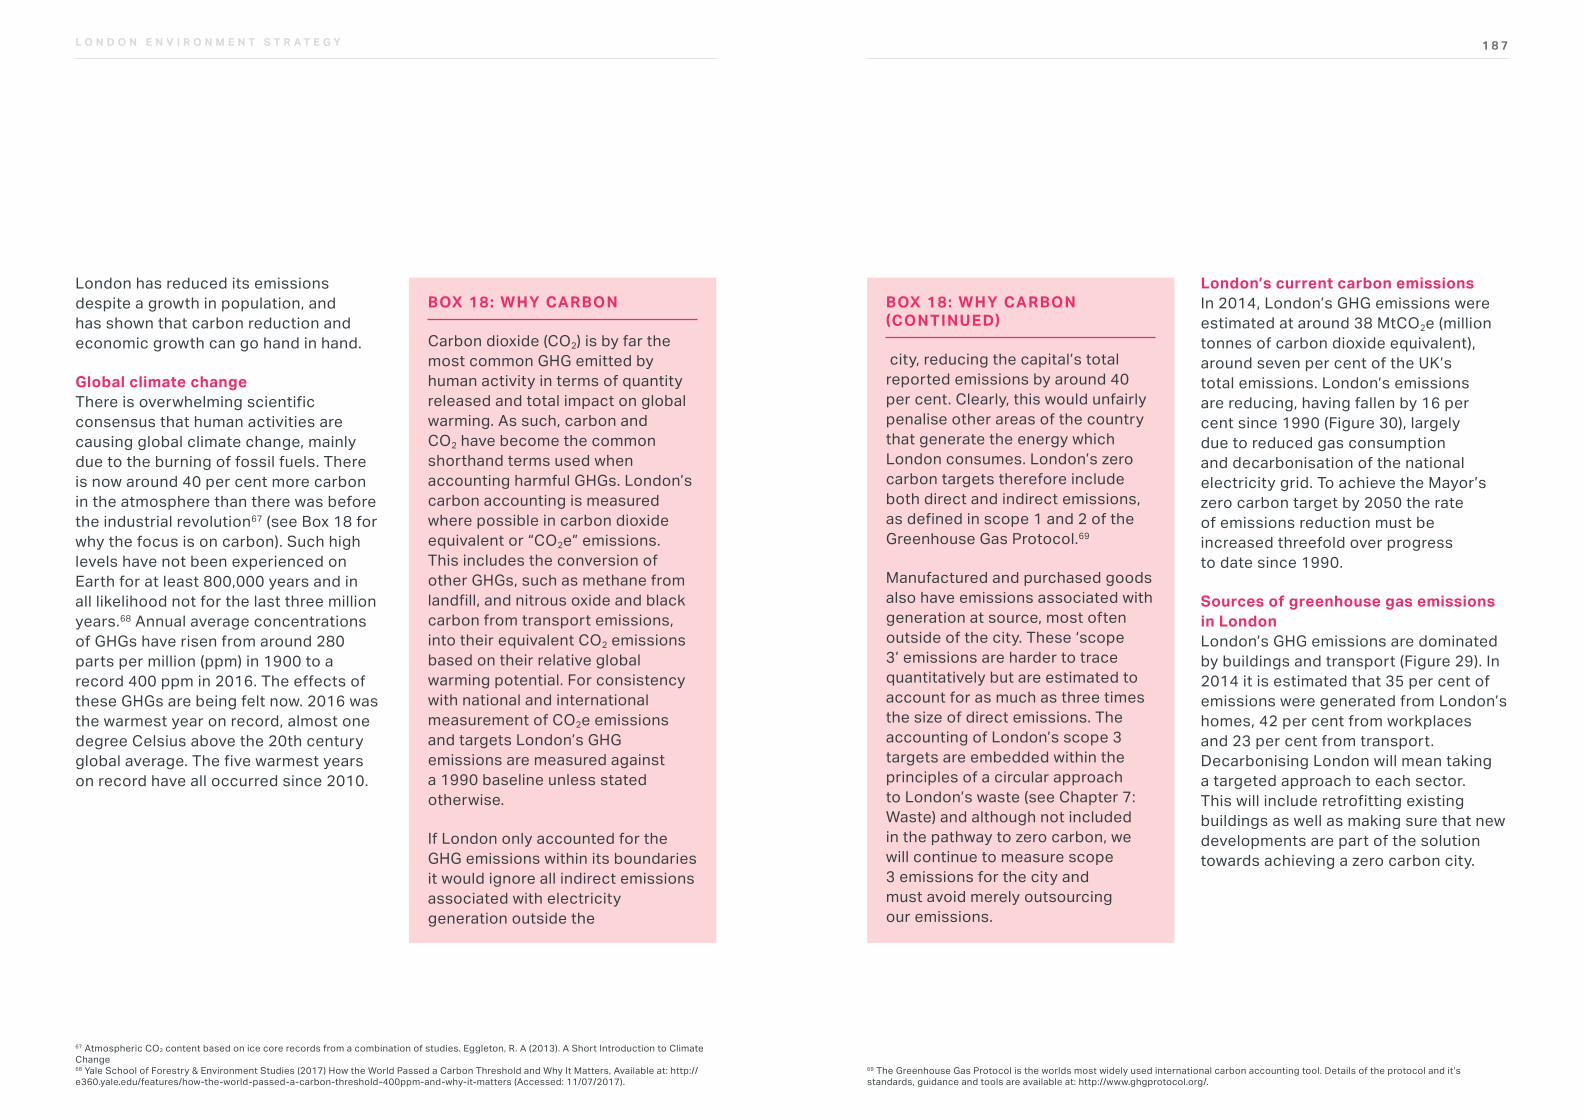
1 8 7L O N D O N E N V I R O N M E N T S T R A T E G Y
69 The Greenhouse Gas Protocol is the worlds most widely used international carbon accounting tool. Details of the protocol and it’s standards, guidance and tools are available at: http://www.ghgprotocol.org/.
BOX 18: WHY CARBON (CONTINUED)
city, reducing the capital’s total reported emissions by around 40 per cent. Clearly, this would unfairly penalise other areas of the country that generate the energy which London consumes. London’s zero carbon targets therefore include both direct and indirect emissions, as defined in scope 1 and 2 of the Greenhouse Gas Protocol.69
Manufactured and purchased goods also have emissions associated with generation at source, most often outside of the city. These ‘scope 3’ emissions are harder to trace quantitatively but are estimated to account for as much as three times the size of direct emissions. The accounting of London’s scope 3 targets are embedded within the principles of a circular approach to London’s waste (see Chapter 7: Waste) and although not included in the pathway to zero carbon, we will continue to measure scope 3 emissions for the city and must avoid merely outsourcing our emissions.
London’s current carbon emissions In 2014, London’s GHG emissions were estimated at around 38 MtCO2e (million tonnes of carbon dioxide equivalent), around seven per cent of the UK’s total emissions. London’s emissions are reducing, having fallen by 16 per cent since 1990 (Figure 30), largely due to reduced gas consumption and decarbonisation of the national electricity grid. To achieve the Mayor’s zero carbon target by 2050 the rate of emissions reduction must be increased threefold over progress to date since 1990.
Sources of greenhouse gas emissions in LondonLondon’s GHG emissions are dominated by buildings and transport (Figure 29). In 2014 it is estimated that 35 per cent of emissions were generated from London’s homes, 42 per cent from workplaces and 23 per cent from transport. Decarbonising London will mean taking a targeted approach to each sector. This will include retrofitting existing buildings as well as making sure that new developments are part of the solution towards achieving a zero carbon city.
BOX 18: WHY CARBON
Carbon dioxide (CO2) is by far the most common GHG emitted by human activity in terms of quantity released and total impact on global warming. As such, carbon and CO2 have become the common shorthand terms used when accounting harmful GHGs. London’s carbon accounting is measured where possible in carbon dioxide equivalent or “CO2e” emissions. This includes the conversion of other GHGs, such as methane from landfill, and nitrous oxide and black carbon from transport emissions, into their equivalent CO2 emissions based on their relative global warming potential. For consistency with national and international measurement of CO2e emissions and targets London’s GHG emissions are measured against a 1990 baseline unless stated otherwise.
If London only accounted for the GHG emissions within its boundaries it would ignore all indirect emissions associated with electricity generation outside the
67 Atmospheric CO2 content based on ice core records from a combination of studies. Eggleton, R. A (2013). A Short Introduction to Climate Change 68 Yale School of Forestry & Environment Studies (2017) How the World Passed a Carbon Threshold and Why It Matters, Available at: http://e360.yale.edu/features/how-the-world-passed-a-carbon-threshold-400ppm-and-why-it-matters (Accessed: 11/07/2017).
London has reduced its emissions despite a growth in population, and has shown that carbon reduction and economic growth can go hand in hand.
Global climate changeThere is overwhelming scientific consensus that human activities are causing global climate change, mainly due to the burning of fossil fuels. There is now around 40 per cent more carbon in the atmosphere than there was before the industrial revolution67 (see Box 18 for why the focus is on carbon). Such high levels have not been experienced on Earth for at least 800,000 years and in all likelihood not for the last three million years.68 Annual average concentrations of GHGs have risen from around 280 parts per million (ppm) in 1900 to a record 400 ppm in 2016. The effects of these GHGs are being felt now. 2016 was the warmest year on record, almost one degree Celsius above the 20th century global average. The five warmest years on record have all occurred since 2010.
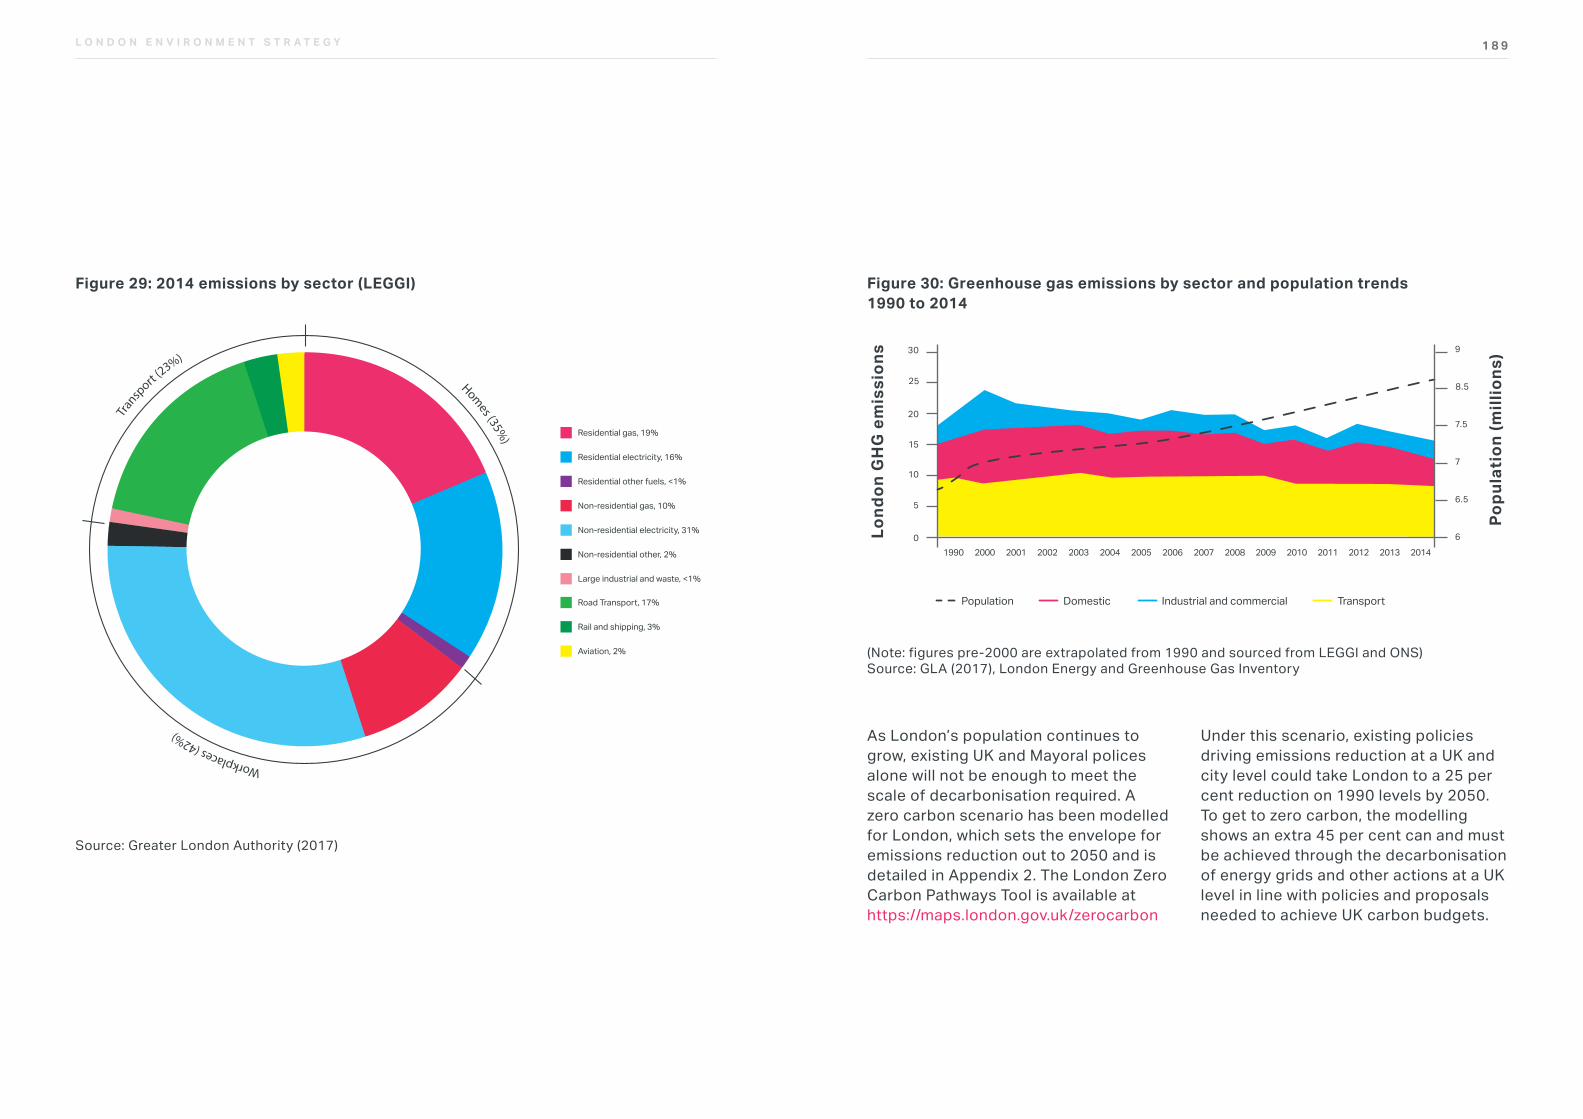
1 8 9L O N D O N E N V I R O N M E N T S T R A T E G Y
As London’s population continues to grow, existing UK and Mayoral polices alone will not be enough to meet the scale of decarbonisation required. A zero carbon scenario has been modelled for London, which sets the envelope for emissions reduction out to 2050 and is detailed in Appendix 2. The London Zero Carbon Pathways Tool is available at https://maps.london.gov.uk/zerocarbon
Under this scenario, existing policies driving emissions reduction at a UK and city level could take London to a 25 per cent reduction on 1990 levels by 2050. To get to zero carbon, the modelling shows an extra 45 per cent can and must be achieved through the decarbonisation of energy grids and other actions at a UK level in line with policies and proposals needed to achieve UK carbon budgets.
Figure 30: Greenhouse gas emissions by sector and population trends 1990 to 2014
Fig 1: Greenhouse gas emissions and population in London, 1990 to 2014
Source: GLA (2017), London Energy and Greenhouse Gas Inventory
Available at: data.london.gov.uk/dataset?q=leggi
TYPE OF GRAPH: CLIMATE CHANGE AND ENERGY
Reference
Lond
on G
HG
em
issi
ons
Popu
lati
on (m
illio
ns)
DomesticPopulation Industrial and commercial Transport
2001 2002 2003 2004 2005 2006 2007 2008 2009 2010 2011 2012 2013 2014200019900
5
15
10
20
25
30
6
7
6.5
7.5
8.5
9
(Note: figures pre-2000 are extrapolated from 1990 and sourced from LEGGI and ONS) Source: GLA (2017), London Energy and Greenhouse Gas Inventory
Figure 29: 2014 emissions by sector (LEGGI)
Residential gas, 19%
Residential electricity, 16%
Residential other fuels, <1%
Non-residential gas, 10%
Non-residential electricity, 31%
Non-residential other, 2%
Large industrial and waste, <1%
Road Transport, 17%
Rail and shipping, 3%
Aviation, 2%
Tran
sp
ort (23%)
Homes (35%
)
Workplaces (42%)
Source: Greater London Authority (2017)
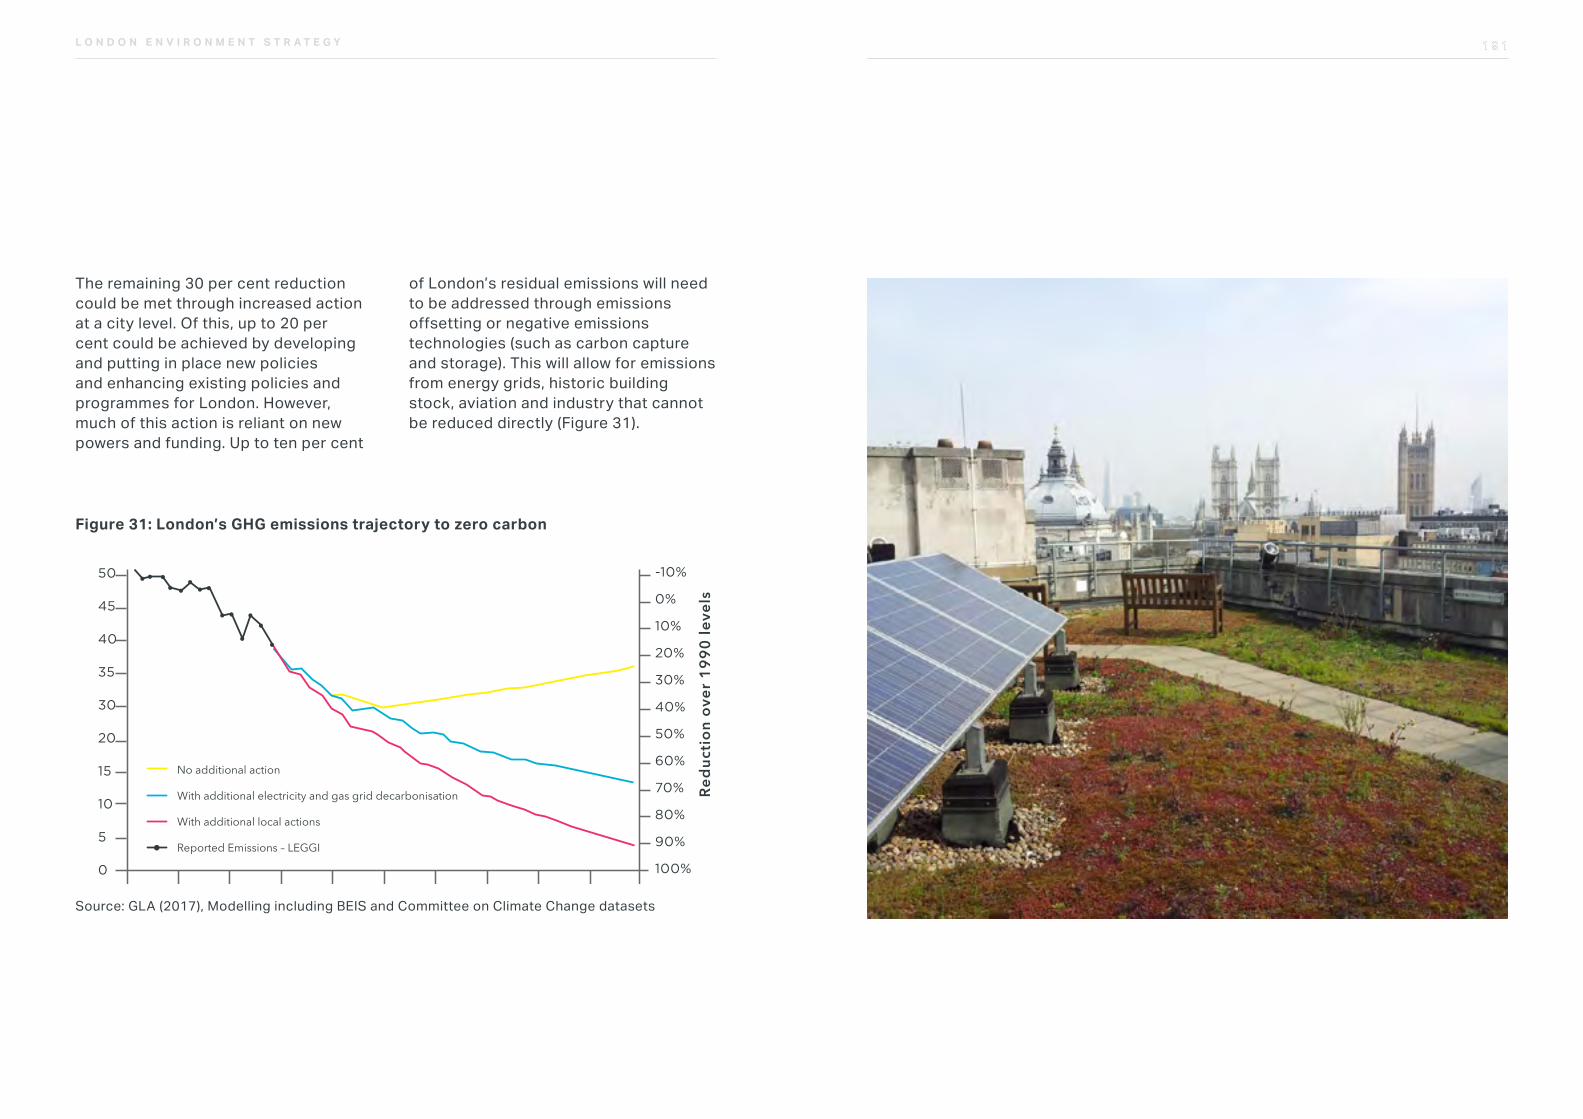
1 9 1L O N D O N E N V I R O N M E N T S T R A T E G Y 1 9 1
The remaining 30 per cent reduction could be met through increased action at a city level. Of this, up to 20 per cent could be achieved by developing and putting in place new policies and enhancing existing policies and programmes for London. However, much of this action is reliant on new powers and funding. Up to ten per cent
of London’s residual emissions will need to be addressed through emissions offsetting or negative emissions technologies (such as carbon capture and storage). This will allow for emissions from energy grids, historic building stock, aviation and industry that cannot be reduced directly (Figure 31).
Figure 31: London’s GHG emissions trajectory to zero carbon
Fig 2: London's zero carbon GHG emissions trajectory
Source: GLA (2017), Modelling including BEIS and CCC datasets
Available at: www.london.gov.uk/what-we-do/environment/climate-change-weather-and-water/climate-change-and-weather
TYPE OF GRAPH: CLIMATE CHANGE AND ENERGY
Reference
Lond
on’s
em
issi
ons
(MC
O2e
)
Redu
ctio
n ov
er 1
990
leve
ls
2000
0
5
10
15
20
30
35
40
45
50
2005 2010 2015 2020 2025 2030 2035 2040 2045 2050
100%
90%
80%
70%
60%
50%
40%
30%
20%
10%
0%
-10%
No additional action
With additional electricity and gas grid decarbonisation
With additional local actions
Reported Emissions – LEGGI
Source: GLA (2017), Modelling including BEIS and Committee on Climate Change datasets
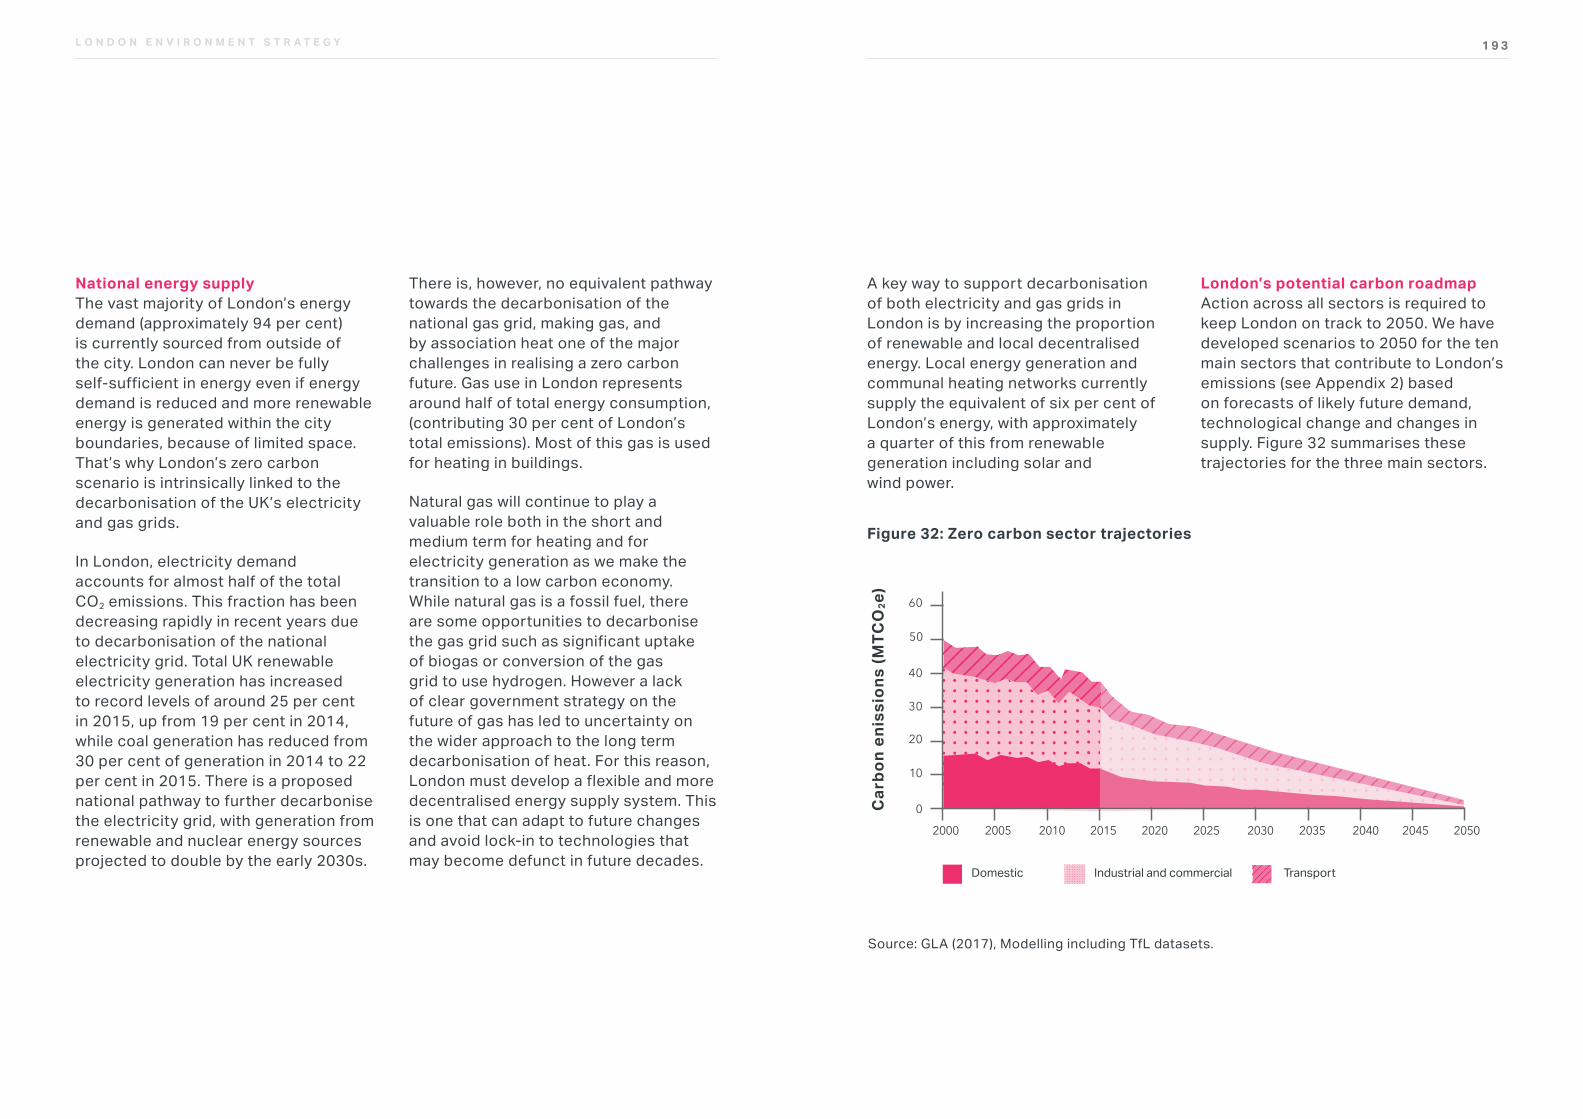
1 9 3L O N D O N E N V I R O N M E N T S T R A T E G Y
A key way to support decarbonisation of both electricity and gas grids in London is by increasing the proportion of renewable and local decentralised energy. Local energy generation and communal heating networks currently supply the equivalent of six per cent of London’s energy, with approximately a quarter of this from renewable generation including solar and wind power.
London’s potential carbon roadmap Action across all sectors is required to keep London on track to 2050. We have developed scenarios to 2050 for the ten main sectors that contribute to London’s emissions (see Appendix 2) based on forecasts of likely future demand, technological change and changes in supply. Figure 32 summarises these trajectories for the three main sectors.
Figure 32: Zero carbon sector trajectories
Fig 3: Zero carbon sector trajectories
Source: GLA (2017), Modelling including TfL datasets
Available at: www.london.gov.uk/what-we-do/environment/climate-change-weather-and-water/climate-change-and-weather
TYPE OF GRAPH: CLIMATE CHANGE AND ENERGY
Reference
Car
bon
enis
sion
s (M
TCO
2e)
Domestic Industrial and commercial Transport
20502010 2015 2020 2025 2030 2035 2040 204520052000
0
10
30
20
40
50
60
Source: GLA (2017), Modelling including TfL datasets.
National energy supplyThe vast majority of London’s energy demand (approximately 94 per cent) is currently sourced from outside of the city. London can never be fully self-sufficient in energy even if energy demand is reduced and more renewable energy is generated within the city boundaries, because of limited space. That’s why London’s zero carbon scenario is intrinsically linked to the decarbonisation of the UK’s electricity and gas grids.
In London, electricity demand accounts for almost half of the total CO2 emissions. This fraction has been decreasing rapidly in recent years due to decarbonisation of the national electricity grid. Total UK renewable electricity generation has increased to record levels of around 25 per cent in 2015, up from 19 per cent in 2014, while coal generation has reduced from 30 per cent of generation in 2014 to 22 per cent in 2015. There is a proposed national pathway to further decarbonise the electricity grid, with generation from renewable and nuclear energy sources projected to double by the early 2030s.
There is, however, no equivalent pathway towards the decarbonisation of the national gas grid, making gas, and by association heat one of the major challenges in realising a zero carbon future. Gas use in London represents around half of total energy consumption, (contributing 30 per cent of London’s total emissions). Most of this gas is used for heating in buildings.
Natural gas will continue to play a valuable role both in the short and medium term for heating and for electricity generation as we make the transition to a low carbon economy. While natural gas is a fossil fuel, there are some opportunities to decarbonise the gas grid such as significant uptake of biogas or conversion of the gas grid to use hydrogen. However a lack of clear government strategy on the future of gas has led to uncertainty on the wider approach to the long term decarbonisation of heat. For this reason, London must develop a flexible and more decentralised energy supply system. This is one that can adapt to future changes and avoid lock-in to technologies that may become defunct in future decades.
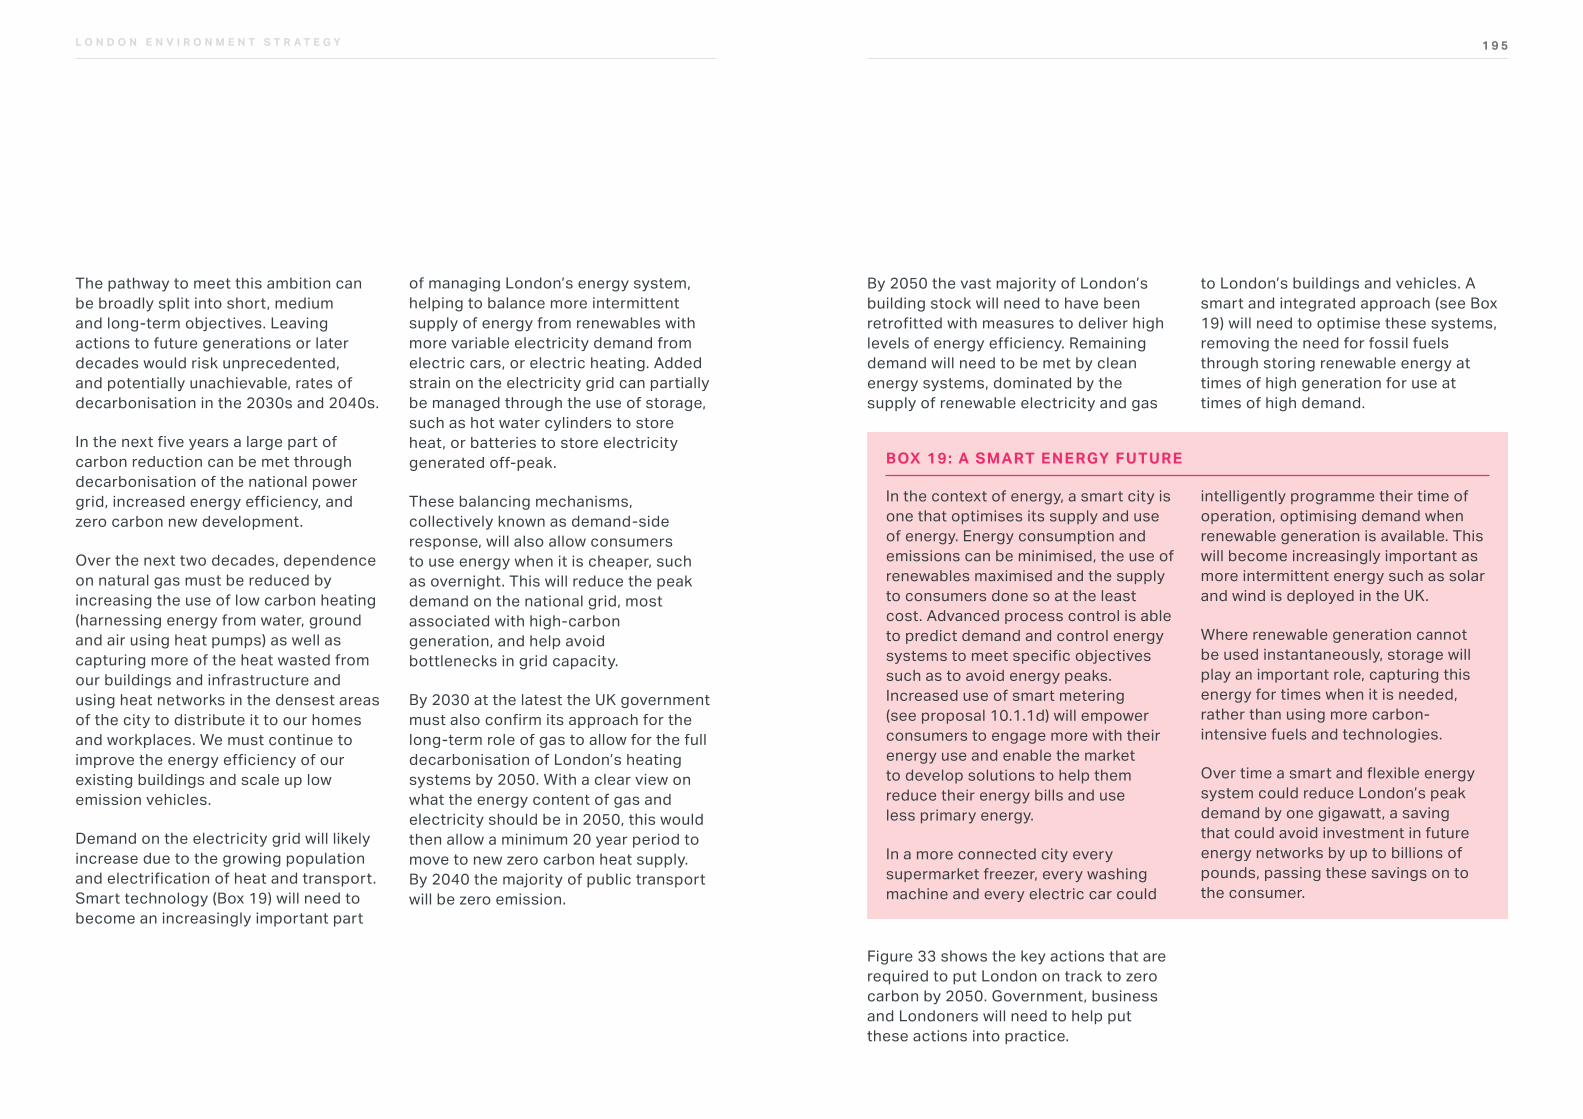
1 9 5L O N D O N E N V I R O N M E N T S T R A T E G Y
By 2050 the vast majority of London’s building stock will need to have been retrofitted with measures to deliver high levels of energy efficiency. Remaining demand will need to be met by clean energy systems, dominated by the supply of renewable electricity and gas
to London’s buildings and vehicles. A smart and integrated approach (see Box 19) will need to optimise these systems, removing the need for fossil fuels through storing renewable energy at times of high generation for use at times of high demand.
Figure 33 shows the key actions that are required to put London on track to zero carbon by 2050. Government, business and Londoners will need to help put these actions into practice.
In the context of energy, a smart city is one that optimises its supply and use of energy. Energy consumption and emissions can be minimised, the use of renewables maximised and the supply to consumers done so at the least cost. Advanced process control is able to predict demand and control energy systems to meet specific objectives such as to avoid energy peaks. Increased use of smart metering (see proposal 10.1.1d) will empower consumers to engage more with their energy use and enable the market to develop solutions to help them reduce their energy bills and use less primary energy.
In a more connected city every supermarket freezer, every washing machine and every electric car could
intelligently programme their time of operation, optimising demand when renewable generation is available. This will become increasingly important as more intermittent energy such as solar and wind is deployed in the UK.
Where renewable generation cannot be used instantaneously, storage will play an important role, capturing this energy for times when it is needed, rather than using more carbon-intensive fuels and technologies.
Over time a smart and flexible energy system could reduce London’s peak demand by one gigawatt, a saving that could avoid investment in future energy networks by up to billions of pounds, passing these savings on to the consumer.
BOX 19: A SMART ENERGY FUTURE
The pathway to meet this ambition can be broadly split into short, medium and long-term objectives. Leaving actions to future generations or later decades would risk unprecedented, and potentially unachievable, rates of decarbonisation in the 2030s and 2040s.
In the next five years a large part of carbon reduction can be met through decarbonisation of the national power grid, increased energy efficiency, and zero carbon new development.
Over the next two decades, dependence on natural gas must be reduced by increasing the use of low carbon heating (harnessing energy from water, ground and air using heat pumps) as well as capturing more of the heat wasted from our buildings and infrastructure and using heat networks in the densest areas of the city to distribute it to our homes and workplaces. We must continue to improve the energy efficiency of our existing buildings and scale up low emission vehicles.
Demand on the electricity grid will likely increase due to the growing population and electrification of heat and transport. Smart technology (Box 19) will need to become an increasingly important part
of managing London’s energy system, helping to balance more intermittent supply of energy from renewables with more variable electricity demand from electric cars, or electric heating. Added strain on the electricity grid can partially be managed through the use of storage, such as hot water cylinders to store heat, or batteries to store electricity generated off-peak.
These balancing mechanisms, collectively known as demand-side response, will also allow consumers to use energy when it is cheaper, such as overnight. This will reduce the peak demand on the national grid, most associated with high-carbon generation, and help avoid bottlenecks in grid capacity.
By 2030 at the latest the UK government must also confirm its approach for the long-term role of gas to allow for the full decarbonisation of London’s heating systems by 2050. With a clear view on what the energy content of gas and electricity should be in 2050, this would then allow a minimum 20 year period to move to new zero carbon heat supply. By 2040 the majority of public transport will be zero emission.
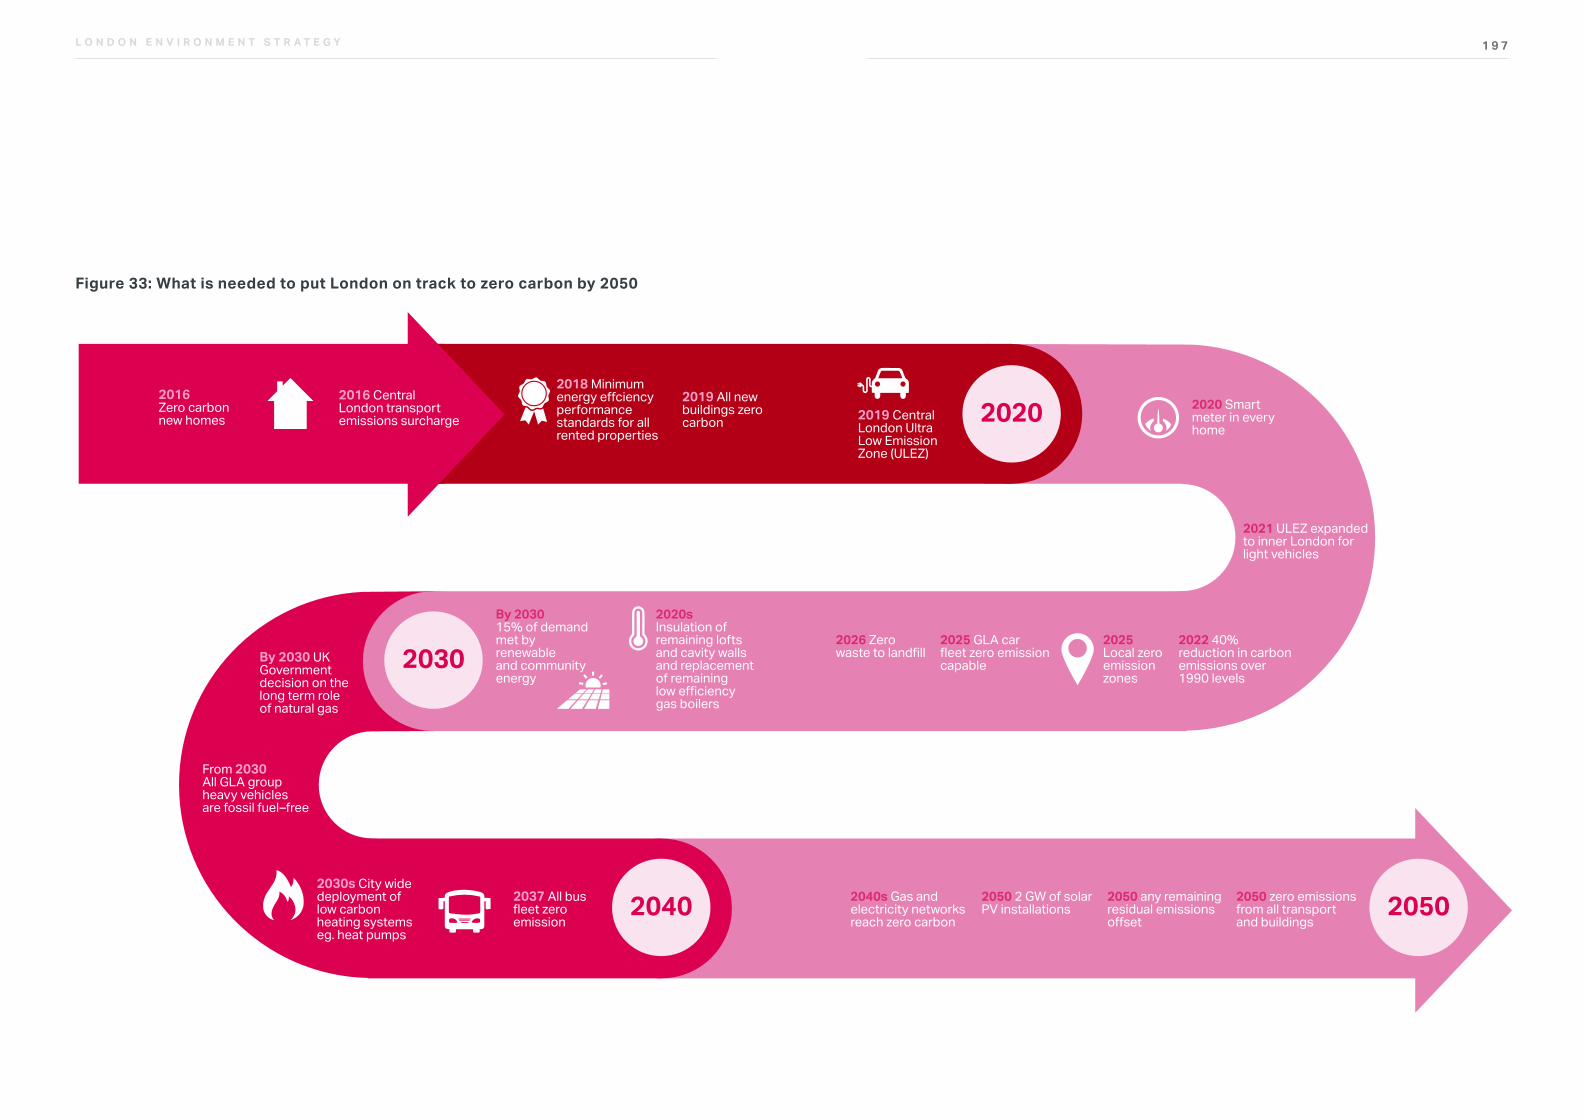
1 9 7L O N D O N E N V I R O N M E N T S T R A T E G Y
Figure 33: What is needed to put London on track to zero carbon by 2050
2020
2030
2040 2050
2016Zero carbonnew homes
2018 Minimum energy effciencyperformance standards for allrented properties
2020 Smartmeter in everyhome
2021 ULEZ expanded to inner London forlight vehicles
2022 40%reduction in carbonemissions over 1990 levels
2025Local zeroemissionzones
2026 Zerowaste to landfill
2025 GLA carfleet zero emissioncapable
2020sInsulation ofremaining loftsand cavity wallsand replacementof remaininglow efficiencygas boilers
By 203015% of demandmet byrenewableand communityenergy
By 2030 UKGovernmentdecision on thelong term roleof natural gas
From 2030All GLA groupheavy vehiclesare fossil fuel–free
2030s City widedeployment oflow carbonheating systemseg. heat pumps
2037 All busfleet zeroemission
2040s Gas andelectricity networksreach zero carbon
2050 2 GW of solarPV installations
2050 any remainingresidual emissionsoffset
2050 zero emissionsfrom all transport and buildings
2019 All newbuildings zerocarbon 2019 Central
London UltraLow EmissionZone (ULEZ)
2016 CentralLondon transportemissions surcharge
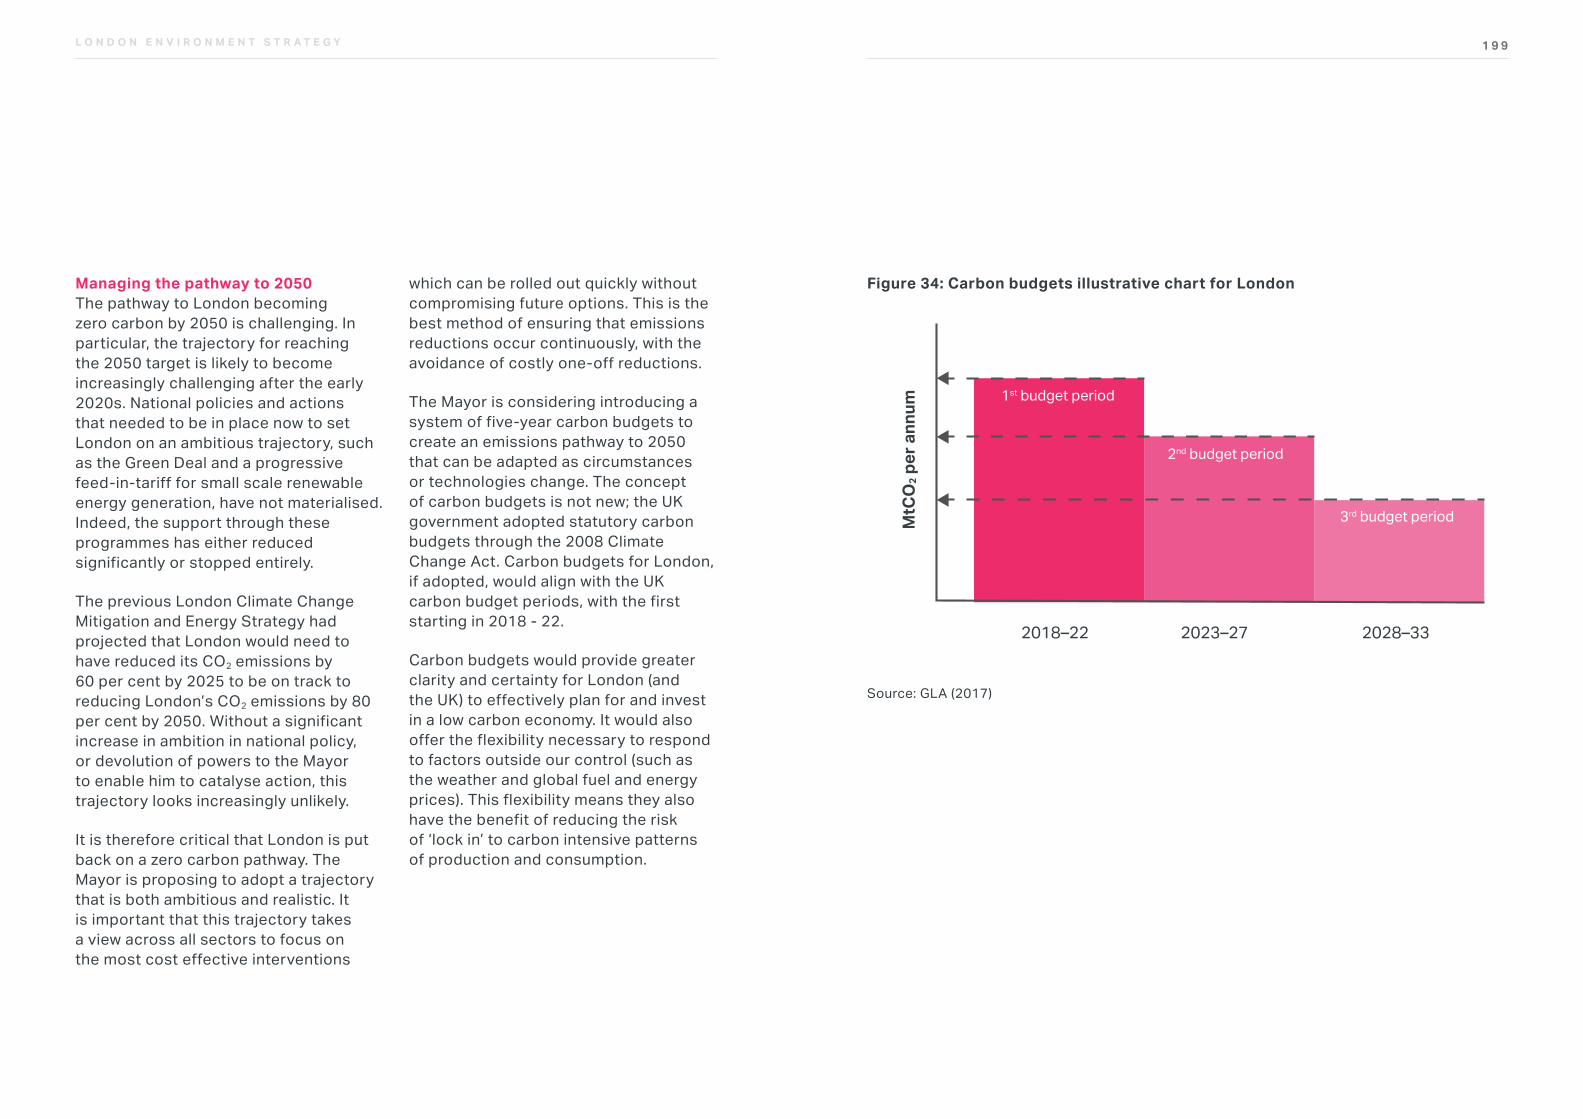
1 9 9L O N D O N E N V I R O N M E N T S T R A T E G Y
Figure 34: Carbon budgets illustrative chart for London
Fig 5: Concept of carbon budgets
Average annual emissionsduring
Source: GLA (2017)
Available at:
TYPE OF GRAPH: CLIMATE CHANGE AND ENERGY
Reference
MtC
O2 p
er a
nnum
2018–22 2023–27 2028–33
1st budget period
2nd budget period
3rd budget period
Source: GLA (2017)
Managing the pathway to 2050The pathway to London becoming zero carbon by 2050 is challenging. In particular, the trajectory for reaching the 2050 target is likely to become increasingly challenging after the early 2020s. National policies and actions that needed to be in place now to set London on an ambitious trajectory, such as the Green Deal and a progressive feed-in-tariff for small scale renewable energy generation, have not materialised. Indeed, the support through these programmes has either reduced significantly or stopped entirely.
The previous London Climate Change Mitigation and Energy Strategy had projected that London would need to have reduced its CO2 emissions by 60 per cent by 2025 to be on track to reducing London’s CO2 emissions by 80 per cent by 2050. Without a significant increase in ambition in national policy, or devolution of powers to the Mayor to enable him to catalyse action, this trajectory looks increasingly unlikely.
It is therefore critical that London is put back on a zero carbon pathway. The Mayor is proposing to adopt a trajectory that is both ambitious and realistic. It is important that this trajectory takes a view across all sectors to focus on the most cost effective interventions
which can be rolled out quickly without compromising future options. This is the best method of ensuring that emissions reductions occur continuously, with the avoidance of costly one-off reductions.
The Mayor is considering introducing a system of five-year carbon budgets to create an emissions pathway to 2050 that can be adapted as circumstances or technologies change. The concept of carbon budgets is not new; the UK government adopted statutory carbon budgets through the 2008 Climate Change Act. Carbon budgets for London, if adopted, would align with the UK carbon budget periods, with the first starting in 2018 - 22.
Carbon budgets would provide greater clarity and certainty for London (and the UK) to effectively plan for and invest in a low carbon economy. It would also offer the flexibility necessary to respond to factors outside our control (such as the weather and global fuel and energy prices). This flexibility means they also have the benefit of reducing the risk of ‘lock in’ to carbon intensive patterns of production and consumption.
2 0 1L O N D O N E N V I R O N M E N T S T R A T E G Y
To place London on track to a zero carbon city Energy for Londoners will:
• accelerate the retrofitting of buildings, while encouraging energy demand reduction and energy management practices, smart meter roll-out and demand side management
• decarbonise London’s energy supply by developing and delivering
decentralised energy, renewable generation, especially solar, community energy programmes
• protect the most vulnerable and tackle fuel poverty
• tender for the delivery of an energy supply company, aiming to offer fairer energy bills to Londoners as soon as possible
• attract finance for energy efficiency and renewable energy
BOX 20: ENERGY FOR LONDONERS
ENERGY FOR LONDONERS
Objective 1 Reduce emissions of London’s
homes and workplaces while protecting the most vulnerable by
tackling fuel poverty
Decentralised energy
Solar generation and community energy
A smarter grid with demand side management
Fair tariffs
Energy efficiency
Fuel poverty support
Modelling suggests that within the first carbon budget period (2018-2022) London can achieve a 40 per cent reduction in carbon dioxide emissions on 1990 levels. This is more than national carbon budgets over the same period. The Mayor intends to use his powers and programmes to put London on this track, but to achieve the target requires government to deliver early action to meet UK electricity grid decarbonisation projections out to 2022 and urgently clarify its policy and support through its upcoming emissions reduction plan and through the Levy Control Framework.
Without decarbonisation at a national level, London is expected to achieve only a 34 per cent reduction during this budget period.
In the absence of this long-overdue policy clarity from national government, final carbon budget levels will be defined as an outcome of this strategy consultation. The Mayor will be undertaking a more detailed ‘bottom-up’ analysis over the coming months to more accurately project what emissions reductions are realistically achievable over the carbon budget periods.
Energy for Londoners Existing climate change and energy programmes in London achieved a reduction of 670 ktCO2e in 2015; a threefold increase on 2011 levels. While this is significant in terms of the savings at a building level, this represents only two per cent of London’s energy demand.
The Mayor’s new Energy for Londoners programme will help speed up work to decarbonise London’s homes and workplaces and develop clean energy systems (Box 20).
Objective 2 Develop clean and smart
integrated energy systems utilising local and renewable
energy resources
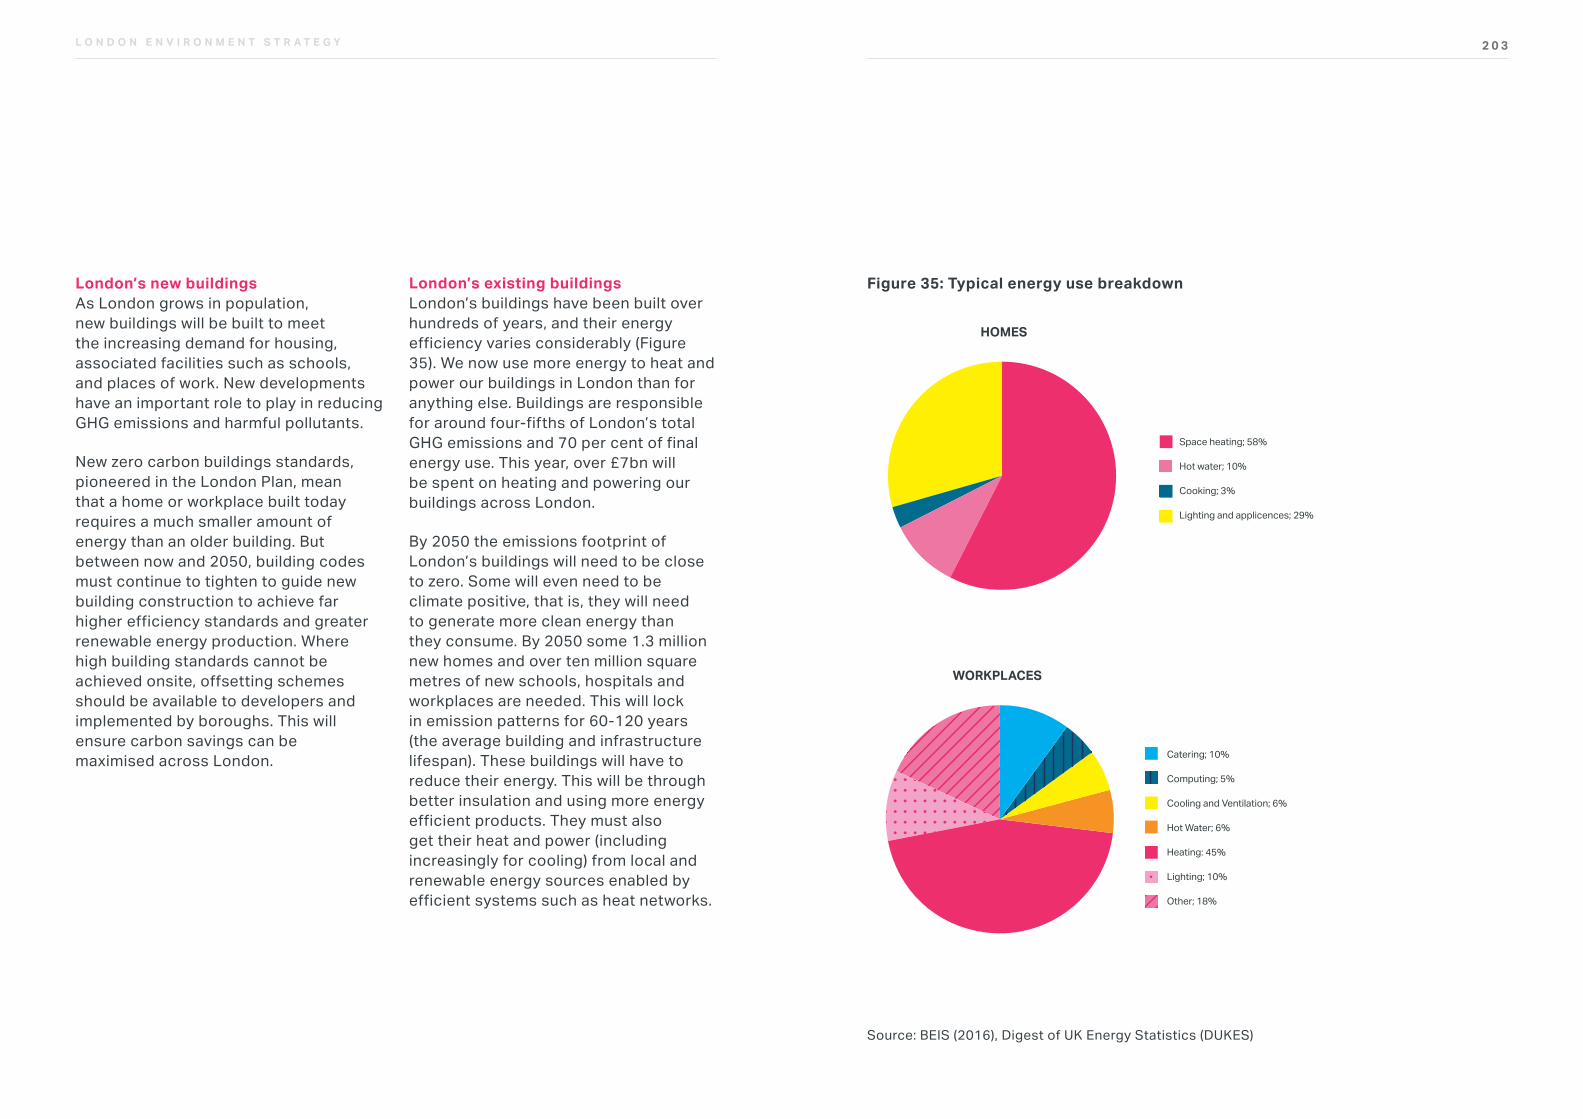
2 0 3L O N D O N E N V I R O N M E N T S T R A T E G Y
Figure 35: Typical energy use breakdown
Source: BEIS (2016), Digest of UK Energy Statistics (DUKES)
Fig 7: Emissions and energy use in London’s existing homes
HOMES WORKPLACES
Source: BEIS (2016), Digest of UK Energy Statistics (DUKES)
Available at: www.gov.uk/government/collections/digest-of-uk-energy-statistics-dukes
TYPE OF GRAPH: CLIMATE CHANGE AND ENERGY
Reference
Space heating; 58%
Hot water; 10%
Cooking; 3%
Lighting and applicences; 29%
Catering; 10%
Computing; 5%
Cooling and Ventilation; 6%
Hot Water; 6%
Heating: 45%
Lighting; 10%
Other; 18%
London’s new buildingsAs London grows in population, new buildings will be built to meet the increasing demand for housing, associated facilities such as schools, and places of work. New developments have an important role to play in reducing GHG emissions and harmful pollutants.
New zero carbon buildings standards, pioneered in the London Plan, mean that a home or workplace built today requires a much smaller amount of energy than an older building. But between now and 2050, building codes must continue to tighten to guide new building construction to achieve far higher efficiency standards and greater renewable energy production. Where high building standards cannot be achieved onsite, offsetting schemes should be available to developers and implemented by boroughs. This will ensure carbon savings can be maximised across London.
London’s existing buildingsLondon’s buildings have been built over hundreds of years, and their energy efficiency varies considerably (Figure 35). We now use more energy to heat and power our buildings in London than for anything else. Buildings are responsible for around four-fifths of London’s total GHG emissions and 70 per cent of final energy use. This year, over £7bn will be spent on heating and powering our buildings across London.
By 2050 the emissions footprint of London’s buildings will need to be close to zero. Some will even need to be climate positive, that is, they will need to generate more clean energy than they consume. By 2050 some 1.3 million new homes and over ten million square metres of new schools, hospitals and workplaces are needed. This will lock in emission patterns for 60-120 years (the average building and infrastructure lifespan). These buildings will have to reduce their energy. This will be through better insulation and using more energy efficient products. They must also get their heat and power (including increasingly for cooling) from local and renewable energy sources enabled by efficient systems such as heat networks.
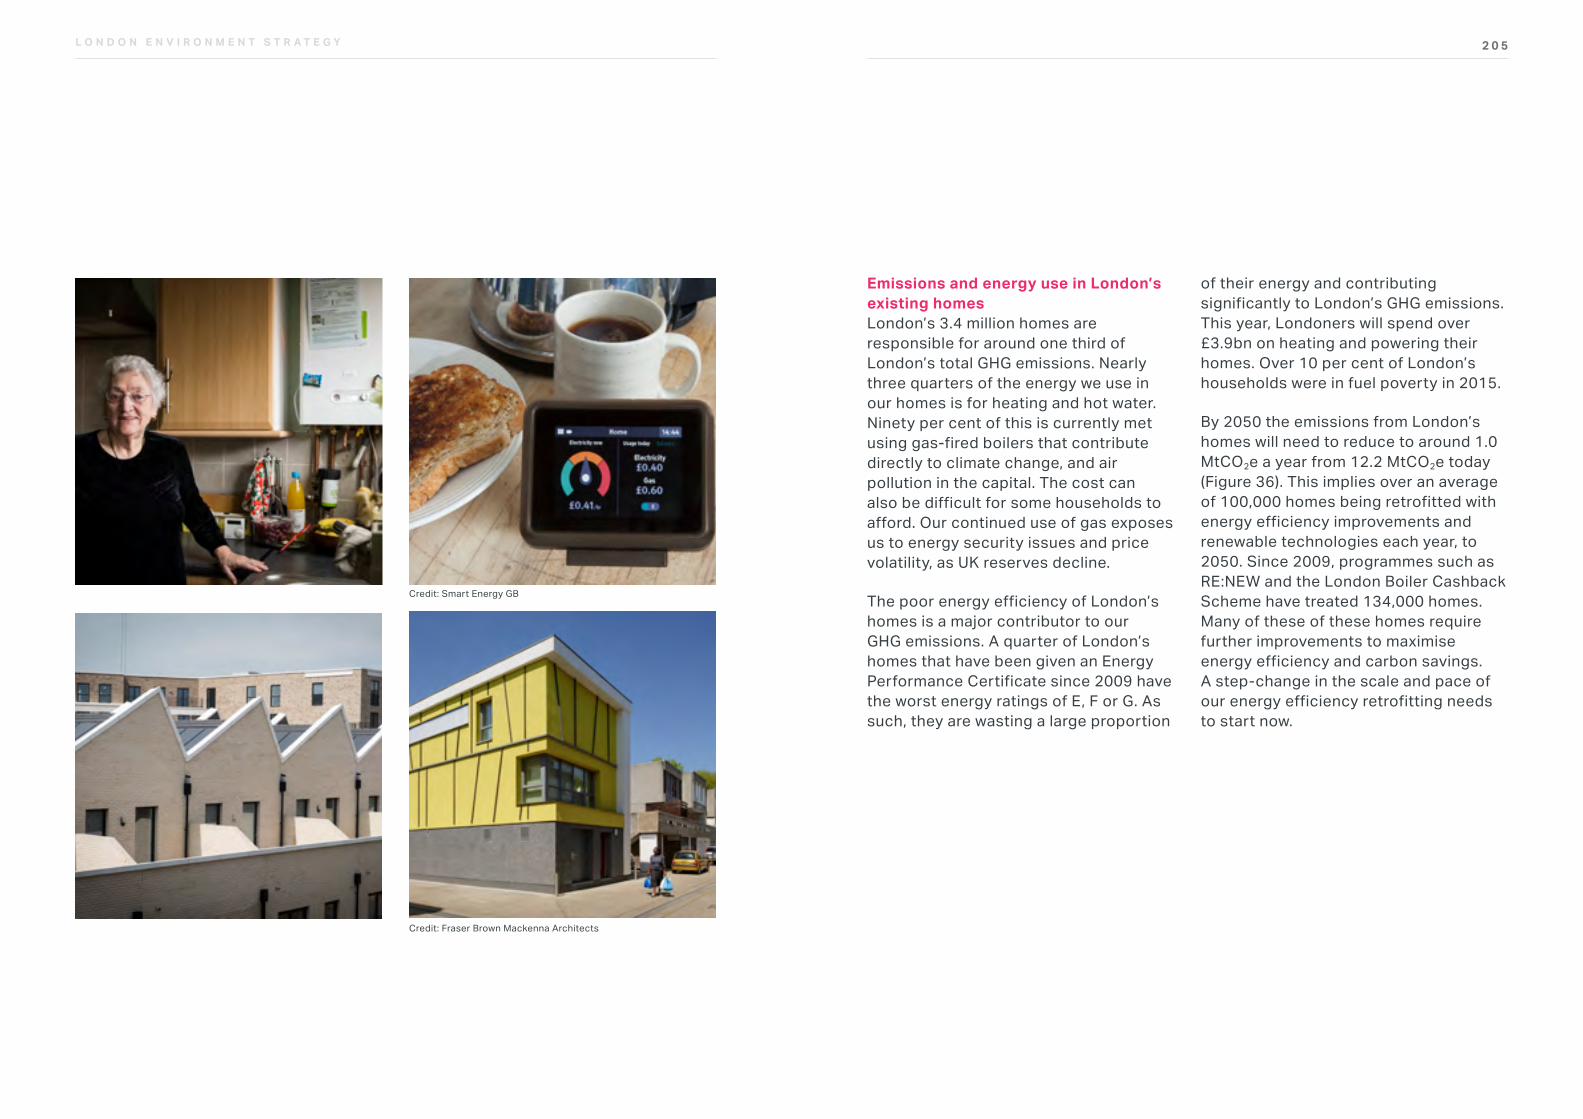
2 0 5L O N D O N E N V I R O N M E N T S T R A T E G Y
Emissions and energy use in London’s existing homesLondon’s 3.4 million homes are responsible for around one third of London’s total GHG emissions. Nearly three quarters of the energy we use in our homes is for heating and hot water. Ninety per cent of this is currently met using gas-fired boilers that contribute directly to climate change, and air pollution in the capital. The cost can also be difficult for some households to afford. Our continued use of gas exposes us to energy security issues and price volatility, as UK reserves decline.
The poor energy efficiency of London’s homes is a major contributor to our GHG emissions. A quarter of London’s homes that have been given an Energy Performance Certificate since 2009 have the worst energy ratings of E, F or G. As such, they are wasting a large proportion
of their energy and contributing significantly to London’s GHG emissions. This year, Londoners will spend over £3.9bn on heating and powering their homes. Over 10 per cent of London’s households were in fuel poverty in 2015.
By 2050 the emissions from London’s homes will need to reduce to around 1.0 MtCO2e a year from 12.2 MtCO2e today (Figure 36). This implies over an average of 100,000 homes being retrofitted with energy efficiency improvements and renewable technologies each year, to 2050. Since 2009, programmes such as RE:NEW and the London Boiler Cashback Scheme have treated 134,000 homes. Many of these of these homes require further improvements to maximise energy efficiency and carbon savings. A step-change in the scale and pace of our energy efficiency retrofitting needs to start now.
Credit: Fraser Brown Mackenna Architects
Credit: Smart Energy GB
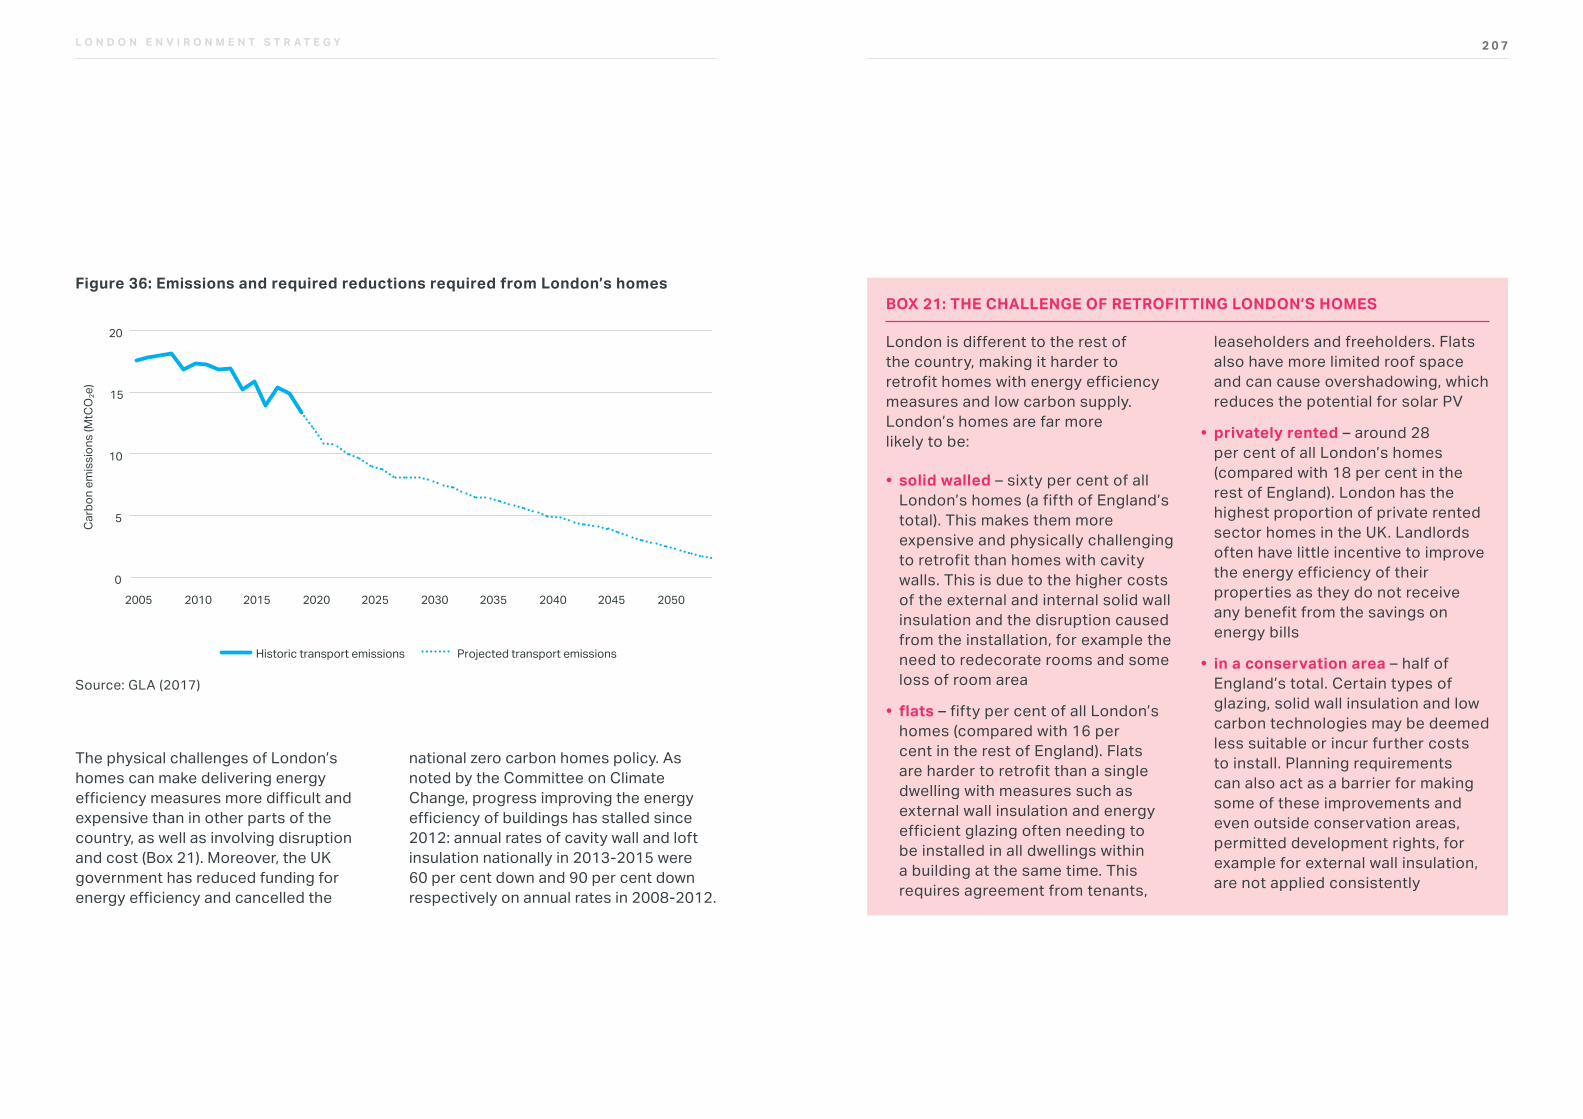
2 0 7L O N D O N E N V I R O N M E N T S T R A T E G Y
London is different to the rest of the country, making it harder to retrofit homes with energy efficiency measures and low carbon supply. London’s homes are far more likely to be:
• solid walled – sixty per cent of all London’s homes (a fifth of England’s total). This makes them more expensive and physically challenging to retrofit than homes with cavity walls. This is due to the higher costs of the external and internal solid wall insulation and the disruption caused from the installation, for example the need to redecorate rooms and some loss of room area
• flats – fifty per cent of all London’s homes (compared with 16 per cent in the rest of England). Flats are harder to retrofit than a single dwelling with measures such as external wall insulation and energy efficient glazing often needing to be installed in all dwellings within a building at the same time. This requires agreement from tenants,
leaseholders and freeholders. Flats also have more limited roof space and can cause overshadowing, which reduces the potential for solar PV
• privately rented – around 28 per cent of all London’s homes (compared with 18 per cent in the rest of England). London has the highest proportion of private rented sector homes in the UK. Landlords often have little incentive to improve the energy efficiency of their properties as they do not receive any benefit from the savings on energy bills
• in a conservation area – half of England’s total. Certain types of glazing, solid wall insulation and low carbon technologies may be deemed less suitable or incur further costs to install. Planning requirements can also act as a barrier for making some of these improvements and even outside conservation areas, permitted development rights, for example for external wall insulation, are not applied consistently
BOX 21: THE CHALLENGE OF RETROFITTING LONDON’S HOMESFigure 36: Emissions and required reductions required from London’s homes
Source: GLA (2017)
The physical challenges of London’s homes can make delivering energy efficiency measures more difficult and expensive than in other parts of the country, as well as involving disruption and cost (Box 21). Moreover, the UK government has reduced funding for energy efficiency and cancelled the
national zero carbon homes policy. As noted by the Committee on Climate Change, progress improving the energy efficiency of buildings has stalled since 2012: annual rates of cavity wall and loft insulation nationally in 2013-2015 were 60 per cent down and 90 per cent down respectively on annual rates in 2008-2012.
0
5
10
15
20
2005 2010 2015 2020 2025 2030 2035 2040 2045 2050
Historic transport emissions Projected transport emissions
Carb
on e
mis
sion
s (M
tCO
2e)
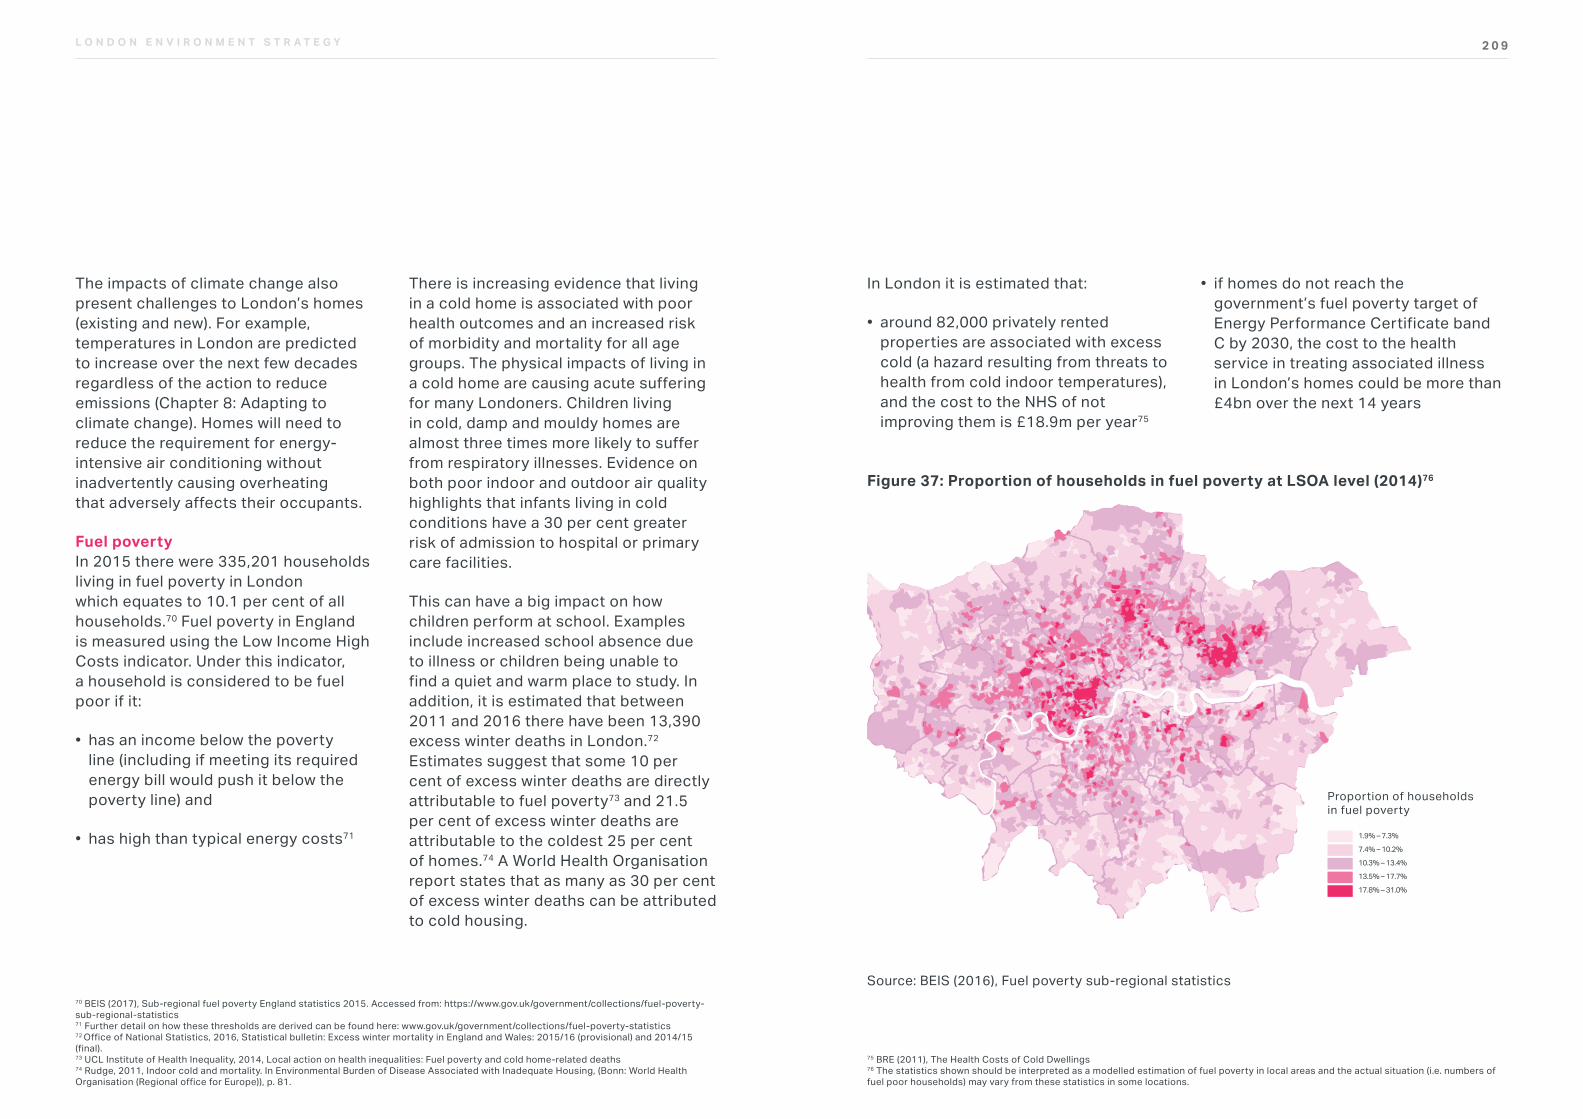
2 0 9L O N D O N E N V I R O N M E N T S T R A T E G Y
In London it is estimated that:
• around 82,000 privately rented properties are associated with excess cold (a hazard resulting from threats to health from cold indoor temperatures), and the cost to the NHS of not improving them is £18.9m per year75
• if homes do not reach the government’s fuel poverty target of Energy Performance Certificate band C by 2030, the cost to the health service in treating associated illness in London’s homes could be more than £4bn over the next 14 years
Figure 37: Proportion of households in fuel poverty at LSOA level (2014)76
Source: BEIS (2016), Fuel poverty sub-regional statistics
Fig 11: Proportion of households in fuel poverty at LSOA level (2014)
Source: BEIS (2016), Fuel poverty sub-regional statistics
Available at: www.gov.uk/government/collections/fuel-poverty-sub-regional-statistics
TYPE OF GRAPH: CLIMATE CHANGE AND ENERGY
Reference
Proportion of households in fuel poverty
1.9% – 7.3%
7.4% – 10.2%
10.3% – 13.4%
13.5% – 17.7%
17.8% – 31.0%
75 BRE (2011), The Health Costs of Cold Dwellings 76 The statistics shown should be interpreted as a modelled estimation of fuel poverty in local areas and the actual situation (i.e. numbers of fuel poor households) may vary from these statistics in some locations.
The impacts of climate change also present challenges to London’s homes (existing and new). For example, temperatures in London are predicted to increase over the next few decades regardless of the action to reduce emissions (Chapter 8: Adapting to climate change). Homes will need to reduce the requirement for energy-intensive air conditioning without inadvertently causing overheating that adversely affects their occupants.
Fuel povertyIn 2015 there were 335,201 households living in fuel poverty in London which equates to 10.1 per cent of all households.70 Fuel poverty in England is measured using the Low Income High Costs indicator. Under this indicator, a household is considered to be fuel poor if it:
• has an income below the poverty line (including if meeting its required energy bill would push it below the poverty line) and
• has high than typical energy costs71
There is increasing evidence that living in a cold home is associated with poor health outcomes and an increased risk of morbidity and mortality for all age groups. The physical impacts of living in a cold home are causing acute suffering for many Londoners. Children living in cold, damp and mouldy homes are almost three times more likely to suffer from respiratory illnesses. Evidence on both poor indoor and outdoor air quality highlights that infants living in cold conditions have a 30 per cent greater risk of admission to hospital or primary care facilities.
This can have a big impact on how children perform at school. Examples include increased school absence due to illness or children being unable to find a quiet and warm place to study. In addition, it is estimated that between 2011 and 2016 there have been 13,390 excess winter deaths in London.72 Estimates suggest that some 10 per cent of excess winter deaths are directly attributable to fuel poverty73 and 21.5 per cent of excess winter deaths are attributable to the coldest 25 per cent of homes.74 A World Health Organisation report states that as many as 30 per cent of excess winter deaths can be attributed to cold housing.
70 BEIS (2017), Sub-regional fuel poverty England statistics 2015. Accessed from: https://www.gov.uk/government/collections/fuel-poverty-sub-regional-statistics71 Further detail on how these thresholds are derived can be found here: www.gov.uk/government/collections/fuel-poverty-statistics72 Office of National Statistics, 2016, Statistical bulletin: Excess winter mortality in England and Wales: 2015/16 (provisional) and 2014/15 (final).73 UCL Institute of Health Inequality, 2014, Local action on health inequalities: Fuel poverty and cold home-related deaths74 Rudge, 2011, Indoor cold and mortality. In Environmental Burden of Disease Associated with Inadequate Housing, (Bonn: World Health Organisation (Regional office for Europe)), p. 81.
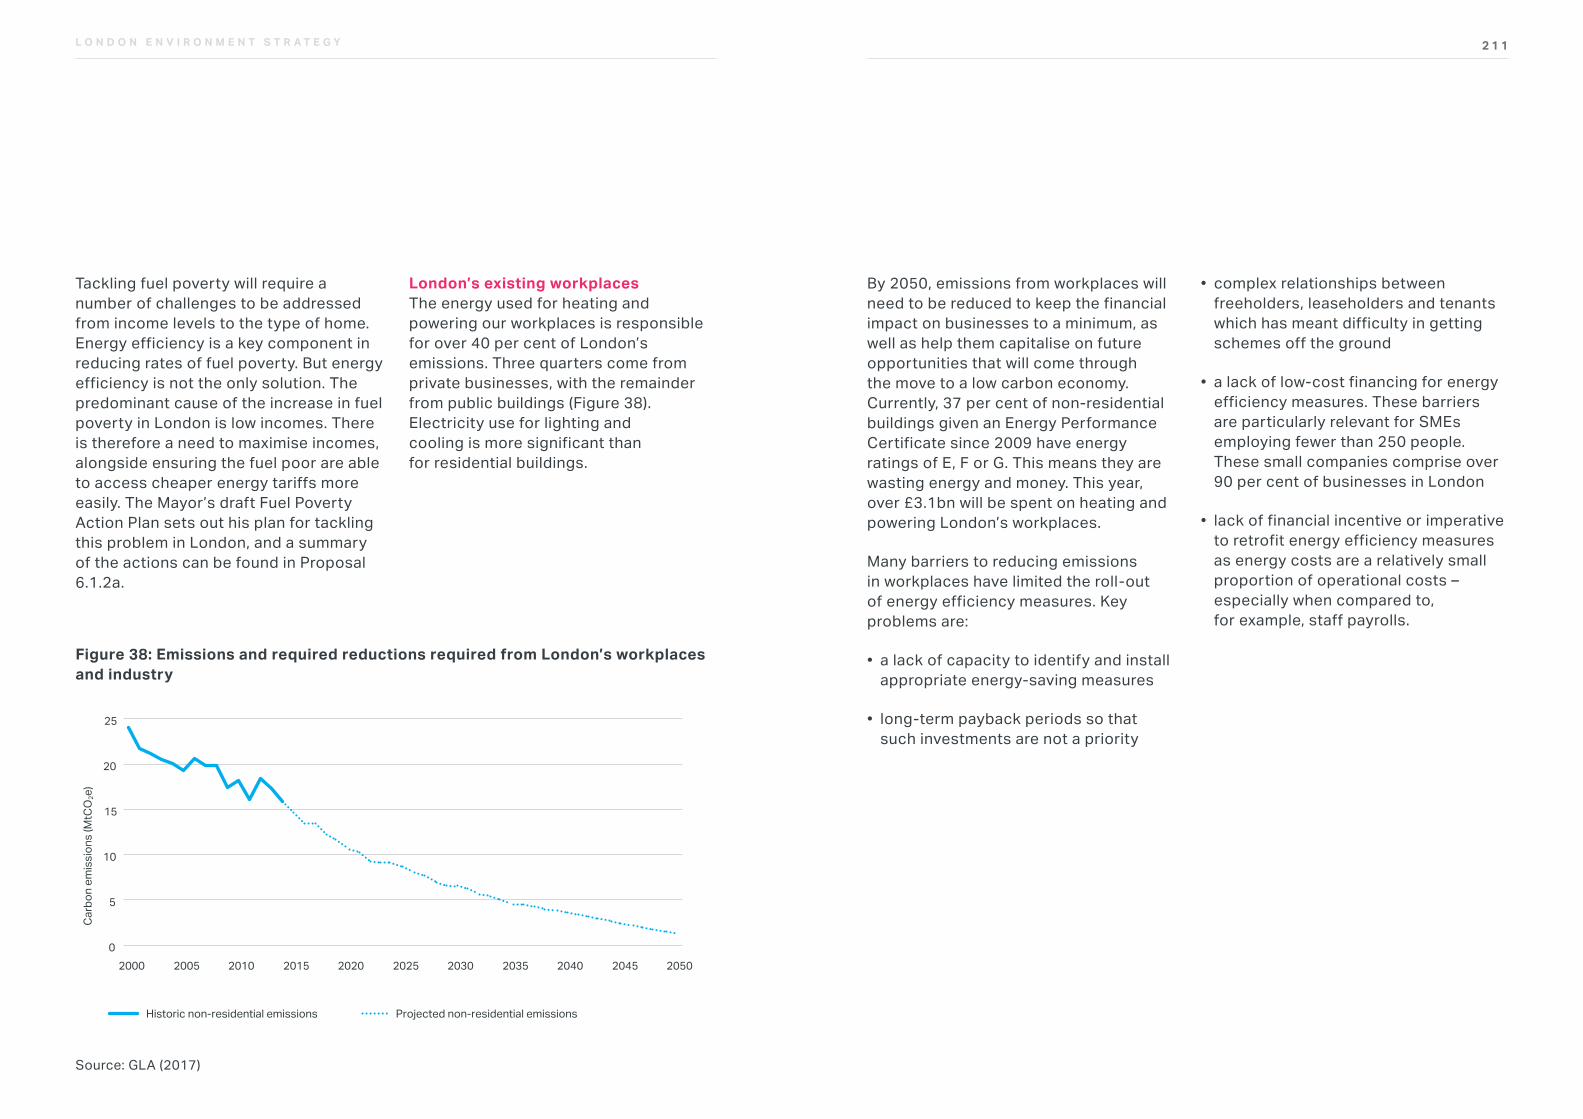
2 1 1L O N D O N E N V I R O N M E N T S T R A T E G Y
Figure 38: Emissions and required reductions required from London’s workplaces and industry
Source: GLA (2017)
Tackling fuel poverty will require a number of challenges to be addressed from income levels to the type of home. Energy efficiency is a key component in reducing rates of fuel poverty. But energy efficiency is not the only solution. The predominant cause of the increase in fuel poverty in London is low incomes. There is therefore a need to maximise incomes, alongside ensuring the fuel poor are able to access cheaper energy tariffs more easily. The Mayor’s draft Fuel Poverty Action Plan sets out his plan for tackling this problem in London, and a summary of the actions can be found in Proposal 6.1.2a.
London’s existing workplacesThe energy used for heating and powering our workplaces is responsible for over 40 per cent of London’s emissions. Three quarters come from private businesses, with the remainder from public buildings (Figure 38). Electricity use for lighting and cooling is more significant than for residential buildings.
0
5
10
15
20
25
2000 2005 2010 2015 2020 2025 2030 2035 2040 2045 2050
Historic non-residential emissions Projected non-residential emissions
Carb
on e
mis
sion
s (M
tCO
2e)
By 2050, emissions from workplaces will need to be reduced to keep the financial impact on businesses to a minimum, as well as help them capitalise on future opportunities that will come through the move to a low carbon economy. Currently, 37 per cent of non-residential buildings given an Energy Performance Certificate since 2009 have energy ratings of E, F or G. This means they are wasting energy and money. This year, over £3.1bn will be spent on heating and powering London’s workplaces.
Many barriers to reducing emissions in workplaces have limited the roll-out of energy efficiency measures. Key problems are:
• a lack of capacity to identify and install appropriate energy-saving measures
• long-term payback periods so that such investments are not a priority
• complex relationships between freeholders, leaseholders and tenants which has meant difficulty in getting schemes off the ground
• a lack of low-cost financing for energy efficiency measures. These barriers are particularly relevant for SMEs employing fewer than 250 people. These small companies comprise over 90 per cent of businesses in London
• lack of financial incentive or imperative to retrofit energy efficiency measures as energy costs are a relatively small proportion of operational costs – especially when compared to, for example, staff payrolls.
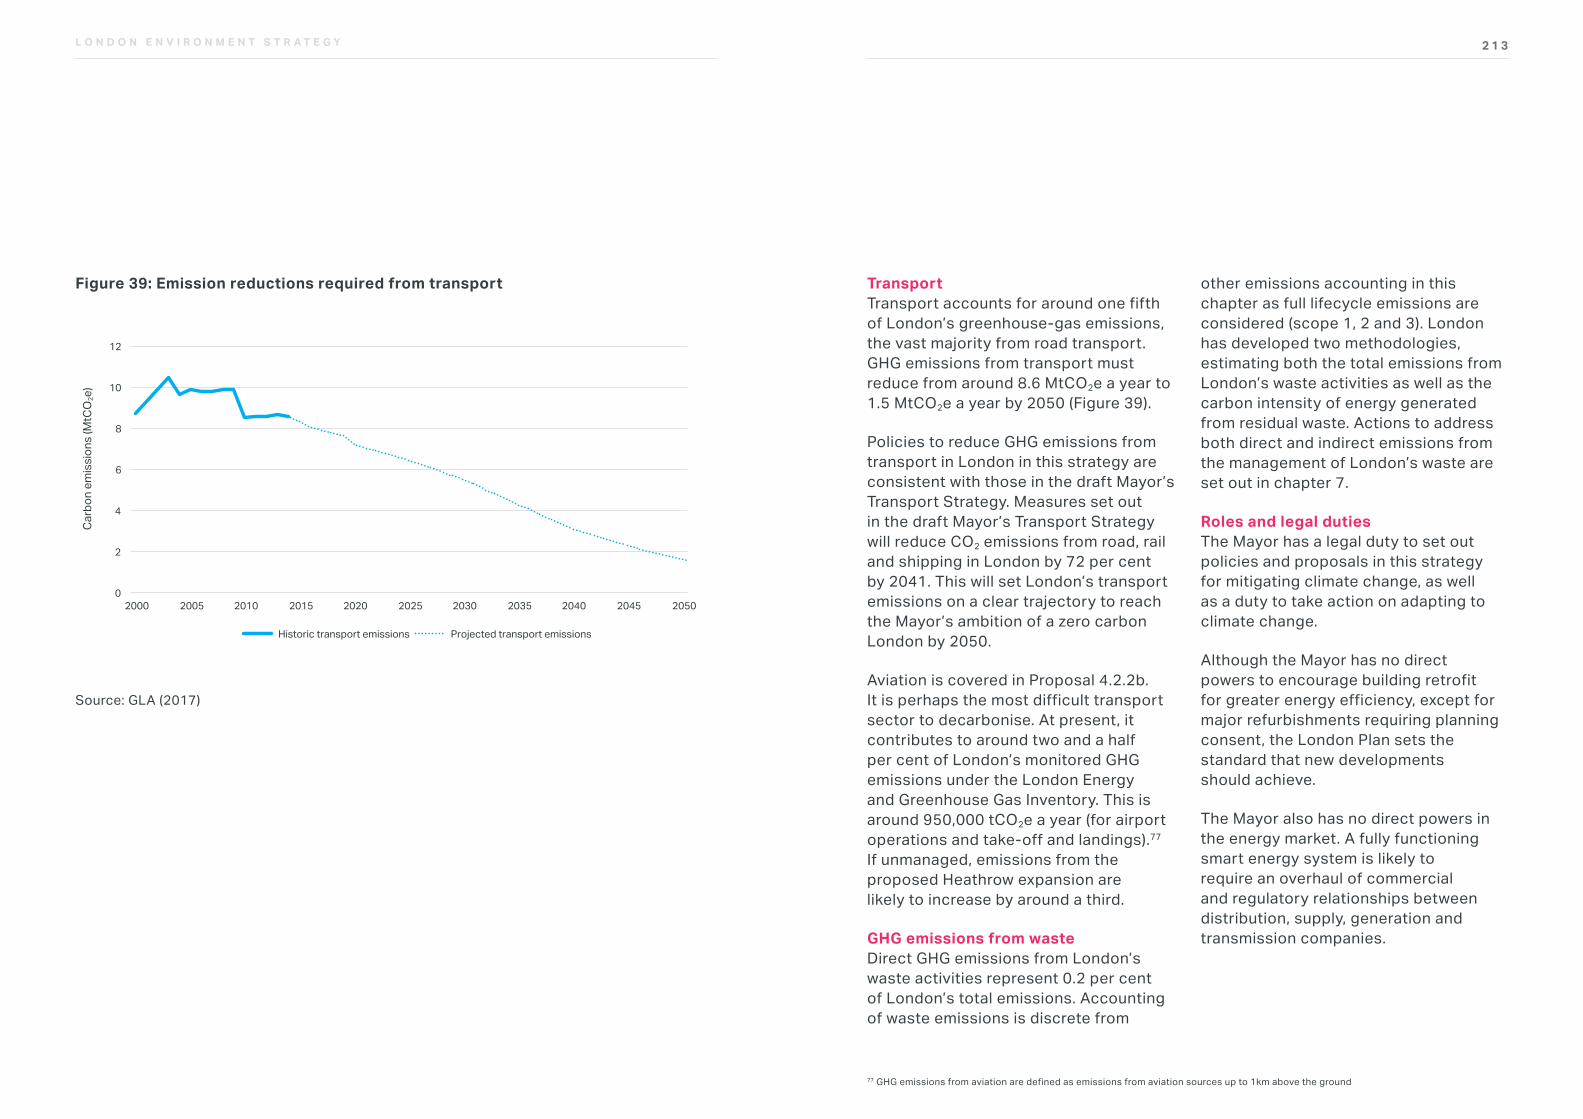
2 1 3L O N D O N E N V I R O N M E N T S T R A T E G Y
TransportTransport accounts for around one fifth of London’s greenhouse-gas emissions, the vast majority from road transport. GHG emissions from transport must reduce from around 8.6 MtCO2e a year to 1.5 MtCO2e a year by 2050 (Figure 39).
Policies to reduce GHG emissions from transport in London in this strategy are consistent with those in the draft Mayor’s Transport Strategy. Measures set out in the draft Mayor’s Transport Strategy will reduce CO2 emissions from road, rail and shipping in London by 72 per cent by 2041. This will set London’s transport emissions on a clear trajectory to reach the Mayor’s ambition of a zero carbon London by 2050.
Aviation is covered in Proposal 4.2.2b. It is perhaps the most difficult transport sector to decarbonise. At present, it contributes to around two and a half per cent of London’s monitored GHG emissions under the London Energy and Greenhouse Gas Inventory. This is around 950,000 tCO2e a year (for airport operations and take-off and landings).77 If unmanaged, emissions from the proposed Heathrow expansion are likely to increase by around a third.
GHG emissions from wasteDirect GHG emissions from London’s waste activities represent 0.2 per cent of London’s total emissions. Accounting of waste emissions is discrete from
other emissions accounting in this chapter as full lifecycle emissions are considered (scope 1, 2 and 3). London has developed two methodologies, estimating both the total emissions from London’s waste activities as well as the carbon intensity of energy generated from residual waste. Actions to address both direct and indirect emissions from the management of London’s waste are set out in chapter 7.
Roles and legal dutiesThe Mayor has a legal duty to set out policies and proposals in this strategy for mitigating climate change, as well as a duty to take action on adapting to climate change.
Although the Mayor has no direct powers to encourage building retrofit for greater energy efficiency, except for major refurbishments requiring planning consent, the London Plan sets the standard that new developments should achieve.
The Mayor also has no direct powers in the energy market. A fully functioning smart energy system is likely to require an overhaul of commercial and regulatory relationships between distribution, supply, generation and transmission companies.
77 GHG emissions from aviation are defined as emissions from aviation sources up to 1km above the ground
Figure 39: Emission reductions required from transport
0
2
4
6
8
10
12
2000 2005 2010 2015 2020 2025 2030 2035 2040 2045 2050
Historic transport emissions Projected transport emissions
Carb
on e
mis
sion
s (M
tCO
2e)
Source: GLA (2017)
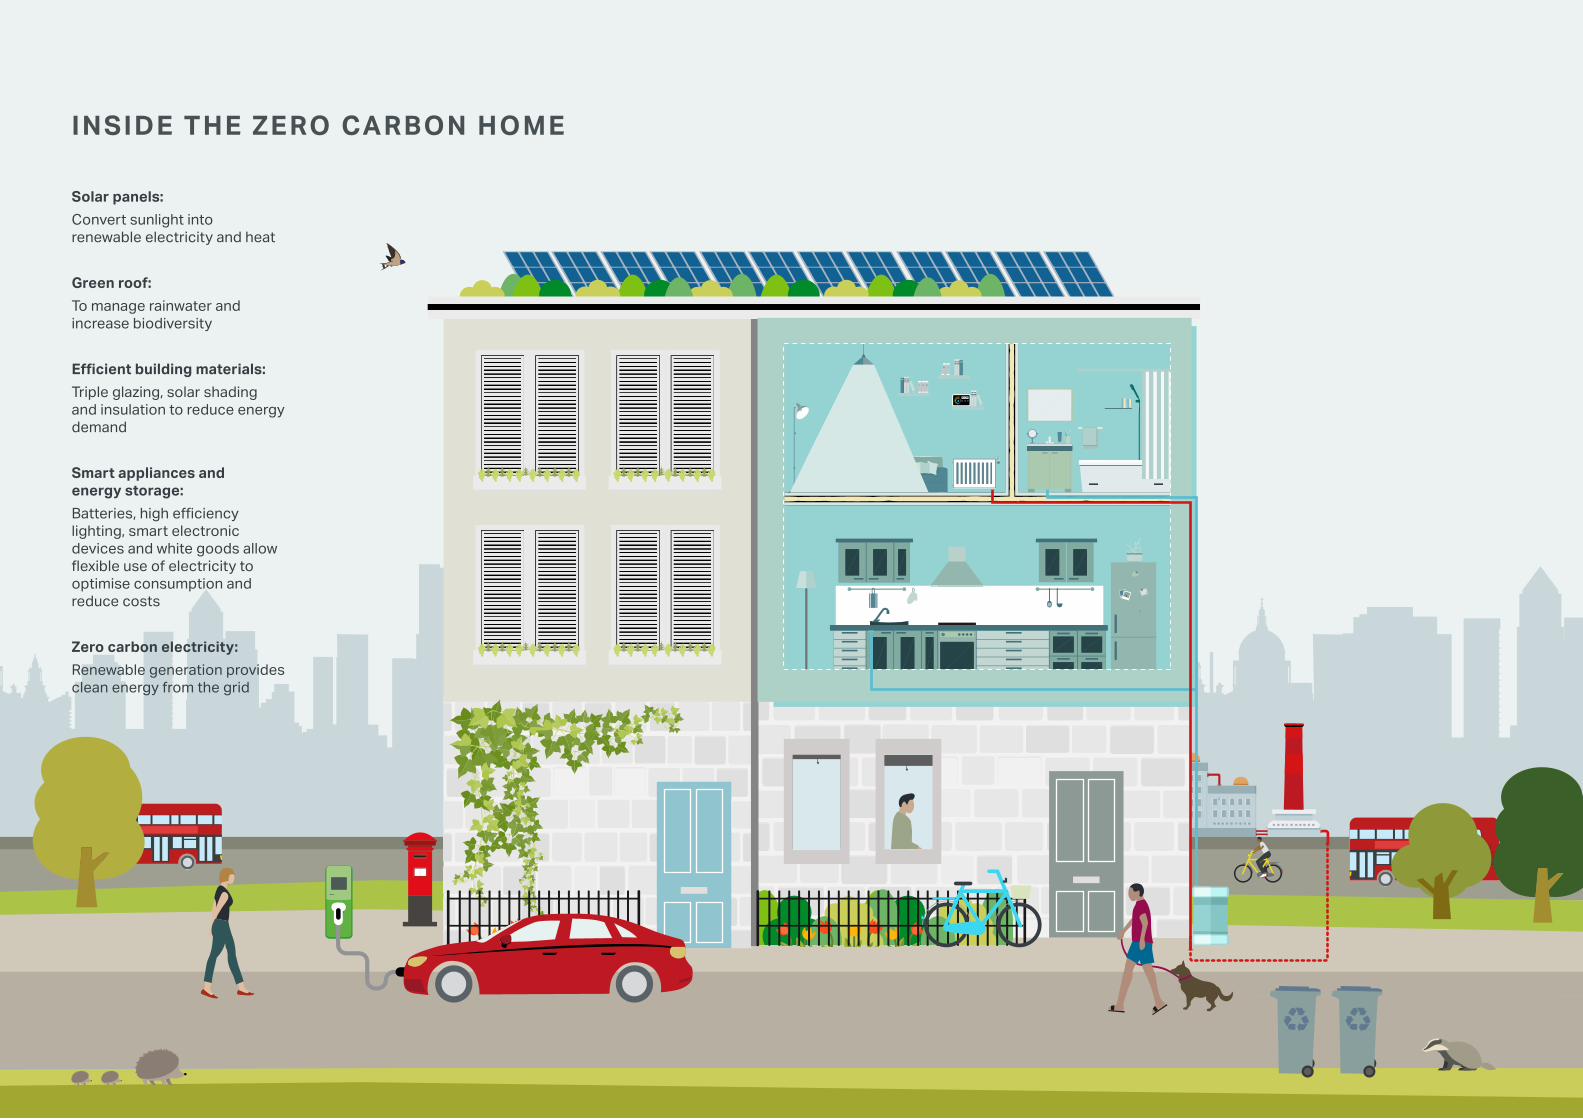
2 1 5L O N D O N E N V I R O N M E N T S T R A T E G Y
Low-flow water fixtures:Reduce water usage
Home energy manager:A control panel inside the home that allows homeowners to manage energy consumption
Heating and cooling system:Highly efficient low carbon energy supply through district heating or individual building heat pumps
Water harvesting:Greywater harvesting for toilet flushing and rainwater collection for irrigation
£2.28
INSIDE THE ZERO CARBON HOME
Solar panels:Convert sunlight into renewable electricity and heat
Green roof:To manage rainwater and increase biodiversity
Efficient building materials:Triple glazing, solar shading and insulation to reduce energy demand
Smart appliances and energy storage:Batteries, high efficiency lighting, smart electronic devices and white goods allow flexible use of electricity to optimise consumption and reduce costs
Zero carbon electricity:Renewable generation provides clean energy from the grid
2 1 7L O N D O N E N V I R O N M E N T S T R A T E G Y
For existing buildings the Mayor has identified a number of actions that are required to reduce emissions. These include:
• helping Londoners improve the energy efficiency of their homes and workplaces through technical advice, support and funding
• piloting new approaches to retrofitting which make existing homes zero energy and eradicate energy bills
• lobbying government for financial support and regulatory change to speed up the retrofitting of homes
• support the roll out of smart meters to provide Londoners with the information they need to make better low carbon choices
• tendering for the delivery of an energy supply company, aiming to offer fairer energy bills to Londoners as soon as possible
• scrapping of the most polluting boilers from workplaces.
Alleviating fuel poverty is a key element of the Mayor’s ambition to become a zero carbon city. The Mayor’s Fuel Poverty Action Plan aims to:
1. boost the incomes of people in fuel poverty
2. increase the energy efficiency of London’s homes
3. ensure Londoners in fuel poverty can access fairer and more affordable energy tariffs
Policy 6.1.1 Policy 6.1.1 Improve the energy efficiency of London’s homes and support the transition to low carbon heating and power through Energy for Londoners
Proposal 6.1.1a Contribute to helping Londoners improve the energy efficiency of their homes, where appropriate, by providing technical assistance, support and funding
Many energy efficiency measures such as loft and cavity wall insulation are cost effective, and help people save money on their bills. There is some support available from the government to help roll-out these measures. But the pace and scale of the change needed to retrofit London’s homes and to overcome the barriers that London faces requires more effort from all involved.
OBJECTIVE 6.1 REDUCE EMISSIONS OF LONDON’S HOMES AND WORKPLACES WHILE PROTECTING THE MOST VULNERABLE BY TACKLING FUEL POVERTY
Approximately 80 per cent of the buildings today will still be standing in 2050. By 2050 some 1.3 million new homes and over ten million square metres of new schools, hospitals and workplaces are needed, which will increase the amount of energy required. Energy efficiency is the first and best fuel, and is often the most cost-effective way to decarbonise buildings. It also saves households and businesses money on their energy bills. That makes it one of the key ways to help ensure that the poorest and most vulnerable households are able to heat their homes affordably.
Emissions will need to be reduced from new and existing buildings. Through the London Plan, the Mayor will ensure greater planning standards for new developments so new buildings are highly efficient and incorporate renewable energy where appropriate.
Objectives, policies and proposals
“ Alleviating fuel poverty is a key element of the Mayor’s ambition to become a zero carbon city.”
L O N D O N E N V I R O N M E N T S T R A T E G Y
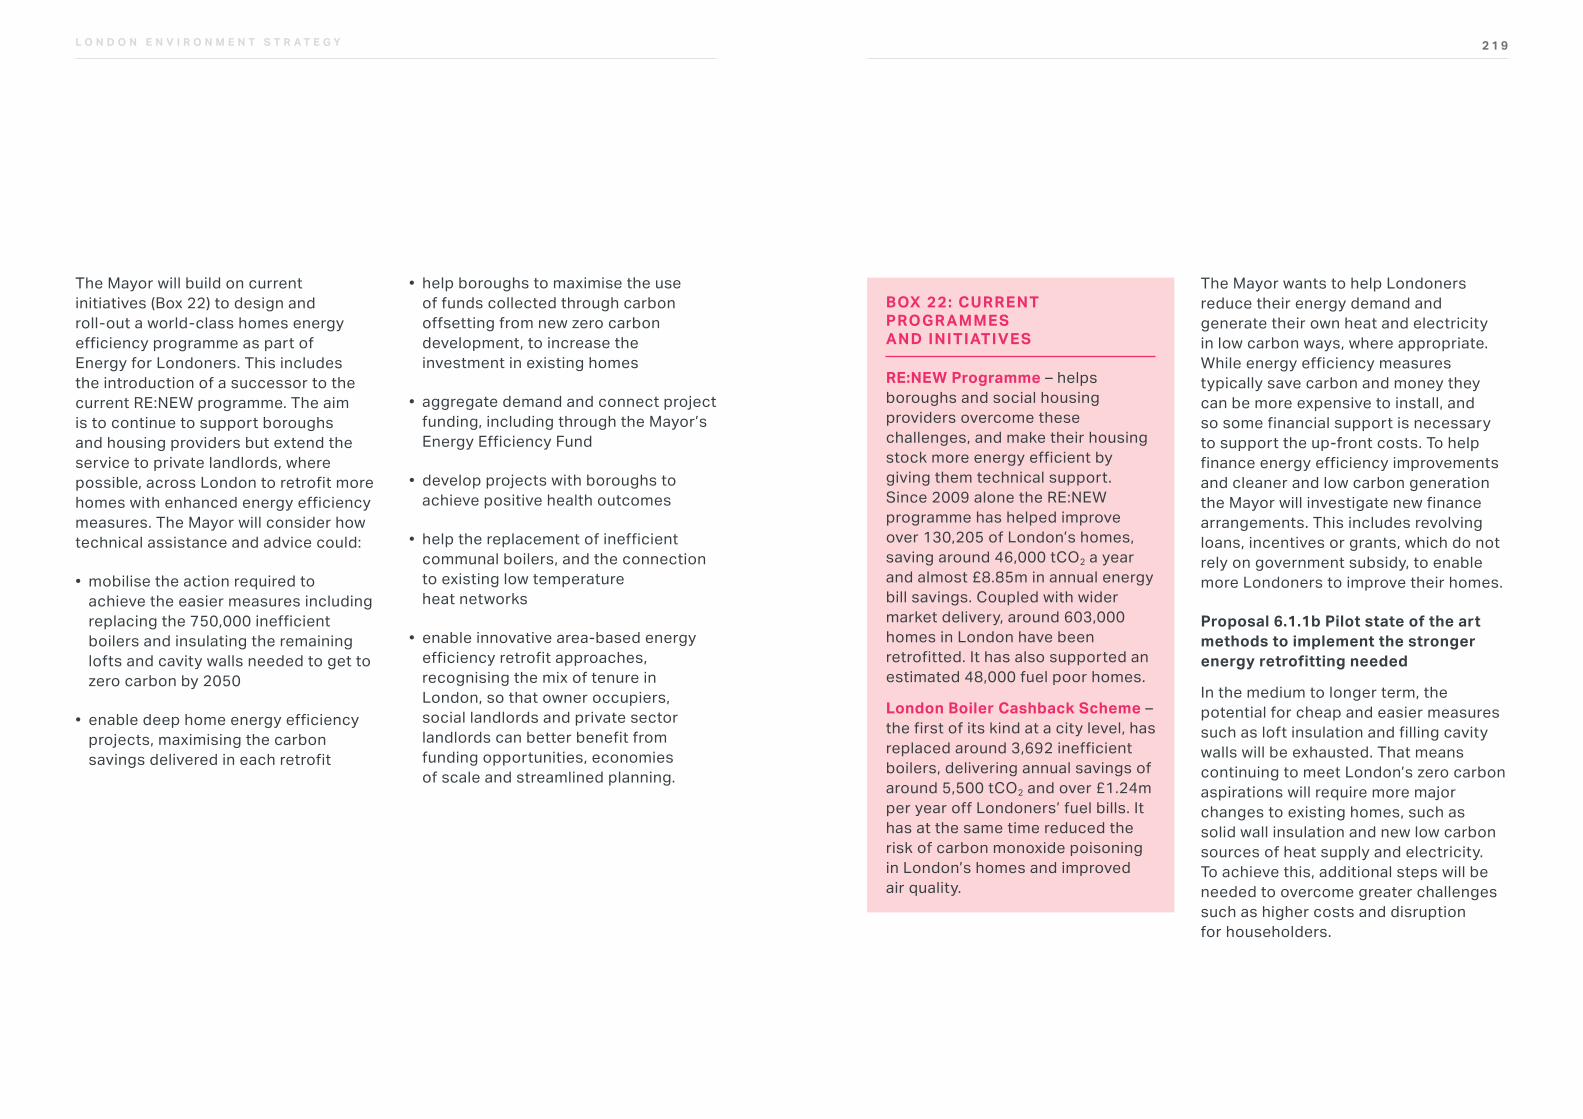
2 1 9L O N D O N E N V I R O N M E N T S T R A T E G Y
The Mayor wants to help Londoners reduce their energy demand and generate their own heat and electricity in low carbon ways, where appropriate. While energy efficiency measures typically save carbon and money they can be more expensive to install, and so some financial support is necessary to support the up-front costs. To help finance energy efficiency improvements and cleaner and low carbon generation the Mayor will investigate new finance arrangements. This includes revolving loans, incentives or grants, which do not rely on government subsidy, to enable more Londoners to improve their homes.
Proposal 6.1.1b Pilot state of the art methods to implement the stronger energy retrofitting needed
In the medium to longer term, the potential for cheap and easier measures such as loft insulation and filling cavity walls will be exhausted. That means continuing to meet London’s zero carbon aspirations will require more major changes to existing homes, such as solid wall insulation and new low carbon sources of heat supply and electricity. To achieve this, additional steps will be needed to overcome greater challenges such as higher costs and disruption for householders.
The Mayor will build on current initiatives (Box 22) to design and roll-out a world-class homes energy efficiency programme as part of Energy for Londoners. This includes the introduction of a successor to the current RE:NEW programme. The aim is to continue to support boroughs and housing providers but extend the service to private landlords, where possible, across London to retrofit more homes with enhanced energy efficiency measures. The Mayor will consider how technical assistance and advice could:
• mobilise the action required to achieve the easier measures including replacing the 750,000 inefficient boilers and insulating the remaining lofts and cavity walls needed to get to zero carbon by 2050
• enable deep home energy efficiency projects, maximising the carbon savings delivered in each retrofit
• help boroughs to maximise the use of funds collected through carbon offsetting from new zero carbon development, to increase the investment in existing homes
• aggregate demand and connect project funding, including through the Mayor’s Energy Efficiency Fund
• develop projects with boroughs to achieve positive health outcomes
• help the replacement of inefficient communal boilers, and the connection to existing low temperature heat networks
• enable innovative area-based energy efficiency retrofit approaches, recognising the mix of tenure in London, so that owner occupiers, social landlords and private sector landlords can better benefit from funding opportunities, economies of scale and streamlined planning.
BOX 22: CURRENT PROGR AMMES AND INITIATIVES
RE:NEW Programme – helps boroughs and social housing providers overcome these challenges, and make their housing stock more energy efficient by giving them technical support. Since 2009 alone the RE:NEW programme has helped improve over 130,205 of London’s homes, saving around 46,000 tCO2 a year and almost £8.85m in annual energy bill savings. Coupled with wider market delivery, around 603,000 homes in London have been retrofitted. It has also supported an estimated 48,000 fuel poor homes.
London Boiler Cashback Scheme – the first of its kind at a city level, has replaced around 3,692 inefficient boilers, delivering annual savings of around 5,500 tCO2 and over £1.24m per year off Londoners’ fuel bills. It has at the same time reduced the risk of carbon monoxide poisoning in London’s homes and improved air quality.
2 2 1L O N D O N E N V I R O N M E N T S T R A T E G Y
The installation of rooftop solar PV coupled with batteries is likely to be a key part of this pilot. Energy Leap will also try to establish the ‘value up-lift’ that comes from installing solar, through post-retrofit valuations. If successful, Energy Leap will lead to a bigger project looking to overcome other key challenges including more complex building types and mixed-tenure housing.
In addition to Energy Leap, the Mayor will explore alternative approaches to deeper and whole-house retrofitting which could help make radical reductions in household carbon emissions and energy bills.
Proposal 6.1.1c Make the case to government to introduce the long-term regulatory and financial framework to support and speed up the rate of energy efficiency
The Mayor’s programmes alone cannot deliver the necessary energy efficiency measures in homes to meet the zero carbon target, it will also require supportive policy and funding from national government.
There have been several government policies to support home energy efficiency. However many have been subject to continual change and intermittent and inadequate funding, creating uncertainty in the market and stalling implementation. To help provide the energy efficiency measures required in London, the Mayor will advocate to government the need for the following national and regional action:
National actions• accelerating implementation of the
new ECO scheme with an enhanced ambition and introduce a successor to the Green Deal to ensure that existing housing stock is quickly made more energy efficient
• extending, promoting and improving mandatory home energy efficiency standards, for example extending the minimum standards in the Private Rented Sector Energy Efficiency Regulations to apply to social housing and market sales
• developing fiscal incentives to increase uptake of solid wall insulation and low carbon heating power, for example reductions in VAT (which could be
Through Energy for Londoners the Mayor will help build a strong and expanding market for deeper energy efficiency retrofitting so each home improvement can include all suitable measures available. By increasing demand for home improvements, energy efficiency measures and low carbon supply technologies (like heat pumps and solar PV) will become a cheaper option. That way they will be able to compete with fossil fuels.
To help achieve this, the Mayor’s Energy Leap Project will deliver some of the first whole house zero energy retrofits in London and the UK. It will trial payment mechanisms including the ability to recoup some or all of the capital cost of the refurbishment work through savings on energy bills, maintenance and energy performance guarantees. This project will also improve the look and feel of the home and bring greater awareness to home energy use.
The Energy Leap project will act as a first pilot to prove the concept. If successful, it will allow a larger demonstrator to happen. This will help overcome other key challenges including more complex building typologies and mixed-tenure properties.
“ The Mayor’s Energy Leap Project will deliver some of the first whole house zero energy retrofits in London and the UK.”
L O N D O N E N V I R O N M E N T S T R A T E G Y
2 2 3L O N D O N E N V I R O N M E N T S T R A T E G Y
78 The Energy Company Obligation was previously focused on reducing carbon emissions from homes through the installation of energy efficiency measures. Part of ECO was ring-fenced for low income households to ensure that it was not regressive, given all households pay through their energy bills. However, successive governments have reduced to overall ambition, and therefore level of investment, of ECO, leaving a much smaller programme. Government decided that it would focus this smaller pot almost exclusively on low income households to alleviate fuel poverty. The current phase of ECO runs from April 2017 to October 2018 and is being treated as a transition from the changing focus from carbon emissions reduction to fuel poverty alleviation79 Survey by London Association of Local Energy Officers (ALEO), 2016
to make positive changes to their home that will help cut energy bills and demand and contribute towards reducing carbon emissions, they need timely, impartial, and accurate information and advice.
Smart meters will have a critical role in building the foundations for a zero carbon energy system for London. The first step is the installation of smart meters alongside the use of flexible energy tariffs and more energy efficient appliances.
The rollout of smart meters has multiple benefits:
• they give near real time information on energy use – expressed in pounds and pence
• enable people to better understand and manage energy use, helping to them move to cheaper time of day tariffs to reduce energy bills
• bring an end to estimated billing – consumers will only be billed for the energy actually used, helping people to budget better
• easier switching – smoother and faster to switch suppliers to get the best deals
The government has committed to mandating the offer of smart meters to every London household and small business, and delivering meters to all homes by the end of 2020. But the roll out is behind schedule.
The Mayor will encourage all new developments to install smart meters. Through Energy for Londoners, greater awareness of energy management will be promoted such as identifying the most energy efficient appliances, guidance on selecting the best energy tariffs and supporting ‘switch off’ campaigns and competitions. The Mayor will work with energy suppliers and Smart Energy GB to establish smart meter roll-out campaigns and include their installation as a measure through energy efficiency programmes.
done following UK’s exit from the EU), voucher schemes and low or zero interest rate loans
• issuing planning guidance on external wall insulation to increase boroughs’ understanding and awareness of the technology and help householders and social housing providers prepare good quality applications
Regional actions• setting regional targets for energy
supplier obligations, such as the ECO, and other government-mandated support schemes in order to ensure that London receives its fair share of support
Local actions• raising awareness by private
landlords of the need to comply with Private Rented Sector Energy Efficiency Regulations
• working with local authority trading standards teams to enforce Private Rented Sector Energy Efficiency Regulations, including provision of appropriate training.
The Mayor will also offer to work with national government to:
• pilot revenue-neutral incentives which, subject to further scoping, might include incorporating Energy Performance Certificate rating in the way Stamp Duty Land Tax is calculated. This would act as a ‘trigger’ at the point of purchase and enable home owners to claim rebates when they improve the efficiency of their home
• implement the recommendations of Each Home Counts (the Bonfield Review) in London. This includes using evidence from London’s retrofit projects to help develop and implement a quality mark and installer Code of Conduct for the residential retrofit sector
Proposal 6.1.1d Improve the way energy is managed in London including through supporting the roll out of smart meters and advocating time of day tariffs
Individual actions and choices within homes can have an important impact on energy use. To enable householders
2 2 5L O N D O N E N V I R O N M E N T S T R A T E G Y
• providing guidance and support to boroughs on how they can use data to identify households in fuel poverty
• establishing a high-profile cross-sectoral Fuel Poverty Partnership to coordinate action in London
• calling on government to develop fiscal incentives for solid wall insulation and review the Minimum Energy Efficiency Standard to remove exemptions and increase the number of properties treated.
Further details are in the draft Fuel Poverty Action Plan and the Mayor welcomes feedback on this Plan during the period of the consultation on this strategy.
Proposal 6.1.2b Tender for the delivery of an energy supply company, aiming to offer fairer energy bills to Londoners and encourage Londoners to switch and move away from pre-payment meters
The UK energy market is currently dysfunctional and most customers pay too much for their electricity and gas. This national problem is particularly acute in London. The Competition and Markets Authority’s (CMA) 2014-16
“ As part of Energy for Londoners the Mayor will introduce ambitious programmes to make London’s workplaces more energy efficient and low carbon.”
2 2 5
Policy 6.1.2 Tackle fuel poverty in London and protect the most vulnerable through the Mayor’s Fuel Poverty Action Plan
Proposal 6.1.2a The Mayor will work with partners to help alleviate fuel poverty in London through implementing the recommendations of the Fuel Poverty Action Plan
Historically, central government and the boroughs have taken the lead in providing fuel poverty support programmes. However, central government has reduced its support for fuel poverty alleviation since 2012. Remaining support is in the form of the Warm Home Discount78 and the ECO, which is now focused largely on energy efficiency measures for low income households.
Many boroughs, given the financial pressures they are under, have not been able to maintain support for many of their fuel poverty support programmes. 46 per cent of boroughs do not have any officer responsible for fuel poverty alleviation, and a further 46 per cent have fuel poverty as only part of an officer’s role.79 This leaves significant gaps in the provision of support for households struggling to keep their homes warm and pay for their energy bills.
To help reduce fuel poverty, the Mayor has already introduced the Better Boilers pilot scheme80 which targeted homeowners receiving benefits (as a proxy for fuel poverty), and has helped replace and repair 307 boilers, and install new heating controls.
In addition to this scheme, the Mayor has published a draft Fuel Poverty Action Plan which will sets the actions required to further alleviate fuel poverty in London. The Mayor’s ambition is to reduce both the prevalence of fuel poverty in London and the ‘depth’ of fuel poverty that Londoners experience. Actions include:
• investing directly in energy efficiency programmes targeting carbon reduction and tackling fuel poverty
• providing funding to support and create local advice and referral networks as a way of helping to improve the living conditions of fuel poor households signposting the fuel poor to more affordable energy tariffs and offering fairer energy through Energy for Londoners
• implementing a programme to help Londoners get access to all of the income support they are entitled to
80 Better Boilers has also removed harmful asbestos from many fuel poor homes (which causes around 5000 deaths every year in the UK), which had previously insulated old pipes and heating systems. The scheme also provided important learnings in relation to delivering fuel poverty support in London and the type of support vulnerable people need, which is helping to inform the development of new initiatives under Energy for Londoners.
2 2 7L O N D O N E N V I R O N M E N T S T R A T E G Y
heating and cooling. To achieve the Mayor’s zero carbon ambition by 2050 the emissions footprint of London’s workplaces will need to account for only 1.6 MtCO2e reducing from around 16.6 MtCO2e. This implies around 15,000 workplaces being retrofitted with energy efficiency improvements and renewable technologies each year to 2050.
As part of Energy for Londoners the Mayor will introduce ambitious programmes to make London’s workplaces more energy efficient and low carbon.
The Mayor will support the public sector to retrofit their buildings with carbon and energy reduction measures through an improved Energy for Londoners programme building on the current RE:FIT programme. Launched in spring 2016, this phase of the programme will run until August 2019. The programme will support London’s public-sector building managers to reduce energy demand and carbon emissions, improve air quality, and deliver large guaranteed energy savings for the public sector. RE:FIT addresses the lack of technical expertise and (increasingly) capacity within many public-sector organisations by providing free-of-charge expert support to public sector bodies (including London boroughs, NHS bodies, schools, universities and colleges, central government departments and cultural and heritage organisations).
The framework of 16 suppliers enables organisations to procure suppliers quickly, efficiently and economically to deliver energy saving measures, and guarantee energy savings.
The scope of RE:FIT has been extended to offer support to more organisations, bringing a greater focus on solar energy, and expanding its scope to include the retrofit of non-building assets, such as LED street lighting and electric vehicle charging infrastructure, and the promotion of district heating (see Box 23 for a case study). By 2020 the programme aims to have reduced emissions by nearly 25,000 tCO2e pa, saved at least 68 GWh of energy and retrofitted over 400 buildings from a range of public sector bodies.
We will lead by example on the GLA group’s own estate and activities. The GLA group has reduced emissions from its fleet and operations from 189 ktCO2e in 2012/13 to 160 ktCO2e in 2015/16 and is committed to a 60 per cent reduction on 1990 levels by 2025. More can be done to reduce energy use and CO2 emissions, and utilise renewable electricity and low carbon heat sources. The Mayor’s zero carbon target will be taken into account across City Hall and the rest of the GLA group including when making major investment decisions and providing funding for building regeneration or retrofit projects.
Energy Market Investigation identified that 70 per cent of domestic customers could save as much as £300 per year by switching supplier, but that 56 per cent of consumers have never switched energy supplier or did not realise that this was possible. A fifth of Londoners are on pre-payment meters, which tends to mean higher tariffs and less access to good deals. There is no incentive for the energy market to help customers move from the most expensive tariffs. London has the lowest levels of switching of all regions in the UK for gas and is below the national average for electricity. Recent proposals for a cap may help reduce costs for some. The risk is that, although the differential between the highest and lowest prices narrows, many people will still pay too much.
The Mayor will tender for the delivery of an energy supply company. The Mayor will issue a tender with the aim of procuring a scheme to offer fairer energy bills for Londoners. In light of changing market conditions and uncertainty in national policy, the Mayor aims to start a scheme using an existing supplier. This will allow Londoners to have fairer energy bills sooner. The option to move to a fully licensed supply company will kept under review in light of changes in the market and clarification of national policy, as well as the progression of the Licence Lite project.
While it is being established the Mayor will encourage people to switch energy supplier to seek a better deal. Previous experience, such as that of the Big London Energy Switch, demonstrates that this kind of engagement can deliver significant energy savings, but there is a need to go further by engaging groups identified by the CMA as being less inclined to switch.
The Mayor will work with London boroughs, community energy groups and charities to help engage harder-to-reach groups of customers and those who could soon become fuel poor.
Policy 6.1.3 Improve the energy efficiency of London’s workplaces and support the transition to low carbon heating and power
Proposal 6.1.3a Provide direct technical support and assistance to help reduce CO2 emissions and energy within the public sector, including leading by example in the GLA group estate
London’s workplaces are diverse, hosting a plethora of organisations from the public, private and third sectors which include banks, retailers, manufacturers, government, charities, schools and hospitals. Workplaces which include both commercial and some light industry are responsible for around 42 per cent of London’s GHG emissions from powering the technology, lighting,
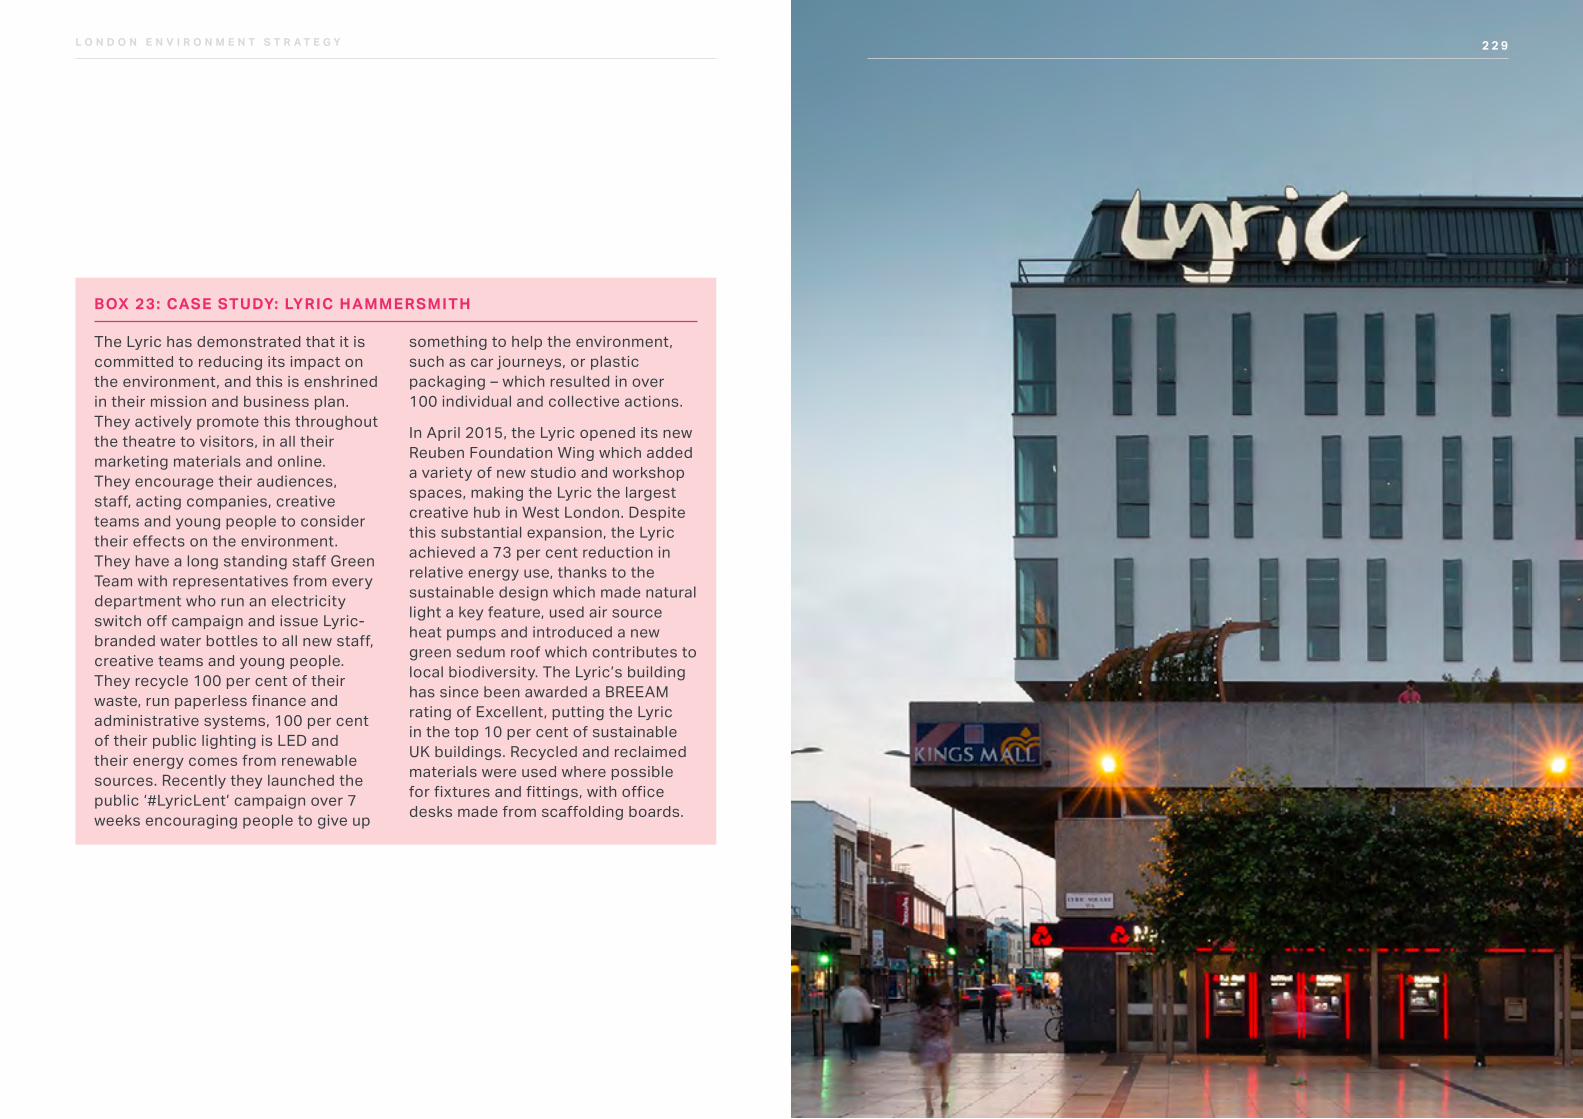
2 2 9L O N D O N E N V I R O N M E N T S T R A T E G Y 2 2 9
The Lyric has demonstrated that it is committed to reducing its impact on the environment, and this is enshrined in their mission and business plan. They actively promote this throughout the theatre to visitors, in all their marketing materials and online. They encourage their audiences, staff, acting companies, creative teams and young people to consider their effects on the environment. They have a long standing staff Green Team with representatives from every department who run an electricity switch off campaign and issue Lyric-branded water bottles to all new staff, creative teams and young people. They recycle 100 per cent of their waste, run paperless finance and administrative systems, 100 per cent of their public lighting is LED and their energy comes from renewable sources. Recently they launched the public ‘#LyricLent’ campaign over 7 weeks encouraging people to give up
something to help the environment, such as car journeys, or plastic packaging – which resulted in over 100 individual and collective actions.
In April 2015, the Lyric opened its new Reuben Foundation Wing which added a variety of new studio and workshop spaces, making the Lyric the largest creative hub in West London. Despite this substantial expansion, the Lyric achieved a 73 per cent reduction in relative energy use, thanks to the sustainable design which made natural light a key feature, used air source heat pumps and introduced a new green sedum roof which contributes to local biodiversity. The Lyric’s building has since been awarded a BREEAM rating of Excellent, putting the Lyric in the top 10 per cent of sustainable UK buildings. Recycled and reclaimed materials were used where possible for fixtures and fittings, with office desks made from scaffolding boards.
BOX 23: CASE STUDY: LYRIC HAMMERSMITH
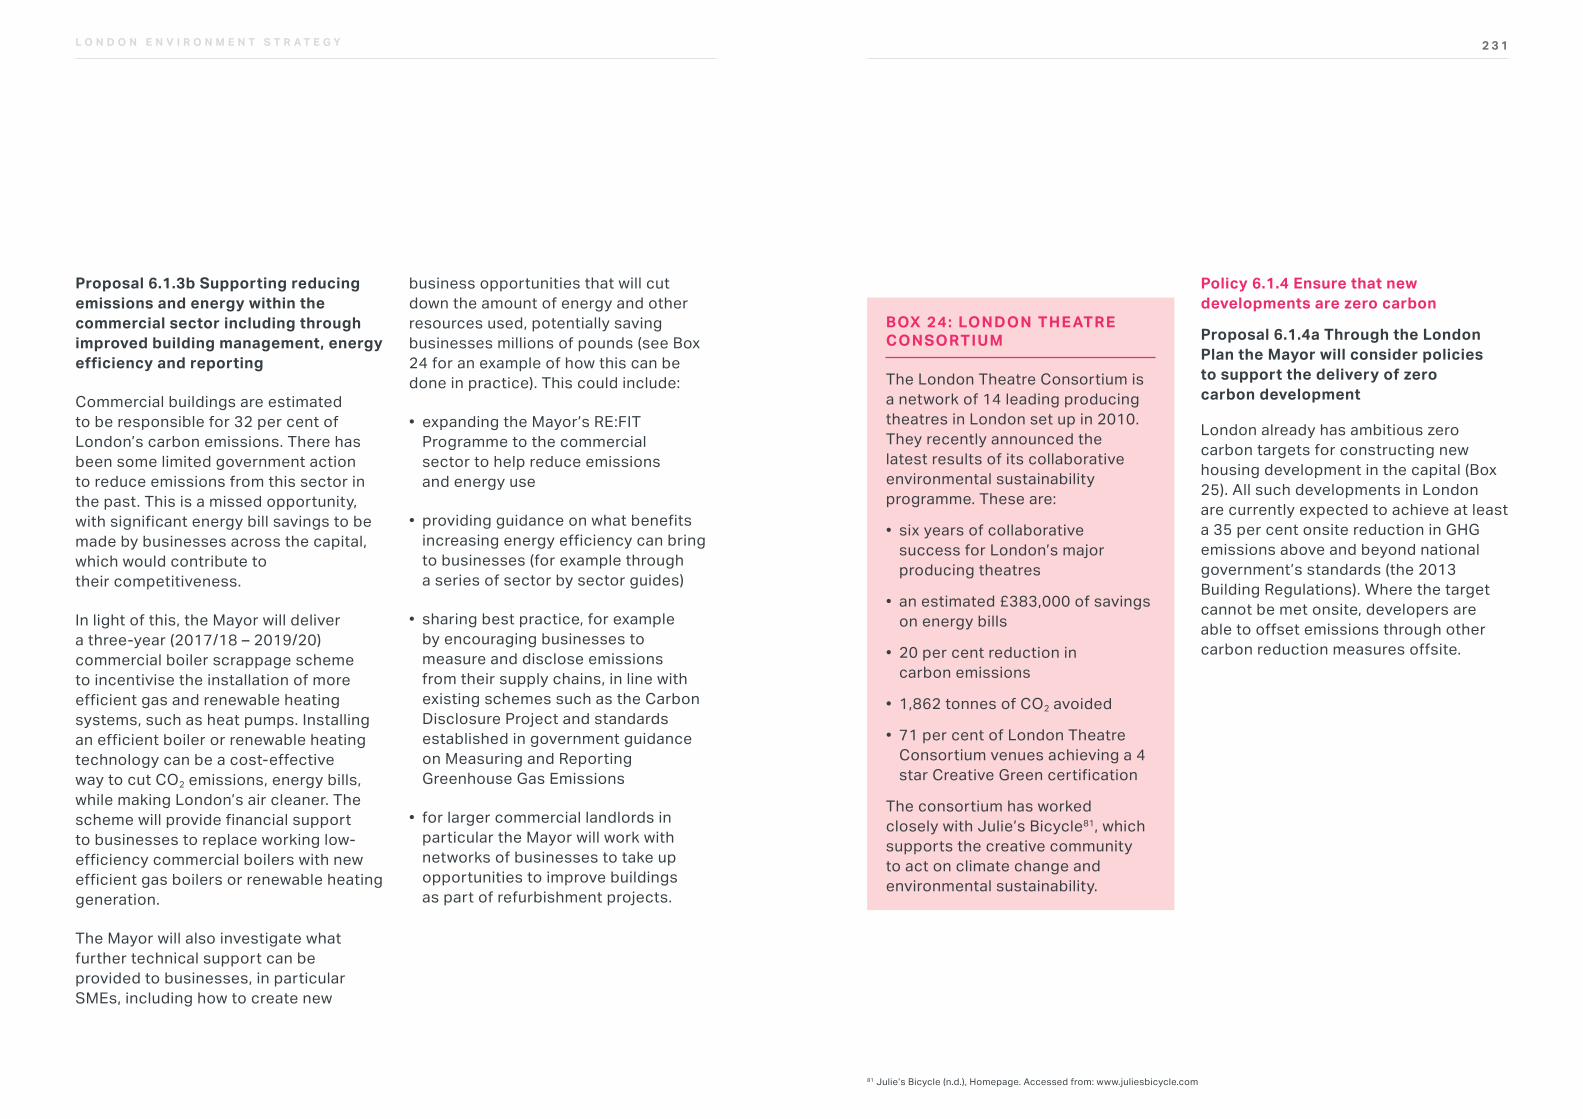
2 3 1L O N D O N E N V I R O N M E N T S T R A T E G Y
81 Julie’s Bicycle (n.d.), Homepage. Accessed from: www.juliesbicycle.com
Policy 6.1.4 Ensure that new developments are zero carbon
Proposal 6.1.4a Through the London Plan the Mayor will consider policies to support the delivery of zero carbon development
London already has ambitious zero carbon targets for constructing new housing development in the capital (Box 25). All such developments in London are currently expected to achieve at least a 35 per cent onsite reduction in GHG emissions above and beyond national government’s standards (the 2013 Building Regulations). Where the target cannot be met onsite, developers are able to offset emissions through other carbon reduction measures offsite.
Proposal 6.1.3b Supporting reducing emissions and energy within the commercial sector including through improved building management, energy efficiency and reporting
Commercial buildings are estimated to be responsible for 32 per cent of London’s carbon emissions. There has been some limited government action to reduce emissions from this sector in the past. This is a missed opportunity, with significant energy bill savings to be made by businesses across the capital, which would contribute to their competitiveness.
In light of this, the Mayor will deliver a three-year (2017/18 – 2019/20) commercial boiler scrappage scheme to incentivise the installation of more efficient gas and renewable heating systems, such as heat pumps. Installing an efficient boiler or renewable heating technology can be a cost-effective way to cut CO2 emissions, energy bills, while making London’s air cleaner. The scheme will provide financial support to businesses to replace working low-efficiency commercial boilers with new efficient gas boilers or renewable heating generation.
The Mayor will also investigate what further technical support can be provided to businesses, in particular SMEs, including how to create new
business opportunities that will cut down the amount of energy and other resources used, potentially saving businesses millions of pounds (see Box 24 for an example of how this can be done in practice). This could include:
• expanding the Mayor’s RE:FIT Programme to the commercial sector to help reduce emissions and energy use
• providing guidance on what benefits increasing energy efficiency can bring to businesses (for example through a series of sector by sector guides)
• sharing best practice, for example by encouraging businesses to measure and disclose emissions from their supply chains, in line with existing schemes such as the Carbon Disclosure Project and standards established in government guidance on Measuring and Reporting Greenhouse Gas Emissions
• for larger commercial landlords in particular the Mayor will work with networks of businesses to take up opportunities to improve buildings as part of refurbishment projects.
BOX 24: LONDON THE ATRE CONSORTIUM
The London Theatre Consortium is a network of 14 leading producing theatres in London set up in 2010. They recently announced the latest results of its collaborative environmental sustainability programme. These are:
• six years of collaborative success for London’s major producing theatres
• an estimated £383,000 of savings on energy bills
• 20 per cent reduction in carbon emissions
• 1,862 tonnes of CO2 avoided
• 71 per cent of London Theatre Consortium venues achieving a 4 star Creative Green certification
The consortium has worked closely with Julie’s Bicycle81, which supports the creative community to act on climate change and environmental sustainability.
2 3 3L O N D O N E N V I R O N M E N T S T R A T E G Y
developers should investigate generating and storing renewable energy onsite, as well as using it onsite, to contribute to London’s security of energy supply.
Developers will be expected to commit to delivering against the energy hierarchy in their energy strategies and the Mayor will report annually on the estimated emissions saved from strategic developments.
In 2016, new developments reported an average carbon reduction of seven per cent beyond Part L of the Building Regulations from energy efficiency measures (the ‘be lean’ element of the energy hierarchy). Reducing energy demand not only saves energy and carbon emissions, but also reduces energy bills and so the Mayor intends to investigate measures to encourage further carbon savings from the ‘be lean’ element of the hierarchy, including the possibility of introducing an energy efficiency target.
Alongside this policy for homes, the Mayor is intending to introduce a zero carbon standard for non-residential buildings in the London Plan from 2019 to ensure that all new major development in London contributes to the Mayor’s zero carbon city ambition.
Unabated climate change presents a major environmental and health hazard, and decarbonising our energy supply is important. At the same time, London is currently failing to meet legally binding air quality standards, and public health is suffering as a result. Tackling this is the priority so the energy hierarchy will be structured so it also contributes towards improving air quality.
In particular, while Combined Heat and Power systems (CHP) can have benefits in terms of carbon emissions, gas engine CHP plant usually gives rise to higher emissions of NOx and/or PM10 emissions than ultra-low NOx gas boilers, even when abatement equipment is used. Therefore in preparing his London Plan, the Mayor will consider whether, in areas which exceed legal air quality limits, the policy should prevent emissions from energy production plant, including from CHP, that would exceed those of an ultra-low NOx gas boiler. Energy production plant used in other areas should meet all relevant emission standards (which may require abatement equipment) as considered by the new London Plan, as well as not causing unacceptable local impacts on air quality.
The approach that developers are expected to follow – the energy hierarchy – is set out in the London Plan. This expects development proposals to minimise carbon dioxide emissions from construction and future operation of the building as well as its annual and peak energy demand.
To achieve the Mayor’s zero carbon development target, the energy hierarchy wording will be updated to:
1. be lean: use less energy and manage demand during construction and operation
2. be clean: exploit local energy resources (such as secondary heat) and supply energy efficiently and cleanly
3. be green: generate, store and use renewable energy onsite
Developers will be expected to manage energy demand from construction as well as the operation of the development as the emissions from embedded carbon become a greater part of a development’s carbon footprint. Developers will also be expected to prioritise local energy sources, where available, and ensure that air quality is a key consideration in determining energy supply to the development. Finally,
BOX 25: IMPLEMENTING LONDON PL AN POLICIES
In 2016, planning applications considered by the Mayor will be expected to achieve reductions in regulated CO2 emission of 36 per cent above Part L requirements of 2013 Building Regulations. This is estimated to save over 48,000 tonnes CO2 per annum against the Part L baseline and deliver over £150m investment in heat network infrastructure, £12m in solar PV panels and additional investment in other energy technologies to assist the transition to zero carbon, most notably heat pumps.
2 3 5L O N D O N E N V I R O N M E N T S T R A T E G Y
The energy strategies developers commit to must be delivered in practice, and any potential performance gap between design and construction must be minimised. This requires accurate methods for measuring performance once the developments are operational as well as good enforcement. However, boroughs have limited resources to enforce planning conditions and developers’ interest or involvement is likely to have ceased.
To address these challenges the Mayor will review the potential for applying other more effective methods of estimating building energy and carbon performance. The Mayor will also work with boroughs and developers to design more effective arrangements for monitoring the operational energy performance of new buildings, and provide guidance through supplementary documents to the London Plan.
Proposal 6.1.4c Encourage the reduction of whole lifecycle building emissions (embodied carbon)
As onsite emissions continue to reduce, embodied carbon (those emissions associated with the production of
building materials) will form a greater part of a development’s total carbon footprint. In order to reduce these emissions, accurate measurement methodologies are needed. A survey conducted to inform the assessment of city-wide carbon footprints found no consistency in the data sources, tools or methodologies used to calculate embodied emissions.84 Ninety per cent of construction industry professionals responded to a survey stating that they would benefit from better guidance and support.
As a step towards reducing embodied carbon emissions, the Mayor will support the work of BREEAM and RICS to develop a new British Standard to estimate whole life cycle building emissions.
In addition, the Mayor will work through the London Waste and Recycling Board to assess how a circular economy approach can help contribute to reducing embodied carbon by, for example, re-using materials or for new major developments to achieve a specified BREEAM credit for Responsible Sourcing of Materials.85
84 Mayor of London (2014), Application of PAS 2070: London case study. Accessed from: https://data.london.gov.uk/dataset/application-pas-2070-london-case-study 85 BREEAM is a widely used sustainability assessment method for master planning projects, infrastructure and buildings. It addresses several lifecycle stages such as new construction, refurbishment and operation. The Responsible Sourcing of Materials component of the BREEAM assessment recognises and encourages the specification of responsibly sourced materials for key building elements.
Offset fundsWhile the Mayor intends to maximise onsite emissions reductions from new development, offsetting funds have a role to play where onsite measures are not technically feasible or cost effective. These funds could raise considerable funding to enable energy efficiency measures to be installed in local buildings, and be prioritised to tackle local issues including fuel poverty.
As part of the Mayor’s 2016 zero carbon homes policy developers are able to meet their obligations by supporting offsite carbon abatement measures. This can either be by paying into carbon offset funds collected by the Local Planning Authority (LPA), or delivered offsite via a carbon saving project agreed between the LPA and the developer.
The majority of London’s LPAs have now set up offset funds and the Mayor is working with boroughs to monitor progress. If all LPAs were to establish offset funds and if the proceeds were used more strategically (for example, part or all of the offset funds were to be pooled) then this could be used to help improve the energy efficiency of the existing building stock and help tackle fuel poverty.
The Mayor’s energy efficiency programmes could provide technical support to boroughs to help ensure that offsetting funds are being used effectively to reduce carbon whilst encouraging a holistic approach to retrofitting buildings.
The Mayor will publish guidance to LPAs on the allocation and use of offsetting payments and review the current carbon price82 to determine the most effective level to deliver carbon offsetting projects and the option of pooling funds.
Proposal 6.1.4b Support the design of effective methods to ensure the energy and carbon performance of new developments meet their agreed designed standards
There have recently been observed gaps in the designed energy performance and the operational performance of new developments, mainly due to materials and components not meeting specification and lack of knowledge and skills of those making decisions within the construction process.83
82 Most boroughs use £60 per tonne83 Zero Carbon Hub (2013), Closing the Gap Between Design and As-Built Performance. Accessed from: http://webcache.googleusercontent.com/search?q=cache:dDSCfVrwoyQJ:www.zerocarbonhub.org/sites/default/files/resources/reports/Closing_the_Gap_Bewteen_Design_and_As-Built_Performance_Interim_Report.pdf+&cd=1&hl=en&ct=clnk&gl=uk
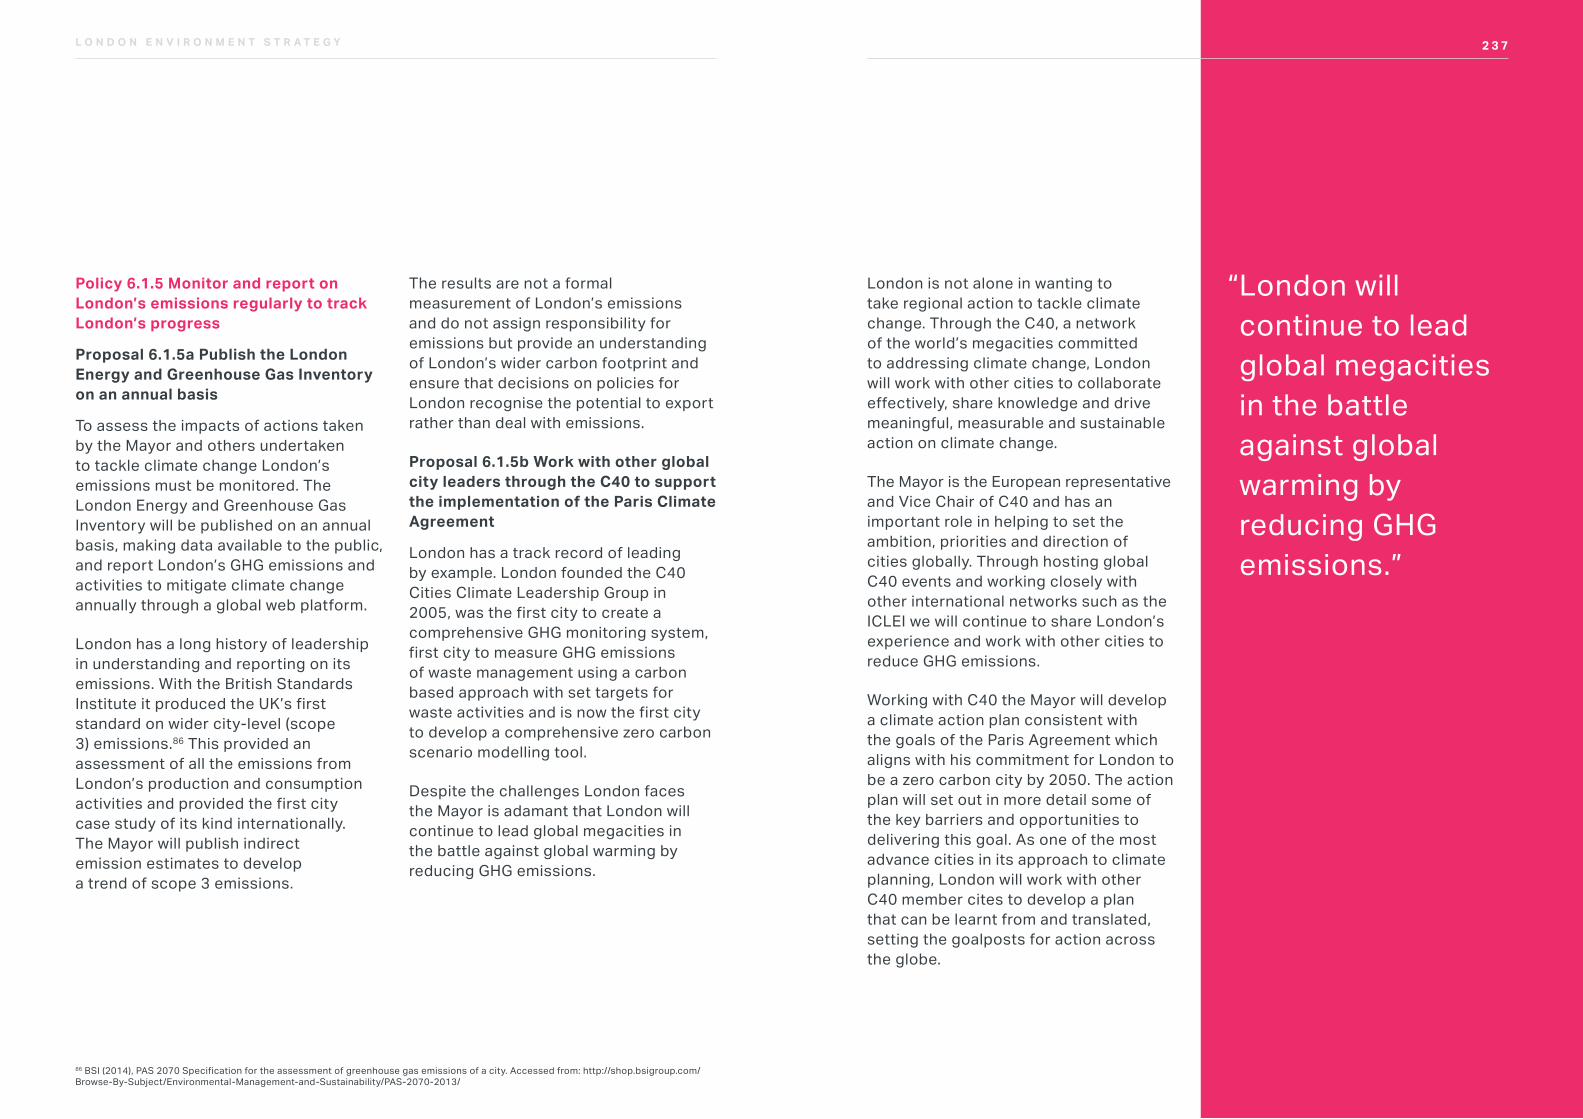
2 3 7L O N D O N E N V I R O N M E N T S T R A T E G Y
London is not alone in wanting to take regional action to tackle climate change. Through the C40, a network of the world’s megacities committed to addressing climate change, London will work with other cities to collaborate effectively, share knowledge and drive meaningful, measurable and sustainable action on climate change.
The Mayor is the European representative and Vice Chair of C40 and has an important role in helping to set the ambition, priorities and direction of cities globally. Through hosting global C40 events and working closely with other international networks such as the ICLEI we will continue to share London’s experience and work with other cities to reduce GHG emissions.
Working with C40 the Mayor will develop a climate action plan consistent with the goals of the Paris Agreement which aligns with his commitment for London to be a zero carbon city by 2050. The action plan will set out in more detail some of the key barriers and opportunities to delivering this goal. As one of the most advance cities in its approach to climate planning, London will work with other C40 member cites to develop a plan that can be learnt from and translated, setting the goalposts for action across the globe.
“ London will continue to lead global megacities in the battle against global warming by reducing GHG emissions.”
2 3 7
Policy 6.1.5 Monitor and report on London’s emissions regularly to track London’s progress
Proposal 6.1.5a Publish the London Energy and Greenhouse Gas Inventory on an annual basis
To assess the impacts of actions taken by the Mayor and others undertaken to tackle climate change London’s emissions must be monitored. The London Energy and Greenhouse Gas Inventory will be published on an annual basis, making data available to the public, and report London’s GHG emissions and activities to mitigate climate change annually through a global web platform.
London has a long history of leadership in understanding and reporting on its emissions. With the British Standards Institute it produced the UK’s first standard on wider city-level (scope 3) emissions.86 This provided an assessment of all the emissions from London’s production and consumption activities and provided the first city case study of its kind internationally. The Mayor will publish indirect emission estimates to develop a trend of scope 3 emissions.
The results are not a formal measurement of London’s emissions and do not assign responsibility for emissions but provide an understanding of London’s wider carbon footprint and ensure that decisions on policies for London recognise the potential to export rather than deal with emissions.
Proposal 6.1.5b Work with other global city leaders through the C40 to support the implementation of the Paris Climate Agreement
London has a track record of leading by example. London founded the C40 Cities Climate Leadership Group in 2005, was the first city to create a comprehensive GHG monitoring system, first city to measure GHG emissions of waste management using a carbon based approach with set targets for waste activities and is now the first city to develop a comprehensive zero carbon scenario modelling tool.
Despite the challenges London faces the Mayor is adamant that London will continue to lead global megacities in the battle against global warming by reducing GHG emissions.
86 BSI (2014), PAS 2070 Specification for the assessment of greenhouse gas emissions of a city. Accessed from: http://shop.bsigroup.com/Browse-By-Subject/Environmental-Management-and-Sustainability/PAS-2070-2013/
2 3 9L O N D O N E N V I R O N M E N T S T R A T E G Y
on local energy resources utilising heat pumps that supply communal or district heating (or cooling) through a network of underground pipes connecting it to homes and buildings. For London to become zero carbon by 2050, the energy system will need to move away from using natural gas to being fuelled more from municipal waste, renewable energy and the heat that is wasted from industrial and commercial processes.
The changing nature of energy supply will mean that the way energy is used, and the infrastructure that supports supply, will need to become more flexible integrating different types of energy and responding to demand at different times of the day. A smart approach is therefore required which uses real-time data and technologies such as smart meters to ensure that the energy system can operate in a way that will reduce system peaks. Combined with the increasing use of energy storage and balancing electricity, heat and cooling demand with the available supply, a smart system will deliver the optimum cost savings, reduce resource consumption and promote environmental benefits.
The Mayor will work to increase delivery of decentralised energy in London and identify and map the opportunities to create a smart, flexible energy system.
Policy 6.2.1 Delivering more decentralised energy in London
Proposal 6.2.1a Help implement large scale decentralised and low carbon energy projects, including stimulating demand from the GLA group
District heating networks and renewable energy supply account for approximately half of London’s decentralised energy systems, delivering the equivalent of two per cent of total demand. There is the opportunity to increase this type of energy supply to 15 per cent of demand by 2030. There are a number of opportunities for further decentralised energy projects including large-scale solar PV installations and heat networks utilising technologies such as heat pumps in combination with secondary heat sources.
To facilitate implementation the Mayor will provide support to boroughs and the private sector through the Decentralised Energy Enabling Project (DEEP)87. Over the next two years, this programme will help implement large-scale decentralised energy projects in London, which the market is currently failing to develop. DEEP will provide technical, commercial, financial and other support services to assist public and private sectors to develop, procure and bring into operation these large scale projects.
87 DEEP will provide technical, commercial, financial and other advisory and support services to assist public and private energy suppliers to develop, procure and bring into operation larger-scale DE schemes that deliver significant greenhouse-gas emission reductions at market-competitive prices. It will deliver CO2 reductions of 17,400 tonnes per annum by September 2019 through projects it directly supports, and aims to enable 90 MW of capacity installed by 2023. It will prioritise key locations where the feasibility is most suitable.
OBJECTIVE 6.2 DEVELOP CLEAN AND SMART, INTEGRATED ENERGY SYSTEMS UTILISING LOCAL AND RENEWABLE ENERGY RESOURCES
In addition to reducing the energy use of buildings in London there is a need to transform the energy system so that power and heat for buildings and transport is generated from clean, low carbon and renewable sources, such as solar and waste heat.
Energy infrastructure will need to be transformed so that it is smarter and more effective. This will enable supply and demand of energy to be better matched, reduce consumption and enable people to take advantage of cheaper electricity, sold during low demand periods such as overnight, or high supply periods such as on sunny and windy days.
While this is a national issue, in London the supply of more local, decentralised, low carbon energy can be maximised. Decentralised energy ranges from small production, such as electricity from solar PV panels, to larger scale systems based
“ The Mayor will work to increase delivery of decentralised energy in London and identify and map the opportunities to create a smart, flexible energy system.”
L O N D O N E N V I R O N M E N T S T R A T E G Y
2 4 1L O N D O N E N V I R O N M E N T S T R A T E G YL O N D O N E N V I R O N M E N T S T R A T E G Y
The Mayor can potentially have a more direct role in the delivery of heat networks, significantly increasing the rate of their development in London. The Mayor will therefore consider the establishment of a District Heating Network Delivery Body for London that secures funding, and in partnership with London Boroughs, develops and builds district heating networks. For such a model to work it is likely that central government will need to create a level playing field for the treatment of district heating networks compared to other statutory utilities regarding access rights and business rates.
The Mayor wants to stimulate demand for further decentralised energy supply in London. This will include developing affordably-priced markets for locally generated electricity. Licence Lite, will look to purchase electricity from low and zero carbon generators in London, under a power purchase agreement, and sell it to GLA group members and public sector organisations to use in their buildings (Box 26). The Mayor will evaluate the success of an initial Licence Lite trial with TfL and look to develop a business case for signing up other GLA group members and public sector organisations to purchase local low carbon power.
Implementation of large scale decentralised and low carbon energy projects will be undertaken in a coordinated way so they also contribute towards improving air quality as well as reducing carbon emissions. This will include meeting any relevant air quality standards and emission requirements set out in the London Plan.
BOX 26: LICENCE LITE
The Licence Lite project will deliver the Mayoral manifesto commitment to ‘buy clean energy generated across the city, using it to power GLA and TfL facilities’. The project will acquire an Ofgem junior electricity supply licence to buy locally generated low carbon electricity at a higher price than they would otherwise receive from the wholesale market and sell to GLA group facilities. Licence Lite aims to be operational by autumn 2017.
Proposal 6.2.1b Increase the amount of solar generation in London including through community energy projects and on GLA group buildings
The Mayor wants to see a solar revolution in London with more heat and electricity generated from renewable solar sources. The draft Solar Action Plan, the first of its kind for London, sets out how the Mayor will seize the opportunity for solar energy in the capital and increase deployment in the coming years.
By 2030, the Mayor’s programmes will lead to an extra 100 megawatts (MW) of installed solar energy generation in London. That will more than double the city’s current solar energy generation capacity (95 MW). The Mayor thinks London can, and should, go further than this. To meet the zero carbon target, London will require around ten times more solar energy generation to be installed – two gigawatts (GW) by 2050. This can’t be done through the Mayor’s leadership and programmes alone. It will need strong and supportive policy from national government and the support of local government, the private sector, charities and individuals.
“ The Mayor wants to see a solar revolution in London with more heat and electricity generated from renewable solar sources.”
2 4 3L O N D O N E N V I R O N M E N T S T R A T E G Y
BOX 27: THE MAYOR’S DR AFT SOL AR ACTION PL AN
The actions in this draft plan will put London on track to realising the potential of solar energy. In addition, it will maximise the contribution of solar to the Mayor’s zero carbon city ambition.
Mayoral actions:
1. Lead by example by maximising solar energy technologies on GLA group buildings and land
• map the full potential for solar energy generation on the GLA group estate in 2018 and
Proposal 6.2.1b Increase the amount of solar generation in London including through community energy projects and on GLA group buildings
The Mayor wants to see a solar revolution in London with more heat and electricity generated from renewable solar sources. The draft Solar Action Plan, the first of its kind for London, sets out how the Mayor will seize the opportunity for solar energy in the capital and increase deployment in the coming years.
By 2030, the Mayor’s programmes will lead to an extra 100 megawatts (MW) of installed solar energy generation in London. That will more than double the city’s current solar energy generation capacity (95 MW). The Mayor thinks London can, and should, go further than this. To meet the zero carbon target, London will require around ten times more solar energy generation to be installed – two gigawatts (GW) by 2050. This can’t be done through the Mayor’s leadership and programmes alone. It will need strong and supportive policy from national government and the support of local government, the private sector, charities and individuals.
Box 27 summarises the Mayor’s proposed approach and headline actions to increase the amount of solar generation installed in London. These include leading by example by maximising solar energy technologies on GLA group buildings and land. In
maximise installation on the GLA group’s buildings and land
2. Encourage solar energy installations through the planning system
• ensure that new developments include solar, where feasible, and work with boroughs to ensure planning policies don’t necessarily restrict solar installation on existing properties
3. Help Londoners to retrofit solar energy technologies on their homes and workplaces through the Mayor’s programmes and funding
• pilot a new ‘solar reverse auction’ scheme to reduce installation costs for Londoners
• develop a grants scheme to help solar energy projects get off the ground
• encourage public sector organisations and providers of social housing to retrofit solar energy technologies on buildings. This will include promoting technical help programmes like the Mayor’s RE:FIT programme
and the introduction of a successor to the RE:NEW programme
• support projects that promote energy storage
4. Help Londoners to make informed decisions about investing in solar energy technologies
• produce an interactive map for Londoners to identify solar energy generation potential and promote it through Mayoral programmes
• provide clear guidance and information on installing solar energy technologies
Further government action:
5. Call on government to set a national policy framework to help London realise its solar energy potential
• call on government to ensure national policy is introduced to support higher levels of solar energy deployment in London as part of a package of national government policy measures that enable London to meet its ambitious zero carbon target by 2050
BOX 27: THE MAYOR’S DR AFT SOL AR ACTION PL AN (CONTINUED)
addition to continuing to encourage solar energy through the planning system, the Mayor will also encourage Londoners to retrofit solar on their homes. This will be achieved by producing an interactive map for Londoners with guidance and information on installing solar, and piloting a new solar reverse auction scheme to reduce installation costs for Londoners. To support communities, the Mayor will also introduce a community energy support scheme to help get solar projects up and running.
The Mayor would welcome feedback on the draft Solar Action plan during the consultation of this strategy.
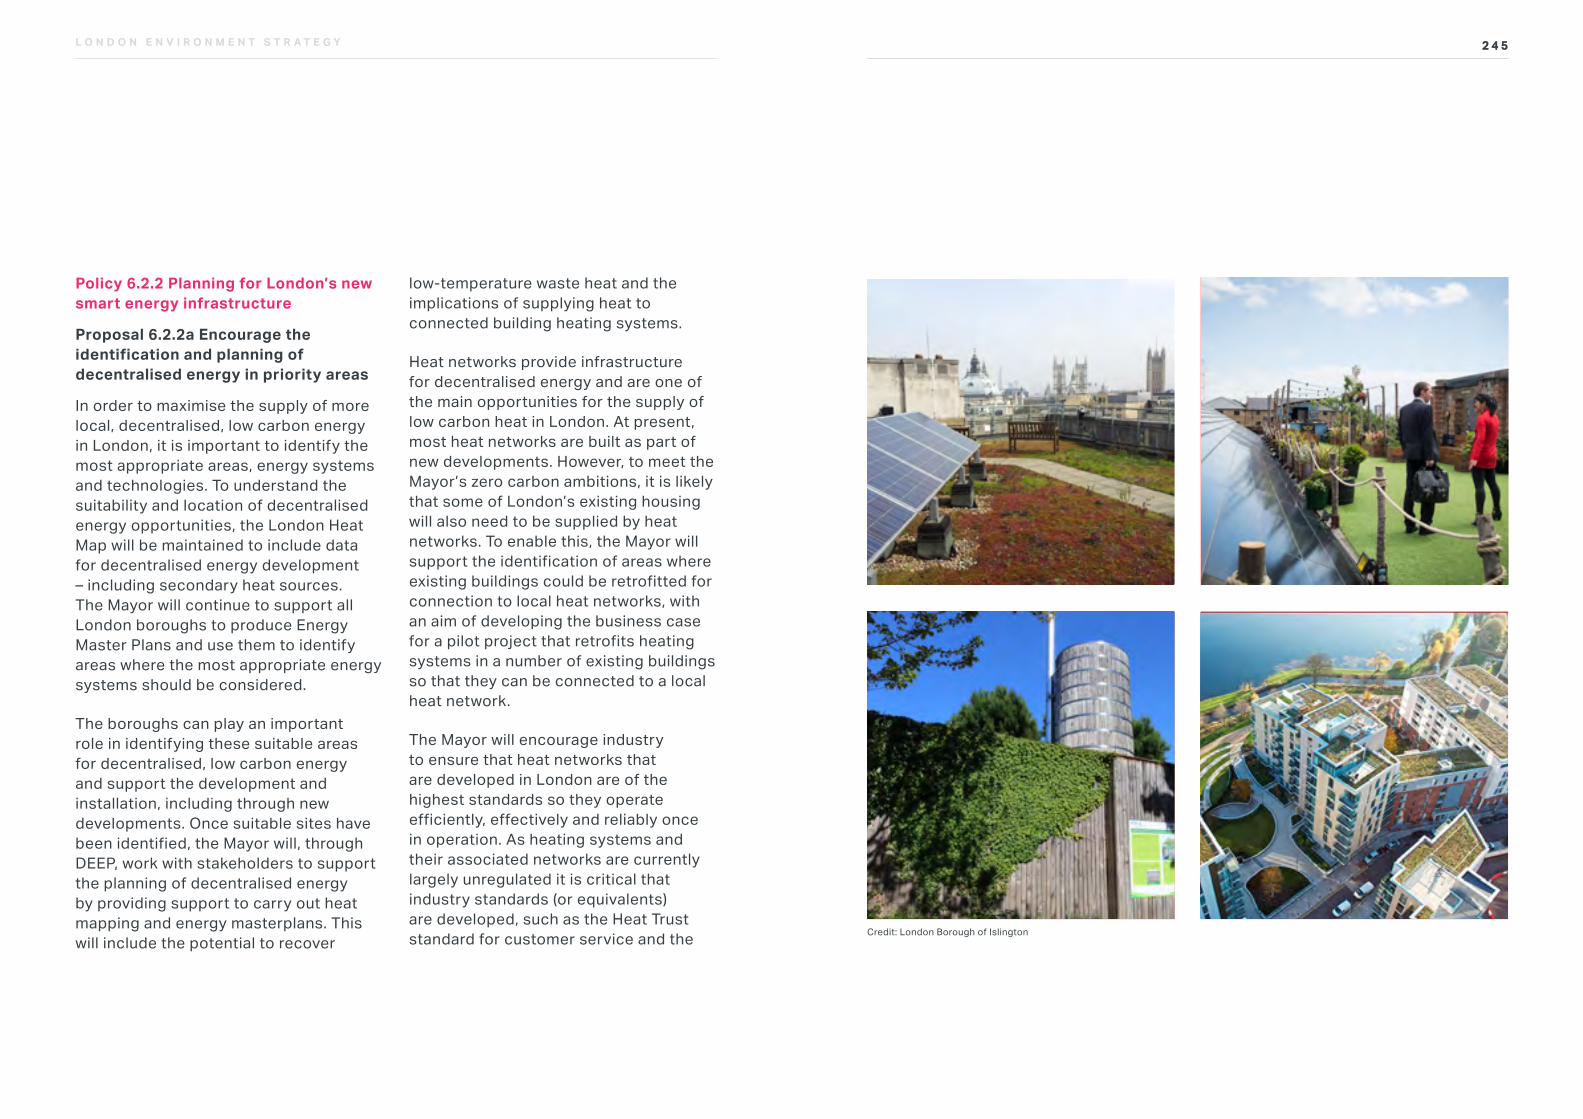
2 4 5L O N D O N E N V I R O N M E N T S T R A T E G Y
Policy 6.2.2 Planning for London’s new smart energy infrastructure
Proposal 6.2.2a Encourage the identification and planning of decentralised energy in priority areas
In order to maximise the supply of more local, decentralised, low carbon energy in London, it is important to identify the most appropriate areas, energy systems and technologies. To understand the suitability and location of decentralised energy opportunities, the London Heat Map will be maintained to include data for decentralised energy development – including secondary heat sources. The Mayor will continue to support all London boroughs to produce Energy Master Plans and use them to identify areas where the most appropriate energy systems should be considered.
The boroughs can play an important role in identifying these suitable areas for decentralised, low carbon energy and support the development and installation, including through new developments. Once suitable sites have been identified, the Mayor will, through DEEP, work with stakeholders to support the planning of decentralised energy by providing support to carry out heat mapping and energy masterplans. This will include the potential to recover
low-temperature waste heat and the implications of supplying heat to connected building heating systems.
Heat networks provide infrastructure for decentralised energy and are one of the main opportunities for the supply of low carbon heat in London. At present, most heat networks are built as part of new developments. However, to meet the Mayor’s zero carbon ambitions, it is likely that some of London’s existing housing will also need to be supplied by heat networks. To enable this, the Mayor will support the identification of areas where existing buildings could be retrofitted for connection to local heat networks, with an aim of developing the business case for a pilot project that retrofits heating systems in a number of existing buildings so that they can be connected to a local heat network.
The Mayor will encourage industry to ensure that heat networks that are developed in London are of the highest standards so they operate efficiently, effectively and reliably once in operation. As heating systems and their associated networks are currently largely unregulated it is critical that industry standards (or equivalents) are developed, such as the Heat Trust standard for customer service and the
2 4 5
Credit: London Borough of Islington
2 4 7L O N D O N E N V I R O N M E N T S T R A T E G Y
heat networks Code of Practice for the design, specification and operation of heat networks are of a high and relevant standard. The Mayor will work with all stakeholders to update London’s guidance on design and specifications for heat networks and consumer standards in light of latest standards and feedback from Londoners.
Storage of energy will also be important to balance supply and demand at the building, district and national levels. Battery storage is likely to become increasingly important, and thermal storage could enable surplus electricity generation from renewables (e.g. solar PV in the summer), to be converted to and stored as heat for later use in district heating. London’s potential for inter-seasonal thermal storage has yet to be explored, but if feasible, excess summertime energy could be captured for wintertime heating.
City subsurface temperatures are known to have increased due to the urban heat island (UHI) effect (see Chapter 8: Adapting to Climate Change) causing increased aquifer temperatures. The Mayor will investigate the potential for London’s geology to provide thermal storage and heat source as a consequence of the UHI effect, in conjunction with future low temperature heat networks.
National government will also need to decide on whether the UK moves to a hydrogen economy, which would see gas networks adapt the system to transport hydrogen for heating, cooking, homes and transportation in a similar way to the supply of natural gas today. The Mayor will work with national government to identify research opportunities to pilot zero carbon hydrogen heat projects working with the London Hydrogen Partnership.
Proposal 6.2.2b Undertake demonstration project and trials to improve London’s energy systems
To ensure that London is at the forefront of developing smart and integrated energy systems, the Mayor will support demonstrations and trials of advanced approaches to optimise London’s energy systems, sharing findings across London, nationally and internationally.
For example, the Mayor has supported CELSIUS, an EU Smart Cities Demonstration Project with five European partner cities: Gothenburg (lead partner), London and Islington Council, Cologne, Genoa and Rotterdam, which runs until December 2017. It investigates the role of waste heat in district heating networks and the role of district heat networks in the wider
energy system. Phase 2 of Islington Council‘s Bunhill Heat and Power Heat Network is the London demonstrator. It is integrating waste heat from the Tube into the network and using smart controls to operate the energy centre.
The Mayor is also supporting, Sharing Cities, a €25m smart city demonstrator programme in partnership with Greenwich, Milan, Lisbon, Bordeaux, Burgas and Warsaw. The programme aims to use data and digital approaches to ‘connect up’ existing and new building, transport and energy infrastructure, to reduce energy demand, bills and emissions, and achieve integrated city infrastructures that meet citizens’ needs.
Through Sharing Cities the Mayor will work with Greenwich to apply retrofitting solutions to residential five non-residential properties, including integrating low carbon energy supply, improvements to the physical fabric of buildings to make them more energy efficient, and the installation of smart digital heating and electricity controls in individual apartments. The Mayor will also support the implementation of a sustainable energy management system that will integrate city infrastructures, optimise energy supply, and use
data analytics and predictive control techniques to create energy services that Londoners want. Scaled up across London, a sustainable energy management system has the potential to reduce energy consumption by up to 20 per cent, cut energy bills and emissions. The Mayor will deliver a comprehensive quantitative evaluation of the performance of the measures across the Greenwich demonstrator and share this learning across London, nationally and internationally.
Proposal 6.2.2c Investigate the potential for further smart, flexible energy system demonstrators and pilots where Londoners can help manage demand
The Mayor has assessed the impact on the national electricity system resulting from the electrification of heating to achieve zero carbon. It considered the system reinforcement investment and Londoner’s energy bills for a high DE scenario compared with a low scenario. It concluded that the former would cost the national system £20bn less, and Londoner’s bills would be 40 per cent lower.
2 4 9L O N D O N E N V I R O N M E N T S T R A T E G Y
London therefore plays an important role within the national energy system and the Mayor will work with central government, the Grid Operator and other key stakeholders (including Ofgem, National Grid and Distribution Network Operator Companies) to investigate the approach to the planning of city energy systems that will lead to smart, flexible city systems operating as part of the national system and allow Londoners to participate in the demand side response market. This includes:
• demand side response initiatives and the impact of electrification upon the grid
• the potential role of a zero carbon gas supply for London and the role of district heating networks in an integrated energy system
• and, most importantly, the flexibility potential of London’s demand side response could offer
The Mayor will investigate future demonstrators and pilots including:
• innovations that flexibly match changing energy supply and demand profiles of the future
• incorporating storage or advanced management and optimisation of multiple energy supply to boost use and efficiency
• removing barriers to innovative SMEs accessing energy markets, offering customers better energy services and creating new value for London’s tech businesses
Proposal 6.2.2d The Mayor will oppose fracking in London
The Mayor has been clear that he opposes fracking in London and through the new London Plan he will consider policies to ensure that fracking is prevented in London. If any fracking applications were made in London in the Green Belt or on Metropolitan Open Land the current London Plan contains strong policies for their protection, however the Mayor will look to strengthen this policy further.
OBJECTIVE 6.3 A ZERO EMISSION TRANSPORT NETWORK BY 2050
The Mayor’s ambition is to have a zero emission transport network by 2050. This will be achieved through an integrated approach to reducing carbon emissions and air pollutants from transport. The policies and proposals to reduce London’s carbon emissions from transport have therefore been combined with policies and proposals under the air quality chapter of this strategy. Please see Chapter 4 for full air quality policies and proposals.
QCONSULTATION QUESTIONS: CLIMATE CHANGE MITIGATION AND ENERGY
1. Do you agree that the policies and proposals outlined will meet the Mayor’s ambition to make London a zero carbon city by 2050? Is the proposed approach and pace realistic and achievable?
2. To achieve the Mayor’s zero carbon ambition we estimate (between now and 2050), up to 100,000 homes will need to be retrofitted every year with energy efficiency measures. Do you agree with the Mayor’s
policies and proposals to achieve his contribution to this? What more can central government and others do to achieve this?
3. Which policies or programmes would most motivate businesses to reduce energy use and carbon emissions?
4. Please provide any further comments on the policies and programmes mentioned in this chapter, including those in the draft solar action plan and draft fuel poverty action plan that accompany this strategy.
london.gov.uk/environment-strategy

2 5 1L O N D O N E N V I R O N M E N T S T R A T E G Y
Chapter 7: Waste
2 5 1
2 5 3L O N D O N E N V I R O N M E N T S T R A T E G Y
INTRODUCTION
Our linear economy (take, make and dispose) is unsustainable. It produces too much waste, with around 7m tonnes coming from London’s homes, public buildings and businesses each year, too much of which goes to landfill and incineration. Of this, only 52 per cent is currently recycled and performance has stagnated. Landfill and incineration are undesirable, costly and an inefficient use of resources. The capacity of landfills accepting London’s waste is expected to run out by 2026 and London’s waste bill is now in in excess of £2bn a year and rising.
Through increasingly clever design of goods and services we are beginning to treat our waste as the valuable resource it is. In order to maximise this we need to reduce waste in the first place and then reuse or recycle as much as possible. What’s left over can then be used to generate low carbon energy, minimising the amount going to landfill.
AIM London will be a zero waste city. By 2026 no biodegradable or recyclable waste will be sent to landfill and by 2030 65 per cent of London’s municipal waste will be recycled.
L O N D O N E N V I R O N M E N T S T R A T E G Y
Cutting waste and recovering value from more of it can provide a number of benefits including jobs, apprenticeships, secondary materials, and affordable low carbon energy. Effective waste management delivering high quality materials to market can give local authorities a reliable high value income stream. This can help to offset costs associated with service improvements. More of London’s reusable items like furniture, fittings and electrical appliances need to be kept in use. Redistributing them to where they are needed can create local work, keep resource costs down and help reduce poverty.
The Mayor will take a circular approach to London’s use of resources that designs out waste, keeps materials in use at their highest value for as long as possible and minimises environmental impact. The actions required to deliver this are:
• firstly, significantly cutting waste and encouraging reuse to minimise the use of virgin resources. Efforts will be focused on reducing food waste and single use packaging as they offer the biggest opportunity for change
• once waste reduction and reuse opportunities have been exhausted there must be a focus on maximising the recycling of materials that are left
• generating low carbon energy from truly residual waste leaving very little waste going to landfill
• ensuring that there is sufficient infrastructure to support these actions within London helping to create opportunities for businesses developing reuse, repair and remanufacturing services
Roles and legal dutiesThe Mayor is required under the GLA Act to produce a municipal waste management strategy. However, the Mayor is not a waste authority and it is ultimately the waste collection and disposal authorities, businesses and the commercial waste industry that will implement the waste policies in this strategy in collaboration with the Mayor. The Mayor’s role is a combination of exercising regulatory functions (ensuring local authority waste plans, services, strategies and contracts are in general conformity with his waste policies and proposals) and non-regulatory functions
2 5 5L O N D O N E N V I R O N M E N T S T R A T E G Y
(funding, research, technical assistance, providing guidance, campaigns and facilitating and supporting good practice). There are 33 waste collection authorities (boroughs and City of London), 12 authorities that are “unitary” waste authorities (combined collection and disposal), four statutory waste disposal authorities and one voluntary waste partnership.88 The waste collection authorities and the waste disposal authorities are referred to as ‘waste authorities’ in this strategy.
In 2011 Defra changed the definition of municipal waste to align with the EU definition, which defines municipal waste much more broadly to be household waste or waste similar in composition to household waste. Applying this definition brings an additional 3.3 million tonnes of waste into scope, regardless of who collects it. This change was made to make sure that the UK is correctly reporting its performance for meeting its landfill diversion targets under the European Landfill Directive. Commercially collected waste is covered in this strategy because of its importance to London’s environment generally.
88 South London Waste Partnership comprising Merton, Sutton, Kingston upon Thames and Croydon.
Taking this approach places no additional legal requirement on London’s waste authorities, who must continue to act in general conformity within the municipal waste management provisions of this strategy, including binding targets for municipal waste in their possession or control.
Municipal waste targets set in this strategy are non-binding in so far as they relate to Commercial Waste Contractors (CWCs). The Mayor expects CWCs to have regard to those municipal waste targets and they will be achieved through additional activity and services by waste authorities, the commercial waste industry and other relevant organisations working in partnership with the Mayor.
To avoid confusion this strategy uses the terms set out in Box 28.
BOX 28: DEFINITIONS OF TERMS USED IN THIS CHAPTER
• “waste” refers to any substance or object which the holder discards, intends to discard or is required to discard
• “municipal waste” household waste or business waste that is similar in composition irrespective of who collects or disposes of it
• “Local Authority Collected Waste (LACW)” refers to all waste in the possession or control of waste authorities. This includes waste collected from households and businesses
• “waste authority (ies)” means a Waste Collection Authority and a Waste Disposal Authority. It includes London’s 33 waste collection authorities (all 32 boroughs and the City of London), those 12 authorities that are “unitary” waste authorities (combined collection and disposal) and the 4 statutory waste disposal authorities
• “Commercially Collected Waste” refers to municipal waste in the possession or control of a body or organisation that is not a waste authority
The London Waste and Recycling Board (LWARB) is also a key delivery partner for his policies. It brings together the Mayor, boroughs, and other stakeholders involved in managing London’s waste with the objective of promoting and encouraging less waste and its sustainable management89 and it must act in accordance with the Mayor’s waste policies. The Mayor through his appointed representatives on LWARB oversees a £20.4m fund from 2017-2020 to deliver against its objectives of reducing waste and increasing reuse and recycling (see Box 29).
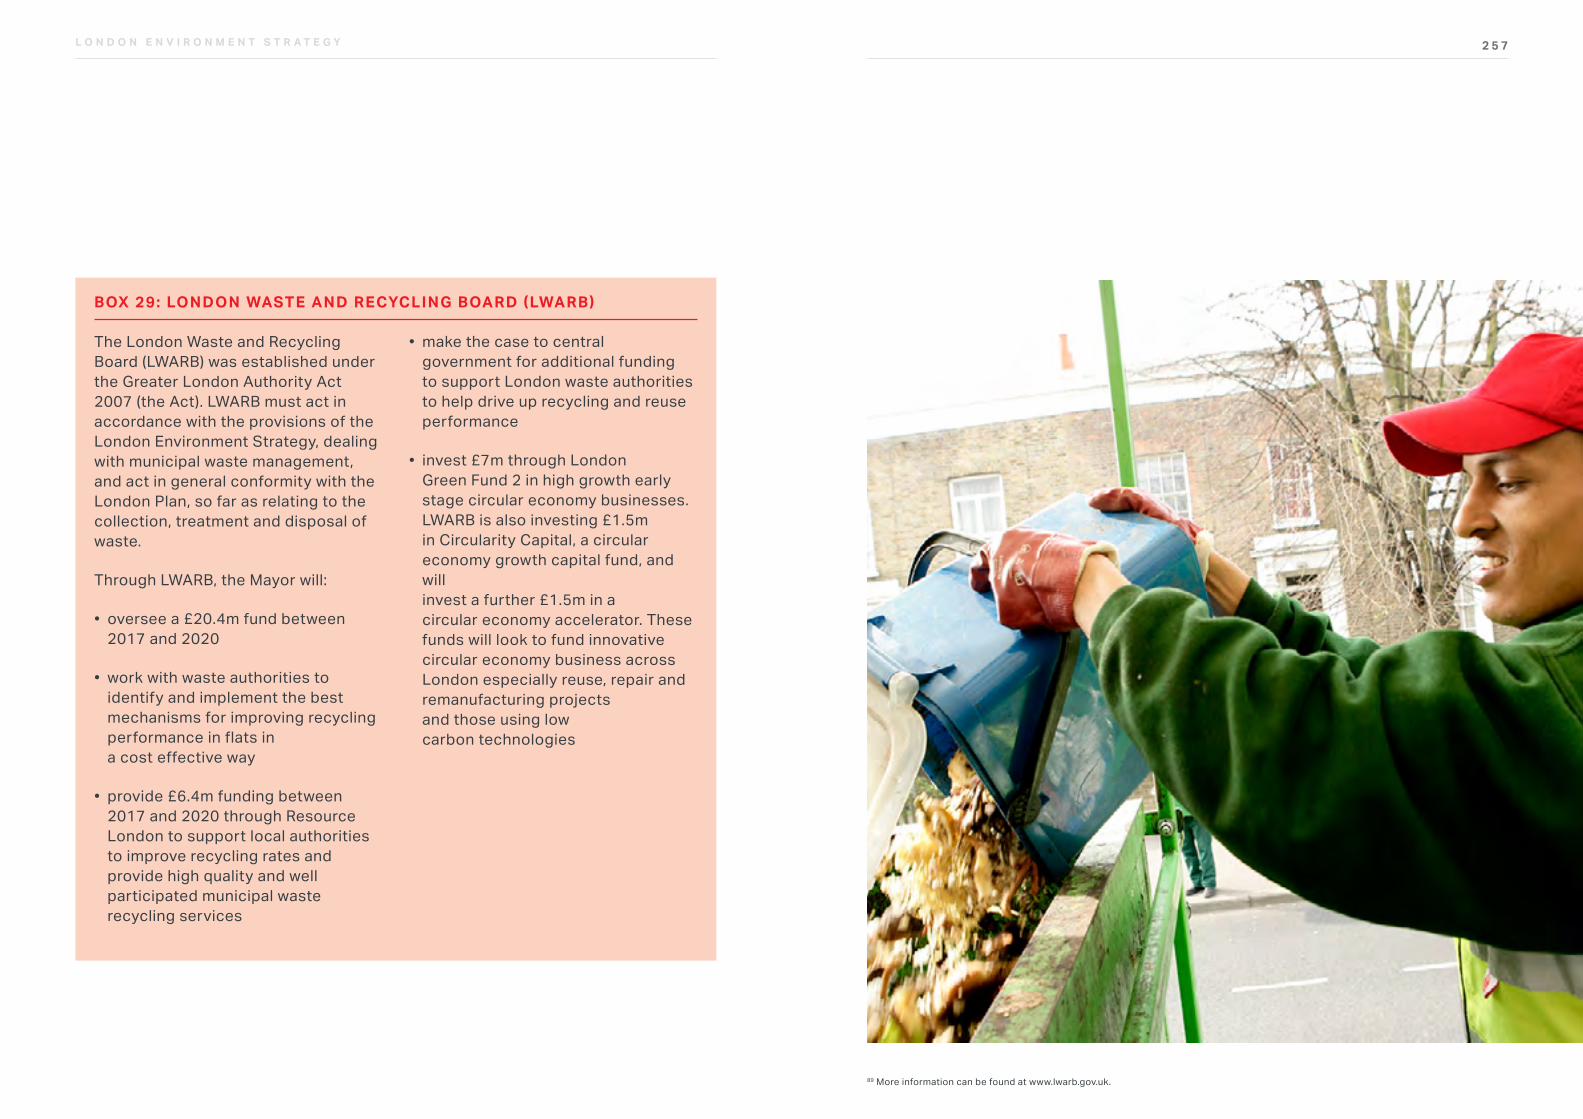
2 5 7L O N D O N E N V I R O N M E N T S T R A T E G Y
The London Waste and Recycling Board (LWARB) was established under the Greater London Authority Act 2007 (the Act). LWARB must act in accordance with the provisions of the London Environment Strategy, dealing with municipal waste management, and act in general conformity with the London Plan, so far as relating to the collection, treatment and disposal of waste.
Through LWARB, the Mayor will:
• oversee a £20.4m fund between 2017 and 2020
• work with waste authorities to identify and implement the best mechanisms for improving recycling performance in flats in a cost effective way
• provide £6.4m funding between 2017 and 2020 through Resource London to support local authorities to improve recycling rates and provide high quality and well participated municipal waste recycling services
• make the case to central government for additional funding to support London waste authorities to help drive up recycling and reuse performance
• invest £7m through London Green Fund 2 in high growth early stage circular economy businesses. LWARB is also investing £1.5m in Circularity Capital, a circular economy growth capital fund, and will invest a further £1.5m in a circular economy accelerator. These funds will look to fund innovative circular economy business across London especially reuse, repair and remanufacturing projects and those using low carbon technologies
BOX 29: LONDON WASTE AND RECYCLING BOARD (LWARB)
89 More information can be found at www.lwarb.gov.uk.
2 5 9L O N D O N E N V I R O N M E N T S T R A T E G Y
The Mayor’s waste powers: general conformity and power of direction.
In performing their waste functions, waste authorities need to show how they are acting in general conformity with the municipal waste provisions of this strategy. General conformity only applies to local authority collected waste (LACW) activities and cannot bring excessive additional costs to waste authorities. The Mayor has the power to direct a waste authority where he considers their waste activities to be detrimental to implementing the municipal waste provisions in this strategy. His power of direction does not apply to businesses or private waste companies.
The Mayor expects waste authorities to help successfully implement his municipal waste management policies and proposals. These expectations are set out in Box 30 below. This will ensure that a consistent approach is taken to applying general conformity.
The Mayor expects waste authorities to do the following in order to show they are acting in general conformity with this strategy’s municipal waste management policies and proposals. They should:
• produce a waste management strategy or plan setting out how their waste activities will:
º help move waste up the waste hierarchy
º provide local economic, social and environmental benefits from improved waste management
º make a meaningful contribution to meeting the Mayor’s targets
• offer the Mayor’s minimum level of household recycling service provision
• make best use of local waste sites identified in local waste plans
• support the phase out of fossil fuel waste transport and boost uptake of low or zero emission alternatives
• use Recycle for London messaging in local awareness raising activities
to ensure a consistent reduce, reuse, recycle message is delivered across London
• demonstrate how they will, or have put in place positive changes to improve recycling performance identified through Resource London’s borough support programme
• publicly notify its intention to tender a waste contract at the same time as notifying the Mayor. This would be a chance for waste authorities considering new services to consider joint procurement options. These can provide better value for money on ‘like for like’ services and achieve service harmonisation across borough boundaries
• procure waste and recycling services that maximise local economic, environmental and social benefits through demonstrating how they will deliver the Mayor’s Responsible Procurement Policy
• carry out any other relevant activity supporting the Mayor’s policies and targets
BOX 30: WASTE AUTHORIT Y E XPECTATIONS
2 6 1L O N D O N E N V I R O N M E N T S T R A T E G Y
Non-municipal waste The Mayor has no responsibility or powers in this strategy to directly control the management of industrial waste and construction, demolition and excavation waste where it is not in the possession or control of a waste authority. The Mayor, can however, use convening, leadership and advocacy to drive improvements. This non-municipal waste is predominantly managed by commercial waste contractors (CWCs). These waste streams are already highly regulated, increasingly managed onsite and in some cases require specialised management and disposal (for example asbestos and chemical waste). However, given their impact on other objectives for London’s environment, the Mayor considers it important to set out in this strategy the expectations for these waste streams. In addition, the London Plan details policies supporting effective management of these other waste streams as they are generally considered a waste planning issue.
LONDON’S ENVIRONMENT NOW
The key evidence to support the Mayor’s ambitions for London’s waste by 2050 is summarised below. You can find out more about the evidence behind the policies and proposals in Appendix 2.
Total amount of municipal waste produced in LondonLondon’s municipal waste stream is made up of a variety of materials. The main components of municipal waste in London are food and green garden waste (22 per cent) and common dry recyclables paper, card, plastics, glass and metals (60 per cent). The remaining 18 per cent is made up of smaller quantities of materials including textiles, waste electricals (WEEE) wood, furniture and household cleaning chemicals.
Around 7m tonnes of waste is produced each year from our homes, public buildings and businesses. Food waste and plastic packaging including single use coffee cups and plastic bottles combined account for around 30 per cent of this.
90 Taking national food waste data published by WRAP Estimate of food surplus and waste arisings in the UK, January 2017 and applying a London equivalent estimate based on London making up around 15 per cent of the UK population. 91 Mayor of London (2016), Capital of Food: Ten Years of London Leadership. Accessed from: www.london.gov.uk/sites/default/files/capital_of_food_report.pdf 92 Emission factors taken from Appendix 1 EPS report. Assumes 50 per cent food waste sent to landfill, 50 per cent sent to incineration.93 WRAP (2016), Plastics Market Situation Report. Accessed from: www.wrap.org.uk/sites/files/wrap/Plastics_Market_Situation_Report.pdf
London produces around 1.5 – 1.75m tonnes of food waste with a value of £2.55bn a year.90 This is likely to be a conservative figure given the extensive and diverse food sector employing more than half a million Londoners and turning over £20bn each year.91 Most of this food waste goes to landfill or incineration producing around 250,000 tonnes of CO2e emissions, although some of this is offset through capturing heat and producing electricity.92 Around a third of food bought is thrown away, most of which is still edible. WRAP (Waste and Resources Action Programme) estimates food waste costs households around £50 per month.
Use of single use packaging materials including coffee cups and plastic bottles is growing and putting increasing pressure on local waste management services. WRAP’s plastic market situation report 201693 estimated the UK produces around 2.2m tonnes of plastic packaging with only around half (or 900,000 tonnes) recycled. In the UK, around 825,000 tonnes of plastic bottles are produced a year. This leads to around 125,000 tonnes produced in London.
“ Around 7m tonnes of waste is produced each year from our homes, public buildings and businesses.”
2 6 1
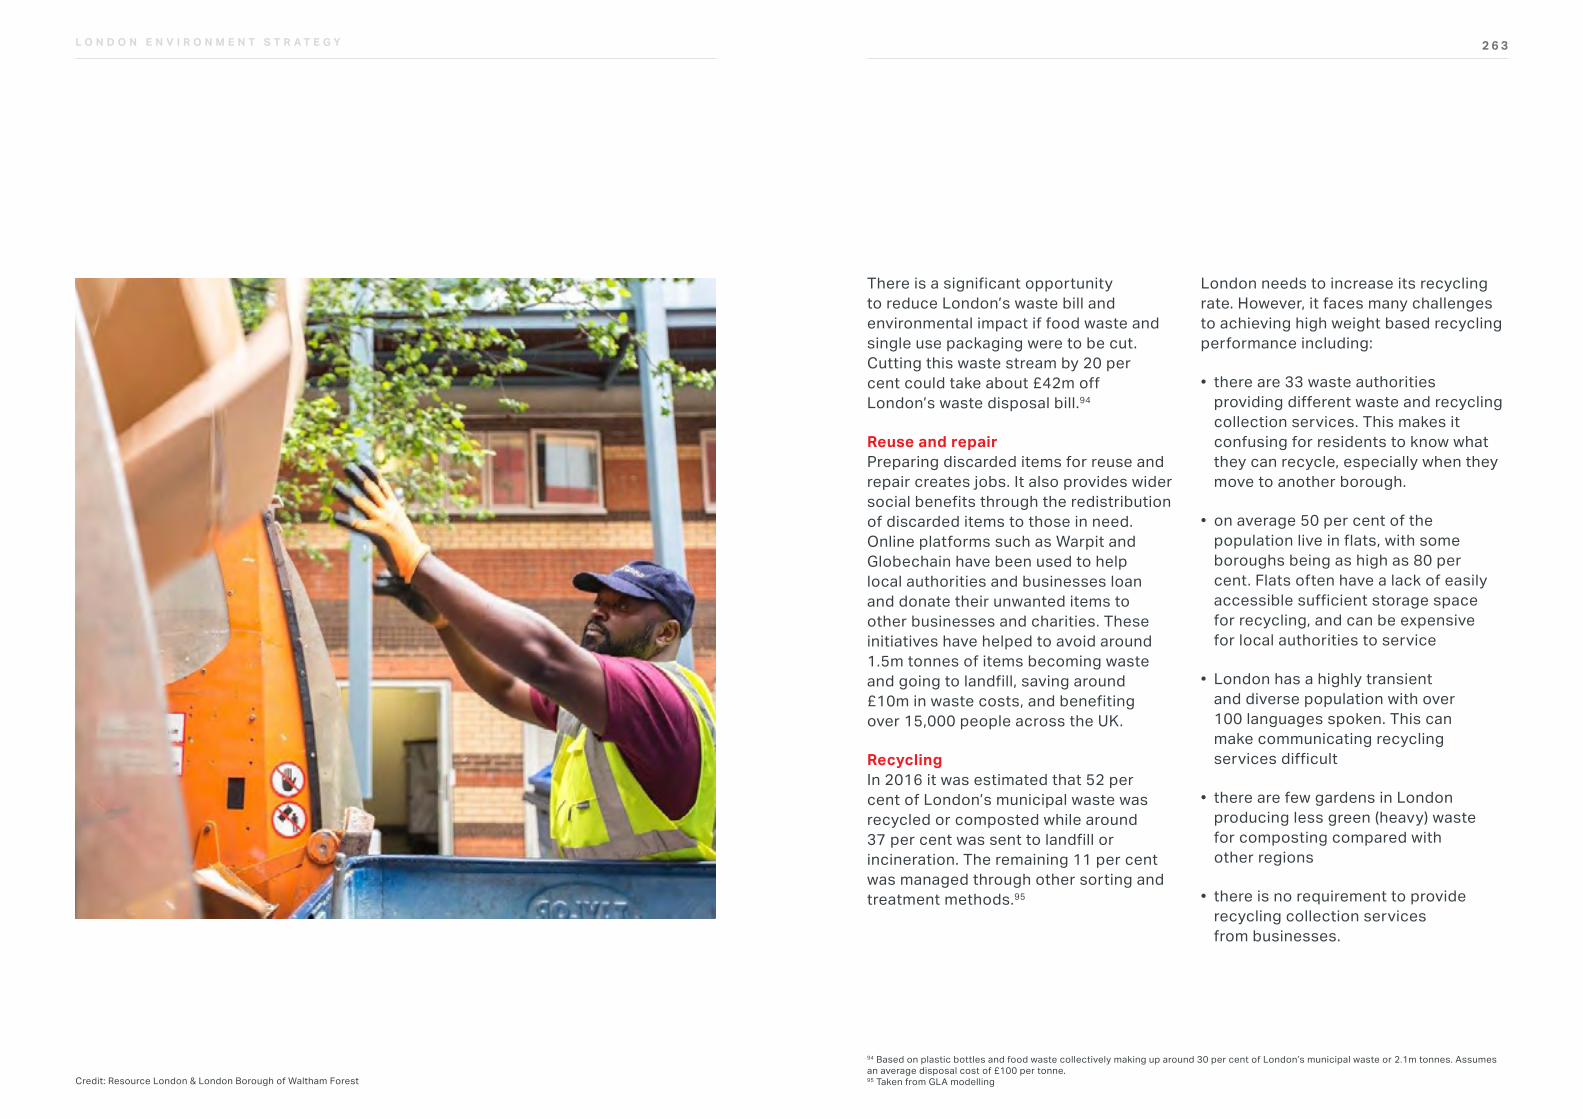
2 6 3L O N D O N E N V I R O N M E N T S T R A T E G Y
There is a significant opportunity to reduce London’s waste bill and environmental impact if food waste and single use packaging were to be cut. Cutting this waste stream by 20 per cent could take about £42m off London’s waste disposal bill.94
Reuse and repairPreparing discarded items for reuse and repair creates jobs. It also provides wider social benefits through the redistribution of discarded items to those in need. Online platforms such as Warpit and Globechain have been used to help local authorities and businesses loan and donate their unwanted items to other businesses and charities. These initiatives have helped to avoid around 1.5m tonnes of items becoming waste and going to landfill, saving around £10m in waste costs, and benefiting over 15,000 people across the UK.
RecyclingIn 2016 it was estimated that 52 per cent of London’s municipal waste was recycled or composted while around 37 per cent was sent to landfill or incineration. The remaining 11 per cent was managed through other sorting and treatment methods.95
London needs to increase its recycling rate. However, it faces many challenges to achieving high weight based recycling performance including:
• there are 33 waste authorities providing different waste and recycling collection services. This makes it confusing for residents to know what they can recycle, especially when they move to another borough.
• on average 50 per cent of the population live in flats, with some boroughs being as high as 80 per cent. Flats often have a lack of easily accessible sufficient storage space for recycling, and can be expensive for local authorities to service
• London has a highly transient and diverse population with over 100 languages spoken. This can make communicating recycling services difficult
• there are few gardens in London producing less green (heavy) waste for composting compared with other regions
• there is no requirement to provide recycling collection services from businesses.
94 Based on plastic bottles and food waste collectively making up around 30 per cent of London’s municipal waste or 2.1m tonnes. Assumes an average disposal cost of £100 per tonne. 95 Taken from GLA modellingCredit: Resource London & London Borough of Waltham Forest
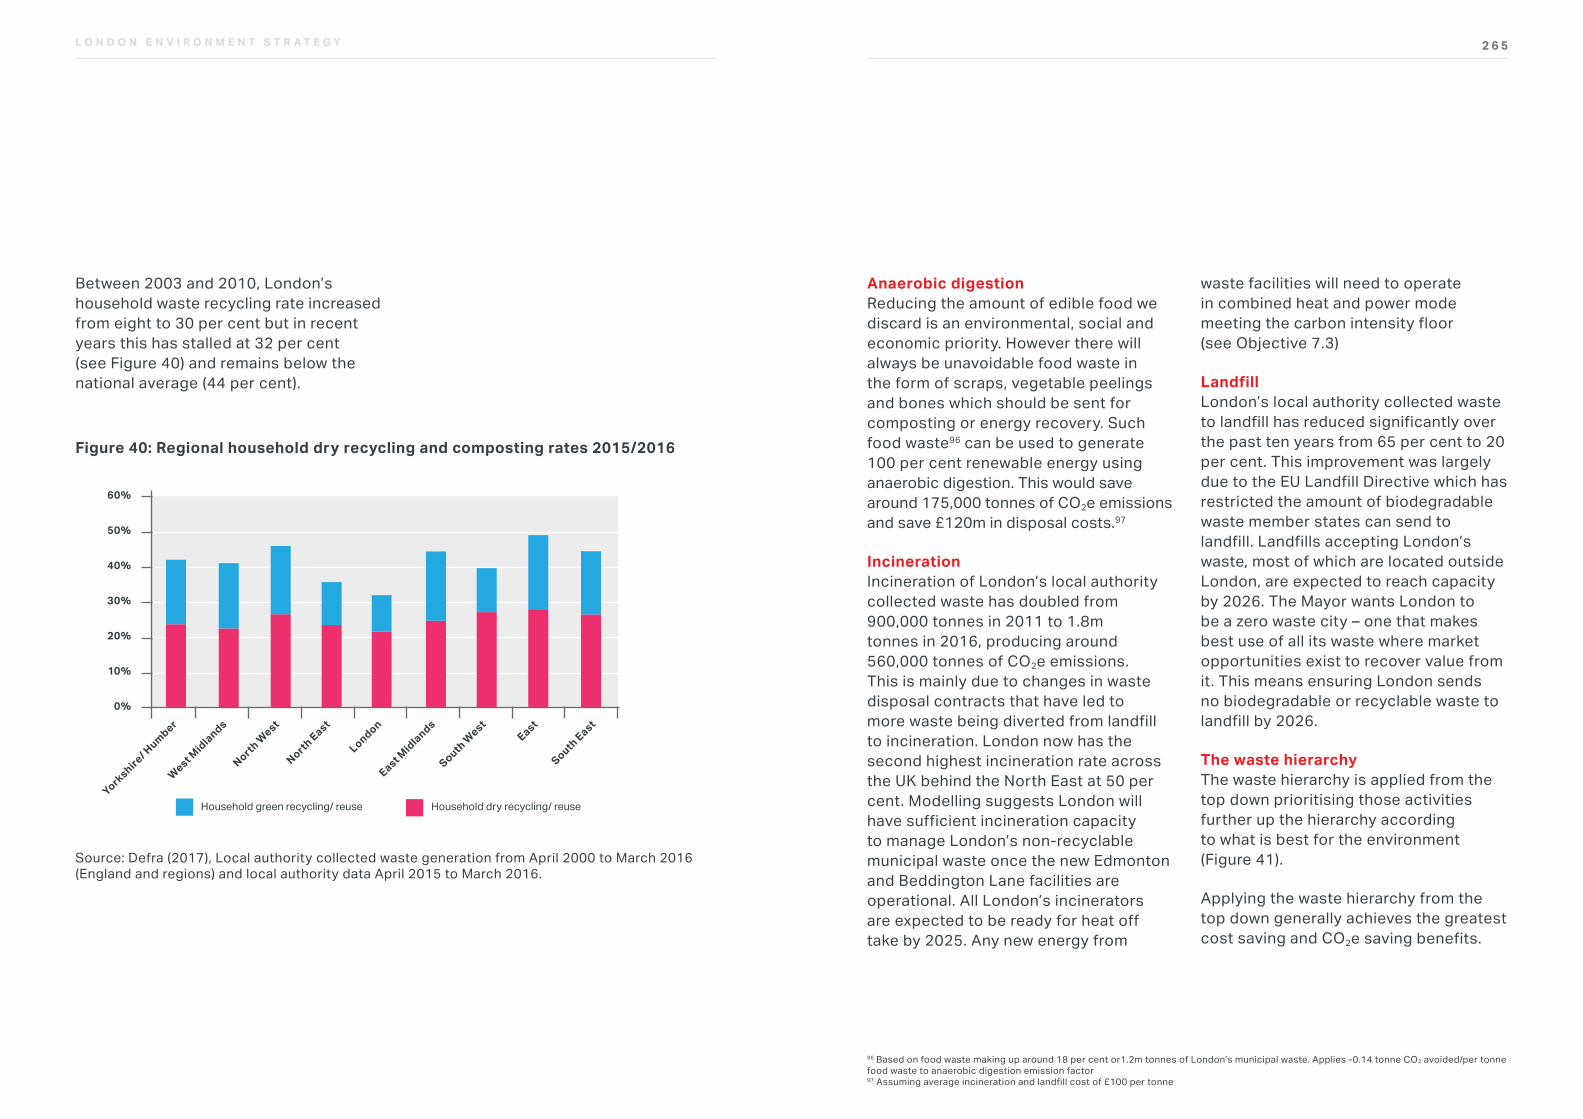
2 6 5L O N D O N E N V I R O N M E N T S T R A T E G Y
Between 2003 and 2010, London’s household waste recycling rate increased from eight to 30 per cent but in recent years this has stalled at 32 per cent (see Figure 40) and remains below the national average (44 per cent).
Figure 40: Regional household dry recycling and composting rates 2015/2016
TYPE OF GRAPH: WASTE
Reference
Available at: www.gov.uk/government/statistical-data-sets/env18-local-authority-collected-waste-annual-results-tables
Fig 9: Regional household dry recycling and composting rates 2015/16
Household dry recycling/ reuseHousehold green recycling/ reuse
0%
Yorkshire
/ Humber
West Midlands
North W
est
North East
London
East Midlands
South West
East
South East
10%
20%
30%
40%
50%
60%
Source: Defra (2017), Local authority collected waste generation from April 2000 to March 2016 (England and regions) and local authority data April 2015 to March 2016. Source: Defra (2017), Local authority collected waste generation from April 2000 to March 2016 (England and regions) and local authority data April 2015 to March 2016.
Anaerobic digestionReducing the amount of edible food we discard is an environmental, social and economic priority. However there will always be unavoidable food waste in the form of scraps, vegetable peelings and bones which should be sent for composting or energy recovery. Such food waste96 can be used to generate 100 per cent renewable energy using anaerobic digestion. This would save around 175,000 tonnes of CO2e emissions and save £120m in disposal costs.97
Incineration Incineration of London’s local authority collected waste has doubled from 900,000 tonnes in 2011 to 1.8m tonnes in 2016, producing around 560,000 tonnes of CO2e emissions. This is mainly due to changes in waste disposal contracts that have led to more waste being diverted from landfill to incineration. London now has the second highest incineration rate across the UK behind the North East at 50 per cent. Modelling suggests London will have sufficient incineration capacity to manage London’s non-recyclable municipal waste once the new Edmonton and Beddington Lane facilities are operational. All London’s incinerators are expected to be ready for heat off take by 2025. Any new energy from
waste facilities will need to operate in combined heat and power mode meeting the carbon intensity floor (see Objective 7.3)
LandfillLondon’s local authority collected waste to landfill has reduced significantly over the past ten years from 65 per cent to 20 per cent. This improvement was largely due to the EU Landfill Directive which has restricted the amount of biodegradable waste member states can send to landfill. Landfills accepting London’s waste, most of which are located outside London, are expected to reach capacity by 2026. The Mayor wants London to be a zero waste city – one that makes best use of all its waste where market opportunities exist to recover value from it. This means ensuring London sends no biodegradable or recyclable waste to landfill by 2026.
The waste hierarchyThe waste hierarchy is applied from the top down prioritising those activities further up the hierarchy according to what is best for the environment (Figure 41).
Applying the waste hierarchy from the top down generally achieves the greatest cost saving and CO2e saving benefits.
96 Based on food waste making up around 18 per cent or1.2m tonnes of London’s municipal waste. Applies -0.14 tonne CO2 avoided/per tonne food waste to anaerobic digestion emission factor97 Assuming average incineration and landfill cost of £100 per tonne
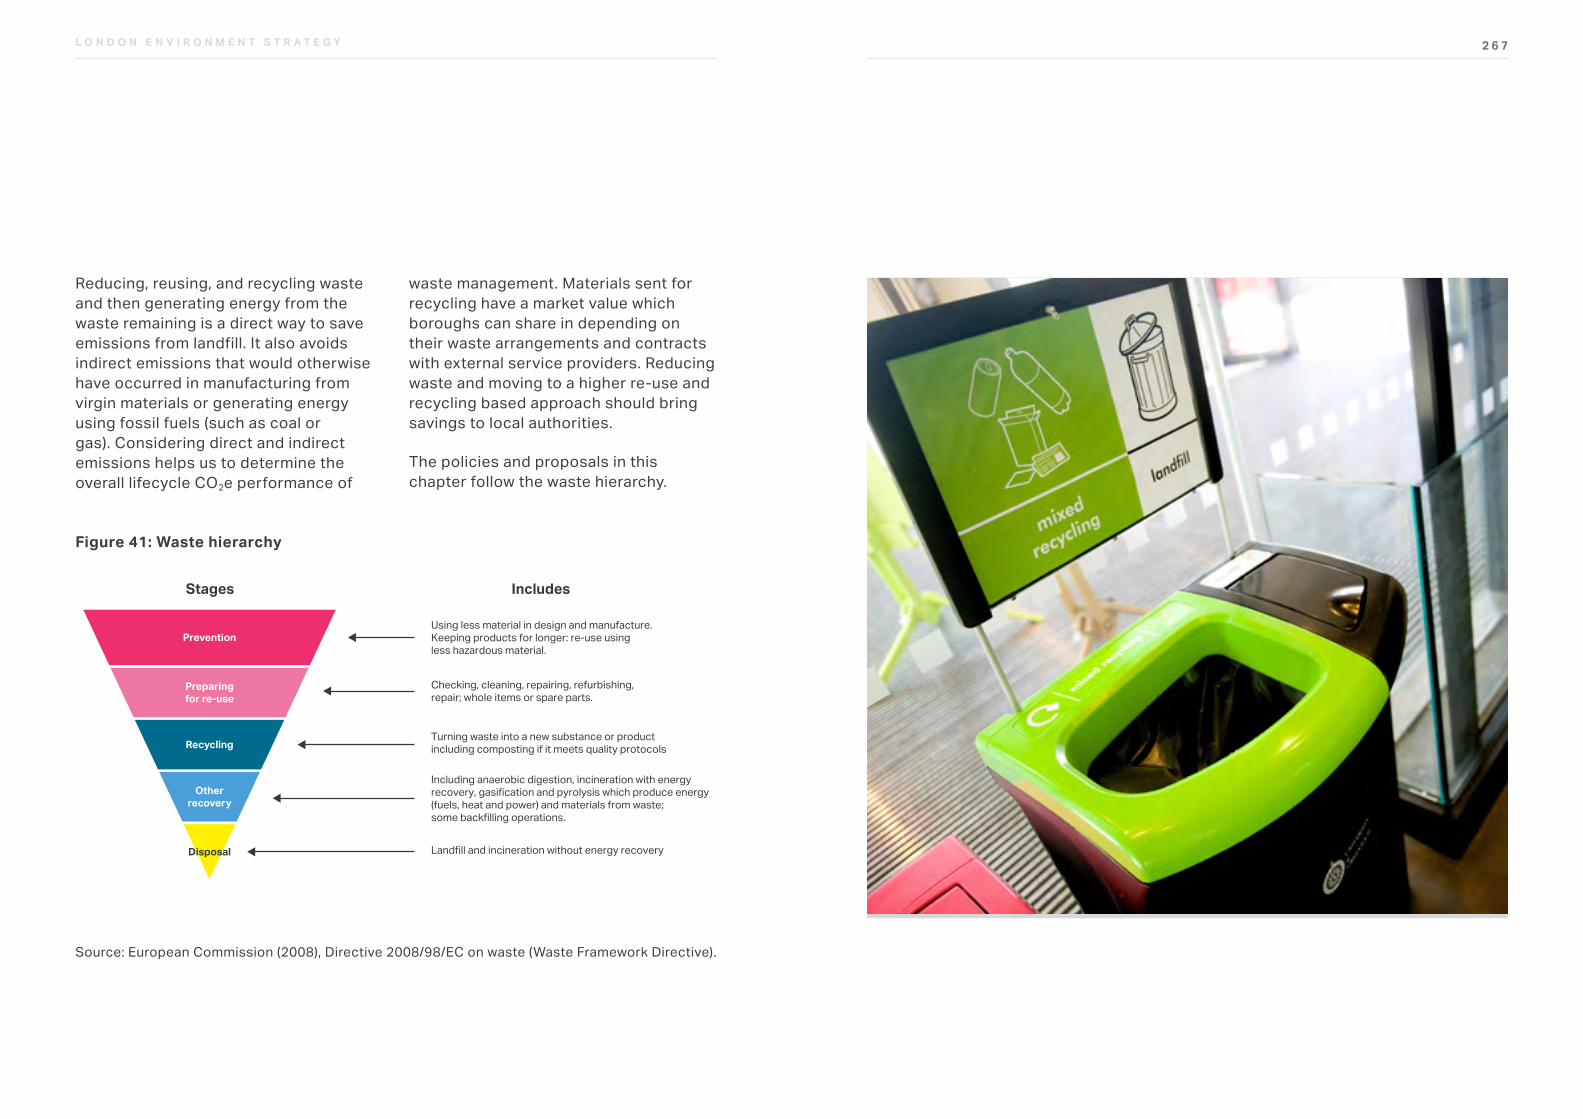
2 6 7L O N D O N E N V I R O N M E N T S T R A T E G Y
Reducing, reusing, and recycling waste and then generating energy from the waste remaining is a direct way to save emissions from landfill. It also avoids indirect emissions that would otherwise have occurred in manufacturing from virgin materials or generating energy using fossil fuels (such as coal or gas). Considering direct and indirect emissions helps us to determine the overall lifecycle CO2e performance of
waste management. Materials sent for recycling have a market value which boroughs can share in depending on their waste arrangements and contracts with external service providers. Reducing waste and moving to a higher re-use and recycling based approach should bring savings to local authorities.
The policies and proposals in this chapter follow the waste hierarchy.
Figure 41: Waste hierarchy
TYPE OF GRAPH: WASTE
Reference
Available at: ec.europa.eu/environment/waste/framework/
Fig 1: The waste hierarchy
Source: European Commission (2008), Directive 2008/98/EC on waste (Waste Framework Directive).
Stages Includes
Prevention
Preparingfor re-use
Recycling
Otherrecovery
Disposal
Using less material in design and manufacture.Keeping products for longer: re-use using less hazardous material.
Checking, cleaning, repairing, refurbishing, repair; whole items or spare parts.
Turning waste into a new substance or product including composting if it meets quality protocols
Landfill and incineration without energy recovery
Including anaerobic digestion, incineration with energyrecovery, gasification and pyrolysis which produce energy(fuels, heat and power) and materials from waste; some backfilling operations.
Source: European Commission (2008), Directive 2008/98/EC on waste (Waste Framework Directive).
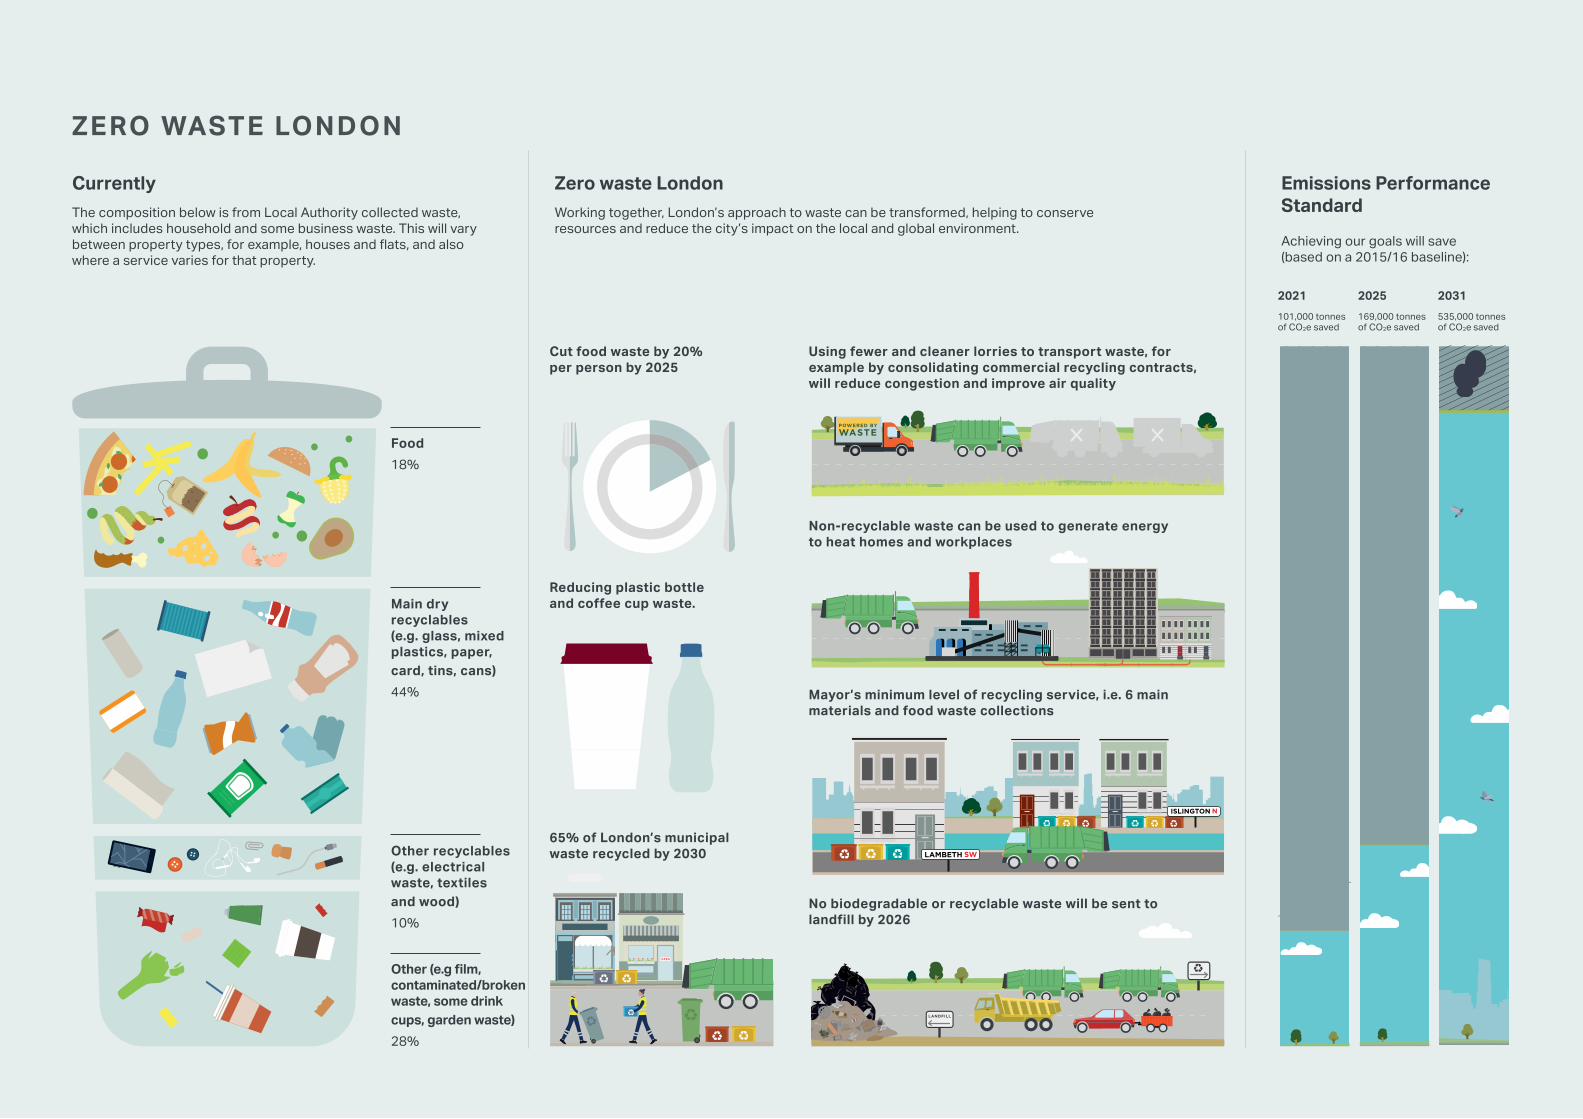
2 6 9L O N D O N E N V I R O N M E N T S T R A T E G Y
SWLAMBETH
NISLINGTON
LANDFILL
POWERED BY
WASTE
OPEN
ZERO WASTE LONDON
Currently Zero waste LondonThe composition below is from Local Authority collected waste, which includes household and some business waste. This will vary between property types, for example, houses and flats, and also where a service varies for that property.
Cut food waste by 20% per person by 2025
Reducing plastic bottle and coffee cup waste.
65% of London’s municipal waste recycled by 2030
Food18%
Main dry recyclables (e.g. glass, mixed plastics, paper, card, tins, cans)44%
Other recyclables (e.g. electrical waste, textiles and wood)10%
Other (e.g film, contaminated/broken waste, some drink cups, garden waste)28%
Emissions Performance StandardWorking together, London’s approach to waste can be transformed, helping to conserve
resources and reduce the city’s impact on the local and global environment.
Using fewer and cleaner lorries to transport waste, for example by consolidating commercial recycling contracts, will reduce congestion and improve air quality
2021101,000 tonnes of CO2e saved
2025169,000 tonnes of CO2e saved
2031535,000 tonnes of CO2e saved
Non-recyclable waste can be used to generate energy to heat homes and workplaces
Mayor’s minimum level of recycling service, i.e. 6 main materials and food waste collections
No biodegradable or recyclable waste will be sent to landfill by 2026
Achieving our goals will save (based on a 2015/16 baseline):
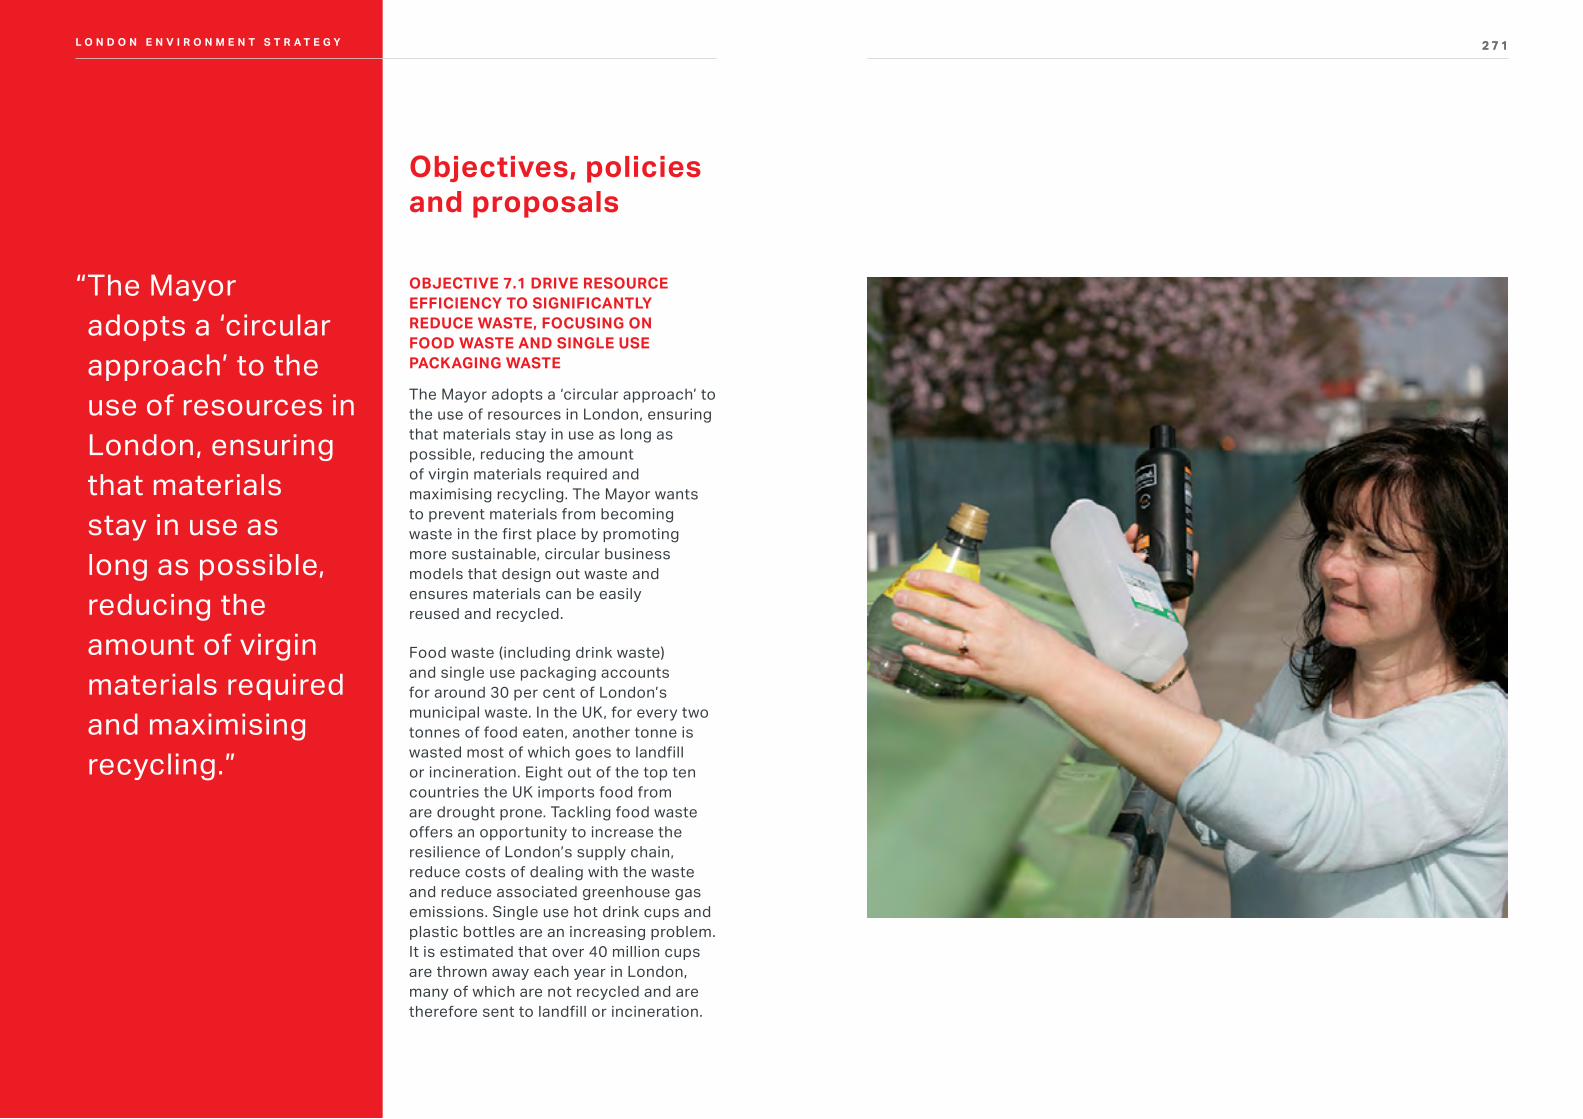
2 7 1L O N D O N E N V I R O N M E N T S T R A T E G Y
OBJECTIVE 7.1 DRIVE RESOURCE EFFICIENCY TO SIGNIFICANTLY REDUCE WASTE, FOCUSING ON FOOD WASTE AND SINGLE USE PACKAGING WASTE
The Mayor adopts a ‘circular approach’ to the use of resources in London, ensuring that materials stay in use as long as possible, reducing the amount of virgin materials required and maximising recycling. The Mayor wants to prevent materials from becoming waste in the first place by promoting more sustainable, circular business models that design out waste and ensures materials can be easily reused and recycled.
Food waste (including drink waste) and single use packaging accounts for around 30 per cent of London’s municipal waste. In the UK, for every two tonnes of food eaten, another tonne is wasted most of which goes to landfill or incineration. Eight out of the top ten countries the UK imports food from are drought prone. Tackling food waste offers an opportunity to increase the resilience of London’s supply chain, reduce costs of dealing with the waste and reduce associated greenhouse gas emissions. Single use hot drink cups and plastic bottles are an increasing problem. It is estimated that over 40 million cups are thrown away each year in London, many of which are not recycled and are therefore sent to landfill or incineration.
Objectives, policies and proposals
“ The Mayor adopts a ‘circular approach’ to the use of resources in London, ensuring that materials stay in use as long as possible, reducing the amount of virgin materials required and maximising recycling.”
2 7 1L O N D O N E N V I R O N M E N T S T R A T E G Y
2 7 3L O N D O N E N V I R O N M E N T S T R A T E G Y
Policy 7.1.1 The Mayor will work with Londoners, waste authorities, government and other stakeholders to significantly cut waste
Proposal 7.1.1a The Mayor will support campaigns and initiatives to prevent food going to waste
The Courtauld Commitment 2025 (C2025) is a key initiative for London and the UK to significantly cut food waste. This is an ambitious voluntary agreement that brings together organisations across the food system, from producer to consumer, to make food and drink production and consumption more sustainable. It sets a target of 20 per cent reduction in food and drink waste and the associated GHG emissions per person by 2025. The Mayor will be a key engagement partner to C2025 and working with WRAP and LWARB will strive to achieve these targets in London.
“ By 2025, food waste will have reduced by 20% per person.”
L O N D O N E N V I R O N M E N T S T R A T E G Y
Through working with LWARB and Resource London, waste authorities and other relevant parties, the Mayor will support campaigns including Recycle for London, Love Food Hate Waste, and Trifocal to help Londoners and businesses to reduce waste. The Mayor will apply lessons and best practice taken from previous programmes such as the GLA’s Foodsave programme. Foodsave worked with 170 business and charities, helping small businesses to save around £6,000 per year from reducing food waste and collectively preventing around 1200 tonnes of food waste going to landfill or incineration.
Proposal 7.1.1b The Mayor will support campaigns and initiatives to cut the use of single use packaging
Plastic packaging blights our streets, finds its way into oceans harming wildlife and takes centuries to break down whilst
releasing toxic chemicals. Single use plastic bottles form the most prevalent form of plastic packaging in our oceans and accelerated action is needed to phase out non-recyclable plastic packaging. Some large companies have already responded to this challenge pledging to ensure 100 per cent of its plastic packaging is fully reusable, recyclable or compostable by 2025. The Ellen MacArthur Foundation (EMF) have also unveiled a business backed action plan as part of its New Plastics Economy work to crack down on plastic waste and recycle 70 per cent of plastic packaging globally. The Mayor calls on food and drink businesses to offer incentives for their customers to use their own reusable drink cups and water bottles. The Mayor will also take the following actions to reduce the amount of plastic bottles and single use cups:

2 7 5L O N D O N E N V I R O N M E N T S T R A T E G Y
• investigating the feasibility of a deposit return scheme for water bottles through the government’s litter strategy working group
• working with stakeholders including environment groups, Transport for London and LWARB to improve access to tap water through community water refill schemes building on existing schemes
• working with the GLA group to reduce plastic bottle sales and improve access to tap water on all our premises
• working with the supply chain from manufacturers to retailers and waste authorities to trial and roll out coffee cup recycling bins across London.
Proposal 7.1.1c The Mayor, will support campaigns, initiatives and business models to reuse materials
The Mayor will work with LWARB, Ellen MacArthur Foundation and other partners to develop a circular business programme to increase reuse of materials. This will support entrepreneurs and businesses to adopt, scale up and
2 7 4 2 7 5L O N D O N E N V I R O N M E N T S T R A T E G Y
benefit from circular economy business models in five mains areas: products as a service, sharing economy, prolonging product life, renewable inputs and recovering value at end of life.
The Mayor, through LWARB, will invest funds into developing businesses that embrace the circular approach to resource use especially businesses with reuse, repair and remanufacturing projects and those using low carbon technologies. LWARB will also invest in
a circular economy growth capital fund and accelerator to provide support for those companies who will be growing the circular economy in London and delivering the co-benefits of greenhouse gas emission reductions and increased resilience for the city.
The Mayor will work with organisations including the Restart Project, Globechain and Warpit to boost materials repair and help divert unwanted items to useful purposes.
Credit: The Restart Project, https://creativecommons.org/licenses/by-nc-sa/2.0/
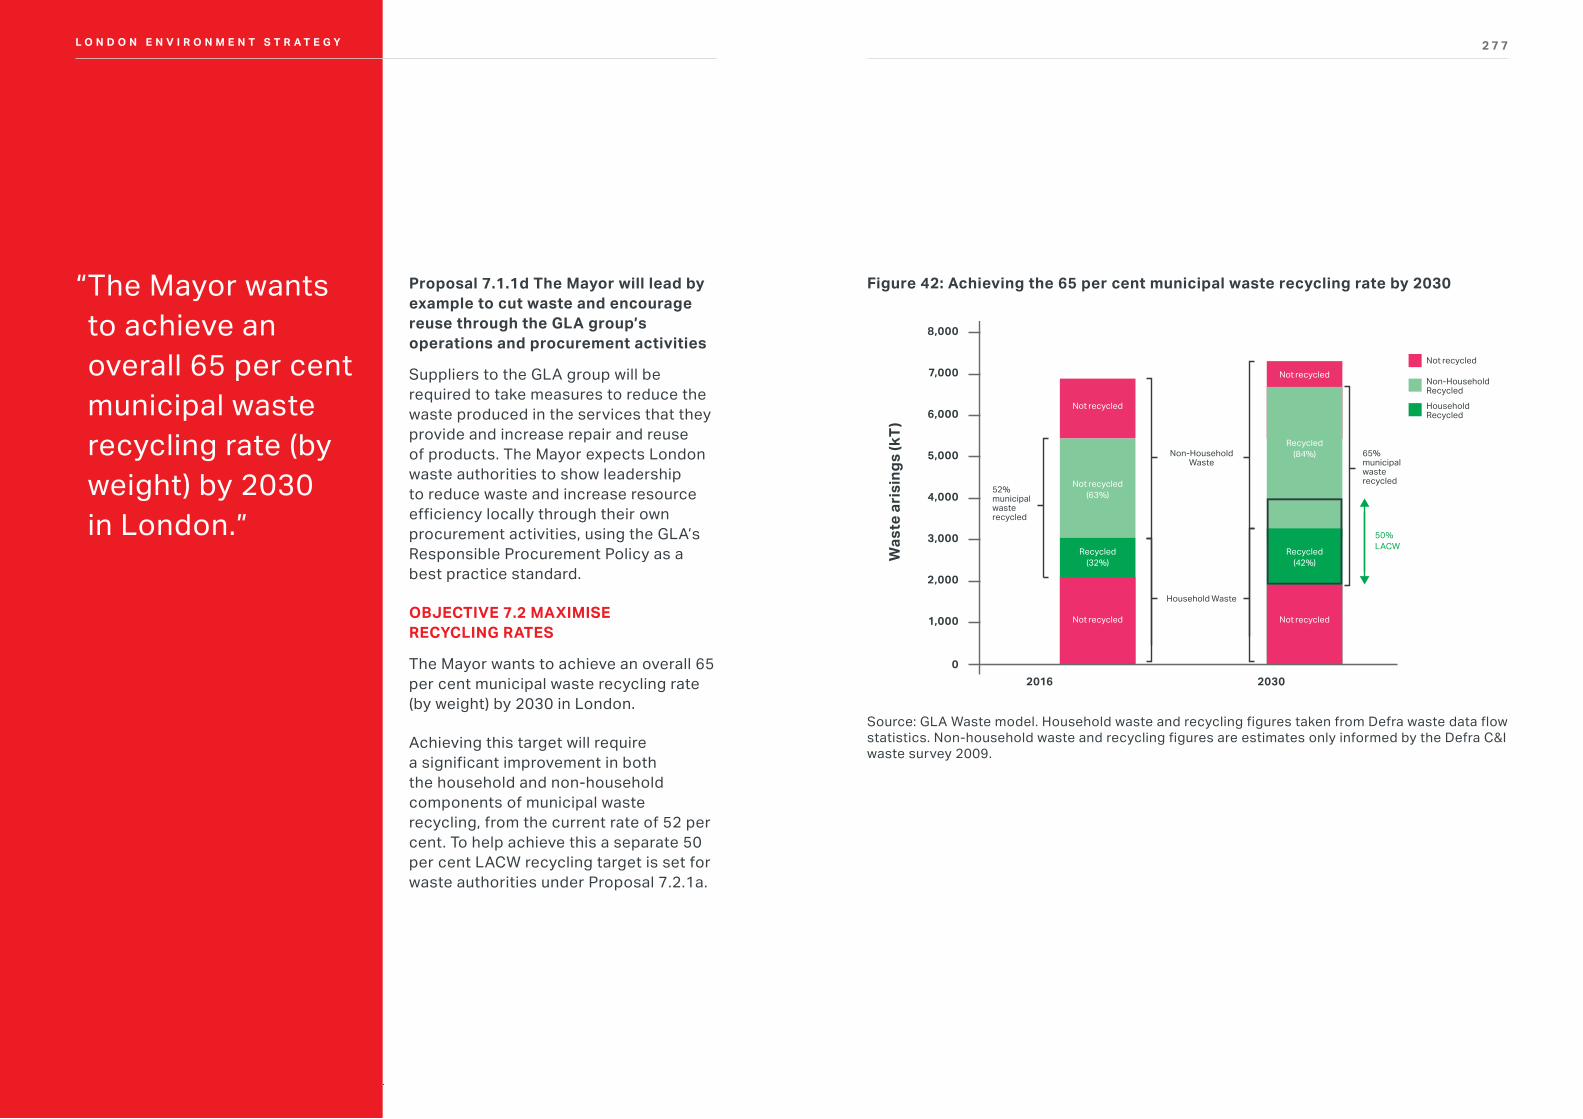
2 7 7L O N D O N E N V I R O N M E N T S T R A T E G Y
Proposal 7.1.1d The Mayor will lead by example to cut waste and encourage reuse through the GLA group’s operations and procurement activities
Suppliers to the GLA group will be required to take measures to reduce the waste produced in the services that they provide and increase repair and reuse of products. The Mayor expects London waste authorities to show leadership to reduce waste and increase resource efficiency locally through their own procurement activities, using the GLA’s Responsible Procurement Policy as a best practice standard.
OBJECTIVE 7.2 MAXIMISE RECYCLING RATES
The Mayor wants to achieve an overall 65 per cent municipal waste recycling rate (by weight) by 2030 in London.
Achieving this target will require a significant improvement in both the household and non-household components of municipal waste recycling, from the current rate of 52 per cent. To help achieve this a separate 50 per cent LACW recycling target is set for waste authorities under Proposal 7.2.1a.
Figure 42: Achieving the 65 per cent municipal waste recycling rate by 2030
TYPE OF GRAPH: AIR QUALITY
Reference
Fig 41:
Was
te a
risi
ngs
(kT)
7,000
8,000
6,000
5,000
4,000
3,000
2,000
1,000
02016 2030
Non-HouseholdWaste
Not recycled
Non-HouseholdRecycled
HouseholdRecycled
65%municipal waste recycled
50%LACW
52% municipal waste recycled
Household Waste
Not recycled
Not recycled
Not recycledNot recycled
Not recycled(63%)
Recycled(32%)
Recycled(42%)
Recycled(84%)
Source: GLA Waste model. Household waste and recycling figures taken from Defra waste data flow statistics. Non-household waste and recycling figures are estimates only informed by the Defra C&I waste survey 2009.
98 In line with market, reprocessors and recycling industry standards.
“ The Mayor wants to achieve an overall 65 per cent municipal waste recycling rate (by weight) by 2030 in London.”
L O N D O N E N V I R O N M E N T S T R A T E G Y
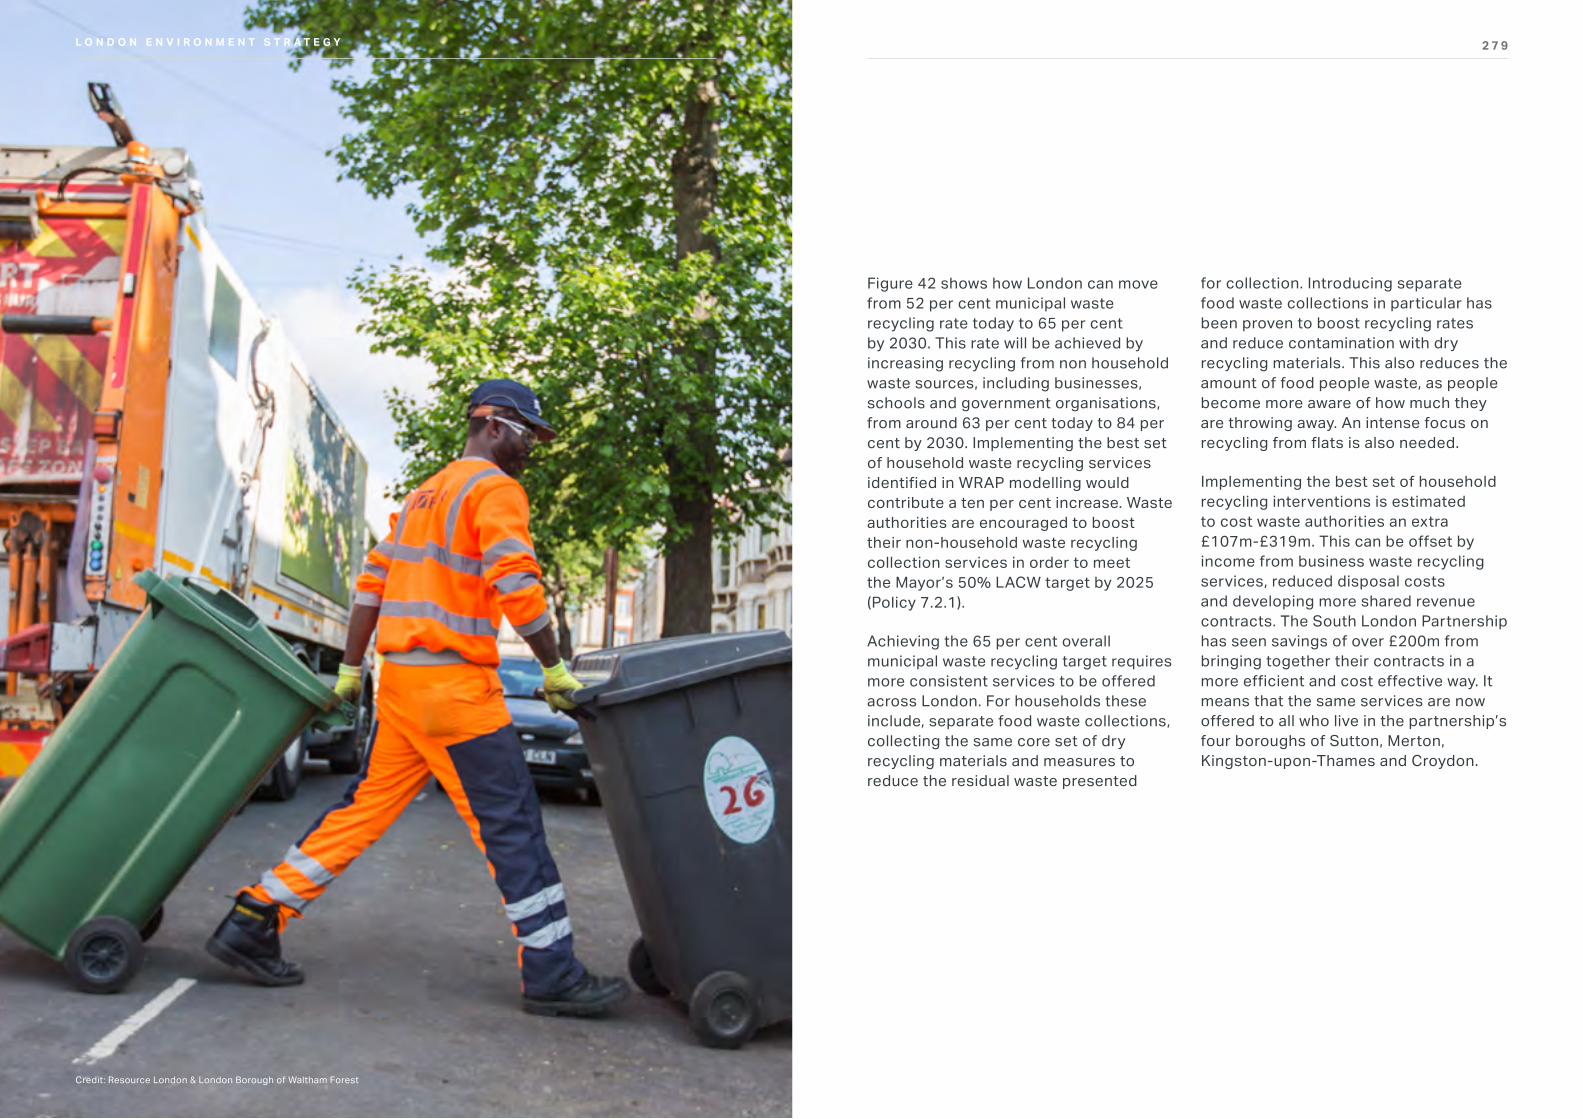
2 7 9L O N D O N E N V I R O N M E N T S T R A T E G YL O N D O N E N V I R O N M E N T S T R A T E G Y
Figure 42 shows how London can move from 52 per cent municipal waste recycling rate today to 65 per cent by 2030. This rate will be achieved by increasing recycling from non household waste sources, including businesses, schools and government organisations, from around 63 per cent today to 84 per cent by 2030. Implementing the best set of household waste recycling services identified in WRAP modelling would contribute a ten per cent increase. Waste authorities are encouraged to boost their non-household waste recycling collection services in order to meet the Mayor’s 50% LACW target by 2025 (Policy 7.2.1).
Achieving the 65 per cent overall municipal waste recycling target requires more consistent services to be offered across London. For households these include, separate food waste collections, collecting the same core set of dry recycling materials and measures to reduce the residual waste presented
for collection. Introducing separate food waste collections in particular has been proven to boost recycling rates and reduce contamination with dry recycling materials. This also reduces the amount of food people waste, as people become more aware of how much they are throwing away. An intense focus on recycling from flats is also needed.
Implementing the best set of household recycling interventions is estimated to cost waste authorities an extra £107m-£319m. This can be offset by income from business waste recycling services, reduced disposal costs and developing more shared revenue contracts. The South London Partnership has seen savings of over £200m from bringing together their contracts in a more efficient and cost effective way. It means that the same services are now offered to all who live in the partnership’s four boroughs of Sutton, Merton, Kingston-upon-Thames and Croydon.
Credit: Resource London & London Borough of Waltham Forest
2 8 1L O N D O N E N V I R O N M E N T S T R A T E G Y
Policy 7.2.1 Increase recycling rates for local authority collected waste
Proposal 7.2.1a The Mayor will set targets for local authority collected waste, a minimum level of service for household waste recycling collections and hold a contract register of waste authority waste contracts
The Mayor wants waste authorities to collectively achieve a 50 per cent LACW recycling target by 2025 and aspire to achieve 60 per cent by 2030.
To help them achieve these targets waste authorities should deliver the following minimum level of service for household recycling:
• all properties with kerbside recycling collections to receive a separate weekly food waste collection
• all kerbside serviced properties to receive a collection of, at a minimum, the six main dry recycling materials (glass, cans, paper, card, plastic bottles and mixed plastics (tubs, pots and trays)98
Waste authorities will need to demonstrate how they will meet the above minimum level of service by 2020
“ The Mayor wants waste authorities to collectively achieve a 50 per cent LACW recycling target by 2025.”
L O N D O N E N V I R O N M E N T S T R A T E G Y
(at the latest) and also look to provide this to flats where feasible. They should also collect other items for recycling from households such as small electrical waste, foil and tetra packs where it makes sense to do so.
Some waste authorities have experienced cost savings and recycling improvements from reduced collection of residual waste, through reducing bin sizes or changing the frequency of collections The Mayor encourages waste authorities to consider such interventions.
Modelling carried out by WRAP shows that it is feasible to achieve an increase in household waste recycling from 32 per cent today to 42-43 per cent by 2022. The remaining gap to achieve 50 per cent LACW recycling target can be met by waste authorities developing or boosting their business and other non-household waste collection services.
Modelling and research in the evidence base (see Appendix 2) shows where the opportunities are to improve waste authority collection recycling performance. It includes what can be realistically achieved at a borough level and addresses the issue of London’s low performing recycling rate and fragmented collection services.
Achieving the 50 per cent target will inevitably mean some waste authorities achieving higher recycling rates than others recognising that there are local circumstances and challenges, particularly in those boroughs with a high proportion of flats.
The Mayor will hold a contract register to monitor when waste authority contracts come up for renewal. Waste authorities in developing their waste contracts will need to share relevant contract information and notify their intention to procure in the register. The register will be available for all waste authorities to view and therefore provide joint working opportunities. The Mayor will seek views on which contracts are most appropriate for advertising in the register.
Through the contract register and working with LWARB and waste authorities, the Mayor will identify opportunities to promote greater consistency to help harmonise waste and recycling services in London to achieve the best economy of scale and service provision benefits.
Support will continue to be available, through LWARB’s Resource London programme, for waste authorities to model the impact on their recycling rates and identify the mechanisms to achieve a minimum level of service, in a cost effective and accelerated way.
98 In line with market, reprocessors and recycling industry standards
2 8 3L O N D O N E N V I R O N M E N T S T R A T E G Y
Proposal 7.2.1b The Mayor will support efforts to increase recycling rates in flats
The Mayor will encourage Resource London to provide more support and funding to those waste authorities who are working towards achieving higher recycling performance in flats. Through LWARB the Mayor will seek additional funding to tackle recycling performance in flats.
Proposal 7.2.1c The Mayor, through LWARB’s London Business Waste Recycling (LBWR) service, will support waste authorities to boost commercial reuse and recycling performance.
To meet the Mayor’s 50 per cent LACW recycling target, waste authorities should identify opportunities to improve their own commercial waste recycling services. Boroughs are expected to offer businesses the same household minimum level of service where feasible. Support is currently available through LWARB’s London Business Waste and Recycling (LBWR) service to boost commercial recycling services.
London Business Waste and Recycling is a new start up company owned by LWARB which provides commercial waste marketing and customer facing services on behalf of London boroughs
to business. LBWR has been capitalised through a loan from LWARB and all its profits are passed on to the participating London boroughs. LBWR is currently operating in one borough and a further three boroughs are in the process of agreeing partnership arrangements with it. A number of other boroughs have expressed interest in exploring opportunities to work with the business and these will be pursued in the coming year.
Policy 7.2.2 Increase recycling rates for commercially collected waste and reduce litter and fly tipping
The Mayor will work with LWARB, the waste sector generally and other stakeholders to improve recycling services to businesses provided by commercial waste contractors. This will be necessary to achieve the Mayor’s overall 65 per cent municipal waste recycling target by 2030 and will also provide local air quality and street scene benefits by reducing the number of waste vehicles on the road.
Proposal 7.2.2a The Mayor will support efforts to consolidate commercially collected waste services to improve recycling performance, reduce congestion, improve the public realm and improve air quality
There have been recent pilot studies in London in Bond Street BID and New York on consolidating waste services. These look at introducing a single waste contractor to run collections to businesses in a designated area. The pilots were successful in helping to reduce the number of collection vehicles and improve local air quality. Bond Street saw a 94 per cent drop in waste vehicle movements. As a result, TfL has developed a free toolkit helping neighbouring businesses to consolidate their waste collection services to save money and reduce vehicle movements. New York City are now taking this one step further and looking into establishing a commercial waste zone system across the city, where waste collection companies bid to be part of a geographical framework to provide waste and recycling services to business in the city. They want to find out if there is enough inefficiency in how waste is collected and whether collection zones can reduce these by creating benefits like better recycling rates, working conditions and wages.
The Mayor will work with TfL and Business Improvement Districts (BIDs) to promote the waste contract consolidation toolkit and look at the feasibility of a commercial waste framework in London. He will also work
with Defra and waste companies to improve commercial waste data ensuring all waste operators in London are using Electronic Duty of Care to record what happens to the waste they produce and handle. This improved data will allow opportunities for consolidated services to be identified more easily.
Proposal 7.2.2b The Mayor will support waste authorities to reduce littering and fly tipping by working with government on the implementation of its Litter Strategy for England
Local authorities are responsible for litter and enforcing and prosecuting small scale illegal dumping of waste (fly tipping). The Environment Agency is responsible for prosecuting large scale offences. Fly tipping in London is a big problem due to the cost of clearance and its negative effect on the streetscape.
The Mayor will work with government and the Chartered Institute of Waste Management (CIWM) to promote duty of care to waste authorities and businesses. The Mayor will use CIWM Right Waste, Right Place campaign to build on any knowledge gaps and help reduce fly tipping and litter in London and will also seek a seat on the government’s Litter Strategy Working Group to ensure London’s needs are taken into account.
2 8 5L O N D O N E N V I R O N M E N T S T R A T E G Y
OBJECTIVE 7.3 REDUCE THE ENVIRONMENTAL IMPACT OF WASTE ACTIVITIES
Reducing the environmental impact of how London manages its waste is important if London is to become a zero carbon city with a zero emission transport network by 2050. The Mayor wants to make sure that waste authorities are contributing all they possibly can to these ambitions through decarbonising and cleaning up their fleets.
There is also an opportunity to reduce greenhouse gas (GHG) emissions from waste management activities. In 2010 the GLA developed a pioneering emissions performance standard (EPS) to assess the GHG emissions associated with the collection, treatment, energy generation, and final disposal of London’s local authority collected waste.
While the Mayor has a weight based target of 65 per cent of municipal waste being recycled overall by 2030, he is also retaining a carbon based EPS approach that will sit alongside this target. Sending waste to landfill or incineration generates GHG emissions whereas recycling materials avoids GHG emissions that would have otherwise occurred in the manufacturing of virgin materials. A carbon based approach promotes recycling particularly of high carbon and high value materials such as plastic, metals and textiles.
“ Reducing the environmental impact of how London manages its waste is important if London is to become a zero carbon city with a zero emission transport network by 2050.”
L O N D O N E N V I R O N M E N T S T R A T E G Y
Policy 7.3.1 Reduce emissions from transport of waste
Proposal 7.3.1a Waste authorities must demonstrate how they will transition their waste fleets to low or zero emission options, prioritising the phasing out of diesel
Waste authority waste fleets are expected to comply with the Ultra Low Emission Zone (ULEZ) vehicle exhaust emission standards and to work towards the Mayor’s overall ambition that:
• all new cars and vans (less than 3.5 tonnes) being zero emission capable from 2025
• all heavy vehicles (greater than 3.5 tonnes) being fossil fuel-free from 2030
• zero emission fleets by 2050
Fossil-fuel free can include the use of 100 per cent renewable fuels derived from sources such as food waste and waste oils.
Working with waste authorities, TfL, and the waste industry the Mayor will increase the use of renewable fuels from waste derived sources including biodiesel, hydro-treated vegetable oil and bio-methane, as a transition fuel, in municipal waste fleets.
Waste authorities in procuring their waste fleets and waste transport services should demonstrate how they will promote the use of sustainable transport modes, renewable fuels and other low emission options in their relevant tender specification documents.
Proposal 7.3.1b The Mayor will work with stakeholders to encourage a reduction in municipal waste transported by road and will increase its transportation by rail and river
The Mayor will work with waste authorities, TfL, National Rail, the Port of London and other relevant stakeholders to increase the transportation of municipal waste by rail and river. This will not only reduce congestion on the roads but will also deliver air quality and carbon emission benefits.
Policy 7.3.2 Reduce the climate change impact of waste activities
Proposal 7.3.2a Waste authorities in delivering their waste management functions are expected to demonstrate how they can meet the GHG Emissions Performance Standard (EPS)
The Mayor will set a revised EPS for London’s LACW for waste authorities to work towards achieving. Waste authorities should aim to achieve both

2 8 7L O N D O N E N V I R O N M E N T S T R A T E G Y
the Mayor’s LACW recycling targets and EPS targets although the Mayor’s LACW targets will take priority. Achieving high recycling rates generally offers the greatest opportunity for reducing CO2 e emissions and meeting the EPS. The Mayor will develop guidance on achieving the weight based recycling targets and meeting the EPS. The Mayor has developed an online ready reckoner tool to support boroughs model their waste options against the EPS. This can be found at www.london.gov.uk/what-we-do/environment/waste-and-recycling/waste-policy. Meeting the EPS is best achieved by:
• reducing waste and increasing reuse
• maximising recycling rates, targeting materials with high embodied carbon (plastics, metals, and textiles)
• generating low carbon energy from organic waste (eg anaerobic digestion of food waste)
• using waste derived fuels (as a transition fuel) and other low CO2 transport options
• making sure only truly residual waste is going for energy generation
• avoiding landfill
In performing their waste functions the Mayor expects waste authorities to set out how their waste activities achieve the following EPS targets:
• 0.069 tonnes CO2e per tonne of waste managed by 2020/21
• 0.084 tonnes CO2e per tonne of waste managed by 2024/25
• 0.167 tonnes CO2e per tonne of waste managed by 2030/31
The Mayor will monitor and report annually on London’s performance against the EPS and work with the Environment Agency to ensure that there are no adverse impacts on the environment including air quality.
Proposal 7.3.2b Waste authorities must demonstrate how solutions generating energy from waste meet the carbon intensity floor (CIF), or put in place demonstrable steps to meet it in the short-term
In addition to developing the EPS, a minimum carbon emissions performance standard was set. Known as the ‘carbon intensity floor’ or CIF, this was developed to help decarbonise London’s energy supply by encouraging clean, efficient
2 8 7
Credit: WRAP
2 8 9L O N D O N E N V I R O N M E N T S T R A T E G Y
and local energy generation from London’s non-recycled waste. Waste going to energy from waste plants often contains large amounts of recyclable materials that are high carbon and high value. Reducing the amount of high carbon materials particularly plastics and metals going to energy from waste plants will deliver greenhouse gas savings, and reduce the reliance on fossil fuels. This will drive change and investment within boroughs and with facility operators to ensure that truely residual waste is used to generate both heat and power for the benefit of Londoners.
The Mayor will retain, for waste authorities, a target CIF level of 400 grams of CO2 per kWh of electricity produced from LACW until at least 2025.
Meeting this CIF target effectively rules out the use of traditional mass burn incineration techniques generating electricity only. It supports the take up of highly efficient technologies generating both heat and power. Achieving the CIF target can be done by:
• reaching high recycling rates including plastics, metals and textiles. This reduces the ‘carbon intensity’ of residual waste going to energy generation
• pre-treatment to remove recyclable materials from the residual waste stream
• generating energy from 100 per cent organic waste (e.g. anaerobic digestion of food waste). This is deemed to be carbon neutral
• using energy generation facilities generating both heat and power
• using waste derived fuels and other low CO2 transport options
Steps to demonstrate compliance with the CIF should include but are not be limited to:
• ongoing reductions in the amount of high fossil carbon materials sent for incineration or gasification that could be recycled
• activities resulting in investment in technology or infrastructure improving the overall efficiency of the facility to meet the CIF
• waste authorities and relevant facility operators actively supporting rollout of existing energy master plans to help connect heat infrastructure to local developments
The CIF will be reviewed by 2025, or earlier where appropriate, once London’s heat networks and demand are better understood, with a view to tightening it to around 300 grams per kWh of electricity produced.
The Mayor, through his Decentralised Energy Enabling Programme will work with London’s incinerator operators and waste authorities to identify solutions that can meet the CIF as they develop their waste contracts and strategies. This may include linking thermal treatment options proposed in their contracts with proposals in local energy master plans that support combined heat and power (CHP) opportunities. Opportunities include connecting to existing homes and to new developments delivered though GLA Housing Zones, Opportunity Areas and other major development schemes.
OBJECTIVE 7.4 MAXIMISE LOCAL WASTE SITES AND ENSURE LONDON HAS SUFFICIENT INFRASTRUCTURE TO MANAGE ALL THE WASTE IT PRODUCES
The Mayor wants to retain the economic value of London’s waste within London and ensure that London can manage 100 per cent of its waste within the city by 2026.
In 2015 London managed around half the waste it produced within London. Most exported waste goes to landfill mainly in the South East, and, along with it goes the economic value of recovered materials for reuse, recycling or energy generation. Although waste to landfill has declined by 70 per cent since 2005, London still landfills around 1 million tonnes of waste each year costing
“ The Mayor wants to retain the economic value of London’s waste within London and ensure that London can manage 100 per cent of its waste within the city by 2026.”
2 8 9
2 9 1L O N D O N E N V I R O N M E N T S T R A T E G Y
around £100 million.99 Landfills accepting London’s waste are expected to close by 2026 and no new capacity planned. To deal with this London needs to firstly reduce waste produced and secondly ensure it has access to sufficient capacity to recover value from more of its waste and remove any reliance on landfill.
The Mayor, through the new London Plan, will set policies for the identification and safeguarding of waste sites in London to enable 100 per cent of London’s municipal waste to be managed within London by 2026.
Policy 7.4.1 Supporting the use of local waste sites and promoting a circular approach to waste management
Proposal 7.4.1a Waste authorities in developing their waste contracts and services will need to identify how to maximise the use of local waste facilities and identified sites for waste
The Mayor expects waste authorities to consider the use of local waste sites where they deliver clear local benefits helping to keep the value of London’s waste in London.
The GLA has developed a GIS map of London’s waste facilities https://maps.london.gov.uk/webmaps/waste/. The London waste map, updated on an annual basis, is publicly available to help London waste authorities, its two Mayoral Development Corporations and waste facility operators to identity and access local waste facilities and find suitable sites for new facilities.
Proposal 7.4.1b The Mayor will support the development of new waste infrastructure supporting circular economy outcomes reuse, repair and remanufacture
Through LWARB the Mayor will encourage investment into new waste facilities where they are needed. The Mayor wants to see London’s waste sites optimised to support circular economy activities like reuse and repair providing environmental and social benefits by creating new jobs and apprenticeships. This will be supported by LWARB’s Advance London work programme which will enable and provide support and funding to businesses that use circular economy business models.
QCONSULTATION QUESTIONS: WASTE
1. Do you agree that the Mayor’s policies and proposals will effectively help Londoners and businesses to recycle more?
2. Do you support the Mayor’s ambition to ensure food waste and the six main recyclable materials (glass, cans, paper, card, plastic bottles and mixed plastics) are collected consistently across London?
3. Do you think the Mayor should set borough specific household waste recycling targets?
4. What needs to happen to tackle poor recycling performance in flats?
5. What are the most effective measures to reduce single-use packaging in London such as water bottles and coffee cups?
6. Please provide any further comments on the policies and programmes mentioned in this chapter.
london.gov.uk/environment-strategy
99 Based on landfill costs of £102 per tonne including landfill tax of £84.40 per tonne. Source WRAP gatefees report 2016
2 9 3L O N D O N E N V I R O N M E N T S T R A T E G Y
Chapter 8: Adapting to climate change
2 9 3
2 9 5L O N D O N E N V I R O N M E N T S T R A T E G Y
INTRODUCTION
As a growing city, London faces increasing pressure on housing, infrastructure, services, environment, and Londoners’ wellbeing and prosperity. Climate change will increase these existing pressures. It will make flooding more frequent and severe, threaten water resources, and increase the risk of overheating for buildings and infrastructure.
Global average temperatures have risen by over 1°C since 1850. If the world continues emitting greenhouse gases (GHGs) at today’s levels, then average global temperatures could rise by up to five degrees Celsius by the end of this century and average temperatures in London are already getting higher. The total amount of rainfall over a typical year is likely to remain broadly similar to current levels. However, there are likely to be seasonal changes, with summers generally becoming drier and winters wetter (though there will be more variability in weather patterns). The rainfall that does occur is likely to be in more intense storms. This will increase the risk of flooding, especially surface water flooding. London is likely to be at higher risk of drought as there will be less water to be captured in the summer and the groundwater will not be replenished during winter, and possibly more demand for water during hotter periods.
AIM London and Londoners will be resilient to severe weather and longer-term climate change impacts. This will include flooding, heat risk and drought.
L O N D O N E N V I R O N M E N T S T R A T E G Y
Climate change will disproportionately affect those least able to respond and recover from it. Poorer Londoners will find it more difficult to recover from flooding, may be less able to afford air conditioning to keep cool in hotter summers, and will suffer more from the effects of the urban heat island effect which results in urban areas being warmer than surrounding rural areas.
The challenge is how to manage these complex, and often interactive, pressures to ensure London and Londoners can adapt to climate change and stay resilient to any severe weather events that do occur.
Adaptation requires managing risks for the longer term, but to focus solely on risk management would be to overlook the many additional benefits of adaptation. For example, adaptation provides an opportunity to consider climate change alongside wider social, demographic, economic, environmental, and political priorities. This will help create a fairer, more prosperous, healthier, and more resilient city.
BOX 31: CLIMATE ADAPTATION AND RESILIENCE DEFINITIONS 100
Adaptation is the process (or outcome of a process) that leads to a reduction in harm or risk of harm, or realisation of benefits associated with climate variability and climate change.
Resilience is the ability of a system to recover from the effect of an extreme load that may have caused harm.
Adaptation policies can lead to greater resilience of communities and ecosystems to climate change.
100 UK CIP (2003), Climate adaptation: Risk, uncertainty and decision-making. Accessed from: http://www.ukcip.org.uk/wp-content/PDFs/UKCIP-Risk-framework.pdf.OECD (2006), Adaptation to Climate Change: Key Terms. Accessed from: http://www.oecd.org/env/cc/36736773.pdf.
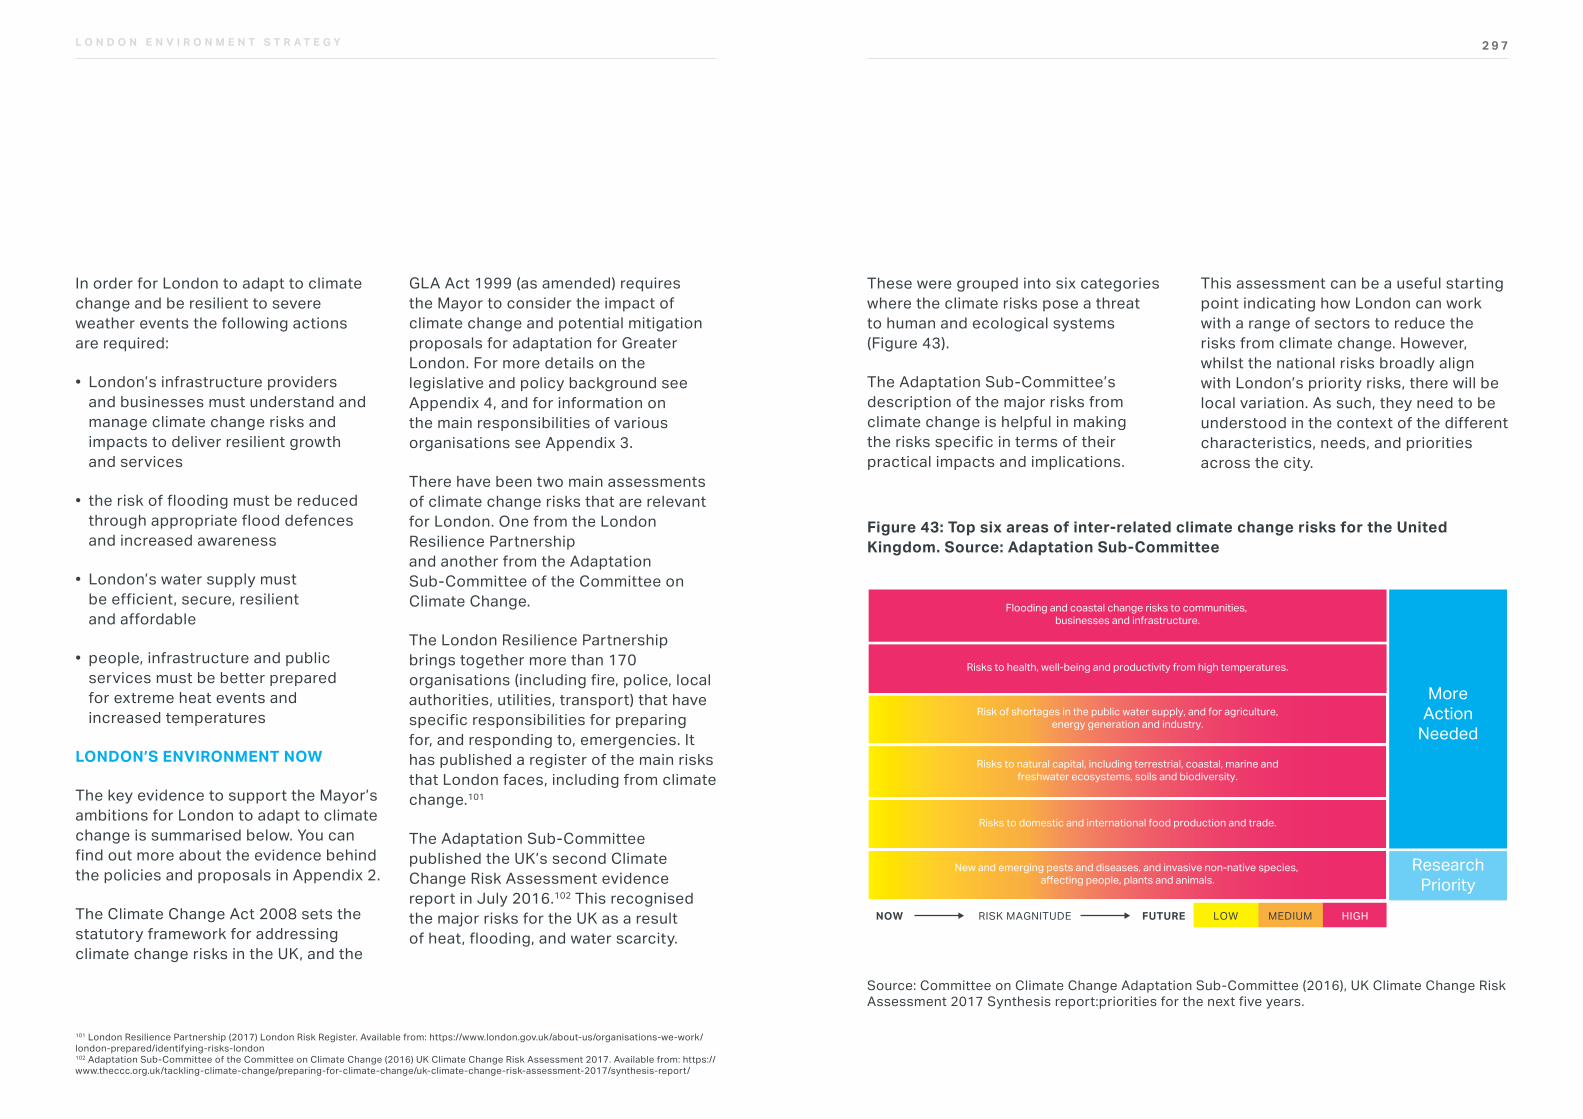
2 9 7L O N D O N E N V I R O N M E N T S T R A T E G Y
In order for London to adapt to climate change and be resilient to severe weather events the following actions are required:
• London’s infrastructure providers and businesses must understand and manage climate change risks and impacts to deliver resilient growth and services
• the risk of flooding must be reduced through appropriate flood defences and increased awareness
• London’s water supply must be efficient, secure, resilient and affordable
• people, infrastructure and public services must be better prepared for extreme heat events and increased temperatures
LONDON’S ENVIRONMENT NOW
The key evidence to support the Mayor’s ambitions for London to adapt to climate change is summarised below. You can find out more about the evidence behind the policies and proposals in Appendix 2.
The Climate Change Act 2008 sets the statutory framework for addressing climate change risks in the UK, and the
GLA Act 1999 (as amended) requires the Mayor to consider the impact of climate change and potential mitigation proposals for adaptation for Greater London. For more details on the legislative and policy background see Appendix 4, and for information on the main responsibilities of various organisations see Appendix 3.
There have been two main assessments of climate change risks that are relevant for London. One from the London Resilience Partnership and another from the Adaptation Sub-Committee of the Committee on Climate Change.
The London Resilience Partnership brings together more than 170 organisations (including fire, police, local authorities, utilities, transport) that have specific responsibilities for preparing for, and responding to, emergencies. It has published a register of the main risks that London faces, including from climate change.101
The Adaptation Sub-Committee published the UK’s second Climate Change Risk Assessment evidence report in July 2016.102 This recognised the major risks for the UK as a result of heat, flooding, and water scarcity.
101 London Resilience Partnership (2017) London Risk Register. Available from: https://www.london.gov.uk/about-us/organisations-we-work/london-prepared/identifying-risks-london 102 Adaptation Sub-Committee of the Committee on Climate Change (2016) UK Climate Change Risk Assessment 2017. Available from: https://www.theccc.org.uk/tackling-climate-change/preparing-for-climate-change/uk-climate-change-risk-assessment-2017/synthesis-report/
These were grouped into six categories where the climate risks pose a threat to human and ecological systems (Figure 43).
The Adaptation Sub-Committee’s description of the major risks from climate change is helpful in making the risks specific in terms of their practical impacts and implications.
This assessment can be a useful starting point indicating how London can work with a range of sectors to reduce the risks from climate change. However, whilst the national risks broadly align with London’s priority risks, there will be local variation. As such, they need to be understood in the context of the different characteristics, needs, and priorities across the city.
Figure 43: Top six areas of inter-related climate change risks for the United Kingdom. Source: Adaptation Sub-Committee
TYPE OF GRAPH: RESILIENCE AND WATER
Reference
Fig 2: Top six areas of inter-related climate change risks for the United Kingdom
Source: Committee on Climate Change Adaptation Sub-Committee (2016), UK Climate Change Risk Assessment 2017 Synthesis report:priorities for the next five years. Available at: theccc.org.uk/uk-climate-change-risk-assessment-2017/synthesis-report/
Flooding and coastal change risks to communities, businesses and infrastructure.
NOW LOW MEDIUM HIGHRISK MAGNITUDE FUTURE
Risks to health, well-being and productivity from high temperatures.
Risk of shortages in the public water supply, and for agriculture,energy generation and industry.
Risks to natural capital, including terrestrial, coastal, marine andfreshwater ecosystems, soils and biodiversity.
Risks to domestic and international food production and trade.
New and emerging pests and diseases, and invasive non-native species, affecting people, plants and animals.
MoreAction
Needed
ResearchPriority
Source: Committee on Climate Change Adaptation Sub-Committee (2016), UK Climate Change Risk Assessment 2017 Synthesis report: priorities for the next five years.
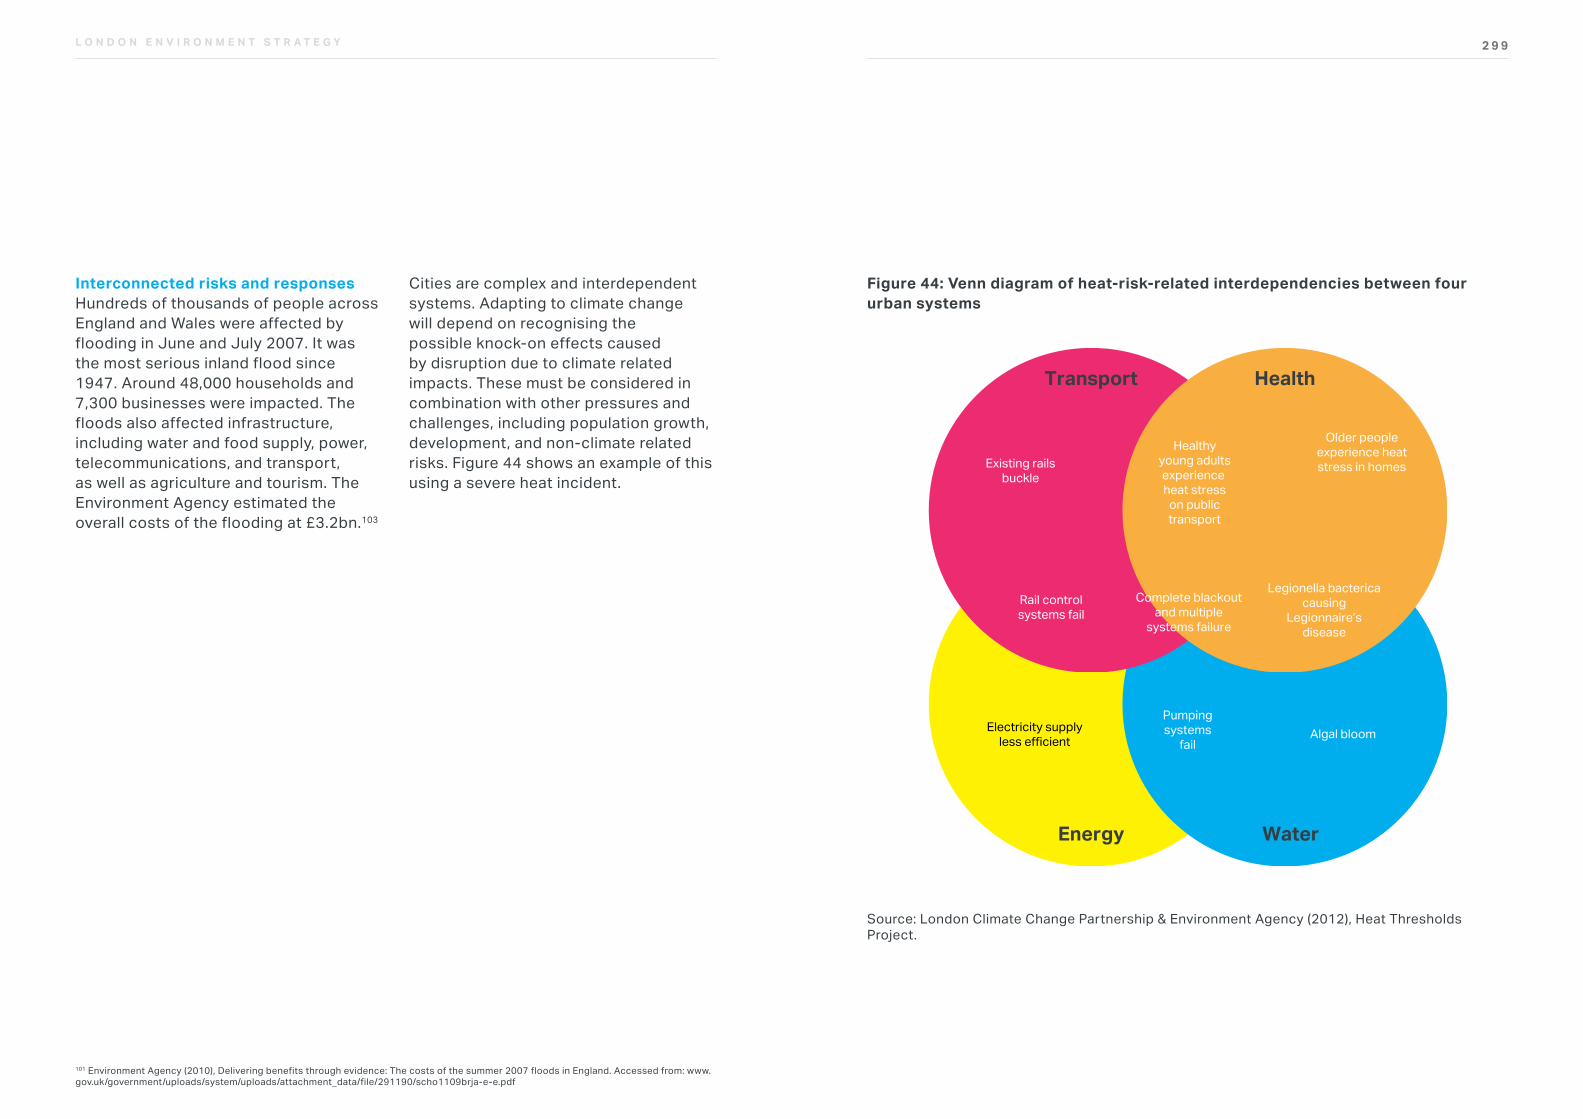
2 9 9L O N D O N E N V I R O N M E N T S T R A T E G Y
Interconnected risks and responses Hundreds of thousands of people across England and Wales were affected by flooding in June and July 2007. It was the most serious inland flood since 1947. Around 48,000 households and 7,300 businesses were impacted. The floods also affected infrastructure, including water and food supply, power, telecommunications, and transport, as well as agriculture and tourism. The Environment Agency estimated the overall costs of the flooding at £3.2bn.103
Cities are complex and interdependent systems. Adapting to climate change will depend on recognising the possible knock-on effects caused by disruption due to climate related impacts. These must be considered in combination with other pressures and challenges, including population growth, development, and non-climate related risks. Figure 44 shows an example of this using a severe heat incident.
101 Environment Agency (2010), Delivering benefits through evidence: The costs of the summer 2007 floods in England. Accessed from: www.gov.uk/government/uploads/system/uploads/attachment_data/file/291190/scho1109brja-e-e.pdf
Figure 44: Venn diagram of heat-risk-related interdependencies between four urban systems
TYPE OF GRAPH: RESILIENCE AND WATER
Reference
Available at: climatelondon.org.uk/publications/overheating-thresholds-report/
Fig 3: Venn diagram of heat-risk-related interdependencies between four urban systems
Source: London Climate Change Partnership & Environment Agency (2012), Heat Thresholds Project.
Transport
Existing railsbuckle
Rail controlsystems fail
Electricity supplyless efficient
Pumpingsystems
failAlgal bloom
Legionella bactericacausing
Legionnaire’sdisease
Older peopleexperience heatstress in homes
Healthyyoung adultsexperience heat stress
on publictransport
Complete blackoutand multiple
systems failure
Health
WaterEnergy
Source: London Climate Change Partnership & Environment Agency (2012), Heat Thresholds Project.
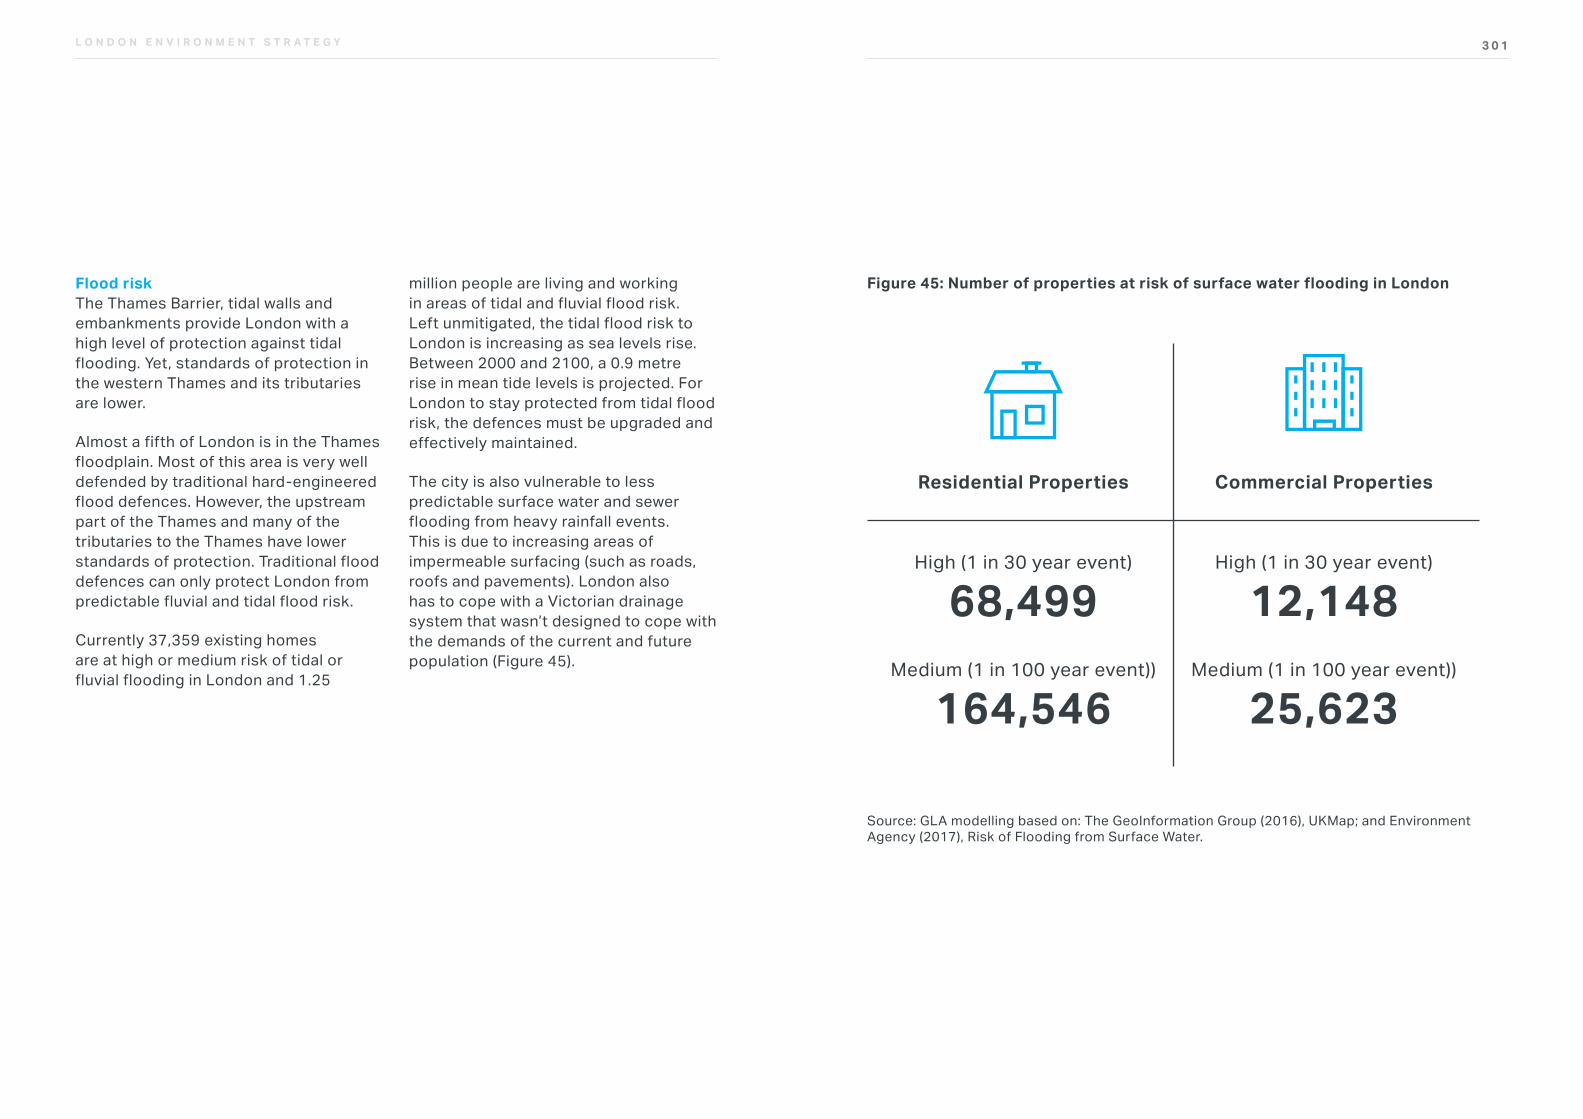
3 0 1L O N D O N E N V I R O N M E N T S T R A T E G Y
Flood riskThe Thames Barrier, tidal walls and embankments provide London with a high level of protection against tidal flooding. Yet, standards of protection in the western Thames and its tributaries are lower.
Almost a fifth of London is in the Thames floodplain. Most of this area is very well defended by traditional hard-engineered flood defences. However, the upstream part of the Thames and many of the tributaries to the Thames have lower standards of protection. Traditional flood defences can only protect London from predictable fluvial and tidal flood risk.
Currently 37,359 existing homes are at high or medium risk of tidal or fluvial flooding in London and 1.25
million people are living and working in areas of tidal and fluvial flood risk. Left unmitigated, the tidal flood risk to London is increasing as sea levels rise. Between 2000 and 2100, a 0.9 metre rise in mean tide levels is projected. For London to stay protected from tidal flood risk, the defences must be upgraded and effectively maintained.
The city is also vulnerable to less predictable surface water and sewer flooding from heavy rainfall events. This is due to increasing areas of impermeable surfacing (such as roads, roofs and pavements). London also has to cope with a Victorian drainage system that wasn’t designed to cope with the demands of the current and future population (Figure 45).
Figure 45: Number of properties at risk of surface water flooding in London
Source: GLA modelling based on: The GeoInformation Group (2016), UKMap; and Environment Agency (2017), Risk of Flooding from Surface Water.
Residential Properties
High (1 in 30 year event)
68,499Medium (1 in 100 year event))
164,546
Commercial Properties
High (1 in 30 year event)
12,148Medium (1 in 100 year event))
25,623
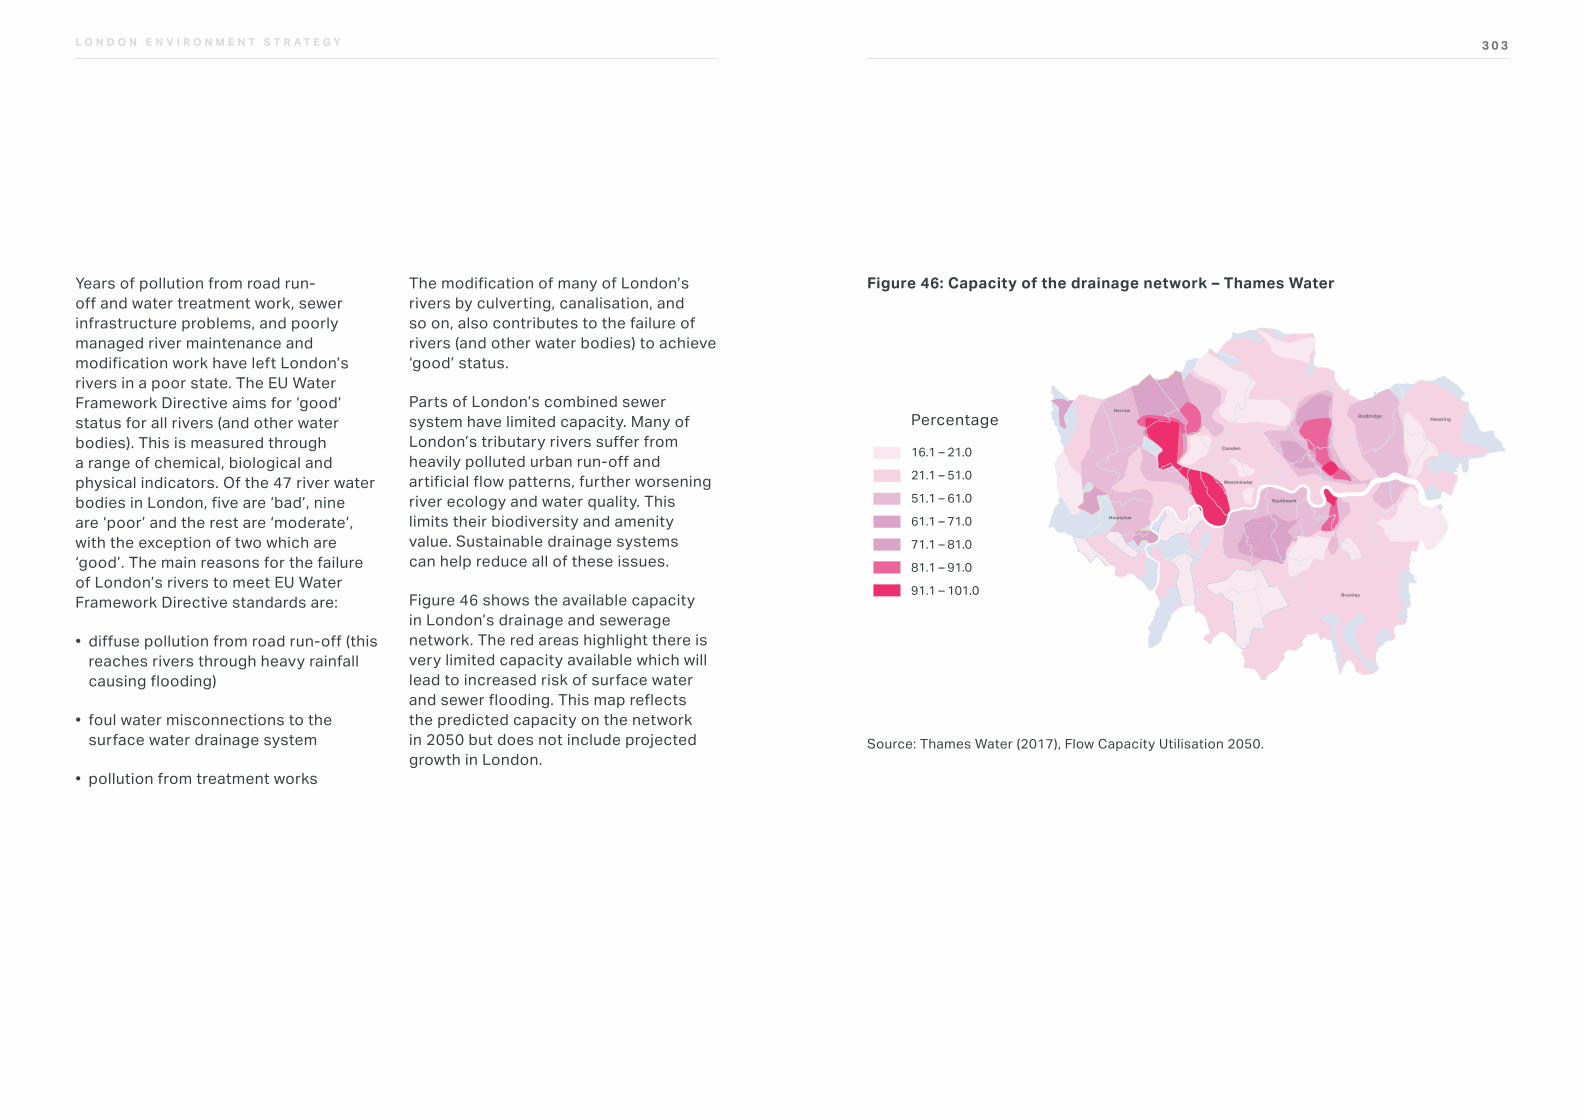
3 0 3L O N D O N E N V I R O N M E N T S T R A T E G Y
Years of pollution from road run-off and water treatment work, sewer infrastructure problems, and poorly managed river maintenance and modification work have left London’s rivers in a poor state. The EU Water Framework Directive aims for ‘good’ status for all rivers (and other water bodies). This is measured through a range of chemical, biological and physical indicators. Of the 47 river water bodies in London, five are ‘bad’, nine are ‘poor’ and the rest are ‘moderate’, with the exception of two which are ‘good’. The main reasons for the failure of London’s rivers to meet EU Water Framework Directive standards are:
• diffuse pollution from road run-off (this reaches rivers through heavy rainfall causing flooding)
• foul water misconnections to the surface water drainage system
• pollution from treatment works
The modification of many of London’s rivers by culverting, canalisation, and so on, also contributes to the failure of rivers (and other water bodies) to achieve ‘good’ status.
Parts of London’s combined sewer system have limited capacity. Many of London’s tributary rivers suffer from heavily polluted urban run-off and artificial flow patterns, further worsening river ecology and water quality. This limits their biodiversity and amenity value. Sustainable drainage systems can help reduce all of these issues.
Figure 46 shows the available capacity in London’s drainage and sewerage network. The red areas highlight there is very limited capacity available which will lead to increased risk of surface water and sewer flooding. This map reflects the predicted capacity on the network in 2050 but does not include projected growth in London.
Figure 46: Capacity of the drainage network – Thames Water
TYPE OF GRAPH: RESILIENCE AND WATER
Reference
Fig 11: Future capacity of the sewer network
Source: Thames Water (2017), Flow Capacity Utilisation 2050.
Percentage
16.1 – 21.0
21.1 – 51.0
51.1 – 61.0
61.1 – 71.0
71.1 – 81.0
81.1 – 91.0
91.1 – 101.0 Bromley
Southwark
Camden
HaveringRedbridge
Hounslow
Harrow
Westminster
Source: Thames Water (2017), Flow Capacity Utilisation 2050.
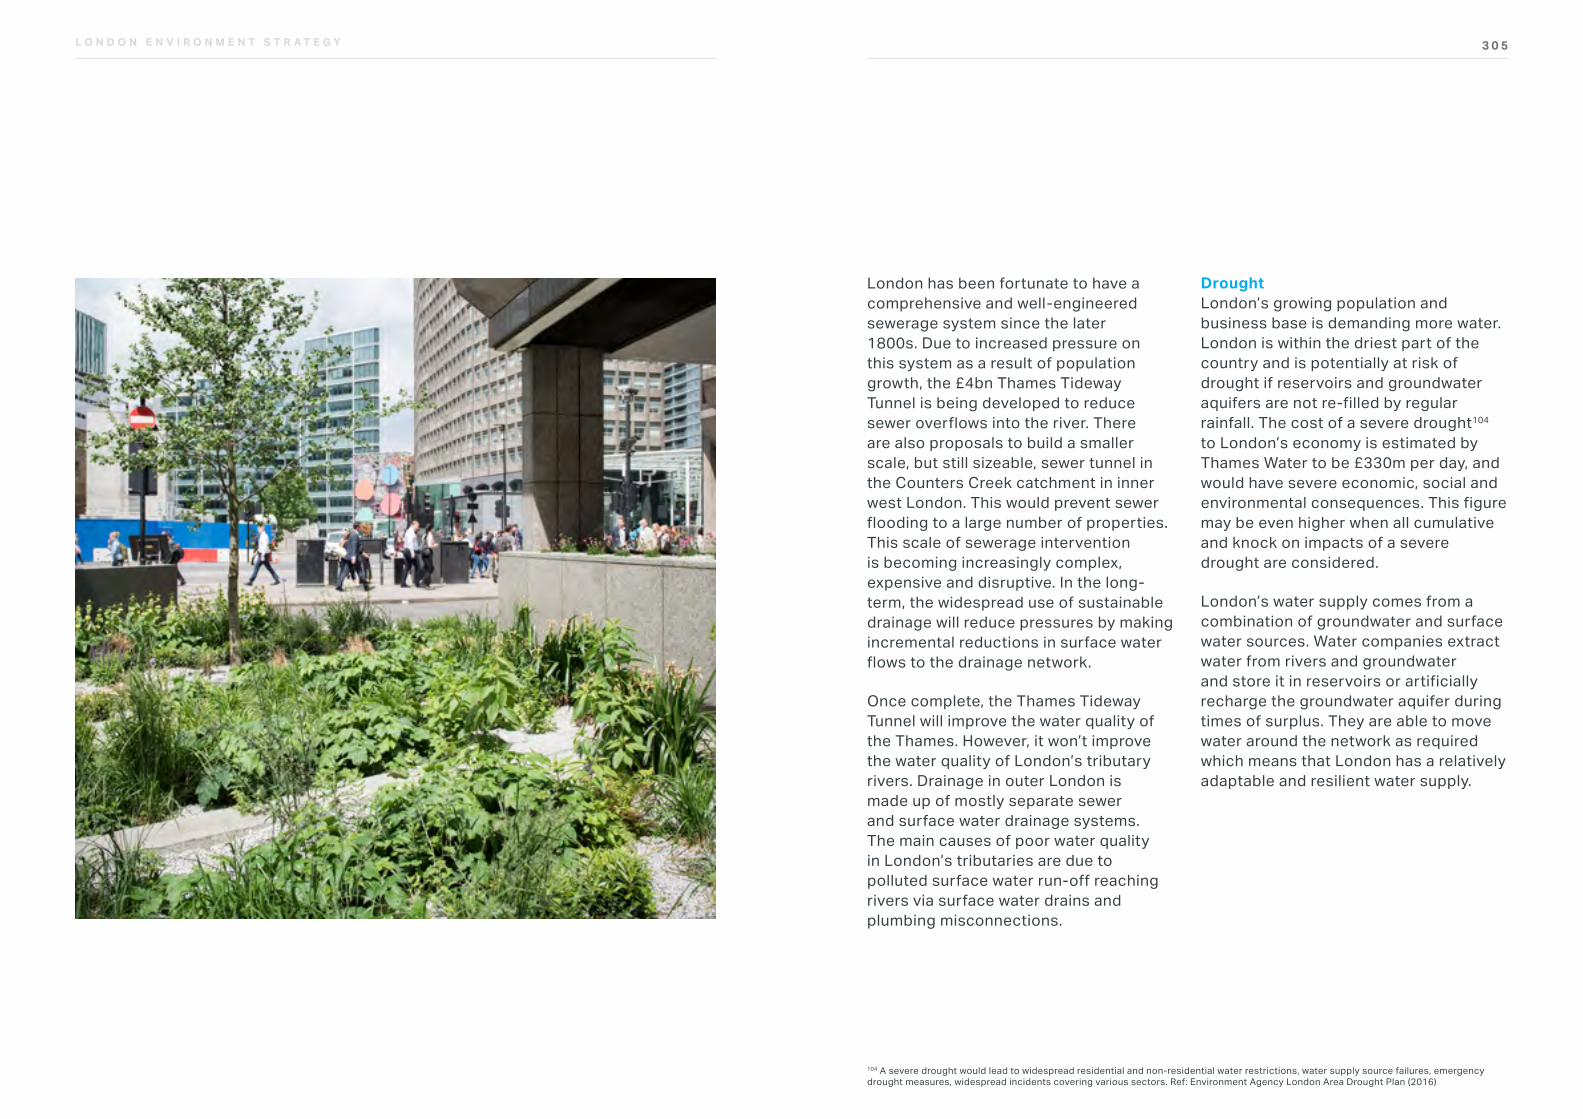
3 0 5L O N D O N E N V I R O N M E N T S T R A T E G Y
London has been fortunate to have a comprehensive and well-engineered sewerage system since the later 1800s. Due to increased pressure on this system as a result of population growth, the £4bn Thames Tideway Tunnel is being developed to reduce sewer overflows into the river. There are also proposals to build a smaller scale, but still sizeable, sewer tunnel in the Counters Creek catchment in inner west London. This would prevent sewer flooding to a large number of properties. This scale of sewerage intervention is becoming increasingly complex, expensive and disruptive. In the long-term, the widespread use of sustainable drainage will reduce pressures by making incremental reductions in surface water flows to the drainage network.
Once complete, the Thames Tideway Tunnel will improve the water quality of the Thames. However, it won’t improve the water quality of London’s tributary rivers. Drainage in outer London is made up of mostly separate sewer and surface water drainage systems. The main causes of poor water quality in London’s tributaries are due to polluted surface water run-off reaching rivers via surface water drains and plumbing misconnections.
Drought London’s growing population and business base is demanding more water. London is within the driest part of the country and is potentially at risk of drought if reservoirs and groundwater aquifers are not re-filled by regular rainfall. The cost of a severe drought104 to London’s economy is estimated by Thames Water to be £330m per day, and would have severe economic, social and environmental consequences. This figure may be even higher when all cumulative and knock on impacts of a severe drought are considered.
London’s water supply comes from a combination of groundwater and surface water sources. Water companies extract water from rivers and groundwater and store it in reservoirs or artificially recharge the groundwater aquifer during times of surplus. They are able to move water around the network as required which means that London has a relatively adaptable and resilient water supply.
104 A severe drought would lead to widespread residential and non-residential water restrictions, water supply source failures, emergency drought measures, widespread incidents covering various sectors. Ref: Environment Agency London Area Drought Plan (2016)
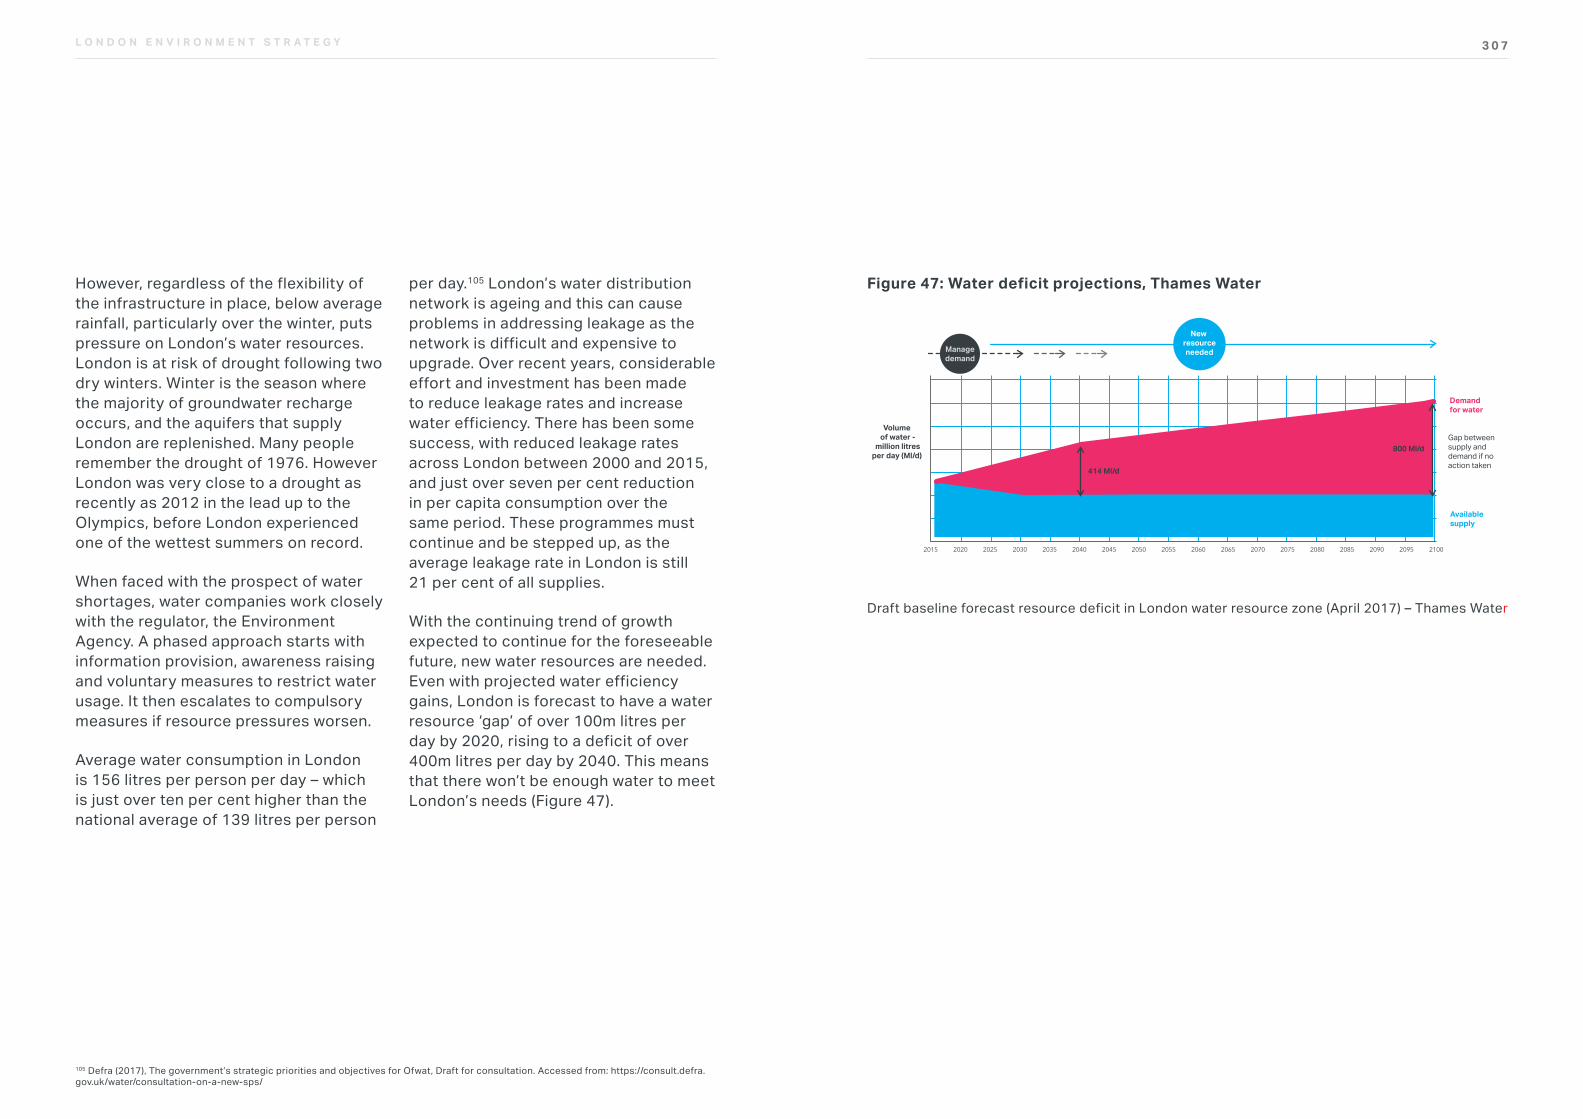
3 0 7L O N D O N E N V I R O N M E N T S T R A T E G Y
However, regardless of the flexibility of the infrastructure in place, below average rainfall, particularly over the winter, puts pressure on London’s water resources. London is at risk of drought following two dry winters. Winter is the season where the majority of groundwater recharge occurs, and the aquifers that supply London are replenished. Many people remember the drought of 1976. However London was very close to a drought as recently as 2012 in the lead up to the Olympics, before London experienced one of the wettest summers on record.
When faced with the prospect of water shortages, water companies work closely with the regulator, the Environment Agency. A phased approach starts with information provision, awareness raising and voluntary measures to restrict water usage. It then escalates to compulsory measures if resource pressures worsen.
Average water consumption in London is 156 litres per person per day – which is just over ten per cent higher than the national average of 139 litres per person
per day.105 London’s water distribution network is ageing and this can cause problems in addressing leakage as the network is difficult and expensive to upgrade. Over recent years, considerable effort and investment has been made to reduce leakage rates and increase water efficiency. There has been some success, with reduced leakage rates across London between 2000 and 2015, and just over seven per cent reduction in per capita consumption over the same period. These programmes must continue and be stepped up, as the average leakage rate in London is still 21 per cent of all supplies.
With the continuing trend of growth expected to continue for the foreseeable future, new water resources are needed. Even with projected water efficiency gains, London is forecast to have a water resource ‘gap’ of over 100m litres per day by 2020, rising to a deficit of over 400m litres per day by 2040. This means that there won’t be enough water to meet London’s needs (Figure 47).
105 Defra (2017), The government’s strategic priorities and objectives for Ofwat, Draft for consultation. Accessed from: https://consult.defra.gov.uk/water/consultation-on-a-new-sps/
Figure 47: Water deficit projections, Thames Water
Draft baseline forecast resource deficit in London water resource zone (April 2017) – Thames Water
2015 2020 2025 2030 2035 2040 2045 2050 2055 2060 2065 2070 2075 2080 2085 2090 2095 2100
Gap betweensupply and demand if noaction taken
Availablesupply
Demandfor water
Managedemand
414 Ml/d
800 Ml/d
New resourceneeded
Volume of water -
million litresper day (Ml/d)
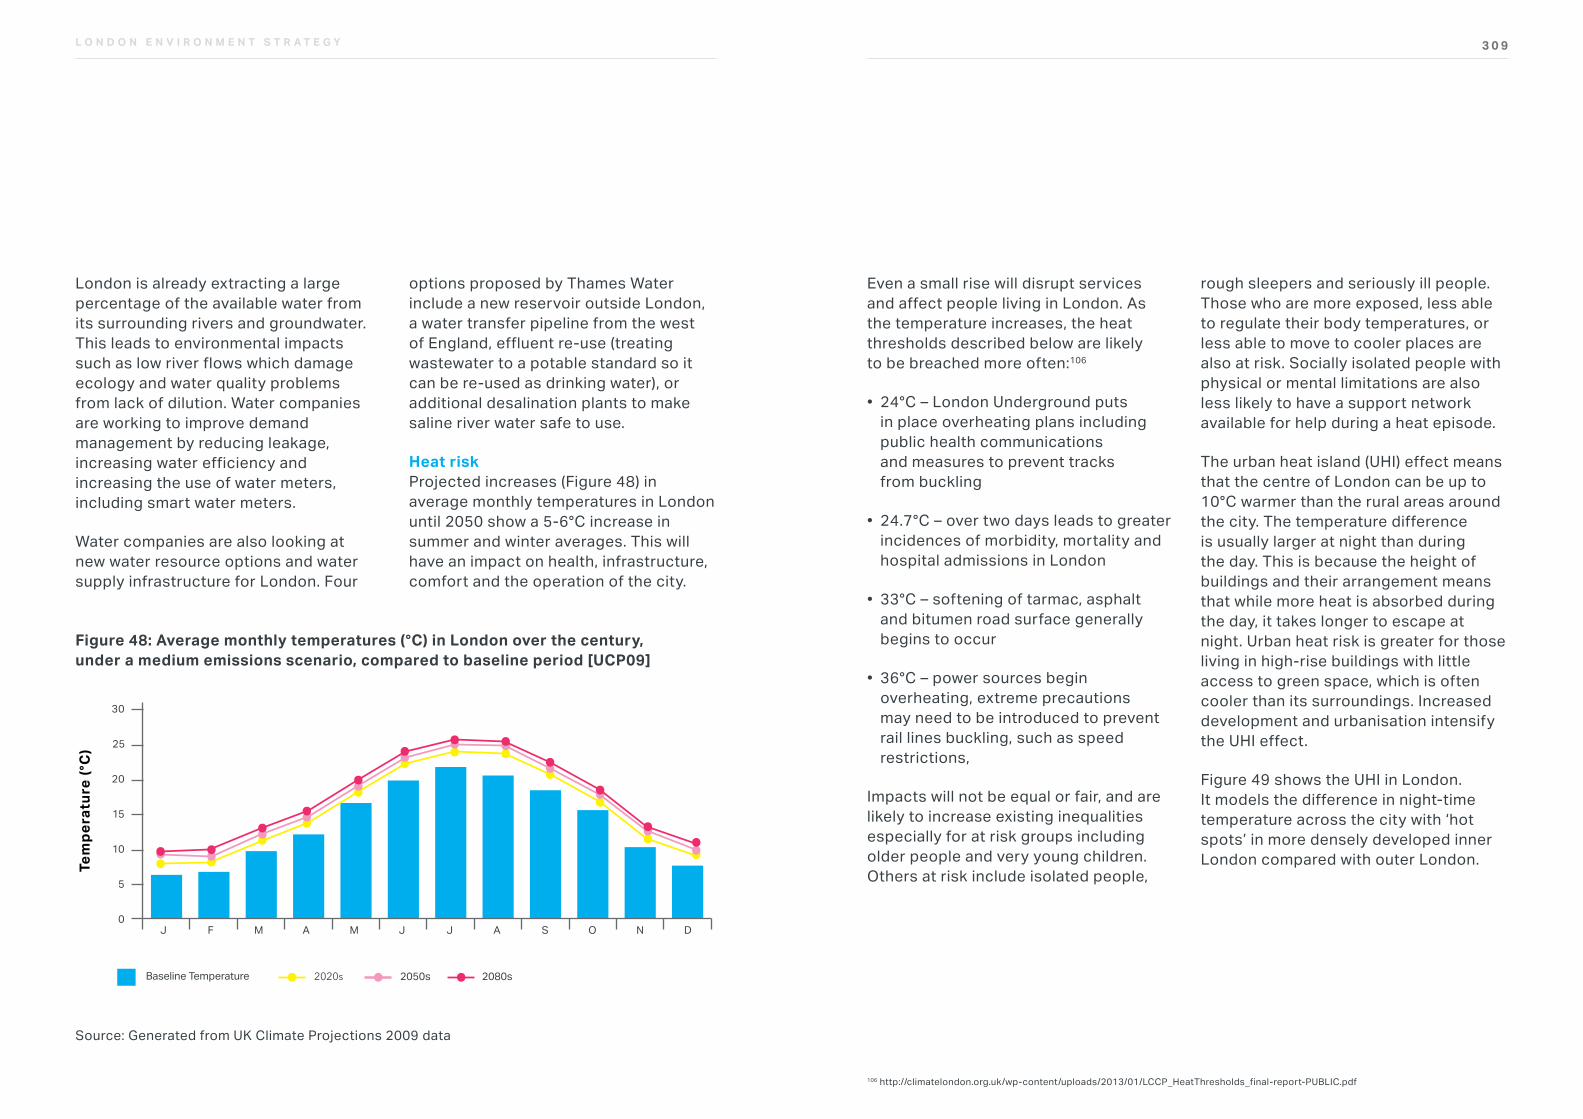
3 0 9L O N D O N E N V I R O N M E N T S T R A T E G Y
London is already extracting a large percentage of the available water from its surrounding rivers and groundwater. This leads to environmental impacts such as low river flows which damage ecology and water quality problems from lack of dilution. Water companies are working to improve demand management by reducing leakage, increasing water efficiency and increasing the use of water meters, including smart water meters.
Water companies are also looking at new water resource options and water supply infrastructure for London. Four
options proposed by Thames Water include a new reservoir outside London, a water transfer pipeline from the west of England, effluent re-use (treating wastewater to a potable standard so it can be re-used as drinking water), or additional desalination plants to make saline river water safe to use.
Heat riskProjected increases (Figure 48) in average monthly temperatures in London until 2050 show a 5-6°C increase in summer and winter averages. This will have an impact on health, infrastructure, comfort and the operation of the city.
Figure 48: Average monthly temperatures (°C) in London over the century, under a medium emissions scenario, compared to baseline period [UCP09]
TYPE OF GRAPH: RESILIENCE AND WATER
Reference
Fig 1: Average monthly temperatures (˚C) in London over the century, under a medium emissions scenario, compare to baseline period
Source: TBC
Available at: TBC
Tem
pera
ture
(°C
)
Baseline Temperature
M A M J J A S O N DFJ0
5
15
10
20
25
30
2020s 2050s 2080s
Source: Generated from UK Climate Projections 2009 data
Even a small rise will disrupt services and affect people living in London. As the temperature increases, the heat thresholds described below are likely to be breached more often:106
• 24°C – London Underground puts in place overheating plans including public health communications and measures to prevent tracks from buckling
• 24.7°C – over two days leads to greater incidences of morbidity, mortality and hospital admissions in London
• 33°C – softening of tarmac, asphalt and bitumen road surface generally begins to occur
• 36°C – power sources begin overheating, extreme precautions may need to be introduced to prevent rail lines buckling, such as speed restrictions,
Impacts will not be equal or fair, and are likely to increase existing inequalities especially for at risk groups including older people and very young children. Others at risk include isolated people,
rough sleepers and seriously ill people. Those who are more exposed, less able to regulate their body temperatures, or less able to move to cooler places are also at risk. Socially isolated people with physical or mental limitations are also less likely to have a support network available for help during a heat episode.
The urban heat island (UHI) effect means that the centre of London can be up to 10°C warmer than the rural areas around the city. The temperature difference is usually larger at night than during the day. This is because the height of buildings and their arrangement means that while more heat is absorbed during the day, it takes longer to escape at night. Urban heat risk is greater for those living in high-rise buildings with little access to green space, which is often cooler than its surroundings. Increased development and urbanisation intensify the UHI effect.
Figure 49 shows the UHI in London. It models the difference in night-time temperature across the city with ‘hot spots’ in more densely developed inner London compared with outer London.
106 http://climatelondon.org.uk/wp-content/uploads/2013/01/LCCP_HeatThresholds_final-report-PUBLIC.pdf
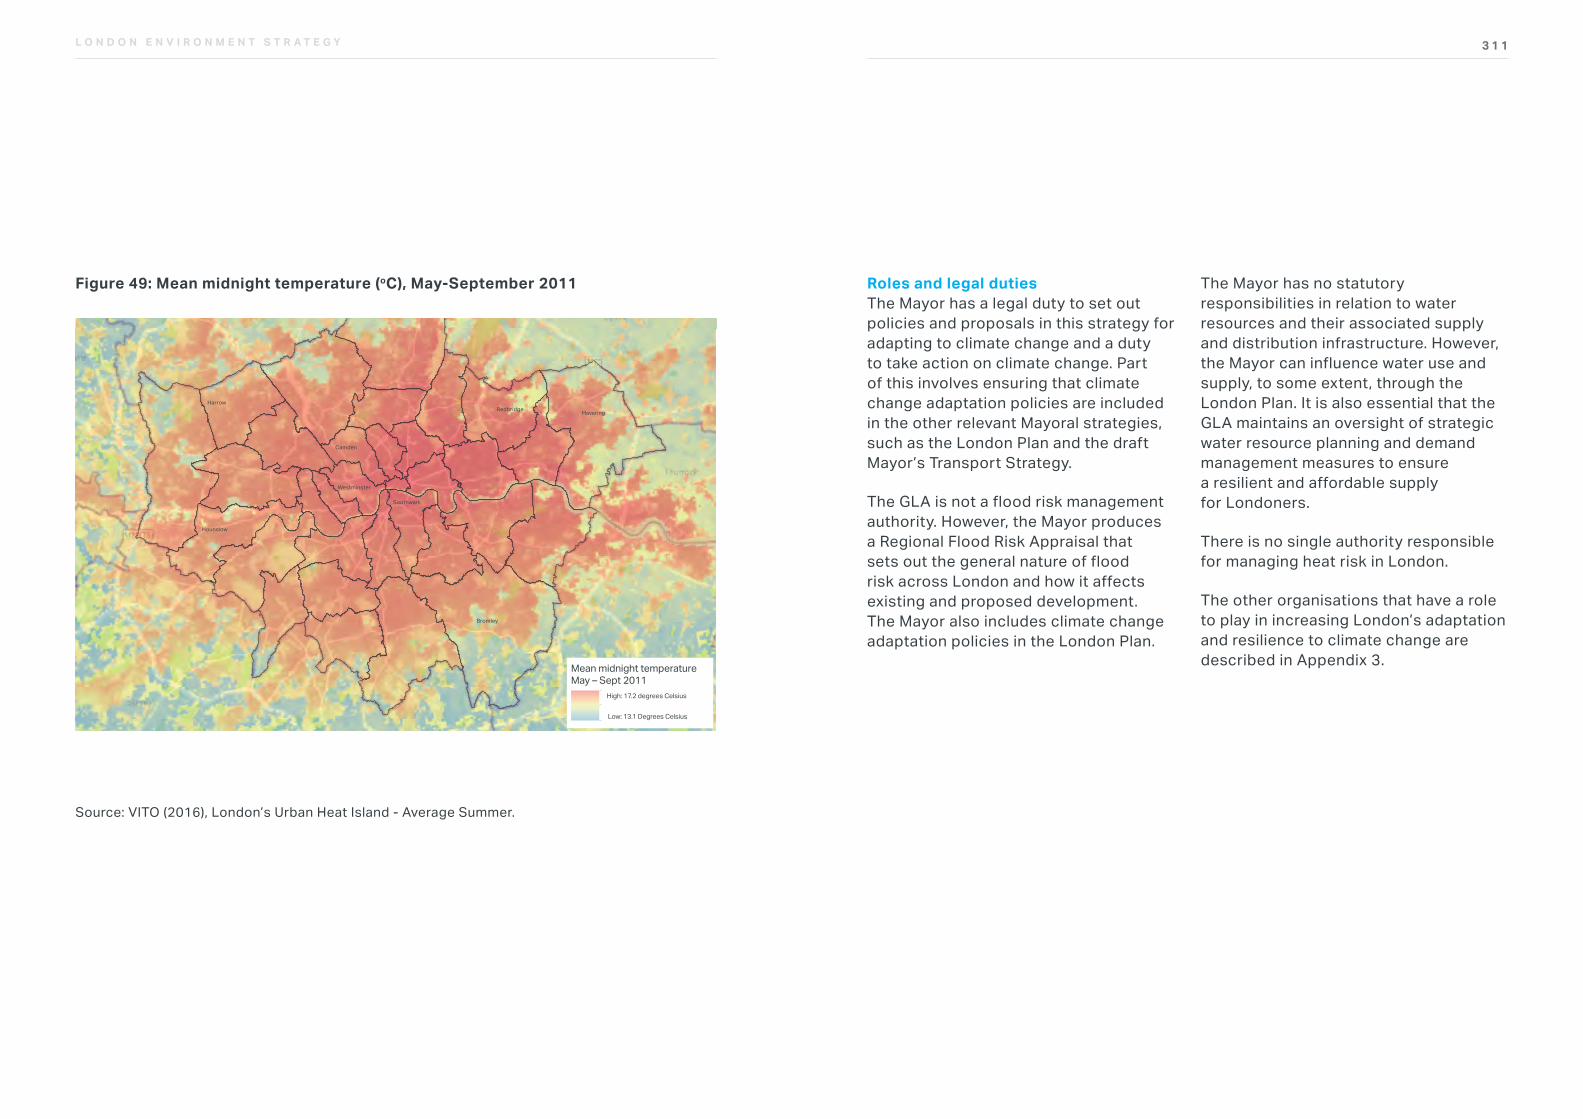
3 1 1L O N D O N E N V I R O N M E N T S T R A T E G Y
Figure 49: Mean midnight temperature (oC), May-September 2011
TYPE OF GRAPH: RESILIENCE AND WATER
Reference
Available at: data.london.gov.uk/dataset/london-s-urban-heat-island---average-summer
Fig 5: London's Urban Heat Island
Source: VITO (2016), London's Urban Heat Island - Average Summer.
Mean midnight temperatureMay – Sept 2011
High: 17.2 degrees Celsius
Low: 13.1 Degrees Celsius
Bromley
Southwark
Camden
HaveringRedbridge
Hounslow
Harrow
Westminster
Mean midnight temperatureMay – Sept 2011
High: 17.2 degrees Celsius
Low: 13.1 Degrees Celsius
Bromley
Southwark
Camden
HaveringRedbridge
Hounslow
Harrow
Westminster
Source: VITO (2016), London’s Urban Heat Island - Average Summer.
Roles and legal dutiesThe Mayor has a legal duty to set out policies and proposals in this strategy for adapting to climate change and a duty to take action on climate change. Part of this involves ensuring that climate change adaptation policies are included in the other relevant Mayoral strategies, such as the London Plan and the draft Mayor’s Transport Strategy.
The GLA is not a flood risk management authority. However, the Mayor produces a Regional Flood Risk Appraisal that sets out the general nature of flood risk across London and how it affects existing and proposed development. The Mayor also includes climate change adaptation policies in the London Plan.
The Mayor has no statutory responsibilities in relation to water resources and their associated supply and distribution infrastructure. However, the Mayor can influence water use and supply, to some extent, through the London Plan. It is also essential that the GLA maintains an oversight of strategic water resource planning and demand management measures to ensure a resilient and affordable supply for Londoners.
There is no single authority responsible for managing heat risk in London.
The other organisations that have a role to play in increasing London’s adaptation and resilience to climate change are described in Appendix 3.
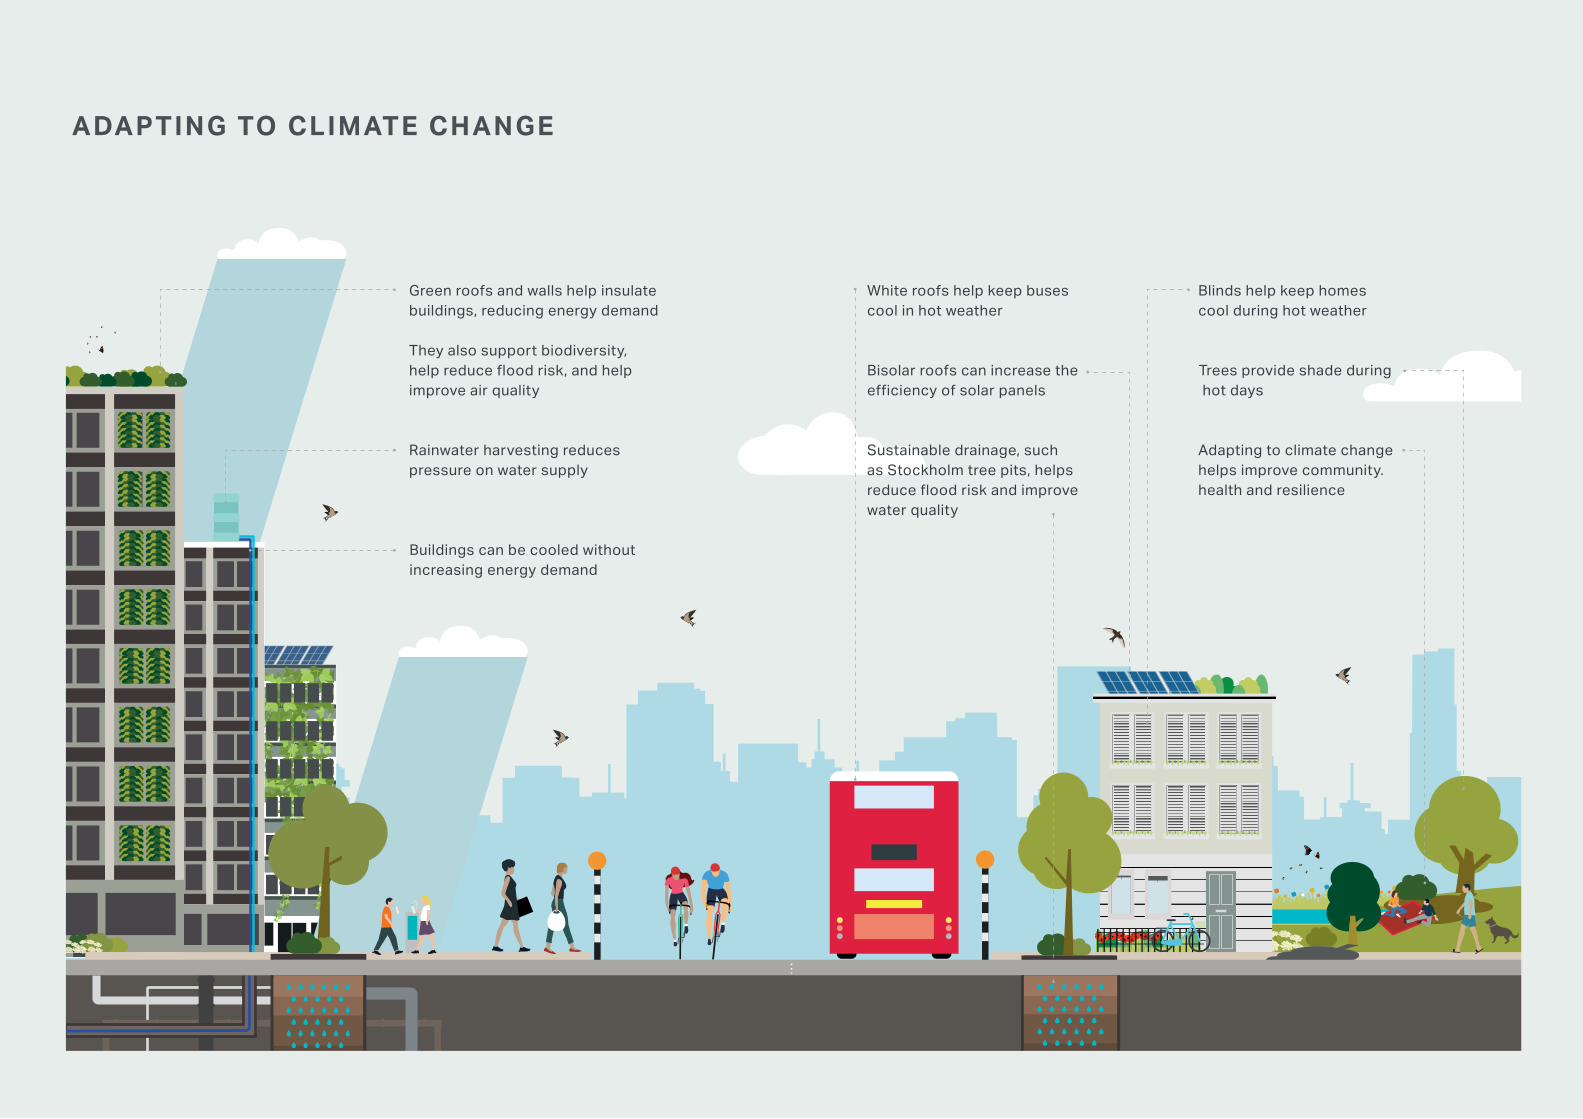
3 1 3L O N D O N E N V I R O N M E N T S T R A T E G Y
Trees provide shade during hot days
Rainwater harvesting reduces pressure on water supply
Sustainable drainage, such as Stockholm tree pits, helps reduce flood risk and improve water quality
Bisolar roofs can increase the efficiency of solar panels
Buildings can be cooled without increasing energy demand
Green roofs and walls help insulate buildings, reducing energy demand
They also support biodiversity, help reduce flood risk, and help improve air quality
Blinds help keep homes cool during hot weather
White roofs help keep buses cool in hot weather
Adapting to climate change helps improve community. health and resilience
ADAPTING TO CLIMATE CHANGE
3 1 5L O N D O N E N V I R O N M E N T S T R A T E G Y
OBJECTIVE 8.1 UNDERSTAND AND MANAGE THE RISKS AND IMPACTS OF SEVERE WEATHER AND FUTURE CLIMATE CHANGE IN LONDON ON CRITICAL INFRASTRUCTURE, PUBLIC SERVICES, BUILDINGS AND PEOPLE
It is vital that sectors including transport, digital, energy, water and buildings are able to adapt to the impacts of climate change to ensure that services can continue to be delivered even through periods of severe weather.
There is not a complete understanding of what will happen if risks from climate change are not addressed as social and environmental impacts are difficult to quantify. However, the insurance and financial sectors have tried to measure the potential economic losses if greenhouse gas emissions are not reduced. A Nature Climate Change study by the London School of Economics107 found that climate change could reduce the value of world’s financial assets by £2.5 trillion, and possibly up to ten times that figure in a worst-case scenario. The losses would be caused by the direct destruction of assets by increasingly extreme weather events, and a loss of earnings for those affected by high temperatures, drought and other climate
change impacts. In a World Economic Forum survey in 2016,108 some 750 experts found that a catastrophe due to climate change would be the biggest potential threat to the global economy. They believed it to be more of a risk than weapons of mass destruction, water crises, mass involuntary migration and a severe energy price shock. The report concluded the connections between climate change and other risks, like involuntary migration, are getting stronger.
In order to monitor London’s ability to adapt to climate change and remain resilient during severe weather events it is necessary to establish a baseline and then monitor and measure the progress being made. In order to understand how climate change may affect the critical functions of the city. The Mayor wants to work with different sectors in London to do this rather than solely focussing on individual risks. This work will include developing indicators, identifying thresholds that indicate severe disruption as a result of climate change for example during heatwaves in London and developing plans for how to deal with it if and when they do occur.
Objectives, policies and proposals
107 Dietz, S., Bowen, A., Dixon, C., Gradwell, P. (2016) ‘Climate value at risk’ of global financial assets. Nature: climate change [online]. Accessed from: www.nature.com/nclimate/journal/v6/n7/full/nclimate2972.html 108 World Economic Forum (2106), World Economic Forum Global Risks Report 2016, 11th Edition. Accessed from: www3.weforum.org/docs/GRR/WEF_GRR16.pdf
Policy 8.1.1 Priority sectors understand the impacts of severe weather and climate change, prioritise the key risks, and identify mitigation measures where appropriate
Proposal 8.1.1a The Mayor will work with the main infrastructure providers in transport, energy, water, and buildings to identify thresholds for disruption and produce integrated plans for addressing long-term climate risks
Thresholds are points at which, given certain conditions, disruption to services, infrastructure, or people’s wellbeing occurs. For example, vulnerability of buildings to power failures increases when external temperatures reach 30⁰C. External air temperatures of 36⁰C result in rail track temperatures of 48⁰C to 52⁰C. At such times, Network Rail puts in place extreme precautions like speed restrictions to prevent the buckling of rails.
Identifying thresholds is crucial for planning to prevent disruption. Climate projections can be used to understand how the risk of disruption is expected to change into the future with climate change.
The Mayor, through the London Climate Change Partnership (LCCP), will convene sectoral partners and relevant experts from the research community to share knowledge, identify thresholds, and collaborate around resilience planning.
Progress will be assessed through monitoring indicators and qualitative review of plans across sectors developed as part of this activity.
Proposal 8.1.1b The Mayor will promote ways to continually improve resilience in infrastructure among priority sectors to ensure that London remains a leading global city
The Mayor, through the LCCP, will work with critical sectors to identify adaptive pathways for managing severe weather and longer term climate change risks. As these sectors will be developing large-scale infrastructure that will have long lifespans, they can benefit from adaptive pathways, which allow for flexibility in decision-making so that we don’t cut off options for the future. The approach helps us time decisions in order to accommodate changing information in an uncertain future.
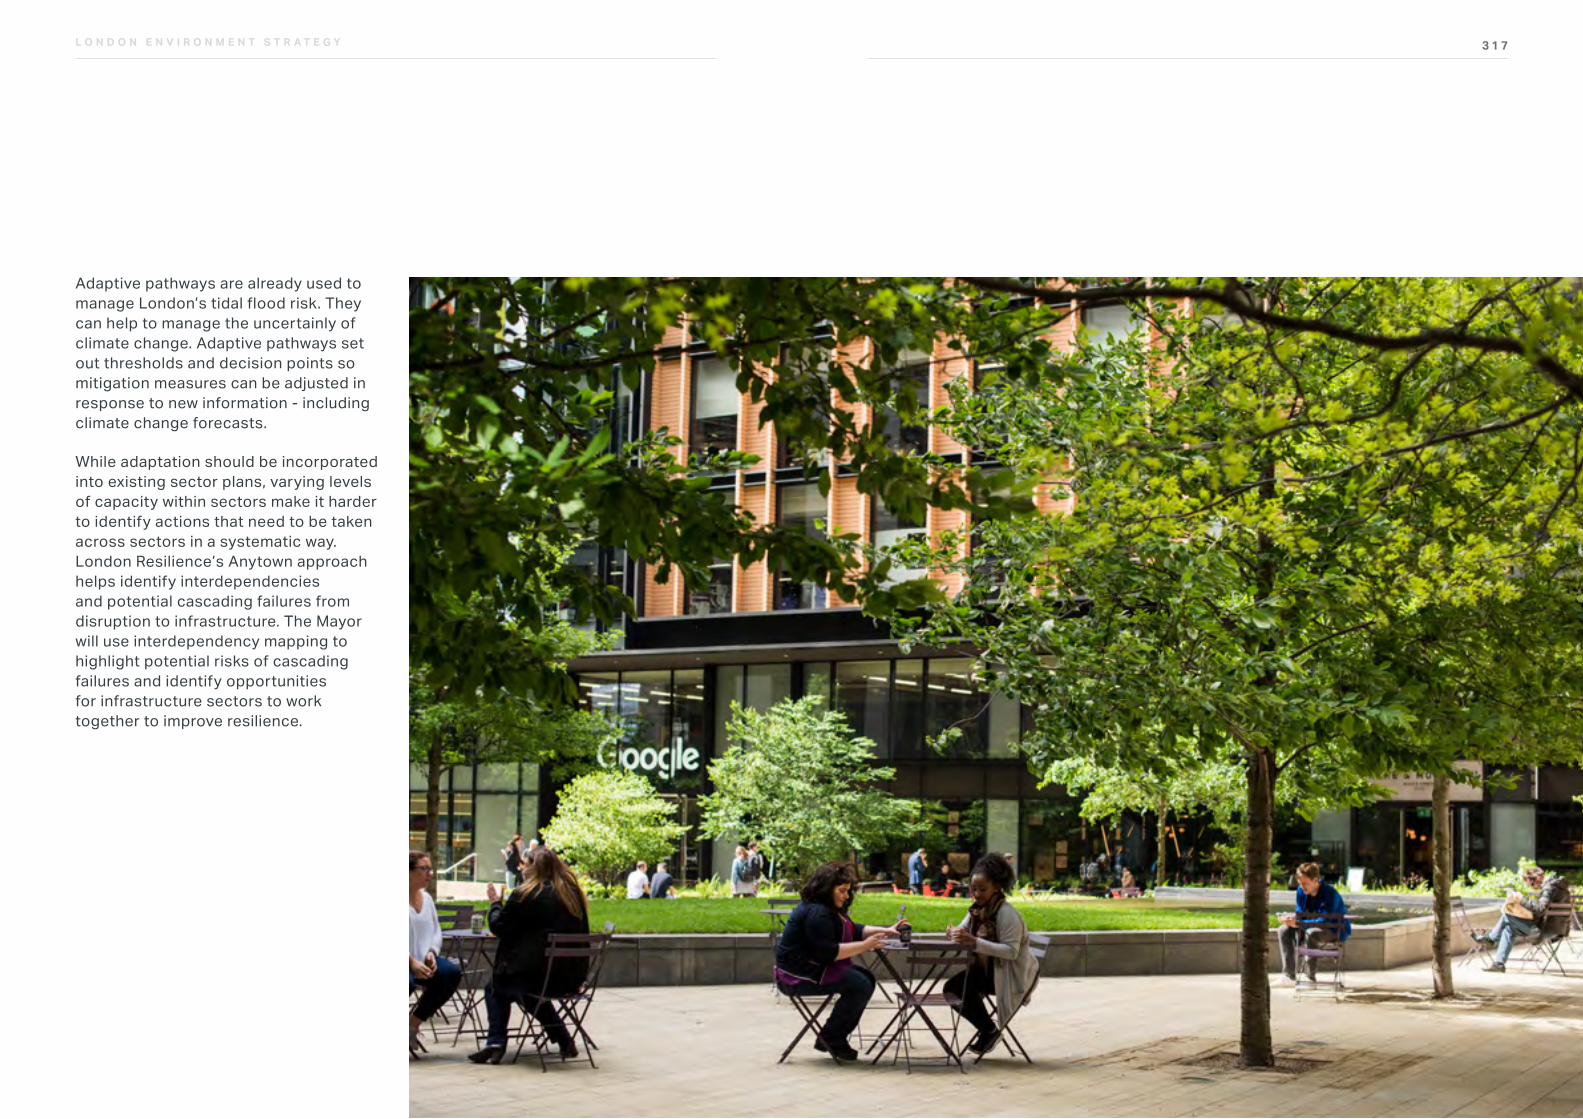
3 1 7L O N D O N E N V I R O N M E N T S T R A T E G Y
Adaptive pathways are already used to manage London’s tidal flood risk. They can help to manage the uncertainly of climate change. Adaptive pathways set out thresholds and decision points so mitigation measures can be adjusted in response to new information - including climate change forecasts.
While adaptation should be incorporated into existing sector plans, varying levels of capacity within sectors make it harder to identify actions that need to be taken across sectors in a systematic way. London Resilience’s Anytown approach helps identify interdependencies and potential cascading failures from disruption to infrastructure. The Mayor will use interdependency mapping to highlight potential risks of cascading failures and identify opportunities for infrastructure sectors to work together to improve resilience.
3 1 9L O N D O N E N V I R O N M E N T S T R A T E G Y
Policy 8.1.2 Develop, refine and monitor plans and indicators of London’s resilience to severe weather and longer term climate change impacts on flooding, heat risk and water pollution
Proposal 8.1.2a Through the London Climate Change Partnership, the Mayor will agree indicators with priority sector representatives and establish a baseline for regular monitoring
There is currently no systematic collection of data to illustrate how well the city is adapting to the impacts of severe weather and longer-term climate change.
Such data collection, largely drawn from existing data sets, would help London adapt to climate change and become more resilient. It would capture evidence of good and poor performance, identify adaptation priorities and highlight knowledge gaps. Where possible, this would include assessing financial costs of severe weather to support the business case for adaptation.
Indicators will be developed in collaboration with partners and stakeholders from priority sectors that have key roles to play in London adapting to climate change. These include transport, digital, energy, water and buildings. The indicators will be collected, maintained, and monitored on a regular basis and will largely be drawn from existing sources of data and will cover climate change, social vulnerability, environmental and financial impacts.
OBJECTIVE 8.2 REDUCE RISKS AND IMPACTS OF FLOODING IN LONDON ON PEOPLE AND PROPERTY AND IMPROVE WATER QUALITY IN LONDON’S RIVERS AND WATERWAYS
London is vulnerable to flooding from five sources: tidal, river, surface, sewer and groundwater.
Over centuries, London has grown on the banks of the Thames, encroaching on the natural floodplain. As the city has become more built up the river walls have been raised incrementally. Part of London (approximately 15 per cent) sits in the natural tidal floodplain on land that would flood on virtually every high tide, were it not for the Thames’ flood defences. The current flood risk
to London is highest when a peak spring tide coincides with a North Sea tidal surge. This is caused by a specific set of meteorological conditions, including low pressure over the North Sea and a northerly wind resulting in raised sea levels. The highest water levels occur when the peak of the tide coincides with peak surge.
London had major flooding from an east coast tidal surge in 1928. It narrowly escaped a major flood in 1953, when serious flooding struck the outer estuary in Kent and Essex. This latter event provided the push for building the present day Thames Tidal Defences. The Thames Barrier is the iconic centrepiece of this system of river walls, embankments and gates and barriers that stretch out into Kent and Essex. This system gives London one of the highest levels of tidal flood protection in the world, currently modelled to provide more than one in 1,000 year protection. The flood defences protect many thousands of homes, critical infrastructure, including many tube and rail stations, and property worth over £200bn.
At present the Thames Barrier also protects west London from fluvial
“ Flood defences protect many thousands of homes, critical infrastructure, including many tube and rail stations, and property worth over £200bn.”
3 1 93 1 9
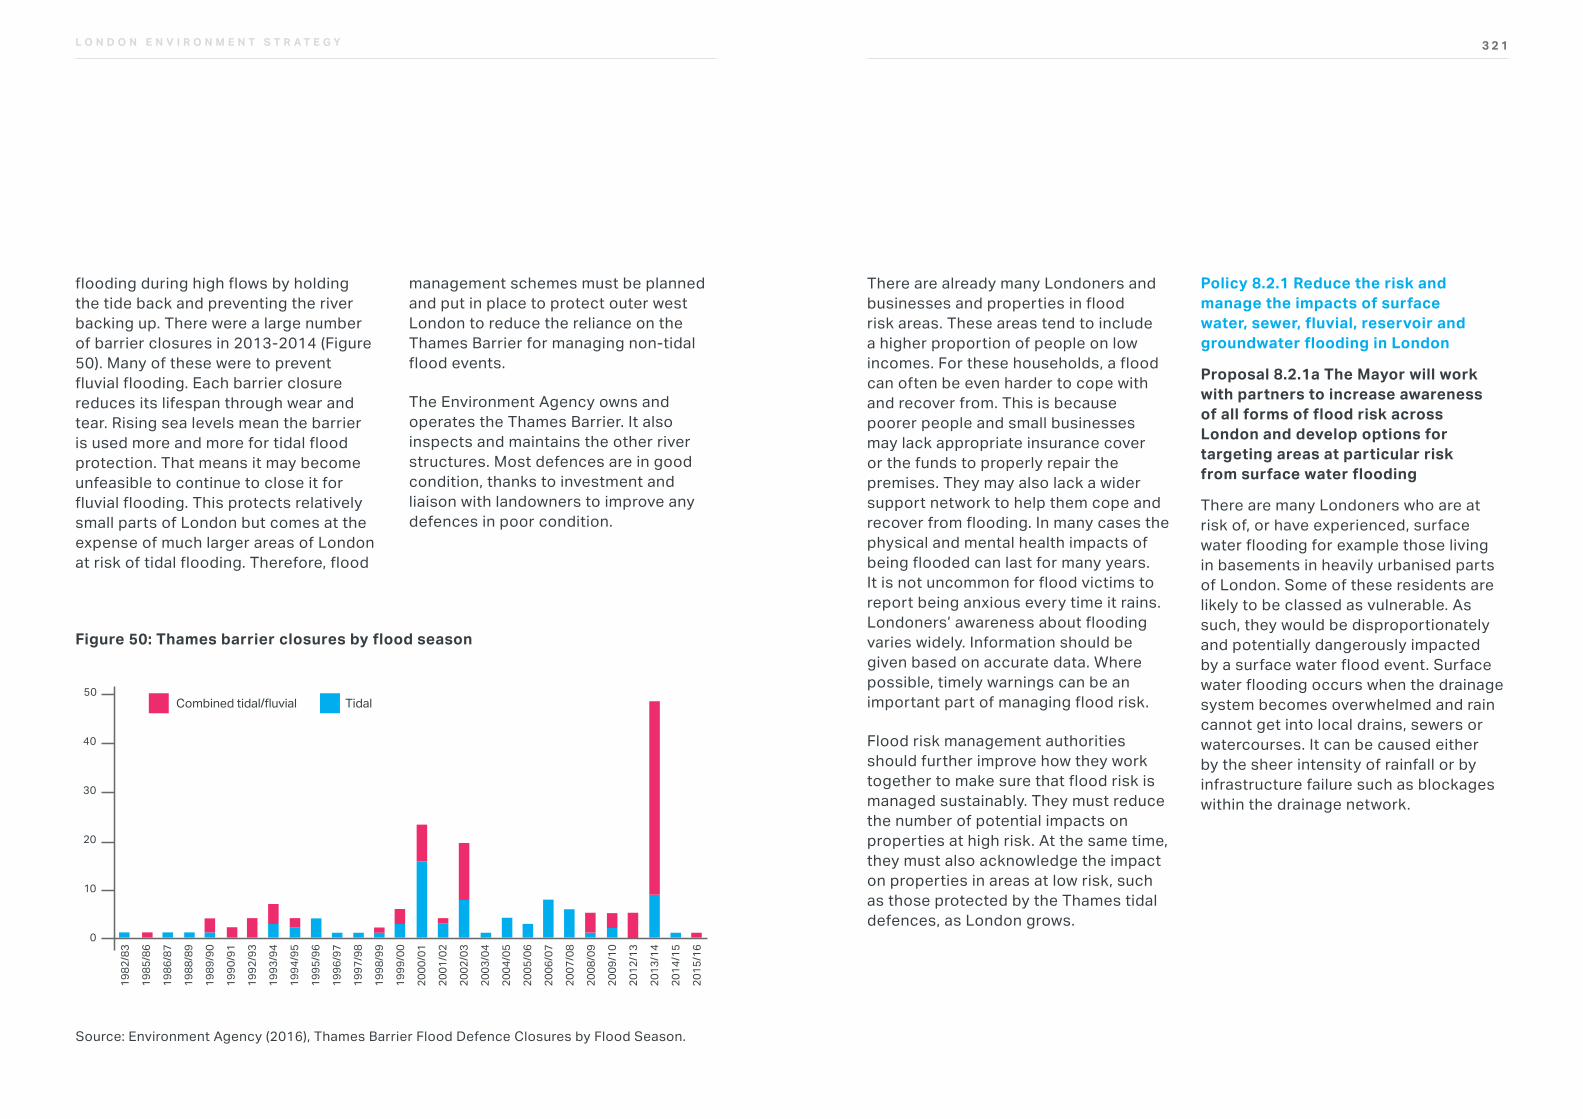
3 2 1L O N D O N E N V I R O N M E N T S T R A T E G Y
flooding during high flows by holding the tide back and preventing the river backing up. There were a large number of barrier closures in 2013-2014 (Figure 50). Many of these were to prevent fluvial flooding. Each barrier closure reduces its lifespan through wear and tear. Rising sea levels mean the barrier is used more and more for tidal flood protection. That means it may become unfeasible to continue to close it for fluvial flooding. This protects relatively small parts of London but comes at the expense of much larger areas of London at risk of tidal flooding. Therefore, flood
management schemes must be planned and put in place to protect outer west London to reduce the reliance on the Thames Barrier for managing non-tidal flood events.
The Environment Agency owns and operates the Thames Barrier. It also inspects and maintains the other river structures. Most defences are in good condition, thanks to investment and liaison with landowners to improve any defences in poor condition.
Figure 50: Thames barrier closures by flood season
TYPE OF GRAPH: RESILIENCE AND WATER
Reference
Fig 6: Number of Thames Barrier closures by season
Source: Environment Agency (2016), Thames Barrier Flood Defence Closures by Flood Season.
Num
ber
of c
losu
res
Combined tidal/fluvial Tidal
1982
/83
1985
/86
1986
/87
1988
/89
1989
/90
1990
/91
1992
/93
1993
/94
1994
/95
1995
/96
1996
/97
1997
/98
1998
/99
1999
/00
2000
/01
2001
/02
2002
/03
2003
/04
2004
/05
2005
/06
2006
/07
2007
/08
2008
/09
2009
/10
2012
/13
2013
/14
2014
/15
2015
/16
10
30
20
40
50
0
Source: Environment Agency (2016), Thames Barrier Flood Defence Closures by Flood Season.
There are already many Londoners and businesses and properties in flood risk areas. These areas tend to include a higher proportion of people on low incomes. For these households, a flood can often be even harder to cope with and recover from. This is because poorer people and small businesses may lack appropriate insurance cover or the funds to properly repair the premises. They may also lack a wider support network to help them cope and recover from flooding. In many cases the physical and mental health impacts of being flooded can last for many years. It is not uncommon for flood victims to report being anxious every time it rains. Londoners’ awareness about flooding varies widely. Information should be given based on accurate data. Where possible, timely warnings can be an important part of managing flood risk.
Flood risk management authorities should further improve how they work together to make sure that flood risk is managed sustainably. They must reduce the number of potential impacts on properties at high risk. At the same time, they must also acknowledge the impact on properties in areas at low risk, such as those protected by the Thames tidal defences, as London grows.
Policy 8.2.1 Reduce the risk and manage the impacts of surface water, sewer, fluvial, reservoir and groundwater flooding in London
Proposal 8.2.1a The Mayor will work with partners to increase awareness of all forms of flood risk across London and develop options for targeting areas at particular risk from surface water flooding
There are many Londoners who are at risk of, or have experienced, surface water flooding for example those living in basements in heavily urbanised parts of London. Some of these residents are likely to be classed as vulnerable. As such, they would be disproportionately and potentially dangerously impacted by a surface water flood event. Surface water flooding occurs when the drainage system becomes overwhelmed and rain cannot get into local drains, sewers or watercourses. It can be caused either by the sheer intensity of rainfall or by infrastructure failure such as blockages within the drainage network.
3 2 3L O N D O N E N V I R O N M E N T S T R A T E G Y
The sporadic and intense nature of heavy rainfall makes it very hard to accurately predict when and where surface water flooding will occur. This means it is difficult to provide a reliable warning or alerts system. As a result, those at risk of surface water flooding may have little or no knowledge of the extent of the potential risk they face. The Mayor, flood risk management authorities109 and other partners in London have done research into this area. This has helped get a better understanding and mapping of surface water flood risk in the London boroughs. It is less clear whether residents in surface water flood risk areas know what risk they face or how to reduce the risk and respond.
The Mayor will bring all partners together, including the London Resilience Forum and flood risk authorities in London. This will help identify those most at risk of or most vulnerable to surface water flooding. They can also work to increase their understanding of the risk and how to respond. This should include providing information to help build their capacity to adapt and become more resilient.
The Mayor will continue to work with Lead Local Flood Authorities and the Environment Agency through the Drain London project and the London Drainage
Engineers Group to promote a consistent approach to managing surface water more sustainably and reducing the risks where surface water flooding happens often. The Mayor will expect Thames Water to continually reduce the number of properties at risk from sewer flooding.
Proposal 8.2.1b The Mayor will support flood risk management authorities in London to manage fluvial flood risk and promote best practice approaches in hard and soft-engineered flood management
The Mayor will expect the Environment Agency to improve flood defences on London’s fluvial (river) networks through supporting them in making sure owners of river walls play their part in maintaining defences. The Mayor will work with the Environment Agency to develop 25-year flood risk management strategies for each river catchment. These will account for the need for new development within those catchments and opportunities to manage flood water in the most sustainable cost-effective ways. This is a chance to increase London’s green cover using green infrastructure to help manage flood risk, including sustainable drainage systems (SuDS).
109 In London the Risk Management Authorities are: Environment Agency, Lead Local Flood Authorities (London boroughs and City of London), Regional Flood and Coastal Committee, Highways England and water and sewerage companies.
Sustainable drainage and natural flood management techniques need to be used at a strategic scale alongside hard engineered flood defences. Together, this can manage rainwater at source and slow the flow of water reaching the rivers. Sustainable drainage and natural flood management can, for example, potentially reduce the need for new hard flood defences downstream. It can also be a way to reduce flood risk where hard defences are undesirable or undeliverable. For example, multiple small schemes could be located strategically. This means when combined they can reduce flood risk downstream or in an area susceptible to flooding. The catchment based approach to flood management in the River Thames could over time reduce the number of properties at risk in west London. By so doing, it could also reduce the need for fluvial Thames Barrier closures. This would help to extend the barrier’s life as a tidal flood defence for London.
The Mayor will support and work with partners including the Thames Regional Flood and Coastal Committee and the flood risk management authorities and river catchment partners in order to reduce flood risk in London and establish the appropriate approach to funding for fluvial flood risk management including fair allocation of the cost.
BOX 32: NATURE-BASED APPROACHES TO MANAGING FLOOD RISK
Sustainable Drainage Systems (SuDS) are measures to help capture, use, delay the dispersal of, discharge or absorb surface water. There is a preference towards maximising the use of green infrastructure solutions to achieve this, due to the additional benefits beyond water management that SuDS can deliver.
Natural Flood Management involves managing flood risk by protecting, restoring and emulating the natural regulating function of catchments and rivers; often through a series of smaller interventions in the upper sections of a river catchment, closer to source, to slow or delay flows downstream.
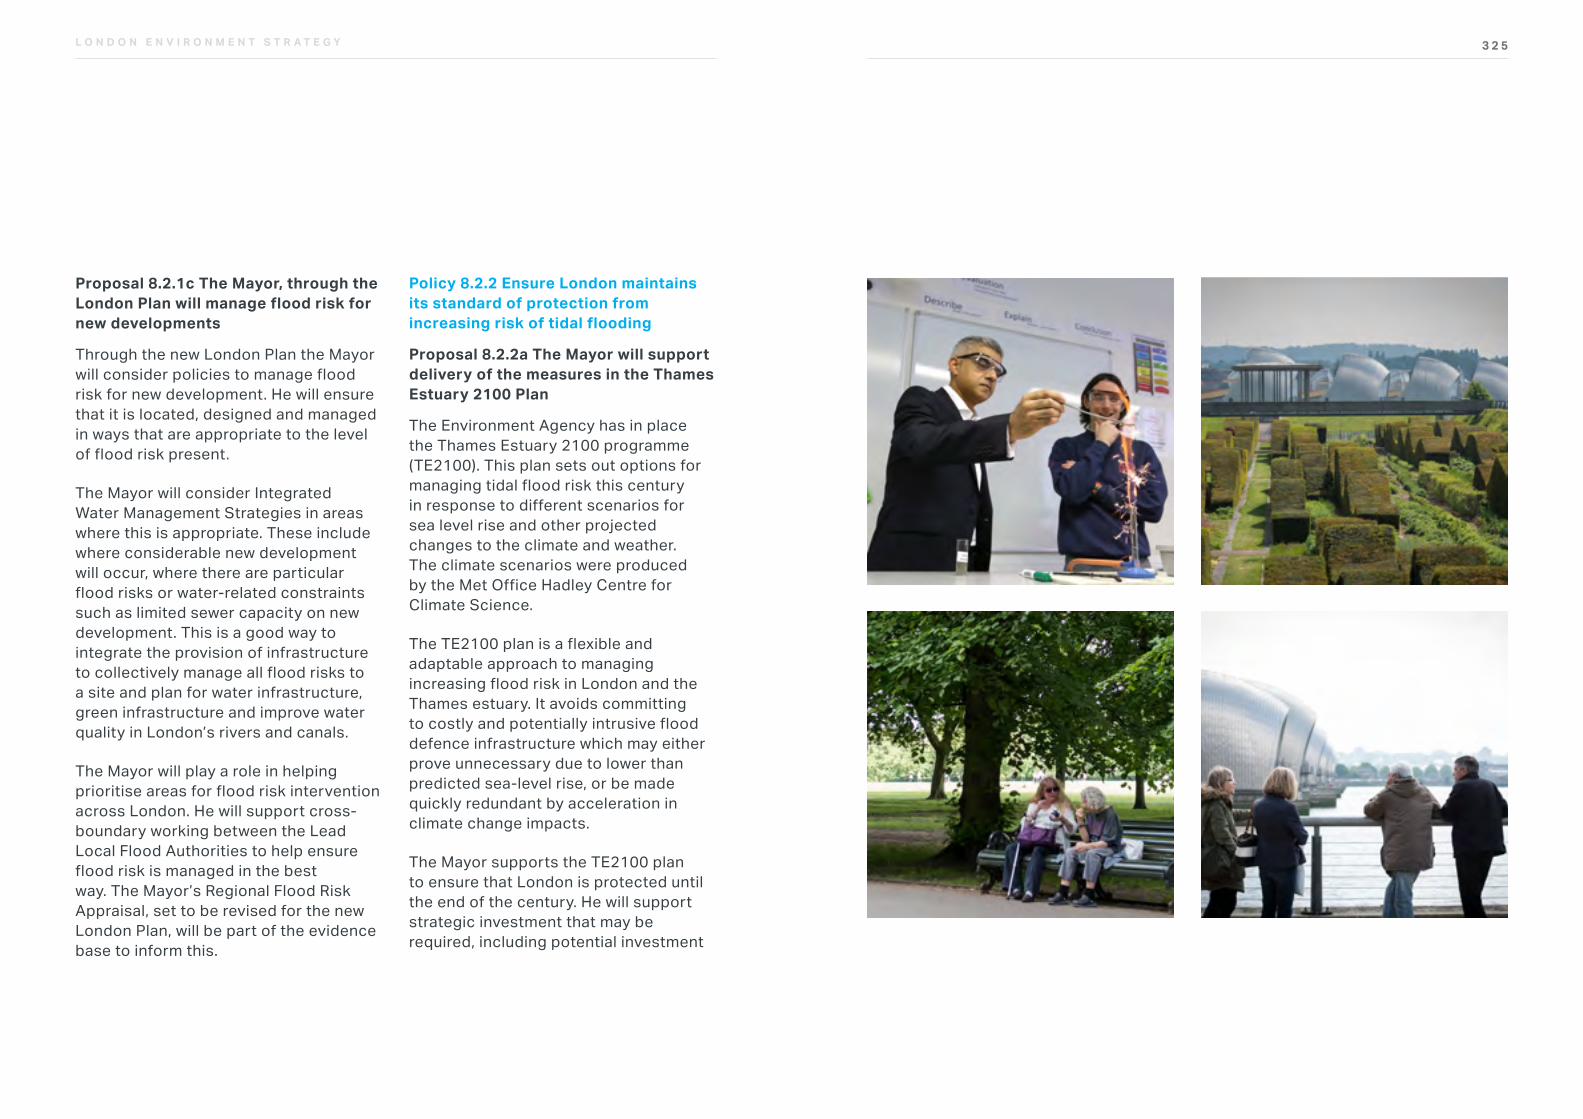
3 2 5L O N D O N E N V I R O N M E N T S T R A T E G Y
Proposal 8.2.1c The Mayor, through the London Plan will manage flood risk for new developments
Through the new London Plan the Mayor will consider policies to manage flood risk for new development. He will ensure that it is located, designed and managed in ways that are appropriate to the level of flood risk present.
The Mayor will consider Integrated Water Management Strategies in areas where this is appropriate. These include where considerable new development will occur, where there are particular flood risks or water-related constraints such as limited sewer capacity on new development. This is a good way to integrate the provision of infrastructure to collectively manage all flood risks to a site and plan for water infrastructure, green infrastructure and improve water quality in London’s rivers and canals.
The Mayor will play a role in helping prioritise areas for flood risk intervention across London. He will support cross-boundary working between the Lead Local Flood Authorities to help ensure flood risk is managed in the best way. The Mayor’s Regional Flood Risk Appraisal, set to be revised for the new London Plan, will be part of the evidence base to inform this.
Policy 8.2.2 Ensure London maintains its standard of protection from increasing risk of tidal flooding
Proposal 8.2.2a The Mayor will support delivery of the measures in the Thames Estuary 2100 Plan
The Environment Agency has in place the Thames Estuary 2100 programme (TE2100). This plan sets out options for managing tidal flood risk this century in response to different scenarios for sea level rise and other projected changes to the climate and weather. The climate scenarios were produced by the Met Office Hadley Centre for Climate Science.
The TE2100 plan is a flexible and adaptable approach to managing increasing flood risk in London and the Thames estuary. It avoids committing to costly and potentially intrusive flood defence infrastructure which may either prove unnecessary due to lower than predicted sea-level rise, or be made quickly redundant by acceleration in climate change impacts.
The Mayor supports the TE2100 plan to ensure that London is protected until the end of the century. He will support strategic investment that may be required, including potential investment
3 2 7L O N D O N E N V I R O N M E N T S T R A T E G Y
outside London. The Mayor will also look for suitable alternatives to managing fluvial flood risk in outer west London. In addition, the Mayor will work with flood risk management authorities to increase awareness of tidal flood risk.
The Mayor supports riverside strategies which meet the requirements of the TE2100 Plan and provide the required future standard of protection from tidal flood risk. This will involve several different parties including, but not limited to the GLA, the riverside boroughs, the Environment Agency and the Port of London Authority. The Mayor will coordinate these agencies and identify the most appropriate forum. This will ensure the right balance is struck between flood protection and preserving the heritage and improving the appeal of London’s riverfront.
Proposal 8.2.2b The Mayor will support the safeguarding of sites for a new Thames Barrier east of London
Through the TE2100 Plan, it is anticipated that a new Thames Barrier will be required to maintain London’s tidal flood defence to 2100 and beyond. Based on current projections this will be required by around 2070 to keep the current standard of protection. However,
this date is dependent on the rate of sea level rise, which is being monitored as part of the plan process. If a new barrier is required, detailed planning will need to start by 2050 to ensure delivery by 2070. The location for the barrier will need to be safeguarded well in advance of this. It is likely that a new barrier will be situated outside of London, but will be working to protect the city. The Mayor will work with the Environment Agency and local authorities outside of London to ensure that the best safeguarding approach is identified.
Policy 8.2.3 Increase the amount of sustainable drainage prioritising greener systems across London in new development, and also retrofit solutions
Proposal 8.2.3a Through the new London Plan, the Mayor will consider more ambitious requirements for sustainable drainage in relation to new development
Sustainable drainage systems can provide a range of benefits. These include reducing surface water flood risk, treating polluted run-off, preventing pollution from entering tributary rivers and streams and opportunities to save water through reuse.
Sustainable drainage can be ‘green’ or ‘grey.’ Green systems use natural vegetation to treat and store water. Grey systems use hard engineering such as oversized pipework or underground tanks to store water for slow release back to the drainage system once there is space available. Both types are effective. However, green systems also offer further benefits by increasing green cover and creating more pleasant landscapes and healthier, more attractive streets in London.
The current London Plan policy on sustainable drainage has been effective in increasing the amount of sustainable drainage delivered as part of new developments. However, most systems being installed are underground storage tanks. These do not provide the wider range of benefits that some other sustainable drainage options can. Also, attenuation rates and storage volumes achieved by new development are frequently lower than could be achieved. Through the new London Plan, the Mayor will consider policies that encourage green infrastructure sustainable drainage systems where possible.
“ Sustainable drainage systems can provide a range of benefits. These include reducing surface water flood risk, treating polluted run-off, preventing pollution from entering tributary rivers and streams and opportunities to save water through reuse.”
3 2 73 2 7
3 2 9L O N D O N E N V I R O N M E N T S T R A T E G Y
Proposal 8.2.3b Implement the actions in the London Sustainable Drainage Action Plan to retrofit more sustainable drainage for London
The London Sustainable Drainage Action Plan was published in December 2016. Its main focus is to enable and mainstream the retrofitting of sustainable drainage to existing buildings, land and infrastructure. A lack of funding available in this area limits opportunities for large-scale drainage improvement programme. Instead, opportunities to incorporate sustainable drainage into planned maintenance, repair or improvement works should be identified and carried out. This way sustainable drainage can be introduced at a much lower cost. These measures can save money, for example where ‘harvested’ rainwater replaces large scale water supplies used for irrigation, toilet flushing or vehicle/plant cleaning. Many of the actions are designed to be delivered by the Mayor in partnership with the Risk Management Authorities and the sector partners and focus on generating funding and opportunities for increased retrofitting of sustainable drainage.
Providing guidance and identifying funding will be the initial areas of focus for the action plan.
Proposal 8.2.3c The Mayor will consider a range of mechanisms to encourage sustainable drainage retrofit on large non-residential properties
Currently, there are limited incentives to encourage property owners to disconnect their properties from the drainage networks and manage surface water onsite using sustainable drainage which would help to reduce the pressure on drainage. Large non-residential land owners with large impermeable areas such as car parks could make a contribution to reducing surface water going into the drains. The automatic right to connect to the drainage system means water companies must accept surface water drainage, regardless of whether the local network has capacity.
In addition, we have a billing system which charges customers in London, including large commercial/non-residential customers, for disposing of their surface water based on the rateable value of the property. This has a limited relationship with the size of the site and means there is no extra incentive for larger sites to better manage their surface water. This exacerbates the problem. The current system means small sites of higher land value (for example inner city premises) may be subsidising larger (for example outer London sites) in terms of surface water drainage charges. A fairer way to pay might be charging linked to the land area
drained. This could give an incentive to use alternative ways of managing surface water drainage to keep drainage costs for large sites down.
Proportionally the biggest gains can be made for large sites that are most likely to see increases in charges. These areas are more likely to have the land area to install significant sustainable drainage features. However, any move to such a system would need to safeguard certain non-commercial sectors that occupy large sites and could be financially disadvantaged by a new charging approach. These could include certain educational establishments, community or charity facilities.
Offsetting is another mechanism that should be looked at. This would consider providing, or funding a reduction of surface water flows elsewhere in the same catchment, if not possible onsite, in exchange for a reduction in drainage charge. Other models for using offsets to encourage more sustainable approaches to drainage are being put in place internationally and may provide a model for London. This requires further investigation to establish whether these are feasible approaches to encouraging increased installation of sustainable drainage in certain sectors of the economy. The Mayor will work with Thames Water, Ofwat and other stakeholders to investigate this.
Policy 8.2.4 Work with stakeholders to improve London’s sewerage system so it is sustainable, resilient and cost effective and makes best use of innovation
Proposal 8.2.4a Through the new London Plan, the Mayor will consider a policy to support appropriate and sustainable new sewerage infrastructure. He will encourage suitable new technologies and intensify existing treatment works to help meet future needs
To accommodate growth in London, we also need to expand and further develop sewage treatment works. A number of the works have been upgraded the past ten years. Some such as Deephams sewage treatment works are currently having a major upgrade. By the middle of the century, more upgrades will be required to boost capacity at London’s sewage treatment works and meet the needs of a growing population.
Given London’s projected growth, even if the amount of surface water entering the sewage system is cut, we will still need to expand London’s sewage treatment capacity in the future. At some point in the next 20-30 years it is likely that several if not all of London’s major strategic sewage treatment works will require upgrades to increase capacity.
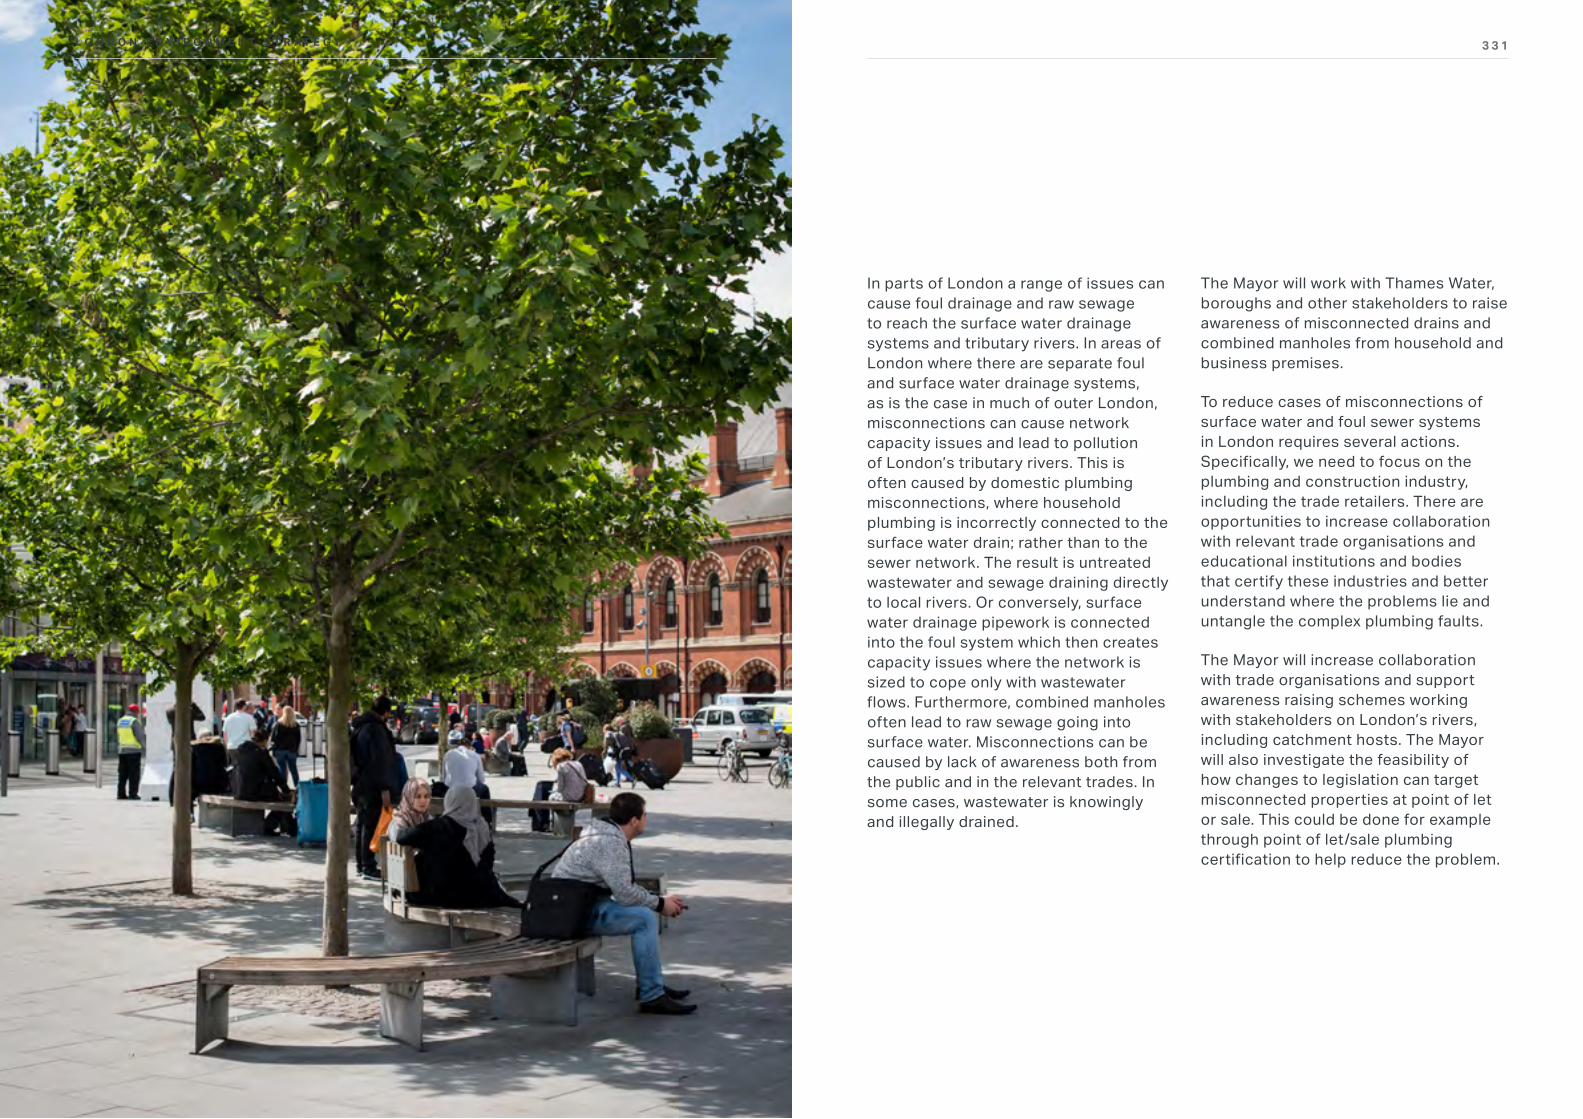
3 3 1L O N D O N E N V I R O N M E N T S T R A T E G YL O N D O N E N V I R O N M E N T S T R A T E G Y
In parts of London a range of issues can cause foul drainage and raw sewage to reach the surface water drainage systems and tributary rivers. In areas of London where there are separate foul and surface water drainage systems, as is the case in much of outer London, misconnections can cause network capacity issues and lead to pollution of London’s tributary rivers. This is often caused by domestic plumbing misconnections, where household plumbing is incorrectly connected to the surface water drain; rather than to the sewer network. The result is untreated wastewater and sewage draining directly to local rivers. Or conversely, surface water drainage pipework is connected into the foul system which then creates capacity issues where the network is sized to cope only with wastewater flows. Furthermore, combined manholes often lead to raw sewage going into surface water. Misconnections can be caused by lack of awareness both from the public and in the relevant trades. In some cases, wastewater is knowingly and illegally drained.
The Mayor will work with Thames Water, boroughs and other stakeholders to raise awareness of misconnected drains and combined manholes from household and business premises.
To reduce cases of misconnections of surface water and foul sewer systems in London requires several actions. Specifically, we need to focus on the plumbing and construction industry, including the trade retailers. There are opportunities to increase collaboration with relevant trade organisations and educational institutions and bodies that certify these industries and better understand where the problems lie and untangle the complex plumbing faults.
The Mayor will increase collaboration with trade organisations and support awareness raising schemes working with stakeholders on London’s rivers, including catchment hosts. The Mayor will also investigate the feasibility of how changes to legislation can target misconnected properties at point of let or sale. This could be done for example through point of let/sale plumbing certification to help reduce the problem.
3 3 3L O N D O N E N V I R O N M E N T S T R A T E G Y
OBJECTIVE 8.3 ENSURING EFFICIENT, SECURE, RESILIENT AND AFFORDABLE WATER SUPPLIES FOR LONDONERS
In order to ensure an efficient, secure, resilient and affordable water supply for London, water demand must be managed through water efficiency, leakage reduction and metering and increased public awareness of water usage.
London faces increasing water scarcity in future without action. Demand for water will grow with London’s growing population and climate change is predicted to increase the risk of drought. As London’s water supply is mostly drawn from the River Thames, the River Lee and groundwater from the hills around London, it is crucial that we balance the demand for more drinking water with the needs of the environment. Over abstraction, be it from groundwater or rivers, damages ecosystems by reducing flows in rivers and can impact on water quality, navigation and recreation.
In some cases controlling some level of over abstraction may be necessary during drought, but is not sustainable or cost effective in the long-term. It is therefore essential that there is a twin track approach of improving water efficiency and enhancing London’s water resources and supply network.
New mechanisms in the water market can also help London achieve an efficient, secure, resilient and affordable water supply. The retail water and wastewater market was established for non-residential customers in April 2017. Ofwat state that 1.2 million customers in England are now eligible to choose their water retailer. This is expected to bring efficiency savings through companies with multiple sites nationally being able to streamline their billing process, by dealing with a single retailer rather than multiple geographically specific water companies.
Potential water market benefits could include lower bills, helping people use less water, improved services as new offers emerge.
Potential environmental benefits include:
• an expected reduction in water use through increased water efficiency
• reduced environmental impact from abstraction through reduced use
• reduced carbon emissions from reduced water supply pumping and treatment
Policy 8.3.1 Reduce London’s water consumption and leakage rate
Proposal 8.3.1a Holding to account London’s water companies on the need to further reduce leakage rates and reduce the likelihood of major water mains bursts
Leakage from the water supply network is stubbornly high in London, Thames Water has experienced a series of major mains bursts that have resulted in major property flooding, culminating in those in Islington and Stoke Newington in late 2016. These triggered an independent forensic assessment of the mains bursts which made a series of recommendations to Thames Water on how to reduce further incidents. It is clear that additional monitoring and improved early detection is required.
“ The Mayor will expect all water companies operating in London to set out measures to reduce leakage rates and risk of major mains bursts.”
3 3 33 3 3
3 3 5L O N D O N E N V I R O N M E N T S T R A T E G Y
The Mayor will expect all water companies operating in London to set out measures to reduce leakage rates and risk of major mains bursts and regularly report progress.
Proposal 8.3.1b Work with London’s water companies to promote water metering, encouraging wise water usage and a reduction in leaks
The Mayor supports London’s water companies in increasing the number of properties that have smart water meters. Water metering ensures people are charged proportionally for the amount they use.
Water meters, especially new smart meters, can help customers better understand their water use behaviour and so contribute to reducing household consumption. Smart meters also provide customers and water companies with the ability to quickly identify leaks in their household. Thames Water estimates that up to a third of total network leakage can be attributed to leaks in the customer’s pipework. Current estimates suggest one in ten households that have a meter installed have identified a previously undetected leak. Smart meters also provide useful data for water companies to identify local network leaks.
Water pricing has a significant effect on household consumption. In Berlin, water is priced at about twice London prices and per capita household consumption is about 115 litres per person per day. Conversely, the average consumption in Milan where water is far cheaper than in London, is over 220 litres per person per day. Of course, there are climatic variations between the regions which may influence behaviour, but the relationship between the price of water and household water use is significant across many cities. Charging customers proportionally to the amount used will encourage people to use less and save money on their bills but mechanisms need to be in place to ensure ‘water poverty’ is not created.
More work needs to be done to ensure Londoners are aware of the role and benefits of smart water metering, for example, through public engagement and effective communication. Synergies between the energy smart meter programme and that of the water sector should also be explored, with view to delivering efficiencies, however there are differences in the current smart meter technologies being delivered and the sectors use different communications networks and transmitter technologies, so requires further investigation.
Proposal 8.3.1c Support delivery of water saving measures through Energy for Londoners
Domestic hot water heating accounts for approximately 25 per cent of household energy consumption. If Londoners reduce their household hot water consumption they will see an associated reduction in their energy bills. This is a significant incentive to reduce water consumption. It is likely that this is fairly well understood by the public yet there is scope to further reiterate this message as part of including water saving initiatives in Energy for Londoners.
There are marked differences in the way different communities, cultures and religions, as well as different age groups, use water. More research is needed into the scale of differences and what measures or advice/information may be appropriate to reduce water use in these specific groups or areas.
A better understanding of how effective new water efficient development measures have been is needed. The Mayor will work with relevant stakeholders to review the water efficiency performance of these developments and share lessons learnt and best practice and shape future policy.
Proposal 8.3.1d Through the new London Plan the Mayor will consider policies to require new housing development to be more water efficient
New homes will need to be more water efficient than London’s existing housing stock to minimise the increase in future demand. Specifying high water efficiency standards at the planning and development stage through strategic planning policy is an effective means of achieving more water efficient homes. Through the new London Plan, the Mayor will consider a policy that requires new developments to, as a minimum, meet 105 litres per person per day for household water consumption and encourages developers to better that standard for example incorporating water reuse systems.
3 3 7L O N D O N E N V I R O N M E N T S T R A T E G Y
Policy 8.3.2 Support the planning for a new strategic water resource appropriate for London
Proposal 8.3.2a The Mayor will support plans for a new strategic water resource to serve London and will assess whether the preferred options are appropriate for London and Londoners
The Mayor supports, in principle, the need for major new water resources for London and the south east of England, but wants to ensure the solution or solutions are acceptable to London in terms of scale, flexibility and compatibility with the Mayor’s wider priorities for London including being a zero carbon city by 2050. Thames Water is currently researching variants of four main options for a new water resource to establish which, or a combination of which will be best placed to serve London into the future. The Mayor will review Thames Water’s research, once it is available, taking into account water companies’ performance on leakage targets. The Mayor will also consider how the delivery of more local water distribution infrastructure, including new local reservoirs, mains and water treatment capacity, can play a part on securing London’s future water supply.
Defra has committed to releasing a water supply National Policy Statement which is likely to be adopted within two years. Any National Policy Statement will recommend that strategic water supply infrastructure over a given size/capacity threshold be eligible for Nationally Significant Infrastructure Project (NSIP) status and it is likely that delivery of a new strategic water resource for London would be given this status. Agreement would be through a Development Consent Order whereby the Secretary of State grants NSIP approval. It replaces the need for a conventional planning application and generally reduces the time it takes to receive approval. The Mayor will ensure that London’s interests are protected during this process.
OBJECTIVE 8.4 LONDON’S PEOPLE, INFRASTRUCTURE AND PUBLIC SERVICES ARE BETTER PREPARED FOR AND MORE RESILIENT TO EXTREME HEAT EVENTS
Extreme heat events will impact on many aspects of Londoners lives. For this reason the Mayor will take a series of actions from providing timely and accessible information for Londoners during heatwaves, planning for minimising the risk of overheating in new and existing developments and managing heat risk on London’s transport.
Policy 8.4.1 Ensure Londoners can prepare, respond to and recover from the impacts of extreme heat events in London
Proposal 8.4.1a Develop a communications protocol for Londoners in times of an extreme heat event
So that organisations are prepared for extreme heat events, the Mayor will help to develop and promote a communications plan for severe heat events to keep Londoners safe. This will involve working with the GLA group, Public Health England and the London Resilience Forum to agree on the how best to respond to an extreme heat event and build into usual emergency planning responses.
Through providing accessible and timely information Londoners should be able to reduce the impacts of extreme heat events in their homes, workplaces and on journeys around the city. Currently Londoners receive information from a number of sources and the Mayor wants to take the lead in convening the necessary partners to ensure Londoners are safeguarded.
“ Through providing accessible and timely information Londoners should be able to reduce the impacts of extreme heat events in their homes, workplaces and on journeys around the city.”
3 3 73 3 7
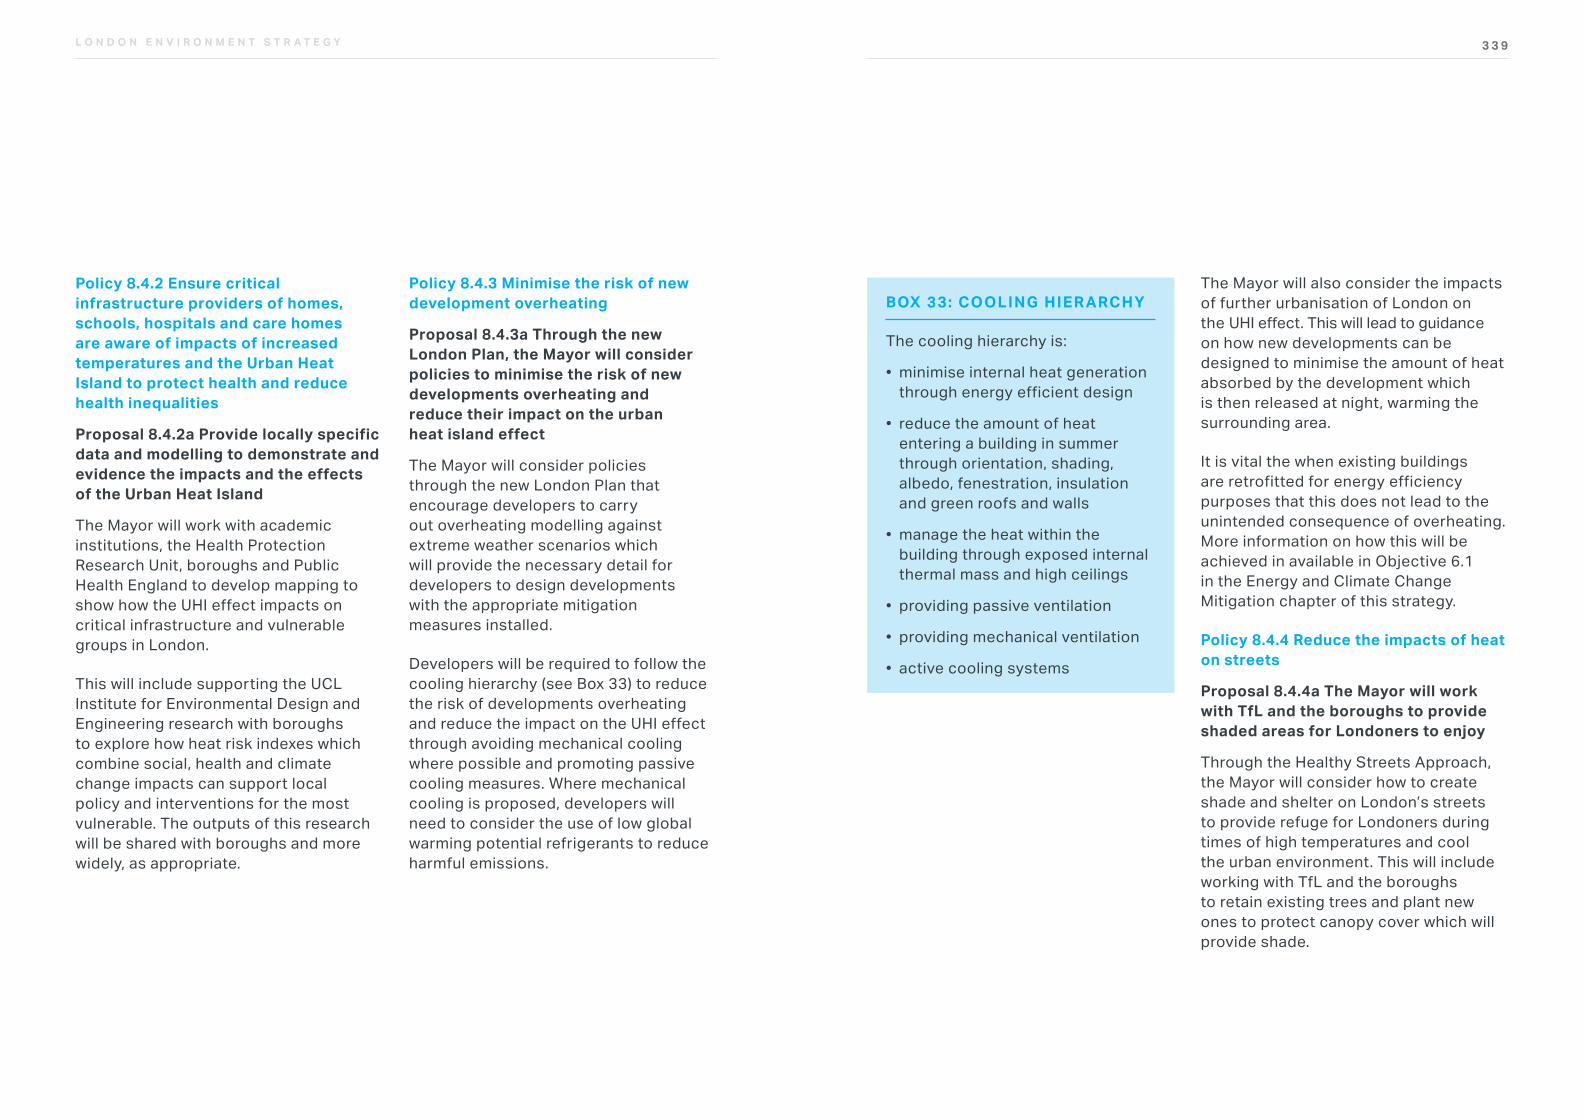
3 3 9L O N D O N E N V I R O N M E N T S T R A T E G Y
Policy 8.4.2 Ensure critical infrastructure providers of homes, schools, hospitals and care homes are aware of impacts of increased temperatures and the Urban Heat Island to protect health and reduce health inequalities
Proposal 8.4.2a Provide locally specific data and modelling to demonstrate and evidence the impacts and the effects of the Urban Heat Island
The Mayor will work with academic institutions, the Health Protection Research Unit, boroughs and Public Health England to develop mapping to show how the UHI effect impacts on critical infrastructure and vulnerable groups in London.
This will include supporting the UCL Institute for Environmental Design and Engineering research with boroughs to explore how heat risk indexes which combine social, health and climate change impacts can support local policy and interventions for the most vulnerable. The outputs of this research will be shared with boroughs and more widely, as appropriate.
Policy 8.4.3 Minimise the risk of new development overheating
Proposal 8.4.3a Through the new London Plan, the Mayor will consider policies to minimise the risk of new developments overheating and reduce their impact on the urban heat island effect
The Mayor will consider policies through the new London Plan that encourage developers to carry out overheating modelling against extreme weather scenarios which will provide the necessary detail for developers to design developments with the appropriate mitigation measures installed.
Developers will be required to follow the cooling hierarchy (see Box 33) to reduce the risk of developments overheating and reduce the impact on the UHI effect through avoiding mechanical cooling where possible and promoting passive cooling measures. Where mechanical cooling is proposed, developers will need to consider the use of low global warming potential refrigerants to reduce harmful emissions.
The Mayor will also consider the impacts of further urbanisation of London on the UHI effect. This will lead to guidance on how new developments can be designed to minimise the amount of heat absorbed by the development which is then released at night, warming the surrounding area.
It is vital the when existing buildings are retrofitted for energy efficiency purposes that this does not lead to the unintended consequence of overheating. More information on how this will be achieved in available in Objective 6.1 in the Energy and Climate Change Mitigation chapter of this strategy.
Policy 8.4.4 Reduce the impacts of heat on streets
Proposal 8.4.4a The Mayor will work with TfL and the boroughs to provide shaded areas for Londoners to enjoy
Through the Healthy Streets Approach, the Mayor will consider how to create shade and shelter on London’s streets to provide refuge for Londoners during times of high temperatures and cool the urban environment. This will include working with TfL and the boroughs to retain existing trees and plant new ones to protect canopy cover which will provide shade.
BOX 33: COOLING HIER ARCHY
The cooling hierarchy is:
• minimise internal heat generation through energy efficient design
• reduce the amount of heat entering a building in summer through orientation, shading, albedo, fenestration, insulation and green roofs and walls
• manage the heat within the building through exposed internal thermal mass and high ceilings
• providing passive ventilation
• providing mechanical ventilation
• active cooling systems
3 4 1L O N D O N E N V I R O N M E N T S T R A T E G Y
Proposal 8.4.4b The Mayor will work with TfL to put in place initiatives that will minimise heat on the underground and bus networks
The Mayor, through TfL will continue to minimise heat on the London Underground by following the cooling hierarchy detailed below:
• recycle – focus on using and optimising train regenerative braking to recycle heat rather than release it (allows trains to generate electricity to power other trains)
• resilience - map and manage heat impact on the network whilst considering future factors such as climate change
• reduce – focus on minimising energy use, for example, optimising train performance
• recover – focus on the use and optimisation of waste heat energy recovered from tunnel ventilation, station ventilation and station cooling systems. This could for example include local reuse or creating opportunities for beneficial uses such as supplying low grade waste heat to nearby district heating networks
• remove – manage the thermal environment of the network via the targeted introduction of appropriately sized cooling infrastructure (low energy and whole life cost methods prioritised.
The Mayor, through TfL will continue to take actions to cool the bus network. These include: painting bus roofs white to help reflect heat; tinted windows to reduce heat gain from solar rays and insulating buses to reduce the heat from the engine.
QCONSULTATION QUESTIONS: ADAPTING TO CLIMATE CHANGE
1. Do you think the Mayor’s policies and proposals are sufficient to increase London’s resilience to climate change?
2. Do you agree with the Mayor’s policies and proposals to make Londoners, more aware of the risks of climate change, like overheating in buildings and flooding following heavy downpours?
3. Do you agree with the Mayor’s policies and proposals to reduce water demand and leakages in London?
4. What do you see as the biggest opportunities to tackle climate change risks in London and how can the Mayor support this?
5. Please provide any further comments on the policies and programmes mentioned in this chapter.
london.gov.uk/environment-strategy
3 4 3L O N D O N E N V I R O N M E N T S T R A T E G Y
Chapter 9: Ambient noise
3 4 3
3 4 5L O N D O N E N V I R O N M E N T S T R A T E G Y
INTRODUCTION
As a world city, sound is an inevitable part of everyday life for Londoners and is part of what makes the city a vibrant and enjoyable place to be. When sound is unwanted and interferes with normal activities, such as sleep or conversation, it is classified as noise. Excessive noise, and the problems that go along with it, have long been accepted as a necessary cost of living in a successful city. But by tackling excessive noise, London can become a healthier and more pleasant place to live. This strategy examines ambient noise, which is made up of long-term predictable sources of background noise, such as traffic and industry noise, in a given location.
The impacts that noise can have on health may not be obvious, but they can be significant. There are a number of widespread adverse effects of noise, most common of which are annoyance and sleep disturbance. In cases of prolonged exposure to excessive noise, health impacts include cardiovascular and physiological effects, mental health effects, hearing impairment, reduced performance and communication and learning effects.110 The World Health Organisation (WHO) recognises environmental noise as the second largest environmental health risk in Western Europe behind air quality.
AIM Londoners’ quality of life will be improved by reducing the number of people adversely affected by noise and promoting more quiet and tranquil spaces.
L O N D O N E N V I R O N M E N T S T R A T E G Y
The WHO identifies some groups as more vulnerable to noise. This includes children, chronically ill people, older people, and shift workers. In addition, the less affluent who cannot afford to live in quiet residential areas or to adequately insulate their homes, are likely to suffer disproportionately.111 Despite this link, no London-based research has been completed to consider how noise impacts vulnerable groups.
Tackling the adverse impacts of ambient noise in London requires the following actions:
• Reducing the adverse impacts of noise from transport and non-transport sources
• Promoting good acoustic design and quiet and tranquil spaces, giving people respite from the noise of everyday city life.
LONDON’S ENVIRONMENT NOW
As London’s population grows, the consideration of ambient noise and how it is managed across the city will become increasingly important. The
work by the WHO to highlight the health implications of noise has gone a long way to bring noise into the spotlight, but there is still limited availability of noise data for London. Complaints are typically collected at the local area level, while much other data and research is completed at the UK or EU level. Although this provides valuable insight, it does leave room to improve the evidence base for London.
The key evidence to support the Mayor’s ambitions for ambient noise in London is summarised below. You can find out more about the evidence behind the policies and proposals in Appendix 2.
For details on the legislative and policy background see Appendix 4, and for information on the main responsibilities of various organisations see Appendix 3.
Road traffic noiseThe social cost of noise pollution in England from road traffic alone is estimated to be between £7bn and £10bn per year.112 Due to the extensive road network spread across the city, road traffic is the largest single cause of noise pollution in London.
110 Health Protection Agency (2010), Environmental Noise and Health in the UK111 World Health Organisation (n.d.), Noise: Data and statistics. Accessed from: www.euro.who.int/en/health-topics/environment-and-health/noise/data-and-statistics
112 Defra (2013), Protecting and enhancing our urban and natural environment to improve public health and wellbeing. Accessed from: http://webarchive.nationalarchives.gov.uk/20130822084033/https:/www.gov.uk/government/policies/protecting-and-enhancing-our-urban-and-natural-environment-to-improve-public-health-and-wellbeing/supporting-pages/international-european-and-national-standards-for-air-quality
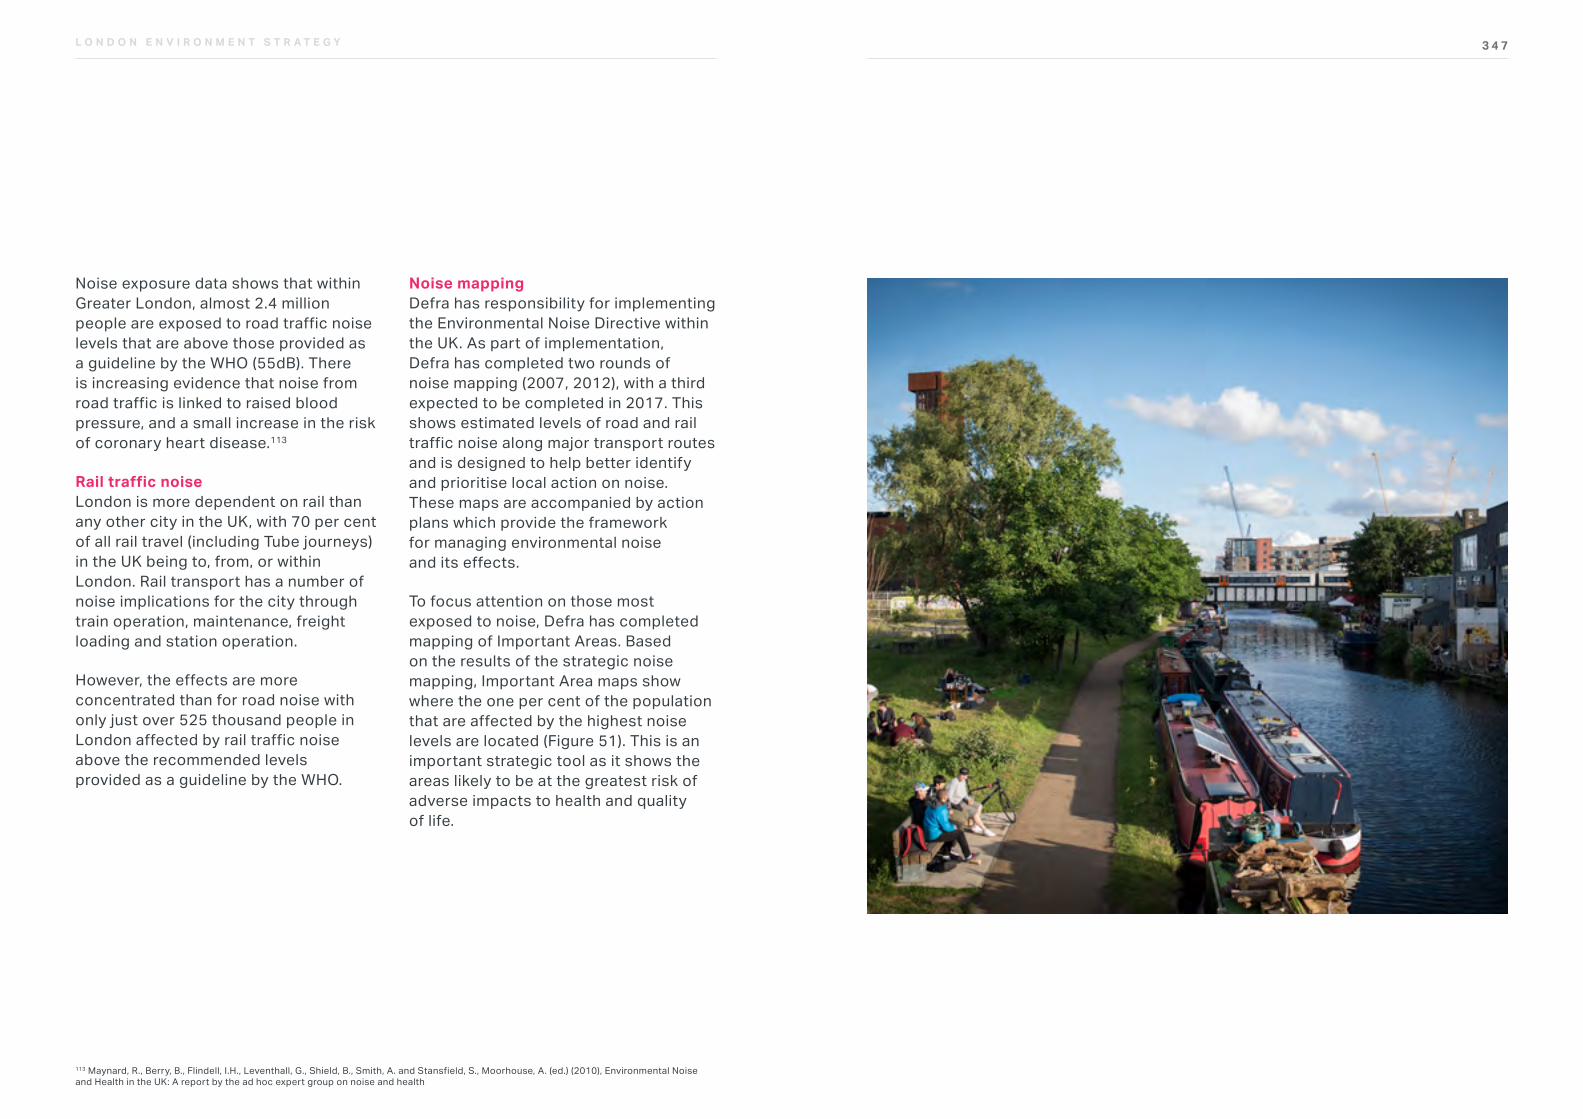
3 4 7L O N D O N E N V I R O N M E N T S T R A T E G Y
Noise exposure data shows that within Greater London, almost 2.4 million people are exposed to road traffic noise levels that are above those provided as a guideline by the WHO (55dB). There is increasing evidence that noise from road traffic is linked to raised blood pressure, and a small increase in the risk of coronary heart disease.113
Rail traffic noiseLondon is more dependent on rail than any other city in the UK, with 70 per cent of all rail travel (including Tube journeys) in the UK being to, from, or within London. Rail transport has a number of noise implications for the city through train operation, maintenance, freight loading and station operation.
However, the effects are more concentrated than for road noise with only just over 525 thousand people in London affected by rail traffic noise above the recommended levels provided as a guideline by the WHO.
Noise mappingDefra has responsibility for implementing the Environmental Noise Directive within the UK. As part of implementation, Defra has completed two rounds of noise mapping (2007, 2012), with a third expected to be completed in 2017. This shows estimated levels of road and rail traffic noise along major transport routes and is designed to help better identify and prioritise local action on noise. These maps are accompanied by action plans which provide the framework for managing environmental noise and its effects.
To focus attention on those most exposed to noise, Defra has completed mapping of Important Areas. Based on the results of the strategic noise mapping, Important Area maps show where the one per cent of the population that are affected by the highest noise levels are located (Figure 51). This is an important strategic tool as it shows the areas likely to be at the greatest risk of adverse impacts to health and quality of life.
113 Maynard, R., Berry, B., Flindell, I.H., Leventhall, G., Shield, B., Smith, A. and Stansfield, S., Moorhouse, A. (ed.) (2010), Environmental Noise and Health in the UK: A report by the ad hoc expert group on noise and health
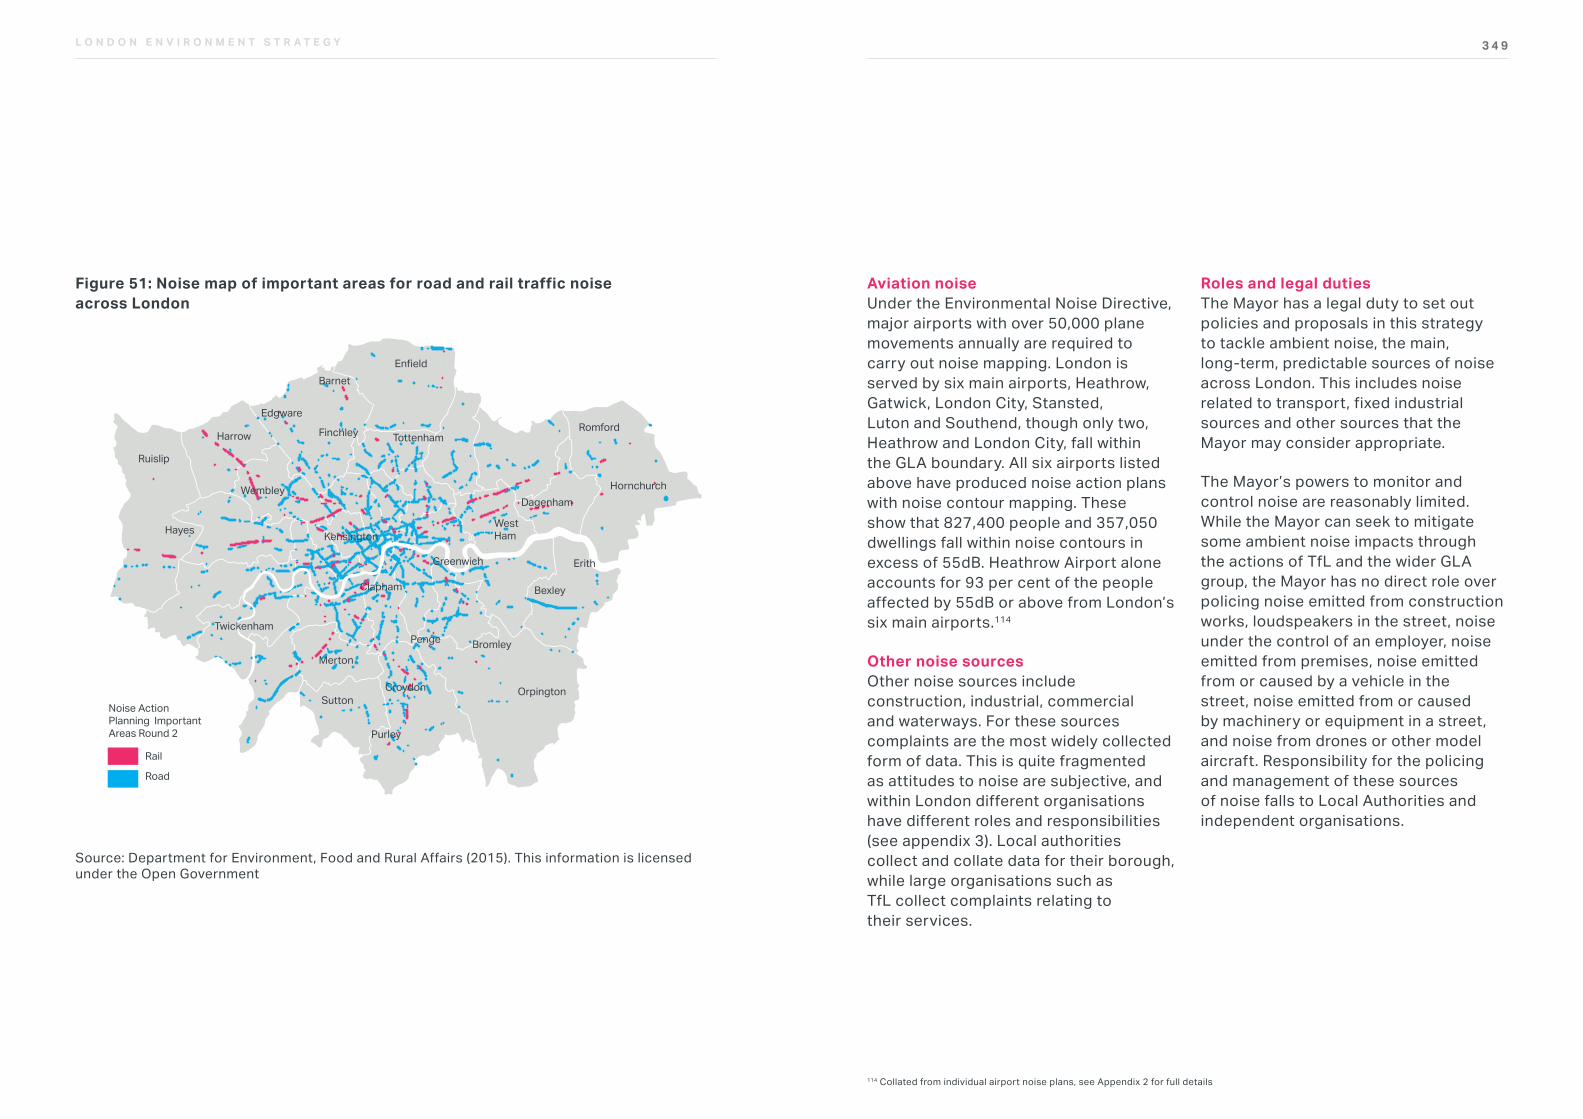
3 4 9L O N D O N E N V I R O N M E N T S T R A T E G Y
Figure 51: Noise map of important areas for road and rail traffic noise across London
Noise ActionPlanning ImportantAreas Round 2
Rail
Road
Ruislip
Harrow
Edgware
Finchley
Barnet
Tottenham
En�eld
Hornchurch
Romford
Dagenham
WestHam
Bexley
Erith
Orpington
BromleyPenge
Croydon
Purley
Sutton
Merton
Twickenham
Wembley
Hayes
Greenwich
Clapham
Kensington
Fig 1: Noise Action Planning Important Areas Round 2
TYPE OF GRAPH: NOISE
Reference
Source: Department for Environment, Food and Rural Affairs (2015). This information is licensed under the Open GovernmentLicence v3.0. To view this licence, visit nationalarchives.gov.uk/doc/open-government-licence/Source: Department for Environment, Food and Rural Affairs (2015). This information is licensed under the Open Government
Aviation noiseUnder the Environmental Noise Directive, major airports with over 50,000 plane movements annually are required to carry out noise mapping. London is served by six main airports, Heathrow, Gatwick, London City, Stansted, Luton and Southend, though only two, Heathrow and London City, fall within the GLA boundary. All six airports listed above have produced noise action plans with noise contour mapping. These show that 827,400 people and 357,050 dwellings fall within noise contours in excess of 55dB. Heathrow Airport alone accounts for 93 per cent of the people affected by 55dB or above from London’s six main airports.114
Other noise sourcesOther noise sources include construction, industrial, commercial and waterways. For these sources complaints are the most widely collected form of data. This is quite fragmented as attitudes to noise are subjective, and within London different organisations have different roles and responsibilities (see appendix 3). Local authorities collect and collate data for their borough, while large organisations such as TfL collect complaints relating to their services.
Roles and legal dutiesThe Mayor has a legal duty to set out policies and proposals in this strategy to tackle ambient noise, the main, long-term, predictable sources of noise across London. This includes noise related to transport, fixed industrial sources and other sources that the Mayor may consider appropriate.
The Mayor’s powers to monitor and control noise are reasonably limited. While the Mayor can seek to mitigate some ambient noise impacts through the actions of TfL and the wider GLA group, the Mayor has no direct role over policing noise emitted from construction works, loudspeakers in the street, noise under the control of an employer, noise emitted from premises, noise emitted from or caused by a vehicle in the street, noise emitted from or caused by machinery or equipment in a street, and noise from drones or other model aircraft. Responsibility for the policing and management of these sources of noise falls to Local Authorities and independent organisations.
114 Collated from individual airport noise plans, see Appendix 2 for full details
3 5 1L O N D O N E N V I R O N M E N T S T R A T E G Y
OBJECTIVE 9.1 REDUCING THE ADVERSE IMPACTS OF NOISE BY TARGETING LOCATIONS WITH THE HIGHEST NOISE POLLUTION FROM TRANSPORT
Many people live in areas where noise levels exceed the guidelines set by the WHO. In the UK, 55 per cent of the population live in dwellings where the recommended maximum daytime sound level is exceeded, and 67 per cent live in places where noise exceeds the night-time recommended maximum.115
As road transport is the biggest source of noise pollution for London the Mayor will:
• encourage mode shift to reduce car use in favour of more sustainable models of travel such as walking, cycling and public transport.
• promote quieter, low emission vehicles and road surfaces
• reduce noise from freight activity through the consolidation of services.
Noise from other transport sources, especially aviation, are also an issue in London. The Mayor will work with stakeholders to reduce the impacts of noise from aviation, rail and river activities.
Policy 9.1.1 Minimise the adverse impacts of noise from London’s road transport network
Proposal 9.1.1a The Mayor will work with TfL to encourage mode shift to reduce road traffic
The draft Mayor’s Transport Strategy sets out a strong ambition to reduce car use in favour of more sustainable, quieter and space efficient modes of travel. Streets make up 80 per cent of London’s public space, so reducing the impact of road traffic noise has the potential to dramatically improve the experience of living, working and spending time in the city.
London’s streets are already some of the most congested in the world. In cities and urban areas, most vehicle noise comes from the engine. This dominates over noise generated by tyres and road surfaces at lower vehicle speeds. Therefore, the best way to reduce the amount of noise generated by road traffic is to reduce traffic volumes.
The draft Mayor’s Transport strategy aims to increase the number of trips made by walking, cycling and public transport from 64 per cent today to 80 per cent by 2041. This will reduce overall road traffic and have positive implications for road noise levels across London.
Objectives, policies and proposals
115 National Noise incidence survey (NIS) a Defra funded study run in 2000/2001, cited in Environmental Noise and Health in the UK, July 2010
Proposal 9.1.1b The Mayor will work with TfL to encourage the transition to zero emission vehicles
The Mayor wants to make London’s transport network zero emission by 2050. This will be achieved by changing London’s streets and transport infrastructure to enable zero emission transport, and support the accelerated uptake of ultra low and zero emission technologies, such as electric and hydrogen vehicles. These vehicles have lower noise emissions, with limited engine noise when operating in electric mode. As a result, they offer a quieter and cleaner alternative for motorised traffic that remains.
You can find out more about the Mayor’s vision for a zero emission transport network in the Chapter 4 of this strategy.
Proposal 9.1.1c The Mayor will work with key stakeholders to reduce noise from freight activity in London
In the draft Mayor’s Transport Strategy, the Mayor is encouraging the overall reduction of freight and lorry traffic by consolidating services and by improving the use of consolidation and distribution centres. Freight vehicles account for about one fifth of traffic in London. This can be reduced by encouraging more freight to move onto the rail and river network, and to allow non-London freight to avoid passing through London.
“ The Mayor wants to make London’s transport network zero emission by 2050.”
3 5 13 5 13 5 13 5 1
3 5 3L O N D O N E N V I R O N M E N T S T R A T E G Y
Freight is essential to the local economy and services that a growing city requires. But, as the city grows, commercial activity must become more responsible and efficient to avoid a negative impact on residents. Re-timing deliveries and collections and managing noise impacts via responsible practices and behaviours can move trips from busy to quieter times. However, a large amount of freight is generated around goods and services for residents who want it delivered at a time and place that suits them. Therefore, influencing changes in consumer behaviour would have a big impact.
Mitigating noise impacts through responsible practices and behaviours can reduce disturbance. This can be done by using better vehicles and quieter equipment, as well as raising awareness through training and publicity for both those making and receiving deliveries. TfL will be publishing best practice guidance on noise mitigation for freight operators later this year.
Collaborative working between businesses, fleet operators and local authorities is essential in managing local issues. As technology advances and better equipment becomes available, the Mayor will encourage boroughs to review noise management and enforcement. This includes the London Lorry Control Scheme, which controls the movement
of heavy goods vehicles at night and at weekends, and promoting good practice in the design of buildings and loading facilities.
Proposal 9.1.1d The Mayor will work with TfL to encourage quieter driving styles and provide low noise road surfaces
The use of low noise road surfaces is a proposal within the draft Mayor’s Transport Strategy and further information will be provided through Local Implementation Plan (LIP) Guidance. Low noise road surfaces offer considerable potential to cut road noise and have the advantage of bringing immediate benefits. TfL currently uses materials on its network, which, by default, provide noise absorption. However, it will investigate lower noise materials that are specifically designed for noise absorption.
Driving at lower speeds and avoiding high acceleration will result in lower engine noise and a significant drop in overall road traffic noise when adopted on a wide scale. Less aggressive driving styles are thought to decrease noise by 1-5 dB(A) for cars and heavy commercial vehicles, and as much at 7dB(A) for motorcycles. As a result, influencing how vehicles are driven, towards more passive styles, can have major benefits in reducing noise.
Driving styles can be influenced by putting in place and policing lower speed limits, greater compliance with speed limits, and via training and enforcing best practice. The responsibility of driver testing and certification of driving instructors falls to the Driver and Vehicle Standards Agency. The Mayor and TfL are developing a London Standard for motorcycle training and will support driver recognition schemes to encourage best practice.
Policy 9.1.2 Minimise the adverse impacts of noise from non-road transport
Proposal 9.1.2a The Mayor will work with TfL to monitor and manage the noise impacts of Tube and rail services, especially the Night Tube and other night time TfL rail services
London’s night-time economy and cultural scene require a comprehensive, integrated night-time public transport service. More than 200,000 people use the Night Tube services each weekend. This is expected to increase as the service extends to other parts of the network.
To minimise noise from increased operations, TfL has been working to reduce noise from the tracks through increased investment in renewal and maintenance programmes. In addition, it has worked to decrease noise from late-night station operation.
Proposal 9.1.2b The Mayor will work with TfL to ensure new rail infrastructure uses technology that is effective at reducing noise
London is more dependent on rail than any other city in the UK. Within the UK, 70 per cent of all rail travel is to, from and within London. The Mayor, through TfL, and by working with Network Rail and train operating companies, plans to tackle crowding and enable mode shift by increasing the capacity of rail based services across London by at least 80 per cent by 2041. This will require the development of new lines and services which add further to rail noise across London. The draft Mayor’s Transport Strategy sets out proposals to mitigate noise from rail services.
In addition to TfL, there are a number of other responsible bodies for rail service within London. The Mayor will seek to work with Network Rail and train operating companies to mitigate, where reasonably practicable, the effects of noise caused by these services. The Mayor requires noise issues to be addressed as part of all planned railway works and for steps to be taken that minimise the impact of works on neighbours. The Mayor wants suburban rail services to be devolved. This will help ensure integration of the provision of services and a more consistent experience for customers.
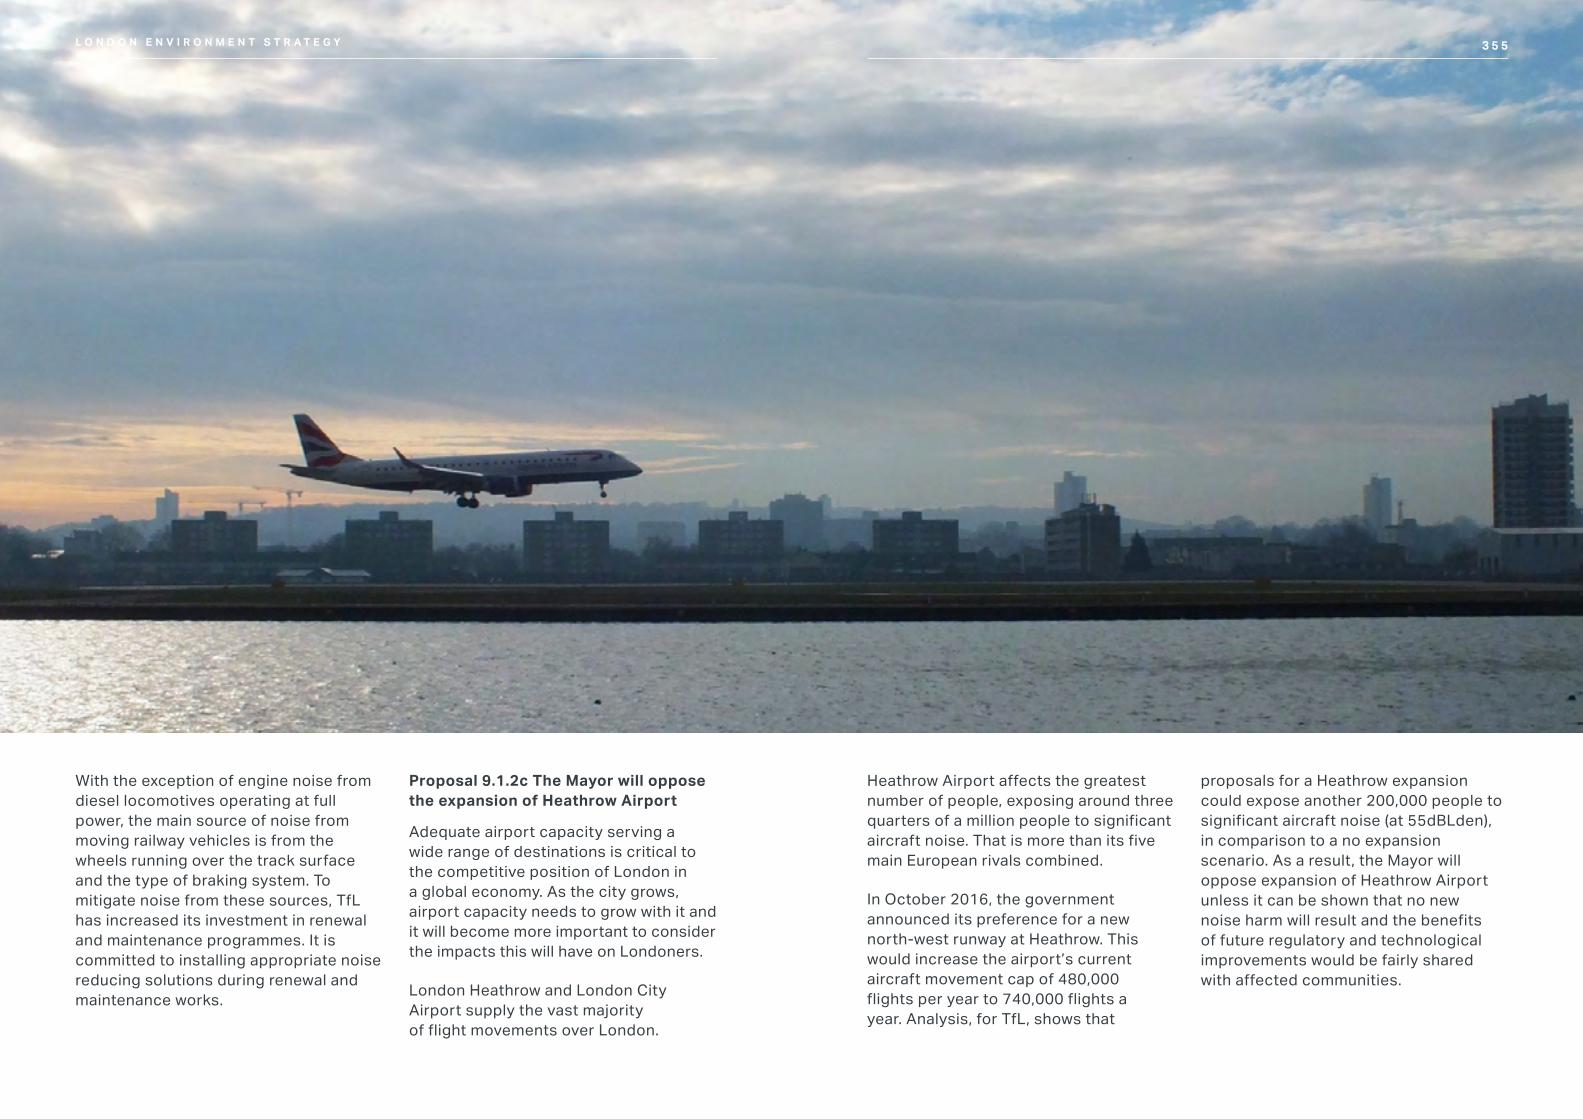
3 5 5L O N D O N E N V I R O N M E N T S T R A T E G Y
With the exception of engine noise from diesel locomotives operating at full power, the main source of noise from moving railway vehicles is from the wheels running over the track surface and the type of braking system. To mitigate noise from these sources, TfL has increased its investment in renewal and maintenance programmes. It is committed to installing appropriate noise reducing solutions during renewal and maintenance works.
Proposal 9.1.2c The Mayor will oppose the expansion of Heathrow Airport
Adequate airport capacity serving a wide range of destinations is critical to the competitive position of London in a global economy. As the city grows, airport capacity needs to grow with it and it will become more important to consider the impacts this will have on Londoners.
London Heathrow and London City Airport supply the vast majority of flight movements over London.
3 5 5L O N D O N E N V I R O N M E N T S T R A T E G Y
Heathrow Airport affects the greatest number of people, exposing around three quarters of a million people to significant aircraft noise. That is more than its five main European rivals combined.
In October 2016, the government announced its preference for a new north-west runway at Heathrow. This would increase the airport’s current aircraft movement cap of 480,000 flights per year to 740,000 flights a year. Analysis, for TfL, shows that
proposals for a Heathrow expansion could expose another 200,000 people to significant aircraft noise (at 55dBLden), in comparison to a no expansion scenario. As a result, the Mayor will oppose expansion of Heathrow Airport unless it can be shown that no new noise harm will result and the benefits of future regulatory and technological improvements would be fairly shared with affected communities.
3 5 7L O N D O N E N V I R O N M E N T S T R A T E G Y
The Mayor responded to the Department for Transport (DfT) consultation on the Draft National Policy Statement in May 2017 to oppose the expansion of Heathrow Airport in light of the potential increase in noise.
The impacts of expansion of Heathrow Airport on air quality and greenhouse emissions are covered in Chapter 4.
Proposal 9.1.2d The Mayor will lobby to reduce helicopter noise exposure for Londoners
Noise from helicopter flights can be a particular source of annoyance for Londoners. The problem is compounded by an outdated regulatory regime which is very limited in the restrictions it places on the number of helicopters and the routes they can fly. The Mayor is lobbying for the Civil Aviation Authority and government to review and amend the regime to ensure reduced helicopter noise exposure for Londoners.
Proposal 9.1.2e The Mayor will continue to lobby to minimise the adverse impacts of noise from aviation
The effects of noise from aircraft, particularly at night, cause significant impacts on the health and quality of life of Londoners. Aircraft, while quieter than in the past, are still very noisy and generate a great deal of nuisance for those living under flight paths. The industry needs to be held to account for its noise impacts, and the concerns of local communities must be properly addressed. To minimise the adverse impacts of noise from aviation, the Mayor has, and will continue to lobby for:
• Reduced night flights from airports that may affect London residents
• Modernisation of airspace, in particular for changes that seek to encourage more efficient flight operations
• The establishment of an independent noise regulator with powers of sanction
The full responses to all the aviation consultations to date can be found at https://tfl.gov.uk/corporate/publications-and-reports/aviation.
116 Aecom (2013), Survey of Noise Attitudes (SoNA) 2013 – Prepared for: Defra. Accessed from: http://randd.defra.gov.uk/Document.aspx?Document=13319_NANR322SoNA2013ReportFinalNov2015.pdf
Proposal 9.1.2f The Mayor will work with the Thames and London Waterways Forum on a range of options to help address noise arising from waterway use
River services are an integral part of London’s public transport system and will play a greater role in supporting growth. In recent years, there have been strategic efforts to increase the use of the river and waterways network for passenger services, freight and waste. In the longer term, any significant increase in river traffic could generate more noise both on and alongside the river.
The Survey of Noise Attitudes (SoNA) 2013 found that 95 per cent of survey respondents across England could not hear noise from sea, river or canal.116 This made noise from water sources the least disruptive of those reported within SoNA. While noise from waterways is not currently considered an issue, the Mayor will continue to work with relevant parties, like the Port of London Authority, through the Thames and London Waterways Forum. This forum centralises all waterway discussions and brings all
key stakeholders together to deliver the goals set out in this strategy, the draft Mayor’s Transport Strategy and the London Plan. It will work to collectively gather and review available evidence. This will be used as the foundation to address observed or potential noise issues. It will also guide growth in waterway use in a way that avoids excessive increases in noise complaints.
Policy 9.1.3 Minimise the adverse impacts of noise from non-transport sources
Proposal 9.1.3a The Mayor will provide guidance on appropriate noise mitigation measures for commercial and industrial premises
Guidance on appropriate noise mitigation measures for commercial and industrial premises can be found in Supplementary Planning Guidance (SPG). This sets out the layout, design and management practices that developers should follow to reduce noise from these sites. This guidance will be kept under review to ensure that it is mitigating noise from these premises in the long-term. The Mayor will minimise adverse noise impacts on local residents from construction on large and long-term building sites.
3 5 9L O N D O N E N V I R O N M E N T S T R A T E G Y
The Mayor will establish best practice guidance for noise produced by construction and demolition, and advice on noise management of construction activity.
Construction and demolition sites, including roadworks, can greatly contribute to noise levels if they are not well managed. Given how long some of these projects last and the number of projects that can happen in an area at once, this can have serious negative impacts on local businesses and residents. Improved strategic management, technology and communication can be used to reduce the negative impacts of noise on those nearby.
Construction is generally policed by Local Authority Environmental Health teams. However, given construction is so widespread across London, it is important to ensure that steps are taken to minimise its impact. Building sites are all unique and their noise strategies should reflect this. Each site needs to take into consideration surrounding land uses, existing day time noise and the methods of construction/demolition.
“ The Mayor will help to minimise adverse noise impacts on local residents from construction on large and long-term building sites.”
L O N D O N E N V I R O N M E N T S T R A T E G Y
BOX 34: MOVING NOISE SOURCES
The powers provided to the Mayor through the GLA Act 1999, and to the boroughs through the Environmental Protection Act 1990 are designed to combat static sources of noise. However, in many cases, it is the unexpected sources of noise which are most disruptive, whether music from a passing car, a party boat on the River Thames or emergency sirens.
Moving noise sources are much harder to police as responding to complaints usually results in action when it is too late, with the source of noise having moved to a new location or abated. In some cities, noise powers have been extended to cover some moveable sources of noise. For example, in New York City, the Noise Code specifically restricts the volume of car stereos.
While the Mayor currently does not have provision for the policing of moving sources of noise, the Mayor will investigate how this is legislated elsewhere and what powers may be required to control moving noise sources within London.
117 http://content.tfl.gov.uk/lane-rental-benefits-report-november-2016.pdf
TfL is working with boroughs to reduce the number of trips in peak time and encourage the wider use of quiet deliveries through cleaner vehicles, and foot and cycle deliveries.
Proposal 9.1.3b The Mayor will encourage better planning and integration of road works
The Mayor will continue to encourage best practice in roadworks through the Code of Conduct for Roadworks.
Roadworks are vital to providing essential utility services and enabling much needed development and improvements to public space. However, they also cause significant delay and disruption to the road network and frustration to road users and nearby residents. It is important to ensure that roadworks are consolidated where appropriate and completed in the most efficient manner to limit their impact.
The Mayor, through TfL, incentivises the quick completion of roadworks in traffic sensitive areas through the Lane Rental scheme which applies a daily charge for occupation of the most traffic sensitive streets at traffic sensitive times.117 In addition, it supports the London Permit scheme which is designed to allow boroughs to coordinate roadworks by different companies and minimise the amount of times the same area is dug up.
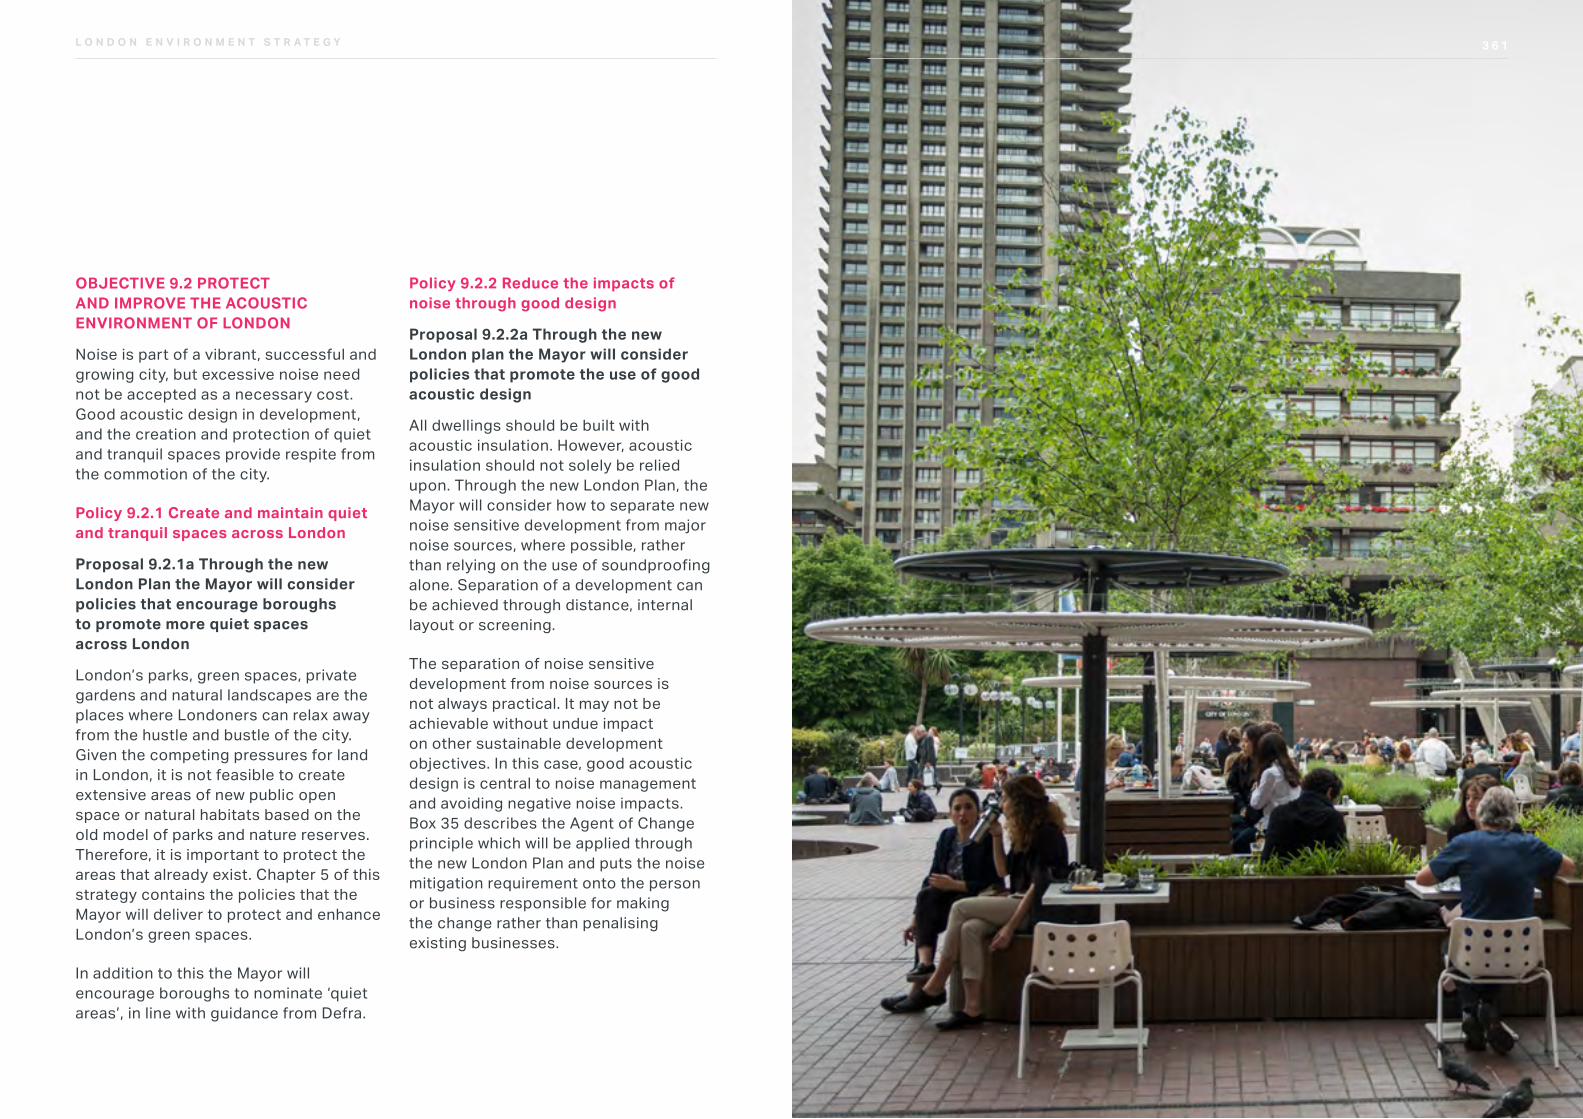
3 6 1L O N D O N E N V I R O N M E N T S T R A T E G Y
OBJECTIVE 9.2 PROTECT AND IMPROVE THE ACOUSTIC ENVIRONMENT OF LONDON
Noise is part of a vibrant, successful and growing city, but excessive noise need not be accepted as a necessary cost. Good acoustic design in development, and the creation and protection of quiet and tranquil spaces provide respite from the commotion of the city.
Policy 9.2.1 Create and maintain quiet and tranquil spaces across London
Proposal 9.2.1a Through the new London Plan the Mayor will consider policies that encourage boroughs to promote more quiet spaces across London
London’s parks, green spaces, private gardens and natural landscapes are the places where Londoners can relax away from the hustle and bustle of the city. Given the competing pressures for land in London, it is not feasible to create extensive areas of new public open space or natural habitats based on the old model of parks and nature reserves. Therefore, it is important to protect the areas that already exist. Chapter 5 of this strategy contains the policies that the Mayor will deliver to protect and enhance London’s green spaces.
In addition to this the Mayor will encourage boroughs to nominate ‘quiet areas’, in line with guidance from Defra.
Policy 9.2.2 Reduce the impacts of noise through good design
Proposal 9.2.2a Through the new London plan the Mayor will consider policies that promote the use of good acoustic design
All dwellings should be built with acoustic insulation. However, acoustic insulation should not solely be relied upon. Through the new London Plan, the Mayor will consider how to separate new noise sensitive development from major noise sources, where possible, rather than relying on the use of soundproofing alone. Separation of a development can be achieved through distance, internal layout or screening.
The separation of noise sensitive development from noise sources is not always practical. It may not be achievable without undue impact on other sustainable development objectives. In this case, good acoustic design is central to noise management and avoiding negative noise impacts. Box 35 describes the Agent of Change principle which will be applied through the new London Plan and puts the noise mitigation requirement onto the person or business responsible for making the change rather than penalising existing businesses.
3 6 1
3 6 3L O N D O N E N V I R O N M E N T S T R A T E G Y
Good acoustic design not only applies to individual buildings; it also applies to how the city runs. As the night time economy grows (see Box 36), it is important to understand and mitigate the noise of people coming and going between venues. In areas with a strong night time economy, quick and quiet exit routes for customers must be considered. These must take people quickly to transport stops and help direct them away from quieter residential areas.
Noise management includes promoting good acoustic design in development whenever opportunities arise. This can be via traditional and innovative noise reduction measures as well as deliberately introducing sounds to enhance the soundscape and mitigate unwanted noise.
It is preferable to avoid the adverse impacts of noise by distancing dwellings and sensitive uses from noise sources. However, the density of the city is making this increasingly difficult to achieve. Sustaining and protecting businesses that add to the vitality of the city, such as theatres, concert halls, pubs and live music venues, requires a sensitive approach to managing change in surrounding areas. Policies are required that reconcile the competing needs of noise mitigation with housing pressures and the need to maintain London as a vibrant and interesting city.
The National Planning Policy Framework states that planning policies and decisions should aim to avoid placing unreasonable
restrictions on existing businesses. Within London, this will be considered through the Agent of Change principle.
Agent of Change refers to the principle that the person or business responsible for the change is responsible for managing the impact of the change. In April 2017, the Mayor consulted on the draft Culture and Night Time Economy Supplementary Planning Guidance (SPG). This provides guidance on this principle to ensure that existing planning policy is used as effectively as possible. The government is consulting on amending the National Planning Policy Framework (NPPF) to strengthen these protections. The Mayor also aims to introduce Agent of Change in the new London Plan.
BOX 35: THE AGENT OF CHANGE PRINCIPLE“ Good acoustic design not only applies to individual buildings; it also applies to how the city runs.”
L O N D O N E N V I R O N M E N T S T R A T E G Y
3 6 5L O N D O N E N V I R O N M E N T S T R A T E G Y
QCONSULTATION QUESTIONS: AMBIENT NOISE
1. Are there any other actions you think the Mayor should be taking to work with the boroughs and other key stakeholders to reduce noise?
2. Do you think that the boroughs and the Mayor have sufficient powers to manage noise across London? If not, what additional powers are required and which organisation should hold them?
3. Do you agree with the Mayor’s policies and proposals to improve Londoners’ awareness of the health risks of noise?
4. Please provide any further comments on the policies and programmes mentioned in this chapter.
london.gov.uk/environment-strategy
London has reportedly lost almost a third of its night clubs and live music venues, some 35 per cent of its grassroots music venues and 50 per cent of its night clubs since 2007. The draft Culture and Night Time Economy Supplementary Planning Guidance encourages boroughs to sustain existing venues. It also encourages them to provide new facilities to protect against the unnecessary loss of valued social, recreational and cultural facilities and services.
To reconcile the competing needs of noise mitigation with a growing night time economy, the Mayor will investigate how to support and enhance the night time economy in the London Plan. This may include encouraging boroughs to consider the cumulative impacts of high concentrations of night time activities on noise pollution for residents.
Housing proposed near existing cultural venues should include necessary acoustic design measures
to ensure residential units have sound insulation to mitigate noise impacts. Since April 2016, developers are required to seek prior approval from the local planning authority to change a use from office to residential under permitted development rights. This means local planning authorities must take account of national planning policy and guidance on noise, in a similar way to a planning application. It is also a way to raise any material concerns by owners of music venues in relation to noise. This will help ensure that before residents move into new housing near to well-established businesses, appropriate noise mitigation measures will be put in.
Likewise, prospective residents should have means to stay informed of nearby businesses and activities that create night time noise. This can be achieved by attaching informatives - extra information to the documentation for new residential planning permissions.
BOX 36: THE NIGHT TIME ECONOMY
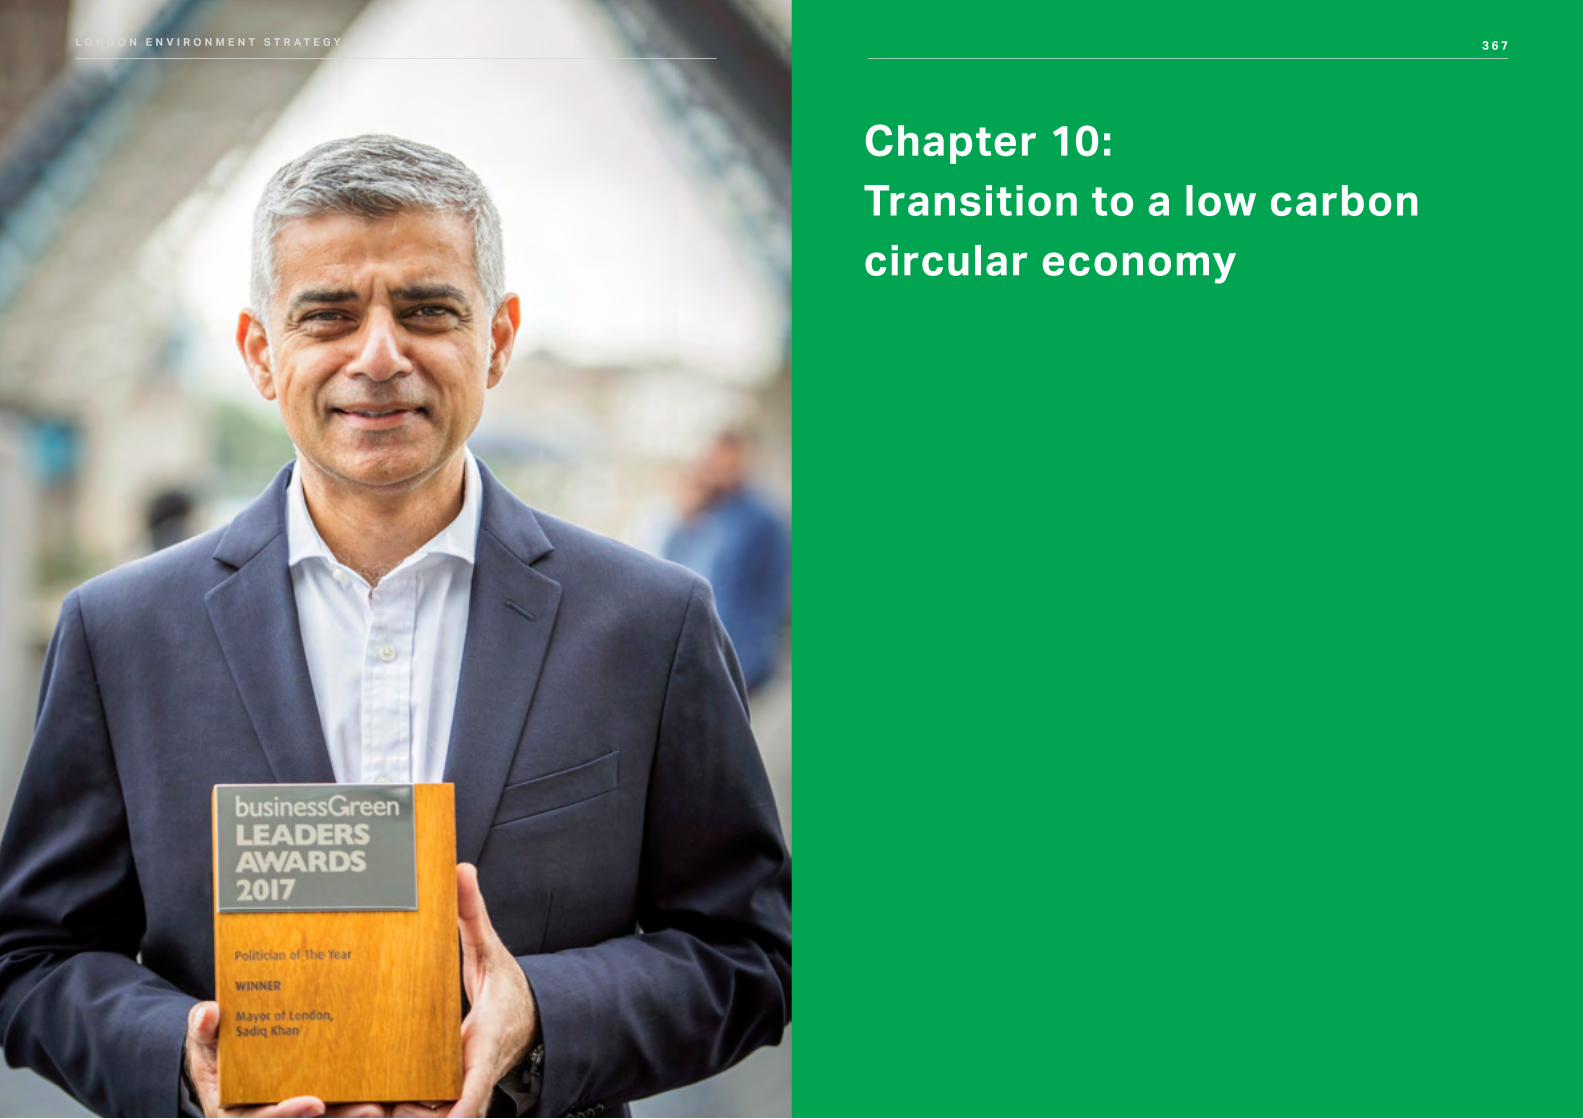
3 6 7L O N D O N E N V I R O N M E N T S T R A T E G Y
Chapter 10: Transition to a low carbon circular economy
3 6 7
3 6 9L O N D O N E N V I R O N M E N T S T R A T E G Y
INTRODUCTION
London already has a strong low carbon and environmental goods and services sector, worth £30.4bn as estimated through sales in 2014/15. The Mayor wants to ensure that as London and the world’s economies make the transition to the low carbon circular economy London’s businesses and workers are supported to be able to compete effectively in this growing global market. All of the Mayor’s strategies will play their role in supporting this but this strategy and the Economic Development Strategy will play the primary roles. This chapter sets out the policies and proposals that the Mayor will implement in order to make the transition to a low carbon circular economy.
A sizable global low carbon market has already been established in response to existing environmental policy and regulations. It has enjoyed an average global growth rate of 11.3 per cent per year since 2008 during which average global GDP growth was 3.3 per cent. It is estimated to already be worth around $5 trillion, or 4.7 per cent of global GDP.118 International commitment around the need for a global transition to a low carbon circular economy has grown considerably in the past few years with the ‘Paris Agreement on Climate Change’
“ London already has a strong low carbon and environmental goods and services sector, worth £30.4bn as estimated through sales in 2014/15.”
L O N D O N E N V I R O N M E N T S T R A T E G Y
118 http://www.bankofengland.co.uk/publications/Pages/speeches/2015/844.aspx
and the ‘2030 Agenda for Sustainable Development’ both being agreed by over 150 nation states. These create the framework within which the world will act to protect the planet, tackle climate change, end poverty and reduce inequality.
Below are three integrated elements that illustrate the Mayor’s role in creating, enabling and benefitting from the transition to a low carbon circular economy:
1. Creating Market Demand – The Mayor will show leadership and ensure that London is illustrating, through its strong policy framework, how cities can create demand for low carbon and environmental goods and services that directly address the environmental challenges that they face and drive resource efficiency and a reduction in consumption. The GLA group, and the public sector more generally can create demand for low carbon resource efficient goods and services directly through procurement.
2. Capturing a Share of the Market – The Mayor will support London’s existing and future businesses to develop the skills, knowledge, experience
and expertise to be competitive in a low carbon circular economy. In particular it will help businesses that are providing low carbon and resource efficient goods and services to ensure that they are as competitive as possible in this growing global market.
3. Enabling the Transition – For this transition to be possible there needs to be major investment in the city’s infrastructure to create the necessary comprehensive and integrated systems, such as energy, water and waste. These systems will allow London, its citizens and its businesses to effortlessly live, work and play in what will be an ever increasingly low carbon and resource efficient world.
To be a global leader in this sector and realise both the environmental and economic benefits that this represents the Mayor will support London to:
• grow the low carbon and environmental good and services sector and market
• enable London's businesses, academia and citizens to actively compete in and contribute to the low carbon circular economy
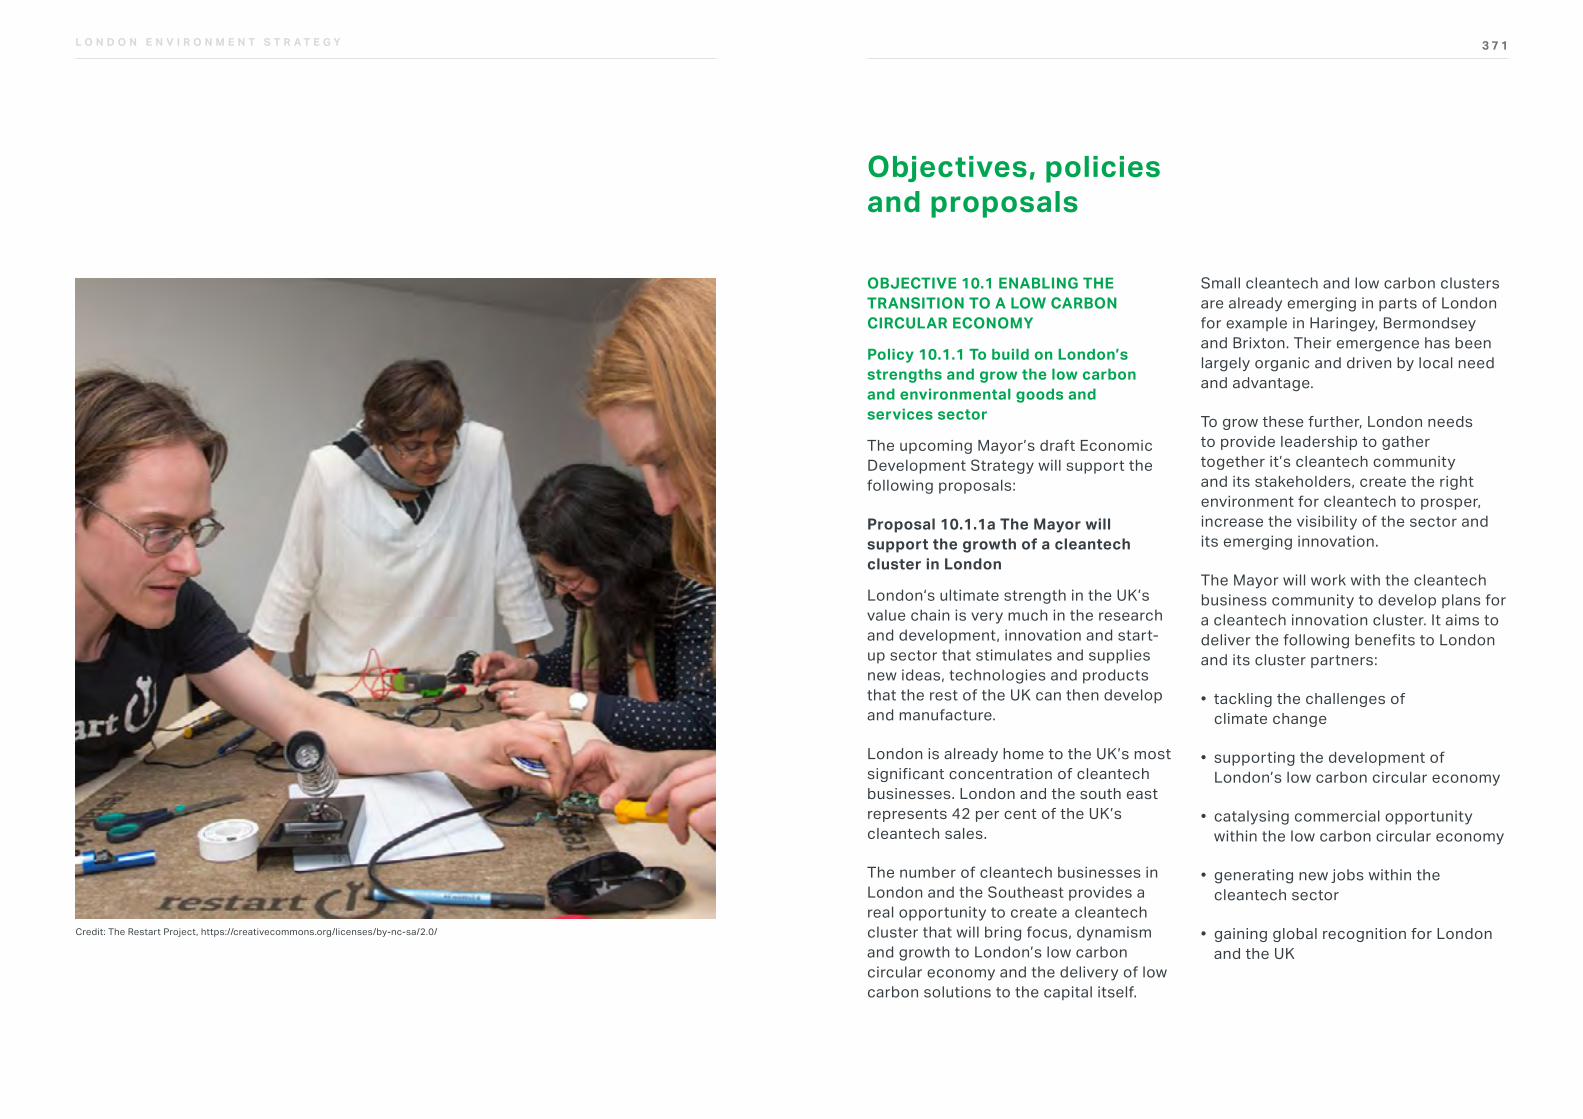
3 7 1L O N D O N E N V I R O N M E N T S T R A T E G Y
OBJECTIVE 10.1 ENABLING THE TRANSITION TO A LOW CARBON CIRCULAR ECONOMY
Policy 10.1.1 To build on London’s strengths and grow the low carbon and environmental goods and services sector
The upcoming Mayor’s draft Economic Development Strategy will support the following proposals:
Proposal 10.1.1a The Mayor will support the growth of a cleantech cluster in London
London‘s ultimate strength in the UK’s value chain is very much in the research and development, innovation and start-up sector that stimulates and supplies new ideas, technologies and products that the rest of the UK can then develop and manufacture.
London is already home to the UK’s most significant concentration of cleantech businesses. London and the south east represents 42 per cent of the UK’s cleantech sales.
The number of cleantech businesses in London and the Southeast provides a real opportunity to create a cleantech cluster that will bring focus, dynamism and growth to London’s low carbon circular economy and the delivery of low carbon solutions to the capital itself.
Small cleantech and low carbon clusters are already emerging in parts of London for example in Haringey, Bermondsey and Brixton. Their emergence has been largely organic and driven by local need and advantage.
To grow these further, London needs to provide leadership to gather together it’s cleantech community and its stakeholders, create the right environment for cleantech to prosper, increase the visibility of the sector and its emerging innovation.
The Mayor will work with the cleantech business community to develop plans for a cleantech innovation cluster. It aims to deliver the following benefits to London and its cluster partners:
• tackling the challenges of climate change
• supporting the development of London’s low carbon circular economy
• catalysing commercial opportunity within the low carbon circular economy
• generating new jobs within the cleantech sector
• gaining global recognition for London and the UK
Objectives, policies and proposals
Credit: The Restart Project, https://creativecommons.org/licenses/by-nc-sa/2.0/
3 7 3L O N D O N E N V I R O N M E N T S T R A T E G Y
Proposal 10.1.1b The Mayor will promote those sectors where London can show its clear leadership for consideration as part of the UK Industrial Strategy’s Sector Deal Programme
In addition to general support frameworks for doing business, the Mayor believes a more targeted approach is needed to address some sector-specific opportunities and challenges. London can be a leader in addressing some of the big strategic challenges facing global cities like climate change, which require a collaborative ‘mission-led’ response between the public and private sector, and with other global cities.
London is leading the way in the UK in a number of sectors including cleantech, financing and advanced urban services. These sectors will be promoted by the Mayor for recognition by government as part of the proposed Industrial Strategy Sector Deal Programme. Some of these sectors will develop innovative solutions for challenges faced by businesses in making the transition to the low carbon circular economy.
The following proposals relate to the work of this strategy:
Proposal 10.1.1c The Mayor will explore approaches that support innovative businesses to create solutions to London’s environmental challenges
The Mayor will work with global networks, such as C40 and the International Cleantech Cluster Network and other cities to gain knowledge and develop ideas for how innovative businesses can help create solutions to address London’s environmental challenges. This will also aim to develop business models that will support the transition to a low carbon circular economy.
Proposal 10.1.1d The Mayor will work with the GLA group and other public sector organisations to maximise the use of sustainable procurement approaches to drive demand for low carbon and environmental goods, services and solutions
The Mayor will actively use and promote the Responsible Procurement Policy to drive demand for goods and services that have high environmental specifications and companies that have high environmental performance.
Proposal 10.1.1e The Mayor will work with stakeholders from across the financial and environmental sectors to develop financing mechanisms
The Mayor will work with partners to increase the flow of finance to support the delivery of large-scale projects that address the environmental challenges that London is facing. For example the Mayor will use the London Green Fund and London Energy Efficiency Fund to finance low carbon circular economy projects.
The Mayor will also explore the use of low cost financing and bulk purchasing, and innovative products such as green bonds and climate change ISAs, to help attract large scale institutional investment into environmental projects.
Proposal 10.1.1f The GLA group will demonstrate how public and private sector organisations could use large-scale investment, such as pension funds, to provide investment for low carbon and environmental projects and catalyse the transition to the low carbon circular economy
With the anticipated growth in London over the coming decades, it is anticipated that significant investment in new infrastructure will be required,
and it is essential that this infrastructure investment is sustainable. Pension funds can be a source of this investment.
To support this, the Mayor has asked the London Pension Fund Authority (LPFA) to help encourage the infrastructure investment London needs. The GLA group and the LPFA have agreed a climate change policy covering combined assets of just under £10bn and agreed to no longer consider new active investments in fossil fuel companies that are directly engaged in the extraction of coal, oil and natural gas as sources of energy, including all necessary divestment required in line with the policy with a deadline of 2020.
3 7 5L O N D O N E N V I R O N M E N T S T R A T E G Y
Policy 10.1.2 To build on London’s strengths and enable London’s businesses, academia and citizens to actively compete in and contribute to the low carbon circular economy
The following proposal will be encapsulated within the Mayor’s draft Economic Development Strategy and will be available to support all businesses including those within the low carbon and environmental goods and services sector.
Proposal 10.1.2a To support start-ups and business growth across the economy, including in the low carbon and environmental goods and services sector
The Mayor’s new Economic Development Strategy will identify a range of measures to support start-ups and business growth across London’s economy. These will be available for all businesses including those in the low carbon and environmental goods and services sector.
Support will include the Growth Hub – London’s gateway to business support. Whilst the Growth Hub aims to support start-ups and business growth through coordinating London’s general business support offer, it is also being developed to showcase low carbon and environmental business support schemes.
The London & Partners led Business Growth Programme has also been established to support SMEs within life sciences, digital/tech, creative, media and telecoms sectors to grow.
This general support will include meeting the skills needs of businesses, including through use of the Adult Education Budget once devolved to the Mayor in 2019/20 and delivering high quality (including higher level and degree) apprenticeships.
There will also be some specialised support in the form of the ERDF-funded projects: Advance London and Better Futures. The Advance London project will support businesses to develop more sustainable, circular and inclusive business models; and the Better Futures project is a SME Business Incubator Programme to support the growth of the low carbon, cleantech and resource efficient sector in London.
The following proposal will be delivered through this strategy but with support from the Mayor’s draft Economic Development Strategy.
Proposal 10.1.2b To support students and young entrepreneurs to think about new business opportunities within the low carbon circular economy and establish start-ups that exploit these opportunities
The Mayor’s Entrepreneur programme will continue to engage university students across London on low carbon circular economy market opportunities and work with them to develop new ideas for environmental goods and services that tackle the environmental challenges that cities are facing today.
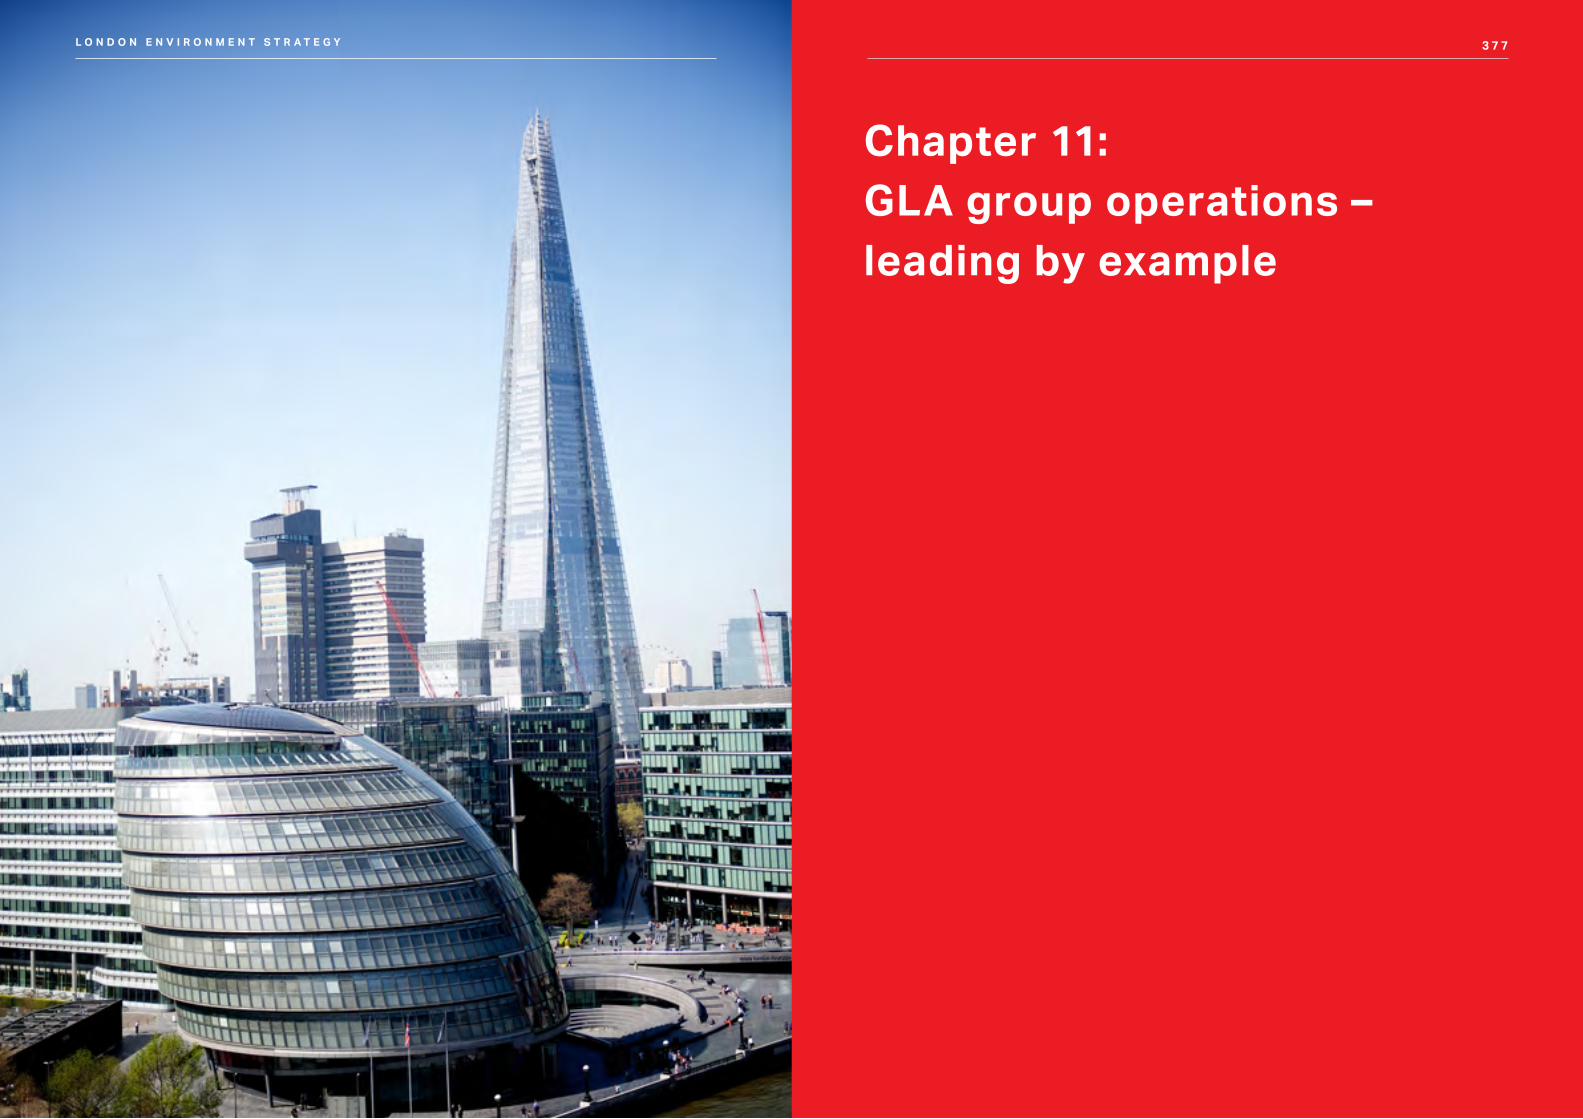
3 7 7L O N D O N E N V I R O N M E N T S T R A T E G Y
Chapter 11: GLA group operations – leading by example
3 7 7
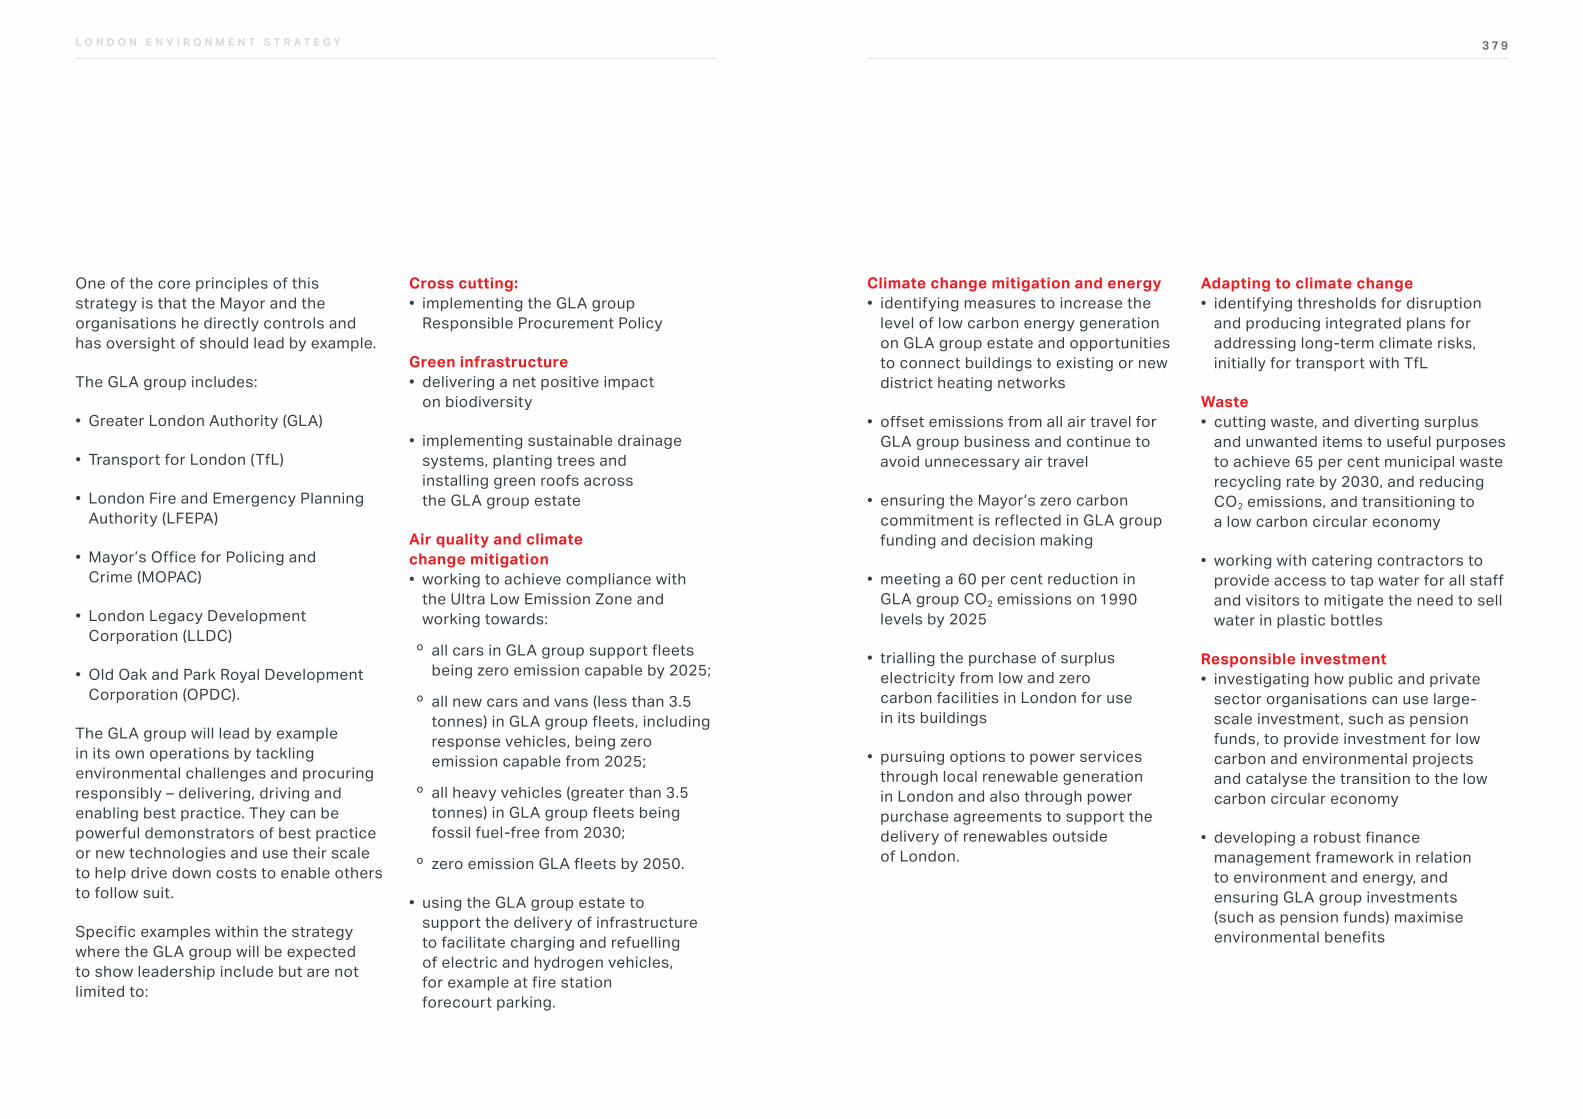
3 7 9L O N D O N E N V I R O N M E N T S T R A T E G Y
One of the core principles of this strategy is that the Mayor and the organisations he directly controls and has oversight of should lead by example.
The GLA group includes:
• Greater London Authority (GLA)
• Transport for London (TfL)
• London Fire and Emergency Planning Authority (LFEPA)
• Mayor’s Office for Policing and Crime (MOPAC)
• London Legacy Development Corporation (LLDC)
• Old Oak and Park Royal Development Corporation (OPDC).
The GLA group will lead by example in its own operations by tackling environmental challenges and procuring responsibly – delivering, driving and enabling best practice. They can be powerful demonstrators of best practice or new technologies and use their scale to help drive down costs to enable others to follow suit.
Specific examples within the strategy where the GLA group will be expected to show leadership include but are not limited to:
Cross cutting:• implementing the GLA group
Responsible Procurement Policy
Green infrastructure• delivering a net positive impact
on biodiversity
• implementing sustainable drainage systems, planting trees and installing green roofs across the GLA group estate
Air quality and climate change mitigation• working to achieve compliance with
the Ultra Low Emission Zone and working towards:
º all cars in GLA group support fleets being zero emission capable by 2025;
º all new cars and vans (less than 3.5 tonnes) in GLA group fleets, including response vehicles, being zero emission capable from 2025;
º all heavy vehicles (greater than 3.5 tonnes) in GLA group fleets being fossil fuel-free from 2030;
º zero emission GLA fleets by 2050.
• using the GLA group estate to support the delivery of infrastructure to facilitate charging and refuelling of electric and hydrogen vehicles, for example at fire station forecourt parking.
Climate change mitigation and energy• identifying measures to increase the
level of low carbon energy generation on GLA group estate and opportunities to connect buildings to existing or new district heating networks
• offset emissions from all air travel for GLA group business and continue to avoid unnecessary air travel
• ensuring the Mayor’s zero carbon commitment is reflected in GLA group funding and decision making
• meeting a 60 per cent reduction in GLA group CO2 emissions on 1990 levels by 2025
• trialling the purchase of surplus electricity from low and zero carbon facilities in London for use in its buildings
• pursuing options to power services through local renewable generation in London and also through power purchase agreements to support the delivery of renewables outside of London.
Adapting to climate change• identifying thresholds for disruption
and producing integrated plans for addressing long-term climate risks, initially for transport with TfL
Waste• cutting waste, and diverting surplus
and unwanted items to useful purposes to achieve 65 per cent municipal waste recycling rate by 2030, and reducing CO2 emissions, and transitioning to a low carbon circular economy
• working with catering contractors to provide access to tap water for all staff and visitors to mitigate the need to sell water in plastic bottles
Responsible investment• investigating how public and private
sector organisations can use large-scale investment, such as pension funds, to provide investment for low carbon and environmental projects and catalyse the transition to the low carbon circular economy
• developing a robust finance management framework in relation to environment and energy, and ensuring GLA group investments (such as pension funds) maximise environmental benefits
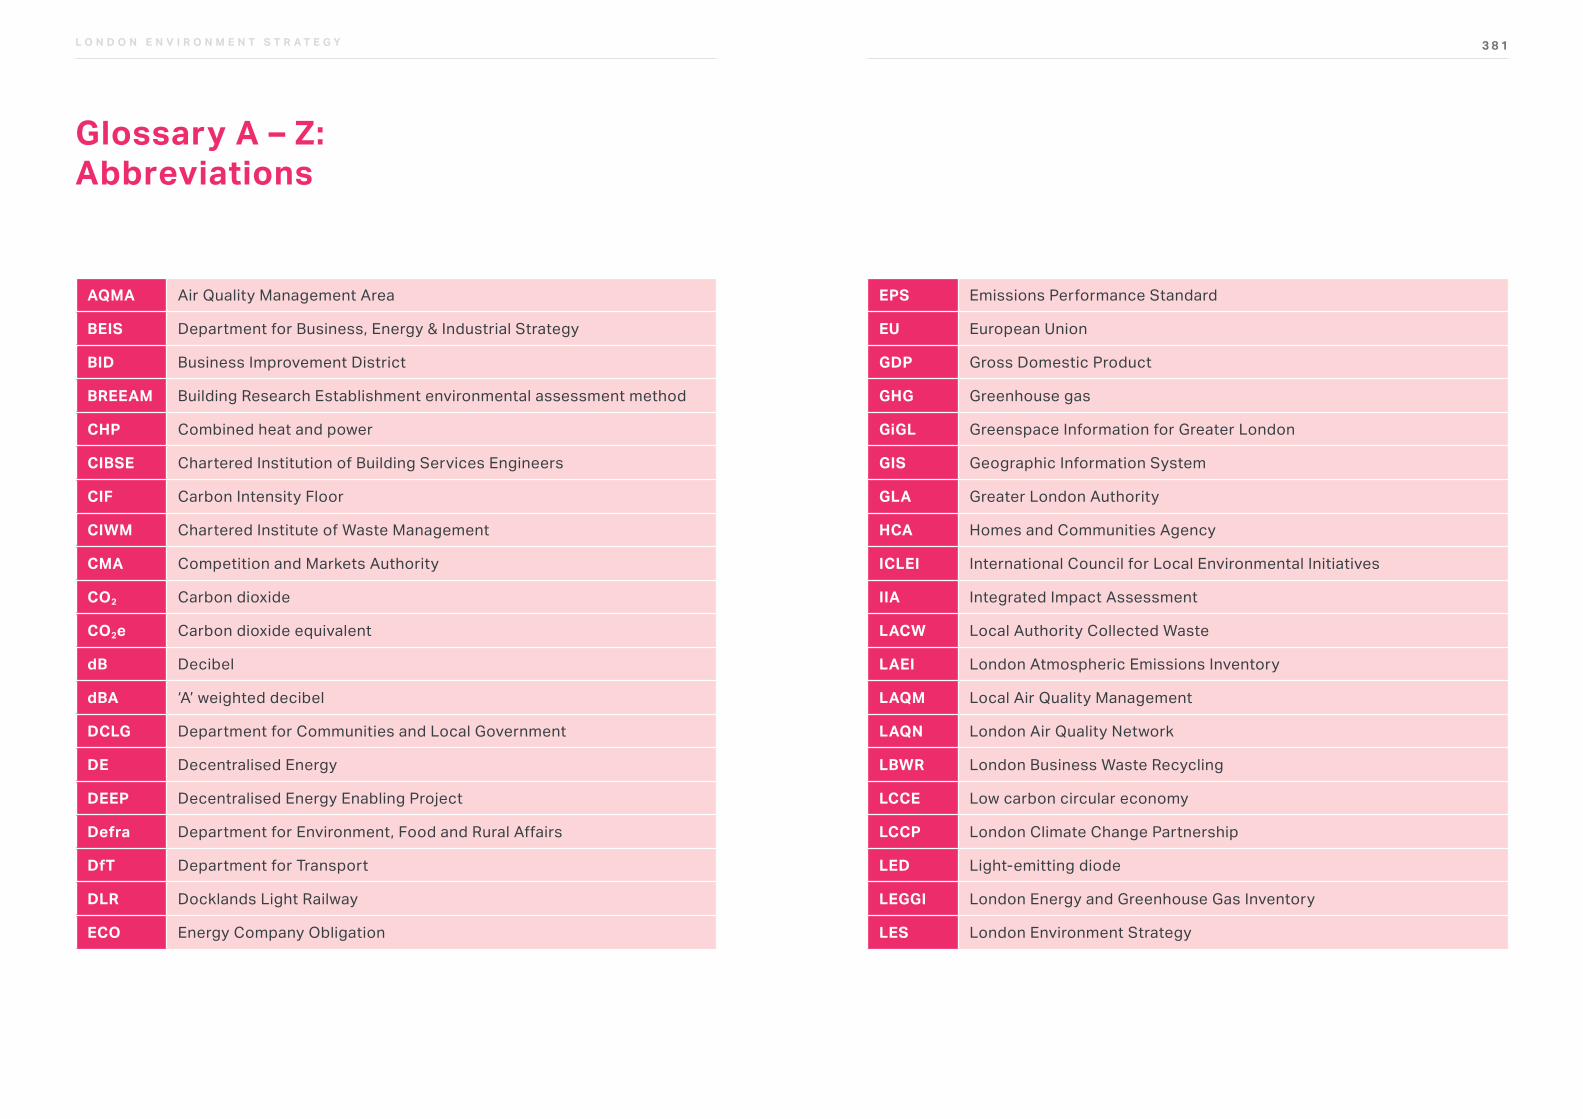
3 8 1L O N D O N E N V I R O N M E N T S T R A T E G Y
AQMA Air Quality Management Area
BEIS Department for Business, Energy & Industrial Strategy
BID Business Improvement District
BREEAM Building Research Establishment environmental assessment method
CHP Combined heat and power
CIBSE Chartered Institution of Building Services Engineers
CIF Carbon Intensity Floor
CIWM Chartered Institute of Waste Management
CMA Competition and Markets Authority
CO2 Carbon dioxide
CO2e Carbon dioxide equivalent
dB Decibel
dBA ‘A’ weighted decibel
DCLG Department for Communities and Local Government
DE Decentralised Energy
DEEP Decentralised Energy Enabling Project
Defra Department for Environment, Food and Rural Affairs
DfT Department for Transport
DLR Docklands Light Railway
ECO Energy Company Obligation
Glossary A – Z: Abbreviations
EPS Emissions Performance Standard
EU European Union
GDP Gross Domestic Product
GHG Greenhouse gas
GiGL Greenspace Information for Greater London
GIS Geographic Information System
GLA Greater London Authority
HCA Homes and Communities Agency
ICLEI International Council for Local Environmental Initiatives
IIA Integrated Impact Assessment
LACW Local Authority Collected Waste
LAEI London Atmospheric Emissions Inventory
LAQM Local Air Quality Management
LAQN London Air Quality Network
LBWR London Business Waste Recycling
LCCE Low carbon circular economy
LCCP London Climate Change Partnership
LED Light-emitting diode
LEGGI London Energy and Greenhouse Gas Inventory
LES London Environment Strategy
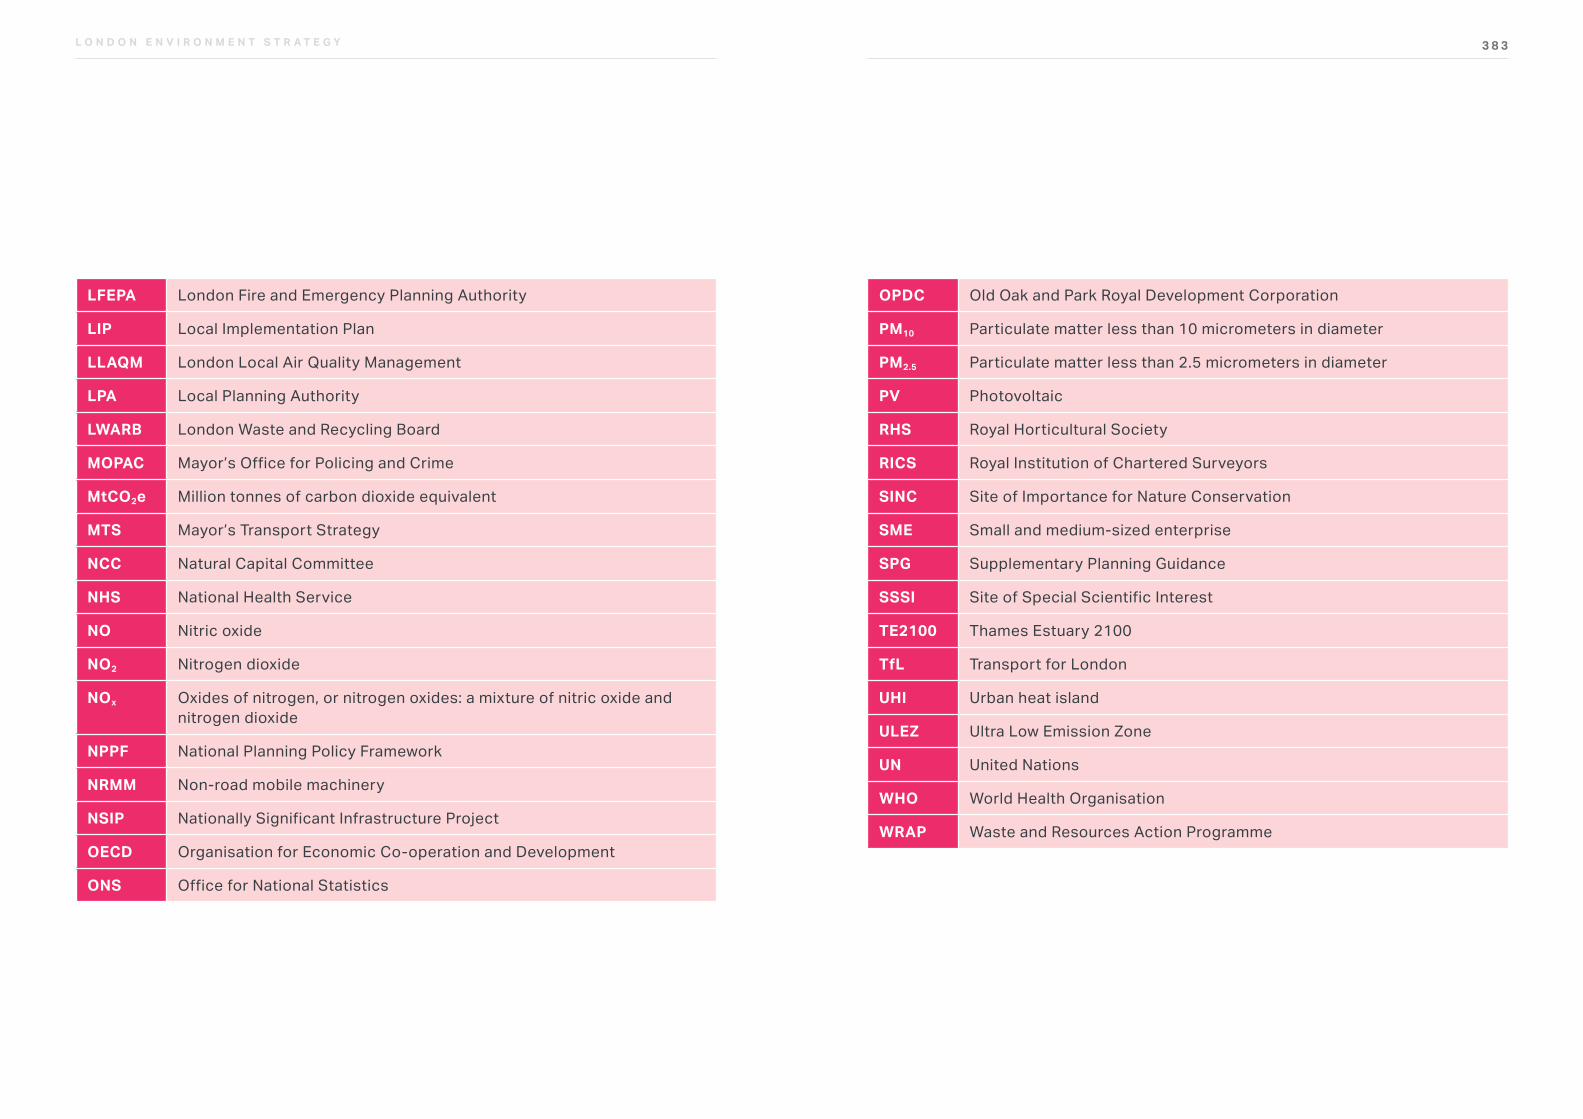
3 8 3L O N D O N E N V I R O N M E N T S T R A T E G Y
LFEPA London Fire and Emergency Planning Authority
LIP Local Implementation Plan
LLAQM London Local Air Quality Management
LPA Local Planning Authority
LWARB London Waste and Recycling Board
MOPAC Mayor’s Office for Policing and Crime
MtCO2e Million tonnes of carbon dioxide equivalent
MTS Mayor’s Transport Strategy
NCC Natural Capital Committee
NHS National Health Service
NO Nitric oxide
NO2 Nitrogen dioxide
NOx Oxides of nitrogen, or nitrogen oxides: a mixture of nitric oxide and nitrogen dioxide
NPPF National Planning Policy Framework
NRMM Non-road mobile machinery
NSIP Nationally Significant Infrastructure Project
OECD Organisation for Economic Co-operation and Development
ONS Office for National Statistics
OPDC Old Oak and Park Royal Development Corporation
PM10 Particulate matter less than 10 micrometers in diameter
PM2.5 Particulate matter less than 2.5 micrometers in diameter
PV Photovoltaic
RHS Royal Horticultural Society
RICS Royal Institution of Chartered Surveyors
SINC Site of Importance for Nature Conservation
SME Small and medium-sized enterprise
SPG Supplementary Planning Guidance
SSSI Site of Special Scientific Interest
TE2100 Thames Estuary 2100
TfL Transport for London
UHI Urban heat island
ULEZ Ultra Low Emission Zone
UN United Nations
WHO World Health Organisation
WRAP Waste and Resources Action Programme
3 8 5L O N D O N E N V I R O N M E N T S T R A T E G Y
AA-weighting A system of adjustments applied to sound of different frequencies to take account of the way the sensitivity of the human ear varies with sound frequency.
Adaptation The process (or outcome of a process) that leads to a reduction in harm or risk of harm, or realisation of benefits associated with climate variability and climate change. Adaptation policies can lead to greater resilience of communities and ecosystems to climate change (see ‘Resilience’).
Adaptive pathways Or adaptation pathways. A way of thinking that supports making decisions today that don’t cut off options for the future. Especially useful in planning for the longer term given uncertainty, as with climate change (see ‘Thames Estuary 2100’).
Agglomeration Defined by Defra as an area with a population of more than 100,000, a population density equal to or greater than 500 people per km2, and which is considered to be urbanised.
Air pollutants Generic term for emitted substances that have adverse effects on humans and the ecosystem.
Air Quality Management Area (AQMA) An area that a local authority has designated for action, based upon a prediction that Air quality objectives will be exceeded.
Air quality neutral Air Quality Neutral is a standard for new buildings that are designed to ensure that they do not emit more pollution than existing buildings of the same type.
Air quality positive An Air Quality Positive development is one that is not only working towards being “zero emission” but is also making positive contributions towards improving air quality beyond the immediate site boundary and reducing public exposure to air pollution, both on and off-site.
All London Green Grid A policy framework set out in Supplementary Planning Guidance to the London Plan. It promotes the design and delivery of green infrastructure across London.
Ambient noise Ambient noise is composed of long term predictable sources of background noise for a given location, such as from transport and industry, as distinct from individual events, such as a noisy all night party. Specifically in this strategy, long term, systematically predictable noise emitted by road traffic, rail traffic, air traffic, water transport, and from sites of industrial activity. Unless stated otherwise, noise includes vibration.
Anaerobic digestion The biological degradation of organics in the absence of oxygen, producing biogas (with a typical composition of 65 per cent methane and 35 per cent CO2) and residue (digestate) suitable for use as a soil improver.
Glossary A – Z: General
Annual mean The average concentration of a given pollutant over a calendar year at a given location. Legal limits for long term pollution concentrations are set on the annual mean value. Short term limits have also been set based on 1-hour or 24-hour means.
Aquifer A permeable rock that stores groundwater and allows it to flow into a well or borehole, through the voids, or pore spaces, in the rock.
Areas of Deficiency in access to nature Areas where people have to walk more than one kilometre to reach an accessible Metropolitan or Borough Site of Importance for Nature (SINC).
Areas of Deficiency in access to public open space Areas lacking in sufficient publicly accessible green space, as defined by a set of standards in the London Plan.
Attenuation The storage and slow release of surface water run-off. This is one of the key features of sustainable drainage systems (see ‘SuDS’).
BBackground noise The noise normally present for most of the time at a given site, usually described by the LA90 level, the level exceeded for 90% of the time.
Biodegradable waste Any waste that is capable of undergoing anaerobic or aerobic decomposition, such as organic kitchen and green garden waste, and paper and paperboard.
Biodiversity The diversity (or variety) of plants, animals and other living things in a particular area. It encompasses habitat diversity, species diversity and genetic diversity. Often used as a term for describing all wildlife.
Biodiversity offsetting A mechanism to determine how any impacts on wildlife or wildlife habitats resulting from development or change of land use can be compensated by creating replacement habitat elsewhere.
Biofuel A hydrocarbon that is made by or from a living organism that can be used to generate energy, such as ethanol and biodiesel.
Bio-methane See ‘Methane’.
Biomass The total dry organic matter or stored energy of plant matter. As a fuel it includes energy crops and sewage, as well as forestry and agricultural residues.
Black carbon A component of PM2.5 formed through the incomplete combustion of fossil fuels. Black carbon contributes to climate change.
Boroughs Usually used to refer to all 32 London boroughs and the City of London. The boroughs are the principal local authorities in London and are responsible for running most local services in their areas, such as schools, social services, waste collection and roads.
3 8 7L O N D O N E N V I R O N M E N T S T R A T E G Y
BREEAM A sustainability assessment method for masterplanning projects, infrastructure and buildings.
Business Improvement District A defined area in which a levy is charged on all business rate payers in addition to the business rates bill. This levy is used to develop projects that will benefit businesses in the local area.
CCanopy cover The amount of land within a defined area that is beneath the foliage of trees.
Carbon dioxide (CO2) Principal greenhouse gas related to climate change.
Carbon dioxide-equivalent (CO2e) The universal unit of measurement used to indicate the global warming potential (GWP) of greenhouse gases. It is used to evaluate the impacts of releasing (or avoiding the release of) different greenhouse gases. For example, the GWP of methane is 21 times that of CO2, which has a GWP of 1. Sulphur hexafluoride has a GWP of 23,900. A CO2-equivalent figure is |used to represent the warming impact of greenhouse gases. See also definition of Global Warming Potential.
Carbon footprint Total greenhouse gas emissions resulting from an activity or group of activities, including embodied carbon.
Carbon intensity floor The CO2e emissions performance level set for electricity generated from London’s municipal waste to achieve. The carbon intensity floor has been set at the level whereby any electricity generated from London’s municipal waste is to be no more polluting in carbon terms than the electricity source it replaces. The carbon intensity floor sits within the Emissions Performance Standard that has been set for London’s activities associated with the collection, treatment and final disposal of London’s municipal waste to achieve.
Central, Inner and Outer London These definitions can vary depending on the context in which they are being used. For the purposes of analysis (and future monitoring), this strategy has used the following definitions:
• central London: an area broadly equivalent to the Central Activities Zone (CAZ), as defined by the London Plan
• inner London (excluding central London, as appropriate): the boroughs of Camden, City of London, Hackney, Hammersmith & Fulham, Haringey, Islington, Kensington & Chelsea, Lambeth, Lewisham, Newham, Southwark, Tower Hamlets, Wandsworth and the City of Westminster, as defined by the Office for National Statistics
• outer London: the boroughs of Barking and Dagenham, Barnet, Bexley, Brent, Bromley, Croydon, Ealing, Enfield, Greenwich, Harrow, Havering, Hillingdon, Hounslow, Kingston upon Thames, Merton, Redbridge, Richmond upon Thames, Sutton and Waltham Forest, as defined by the Office for National Statistics
The London Plan also set outs similar definitions of inner and outer London, which may be updated over time. However, for some uses, boundaries based on borough or the CAZ are not appropriate, such as the inner London ULEZ, which is based on the North and South Circular Roads, or the Congestion Charge zone, which is based on the Inner Ring Road.
Circular economy An economic model in which resources are kept in use at the highest level possible for as long as possible in order to maximise value and reduce waste, moving away from the traditional linear economic model of ‘make, use, dispose’.
Civil society organisation See ‘Third sector’.
Climate change A large-scale, long-term shift in the planet’s weather patterns or average temperatures. Characterised by higher temperatures, sea level rise, changing rainfall, and more frequent and severe extreme weather.
Combined heat and power (CHP) The combined production of electricity and usable heat is known as combined heat and power (CHP). Steam or hot water, which would otherwise be rejected when electricity alone is produced, is used for space or process heating.
Combined sewer system Sewers that are designed to collect rainwater runoff, domestic sewage, and industrial wastewater in the same pipe.
Commercially collected waste Waste from businesses in the possession or control of a body or organisation that is not a waste authority
Concentration The amount of a given air pollutant in the local atmosphere. Concentrations are usually measured in units of micrograms per meter cubed (µg/m3).Depending on the pollutant, 1 µg/m3 is usually around 1-4 parts per billion.
Concentrations can change very rapidly over time so they are usually reported as average values over an hour, a day or a year (see ‘Annual mean’).
Congestion charge The charge applied to vehicles entering a defined area of central London, introduced to reduce congestion. Some vehicles are currently exempt from the Congestion Charge.
Conservation (or nature conservation) The protection, management and improvement of land for the benefit of wild species and habitats, as well as the human communities that use and enjoy them. This also covers the creation and re-creation of wildlife habitats, and can be used to include geological conservation.
Consolidation The process of rearranging and combining deliveries to reduce the number of van and lorry journeys made in London.
3 8 9L O N D O N E N V I R O N M E N T S T R A T E G Y
DdB(A) ‘A’ weighted decibel - see ‘A-weighting’.
Decarbonise To remove or reduce the potential carbon dioxide emissions to the atmosphere from a process or structure.
Decentralised Energy (DE) A range of definitions exist for DE. In the context of this strategy, DE refers to low and zero carbon power and/or heat generated and delivered within London. This includes microgeneration, such as photovoltaics on individual buildings, through to large-scale heat networks.
Decibel (dB) A unit of sound pressure level on a logarithmic scale – the logarithmic ratio of a sound pressure relative to a reference level.
Demand Side Response Demand Side Response is all about intelligent energy use. By ‘demand side’, we mean services that enable businesses and consumers to turn up, turn down or shift demand in real-time. This is a really important tool to help ensure a secure, sustainable and affordable electricity system. It can help us soften peaks in demand and fill in the troughs, especially at times when power is more abundant, affordable and clean.
District Heating Network (DHN) A network of pipes carrying hot water or steam, usually underground, that connects heat production equipment with heat customers. They can range from several metres to several kilometres in length.
Drought An extended period of insufficient rainfall (or other precipitation) that results in water shortages with impacts on people, animals, and vegetation.
EEcological resilience The ability of the natural environment to recover from damage, disturbance or pollution.
Electric vehicle A vehicle that uses an electric motor for propulsion, comprising ones that run solely on batteries, as well as plug-in hybrid electric vehicles that have an attached petrol or diesel engine to power the battery engine.
Embodied carbon / energy / emissions The total life cycle carbon / energy / greenhouse gases used in the collection, manufacture, transportation, assembly, recycling and disposal of a given material or product.
Emissions Pollutants produced by mechanical, industrial or combustion processes that are released into the atmosphere.
Energy efficiency Making the best or most efficient use of energy in order to achieve a given output of goods or services, and of comfort and convenience.
Energy from waste A number of established and emerging technologies, though most energy recovery is through incineration technologies. Many wastes are combustible, with relatively high calorific values – this energy can be recovered through (for instance) incineration with electricity generation.
Energy hierarchy The Mayor’s tiered approach to reducing carbon dioxide emissions in the built environment. The first step is to reduce energy demand (be lean), the second step is to supply energy efficiently (be clean) and the third step is using renewable energy (be green).
Energy masterplanning Spatial and strategic planning that identifies and develops opportunities for decentralised energy and the associated technical, financial and legal considerations that provide the basis for project delivery.
Euro standards EU standards that define maximum air pollutant emissions for new vehicles sold within EU member states. These range from Euro 1-6 for light vehicles and Euro I-VI for heavy vehicles.
Exposure Exposure is a measure of the amount of pollution that someone comes into contact with or breathes in. Exposure is different from concentrations as it takes into account human factors, such as how long someone is in a place and what they are doing, as well as the amount of pollution in the air.
FFluvial flooding Rivers bursting their banks as a result of heavy rainfall can cause flooding of land, infrastructure and homes.
Fuel cell A cell that acts like a constantly recharging battery, electrochemically combining hydrogen and oxygen to generate power. For hydrogen fuel cells, water and heat are the only by-products and there is no direct air pollution or noise emissions. They are suitable for a range of applications, including vehicles and buildings.
Fuel Poverty A household is considered to be in fuel poverty if the fuel costs required to heat and power the home adequately are above average (the national median level) and if they were to spend that amount, they would be left with a residual income below the official poverty line. It is caused by the combination of three factors: low incomes; the poor energy efficiency of homes; and high energy prices.
Functional bodies See ‘GLA group’.
3 9 1L O N D O N E N V I R O N M E N T S T R A T E G Y
GGeneral Assessment of London’s Environment The GLA Act 1999 (as amended) requires the London Environment Strategy to contain a general assessment of London’s environment, as relevant to the Mayor’s and the GLA’s functions.
Geographic Information System (GIS) A form of data storage software that stores information linked to a geographical location.
GLA The Greater London Authority is the administrative body for Greater London. It comprises a directly elected Mayor and directly elected London Assembly.
GLA group
The Mayor has responsibility for appointing members to, and setting budgets for, five organisations: Transport for London (TfL), London Legacy Development Corporation (LLDC), London Fire and Emergency Planning Authority (LFEPA), Mayor’s Office for Policing and Crime (MOPAC), and Old Oak and Park Royal Development Corporation (OPDC).
Global Warming Potential A measure of how much a given mass of greenhouse gas is emitted to contribute to global warming. It is a relative scale which compare the gas in question to that of the same mass of carbon dioxide (whose GWP is by definition 1). Methane has a GWP of 23. A GWP is calculated over a specific time interval and the value of this must be stated whenever a GWP is quoted or else the value is meaningless.
Greater London The geographical area encompassed by the 32 London boroughs and the City of London.
Greater London Urban Area An area used by Defra to complete noise action plans and noise mapping. The Greater London Urban area contains 59 Local Authorities either wholly or in part. The area differs from the Greater London boundary.
Green Belt The area of land around London (or other urban areas) that is protected from inappropriate development by land-use planning policies. Metropolitan Green Belt is a statutory green belt around London aiming to control urban growth
Green corridor Relatively continuous areas of open space leading through the built environment, which may link sites to each other and to the Green Belt or Metropolitan Open Land. They often consist of rivers, railway embankments and cuttings, roadside verges, canals, parks, playing fields and extensive areas of private gardens. They may allow animals and plants to be found further into the built-up area than would otherwise be the case and provide an extension to the habitats of the sites they join.
Green infrastructure A network of green spaces – and features such as street trees and green roofs – that is planned, designed and managed to deliver a range of benefits. These include mitigating flooding, cooling the urban environment and enhancing biodiversity and ecological resilience, as well as providing more attractive places for people.
Green infrastructure services Beneficial services provided by green infrastructure.
Green roofs/walls Planting on roofs or walls to provide climate change adaptation, amenity, food-growing and recreational benefits.
Greening The improvement of the appearance, function and wildlife value of the urban environment through soft landscaping.
Greenhouse gas (GHG) Any gas that induces the greenhouse effect, trapping heat within the atmosphere that would normally be lost to space, resulting in an increase in average atmospheric temperatures, contributing to climate change. Examples include carbon dioxide, methane and nitrous oxides.
Greenspace Information for Greater London (GiGL) London’s environmental records centre. GiGL provides a hub for collating and sharing data about wildlife, habitats, green space and related data.
Gross Domestic Product (GDP) A monetary measure of the market value of all final goods and services produced by a country in a period.
Groundwater Water stored within saturated rock or soil (see ‘Aquifer’ and ‘Recharge’).
Groundwater recharge See ‘Recharge’.
HHabitat (or wildlife habitat) The physical environment required to sustain animals, plants and other species. It includes air, water and soil, as well as other living things. In London, habitat categories are mainly types of vegetation such as woodland, chalk grassland and reedbed, but also include more urban habitats such as parks and gardens. See also Priority Habitat.
Health inequalities Health inequalities are systematic, avoidable and unfair differences in mental or physical health between groups of people. These differences affect how long people live in good health and are mostly a result of differences in people’s homes, education and childhood experiences, their environments, their jobs and employment prospects, their access to good public services and their habits.
Household waste All waste collected by Waste Collection Authorities under section 45(1) of the Environmental Protection Act 1990, plus all waste arisings from Civic Amenity sites and waste collected by third parties for which collection or disposal credits are paid under Section 52 of the Environmental Protection Act 1990. Household waste includes waste from collection rounds of domestic properties (including separate rounds for the collection of recyclables), street cleansing and litter collection, beach cleansing, bulky household waste collections, hazardous household waste collections, household clinical waste collections, garden waste collections,
3 9 3L O N D O N E N V I R O N M E N T S T R A T E G Y
Civic Amenity/Reuse and Recycling Centre wastes, drop-off/’bring’ systems, clearance of fly-tipped wastes, weekend skip services and any other household waste collected by the waste authorities. Household waste accounts for approximately four-fifths of London’s municipal waste.
Hybrid vehicle A vehicle that utilises batteries and electric traction motors in conjunction with the internal combustion engine.
IImpermeable surface Mainly artificial structures (such as pavements, roads, driveways, parking areas and rooftops) that are covered by materials impenetrable to water (such as asphalt, concrete, brick and stone). Impermeable surfaces also collect solar heat in their dense mass. When the heat is released, it raises air temperatures (see ‘Urban heat island’).
Incineration The controlled burning of waste in the presence of sufficient air to achieve complete combustion. Energy is usually recovered in the form of electric power and/or heat. The emissions are controlled under EU Directive 2000/76/EC. This Directive also applies to other thermal treatment processes such as pyrolysis and gasification, so the term incineration may be applied to a wider range of thermal waste treatment processes. See also separate definitions of mass burn incineration, pyrolysis, and gasification.
Integrated Impact Assessment The process of covering more than one type of impact assessment into a single process. This can improve efficiency, as many of the issues covered in the different forms of assessment overlap, and can simplify outcomes and recommendations for policy makers. The Mayor of London, has taken an integrated approach to assessing the impacts of his strategies, incorporating the requirements of Strategic Environmental Assessment, Sustainability Appraisal, Health Impact Assessment, and Equalities Impact Assessment.
Inner London See ‘Central, Inner and Outer London’.
Integrated Impact Assessment (IIA) A systematic process for assessing the likely sustainability effects of the strategy in order to ensure they are fully considered and addressed at the earliest appropriate stage of decision-making. The environment policies and proposals within the draft strategy are subject to the following assessments, and the findings have been collated into the overall IIA Report: Strategic Environmental Assessment (SEA); Habitats Regulation Assessment (HRA); Equalities Impact Assessment (EqIA); Health Impact Assessment (HIA); Assessment of Economic Impact (AEI); and Community Safety Impact Assessment (CSIA).
Integrated Water Management Strategy An assessment of how water and related resources can be co-ordinated, developed and managed, to improve both efficiency and sustainability.
LLAeq A-weighted equivalent continuous sound level for a specified time period. This is a measure of long term average noise exposure, and is the preferred method for describing sound levels that vary over time.
Landfill Areas of land in which waste is deposited. Landfill sites are often located in disused quarries or mines. In areas where there are limited, or no ready-made voids, the practice of landraising is sometimes carried out, where some or all of the waste is deposited above ground, and the landscape is contoured.
Landscape See ‘Natural landscape’.
Lden Day Evening Night (DEN) equivalent level. An environmental noise indicator for annoyance, derived from the average sound energy level over the day, evening and night periods for one year. It has a 12 hour daytime period, a 4 hour evening period and a 8 hour night period, with a penalty of 5 dB added for the evening hours or 19:00 to 22:00, and a penalty of 10 dB added for the night-time hours of 22:00 to 07:00.
LEGGI The London Energy and Greenhouse Gas Inventory, showing greenhouse gas emissions and energy consumption for London.
Local authorities See ‘London boroughs/boroughs’.
Local Authority Collected Waste (LACW) All waste in the possession or control of waste authorities. This includes waste collected from households and businesses.
London Shorthand for Greater London.
London Air Quality Network (LAQN) A network of air quality monitoring stations across London. The London Air Quality Network includes monitoring stations run by the majority of boroughs. It provides live and historical data on the web. Some boroughs choose to use other services to collect and display their data.
London Assembly The directly-elected London regional body comprising 14 constituency members and 11 pan-London members. A component of the Greater London Authority.
London Atmospheric Emissions Inventory (LAEI) A database of emissions sources and information about rates of emissions for air pollutants within and around London.
London Boiler Cashback Scheme A scheme (now closed) that provided 6,500 London homeowners or accredited landlords with £400 towards the cost of upgrading to a new, high efficiency boiler from the scheme, on a first come first serve basis.
London Councils An organisation that represents London’s 33 local authorities, and lobbies on their behalf. London Councils also runs a number of pan-London services.
3 9 5L O N D O N E N V I R O N M E N T S T R A T E G Y
London Fire and Emergency Planning Authority (LFEPA) The London Fire and Civil Defence Authority was reconstituted on 3 July 2000 as the London Fire and Emergency Planning Authority, which is directly accountable to the Mayor.
London Local Air Quality Management Framework (LLAQM) The statutory process used by local authorities to assess, review and improve air quality within their areas.
London Plan The Mayor’s spatial development strategy for London.
Low carbon circular economy See ‘Low carbon economy’ and ‘Circular economy’.
Low carbon economy A functioning economy that continues to minimise the carbon intensity of the activity that drives it.
Low carbon energy Energy generated with a low production of carbon. Low carbon energy is typically achieved using waste with high biomass (for example food and green garden waste) composition and/or using highly efficient energy generation techniques, such as combined heat and power. See definition of Combined Heat and Power.
Low Emission Zone (LEZ) A charging zone across most of Greater London for vehicles that do not meet emissions standards for particulate matter.
MMayor’s Fuel Poverty Action Plan The Mayor first announced the development of a Fuel Poverty Action Plan at Mayor’s Question Time in October 2016. While not a London-specific problem, fuel poverty has been increasing in London as a result of falling incomes, rising housing costs, and increasing income inequality. The plan identifies stakeholders that have a role to play in tackling fuel poverty with the Mayor’s effort focussed on targeting existing Mayoral programmes towards the fuel poor and supporting boroughs to increase enforcement of housing standards.
Mayor’s Office for Policing and Crime (MOPAC) Mayoral office responsible for policing in the capital outside the City of London.
Mayor’s Transport Strategy (MTS) Sets out the Mayor’s policies and proposals to reshape transport in London.
Methane / Bio-methane A greenhouse gas, 23 times stronger as a global warming gas than carbon dioxide. Methane / bio-methane is the predominant greenhouse gas from waste, mostly from biodegradable waste decomposing in landfill. Methane emissions from landfills make up approximately 40 per cent of UK greenhouse gas emissions.
Metropolitan Open Land Extensive areas of land bounded by urban development around London that fulfils a similar function to Green Belt and is protected from inappropriate development by land-use planning policies.
Microgeneration The small-scale generation of heat and power by individuals, small businesses and communities to meet their own needs, as alternatives to traditional centralized grid-connected power.
Mode shift Changing a journey from one mode of transport, such as a car, to another mode of transport, such as a bicycle or bus.
Municipal waste Household waste or business waste that is similar in composition irrespective of who collects or disposes of it.
NNational Park City The term coined by the Greater London National Park City Initiative to promote collective action for a city where people and nature are better connected. The Mayor has endorsed and adopted the term to describe the ways in which he will work with partners to make London greener by improving London’s green infrastructure.
Natural capital The economic benefits to people provided by the services the environment provides for free; such as cleaner air, cleaner water, better health, pollination, tranquility and access to nature.
Natural capital accounting A methodology for revealing the full economic value of natural capital by describing its benefits in monetary terms.
Nature conservation See ‘Conservation’.
Natural heritage An overarching term that describes the cultural associations connected to the human experience of biodiversity, natural landscape, geology and topography.
Natural landscape (or Landscape) The visible natural features of an area of land (such as trees, grasslands, rivers and lakes) that contribute to the aesthetic value or traditional character of an area.
Nitrogen dioxide A gas formed by combustion, identified as an air pollutant harmful to human health. The legal limit values measure concentrations of NO2 in the air.
Nitric oxides A generic term for nitrogen dioxide (NO2) and nitrogen monoxide (NO) – the latter can form NO2 in the atmosphere. Euro standards set NOx vehicle emissions limits.
Noise ‘Unwanted sound’. Noise includes vibration, except where the context indicates otherwise. Noise is classified as a pollutant in the European Directive on Integrated Pollution Prevention and Control.
Noise map Noise mapping is the representation of acoustic data in a cartographical format. Noise maps are in most cases computer-generated drawings showing outdoor noise levels laid over a base of geographical information. Noise maps are required by the Environmental Noise Directive for all member states.
3 9 7L O N D O N E N V I R O N M E N T S T R A T E G Y
Noise nuisance Defined by the World Health Organisation as ‘a feeling of displeasure evoked by noise’. Statutory nuisance has a more specific meaning and is subject to legal action under the Environmental Protection Act 1990.
Non-Road Mobile Machinery (NRMM) Any mobile machine, item of transportable industrial equipment or vehicle that has a combustion engine and is not intended for carrying passengers or goods on the street. Non-Road Mobile Machinery includes construction equipment, generators and other machinery.
OOld Oak and Park Royal Development Corporation (OPDC) A Mayoral Development Corporation with full planning powers for the Old Oak and Park Royal Opportunity Area in west London (see ‘Functional bodies’).
Opportunity Areas London’s principal areas of opportunity for accommodating large-scale development to provide substantial numbers of new jobs and homes. Each typically has more than 5,000 jobs and/or 2,500 homes, with a mixed and intensive use of land, assisted by good public transport accessibility.
Outer London See ‘Central, Inner and Outer London’.
PParticulate matter A mixture of various solid and liquid particles of various chemical compositions suspended in the air. (see PM10 and PM2.5).
Permeable surface Material that is itself impervious to water but, allows infiltration of water through the pattern of void formed through the surface. Examples include permeable paving and gravelled areas.
Photovoltaics (PV) The direct conversion of solar radiation into electricity by the interaction of light with electrons in a semiconductor device or cell.
PM2.5 Particulate matter that is 2.5 microns or less in diameter. Particulates of this size are small enough to penetrate deep into the lungs and other organs, causing a wide range of health impacts, and are therefore subject to legal limit values.
PM10 Particulate matter that is 10 microns or less in diameter. It is harmful to human health and subject to legal limit values.
Priority habitat London’s priority habitats are those areas of wildlife habitat which are of most importance in London. Most areas of priority habitat are protected within Sites of importance for Nature Conservation. A full list of priority habitats is included in Appendix 2B.
Priority species These are species that are a conservation priority because they are under particular threat, or they are characteristic of a particular region. A full list of priority species is provided in Appendix 2A.
Protected species Certain plant and animal species protected to various degrees in law, particularly the Wildlife and Countryside Act, 1981 (as amended).
Public realm Publicly accessible space between and within buildings, including streets, squares, forecourts, parks and open spaces.
QQuiet area Defined by the EU Environmental Noise Directive as an area, delimited by the competent authority, which is not exposed to a value of Lden or of another appropriate noise indicator greater than a certain value set by the Member State, from any noise source.
RRecharge (or groundwater recharge) The process of rainwater moving from the surface, through the soil, and into the aquifer (see ‘Aquifer’ and ‘Groundwater’).
Recycling The reprocessing of waste, either into the same product or a different one. Many non-hazardous industrial wastes such as paper, glass, cardboard, plastics and scrap metals can be recycled. Special wastes such as solvents can also be recycled by specialist companies, or by in-house equipment.
Regional Flood Risk Appraisal A strategic overview of flood risk across an area. It provides a high-level assessment of all sources of flooding, and addresses its probability and consequences.
Renewable energy Energy derived from a source that is continually replenished, such as wind, wave, solar, hydroelectric and energy from plant material, but not fossil fuels or nuclear energy. Although not strictly renewable, geothermal energy is generally included.
Renewable heating technology Low emission heating technologies, including ground source heat pumps, water source heat pumps, solar water heating, air source heat pumps, biomass and thermal stores.
Resilience Resilience is the ability of a system to recover from the effect of an extreme load that may have caused harm.
3 9 9L O N D O N E N V I R O N M E N T S T R A T E G Y
Responsible procurement Socially, environmentally and economically sustainable procurement to deliver an improved quality of life and better value for money. It involves working across London to provide sustained employment opportunities and improve working conditions. It means opening up access to contract opportunities for London’s diverse businesses, and voluntary and community sector organisations, encouraging improved practices with suppliers and promoting greater environmental sustainability to make London a better place to live and work.
Resuspension Over time, particulate matter settles onto the ground. When disturbed (e.g. when vehicles drive over settled particulate matter), these particulates can be returned to the atmosphere. This process is referred to as resuspension.
Retrofitting The addition of new technology or features to existing buildings, vehicles and infrastructure in order to make them more efficient and to reduce their environmental impacts.
SSmart Meter A smart meter is the next generation of a gas and electricity meter, measuring how much gas and electricity is being using, as well as what it’s costing consumers in pounds and pence, and displays this on an in-home display. The smart meter shows a digital meter reading and automatically sends the reading to your energy supplier at least once a month, so consumers will receive accurate, not estimated, bills.
Reuse Can be practised by the commercial sector with the use of products designed to be used a number of times, such as reusable packaging. Householders can purchase products that use refillable containers, or reuse plastic bags. The processes contribute to sustainable development and can save raw materials, energy and transport costs.
Site of Importance for Nature Conservation (SINC) Areas of land chosen to represent the best wildlife habitats in London and areas of land where people can experience nature close to where they live and work. Sites are classified into Sites of Metropolitan, Borough and Local Importance depending on their relative value. Unlike SSSIs SINCs are not legally protected, but their value must be considered in any land-use planning decision. Procedures for the identification of SINCs are set out in Appendix 5.
Site of Special Scientific Interest Areas of land with ecological or geological interest of national importance. They are designated by Natural England under the Wildlife and Countryside Act (1981 as amended) and have legal protection
Smart digital city Using new technologies and increased connectivity to make more efficient use of infrastructure and provide more efficient services.
Social housing An umbrella term referring to rental housing which may be owned and managed by the state, by not-for-profit organisations, or by a combination of the two, usually with the aim of providing affordable housing.
Soundscape The overall quality of an acoustic environment as a place for human experience. Soundscape design may encompass reduction or elimination of certain sounds (‘noise abatement’), preservation of certain sounds (‘soundmarks’), and the combination and balancing of sounds to create or enhance an attractive and stimulating acoustic environment (analogous to the sound engineering of products).
Street trees Trees planted along roads and highways, usually in tree pits in the pavement but also in road-side amenity green space.
Supplementary Planning Guidance Supplementary planning guidance gives further detail on certain policies found in the London Plan.
Surface water Rainwater lying on the surface or within surface water drains/sewers.
Sustainable development Development that meets the needs of the present without compromising the ability of future generations to meet their own needs.
Sustainable Drainage System (SuDS) Measures and techniques to help capture, use, delay the dispersal of, discharge or absorb surface water. London’s approach is set out in the Sustainable Drainage Action Plan.
TThames Estuary 2100 An Environment Agency plan with recommendations for flood risk management for London and the Thames estuary through to the end of the century and beyond. It takes an adaptive pathways approach, i.e. actions are adaptable to a range of change indicators, including changing climate, to ensure that the actions that are taken are the right ones, taken at the right time and will not waste money on over-engineered solutions.
Thames Tideway Tunnel A major new sewer that will help tackle the problem of sewer overflows into the River Thames.
Third sector Voluntary or not-for-profit organisations, charities, and social enterprises.
4 0 1L O N D O N E N V I R O N M E N T S T R A T E G Y
Tidal flooding Flooding as a result of exceptionally high tides, often combined with storm surges.
Transport for London (TfL) One of the GLA group of organisations, accountable to the Mayor, with responsibility for delivering an integrated and sustainable transport strategy for London.
Tyre and brake wear Friction between vehicle tyres and the road causes emissions of particulate matter into the atmosphere. Similarly, friction and wear within vehicle brakes emits particulate matter. These two sources are referred to as “tyre and break wear”
UUltra Low Emission Vehicle Vehicle with reduced emissions of air pollutants and CO2, including battery electric, hydrogen fuel cell electric, plug-in hybrid and range-extended electric vehicles.
Ultra Low Emission Zone (ULEZ) Charging zone in which vehicles that do not comply with emissions standards for air pollutants will be subject to a daily charge.
Urban forest A term to describe all of the trees (woodlands, street trees and trees in parks, gardens and other green spaces) within an urban area.
Urban Greening Factor A land-use planning tool to help determine the amount of greening required in new developments.
Urban heat island The height of buildings and their arrangement means that while more heat is absorbed during the day, it takes longer to escape at night. As a result, the centre of London can be up to 10°C warmer than the rural areas around the city. The temperature difference is usually larger at night than during the day. The UHI effect is noticeable during both the summer and winter months.
VVehicle Excise Duty (VED) A tax (also known as ‘vehicle tax’, ‘car tax’, and ‘road tax’) that is levied as an excise duty. It must be paid for most types of vehicles being used (or parked) on the public roads in the United Kingdom.
Virgin materials Natural materials that have not previously been used, such as (natural) wood, coal, gas or oil.
WWaste Any substance or object which the holder discards, intends to discard or is required to discard.
Waste authority A Waste Collection Authority and a Waste Disposal Authority. It includes London’s 33 waste collection authorities (all 32 boroughs and the City of London), those 12 authorities that are “unitary” waste authorities (combined collection and disposal) and the 4 statutory waste disposal authorities.
Waste collection authority The authority responsible for arranging the collection of household waste in their area (in London this is on a borough-wide basis) and commercial or industrial waste on request.
Waste disposal authority The authority responsible for arranging for the disposal of waste collected in their area by the Waste Collection Authority. They also provide sites where householders can deposit waste free of charge (Re-use and Recycling Centres).
Wildlife habitat See ‘Habitat’.
ZZero carbon Activity that causes no net release of carbon dioxide and other greenhouse gas emissions into the atmosphere.
Zero emission capable vehicle A vehicle that is constructed to be capable of operating in zero emission mode for at least part of its operating cycle. The zero emission mode may be augmented by an internal combustion engine configured to extend the driving range of the vehicle, either by propelling the driven wheels or by powering an on-board generator.
Zero emission zone A zone within which vehicles not capable of operating with zero-pollutant exhaust emissions are subject to road user charges (similar to ULEZ or LEZ) and/or other vehicle prohibitions or restrictions.
Zero waste city A city that makes best use of all its waste where market opportunities exist to recover value from it.


