Embed Size (px)
Citation preview

Long term exposure to ambient air pollution andincidence of acute coronary events: prospective cohortstudy and meta-analysis in 11 European cohorts fromthe ESCAPE Project
OPEN ACCESS
Giulia Cesaroni senior researcher 1, Francesco Forastiere research director 1, Massimo Stafoggiasenior researcher 1, Zorana J Andersen associate professor in epidemiology 2 3, Chiara Badaloniresearch fellow 1, Rob Beelen senior researcher 4, Barbara Caracciolo researcher 5 6, Ulf de Fairesenior professor of cardiovascular epidemiology 7, Raimund Erbel professor 8, Kirsten T Eriksenresearcher 2, Laura Fratiglioni professor in geriatric epidemiology 5 9 10, Claudia Galassi medicalepidemiologist 11, Regina Hampel research fellow 12, Margit Heier research fellow 12 13, Frauke Hennigresearch fellow 14, Agneta Hilding researcher 15, Barbara Hoffmann professor 14 16, Danny Houthuijssenior researcher17, Karl-Heinz Jöckel professor18, Michal Korek doctoral student7, Timo Lanki chiefresearcher 19, Karin Leander researcher 7, Patrik K E Magnusson professor 20, Enrica Miglioreepidemiologist11, Caes-Göran Ostenson professor15, Kim Overvad professor2122, Nancy L Pedersenprofessor of genetic epidemiology 20, Juha Pekkanen J professor 19, Johanna Penell researcher 7,Göran Pershagen professor7, Andrei Pyko research fellow7, Ole Raaschou-Nielsen head of researchgroup 2, Andrea Ranzi project manager in environmental epidemiology 23, Fulvio Ricceri researchfellow 24, Carlotta Sacerdote medical epidemiologist 11, Veikko Salomaa research professor 25, WimSwart researcher 17, Anu W Turunen researcher 19, Paolo Vineis professor in epidemiology 24 26,Gudrun Weinmayr research associate 14 27, Kathrin Wolf research fellow 12, Kees de Hoogh seniorresearch officer 26, Gerard Hoek associate professor 4, Bert Brunekreef professor 4 28, Annette Petersprofessor 12
1Department of Epidemiology, Lazio Regional Health Service, 00198 Rome, Italy; 2Danish Cancer Society Research Center, 2100 Copenhagen,Denmark; 3Center for Epidemiology and Screening, Department of Public Health, University of Copenhagen, 1014 Copenhagen, Denmark; 4Institutefor Risk Assessment Sciences, Utrecht University, PO Box 80178, 3508 TD Utrecht, Netherlands; 5Aging Research Center, Department ofNeurobiology, Care Sciences and Society, Karolinska Institutet, S-113 30 Stockholm, Sweden; 6Stress Research Institute, Stockholm University,SE-106 91 Stockholm, Sweden; 7Institute of Environmental Medicine, Karolinska Institutet, Box 210 SE-171 77 Stockholm, Sweden; 8West GermanHeart Center, University Hospital of Essen, 45122 Essen, Germany; 9Stockholm Gerontology Research Center, 113 30 Stockholm, Sweden;10Division of Clinical Geriatrics, Karolinska University Hospital, SE-141 86 Stockholm, Sweden; 11Unit of Cancer Epidemiology, “Città della Salutee della Scienza” Hospital, University of Turin, and Center for Cancer Prevention Piemonte, 10126 Turin, Italy; 12Helmholtz Zentrum München,German Research Center for Environmental Health, Institute of Epidemiology II, 85764 Neuherberg, Germany; 13Central Hospital of Augsburg,MONICA/KORA Myocardial Infarction Registry, D-86156 Augsburg, Germany; 14IUF-Leibniz Research Institute for Environmental Medicine, 40225Düsseldorf, Germany; 15Department of Molecular Medicine and Surgery, Karolinska Institutet, Karolinska University Hospital, SE-171 77 Stockholm,Sweden; 16Medical Faculty, University of Düsseldorf, 40225 Düsseldorf, Germany; 17National Insititute for Public Health and the Environment, POBox 1, 3720 BA Bilthoven, Netherlands; 18Institute for Medical Informatics, Biometry and Epidemiology, University Hospital of Essen, D-45122Essen, Germany; 19National Institute for Health and Welfare “THL”, Department of Environmental Health, PO Box 95, FI-70701 Kuopio, Finland;20Department of Medical Epidemiology and Biostatistics, Karolinska Institutet, SE-171 77 Stockholm, Sweden; 21Section for Epidemiology, Departmentof Public Health, Aarhus University, DK-8000 Aarhus, Denmark; 22Department of Cardiology, Cardiovascular Research Center, Aalborg UniversityHospital, DK-9000 Aalborg, Denmark; 23Environmental Health Reference Centre-Regional Agency for Environmental Prevention of Emilia-Romagna,41121 Modena, Italy; 24Molecular and Genetic Epidemiology Unit, HuGeF-Human Genetics Foundation-Turin, 10126 Turin, Italy; 25THL-National
No commercial reuse: See rights and reprints http://www.bmj.com/permissions Subscribe: http://www.bmj.com/subscribe
BMJ 2014;348:f7412 doi: 10.1136/bmj.f7412 (Published 21 January 2014) Page 1 of 16
Research
RESEARCH

Institute for Health andWelfare, Department of Chronic Disease Prevention, POB 30, FI-00271 Helsinki, Finland; 26MRC-HPA Centre for Environmentand Health, Department of Epidemiology and Biostatistics, Imperial College London, St Mary’s Campus, London W2 1PG, UK; 27Institute ofEpidemiology and Medical Biometry, Ulm University, 89069 Ulm, Germany; 28Julius Center for Health Sciences and Primary Care, University MedicalCenter Utrecht, PO Box 85500, 3508 GA Utrecht, Netherlands
AbstractObjectives To study the effect of long term exposure to airbornepollutants on the incidence of acute coronary events in 11 cohortsparticipating in the European Study of Cohorts for Air Pollution Effects(ESCAPE).
Design Prospective cohort studies and meta-analysis of the results.
Setting Cohorts in Finland, Sweden, Denmark, Germany, and Italy.
Participants 100 166 people were enrolled from 1997 to 2007 andfollowed for an average of 11.5 years. Participants were free fromprevious coronary events at baseline.
Main outcomemeasuresModelled concentrations of particulate matter<2.5 μm (PM2.5), 2.5-10 μm (PMcoarse), and <10 μm (PM10) in aerodynamicdiameter, soot (PM2.5 absorbance), nitrogen oxides, and traffic exposureat the home address based on measurements of air pollution conductedin 2008-12. Cohort specific hazard ratios for incidence of acute coronaryevents (myocardial infarction and unstable angina) per fixed incrementsof the pollutants with adjustment for sociodemographic and lifestyle riskfactors, and pooled random effects meta-analytic hazard ratios.
Results 5157 participants experienced incident events. A 5 μg/m3
increase in estimated annual mean PM2.5 was associated with a 13%increased risk of coronary events (hazard ratio 1.13, 95% confidenceinterval 0.98 to 1.30), and a 10 μg/m3 increase in estimated annual meanPM10was associated with a 12% increased risk of coronary events (1.12,1.01 to 1.25) with no evidence of heterogeneity between cohorts. Positiveassociations were detected below the current annual European limitvalue of 25 μg/m3 for PM2.5 (1.18, 1.01 to 1.39, for 5 μg/m
3 increase inPM2.5) and below 40 μg/m3 for PM10 (1.12, 1.00 to 1.27, for 10 μg/m
3
increase in PM10). Positive but non-significant associations were foundwith other pollutants.
Conclusions Long term exposure to particulate matter is associatedwith incidence of coronary events, and this association persists at levelsof exposure below the current European limit values.
IntroductionAccording to the recent report on the Global Burden of Disease,throughout the world particulate air pollution is estimated tocause 3.1 million deaths a year and 22% of disability adjustedlife years (DALY) due to ischaemic heart disease.1 Severalcohort studies have reported that long term exposure to airpollution is associated with mortality, in particularcardiovascular mortality.2-13 The evidence of an effect on
incidence of cardiovascular events—that is, acute myocardialinfarction and unstable angina—is less consistent and requiresfurther investigations.12-15
In the European Union the current annual limit for particulatematter <2.5 μm (PM2.5) is 25 µg/m3, which is far above thatimplemented in the United States (12 µg/m3). One obstacle inthe European standard setting process in the past had been thatthe available estimates of the exposure-response associationsof particulate matter were primarily based on studies conductedin North America.3-12 In response, the ESCAPE Study (EuropeanStudy of Cohorts for Air Pollution Effects) was conductedbetween 2008 and 2012 to quantify the associations betweenexposures and health outcomes by using standardised methodsfor assessment of exposure and data from existing cohortstudies.16 17
We estimated the association between long term exposure toparticulate matter <2.5 μm (PM2.5), 2.5-10 μm (coarse), <10 μm(PM10) in aerodynamic diameter, soot (PM2.5 absorbance),nitrogen oxides (NOx and NO2), and traffic indicators and theincidence of coronary events.We evaluated effect modificationby several individual characteristics, and we investigated theexposure-response relations of the pollutants below selectedthresholds.
MethodsDesign and populationThis study is an analysis of cohort data obtained by ESCAPEto investigate the long term effects of exposure to air pollutionon human health in Europe and a meta-analysis of the cohortspecific results. The present study included 11 European cohortsfrom five countries with information about incident cases ofacute coronary events and the most important potentialconfounders. The cohorts were in Finland (FINRISK)18; Sweden(the Swedish National Study on Aging and Care inKungsholmen (SNAC-K), the Screening Across the LifespanTwin Study, (SALT), the 60 year olds study, and the StockholmDiabetes Prevention Program study (SDPP))19-22; Denmark (theDanishDiet, Cancer andHealth cohort study [DCH])23; Germany(the Heinz Nixdorf Recall Study (HNR), the Cooperative HealthResearch in the Augsburg Region (KORA))24 25; and Italy (theEuropean Prospective Investigation into Cancer and Nutrition
Correspondence to: G Cesaroni [email protected]
Extra material supplied by the author (see http://www.bmj.com/content/348/bmj.f7412?tab=related#webextra)
Appendix: Cohort details and noise assessment
Video on bmj.com (see also http://bmj.com/video)
Video abstract
No commercial reuse: See rights and reprints http://www.bmj.com/permissions Subscribe: http://www.bmj.com/subscribe
BMJ 2014;348:f7412 doi: 10.1136/bmj.f7412 (Published 21 January 2014) Page 2 of 16
RESEARCH

in Turin (Epic-Turin), the International Study on Asthma andAllergies in Childhood in Turin and Rome (parents ofrepresentative samples of children participating in SIDRIA-Turinand SIDRIA-Rome)).26 27 These were all centres included in theESCAPE intensivemonitoring programme for particulate matterand nitrogen oxides.28 29 Table 1 shows specific settings, periodsof recruitment, and person years at risk⇓. With the exceptionof the Italian cohorts, all the cohorts enrolled representativesamples of the adult population for the age groups consideredin the single studies. Additional information on each cohort ispresented in the appendix.
Outcome definitionFor nine out of 11 cohorts, information on coronary events wasderived by record linkage procedures with hospital dischargeand mortality registries. We selected international classificationof diseases (ICD) codes for “acute myocardial infarction” or“other acute and sub-acute forms of ischemic heart disease”(ICD-9-CM codes: 410, 411; ICD-10 codes: I21, I23, I20.0,I24) in principal diagnoses of hospital discharges. We alsoconsidered as incident cases those people who died outsidehospital from ischaemic heart diseases, according to the deathcertificates (ICD-9: 410-414; ICD-10: I20-I25) and had noevidence of hospital admission for ischaemic heart disease inthe 28 days before death and no evidence of admission for anycause in the two days before death. To identify incident cases,we excluded those who had had an acute coronary event orcerebrovascular event previously (previous admission to hospitalwith principal or secondary diagnoses with ICD-9 codes 410,411, 430, 431, 434, 436 and ICD-10 codes I21, I23, I20.0, I24,I61, I63, I64). The reference period to evaluate previous eventsvaried across the cohorts, with the minimum of three years inthe two SIDRIA cohorts and all lifelong history for the KORAcohort. For the HNR study, incident cases were adjudicated byan independent end point committee based onmedical records.24For the KORA cohort, incident cases were determined byinterview and medical history and validated through linkagewith the myocardial infarction register.25
Exposure to air pollutionExposure to air pollution in each area was estimated followinga standard methods developed for the ESCAPE project anddescribed elsewhere.28 29 Briefly, for each area under study,particulate matter of varying sizes measured in μm (shown assubscript)—that is, PM10, coarse PM, PM2.5, and PM2.5
absorbance (blackness of the PM2.5 exposed filter, determinedby measurement of light reflectance as a marker for soot andblack carbon)—was measured in 20 sites, and nitrogen oxideswere measured in 40 sites in three separate two week periods(to cover different seasons) over one year (between 2008 and2011). For each site, results from the three measurements wereaveraged to estimate the annual average, with adjustment fortemporal variation by using a centrally located backgroundreference site, which was operated for a whole year.30 31By usingseveral traffic and land use variables, we developed area specificland use regression (LUR)models to explain the spatial variationof each measured pollutant. These models were then used toestimate concentrations of air pollution at each participant’sresidential address. Geographical variables typically evaluatedinclude altitude, population density, industrial land use, greenspace, and traffic flows variables.30 31 In addition toconcentrations of pollutants, we considered two traffic variablesat the participant’s residence: traffic intensity on the nearestroad (vehicles/day) and traffic load on major roads in a 100 mbuffer (vehicles×m/day), defined as the sum of traffic intensity
on roads with >5000 vehicles/day multiplied by the length ofthose roads in a 100 m buffer. To validate the models, we usedthe leave one out cross validation method— that is,systematically subtracting each of the monitoring points fromthe model one by one, and then comparing the predicted valuefor each monitoring location with the measured level at thelocation without using this measurement in the development ofthe model.30 31
CovariatesAll cohorts had a common set of potential confounders andeffect modifiers at baseline: marital status (coded as single,married/living with partner, divorced/separated, widowed; forthe SDPP cohort only the binary variable “living with partner”was available; for SIDRIA-Rome all participants were livingas couples at baseline), education (primary school or less, up tosecondary school or equivalent, university degree and more),occupation (employed, unemployed, homemaker/housewife,retired), smoking status (current, former, never), duration ofsmoking (years), smoking intensity (cigarettes/day),hypertension, and diabetes. Most cohorts had information onadditional cardiovascular risk factors such as body mass index(BMI; coded as <25, 25-29, ≥30), physical activity (<1hour/week, about 1 hour/week, >2 hours/week), alcoholconsumption (never, 1-3 drinks/week, 3-6 drinks/week, >6drinks/week), and three cohorts had information on use of drugsfor hormone replacement therapy. Four of 11 cohorts had dataon cholesterol concentrations. Ten of 11 cohorts had data onnoise exposure, estimated at the residential addresses fromEuropean noise exposure assessment in 2007, and we used aneight class categorical variable of 5 dB of exposure from 45 dBto 75 dB and more (see appendix). Each cohort also used anarea based socioeconomic status indicator becausesocioeconomic indicators at the area level are predictors ofmorbidity, access to care, and lifestyle risk factors in additionto individual socioeconomic characteristics.32
Statistical analysesTo evaluate the association between exposure to air pollutionand incidence of coronary events we performed the analyses intwo stages. Firstly, we analysed each cohort using a commonprotocol for confounders, outcomes, and statistical modelling.We used Cox proportional hazards regression models (hazardratios) with age as the time scale. A script with statistical codewas provided to all cohort specific analysts. The results wereevaluated centrally at the Department of Epidemiology in Rome.Secondly, we carried out a random effects meta-analysis to poolresults.33We calculated I2 statistics and P values for χ2 test fromCochran’s Q to quantify the heterogeneity among studies.34
We first estimated hazard ratios adjusted for age, sex, and yearof enrolment only (model 1), then adjusted for a common setof individual covariates (marital status, education, occupation,smoking status, smoking duration, and smoking intensity; model2), and then adjusted for area based socioeconomic statusindicators (model 3). When investigating the effects of trafficvariables we also adjusted all models for backgroundNO2 levels.We estimated the effects of exposure to air pollution using fixedincrements of pollutants (20 µg/m3 for NOx, 10 µg/m3 for PM10
and NO2, 5 µg/m3 for PM2.5 and PMcoarse,10−5/m for PM2.5
absorbance).We performed several sensitivity analyses to deal with potentialsources of bias and to consider the confounding role ofadditional cardiovascular risk factors. Firstly, we adjusted forpossible intermediate variables (diabetes, hypertension) available
No commercial reuse: See rights and reprints http://www.bmj.com/permissions Subscribe: http://www.bmj.com/subscribe
BMJ 2014;348:f7412 doi: 10.1136/bmj.f7412 (Published 21 January 2014) Page 3 of 16
RESEARCH
in all the cohorts; then for physical activity, alcoholconsumption, and BMI (available in eight cohorts); finally weadded to previously mentioned factors the cholesterolconcentration (available in four cohorts). We then analysed therole of living in low/high urbanised settings, of noise exposure,and of residential stability (restricting the analysis to those livingat the same baseline address during the follow-up).We stratifiedthe Cox model 3 for predictors that did not meet theproportionality hazard assumption. We analysed the influentialrole of the largest cohort by excluding the DCH study from theanalysis. Finally, we evaluated the role of the performance ofland use regression models, stratifying cohorts by crossvalidation R2> or ≤60%.To explore the effect of clustering by area of residence in theassociation between exposure and mortality—that is, residentsin the same area usually share similar characteristics(socioeconomic status, health, access to services) and havesimilar environmental and air conditions—we performed afrailty model to measure the role each area played.4
We evaluated potential effect modification by adding to model3 an interaction term of exposure and one effect modifier at atime (sex, educational level, smoking status, BMI, hypertension,and residence in low or high urbanised settings). We used thelikelihood ratio test to compare the models with and withoutinteraction terms. For age during follow-up, we estimated effectmodification by adding an interaction term between exposureand a time dependent categorical variable indicating age group(<60, 60-74, >75).To provide information about the health effects below specificthreshold values (20, 30, and 40 µg/m3 for PM10, and 15, 20,and 25 µg/m3 for PM2.5), we studied the effect of fixedincrements of PM2.5 and PM10 among people with air pollutionconcentrations at residences only below these thresholds.We used STATA software (versions 10, 11, and 12) for all theanalyses, with the exception of frailty models for which we usedR (www.r-project.org).
ResultsTable 1 shows a summary description of the 11 Europeancohorts⇓. Table 2 shows individual characteristics ofparticipants⇓ and table 3 their exposures to air pollution⇓.Additional characteristics of the participants are provided intable 4⇓. The enrolment period covered 15 years, and theaverage follow-up was 11.5 years. The participating cohortsvaried in characteristics, availability of data on covariates, andlevels of exposure. The proportion of participants included inthe study ranged from 82.4% to 99.3% of the original cohorts(overall 93.1%), after exclusion of missing values on any of thecovariates in model 3. There were no differences in exposurelevels between included and excluded participants. Among 100166 participants included in the study and followed for 1 154386 person years, there were 5157 incident cases. The averagePM2.5 level at residence ranged from 7.3 µg/m3 in Sweden(SD=1.3) to 31.0 µg/m3 (SD=1.7) in northern Italy, and all otherpollutants had similar patterns. All exposure models had goodperformance (R2 ≥0.61), and the prediction ability of modelsfor nitrogen dioxides (based on a larger number ofmeasurementssites) was slightly higher than those of particulate models.Table 5⇓ shows the pooled hazard ratios with 95% confidenceintervals for incidence of coronary events for fixed incrementsof all pollutants.We observed the strongest association for PM10.While in model 1 (adjusted for age, sex, and calendar period)all particulate matter indicators were strongly associated withincidence of coronary events, when we adjusted for marital
status, education, occupation, smoking status, smoking duration,smoking intensity, and socioeconomic area indicator (model 3),only PM10 showed a significant association (hazard ratio 1.12,95% confidence interval 1.01 to 1.25, for each 10 µg/m3
increase). There was also an association for PM2.5 (1.13, 0.98to 1.30, for each 5 µg/m3 increase) and for coarse particles,whereas only small positive associations were found for nitrogenoxides. There was no evidence of an effect of traffic variables.There was no evidence of statistical heterogeneity between thecohort specific effect estimates (I2<5%). The figure⇓ shows theforest plots of 10 µg/m3 PM10 and 5 µg/m3 PM2.5 increments(model 3).Table 6⇓ shows the results of the sensitivity analyses for PM10
and PM2.5 from the base model (model 3), reporting the numberof cohorts and participants included in each analysis. Overall,there were only a few marginal changes in the effect estimatesacross the various models, and there was no evidence ofheterogeneity among cohorts. When we considered diabetesand hypertension in the adjustment, the effect estimates for PM10
and for PM2.5 were slightly lower (hazard ratio 1.11 (95%confidence interval 1.00 to 1.24) and 1.11 (0.96 to 1.28),respectively). When we considered physical activity, alcoholconsumption, and BMI in the eight cohorts with availableinformation, the association between particulate matter andincidence of coronary events remained stable. Adjustment forcholesterol in the four cohorts with this variable did not alterthe results. Adjustment for location of residence (urban,suburban/rural) slightly increased the effect estimates. In 63121 participants who did not change their address during thefollow-up, the effect estimate of air pollution was higher thanin the whole population (hazard ratio 1.16 (1.01 to 1.32) for 10μg/m3 PM10, and 1.18 (0.98 to 1.42) for 5 μg/m3 PM2.5), possiblybecause of more accurate exposure assignment. Exclusion ofthe large DCH study did not influence the results. When werestricted themeta-analysis to nine cohorts with exposuremodelswith high cross validation (R2 >60) for PM10 and six cohorts forPM2.5, we found stronger associations (hazard ratio 1.18 (1.05to 1.33) for 10 μg/m3 PM10, and 1.35 (1.04 to 1.74) for 5 μg/m3
PM2.5). When we took individual and area level covariates intoaccount, we found no evidence of clustering in theneighbourhoods (data not shown).Effect modification by age showed stronger PM2.5 effects forthose aged 60-74 (hazard ratio 1.25, 95% confidence interval1.03 to 1.51) and for those >75 (1.18, 0.85 to 1.64) than amongthose aged under 60 (0.91, 0.71 to 1.15), with P=0.11 for effectmodification. For all other effect modifiers, the P value of effectmodification was far from significant (≥0.22).Table 7⇓ shows the results of the threshold analysis for PM2.5
and PM10. When we restricted the analysis to participants fromnine cohorts exposed to PM2.5 concentrations below the currentEuropean limit value (<25 µg/m3), there was a 18% increasedrisk per 5 µg/m3 increase in PM2.5 (hazard ratio 1.18, 95%confidence interval 1.01 to 1.39). Similarly, for PM10 below thecurrent European limit value (40 µg/m3) there was a 12%increased risk per 10 µg/m3 increase in PM10 (1.12, 1.00 to 1.27).The effect was present even at exposure levels <15 µg/m3 forPM2.5 and <20 µg/m3 for PM10. This result was not an artefactcaused by cohort selection at different thresholds as it persistedwhen we the restricted analysis to the seven cohorts with dataavailable in each threshold (table 7, right columns⇓).
DiscussionThis European multicentre study found that long term exposureto particulate air pollution is associated with an increased risk
No commercial reuse: See rights and reprints http://www.bmj.com/permissions Subscribe: http://www.bmj.com/subscribe
BMJ 2014;348:f7412 doi: 10.1136/bmj.f7412 (Published 21 January 2014) Page 4 of 16
RESEARCH

of first coronary events. For both particulate matter withdiameter <10 μm and <2.5 μm (PM10 and PM2.5), we foundassociations at levels below the current European limits. Theresults were substantially robust to adjustment for confoundingand model specification.
Comparison with other studiesOur effect estimates are similar to or higher than those fromtwo cohort studies from the US. For an increase of 10 µg/m3 inPM2.5, Miller and colleagues found a 21% (hazard ratio 1.21,95% confidence interval 1.04 to 1.42) increased risk of firstcoronary heart disease in postmenopausal women, and a(non-significant) 6% higher risk of myocardial infarction.9 Inthe USNurses’ Health Study,11 there was an increased incidenceof coronary heart disease for a 10 µg/m3 increase in PM2.5 (hazardratio 1.11, 0.79 to 1.55) and for a 10 µg/m3 increase in coarseparticles (1.04, 0.82 to 1.32). In the UK, Atkinson and colleaguesfound a non-significant 1% (−2% to 5%) higher risk in incidentmyocardial infarction per 3 µg/m3 increase in PM10.14 In theCalifornia Teachers Study, Lipsett and colleagues found noevidence of increased myocardial infarction incidence per10µg/m3 increments in PM2.5 and PM10.12 The results are also inline with the evidence produced so far by studies on the shortterm effects of particulate matter on ischaemic heart disease.35 36
We found a suggestion of a higher risk associated withparticulate exposure in participants aged over 60. Evidence onwhich age range is the most susceptible is mixed. Miller andcolleagues found a higher risk in those aged >70 compared with<70,9 while Gan and colleagues found higher risks in firstadmissions to hospital for coronary heart disease in both thoseaged <60 and 60-69 than those aged ≥70.5
We found an effect of PM2.5 below 25, 20, and 15 μg/m3, andour results highlight the possible harmful health effects of fineparticles well below the current EU annual limit for PM2.5. It isclear that generalisability of these findings to the entire Europeanpopulation is not straightforward because the cohorts are notrepresentative of the European population. Besides thedifferences among the cohorts in age range and underlying riskprofiles, however, we detected no heterogeneity in the effectestimates among the cohorts.There are several possible mechanisms through which exposureto air pollution can affect the cardiovascular system, includingsystemic inflammation, systemic oxidative stress, thrombosisand coagulation, changes in blood pressure, progression ofatherosclerosis, and reduced heart rate variability.15Most of thisevidence comes from studies of short term exposures and shortterm responses of cardiovascular function. The pathwaysimplicated provide plausible biological mechanisms based onrepeated exacerbations of cardiovascular risk factors potentiallyleading to long term progression of coronary artery disease.15 37
It is unlikely that our findings are driven by an excess incoronary disease mortality because in these and some othercohorts participating in the ESCAPE project we could not findmuch evidence of an association between exposure to airpollution andmortality for ischaemic heart disease or myocardialinfarction.38
Our main positive results for coronary events are for anassociation with particulate matter, and the evidence for otherpollutants such as nitrogen oxides could be considered assuggestive based on the small positive estimates. Severalpredictor variables explained the spatial variation of PM10 andPM2.5 in ESCAPE study areas,30 including not only trafficvariables but also population density, industrial sources, urbangreen, and altitude. Estimated PM10 at place of residence
therefore represents not only traffic emissions. In contrast, thespatial variation in PM2.5 absorbance was more exclusivelyexplained by traffic variables. Our findings suggest that sourcesother than vehicular traffic can have an important role on therisk of acute ischaemic heart disease.
Strengths and weaknessesIn this first multicentre European study to investigate long termeffects of air pollution on incidence of coronary events, we useda standardised approach for assessment of exposure with respectto measurements andmodelling.28-31Both the measurements andthe land use regression models were centrally validated, anddata analyses were centrally planned and conducted in the sameway in each cohort. The European locations captured in thisproject provide a wide range of exposures and mixtures thatvary from north to south. Although the design of the study didnot allow us to benefit from the large variability of pollutantexposure between cohorts, we took advantage of the exposurevariation within cohorts. The use of existing cohorts, notdesigned for air pollution epidemiology, might be seen as alimitation of the ESCAPE project. Indeed, we were able toperform a planned meta-analysis and make the most of existingstudies in an efficient way. Therefore, we consider these datathe first systematic assessment of the impact of ambient particleson incident coronary artery disease in Europe, highlighting thatthe burden of disease might be underestimated when estimatesof mortality are considered alone.15 39
The assessment of exposure was conducted in 2008-11, whilethe cohorts were enrolled over 15 years, starting in 1992. Theuse of modelled concentrations based on measurements takenlong after the beginning of the study assumes that spatialcontrasts were stable over time, an assumption that has beensupported from observations in different settings.40-42 In theESCAPE project considerable effort was made to take thisproblem into account; when possible, we back-extrapolated airpollution concentrations.17Analyses of the association betweenback-extrapolated concentrations and incidence of coronaryevents made no important difference.We collected individual data onmany cardiovascular risk factorsto deal with confounding. When we compared the results of the“base model” with a model containing additional cardiovascularrisk factors, we obtained similar results. It should be noted thatvariables used to adjust for area level socioeconomic status weredifferent from cohort to cohort, ranging from the percentage oflow income inhabitants in a 5 km grid in KORA to a censusblock deprivation index in the Italian cohorts. We could notdetermine whether this might have affected the results, butgeneral adjustment for area level socioeconomic indicators didnot have much influence in cohort specific analyses. Data onthe most relevant cardiovascular risk factors (smoking, diabetesor hypertension, BMI, physical activity) were available foralmost all cohorts, therefore a strong bias in the effect estimatescaused by confounding is unlikely. Nevertheless, we cannotrule out residual confounding by, for example, differences indiet. In addition, we observed evidence for effect modification,but even within this large multicentre study, the power toreliably detect effect modification is limited and therefore weselected a limited set of interactions to evaluate a priori.All cohorts, with the exception of the DCH study, enrolled fewerthan 10 000 participants, making the statistical power to detecteffects of air pollution in single studies limited. Thecharacteristics of participants were heterogeneous, with twocohorts having younger participants than the others. Youngerage could be a reason for the smaller effects found in some of
No commercial reuse: See rights and reprints http://www.bmj.com/permissions Subscribe: http://www.bmj.com/subscribe
BMJ 2014;348:f7412 doi: 10.1136/bmj.f7412 (Published 21 January 2014) Page 5 of 16
RESEARCH

the cohorts. Finally, in nine out of 11 cohorts outcomes wereascertained from routine administrative databases, which couldhave led to a less precise effect estimate from misclassificationof the outcome.When we included only the studies with the best exposureassessment models (performance of the land use regressionleave-one-out cross validation R2>60%), we found increasedeffect estimates. This could be because of reducedmisclassification of exposure. The cohorts with validation R2
≤60%, however, had young participants and (in particular theItalian ones) had higher rates of smoking and a better exposureassessment might be not the only explanation.
ConclusionsOur study suggests an association between long term exposureto inhalable particulate matter and incidence of coronary events.These associations remained for exposure concentrations belowthe current European limits. The results of this study, togetherwith other ESCAPE findings, support lowering of Europeanlimits for particulate air pollution to adequately protect publichealth.
We thank Marjan Tewis, Marieke Oldenwening, Marloes Eeftens, UlrichQuass, Lee-Jane Sally Liu for their help with exposure assessment anddata management within ESCAPE.For the Finnish part, additional funding came from the Academy ofFinland (project number 129317). Exposure assessment was performedby Tarja Yli-Tuomi, Pekka Taimisto, and Arto Pennanen from theDepartment of Environmental Health. Mortality, area-level SES, andbuilding data were provided by Statistics Finland.The four Swedish cohorts (SNAC-K, SALT, 60y, SDPP) were partiallyfunded by the Swedish Environmental Protection Agency, the SwedishCouncil for Working Life and Social Research and the SwedishHeart-Lung Foundation. The SALT cohort was additionally supportedby NIH grant AG-08724. The 60 year cohort was additionally funded bythe Stockholm County Council and the Swedish Research Council(longitudinal research and 0593). The SDPP cohort was additionallyfunded by the Stockholm County Council; the Swedish ResearchCouncil; the Swedish Diabetes Association; and the Novo NordiskScandinavia. We thank the Heinz Nixdorf Foundation, the GermanMinistry of Education and Science (BMBF), the German AerospaceCenter (Deutsches Zentrum für Luft- und Raumfahrt (DLR)), and theGerman Research Foundation (DFG HO 3314/2-1 and JO170/8-1),Bonn, Germany, for their generous support of Heinz Nixdorf Recallstudy. The KORA research platform and the MONICA Augsburg studieswere initiated and financed by the Helmholtz ZentrumMünchen, GermanResearch Center for Environmental Health, which is funded by theGerman Federal Ministry of Education and Research and by the Stateof Bavaria. The SIDRIA cohort study was partially funded by the ItalianMinistry of Health. Giuseppe Costa provided data from the TurinLongitudinal Study for the follow-up of the SIDRIA-Turin cohort. Exposureassessment in Turin was performed by Daniela Raffaele and MarcoGilardetti. Noise assessment in Turin was performed by Daniele Grassoand Jacopo Fogola (Regional Agency for the Protection of theEnvironment of Piedmont). We thank Simone Bucci, Patrizio Pasquinelli,and Eleonora Zirro for exposure assessment in Rome.Contributors: GC contributed to the design, exposure assessment, dataanalyses, and drafted the manuscript; FF contributed to the design,provided local cohort data and drafted the manuscript; MS contributedto the design, statistical script, and data analyses; ZJA, RH contributedto the statistical script and data analysis; CB, FH, EM, JPen, APy, FR,and AT contributed to the data analyses; RB, GH contributed to thedesign, exposure assessment and statistical script; BC, UdF, RE, LF,MH, AH, KHJ, KL, PKEM, CGO, KO, NLP, JPek, CS, and VS provided
local cohort data; CG contributed to exposure assessment and providedlocal cohort data; BH, ORN, GP, and PV contributed to the design andprovided local cohort data; MK contributed to the exposure assessmentand the data analyses; KTE, DH, TL, AR, WS, and KdH contributed toexposure assessment; GW and KW contributed to the statistical script;BB and APe contributed to the design and drafted the manuscript. Allauthors contributed to critical reading of and comments to themanuscript, interpretation of data and approved the final draft. GC isguarantor.Funding: The research leading to these results has received fundingfrom the European Community’s Seventh Framework Program(FP7/2007-2011) under grant agreement No 211250. The sources offunding had no role in study design, data collection, analyses,interpretation, and decision to submit the article for publication.Competing interests: All authors have completed the ICMJE uniformdisclosure form at www.icmje.org/coi_disclosure.pdf and declare: nosupport from any organisation for the submitted work; no financialrelationships with any organisations that might have an interest in thesubmitted work in the previous three years; no other relationships oractivities that could appear to have influenced the submitted work.Ethical approval: The original cohort studies were approved byappropriate institutional review boards complying with all relevantnational, state, and local regulations.Transparency statement: The lead author affirms that this manuscriptis an honest, accurate, and transparent account of the study beingreported; that no important aspects of the study have been omitted; andthat any discrepancies from the study as planned have been explained.Data sharing: meta-analytic data and statistical code are available fromthe corresponding author.
1 Lim SS, Vos T, Flaxman AD, Danei G, Shibuya K, Adair-Rohani H, et al. A comparativerisk assessment of burden of disease and injury attributable to 67 risk factor clusters in21 regions, 1990-2010: a systematic analysis for the Global Burden of Disease Study2010. Lancet 2012;380:2224-60.
2 Beelen R, Hoek G, van den Brandt PA, Goldbohm RA, Fischer P, Schouten LJ, et al.Long-term effects of traffic-related air pollution on mortality in a Dutch cohort (NLCS-AIRstudy). Environ Health Perspect 2008;116:196-202.
3 Chen LH, Knutsen SF, Shavlik D, Beeson WL, Petersen F, Ghamsary M, et al. Theassociation between fatal coronary heart disease and ambient particulate air pollution:Are females at greater risk? Environ Health Perspect 2005;113:1723-9.
4 Crouse DL, Peters PA, van Donkelaar A, Goldberg MS, Villeneuve PJ, Brion O, et al.Risk of nonaccidental and cardiovascular mortality in relation to long-term exposure tolow concentrations of fine particulate matter: a Canadian national-level cohort study.Environ Health Perspect 2012;120:708-14.
5 Gan WQ, Koehoorn M, Davies HW, Demers PA, Tamburic L, Brauer M. Long-termexposure to traffic-related air pollution and the risk of coronary heart disease hospitalizationand mortality. Environ Health Perspect 2011;119:501-7.
6 Jerrett M, Burnett RT, Ma R, Pope CA 3rd, Krewski D, Newbold KB, et al. Spatial analysisof air pollution and mortality in Los Angeles. Epidemiology 2005;16:727-36.
7 Krewski D, Jerrett M, Burnett RT, Ma R, Hughes E, Shi Y, et al. Extended follow-up andspatial analysis of the American Cancer Society study linking particulate air pollution andmortality. HEI Research Report 140. Health Effects Institute, 2009.
8 Laden F, Schwartz J, Speizer FE, Dockery DW. Reduction in fine particulate air pollutionand mortality: extended follow-up of the Harvard Six Cities study. Am J Respir Crit CareMed 2006;173:667-72.
9 Miller KA, Siscovick DS, Sheppard L, Shepherd K, Sullivan JH, Anderson GL, et al.Long-term exposure to air pollution and incidence of cardiovascular events in women. NEngl J Med 2007;356:447-58.
10 Pope CA 3rd, Burnett RT, Thurston GD, Thun MJ, Calle EE, Krewski D, et al.Cardiovascular mortality and long-term exposure to particulate air pollution: epidemiologicalevidence of general pathophysiological pathways of disease. Circulation 2004;109:71-7.
11 Puett RC, Hart JE, Yanosky JD, Paciorek C, Schwartz J, Suh H, et al. Chronic fine andcoarse particulate exposure, mortality, and coronary heart disease in the Nurses’ HealthStudy. Environ Health Perspect 2009;117:1697-701.
12 Lipsett MJ, Ostro BD, Reynolds P, Goldberg D, Hertz A, Jerrett M, et al. Long-termexposure to air pollution and cardiorespiratory disease in the California teachers studycohort. Am J Respir Crit Care Med 2011;184:828-35.
13 Raaschou-Nielsen O, Andersen ZJ, Jensen SS, Ketzel M, Sørensen M, Hansen J, et al.Traffic air pollution and mortality from cardiovascular disease and all causes: a Danishcohort study. Environ Health 2012;11:60.
14 Atkinson RW, Carey IM, Kent AJ, van Staa TP, Anderson HR, Cook DG. Long-termexposure to outdoor air pollution and incidence of cardiovascular diseases. Epidemiology2013;24:44-53.
15 Brook RD, Rajagopalan S, Pope CA 3rd, Brook JR, Bhatnagar A, Diez-Roux AV, et al;American Heart Association Council on Epidemiology and Prevention, Council on theKidney in Cardiovascular Disease, and Council on Nutrition, Physical Activity andMetabolism. Particulate matter air pollution and cardiovascular disease: an update to thescientific statement from the American Heart Association. Circulation 2010;121:2331-78.
16 ESCAPE. European study of cohorts for air pollution effects. www.escapeproject.eu.
No commercial reuse: See rights and reprints http://www.bmj.com/permissions Subscribe: http://www.bmj.com/subscribe
BMJ 2014;348:f7412 doi: 10.1136/bmj.f7412 (Published 21 January 2014) Page 6 of 16
RESEARCH

What is already known on this topic
Ambient particulate matter air pollution is estimated to cause 3.1 million deaths worldwide per year, and 22% of DALYs (disability adjustedlife years) from ischaemic heart diseaseThe association between long term exposure to air pollution and incidence of coronary events remains controversial
What this study adds
There is an association between outdoor particulate matter and incidence of acute coronary events, even for exposure levels below thecurrent European limitsThe burden of disease attributable to outdoor particulate matter might be underestimated if only estimates of mortality are consideredThe results of this study support lowering of the EU limits for particulate matter air pollution
17 Beelen R, Raaschou-Nielsen O, Stafoggia M, Andersen ZJ, Weinmayr G, Hoffmann B,et al. Effects of long-term exposure to air pollution on natural cause mortality: an analysisof 22 European cohorts within the multi-center ESCAPE project. Lancet Early onlinepublication 9 December 2013. http://dx.doi.org/10.1016/S0140-6736(13)62158-3.
18 Vartiainen E, Laatikainen T, Peltonen M, Juolevi A, Männistö S, Sundvall J, et al.Thirty-five-year trends in cardiovascular risk factors in Finland. Int J Epidemiol2010;39:504-18.
19 Meinow B, Kåreholt I, Lagergren M. According to need? Predicting the amount of municipalhome help allocated to elderly recipients in an urban area of Sweden. Health Soc CareCommunity 2005;13:366-377.
20 Lichtenstein P, Sullivan PF, Cnattingius S, Gatz M, Johansson S, Carlström E, et al. TheSwedish Twin Registry in the Third Millennium—an update. Twin Res Hum Genet2006;9:875-82.
21 Wandell PE, Wajngot A, de Faire U, Hellenius ML. Increased prevalence of diabetesamong immigrants from non-European countries in 60-year-old men and women inSweden. Diabet Metab 2007;33:30-6.
22 Eriksson AK, Ekbom A, Granath F, Hilding A, Efendic S, Ostenson CG. Psychologicaldistress and risk of pre-diabetes and Type 2 diabetes in a prospective study of Swedishmiddle-aged men and women. Diabet Med 2008;25:834-42.
23 Tjønneland A, Olsen A, Boll K, Stripp C, Christensen J, Engholm G, et al. Study design,exposure variables, and socioeconomic determinants of participation in diet, cancer andhealth: a population-based prospective cohort study of 57,053 men and women inDenmark. Scand J Public Health 2007;35:432-41.
24 Erbel R, Möhlenkamp S, Moebus S, Schmermund A, Lehmann N, Stang A, et al. HeinzNixdorf Recall Study Investigative Group. Coronary risk stratification, discrimination, andreclassification improvement based on quantification of subclinical coronary atherosclerosis:the Heinz Nixdorf Recall study. J Am Coll Cardiol 2010;56:1397-406.
25 Holle R, Happich M, Löwel H, Wichmann HE; MONICA/KORA Study Group. KORA—aresearch platform for population based health research.Gesundheitswesen 2005;67(suppl1):S19-25.
26 Cesaroni G, Badaloni C, Porta D, Forastiere F, Perucci CA. Comparison between variousindices of exposure to traffic-related air pollution and their impact on respiratory health inadults. Occup Environ Med 2008;65:683-90.
27 Vineis P, Hoek G, Krzyzanowski M, Vigna-Taglianti F, Veglia F, Airoldi L, et al. Air pollutionand risk of lung cancer in a prospective study in Europe. Int J Cancer 2006;119:169-74.
28 Cyrys J, Eeftens M, Heinrich J, Ampe C, Armengaud A, Beelen R, et al. Variation of NO2and NOx concentrations between and within 36 European study areas: results from theESCAPE study. Atmosph Environ 2012;62:374-90.
29 Eeftens M, Tsai M, Ampe C, Anwander B, Beelen R, Bellander T, et al. Spatial variationof PM2.5, PM10, PM2.5 absorbance and PMcoarse concentrations between and within 20European study areas and the relationship with NO2—results of the ESCAPE project.Atmosph Environ 2012;62:303-17.
30 Eeftens M, Beelen R, de Hoogh K, Bellander T, Cesaroni G, Cirach M, et al. Developmentof land use regression models for PM(2.5), PM(2.5) absorbance, PM(10) and PM(coarse)
in 20 European Study Areas; Results of the ESCAPE Project. Environ Sci Technol2012;46:11195-205.
31 Beelen R, Hoek G, Vienneau D, Eeftens M, Dimakopoulou K, Pedeli X, et al. Developmentof NO2 and NOx land use regression models for estimating air pollution exposure in 36study areas in Europe—the ESCAPE project. Atmosph Environ doi:10.1016/j.atmosenv.2013.02.037.
32 Diez Roux AV, Merkin SS, Hannan P, Jacobs DR, Kiefe CI. Area characteristics,individual-level socioeconomic indicators, and smoking in young adults: the coronaryartery disease risk development in young adults study. Am J Epidemiol 2003;157:315-26.
33 DerSimonian R, Laird N. Meta-analysis in clinical trials. Control Clin Trials 1986;7:177-88.34 Higgins JP, Thompson SG. Quantifying heterogeneity in a meta-analysis. Stat Med
2002;21:1539-58.35 Zanobetti A, Schwartz J. The effect of particulate air pollution on emergency admissions
for myocardial infarction: a multicity case-crossover analysis. Environ Health Perspect2005;113:978-82.
36 Pope CA III, Muhlestein JB, May HT, Renlund DG, Anderson JL, Horne BD. Ischemicheart disease events triggered by short-term exposure to fine particulate air pollution.Circulation 2006;114:2443-8.
37 Peters A. Ambient particulate matter and the risk for cardiovascular disease. ProgCardiovasc Dis 2011;53:327-33.
38 Beelen R, Stafoggia M, Raaschou-Nielsen M, Andersen ZJ, Xun WW, Katsouyanni K, etal. Long-term exposure to air pollution and cardiovascular mortality: an analysis of 22European cohorts within the ESCAPE project. Epidemiology (in press).
39 Hoek G, Krishnan RM, Beelen R, Peters A, Ostro B, Brunekreef B, et al. Long-term airpollution exposure and cardio- respiratory mortality: a review. Environ Health 2013;12:43.
40 Cesaroni G, Porta D, Badaloni C, Stafoggia M, Eeftens M, Meliefste K, et al. Nitrogendioxide levels estimated from land use regression models several years apart andassociation with mortality in a large cohort study. Environ Health 2012;11:48.
41 Eeftens M, Beelen R, Fischer P, Brunekreef B, Meliefste K, Hoek G. Stability of measuredand modelled spatial contrasts in NO2 over time. Occup Environ Med 2011;68:765-70.
42 Wang R, Henderson SB, Sbihi H, Allen RW, Brauer M. Temporal stability of land useregression models for traffic-related air pollution. Atmosph Environ 2013;64:312-9.
Accepted: 04 December 2013
Cite this as: BMJ 2014;348:f7412This is an Open Access article distributed in accordance with the Creative CommonsAttribution Non Commercial (CC BY-NC 3.0) license, which permits others to distribute,remix, adapt, build upon this work non-commercially, and license their derivative workson different terms, provided the original work is properly cited and the use isnon-commercial. See: http://creativecommons.org/licenses/by-nc/3.0/.
No commercial reuse: See rights and reprints http://www.bmj.com/permissions Subscribe: http://www.bmj.com/subscribe
BMJ 2014;348:f7412 doi: 10.1136/bmj.f7412 (Published 21 January 2014) Page 7 of 16
RESEARCH

Tables
Table 1| Summary description of 11 European cohorts from five countries contributing data to study long term exposure to ambient airpollution and incidence of acute coronary events
SIDRIAEPICTurinKORAHNRDCHSDPP
60 yearoldsSALTSNAC-KFINRISKVariable RomeTurin
9200513772308301443335 69377233686608426849995No ofparticipants
102 89456 36691 49084 59534 941464 055106 99539 97851 75616 256105 060Person years atrisk
87.195.582.494.099.396.097.691.092.389.493.5% of originalcohort
2051231572821353293181165204200212No of cases
Rome(Italy)
Turin (Italy)Turin(Italy)
Augsburg(Germany)
Ruhr Area(Germany)
Copenhagen(Denmark)
Stockholm(Sweden)
Stockholm(Sweden)
Stockholm(Sweden)
Stockholm(Sweden)
Turku andHelsinki(Finland)
Study location
199919991993-981994-95,1999-2001
2000-031993-971992-981997-991998-20022001-041992, 1997,2002, 2007
Years ofenrolment
No commercial reuse: See rights and reprints http://www.bmj.com/permissions Subscribe: http://www.bmj.com/subscribe
BMJ 2014;348:f7412 doi: 10.1136/bmj.f7412 (Published 21 January 2014) Page 8 of 16
RESEARCH
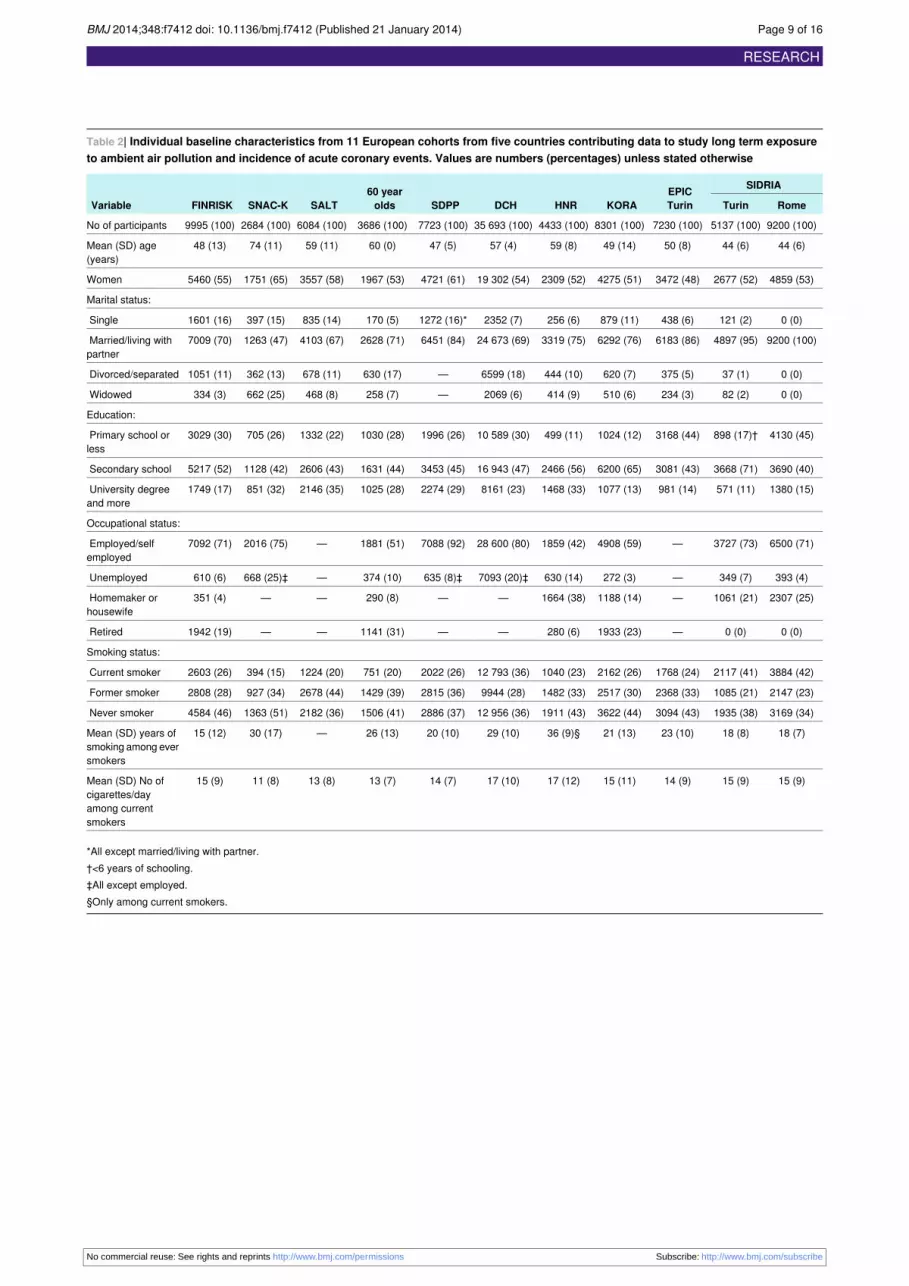
Table 2| Individual baseline characteristics from 11 European cohorts from five countries contributing data to study long term exposureto ambient air pollution and incidence of acute coronary events. Values are numbers (percentages) unless stated otherwise
SIDRIAEPICTurinKORAHNRDCHSDPP
60 yearoldsSALTSNAC-KFINRISKVariable RomeTurin
9200 (100)5137 (100)7230 (100)8301 (100)4433 (100)35 693 (100)7723 (100)3686 (100)6084 (100)2684 (100)9995 (100)No of participants
44 (6)44 (6)50 (8)49 (14)59 (8)57 (4)47 (5)60 (0)59 (11)74 (11)48 (13)Mean (SD) age(years)
4859 (53)2677 (52)3472 (48)4275 (51)2309 (52)19 302 (54)4721 (61)1967 (53)3557 (58)1751 (65)5460 (55)Women
Marital status:
0 (0)121 (2)438 (6)879 (11)256 (6)2352 (7)1272 (16)*170 (5)835 (14)397 (15)1601 (16)Single
9200 (100)4897 (95)6183 (86)6292 (76)3319 (75)24 673 (69)6451 (84)2628 (71)4103 (67)1263 (47)7009 (70)Married/living withpartner
0 (0)37 (1)375 (5)620 (7)444 (10)6599 (18)—630 (17)678 (11)362 (13)1051 (11)Divorced/separated
0 (0)82 (2)234 (3)510 (6)414 (9)2069 (6)—258 (7)468 (8)662 (25)334 (3)Widowed
Education:
4130 (45)898 (17)†3168 (44)1024 (12)499 (11)10 589 (30)1996 (26)1030 (28)1332 (22)705 (26)3029 (30)Primary school orless
3690 (40)3668 (71)3081 (43)6200 (65)2466 (56)16 943 (47)3453 (45)1631 (44)2606 (43)1128 (42)5217 (52)Secondary school
1380 (15)571 (11)981 (14)1077 (13)1468 (33)8161 (23)2274 (29)1025 (28)2146 (35)851 (32)1749 (17)University degreeand more
Occupational status:
6500 (71)3727 (73)—4908 (59)1859 (42)28 600 (80)7088 (92)1881 (51)—2016 (75)7092 (71)Employed/selfemployed
393 (4)349 (7)—272 (3)630 (14)7093 (20)‡635 (8)‡374 (10)—668 (25)‡610 (6)Unemployed
2307 (25)1061 (21)—1188 (14)1664 (38)——290 (8)——351 (4)Homemaker orhousewife
0 (0)0 (0)—1933 (23)280 (6)——1141 (31)——1942 (19)Retired
Smoking status:
3884 (42)2117 (41)1768 (24)2162 (26)1040 (23)12 793 (36)2022 (26)751 (20)1224 (20)394 (15)2603 (26)Current smoker
2147 (23)1085 (21)2368 (33)2517 (30)1482 (33)9944 (28)2815 (36)1429 (39)2678 (44)927 (34)2808 (28)Former smoker
3169 (34)1935 (38)3094 (43)3622 (44)1911 (43)12 956 (36)2886 (37)1506 (41)2182 (36)1363 (51)4584 (46)Never smoker
18 (7)18 (8)23 (10)21 (13)36 (9)§29 (10)20 (10)26 (13)—30 (17)15 (12)Mean (SD) years ofsmoking among eversmokers
15 (9)15 (9)14 (9)15 (11)17 (12)17 (10)14 (7)13 (7)13 (8)11 (8)15 (9)Mean (SD) No ofcigarettes/dayamong currentsmokers
*All except married/living with partner.†<6 years of schooling.‡All except employed.§Only among current smokers.
No commercial reuse: See rights and reprints http://www.bmj.com/permissions Subscribe: http://www.bmj.com/subscribe
BMJ 2014;348:f7412 doi: 10.1136/bmj.f7412 (Published 21 January 2014) Page 9 of 16
RESEARCH

Table 3| Air pollution exposure at residential address of individuals from 11 European cohorts from five countries contributing data tostudy long term exposure to ambient air pollution and incidence of acute coronary events. Figures are means and 5-95th centile ranges,correlation coefficients between PM2.5 and other pollutants, and R2 of models and their cross validation
SIDRIAEPICTurinKORAHNRDCHSDPP
60 yearoldsSALTSNAC-KFINRISKVariable RomeTurin
Mean (5th-95th centile) annual air pollution (µg/m3) at residence address
36 (31-47)48(41-54)
46(39-52)
20 (16-24)28(25-32)
17 (14-20)14 (6-17)15 (7-21)15 (7-21)16 (6-29)14 (10-20)PM10
17 (12-24)17(13-20)
16(12-20)
6 (5-8)10 (7-12)6 (4-7)6 (1-9)7 (1-12)7 (2-12)8 (1-19)7 (4-11)Coarse PM
19 (17-23)31(29-34)
30(27-33)
14 (13-15)18(17-20)
11 (10-13)7 (5-8)7 (5-9)7 (5-9)8 (6-10)8 (6-9)PM2.5
2.7 (2.2-4.0)3.2(2.6-3.8)
3.1(2.3-3.6)
1.7(1.5-2.0)
1.6(1.2-2.2)
1.2 (0.8-1.5)0.5(0.4-0.7)
0.6(0.4-0.9)
0.6(0.4-0.9)
0.8 (0.5-1.2)0.9(0.5-1.2)
AbsorbancePM2.5,10
-5/m
39 (26-56)60(42-77)
53(34-68)
19 (14-26)30(23-39)
16 (8-30)8 (6-11)11 (6-20)11 (7-20)17 (9-25)15 (9-24)NO2
82 (39-122)107(79-162)
96(62-132)
33 (24-47)51(33-72)
27 (7-66)14 (12-20)19 (12-39)19 (12-40)33 (15-58)24 (14-41)NOx
2966(500-15312)
4290(0-24379)
3907(0-23951)
1636(500-8367)
-2994(200-16145)
864(500-2575)
1455(500-6300)
1454(500-6000)
3726(500-21828)
1670(50-9011)
Daily No ofvehicles/day onnearest road
1417(0-6947)
804(0-4197)
466(0-2340)
444(0-2805)
1017(0-4302)
1274(51-4719)
109(0-986)
521(0-3048)
578(0-3437)
2307 (0-6572)633(0-3711)
Daily traffic load onmajor roads in 100 mbuffer (thousand),(vehicles×meters/day)
Pearson correlations coefficients between PM2.5 and:
0.920.560.620.420.900.740.310.500.490.700.67PM10
0.900.320.510.380.510.600.320.500.500.710.10Coarse PM
0.780.730.770.500.760.490.900.840.840.980.98Absorbance PM2.5
0.690.670.720.450.630.570.610.610.600.820.41NO2
R2 of land use regression models and their leave one out cross validation
0.72-0.590.78-0.690.78-0.690.83-0.750.69-0.630.75-0.640.82-0.770.82-0.770.82-0.770.82-0.77067-0.42PM10
0.70-0.570.65-0.580.65-0.580.81-0.790.66-0.570.71-0.540.72-0.650.72-0.650.72-0.650.72-0.650.61-0.33Coarse PM
0.71-0.600.71-0.590.71-0.590.78-0.620.88-0.790.62-0.550.87-0.780.87-0.780.87-0.780.87-0.780.67-0.53PM2.5
0.84-0.700.88-0.810.88-0.810.91-0.820.97-0.950.92-0.860.89-0.850.89-0.850.89-0.850.89-0.850.65-0.47Absorbance PM2.5
0.87-0.760.78-0.700.78-0.700.86-0.670.89-0.840.88-0.830.82-0.780.82-0.780.82-0.780.82-0.780.83-0.75NO2
0.80-0.790.78-0.720.78-0.720.88-0.760.88-0.810.83-0.730.83-0.790.83-0.790.83-0.790.83-0.790.85-0.74NOx
PM2.5=particulate matter <2.5 µm; PM10=particulate matter <10 µm; NO2=nitrogen dioxide; NOx=nitrogen oxides.
No commercial reuse: See rights and reprints http://www.bmj.com/permissions Subscribe: http://www.bmj.com/subscribe
BMJ 2014;348:f7412 doi: 10.1136/bmj.f7412 (Published 21 January 2014) Page 10 of 16
RESEARCH

Table 4| Additional baseline characteristics of study populations in analysis of long term exposure to ambient air pollution and incidenceof acute coronary events. Values are numbers (percentages) unless stated otherwise
SIDRIA
EPIC TurinKORAHNRDCHSDPP60 yearoldsSALTSNAC-KFINRISK RomeTurin
Area level socioeconomic indicators*:
2332 (25)1114 (22)963 (13)———3024 (39)898 (24)1692 (28)1429 (53)—1 (lowest)
1802 (20)1114 (22)1404 (19)———1164 (15)924 (25)2643 (43)1252 (47)—2
1675 (18)944 (18)1342 (19)———2016 (26)938 (25)242 (4)3 (0)—3
1684 (18)1070 (21)1662 (23)———1519 (20)926 (25)1507 (25)——4
1707 (19)895 (17)1859 (26)————————5 (highest)
28.1 (18.4)12.6 (3.1)1.9 (0.4)22 946(5458)
Mean (SD)
——25.3 (3.8)27.1 (4.6)27.8 (4.6)26.0 (4.1)25.7 (4.0)26.8 (4.2)28.5 (4.1)25.6 (4.1)26.3 (4.6)Mean (SD)BMI
BMI in classes:
——3691 (51)2824 (34)1201 (27)15 998 (45)3741 (49)1349 (37)1055 (18)1209 (48)4329 (43)<25
——2779 (38)3551 (43)2025 (46)14 642 (41)2995 (39)1633 (44)3131 (52)1004 (40)3852 (39)25-29
——761 (11)1852 (23)1189 (27)5026 (14)964 (13)704 (19)1805 (30)302 (12)1811 (18)>29
Physical activity (hours/week):
——1660 (23)3107 (37)2263 (51)15 984 (45)846 (11)2510 (69)1575 (26)464 (20)1808 (18)<1
——2032 (28)3515 (42)490 (11)19 709 (55)6273 (81)858 (24)3757 (62)686 (30)3322 (33)~1
——3538 (49)1666 (20)1667 (38)—597 (8)279 (8)716 (12)1115 (49)4839 (49)>2
Alcohol consumption (drinks/week):
——457 (6)3867 (47)1015 (23)776 (2)594 (8)168 (5)—519 (19)1320 (13)Never
——201 (3)1212 (15)1190 (27)34 142 (98)†2876 (38)771 (21)—634 (24)4566 (46)1-3
——347 (5)549 (7)2127 (49)—3873 (51)1622 (44)—1236 (46)3139 (32)3-6
——6225 (86)2662 (32)—280 (4)1123 (30)—288 (11)824 (8)>6
Diabetes mellitus:
9179 (100)5111 (99)7118 (98)7940 (96)3877 (87)34 943 (98)7597 (98)3533 (96)5833 (96)2464 (92)9546 (96)No
21 (0)26 (1)110 (2)360 (4)556 (13)703 (2)126 (2)153 (4)251 (4)220 (8)426 (4)Yes
Hypertension:
9124 (99)5082 (99)3629 (53)5098 (62)2002 (45)30 033 (84)5801 (76)1770 (48)4735 (78)902 (34)5877 (59)No
76 (1)55 (1)3255 (47)3190 (38)2423 (55)5625 (16)1837 (24)1915 (52)1347 (22)1762 (66)4042 (41)Yes
———229 (44)231 (39)——231 (41)——211 (78)Mean (SD)serumcholesterol
Noise exposure at baseline address (dB):
—62 (1)44 (1)466 (6)721 (17)126 (0)—84 (6)123 (5)<45
—121 (2)115 (2)1345 (16)989 (23)1838 (5)—110 (7)200 (8)319 (12)1912 (23)‡45-49
—103 (2)87 (2)2946 (36)853 (20)9634 (27)—292 (20)524 (21)799 (30)2040 (24)50-54
—186 (4)253 (5)1873 (23)565 (13)9560 (27)—304 (21)550 (23)692 (26)1721 (21)55-59
—2237 (44)2419 (43)987 (12)482 (11)7625 (21)—291 (20)435 (18)627 (24)1181 (14)60-64
—1133 (22)1254 (22)478 (6)462 (11)4600 (13)—225 (15)332 (14)230 (9)784 (9)65-69
—1126 (22)1369 (24)199 (2)194 (5)2010 (6)—143 (10)237 (10)0714 (9)‡70-74
—156 (3)136 (2)3 (0)40 (1)294 (1)—30 (2)43 (2)——>74
Living in areas of low urbanisation:
9200 (100)5137 (100)7230 (100)3557 (43)4433 (100)14 155 (40)0 (0)1450 (39)2763 (45)2684 (100)9086 (91)No
0 (0)0 (0)0 (0)4744 (57)0 (0)21 538 (60)7723 (100)2236 (61)3321 (55)0 (0)909 (9)Yes
*FINRISK: median income rate in 3 km area; SNAC-K: mean income in thirds at small neighbourhood level (Small Area for Market Statistics); SALT and SDPP:mean income in four categories at municipality level; 60 years: mean income in quarters at small neighbourhood level (Small Area for Market Statistics); DCH:mean income at municipality level (16 units with median population of 1500 inhabitants), per/100 000; HNR: unemployment rate at neighbourhood level; KORA:percentage of low income in 5 km grid; EPIC-Turin, SIDRIA-Turin, and SIDRIA-Rome: deprivation index, census block level (average 500 inhabitants).
No commercial reuse: See rights and reprints http://www.bmj.com/permissions Subscribe: http://www.bmj.com/subscribe
BMJ 2014;348:f7412 doi: 10.1136/bmj.f7412 (Published 21 January 2014) Page 11 of 16
RESEARCH

Table 4 (continued)
SIDRIA
EPIC TurinKORAHNRDCHSDPP60 yearoldsSALTSNAC-KFINRISK RomeTurin
†Any category of drinking.‡First and last two classes are collapsed.
No commercial reuse: See rights and reprints http://www.bmj.com/permissions Subscribe: http://www.bmj.com/subscribe
BMJ 2014;348:f7412 doi: 10.1136/bmj.f7412 (Published 21 January 2014) Page 12 of 16
RESEARCH

Table 5| Association between exposure to pollutants and incidence of coronary events. Results expressed per fixed increments
Pooled hazard ratios (95% CI)
ParticipantsCohortsFixed incrementExposure Model 3‡Model 2†Model 1*
1.12 (1.01 to 1.25)1.12 (1.01 to 1.24)1.15 (1.04 to 1.28)100 1661110PM10 (µg/m3)
1.06 (0.98 to 1.15)1.06 (0.98 to 1.14)1.08 (1.00 to 1.17)100 166115Coarse PM (µg/m3)
1.13 (0.98 to 1.30)1.15 (1.00 to 1.32)1.22 (1.04 to 1.44)100 166115PM2.5 (µg/m3)
1.10 (0.98 to 1.24)1.10 (0.98 to 1.24)1.18 (1.05 to 1.32)100 166111Absorbance PM2.5 (10−5/m)
1.03 (0.97 to 1.08)1.03 (0.96 to 1.11)1.04 (0.96 to 1.12)100 1661110NO2 (µg/m3)
1.01 (0.98 to 1.05)1.01 (0.98 to 1.05)1.03 (1.00 to 1.07)100 1661120NOx (µg/m3)
1.01 (0.98 to 1.04)1.01 (0.98 to 1.04)1.01 (0.98 to 1.04)95 733105000Traffic intensity on nearest road adjusted forbackground NO2 (vehicles/day)§
1.00 (0.95 to 1.06)1.00 (0.95 to 1.06)1.02 (0.96 to 1.08)100 166114 000 000Traffic load on major roads in 100 m bufferadjusted for background NO2(vehicles×m/day)
*Adjusted for age (time variable), year of enrolment and sex†As for model 1 plus adjusted for marital status, education, occupation, smoking status, smoking duration, and smoking intensity.‡As for model 2 plus adjusted for socioeconomic area level variables.§All cohorts except HNR study.24
No commercial reuse: See rights and reprints http://www.bmj.com/permissions Subscribe: http://www.bmj.com/subscribe
BMJ 2014;348:f7412 doi: 10.1136/bmj.f7412 (Published 21 January 2014) Page 13 of 16
RESEARCH

Table 6| Incidence of coronary events, results from sensitivity analyses. Figures are pooled hazard ratios (and 95% CI) for 10 µg/m3 PM10and 5 µg/m3 PM2.5, I2 statistics, and P value for heterogeneity
Hazard ratio† (95% CI)
No of participants*No of cohortsModel 5 µg/m3 PM2.510 µg/m3 PM10
1.13 (0.98 to 1.30)1.12 (1.01 to 1.25)100 16611Base model (model 3)
Role of cardiovascular risk factors
Intermediate variables: diabetes and hypertension:
1.11 (0.96 to 1.28)1.11 (1.00 to 1.24)99 52611+ diabetes and hypertension
Physical activity, alcohol and BMI‡:
1.22 (1.03 to 1.44)1.17 (1.04 to 1.33)77 5848Base model, on subset of participants withadditional information
1.19 (1.01 to 1.42)1.17 (1.04 to 1.33)77 5848+ additional information
All cardiovascular risk factors (diabetes, hypertension, physical activity, alcohol, BMI, cholesterol)§:
1.28 (0.92 to 1.79)1.19 (0.92 to 1.53)25 6254Base model, on subset of participants withadditional information
1.29 (0.92 to 1.81)1.20 (0.93 to 1.56)25 6254+ additional information
Urban/suburban-rural residence location:
1.13 (0.98 to 1.39)1.12 (1.01 to 1.25)100 16611Base model, on subset of participants withadditional information
1.14 (0.99 to 1.31)1.13 (1.02 to 1.26)100 16611+ additional information
Noise¶:
1.16 (0.98 to 1.37)1.14 (1.01 to 1.30)73 8409Base model, on subset of participants withnoise information
1.13 (0.95 to 1.36)1.14 (1.01 to 1.31)73 8409+ noise variable
Change of address**:
1.14 (0.98 to 1.33)1.11 (0.99 to 1.23)92 93610Base model, on subset of cohorts withchange of address information
1.18 (0.98 to 1.42)1.16 (1.01 to 1.32)63 12110Participants who didn’t change addressduring follow-up
Proportionality hazards (PH) assumption:
1.13 (0.98 to 1.30)1.10 (0.99 to 1.23)100 16611Variables that do not meet PH put as strata
Exclusion of DCH Study
1.09 (0.92 to 1.30)1.12 (0.99 to 1.27)64 47310Data after exclusion
Performance of land use regression model††:
1.35 (1.04 to 1.74)1.18 (1.05 to 1.33)——Leave one out cross validation R2>60%
1.05 (0.89 to 1.25)0.88 (0.68 to 1.12)——Leave one out cross validation R2≤60%
*Figures depend on number of cohorts included and on missing values of included variables†Adjusted for age (time variable), year of enrolment, sex, marital status, education, occupation, smoking status, smoking duration, smoking intensity, andsocioeconomic area level indicators.‡Excludes SALT, SIDRIA-Turin, and SIDRIA-Rome.§Includes FINRISK, 60 year olds, HNR, and KORA.¶All cohorts except SDPP and SIDRIA-Rome.**All cohorts except EPIC-Turin.††For PM10: nine cohorts, 80 971 participants (excludes FINRISK and SIDRIA-Rome). For PM2.5: six cohorts, 42 906 participants (excludes FINRISK, DCH,EPIC-Turin, SIDRIA-Turin, and SIDRIA-Rome).
No commercial reuse: See rights and reprints http://www.bmj.com/permissions Subscribe: http://www.bmj.com/subscribe
BMJ 2014;348:f7412 doi: 10.1136/bmj.f7412 (Published 21 January 2014) Page 14 of 16
RESEARCH

Table 7| Results from random-effects meta-analyses for adjusted association between incidence of coronary events and exposure to PM10and PM2.5 below various threshold values. Figures are pooled hazard ratios (95% CI) for 10 µg/m3 PM10 and 5 µg/m3 PM2.5, I2 statistic,and P value for heterogeneity
Cohorts with exposure data available for all thresholdsCohorts with exposure data available for respective thresholdExposureandthreshold P valueI2HR* (95% CI)
No ofparticipants
No ofcohortsP valueI2HR* (95% CI)
No ofparticipants
No ofcohorts
PM10 (µg/m3):
0.9201.15 (1.02 to1.30)
74 1667†—————Full range ofexposure
0.9101.20 (1.01 to1.41)
64 3637†0.9101.20 (1.01 to1.41)
64 3637†<20
0.9101.12 (0.98 to1.27)
74 0197†0.9401.12 (0.98 to1.27)
77 9978‡<30
0.9201.15 (1.02 to1.30)
74 1667†0.4801.12 (1.00 to1.27)
86 2229§<40
PM2.5 (µg/m3):
0.5701.23 (1.04 to1.46)
74 1667†—————Full range ofexposure
0.7401.19 (1.00 to1.42)
73 4207†0.7401.19 (1.00 to1.42)
73 4207†<15
0.5701.23 (1.04 to1.46)
74 1667†0.18301.17 (0.91 to1.50)
85 2169§<20
0.5701.23 (1.04 to1.46)
74 1667†0.5601.18 (1.01 to1.39)
87 5329§<25
*Adjusted for age (time variable), year of enrolment, sex, marital status, education, occupation, smoking status, smoking duration, smoking intensity. andsocioeconomic area level indicators†All cohorts except Heinz Nixdorf Recall Study, EPIC-Turin, SIDRIA-Turin and SIDRIA-Rome.‡All cohorts except EPIC-Turin, SIDRIA-Turin and SIDRIA-Rome.§All cohorts except EPIC-Turin and SIDRIA-Turin.
No commercial reuse: See rights and reprints http://www.bmj.com/permissions Subscribe: http://www.bmj.com/subscribe
BMJ 2014;348:f7412 doi: 10.1136/bmj.f7412 (Published 21 January 2014) Page 15 of 16
RESEARCH

Figure
Hazard ratios of incident coronary events per 10 µg/m3 PM10 and 5 µg/m3 PM2.5. Cohort specific and meta-analytic results
No commercial reuse: See rights and reprints http://www.bmj.com/permissions Subscribe: http://www.bmj.com/subscribe
BMJ 2014;348:f7412 doi: 10.1136/bmj.f7412 (Published 21 January 2014) Page 16 of 16
RESEARCH


![[Guidelines for management of community-acquired pneumonia in adults]](https://img.pdfslide.net/doc/110x75/634b0640913672970c08d5da/guidelines-for-management-of-community-acquired-pneumonia-in-adults.jpg)


