Embed Size (px)
Citation preview
South Wairarapa District Council
Long Term Plan2015/2025
SOUTH WAIRARAPA
DISTRICT COUNCIL

SOUTH WAIRARAPA DISTRICT COUNCIL’S LONG TERM PLAN 2015/2025
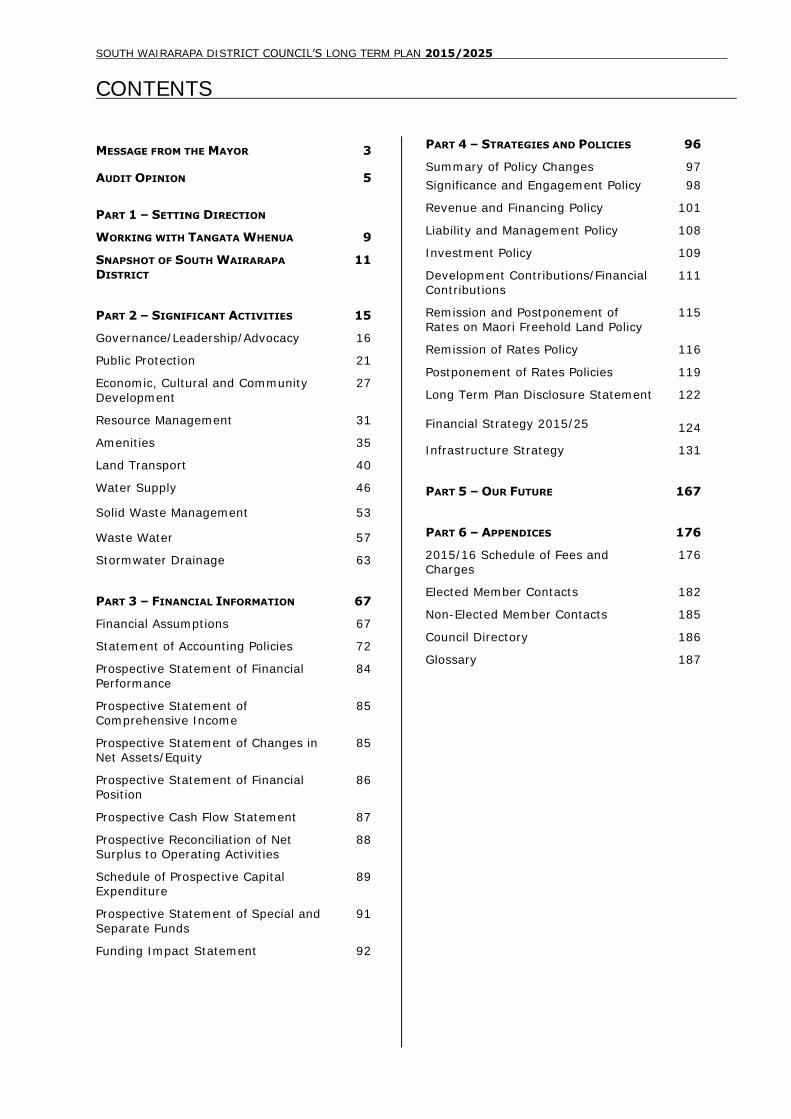
CONTENTS
MESSAGE FROM THE MAYOR 3
AUDIT OPINION 5
PART 1 – SETTING DIRECTION
WORKING WITH TANGATA WHENUA 9
SNAPSHOT OF SOUTH WAIRARAPA
DISTRICT 11
PART 2 – SIGNIFICANT ACTIVITIES
15
Governance/Leadership/Advocacy 16
Public Protection 21
Economic, Cultural and Community
Development
27
Resource Management 31
Amenities 35
Land Transport 40
Water Supply 46
Solid Waste Management 53
Waste Water 57
Stormwater Drainage 63
PART 3 – FINANCIAL INFORMATION
67
Financial Assumptions 67
Statement of Accounting Policies 72
Prospective Statement of Financial
Performance
84
Prospective Statement of Comprehensive Income
85
Prospective Statement of Changes in Net Assets/Equity
85
Prospective Statement of Financial Position
86
Prospective Cash Flow Statement 87
Prospective Reconciliation of Net Surplus to Operating Activities
88
Schedule of Prospective Capital Expenditure
89
Prospective Statement of Special and
Separate Funds
91
Funding Impact Statement 92
PART 4 – STRATEGIES AND POLICIES 96
Summary of Policy Changes
Significance and Engagement Policy
97
98
Revenue and Financing Policy 101
Liability and Management Policy 108
Investment Policy 109
Development Contributions/Financial Contributions
111
Remission and Postponement of Rates on Maori Freehold Land Policy
115
Remission of Rates Policy 116
Postponement of Rates Policies 119
Long Term Plan Disclosure Statement Financial Strategy 2015/25
122
124
Infrastructure Strategy 131
PART 5 – OUR FUTURE 167
PART 6 – APPENDICES
176
2015/16 Schedule of Fees and Charges
176
Elected Member Contacts 182
Non-Elected Member Contacts 185
Council Directory 186
Glossary 187

SOUTH WAIRARAPA DISTRICT COUNCIL‟S LONG TERM PLAN 2015/2025
3
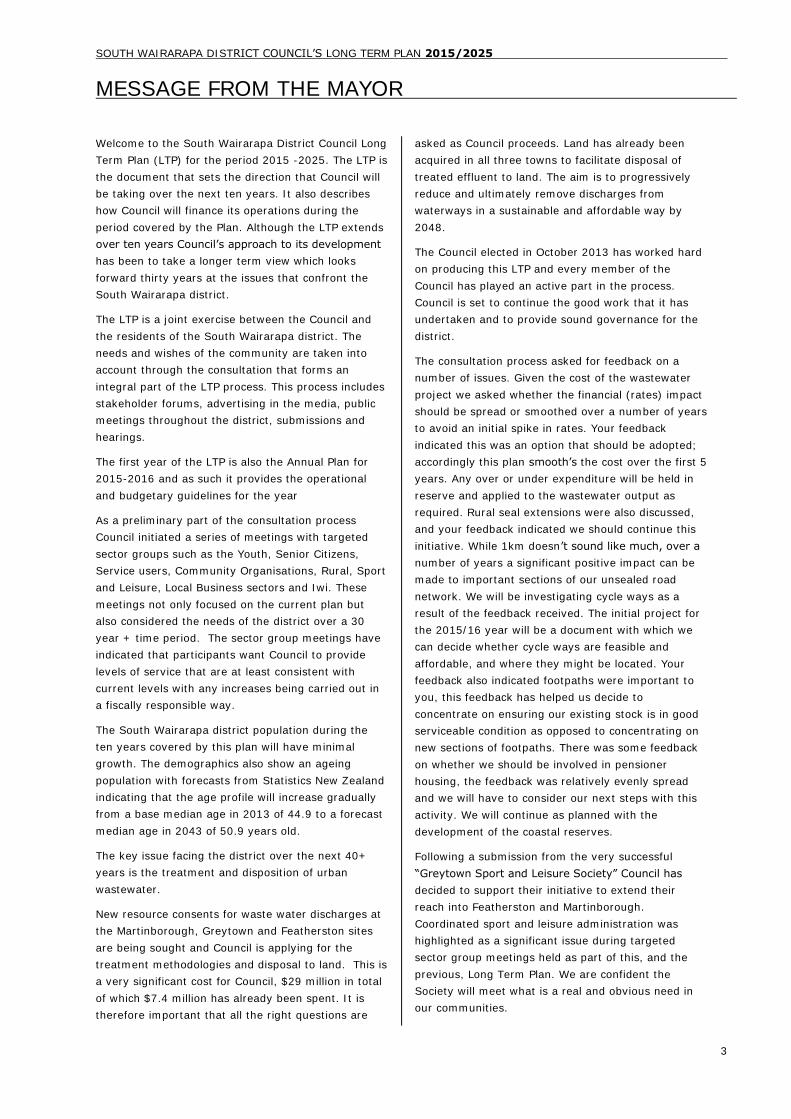
MESSAGE FROM THE MAYOR
Welcome to the South Wairarapa District Council Long
Term Plan (LTP) for the period 2015 -2025. The LTP is
the document that sets the direction that Council will
be taking over the next ten years. It also describes
how Council will finance its operations during the
period covered by the Plan. Although the LTP extends
over ten years Council‟s approach to its development
has been to take a longer term view which looks
forward thirty years at the issues that confront the
South Wairarapa district.
The LTP is a joint exercise between the Council and
the residents of the South Wairarapa district. The
needs and wishes of the community are taken into
account through the consultation that forms an
integral part of the LTP process. This process includes
stakeholder forums, advertising in the media, public
meetings throughout the district, submissions and
hearings.
The first year of the LTP is also the Annual Plan for
2015-2016 and as such it provides the operational
and budgetary guidelines for the year
As a preliminary part of the consultation process
Council initiated a series of meetings with targeted
sector groups such as the Youth, Senior Citizens,
Service users, Community Organisations, Rural, Sport
and Leisure, Local Business sectors and Iwi. These
meetings not only focused on the current plan but
also considered the needs of the district over a 30
year + time period. The sector group meetings have
indicated that participants want Council to provide
levels of service that are at least consistent with
current levels with any increases being carried out in
a fiscally responsible way.
The South Wairarapa district population during the
ten years covered by this plan will have minimal
growth. The demographics also show an ageing
population with forecasts from Statistics New Zealand
indicating that the age profile will increase gradually
from a base median age in 2013 of 44.9 to a forecast
median age in 2043 of 50.9 years old.
The key issue facing the district over the next 40+
years is the treatment and disposition of urban
wastewater.
New resource consents for waste water discharges at
the Martinborough, Greytown and Featherston sites
are being sought and Council is applying for the
treatment methodologies and disposal to land. This is
a very significant cost for Council, $29 million in total
of which $7.4 million has already been spent. It is
therefore important that all the right questions are
asked as Council proceeds. Land has already been
acquired in all three towns to facilitate disposal of
treated effluent to land. The aim is to progressively
reduce and ultimately remove discharges from
waterways in a sustainable and affordable way by
2048.
The Council elected in October 2013 has worked hard
on producing this LTP and every member of the
Council has played an active part in the process.
Council is set to continue the good work that it has
undertaken and to provide sound governance for the
district.
The consultation process asked for feedback on a
number of issues. Given the cost of the wastewater
project we asked whether the financial (rates) impact
should be spread or smoothed over a number of years
to avoid an initial spike in rates. Your feedback
indicated this was an option that should be adopted;
accordingly this plan smooth‟s the cost over the first 5
years. Any over or under expenditure will be held in
reserve and applied to the wastewater output as
required. Rural seal extensions were also discussed,
and your feedback indicated we should continue this
initiative. While 1km doesn‟t sound like much, over a
number of years a significant positive impact can be
made to important sections of our unsealed road
network. We will be investigating cycle ways as a
result of the feedback received. The initial project for
the 2015/16 year will be a document with which we
can decide whether cycle ways are feasible and
affordable, and where they might be located. Your
feedback also indicated footpaths were important to
you, this feedback has helped us decide to
concentrate on ensuring our existing stock is in good
serviceable condition as opposed to concentrating on
new sections of footpaths. There was some feedback
on whether we should be involved in pensioner
housing, the feedback was relatively evenly spread
and we will have to consider our next steps with this
activity. We will continue as planned with the
development of the coastal reserves.
Following a submission from the very successful
“Greytown Sport and Leisure Society” Council has
decided to support their initiative to extend their
reach into Featherston and Martinborough.
Coordinated sport and leisure administration was
highlighted as a significant issue during targeted
sector group meetings held as part of this, and the
previous, Long Term Plan. We are confident the
Society will meet what is a real and obvious need in
our communities.

SOUTH WAIRARAPA DISTRICT COUNCIL‟S LONG TERM PLAN 2015/2025
4
This is an interesting and challenging time for the
Council as there is much discussion about the future
structure of local councils within New Zealand. At the
time of writing the initial proposal put forward by the
Local Government Commission has been withdrawn,
and no firm decision on the future of local
government within the Wellington region has been
made. The application submitted by the three
Wairarapa council‟s remains as an application, as does
the application from Greater Wellington Regional
Council. By leaving these applications “open” the
Local Government Commission can now explore other
opportunities, and the Commission has signalled it
wishes to involve local authorities more in this
process. There is no timeframe, or even plan, as to
what the next steps may be.
In the mean time we continue to deliver services to
the community as efficiently and effectively as
possible collaborating with neighbouring councils
Carterton and Masterton forming shared services and
working groups where beneficial.
The Council will need to continue to anticipate and
work with recent and upcoming changes in legislation
in the areas of building, liquor licensing and resource
management. In administering the District Plan and
carrying out other regulatory functions, Council must
also look to encourage and support economic
development and growth where possible.
Council‟s infrastructural assets are critical to the
delivery of the levels of service outlined in the LTP.
The infrastructure has been constructed over a
significant period of time and it continues to age but
remains serviceable. The LTP outlines the key
condition assessments for roading, water, sewerage
and stormwater systems within the district. The
maintenance and renewal programmes integrated into
this plan‟s financial estimates have been created
through robust condition assessment exercises
undertaken by council officers to ensure that the
overall condition of the infrastructure systems is
maintained to deliver the levels of service set out in
the LTP, and for many years beyond.
While previous legislative changes took to the word
“community” from the long term plan process, the
community has made a significant contribution in
shaping this plan, and for that we thank you for your
input.
Adrienne Staples
Mayor
SOUTH WAIRARAPA DISTRICT COUNCIL‟S LONG TERM PLAN 2015/2025
5
To the reader
Independent auditor’s report on South Wairarapa District Council’s 2015/25 Long-Term Plan
I am the Auditor-General’s appointed auditor for South Wairarapa District Council (the Council).
Section 94 of the Local Government Act 2002 (the Act) requires an audit report on the Council’s
Long-Term Plan (the plan). I have carried out this audit using the staff and resources of Audit
New Zealand. We completed the audit on 24 June 2015.
Opinion
In my opinion:
the plan provides a reasonable basis for:
long-term, integrated decision-making and coordination of the Council’s resources; and
accountability of the Council to the community;
the information and assumptions underlying the forecast information in the plan are reasonable; and
the disclosures on pages 122 to 123 represent a complete list of the disclosures required by Part 2 of the Local Government (Financial Reporting and Prudence) Regulations 2014 and accurately reflect the information drawn from District Council’s audited information.
This opinion does not provide assurance that the forecasts in the plan will be achieved, because events
do not always occur as expected and variations may be material. Nor does it guarantee complete
accuracy of the information in the plan.
Basis of Opinion
We carried out our work in accordance with the Auditor-General’s Auditing Standards, relevant international standards and the ethical requirements in those standards.1
We assessed the evidence the Council has to support the information and disclosures in the plan and the application of its policies and strategies to the forecast information in the plan. To select appropriate audit procedures, we assessed the risk of material misstatement and the Council’s systems and processes applying to the preparation of the plan.
1 The International Standard on Assurance Engagements (New Zealand) 3000 (Revised): Assurance Engagements
Other Than Audits or Reviews of Historical Financial Information and The International Standard on Assurance
Engagements 3400: The Examination of Prospective Financial Information.
SOUTH WAIRARAPA DISTRICT COUNCIL‟S LONG TERM PLAN 2015/2025
6
Our audit procedures included assessing whether:
the Council’s financial strategy, and the associated financial policies, support prudent financial management by the Council;
the Council’s infrastructure strategy identifies the significant infrastructure issues that the Council is likely to face over the next 30 years;
the information in the plan is based on materially complete and reliable asset and activity information;
the Council’s key plans and policies have been consistently applied in the development of the forecast information;
the assumptions set out within the plan are based on the best information currently available to the Council and provide a reasonable and supportable basis for the preparation of the forecast information;
the forecast financial information has been properly prepared on the basis of the underlying information and the assumptions adopted and complies with generally accepted accounting practice in New Zealand;
the rationale for the Council’s activities is clearly presented and agreed levels of service are reflected throughout the plan;
the levels of service and performance measures are reasonable estimates and reflect the main aspects of the Council’s intended service delivery and performance; and
the relationship between the levels of service, performance measures and forecast financial information has been adequately explained within the plan.
We did not evaluate the security and controls over the electronic publication of the plan.
Responsibilities of the Council and auditor
The Council is responsible for:
meeting all legal requirements affecting its procedures, decisions, consultation, disclosures and other actions relating to the preparation of the plan;
presenting forecast financial information in accordance with generally accepted accounting practice in New Zealand; and
having systems and processes in place to enable the preparation of a plan that is free from material misstatement.
I am responsible for expressing an independent opinion on aspects of the plan, as required by sections
94 and 259C of the Act. I do not express an opinion on the merits of the plan’s policy content.
SOUTH WAIRARAPA DISTRICT COUNCIL‟S LONG TERM PLAN 2015/2025
7
Independence
We have followed the independence requirements of the Auditor-General, which incorporate those of
the External Reporting Board. Other than our work in carrying out all legally required external audits,
we have no relationship with, or interests in, the Council or any of its subsidiaries.
Phil Kennerley, Audit New Zealand
On behalf of the Auditor-General, Wellington, New Zealand
SOUTH WAIRARAPA DISTRICT COUNCIL‟S LONG TERM PLAN 2015/2025
8
WHAT IS A LONG TERM COUNCIL PLAN?
The Local Government Act 2002 requires every
district council to produce, once every three years,
a Long Term Council Plan (LTP) which sets out what
the council will do for at least the next ten years.
The 2015/2025 Long Term Plan
Describes the „Community Outcomes‟ of the
South Wairarapa district (what the community
has told South Wairarapa District Council it
wants achieved).
Provides a long-term focus for the decisions
and activities of Council.
Provides a basis for Council to be accountable
to the community.
Through the consultation process has allowed
the public to participate in decision-making
processes on activities to be undertaken by
Council.
Describes the activities of Council, setting out
what we will do in the next 3 years, 10 years
and beyond and what the cost of those
activities will be.
The LTP is aligned with other core planning
documents by which Council is accountable to the
South Wairarapa community, including the Annual
Plan and the Annual Report as well as the District
Plan, Strategies and Policies. Please note that the
information in the LTP may not be appropriate for
purposes other than those described above.
Development of this LTP followed an extensive
process which includes consideration of a wide
range of issues such as the maintenance and
upgrading requirements of Council assets and
feedback received from the public from various
consultation exercises undertaken by Council.
Part 1Setting Direction
Working with Tangata Whenua
District and Regional Responsibilities
Snapshot of South Wairarapa District
Community Outcomes
Significant Activities
Measuring Performance
SOUTH WAIRARAPA
DISTRICT COUNCIL

SOUTH WAIRARAPA DISTRICT COUNCIL‟S LONG TERM PLAN 2015/2025
PART 1: SETTING DIRECTION 9
WORKING WITH TANGATA WHENUA
The South Wairarapa district is rich
in Maori history and culture
Some of the earliest known occupational sites exist
within its boundaries, and for centuries the natural
environment has provided both material and
spiritual sustenance. Its place in the Maori political
history of New Zealand is a matter of national
record.
Lake Wairarapa and the South Wairarapa coastline
are of immense cultural, spiritual and historic
significance to Maori.
Relationship Building
The Resource Management Act 1991 (RMA) and
more recently the Local Government Act 2002
(LGA), require Council to establish more formal,
meaningful and sustainable relationships with
Maori. These relationships, guided by the Treaty of
Waitangi principles, are intended to foster:
Opportunities for Maori to contribute to the
decision-making process of Council.
The development of Maori capacity to
contribute to the decision-making process of
Council.
The provision of information to Maori enabling
them to contribute to the decision-making
processes of Council.
The Council is committed to engage in active
consultation with Maori and to foster positive
relationships in pursuance of the partnership
envisaged under the Treaty of Waitangi, on matters
that affect and concern Maori.
A Maori Standing Committee has been in operation
for a number of years and representatives from the
local marae and Iwi are members of this committee.
Marae are located at Papawai, Martinborough
(Hauariki) and Pirinoa (Kohunui) and the Wairarapa
Iwi are Rangitane o Wairarapa and Ngati
Kahungunu ki Wairarapa.
The role of the Maori Standing Committee is to:
Advise on tangata whenua and Maori interest in
the Council‟s major areas of activity.
Establish a method of consultation, which
involves tangata whenua, on all matters
relating to the district‟s resources, and
involving the district‟s planning processes.
Advise on consultation processes with Maori in
the district and assist in the development of
consultation networks throughout the district.
Promote the development of processes within
Council, which develop policy, processes and
guidelines, based on the Treaty of Waitangi
principles of participation, partnership and
active protection.
Working Together
Members of the Maori Standing Committee provided
input from Maori on current and long term issues as
well as current or potential Council projects. The
input from has been incorporated into this LTP.
The table that follows incorporates the key issues as
identified by Maori.
KEY ISSUES FOR MAORI
Wastewater treatment
- No sewer release to rivers and waterways
- No impact of sewer to receiving environment
- Management of farm nutrient runoff
- Mauri of water
Recognition, promotion and protection of Maori heritage and cultural assets
- Telling „our story‟
- Heritage Park – accessibility of some sites
- Protection of significant sites
- Kaitiakitanga
- Signage to support this
Maori health and care of aging population
Recognition of Marae as a community asset
- Financial and promotional assistance
- Community partnerships with marae
- Transfer of skills/resources from Marae to community
Treaty Settlement
It is envisaged treaty Settlement with the crown will be reached with Rangitaane and may be reached with Ngata Kahungunu during this
LTP period. This is likely to have implications and opportunities for the
Council to be worked through.
SOUTH WAIRARAPA DISTRICT COUNCIL‟S LONG TERM PLAN 2015/2025
PART 1: SETTING DIRECTION 10
DISTRICT AND REGIONAL RESPONSIBILTIES
South Wairarapa District Council is
one of three local authorities
operating in the Wairarapa
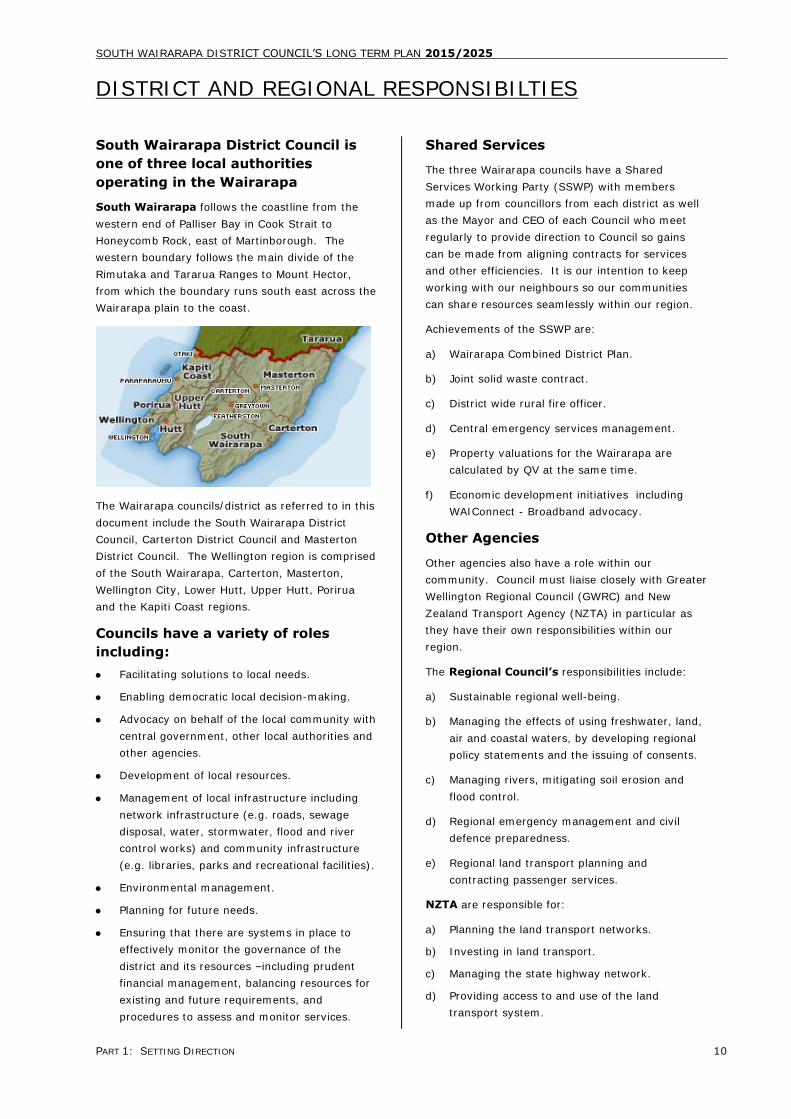
South Wairarapa follows the coastline from the
western end of Palliser Bay in Cook Strait to
Honeycomb Rock, east of Martinborough. The
western boundary follows the main divide of the
Rimutaka and Tararua Ranges to Mount Hector,
from which the boundary runs south east across the
Wairarapa plain to the coast.
The Wairarapa councils/district as referred to in this
document include the South Wairarapa District
Council, Carterton District Council and Masterton
District Council. The Wellington region is comprised
of the South Wairarapa, Carterton, Masterton,
Wellington City, Lower Hutt, Upper Hutt, Porirua
and the Kapiti Coast regions.
Councils have a variety of roles
including:
Facilitating solutions to local needs.
Enabling democratic local decision-making.
Advocacy on behalf of the local community with
central government, other local authorities and
other agencies.
Development of local resources.
Management of local infrastructure including
network infrastructure (e.g. roads, sewage
disposal, water, stormwater, flood and river
control works) and community infrastructure
(e.g. libraries, parks and recreational facilities).
Environmental management.
Planning for future needs.
Ensuring that there are systems in place to
effectively monitor the governance of the
district and its resources –including prudent
financial management, balancing resources for
existing and future requirements, and
procedures to assess and monitor services.
Shared Services
The three Wairarapa councils have a Shared
Services Working Party (SSWP) with members
made up from councillors from each district as well
as the Mayor and CEO of each Council who meet
regularly to provide direction to Council so gains
can be made from aligning contracts for services
and other efficiencies. It is our intention to keep
working with our neighbours so our communities
can share resources seamlessly within our region.
Achievements of the SSWP are:
a) Wairarapa Combined District Plan.
b) Joint solid waste contract.
c) District wide rural fire officer.
d) Central emergency services management.
e) Property valuations for the Wairarapa are
calculated by QV at the same time.
f) Economic development initiatives including
WAIConnect - Broadband advocacy.
Other Agencies
Other agencies also have a role within our
community. Council must liaise closely with Greater
Wellington Regional Council (GWRC) and New
Zealand Transport Agency (NZTA) in particular as
they have their own responsibilities within our
region.
The Regional Council’s responsibilities include:
a) Sustainable regional well-being.
b) Managing the effects of using freshwater, land,
air and coastal waters, by developing regional
policy statements and the issuing of consents.
c) Managing rivers, mitigating soil erosion and
flood control.
d) Regional emergency management and civil
defence preparedness.
e) Regional land transport planning and
contracting passenger services.
NZTA are responsible for:
a) Planning the land transport networks.
b) Investing in land transport.
c) Managing the state highway network.
d) Providing access to and use of the land
transport system.

SOUTH WAIRARAPA DISTRICT COUNCIL‟S LONG TERM PLAN 2015/2025
PART 1: SETTING DIRECTION 11
SNAPSHOT OF SOUTH WAIRARAPA DISTRICT
Area
The South Wairarapa district is situated at the
southernmost corner of the North Island and has an
area of approximately 248,455 hectares (2,484
square kilometres).
In the south the district boundary follows the
coastline from the western end of Palliser Bay in
Cook Strait to Honeycomb Rock, east of
Martinborough.
The western boundary follows the main divide of
the Rimutaka and Tararua ranges to Mount Hector,
from which the boundary runs south east across the
Wairarapa Plains to the coast.
The district includes the towns of Featherston,
Greytown and Martinborough which are the main
population centres.
Natural Resources
The South Wairarapa district is rich in natural
resources including soils, vegetation, wildlife,
freshwater, landscapes, forest parks and minerals.
These are detailed in the early sections of the
District Plan.
Of particular interest are Lake Wairarapa and the
Coast.
Lake Wairarapa
Lake Wairarapa is large and shallow, with a surface
area of 7,800 hectares and dimensions of 18km
(north/south) and 6km (east/west). Maximum
depths seldom exceed 2.5 metres.
Lake Wairarapa is an example of a “lateral lake”,
formed when a lateral tributary valley drowned
behind the levees of the Ruamahanga River. Some
of the main ponds between the Ruamahanga River
and southern Lake Wairarapa may also have been
formed by this process.
The lake shore and hydrology have been
considerably modified due to continuing natural
processes such as sedimentation (resulting in
“delta” formation) and wave action; natural events
like the 1855 earthquake (resulting in considerable
uplift); pioneer endeavours of forest clearance and
over grazing; and recent farming and river control
activities.
The Lower Wairarapa Development Scheme,
proposed by the former Wairarapa Catchment
Board, was approved in 1961. The aim was to
increase agricultural production by reclaiming 5,260
hectares of the lake and wetlands and protecting
16,200 hectares of the lower Wairarapa from
flooding. The Scheme is currently being reviewed
by Greater Wellington Regional Council.
A National Water Conservation Order has been
granted in respect to the waters of Lake Wairarapa
and its contributing rivers and streams. Minimum
lake levels are imposed in order to preserve the
lake in its natural state and “protect recreational
wildlife habitat features”.
Lake Wairarapa is of immense cultural and spiritual
significance to Maori.
With the changes to the Lake Wairarapa wetlands
over the past 150 years many traditional fishing
sites and sources of plant materials such as flax, ti
(cabbage tree) and pingao have been lost or greatly
reduced. With appropriate management and
plantings, some of these sites could be restored
specifically for the sustainable harvest of cultural
materials, which would have the additional benefit
of increasing habitat diversity for wildlife.
Guidelines for the management of the Lake
Wairarapa wetlands have been produced and
adopted by interested parties.
In 2005 both Lake Wairarapa and the Ruamahanga
River were included in a list of nationally significant
water bodies.
The Coast
The coastline of the district is the longest local
authority coastline in the Wellington region,
covering some 124km. Of this approximately
27km is beach (25km undeveloped) and the
balance (97km) is rock and cliff; 32km of the
coastline is in public ownership (being marginal
strips, recreation reserves or other reserves and
Forest Parks); 78km is private freehold land; and
14km is Maori land.
From Palliser Bay around to Cape Palliser there are
many rocky headlands restricting agricultural or
forestry uses. East of Cape Palliser there are a
series of important coastal flats, some of which
have been developed for farming, and several river
mouths. Whether flat or headland the coastline
has important recreational, scenic, and historic
Maori values, as well as important natural values in
river estuaries.
Cape Palliser Road provides some access for the
area, particularly for the Ngawi fishing village and
beach settlements located along it. Otherwise the
SOUTH WAIRARAPA DISTRICT COUNCIL‟S LONG TERM PLAN 2015/2025
PART 1: SETTING DIRECTION 12
coast is only reached by road along the river valleys
with no interconnecting routes near the coast.
A Coastal Strategy was developed jointly by the
combined efforts of the Greater Wellington Regional
Council and the district councils of Masterton,
Carterton and South Wairarapa. Elements of the
coastal strategy are included in the Wairarapa
Combined District Plan.
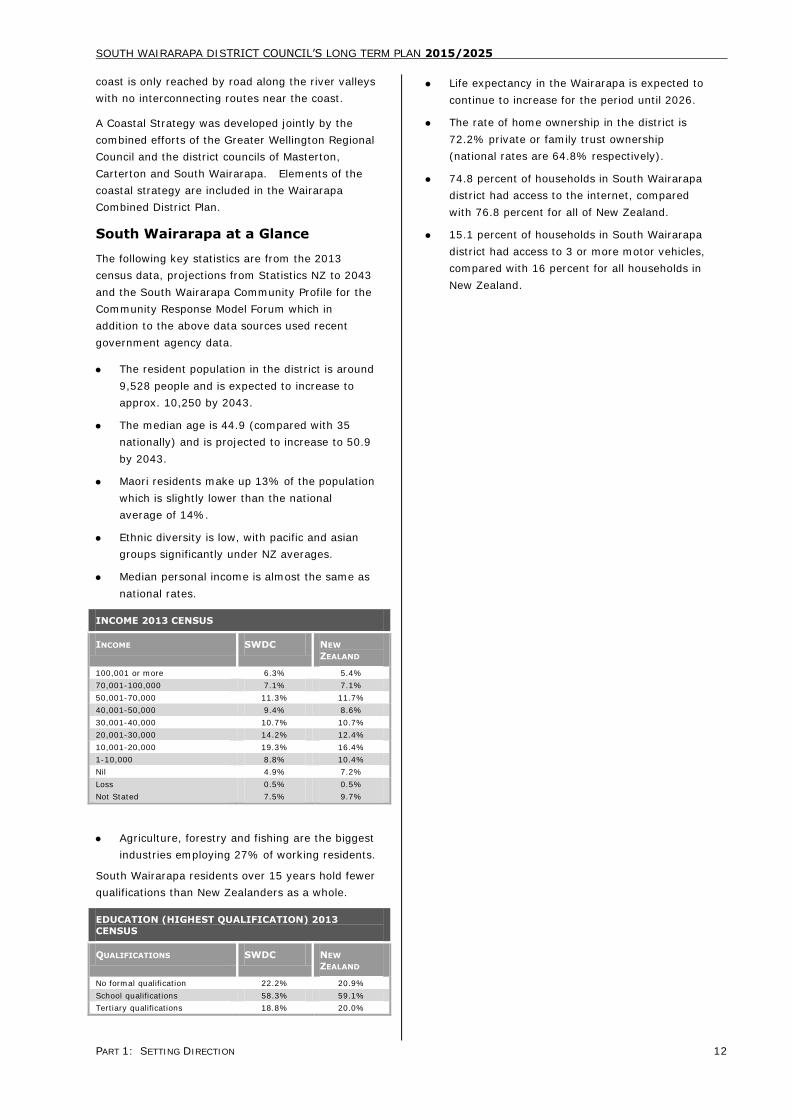
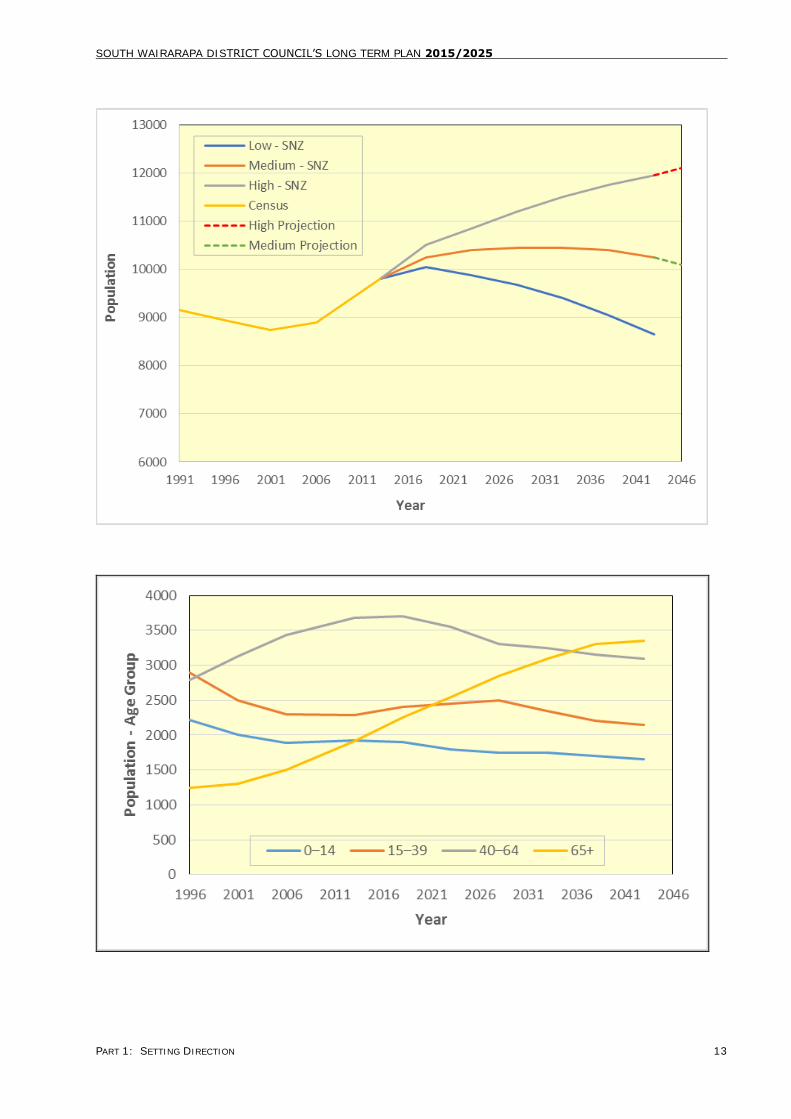
South Wairarapa at a Glance
The following key statistics are from the 2013
census data, projections from Statistics NZ to 2043
and the South Wairarapa Community Profile for the
Community Response Model Forum which in
addition to the above data sources used recent
government agency data.
The resident population in the district is around
9,528 people and is expected to increase to
approx. 10,250 by 2043.
The median age is 44.9 (compared with 35
nationally) and is projected to increase to 50.9
by 2043.
Maori residents make up 13% of the population
which is slightly lower than the national
average of 14%.
Ethnic diversity is low, with pacific and asian
groups significantly under NZ averages.
Median personal income is almost the same as
national rates.
INCOME 2013 CENSUS
INCOME SWDC NEW
ZEALAND
100,001 or more 6.3% 5.4%
70,001-100,000 7.1% 7.1%
50,001-70,000 11.3% 11.7%
40,001-50,000 9.4% 8.6%
30,001-40,000 10.7% 10.7%
20,001-30,000 14.2% 12.4%
10,001-20,000 19.3% 16.4%
1-10,000 8.8% 10.4%
Nil 4.9% 7.2%
Loss 0.5% 0.5%
Not Stated 7.5% 9.7%
Agriculture, forestry and fishing are the biggest
industries employing 27% of working residents.
South Wairarapa residents over 15 years hold fewer
qualifications than New Zealanders as a whole.
EDUCATION (HIGHEST QUALIFICATION) 2013
CENSUS
QUALIFICATIONS SWDC NEW
ZEALAND
No formal qualification 22.2% 20.9%
School qualifications 58.3% 59.1%
Tertiary qualifications 18.8% 20.0%
Life expectancy in the Wairarapa is expected to
continue to increase for the period until 2026.
The rate of home ownership in the district is
72.2% private or family trust ownership
(national rates are 64.8% respectively).
74.8 percent of households in South Wairarapa
district had access to the internet, compared
with 76.8 percent for all of New Zealand.
15.1 percent of households in South Wairarapa
district had access to 3 or more motor vehicles,
compared with 16 percent for all households in
New Zealand.
SOUTH WAIRARAPA DISTRICT COUNCIL‟S LONG TERM PLAN 2015/2025
PART 1: SETTING DIRECTION 13

SOUTH WAIRARAPA DISTRICT COUNCIL‟S LONG TERM PLAN 2015/2025
PART 1: SETTING DIRECTION 14
COMMUNITY OUTCOMES
Our Vision is to ‘work with and for
the South Wairarapa communities to
affect the best possible social and
economic outcomes which are based
on valuing and respecting the people,
the land and the resources’
Five community outcomes have been identified by
the community in order to achieve this vision.
Council has a role in achieving the community
outcomes via significant activities. The community
outcomes for the South Wairarapa are as follows:
HEALTHY & ECONOMICALLY SECURE PEOPLE
Working towards healthy and well housed people who are economically
secure, active and involved in their community.
EDUCATED AND KNOWLEDGEABLE PEOPLE
Educated and knowledgeable people who feel confident that they can
achieve their aspirations.
VIBRANT AND STRONG COMMUNITIES
A place where people feel safe, are proud to live and have a sense of
belonging.
SUSTAINABLE SOUTH WAIRARAPA
A sustainably managed district where economic development and
environmental management go hand in hand.
A PLACE THAT’S ACCESSIBLE AND EASY TO GET
AROUND
Well served by a range of transport options (including roading), local
and regional services and telecommunications.
SIGNIFICANT ACTIVITIES
The Community‟s outcomes define the future shape
and form of social, cultural, economic and
environmental well being for the district. Council,
along with other key-stakeholders, has a role in
promoting the sustainable well-being of its district
community. It achieves this through the collective
application of its ten significant activities, being:
Governance/Leadership/ Advocacy
Public Protection
Economic, Cultural & Community Development
Resource Management
Amenities
Land Transport
Water Supply
Solid Waste Management
Sewerage
Stormwater Drainage
Each significant activity comprises a number of sub-
activities. The scope and cost of providing each
significant activity is determined through a series of
agreed levels of service. The quantity and quality
of each level of service translates into cost –
generally the higher the service the higher the cost.
In a number of cases, the minimum levels of service
are determined by statutory and regulatory
compliance rather than community requirements.
Part 2 defines the services, costs and performance
indicators for each significant activity. Council is
satisfied that the level of funding provided in this
Long Term Plan will provide funds to complete
projects up until 2025 and at least maintain the
current levels of service.
MEASURING
PERFORMANCE
Council resolved to retain the community outcomes
as it was felt they were still relevant.
It is very important that Council‟s performance in
undertaking its significant activities is evaluated.
For each significant activity a number of key
performance indicators (some of these are
regulatory requirements) are given as part of the
performance measures, with targets to be achieved
for monitoring purposes.

Part 2Significant Activities
SOUTH WAIRARAPA
DISTRICT COUNCIL
Significant Activities
Introduction
Governance/Leadership/Advocacy
Public Protection
Economic, Cultural and Community Development
Resource Management
Amenities
Land Transport
Water Supply
Solid Waste Management
Waste Water
Stormwater Drainage

SOUTH WAIRARAPA DISTRICT COUNCIL’S LONG TERM PLAN 2015/2025
PART 2: SIGNIFICANT ACTIVITIES 15
SIGNIFICANT ACTIVITIES INTRODUCTION
The community outcomes define the future shape and form of social, cultural,
economic and environmental well-being for the district.
Council, along with other key stakeholders, has a role in promoting the sustainable well-being of its district and
communities. Well-being is achieved through the collective application of Council’s ten significant activities:
Governance/Leadership/ Advocacy
Public Protection
Economic, Cultural & Community Development
Resource Management
Amenities
Land Transport
Water Supply
Solid Waste Management
Sewerage
Storm water Drainage
Each significant activity comprises a number of sub-activities. The scope and cost of providing each significant
activity is determined through a series of agreed levels of service. The quantity and quality of each level of
service translates into cost – generally the higher the service the higher the cost. In a number of cases, the
minimum levels of service are determined by statutory and regulatory compliance rather than community
requirements.
The following section defines the services, costs and performance indicators for each significant activity. Council
is satisfied that the level of funding provided in this Long Term Plan will at least maintain the levels of service
established in the 2012/2022 LTP. The LTP includes a new range of service level measures as outlined in the
amendments to the Local Government Act 2002. Plan changes may occur following further legislative change.
SOUTH WAIRARAPA DISTRICT COUNCIL’S LONG TERM PLAN 2015/2025
PART 2: SIGNIFICANT ACTIVITIES 16
GOVERNANCE/LEADERSHIP/ ADVOCACY
1. DESCRIPTION
The Local Government Act 2002 defines the purpose
of local government which is to:
Enable democratic local decision-making and
action by, and on behalf of, communities; and
Promote the social, economic, environmental
and cultural well-being of communities, in the
present and for the future.
While Council provides a limited range of services
compared with the larger local authorities, its
leadership and advocacy on behalf of the
community is a major role for Council. Such
leadership and advocacy can cover a very wide
range of issues important to the community.
Governance is the means for collective action in
society, responding to and guiding change that is
beyond the capacity of private action. Council is
carrying this out appropriately.
The governance model under the Act is
representative democracy. The community elects
individuals to make judgements on behalf of the
community about what will promote well-being.
Although the model is one of representative
democracy there are strong elements of citizen
participation.
There are 3 elements to governance under the Act,
these are:
Representing the community.
Strategic planning and policy development.
Monitoring performance.
Representation
This involves the provision of leadership and
governance of the district through the Mayor’s
office, the Council/committee structure and the
three community boards Greytown, Featherston and
Martinborough. The Mayor is elected “at large” by
the district as a whole, irrespective of the existence
of wards, and chairs the meetings of full Council.
The Mayor is usually appointed to be the
spokesperson on behalf of the Council on decisions
and policies made by the Council.
In the interests of efficiency, and to provide
separation between the Council’s regulatory and
non-regulatory roles, the Council may choose to
establish committees. Representation on and
delegations to committees is decided by the Mayor,
usually after each triennial election. A committee
chairperson is responsible for presiding over
meetings of a committee and ensuring that the
committee acts within the powers delegated by
Council.
The chairs of Council committees and the three
community boards are elected from within by each
of the respective committees/community boards.
The South Wairarapa District Council currently
operates three publicly notified committees as
follows:
The Planning Hearings Committee.
The Maori Standing Committee.
The Policy and Finance Committee.
Council, policy and finance, and community board
meetings are held six weekly and the Planning
Hearings Committee meet as required. A number of
operational committees, working parties and focus
groups also meet as required.
A fundamental role of the Council is to represent
the views of its electors. It differs from the
governance role in that the latter is about decision
making on matters before the Council, whereas
representation encompasses being accessible to the
community to receive and understand their views,
and if appropriate explain Council reasoning behind
a particular decision or policy to those who might be
interested. Representation also includes
representation of Council through membership of
various Council and community organisations.
For this the Mayor, councillors and community
board members are set remuneration independently
by the Remuneration Authority.
Strategic Planning and Policy
Development
This involves carrying out long term and annual
planning for the district and producing plans which
reflect the Council’s role and level of involvement in
helping to achieve the community outcomes. The
long term plan is produced on a three yearly cycle.
Communicating and consulting with the community
is fundamental to the Council’s strategic planning
role. Formal consultation is required before certain
decisions can be made. The trigger for the extent of
consultation is determined by Council based on the
extent to which the Council is already aware of the
issues, the interests of those affected by a
particular proposal, and the regard to the
circumstances in which a decision is being made.
SOUTH WAIRARAPA DISTRICT COUNCIL’S LONG TERM PLAN 2015/2025
PART 2: SIGNIFICANT ACTIVITIES 17
This is outlined in the Significance and Engagement
Policy.
This also involves planning and strategy
development for urban and district growth to ensure
growth is sustainable and infrastructural planning
for the future can be carried out with certainty
within clearly defined boundaries. Reviews of the
District Plan are included in this activity. Policy
development arising from this activity provides the
framework for the community’s strategic direction.
Monitoring and Reporting
Monitoring of community outcomes takes place
independently on a three-yearly cycle. The objective
is to measure the impact of Council’s role and
programmes on achieving the outcomes, and to
report on the progress made.
After each financial year the Council is required to
prepare an annual report setting out information on
the level of achievement against the key financial
and performance targets for the year ended 30
June. The annual plan identifies what the Council
plans to do over the next 12 months. The annual
report explains what actually took place and the
financial position at year end.
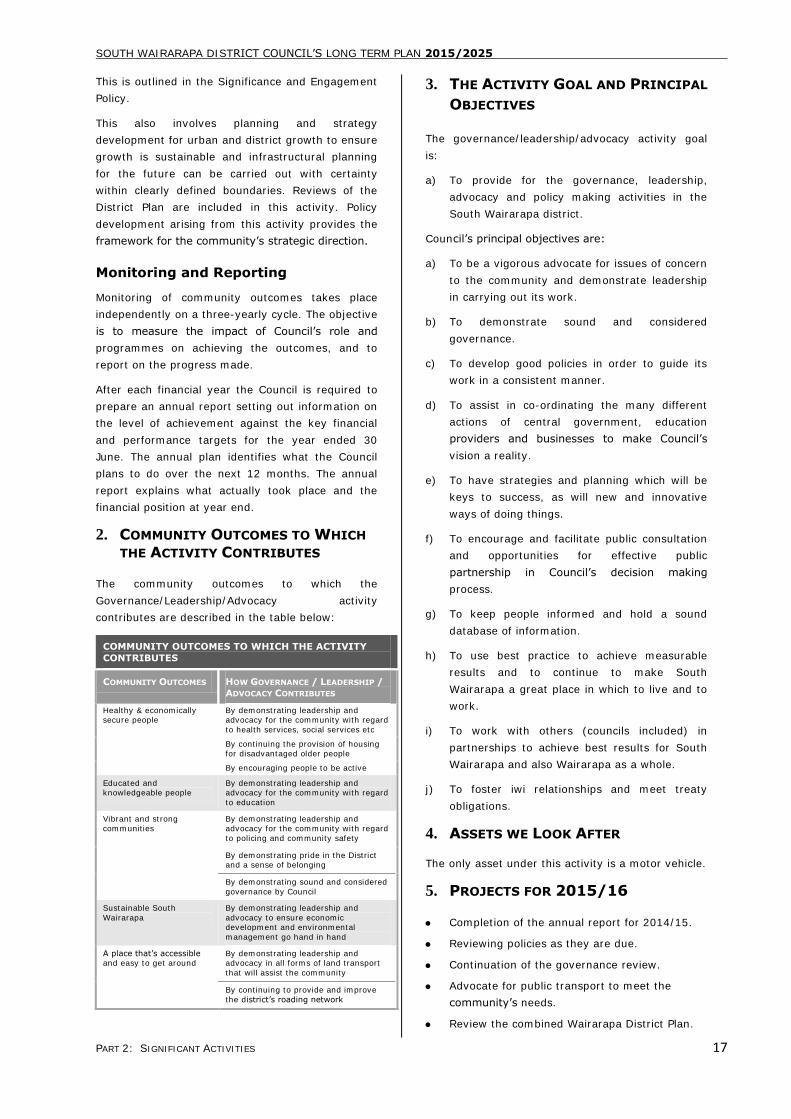
2. COMMUNITY OUTCOMES TO WHICH
THE ACTIVITY CONTRIBUTES
The community outcomes to which the
Governance/Leadership/Advocacy activity
contributes are described in the table below:
COMMUNITY OUTCOMES TO WHICH THE ACTIVITY
CONTRIBUTES
COMMUNITY OUTCOMES HOW GOVERNANCE / LEADERSHIP /
ADVOCACY CONTRIBUTES
Healthy & economically secure people
By demonstrating leadership and advocacy for the community with regard
to health services, social services etc
By continuing the provision of housing for disadvantaged older people
By encouraging people to be active
Educated and knowledgeable people
By demonstrating leadership and advocacy for the community with regard
to education
Vibrant and strong communities
By demonstrating leadership and advocacy for the community with regard
to policing and community safety
By demonstrating pride in the District and a sense of belonging
By demonstrating sound and considered
governance by Council
Sustainable South
Wairarapa
By demonstrating leadership and
advocacy to ensure economic development and environmental
management go hand in hand
A place that’s accessible and easy to get around
By demonstrating leadership and advocacy in all forms of land transport
that will assist the community
By continuing to provide and improve
the district’s roading network
3. THE ACTIVITY GOAL AND PRINCIPAL
OBJECTIVES
The governance/leadership/advocacy activity goal
is:
a) To provide for the governance, leadership,
advocacy and policy making activities in the
South Wairarapa district.
Council’s principal objectives are:
a) To be a vigorous advocate for issues of concern
to the community and demonstrate leadership
in carrying out its work.
b) To demonstrate sound and considered
governance.
c) To develop good policies in order to guide its
work in a consistent manner.
d) To assist in co-ordinating the many different
actions of central government, education
providers and businesses to make Council’s
vision a reality.
e) To have strategies and planning which will be
keys to success, as will new and innovative
ways of doing things.
f) To encourage and facilitate public consultation
and opportunities for effective public
partnership in Council’s decision making
process.
g) To keep people informed and hold a sound
database of information.
h) To use best practice to achieve measurable
results and to continue to make South
Wairarapa a great place in which to live and to
work.
i) To work with others (councils included) in
partnerships to achieve best results for South
Wairarapa and also Wairarapa as a whole.
j) To foster iwi relationships and meet treaty
obligations.
4. ASSETS WE LOOK AFTER
The only asset under this activity is a motor vehicle.
5. PROJECTS FOR 2015/16
Completion of the annual report for 2014/15.
Reviewing policies as they are due.
Continuation of the governance review.
Advocate for public transport to meet the
community’s needs.
Review the combined Wairarapa District Plan.
SOUTH WAIRARAPA DISTRICT COUNCIL’S LONG TERM PLAN 2015/2025
PART 2: SIGNIFICANT ACTIVITIES 18
6. PROJECTS FOR 2015/16 AND
BEYOND
It is envisaged treaty settlement will be reached
between the crown and Rangitaane during this long
term plan period with an agreement in principle
signed between the parties in 2014. Ngati
Kahungunu may also reach settlement. This will
require input and consideration on how SWDC
works during and after the transition including a
review of the Maori Standing Committee.
7. SIGNIFICANT NEGATIVE EFFECTS
There are no identified significant negative effects
this activity will have on social, economic,
environmental, or cultural well-being of the local
community.
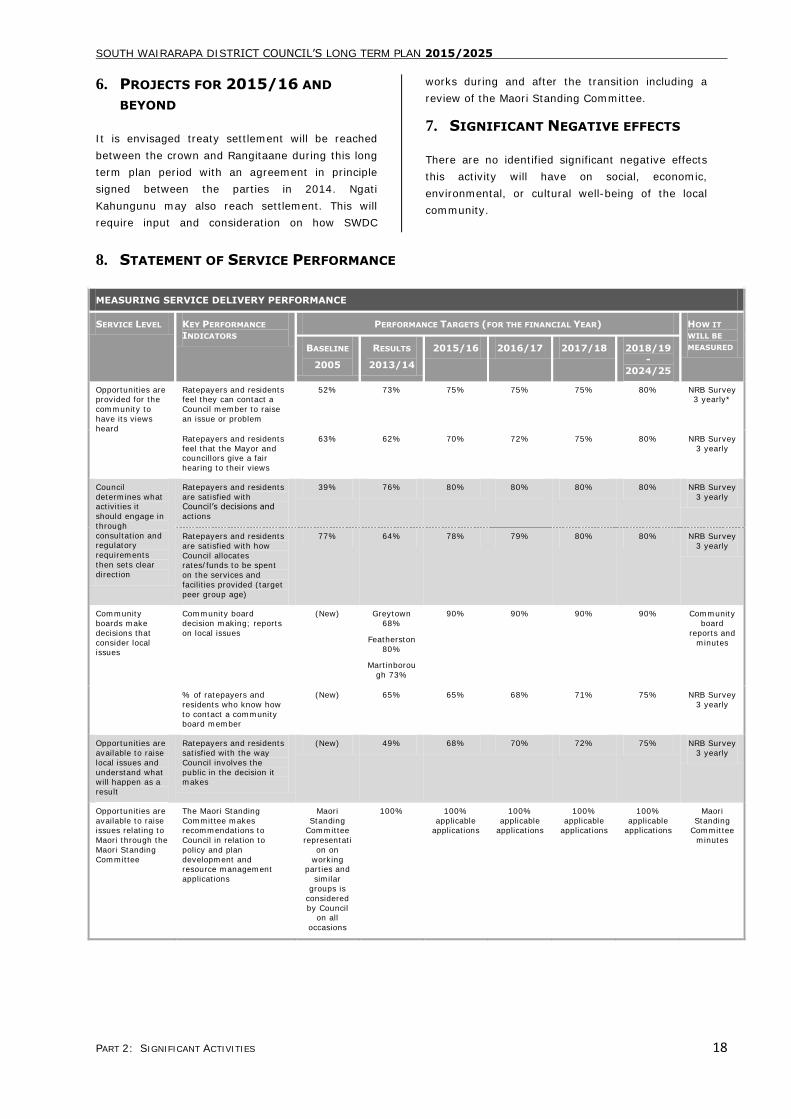
8. STATEMENT OF SERVICE PERFORMANCE
MEASURING SERVICE DELIVERY PERFORMANCE
SERVICE LEVEL KEY PERFORMANCE
INDICATORS
PERFORMANCE TARGETS (FOR THE FINANCIAL YEAR) HOW IT
WILL BE
MEASURED BASELINE
2005
RESULTS
2013/14
2015/16 2016/17 2017/18 2018/19-
2024/25
Opportunities are provided for the
community to
have its views
heard
Ratepayers and residents feel they can contact a
Council member to raise
an issue or problem
52% 73% 75% 75% 75% 80% NRB Survey 3 yearly*
Ratepayers and residents
feel that the Mayor and councillors give a fair
hearing to their views
63% 62% 70% 72% 75% 80% NRB Survey
3 yearly
Council
determines what activities it
should engage in
through
consultation and regulatory
requirements
then sets clear
direction
Ratepayers and residents
are satisfied with Council’s decisions and
actions
39% 76% 80% 80%
80% 80% NRB Survey
3 yearly
Ratepayers and residents
are satisfied with how
Council allocates rates/funds to be spent
on the services and
facilities provided (target
peer group age)
77% 64% 78% 79% 80% 80% NRB Survey
3 yearly
Community
boards make
decisions that
consider local issues
Community board
decision making; reports
on local issues
(New) Greytown
68%
Featherston
80%
Martinborou
gh 73%
90% 90% 90% 90% Community
board
reports and
minutes
% of ratepayers and
residents who know how
to contact a community board member
(New) 65% 65% 68% 71% 75% NRB Survey
3 yearly
Opportunities are
available to raise
local issues and
understand what will happen as a
result
Ratepayers and residents
satisfied with the way
Council involves the
public in the decision it makes
(New) 49% 68% 70% 72% 75% NRB Survey
3 yearly
Opportunities are
available to raise issues relating to
Maori through the
Maori Standing
Committee
The Maori Standing
Committee makes recommendations to
Council in relation to
policy and plan
development and resource management
applications
Maori
Standing Committee
representati
on on
working parties and
similar
groups is
considered
by Council on all
occasions
100% 100%
applicable applications
100%
applicable applications
100%
applicable applications
100%
applicable applications
Maori
Standing Committee
minutes

SOUTH WAIRARAPA DISTRICT COUNCIL’S LONG TERM PLAN 2015/2025
PART 2: SIGNIFICANT ACTIVITIES 19
9. GOVERNANCE, LEADERSHIP AND ADVOCACY PROSPECTIVE OPERATING STATEMENT
FOR THE YEARS ENDING 30 JUNE 2015 – 30 JUNE 2025
30
JUN E
2015
A nnual
P lan
$ 000
30
JUN E
2016
$ 000
30
JUN E
2017
$ 000
30
JUN E
2018
$ 000
30
JUN E
2019
$ 000
30
JUN E
2020
$ 000
30
JUN E
2021
$ 000
30
JUN E
2022
$ 000
30
JUN E
2023
$ 000
30
JUN E
2024
$ 000
30
JUN E
2025
$ 000
OP ER A T IN G IN C OM E
M iscellaneous income - - - - - - - - - - - T o tal Operat ing Inco me - - - - - - - - - - -
OP ER A T IN G C OST S
Administration expenses 530 559 569 583 598 611 623 643 657 676 690 Elections 20 13 13 13 13 13 13 13 13 13 13 Community boards 159 145 147 150 154 157 161 166 170 175 180 M aori standing committee 41 35 35 36 37 37 38 39 40 41 42 T o tal Operat ing C o sts 750 751 763 781 801 818 835 861 880 904 925
Note: Total operating costs include; Depreation 23 4 5 6 7 8 6 8 7 7 1
N et C o st o f Service (750) (751) (763) (781) (801) (818) (835) (861) (880) (904) (925)
C A P IT A L EXP EN D IT UR E
M otor vehicles - - 40 - - - - 40 - - - T o tal C apital Expenditure - - 40 - - - - 40 - - -
P ublic D ebt
Loan repayments - - - - - - - - - - - Sinking fund contributions - - - - - - - - - - - T o tal D ebt R equirements - - - - - - - - - - -
T o tal C apital & D ebt - - 40 - - - - 40 - - -
F unding R equired 750 751 803 781 801 818 835 901 880 904 925
F unded B y:
Rates income General rates 668 662 729 764 781 795 806 828 842 861 877 Target ratesTotal Rates Income 668 662 729 764 781 795 806 828 842 861 877 Loans - - - - - - - - - - - Depreciation Reserves 23 4 5 6 7 8 6 8 7 7 1 Reserve transfers 34 60 52 (6) (7) (8) (6) 32 (7) (7) (1) Other 25 25 18 17 20 23 30 32 38 43 48 Total Other Funding 82 89 75 17 20 23 30 72 38 43 48
T o tal F unding 750 751 803 781 801 818 835 901 880 904 925
GOVERNANCE, LEADERSHIP & ADVOCACY PROJECTED OPERATING STATEMENT
FOR THE YEARS ENDED 30 JUNE 2015-2025
SOUTH WAIRARAPA DISTRICT COUNCIL’S LONG TERM PLAN 2015/2025
PART 2: SIGNIFICANT ACTIVITIES 20
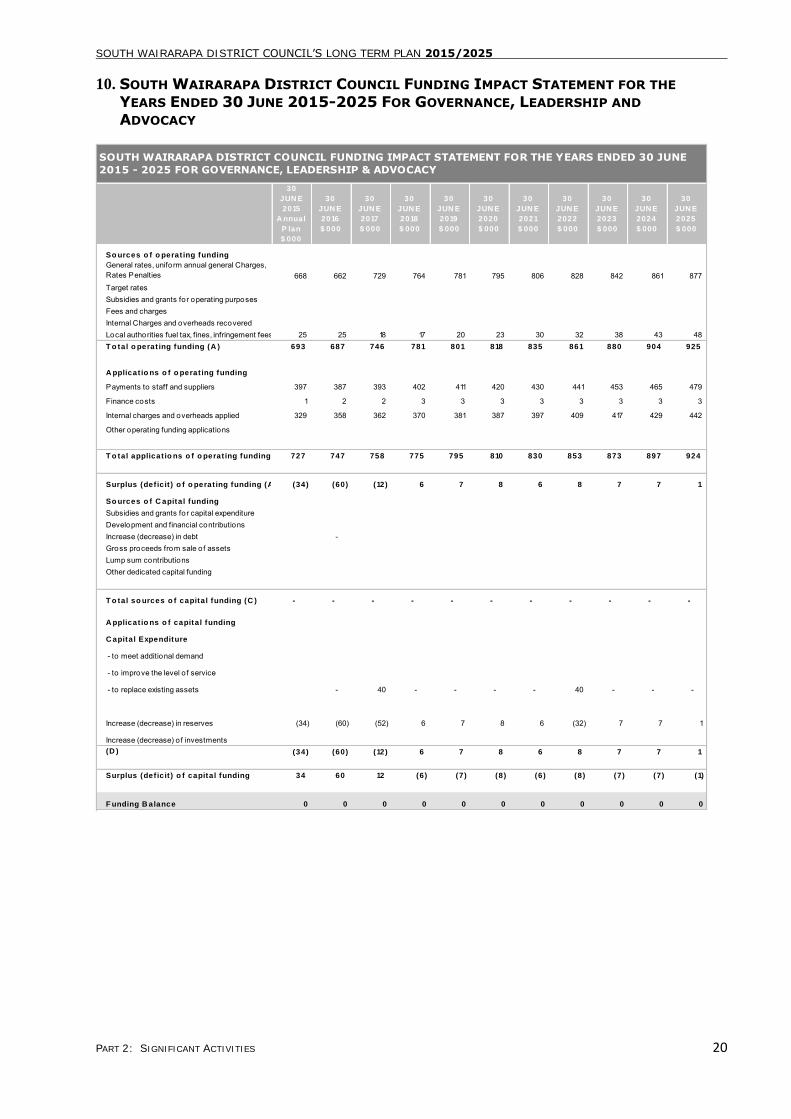
10. SOUTH WAIRARAPA DISTRICT COUNCIL FUNDING IMPACT STATEMENT FOR THE
YEARS ENDED 30 JUNE 2015-2025 FOR GOVERNANCE, LEADERSHIP AND
ADVOCACY
30
JUN E
2015
A nnual
P lan
$ 000
30
JUN E
2016
$ 000
30
JUN E
2017
$ 000
30
JUN E
2018
$ 000
30
JUN E
2019
$ 000
30
JUN E
2020
$ 000
30
JUN E
2021
$ 000
30
JUN E
2022
$ 000
30
JUN E
2023
$ 000
30
JUN E
2024
$ 000
30
JUN E
2025
$ 000
So urces o f o perat ing funding
General rates, uniform annual general Charges, Rates Penalties 668 662 729 764 781 795 806 828 842 861 877 Target ratesSubsidies and grants for operating purposesFees and chargesInternal Charges and overheads recoveredLocal authorities fuel tax, fines, infringement fees, and other receipts25 25 18 17 20 23 30 32 38 43 48 T o tal o perat ing funding (A ) 693 687 746 781 801 818 835 861 880 904 925
A pplicat io ns o f o perat ing funding
Payments to staff and suppliers 397 387 393 402 411 420 430 441 453 465 479
Finance costs 1 2 2 3 3 3 3 3 3 3 3
Internal charges and overheads applied 329 358 362 370 381 387 397 409 417 429 442
Other operating funding applications
T o tal applicat io ns o f o perat ing funding (B ) 727 747 758 775 795 810 830 853 873 897 924
Surplus (def ic it ) o f o perat ing funding (A -B ) (34) (60) (12) 6 7 8 6 8 7 7 1
So urces o f C apital funding
Subsidies and grants for capital expenditureDevelopment and financial contributionsIncrease (decrease) in debt - Gross proceeds from sale of assetsLump sum contributionsOther dedicated capital funding
T o tal so urces o f capital funding (C ) - - - - - - - - - - -
A pplicat io ns o f capital funding
C apital Expenditure
- to meet additional demand
- to improve the level o f service
- to replace existing assets - 40 - - - - 40 - - -
Increase (decrease) in reserves (34) (60) (52) 6 7 8 6 (32) 7 7 1
Increase (decrease) of investmentsT o tal applicat io ns o f capital funding
(D ) (34) (60) (12) 6 7 8 6 8 7 7 1
Surplus (def ic it ) o f capital funding 34 60 12 (6) (7) (8) (6) (8) (7) (7) (1)
F unding B alance 0 0 0 0 0 0 0 0 0 0 0
SOUTH WAIRARAPA DISTRICT COUNCIL FUNDING IMPACT STATEMENT FOR THE YEARS ENDED 30 JUNE
2015 - 2025 FOR GOVERNANCE, LEADERSHIP & ADVOCACY
SOUTH WAIRARAPA DISTRICT COUNCIL’S LONG TERM PLAN 2015/2025
PART 2: SIGNIFICANT ACTIVITIES 21
PUBLIC PROTECTION
1. DESCRIPTION
Public protection activities and responsibilities arise
under a range of legislation. These responsibilities
relate to and include:
Public nuisances and health
Noise
Safe and sanitary buildings
Dogs and animals
Alcohol and safe food
Emergency management and civil defence
Rural fire
Gaming machine numbers and venues
Location of brothels
Public Nuisance and Health
Council aims to ensure the environmental health of
the district and its citizens through enforcement and
licensing under relevant statutes, regulations and
bylaws, together with educational activities.
Noise
The Combined Wairarapa District Plan sets noise
limits and Council aims to enforce these for the
benefit of residents and those operating any business
or activity that has a noise component. In addition
Council enforces section 326 of the Resource
Management Act 1991 relating to excessive noise.
Safe and Sanitary Buildings
Council’s role is to ensure that all new building works
and building activities in the district comply with
legislative requirements for safety and sanitary
conditions. Council provides services to ensure all:
Building works subject to consent meet the
appropriate design and construction standards.
Address non-compliance with the Building Act.
Adjustments made to the building fees and charges
schedule are to recognise increased costs in
processing building consent applications since the last
fee adjustment 3 years ago. In reviewing the fees,
Council also consulted with MDC and CDC
consequently MDC are also adjusting their fees by
4.1%.
Dogs and Animals
Council provides a response service to address issues
with dogs and other animals to prevent nuisances and
ensure public safety. The service enforces the
requirements of the:
Dog Control By-law 2005.
The Dog Control Act 2003.
The Council’s own policies and bylaws.
Alcohol
Council administers the Sale and Supply of Alcohol
Act 2012 with the aim of encouraging responsible and
safe drinking in the South Wairarapa. Council does
this through the development and implementation of
its Local Alcohol Policy, use of inspection services,
enforcement and educational processes for licencees
and staff. Council also supports the operation of the
District Licencing Committee in carrying out its
decision making responsibilities under the Act.
Safe food
The Food Act came into effect in March 2015.
Provision for a 3 year transition period has been
incorporated into regulations. During this time food
premises operating under the former Food Hygiene
Regulations 1974 will be required to transition to the
new regulatory regime.
The Act replaces the Food Hygiene Regulations which
required registration of food premises based on
inspection of physical facilities against standards
towards a system based on risk based Food Control
Plans (FCP) and national programmes.
Council retains a primary role as a registration
authority, and is the first point of contact for a
significant proportion of businesses. Council also
monitors for compliance. This process is more
extensive than previous systems and is requiring
additional resources to be applied, for Council to fulfil
its responsibilities under the Act ensuring safe food is
available to its community.
Emergency Management and Civil
Defence
The Wellington region is exposed to a wide range of
natural and man-made hazards (earthquake, flooding,
landslide, tsunami, storm, biological, chemical,
terrorism, etc.). However, there is a great deal that
we can do to reduce the impact of these hazards on
our communities. Our approach to emergency
management is based on the principles of reduction of
risk, readiness, response and recovery.
Greater Wellington Regional Council (GWRC) has
joined with the city and district councils in the region
to form a semi-autonomous civil defence and
emergency management group. All the councils’
emergency management staff and resources are
SOUTH WAIRARAPA DISTRICT COUNCIL’S LONG TERM PLAN 2015/2025
PART 2: SIGNIFICANT ACTIVITIES 22
pooled together. Improved effectiveness from
increased scale and co-ordination, as well as
efficiencies from the centralised provision of services
such as training and public education has occurred.
Local emergency management offices will be retained
to enable effective local responses to emergencies.
The team has:
Prepared the Wellington Region CDEM Group Plan
and associated plans.
Led further development of the community
response plans for Martinborough, Featherston
and Greytown.
Educated people about the risks they face and
how to prepare for emergency events, through
attending public events, running training courses
and attending community group meetings.
Maintained the Wellington Region CDEM Groups’
emergency operations centre so that it can be
quickly activated to manage an emergency event.
The centre has information management
systems, robust communication systems and
trained volunteer staff.
Worked with central government, emergency
services, welfare groups, lifeline utilities and a
wide range of interested and affected
organisations on emergency management issues.
The Civil Defence Emergency Management Act 2002
requires each region to have a CDEM Group and
prepare a CDEM Group Plan. The Act also requires
GWRC to be the administering authority for the
Wellington region CDEM Group. While all staff of the
team are GWRC employees, the work of the team is
overseen by the CDEM Group (a joint committee of all
the mayors in the region along with the Chair of
Greater Wellington) and the Co-ordinating Executive
Group1.
Wairarapa has 1.5 staff dedicated to the area.
A civil defence response, while coordinated by the
regional body, relies heavily on small local groups
within the community.
1 The Co-ordinating Executive Group is a requirement of the
Civil Defence and Emergency Management Act 2002 and is
made up of the Chief Executives of GWRC, the district and
city councils and district health boards in the region, along
with senior representatives from NZ Policy, NZ Fire Service,
Wellington Lifelines Group and the Regional Commissioner for
the Ministry of Social Development.
Rural Fire
Council is required to maintain a rural fire
organisation capable of responding to rural fire events
as provided for in the Forest and Rural Fire Act 2002.
From 1 July 2011 the Wairarapa Rural Fire District
(WRFD) administers this responsibility on Council’s
behalf.
The WRFD is a contractor to SWDC, and this model
continues to have a positive impact.
2. COMMUNITY OUTCOMES TO WHICH
THE ACTIVITY CONTRIBUTES
The community outcomes to which the public
protection activity primarily contributes are described
in the table below.
COMMUNITY OUTCOMES TO WHICH THE ACTIVITY
CONTRIBUTES
COMMUNITY OUTCOMES HOW PUBLIC PROTECTION
CONTRIBUTES
Healthy & economically
secure people
By providing services which help to
protect the health of the community
Educated & knowledgeable people
By contributing to Council’s data base of public information
Vibrant and strong communities
By providing services which help to protect the safety and welfare of the
community
Sustainable South Wairarapa
By providing services in a sustainably managed way
3. THE ACTIVITY GOAL AND PRINCIPAL
OBJECTIVES
The public protection activity goal is:
a) To ensure adequate levels of protection of public
health, welfare and safety.
The Council’s principal objectives are:
a) To ensure that services are provided to meet
legislative requirements and reasonable
community expectations.
b) To ensure that the required services are provided
in a cost effective manner to the community.
c) To put in place appropriate operational regimes
for all matters relating to public protection.
4. ASSETS WE LOOK AFTER
The only assets under this activity are motor vehicles.
SOUTH WAIRARAPA DISTRICT COUNCIL’S LONG TERM PLAN 2015/2025
PART 2: SIGNIFICANT ACTIVITIES 23
5. PROJECTS FOR 2015/16
The projects for 2015/16 include:
Monitor the performance of and if required
review, update and consult on the Council's
bylaws.
Setup and commence a project to scan existing
building consent files along with all new building
consents.
Commence development and establishment of
electronic building consent processing and work
with Masterton District Council and Carterton
District Council where appropriate.
Review the Gambling Policy.
Review adequacy of current pound facility and
determine necessary improvements.
Work where practicable, with the other councils in
the Wairarapa region to develop procedures and
practices to implement the new Food Act.
Complete the development of a Local Alcohol
Policy with MDC and CDC and monitor the
performance of DLC and Council processes in
implementation of the Act and LAP.
Maintain accreditation as a Building Control
Authority. Next bi-annual review is due in 2016.
Review regulatory policy documents by due
dates.
Consider earthquake strengthening support
opportunities.
6. KEY PROJECTS FOR 2016/17 AND
BEYOND
Projects for 2016/17 and beyond include:
Continue scanning existing building consent files.
Changes in legislation may require additional
projects to be initiated, particularly the Food Act
2014, while proposed adjustments to the Building
Act, in particular relating to earthquake prone
buildings, may require specific policy and
operational responses.
7. SIGNIFICANT NEGATIVE EFFECTS
There are no identified significant negative effects this
activity will have on social, economic, environmental,
or cultural well-being of the local community.
SOUTH WAIRARAPA DISTRICT COUNCIL’S LONG TERM PLAN 2015/2025
PART 2: SIGNIFICANT ACTIVITIES 24
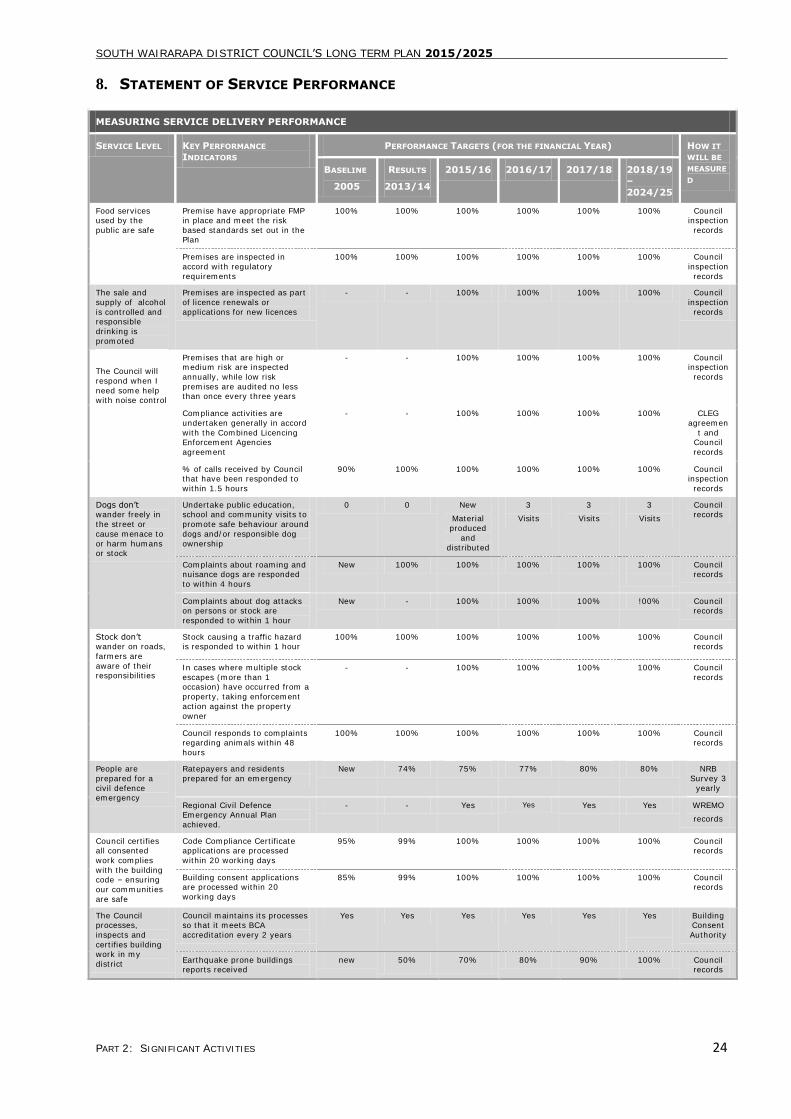
8. STATEMENT OF SERVICE PERFORMANCE
MEASURING SERVICE DELIVERY PERFORMANCE
SERVICE LEVEL KEY PERFORMANCE
INDICATORS
PERFORMANCE TARGETS (FOR THE FINANCIAL YEAR) HOW IT
WILL BE
MEASURE
D BASELINE
2005
RESULTS
2013/14
2015/16 2016/17 2017/18 2018/19
–
2024/25
Food services used by the
public are safe
Premise have appropriate FMP in place and meet the risk
based standards set out in the Plan
100% 100% 100% 100% 100% 100% Council inspection
records
Premises are inspected in
accord with regulatory
requirements
100% 100% 100% 100% 100% 100% Council
inspection
records
The sale and
supply of alcohol
is controlled and responsible
drinking is
promoted
Premises are inspected as part
of licence renewals or
applications for new licences
- - 100% 100% 100% 100% Council
inspection
records
The Council will
respond when I
need some help with noise control
Premises that are high or medium risk are inspected
annually, while low risk
premises are audited no less than once every three years
- - 100% 100% 100% 100% Council inspection
records
Compliance activities are
undertaken generally in accord
with the Combined Licencing Enforcement Agencies
agreement
- - 100% 100% 100% 100% CLEG
agreemen
t and Council
records
% of calls received by Council that have been responded to
within 1.5 hours
90% 100% 100% 100% 100% 100% Council inspection
records
Dogs don’t wander freely in
the street or
cause menace to
or harm humans or stock
Undertake public education, school and community visits to
promote safe behaviour around
dogs and/or responsible dog
ownership
0 0 New
Material
produced
and
distributed
3
Visits
3
Visits
3
Visits
Council records
Complaints about roaming and nuisance dogs are responded
to within 4 hours
New 100% 100% 100% 100% 100%
Council records
Complaints about dog attacks on persons or stock are
responded to within 1 hour
New - 100% 100% 100% !00% Council records
Stock don’t wander on roads,
farmers are
aware of their responsibilities
Stock causing a traffic hazard is responded to within 1 hour
100% 100% 100% 100% 100% 100%
Council records
In cases where multiple stock
escapes (more than 1 occasion) have occurred from a
property, taking enforcement
action against the property
owner
- - 100% 100% 100% 100%
Council
records
Council responds to complaints regarding animals within 48
hours
100% 100% 100% 100% 100% 100% Council records
People are
prepared for a
civil defence emergency
Ratepayers and residents
prepared for an emergency
New 74% 75% 77% 80% 80% NRB
Survey 3
yearly
Regional Civil Defence Emergency Annual Plan
achieved.
- - Yes Yes Yes Yes WREMO
records
Council certifies all consented
work complies
with the building code – ensuring
our communities
are safe
Code Compliance Certificate applications are processed
within 20 working days
95% 99% 100% 100% 100% 100% Council records
Building consent applications are processed within 20
working days
85% 99% 100% 100% 100% 100% Council records
The Council processes,
inspects and
certifies building work in my
district
Council maintains its processes so that it meets BCA
accreditation every 2 years
Yes Yes Yes Yes Yes Yes
Building Consent
Authority
Earthquake prone buildings reports received
new 50% 70% 80% 90% 100% Council records
SOUTH WAIRARAPA DISTRICT COUNCIL’S LONG TERM PLAN 2015/2025
PART 2: SIGNIFICANT ACTIVITIES 25
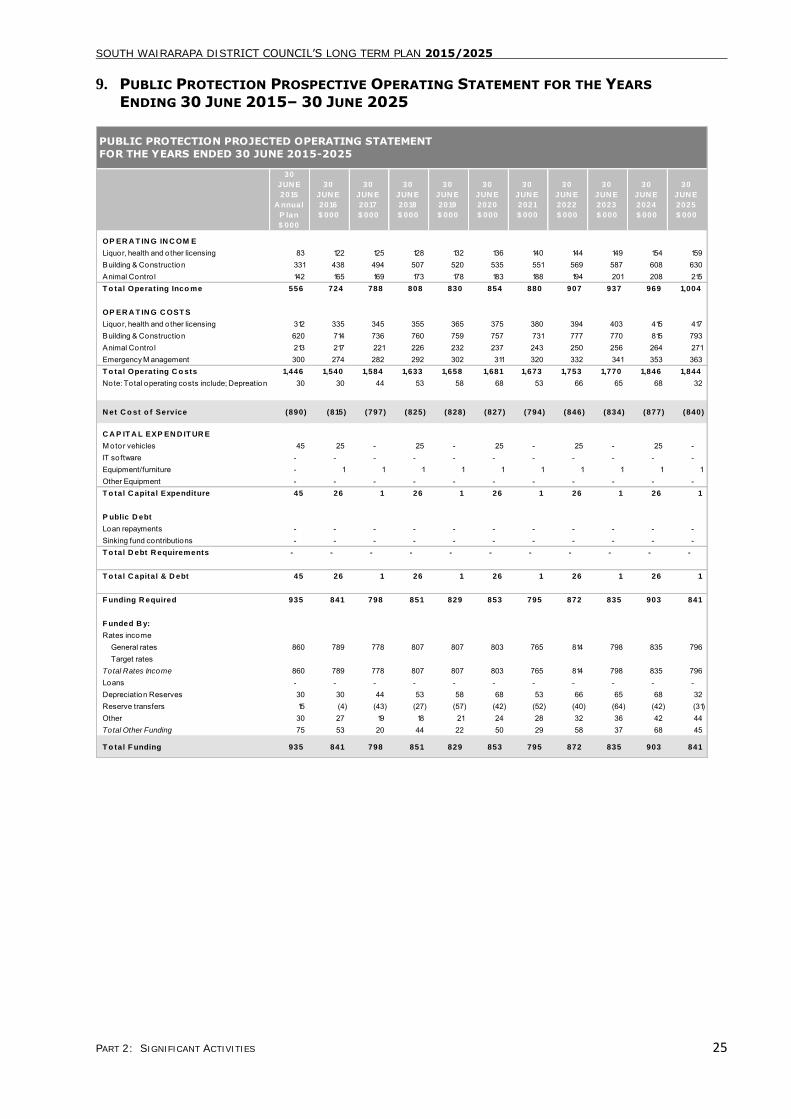
9. PUBLIC PROTECTION PROSPECTIVE OPERATING STATEMENT FOR THE YEARS
ENDING 30 JUNE 2015– 30 JUNE 2025
30
JUN E
2015
A nnual
P lan
$ 000
30
JUN E
2016
$ 000
30
JUN E
2017
$ 000
30
JUN E
2018
$ 000
30
JUN E
2019
$ 000
30
JUN E
2020
$ 000
30
JUN E
2021
$ 000
30
JUN E
2022
$ 000
30
JUN E
2023
$ 000
30
JUN E
2024
$ 000
30
JUN E
2025
$ 000
OP ER A T IN G IN C OM E
Liquor, health and other licensing 83 122 125 128 132 136 140 144 149 154 159 Building & Construction 331 438 494 507 520 535 551 569 587 608 630 Animal Contro l 142 165 169 173 178 183 188 194 201 208 215 T o tal Operat ing Inco me 556 724 788 808 830 854 880 907 937 969 1,004
OP ER A T IN G C OST S
Liquor, health and other licensing 312 335 345 355 365 375 380 394 403 415 417 Building & Construction 620 714 736 760 759 757 731 777 770 815 793 Animal Contro l 213 217 221 226 232 237 243 250 256 264 271 Emergency M anagement 300 274 282 292 302 311 320 332 341 353 363 T o tal Operat ing C o sts 1,446 1,540 1,584 1,633 1,658 1,681 1,673 1,753 1,770 1,846 1,844
Note: Total operating costs include; Depreation 30 30 44 53 58 68 53 66 65 68 32
N et C o st o f Service (890) (815) (797) (825) (828) (827) (794) (846) (834) (877) (840)
C A P IT A L EXP EN D IT UR E
M otor vehicles 45 25 - 25 - 25 - 25 - 25 - IT software - - - - - - - - - - - Equipment/furniture - 1 1 1 1 1 1 1 1 1 1 Other Equipment - - - - - - - - - - - T o tal C apital Expenditure 45 26 1 26 1 26 1 26 1 26 1
P ublic D ebt
Loan repayments - - - - - - - - - - - Sinking fund contributions - - - - - - - - - - - T o tal D ebt R equirements - - - - - - - - - - -
T o tal C apital & D ebt 45 26 1 26 1 26 1 26 1 26 1
F unding R equired 935 841 798 851 829 853 795 872 835 903 841
F unded B y:
Rates income General rates 860 789 778 807 807 803 765 814 798 835 796 Target ratesTotal Rates Income 860 789 778 807 807 803 765 814 798 835 796 Loans - - - - - - - - - - - Depreciation Reserves 30 30 44 53 58 68 53 66 65 68 32 Reserve transfers 15 (4) (43) (27) (57) (42) (52) (40) (64) (42) (31) Other 30 27 19 18 21 24 28 32 36 42 44 Total Other Funding 75 53 20 44 22 50 29 58 37 68 45
T o tal F unding 935 841 798 851 829 853 795 872 835 903 841
PUBLIC PROTECTION PROJECTED OPERATING STATEMENT
FOR THE YEARS ENDED 30 JUNE 2015-2025

SOUTH WAIRARAPA DISTRICT COUNCIL’S LONG TERM PLAN 2015/2025
PART 2: SIGNIFICANT ACTIVITIES 26
10. SOUTH WAIRARAPA DISTRICT COUNCIL FUNDING IMPACT STATEMENT FOR THE
YEARS ENDED 30 JUNE 2015-2025 FOR PUBLIC PROTECTION
30
JUN E
2015
A nnual
P lan
$ 000
30
JUN E
2016
$ 000
30
JUN E
2017
$ 000
30
JUN E
2018
$ 000
30
JUN E
2019
$ 000
30
JUN E
2020
$ 000
30
JUN E
2021
$ 000
30
JUN E
2022
$ 000
30
JUN E
2023
$ 000
30
JUN E
2024
$ 000
30
JUN E
2025
$ 000
So urces o f o perat ing funding
General rates, uniform annual general Charges, Rates Penalties 860 789 778 807 807 803 765 814 798 835 796
Target rates
Subsidies and grants for operating purposes
Fees and charges 540 687 749 768 789 812 836 862 891 922 955
Internal Charges and overheads recoveredLocal authorities fuel tax, fines, infringement fees, and other receipts 45 65 57 58 62 65 71 76 82 90 93
T o tal o perat ing funding (A ) 1,446 1,540 1,584 1,633 1,658 1,681 1,673 1,753 1,770 1,846 1,844
A pplicat io ns o f o perat ing funding
Payments to staff and suppliers 1,167 1,264 1,295 1,328 1,337 1,348 1,349 1,404 1,420 1,485 1,507
Finance costs 6 9 9 9 9 10 10 10 11 11 11
Internal charges and overheads applied 243 238 236 243 254 255 261 273 275 283 294
Other operating funding applications
T o tal applicat io ns o f o perat ing
funding (B ) 1,416 1,510 1,540 1,580 1,600 1,613 1,620 1,687 1,705 1,779 1,811
Surplus (def ic it ) o f o perat ing funding
(A -B )30 30 44 53 58 68 53 66 65 68 32
So urces o f C apital funding
Subsidies and grants for capital expenditure
Development and financial contributions
Increase (decrease) in debt
Gross proceeds from sale of assets
Lump sum contributions
Other dedicated capital funding
T o tal so urces o f capital funding (C ) - - - - - - - - - - -
A pplicat io ns o f capital funding
C apital Expenditure
- to meet additional demand - to improve the level o f service - to replace existing assets 45 26 1 26 1 26 1 26 1 26 1
Increase (decrease) in reserves (15) 4 43 27 57 42 52 40 64 42 31 Increase (decrease) of investmentsT o tal applicat io ns o f capital funding
(D ) 30 30 44 53 58 68 53 66 65 68 32
Surplus (def ic it ) o f capital funding (30) (30) (44) (53) (58) (68) (53) (66) (65) (68) (32)
F unding B alance 0 0 0 0 0 0 0 0 0 0 0
SOUTH WAIRARAPA DISTRICT COUNCIL FUNDING IMPACT STATEMENT FOR THE YEARS ENDED 30 JUNE
2015 - 2025 FOR PUBLIC PROTECTION
SOUTH WAIRARAPA DISTRICT COUNCIL’S LONG TERM PLAN 2015/2025
PART 2: SIGNIFICANT ACTIVITIES 27
ECONOMIC, CULTURAL AND COMMUNITY DEVELOPMENT
1. DESCRIPTION
This Plan summarises the Council’s strategic and
management long term approach to economic,
cultural and community development.
Council’s role to promote the social, economic,
environmental and cultural well-being of the
community involves working collaboratively with
organisations and community groups. Moving
forward Council aims to be creative and innovative
in its thinking and action.
South Wairarapa District Council is a small rural
council with a small ratepayer base. By necessity
it has to use its resources carefully and where
practicable, work with other Wairarapa councils and
other organisations to achieve results. Other
organisations in the community undertake social,
environmental and cultural work and where
appropriate Council provides grants to these
organisations as part of the annual planning
process.
2. COMMUNITY OUTCOMES TO WHICH
THE ACTIVITY CONTRIBUTES
The community outcomes to which the economic,
cultural and community development activity
primarily contributes are described in the table
below:
COMMUNITY OUTCOMES TO WHICH THE ACTIVITY
CONTRIBUTES
COMMUNITY OUTCOMES HOW THE ECONOMIC/CULTURAL AND
COMMUNITY DEVELOPMENT ACTIVITY
CONTRIBUTES
Healthy & economically
secure people
By contributing to the economic
development of the district
Educated and
knowledgeable people
By contributing to the cultural
development of the district
Vibrant and strong By contributing to the social and community development of the district
Sustainable South Wairarapa
By contributing to the environmental well-being of the district
3. THE ACTIVITY GOAL & PRINCIPAL
OBJECTIVES
The economic, cultural and community development
activity goals are:
a) To assist in the stimulation of appropriate and
sustainable economic, tourism and cultural
growth and the development of employment
opportunities throughout the district.
b) To actively develop a safe, inclusive and
cohesive community.
The Council’s principal objectives are:
a) To create a climate for and give encouragement
to organisations and individuals to take
initiatives in the stimulation of economic
growth, tourism and employment opportunities
in the district.
b) To encourage interest in the social development
of the district with the aim of assisting
individuals and community groups to help
themselves.
c) To encourage cultural development for the
benefit of the district and Wairarapa as a
whole.
d) To actively develop a safe, inclusive and
cohesive community by:
1. Making South Wairarapa a safe place for its
residents.
2. Promoting South Wairarapa as a good
place in which to live.
3. Fostering a sense of community pride.
4. Consulting widely to ensure representative
and inclusive policies.
5. Respecting obligations under the Treaty of
Waitangi.
e) To provide community leadership, facilitation,
advocacy and contribute to funding where it
can by way of grants.
4. ASSETS WE LOOK AFTER
There are no assets that this activity manages.
5. PROJECTS FOR 2015/16
Projects for 2015/16 include:
Continued involvement with economic
development both regionally and locally
through the Wellington Regional Strategy,
Wellington Regional Economic Development
Agency, Destination Wairarapa and other
agencies and local business groups.
Continued support for Wairarapa Safer
Community Trust.
Support for cultural organisations including the
Wairarapa Cultural Trust.
Continue to administer the Creative
Communities Scheme under contract with
Creative NZ.
Continued support for the Wairarapa water
project.
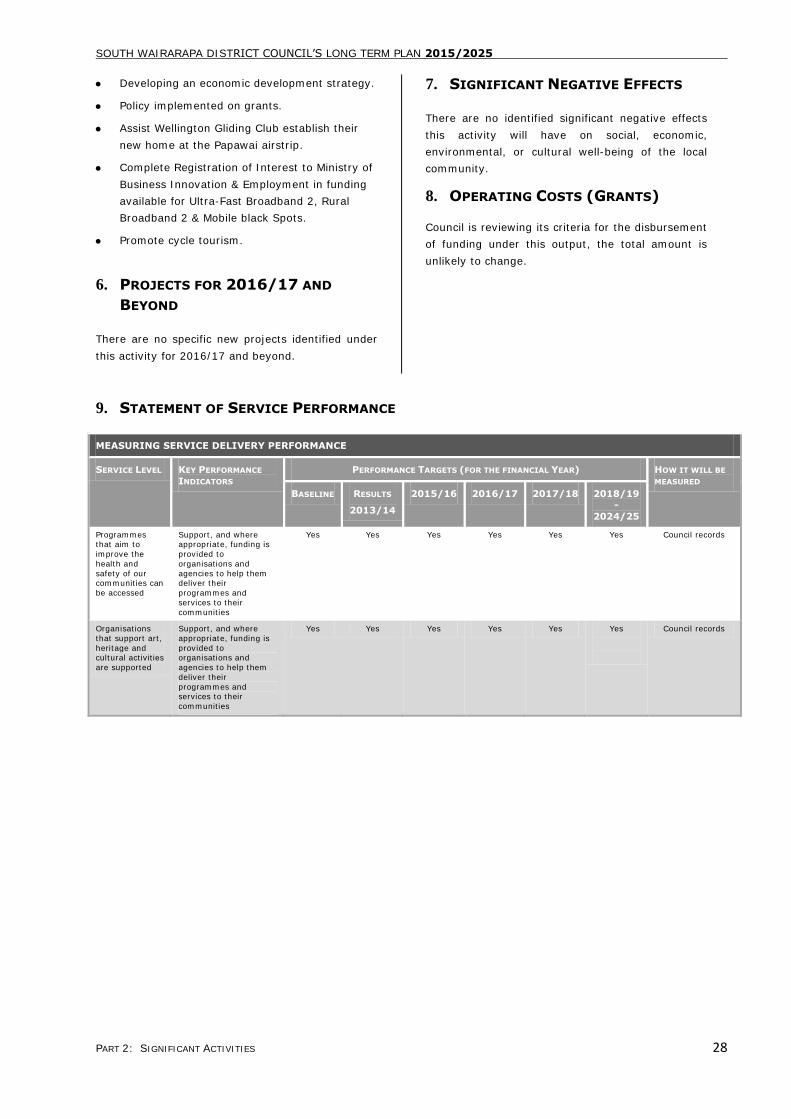
SOUTH WAIRARAPA DISTRICT COUNCIL’S LONG TERM PLAN 2015/2025
PART 2: SIGNIFICANT ACTIVITIES 28
Developing an economic development strategy.
Policy implemented on grants.
Assist Wellington Gliding Club establish their
new home at the Papawai airstrip.
Complete Registration of Interest to Ministry of
Business Innovation & Employment in funding
available for Ultra-Fast Broadband 2, Rural
Broadband 2 & Mobile black Spots.
Promote cycle tourism.
6. PROJECTS FOR 2016/17 AND
BEYOND
There are no specific new projects identified under
this activity for 2016/17 and beyond.
7. SIGNIFICANT NEGATIVE EFFECTS
There are no identified significant negative effects
this activity will have on social, economic,
environmental, or cultural well-being of the local
community.
8. OPERATING COSTS (GRANTS)
Council is reviewing its criteria for the disbursement
of funding under this output, the total amount is
unlikely to change.
9. STATEMENT OF SERVICE PERFORMANCE
MEASURING SERVICE DELIVERY PERFORMANCE
SERVICE LEVEL KEY PERFORMANCE
INDICATORS
PERFORMANCE TARGETS (FOR THE FINANCIAL YEAR) HOW IT WILL BE
MEASURED
BASELINE RESULTS
2013/14
2015/16 2016/17 2017/18 2018/19-
2024/25
Programmes that aim to
improve the
health and
safety of our communities can
be accessed
Support, and where appropriate, funding is
provided to
organisations and
agencies to help them deliver their
programmes and
services to their
communities
Yes Yes Yes Yes Yes Yes Council records
Organisations
that support art,
heritage and cultural activities
are supported
Support, and where
appropriate, funding is
provided to organisations and
agencies to help them
deliver their
programmes and services to their
communities
Yes Yes Yes Yes Yes Yes
Council records
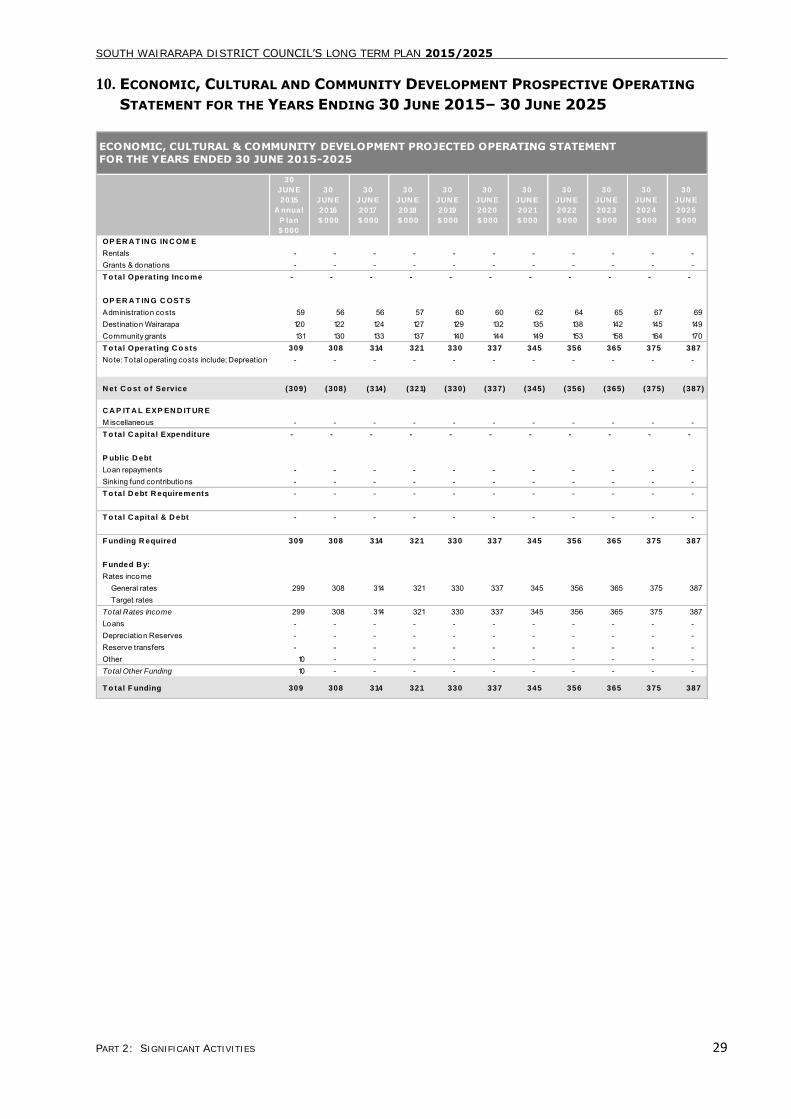
SOUTH WAIRARAPA DISTRICT COUNCIL’S LONG TERM PLAN 2015/2025
PART 2: SIGNIFICANT ACTIVITIES 29
10. ECONOMIC, CULTURAL AND COMMUNITY DEVELOPMENT PROSPECTIVE OPERATING
STATEMENT FOR THE YEARS ENDING 30 JUNE 2015– 30 JUNE 2025
30
JUN E
2015
A nnual
P lan
$ 000
30
JUN E
2016
$ 000
30
JUN E
2017
$ 000
30
JUN E
2018
$ 000
30
JUN E
2019
$ 000
30
JUN E
2020
$ 000
30
JUN E
2021
$ 000
30
JUN E
2022
$ 000
30
JUN E
2023
$ 000
30
JUN E
2024
$ 000
30
JUN E
2025
$ 000
OP ER A T IN G IN C OM E
Rentals - - - - - - - - - - - Grants & donations - - - - - - - - - - - T o tal Operat ing Inco me - - - - - - - - - - -
OP ER A T IN G C OST S
Administration costs 59 56 56 57 60 60 62 64 65 67 69 Destination Wairarapa 120 122 124 127 129 132 135 138 142 145 149 Community grants 131 130 133 137 140 144 149 153 158 164 170 T o tal Operat ing C o sts 309 308 314 321 330 337 345 356 365 375 387
Note: Total operating costs include; Depreation - - - - - - - - - - -
N et C o st o f Service (309) (308) (314) (321) (330) (337) (345) (356) (365) (375) (387)
C A P IT A L EXP EN D IT UR E
M iscellaneous - - - - - - - - - - - T o tal C apital Expenditure - - - - - - - - - - -
P ublic D ebt
Loan repayments - - - - - - - - - - - Sinking fund contributions - - - - - - - - - - - T o tal D ebt R equirements - - - - - - - - - - -
T o tal C apital & D ebt - - - - - - - - - - -
F unding R equired 309 308 314 321 330 337 345 356 365 375 387
F unded B y:
Rates income General rates 299 308 314 321 330 337 345 356 365 375 387 Target ratesTotal Rates Income 299 308 314 321 330 337 345 356 365 375 387 Loans - - - - - - - - - - - Depreciation Reserves - - - - - - - - - - - Reserve transfers - - - - - - - - - - - Other 10 - - - - - - - - - - Total Other Funding 10 - - - - - - - - - -
T o tal F unding 309 308 314 321 330 337 345 356 365 375 387
ECONOMIC, CULTURAL & COMMUNITY DEVELOPMENT PROJECTED OPERATING STATEMENT
FOR THE YEARS ENDED 30 JUNE 2015-2025
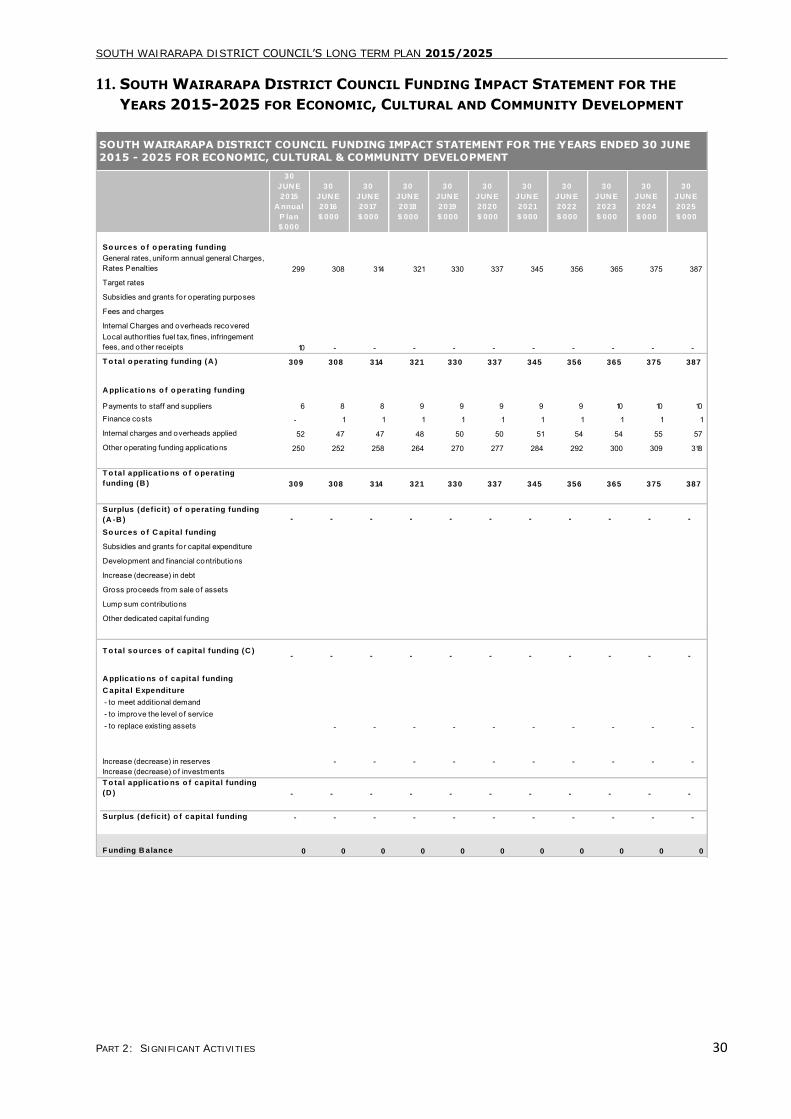
SOUTH WAIRARAPA DISTRICT COUNCIL’S LONG TERM PLAN 2015/2025
PART 2: SIGNIFICANT ACTIVITIES 30
11. SOUTH WAIRARAPA DISTRICT COUNCIL FUNDING IMPACT STATEMENT FOR THE
YEARS 2015-2025 FOR ECONOMIC, CULTURAL AND COMMUNITY DEVELOPMENT
30
JUN E
2015
A nnual
P lan
$ 000
30
JUN E
2016
$ 000
30
JUN E
2017
$ 000
30
JUN E
2018
$ 000
30
JUN E
2019
$ 000
30
JUN E
2020
$ 000
30
JUN E
2021
$ 000
30
JUN E
2022
$ 000
30
JUN E
2023
$ 000
30
JUN E
2024
$ 000
30
JUN E
2025
$ 000
So urces o f o perat ing funding
General rates, uniform annual general Charges, Rates Penalties 299 308 314 321 330 337 345 356 365 375 387
Target rates
Subsidies and grants for operating purposes
Fees and charges
Internal Charges and overheads recoveredLocal authorities fuel tax, fines, infringement fees, and other receipts 10 - - - - - - - - - -
T o tal o perat ing funding (A ) 309 308 314 321 330 337 345 356 365 375 387
A pplicat io ns o f o perat ing funding
Payments to staff and suppliers 6 8 8 9 9 9 9 9 10 10 10
Finance costs - 1 1 1 1 1 1 1 1 1 1
Internal charges and overheads applied 52 47 47 48 50 50 51 54 54 55 57
Other operating funding applications 250 252 258 264 270 277 284 292 300 309 318
T o tal applicat io ns o f o perat ing
funding (B ) 309 308 314 321 330 337 345 356 365 375 387
Surplus (def ic it ) o f o perat ing funding
(A -B ) - - - - - - - - - - -
So urces o f C apital funding
Subsidies and grants for capital expenditure
Development and financial contributions
Increase (decrease) in debt
Gross proceeds from sale of assets
Lump sum contributions
Other dedicated capital funding
T o tal so urces o f capital funding (C )- - - - - - - - - - -
A pplicat io ns o f capital funding
C apital Expenditure
- to meet additional demand - to improve the level o f service - to replace existing assets - - - - - - - - - -
Increase (decrease) in reserves - - - - - - - - - - Increase (decrease) of investmentsT o tal applicat io ns o f capital funding
(D ) - - - - - - - - - - -
Surplus (def ic it ) o f capital funding - - - - - - - - - - -
F unding B alance 0 0 0 0 0 0 0 0 0 0 0
SOUTH WAIRARAPA DISTRICT COUNCIL FUNDING IMPACT STATEMENT FOR THE YEARS ENDED 30 JUNE
2015 - 2025 FOR ECONOMIC, CULTURAL & COMMUNITY DEVELOPMENT
SOUTH WAIRARAPA DISTRICT COUNCIL’S LONG TERM PLAN 2015/2025
PART 2: SIGNIFICANT ACTIVITIES 31
RESOURCE MANAGEMENT
1. DESCRIPTION
Council, together with Carterton and Masterton
District Councils, has a Combined District Plan
under the Resource Management Act 1991.
Under the Act, Council’s district plan should be
monitored and reviewed to ensure the plans
objectives, policies and rules continue to achieve
integrated management of the effects of activities
on the environment; that mitigation or avoidance of
natural hazards is achieved, that hazardous
substances are managed, that land uses,
subdivision of land or use of contaminated land is
appropriately controlled, that noise emissions are
controlled or mitigated and, activities on the surface
of water are appropriately regulated.
This plan summarises the Council’s strategic long-
term approach to resource management, and
controls on the day to day activities of people in the
district through the Plan.
2. COMMUNITY OUTCOMES TO WHICH
THE ACTIVITY CONTRIBUTES
The community outcomes to which resource
management contributes are described in the table
below.
COMMUNITY OUTCOMES TO WHICH THE ACTIVITY
CONTRIBUTES
COMMUNITY OUTCOMES HOW THE RESOURCE MANAGEMENT
ACTIVITY CONTRIBUTES
Educated and knowledgeable people
By contributing to people’s confidence that they can achieve their aspirations
Vibrant and strong communities
By contributing to people feeling safe, are proud to live and have a sense of
belonging
Sustainable South Wairarapa
By ensuring that the district is sustainably managed where economic
development and responsible
environmental management go hand in
hand
3. THE ACTIVITY GOAL AND PRINCIPAL
OBJECTIVES
The resource management activity goals are:
a) To promote the sustainable management of
natural and physical resources of the district.
b) To maintain an effective District Plan that
meets all statutory requirements.
c) To administer the District Plan in an accurate,
consistent and timely manner, providing
certainty to residents and meeting legal
requirements.
The Council’s principal objectives are:
a) Assess all land use and subdivision applications
in accord with the requirements of the Act,
Regional Policy Statement and District Plan.
b) Seek compliance with and if required enforce
the rules of the District Plan, and take
appropriate (in the circumstances) action where
breaches have been identified.
c) Prepare and implement changes to the District
Plan where a change of policy is promoted by
Council or deficiencies in the Plans provisions
have become apparent through practice or
monitoring.
d) Advise the public on the provisions of the
District Plan and on general planning related
matters of whatever nature.
4. ASSETS WE LOOK AFTER
There are no assets that this activity manages.
5. PROJECTS FOR 2015/16
Projects for 2015/16 include:
Monitor the implementation of the Coastal
Reserves Management Plan.
Continue to improve the functionality of the
District Plan and undertake Council initiated
plan changes where necessary.
Respond to changes to the Resource
Management Act 1991 by Government to
ensure compliance with statutory requirements.
Continue to provide an approach that meets
the Council's legislative requirements while
facilitating investment in buildings and
businesses in the district.
Review residential water race maintenance.
Review the Combined Wairarapa District Plan in
particular notable trees, historic buildings,
signage, residential standards and flood
management.
6. PROJECTS FOR 2016/17 AND
BEYOND
Intended changes to the Resource Management Act
by Government will impact significantly on future
planning activity and service delivery. While these
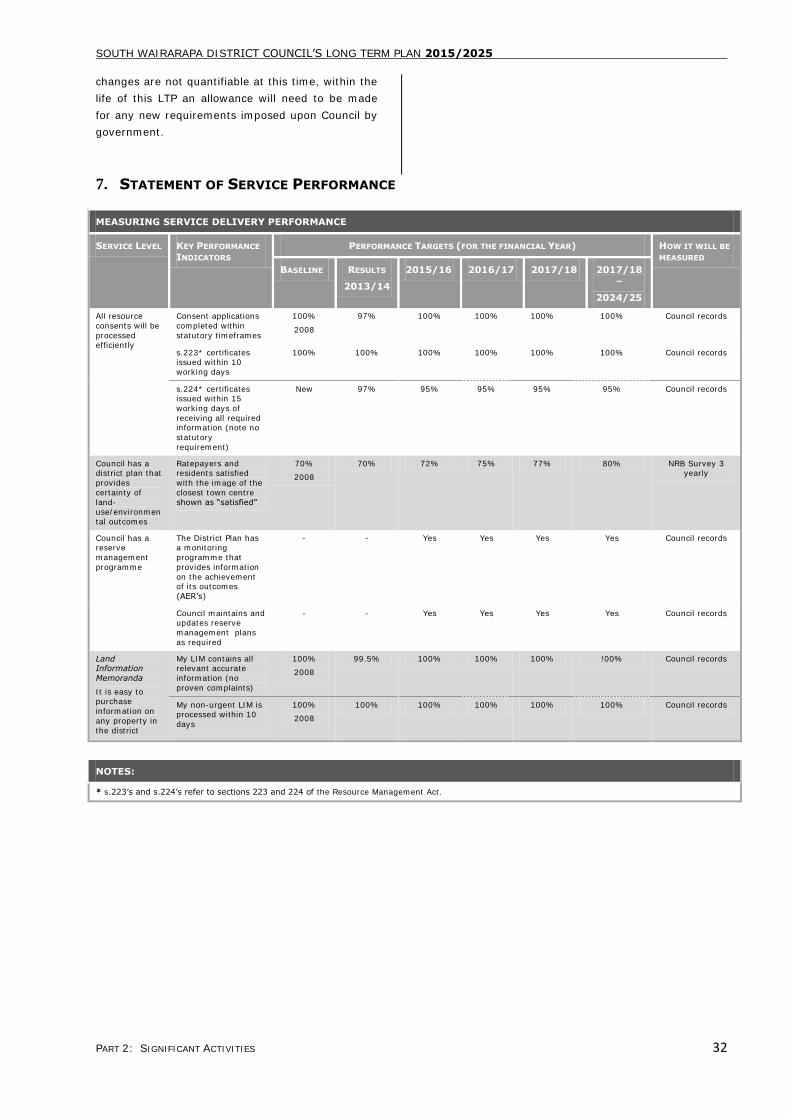
SOUTH WAIRARAPA DISTRICT COUNCIL’S LONG TERM PLAN 2015/2025
PART 2: SIGNIFICANT ACTIVITIES 32
changes are not quantifiable at this time, within the
life of this LTP an allowance will need to be made
for any new requirements imposed upon Council by
government.
7. STATEMENT OF SERVICE PERFORMANCE
MEASURING SERVICE DELIVERY PERFORMANCE
SERVICE LEVEL KEY PERFORMANCE
INDICATORS
PERFORMANCE TARGETS (FOR THE FINANCIAL YEAR) HOW IT WILL BE
MEASURED
BASELINE RESULTS
2013/14
2015/16 2016/17 2017/18 2017/18
–
2024/25
All resource
consents will be
processed efficiently
Consent applications
completed within
statutory timeframes
100%
2008
97% 100% 100% 100% 100% Council records
s.223* certificates issued within 10
working days
100% 100% 100% 100% 100% 100% Council records
s.224* certificates issued within 15
working days of
receiving all required information (note no
statutory
requirement)
New 97% 95% 95% 95% 95% Council records
Council has a district plan that
provides
certainty of
land-use/environmen
tal outcomes
Ratepayers and residents satisfied
with the image of the
closest town centre
shown as “satisfied”
70%
2008
70% 72% 75% 77% 80% NRB Survey 3 yearly
Council has a reserve
management
programme
The District Plan has a monitoring
programme that
provides information
on the achievement of its outcomes
(AER’s)
- - Yes Yes Yes Yes Council records
Council maintains and updates reserve
management plans
as required
- - Yes Yes Yes Yes Council records
Land Information
Memoranda
It is easy to purchase
information on
any property in
the district
My LIM contains all relevant accurate
information (no
proven complaints)
100%
2008
99.5% 100% 100% 100% !00% Council records
My non-urgent LIM is processed within 10
days
100%
2008
100% 100% 100% 100% 100% Council records
NOTES:
* s.223’s and s.224’s refer to sections 223 and 224 of the Resource Management Act.
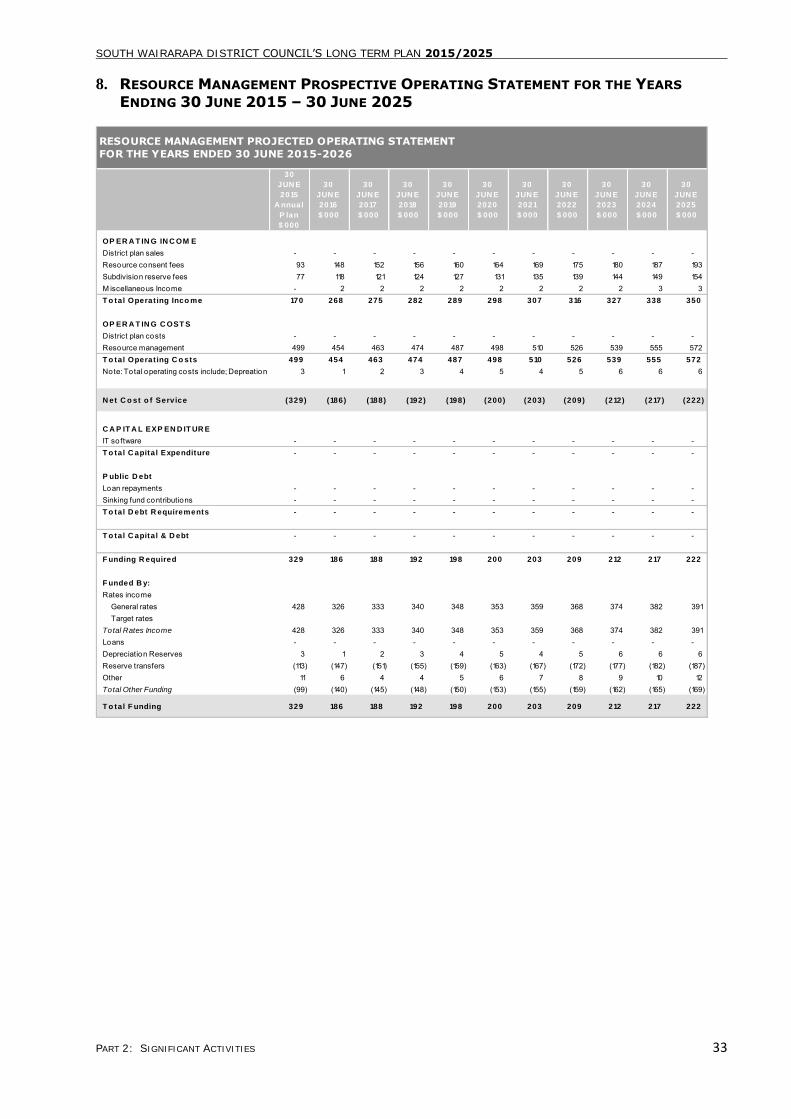
SOUTH WAIRARAPA DISTRICT COUNCIL’S LONG TERM PLAN 2015/2025
PART 2: SIGNIFICANT ACTIVITIES 33
8. RESOURCE MANAGEMENT PROSPECTIVE OPERATING STATEMENT FOR THE YEARS
ENDING 30 JUNE 2015 – 30 JUNE 2025
30
JUN E
2015
A nnual
P lan
$ 000
30
JUN E
2016
$ 000
30
JUN E
2017
$ 000
30
JUN E
2018
$ 000
30
JUN E
2019
$ 000
30
JUN E
2020
$ 000
30
JUN E
2021
$ 000
30
JUN E
2022
$ 000
30
JUN E
2023
$ 000
30
JUN E
2024
$ 000
30
JUN E
2025
$ 000
OP ER A T IN G IN C OM E
District plan sales - - - - - - - - - - - Resource consent fees 93 148 152 156 160 164 169 175 180 187 193 Subdivision reserve fees 77 118 121 124 127 131 135 139 144 149 154 M iscellaneous Income - 2 2 2 2 2 2 2 2 3 3 T o tal Operat ing Inco me 170 268 275 282 289 298 307 316 327 338 350
OP ER A T IN G C OST S
District plan costs - - - - - - - - - - - Resource management 499 454 463 474 487 498 510 526 539 555 572 T o tal Operat ing C o sts 499 454 463 474 487 498 510 526 539 555 572
Note: Total operating costs include; Depreation 3 1 2 3 4 5 4 5 6 6 6
N et C o st o f Service (329) (186) (188) (192) (198) (200) (203) (209) (212) (217) (222)
C A P IT A L EXP EN D IT UR E
IT software - - - - - - - - - - - T o tal C apital Expenditure - - - - - - - - - - -
P ublic D ebt
Loan repayments - - - - - - - - - - - Sinking fund contributions - - - - - - - - - - - T o tal D ebt R equirements - - - - - - - - - - -
T o tal C apital & D ebt - - - - - - - - - - -
F unding R equired 329 186 188 192 198 200 203 209 212 217 222
F unded B y:
Rates income General rates 428 326 333 340 348 353 359 368 374 382 391 Target ratesTotal Rates Income 428 326 333 340 348 353 359 368 374 382 391 Loans - - - - - - - - - - - Depreciation Reserves 3 1 2 3 4 5 4 5 6 6 6 Reserve transfers (113) (147) (151) (155) (159) (163) (167) (172) (177) (182) (187) Other 11 6 4 4 5 6 7 8 9 10 12 Total Other Funding (99) (140) (145) (148) (150) (153) (155) (159) (162) (165) (169)
T o tal F unding 329 186 188 192 198 200 203 209 212 217 222
RESOURCE MANAGEMENT PROJECTED OPERATING STATEMENT
FOR THE YEARS ENDED 30 JUNE 2015-2026
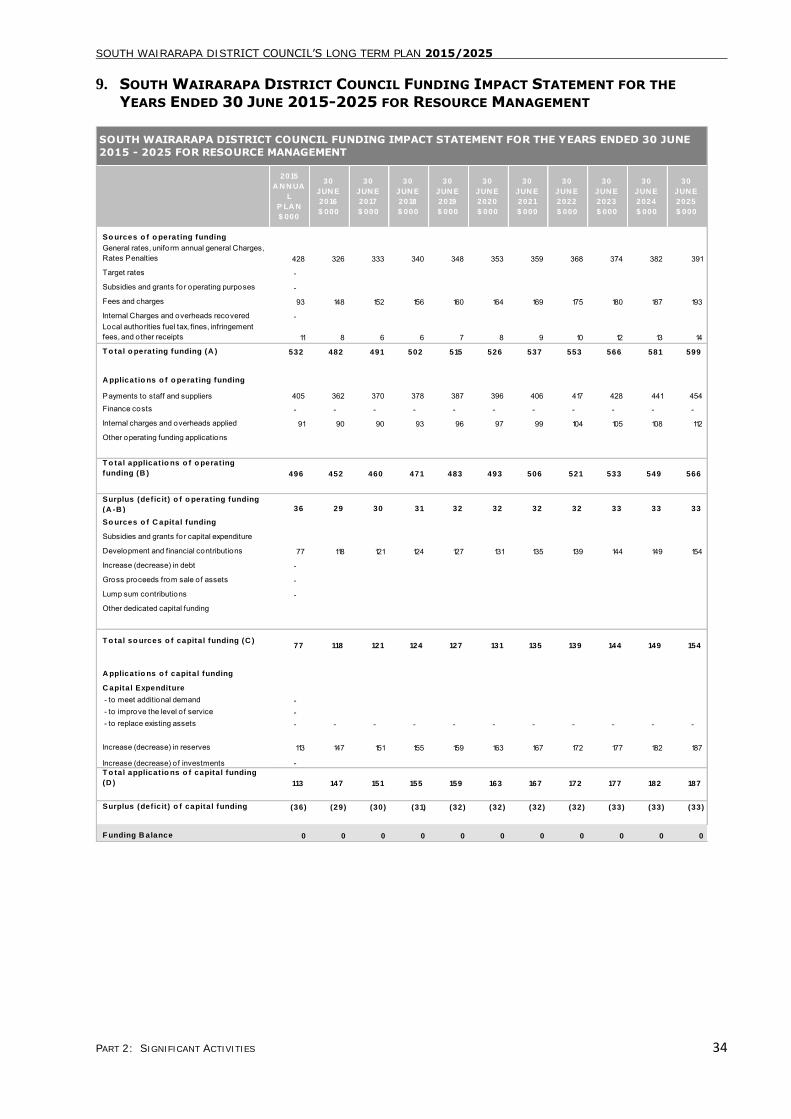
SOUTH WAIRARAPA DISTRICT COUNCIL’S LONG TERM PLAN 2015/2025
PART 2: SIGNIFICANT ACTIVITIES 34
9. SOUTH WAIRARAPA DISTRICT COUNCIL FUNDING IMPACT STATEMENT FOR THE
YEARS ENDED 30 JUNE 2015-2025 FOR RESOURCE MANAGEMENT
2015
A N N UA
L
P LA N
$ 000
30
JUN E
2016
$ 000
30
JUN E
2017
$ 000
30
JUN E
2018
$ 000
30
JUN E
2019
$ 000
30
JUN E
2020
$ 000
30
JUN E
2021
$ 000
30
JUN E
2022
$ 000
30
JUN E
2023
$ 000
30
JUN E
2024
$ 000
30
JUN E
2025
$ 000
So urces o f o perat ing funding
General rates, uniform annual general Charges, Rates Penalties 428 326 333 340 348 353 359 368 374 382 391
Target rates -
Subsidies and grants for operating purposes -
Fees and charges 93 148 152 156 160 164 169 175 180 187 193
Internal Charges and overheads recovered - Local authorities fuel tax, fines, infringement fees, and other receipts 11 8 6 6 7 8 9 10 12 13 14
T o tal o perat ing funding (A ) 532 482 491 502 515 526 537 553 566 581 599
A pplicat io ns o f o perat ing funding
Payments to staff and suppliers 405 362 370 378 387 396 406 417 428 441 454
Finance costs - - - - - - - - - - -
Internal charges and overheads applied 91 90 90 93 96 97 99 104 105 108 112
Other operating funding applications
T o tal applicat io ns o f o perat ing
funding (B ) 496 452 460 471 483 493 506 521 533 549 566
Surplus (def ic it ) o f o perat ing funding
(A -B ) 36 29 30 31 32 32 32 32 33 33 33
So urces o f C apital funding
Subsidies and grants for capital expenditure
Development and financial contributions 77 118 121 124 127 131 135 139 144 149 154
Increase (decrease) in debt -
Gross proceeds from sale of assets -
Lump sum contributions -
Other dedicated capital funding
T o tal so urces o f capital funding (C )77 118 121 124 127 131 135 139 144 149 154
A pplicat io ns o f capital funding
C apital Expenditure
- to meet additional demand - - to improve the level o f service - - to replace existing assets - - - - - - - - - - -
Increase (decrease) in reserves 113 147 151 155 159 163 167 172 177 182 187
Increase (decrease) of investments - T o tal applicat io ns o f capital funding
(D ) 113 147 151 155 159 163 167 172 177 182 187
Surplus (def ic it ) o f capital funding (36) (29) (30) (31) (32) (32) (32) (32) (33) (33) (33)
F unding B alance 0 0 0 0 0 0 0 0 0 0 0
SOUTH WAIRARAPA DISTRICT COUNCIL FUNDING IMPACT STATEMENT FOR THE YEARS ENDED 30 JUNE
2015 - 2025 FOR RESOURCE MANAGEMENT
SOUTH WAIRARAPA DISTRICT COUNCIL’S LONG TERM PLAN 2015/2025
PART 2: SIGNIFICANT ACTIVITIES 35
AMENITIES
1. DESCRIPTION
This plan summarises the Council’s strategic and
management long term approach to amenity
development.
Council owns a number of properties and amenities
in the district. These are held to assist Council to
achieve its objectives (e.g. Council offices), or for
social and historical reasons.
The Local Government Act 2002 provides the
statutory authority for Council to own and manage
properties. Council provides the management,
planning, administration and maintenance of
outdoor sports and recreation areas, children’s
playgrounds, passive parks, reserves and open
spaces for casual and spontaneous leisure needs.
In addition, Council is a key member of the Joint
Wairarapa Moana Conservation Project for Lake
Wairarapa in partnership with iwi, Greater
Wellington Regional Council and Department of
Conservation.
The Council is also responsible for the provision and
maintenance of Council’s cemeteries, public
swimming pools, and management of Council’s
forestry plantations and for the administration of
Council’s policies relating to amenities.
Following a consultation process coastal plans have
been completed and a prioritised program of work
has been allowed for in this LTP.
The libraries in the district are operated as part of
the Wairarapa Library Service, a combined
operation with the Carterton District Council.
2. COMMUNITY OUTCOMES TO WHICH
THE ACTIVITY CONTRIBUTES
The community outcomes to which the amenities
activity primarily contributes are described in the
following table.
COMMUNITY OUTCOMES TO WHICH THE ACTIVITY
CONTRIBUTES
COMMUNITY OUTCOMES HOW THE AMENITIES ACTIVITY
CONTRIBUTES
Healthy & economically secure people.
By providing amenities to assist active communities
Educated & knowledgeable people.
By providing amenities to assist people achieve their aspirations
Vibrant & strong communities
By providing amenities for outside communities to feel safe, so that they
are proud to live here and have a sense
of belonging
Sustainable South Wairarapa
By providing amenities which are sustainably managed
3. THE ACTIVITY GOAL AND PRINCIPAL
OBJECTIVES
The amenities activity goals are:
a) To provide facilities for recreational and social
enhancement.
b) To provide facilities that encourages the safe
and sustainable use of the natural environment
while protecting that natural environment.
The Council’s objectives are:
a) To maintain its assets enabling the public to
safely enjoy the recreational and social services
provided.
b) To achieve defined standards of customer
service.
c) To comply with legal requirements.
d) To achieve defined technical standards.
e) To achieve defined environmental standards.
f) To achieve defined management standards.
4. ASSETS WE LOOK AFTER
This activity maintains the following assets:
Featherston
The following Featherston public amenities are
owned and maintained by Council:
Card Reserve/Randolph Park and Swimming
Pool, Featherston Cemetery, Featherston
Information Centre, Clifford Square, library,
playground, toilet, Dorset Square, Anzac Hall,
War Memorial, Walkway Kereru Grove to Titoki
Grove, Walkway Hardie Grove to Brandon
Street, Walkway Kenward Street to Harrison
Street West, Walkway Watt Street, Walkway
Brandon St to Ludlum St (SH2), Garden One
Tree Hill walkway Revans Street, Garden One
Tree Hill Walkway Bell Street, pensioner flats
(Burling and Mathews), Featherston Swimming
Pool, dog park and skateboard park.
Greytown
The following Greytown public amenities are owned
and maintained by Council:
Greytown Cemetery, SH2 berm Greytown
Southern Gateway, Dog Park, Arbor Reserve,
SOUTH WAIRARAPA DISTRICT COUNCIL’S LONG TERM PLAN 2015/2025
PART 2: SIGNIFICANT ACTIVITIES 36
Pensioner Flats in West Street, Collier Reserve,
Kowhai Reserve, Stella Bull Park and old library
building, public toilets, Soldiers Memorial Park
(includes playground, carpark, bushwalk and
sports fields), Greytown Campground,
Greytown Swimming Pool and the Greytown
Town Centre building.
Martinborough
The following Martinborough public amenities are
owned and maintained by Council:
Dublin Street Cemetery and Puruatanga Road
Cemetery, Centennial Park, Martinborough
Motor Camp, Martinborough Swimming Pool,
Huangarua Park, Coronation Park and
Puruatanga Park, Memorial Square,
Martinborough Town Hall, Martinborough
Playground, Martinborough Public Toilet,
Martinborough Museum, the pensioner flats on
Naples Street, and the newly opened dog park.
Rural
The following rural public amenities are owned and
maintained by Council:
Camp Memorial and Peace Garden SH2, Otauira
Reserve, Lake Reserve off Lake Domain Road
south of Featherston, Diversion Reserve off
East West Access Road near the Barrage
Bridge, Te Hopi camp site off East West Access
Road, Lake Ferry two large grassed areas one
either side of the Motor Camp (includes toilets
and playground), Lake Ferry car park surf
toilet, coastal camping area with pit toilet, Te
Awaiti and Tora Farm Road toilets and sites for
camping, Cape Palliser Road litter bin sites and
pit toilet.
Other amenities
The following amenities are owned and maintained
by Council and/or Council’s leasee:
Featherston: Daniell Street adjacent to
Railway, Johnson Street adjacent to railway,
traffic islands and berms.
Martinborough: Grassed area adjacent to the
fire station, Council offices, information centre
building and garden, old Council works office
and yard, old Council chambers in Cork Street,
and Pain Farm.
Greytown: Historic railway goods shed,
Greytown cycle trail, and the walkway between
Udy and Kuratawhiti Streets.
5. PROJECTS FOR 2015/16
Projects for 2015/16 include:
Continue the new cemetery development at
Featherston.
Carry out the strengthening of Martinborough
Town Hall.
Program works from the coastal reserves
development plans.
Establish Soldiers Memorial Park Development
Plan.
Featherston Town Square.
Complete the ANZAC Hall upgrade.
Complete pool upgrades.
Development plan for youth focused facility in
Greytown.
Development plan for Card Reserve.
Connect libraries to ultra-fast broadband.
PROJECTS FOR 2016/17 AND BEYOND
Projects for 2016/17 and beyond include:
RF ID library system.
6. SIGNIFICANT NEGATIVE EFFECTS
There are no identified significant negative effects
this activity will have on social, economic,
environmental, or cultural well-being of the local
community.
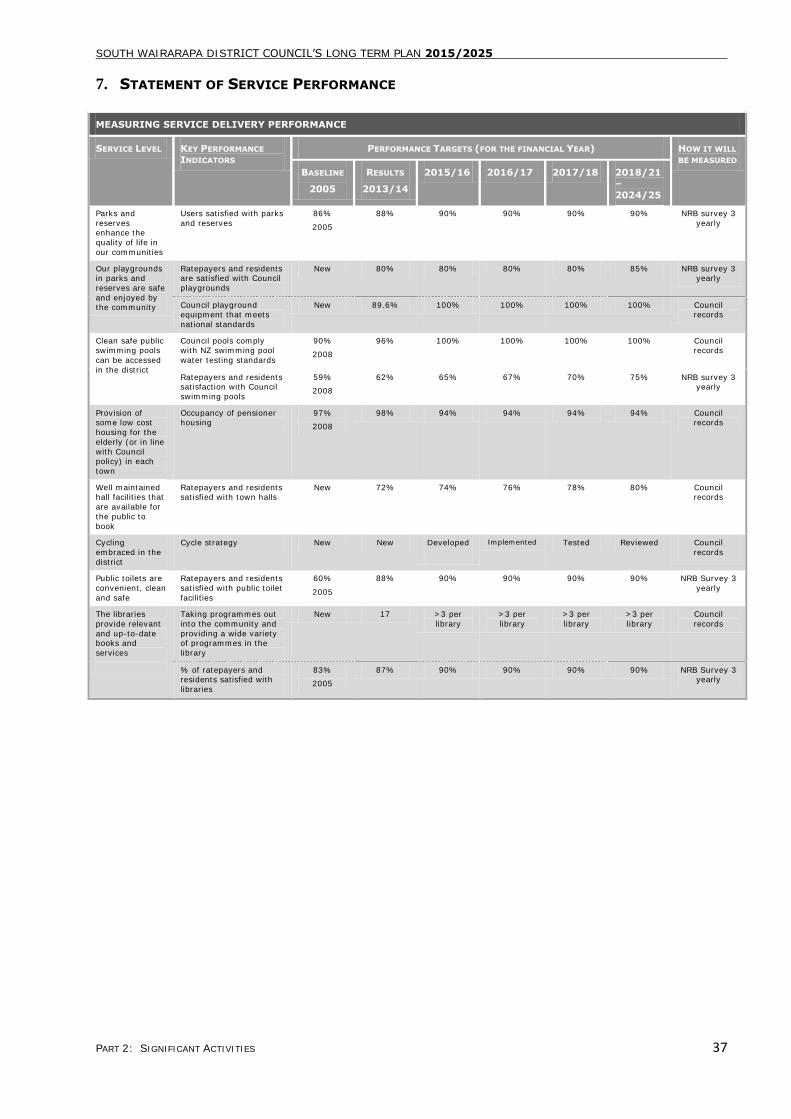
SOUTH WAIRARAPA DISTRICT COUNCIL’S LONG TERM PLAN 2015/2025
PART 2: SIGNIFICANT ACTIVITIES 37
7. STATEMENT OF SERVICE PERFORMANCE
MEASURING SERVICE DELIVERY PERFORMANCE
SERVICE LEVEL KEY PERFORMANCE
INDICATORS
PERFORMANCE TARGETS (FOR THE FINANCIAL YEAR) HOW IT WILL
BE MEASURED
BASELINE
2005
RESULTS
2013/14
2015/16 2016/17 2017/18 2018/21
–
2024/25
Parks and
reserves enhance the
quality of life in
our communities
Users satisfied with parks
and reserves
86%
2005
88% 90% 90% 90% 90% NRB survey 3
yearly
Our playgrounds in parks and
reserves are safe
and enjoyed by the community
Ratepayers and residents are satisfied with Council
playgrounds
New 80% 80% 80% 80% 85% NRB survey 3 yearly
Council playground equipment that meets
national standards
New 89.6% 100% 100% 100% 100% Council records
Clean safe public swimming pools
can be accessed
in the district
Council pools comply with NZ swimming pool
water testing standards
90%
2008
96% 100% 100% 100% 100% Council records
Ratepayers and residents satisfaction with Council
swimming pools
59%
2008
62% 65% 67% 70% 75% NRB survey 3 yearly
Provision of some low cost
housing for the
elderly (or in line
with Council policy) in each
town
Occupancy of pensioner housing
97%
2008
98% 94% 94% 94% 94% Council records
Well maintained hall facilities that
are available for
the public to
book
Ratepayers and residents satisfied with town halls
New 72% 74% 76% 78% 80% Council records
Cycling
embraced in the
district
Cycle strategy New New Developed
Implemented Tested Reviewed Council
records
Public toilets are
convenient, clean
and safe
Ratepayers and residents
satisfied with public toilet
facilities
60%
2005
88% 90% 90% 90% 90% NRB Survey 3
yearly
The libraries
provide relevant
and up-to-date books and
services
Taking programmes out
into the community and
providing a wide variety of programmes in the
library
New 17 >3 per
library
>3 per
library
>3 per
library
>3 per
library
Council
records
% of ratepayers and residents satisfied with
libraries
83%
2005
87% 90% 90% 90% 90% NRB Survey 3 yearly

SOUTH WAIRARAPA DISTRICT COUNCIL’S LONG TERM PLAN 2015/2025
PART 2: SIGNIFICANT ACTIVITIES 38
8. AMENITIES PROSPECTIVE OPERATING STATEMENT FOR THE YEARS ENDING 30
JUNE 2015– 30 JUNE 2025
30
JUN E
2015
A nnual
P lan
$ 000
30
JUN E
2016
$ 000
30
JUN E
2017
$ 000
30
JUN E
2018
$ 000
30
JUN E
2019
$ 000
30
JUN E
2020
$ 000
30
JUN E
2021
$ 000
30
JUN E
2022
$ 000
30
JUN E
2023
$ 000
30
JUN E
2024
$ 000
30
JUN E
2025
$ 000
OP ER A T IN G IN C OM E
Parks and reserves and to ilets 5 18 18 19 19 20 21 21 22 23 23 Swimming pools 27 18 18 19 19 20 21 21 22 23 23 Libraries 47 48 49 51 52 53 55 57 59 61 63 Community buildings 21 2,020 21 21 22 22 23 24 24 25 26 Cemeteries 39 39 40 41 42 43 44 46 47 49 50 Rental properties 311 286 293 301 309 318 328 338 349 361 374 T o tal Operat ing Inco me 449 2 ,429 440 451 463 477 491 506 523 541 560
OP ER A T IN G C OST S
Parks and reserves and to ilets 818 904 938 965 987 1,015 1,046 1,071 1,102 1,138 1,175 Swimming pools 388 408 393 405 414 426 439 450 463 478 494 Libraries 795 710 759 784 786 810 837 837 856 881 898 Community buildings 353 384 348 360 360 372 384 384 393 404 411 Cemeteries 186 176 180 184 190 194 200 206 212 219 227 Rental properties 380 242 272 274 278 284 292 297 304 312 320 T o tal Operat ing C o sts 2,921 2 ,825 2 ,889 2 ,972 3 ,014 3 ,100 3 ,197 3 ,245 3 ,329 3 ,432 3 ,525
Note: Total operating costs include; Depreation 376 258 346 373 343 371 398 358 368 381 373
N et C o st o f Service (2,472) (396) (2 ,450) (2 ,521) (2 ,551) (2 ,624) (2 ,706) (2 ,738) (2 ,806) (2 ,891) (2 ,965)
C A P IT A L EXP EN D IT UR E
Library books 90 92 94 96 99 101 104 107 109 112 115 To ilets 25 47 - - - - - - - - - Reserves 60 73 16 16 16 17 17 18 18 19 19 Property improvements 21 - - 54 - - - - - - - P laygrounds 24 31 31 32 33 34 35 36 36 37 38 Swimming pool renewals 60 5 - - - - - - - - - Cemetery developments 50 46 32 81 - - - - - - - Cemetery development renewals - - - - - - - - - - - Campgrounds 5 5 5 5 5 6 6 6 6 6 6 Campgrounds renewals - 5 5 5 5 6 6 6 6 6 6 Town centres 30 31 31 32 33 34 35 36 36 37 38 Greytown town hall 5 9 214 5 5 6 6 6 6 6 6 M artinborough town hall 505 - 3,795 - - - - - - - - ANZAC hall 6 - - - - - - - - - - Featherston stadium 9 153 - - - - - - - - - Community buildings 27 10 10 11 11 11 12 12 12 12 13 Community housing 59 25 22 37 27 28 29 30 30 31 32 M artinborough museum - - - - - - - - - - - Libraries - 22 10 11 11 11 12 12 12 12 13 Library computer software - - - - - - - - - - - Library computer software - Kotui 55 - - - - - - - - - - Cycle Trail - Coss creek to Featherston 205 - - - - - - - - - - Featherston library - - - - - - - - - - - Greytown library - - - - - - - - - - - M artinborough library - - - - - - - - - - - T o tal C apital Expenditure 1,235 555 4 ,267 387 247 253 260 266 274 281 289
P ublic D ebt
Loan repayments 19 38 77 61 64 68 71 75 78 82 86 Sinking fund contributions (2) - - - - - - - - - - T o tal D ebt R equirements 17 38 77 61 64 68 71 75 78 82 86
M iscellaneo us
Depreciation not funded (118) (103) (134) (142) (134) (142) (150) (138) (141) (145) (142) T o tal M iscellaneo us (118) (103) (134) (142) (134) (142) (150) (138) (141) (145) (142)
T o tal C apital, D ebt & M iscellaneo us 1,134 489 4 ,209 306 178 179 181 203 211 219 233
F unding R equired 3,606 886 6 ,659 2 ,826 2 ,729 2 ,803 2 ,887 2 ,941 3 ,017 3 ,109 3 ,197
F unded B y:
Rates income General rates 1,799 2,063 1,904 1,943 1,965 2,011 2,254 2,330 2,639 2,708 2,774 Target ratesTotal Rates Income 1,799 2,063 1,904 1,943 1,965 2,011 2,254 2,330 2,639 2,708 2,774 Loans - 1,405 235 - - - - - - - - Depreciation Reserves 258 155 212 231 210 229 248 220 227 236 231 Reserve transfers 1,465 (2,751) 4,249 595 487 486 287 285 26 23 34 Other 84 14 59 58 66 77 98 106 124 142 159 T o tal Other F unding 1,807 (1,177) 4,755 883 763 792 633 611 377 401 423
T o tal F unding 3,606 886 6 ,659 2 ,826 2 ,729 2 ,803 2 ,887 2 ,941 3 ,017 3 ,109 3 ,197
AMENITIES PROJECTED OPERATING STATEMENT
FOR THE YEARS ENDED 30 JUNE 2015-2025
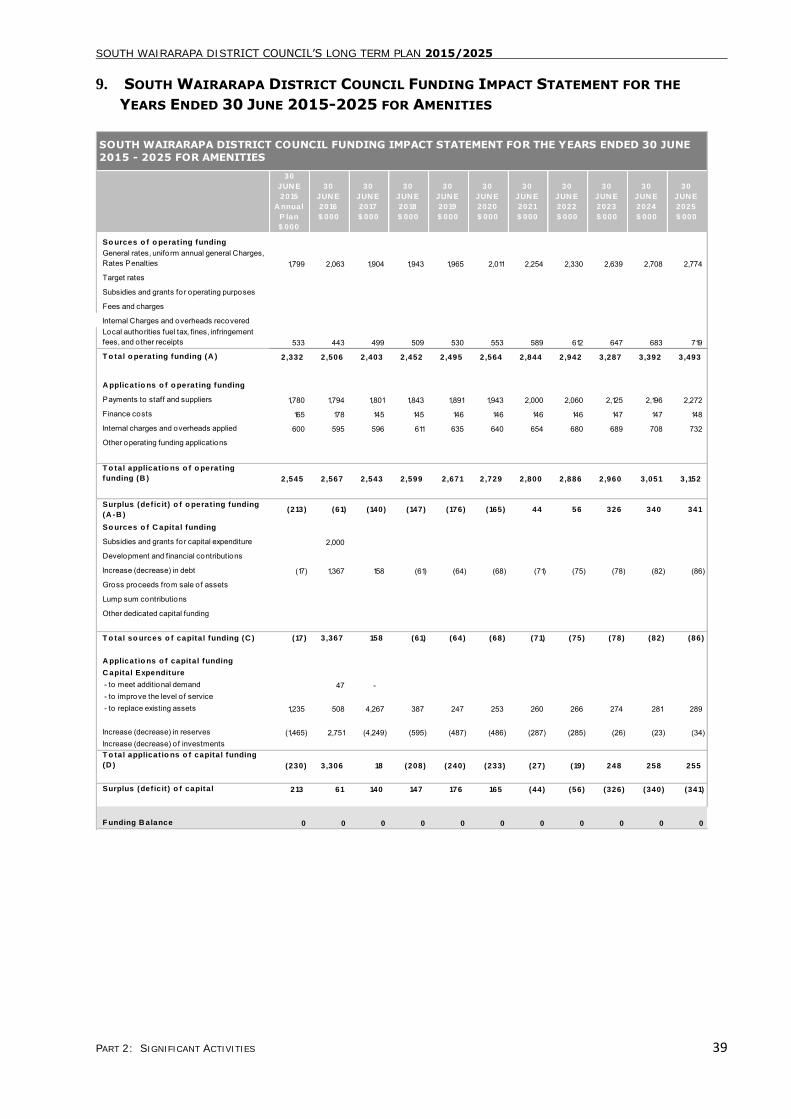
SOUTH WAIRARAPA DISTRICT COUNCIL’S LONG TERM PLAN 2015/2025
PART 2: SIGNIFICANT ACTIVITIES 39
9. SOUTH WAIRARAPA DISTRICT COUNCIL FUNDING IMPACT STATEMENT FOR THE
YEARS ENDED 30 JUNE 2015-2025 FOR AMENITIES
30
JUN E
2015
A nnual
P lan
$ 000
30
JUN E
2016
$ 000
30
JUN E
2017
$ 000
30
JUN E
2018
$ 000
30
JUN E
2019
$ 000
30
JUN E
2020
$ 000
30
JUN E
2021
$ 000
30
JUN E
2022
$ 000
30
JUN E
2023
$ 000
30
JUN E
2024
$ 000
30
JUN E
2025
$ 000
So urces o f o perat ing funding
General rates, uniform annual general Charges, Rates Penalties 1,799 2,063 1,904 1,943 1,965 2,011 2,254 2,330 2,639 2,708 2,774
Target rates
Subsidies and grants for operating purposes
Fees and charges
Internal Charges and overheads recoveredLocal authorities fuel tax, fines, infringement fees, and other receipts 533 443 499 509 530 553 589 612 647 683 719
T o tal o perat ing funding (A ) 2,332 2 ,506 2 ,403 2 ,452 2 ,495 2 ,564 2 ,844 2 ,942 3 ,287 3 ,392 3 ,493
A pplicat io ns o f o perat ing funding
Payments to staff and suppliers 1,780 1,794 1,801 1,843 1,891 1,943 2,000 2,060 2,125 2,196 2,272
Finance costs 165 178 145 145 146 146 146 146 147 147 148
Internal charges and overheads applied 600 595 596 611 635 640 654 680 689 708 732
Other operating funding applications
T o tal applicat io ns o f o perat ing
funding (B ) 2,545 2 ,567 2 ,543 2 ,599 2 ,671 2 ,729 2 ,800 2 ,886 2 ,960 3 ,051 3 ,152
Surplus (def ic it ) o f o perat ing funding
(A -B )(213) (61) (140) (147) (176) (165) 44 56 326 340 341
So urces o f C apital funding
Subsidies and grants for capital expenditure 2,000
Development and financial contributions
Increase (decrease) in debt (17) 1,367 158 (61) (64) (68) (71) (75) (78) (82) (86)
Gross proceeds from sale of assets
Lump sum contributions
Other dedicated capital funding
T o tal so urces o f capital funding (C ) (17) 3 ,367 158 (61) (64) (68) (71) (75) (78) (82) (86)
A pplicat io ns o f capital funding
C apital Expenditure
- to meet additional demand 47 - - to improve the level o f service - to replace existing assets 1,235 508 4,267 387 247 253 260 266 274 281 289
Increase (decrease) in reserves (1,465) 2,751 (4,249) (595) (487) (486) (287) (285) (26) (23) (34) Increase (decrease) of investmentsT o tal applicat io ns o f capital funding
(D ) (230) 3 ,306 18 (208) (240) (233) (27) (19) 248 258 255
Surplus (def ic it ) o f capital 213 61 140 147 176 165 (44) (56) (326) (340) (341)
F unding B alance 0 0 0 0 0 0 0 0 0 0 0
SOUTH WAIRARAPA DISTRICT COUNCIL FUNDING IMPACT STATEMENT FOR THE YEARS ENDED 30 JUNE
2015 - 2025 FOR AMENITIES
SOUTH WAIRARAPA DISTRICT COUNCIL’S LONG TERM PLAN 2015/2025
PART 2: SIGNIFICANT ACTIVITIES 40
LAND TRANSPORT (ROADING AND FOOTPATHS)
1. DESCRIPTION
This Plan covers the provision of roading network
services to the residents of South Wairarapa
district. This includes roads, bridges and culverts,
footpaths, street lighting, street cleaning,
vegetation control, kerb and channel, and
structures such as retaining walls, bus shelters and
car parks including railway station car parks.
The provision and management of roads is a
function of local authorities in the terms of the Local
Government Act 2002 including the relevant
provisions of the LGA 1974 and the Land Transport
Management Act 2003. These acts stipulate that
South Wairarapa District Council is the owner and
road controlling authority of all roads other than
state highways in the district.
The section of State Highways 2 and 53 within the
South Wairarapa district boundary are controlled
and operated by NZTA. Footpaths within state
highway corridors in urban areas are included in
this plan as they are maintained by Council.
The operation and maintenance of the roading
components of the network are eligible for financial
assistance from NZTA at the new subsidy rate of
52%. For the Special Purpose Road (Cape Palliser
Road) subsidy rates are 100% for the next 3 years
transitioning to 52% by 2018.
2. COMMUNITY OUTCOMES TO WHICH
THE ACTIVITY CONTRIBUTES
The community outcomes to which the roading
activity primarily contributes are described in the
table below.
COMMUNITY OUTCOMES TO WHICH THE ACTIVITY
CONTRIBUTES
COMMUNITY OUTCOMES HOW THE AMENITIES ACTIVITY
CONTRIBUTES
Healthy and economically
secure people
By advocating for better transport
systems for the community with regard to health services, employment
opportunities and social services
Vibrant and strong communities
By ensuring land transport, in all its forms, is safe for the community and
that it encourages a sense of pride and
belonging
A place that is accessible and easy to get around.
By demonstrating advocacy and commitment to achieving improved land
transport options and services and
telecommunications
Sustainable South
Wairarapa.
By ensuring all transport options and
telecommunications add to the
sustainability of the South Wairarapa
3. THE ACTIVITY GOAL AND PRINCIPAL
OBJECTIVES
The land transport goal is:
a) To improve transport options.
b) To plan, provide and maintain a roading
network for the safe, comfortable and
convenient movement of people and goods.
The Council’s principal objectives are:
a) To achieve defined standards of customer
service.
b) To protect the health and safety of the
community.
c) To minimise adverse effects on the
environment.
d) To comply with legal requirements.
e) To achieve defined technical standards
including NZTA agreement.
f) To implement policies of South Wairarapa
District Council.
g) To achieve defined standards of system
management.
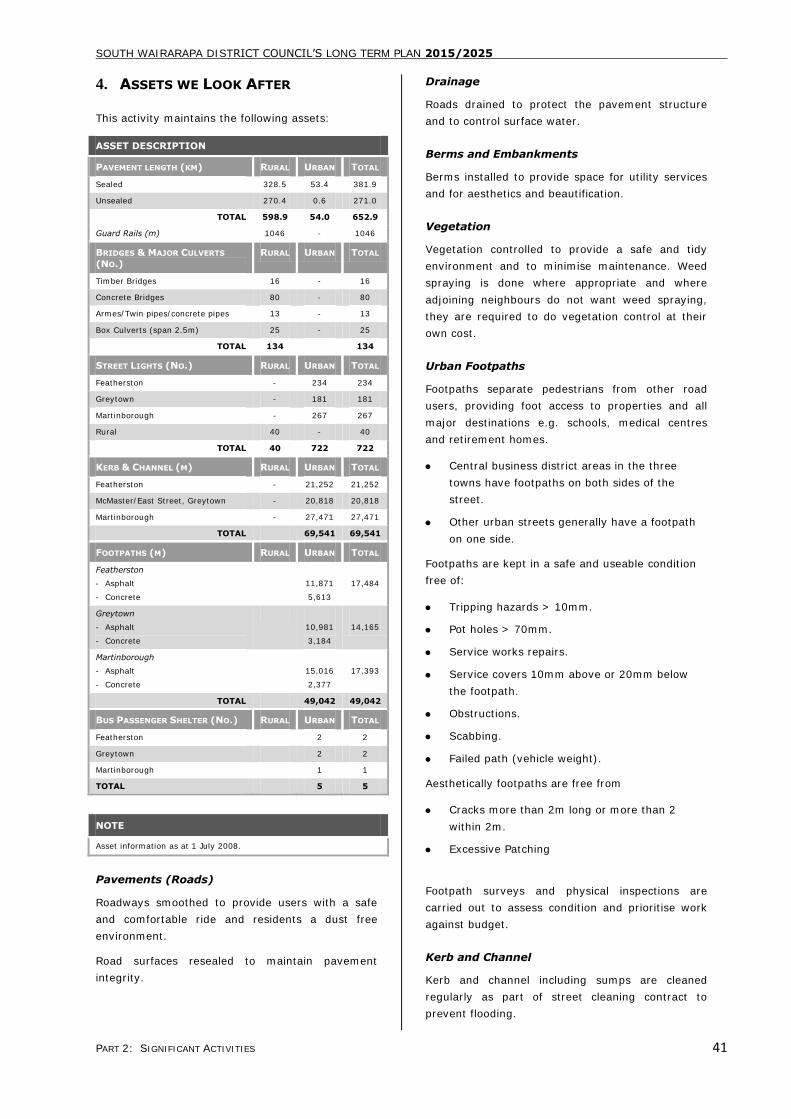
SOUTH WAIRARAPA DISTRICT COUNCIL’S LONG TERM PLAN 2015/2025
PART 2: SIGNIFICANT ACTIVITIES 41
4. ASSETS WE LOOK AFTER
This activity maintains the following assets:
ASSET DESCRIPTION
PAVEMENT LENGTH (KM) RURAL URBAN TOTAL
Sealed 328.5 53.4 381.9
Unsealed 270.4 0.6 271.0
TOTAL 598.9 54.0 652.9
Guard Rails (m) 1046 - 1046
BRIDGES & MAJOR CULVERTS
(NO.)
RURAL URBAN TOTAL
Timber Bridges 16 - 16
Concrete Bridges 80 - 80
Armes/Twin pipes/concrete pipes 13 - 13
Box Culverts (span 2.5m) 25 - 25
TOTAL 134 134
STREET LIGHTS (NO.) RURAL URBAN TOTAL
Featherston - 234 234
Greytown - 181 181
Martinborough - 267 267
Rural 40 - 40
TOTAL 40 722 722
KERB & CHANNEL (M) RURAL URBAN TOTAL
Featherston - 21,252 21,252
McMaster/East Street, Greytown - 20,818 20,818
Martinborough - 27,471 27,471
TOTAL 69,541 69,541
FOOTPATHS (M) RURAL URBAN TOTAL
Featherston
- Asphalt
- Concrete
11,871
5,613
17,484
Greytown
- Asphalt
- Concrete
10,981
3,184
14,165
Martinborough
- Asphalt
- Concrete
15,016
2,377
17,393
TOTAL 49,042 49,042
BUS PASSENGER SHELTER (NO.) RURAL URBAN TOTAL
Featherston 2 2
Greytown 2 2
Martinborough 1 1
TOTAL 5 5
NOTE
Asset information as at 1 July 2008.
Pavements (Roads)
Roadways smoothed to provide users with a safe
and comfortable ride and residents a dust free
environment.
Road surfaces resealed to maintain pavement
integrity.
Drainage
Roads drained to protect the pavement structure
and to control surface water.
Berms and Embankments
Berms installed to provide space for utility services
and for aesthetics and beautification.
Vegetation
Vegetation controlled to provide a safe and tidy
environment and to minimise maintenance. Weed
spraying is done where appropriate and where
adjoining neighbours do not want weed spraying,
they are required to do vegetation control at their
own cost.
Urban Footpaths
Footpaths separate pedestrians from other road
users, providing foot access to properties and all
major destinations e.g. schools, medical centres
and retirement homes.
Central business district areas in the three
towns have footpaths on both sides of the
street.
Other urban streets generally have a footpath
on one side.
Footpaths are kept in a safe and useable condition
free of:
Tripping hazards > 10mm.
Pot holes > 70mm.
Service works repairs.
Service covers 10mm above or 20mm below
the footpath.
Obstructions.
Scabbing.
Failed path (vehicle weight).
Aesthetically footpaths are free from
Cracks more than 2m long or more than 2
within 2m.
Excessive Patching
Footpath surveys and physical inspections are
carried out to assess condition and prioritise work
against budget.
Kerb and Channel
Kerb and channel including sumps are cleaned
regularly as part of street cleaning contract to
prevent flooding.

SOUTH WAIRARAPA DISTRICT COUNCIL’S LONG TERM PLAN 2015/2025
PART 2: SIGNIFICANT ACTIVITIES 42
Structures
Bridges and cattle stops maintained to ensure
continuity of roading network.
Retaining walls and seawalls provided to maintain
roadway stability.
Street cleaning
Street cleaning in urban areas is carried out on a
programmed basis to minimise flooding, and
maintain a clean and tidy environment.
Vehicle access
Vehicle access to properties (conforming to District
Plan provisions) to ensure traffic safety and
adequate drainage.
Car Parking
On and off street car parking areas are provided in
business and shopping areas to meet commuter and
residential parking needs, and District Plan and
Building Act requirements.
Bus passenger shelters
Bus passenger shelters in urban areas are provided
and maintained for the convenience of public
transport users by Wellington Regional Council in
consultation with South Wairarapa District Council.
Street lighting
Street lighting is maintained to provide road user
and pedestrian safety and security (Powerco is
responsible for maintaining the current lines).
Residential streets in urban areas are lit to the
National Standard (NZS 6701) therefore providing
sufficient light to show the way and illuminate any
hazards for both vehicle users and pedestrians.
5. PROJECTS FOR 2015/16
Projects for 2015/16 include:
Complete an annual reseals programme and re-
metaling programme.
Complete the bridge inspection programme and
develop works program for 2016/17 from the
results.
Renew and extend footpaths as per community
board programme.
Construct a cycle trail from Cross Creek to
Featherston.
Complete 1km seal extensions.
Develop a cycle strategy.
Investigate options for rural residential
footpaths.
6. PROJECTS FOR 2016/17 AND
BEYOND
Complete annual seal extension, reseal and re-
metaling programmes.
Develop works program for 2017/18 from the
bridge inspection program results.
Renew and extend footpaths as per community
board programme.
Special purpose road transition from 100% to
52% subsidy.
Implement cycle strategy.
7. SIGNIFICANT NEGATIVE EFFECTS
An unsafe roading network could endanger users.
In order to ensure the safety of road users, the
roading network needs to be maintained. The
roading network is maintained using contemporary
techniques and the roading program is audited by
NZTA.
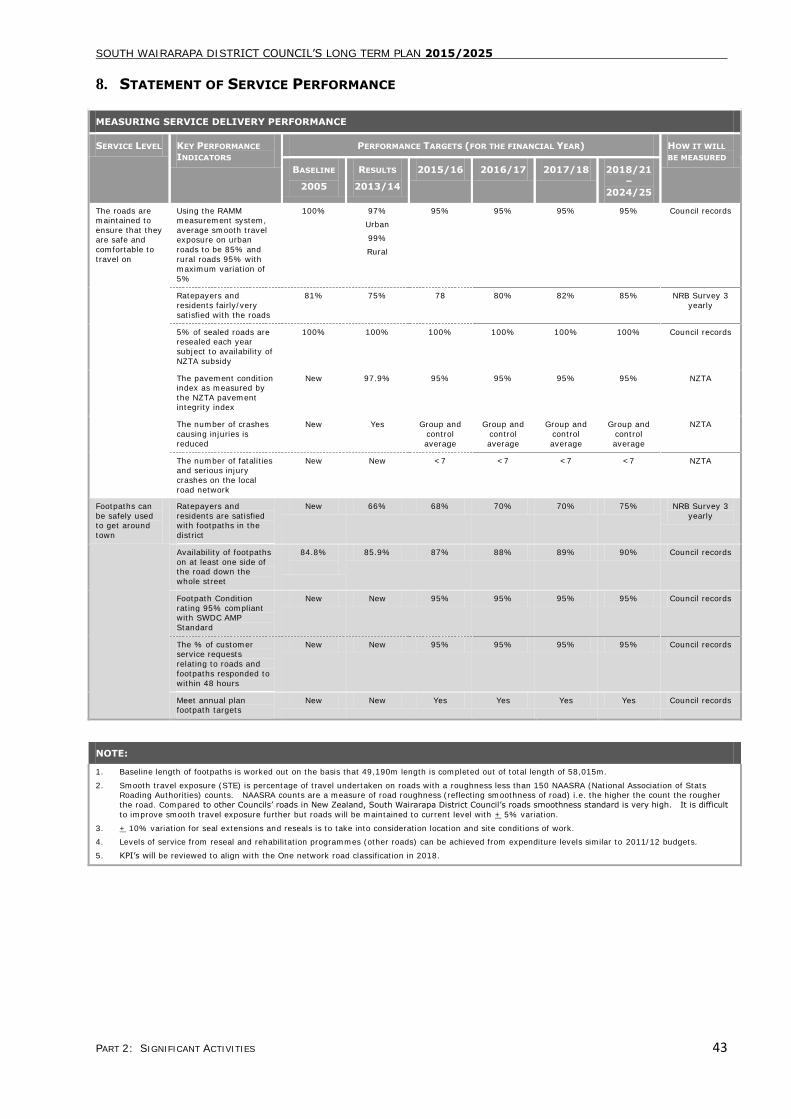
SOUTH WAIRARAPA DISTRICT COUNCIL’S LONG TERM PLAN 2015/2025
PART 2: SIGNIFICANT ACTIVITIES 43
8. STATEMENT OF SERVICE PERFORMANCE
MEASURING SERVICE DELIVERY PERFORMANCE
SERVICE LEVEL KEY PERFORMANCE
INDICATORS
PERFORMANCE TARGETS (FOR THE FINANCIAL YEAR) HOW IT WILL
BE MEASURED
BASELINE
2005
RESULTS
2013/14
2015/16 2016/17 2017/18 2018/21–
2024/25
The roads are maintained to
ensure that they are safe and
comfortable to
travel on
Using the RAMM measurement system,
average smooth travel exposure on urban
roads to be 85% and
rural roads 95% with
maximum variation of
5%
100% 97%
Urban
99%
Rural
95% 95% 95% 95% Council records
Ratepayers and
residents fairly/very
satisfied with the roads
81% 75% 78 80% 82% 85% NRB Survey 3
yearly
5% of sealed roads are resealed each year
subject to availability of
NZTA subsidy
100% 100% 100% 100% 100% 100% Council records
The pavement condition index as measured by
the NZTA pavement integrity index
New 97.9% 95% 95% 95% 95% NZTA
The number of crashes
causing injuries is
reduced
New Yes Group and
control
average
Group and
control
average
Group and
control
average
Group and
control
average
NZTA
The number of fatalities and serious injury
crashes on the local
road network
New New <7
<7 <7 <7 NZTA
Footpaths can
be safely used to get around
town
Ratepayers and
residents are satisfied with footpaths in the
district
New 66% 68% 70% 70% 75% NRB Survey 3
yearly
Availability of footpaths
on at least one side of the road down the
whole street
84.8%
85.9% 87% 88% 89% 90% Council records
Footpath Condition
rating 95% compliant with SWDC AMP
Standard
New New 95% 95% 95% 95% Council records
The % of customer service requests
relating to roads and
footpaths responded to
within 48 hours
New New 95% 95% 95% 95% Council records
Meet annual plan footpath targets
New New Yes Yes Yes Yes Council records
NOTE:
1. Baseline length of footpaths is worked out on the basis that 49,190m length is completed out of total length of 58,015m.
2. Smooth travel exposure (STE) is percentage of travel undertaken on roads with a roughness less than 150 NAASRA (National Association of Stats Roading Authorities) counts. NAASRA counts are a measure of road roughness (reflecting smoothness of road) i.e. the higher the count the rougher
the road. Compared to other Councils’ roads in New Zealand, South Wairarapa District Council’s roads smoothness standard is very high. It is difficult
to improve smooth travel exposure further but roads will be maintained to current level with + 5% variation.
3. + 10% variation for seal extensions and reseals is to take into consideration location and site conditions of work.
4. Levels of service from reseal and rehabilitation programmes (other roads) can be achieved from expenditure levels similar to 2011/12 budgets.
5. KPI’s will be reviewed to align with the One network road classification in 2018.
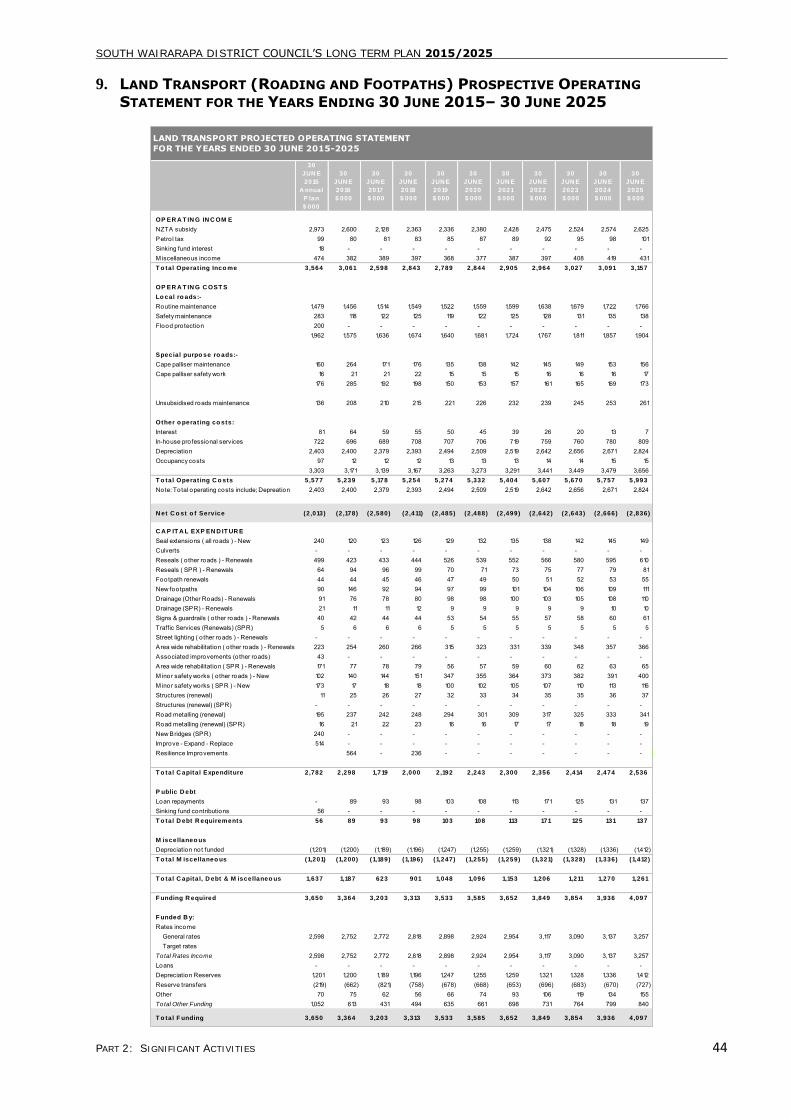
SOUTH WAIRARAPA DISTRICT COUNCIL’S LONG TERM PLAN 2015/2025
PART 2: SIGNIFICANT ACTIVITIES 44
9. LAND TRANSPORT (ROADING AND FOOTPATHS) PROSPECTIVE OPERATING
STATEMENT FOR THE YEARS ENDING 30 JUNE 2015– 30 JUNE 2025
30
JUN E
2015
A nnual
P lan
$ 000
30
JUN E
2016
$ 000
30
JUN E
2017
$ 000
30
JUN E
2018
$ 000
30
JUN E
2019
$ 000
30
JUN E
2020
$ 000
30
JUN E
2021
$ 000
30
JUN E
2022
$ 000
30
JUN E
2023
$ 000
30
JUN E
2024
$ 000
30
JUN E
2025
$ 000
OP ER A T IN G IN C OM E
NZTA subsidy 2,973 2,600 2,128 2,363 2,336 2,380 2,428 2,475 2,524 2,574 2,625 Petro l tax 99 80 81 83 85 87 89 92 95 98 101 Sinking fund interest 18 - - - - - - - - - - M iscellaneous income 474 382 389 397 368 377 387 397 408 419 431 T o tal Operat ing Inco me 3,564 3 ,061 2 ,598 2 ,843 2 ,789 2 ,844 2 ,905 2 ,964 3 ,027 3 ,091 3 ,157
OP ER A T IN G C OST S
Lo cal ro ads:-
Routine maintenance 1,479 1,456 1,514 1,549 1,522 1,559 1,599 1,638 1,679 1,722 1,766 Safety maintenance 283 118 122 125 119 122 125 128 131 135 138 Flood protection 200 - - - - - - - - - -
1,962 1,575 1,636 1,674 1,640 1,681 1,724 1,767 1,811 1,857 1,904
Special purpo se ro ads:-
Cape palliser maintenance 160 264 171 176 135 138 142 145 149 153 156 Cape palliser safety work 16 21 21 22 15 15 15 16 16 16 17
176 285 192 198 150 153 157 161 165 169 173
Unsubsidised roads maintenance 136 208 210 215 221 226 232 239 245 253 261
Other o perat ing co sts:
Interest 81 64 59 55 50 45 39 26 20 13 7 In-house professional services 722 696 689 708 707 706 719 759 760 780 809 Depreciation 2,403 2,400 2,379 2,393 2,494 2,509 2,519 2,642 2,656 2,671 2,824 Occupancy costs 97 12 12 12 13 13 13 14 14 15 15
3,303 3,171 3,139 3,167 3,263 3,273 3,291 3,441 3,449 3,479 3,656 T o tal Operat ing C o sts 5,577 5 ,239 5 ,178 5 ,254 5 ,274 5 ,332 5 ,404 5 ,607 5 ,670 5 ,757 5 ,993
Note: Total operating costs include; Depreation 2,403 2,400 2,379 2,393 2,494 2,509 2,519 2,642 2,656 2,671 2,824
N et C o st o f Service (2,013) (2 ,178) (2 ,580) (2 ,411) (2 ,485) (2 ,488) (2 ,499) (2 ,642) (2 ,643) (2 ,666) (2 ,836)
C A P IT A L EXP EN D IT UR E
Seal extensions ( all roads ) - New 240 120 123 126 129 132 135 138 142 145 149 Culverts - - - - - - - - - - - Reseals ( o ther roads ) - Renewals 499 423 433 444 526 539 552 566 580 595 610 Reseals ( SPR ) - Renewals 64 94 96 99 70 71 73 75 77 79 81 Footpath renewals 44 44 45 46 47 49 50 51 52 53 55 New footpaths 90 146 92 94 97 99 101 104 106 109 111 Drainage (Other Roads) - Renewals 91 76 78 80 98 98 100 103 105 108 110 Drainage (SPR) - Renewals 21 11 11 12 9 9 9 9 9 10 10 Signs & guardrails ( o ther roads ) - Renewals 40 42 44 44 53 54 55 57 58 60 61 Traffic Services (Renewals) (SPR) 5 6 6 6 5 5 5 5 5 5 5 Street lighting ( o ther roads ) - Renewals - - - - - - - - - - - Area wide rehabilitation ( o ther roads ) - Renewals 223 254 260 266 315 323 331 339 348 357 366 Associated improvements (o ther roads) 43 - - - - - - - - - - Area wide rehabilitation ( SPR ) - Renewals 171 77 78 79 56 57 59 60 62 63 65 M inor safety works ( o ther roads ) - New 102 140 144 151 347 355 364 373 382 391 400 M inor safety works ( SPR ) - New 173 17 18 18 100 102 105 107 110 113 116 Structures (renewal) 11 25 26 27 32 33 34 35 35 36 37 Structures (renewal) (SPR) - - - - - - - - - - - Road metalling (renewal) 195 237 242 248 294 301 309 317 325 333 341 Road metalling (renewal) (SPR) 16 21 22 23 16 16 17 17 18 18 19 New Bridges (SPR) 240 - - - - - - - - - - Improve - Expand - Replace 514 - - - - - - - - - - Resilience Improvements 564 - 236 - - - - - - -
T o tal C apital Expenditure 2,782 2 ,298 1,719 2 ,000 2 ,192 2 ,243 2 ,300 2 ,356 2 ,414 2 ,474 2 ,536
P ublic D ebt
Loan repayments - 89 93 98 103 108 113 171 125 131 137 Sinking fund contributions 56 - - - - - - - - - - T o tal D ebt R equirements 56 89 93 98 103 108 113 171 125 131 137
M iscellaneo us
Depreciation not funded (1,201) (1,200) (1,189) (1,196) (1,247) (1,255) (1,259) (1,321) (1,328) (1,336) (1,412) T o tal M iscellaneo us (1,201) (1,200) (1,189) (1,196) (1,247) (1,255) (1,259) (1,321) (1,328) (1,336) (1,412)
T o tal C apital, D ebt & M iscellaneo us 1,637 1,187 623 901 1,048 1,096 1,153 1,206 1,211 1,270 1,261
F unding R equired 3,650 3 ,364 3 ,203 3 ,313 3 ,533 3 ,585 3 ,652 3 ,849 3 ,854 3 ,936 4 ,097
F unded B y:
Rates income General rates 2,598 2,752 2,772 2,818 2,898 2,924 2,954 3,117 3,090 3,137 3,257 Target ratesTotal Rates Income 2,598 2,752 2,772 2,818 2,898 2,924 2,954 3,117 3,090 3,137 3,257 Loans - - - - - - - - - - - Depreciation Reserves 1,201 1,200 1,189 1,196 1,247 1,255 1,259 1,321 1,328 1,336 1,412 Reserve transfers (219) (662) (821) (758) (678) (668) (653) (696) (683) (670) (727) Other 70 75 62 56 66 74 93 106 119 134 155 Total Other Funding 1,052 613 431 494 635 661 698 731 764 799 840
T o tal F unding 3,650 3 ,364 3 ,203 3 ,313 3 ,533 3 ,585 3 ,652 3 ,849 3 ,854 3 ,936 4 ,097
LAND TRANSPORT PROJECTED OPERATING STATEMENT
FOR THE YEARS ENDED 30 JUNE 2015-2025
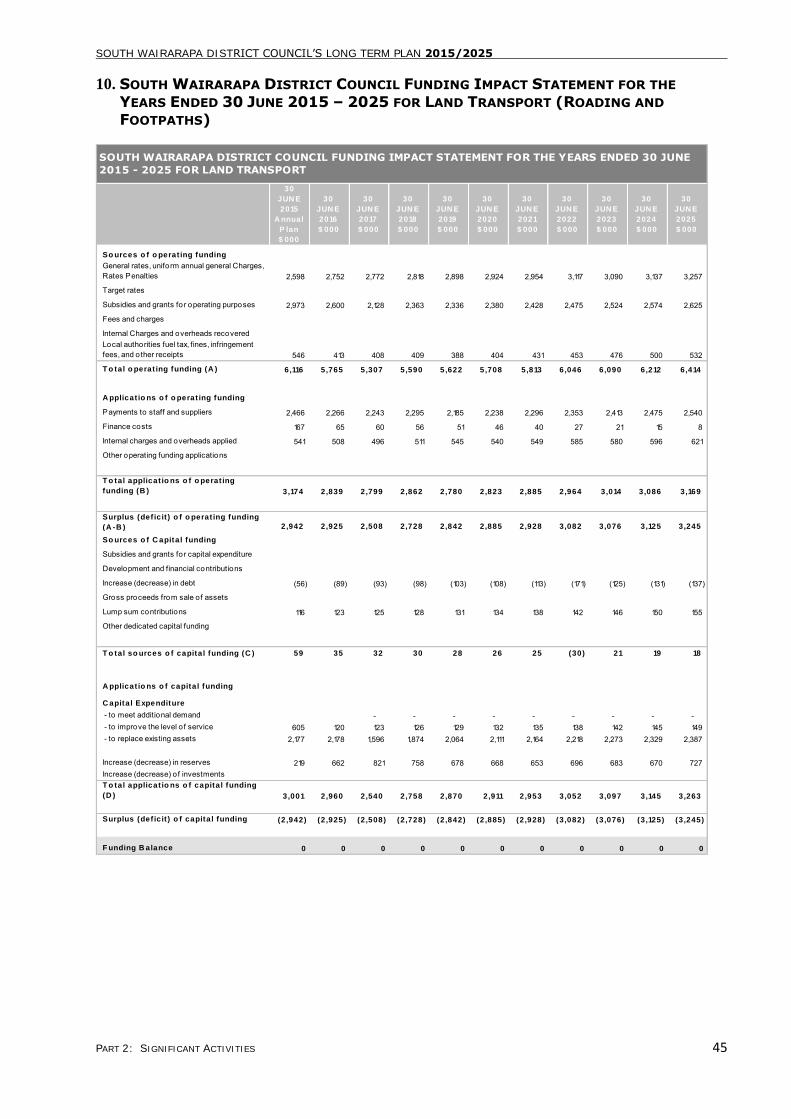
SOUTH WAIRARAPA DISTRICT COUNCIL’S LONG TERM PLAN 2015/2025
PART 2: SIGNIFICANT ACTIVITIES 45
10. SOUTH WAIRARAPA DISTRICT COUNCIL FUNDING IMPACT STATEMENT FOR THE
YEARS ENDED 30 JUNE 2015 – 2025 FOR LAND TRANSPORT (ROADING AND
FOOTPATHS)
30
JUN E
2015
A nnual
P lan
$ 000
30
JUN E
2016
$ 000
30
JUN E
2017
$ 000
30
JUN E
2018
$ 000
30
JUN E
2019
$ 000
30
JUN E
2020
$ 000
30
JUN E
2021
$ 000
30
JUN E
2022
$ 000
30
JUN E
2023
$ 000
30
JUN E
2024
$ 000
30
JUN E
2025
$ 000
So urces o f o perat ing funding
General rates, uniform annual general Charges, Rates Penalties 2,598 2,752 2,772 2,818 2,898 2,924 2,954 3,117 3,090 3,137 3,257
Target rates
Subsidies and grants for operating purposes 2,973 2,600 2,128 2,363 2,336 2,380 2,428 2,475 2,524 2,574 2,625
Fees and charges
Internal Charges and overheads recoveredLocal authorities fuel tax, fines, infringement fees, and other receipts 546 413 408 409 388 404 431 453 476 500 532
T o tal o perat ing funding (A ) 6,116 5 ,765 5 ,307 5 ,590 5 ,622 5 ,708 5 ,813 6 ,046 6 ,090 6 ,212 6 ,414
A pplicat io ns o f o perat ing funding
Payments to staff and suppliers 2,466 2,266 2,243 2,295 2,185 2,238 2,296 2,353 2,413 2,475 2,540
Finance costs 167 65 60 56 51 46 40 27 21 15 8
Internal charges and overheads applied 541 508 496 511 545 540 549 585 580 596 621
Other operating funding applications
T o tal applicat io ns o f o perat ing
funding (B ) 3,174 2 ,839 2 ,799 2 ,862 2 ,780 2 ,823 2 ,885 2 ,964 3 ,014 3 ,086 3 ,169
Surplus (def ic it ) o f o perat ing funding
(A -B ) 2,942 2 ,925 2 ,508 2 ,728 2 ,842 2 ,885 2 ,928 3 ,082 3 ,076 3 ,125 3 ,245
So urces o f C apital funding
Subsidies and grants for capital expenditure
Development and financial contributions
Increase (decrease) in debt (56) (89) (93) (98) (103) (108) (113) (171) (125) (131) (137)
Gross proceeds from sale of assets
Lump sum contributions 116 123 125 128 131 134 138 142 146 150 155
Other dedicated capital funding
T o tal so urces o f capital funding (C ) 59 35 32 30 28 26 25 (30) 21 19 18
A pplicat io ns o f capital funding
C apital Expenditure
- to meet additional demand - - - - - - - - - - to improve the level o f service 605 120 123 126 129 132 135 138 142 145 149 - to replace existing assets 2,177 2,178 1,596 1,874 2,064 2,111 2,164 2,218 2,273 2,329 2,387
Increase (decrease) in reserves 219 662 821 758 678 668 653 696 683 670 727 Increase (decrease) of investmentsT o tal applicat io ns o f capital funding
(D ) 3,001 2 ,960 2 ,540 2 ,758 2 ,870 2 ,911 2 ,953 3 ,052 3 ,097 3 ,145 3 ,263
Surplus (def ic it ) o f capital funding (2,942) (2 ,925) (2 ,508) (2 ,728) (2 ,842) (2 ,885) (2 ,928) (3 ,082) (3 ,076) (3 ,125) (3 ,245)
F unding B alance 0 0 0 0 0 0 0 0 0 0 0
SOUTH WAIRARAPA DISTRICT COUNCIL FUNDING IMPACT STATEMENT FOR THE YEARS ENDED 30 JUNE
2015 - 2025 FOR LAND TRANSPORT
SOUTH WAIRARAPA DISTRICT COUNCIL’S LONG TERM PLAN 2015/2025
PART 2: SIGNIFICANT ACTIVITIES 46
WATER SUPPLY
1. DESCRIPTION
This plan summarises the Council’s strategic and
management long-term approach for the provision
and maintenance of potable water supplies to
properties throughout the district (excluding those
that service single premises that have their own
rainwater tanks or bores) – whether they be
provided by public or private means.
Territorial authorities have numerous
responsibilities relating to the supply of water
including duty under the Health Act 1956 to
improve, promote, and protect public health within
their districts. This implies that in the case of the
provision of potable water, councils have an
obligation to identify where such a service is
required, and to either provide it directly
themselves, or to maintain an overview of the
supply if it is provided by others.
In the South Wairarapa district, there are presently
two public water supply systems – Greytown (for
Greytown and Featherston) and Martinborough,
with 3615 serviced and 263 serviceable
connections.
Five sources supply water to the urban populations
of Featherston, Greytown and Martinborough. The
sources of water are:
Featherston – Boar Bush Gully
Catchment
A catchment area of approximately 3km2 supplies
runoff to an earth dam. The reservoir behind the
earth dam contains approximately 40 days storage
and includes a settling pond immediately upstream.
Water flows by gravity from the reservoir to the
Boar Bush holding tanks which have a capacity of
450,000 litres. This source is currently operated as
an emergency supply only.
Featherston – Tait’s Creek Intake
Weir
A concrete intake weir is located across Tait's Creek
to the north of Featherston. The weir is designed to
divert water from the creek into a 300mm gravity
trunk main which supplies water to the holding
tanks. The catchment area upstream of the weir is
about 16km2 with the 9km length of trunk main
having a capacity of 6.3 million litres per day. This
source is currently operated as an emergency
supply only.
This supply is under review, and options are being
considered to ensure a reliable emergency supply is
available. The preferred option is a bore utilising the
Tauherenikau ground water zone.
Greytown & Featherston – Waiohine
River
Water is abstracted from the Waiohine River into a
diversion channel on the river berm from which it is
pumped to storage ponds each having a capacity of
18,250,000 litres.
Water then passes through an ultra-filtration plant
and supplies both Greytown and Featherston. A
3.9km 300mm PVC pipe supplies water from the UF
plant to the pipeline crossing the Tauherenikau
River.
Council has identified the most suitable option to be
the installation of two further bores approximately
100 metres from the recently installed bore and to
connect all three bores to the Waiohine treatment
plant. To achieve the necessary 4-log protozoa
removal level, the installation of UV disinfection
after the existing membrane process is proposed.
This option will allow bore water to be used as the
main water source, supplemented by the river
source during the summer demand peak. This work
is proposed to be completed by the end of June
2016.
Greytown Well
This is an alternative source of water for Greytown.
It is required when the principal source of water
from the Waiohine River has elevated turbidity
conditions limiting the operation of the ultra-
filtration plant at Woodside.
The groundwater is abstracted from a single bore
along Kuratawhiti Street outside the Memorial
Baths. Water is pumped directly into the existing
mains via a 300mm main over 450m meters.
The resource consent allows a total abstraction of
60 litres per second. This supply has been utilised
more than anticipated recently and options are
being reviewed to reduce usage. The changes to the
Featherston supply will to a certain extent reduce
usage of this bore.
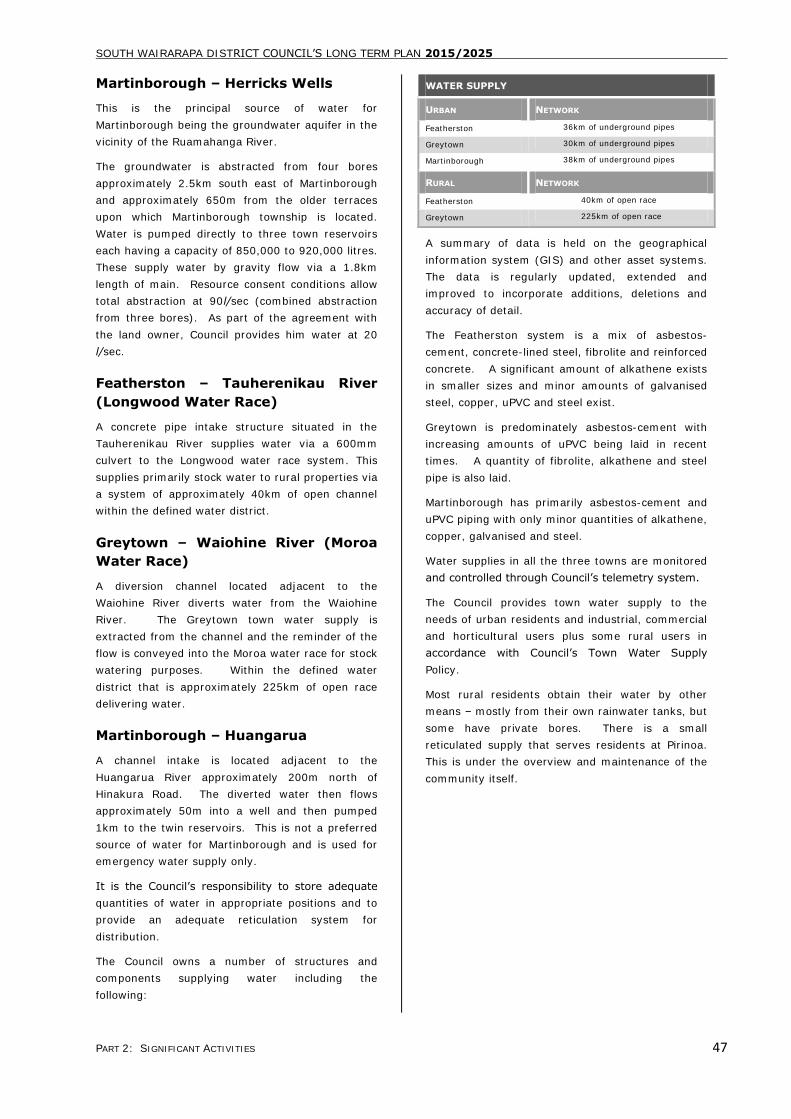
SOUTH WAIRARAPA DISTRICT COUNCIL’S LONG TERM PLAN 2015/2025
PART 2: SIGNIFICANT ACTIVITIES 47
Martinborough – Herricks Wells
This is the principal source of water for
Martinborough being the groundwater aquifer in the
vicinity of the Ruamahanga River.
The groundwater is abstracted from four bores
approximately 2.5km south east of Martinborough
and approximately 650m from the older terraces
upon which Martinborough township is located.
Water is pumped directly to three town reservoirs
each having a capacity of 850,000 to 920,000 litres.
These supply water by gravity flow via a 1.8km
length of main. Resource consent conditions allow
total abstraction at 90l/sec (combined abstraction
from three bores). As part of the agreement with
the land owner, Council provides him water at 20
l/sec.
Featherston – Tauherenikau River
(Longwood Water Race)
A concrete pipe intake structure situated in the
Tauherenikau River supplies water via a 600mm
culvert to the Longwood water race system. This
supplies primarily stock water to rural properties via
a system of approximately 40km of open channel
within the defined water district.
Greytown – Waiohine River (Moroa
Water Race)
A diversion channel located adjacent to the
Waiohine River diverts water from the Waiohine
River. The Greytown town water supply is
extracted from the channel and the reminder of the
flow is conveyed into the Moroa water race for stock
watering purposes. Within the defined water
district that is approximately 225km of open race
delivering water.
Martinborough – Huangarua
A channel intake is located adjacent to the
Huangarua River approximately 200m north of
Hinakura Road. The diverted water then flows
approximately 50m into a well and then pumped
1km to the twin reservoirs. This is not a preferred
source of water for Martinborough and is used for
emergency water supply only.
It is the Council’s responsibility to store adequate
quantities of water in appropriate positions and to
provide an adequate reticulation system for
distribution.
The Council owns a number of structures and
components supplying water including the
following:
WATER SUPPLY
URBAN NETWORK
Featherston 36km of underground pipes
Greytown 30km of underground pipes
Martinborough 38km of underground pipes
RURAL NETWORK
Featherston 40km of open race
Greytown 225km of open race
A summary of data is held on the geographical
information system (GIS) and other asset systems.
The data is regularly updated, extended and
improved to incorporate additions, deletions and
accuracy of detail.
The Featherston system is a mix of asbestos-
cement, concrete-lined steel, fibrolite and reinforced
concrete. A significant amount of alkathene exists
in smaller sizes and minor amounts of galvanised
steel, copper, uPVC and steel exist.
Greytown is predominately asbestos-cement with
increasing amounts of uPVC being laid in recent
times. A quantity of fibrolite, alkathene and steel
pipe is also laid.
Martinborough has primarily asbestos-cement and
uPVC piping with only minor quantities of alkathene,
copper, galvanised and steel.
Water supplies in all the three towns are monitored
and controlled through Council’s telemetry system.
The Council provides town water supply to the
needs of urban residents and industrial, commercial
and horticultural users plus some rural users in
accordance with Council’s Town Water Supply
Policy.
Most rural residents obtain their water by other
means – mostly from their own rainwater tanks, but
some have private bores. There is a small
reticulated supply that serves residents at Pirinoa.
This is under the overview and maintenance of the
community itself.

SOUTH WAIRARAPA DISTRICT COUNCIL’S LONG TERM PLAN 2015/2025
PART 2: SIGNIFICANT ACTIVITIES 48
2. COMMUNITY OUTCOMES TO WHICH
THE ACTIVITY CONTRIBUTES
The community outcomes to which the water supply
activity primarily contributes are described in the
table below.
COMMUNITY OUTCOMES TO WHICH THE ACTIVITY
CONTRIBUTES
COMMUNITY OUTCOMES HOW THE WATER SUPPLY ACTIVITY
CONTRIBUTES
Healthy & economically secure people
By ensuring that adequate public supplies are provided, at an affordable
cost, and that private supplies are
properly monitored
Vibrant & strong communities
By ensuring that adequately located and pressured connections for fire fighting
are provided in reticulated communities
Sustainable South Wairarapa
By ensuring that all of the reticulated systems operate as efficiently as
possible, that the conditions of the water permits are complied with and
that average consumption per annum is
maintained or reduced
Healthy & economically
secure people
By ensuring that adequate public
supplies are provided, at an affordable cost, and that private supplies are
properly monitored
3. THE ACTIVITY GOAL AND PRINCIPAL
OBJECTIVES
The water supply activity goal is:
a) To provide reliable (as possible) and
sustainable reticulated water supplies to the
townships of Greytown, Featherston and
Martinborough.
b) To provide stock water race supply networks
from the Tauherenikau and Waiohine Rivers.
c) To encourage conservation of this valuable
resource.
The Council’s principal objectives are:
a) To achieve defined standards of customer
service.
b) To protect the health and safety of the
community.
c) To minimise adverse effects on the
environment.
d) To comply with legal requirements.
e) To achieve defined technical standards.
f) To implement policies of South Wairarapa
District Council.
g) To promote development throughout the
district.
h) To achieve defined standards of system
management.
4. ASSETS WE LOOK AFTER
Water Sources Urban
Five sources supply water to the urban populations
of Featherston, Greytown and Martinborough. The
sources of water are:
Featherston - Boar Bush Gully Catchment. This
source is currently operated as an emergency
supply only.
Featherston - Tait's Creek Intake Weir.
This source is currently operated as an
emergency supply only.
Greytown & Featherston - Waiohine River.
Greytown – supplementary well.
Martinborough - Herrick’s Wells. This is the
preferred source of water for Martinborough.
Martinborough – Huangarua (used for
emergency water supply only).
Water Sources Rural (Stock Water Races)
Two sources supply water to the rural areas of
Featherston and Greytown. The sources of water
are:
Featherston - Tauherenikau River (Longwood
Water Race).
Greytown - Waiohine River (Moroa Water
Race).
5. PROJECTS FOR 2015/16
Projects for 2015/16 include:
Renewal of ultra-filtration units at
Greytown/Featherston water treatment plant at
the rate of approximately 5 per year (average
duration of renewals cycle is 20 years).
Renewal of valves, pumps and fittings including
telemetry equipment as required.
Continue the alternative Featherston supply
project.
Implement outstanding water rates penalty.
6. PROJECTS FOR 2016/17 AND
BEYOND
Projects for 2016/17 and beyond include:
Complete the alternative Featherston supply
project.
Maintain water races to meet consent
requirements.
SOUTH WAIRARAPA DISTRICT COUNCIL’S LONG TERM PLAN 2015/2025
PART 2: SIGNIFICANT ACTIVITIES 49
Investigate decommissioning Boar Bush Gully
and Tait’s Creek Featherston alternate supplies.
7. SIGNIFICANT NEGATIVE EFFECTS
A water supply that does not meet minimum health
standards could cause health problems for users.
Council uses contemporary techniques to ensure the
water supply is fit for use.
In addition, a reliable supply is needed for fire
fighting purposes. Council ensures reliability by
regularly maintaining the system.
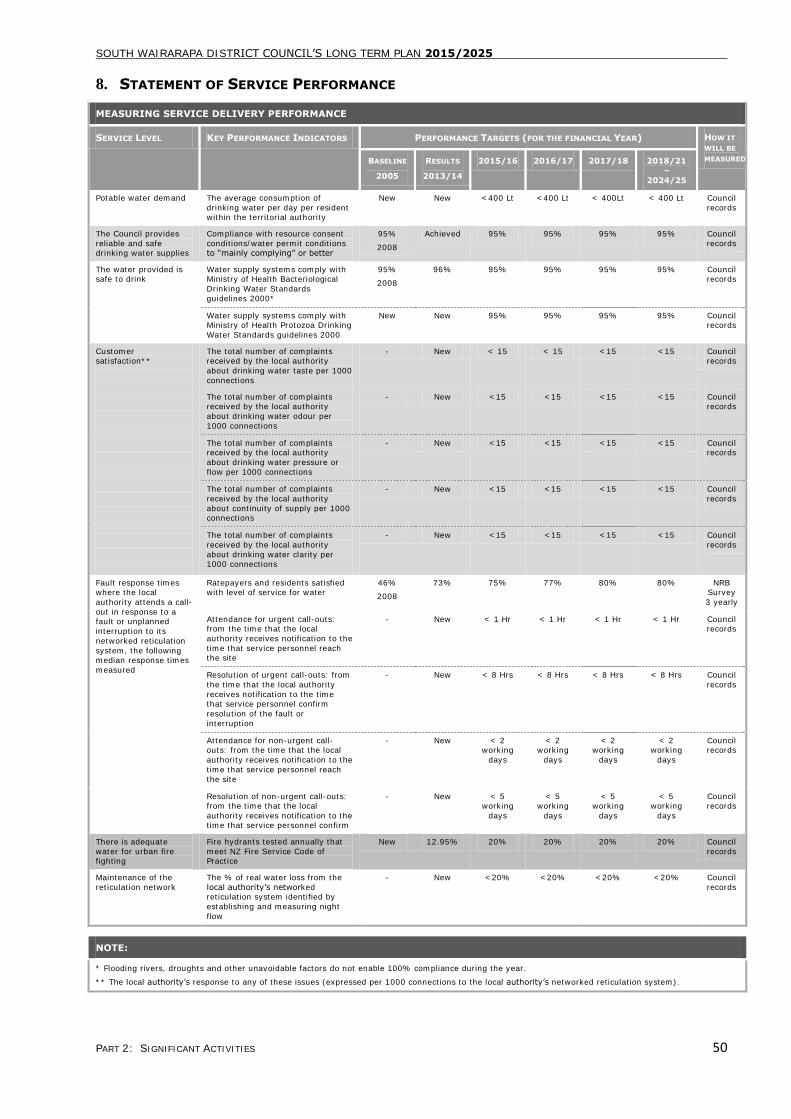
SOUTH WAIRARAPA DISTRICT COUNCIL’S LONG TERM PLAN 2015/2025
PART 2: SIGNIFICANT ACTIVITIES 50
8. STATEMENT OF SERVICE PERFORMANCE
MEASURING SERVICE DELIVERY PERFORMANCE
SERVICE LEVEL KEY PERFORMANCE INDICATORS PERFORMANCE TARGETS (FOR THE FINANCIAL YEAR) HOW IT
WILL BE
MEASURED BASELINE
2005
RESULTS
2013/14
2015/16 2016/17 2017/18 2018/21
–
2024/25
Potable water demand The average consumption of
drinking water per day per resident within the territorial authority
New New <400 Lt <400 Lt < 400Lt < 400 Lt Council
records
The Council provides
reliable and safe drinking water supplies
Compliance with resource consent
conditions/water permit conditions to “mainly complying” or better
95%
2008
Achieved 95% 95% 95% 95% Council
records
The water provided is safe to drink
Water supply systems comply with Ministry of Health Bacteriological
Drinking Water Standards
guidelines 2000*
95%
2008
96% 95% 95% 95% 95% Council records
Water supply systems comply with Ministry of Health Protozoa Drinking
Water Standards guidelines 2000
New New 95% 95% 95% 95% Council records
Customer satisfaction**
The total number of complaints received by the local authority
about drinking water taste per 1000
connections
- New < 15 < 15 <15 <15 Council records
The total number of complaints received by the local authority
about drinking water odour per
1000 connections
- New <15 <15 <15 <15 Council records
The total number of complaints received by the local authority
about drinking water pressure or
flow per 1000 connections
- New <15 <15 <15 <15 Council records
The total number of complaints
received by the local authority
about continuity of supply per 1000 connections
- New <15 <15 <15 <15 Council
records
The total number of complaints
received by the local authority
about drinking water clarity per 1000 connections
- New <15 <15 <15 <15 Council
records
Fault response times where the local
authority attends a call-
out in response to a fault or unplanned
interruption to its
networked reticulation
system, the following median response times
measured
Ratepayers and residents satisfied with level of service for water
46%
2008
73% 75% 77% 80% 80% NRB Survey
3 yearly
Attendance for urgent call-outs: from the time that the local
authority receives notification to the
time that service personnel reach the site
- New < 1 Hr < 1 Hr < 1 Hr < 1 Hr Council records
Resolution of urgent call-outs: from
the time that the local authority
receives notification to the time that service personnel confirm
resolution of the fault or
interruption
- New < 8 Hrs < 8 Hrs < 8 Hrs < 8 Hrs Council
records
Attendance for non-urgent call-outs: from the time that the local
authority receives notification to the
time that service personnel reach
the site
- New < 2 working
days
< 2 working
days
< 2 working
days
< 2 working
days
Council records
Resolution of non-urgent call-outs: from the time that the local
authority receives notification to the time that service personnel confirm
- New < 5 working
days
< 5 working
days
< 5 working
days
< 5 working
days
Council records
There is adequate
water for urban fire fighting
Fire hydrants tested annually that
meet NZ Fire Service Code of Practice
New 12.95% 20% 20% 20% 20% Council
records
Maintenance of the
reticulation network
The % of real water loss from the
local authority’s networked reticulation system identified by
establishing and measuring night
flow
- New <20% <20% <20% <20% Council
records
NOTE:
* Flooding rivers, droughts and other unavoidable factors do not enable 100% compliance during the year.
** The local authority’s response to any of these issues (expressed per 1000 connections to the local authority’s networked reticulation system).
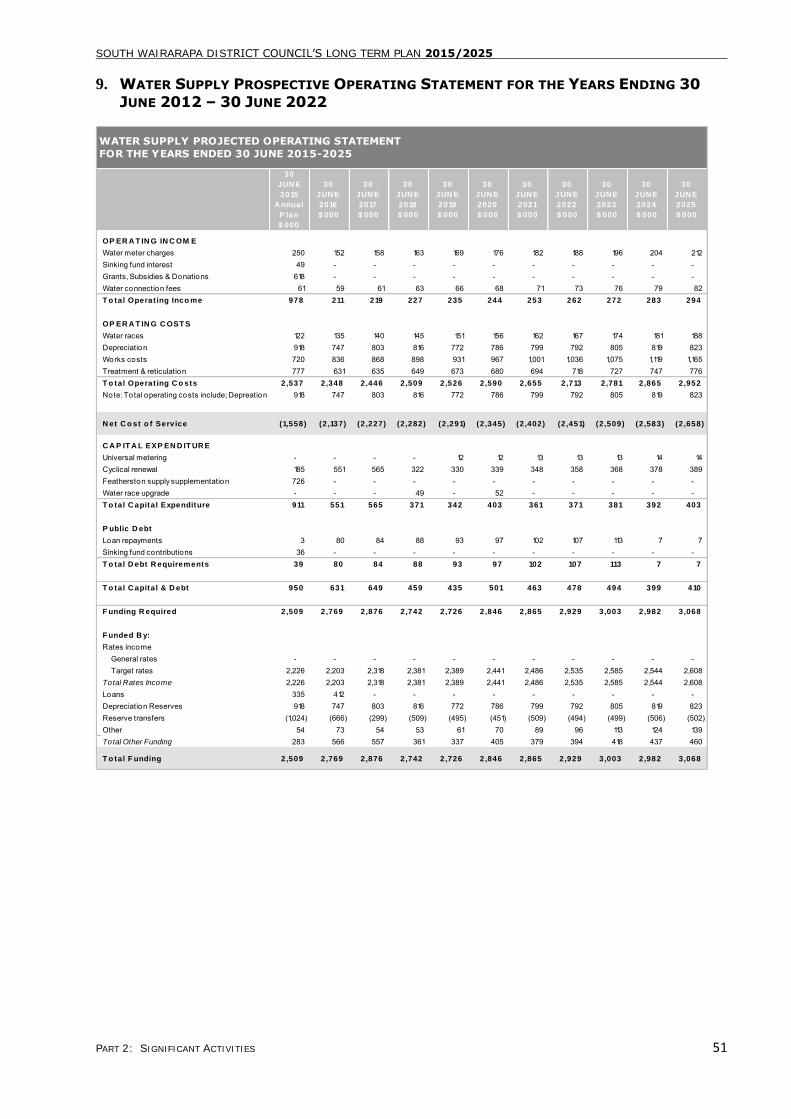
SOUTH WAIRARAPA DISTRICT COUNCIL’S LONG TERM PLAN 2015/2025
PART 2: SIGNIFICANT ACTIVITIES 51
9. WATER SUPPLY PROSPECTIVE OPERATING STATEMENT FOR THE YEARS ENDING 30
JUNE 2012 – 30 JUNE 2022
30
JUN E
2015
A nnual
P lan
$ 000
30
JUN E
2016
$ 000
30
JUN E
2017
$ 000
30
JUN E
2018
$ 000
30
JUN E
2019
$ 000
30
JUN E
2020
$ 000
30
JUN E
2021
$ 000
30
JUN E
2022
$ 000
30
JUN E
2023
$ 000
30
JUN E
2024
$ 000
30
JUN E
2025
$ 000
OP ER A T IN G IN C OM E
Water meter charges 250 152 158 163 169 176 182 188 196 204 212 Sinking fund interest 49 - - - - - - - - - - Grants, Subsidies & Donations 618 - - - - - - - - - - Water connection fees 61 59 61 63 66 68 71 73 76 79 82 T o tal Operat ing Inco me 978 211 219 227 235 244 253 262 272 283 294
OP ER A T IN G C OST S
Water races 122 135 140 145 151 156 162 167 174 181 188 Depreciation 918 747 803 816 772 786 799 792 805 819 823 Works costs 720 836 868 898 931 967 1,001 1,036 1,075 1,119 1,165 Treatment & reticulation 777 631 635 649 673 680 694 718 727 747 776 T o tal Operat ing C o sts 2,537 2 ,348 2 ,446 2 ,509 2 ,526 2 ,590 2 ,655 2 ,713 2 ,781 2 ,865 2 ,952
Note: Total operating costs include; Depreation 918 747 803 816 772 786 799 792 805 819 823
N et C o st o f Service (1,558) (2 ,137) (2 ,227) (2 ,282) (2 ,291) (2 ,345) (2 ,402) (2 ,451) (2 ,509) (2 ,583) (2 ,658)
C A P IT A L EXP EN D IT UR E
Universal metering - - - - 12 12 13 13 13 14 14 Cyclical renewal 185 551 565 322 330 339 348 358 368 378 389 Featherston supply supplementation 726 - - - - - - - - - - Water race upgrade - - - 49 - 52 - - - - - T o tal C apital Expenditure 911 551 565 371 342 403 361 371 381 392 403
P ublic D ebt
Loan repayments 3 80 84 88 93 97 102 107 113 7 7 Sinking fund contributions 36 - - - - - - - - - - T o tal D ebt R equirements 39 80 84 88 93 97 102 107 113 7 7
T o tal C apital & D ebt 950 631 649 459 435 501 463 478 494 399 410
F unding R equired 2,509 2 ,769 2 ,876 2 ,742 2 ,726 2 ,846 2 ,865 2 ,929 3 ,003 2 ,982 3 ,068
F unded B y:
Rates income General rates - - - - - - - - - - - Target rates 2,226 2,203 2,318 2,381 2,389 2,441 2,486 2,535 2,585 2,544 2,608 Total Rates Income 2,226 2,203 2,318 2,381 2,389 2,441 2,486 2,535 2,585 2,544 2,608 Loans 335 412 - - - - - - - - - Depreciation Reserves 918 747 803 816 772 786 799 792 805 819 823 Reserve transfers (1,024) (666) (299) (509) (495) (451) (509) (494) (499) (506) (502) Other 54 73 54 53 61 70 89 96 113 124 139 Total Other Funding 283 566 557 361 337 405 379 394 418 437 460
T o tal F unding 2,509 2 ,769 2 ,876 2 ,742 2 ,726 2 ,846 2 ,865 2 ,929 3 ,003 2 ,982 3 ,068
WATER SUPPLY PROJECTED OPERATING STATEMENT
FOR THE YEARS ENDED 30 JUNE 2015-2025
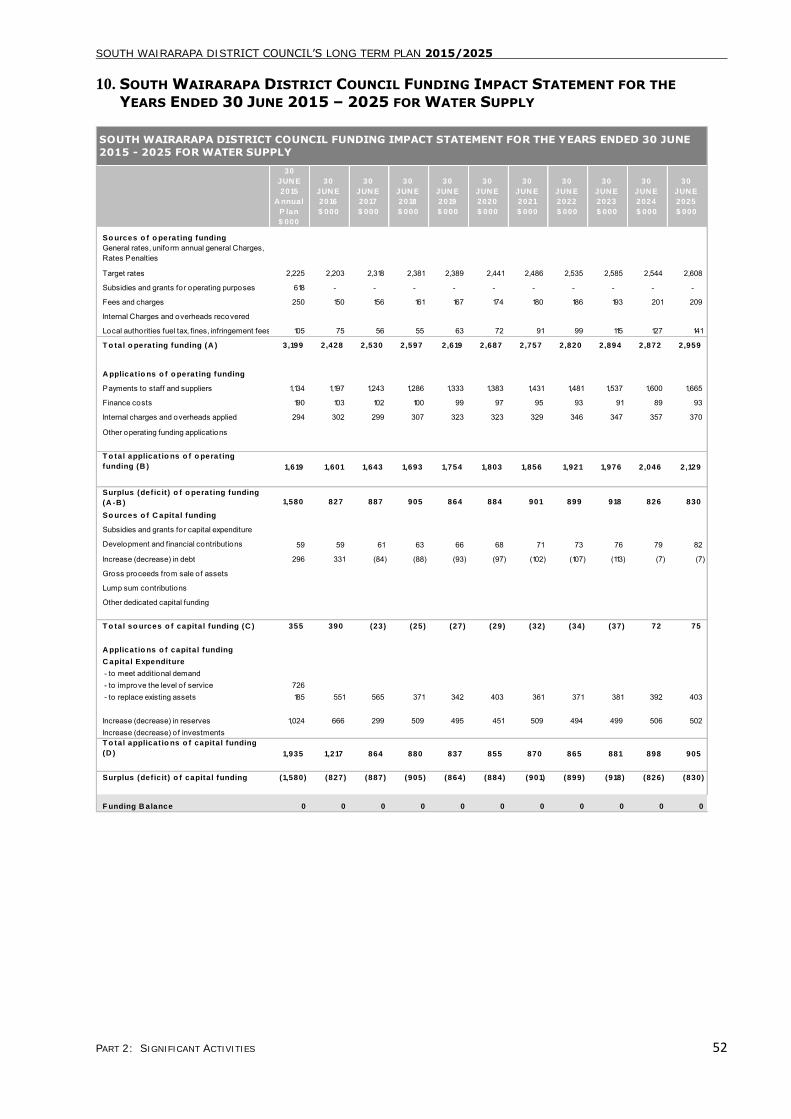
SOUTH WAIRARAPA DISTRICT COUNCIL’S LONG TERM PLAN 2015/2025
PART 2: SIGNIFICANT ACTIVITIES 52
10. SOUTH WAIRARAPA DISTRICT COUNCIL FUNDING IMPACT STATEMENT FOR THE
YEARS ENDED 30 JUNE 2015 – 2025 FOR WATER SUPPLY
30
JUN E
2015
A nnual
P lan
$ 000
30
JUN E
2016
$ 000
30
JUN E
2017
$ 000
30
JUN E
2018
$ 000
30
JUN E
2019
$ 000
30
JUN E
2020
$ 000
30
JUN E
2021
$ 000
30
JUN E
2022
$ 000
30
JUN E
2023
$ 000
30
JUN E
2024
$ 000
30
JUN E
2025
$ 000
So urces o f o perat ing funding
General rates, uniform annual general Charges, Rates Penalties
Target rates 2,225 2,203 2,318 2,381 2,389 2,441 2,486 2,535 2,585 2,544 2,608
Subsidies and grants for operating purposes 618 - - - - - - - - - -
Fees and charges 250 150 156 161 167 174 180 186 193 201 209
Internal Charges and overheads recovered
Local authorities fuel tax, fines, infringement fees, and other receipts105 75 56 55 63 72 91 99 115 127 141
T o tal o perat ing funding (A ) 3,199 2 ,428 2 ,530 2 ,597 2 ,619 2 ,687 2 ,757 2 ,820 2 ,894 2 ,872 2 ,959
A pplicat io ns o f o perat ing funding
Payments to staff and suppliers 1,134 1,197 1,243 1,286 1,333 1,383 1,431 1,481 1,537 1,600 1,665
Finance costs 190 103 102 100 99 97 95 93 91 89 93
Internal charges and overheads applied 294 302 299 307 323 323 329 346 347 357 370
Other operating funding applications
T o tal applicat io ns o f o perat ing
funding (B ) 1,619 1,601 1,643 1,693 1,754 1,803 1,856 1,921 1,976 2 ,046 2 ,129
Surplus (def ic it ) o f o perat ing funding
(A -B ) 1,580 827 887 905 864 884 901 899 918 826 830
So urces o f C apital funding
Subsidies and grants for capital expenditure
Development and financial contributions 59 59 61 63 66 68 71 73 76 79 82
Increase (decrease) in debt 296 331 (84) (88) (93) (97) (102) (107) (113) (7) (7)
Gross proceeds from sale of assets
Lump sum contributions
Other dedicated capital funding
T o tal so urces o f capital funding (C ) 355 390 (23) (25) (27) (29) (32) (34) (37) 72 75
A pplicat io ns o f capital funding
C apital Expenditure
- to meet additional demand - to improve the level o f service 726 - to replace existing assets 185 551 565 371 342 403 361 371 381 392 403
Increase (decrease) in reserves 1,024 666 299 509 495 451 509 494 499 506 502 Increase (decrease) of investmentsT o tal applicat io ns o f capital funding
(D ) 1,935 1,217 864 880 837 855 870 865 881 898 905
Surplus (def ic it ) o f capital funding (1,580) (827) (887) (905) (864) (884) (901) (899) (918) (826) (830)
F unding B alance 0 0 0 0 0 0 0 0 0 0 0
SOUTH WAIRARAPA DISTRICT COUNCIL FUNDING IMPACT STATEMENT FOR THE YEARS ENDED 30 JUNE
2015 - 2025 FOR WATER SUPPLY
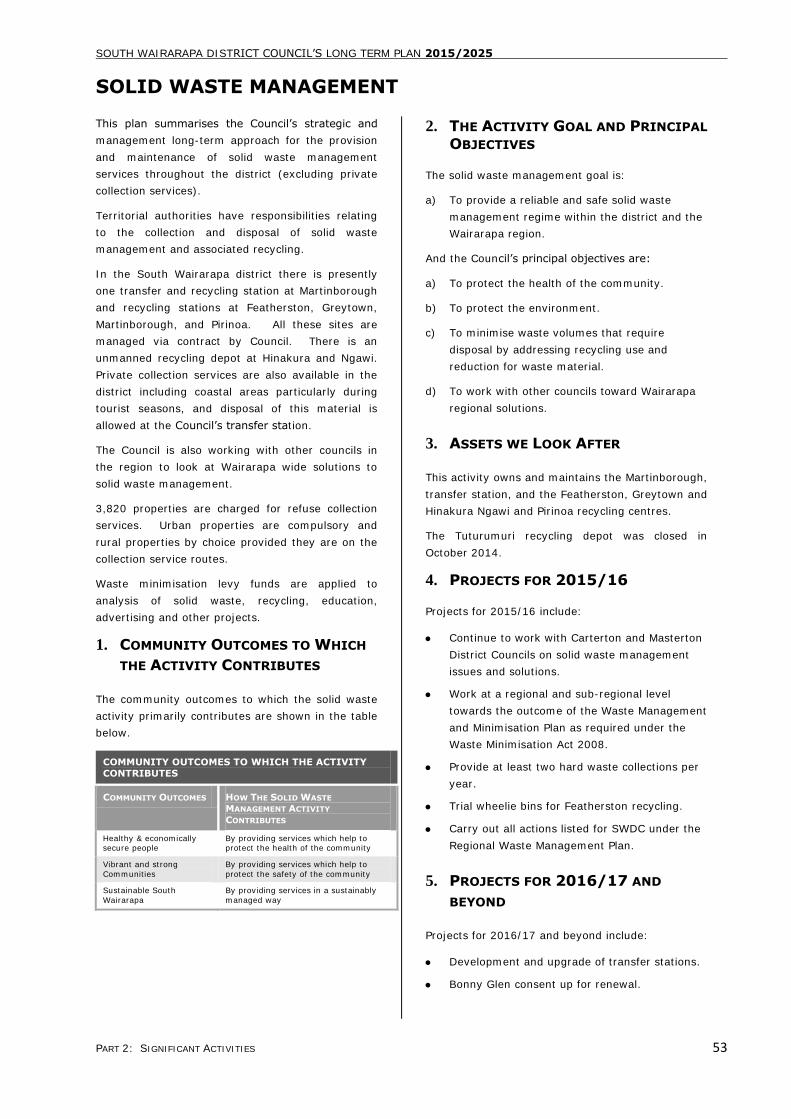
SOUTH WAIRARAPA DISTRICT COUNCIL’S LONG TERM PLAN 2015/2025
PART 2: SIGNIFICANT ACTIVITIES 53
SOLID WASTE MANAGEMENT
This plan summarises the Council’s strategic and
management long-term approach for the provision
and maintenance of solid waste management
services throughout the district (excluding private
collection services).
Territorial authorities have responsibilities relating
to the collection and disposal of solid waste
management and associated recycling.
In the South Wairarapa district there is presently
one transfer and recycling station at Martinborough
and recycling stations at Featherston, Greytown,
Martinborough, and Pirinoa. All these sites are
managed via contract by Council. There is an
unmanned recycling depot at Hinakura and Ngawi.
Private collection services are also available in the
district including coastal areas particularly during
tourist seasons, and disposal of this material is
allowed at the Council’s transfer station.
The Council is also working with other councils in
the region to look at Wairarapa wide solutions to
solid waste management.
3,820 properties are charged for refuse collection
services. Urban properties are compulsory and
rural properties by choice provided they are on the
collection service routes.
Waste minimisation levy funds are applied to
analysis of solid waste, recycling, education,
advertising and other projects.
1. COMMUNITY OUTCOMES TO WHICH
THE ACTIVITY CONTRIBUTES
The community outcomes to which the solid waste
activity primarily contributes are shown in the table
below.
COMMUNITY OUTCOMES TO WHICH THE ACTIVITY
CONTRIBUTES
COMMUNITY OUTCOMES HOW THE SOLID WASTE
MANAGEMENT ACTIVITY
CONTRIBUTES
Healthy & economically secure people
By providing services which help to protect the health of the community
Vibrant and strong
Communities
By providing services which help to
protect the safety of the community
Sustainable South
Wairarapa
By providing services in a sustainably
managed way
2. THE ACTIVITY GOAL AND PRINCIPAL
OBJECTIVES
The solid waste management goal is:
a) To provide a reliable and safe solid waste
management regime within the district and the
Wairarapa region.
And the Council’s principal objectives are:
a) To protect the health of the community.
b) To protect the environment.
c) To minimise waste volumes that require
disposal by addressing recycling use and
reduction for waste material.
d) To work with other councils toward Wairarapa
regional solutions.
3. ASSETS WE LOOK AFTER
This activity owns and maintains the Martinborough,
transfer station, and the Featherston, Greytown and
Hinakura Ngawi and Pirinoa recycling centres.
The Tuturumuri recycling depot was closed in
October 2014.
4. PROJECTS FOR 2015/16
Projects for 2015/16 include:
Continue to work with Carterton and Masterton
District Councils on solid waste management
issues and solutions.
Work at a regional and sub-regional level
towards the outcome of the Waste Management
and Minimisation Plan as required under the
Waste Minimisation Act 2008.
Provide at least two hard waste collections per
year.
Trial wheelie bins for Featherston recycling.
Carry out all actions listed for SWDC under the
Regional Waste Management Plan.
5. PROJECTS FOR 2016/17 AND
BEYOND
Projects for 2016/17 and beyond include:
Development and upgrade of transfer stations.
Bonny Glen consent up for renewal.
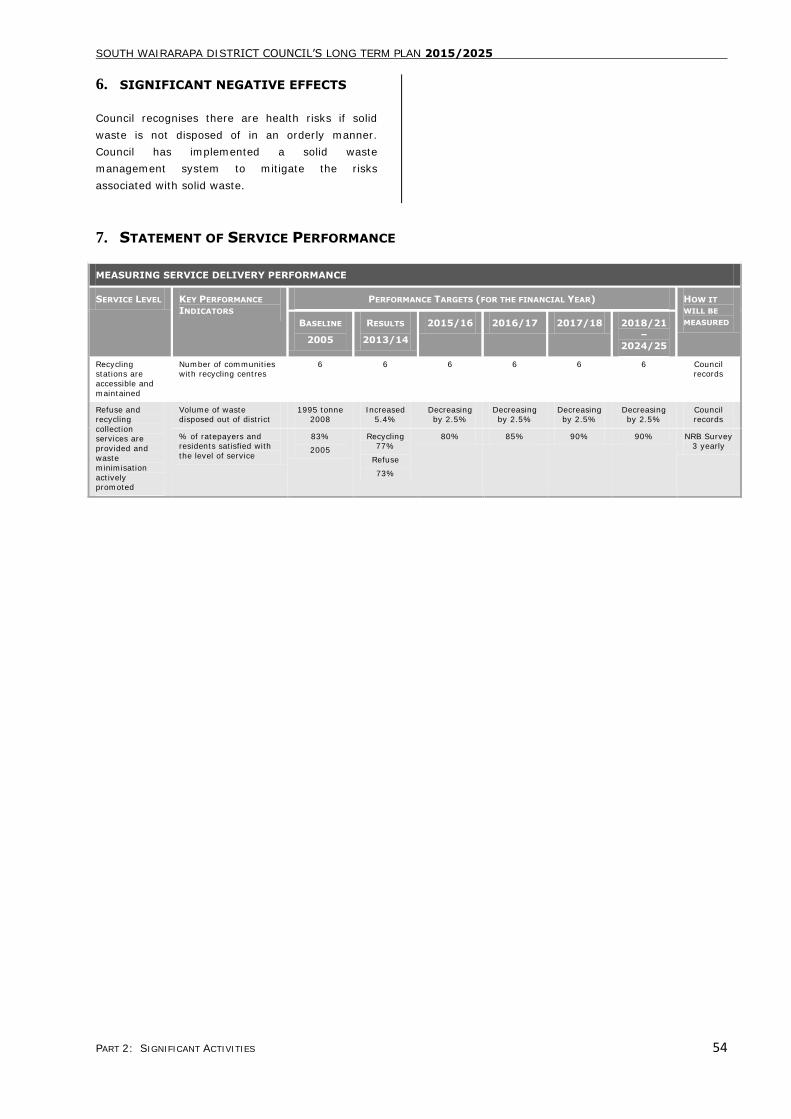
SOUTH WAIRARAPA DISTRICT COUNCIL’S LONG TERM PLAN 2015/2025
PART 2: SIGNIFICANT ACTIVITIES 54
6. SIGNIFICANT NEGATIVE EFFECTS
Council recognises there are health risks if solid
waste is not disposed of in an orderly manner.
Council has implemented a solid waste
management system to mitigate the risks
associated with solid waste.
7. STATEMENT OF SERVICE PERFORMANCE
MEASURING SERVICE DELIVERY PERFORMANCE
SERVICE LEVEL KEY PERFORMANCE
INDICATORS
PERFORMANCE TARGETS (FOR THE FINANCIAL YEAR) HOW IT
WILL BE
MEASURED BASELINE
2005
RESULTS
2013/14
2015/16 2016/17 2017/18 2018/21
–
2024/25
Recycling stations are
accessible and
maintained
Number of communities with recycling centres
6 6 6 6 6 6 Council records
Refuse and recycling
collection services are
provided and
waste
minimisation
actively promoted
Volume of waste disposed out of district
1995 tonne 2008
Increased 5.4%
Decreasing by 2.5%
Decreasing by 2.5%
Decreasing by 2.5%
Decreasing by 2.5%
Council records
% of ratepayers and residents satisfied with
the level of service
83%
2005
Recycling 77%
Refuse
73%
80% 85% 90% 90% NRB Survey 3 yearly
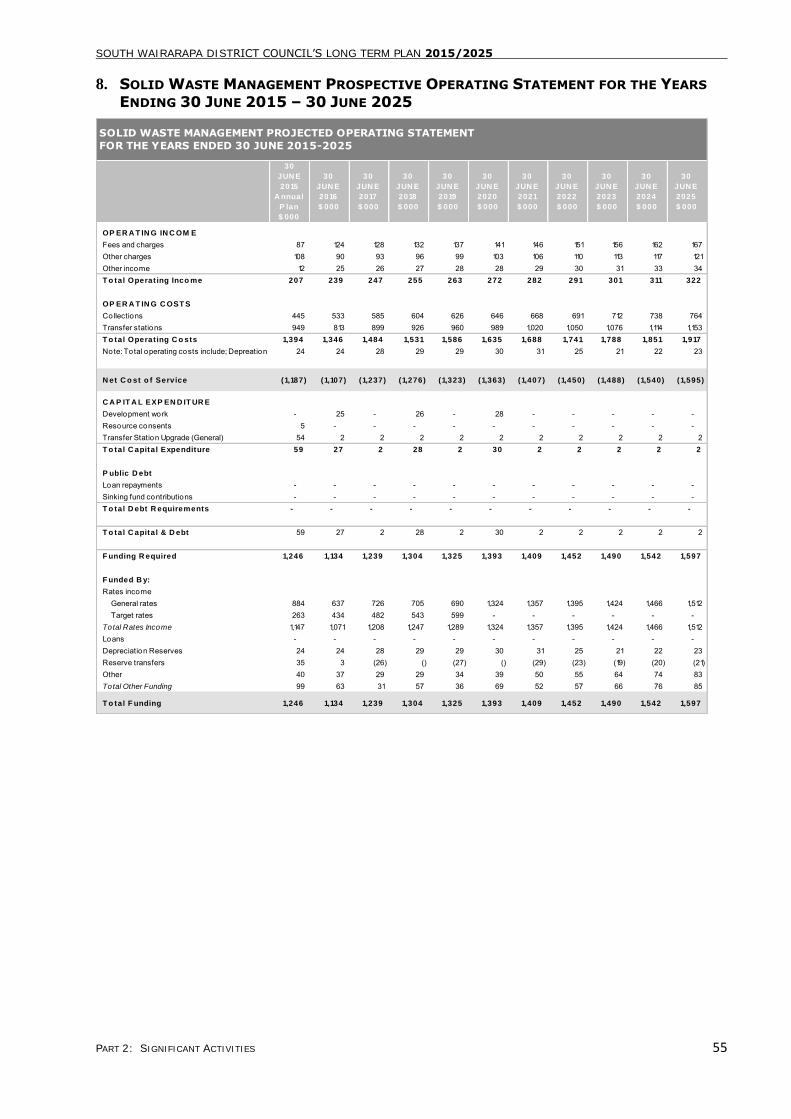
SOUTH WAIRARAPA DISTRICT COUNCIL’S LONG TERM PLAN 2015/2025
PART 2: SIGNIFICANT ACTIVITIES 55
8. SOLID WASTE MANAGEMENT PROSPECTIVE OPERATING STATEMENT FOR THE YEARS
ENDING 30 JUNE 2015 – 30 JUNE 2025
30
JUN E
2015
A nnual
P lan
$ 000
30
JUN E
2016
$ 000
30
JUN E
2017
$ 000
30
JUN E
2018
$ 000
30
JUN E
2019
$ 000
30
JUN E
2020
$ 000
30
JUN E
2021
$ 000
30
JUN E
2022
$ 000
30
JUN E
2023
$ 000
30
JUN E
2024
$ 000
30
JUN E
2025
$ 000
OP ER A T IN G IN C OM E
Fees and charges 87 124 128 132 137 141 146 151 156 162 167 Other charges 108 90 93 96 99 103 106 110 113 117 121 Other income 12 25 26 27 28 28 29 30 31 33 34 T o tal Operat ing Inco me 207 239 247 255 263 272 282 291 301 311 322
OP ER A T IN G C OST S
Collections 445 533 585 604 626 646 668 691 712 738 764 Transfer stations 949 813 899 926 960 989 1,020 1,050 1,076 1,114 1,153 T o tal Operat ing C o sts 1,394 1,346 1,484 1,531 1,586 1,635 1,688 1,741 1,788 1,851 1,917
Note: Total operating costs include; Depreation 24 24 28 29 29 30 31 25 21 22 23
N et C o st o f Service (1,187) (1,107) (1,237) (1,276) (1,323) (1,363) (1,407) (1,450) (1,488) (1,540) (1,595)
C A P IT A L EXP EN D IT UR E
Development work - 25 - 26 - 28 - - - - - Resource consents 5 - - - - - - - - - - Transfer Station Upgrade (General) 54 2 2 2 2 2 2 2 2 2 2 T o tal C apital Expenditure 59 27 2 28 2 30 2 2 2 2 2
P ublic D ebt
Loan repayments - - - - - - - - - - - Sinking fund contributions - - - - - - - - - - - T o tal D ebt R equirements - - - - - - - - - - -
T o tal C apital & D ebt 59 27 2 28 2 30 2 2 2 2 2
F unding R equired 1,246 1,134 1,239 1,304 1,325 1,393 1,409 1,452 1,490 1,542 1,597
F unded B y:
Rates income General rates 884 637 726 705 690 1,324 1,357 1,395 1,424 1,466 1,512 Target rates 263 434 482 543 599 - - - - - - Total Rates Income 1,147 1,071 1,208 1,247 1,289 1,324 1,357 1,395 1,424 1,466 1,512 Loans - - - - - - - - - - - Depreciation Reserves 24 24 28 29 29 30 31 25 21 22 23 Reserve transfers 35 3 (26) () (27) () (29) (23) (19) (20) (21) Other 40 37 29 29 34 39 50 55 64 74 83 Total Other Funding 99 63 31 57 36 69 52 57 66 76 85
T o tal F unding 1,246 1,134 1,239 1,304 1,325 1,393 1,409 1,452 1,490 1,542 1,597
SOLID WASTE MANAGEMENT PROJECTED OPERATING STATEMENT
FOR THE YEARS ENDED 30 JUNE 2015-2025

SOUTH WAIRARAPA DISTRICT COUNCIL’S LONG TERM PLAN 2015/2025
PART 2: SIGNIFICANT ACTIVITIES 56
9. SOUTH WAIRARAPA DISTRICT COUNCIL FUNDING IMPACT STATEMENT FOR THE
YEARS ENDED 30 JUNE 2015-2025 FOR SOLID WASTE MANAGEMENT
30
JUN E
2015
A nnual
P lan
$ 000
30
JUN E
2016
$ 000
30
JUN E
2017
$ 000
30
JUN E
2018
$ 000
30
JUN E
2019
$ 000
30
JUN E
2020
$ 000
30
JUN E
2021
$ 000
30
JUN E
2022
$ 000
30
JUN E
2023
$ 000
30
JUN E
2024
$ 000
30
JUN E
2025
$ 000
So urces o f o perat ing funding
General rates, uniform annual general Charges, Rates Penalties 1,147 1,071 1,208 1,247 1,289 1,324 1,357 1,395 1,424 1,466 1,512
Target rates
Subsidies and grants for operating purposes
Fees and charges 124 128 132 137 141 146 151 156 162 167
Internal Charges and overheads recoveredLocal authorities fuel tax, fines, infringement fees, and other receipts 247 152 148 151 160 170 185 195 209 224 238
T o tal o perat ing funding (A ) 1,394 1,346 1,484 1,531 1,586 1,635 1,688 1,741 1,788 1,851 1,917
A pplicat io ns o f o perat ing funding
Payments to staff and suppliers 1,204 1,189 1,325 1,367 1,414 1,463 1,513 1,563 1,614 1,672 1,731
Finance costs
Internal charges and overheads applied 165 133 131 135 143 142 144 153 153 157 163
Other operating funding applications
T o tal applicat io ns o f o perat ing
funding (B ) 1,370 1,323 1,456 1,502 1,557 1,605 1,658 1,716 1,767 1,829 1,894
Surplus (def ic it ) o f o perat ing funding
(A -B ) 24 24 28 29 29 30 31 25 21 22 23
So urces o f C apital funding
Subsidies and grants for capital expenditure
Development and financial contributions
Increase (decrease) in debt
Gross proceeds from sale of assets
Lump sum contributions
Other dedicated capital funding
T o tal so urces o f capital funding (C ) - - - - - - - - - - -
A pplicat io ns o f capital funding
C apital Expenditure
- to meet additional demand - to improve the level o f service - to replace existing assets 59 27 2 28 2 30 2 2 2 2 2
Increase (decrease) in reserves (35) (3) 26 27 29 23 19 20 21 Increase (decrease) of investments
T o tal applicat io ns o f capital funding
(D ) 24 24 28 29 29 30 31 25 21 22 23
Surplus (def ic it ) o f capital funding (24) (24) (28) (29) (29) (30) (31) (25) (21) (22) (23)
F unding B alance 0 0 0 0 0 0 0 0 0 0 0
SOUTH WAIRARAPA DISTRICT COUNCIL FUNDING IMPACT STATEMENT FOR THE YEARS ENDED 30 JUNE
2015 - 2025 FOR SOLID WASTE MANAGEMENT
SOUTH WAIRARAPA DISTRICT COUNCIL’S LONG TERM PLAN 2015/2025
PART 2: SIGNIFICANT ACTIVITIES 57
WASTE WATER (SEWERAGE)
1. DESCRIPTION
This Plan summarises the Council’s strategic and
management long term approach for the provision
and maintenance of sewerage to properties in the
district (excluding those that service single
premises that have their own septic tanks).
This plan covers the disposal of:
Waste water from the urban centres of
Featherston, Greytown and Martinborough.
The scheme for Lake Ferry settlement.
Territorial authorities have numerous
responsibilities relating to waste water systems.
One responsibility is the duty under the Health Act
1956 to improve, promote, and protect public
health within their districts. This implies that, in
the case of the provision of waste water systems,
councils have an obligation to identify where such a
service is required, and to either provide it directly
themselves, or to maintain an overview of the
supply if it is provided by others.
In the South Wairarapa district, there are presently
four waste water systems, to which 3,784 pans are
serviced and 321 properties serviceable.
The sewerage schemes are:
Featherston – Urban.
Greytown – Urban.
Martinborough – Urban.
Lake Ferry – Rural.
Featherston - Urban
A gravity system (95%) with minor pumping (5%).
Sewage flows by gravity from individual connections
through the mains to a primary and secondary
oxidation pond configuration.
Featherston oxidation ponds are located off
Longwood Road some 1.3 km from the edge of the
urban development. The ponds have a total surface
area of 38,000 m2 and incorporate a clay sealing
layer, polyethylene sealed sides and wavebands.
Treated effluent is discharged via a trough into an
open channel which flows into Donald’s Creek below
Longwood Road.
Council have purchased 170ha Hodder Farm
adjacent to the current oxidation ponds as part of
the consent process to irrigate to land.
Greytown - Urban
A gravity system (95%) with minor pumping (5%).
At present 90% of the Greytown urban area is
connected to the waste water system. Some
properties are still on septic tanks.
Sewage flows by gravity from individual connections
through mains to primary and secondary ponds.
The Greytown sewage ponds are located at the end
of Pah Road, some 3km from Greytown. Pond No 1
has an area of 18,500m2 and Pond No 2 has an area
of 15,000m2. Both ponds are clay lined and have
concrete wavebands.
An internal boulder wall filter was constructed in
2000 for pond No 2. This was a requirement of the
resource consent process and is aimed at improving
effluent quality.
The effluent discharges into the Papawai Stream.
The Papawai Stream flows into the Ruamahanga
River some 1,500 metres downstream of the
effluent discharge point.
Council have purchased 116ha Bicknell Farm
adjacent to the current Papawai site as part of the
consent process to irrigate to land.
Martinborough - Urban
Martinborough operates entirely as a gravity
system.
Sewage flows by gravity from individual connections
through the mains to a single anaerobic pond.
The pond has an area of 16,300m2 and incorporates
a clay sealing layer and waveband. Mechanical
aerators were installed in 1998 and four maturation
ponds were constructed in 2006 to improve the
quality of effluent. It is sited at the end of Weld
Street, some 1.3km from the Square.
Treated effluent is discharged via an outlet
structure into the Ruamahanga River.
A few households in Martinborough are still
operating off septic tanks and not connected to the
system.
Summary of Council Infrastructure
The Council owns a number of structures and
components for the disposal of waste water as
shown in the table on the following page:
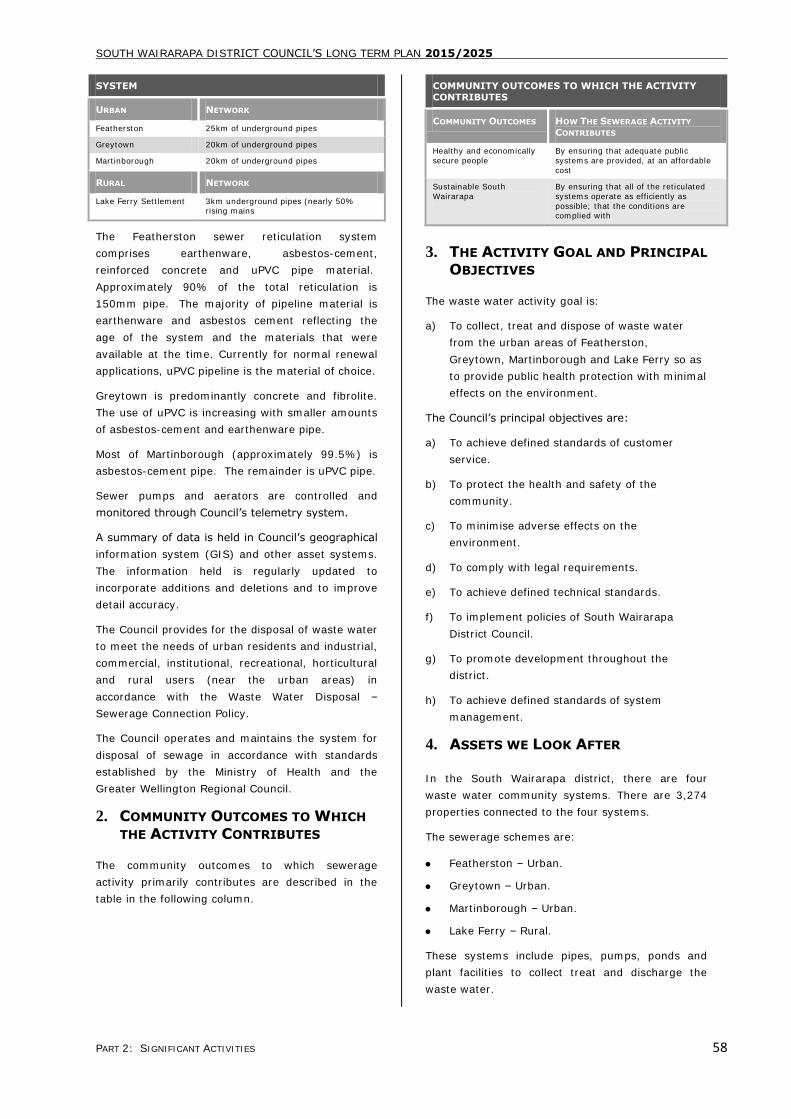
SOUTH WAIRARAPA DISTRICT COUNCIL’S LONG TERM PLAN 2015/2025
PART 2: SIGNIFICANT ACTIVITIES 58
SYSTEM
URBAN NETWORK
Featherston 25km of underground pipes
Greytown 20km of underground pipes
Martinborough 20km of underground pipes
RURAL NETWORK
Lake Ferry Settlement 3km underground pipes (nearly 50% rising mains
The Featherston sewer reticulation system
comprises earthenware, asbestos-cement,
reinforced concrete and uPVC pipe material.
Approximately 90% of the total reticulation is
150mm pipe. The majority of pipeline material is
earthenware and asbestos cement reflecting the
age of the system and the materials that were
available at the time. Currently for normal renewal
applications, uPVC pipeline is the material of choice.
Greytown is predominantly concrete and fibrolite.
The use of uPVC is increasing with smaller amounts
of asbestos-cement and earthenware pipe.
Most of Martinborough (approximately 99.5%) is
asbestos-cement pipe. The remainder is uPVC pipe.
Sewer pumps and aerators are controlled and
monitored through Council’s telemetry system.
A summary of data is held in Council’s geographical
information system (GIS) and other asset systems.
The information held is regularly updated to
incorporate additions and deletions and to improve
detail accuracy.
The Council provides for the disposal of waste water
to meet the needs of urban residents and industrial,
commercial, institutional, recreational, horticultural
and rural users (near the urban areas) in
accordance with the Waste Water Disposal –
Sewerage Connection Policy.
The Council operates and maintains the system for
disposal of sewage in accordance with standards
established by the Ministry of Health and the
Greater Wellington Regional Council.
2. COMMUNITY OUTCOMES TO WHICH
THE ACTIVITY CONTRIBUTES
The community outcomes to which sewerage
activity primarily contributes are described in the
table in the following column.
COMMUNITY OUTCOMES TO WHICH THE ACTIVITY
CONTRIBUTES
COMMUNITY OUTCOMES HOW THE SEWERAGE ACTIVITY
CONTRIBUTES
Healthy and economically
secure people
By ensuring that adequate public
systems are provided, at an affordable
cost
Sustainable South
Wairarapa
By ensuring that all of the reticulated
systems operate as efficiently as
possible; that the conditions are complied with
3. THE ACTIVITY GOAL AND PRINCIPAL
OBJECTIVES
The waste water activity goal is:
a) To collect, treat and dispose of waste water
from the urban areas of Featherston,
Greytown, Martinborough and Lake Ferry so as
to provide public health protection with minimal
effects on the environment.
The Council’s principal objectives are:
a) To achieve defined standards of customer
service.
b) To protect the health and safety of the
community.
c) To minimise adverse effects on the
environment.
d) To comply with legal requirements.
e) To achieve defined technical standards.
f) To implement policies of South Wairarapa
District Council.
g) To promote development throughout the
district.
h) To achieve defined standards of system
management.
4. ASSETS WE LOOK AFTER
In the South Wairarapa district, there are four
waste water community systems. There are 3,274
properties connected to the four systems.
The sewerage schemes are:
Featherston – Urban.
Greytown – Urban.
Martinborough – Urban.
Lake Ferry – Rural.
These systems include pipes, pumps, ponds and
plant facilities to collect treat and discharge the
waste water.
SOUTH WAIRARAPA DISTRICT COUNCIL’S LONG TERM PLAN 2015/2025
PART 2: SIGNIFICANT ACTIVITIES 59
5. PROJECTS FOR 2015/16
Projects for 2015/16 include:
Continued programme of sewerage reticulation
repairs and renewals.
Consent applications are set for:
1. Martinborough, May 2015
2. Greytown, September 2015
3. Featherston, April 2016
Divert flow from Papawai Stream (Greytown).
Install ultra-violet disinfection for the Greytown
effluent discharge and apply for land irrigation
consents.
Making South Wairarapa a safe place for its
residents.
Promoting South Wairarapa as a good place in
which to live.
6. PROJECTS FOR 2016/17 AND
BEYOND
Projects for 2016/17 and beyond include:
Continue to develop waste water treatment
systems to meet the requirements of the new
resource consents.
Irrigating to land.
7. SIGNIFICANT NEGATIVE EFFECTS
Council recognises there are health and
environmental risks if waste water is not disposed
of in an orderly manner. Council has implemented a
waste water system to mitigate the risks associated
with waste water. The resource consent process
ensures health, environmental, and cultural
considerations are taken into account.
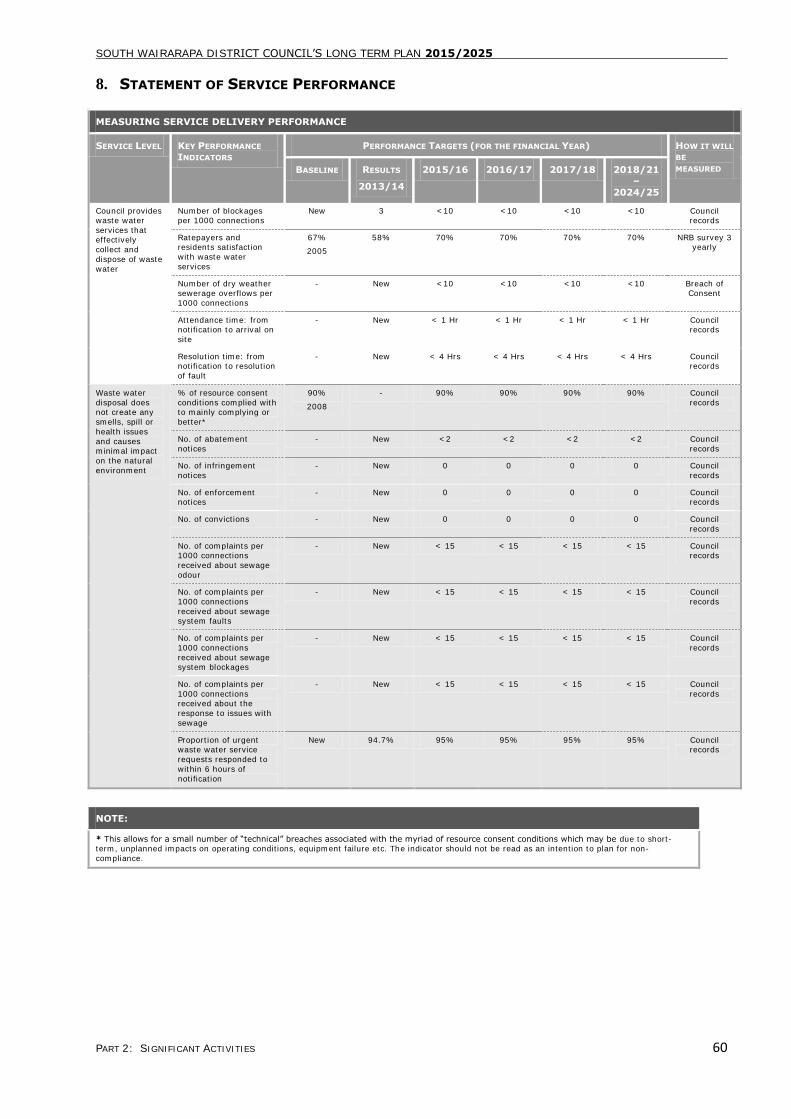
SOUTH WAIRARAPA DISTRICT COUNCIL’S LONG TERM PLAN 2015/2025
PART 2: SIGNIFICANT ACTIVITIES 60
8. STATEMENT OF SERVICE PERFORMANCE
MEASURING SERVICE DELIVERY PERFORMANCE
SERVICE LEVEL KEY PERFORMANCE
INDICATORS
PERFORMANCE TARGETS (FOR THE FINANCIAL YEAR) HOW IT WILL
BE
MEASURED BASELINE RESULTS
2013/14
2015/16 2016/17 2017/18 2018/21
–
2024/25
Council provides waste water
services that effectively
collect and
dispose of waste
water
Number of blockages per 1000 connections
New 3 <10 <10 <10 <10 Council records
Ratepayers and residents satisfaction
with waste water
services
67%
2005
58% 70% 70% 70% 70% NRB survey 3 yearly
Number of dry weather sewerage overflows per
1000 connections
- New <10 <10 <10 <10 Breach of Consent
Attendance time: from notification to arrival on
site
- New < 1 Hr < 1 Hr < 1 Hr < 1 Hr Council records
Resolution time: from notification to resolution
of fault
- New < 4 Hrs < 4 Hrs < 4 Hrs < 4 Hrs Council records
Waste water
disposal does not create any
smells, spill or
health issues
and causes minimal impact
on the natural
environment
% of resource consent
conditions complied with to mainly complying or
better*
90%
2008
- 90% 90% 90% 90% Council
records
No. of abatement
notices
- New <2 <2 <2 <2 Council
records
No. of infringement
notices
- New 0 0 0 0 Council
records
No. of enforcement notices
- New 0 0 0 0 Council records
No. of convictions - New 0 0 0 0 Council
records
No. of complaints per 1000 connections
received about sewage
odour
- New < 15 < 15 < 15 < 15 Council records
No. of complaints per
1000 connections
received about sewage system faults
- New < 15 < 15 < 15 < 15 Council
records
No. of complaints per
1000 connections
received about sewage system blockages
- New < 15 < 15 < 15 < 15 Council
records
No. of complaints per
1000 connections received about the
response to issues with
sewage
- New < 15 < 15 < 15 < 15 Council
records
Proportion of urgent waste water service
requests responded to
within 6 hours of
notification
New 94.7% 95% 95% 95% 95% Council records
NOTE:
* This allows for a small number of “technical” breaches associated with the myriad of resource consent conditions which may be due to short-term, unplanned impacts on operating conditions, equipment failure etc. The indicator should not be read as an intention to plan for non-
compliance.

SOUTH WAIRARAPA DISTRICT COUNCIL’S LONG TERM PLAN 2015/2025
PART 2: SIGNIFICANT ACTIVITIES 61
9. SEWERAGE PROSPECTIVE OPERATING STATEMENT FOR THE YEARS ENDING 30
JUNE 2015 – 30 JUNE 2025
30
JUN E
2015
A nnual
P lan
$ 000
30
JUN E
2016
$ 000
30
JUN E
2017
$ 000
30
JUN E
2018
$ 000
30
JUN E
2019
$ 000
30
JUN E
2020
$ 000
30
JUN E
2021
$ 000
30
JUN E
2022
$ 000
30
JUN E
2023
$ 000
30
JUN E
2024
$ 000
30
JUN E
2025
$ 000
OP ER A T IN G IN C OM E
Fees and charges 95 229 232 235 243 247 251 254 264 275 286 Grants, subsidies & donations - - - - - - - - - - - Sinking fund interest 35 - - - - - - - - - - Contributions 23 23 24 24 25 26 27 28 29 30 32 T o tal Operat ing Inco me 153 252 256 260 269 273 278 282 293 305 318
OP ER A T IN G C OST S
Reticulation 1,196 1,413 1,490 1,562 1,528 1,554 1,586 1,602 1,703 1,735 1,637 Treatment and disposal 419 437 557 542 470 479 490 497 398 390 519 T o tal Operat ing C o sts 1,615 1,851 2 ,047 2 ,104 1,998 2 ,033 2 ,076 2 ,099 2 ,101 2 ,125 2 ,156
Note: Total operating costs include; Depreation 426 353 404 423 422 436 453 468 466 481 498
N et C o st o f Service (1,463) (1,599) (1,791) (1,844) (1,729) (1,759) (1,798) (1,816) (1,808) (1,820) (1,838)
C A P IT A L EXP EN D IT UR E
Reticulation renewals 551 355 314 214 220 226 232 238 245 252 259 A lternative disposal systems (Greytown) 230 392 349 155 239 - 252 173 - - - A lternative disposal systems (M artinborough) 159 36 303 155 - - - 18 27 - 19 A lternative disposal systems (Featherston) 54 61 220 264 40 344 185 - - - - M iscellaneous 2 Lake Ferry sewerage system 10 T o tal C apital Expenditure 1,006 844 1,186 790 499 570 669 429 272 252 278
P ublic D ebt
Loan repayments 63 304 343 373 441 470 503 618 559 587 617 Sinking fund contributions 113 - - - - - - - - - - T o tal D ebt R equirements 176 304 343 373 441 470 503 618 559 587 617
T o tal C apital & D ebt 1,182 1,147 1,529 1,162 940 1,040 1,172 1,047 831 839 895
F unding R equired 2,645 2 ,746 3 ,320 3 ,006 2 ,670 2 ,799 2 ,970 2 ,864 2 ,639 2 ,660 2 ,733
F unded B y:
Rates Income General rates - - - - - - - - - - - Target rates 1,459 1,663 1,865 2,069 2,270 2,378 2,235 2,358 2,279 2,305 2,339 Total Rates Income 1,459 1,663 1,865 2,069 2,270 2,378 2,235 2,358 2,279 2,305 2,339 Loans 1,040 489 872 575 279 344 437 191 27 - 19 Depreciation Reserves 426 353 404 423 422 436 453 468 466 481 498 Reserve transfers (335) 169 121 (118) (365) (432) (248) (258) (250) (259) (270) Other 55 73 57 57 63 73 94 105 118 133 148 Total Other Funding 1,186 1,084 1,454 938 400 421 736 506 360 355 394
T o tal F unding 2,645 2 ,746 3 ,320 3 ,006 2 ,670 2 ,799 2 ,970 2 ,864 2 ,639 2 ,660 2 ,733
SEWERAGE PROJECTED OPERATING STATEMENT
FOR THE YEARS ENDED 30 JUNE 2015-2025
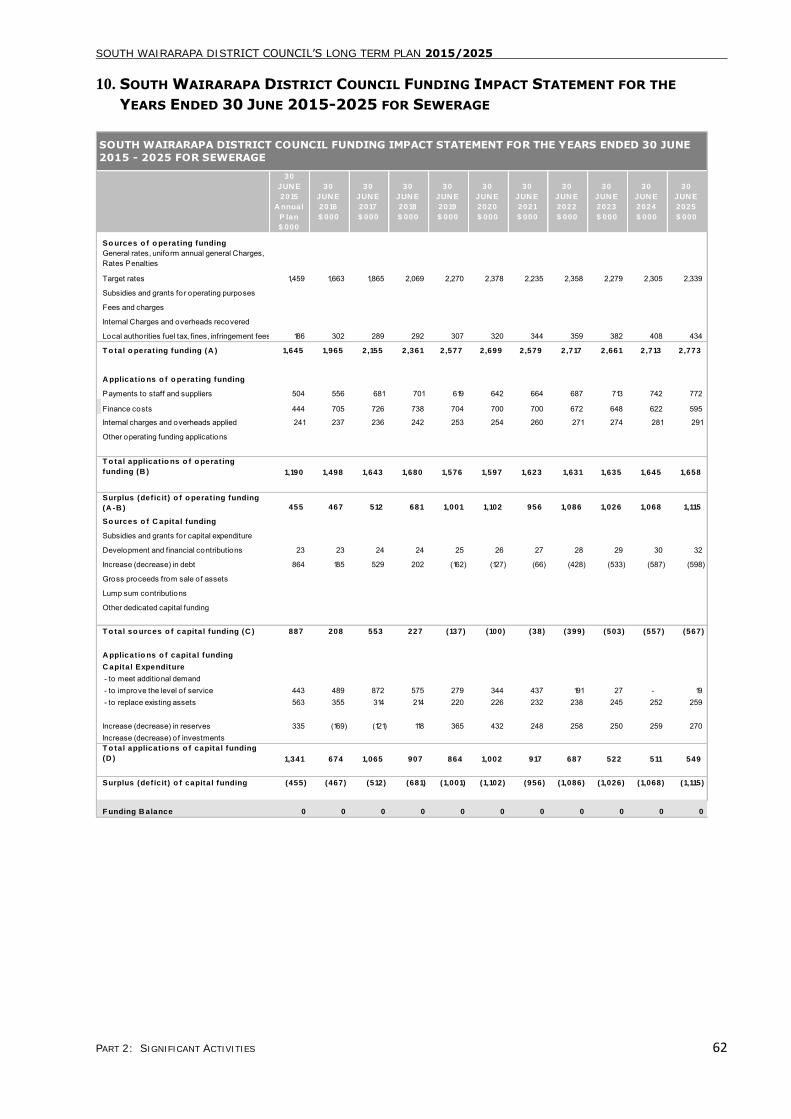
SOUTH WAIRARAPA DISTRICT COUNCIL’S LONG TERM PLAN 2015/2025
PART 2: SIGNIFICANT ACTIVITIES 62
10. SOUTH WAIRARAPA DISTRICT COUNCIL FUNDING IMPACT STATEMENT FOR THE
YEARS ENDED 30 JUNE 2015-2025 FOR SEWERAGE
30
JUN E
2015
A nnual
P lan
$ 000
30
JUN E
2016
$ 000
30
JUN E
2017
$ 000
30
JUN E
2018
$ 000
30
JUN E
2019
$ 000
30
JUN E
2020
$ 000
30
JUN E
2021
$ 000
30
JUN E
2022
$ 000
30
JUN E
2023
$ 000
30
JUN E
2024
$ 000
30
JUN E
2025
$ 000
So urces o f o perat ing funding
General rates, uniform annual general Charges, Rates Penalties
Target rates 1,459 1,663 1,865 2,069 2,270 2,378 2,235 2,358 2,279 2,305 2,339
Subsidies and grants for operating purposes
Fees and charges
Internal Charges and overheads recovered
Local authorities fuel tax, fines, infringement fees, and other receipts186 302 289 292 307 320 344 359 382 408 434
T o tal o perat ing funding (A ) 1,645 1,965 2 ,155 2 ,361 2 ,577 2 ,699 2 ,579 2 ,717 2 ,661 2 ,713 2 ,773
A pplicat io ns o f o perat ing funding
Payments to staff and suppliers 504 556 681 701 619 642 664 687 713 742 772
Finance costs 444 705 726 738 704 700 700 672 648 622 595
Internal charges and overheads applied 241 237 236 242 253 254 260 271 274 281 291
Other operating funding applications
T o tal applicat io ns o f o perat ing
funding (B ) 1,190 1,498 1,643 1,680 1,576 1,597 1,623 1,631 1,635 1,645 1,658
Surplus (def ic it ) o f o perat ing funding
(A -B ) 455 467 512 681 1,001 1,102 956 1,086 1,026 1,068 1,115
So urces o f C apital funding
Subsidies and grants for capital expenditure
Development and financial contributions 23 23 24 24 25 26 27 28 29 30 32
Increase (decrease) in debt 864 185 529 202 (162) (127) (66) (428) (533) (587) (598)
Gross proceeds from sale of assets
Lump sum contributions
Other dedicated capital funding
T o tal so urces o f capital funding (C ) 887 208 553 227 (137) (100) (38) (399) (503) (557) (567)
A pplicat io ns o f capital funding
C apital Expenditure
- to meet additional demand - to improve the level o f service 443 489 872 575 279 344 437 191 27 - 19 - to replace existing assets 563 355 314 214 220 226 232 238 245 252 259
Increase (decrease) in reserves 335 (169) (121) 118 365 432 248 258 250 259 270 Increase (decrease) of investmentsT o tal applicat io ns o f capital funding
(D ) 1,341 674 1,065 907 864 1,002 917 687 522 511 549
Surplus (def ic it ) o f capital funding (455) (467) (512) (681) (1,001) (1,102) (956) (1,086) (1,026) (1,068) (1,115)
F unding B alance 0 0 0 0 0 0 0 0 0 0 0
SOUTH WAIRARAPA DISTRICT COUNCIL FUNDING IMPACT STATEMENT FOR THE YEARS ENDED 30 JUNE
2015 - 2025 FOR SEWERAGE

SOUTH WAIRARAPA DISTRICT COUNCIL’S LONG TERM PLAN 2015/2025
PART 2: SIGNIFICANT ACTIVITIES 63
STORMWATER DRAINAGE
1. DESCRIPTION
This plan summarises the Council’s strategic and
long-term approach for stormwater where this is
provided and maintained by Council, and also the
requirements where it is provided by others.
Territorial authorities have numerous
responsibilities for public stormwater management.
In the case of stormwater Council has an obligation
to identify where such a service is required and to
either provide it directly or to maintain an overview
where it is provided by others.
Design and operational considerations for the
stormwater system are fundamentally different
from other piped services such as water supply and
waste water. For those services, the peak loading
on the system can be estimated and designed for.
The stormwater system cannot provide protection
against all foreseeable storm events and aims only
to provide a level of protection accepted by the
community as being reasonable.
An overall level of stormwater protection is provided
by a combination of:
A primary stormwater system.
A secondary stormwater system.
The primary stormwater system is the system of
reticulation pipes, culverts, open drains and access
chambers. It is designed to collect stormwater
resulting from moderate rainfall and discharge it
into watercourses. The primary stormwater system
is intended to minimise what is often termed as
nuisance flooding.
The secondary stormwater system generally
comprises overland flow-paths designed to convey
excess floodwater with a minimum of damage when
the primary stormwater system is unable to cope.
Roads are often used as secondary flow-paths.
Many of the urban areas are not provided with
secondary stormwater flow-paths. The provision of
secondary stormwater flow-paths is a relatively
recent practice in New Zealand. Secondary flow-
paths are generally provided at the time of
subdivision as the subsequent provision of
secondary stormwater flow-paths is usually
technically difficult and expensive.
Details of stormwater assets are available in
stormwater management plans for the three towns.
Council aims over the long-term to provide
protection of properties in all urban areas and to
ensure stormwater is contained in channels, pipes
and structures to direct the flow in a controlled
manner across Council owned/vested land to a
waterway or other suitable discharge points.
Council’s policy is that unused storm water from the
roof of all buildings is disposed of onsite through
appropriate means.
2. COMMUNITY OUTCOMES TO WHICH
THE ACTIVITY CONTRIBUTES
The community outcomes to which stormwater
activity primarily contributes are described in the
table below.
COMMUNITY OUTCOMES TO WHICH THE ACTIVITY
CONTRIBUTES
COMMUNITY OUTCOMES HOW THE STORMWATER ACTIVITY
CONTRIBUTES
Vibrant and strong communities
By ensuring that people feel safe and are proud to live in
Sustainable South
Wairarapa
By ensuring that the stormwater
systems, whether Council’s or private, operate as efficiently as possible
3. THE ACTIVITY GOAL AND PRINCIPAL
OBJECTIVES
The stormwater activity goal is:
a) To provide and maintain waterways to collect
and dispose of excess surface water to protect
amenities, reduce flooding, avoid erosion and
establish a safe environment.
The Council’s principal objectives are to:
a) Achieve defined standards of customer service.
b) Protect the health and safety of the community.
c) Minimise adverse effects on the environment.
d) Comply with legal requirements.
e) Achieve defined technical standards.
f) Implement policies of the Council.
g) Promote development throughout the district.
h) Achieve defined standards of system
management.
4. ASSETS WE LOOK AFTER
This activity owns and maintains all pipes and pits
that collect and discharge storm water in the
district.
The Moroa water race system also forms part of the
Greytown stormwater drainage system.
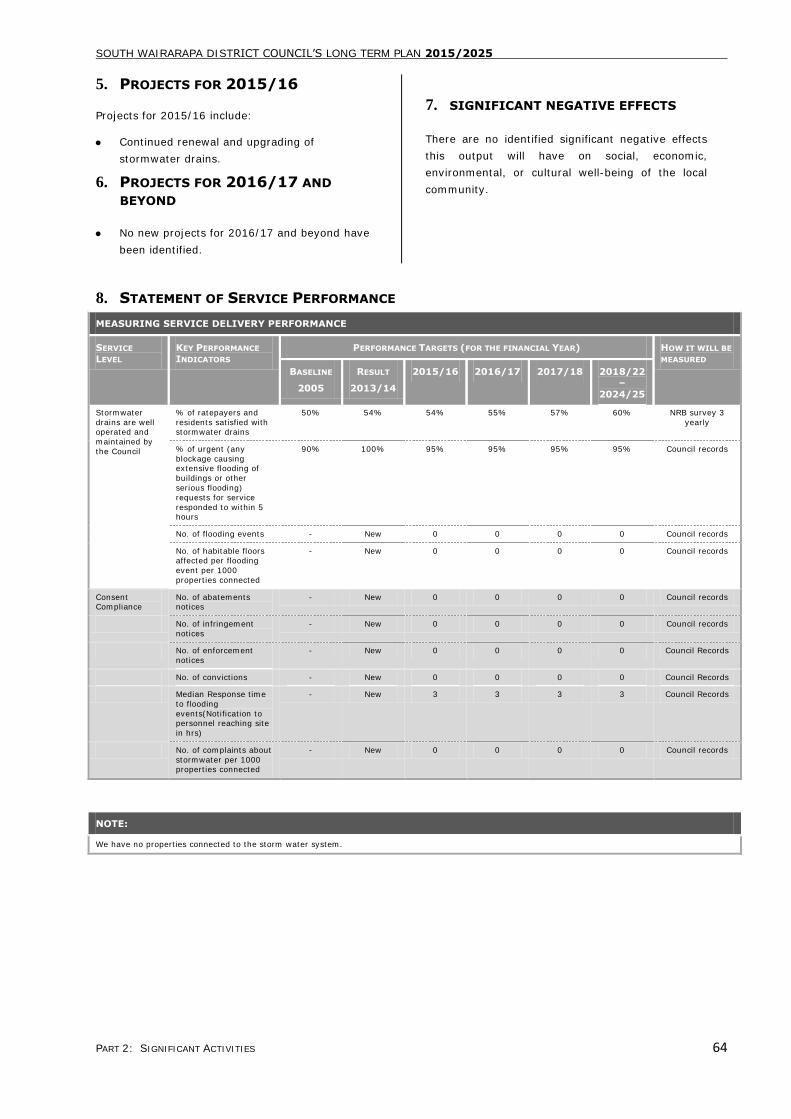
SOUTH WAIRARAPA DISTRICT COUNCIL’S LONG TERM PLAN 2015/2025
PART 2: SIGNIFICANT ACTIVITIES 64
5. PROJECTS FOR 2015/16
Projects for 2015/16 include:
Continued renewal and upgrading of
stormwater drains.
6. PROJECTS FOR 2016/17 AND
BEYOND
No new projects for 2016/17 and beyond have
been identified.
7. SIGNIFICANT NEGATIVE EFFECTS
There are no identified significant negative effects
this output will have on social, economic,
environmental, or cultural well-being of the local
community.
8. STATEMENT OF SERVICE PERFORMANCE
MEASURING SERVICE DELIVERY PERFORMANCE
SERVICE
LEVEL
KEY PERFORMANCE
INDICATORS
PERFORMANCE TARGETS (FOR THE FINANCIAL YEAR) HOW IT WILL BE
MEASURED
BASELINE
2005
RESULT
2013/14
2015/16 2016/17 2017/18 2018/22
–
2024/25
Stormwater
drains are well operated and
maintained by
the Council
% of ratepayers and
residents satisfied with stormwater drains
50% 54% 54% 55% 57% 60% NRB survey 3
yearly
% of urgent (any
blockage causing extensive flooding of
buildings or other
serious flooding)
requests for service
responded to within 5 hours
90%
100% 95%
95%
95%
95%
Council records
No. of flooding events - New 0 0 0 0 Council records
No. of habitable floors affected per flooding
event per 1000
properties connected
- New 0 0 0 0 Council records
Consent Compliance
No. of abatements notices
- New 0 0 0 0 Council records
No. of infringement
notices
- New 0 0 0 0 Council records
No. of enforcement
notices
- New 0 0 0 0 Council Records
No. of convictions - New 0 0 0 0 Council Records
Median Response time
to flooding
events(Notification to personnel reaching site
in hrs)
- New 3 3 3 3 Council Records
No. of complaints about
stormwater per 1000 properties connected
- New 0 0 0 0 Council records
NOTE:
We have no properties connected to the storm water system.
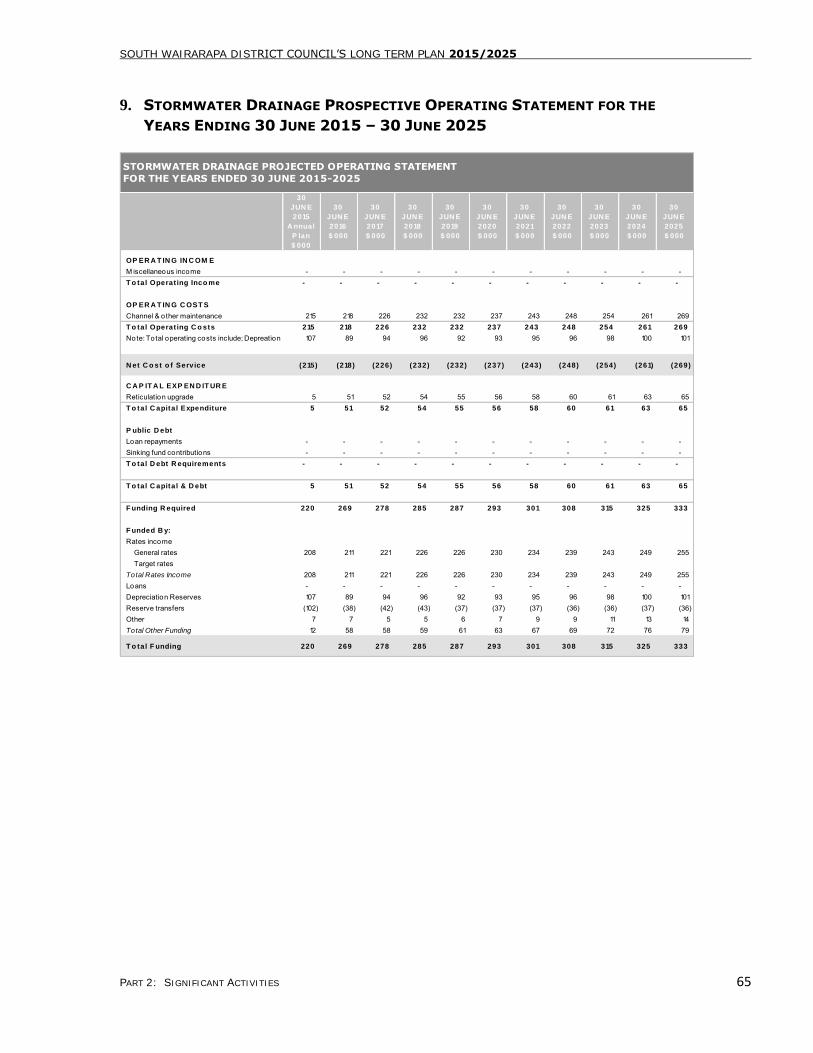
SOUTH WAIRARAPA DISTRICT COUNCIL’S LONG TERM PLAN 2015/2025
PART 2: SIGNIFICANT ACTIVITIES 65
9. STORMWATER DRAINAGE PROSPECTIVE OPERATING STATEMENT FOR THE
YEARS ENDING 30 JUNE 2015 – 30 JUNE 2025
30
JUN E
2015
A nnual
P lan
$ 000
30
JUN E
2016
$ 000
30
JUN E
2017
$ 000
30
JUN E
2018
$ 000
30
JUN E
2019
$ 000
30
JUN E
2020
$ 000
30
JUN E
2021
$ 000
30
JUN E
2022
$ 000
30
JUN E
2023
$ 000
30
JUN E
2024
$ 000
30
JUN E
2025
$ 000
OP ER A T IN G IN C OM E
M iscellaneous income - - - - - - - - - - - T o tal Operat ing Inco me - - - - - - - - - - -
OP ER A T IN G C OST S
Channel & other maintenance 215 218 226 232 232 237 243 248 254 261 269 T o tal Operat ing C o sts 215 218 226 232 232 237 243 248 254 261 269
Note: Total operating costs include; Depreation 107 89 94 96 92 93 95 96 98 100 101
N et C o st o f Service (215) (218) (226) (232) (232) (237) (243) (248) (254) (261) (269)
C A P IT A L EXP EN D IT UR E
Reticulation upgrade 5 51 52 54 55 56 58 60 61 63 65 T o tal C apital Expenditure 5 51 52 54 55 56 58 60 61 63 65
P ublic D ebt
Loan repayments - - - - - - - - - - - Sinking fund contributions - - - - - - - - - - - T o tal D ebt R equirements - - - - - - - - - - -
T o tal C apital & D ebt 5 51 52 54 55 56 58 60 61 63 65
F unding R equired 220 269 278 285 287 293 301 308 315 325 333
F unded B y:
Rates income General rates 208 211 221 226 226 230 234 239 243 249 255 Target ratesTotal Rates Income 208 211 221 226 226 230 234 239 243 249 255 Loans - - - - - - - - - - - Depreciation Reserves 107 89 94 96 92 93 95 96 98 100 101 Reserve transfers (102) (38) (42) (43) (37) (37) (37) (36) (36) (37) (36) Other 7 7 5 5 6 7 9 9 11 13 14 Total Other Funding 12 58 58 59 61 63 67 69 72 76 79
T o tal F unding 220 269 278 285 287 293 301 308 315 325 333
STORMWATER DRAINAGE PROJECTED OPERATING STATEMENT
FOR THE YEARS ENDED 30 JUNE 2015-2025
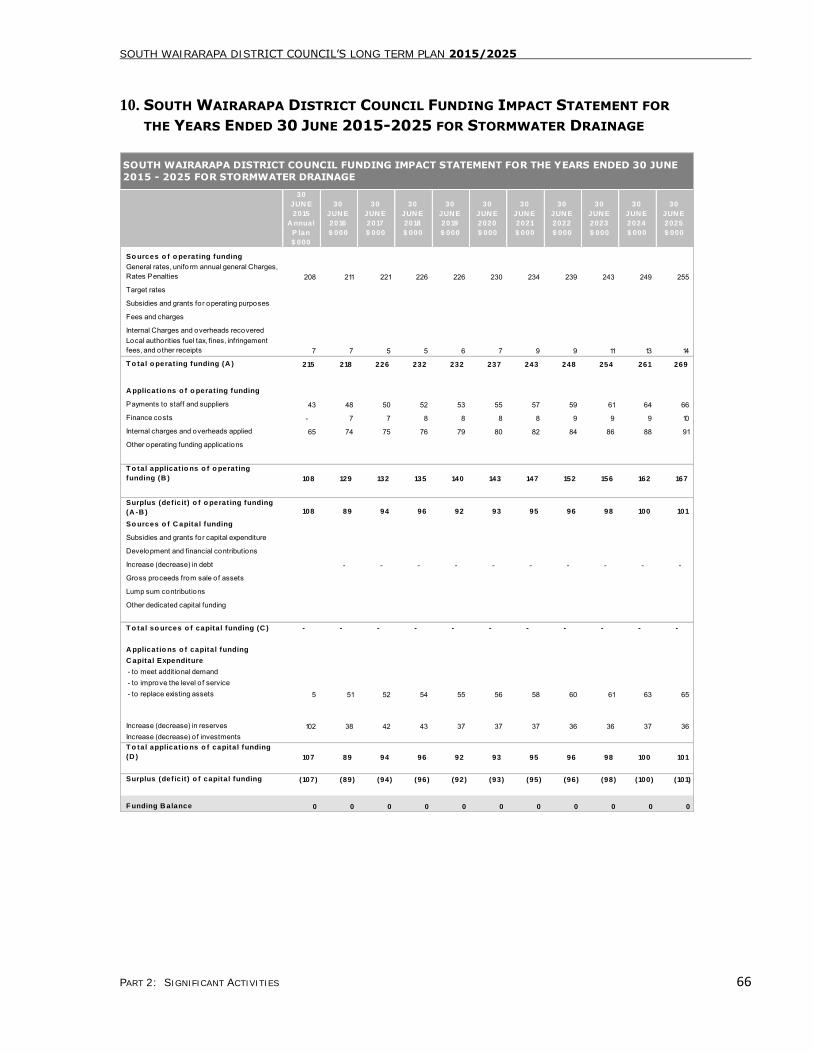
SOUTH WAIRARAPA DISTRICT COUNCIL’S LONG TERM PLAN 2015/2025
PART 2: SIGNIFICANT ACTIVITIES 66
10. SOUTH WAIRARAPA DISTRICT COUNCIL FUNDING IMPACT STATEMENT FOR
THE YEARS ENDED 30 JUNE 2015-2025 FOR STORMWATER DRAINAGE
30
JUN E
2015
A nnual
P lan
$ 000
30
JUN E
2016
$ 000
30
JUN E
2017
$ 000
30
JUN E
2018
$ 000
30
JUN E
2019
$ 000
30
JUN E
2020
$ 000
30
JUN E
2021
$ 000
30
JUN E
2022
$ 000
30
JUN E
2023
$ 000
30
JUN E
2024
$ 000
30
JUN E
2025
$ 000
So urces o f o perat ing funding
General rates, uniform annual general Charges, Rates Penalties 208 211 221 226 226 230 234 239 243 249 255
Target rates
Subsidies and grants for operating purposes
Fees and charges
Internal Charges and overheads recoveredLocal authorities fuel tax, fines, infringement fees, and other receipts 7 7 5 5 6 7 9 9 11 13 14
T o tal o perat ing funding (A ) 215 218 226 232 232 237 243 248 254 261 269
A pplicat io ns o f o perat ing funding
Payments to staff and suppliers 43 48 50 52 53 55 57 59 61 64 66
Finance costs - 7 7 8 8 8 8 9 9 9 10
Internal charges and overheads applied 65 74 75 76 79 80 82 84 86 88 91
Other operating funding applications
T o tal applicat io ns o f o perat ing
funding (B ) 108 129 132 135 140 143 147 152 156 162 167
Surplus (def ic it ) o f o perat ing funding
(A -B ) 108 89 94 96 92 93 95 96 98 100 101
So urces o f C apital funding
Subsidies and grants for capital expenditure
Development and financial contributions
Increase (decrease) in debt - - - - - - - - - -
Gross proceeds from sale of assets
Lump sum contributions
Other dedicated capital funding
T o tal so urces o f capital funding (C ) - - - - - - - - - - -
A pplicat io ns o f capital funding
C apital Expenditure
- to meet additional demand - to improve the level o f service - to replace existing assets 5 51 52 54 55 56 58 60 61 63 65
Increase (decrease) in reserves 102 38 42 43 37 37 37 36 36 37 36 Increase (decrease) of investmentsT o tal applicat io ns o f capital funding
(D ) 107 89 94 96 92 93 95 96 98 100 101
Surplus (def ic it ) o f capital funding (107) (89) (94) (96) (92) (93) (95) (96) (98) (100) (101)
F unding B alance 0 0 0 0 0 0 0 0 0 0 0
SOUTH WAIRARAPA DISTRICT COUNCIL FUNDING IMPACT STATEMENT FOR THE YEARS ENDED 30 JUNE
2015 - 2025 FOR STORMWATER DRAINAGE
SOUTH WAIRARAPA
DISTRICT COUNCIL
Part 3Financial Information
Financial Assumptions
Statement of Accounting Policies
Prospective Financial Statements and Reconciliations
Schedule of Prospective Capital Expenditure
Prospective Statement of Special and Separate Funds
Funding Impact Statement
Reconciliation of Funding Impact Statement to Financial Statements
Reconciliation of Significant Activity Statements to Income Statements
Total Income From Rates
Rates and Charges
Rating Examples

SOUTH WAIRARAPA DISTRICT COUNCIL‟S LONG TERM PLAN 2015/2025
PART 3: FINANCIAL INFORMATION 67
FINANCIAL INFORMATION
FINANCIAL ASSUMPTIONS
1. GENERAL FORECASTING
ASSUMPTIONS
Preamble
This LTP, along with all forward planning
documents, are subject to the risks associated with
making assumptions about the future.
Council has taken care to ensure the forecasts are
as accurate as possible; the significant forecasting
assumptions are discussed below.
In light of the above observations, actual results
may vary from that forecast.
Users should note that the information contained in
this LTP may not be suitable for other purposes.
Governance
There has been a significant amount of discussion
recently on governance in the local authority sector.
There have not been any concrete proposals tabled
from which we can gain an understanding of the
likely shape of local government in the future.
As such we cannot quantify the risk or ascertain any
options.
The assumption in this LTP is therefore that the
status quo will remain for the term of the LTP.
Levels of Service
Unless otherwise stated in the individual activity
sections, services are generally assumed to remain
the same.
Any changes to the services other than those
forecast in the draft LTP will change costs.
Customer expectations regarding levels of service
may change.
Most communities have already defined the levels
of service they expect and what they are prepared
to pay for that level of service. Whilst customers
may wish for a higher level of service, most are
hesitant at paying for this increase.
Population Growth
The latest census was held during 2013, which
identified a population of 9,582. Statistics New
Zealand have estimated the population increasing
to 10,250 in 2043.
The assumption used in this LTP is that population
will remain static over the ten-year period.
POPULATION GROWTH
RISK LEVEL OF
UNCERTAINTY
REASONS AND FINANCIAL
EFFECT OF UNCERTAINTY
Growth does not meet the
assumption
Medium The population growth assumption is based on the
medium statistical growth
predictions.
If the changes are less than
predicted then some projects
will not go ahead and
expenditure will be lower than forecast. If population
growth is higher than
predicted, then some
projects will go ahead earlier
than forecast, and expenditure will be higher
than forecast.
The current infrastructure is
forecast to be able to meet the projected growth.
Number of Rateable Properties
Growth
The number of rateable properties is assumed to be
6,685 by 2025; this is a growth of 2.3% from the
2015 year (6,535).
Forecast rating units by year.
2016 2017 2018 2019 2020
6550 6565 6580 6595 6610
2021 2022 2023 2024 2025
6625 6640 6655 6670 6685
RATEABLE PROPERTIES
RISK LEVEL OF
UNCERTAINTY
REASONS AND FINANCIAL
EFFECT OF UNCERTAINTY
Growth does not
meet assumption
Medium The growth has been based
on figures from 2014 and
takes into account ongoing development in the district.
Should such growth not
continue then some projects
will not go ahead and expenditure will be lower
than forecast. If the growth
is greater than predicted,
then some projects will go ahead earlier than forecast,
and expenditure will be
higher than forecast.
New Zealand Transport Agency
Subsidies from New Zealand Transport Agency have
been included at the approved rate for the 2015/16
year. NZTA has confirmed that the new rate for
SOUTH WAIRARAPA DISTRICT COUNCIL‟S LONG TERM PLAN 2015/2025
PART 3: FINANCIAL INFORMATION 68
other roads will be 52% from 2016 and 100% for
the Special Purpose Roads until 2020 then it drops
5% that year and every year after until it gets to
52%.
NZ TRANSPORT AGENCY
RISK LEVEL OF
UNCERTAINTY
REASONS AND FINANCIAL
EFFECT OF UNCERTAINTY
Changes in subsidy
rate and variation in criteria for
inclusion in
subsidised works
programmes.
Low The government has increased petrol tax to
provide additional funding
for roading and this
commitment is unlikely to
change.
Water Metering
Charging for water use through universal metering
of the district‟s urban water supply is in place.
Water allowances per property will be 350m3 but
may be subject to review if the need arises. Prices
for water used in excess of the allowance will be
charged per cubic metre at a rate of $1.84.
There are a number of external factors that impact
delivery of water services, particularly in changes of
legislation. Changes of this nature are usually
flagged well in advance and are able to be
incorporated in planning documents.
WATER METERING
RISK LEVEL OF
UNCERTAINTY
REASONS AND FINANCIAL
EFFECT OF UNCERTAINTY
Water meters do not generate the
level of revenue
anticipated.
Low As the overall fixed charge for water is high, the impact
of water by meter revenue
being low will not have a material impact on water
supply
Legislative changes are hard
to predict, however the length of time prior to
enacting legislation allows
organization to plan
adequately.
External Factors
There will be no unexpected
changes to legislation or
other external factors that alter the nature of services
provided by Council.
Most changes to legislation
are phased and known about
in advance. Only in extraordinary circumstances
would unexpected changes
to legislation be made.
2. FINANCIAL FORECASTING
ASSUMPTIONS
Revaluation of Non-Current Assets
Revaluation assumptions have been included in the
Plan. These have been done following the Business
& Economic Research Limited (BERL) forecasts of
price level change adjusters.
Revaluation movements will be shown in the
statement of financial position. Revaluations are
carried out at three-year intervals.
REVALUATION OF NON-CURRENT ASSETS
RISK LEVEL OF
UNCERTAINTY
REASONS AND FINANCIAL
EFFECT OF UNCERTAINTY
Actual revaluation results differ from
those in the
forecast.
Medium
Where the actual inflation rate is different from that
forecast, the actual
revaluation will be different
from that forecast.
The LTP for each subsequent
year is reviewed by way of
the Annual Plan round and a
new LTP is produced every three years.
Interest Rates
The range of interest rates on term debt is
calculated at 6.09% to 6.77%. To allow for
anticipated timing of capital expenditure, on
selected loans interest expenditure is provided for
on only 50% of forecast new loan amounts each
year.
The range of interest rates on investments is
calculated at 3.6% to 4.6%.
INTEREST RATES
RISK LEVEL OF
UNCERTAINTY
REASONS AND FINANCIAL
EFFECT OF UNCERTAINTY
That the interest
rate will differ from those used in the
calculations.
Medium
This will be managed
through the Liability Management Policy and
Investment Policy. The
financial impact is not able
to be measured.
A 1% movement in interest rates (on a $1M loan)
increases/decreases total
loan repayments by $8,411.
On the total forecast portfolio of $15M, this would
result in an increase /
decrease of $125,000.
Council would have the option of mitigating this
impact by altering the term
of the loans
Depreciation
Over the term of the LTP, Council has elected to
fully fund depreciation on all assets with the
exception of land transport (where approximately
50% of depreciation is funded) and specific
amenities which Council has identified would not be
replaced or replacement would be funded by rates
and insurance (includes playgrounds, swimming
pools, pensioner housing, Ngawi Hall,
Martinborough Town Hall, ANZAC/Kiwi Hall and
Greytown Town Centre) at the time required.
SOUTH WAIRARAPA DISTRICT COUNCIL‟S LONG TERM PLAN 2015/2025
PART 3: FINANCIAL INFORMATION 69
Depreciation has been calculated on asset values at
their latest revaluation date, and on additions at
cost afterwards.
It is assumed that:
Existing depreciation will continue.
Replacement assets (renewals) affect
depreciation as follows.
Asset renewal will equal that of the assets
being replaced.
New assets‟ depreciation will be the result of
their estimated lives and values.
Depreciation on new and renewal
programmes will impact in the year following
the capital programme.
DEPRECIATION
RISK LEVEL OF
UNCERTAINTY
REASONS AND FINANCIAL
EFFECT OF UNCERTAINTY
That more detailed
analysis of planned capital works once
complete may alter
the depreciation
expense.
That asset lives
may alter due to
new technology
improving asset
lives.
Low Council has asset
management planning and upgrade programmes in
place. Asset capacity and
condition is monitored with
replacement works being planned in accordance with
standard asset management
and professional practices.
Depreciation is calculated in
accordance with normal accounting and asset
management practices.
Asset Lives
Useful lives of assets are based on professional
advice. These are summarised in the depreciation
note within the accounting policies.
ASSET LIVES
RISK LEVEL OF
UNCERTAINTY
REASONS AND FINANCIAL
EFFECT OF UNCERTAINTY
That assets wear
out earlier than estimated.
Low Asset life is based on
estimates of engineers, valuers and asset managers.
Capital projects can be
brought forward in event of
early expiration of assets (this would affect
depreciation and interest of
which the amounts are
unknown).
Asset Condition
Activity and asset management plans have been
prepared for all major activities, and include
renewal and capital programmes for all major
infrastructural assets. These plans include
assessments of asset condition, lifecycle and
demand management. This planning information is
considered by Council to be reasonable and
supportable. There are no substantial asset
disposals or acquisitions that will impact
significantly on the plan.
FUTURE REPLACEMENT OF ASSETS FUNDS
RISK LEVEL OF
UNCERTAINTY
REASONS AND FINANCIAL
EFFECT OF UNCERTAINTY
Asset Management Plans are
incomplete.
Condition ratings and life cycle
demand
assumptions are
erroneous.
Low to Moderate
Asset management plans are updated annually following
„best practice‟ as prescribed
by the New Zealand Infrastructure Asset
Management Manual.
For instance, for roading
asset inventories and condition ratings are stored
and maintained in the RAMM
database and in the AMP.
The new AMP was audited by NZTA in 2014/15 and found
to be adequately
maintained.
Sources of Funds for Future
Replacement of Assets
This is detailed in the Council Activities Section
(Part 2) under each significant activity.
Sources of funding are also included in the Revenue
and Financing Policy.
The funding of the replacement of future assets is
based on the following assumptions:
The funding for the replacement of any individual
asset will be funded from the following sources in
the following order of priority:
From prior year credit depreciation reserve
balances.
From the current years cash arising from the
funding of depreciation.
Loan funding.
Special funds set aside for specific purposes
identified by Council.
FUTURE REPLACEMENT OF ASSETS FUNDS
RISK LEVEL OF
UNCERTAINTY
REASONS AND FINANCIAL
EFFECT OF UNCERTAINTY
That a particular
funding source is
unavailable.
Low As the Council operates a
central treasury function,
should one source of funding be unavailable for asset
replacement, a further
option would be available.
Inflation
Operating Revenues and Expenses
2015/16 revenues and expenses have been
predicted. Beyond this, inflation has been included
in the Plan. Inflation has been predicted using the
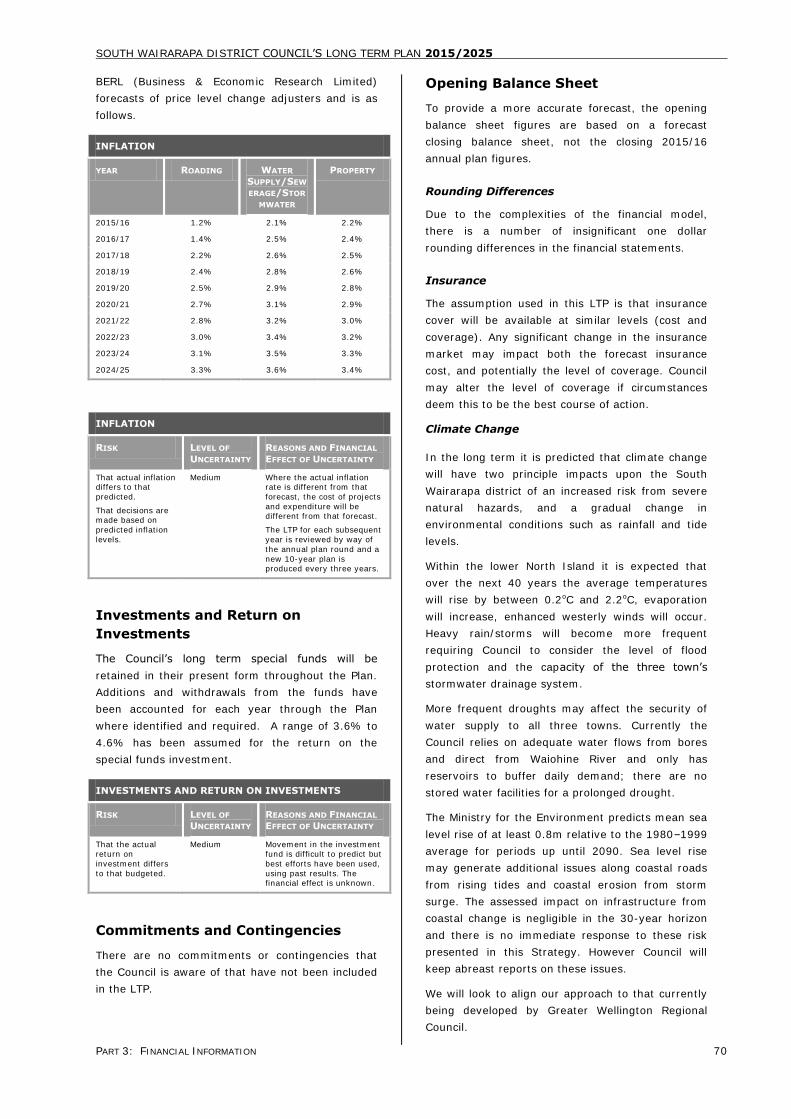
SOUTH WAIRARAPA DISTRICT COUNCIL‟S LONG TERM PLAN 2015/2025
PART 3: FINANCIAL INFORMATION 70
BERL (Business & Economic Research Limited)
forecasts of price level change adjusters and is as
follows.
INFLATION
YEAR ROADING WATER
SUPPLY/SEW
ERAGE/STOR
MWATER
PROPERTY
2015/16 1.2% 2.1% 2.2%
2016/17 1.4% 2.5% 2.4%
2017/18 2.2% 2.6% 2.5%
2018/19 2.4% 2.8% 2.6%
2019/20 2.5% 2.9% 2.8%
2020/21 2.7% 3.1% 2.9%
2021/22 2.8% 3.2% 3.0%
2022/23 3.0% 3.4% 3.2%
2023/24 3.1% 3.5% 3.3%
2024/25 3.3% 3.6% 3.4%
INFLATION
RISK LEVEL OF
UNCERTAINTY
REASONS AND FINANCIAL
EFFECT OF UNCERTAINTY
That actual inflation differs to that
predicted.
That decisions are made based on
predicted inflation
levels.
Medium Where the actual inflation rate is different from that
forecast, the cost of projects
and expenditure will be different from that forecast.
The LTP for each subsequent
year is reviewed by way of
the annual plan round and a
new 10-year plan is produced every three years.
Investments and Return on
Investments
The Council‟s long term special funds will be
retained in their present form throughout the Plan.
Additions and withdrawals from the funds have
been accounted for each year through the Plan
where identified and required. A range of 3.6% to
4.6% has been assumed for the return on the
special funds investment.
INVESTMENTS AND RETURN ON INVESTMENTS
RISK LEVEL OF
UNCERTAINTY
REASONS AND FINANCIAL
EFFECT OF UNCERTAINTY
That the actual return on
investment differs
to that budgeted.
Medium Movement in the investment fund is difficult to predict but
best efforts have been used,
using past results. The financial effect is unknown.
Commitments and Contingencies
There are no commitments or contingencies that
the Council is aware of that have not been included
in the LTP.
Opening Balance Sheet
To provide a more accurate forecast, the opening
balance sheet figures are based on a forecast
closing balance sheet, not the closing 2015/16
annual plan figures.
Rounding Differences
Due to the complexities of the financial model,
there is a number of insignificant one dollar
rounding differences in the financial statements.
Insurance
The assumption used in this LTP is that insurance
cover will be available at similar levels (cost and
coverage). Any significant change in the insurance
market may impact both the forecast insurance
cost, and potentially the level of coverage. Council
may alter the level of coverage if circumstances
deem this to be the best course of action.
Climate Change
In the long term it is predicted that climate change
will have two principle impacts upon the South
Wairarapa district of an increased risk from severe
natural hazards, and a gradual change in
environmental conditions such as rainfall and tide
levels.
Within the lower North Island it is expected that
over the next 40 years the average temperatures
will rise by between 0.2oC and 2.2oC, evaporation
will increase, enhanced westerly winds will occur.
Heavy rain/storms will become more frequent
requiring Council to consider the level of flood
protection and the capacity of the three town‟s
stormwater drainage system.
More frequent droughts may affect the security of
water supply to all three towns. Currently the
Council relies on adequate water flows from bores
and direct from Waiohine River and only has
reservoirs to buffer daily demand; there are no
stored water facilities for a prolonged drought.
The Ministry for the Environment predicts mean sea
level rise of at least 0.8m relative to the 1980–1999
average for periods up until 2090. Sea level rise
may generate additional issues along coastal roads
from rising tides and coastal erosion from storm
surge. The assessed impact on infrastructure from
coastal change is negligible in the 30-year horizon
and there is no immediate response to these risk
presented in this Strategy. However Council will
keep abreast reports on these issues.
We will look to align our approach to that currently
being developed by Greater Wellington Regional
Council.

SOUTH WAIRARAPA DISTRICT COUNCIL‟S LONG TERM PLAN 2015/2025
PART 3: FINANCIAL INFORMATION 71
Martinborough Town Hall
The Council assumes that the all of the external
funding for the Martinborough Town Hall will be
received.
Maintenance, Renewal and Capital Program
The maintenance, renewal and capital expenditure
program for Councils core assets is based on the
information in Council‟s asset/activity management
plans. This information is the best information
available to Council about these assets. For some
assets, (e.g. underground pipes) the information
around age, type and quality in reliable, however, it
is acknowledged that information around condition
has some limitations, Where these limitations exist,
the information will be reviewed as new information
becomes available updated information could result
in changes to the costs of timing of planned
expenditure.
Wairarapa Unitary Authority
The Council assumes that South Wairarapa District
Council will continue to operate as a sole district
council for the foreseeable future.
Authorisation for Issue
The Council is responsible for the prospective
financial statements, underlying assumptions and
other related disclosures.
This document was authorised by Council on
Wednesday 24 June 2015.
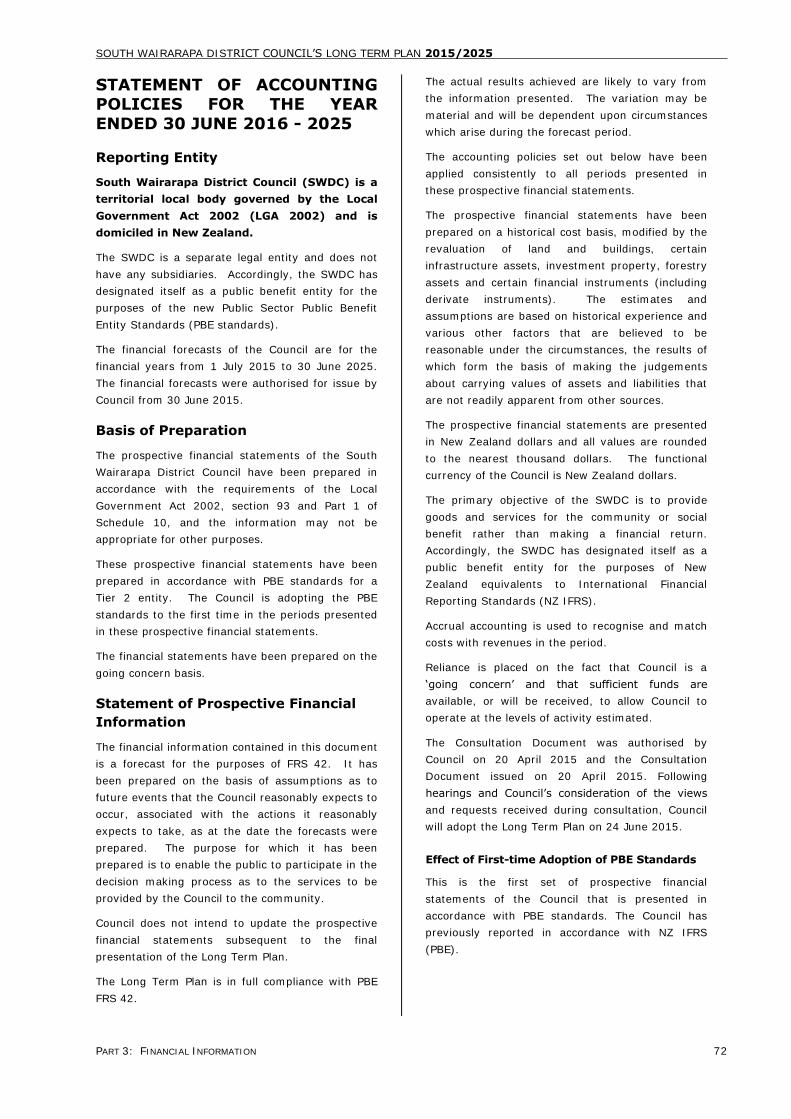
SOUTH WAIRARAPA DISTRICT COUNCIL‟S LONG TERM PLAN 2015/2025
PART 3: FINANCIAL INFORMATION 72
STATEMENT OF ACCOUNTING POLICIES FOR THE YEAR
ENDED 30 JUNE 2016 - 2025
Reporting Entity
South Wairarapa District Council (SWDC) is a
territorial local body governed by the Local
Government Act 2002 (LGA 2002) and is
domiciled in New Zealand.
The SWDC is a separate legal entity and does not
have any subsidiaries. Accordingly, the SWDC has
designated itself as a public benefit entity for the
purposes of the new Public Sector Public Benefit
Entity Standards (PBE standards).
The financial forecasts of the Council are for the
financial years from 1 July 2015 to 30 June 2025.
The financial forecasts were authorised for issue by
Council from 30 June 2015.
Basis of Preparation
The prospective financial statements of the South
Wairarapa District Council have been prepared in
accordance with the requirements of the Local
Government Act 2002, section 93 and Part 1 of
Schedule 10, and the information may not be
appropriate for other purposes.
These prospective financial statements have been
prepared in accordance with PBE standards for a
Tier 2 entity. The Council is adopting the PBE
standards to the first time in the periods presented
in these prospective financial statements.
The financial statements have been prepared on the
going concern basis.
Statement of Prospective Financial
Information
The financial information contained in this document
is a forecast for the purposes of FRS 42. It has
been prepared on the basis of assumptions as to
future events that the Council reasonably expects to
occur, associated with the actions it reasonably
expects to take, as at the date the forecasts were
prepared. The purpose for which it has been
prepared is to enable the public to participate in the
decision making process as to the services to be
provided by the Council to the community.
Council does not intend to update the prospective
financial statements subsequent to the final
presentation of the Long Term Plan.
The Long Term Plan is in full compliance with PBE
FRS 42.
The actual results achieved are likely to vary from
the information presented. The variation may be
material and will be dependent upon circumstances
which arise during the forecast period.
The accounting policies set out below have been
applied consistently to all periods presented in
these prospective financial statements.
The prospective financial statements have been
prepared on a historical cost basis, modified by the
revaluation of land and buildings, certain
infrastructure assets, investment property, forestry
assets and certain financial instruments (including
derivate instruments). The estimates and
assumptions are based on historical experience and
various other factors that are believed to be
reasonable under the circumstances, the results of
which form the basis of making the judgements
about carrying values of assets and liabilities that
are not readily apparent from other sources.
The prospective financial statements are presented
in New Zealand dollars and all values are rounded
to the nearest thousand dollars. The functional
currency of the Council is New Zealand dollars.
The primary objective of the SWDC is to provide
goods and services for the community or social
benefit rather than making a financial return.
Accordingly, the SWDC has designated itself as a
public benefit entity for the purposes of New
Zealand equivalents to International Financial
Reporting Standards (NZ IFRS).
Accrual accounting is used to recognise and match
costs with revenues in the period.
Reliance is placed on the fact that Council is a
„going concern‟ and that sufficient funds are
available, or will be received, to allow Council to
operate at the levels of activity estimated.
The Consultation Document was authorised by
Council on 20 April 2015 and the Consultation
Document issued on 20 April 2015. Following
hearings and Council‟s consideration of the views
and requests received during consultation, Council
will adopt the Long Term Plan on 24 June 2015.
Effect of First-time Adoption of PBE Standards
This is the first set of prospective financial
statements of the Council that is presented in
accordance with PBE standards. The Council has
previously reported in accordance with NZ IFRS
(PBE).
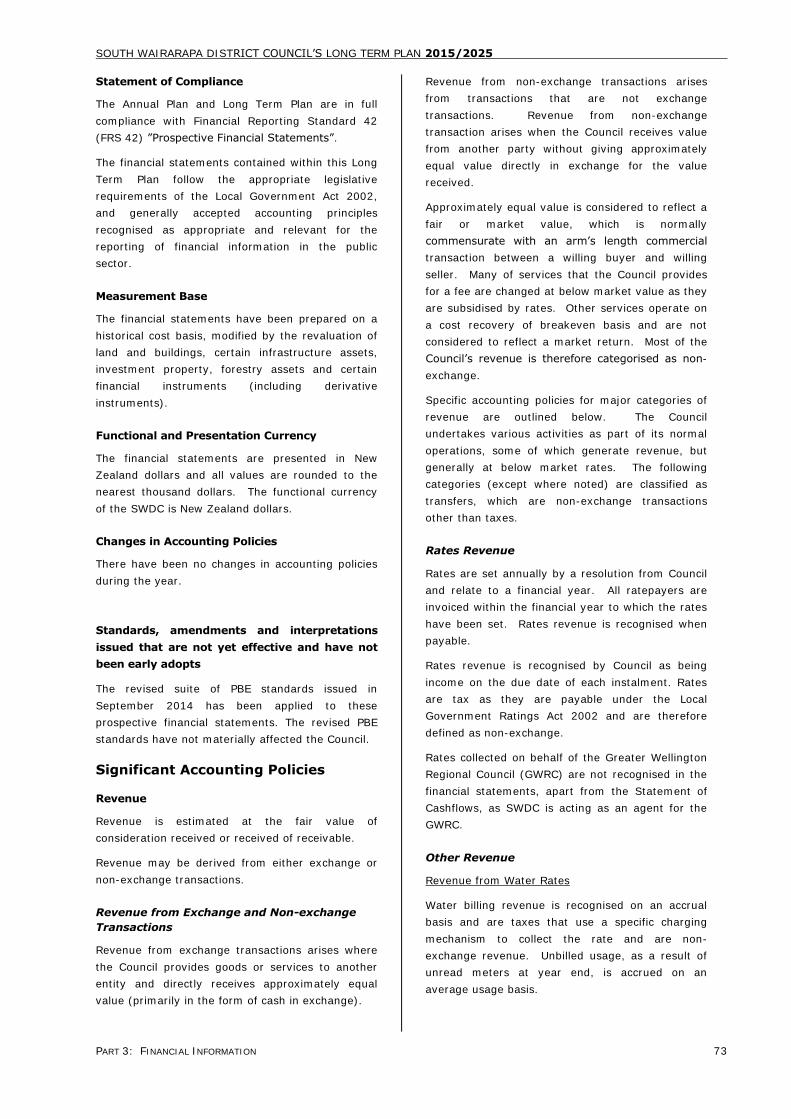
SOUTH WAIRARAPA DISTRICT COUNCIL‟S LONG TERM PLAN 2015/2025
PART 3: FINANCIAL INFORMATION 73
Statement of Compliance
The Annual Plan and Long Term Plan are in full
compliance with Financial Reporting Standard 42
(FRS 42) ”Prospective Financial Statements”.
The financial statements contained within this Long
Term Plan follow the appropriate legislative
requirements of the Local Government Act 2002,
and generally accepted accounting principles
recognised as appropriate and relevant for the
reporting of financial information in the public
sector.
Measurement Base
The financial statements have been prepared on a
historical cost basis, modified by the revaluation of
land and buildings, certain infrastructure assets,
investment property, forestry assets and certain
financial instruments (including derivative
instruments).
Functional and Presentation Currency
The financial statements are presented in New
Zealand dollars and all values are rounded to the
nearest thousand dollars. The functional currency
of the SWDC is New Zealand dollars.
Changes in Accounting Policies
There have been no changes in accounting policies
during the year.
Standards, amendments and interpretations
issued that are not yet effective and have not
been early adopts
The revised suite of PBE standards issued in
September 2014 has been applied to these
prospective financial statements. The revised PBE
standards have not materially affected the Council.
Significant Accounting Policies
Revenue
Revenue is estimated at the fair value of
consideration received or received of receivable.
Revenue may be derived from either exchange or
non-exchange transactions.
Revenue from Exchange and Non-exchange
Transactions
Revenue from exchange transactions arises where
the Council provides goods or services to another
entity and directly receives approximately equal
value (primarily in the form of cash in exchange).
Revenue from non-exchange transactions arises
from transactions that are not exchange
transactions. Revenue from non-exchange
transaction arises when the Council receives value
from another party without giving approximately
equal value directly in exchange for the value
received.
Approximately equal value is considered to reflect a
fair or market value, which is normally
commensurate with an arm‟s length commercial
transaction between a willing buyer and willing
seller. Many of services that the Council provides
for a fee are changed at below market value as they
are subsidised by rates. Other services operate on
a cost recovery of breakeven basis and are not
considered to reflect a market return. Most of the
Council‟s revenue is therefore categorised as non-
exchange.
Specific accounting policies for major categories of
revenue are outlined below. The Council
undertakes various activities as part of its normal
operations, some of which generate revenue, but
generally at below market rates. The following
categories (except where noted) are classified as
transfers, which are non-exchange transactions
other than taxes.
Rates Revenue
Rates are set annually by a resolution from Council
and relate to a financial year. All ratepayers are
invoiced within the financial year to which the rates
have been set. Rates revenue is recognised when
payable.
Rates revenue is recognised by Council as being
income on the due date of each instalment. Rates
are tax as they are payable under the Local
Government Ratings Act 2002 and are therefore
defined as non-exchange.
Rates collected on behalf of the Greater Wellington
Regional Council (GWRC) are not recognised in the
financial statements, apart from the Statement of
Cashflows, as SWDC is acting as an agent for the
GWRC.
Other Revenue
Revenue from Water Rates
Water billing revenue is recognised on an accrual
basis and are taxes that use a specific charging
mechanism to collect the rate and are non-
exchange revenue. Unbilled usage, as a result of
unread meters at year end, is accrued on an
average usage basis.
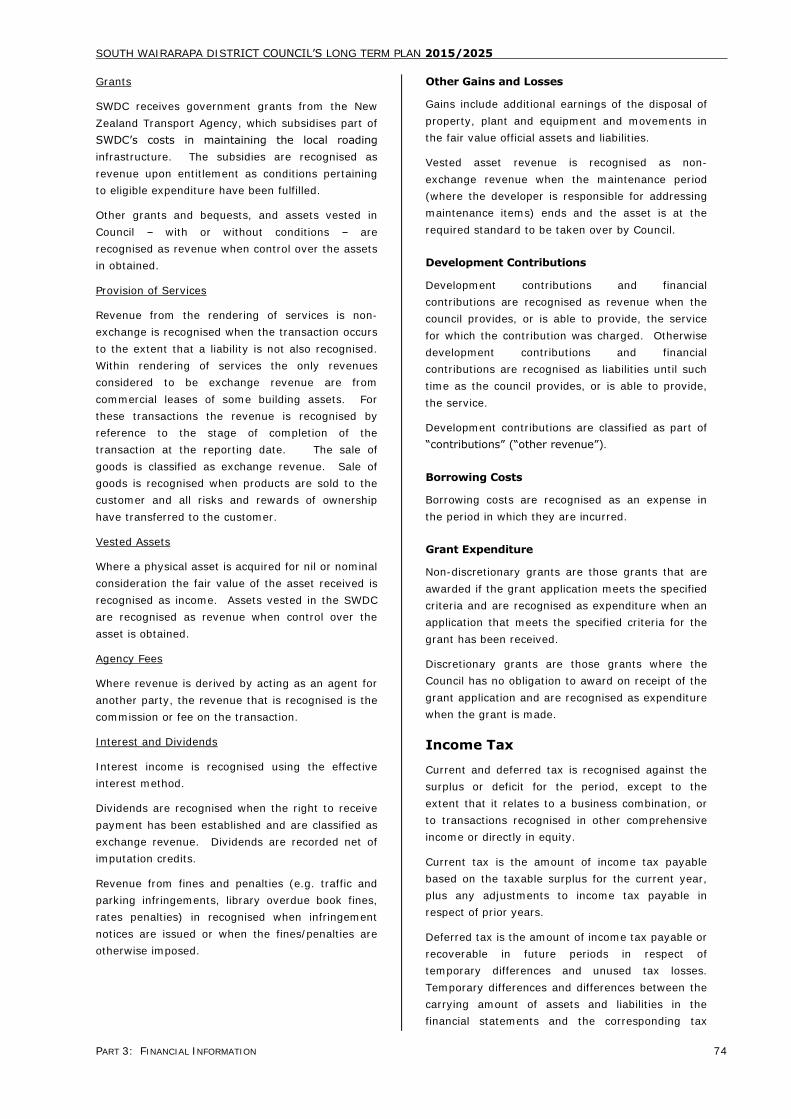
SOUTH WAIRARAPA DISTRICT COUNCIL‟S LONG TERM PLAN 2015/2025
PART 3: FINANCIAL INFORMATION 74
Grants
SWDC receives government grants from the New
Zealand Transport Agency, which subsidises part of
SWDC‟s costs in maintaining the local roading
infrastructure. The subsidies are recognised as
revenue upon entitlement as conditions pertaining
to eligible expenditure have been fulfilled.
Other grants and bequests, and assets vested in
Council – with or without conditions – are
recognised as revenue when control over the assets
in obtained.
Provision of Services
Revenue from the rendering of services is non-
exchange is recognised when the transaction occurs
to the extent that a liability is not also recognised.
Within rendering of services the only revenues
considered to be exchange revenue are from
commercial leases of some building assets. For
these transactions the revenue is recognised by
reference to the stage of completion of the
transaction at the reporting date. The sale of
goods is classified as exchange revenue. Sale of
goods is recognised when products are sold to the
customer and all risks and rewards of ownership
have transferred to the customer.
Vested Assets
Where a physical asset is acquired for nil or nominal
consideration the fair value of the asset received is
recognised as income. Assets vested in the SWDC
are recognised as revenue when control over the
asset is obtained.
Agency Fees
Where revenue is derived by acting as an agent for
another party, the revenue that is recognised is the
commission or fee on the transaction.
Interest and Dividends
Interest income is recognised using the effective
interest method.
Dividends are recognised when the right to receive
payment has been established and are classified as
exchange revenue. Dividends are recorded net of
imputation credits.
Revenue from fines and penalties (e.g. traffic and
parking infringements, library overdue book fines,
rates penalties) in recognised when infringement
notices are issued or when the fines/penalties are
otherwise imposed.
Other Gains and Losses
Gains include additional earnings of the disposal of
property, plant and equipment and movements in
the fair value official assets and liabilities.
Vested asset revenue is recognised as non-
exchange revenue when the maintenance period
(where the developer is responsible for addressing
maintenance items) ends and the asset is at the
required standard to be taken over by Council.
Development Contributions
Development contributions and financial
contributions are recognised as revenue when the
council provides, or is able to provide, the service
for which the contribution was charged. Otherwise
development contributions and financial
contributions are recognised as liabilities until such
time as the council provides, or is able to provide,
the service.
Development contributions are classified as part of
“contributions” (“other revenue”).
Borrowing Costs
Borrowing costs are recognised as an expense in
the period in which they are incurred.
Grant Expenditure
Non-discretionary grants are those grants that are
awarded if the grant application meets the specified
criteria and are recognised as expenditure when an
application that meets the specified criteria for the
grant has been received.
Discretionary grants are those grants where the
Council has no obligation to award on receipt of the
grant application and are recognised as expenditure
when the grant is made.
Income Tax
Current and deferred tax is recognised against the
surplus or deficit for the period, except to the
extent that it relates to a business combination, or
to transactions recognised in other comprehensive
income or directly in equity.
Current tax is the amount of income tax payable
based on the taxable surplus for the current year,
plus any adjustments to income tax payable in
respect of prior years.
Deferred tax is the amount of income tax payable or
recoverable in future periods in respect of
temporary differences and unused tax losses.
Temporary differences and differences between the
carrying amount of assets and liabilities in the
financial statements and the corresponding tax
SOUTH WAIRARAPA DISTRICT COUNCIL‟S LONG TERM PLAN 2015/2025
PART 3: FINANCIAL INFORMATION 75
bases losses used in the computation of taxable
surplus.
Deferred tax is measured at the tax rates that are
expected to apply when the asset is realised or the
liability is settled, based on tax rates (and tax laws)
that have been enacted or substantively enacted at
balance date. The measurement of deferred tax
reflects the tax consequences that would follow
from the manner in which the Council expects to
recover or settle the carrying amount of its assets
and liabilities.
Deferred tax liabilities are generally recognised for
all taxable temporary differences. Deferred tax
assets are recognised to the extent that it is
probable that taxable profits will be available
against which the deductible temporary differences
or tax losses can be utilised.
Deferred tax is not recognised if the temporary
difference arises from the initial recognition of
goodwill or from the initial recognition of an asset
and liability in a transaction that is not a business
combination, and at the time of the transaction,
affects neither accounting surplus nor taxable
surplus.
Leases
Finance Leases
A finance lease is a lease that transfers to the
lessee substantially all the risks and rewards
incidental to ownership of an asset, whether or not
title is eventually transferred.
At the commencement of the lease term, the SWDC
recognises finance leases as assets and liabilities in
the prospective statement of financial position at
the lower of the fair value of the leased item or the
present value of the minimum lease payments.
The finance charge is charged to the statement of
financial performance over the lease period so as to
produce a constant periodic rate of interest on the
remaining balance of the liability.
The amount recognised as an asset is depreciated
over its useful life. If there is no certainty as to
whether the SWDC will obtain ownership at the end
of the lease term, the asset is fully depreciated over
the shorter of the lease term and its useful life.
Operating Leases
An operating lease is a lease that does not transfer
substantially all the risks and rewards incidental to
ownership of an asset. Lease payments under an
operating lease are recognised as an expense on a
straight-line basis over the lease term.
Cash and Cash Equivalents
Cash and cash equivalents includes cash in hand,
deposits held at call with banks, other short-term
highly liquid investments with original maturities of
three months or less, and bank overdrafts.
Bank overdrafts are shown within borrowings in
current liabilities in the statement of financial
position.
Debtors and Other Receivables
Debtors and other receivables are initially measured
at fair value and subsequently measured at
amortised cost using the effective interest method,
less any provision for impairment.
Derivative Financial Instruments and
Hedge Accounting
The Council does not engage in the use of
derivative financial instruments and hedging
activities.
Other Financial Assets
Financial assets are initially recognised at fair value
plus transaction costs unless they are carried at fair
value through surplus or deficit in which case the
transaction costs are recognised in the surplus or
deficit.
Purchases and sales of financial assets are
recognised on trade-date, the date on which the
Council commits to purchase or sell the asset.
Financial assets are derecognised when the rights to
receive cash flows from the financial assets have
expired or have been transferred and the Council
has transferred substantially all the risks and
rewards of ownership.
Financial assets are classified into the following
categories for the purpose of measurement:
Fair value through surplus or deficit.
Loans and receivables.
Held to maturity investments.
Fair value through other comprehensive.
Income.
The classification of a financial asset depends on the
purpose for which the instrument was acquired.
Financial Assets at Fair Value Through Surplus
or Deficit
Financial assets at fair value through profit and loss
include financial assets held for trading. A financial
asset is classified in this category if acquired
principally for the purpose of selling in the short-
SOUTH WAIRARAPA DISTRICT COUNCIL‟S LONG TERM PLAN 2015/2025
PART 3: FINANCIAL INFORMATION 76
term or it is part of a portfolio of identified financial
instruments that are managed together and for
which there is evidence of short-term profit-taking.
Derivatives are also categorised as held for trading
unless they are designated into hedge accounting
relationship for which hedge accounting is applied.
Financial assets acquired principally for the purpose
of selling in the short-term or part of a portfolio
classified as held for trading are classified as a
current asset. The current/non-current
classification of derivatives is explained in the
derivatives accounting policy above.
After initial recognition, financial assets in this
category are measured at their fair values with
gains or losses on re-measurement recognised in
the surplus or deficit.
Council does not hold any financial assets in this
category.
Loans and Receivables
Loans and receivables are non-derivative financial
assets with fixed or determinable payments that are
not quoted in an active market. They are included in
current assets, except for maturities greater than
12 months after the balance date, which are
included in non-current assets.
After initial recognition, they are measured at
amortised cost, using the effective interest method
less impairment. Gains and losses when the asset
is impaired or derecognised are recognised in the
surplus or deficit.
Loans to community organisations made at nil or
below-market interest rates are initially recognised
at the present value of their expected future cash
flows, discounted at the current market rate of
return for a similar financial instrument. The loans
are subsequently measured at amortised cost using
the effective interest method. The difference
between the face value and present value of the
expected future cash flows of the loan is recognised
in the surplus or deficit as a grant.
Council‟s loans and receivables comprise debtors
and other receivables, community and related party
loans. Loans and receivables are classified as
“debtors and other receivables” in the prospective
statement of financial position.
Held to Maturity Investments
Held to maturity investments are non-derivative
financial assets with fixed or determinable
payments and fixed maturities and there is the
positive intention and ability to hold to maturity.
They are included in current assets, except for
maturities greater than 12 months after balance
date, which are included in non-current assets.
After initial recognition they are measured at
amortised cost, using the effective interest method,
less impairment. Gains and losses when the asset
is impaired or derecognised are recognised in the
surplus or deficit.
Council‟s investments in this category include bank
term deposits.
Fair Value Through Other Comprehensive
Income
Financial assets at fair value through other
comprehensive income are those that are
designated into the category at initial recognition or
are not classified in any of the other categories
above. They are included in non-current assets
unless management intends to dispose of the share
investment within 12 months of balance date or if
the debt instrument is not expected to be realized
within 12 months of balance date.
Council includes in this category:
Investments that it intends to hold long-term
but which may be realised before maturity.
Shareholdings that it holds for strategic
purposes.
These investments are measured at their fair value,
with gains and losses recognised in other
comprehensive income, except for impairment
losses, which are recognised in the surplus or
deficit.
On de-recognition, the cumulative gain or loss
previously recognised in other comprehensive
income is reclassified from equity to the surplus or
deficit.
Impairment of Financial Assets
Financial assets are assessed for objective evidence
of impairment at each balance date. Impairment
losses are recognised in the surplus or deficit.
Loans and Other Receivables
Impairment is established when there is objective
evidence that the Council will not be able to collect
amounts due according to the original terms of the
debt. Significant financial difficulties of the debtor,
probability that the debtor will enter into
bankruptcy, and default in payments are considered
indicators that the asset is impaired. The amount
of the impairment is the difference between the
asset‟s carrying amount and the present value of
estimated future cash flows, discounted using the
original effective interest rate. For debtors and
SOUTH WAIRARAPA DISTRICT COUNCIL‟S LONG TERM PLAN 2015/2025
PART 3: FINANCIAL INFORMATION 77
other receivables, the carrying amount of the asset
is reduced through the use of an allowance account,
and the amount of the loss is recognised in the
surplus or deficit. When the receivable is
uncollectible, it is written-off against the allowance
account. Overdue receivables that have been
renegotiated are reclassified as current (that is, not
past due). Impairment in term deposits, local
authority stock, government stock, and community
loans, are recognised directly against the
instruments carrying amount.
Financial Assets at Fair Value Through Other
Comprehensive Income
For equity investments, a significant or prolonged
decline in the fair value of the investment below its
cost is considered objective evidence of impairment.
For debt investments, significant financial difficulties
of the debtor, probability that the debtor will enter
into bankruptcy, and default in payments are
considered objective indicators that the asset is
impaired.
If impairment evidence exists for the investments at
fair value through other comprehensive revenue
and expense, the cumulative loss (measured as the
difference between the acquisition cost and the
current fair value, less any impairment loss on that
financial asset previously recognised in the surplus
or deficit) recognized in other comprehensive
revenue and expense is reclassified from equity to
the surplus or deficit.
Equity instrument impairment losses recognised in
the surplus or deficit are not reversed through the
surplus or deficit.
If in a subsequent period the fair value of a debt
instrument increases and the increase can be
objectively related to an event occurring after the
impairment loss was recognised, the impairment
loss is reversed in the surplus or deficit.
Inventories
Inventories (such as spare parts and other items)
held for distribution or consumption in the provision
of services that are not supplied on a commercial
basis are measured at the lower of cost and current
replacement cost. The valuation includes allowance
for slow moving and obsolete items. Where
inventories are acquired at no cost or for nominal
consideration, the cost is the current replacement
cost at the date of acquisition.
Inventories held for use in the production of goods
and services on a commercial basis are valued at
the lower of cost and net realisable value. The cost
of purchased inventory is determined using the
FIFO method.
The amount of any write-down for the loss of
service potential or from cost to net realisable value
is recognised in the statement of financial
performance in the period of the write-down.
When land held for development and future resale
is transferred from investment property/property,
plant and equipment to inventory, the fair value of
the land at the date of the transfer is its deemed
cost.
Costs directly attributable to the developed land are
capitalised to inventory, with the exception of
infrastructural asset costs which are capitalised to
property, plant and equipment.
Non-current Assets Held for Sale
Non-current assets held for sale are classified as
held for sale if their carrying amount will be
recovered principally through a sale transaction, not
through continuing use. Non-current assets held for
sale are measured at the lower of their carrying
amount and fair value less costs to sell.
Any impairment losses for write-downs of non-
current assets held for sale are recognised in the
statement of financial performance.
Any increases in fair value (less costs to sell) are
recognised up to the level of any impairment losses
that have previously been recognised.
Non-current assets held for sale (including those
that are part of a disposal group) are not
depreciated or amortised while they are classified
as held for sale. Interest and other expenses
attributable to the liabilities of a disposal group
classified as held for sale continue to be recognised.
Property, Plant and Equipment
Property, plant and equipment consist of:
Operational Assets
These include land, buildings, landfill post closure,
library books, plant and equipment, and motor
vehicles.
Restricted Assets
Restricted assets are parks and reserves owned by
the SWDC which provide a benefit or service to the
community and cannot be disposed of because of
legal or other restrictions.
Infrastructure Assets
Infrastructure assets are the fixed utility systems
owned by the SWDC. Each asset class includes all
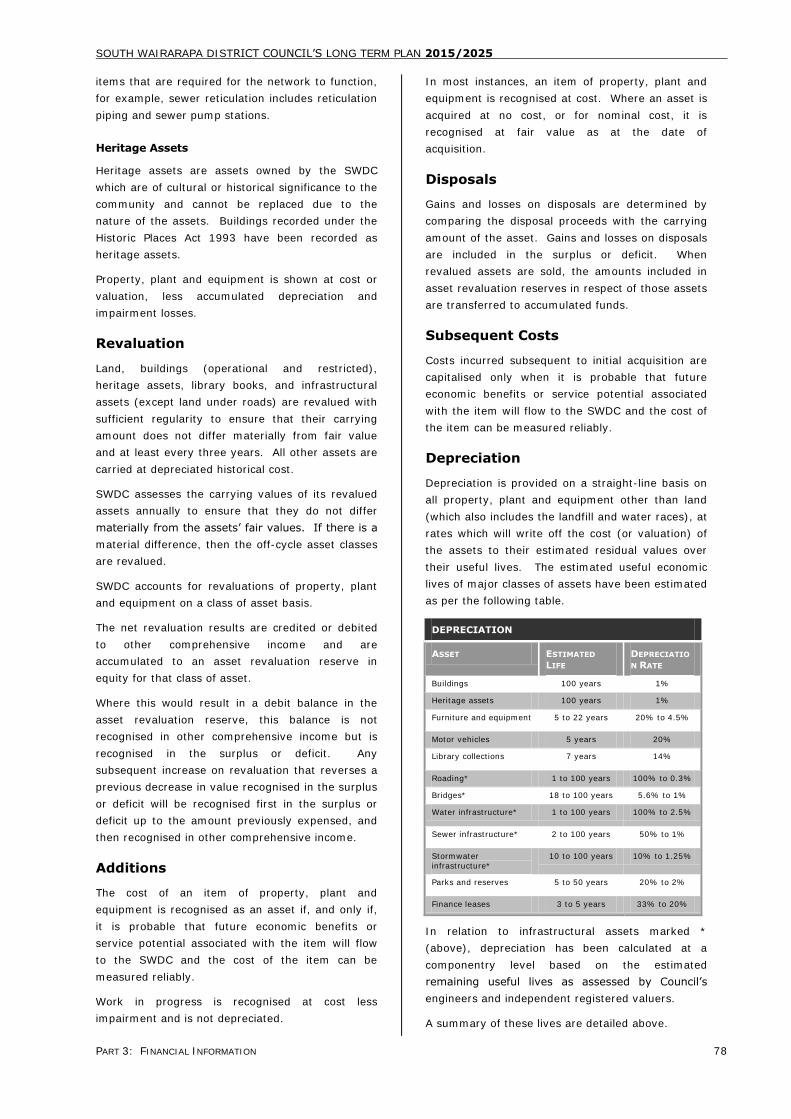
SOUTH WAIRARAPA DISTRICT COUNCIL‟S LONG TERM PLAN 2015/2025
PART 3: FINANCIAL INFORMATION 78
items that are required for the network to function,
for example, sewer reticulation includes reticulation
piping and sewer pump stations.
Heritage Assets
Heritage assets are assets owned by the SWDC
which are of cultural or historical significance to the
community and cannot be replaced due to the
nature of the assets. Buildings recorded under the
Historic Places Act 1993 have been recorded as
heritage assets.
Property, plant and equipment is shown at cost or
valuation, less accumulated depreciation and
impairment losses.
Revaluation
Land, buildings (operational and restricted),
heritage assets, library books, and infrastructural
assets (except land under roads) are revalued with
sufficient regularity to ensure that their carrying
amount does not differ materially from fair value
and at least every three years. All other assets are
carried at depreciated historical cost.
SWDC assesses the carrying values of its revalued
assets annually to ensure that they do not differ
materially from the assets‟ fair values. If there is a
material difference, then the off-cycle asset classes
are revalued.
SWDC accounts for revaluations of property, plant
and equipment on a class of asset basis.
The net revaluation results are credited or debited
to other comprehensive income and are
accumulated to an asset revaluation reserve in
equity for that class of asset.
Where this would result in a debit balance in the
asset revaluation reserve, this balance is not
recognised in other comprehensive income but is
recognised in the surplus or deficit. Any
subsequent increase on revaluation that reverses a
previous decrease in value recognised in the surplus
or deficit will be recognised first in the surplus or
deficit up to the amount previously expensed, and
then recognised in other comprehensive income.
Additions
The cost of an item of property, plant and
equipment is recognised as an asset if, and only if,
it is probable that future economic benefits or
service potential associated with the item will flow
to the SWDC and the cost of the item can be
measured reliably.
Work in progress is recognised at cost less
impairment and is not depreciated.
In most instances, an item of property, plant and
equipment is recognised at cost. Where an asset is
acquired at no cost, or for nominal cost, it is
recognised at fair value as at the date of
acquisition.
Disposals
Gains and losses on disposals are determined by
comparing the disposal proceeds with the carrying
amount of the asset. Gains and losses on disposals
are included in the surplus or deficit. When
revalued assets are sold, the amounts included in
asset revaluation reserves in respect of those assets
are transferred to accumulated funds.
Subsequent Costs
Costs incurred subsequent to initial acquisition are
capitalised only when it is probable that future
economic benefits or service potential associated
with the item will flow to the SWDC and the cost of
the item can be measured reliably.
Depreciation
Depreciation is provided on a straight-line basis on
all property, plant and equipment other than land
(which also includes the landfill and water races), at
rates which will write off the cost (or valuation) of
the assets to their estimated residual values over
their useful lives. The estimated useful economic
lives of major classes of assets have been estimated
as per the following table.
DEPRECIATION
ASSET ESTIMATED
LIFE
DEPRECIATIO
N RATE
Buildings 100 years 1%
Heritage assets 100 years 1%
Furniture and equipment 5 to 22 years 20% to 4.5%
Motor vehicles 5 years 20%
Library collections 7 years 14%
Roading* 1 to 100 years 100% to 0.3%
Bridges* 18 to 100 years 5.6% to 1%
Water infrastructure* 1 to 100 years 100% to 2.5%
Sewer infrastructure* 2 to 100 years 50% to 1%
Stormwater
infrastructure*
10 to 100 years 10% to 1.25%
Parks and reserves 5 to 50 years 20% to 2%
Finance leases 3 to 5 years 33% to 20%
In relation to infrastructural assets marked *
(above), depreciation has been calculated at a
componentry level based on the estimated
remaining useful lives as assessed by Council‟s
engineers and independent registered valuers.
A summary of these lives are detailed above.
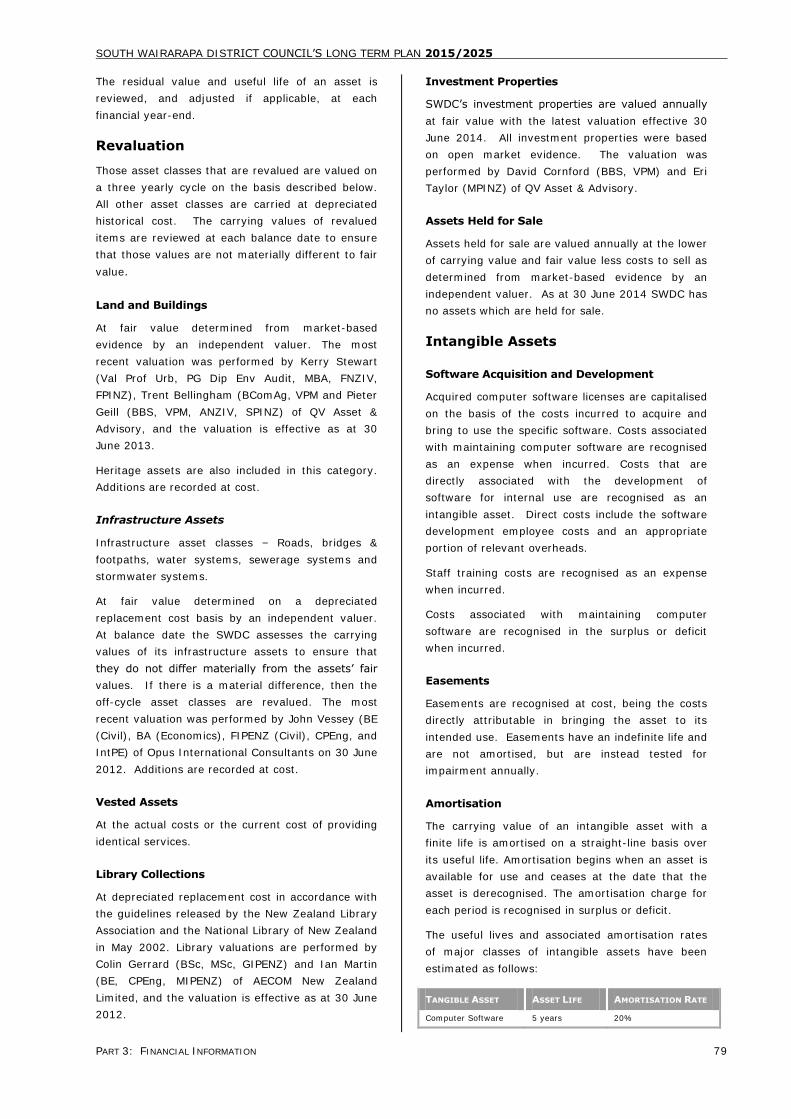
SOUTH WAIRARAPA DISTRICT COUNCIL‟S LONG TERM PLAN 2015/2025
PART 3: FINANCIAL INFORMATION 79
The residual value and useful life of an asset is
reviewed, and adjusted if applicable, at each
financial year-end.
Revaluation
Those asset classes that are revalued are valued on
a three yearly cycle on the basis described below.
All other asset classes are carried at depreciated
historical cost. The carrying values of revalued
items are reviewed at each balance date to ensure
that those values are not materially different to fair
value.
Land and Buildings
At fair value determined from market-based
evidence by an independent valuer. The most
recent valuation was performed by Kerry Stewart
(Val Prof Urb, PG Dip Env Audit, MBA, FNZIV,
FPINZ), Trent Bellingham (BComAg, VPM and Pieter
Geill (BBS, VPM, ANZIV, SPINZ) of QV Asset &
Advisory, and the valuation is effective as at 30
June 2013.
Heritage assets are also included in this category.
Additions are recorded at cost.
Infrastructure Assets
Infrastructure asset classes – Roads, bridges &
footpaths, water systems, sewerage systems and
stormwater systems.
At fair value determined on a depreciated
replacement cost basis by an independent valuer.
At balance date the SWDC assesses the carrying
values of its infrastructure assets to ensure that
they do not differ materially from the assets‟ fair
values. If there is a material difference, then the
off-cycle asset classes are revalued. The most
recent valuation was performed by John Vessey (BE
(Civil), BA (Economics), FIPENZ (Civil), CPEng, and
IntPE) of Opus International Consultants on 30 June
2012. Additions are recorded at cost.
Vested Assets
At the actual costs or the current cost of providing
identical services.
Library Collections
At depreciated replacement cost in accordance with
the guidelines released by the New Zealand Library
Association and the National Library of New Zealand
in May 2002. Library valuations are performed by
Colin Gerrard (BSc, MSc, GIPENZ) and Ian Martin
(BE, CPEng, MIPENZ) of AECOM New Zealand
Limited, and the valuation is effective as at 30 June
2012.
Investment Properties
SWDC‟s investment properties are valued annually
at fair value with the latest valuation effective 30
June 2014. All investment properties were based
on open market evidence. The valuation was
performed by David Cornford (BBS, VPM) and Eri
Taylor (MPINZ) of QV Asset & Advisory.
Assets Held for Sale
Assets held for sale are valued annually at the lower
of carrying value and fair value less costs to sell as
determined from market-based evidence by an
independent valuer. As at 30 June 2014 SWDC has
no assets which are held for sale.
Intangible Assets
Software Acquisition and Development
Acquired computer software licenses are capitalised
on the basis of the costs incurred to acquire and
bring to use the specific software. Costs associated
with maintaining computer software are recognised
as an expense when incurred. Costs that are
directly associated with the development of
software for internal use are recognised as an
intangible asset. Direct costs include the software
development employee costs and an appropriate
portion of relevant overheads.
Staff training costs are recognised as an expense
when incurred.
Costs associated with maintaining computer
software are recognised in the surplus or deficit
when incurred.
Easements
Easements are recognised at cost, being the costs
directly attributable in bringing the asset to its
intended use. Easements have an indefinite life and
are not amortised, but are instead tested for
impairment annually.
Amortisation
The carrying value of an intangible asset with a
finite life is amortised on a straight-line basis over
its useful life. Amortisation begins when an asset is
available for use and ceases at the date that the
asset is derecognised. The amortisation charge for
each period is recognised in surplus or deficit.
The useful lives and associated amortisation rates
of major classes of intangible assets have been
estimated as follows:
TANGIBLE ASSET ASSET LIFE AMORTISATION RATE
Computer Software 5 years 20%
SOUTH WAIRARAPA DISTRICT COUNCIL‟S LONG TERM PLAN 2015/2025
PART 3: FINANCIAL INFORMATION 80
Impairment of Property, Plant and Equipment
and Intangible Assets
Intangible assets that have an indefinite useful life,
or not yet available for use, are not subject to
amortisation and are tested annually for
impairment. Assets that have a finite useful life are
reviewed for indicators of impairment at each
balance date. When there is an indicator of
impairment the asset‟s recoverable amount is
estimated. An impairment loss is recognised for the
amount by which the asset‟s carrying amount
exceeds its recoverable amount. The recoverable
amount is the higher of an asset‟s fair value less
costs to sell and value in use.
Value in use is depreciated replacement cost for an
asset where the future economic benefits or service
potential of the asset are not primarily dependent
on the assets ability to generate net cash flows and
where the entity would, if deprived of the asset,
replace its remaining future economic benefits or
service potential.
The value in use for cash-generating assets and
cash-generating units is the present value of
expected future cash flows.
If an asset‟s carrying amount exceeds its
recoverable amount, the asset is impaired and the
carrying amount is written down to the recoverable
amount. For revalued assets, the impairment loss
is recognised against the revaluation reserve for
that class of asset. Where that results in a debit
balance in the revaluation reserve, the balance is
recognised in the surplus or deficit.
For assets not carried at a revalued amount, the
total impairment loss is recognised in the surplus or
deficit.
The reversal of an impairment loss on a revalued
asset is credited to the revaluation reserve.
However, to the extent that an impairment loss for
that class of asset was previously recognised in the
surplus or deficit, a reversal of the impairment loss
is also recognised in the surplus or deficit.
For assets not carried at a revalued amount (other
than goodwill), the reversal of impairment loss is
recognised in the surplus or deficit.
Investment Properties
Properties leased to third parties under operating
leases are classified as investment property unless
the property is held to meet service delivery
objectives, rather than to earn rentals or for capital
appreciation.
Investment property is measured initially at cost,
including transaction costs.
After initial recognition, the SWDC measures all
investment property at fair value as determined
annually by an independent valuer.
Gains and losses arising from a change in the fair
value of investment property are recognised in the
surplus or deficit.
Impairment of Non-financial Assets
Assets that have an indefinite useful life or not yet
available for use, are not subject to amortisation
and are tested annually for impairment. Assets that
have a finite useful life are reviewed for impairment
at each balance date. When there is an indicator of
impairment, the asset recoverable amount is
estimated. An impairment loss is recognised for the
amount by which the asset‟s carrying amount
exceeds its recoverable amount. The recoverable
amount is the higher of an asset‟s fair value less
costs to sell and value in use.
Value in use is depreciated replacement cost for an
asset where the future economic benefits or service
potential of the asset are not primarily dependent
on the assets ability to generate net cash flows and
where the entity would, if deprived of the asset,
replace its remaining future economic benefits or
service potential.
The value in use for cash-generating assets is the
present value of expected future cash flows.
If an asset‟s carrying amount exceeds its
recoverable amount the asset is impaired and the
carrying amount is written down to the recoverable
amount. For revalued assets the impairment loss is
recognised against the revaluation reserve for that
class of asset. Where that results in a debit balance
in the revaluation reserve, the balance is recognised
in the surplus or deficit.
For assets not carried at a revalued amount, the
total impairment loss is recognised in the surplus or
deficit.
The reversal of an impairment loss on a revalued
asset is credited to the revaluation reserve.
However, to the extent that an impairment loss for
that class of asset was previously recognised in the
statement of financial performance, a reversal of
the impairment loss is also recognised in the
surplus or deficit.
For assets not carried at a revalued amount, the
reversal of an impairment loss is recognised in the
surplus or deficit.
SOUTH WAIRARAPA DISTRICT COUNCIL‟S LONG TERM PLAN 2015/2025
PART 3: FINANCIAL INFORMATION 81
Creditors and Other Payables
Creditors and other payables are initially measured
at fair value and subsequently measured at
amortised cost using the effective interest method.
Employee Entitlements
Short-term Employee Entitlements
Employee benefits that the SWDC expects to be
settled within twelve months of balance date are
measured at nominal values based on accrued
entitlements at current rates of pay.
These include salaries and wages accrued up to
balance date, annual leave earned to, but not yet
taken at balance date, long service leave
entitlements expected to be settled within twelve
months, and sick leave.
The SWDC recognises a liability for sick leave to the
extent that absences in the coming year are
expected to be greater than the sick leave
entitlements earning in the coming year. The
amount is calculated based on the unused sick
leave entitlement that can be carried forward at
balance date, to the extent that the SWDC
anticipates it will be used by staff to cover those
future absences.
The SWDC recognises a liability and an expense for
bonuses where contractually obliged or where there
is a past practice that has created a constructive
obligation.
Presentation of Employee Entitlements
Sick leave, annual leave, vested long service leave,
and non-vested long service leave and retirement
gratuities expected to be settled within 12 months
of balance date, are classified as a current liability.
All other employee entitlements are classified as a
non-current liability.
Superannuation Schemes
Obligations for contributions to defined contribution
superannuation schemes are recognised as an
expense in the surplus or deficit as incurred.
Provisions
The SWDC recognises a provision for future
expenditure of uncertain amount or timing when
there is a present obligation (either legal or
constructive) as a result of a past event, it is
probable that expenditures will be required to settle
the obligation and a reliable estimate can be made
of the amount of the obligation. Provisions are
measured at the present value of the expenditures
expected to be required to settle the obligation
using a pre-tax discount rate that reflects current
market assessments of the time value of money
and the risks specific to the obligation. The
increase in the provision due to the passage of time
is recognised as an interest expense and is included
in “Finance costs”.
Financial Guarantee Contracts
A financial guarantee contract is a contract that
requires the Council to make specified payments to
reimburse the holder of the contract for a loss it
incurs because a specified debtor fails to make
payment when due.
Financial guarantee contracts are initially
recognised at fair value, even if a payment under
the guarantee is not considered probable. If a
financial guarantee contract was issued in a
standalone arm‟s length transaction to an unrelated
party, its fair value at inception is equal to the
consideration received. When no consideration is
received, a liability is recognised based on the
probability that the Council will be required to
reimburse a holder for a loss incurred discounted to
present value. The portion of the guarantee that
remains unrecognised, prior to discounting to fair
value, is disclosed as a contingent liability.
Financial guarantees are subsequently measured at
the initial recognition amount less any amortisation.
However, if it is probable that expenditure will be
required to settle a guarantee, then the provision
for the guarantee is measured at the present value
for the future expenditure.
Borrowings
Borrowings are initially recognised at their fair value
net of transaction costs incurred. After initial
recognition, all borrowings are measured at
amortised cost using the effective interest method.
Borrowings are classified as current liabilities unless
SWDC has an unconditional right to defer
settlement of the liability for at least 12 months
after the balance date, or if the borrowings are
expected to be settled within 12 months of balance
date.
Equity
Equity is the community‟s interest in the SWDC and
is measured as the difference between total assets
and total liabilities. Equity is disaggregated and
classified into a number of components.
The components of equity are:
Public equity – accumulated funds.
Special reserves and trust funds.
SOUTH WAIRARAPA DISTRICT COUNCIL‟S LONG TERM PLAN 2015/2025
PART 3: FINANCIAL INFORMATION 82
Restricted Reserves.
Asset revaluation reserves.
Sinking fund reserves.
Fair value through other comprehensive
income reserves.
Restricted and Council Created
Reserves
Restricted reserves are a component of equity
generally representing a particular use to which
various parts of equity have been assigned.
Reserves may be legally restricted or created by the
SWDC.
Restricted reserves are those subject to specific
conditions accepted as binding by the SWDC and
which may not be revised by the SWDC without
reference to the courts or a third party. Transfers
from these reserves may be made only for certain
specified purposes or when certain specified
conditions are met.
Also included in restricted reserves are reserves
restricted by Council decision. The Council may
alter them without references to any third party or
the Courts. Transfers to and from these reserves
are at the discretion of the Council.
The SWDC‟s objectives, policies and processes for
managing capital are described in note 34 of the
2014 Annual Report.
Asset Revaluation Reserves
The asset revaluation reserve relates to the
revaluation of property, plant and equipment to fair
value.
Fair Value through other Comprehensive
Income Reserves
Fair value through other comprehensive income
reserves comprises the net cumulative change in
the fair value through other comprehensive income
instruments.
Goods and Services Tax (GST)
All items in the financial statements are stated
exclusive of GST, except for receivables and
payables, which are stated on a GST inclusive basis.
Where GST is not recoverable as input tax then it is
recognised as part of the related asset or expense.
The net amount of GST recoverable from, or
payable to, the Inland Revenue Department (IRD) is
included as part of receivables or payables in the
statement of financial position.
The net GST paid to, or received from the IRD,
including the GST relating to investing and financing
activities, is classified as an operating cash flow in
the statement of cash flows.
Commitments and contingencies are disclosed
exclusive of GST.
Cost Allocation
The SWDC has derived the cost of service for each
significant activity of the Council using the cost
allocation system outlined below.
Direct costs are those costs directly attributable to a
significant activity. Indirect costs are those costs,
which cannot be identified in an economically
feasible manner, with a significant activity.
Direct costs are charged directly to significant
activities. Indirect costs are charged to significant
activities using appropriate cost drivers such as
actual usage, staff numbers and floor area.
Prospective Statement of Cash Flows
Cash means cash balances on hand, held in bank
accounts, demand deposits and other highly liquid
investments in which Council invests as part of its
day-to-day cash management. GST is disclosed net
as disclosing gross amounts does not provide any
further meaningful information.
Operating activities include cash received from all
income sources and cash payments made for the
supply of goods and services. Agency transactions
(the collection of GWRC rates) are recognised as
receipts and payments in the statement of cash
flows because they flow through the Council‟s main
bank account.
Investing activities are those activities relating to
the acquisition and disposal of non-current assets.
Financing activities comprise the change in equity
and debt structure of the Council.
Prospective Significant Activity
Statements
The prospective group of activity statements, as
provided in the statement of service performance,
report the net cost of services for significant
activities of the Council, and are represented by the
costs of providing the service less all revenue that
can be allocated to these activities.
Critical Accounting Estimates and
Assumptions
In preparing these prospective financial statements,
the SWDC has made estimates and assumptions
concerning the future. These estimates and
SOUTH WAIRARAPA DISTRICT COUNCIL‟S LONG TERM PLAN 2015/2025
PART 3: FINANCIAL INFORMATION 83
assumptions may differ from the subsequent actual
results. Estimates and judgments are continually
evaluated and are based on historical experience
and other factors, including expectations or future
events that are believed to be reasonable under the
circumstances. The estimates and assumptions
that have a significant risk of causing a material
adjustment to the carrying amounts of assets and
liabilities within the next financial year are
discussed below.
Landfill Aftercare Provision
A provision has been included in the financial
forecasts for the exposure of the Council in relation
to the estimates and uncertainties surrounding the
landfill aftercare provision.
Infrastructural Assets
There are a number of assumptions and estimates
used when performing DRC valuations over
infrastructural assets.
These include:
The physical deterioration and condition of an
asset. For example the Council could be
carrying an asset at an amount that does not
reflect its actual condition. This is particularly
so for those assets which are not visible like
Stormwater, wastewater and water supply
pipes that are underground. This risk is
minimised by Council performing a
combination of physical inspections and
condition modelling assessments of
underground assets.
Estimating any obsolescence or surplus
capacity of an asset.
Estimates are made when determining the
remaining useful lives over which the asset
will be depreciated. These estimates can be
impacted by the local conditions, for example
weather patterns and traffic growth. If useful
lives do not reflect the actual consumption of
the benefits of the asset, then the SWDC
could be over and under estimating the
annual depreciation charge recognised as an
expense in the statement of financial
performance.
To minimise this risk, SWDC‟s infrastructural asset
useful lives have been determined with reference to
the NZ Infrastructural Asset Valuation and
Depreciation Guidelines published by the National
Asset Management Steering Group, and have been
adjusted for local conditions based on past
experience. Asset inspections, deterioration and
condition modelling are also carried out regularly as
part of the SWDC asset management planning
activities, which gives the SWDC further assurance
over its useful life estimates.
Experienced independent valuers perform the
Council‟s infrastructural asset revaluations.
Critical Judgments in Applying the
SWDC’s Accounting Policies
Management has exercised the following critical
judgments in applying the SWDC‟s accounting
policies for these financial statements.
Classification of Property
SWDC owns a number of properties, which are
maintained primarily to provide housing to
pensioners. The receipt of market-based rental
from these properties is incidental to holding these
properties. These properties are held for service
delivery objectives as part of the SWDC‟s social
housing policy. These properties are accounted for
as property, plant and equipment.
Prospective Total Surplus/(Deficit)
Council is projecting a surplus for the financial years
ended 30 June 2017 to 30 June 2025. This surplus
is required to fund a number of
transactions/projects that do not appear in the
prospective statement of financial performance for
accounting purposes i.e. loan repayments,
grants/subsidies/donations for capital projects,
asset revaluations and contributions to reserve
funds. The income for these transactions and
projects is recorded in the prospective statement of
financial performance whereas the payments are
recorded in the prospective statement of financial
position.
This income is partially offset by expenditure items
that are not fully funded by rates i.e. bad debts,
losses, depreciation and operating expenditure
funded by reserves. The expenditure for these
transactions is recorded in the prospective
statement of financial performance and a reduction
is recorded in the prospective statement of financial
position.
Rounding Differences
There will be rounding of numbers in the Plan as the
model calculated to the nearest dollar but the plan
is rounded to the nearest thousands.
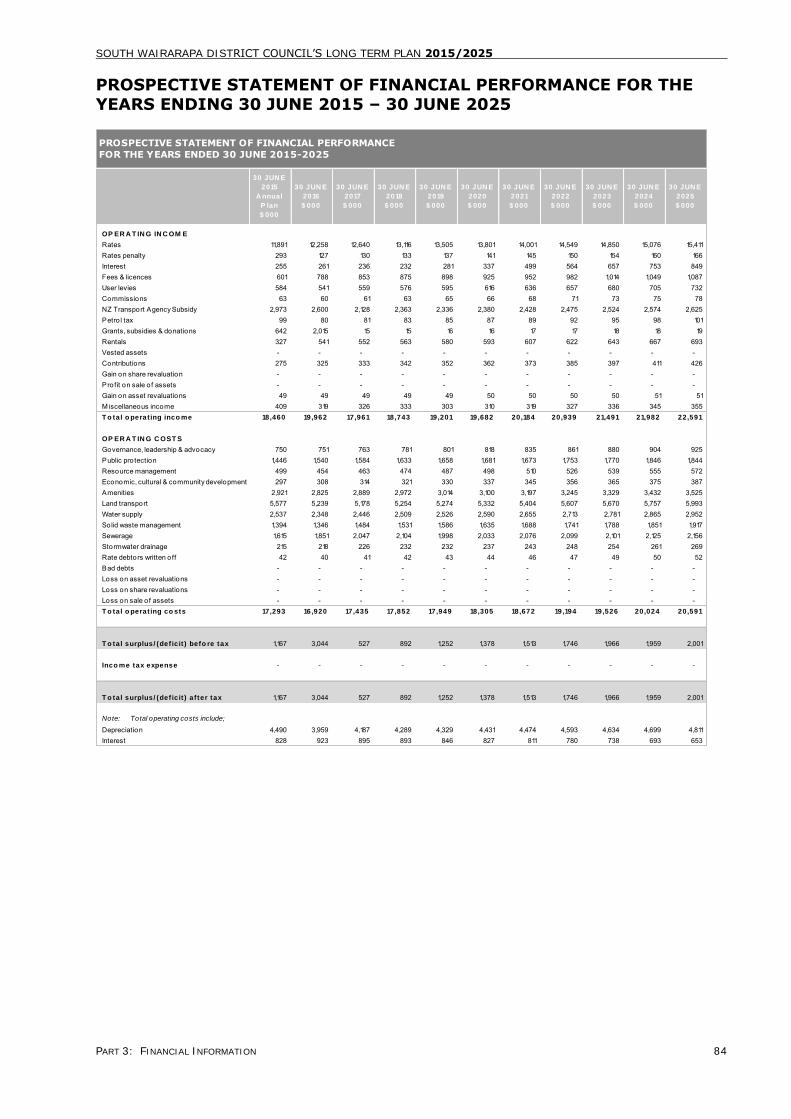
SOUTH WAIRARAPA DISTRICT COUNCIL‟S LONG TERM PLAN 2015/2025
PART 3: FINANCIAL INFORMATION 84
PROSPECTIVE STATEMENT OF FINANCIAL PERFORMANCE FOR THE
YEARS ENDING 30 JUNE 2015 – 30 JUNE 2025
30 JUN E
2015
A nnual
P lan
$ 000
30 JUN E
2016
$ 000
30 JUN E
2017
$ 000
30 JUN E
2018
$ 000
30 JUN E
2019
$ 000
30 JUN E
2020
$ 000
30 JUN E
2021
$ 000
30 JUN E
2022
$ 000
30 JUN E
2023
$ 000
30 JUN E
2024
$ 000
30 JUN E
2025
$ 000
OP ER A T IN G IN C OM E
Rates 11,891 12,258 12,640 13,116 13,505 13,801 14,001 14,549 14,850 15,076 15,411 Rates penalty 293 127 130 133 137 141 145 150 154 160 166 Interest 255 261 236 232 281 337 499 564 657 753 849 Fees & licences 601 788 853 875 898 925 952 982 1,014 1,049 1,087 User levies 584 541 559 576 595 616 636 657 680 705 732 Commissions 63 60 61 63 65 66 68 71 73 75 78 NZ Transport Agency Subsidy 2,973 2,600 2,128 2,363 2,336 2,380 2,428 2,475 2,524 2,574 2,625 Petro l tax 99 80 81 83 85 87 89 92 95 98 101 Grants, subsidies & donations 642 2,015 15 15 16 16 17 17 18 18 19 Rentals 327 541 552 563 580 593 607 622 643 667 693 Vested assets - - - - - - - - - - - Contributions 275 325 333 342 352 362 373 385 397 411 426 Gain on share revaluation - - - - - - - - - - - Profit on sale of assets - - - - - - - - - - - Gain on asset revaluations 49 49 49 49 49 50 50 50 50 51 51 M iscellaneous income 409 319 326 333 303 310 319 327 336 345 355 T o tal o perat ing inco me 18,460 19,962 17,961 18,743 19,201 19,682 20,184 20,939 21,491 21,982 22,591
OP ER A T IN G C OST S
Governance, leadership & advocacy 750 751 763 781 801 818 835 861 880 904 925 Public protection 1,446 1,540 1,584 1,633 1,658 1,681 1,673 1,753 1,770 1,846 1,844 Resource management 499 454 463 474 487 498 510 526 539 555 572 Economic, cultural & community development 297 308 314 321 330 337 345 356 365 375 387 Amenities 2,921 2,825 2,889 2,972 3,014 3,100 3,197 3,245 3,329 3,432 3,525 Land transport 5,577 5,239 5,178 5,254 5,274 5,332 5,404 5,607 5,670 5,757 5,993 Water supply 2,537 2,348 2,446 2,509 2,526 2,590 2,655 2,713 2,781 2,865 2,952 Solid waste management 1,394 1,346 1,484 1,531 1,586 1,635 1,688 1,741 1,788 1,851 1,917 Sewerage 1,615 1,851 2,047 2,104 1,998 2,033 2,076 2,099 2,101 2,125 2,156 Stormwater drainage 215 218 226 232 232 237 243 248 254 261 269 Rate debtors written off 42 40 41 42 43 44 46 47 49 50 52 Bad debts - - - - - - - - - - - Loss on asset revaluations - - - - - - - - - - - Loss on share revaluations - - - - - - - - - - - Loss on sale of assets - - - - - - - - - - - T o tal o perat ing co sts 17,293 16,920 17,435 17,852 17,949 18,305 18,672 19,194 19,526 20,024 20,591
T o tal surplus/ (def ic it ) befo re tax 1,167 3,044 527 892 1,252 1,378 1,513 1,746 1,966 1,959 2,001
Inco me tax expense - - - - - - - - - - -
T o tal surplus/ (def ic it ) af ter tax 1,167 3,044 527 892 1,252 1,378 1,513 1,746 1,966 1,959 2,001
Note: Total operating costs include;
Depreciation 4,490 3,959 4,187 4,289 4,329 4,431 4,474 4,593 4,634 4,699 4,811 Interest 828 923 895 893 846 827 811 780 738 693 653
PROSPECTIVE STATEMENT OF FINANCIAL PERFORMANCE
FOR THE YEARS ENDED 30 JUNE 2015-2025
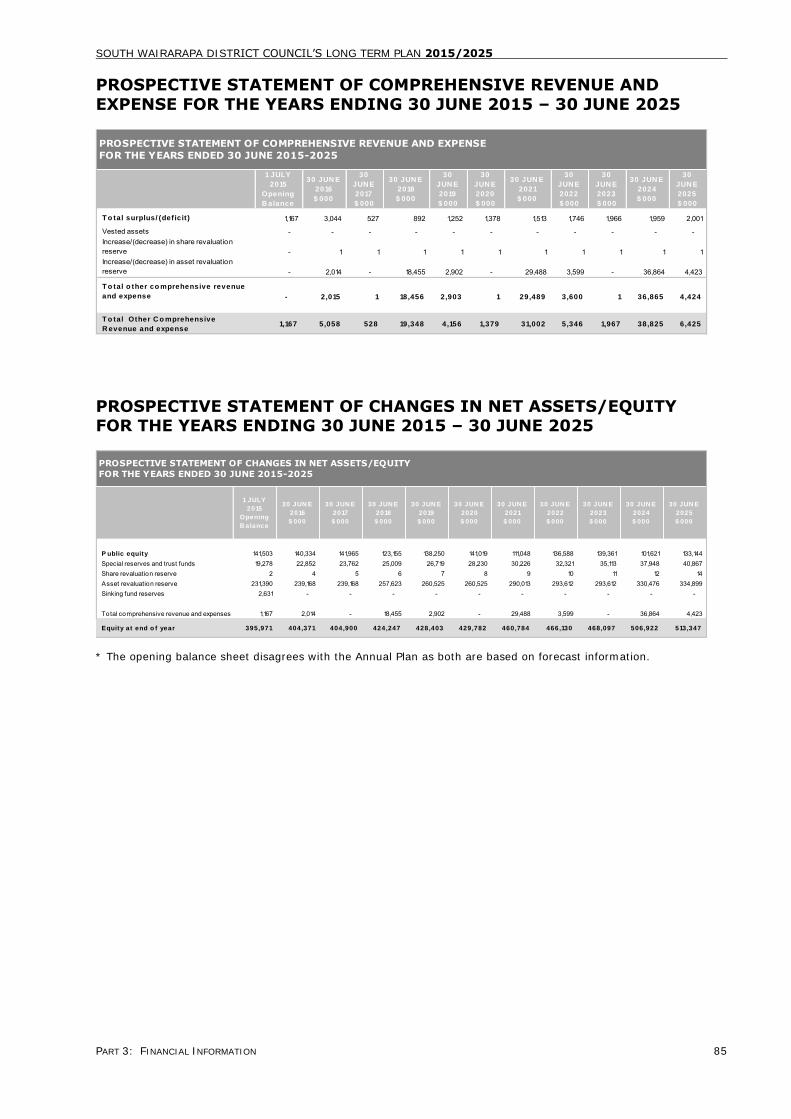
SOUTH WAIRARAPA DISTRICT COUNCIL‟S LONG TERM PLAN 2015/2025
PART 3: FINANCIAL INFORMATION 85
PROSPECTIVE STATEMENT OF COMPREHENSIVE REVENUE AND
EXPENSE FOR THE YEARS ENDING 30 JUNE 2015 – 30 JUNE 2025
1 JULY
2015
Opening
B alance
30 JUN E
2016
$ 000
30
JUN E
2017
$ 000
30 JUN E
2018
$ 000
30
JUN E
2019
$ 000
30
JUN E
2020
$ 000
30 JUN E
2021
$ 000
30
JUN E
2022
$ 000
30
JUN E
2023
$ 000
30 JUN E
2024
$ 000
30
JUN E
2025
$ 000
T o tal surplus/ (def icit ) 1,167 3,044 527 892 1,252 1,378 1,513 1,746 1,966 1,959 2,001
Vested assets - - - - - - - - - - - Increase/(decrease) in share revaluation reserve - 1 1 1 1 1 1 1 1 1 1 Increase/(decrease) in asset revaluation reserve - 2,014 - 18,455 2,902 - 29,488 3,599 - 36,864 4,423
T o tal o ther co mprehensive revenue
and expense - 2 ,015 1 18,456 2 ,903 1 29,489 3 ,600 1 36,865 4 ,424
T o tal Other C o mprehensive
R evenue and expense1,167 5 ,058 528 19,348 4 ,156 1,379 31,002 5 ,346 1,967 38,825 6 ,425
PROSPECTIVE STATEMENT OF COMPREHENSIVE REVENUE AND EXPENSE
FOR THE YEARS ENDED 30 JUNE 2015-2025
PROSPECTIVE STATEMENT OF CHANGES IN NET ASSETS/EQUITY FOR THE YEARS ENDING 30 JUNE 2015 – 30 JUNE 2025
1 JULY
2015
Opening
B alance
30 JUN E
2016
$ 000
30 JUN E
2017
$ 000
30 JUN E
2018
$ 000
30 JUN E
2019
$ 000
30 JUN E
2020
$ 000
30 JUN E
2021
$ 000
30 JUN E
2022
$ 000
30 JUN E
2023
$ 000
30 JUN E
2024
$ 000
30 JUN E
2025
$ 000
P ublic equity 141,503 140,334 141,965 123,155 138,250 141,019 111,048 136,588 139,361 101,621 133,144 Special reserves and trust funds 19,278 22,852 23,762 25,009 26,719 28,230 30,226 32,321 35,113 37,948 40,867 Share revaluation reserve 2 4 5 6 7 8 9 10 11 12 14 Asset revaluation reserve 231,390 239,168 239,168 257,623 260,525 260,525 290,013 293,612 293,612 330,476 334,899 Sinking fund reserves 2,631 - - - - - - - - - -
Total comprehensive revenue and expenses 1,167 2,014 - 18,455 2,902 - 29,488 3,599 - 36,864 4,423
Equity at end o f year 395,971 404,371 404,900 424,247 428,403 429,782 460,784 466,130 468,097 506,922 513,347
PROSPECTIVE STATEMENT OF CHANGES IN NET ASSETS/EQUITY
FOR THE YEARS ENDED 30 JUNE 2015-2025
* The opening balance sheet disagrees with the Annual Plan as both are based on forecast information.
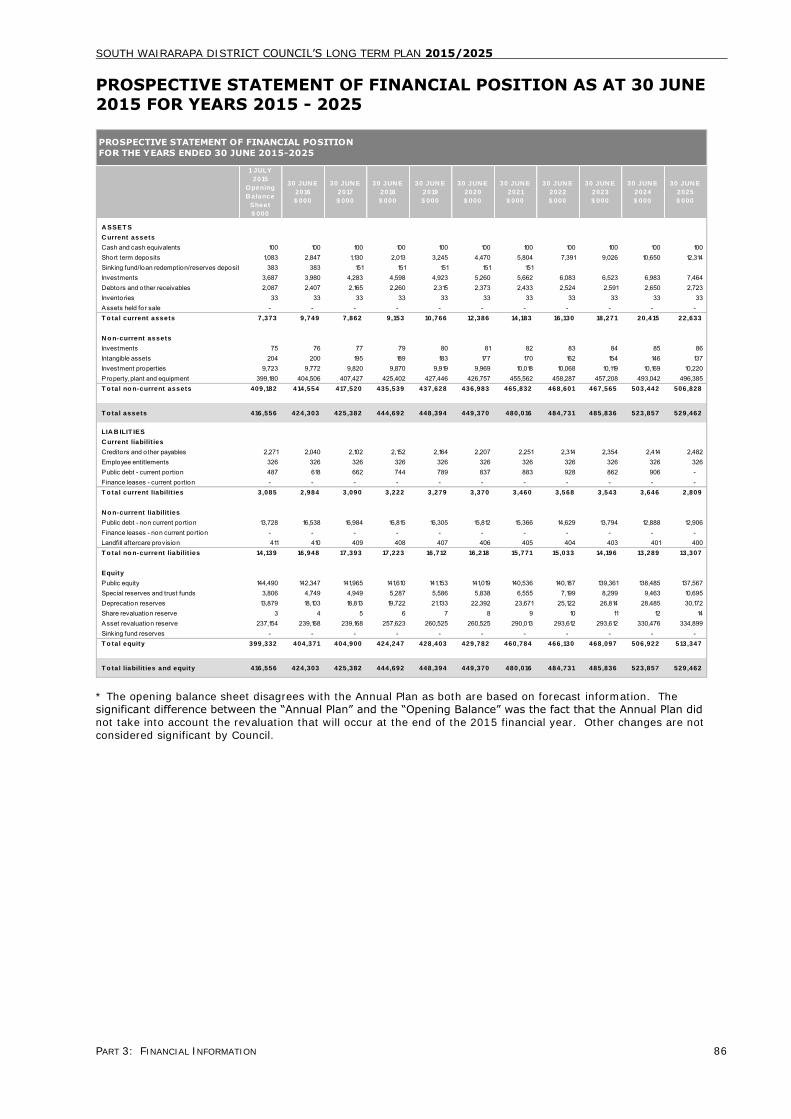
SOUTH WAIRARAPA DISTRICT COUNCIL‟S LONG TERM PLAN 2015/2025
PART 3: FINANCIAL INFORMATION 86
PROSPECTIVE STATEMENT OF FINANCIAL POSITION AS AT 30 JUNE
2015 FOR YEARS 2015 - 2025
1 JULY
2015
Opening
B alance
Sheet
$ 000
30 JUN E
2016
$ 000
30 JUN E
2017
$ 000
30 JUN E
2018
$ 000
30 JUN E
2019
$ 000
30 JUN E
2020
$ 000
30 JUN E
2021
$ 000
30 JUN E
2022
$ 000
30 JUN E
2023
$ 000
30 JUN E
2024
$ 000
30 JUN E
2025
$ 000
A SSET S
C urrent assets
Cash and cash equivalents 100 100 100 100 100 100 100 100 100 100 100 Short term deposits 1,083 2,847 1,130 2,013 3,245 4,470 5,804 7,391 9,026 10,650 12,314 Sinking fund/loan redemption/reserves deposits 383 383 151 151 151 151 151 Investments 3,687 3,980 4,283 4,598 4,923 5,260 5,662 6,083 6,523 6,983 7,464 Debtors and other receivables 2,087 2,407 2,165 2,260 2,315 2,373 2,433 2,524 2,591 2,650 2,723 Inventories 33 33 33 33 33 33 33 33 33 33 33 Assets held for sale - - - - - - - - - - - T o tal current assets 7,373 9 ,749 7 ,862 9 ,153 10,766 12,386 14,183 16,130 18,271 20,415 22,633
N o n-current assets
Investments 75 76 77 79 80 81 82 83 84 85 86 Intangible assets 204 200 195 189 183 177 170 162 154 146 137 Investment properties 9,723 9,772 9,820 9,870 9,919 9,969 10,018 10,068 10,119 10,169 10,220 Property, plant and equipment 399,180 404,506 407,427 425,402 427,446 426,757 455,562 458,287 457,208 493,042 496,385 T o tal no n-current assets 409,182 414,554 417,520 435,539 437,628 436,983 465,832 468,601 467,565 503,442 506,828
T o tal assets 416,556 424,303 425,382 444,692 448,394 449,370 480,016 484,731 485,836 523,857 529,462
LIA B ILIT IES
C urrent liabilit ies
Creditors and other payables 2,271 2,040 2,102 2,152 2,164 2,207 2,251 2,314 2,354 2,414 2,482 Employee entitlements 326 326 326 326 326 326 326 326 326 326 326 Public debt - current portion 487 618 662 744 789 837 883 928 862 906 - Finance leases - current portion - - - - - - - - - - - T o tal current liabilit ies 3,085 2 ,984 3 ,090 3 ,222 3 ,279 3 ,370 3 ,460 3 ,568 3 ,543 3 ,646 2 ,809
N o n-current liabilit ies
Public debt - non current portion 13,728 16,538 16,984 16,815 16,305 15,812 15,366 14,629 13,794 12,888 12,906 Finance leases - non current portion - - - - - - - - - - - Landfill aftercare provision 411 410 409 408 407 406 405 404 403 401 400 T o tal no n-current liabilit ies 14,139 16,948 17,393 17,223 16,712 16,218 15,771 15,033 14,196 13,289 13,307
Equity
Public equity 144,490 142,347 141,965 141,610 141,153 141,019 140,536 140,187 139,361 138,485 137,567 Special reserves and trust funds 3,806 4,749 4,949 5,287 5,586 5,838 6,555 7,199 8,299 9,463 10,695 Deprecation reserves 13,879 18,103 18,813 19,722 21,133 22,392 23,671 25,122 26,814 28,485 30,172 Share revaluation reserve 3 4 5 6 7 8 9 10 11 12 14 Asset revaluation reserve 237,154 239,168 239,168 257,623 260,525 260,525 290,013 293,612 293,612 330,476 334,899 Sinking fund reserves - - - - - - - - - - - T o tal equity 399,332 404,371 404,900 424,247 428,403 429,782 460,784 466,130 468,097 506,922 513,347
T o tal liabilit ies and equity 416,556 424,303 425,382 444,692 448,394 449,370 480,016 484,731 485,836 523,857 529,462
PROSPECTIVE STATEMENT OF FINANCIAL POSITION
FOR THE YEARS ENDED 30 JUNE 2015-2025
* The opening balance sheet disagrees with the Annual Plan as both are based on forecast information. The significant difference between the “Annual Plan” and the “Opening Balance” was the fact that the Annual Plan did not take into account the revaluation that will occur at the end of the 2015 financial year. Other changes are not considered significant by Council.
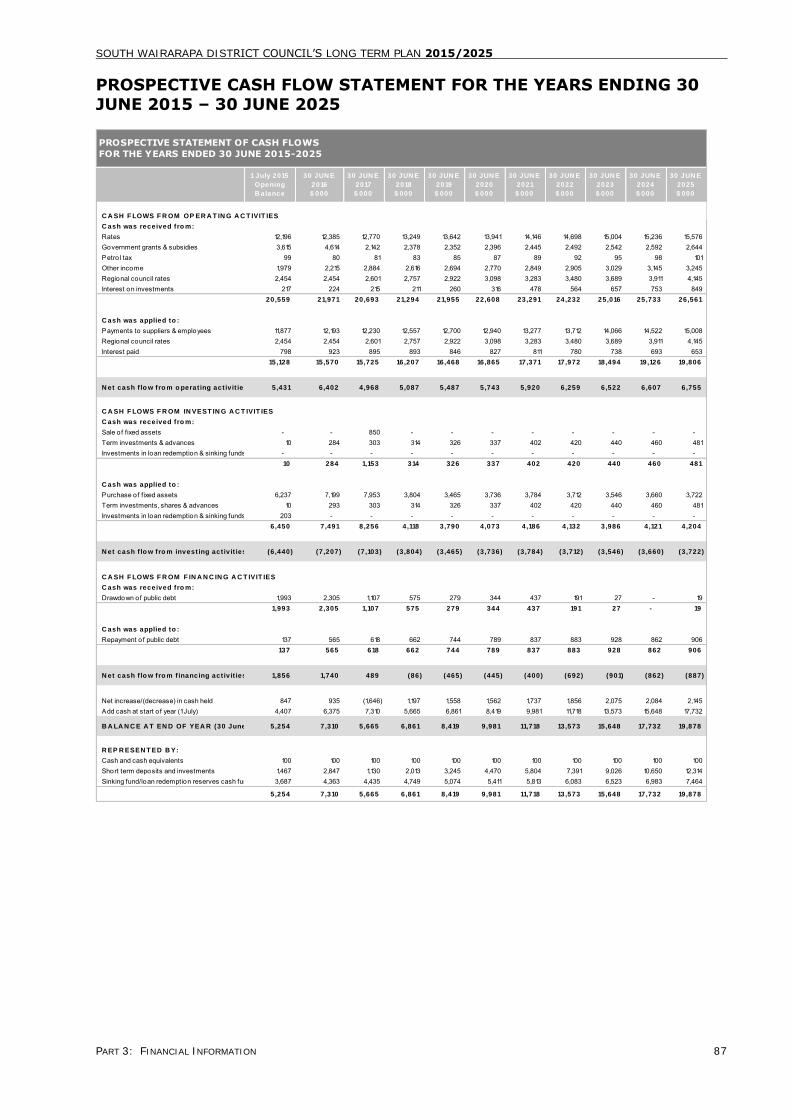
SOUTH WAIRARAPA DISTRICT COUNCIL‟S LONG TERM PLAN 2015/2025
PART 3: FINANCIAL INFORMATION 87
PROSPECTIVE CASH FLOW STATEMENT FOR THE YEARS ENDING 30
JUNE 2015 – 30 JUNE 2025
1 July 2015
Opening
B alance
30 JUN E
2016
$ 000
30 JUN E
2017
$ 000
30 JUN E
2018
$ 000
30 JUN E
2019
$ 000
30 JUN E
2020
$ 000
30 JUN E
2021
$ 000
30 JUN E
2022
$ 000
30 JUN E
2023
$ 000
30 JUN E
2024
$ 000
30 JUN E
2025
$ 000
C A SH F LOWS F R OM OP ER A T IN G A C T IVIT IES
C ash was received fro m:
Rates 12,196 12,385 12,770 13,249 13,642 13,941 14,146 14,698 15,004 15,236 15,576 Government grants & subsidies 3,615 4,614 2,142 2,378 2,352 2,396 2,445 2,492 2,542 2,592 2,644 Petro l tax 99 80 81 83 85 87 89 92 95 98 101 Other income 1,979 2,215 2,884 2,616 2,694 2,770 2,849 2,905 3,029 3,145 3,245 Regional council rates 2,454 2,454 2,601 2,757 2,922 3,098 3,283 3,480 3,689 3,911 4,145 Interest on investments 217 224 215 211 260 316 478 564 657 753 849
20,559 21,971 20,693 21,294 21,955 22,608 23,291 24,232 25,016 25,733 26,561
C ash was applied to :
Payments to suppliers & employees 11,877 12,193 12,230 12,557 12,700 12,940 13,277 13,712 14,066 14,522 15,008 Regional council rates 2,454 2,454 2,601 2,757 2,922 3,098 3,283 3,480 3,689 3,911 4,145 Interest paid 798 923 895 893 846 827 811 780 738 693 653
15,128 15,570 15,725 16,207 16,468 16,865 17,371 17,972 18,494 19,126 19,806
N et cash f lo w fro m o perat ing act iv it ies 5,431 6 ,402 4 ,968 5 ,087 5 ,487 5 ,743 5 ,920 6 ,259 6 ,522 6 ,607 6 ,755
C A SH F LOWS F R OM IN VEST IN G A C T IVIT IES
C ash was received fro m:
Sale of fixed assets - - 850 - - - - - - - - Term investments & advances 10 284 303 314 326 337 402 420 440 460 481 Investments in loan redemption & sinking funds - - - - - - - - - - -
10 284 1,153 314 326 337 402 420 440 460 481
C ash was applied to :
Purchase of fixed assets 6,237 7,199 7,953 3,804 3,465 3,736 3,784 3,712 3,546 3,660 3,722 Term investments, shares & advances 10 293 303 314 326 337 402 420 440 460 481 Investments in loan redemption & sinking funds 203 - - - - - - - - - -
6,450 7 ,491 8 ,256 4 ,118 3 ,790 4 ,073 4 ,186 4 ,132 3 ,986 4 ,121 4 ,204
N et cash f lo w fro m invest ing act iv it ies (6,440) (7 ,207) (7 ,103) (3 ,804) (3 ,465) (3 ,736) (3 ,784) (3 ,712) (3 ,546) (3 ,660) (3 ,722)
C A SH F LOWS F R OM F IN A N C IN G A C T IVIT IES
C ash was received fro m:
Drawdown of public debt 1,993 2,305 1,107 575 279 344 437 191 27 - 19 1,993 2 ,305 1,107 575 279 344 437 191 27 - 19
C ash was applied to :
Repayment of public debt 137 565 618 662 744 789 837 883 928 862 906 137 565 618 662 744 789 837 883 928 862 906
N et cash f lo w fro m f inancing act iv it ies 1,856 1,740 489 (86) (465) (445) (400) (692) (901) (862) (887)
Net increase/(decrease) in cash held 847 935 (1,646) 1,197 1,558 1,562 1,737 1,856 2,075 2,084 2,145 Add cash at start o f year (1 July) 4,407 6,375 7,310 5,665 6,861 8,419 9,981 11,718 13,573 15,648 17,732
B A LA N C E A T EN D OF YEA R (30 June) 5,254 7 ,310 5 ,665 6 ,861 8 ,419 9 ,981 11,718 13,573 15,648 17,732 19,878
R EP R ESEN T ED B Y:
Cash and cash equivalents 100 100 100 100 100 100 100 100 100 100 100 Short term deposits and investments 1,467 2,847 1,130 2,013 3,245 4,470 5,804 7,391 9,026 10,650 12,314 Sinking fund/loan redemption reserves cash funds 3,687 4,363 4,435 4,749 5,074 5,411 5,813 6,083 6,523 6,983 7,464
5,254 7 ,310 5 ,665 6 ,861 8 ,419 9 ,981 11,718 13,573 15,648 17,732 19,878
PROSPECTIVE STATEMENT OF CASH FLOWS
FOR THE YEARS ENDED 30 JUNE 2015-2025
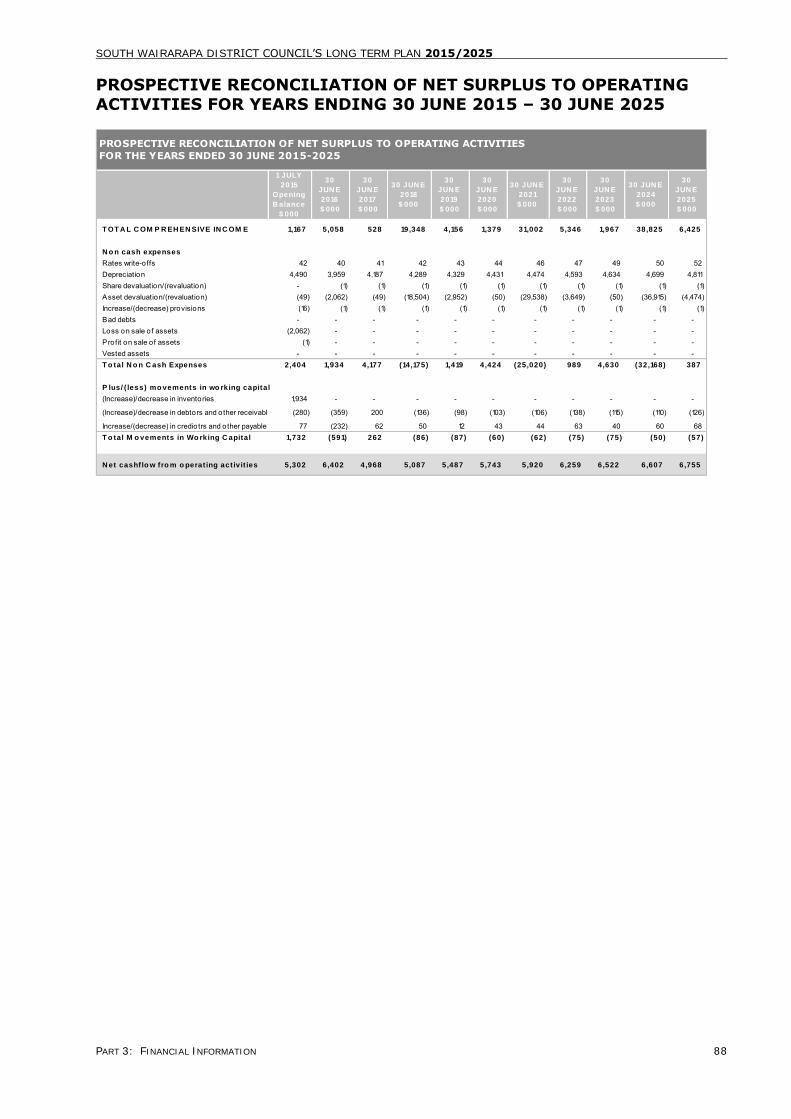
SOUTH WAIRARAPA DISTRICT COUNCIL‟S LONG TERM PLAN 2015/2025
PART 3: FINANCIAL INFORMATION 88
PROSPECTIVE RECONCILIATION OF NET SURPLUS TO OPERATING
ACTIVITIES FOR YEARS ENDING 30 JUNE 2015 – 30 JUNE 2025
1 JULY
2015
Opening
B alance
$ 000
30
JUN E
2016
$ 000
30
JUN E
2017
$ 000
30 JUN E
2018
$ 000
30
JUN E
2019
$ 000
30
JUN E
2020
$ 000
30 JUN E
2021
$ 000
30
JUN E
2022
$ 000
30
JUN E
2023
$ 000
30 JUN E
2024
$ 000
30
JUN E
2025
$ 000
T OT A L C OM P R EH EN SIVE IN C OM E 1,167 5 ,058 528 19,348 4 ,156 1,379 31,002 5 ,346 1,967 38,825 6 ,425
N o n cash expenses
Rates write-offs 42 40 41 42 43 44 46 47 49 50 52 Depreciation 4,490 3,959 4,187 4,289 4,329 4,431 4,474 4,593 4,634 4,699 4,811 Share devaluation/(revaluation) - (1) (1) (1) (1) (1) (1) (1) (1) (1) (1) Asset devaluation/(revaluation) (49) (2,062) (49) (18,504) (2,952) (50) (29,538) (3,649) (50) (36,915) (4,474) Increase/(decrease) provisions (16) (1) (1) (1) (1) (1) (1) (1) (1) (1) (1) Bad debts - - - - - - - - - - - Loss on sale of assets (2,062) - - - - - - - - - - Profit on sale of assets (1) - - - - - - - - - - Vested assets - - - - - - - - - - - T o tal N o n C ash Expenses 2,404 1,934 4 ,177 (14,175) 1,419 4 ,424 (25,020) 989 4 ,630 (32,168) 387
P lus/ ( less) mo vements in wo rking capital
(Increase)/decrease in inventories 1,934 - - - - - - - - - -
(Increase)/decrease in debtors and other receivables (280) (359) 200 (136) (98) (103) (106) (138) (115) (110) (126)
Increase/(decrease) in crediotrs and other payables 77 (232) 62 50 12 43 44 63 40 60 68 T o tal M o vements in Wo rking C apital 1,732 (591) 262 (86) (87) (60) (62) (75) (75) (50) (57)
N et cashflo w fro m o perat ing act ivit ies 5,302 6 ,402 4 ,968 5 ,087 5 ,487 5 ,743 5 ,920 6 ,259 6 ,522 6 ,607 6 ,755
PROSPECTIVE RECONCILIATION OF NET SURPLUS TO OPERATING ACTIVITIES
FOR THE YEARS ENDED 30 JUNE 2015-2025
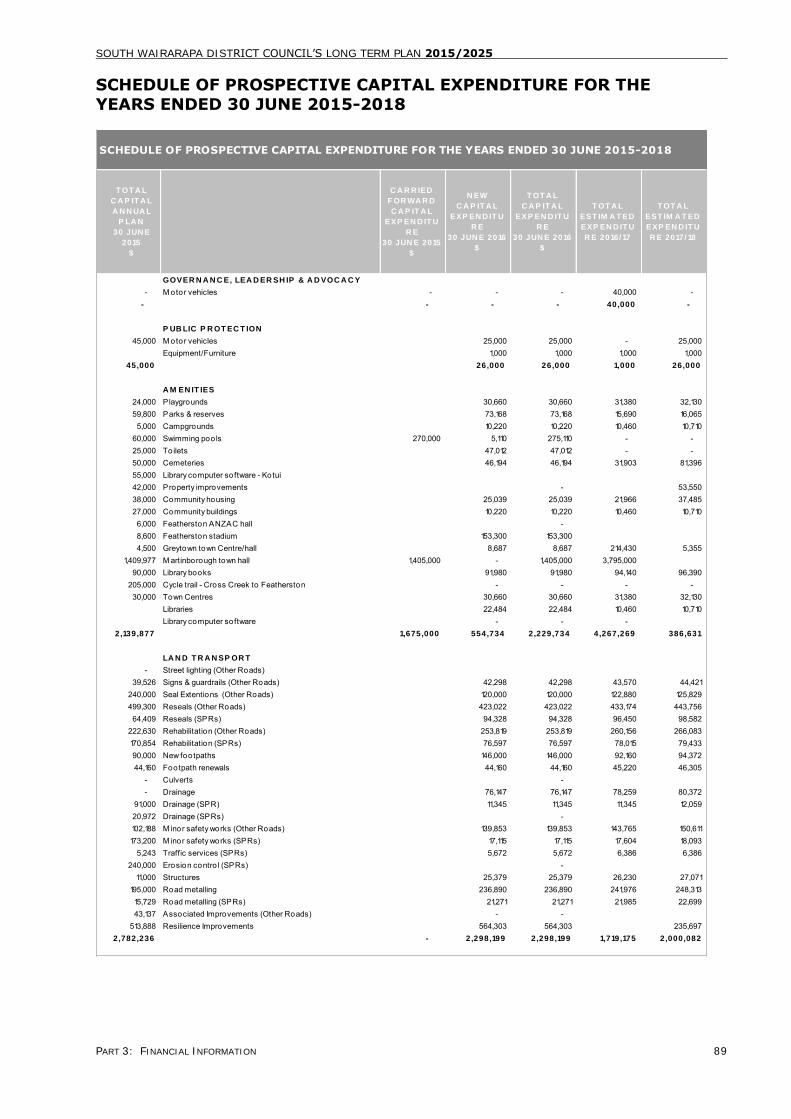
SOUTH WAIRARAPA DISTRICT COUNCIL‟S LONG TERM PLAN 2015/2025
PART 3: FINANCIAL INFORMATION 89
SCHEDULE OF PROSPECTIVE CAPITAL EXPENDITURE FOR THE
YEARS ENDED 30 JUNE 2015-2018
T OT A L
C A P IT A L
A N N UA L
P LA N
30 JUN E
2015
$
C A R R IED
F OR WA R D
C A P IT A L
EXP EN D IT U
R E
30 JUN E 2015
$
N EW
C A P IT A L
EXP EN D IT U
R E
30 JUN E 2016
$
T OT A L
C A P IT A L
EXP EN D IT U
R E
30 JUN E 2016
$
T OT A L
EST IM A T ED
EXP EN D IT U
R E 2016/ 17
T OT A L
EST IM A T ED
EXP EN D IT U
R E 2017/ 18
GOVER N A N C E, LEA D ER SH IP & A D VOC A C Y
- M otor vehicles - - - 40,000 - - - - - 40,000 -
P UB LIC P R OT EC T ION
45,000 M otor vehicles 25,000 25,000 - 25,000 Equipment/Furniture 1,000 1,000 1,000 1,000
45,000 26,000 26,000 1,000 26,000
A M EN IT IES
24,000 P laygrounds 30,660 30,660 31,380 32,130 59,800 Parks & reserves 73,168 73,168 15,690 16,065 5,000 Campgrounds 10,220 10,220 10,460 10,710
60,000 Swimming pools 270,000 5,110 275,110 - - 25,000 To ilets 47,012 47,012 - - 50,000 Cemeteries 46,194 46,194 31,903 81,396 55,000 Library computer software - Kotui42,000 Property improvements - 53,550 38,000 Community housing 25,039 25,039 21,966 37,485 27,000 Community buildings 10,220 10,220 10,460 10,710 6,000 Featherston ANZAC hall - 8,600 Featherston stadium 153,300 153,300 4,500 Greytown town Centre/hall 8,687 8,687 214,430 5,355
1,409,977 M artinborough town hall 1,405,000 - 1,405,000 3,795,000 90,000 Library books 91,980 91,980 94,140 96,390
205,000 Cycle trail - Cross Creek to Featherston - - - - 30,000 Town Centres 30,660 30,660 31,380 32,130
Libraries 22,484 22,484 10,460 10,710 Library computer software - - -
2,139,877 1,675,000 554,734 2 ,229,734 4 ,267,269 386,631
LA N D T R A N SP OR T
- Street lighting (Other Roads)39,526 Signs & guardrails (Other Roads) 42,298 42,298 43,570 44,421
240,000 Seal Extentions (Other Roads) 120,000 120,000 122,880 125,829 499,300 Reseals (Other Roads) 423,022 423,022 433,174 443,756 64,409 Reseals (SPRs) 94,328 94,328 96,450 98,582
222,630 Rehabilitation (Other Roads) 253,819 253,819 260,156 266,083 170,854 Rehabilitation (SPRs) 76,597 76,597 78,015 79,433 90,000 New footpaths 146,000 146,000 92,160 94,372 44,160 Footpath renewals 44,160 44,160 45,220 46,305
- Culverts - - Drainage 76,147 76,147 78,259 80,372
91,000 Drainage (SPR) 11,345 11,345 11,345 12,059 20,972 Drainage (SPRs) - 102,188 M inor safety works (Other Roads) 139,853 139,853 143,765 150,611 173,200 M inor safety works (SPRs) 17,115 17,115 17,604 18,093
5,243 Traffic services (SPRs) 5,672 5,672 6,386 6,386 240,000 Erosion contro l (SPRs) -
11,000 Structures 25,379 25,379 26,230 27,071 195,000 Road metalling 236,890 236,890 241,976 248,313 15,729 Road metalling (SPRs) 21,271 21,271 21,985 22,699 43,137 Associated Improvements (Other Roads) - -
513,888 Resilience Improvements 564,303 564,303 235,697 2,782,236 - 2 ,298,199 2 ,298,199 1,719,175 2 ,000,082
SCHEDULE OF PROSPECTIVE CAPITAL EXPENDITURE FOR THE YEARS ENDED 30 JUNE 2015-2018
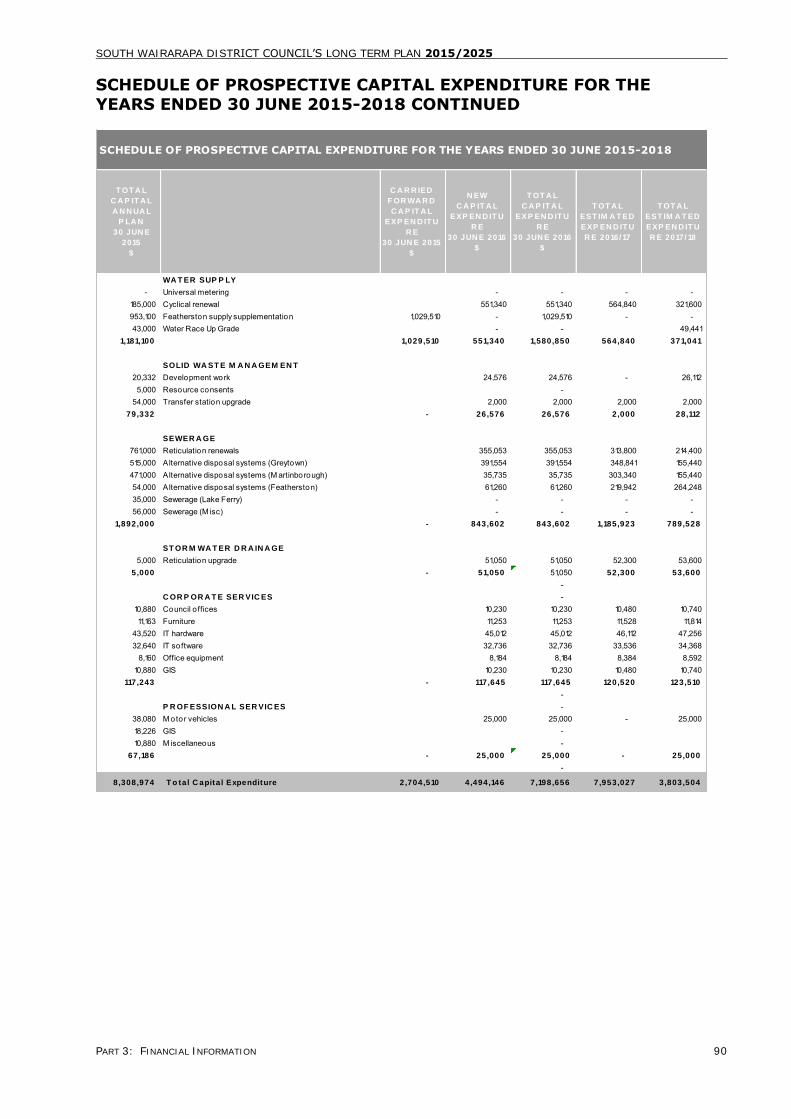
SOUTH WAIRARAPA DISTRICT COUNCIL‟S LONG TERM PLAN 2015/2025
PART 3: FINANCIAL INFORMATION 90
SCHEDULE OF PROSPECTIVE CAPITAL EXPENDITURE FOR THE
YEARS ENDED 30 JUNE 2015-2018 CONTINUED
T OT A L
C A P IT A L
A N N UA L
P LA N
30 JUN E
2015
$
C A R R IED
F OR WA R D
C A P IT A L
EXP EN D IT U
R E
30 JUN E 2015
$
N EW
C A P IT A L
EXP EN D IT U
R E
30 JUN E 2016
$
T OT A L
C A P IT A L
EXP EN D IT U
R E
30 JUN E 2016
$
T OT A L
EST IM A T ED
EXP EN D IT U
R E 2016/ 17
T OT A L
EST IM A T ED
EXP EN D IT U
R E 2017/ 18
WA T ER SUP P LY
- Universal metering - - - - 185,000 Cyclical renewal 551,340 551,340 564,840 321,600 953,100 Featherston supply supplementation 1,029,510 - 1,029,510 - - 43,000 Water Race Up Grade - - 49,441
1,181,100 1,029,510 551,340 1,580,850 564,840 371,041
SOLID WA ST E M A N A GEM EN T
20,332 Development work 24,576 24,576 - 26,112 5,000 Resource consents -
54,000 Transfer station upgrade 2,000 2,000 2,000 2,000 79,332 - 26,576 26,576 2 ,000 28,112
SEWER A GE
761,000 Reticulation renewals 355,053 355,053 313,800 214,400 515,000 A lternative disposal systems (Greytown) 391,554 391,554 348,841 155,440 471,000 A lternative disposal systems (M artinborough) 35,735 35,735 303,340 155,440 54,000 A lternative disposal systems (Featherston) 61,260 61,260 219,942 264,248 35,000 Sewerage (Lake Ferry) - - - - 56,000 Sewerage (M isc) - - - -
1,892,000 - 843,602 843,602 1,185,923 789,528
ST OR M WA T ER D R A IN A GE
5,000 Reticulation upgrade 51,050 51,050 52,300 53,600 5,000 - 51,050 51,050 52,300 53,600
- C OR P OR A T E SER VIC ES -
10,880 Council o ffices 10,230 10,230 10,480 10,740 11,163 Furniture 11,253 11,253 11,528 11,814
43,520 IT hardware 45,012 45,012 46,112 47,256 32,640 IT software 32,736 32,736 33,536 34,368
8,160 Office equipment 8,184 8,184 8,384 8,592 10,880 GIS 10,230 10,230 10,480 10,740
117,243 - 117,645 117,645 120,520 123,510
- P R OF ESSION A L SER VIC ES -
38,080 M otor vehicles 25,000 25,000 - 25,000 18,226 GIS - 10,880 M iscellaneous -
67,186 - 25,000 25,000 - 25,000
-
8,308,974 T o tal C apital Expenditure 2,704,510 4 ,494,146 7 ,198,656 7 ,953,027 3 ,803,504
SCHEDULE OF PROSPECTIVE CAPITAL EXPENDITURE FOR THE YEARS ENDED 30 JUNE 2015-2018
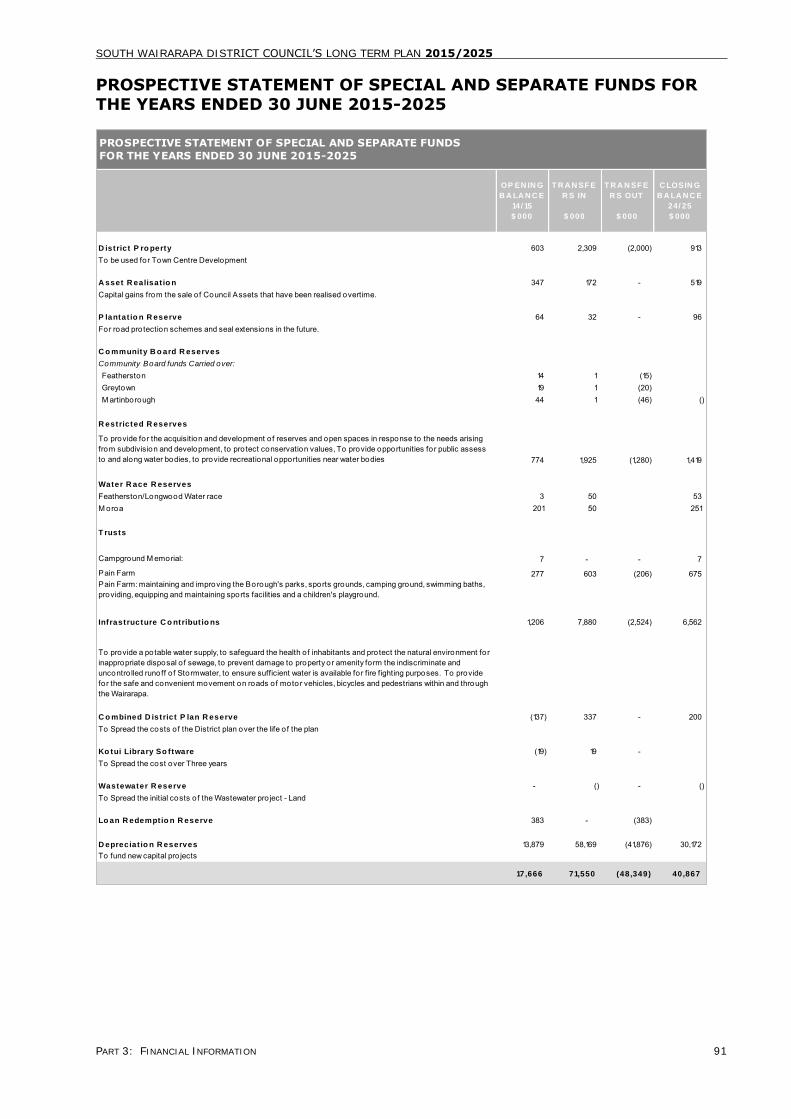
SOUTH WAIRARAPA DISTRICT COUNCIL‟S LONG TERM PLAN 2015/2025
PART 3: FINANCIAL INFORMATION 91
PROSPECTIVE STATEMENT OF SPECIAL AND SEPARATE FUNDS FOR
THE YEARS ENDED 30 JUNE 2015-2025
OP EN IN G
B A LA N C E
14/ 15
$ 000
T R A N SF E
R S IN
$ 000
T R A N SF E
R S OUT
$ 000
C LOSIN G
B A LA N C E
24/ 25
$ 000
D istrict P ro perty 603 2,309 (2,000) 913 To be used for Town Centre Development
A sset R ealisat io n 347 172 - 519 Capital gains from the sale of Council Assets that have been realised overtime.
P lantat io n R eserve 64 32 - 96 For road protection schemes and seal extensions in the future.
C o mmunity B o ard R eserves
Community Board funds Carried over:
Featherston 14 1 (15) Greytown 19 1 (20) M artinborough 44 1 (46) ()
R estricted R eserves
To provide for the acquisition and development of reserves and open spaces in response to the needs arising from subdivision and development, to protect conservation values, To provide opportunities for public assess to and along water bodies, to provide recreational opportunities near water bodies 774 1,925 (1,280) 1,419
Water R ace R eserves
Featherston/Longwood Water race 3 50 53 M oroa 201 50 251
T rusts
Campground M emorial: 7 - - 7
Pain Farm 277 603 (206) 675 Pain Farm: maintaining and improving the Borough's parks, sports grounds, camping ground, swimming baths, providing, equipping and maintaining sports facilities and a children's playground.
Infrastructure C o ntribut io ns 1,206 7,880 (2,524) 6,562
To provide a potable water supply, to safeguard the health of inhabitants and protect the natural environment for inappropriate disposal o f sewage, to prevent damage to property or amenity form the indiscriminate and uncontro lled runoff o f Stormwater, to ensure sufficient water is available for fire fighting purposes. To provide for the safe and convenient movement on roads of motor vehicles, bicycles and pedestrians within and through the Wairarapa.
C o mbined D istrict P lan R eserve (137) 337 - 200 To Spread the costs of the District plan over the life o f the plan
Ko tui Library So ftware (19) 19 - To Spread the cost over Three years
Wastewater R eserve - () - () To Spread the initial costs of the Wastewater pro ject - Land
Lo an R edemptio n R eserve 383 - (383)
D epreciat io n R eserves 13,879 58,169 (41,876) 30,172 To fund new capital pro jects
17,666 71,550 (48,349) 40,867
PROSPECTIVE STATEMENT OF SPECIAL AND SEPARATE FUNDS
FOR THE YEARS ENDED 30 JUNE 2015-2025

SOUTH WAIRARAPA DISTRICT COUNCIL‟S LONG TERM PLAN 2015/2025
PART 3: FINANCIAL INFORMATION 92
FUNDING IMPACT STATEMENT FOR THE YEARS ENDED 30 JUNE 2015-2025
The revenue and financing mechanisms to be used
to cover the estimated expenses of the Council for
the Year ended 30 June 2016 are described in the
Revenue and Financing Policy.
The method and impact of both general and
targeted rates is covered in “The Rating System”
section which follows. The specific rating details
given in the following pages have been drawn from
and are consistent with Council‟s LTP.
Rating System
Introduction
Schedule 101(3) of the Local Government Act 2002
requires Council to include a funding impact
statement in its Annual Plan. The following matters
cover the specific statements to be provided as set
out in Schedule 101(3).
This Funding Impact Statement should be read in
conjunction with Council‟s Revenue and Financing
Policy.
All figures for Rates and Charges in this Funding
Impact Statement are inclusive of GST.
General Rates
The Council proposes to set a general rate based on
the land value of each rating unit in the district.
The general rate will be set on a differential basis
over three rating groups:
Group 1 Commercial. A rate of 0.004218
cents per dollar of rateable land value. The
total we anticipate to raise from this rate is
$178,601.
Group 2 Urban. A rate of 0.002109 cents per
dollar of rateable land value. The total we
anticipate to raise from this rate is $807,793.
Group 3 Rural. A rate of 0.001999 cents per
dollar of rateable land value. The total we
anticipate to raise from this rate is
$3,456,085.
In addition, the Council has set a Uniform Annual
General Charge on each rating unit of $543. The
total we anticipate to raise from this rate is
$3,182,511. Council‟s UAGC has not exceeded the
30% rating cap requirement specified in Section 21
of the Local Government (Rating) Act 2002.
The General Rate, the Uniform Annual General
Charge and the Amenities Charge will be used to
fund, or assist with funding, all Council activities
other than those funded by way of targeted rates
for water supply, sewage disposal and refuse
collection and disposal.
Differential Matters and Categories
The Council proposes to differentiate the General
Rate based on land valuation (Schedule 2 Local
Government (Rating) Act 2002).
The differential categories are:
Group 1 Commercial – all rating units that are
used (or available) primarily for any
commercial or industrial purpose.
Group 2 Urban – all rating units used for
residential and related purposes within the
urban areas of the District Plan.
Group 3 Rural – all rating units within the
rural area in the District Plan.
Separately Used or Inhabitable Part of a Rating
Unit
The following definition applies to the levying of all
targeted rates by the South Wairarapa District
Council where the Council has determined that the
rate shall apply to each separately used or
inhabitable part of a rating unit.
A separately used or inhabitable part of a rating
unit includes any portion of any separate rating unit
used or inhabitable by any person, other than the
ratepayer (as defined by clause 11 of the Local
Government (Rating) Act 2002), having the right to
use or inhabit that portion by virtue of a tenancy,
lease, license or other agreement.
Water Races
Council proposes to set a targeted rate based on
land value for each rating unit in the Featherston–
Longwood water race rating district and separately
for each rating unit in the Moroa Water Race rating
district that have access to the races.
The Featherston-Longwood rate will be .001899
cents per dollar of land value. The total we
anticipate to raise from this rate is $74,750.
The Moroa rate will be .0004505 cents per dollar of
land value. The total we anticipate to raise from
this rate is $80,500.
No lump sum contributions will be invited in respect
of this targeted rate.

SOUTH WAIRARAPA DISTRICT COUNCIL‟S LONG TERM PLAN 2015/2025
PART 3: FINANCIAL INFORMATION 93
Sewage Disposal
Council proposes to set a uniform targeted rate for
wastewater disposal based on each separately used
or inhabitable part of a rating unit which is serviced
by a connection to the system of $465 per serviced
connection. Serviceable rating units, which are
those which could be connected to the system but
are not at this time, will be 50% of this charge of
$233 per serviceable connection.
The uniform targeted rate covers the first two toilet
pans for each separately used or inhabitable part of
a rating unit and the same charge is made for each
additional pan.
No lump sum contributions will be invited in respect
of this targeted rate.
The total we anticipate to raise from this rate is
$1,923,882.
Water Supply
Council proposes to set a uniform targeted rate for
water supply based on each separately used or
inhabitable part of rating unit for all urban, rural or
commercial rating units which are serviced by a
connection to the system of $604 per serviced
connection. Serviceable rating units which are
those who could be serviced but are not at this time
will be 50% of this charge $302 per serviceable
connection.
The uniform targeted rate will apply to each
connection. The total we anticipate to raise from
this rate is $2,533,333.
An additional targeted rate is proposed where the
volume exceeds 350m3 per year for all metered
connections. This charge will be $1.84 per m3, for
the 2015/16 year. The aforesaid volume will be
reviewed as and when required in future.
No lump sum contributions will be invited in respect
of this targeted rate.
Amenities
Council proposes a uniform targeted rate for all
rating units in the urban areas of Featherston,
Greytown and Martinborough for the provision of
amenity facilities of $325 per urban rating unit. The
total we anticipate to raise from this rate is
$1,022,757.
Council proposes a different uniform targeted rate
for all rating units in the rural area of the district for
the provision of amenity facilities of $165 per rural
rating unit. The total we anticipate to raise from
this rate is $438,324.
The amenity facilities include parks and reserves,
swimming baths, community buildings (including
public halls) and other civic amenities.
Refuse Collection
The Council proposes to set a uniform, targeted rate
for rubbish collection and disposal, of $136 this will
apply to rating units and separately inhabited parts
of rating units where the Council provides refuse
collection or use of disposal facilities. The total we
anticipate to raise from this rate is $559,541.
Overall Rating Levels
The combined effect on individual rating units of a
2.98% increase in total rates will vary considerably
from rating unit to rating unit depending on the
different types of rates and valuations applicable.
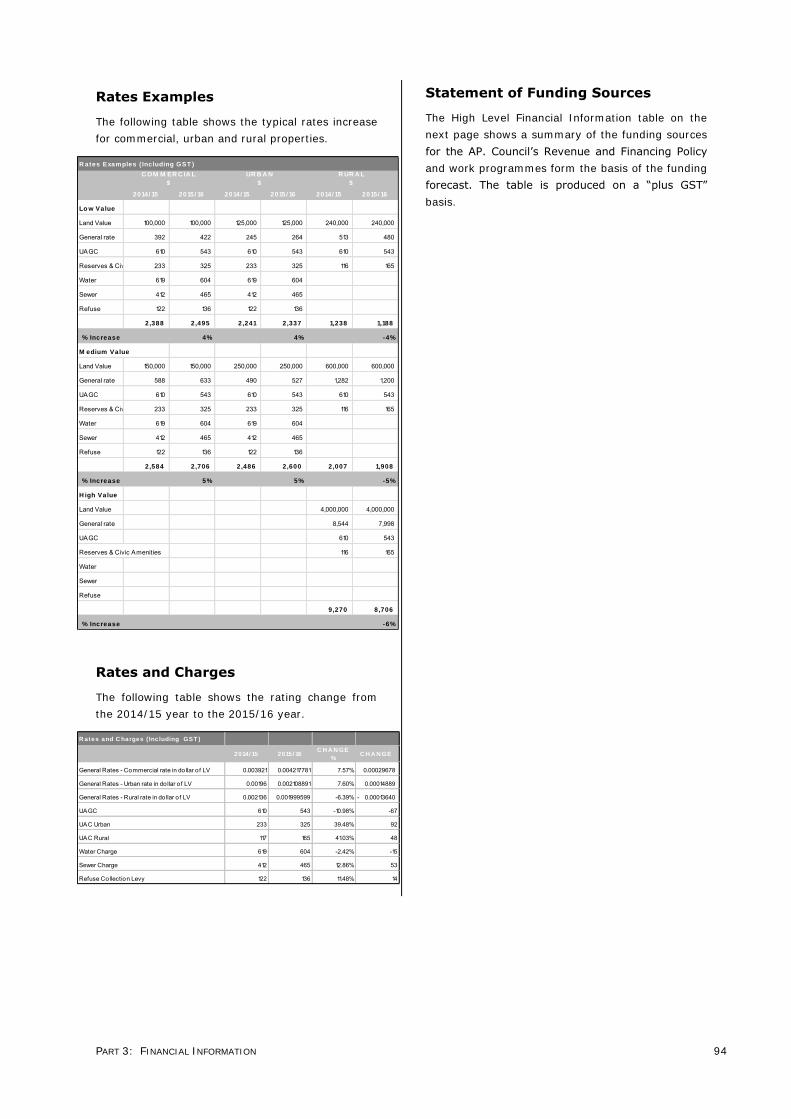
PART 3: FINANCIAL INFORMATION 94
Rates Examples
The following table shows the typical rates increase
for commercial, urban and rural properties.
R ates Examples ( Including GST )
2014/ 15 2015/ 16 2014/ 15 2015/ 16 2014/ 15 2015/ 16
Lo w Value
Land Value 100,000 100,000 125,000 125,000 240,000 240,000
General rate 392 422 245 264 513 480
UAGC 610 543 610 543 610 543
Reserves & Civic Amenities233 325 233 325 116 165
Water 619 604 619 604
Sewer 412 465 412 465
Refuse 122 136 122 136
2,388 2 ,495 2 ,241 2 ,337 1,238 1,188
% Increase 4% 4% -4%
M edium Value
Land Value 150,000 150,000 250,000 250,000 600,000 600,000
General rate 588 633 490 527 1,282 1,200
UAGC 610 543 610 543 610 543
Reserves & Civic Amenities233 325 233 325 116 165
Water 619 604 619 604
Sewer 412 465 412 465
Refuse 122 136 122 136
2,584 2 ,706 2 ,486 2 ,600 2 ,007 1,908
% Increase 5% 5% -5%
H igh Value
Land Value 4,000,000 4,000,000
General rate 8,544 7,998
UAGC 610 543
Reserves & Civic Amenities 116 165
Water
Sewer
Refuse
9,270 8 ,706
% Increase -6%
C OM M ER C IA L
$
UR B A N
$
R UR A L
$
Rates and Charges
The following table shows the rating change from
the 2014/15 year to the 2015/16 year.
R ates and C harges ( Including GST )
2014/ 15 2015/ 16C H A N GE
%C H A N GE
General Rates - Commercial rate in dollar of LV 0.003921 0.004217781 7.57% 0.00029678
General Rates - Urban rate in dollar of LV 0.00196 0.002108891 7.60% 0.00014889
General Rates - Rural rate in dollar of LV 0.002136 0.001999599 -6.39% 0.00013640-
UAGC 610 543 -10.98% -67
UAC Urban 233 325 39.48% 92
UAC Rural 117 165 41.03% 48
Water Charge 619 604 -2.42% -15
Sewer Charge 412 465 12.86% 53
Refuse Collection Levy 122 136 11.48% 14
Statement of Funding Sources
The High Level Financial Information table on the
next page shows a summary of the funding sources
for the AP. Council‟s Revenue and Financing Policy
and work programmes form the basis of the funding
forecast. The table is produced on a “plus GST”
basis.
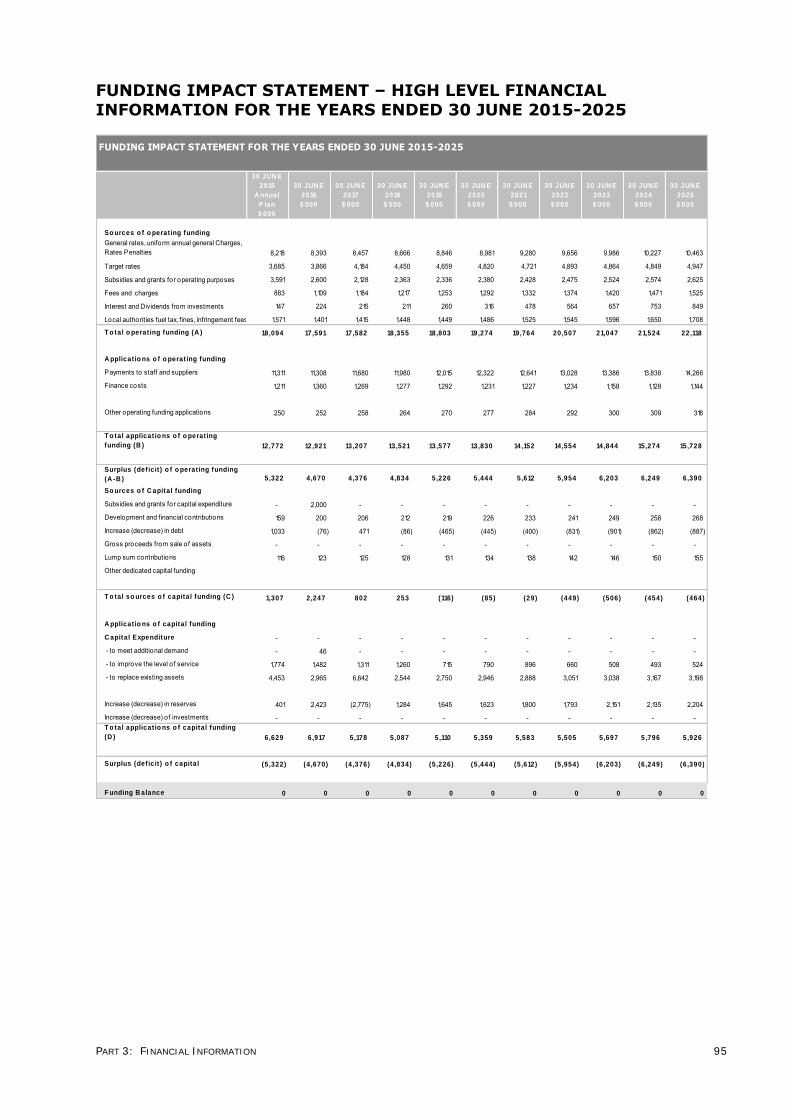
PART 3: FINANCIAL INFORMATION 95
FUNDING IMPACT STATEMENT – HIGH LEVEL FINANCIAL
INFORMATION FOR THE YEARS ENDED 30 JUNE 2015-2025
30 JUN E
2015
A nnual
P lan
$ 000
30 JUN E
2016
$ 000
30 JUN E
2017
$ 000
30 JUN E
2018
$ 000
30 JUN E
2019
$ 000
30 JUN E
2020
$ 000
30 JUN E
2021
$ 000
30 JUN E
2022
$ 000
30 JUN E
2023
$ 000
30 JUN E
2024
$ 000
30 JUN E
2025
$ 000
So urces o f o perat ing funding
General rates, uniform annual general Charges, Rates Penalties 8,218 8,393 8,457 8,666 8,846 8,981 9,280 9,656 9,986 10,227 10,463
Target rates 3,685 3,866 4,184 4,450 4,659 4,820 4,721 4,893 4,864 4,849 4,947
Subsidies and grants for operating purposes 3,591 2,600 2,128 2,363 2,336 2,380 2,428 2,475 2,524 2,574 2,625
Fees and charges 883 1,109 1,184 1,217 1,253 1,292 1,332 1,374 1,420 1,471 1,525
Interest and Dividends from investments 147 224 215 211 260 316 478 564 657 753 849
Local authorities fuel tax, fines, infringement fees, and other receipts1,571 1,401 1,415 1,448 1,449 1,486 1,525 1,545 1,596 1,650 1,708
T o tal o perat ing funding (A ) 18,094 17,591 17,582 18,355 18,803 19,274 19,764 20,507 21,047 21,524 22,118
A pplicat io ns o f o perat ing funding
Payments to staff and suppliers 11,311 11,308 11,680 11,980 12,015 12,322 12,641 13,028 13,386 13,838 14,266
Finance costs 1,211 1,360 1,269 1,277 1,292 1,231 1,227 1,234 1,158 1,128 1,144
Other operating funding applications 250 252 258 264 270 277 284 292 300 309 318
T o tal applicat io ns o f o perat ing
funding (B ) 12,772 12,921 13,207 13,521 13,577 13,830 14,152 14,554 14,844 15,274 15,728
Surplus (def ic it ) o f o perat ing funding
(A -B ) 5,322 4 ,670 4 ,376 4 ,834 5 ,226 5 ,444 5 ,612 5 ,954 6 ,203 6 ,249 6 ,390
So urces o f C apital funding
Subsidies and grants for capital expenditure - 2,000 - - - - - - - - -
Development and financial contributions 159 200 206 212 219 226 233 241 249 258 268
Increase (decrease) in debt 1,033 (76) 471 (86) (465) (445) (400) (831) (901) (862) (887)
Gross proceeds from sale of assets - - - - - - - - - - -
Lump sum contributions 116 123 125 128 131 134 138 142 146 150 155
Other dedicated capital funding
T o tal so urces o f capital funding (C ) 1,307 2 ,247 802 253 (116) (85) (29) (449) (506) (454) (464)
A pplicat io ns o f capital funding
C apital Expenditure - - - - - - - - - - -
- to meet additional demand - 46 - - - - - - - - -
- to improve the level o f service 1,774 1,482 1,311 1,260 715 790 896 660 508 493 524
- to replace existing assets 4,453 2,965 6,642 2,544 2,750 2,946 2,888 3,051 3,038 3,167 3,198
Increase (decrease) in reserves 401 2,423 (2,775) 1,284 1,645 1,623 1,800 1,793 2,151 2,135 2,204
Increase (decrease) of investments - - - - - - - - - - - T o tal applicat io ns o f capital funding
(D ) 6,629 6 ,917 5 ,178 5 ,087 5 ,110 5 ,359 5 ,583 5 ,505 5 ,697 5 ,796 5 ,926
Surplus (def ic it ) o f capital (5 ,322) (4 ,670) (4 ,376) (4 ,834) (5 ,226) (5 ,444) (5 ,612) (5 ,954) (6 ,203) (6 ,249) (6 ,390)
F unding B alance 0 0 0 0 0 0 0 0 0 0 0
FUNDING IMPACT STATEMENT FOR THE YEARS ENDED 30 JUNE 2015-2025

Part 4Policies and
StrategiesIntroduction
Significance and Engagement Policy
Summary of Policy Changes
Revenue and Financing Policy
Liability and Management Policy
Investment Policy
Development Contributions /Financial Contributions Policy
Remission and Postponement of Rates on Maori Freehold Land Policy
Remission of Rates Policy
Postponement of Rates Policies
Financial Reporting and Prudence Disclosure Statement
Financial Strategy
Infrastructure Strategy
SOUTH WAIRARAPA
DISTRICT COUNCIL

SOUTH WAIRARAPA DISTRICT COUNCIL‘S LONG TERM PLAN 2015/2025
PART 4: STRATEGIES AND POLICIES 96
INTRODUCTION TO THE STRATEGIES AND POLICIES
The funding and financial strategy and policies have been reviewed and updated as part of the LTP 2015/2025
process and an infrastructure strategy implemented. A summary of changes is included in this section which
provides the intent of the policy, issues relating to any changes and the expected financial implications of these
changes. The following policies are included in this section:
Significance and Engagement Policy
Revenue and Financing Policy
Liability Management Policy
Investment Policy
Development Contributions/Financial Contributions Policy
Remission and Postponement of Rates on Maori Freehold Land Policy
Rates Remission Policy
Rates Postponement Policy
Also included in this section is Council‘s Financial Strategy for 2015/25 and the Infrastructure Policy to 2045.
SOUTH WAIRARAPA DISTRICT COUNCIL‘S LONG TERM PLAN 2015/2025
PART 4: STRATEGIES AND POLICIES 97
SUMMARY OF POLICY CHANGES
Revenue and Financing Policy
The policy outlines how operating and capital
expenditure for each activity will be funded, what
funding sources are available to Council and how
spending contributes to the community outcomes
included in the LTP. Changes made to the policy
were minor wording changes only.
Financial Impact
There are no material financial implications arising
from the adoption of the updated Revenue and
Financing Policy.
Liability Management Policy
The policy outlines how Council will manage
borrowing and debt. Changes made to the policy
are minor wording changes, introduction of a
borrowing limit and security for borrowings
clarification.
Issues
The change to dispense with the use of sinking
funds and allow the conversion of the existing
sinking fund loans to ordinary loans. Sinking funds
are an inefficient way to set funds aside for future
repayment we borrow the principal and repay
interest only on that loan. At the same time we set
aside a calculated amount each month so that, after
adding interest earned on the funds set aside, there
will be sufficient funds set aside to repay the loan
when it is due.
Financial Impact
There are no material impacts arising from the
adoption of these changes.
Investment Policy
The policy outlines how Council manages
investments and minimises risk. The policy now
includes AIRTEL, Farmlands equity investments,
ETS trading scheme units, the LGFA policy and
statements regarding the objectives for holding the
investments and the return targets for the
investments (new requirement of section 101A of
the Local Government Act).
Financial Impact
There are no material financial implications arising
from the adoption of the updated Investment Policy.
Development Contributions or
Financial Contributions Policy
The policy outlines the requirements for financial
contributions for subdivision and land use consents.
The policy in this document replicates the Financial
Contribution Chapter (23) from the Wairarapa
Combined District Plan.
Financial Impact
There are no material financial implications arising
from the adoption of the updated Financial
Contributions Policy.
Remission and Postponement of
Rates on Maori Freehold Land Policy
The policy recognises that certain Maori land is
eligible for relief from rates. There are no changes
from the previous policy.
Financial Impact
There are no material financial implications arising
from the adoption of the proposed Remission and
Postponement of Rates on Maori Freehold Land
Policy.
Remission of Rates Policy
The policy provides a means for allowing rates relief
where it is considered fair and reasonable to do so.
The remission period has been extended from 5
months up to a period of 24 months.
Issues
3.2.1 Replace ―charitable‖ with ―not for profit‖.
3.2.7 Additional clause to allow remission to be on-
going until criteria no longer met rather than
annual. This reduces administrative overhead.
Financial Impact
Reduction in administrative overhead.
Postponement of Rates Policy
The policy outlines under what conditions Council
will allow postponement of rates.
Issues
3.3.3 Removed the clause to source adequate
insurance for uninsured ratepayers as this is not
current practice.
Financial Impact
There are no material financial implications arising
from the adoption of this amendment.
SOUTH WAIRARAPA DISTRICT COUNCIL‘S LONG TERM PLAN 2015/2025
PART 4: STRATEGIES AND POLICIES 98
SIGNIFICANCE AND ENGAGEMENT POLICY
Background
The Local Government Act 2002 (LGA) requires
local authorities to have a significance and
engagement policy.
References below relate to the LGA unless specified
otherwise.
Once a decision is determined to be ―significant‖ in
accordance with the general approach, criteria and
procedures in this policy, a higher standard of
compliance is required. Section 76(3)(b) requires
that the Council must ensure before a significant
decision is made that subsection 76(1) has been
―appropriately observed‖.
The legislation (schedule 10 LGA) only requires the
Long Term Plan (LTP) to contain a summary of the
Significance and Engagement Policy, but the entire
policy is included in the LTP in place of the
summary.
South Wairarapa District Council
“General Approach” to Significance
The Local Government Act 2002 requires local
authorities to set out their ―general approach to
determining the significance of proposals and
decisions in relation to issues, assets, or other
matters‖ (s90(1)(a)).
The Council will determine the significance of any
issue requiring a decision, by making judgments
according to the likely impact of that decision on:
a) The current and future economic, cultural,
environmental and social well-being of the
district or region.
b) The achievement of, or ability to achieve, the
Council‘s strategic issues and objectives as
currently set out in the LTP.
c) Any persons who are likely to be particularly
affected by, or interested in, the issue,
proposal, decision, or matter.
d) The capacity of the local authority to perform
its role and carry out its activities, now and in
the future.
e) The financial, resource and other costs of the
decision.
Thresholds, Criteria and Procedures
The Policy must also set out any ―thresholds,
criteria, and procedures‖ that the Council uses for
assessing significance (section 90(1)(b)).
The range of issues requiring decisions by local
authorities is very wide and it is impossible to
foresee every possibility. It is therefore
recommended that thresholds are not used to
determine significance.
The following procedure will be used to determine
significance:
Procedure for Determining Significance
a) Identification of an issue requiring a Council
decision (generally by officers).
b) Assessment of significance using the criteria set
out in ―South Wairarapa District Council‘s
General Approach to Significance‖, set out
above; followed by:
c) Officer or other professional advice on
significance and options; followed by:
d) Council consideration and final decision-making
on the:
Degree of significance of the issue.
Appropriate level and type of consultation.
Advice from Council officers will, in normal
circumstances, be included in the Council approved
report format. It is proposed that this format be
revised so that it specifically considers the impact of
decisions as set out in the ―general approach‖
above.
Strategic Assets
This policy must also list those Council owned
assets, considered by the Council to be ―strategic
assets‖ (section 90(2)).
―Strategic asset‖ is defined in the LGA as ― … an
asset or group of assets that the local authority
needs to retain if the local authority is to maintain
the local authority‘s capacity to achieve or promote
any outcome that the local authority determines to
be important to the current or future well-being of
the community‖ and includes:
a) Any asset or group of assets listed in
accordance with section 90(2) by the local
authority; and
b) Any land or building owned by the local
authority and required to maintain the local
authority‘s capacity to provide affordable
housing as part of its social policy; and
SOUTH WAIRARAPA DISTRICT COUNCIL‘S LONG TERM PLAN 2015/2025
PART 4: STRATEGIES AND POLICIES 99
c) Any equity securities held by the local
authority in –
A port company within the meaning of the Port Companies Act 1998;
An airport company within the meaning of the Airport Authorities Act 1966.
The list below shows the South Wairarapa District
Council owned assets that are considered to be
―strategic assets‖. Only those assets that are
important to achieving the Council strategic
objectives have been included.
Roading network (including footpaths, street
lighting and parking).
Wastewater network and oxidation ponds.
Water treatment, storage and supply network.
Solid waste facilities.
Stormwater network and water races.
Reserves and sports fields.
Swimming pools.
Libraries.
Community buildings.
Public toilets.
Cemeteries.
Pensioner housing.
NOTE:
1. Pensioner housing is a strategic asset by law.
2. The Council considers all asset classes listed above as
single whole assets. This is because the asset class as
a whole delivers the service. Strategic decisions,
therefore only concern the whole asset class and not
individual components, unless that component
substantially affects the ability of the Council to
deliver the service, or would be deemed significant
and strategic under the procedure above.
Consultation
Rationale
To ensure a consistent approach is taken to
consultation across South Wairarapa District Council
in compliance with the consultation requirements of
the Local Government Act 2002.
This policy does not cover the submission process
that may be required under the Resource
Management Act 1991 or the Amendment Act 2009.
Introduction and Background
As an organisation responsible to the community it
serves, South Wairarapa District Council is
committed to on-going and effective consultation.
The Council already conducts consultation with the
public on many issues and this policy reflects both
current practice and its responsibilities under the
Local Government Act 2002.
The Council will make its consultation policy publicly
available after the three-yearly Local Body election
of the Mayor and councillors, as set out in section
40 (1)(h) of the Local Government Act 2002.
Note that within this policy, the word council refers
to any decision-maker within Council. This could be
the Council, a committee or sub-committee or an
officer with delegated authority.
Commitment to Consultation
A well-structured consultation process is a key part
of improved decision making. The Council welcomes
and values input from the people of South
Wairarapa district so it can adequately reflect their
views in its decision making. Decision making is
improved as a result.
The Council is also committed to determining the
overall community view as accurately as possible
and will use the appropriate techniques to meet this
objective.
Consultation will enhance the democratic process by
contributing to the decision making of the Council.
The Council is committed to acknowledging the
unique perspective of Māori and will consult with
Council‘s Maori Standing Committee.
What is Consultation?
Consultation is a genuine exchange of information,
points of view and options for decisions between
affected and interested people and decision-makers
before a decision has been made.
It does not mean that the decision will be delegated
to those involved in the consultation process, but
rather that the decision, when made, is likely to be
improved by the public's involvement.
For the purpose of this policy South Wairarapa
District Council has adopted the following definition
of consultation:
Consultation Means the Council Will:
Seek input on a concept, issue or proposal that
has not been decided upon.
Encourage those people who will or may be
affected by, or have an interest in, the matter
Consultation is the dialogue that precedes
decision-making
SOUTH WAIRARAPA DISTRICT COUNCIL‘S LONG TERM PLAN 2015/2025
PART 4: STRATEGIES AND POLICIES 100
to present their views (section 82 (1)(b) Local
Government Act 2002).
Provide those people who will or may be
affected by, or have an interest in, the matter
with reasonable access to relevant information
about the matter, and clear information about
the purpose of the consultation and the scope
of the decisions to be taken following
consideration of the views presented (section
82 (1)(a) and (c) Local Government Act 2002).
Give people a reasonable opportunity to
present their views according to their
preferences and needs (section 82 (1)(d) Local
Government Act 2002).
Listen to what people have to say and consider
their views and comments with an open mind
(section 82 (1)(e) of the Local Government Act
2002).
Decide if and how any proposal should be
changed or developed further.
Report on the final decision and the reasons for
it (section 82 (1)(f) Local Government Act
2002).
Respond to the people involved in the process
(section 82 (1)(f) Local Government Act 2002).
According to this definition, the public's role in
consultation will generally be one of expressing an
opinion and providing additional information. It
does not usually mean that the decision has been
delegated to them.
Consultation may include market research
techniques such as quantitative surveys, qualitative
focus groups and individual interviews.
Consultation is Not:
Solely providing information (although effective
communication forms part of consultation).
Always about reaching an agreement or
consensus.
Always about negotiation.
Consultation is Not Appropriate When:
A decision has already been made or the likely
decision is apparent (section 82 (1)(e) Local
Government Act 2002).
There is a need for commercial sensitivity.
It is a small issue with little public interest.
The likely costs of the consultation are not in
proportion to the benefits (section 82 (4)(e)
Local Government Act 2002).
There is a threat to public health or safety.
SOUTH WAIRARAPA DISTRICT COUNCIL‘S LONG TERM PLAN 2015/2025
PART 4: STRATEGIES AND POLICIES 101
REVENUE AND FINANCING POLICY
Introduction
The Revenue and Financing Policy (Policy) contains
Council's policies with respect to the funding of
operating expenditure and capital expenditure from
various revenue sources. When read in conjunction
with the Funding Impact Statement (Rating), this
policy provides the link between the funding
decisions taken at the activity level, with the
eventual rates assessment that each ratepayer will
receive. It is also the lead policy for other funding
and financial policies including:
Liability Management Policy.
Investment Policy.
Development and/or Financial Contributions
Policy.
Rates Remission Policies.
Rates Postponement Policy.
Section 101 (3) of the Local Government Act 2002
(LGA) set out the requirements Council must
consider as part of the development of the policy.
Section 103 LGA sets out the general contents of
the Policy.
The first step requires consideration, at activity
level of each of the following:
Community outcomes - the community
outcomes to which the activity primarily
contributes (in other words your rationale for
service delivery).
The user/beneficiary pays principle – the
distribution of benefits between the community
as a whole, any identifiable part of the
community, and individuals.
The intergenerational equity principle – the
period in or over which those benefits are
expected to accrue.
The exacerbator pays principle – the extent to
which the actions or inaction of particular
individuals or a group contribute to the need to
undertake the activity.
The costs and benefits, including consequences
for transparency and accountability, of funding
the activity distinctly from other activities.
Community Outcomes
The requirement to consider community outcomes
in the funding process is seen as an obligation for
Council to consider why it is engaged in an activity
and to what level. To that extent, possible funding
of activities should be consistent with achievement
of desired outcomes.
Distribution of Benefits
At this stage, Council is required to consider who
benefits from the activities performed by Council.
This is expressed as the Public/Private split.
Economic theory suggests there are two main
characteristics that need to be considered when
looking at a particular good or service:
Rivalry in Consumption
A good is a rival in consumption if one person's
consumption of the good or service prevents others
from doing so, e.g. a chocolate bar is a good with a
large degree of rivalry in consumption, i.e. if Bill
eats it, Jane cannot.
Excludability
A good or service is excludable if a person can be
prevented from consuming the good or service, e.g.
if Bill does not buy a movie ticket, then the usher
can exclude him by preventing him from entering
the theatre.
At one end of the continuum there are so-called
'public goods'. These are goods which are both non-
rival and non-excludable, i.e. everyone can
consume them and no one can be prevented from
consuming them if they wish. A good example of a
public good is national defence, where the whole
community is protected from an invasion by the
armed forces whether it wishes to be or not, and
this protection cannot be removed from anyone in
New Zealand.
At the other end of the continuum are 'private
goods' which are both rival and excludable. Most
daily consumables are private goods.
Very few goods and services are entirely public
goods or private goods. Most goods and services
are 'mixed goods' and fall somewhere between the
two ends of the continuum.
The characteristics of a good or service determine
what type of funding mechanism might be used to
fund a particular service. Council has already made
judgements about what it considers are public
goods when deciding whether or not to undertake a
particular activity.
For example, a good towards the public end of the
continuum may not be a good candidate for user
charges as people cannot be prevented from
consuming it, or because everyone consumes it
whether they wish to or not. Such goods will
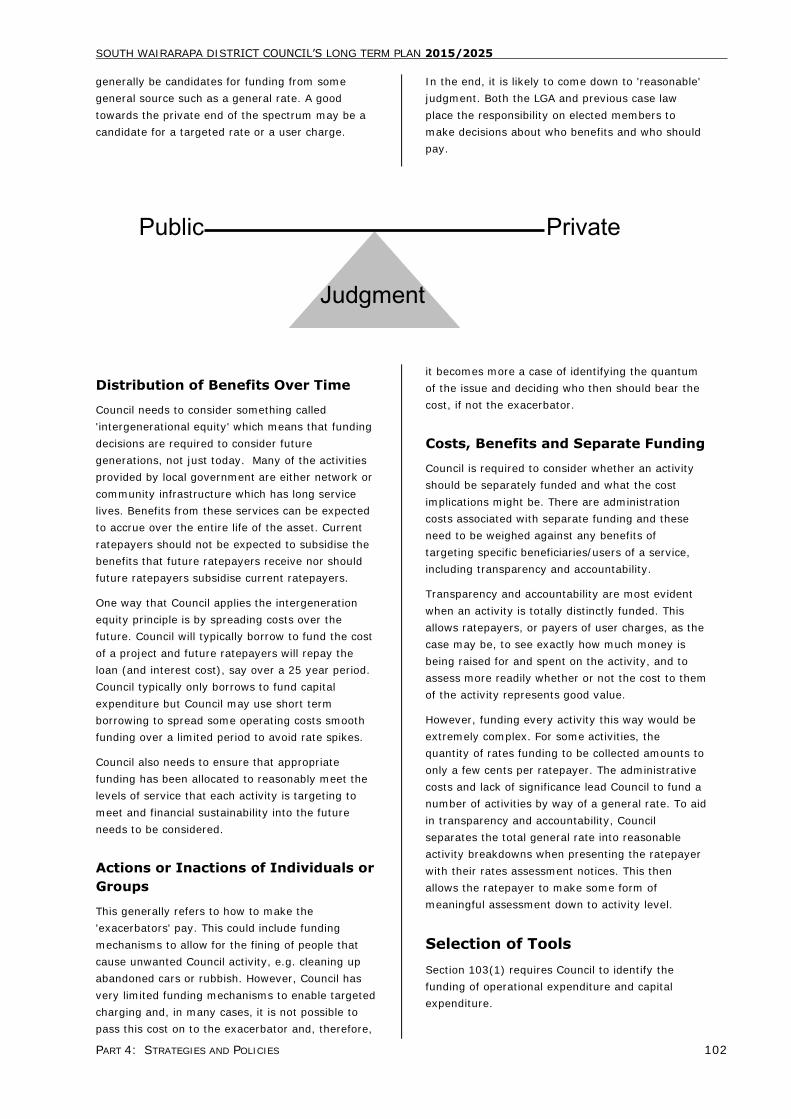
SOUTH WAIRARAPA DISTRICT COUNCIL‘S LONG TERM PLAN 2015/2025
PART 4: STRATEGIES AND POLICIES 102
generally be candidates for funding from some
general source such as a general rate. A good
towards the private end of the spectrum may be a
candidate for a targeted rate or a user charge.
In the end, it is likely to come down to 'reasonable'
judgment. Both the LGA and previous case law
place the responsibility on elected members to
make decisions about who benefits and who should
pay.
Distribution of Benefits Over Time
Council needs to consider something called
'intergenerational equity' which means that funding
decisions are required to consider future
generations, not just today. Many of the activities
provided by local government are either network or
community infrastructure which has long service
lives. Benefits from these services can be expected
to accrue over the entire life of the asset. Current
ratepayers should not be expected to subsidise the
benefits that future ratepayers receive nor should
future ratepayers subsidise current ratepayers.
One way that Council applies the intergeneration
equity principle is by spreading costs over the
future. Council will typically borrow to fund the cost
of a project and future ratepayers will repay the
loan (and interest cost), say over a 25 year period.
Council typically only borrows to fund capital
expenditure but Council may use short term
borrowing to spread some operating costs smooth
funding over a limited period to avoid rate spikes.
Council also needs to ensure that appropriate
funding has been allocated to reasonably meet the
levels of service that each activity is targeting to
meet and financial sustainability into the future
needs to be considered.
Actions or Inactions of Individuals or
Groups
This generally refers to how to make the
'exacerbators' pay. This could include funding
mechanisms to allow for the fining of people that
cause unwanted Council activity, e.g. cleaning up
abandoned cars or rubbish. However, Council has
very limited funding mechanisms to enable targeted
charging and, in many cases, it is not possible to
pass this cost on to the exacerbator and, therefore,
it becomes more a case of identifying the quantum
of the issue and deciding who then should bear the
cost, if not the exacerbator.
Costs, Benefits and Separate Funding
Council is required to consider whether an activity
should be separately funded and what the cost
implications might be. There are administration
costs associated with separate funding and these
need to be weighed against any benefits of
targeting specific beneficiaries/users of a service,
including transparency and accountability.
Transparency and accountability are most evident
when an activity is totally distinctly funded. This
allows ratepayers, or payers of user charges, as the
case may be, to see exactly how much money is
being raised for and spent on the activity, and to
assess more readily whether or not the cost to them
of the activity represents good value.
However, funding every activity this way would be
extremely complex. For some activities, the
quantity of rates funding to be collected amounts to
only a few cents per ratepayer. The administrative
costs and lack of significance lead Council to fund a
number of activities by way of a general rate. To aid
in transparency and accountability, Council
separates the total general rate into reasonable
activity breakdowns when presenting the ratepayer
with their rates assessment notices. This then
allows the ratepayer to make some form of
meaningful assessment down to activity level.
Selection of Tools
Section 103(1) requires Council to identify the
funding of operational expenditure and capital
expenditure.
Judgment
Private Public
SOUTH WAIRARAPA DISTRICT COUNCIL‘S LONG TERM PLAN 2015/2025
PART 4: STRATEGIES AND POLICIES 103
Operational expenditure is normally funded by way
of revenue (income) while capital expenditure can
be funded by way of both revenue and non-revenue
items such as borrowings and the use of Council
created reserves.
Capital expenditure is expenditure when the benefit
of that expenditure is greater than one year and
therefore benefits obtained by those assets spread
according to the life of the asset.
Section 103 (2) LGA requires Council to identify its
funding tools.
A number of tools can be used to allocate both
public and private good. The use of targeted rates
is good example of this. An activity with a very
high percentage of public good can be allocated
over a small geographical area and therefore the
most appropriate tool to recover the expenditure
would be a targeted rate. Therefore in this instance
a targeted rate is used to recover a public good.
However targeted rates can be used to recover a
private good such as use of water from a closed
network. This is where Council can restrict people
using that network and before they can join they
have to formally join to it and are charged the
appropriate fee(s).
Revenue
General Rates (Including Uniform Annual General Charge)
The Council differentiates the General Rate based
on land valuation (Schedule 2 Local Government
(Rating) Act 2002).
The differential categories are:
a) Group 1 Commercial – all rating units that are
used (or available) primarily for any
commercial or industrial purpose.
b) Group 2 Urban – all rating units used for
residential and related purposes within the
urban areas of the District Plan.
c) Group 3 Rural – all rating units within the
rural area in the District Plan.
This is usually used to recover public good.
Council believes that land of value allocates the
costs fairly between the rural and urban
communities.
When Council considered the advantages and
disadvantages of each option it considered it
identified that:
The ratio of land to capital value was
inconsistent across the district and this would
have lead more ratepayers having an increase
than those decreases) in rates payable.
RATIO OF LAND CAPITAL VALUES
MOVEMENT IN GENERAL RATES PERCENT OF GENERAL
PROPERTIES WITH
MOVEMENT
Decrease between 0% and 30% 35%
Increase between 0% and 30% 14%
Increase between 30% and 100% 31%
Increase greater than 100% 20%
As land value is the current method it is
accepted and understood by the majority of
ratepayers.
There would be additional costs in both moving
to capital value and additional costs in
maintaining the rating database without out
any significant increase in value.
Targeted Rates
Targeted rates are set on a differential value and
applied to certain areas or services or activities with
a defined benefit.
These rates can be used for both private good and
public good.
Current targeted rates include the amenity rates.
Lump Sum Contributions
For the recovery of specific capital expenditure,
otherwise loan funded (optional for ratepayer).
This must have a high component of private good.
Fees and Charges
Any fee, recovery fine or charge made Council for
service or activity.
Must have a high component of private good.
Interest and Dividends from Investments
Income from an investment. This would be
generally public good.
Financial & Development Contributions
There are used to recover costs to mitigate the
effects of development. Council has a Financial
Contributions Policy under the Resource
Management Act 1991 which explains the
application and the levying of these fees. Council
does not have a development contributions policy.
This must have a high component of private good.
Grants and Subsidies
Income from external funding entity. These
generally would be of a public good.
SOUTH WAIRARAPA DISTRICT COUNCIL‘S LONG TERM PLAN 2015/2025
PART 4: STRATEGIES AND POLICIES 104
Borrowing
Loans, both short term and long term. This is a
funding tool and does not need a split between
public and private good as it is only deferring the
eventual charge.
Proceeds from Asset Sales
This would only need to be recognized where an
asset was being sold and not replaced with a similar
asset. For the example where the proceeds from
the sale of corporate property where used to fund
another activity. Again this is a funding tool.
Council Created Reserves
Council created reserves result from surplus
revenues over expenditure being held for a
particular purpose or the transfer of non-cash
expenditure (e.g. depreciation).
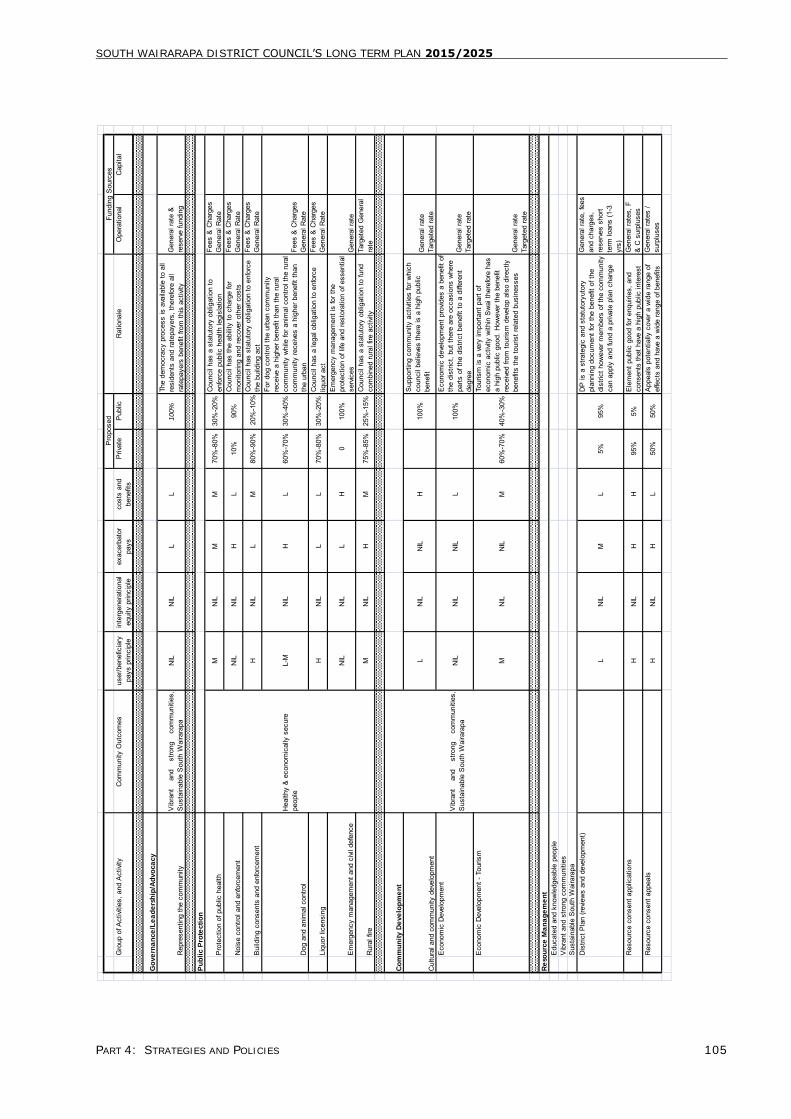
SOUTH WAIRARAPA DISTRICT COUNCIL‘S LONG TERM PLAN 2015/2025
PART 4: STRATEGIES AND POLICIES 105
G
roup
of A
ctivi
ties,
and
Act
ivity
Com
mun
ity O
utco
mes
us
er/b
enef
icia
ry
pays
prin
cipl
e in
terg
ener
atio
nal
equi
ty p
rinci
ple
exac
erba
tor
pays
co
sts
and
bene
fits
Priv
ate
Pub
licR
atio
nale
Ope
ratio
nal
Cap
ital
Go
ve
rna
nce
/Le
ad
ers
hip
/Ad
vo
ca
cy
Rep
rese
ntin
g th
e co
mm
unity
Vib
rant
and
stro
ngco
mm
uniti
es,
Sus
tain
able
Sou
th W
aira
rapa
NIL
NIL
LL
100%
The
dem
ocra
cy p
roce
ss is
ava
ilabl
e to
all
resi
dent
s an
d ra
tepa
yers
, the
refo
re a
ll ra
tepa
yers
ben
efit
from
this
act
ivity
Gen
eral
rate
&
rese
rve
fund
ing
Pu
bli
c P
rote
cti
on
Pro
tect
ion
of p
ublic
hea
lthM
NIL
MM
70%
-80%
30%
-20%
Cou
ncil
has
a st
atut
ory
oblig
atio
n to
en
forc
e pu
blic
hea
lth le
gisl
atio
nFe
es &
Cha
rges
G
ener
al R
ate
Noi
se c
ontro
l and
enf
orce
men
tN
ILN
ILH
L10
%90
%C
ounc
il ha
s th
e ab
ility
to c
harg
e fo
r m
onito
ring
and
reco
ver o
ther
cos
tsFe
es &
Cha
rges
G
ener
al R
ate
Bui
ldin
g co
nsen
ts a
nd e
nfor
cem
ent
HN
ILL
M80
%-9
0% 2
0%-1
0%C
ounc
il ha
s st
atut
ory
oblig
atio
n to
enf
orce
th
e bu
ildin
g ac
tFe
es &
Cha
rges
G
ener
al R
ate
Dog
and
ani
mal
con
trol
L-M
NIL
HL
60%
-70%
30%
-40%
For d
og c
ontro
l the
urb
an c
omm
unity
re
ceive
a h
ighe
r ben
efit
than
the
rura
l co
mm
unity
whi
le fo
r ani
mal
con
trol t
he ru
ral
com
mun
ity re
ceive
s a
high
er b
enef
it th
an
the
urba
nFe
es &
Cha
rges
G
ener
al R
ate
Liqu
or li
cens
ing
HN
ILL
L70
%-8
0%30
%-2
0%C
ounc
il ha
s a
lega
l obl
igat
ion
to e
nfor
ce
liquo
r act
Fees
& C
harg
es
Gen
eral
Rat
e
Em
erge
ncy
man
agem
ent a
nd c
ivil d
efen
ceN
ILN
ILL
H0
100%
Em
erge
ncy
man
agem
ent i
s fo
r the
pr
otec
tion
of li
fe a
nd re
stor
atio
n of
ess
entia
l se
rvic
esG
ener
al ra
te
Rur
al fi
reM
NIL
HM
75%
-85%
25%
-15%
Cou
ncil
has
a st
atut
ory
oblig
atio
n to
fund
co
mbi
ned
rura
l fire
act
ivity
Targ
eted
Gen
eral
ra
te
LN
ILN
ILH
100%
Sup
porti
ng c
omm
unity
act
ivitie
s fo
r whi
ch
coun
cil b
elie
ves
ther
e is
a h
igh
publ
ic
bene
fitG
ener
al ra
te
Targ
eted
rate
Eco
nom
ic D
evel
opm
ent
NIL
NIL
NIL
L10
0%
Eco
nom
ic d
evel
opm
ent p
rovid
es a
ben
efit
of
the
dist
rict,
but t
here
are
occ
asio
ns w
here
pa
rts o
f the
dis
trict
ben
efit
to a
diff
eren
t de
gree
Gen
eral
rate
Ta
rget
ed ra
teE
cono
mic
Dev
elop
men
t - T
ouris
m
MN
ILN
ILM
60%
-70%
40%
-30%
Tour
ism
is a
ver
y im
porta
nt p
art o
f ec
onom
ic a
ctivi
ty w
ithin
Sw
ai th
eref
ore
has
a hi
gh p
ublic
goo
d. H
owev
er th
e be
nefit
re
ceive
d fro
m to
uris
m d
evel
op a
lso
dire
ctly
be
nefit
s th
e to
uris
t rel
ated
bus
ines
ses
Gen
eral
rate
Ta
rget
ed ra
te
Re
sou
rce
Ma
na
ge
me
nt
Edu
cate
d an
d kn
owle
dgea
ble
peop
leV
ibra
nt a
nd s
trong
com
mun
ities
Sus
tain
able
Sou
th W
aira
rapa
Dis
trict
Pla
n (re
view
s an
d de
velo
pmen
t)
LN
ILM
L5%
95%
DP
is a
stra
tegi
c an
d st
atut
oryu
tory
pl
anni
ng d
ocum
ent f
or th
e be
nefit
of t
he
dist
rict h
owev
er m
embe
rs o
f the
com
mun
ity
can
appl
y an
d fu
nd a
priv
ate
plan
cha
nge
Gen
eral
rate
, fee
s an
d ch
arge
s,
rese
rves
sho
rt te
rm lo
ans
(1-3
yr
s)R
esou
rce
cons
ent a
pplic
atio
ns
HN
ILH
H95
%5%
Ele
men
t pub
lic g
ood
for e
nqui
ries,
and
co
nsen
ts th
at h
ave
a hi
gh p
ublic
inte
rest
Gen
eral
rate
s, F
&
C s
urpl
uses
Res
ourc
e co
nsen
t app
eals
HN
ILH
L50
%50
%A
ppea
ls p
oten
tially
cov
er a
wid
e ra
nge
of
effe
cts
and
have
a w
ide
rang
e of
ben
efits
Gen
eral
rate
s /
surp
luse
s
Co
mm
un
ity D
eve
lop
me
nt
Cul
tura
l and
com
mun
ity d
evel
opm
ent
Hea
lthy
& e
cono
mic
ally
sec
ure
peop
le
Vib
rant
and
stro
ngco
mm
uniti
es,
Sus
tain
able
Sou
th W
aira
rapa
Pro
pose
dFu
ndin
g S
ourc
es
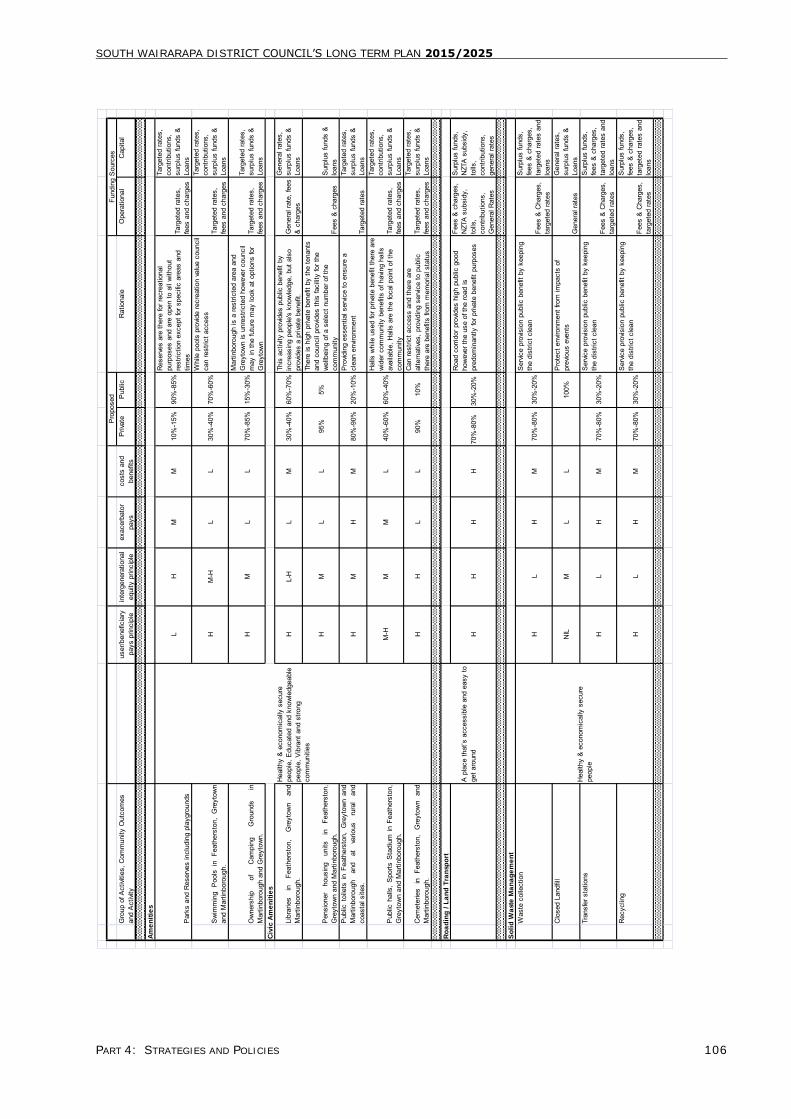
SOUTH WAIRARAPA DISTRICT COUNCIL‘S LONG TERM PLAN 2015/2025
PART 4: STRATEGIES AND POLICIES 106
Gro
up o
f Act
ivitie
s, C
omm
unity
Out
com
es
and
Act
ivity
user
/ben
efic
iary
pa
ys p
rinci
ple
inte
rgen
erat
iona
l eq
uity
prin
cipl
e ex
acer
bato
r pa
ys
cost
s an
d be
nefit
sP
rivat
eP
ublic
Rat
iona
leO
pera
tiona
lC
apita
l
Am
en
itie
s
Par
ks a
nd R
eser
ves
incl
udin
g pl
aygr
ound
s
LH
MM
10%
-15%
90%
-85%
Res
erve
s ar
e th
ere
for r
ecre
atio
nal
purp
oses
and
are
ope
n to
all
with
out
rest
rictio
n ex
cept
for s
peci
fic a
reas
and
tim
esTa
rget
ed ra
tes,
fe
es a
nd c
harg
es
Targ
eted
rate
s,
cont
ribut
ions
, su
rplu
s fu
nds
&
Loan
s
Sw
imm
ing
Poo
lsin
Feat
hers
ton,
Gre
ytow
nan
d M
artin
boro
ugh.
HM
-HL
L30
%-4
0%70
%-6
0%
Whi
le p
ools
pro
vide
recr
eatio
n va
lue
coun
cil
can
rest
rict a
cces
s Ta
rget
ed ra
tes,
fe
es a
nd c
harg
es
Targ
eted
rate
s,
cont
ribut
ions
, su
rplu
s fu
nds
&
Loan
s
Ow
ners
hip
ofC
ampi
ngG
roun
dsin
Mar
tinbo
roug
h an
d G
reyt
own.
HM
LL
70%
-85%
15%
-30%
Mar
tinbo
roug
h is
a re
stric
ted
area
and
G
reyt
own
is u
nres
trict
ed h
owev
er c
ounc
il m
ay in
the
futu
re m
ay lo
ok a
t opt
ions
for
Gre
ytow
nTa
rget
ed ra
tes,
fe
es a
nd c
harg
es
Targ
eted
rate
s,
surp
lus
fund
s &
Lo
ans
Civ
ic A
me
nit
ies
Libr
arie
sin
Feat
hers
ton,
Gre
ytow
nan
dM
artin
boro
ugh.
HL-
HL
M30
%-4
0%60
%-7
0%Th
is a
ctivi
ty p
rovid
es p
ublic
ben
efit
by
incr
easi
ng p
eopl
e's
know
ledg
e, b
ut a
lso
prov
ides
a p
rivat
e be
nefit
.G
ener
al ra
te, f
ees
& c
harg
es
Gen
eral
rate
s,
surp
lus
fund
s &
Lo
ans
Pen
sion
erho
usin
gun
itsin
Feat
hers
ton,
Gre
ytow
n an
d M
artin
boro
ugh.
HM
LL
95%
5%
Ther
e is
hig
h pr
ivate
ben
efit
by th
e te
nant
s an
d co
unci
l pro
vides
this
faci
lity
for t
he
wel
lbei
ng o
f a s
elec
t num
ber o
f the
co
mm
unity
Fees
& c
harg
esS
urpl
us fu
nds
&
loan
s P
ublic
toile
tsin
Feat
hers
ton,
Gre
ytow
nan
dM
artin
boro
ugh
and
atva
rious
rura
lan
dco
asta
l site
s.H
MH
M80
%-9
0%20
%-1
0%P
rovid
ing
esse
ntia
l ser
vice
to e
nsur
e a
clea
n en
viron
men
tTa
rget
ed ra
tes
Targ
eted
rate
s,
surp
lus
fund
s &
Lo
ans
Pub
licha
lls,
Spo
rtsS
tadi
umin
Feat
hers
ton,
Gre
ytow
n an
d M
artin
boro
ugh.
M-H
MM
L40
%-6
0%60
%-4
0%
Hal
ls w
hile
use
d fo
r priv
ate
bene
fit th
ere
are
wid
er c
omm
unity
ben
efits
of h
avin
g ha
lls
avai
labl
e, H
alls
are
the
foca
l poi
nt o
f the
co
mm
unity
Targ
eted
rate
s,
fees
and
cha
rges
Targ
eted
rate
s,
cont
ribut
ions
, su
rplu
s fu
nds
&
Loan
s
Cem
eter
ies
inFe
athe
rsto
n,G
reyt
own
and
Mar
tinbo
roug
h.H
HL
L90
%10
%C
an re
stric
t acc
ess
and
ther
e ar
e al
tern
ative
s, p
rovid
ing
serv
ice
to p
ublic
th
ere
are
bene
fits
from
mem
oria
l sta
tus
Targ
eted
rate
s,
fees
and
cha
rges
Targ
eted
rate
s,
surp
lus
fund
s &
Lo
ans
Ro
ad
ing
/ L
an
d T
ran
spo
rt
HH
HH
70%
-80%
30%
-20%
Roa
d co
rrido
r pro
vides
hig
h pu
blic
goo
d ho
wev
er th
e us
e of
the
road
is
pred
omin
antly
for p
rivat
e be
nefit
pur
pose
s
Fees
& c
harg
es,
NZT
A s
ubsi
dy,
tolls
, co
ntrib
utio
ns,
Gen
eral
Rat
es
Sur
plus
fund
s,
NZT
A s
ubsi
dy,
tolls
, co
ntrib
utio
ns,
gene
ral r
ates
So
lid
Wa
ste
Ma
na
ge
me
nt
Was
te c
olle
ctio
n
HL
HM
70%
-80%
30%
-20%
Ser
vice
prov
isio
n pu
blic
ben
efit
by k
eepi
ng
the
dist
rict c
lean
Fees
& C
harg
es,
targ
eted
rate
s
Sur
plus
fund
s,
fees
& c
harg
es,
targ
eted
rate
s an
d lo
ans
Clo
sed
Land
fill
NIL
ML
L10
0%P
rote
ct e
nviro
nmen
t fro
m im
pact
s of
pr
evio
us e
vent
sG
ener
al ra
tes
Gen
eral
rate
s,
surp
lus
fund
s &
Lo
ans
Tran
sfer
sta
tions
HL
HM
70%
-80%
30%
-20%
Ser
vice
prov
isio
n pu
blic
ben
efit
by k
eepi
ng
the
dist
rict c
lean
Fees
& C
harg
es,
targ
eted
rate
s
Sur
plus
fund
s,
fees
& c
harg
es,
targ
eted
rate
s an
d lo
ans
Rec
yclin
g
HL
HM
70%
-80%
30%
-20%
Ser
vice
prov
isio
n pu
blic
ben
efit
by k
eepi
ng
the
dist
rict c
lean
Fees
& C
harg
es,
targ
eted
rate
s
Sur
plus
fund
s,
fees
& c
harg
es,
targ
eted
rate
s an
d lo
ans
Hea
lthy
& e
cono
mic
ally
sec
ure
peop
le, E
duca
ted
and
know
ledg
eabl
e pe
ople
, Vib
rant
and
stro
ng
com
mun
ities
Hea
lthy
& e
cono
mic
ally
sec
ure
peop
le
A p
lace
that
’s a
cces
sibl
e an
d ea
sy to
ge
t aro
und
Pro
pose
dFu
ndin
g S
ourc
es
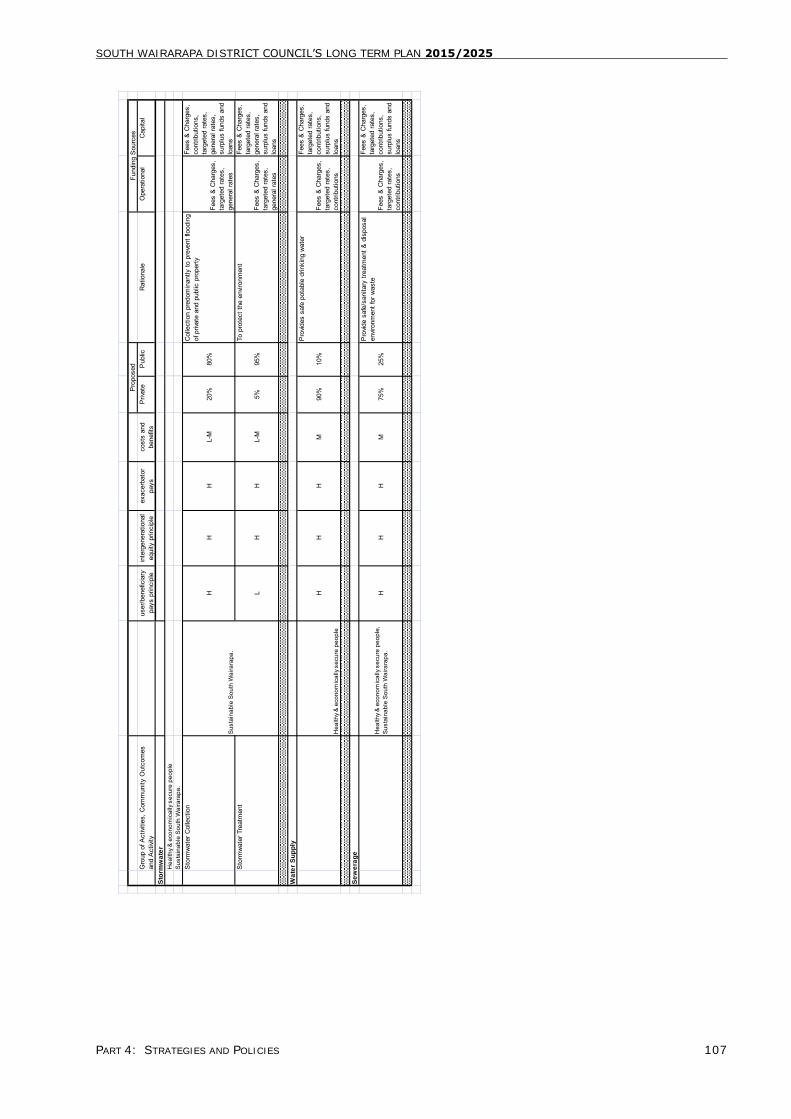
SOUTH WAIRARAPA DISTRICT COUNCIL‘S LONG TERM PLAN 2015/2025
PART 4: STRATEGIES AND POLICIES 107
Gro
up o
f Act
ivitie
s, C
omm
unity
Out
com
es
and
Act
ivity
user
/ben
efic
iary
pa
ys p
rinci
ple
inte
rgen
erat
iona
l eq
uity
prin
cipl
e ex
acer
bato
r pa
ys
cost
s an
d be
nefit
sP
rivat
eP
ublic
Rat
iona
leO
pera
tiona
lC
apita
l
Sto
rmw
ate
r
Hea
lthy
& e
cono
mic
ally
secu
re p
eopl
eS
usta
inab
le S
outh
Wai
rara
pa.
Sto
rmw
ater
Col
lect
ion
HH
HL-
M20
%80
%
Col
lect
ion
pred
omin
antly
to p
reve
nt fl
oodi
ng
of p
rivat
e an
d pu
blic
pro
perty
Fees
& C
harg
es,
targ
eted
rate
s,
gene
ral r
ates
Fees
& C
harg
es,
cont
ribut
ions
, ta
rget
ed ra
tes,
ge
nera
l rat
es,
surp
lus
fund
s an
d lo
ans
Sto
rmw
ater
Tre
atm
ent
LH
HL-
M5%
95%
To p
rote
ct th
e en
viron
men
t
Fees
& C
harg
es,
targ
eted
rate
s,
gene
ral r
ates
Fees
& C
harg
es,
targ
eted
rate
s,
gene
ral r
ates
, su
rplu
s fu
nds
and
loan
s
Wa
ter
Su
pp
ly
Hea
lthy
& e
cono
mic
ally
secu
re p
eopl
e
HH
HM
90%
10%
Pro
vides
saf
e po
tabl
e dr
inki
ng w
ater
Fees
& C
harg
es,
targ
eted
rate
s,
cont
ribut
ions
Fees
& C
harg
es,
targ
eted
rate
s,
cont
ribut
ions
, su
rplu
s fu
nds
and
loan
s
Se
we
rag
e
Hea
lthy
& e
cono
mic
ally
secu
re p
eopl
e,
Sus
tain
able
Sou
th W
aira
rapa
.H
HH
M75
%25
%
Pro
vide
safe
/san
itary
trea
tmen
t & d
ispo
sal
envir
onm
ent f
or w
aste
Fees
& C
harg
es,
targ
eted
rate
s,
cont
ribut
ions
Fees
& C
harg
es,
targ
eted
rate
s,
cont
ribut
ions
, su
rplu
s fu
nds
and
loan
s
Sus
tain
able
Sou
th W
aira
rapa
.
Pro
pose
dFu
ndin
g S
ourc
es
SOUTH WAIRARAPA DISTRICT COUNCIL‘S LONG TERM PLAN 2015/2025
PART 4: STRATEGIES AND POLICIES 108
LIABILITY AND MANAGEMENT POLICY
Introduction
The borrowing management policy will be consistent
with Council‘s overall objectives and plans. The
amount of borrowing is driven on a project by
project basis. Council approves borrowing by
resolution as part of the Annual Planning process.
Council may borrow from itself, any registered bank
or wholesale investor by the issue of local authority
stock, or the Local Government Funding Authority
(following special consultative procedure adoption
during the 2012-22 LTP process) or in any other
manner which it considers appropriate.
Interest Rate Exposure
Council‘s borrowing gives rise to direct exposure to
interest rate movements. Given the long term
nature of Council‘s assets, projects and
intergenerational factors, Council‘s policy is to have
a high percentage of fixed rate borrowing.
Interest rate risk is managed by adjusting the
maturity of borrowings to avoid a concentration of
debt reissues or rollovers in line with interest rate
predictions.
All matters concerning borrowing which can be
lawfully delegated are delegated to the Chief
Executive.
The use of hedging instruments for risk
management on Council‘s borrowing is not
appropriate. Should Council wish to use hedging
instruments an ordinary resolution approving their
use will be adopted by Council.
Liquidity
Liquidity refers to the availability of cash resources
to meet all obligations as they arise.
Short term liquidity management is monitored and
controlled through daily cash management activities
with long term liquidity being monitored and
controlled through the annual plan and long term
financial strategy processes.
Council ensures debt maturity is spread widely to
minimise the risk of large concentrations of debt
maturing at any one time. Council may maintain an
overdraft facility to meet short term cash
requirements as and when necessary.
Credit Exposure
Council is readily able to attract cost effective
borrowing because of the strength of security
offered by its powers to rate, and the very low
historical incidence of default by local authorities.
Debt Repayment
Council has at present two types of loans. These
comprise reducing balance and interest only loans.
Reducing balance (table mortgage) loans are repaid
from operational funds over the life of the loan.
Council can liquidate these loans at any point of
time if allowed under the terms of the loan
agreement. Interest only loans are taken out over
the life of the project and refinanced at three to five
year intervals.
Council has established sinking funds in respect of
all interest only loans. Council has not forecast to
make any repayments of principal on the loans it
has sinking funds for, as the loans are intended to
be for the same length of time as the asset life and
the sinking fund repayment schedules are
calculated based on the same. Most of the loans
are for assets that have a life of either 10 or 20
years and as a result – none of these mature within
the period of this LTP. This spreads the principal
and interest costs related to the asset purchase
evenly over the period of the assets life, and
therefore achieves inter-generational equity for the
ratepayers. While the loan principal is not paid off
progressively, the sinking fund deposits accumulate
progressively and therefore accumulate more
interest earned. Sinking funds may be converted to
―table‖ loans should it be prudent to do so.
Council has introduced a policy of building up its
cash reserves in order to meet future renewals of
its assets.
Council is under no obligation to establish sinking
funds for new borrowings but must consider and
record how it intends to effect repayment.
Terms of repayment should be determined after
consideration of the cost of finance and any
intergenerational benefits of the assets being
financed.
The maximum period over which borrowings are to
be repaid is the lesser of 30 years or the life of the
project, unless otherwise resolved by Council.
Specific Borrowing Limits
The gross interest expense of all borrowings will not
exceed 12% of rates income.
Security
Council does not offer assets as security for
borrowings.
SOUTH WAIRARAPA DISTRICT COUNCIL‘S LONG TERM PLAN 2015/2025
PART 4: STRATEGIES AND POLICIES 109
INVESTMENT POLICY
Introduction
The investment policy will be consistent with
Council‘s overall objectives and plans Council
acknowledges that there are financial risks
associated with its investment activities but is risk
averse. The treasury function is based on managing
risk and protecting investments. There is no
involvement in speculative transactions.
The management of trusts, and special funds and
reserves will be reviewed on a regular basis. This
will ensure that their holding complies with any
statutory or other special requirements and that
their use is consistent with these and with Council
policy at the time.
Investments generally will be made having regard
to the following objectives:
To manage short term cash flows in an efficient
and prudent manner which provides cash for
approved expenditure needs and in the event
of urgent requirements.
To provide cash for the future retirement of
debt on maturity.
To maximise interest income and minimise risk
to the capital invested.
Treasury Investments
Council‘s treasury investments comprise sums
reserved for special purposes and funds held for
working capital requirements. These funds are
managed using the following guidelines:
Funds are invested only with institutions which
offer an excellent degree of security. These
include the New Zealand Government, State
Owned Enterprises, Local Authorities and New
Zealand registered banks.
The maximum amount to be invested with any
one approved institution is 30% of Council‘s
total investments except for the Wairarapa
Building Society which shall be 10%.
Equity Investments
Council has a small shareholdings in the following
organisations:
New Zealand Local Government Insurance
Corporation Limited.
AIRTEL Limited.
Farmlands Limited.
A Council resolution is required to dispose of these
shares.
Council is risk averse and does not wish to expose
itself to the risks associated with equity
investments. It will not as a general rule seek to
acquire further equity investments.
Emissions Trading Scheme
Council has a number of ―New Zealand Emissions
Units‖ that were issued as a result of the
introduction of the emissions trading scheme.
A Council resolution is required to transact these
units.
Local Government Funding Authority
Council may, after following the special consultative
procedure, borrow funds from the Local
Government Funding Authority.
Under certain very limited circumstances, the
borrower notes can convert to shares.
A Council resolution will be required to manage
these shares.
Property
Council does not hold real property for investment
purposes. It may and does purchase property from
time to time to assist in the provision of its core
services to the community. Surplus properties will
be disposed of wherever possible. Council will
review its property holdings on a regular basis.
Mix of Investments
The mix of investments will be determined having
regard to the overall funding needs of Council.
Investment mix is also influenced by risk
management considerations. Council will maintain
sufficient general funds for day to day operational
needs.
Council may establish, alter or dissolve a fund for a
particular purpose by ordinary resolution.
Acquisition of New Investments
Treasury investments are acquired under delegated
authority to the Chief Executive.1
It is unlikely that Council will invest in shares or
investment properties in the foreseeable future. Any
such acquisitions would require a resolution by
Council.
1 Means the Chief Executive and /or other officers to whom the Chief Executive may delegate from time to time.
SOUTH WAIRARAPA DISTRICT COUNCIL‘S LONG TERM PLAN 2015/2025
PART 4: STRATEGIES AND POLICIES 110
When acquiring treasury investments Council seeks
to:
Optimise return on investments.
Ensure investments are secure.
Manage potential interest rate movement
losses.
Disposition of Revenue from
Investments
All dividends, interest and other income from
investments will be available for Council‘s general
use except:
Where Council has resolved that interest
earned on funds invested in an account shall be
reinvested in that account. These accounts
shall be subject to review each year.
Interest earned on sinking funds which shall
remain in the sinking funds.
Disposition of Proceeds of Sale of
Investments
Equity and property investments may be disposed
of by resolution of Council and the proceeds will be
available for Council‘s general use unless it resolves
otherwise. These proceeds may only be used for
capital investments or the retirement of debt.
On maturity, treasury investments may be realised
for Council‘s general use or reinvested under
delegated authority by the Chief Executive.
Procedures
Equity and property investments will be reviewed by
Council before the end of March each year.
Treasury investments will be managed under
delegated authority by the Chief Executive. All
realisations, transfers and reinvestments will
comply with this policy. All treasury transactions are
required to be validated by way of a deal ticket (as
contained in Council‘s Treasury Policy).
Council will receive a schedule of all treasury
investments each month as part of the Chief
Executive Officer's report.
Investment Risk Assessment and
Management
Council has no investment properties and only three
small equity investments. The exposure to risk in
these areas is minimal.
Council‘s primary objective in respect of treasury
investments is the protection of those investments.
Only credit worthy counter parties are acceptable.
Council will manage its exposure to credit risk by
maintaining a diverse investment portfolio with
prescribed limits for each counter party. The
exposure to interest rate risk will be managed by a
mix of terms and staggered maturity dates to
mitigate the effect of market fluctuations.
Objectives for Holding and Managing
Financial Investments and Equity
Securities
The objectives of holding financial investments are:
To maintain sufficient cashflow to meet current
and future needs
To ensure sufficient funding is available to meet
future loan repayments as they fall due through
the maintenance of sinking fund accounts
The objectives of holding equity investments are:
Equity investments are held solely for strategic
purposes and are not held for financial return
Equity investments will only be made to
support companies that provide a service that
may not otherwise be provided, for the benefit
of either the three Wairarapa local authorities,
or a wider base of local authorities.
Targets for Returns on Financial
Investments and Equity Investments
The targets for returns on financial investments are:
The key rationale of the holdings of financial
investments is risk minimisation. Due to the
levels of cash holdings these are managed
solely for cashflow purposes. Council policy
limits investment to very low risk investment,
which by it‘s nature provides modest returns
The objectives of holding equity investments are:
Equity investments are held solely for strategic
purposes and are not held for financial return
There is no quantified target for equity
investments for the reasons outlined above
SOUTH WAIRARAPA DISTRICT COUNCIL‘S LONG TERM PLAN 2015/2025
PART 4: STRATEGIES AND POLICIES 111
DEVELOPMENT CONTRIBUTIONS/FINANCIAL CONTRIBUTIONS
Introduction
As further subdivision occurs and new activities are
established within the Wairarapa, the existing
infrastructure and amenities come under pressure.
Financial contributions are a way of ensuring that
any adverse effects from subdivision and
development on the environment or on community
resources are minimised, including ways of
offsetting any adverse effects with a contribution
toward environmental improvements. Such
contributions can be in the form of money, land,
works or services and may include the provision of
roads and services, the protection of an important
historic or natural feature, the visual enhancement
of a site through landscape treatment or the
provision of access to a hitherto inaccessible river or
stream.
Financial contributions for subdivision and land use
consents may include the costs of upgrading and
expanding community works and services as a
result of the proposal, including (but not limited to)
public roads, public water supplies, and the disposal
of sewage and stormwater.
This section deals with the requirements for
financial contributions, either as a standard of a
permitted activity, or a land use or subdivision
consent.
Where a financial contribution is required as a
condition of a permitted activity or resource
consent, the purpose, circumstances in which a
contribution may be required, and the amount of
that contribution are stated. For some types of
contributions, a maximum contribution is specified
to ensure such contributions are equitable and not
unreasonably onerous for some forms of
development.
Contributions for land use development through the
resource consent process will be sought in full,
unless a previous contribution has been received in
the subdivision of the site. Conversely, if a
contribution was paid at the time of land use
development, then no contribution may be required
at the time of any subsequent subdivision consent
in recognition of the previous contributions.
Reserve Contributions Standard
Circumstances when a general reserves contribution
is required as a condition of a permitted activity or
a resource consent:
a) As a condition of a land use resource consent
for any additional residential unit, provided that
a general reserve contribution has not already
been made at the time of the subdivision
creating that lot or under the relevant Council‘s
Long Term Plan.
b) As a condition of subdivision resource consent
for any new allotment, provided that a general
reserve contribution has not already been made
under the relevant Council‘s Long Term Plan.
c) As a standard of a permitted land use activity
for any additional residential unit, with the
payment of the contribution to be made prior to
the issuance of code of compliance certificate
for the building consent, provided that a
general reserve contribution has not already
been made at the time of the subdivision
creating that lot or under the relevant Council‘s
Long Term Plan.
Reserve Contribution Amount
Amount of contribution for reserves as a standard of
a permitted activity or as a condition of resource
consent:
a) For subdivision, a general district-wide reserves
contribution of 3% of the land value of each
allotment to be created in the Residential,
Commercial and Industrial Zones (plus GST),
and 2% of the land value of each allotment to
be created in the Rural Zone (plus GST). In the
Rural Zone, the maximum amount of the sum
of this general district-wide reserves
contribution and any general district-wide
roads, access, parking and loading contribution
taken under Rule 4.A(g) shall be $7,500 (plus
GST) per allotment created by a subdivision; or
b) For land use development for residential
purposes, a general district-wide reserves
contribution of 0.25% of the value of each
additional residential unit (plus GST).
Assessment Criteria for Remission or Waiver of Reserves Contribution
In determining whether to grant a remission or
waiver of any reserves contribution, regard shall be
had, but not limited to, the following criteria:
a) The activity‘s impacts on the reserve network
and the cost to the relevant Council to avoid,
remedy, or mitigate these impacts.
b) Measures proposed by the developer to
enhance an existing reserve or the open space
of the locality.
SOUTH WAIRARAPA DISTRICT COUNCIL‘S LONG TERM PLAN 2015/2025
PART 4: STRATEGIES AND POLICIES 112
c) Other methods proposed by the developer to
avoid, remedy or mitigate any adverse effects
on the reserve network.
d) Whether any site of natural and cultural
heritage can and should be enhanced or
protected.
Form of Contribution
a) The contribution may be required in the form of
money or land or any combination thereof.
b) If the reserve contribution is in the form of land
which is acceptable to Council, the value of the
land to be vested as reserve shall be
established on the basis of a registered valuer‘s
report. Registered valuer‘s reports shall be
produced at the consent holders cost and be no
older than 3 months at the time the
contribution is paid.
Purpose
a) To provide for the acquisition and development
of reserves and open spaces in response to the
needs arising from subdivision and
development.
b) To protect conservation values of riparian and
coastal margins, and associated water quality
and aquatic habitat.
c) To provide opportunities for public access to
and along water bodies including the coast.
d) To provide recreational opportunities near
water bodies.
Contributions Payable
a) For permitted activities involving construction
of a residential building, contributions shall be
made prior to the issuance of the Code of
Compliance Certificate for the Building Consent.
b) For land use resource consents, contributions
shall be payable as and when required by any
condition of that consent.
c) For subdivision resource consents,
contributions shall be made prior to the
issuance of the Certificate under Section 224 of
the Resource Management Act 1991.
Infrastructure Contributions
Standard
Circumstances when an infrastructure contribution
is required as a standard of a permitted activity or
as a condition of a resource consent:
a) As a condition of a land use resource consent
for any additional residential unit or
administrative, commercial or industrial
purposes towards particular works of one or
more of the types referred to in sections 3.B(a)
to (f) and a contribution under section 3.B(h)
or (i), provided that an infrastructure
contribution towards those particular works and
a contribution under section 3.B(h) or (i) have
not already been made at the time of the
subdivision creating that lot or under the
relevant Council‘s Long Term Plan.
b) As a condition of subdivision resource consent
for any new allotment towards particular works
of one or more of the types referred to in
sections 3.B(a) to (f)and a contribution under
section 3.B(g), provided that an infrastructure
contribution towards those particular works and
a contribution under section 3.B(g), have not
already been made under the relevant Council‘s
Long Term Plan.
c) As a standard of a permitted land use activity
towards particular works of one or more of the
types referred to in sections 3.B(a) to (f) and a
contribution under section 3.B(h) or (i), with
the payment of the contribution(s) to be made
prior to the issuance of code of compliance
certificate for the building consent, provided
that an infrastructure contribution towards
those particular works and a contribution under
section 3.B(h) or (i), have not already been
made at the time of the subdivision creating
that lot of under the relevant Council‘s Long
Term Plan.
Infrastructure Contribution Amount
Amount of contribution for infrastructure as a
standard of a permitted activity or as a condition of
a resource consent:
a) The actual cost of water supply, wastewater or
stormwater disposal systems to the
development; and
b) The actual cost of all necessary water supply,
wastewater or stormwater disposal reticulation
within the development for each allotment or
building; and
c) The actual cost of connections between the
water supply, wastewater or stormwater
disposal reticulation in the development and
the Council's water supply, wastewater and
stormwater disposal system; and
d) The actual cost of upgrading of any existing
Council water supply, wastewater or
stormwater disposal system to the extent that
it is necessary to service the development; and
SOUTH WAIRARAPA DISTRICT COUNCIL‘S LONG TERM PLAN 2015/2025
PART 4: STRATEGIES AND POLICIES 113
e) A share of the cost of the existing water supply,
wastewater or stormwater disposal system
where additional capacity has been created in
anticipation of future development. The share
will be calculated on the proportion of the
additional capacity required to serve the
development; and
f) A share of the cost of new water supply,
wastewater or stormwater disposal system or
upgraded water supply, wastewater or
stormwater disposal system where additional
capacity will be required by the cumulative
effects of an area‘s development - the share
will be calculated on the proportion of the
additional capacity required by the
development; and
g) For subdivisions, a general district-wide
infrastructure contribution of $5000 (plus GST)
per allotment that connects with public
infrastructure and services; or
h) For land use development for residential,
administrative, commercial and industrial
purposes, a general district-wide infrastructure
contribution of $5000 (plus GST) per new unit
for linking with public infrastructure and
services; plus 0.5% of the assessed value of
any building development in excess of
$1,000,000 (plus GST). The assessed value of
the development will be based on the estimated
value of the building as stipulated on the
building consent application; or
i) For land use development for additions and
alterations for administrative, commercial or
industrial purposes that connects with public
infrastructure and services, a general district-
wide infrastructure contribution of 0.5% of the
assessed value of any building development in
excess of $50,000 (plus GST). The assessed
value of the development will be based on the
estimated value (excluding GST) of the building
as stipulated on the building consent
application.
Assessment Criteria for Remission or Waiver of Infrastructure Contribution
In determining whether to grant a remission of any
infrastructure contribution, regard shall be had, but
not limited to, the following criteria:
a) Whether any allotment or any part of the
development is proposed to be connected to
public infrastructure and services.
b) The effect of the proposed subdivision or
development on the infrastructure and the cost
to the relevant Council to avoid, remedy, or
mitigate these impacts.
c) Measures proposed by the developer to
upgrade any existing infrastructure.
d) Whether any contribution had been previously
made towards the establishment or upgrade of
the infrastructure.
Form of Contribution
a) The contribution may be required in the form of
money or works or any combination thereof.
Purpose
a) To provide a potable water supply.
b) To safeguard the health of inhabitants and
protect the natural environment from
inappropriate disposal of sewage.
c) To prevent damage to property or amenity
from the indiscriminate and uncontrolled runoff
of stormwater.
d) To ensure sufficient water is available for fire
fighting purposes.
Contributions Payable
a) For permitted activities involving construction
of a residential building, contributions shall be
made prior to the issuance of the code of
compliance certificate for the building consent.
b) For land use resource consents, contributions
shall be payable as and when required by any
condition of that consent.
c) For subdivision resource consents,
contributions shall be made prior to the
issuance of the certificate under section 224 of
the Resource Management Act 1991.
Roads, Access, Parking & Loading
Contributions Standard
Circumstances when a roads, access, parking and
loading contribution is required as a standard of a
permitted activity or as a condition of a resource
consent:
a) As a condition of a land use resource consent
for any residential, commercial or industrial
activity towards particular works of one or
more of the types referred to in sections 4.B(a)
to (f) and a contribution under section 4.B(g)
provided that a roads, access, parking and
loading contribution towards those particular
works and a contribution under section 4.B(g)
have not already been made at the time of the
SOUTH WAIRARAPA DISTRICT COUNCIL‘S LONG TERM PLAN 2015/2025
PART 4: STRATEGIES AND POLICIES 114
subdivision creating that lot or under the
relevant Council‘s Long Term Plan.
b) As a condition of a subdivision resource consent
for any new allotment towards particular works
of one or more of the types referred to in
sections 4.B(a) to (f) and a contribution under
section 4.B(g) provided that a roads, access,
parking and loading contribution towards those
particular works and a contribution under
section 4.B(g) have not already been made
under the relevant Council‘s Long Term Plan.
c) As a standard of a permitted land use activity
towards particular works of one or more of the
types referred to in sections 4.B(a) to (f) and a
contribution under section 4.B(g) with the
payment of the contribution(s) to be made
prior to the issuance of code of compliance
certificate for the building consent, provided
that a roads, access, parking and loading
contribution towards those particular works and
a contribution under section 4.B(g) have not
already been made at the time of the
subdivision creating that lot or under the
relevant Council‘s Long Term Plan.
d) As a condition of land use resource consent in
the Commercial or Industrial Zones in which
the waiver of all or some of the required on-site
parking is sought.
Roads, Access, Parking and Loading Contribution Amount
Amount of contribution for roads, access, parking
and loading as a standard of a permitted activity or
as a condition of a resource consent:
a) The actual cost of providing a road or access to
the development concerned; and
b) The actual cost of all necessary roads and
accesses within the development area for each
allotment or building; and
c) The actual cost of road or access crossings
between allotments, or buildings in the
development; and
d) A share of the cost of the existing roads and
access where additional capacity has been
created in anticipation of future subdivision or
development. The share will be calculated on
the proportion of that additional capacity which
is to serve the development; and
e) A reasonable share of the cost of new or
upgraded roads or access where additional
capacity or safety improvements are necessary
to accommodate the cumulative effects of the
development within an area. The share will be
calculated on the proportion of additional traffic
likely to be generated by the development; and
f) The cost of forming of the parking spaces
(where a waiver from the District Plan parking
requirements is sought, the cost of forming a
parking space is deemed to be at a rate of
$5,000 (plus GST) per space); and
g) For subdivision, a general district-wide roads,
access, parking and loading contribution of 2%
of the land value of each allotment to be
created in the Residential, Commercial and
Industrial Zones (plus GST), and 3% of the
land value of each allotment to be created in
the Rural Zone (plus GST). In the Rural Zone,
the maximum amount of the sum of this
general district-wide roads, access, parking and
loading contribution and any general
districtwide reserves contribution taken under
Rule 2.A(a) shall be $7,500 (plus GST) per
allotment created by a subdivision.
Form of Contribution
a) The contribution may be required in the form of
money or land or any combination thereof.
Purpose
a) To provide for the safe and convenient
movement on roads of motor vehicles, bicycles
and pedestrians within and through the
Wairarapa.
Contributions Payable
a) For permitted activities involving construction
of a residential building, contributions shall be
made prior to the issuance of the code of
compliance certificate for the building consent.
b) For land use resource consents, contributions
shall be payable as and when required by any
condition of that consent.
c) For subdivision resource consents,
contributions shall be made prior to the
issuance of the certificate under section 224 of
the Resource Management Act 1991.
SOUTH WAIRARAPA DISTRICT COUNCIL‘S LONG TERM PLAN 2015/2025
PART 4: STRATEGIES AND POLICIES 115
REMISSION AND POSTPONEMENT OF RATES ON MAORI FREEHOLD LAND POLICY
Objectives
a) To recognise that certain Maori owned land
may have particular conditions, features,
ownership structures, or other circumstances
that make it appropriate to provide for relief
from rates.
b) To recognise that the Council and the
community benefit through the efficient
collection of rates that are properly payable and
the removal of rating debt that is considered
non-collectable.
c) To meet the requirements of section 102 of the
Local Government Act 2002 to have a policy on
the remission and postponement of rates on
Maori freehold land.
Conditions and Criteria
a) Application for remission or postponement
under this policy should be made prior to the
commencement of the rating year.
Applications made after the commencement of
the rating year may be accepted at the
discretion of the Council. A separate
application must be made for each year.
b) Owners or trustees making application should
include the following information in their
applications:
1. Details of the rating unit or units involved.
2. Documentation that shows that the land
qualifies as land whose beneficial
ownership has been determined by a
freehold order issued by the Maori Land
Court.
c) The Council may of its own volition investigate
and grant remission or postponement of rates
on any Maori freehold land in the district.
d) Relief, and the extent thereof, is at the sole
discretion of the Council and may be cancelled
and reduced at any time.
e) Council will give a remission or postponement
of up to 100% of all rates for the year for which
it is applied or based on the extent to which the
remission or postponement of rates will:
1. Support the use of the land by the owners
for traditional purposes.
2. Support the relationship of Maori and their
cultural traditions with their ancestral
lands.
3. Avoid further alienation of Maori freehold
land.
4. Facilitate any wish of the owners to
develop the land for economic use.
5. Recognise and take account of the
presence of waahi tapu that may affect the
use of the land for other purposes.
6. Recognise and take account of the
importance of the land for community
goals relating to:
The preservation of the natural
character of the coastal environment.
The protection of outstanding natural
features.
The protection of significant indigenous
vegetation and significant habitats of
indigenous fauna.
7. Recognise the level of community services
provided to the land and its occupiers.
8. Recognise matters relating to the physical
accessibility of the land.
9. Provide for an efficient collection of rates
and the removal of rating debt.
f) Decisions on the remission and postponement
of rates on Maori freehold land may be
delegated to Council officers or a committee of
the Council. All delegations will be recorded in
the Council‘s delegation schedule.
SOUTH WAIRARAPA DISTRICT COUNCIL‘S LONG TERM PLAN 2015/2025
PART 4: STRATEGIES AND POLICIES 116
REMISSION OF RATES POLICY
Introduction
In order to allow rate relief where it is considered
fair and reasonable to do so, the Council is required
to adopt policies specifying the circumstances under
which rates will be considered for remission. There
are various types of remission, and the
circumstances under which a remission will be
considered for each type may be different. The
conditions and criteria relating to each type of
remission are therefore set out separately in the
following pages, together with the objectives of the
policy.
Remission of Penalty Rates
Objectives
To enable Council to act fairly and reasonably
in its consideration of rates which have not
been received by the due date.
To provide relief and assistance to those
ratepayers experiencing financial hardship.
Criteria and Conditions
Council will consider each application on its merit
and remission may be granted where it is
considered that the application meets the following
criteria and conditions.
Criteria
a) Council will remit penalty rates where it is
demonstrated that penalty rates have been
levied due to an error by Council.
b) Remission of one penalty will be considered in
any one rating year where payment had been
late due to significant family disruption.
Significant family disruption is likely to be the
ratepayer, or a member of the household being
affected by serious illness, serious accident,
hospitalisation or death.
c) Remission of penalty may be granted if the
ratepayer is able to provide evidence that their
payment has gone astray in the post or the late
payment has otherwise resulted from matters
outside their control. Applications under this
criteria will only be accepted if the ratepayer
has a history of regular payments of rates and
has not incurred penalty rates in the previous
two years.
d) Remission of penalty rates will be considered
for those ratepayers who due to financial
hardship, are in arrears and who have entered
into an agreement with Council to repay all
outstanding and current rates. This
repayment scheme will generally be up to a
period of 24 months. Penalty rates remission
will not be considered if the agreement plan is
not being adhered to.
e) Remission will be considered if a new owner
receives penalty rates through the late issuing
of a sale notice, a wrong address on the sale
notice or late clearance of payment by the
Solicitor on a property settlement. This only
applies to penalty rates incurred on one
instalment. Future instalments do not qualify
under this criteria.
Conditions
a) Application for remission of penalty rates must
be in writing using the prescribed form.
b) Penalty rates will not be considered for
remission if the penalty rates were incurred in a
previous rating year, regardless if the
application otherwise meets the criteria.
Delegation
Council delegates the authority to remit penalty
rates to the Chief Executive Officer or the Policy and
Reporting Manager.
Remission of Rates for Land used by
Sporting, Recreational and
Community Organisations
Objectives
To facilitate the ongoing provision of non-
commercial sporting, recreational and
community services that meet the needs of the
residents of the district.
To provide indirect financial assistance to
community organisations.
To make membership of the organisation more
accessible to the general public, particularly
disadvantaged groups. These may include
children, youth, young families, aged people
and economically disadvantaged people.
Conditions and Criteria
a) This policy will apply to land owned by the
Council or owned and occupied by a not for
profit organisation, which is used exclusively or
principally for sporting, recreation or
community purposes.
b) Council will remit 50% of rates, with the
exception of targeted rates, for organisations
SOUTH WAIRARAPA DISTRICT COUNCIL‘S LONG TERM PLAN 2015/2025
PART 4: STRATEGIES AND POLICIES 117
that qualify under this policy, and with the
exception of rural halls which will receive 100%
remission. Sporting organisations will qualify
for 50% remission regardless of whether they
hold a current licence under the Sale of Liquor
Act 1989.
c) The policy does not apply to organisations
operated for pecuniary profit or which charge
tuition fees.
d) The policy does not apply to groups or
organisations whose primary purpose is to
address the needs of adult members (over 18
years) for entertainment or social interaction,
or who engage in recreational, sporting or
community services as a secondary purpose
only.
e) Applications for remission must be made to the
Council in writing prior to the commencement
of the rating year. Applications received
during a rating year will be applicable from the
commencement of the following rating year.
Applications will not be backdated. All rating
units that have remissions in place at 1 July
2002 are not required to make application.
f) Organisations making application should
include the following documents in support of
their application. Information of activities and
programmes, details of membership and
statement of objectives.
g) Remissions will remain in force until the
purpose of the organization change such that
the criteria is no longer met. No annual
applications are required following the grant of
the remission.
Delegation
Council delegates the authority to remit 50% of
rates for sporting, recreational and community
organisations to the Chief Executive Officer or the
Policy and Reporting Manager.
Remission Of Rates On Land
Protected For Natural, Historical or
Cultural Conservation Purposes.
Objectives
To preserve and promote natural resources and
heritage.
To encourage the protection of land for natural,
historic or cultural purposes.
Conditions and Criteria
a) Ratepayers who own rating units which have
some feature of cultural, natural or historic
heritage which is voluntarily protected may
qualify for remission of rates under this part of
the policy.
b) Land that is non-rateable under section 8 of the
Local Government (Rating) Act and is liable
only for rates for water supply, sewage disposal
or refuse collection will not qualify for remission
under this part of the policy.
c) Applications must be made in writing.
Applications should be supported by
documentary evidence of the protected status
of the rating unit e.g. a copy of the covenant or
other legal mechanism.
d) In considering any application for remission of
rates under this part of the policy the Council
will consider the following criteria:
1. The extent to which the preservation of
natural, cultural or historic heritage will be
promoted by granting remission of rates on
the rating unit.
2. The degree to which features of natural,
cultural or historic heritage are present on
the land.
3. The degree to which features of natural,
cultural or historic heritage inhibit the
economic utilisation of the land.
e) In granting remissions under this part of the
policy, Council may specify certain conditions
before remissions will be granted. Applicants
will be required to agree in writing to these
conditions and to pay any remitted rates if the
conditions are violated.
f) Council will decide what amount of rates will be
remitted on a case-by-case basis.
Delegations
Applications for the remission of rates for protection
of heritage will be considered by Council.
Remission of Uniform Annual General
Charge in Certain Circumstances
Objectives
To encourage continued subdivision activity by
providing rates relief to new subdivisions by
limiting the rates impact of multiple UAGCs.
To assist ratepayers who have multiple rating
units that are contiguous and used as a single
farming operation.
SOUTH WAIRARAPA DISTRICT COUNCIL‘S LONG TERM PLAN 2015/2025
PART 4: STRATEGIES AND POLICIES 118
Conditions and Criteria
a) For subdivision purposes, this policy will apply
to land that is:
1. Subdivided into two or more lots; and
2. Where title has been issued, and
3. The unsold lots remain in common
ownership.
Remission will be the charge for each unsold lot
except one.
b) For multiple rating units, this policy will apply
to land that is:
1. Contiguous, and
2. Are used as part of the farming operation.
Remission will be the charge for each unit
except the main farm residence unit.
Delegation
Council delegates the authority to remit UAGCs to
the Chief Executive Officer or the Policy and
Reporting Manager.
Remission of Reserves and Civic
Amenities Charge
Objectives
To encourage continued subdivision activity by
providing rates relief to new subdivisions by
limiting the rates impact of multiple UAGCs.
To assist ratepayers who have multiple rating
units that are contiguous and used as a single
farming operation
To provide relief to rural farming properties for
a vacant unit used as a run-off.
Conditions and Criteria
a) For subdivision purposes, this policy will apply
to land that is:
1. Subdivided into two or more lots; and
2. Where title has been issued, and
3. The unsold lots remain in common
ownership.
Remission will be the charge for each unsold lot
except one.
b) For multiple rating units, this policy will apply
to land that is:
1. Contiguous, and
2. Are used as part of the farming operation.
Remission will be the charge for each unit
except the main farm residence unit.
c) For a run-off unit the policy will apply to one
unit used as a run-off for a farming operation.
Delegation
Council delegates the authority to remit Reserves
and Civic Amenities Charge to the Chief Executive
Officer or the Policy and reporting Manager.
Remission of Rates for Natural
Disasters
Objective
To provide relief to properties affected by
natural disasters.
Conditions and Criteria
a) Council will remit rates to those properties
identified according to the conditions and
criteria set by Central Government.
The level of remission will be to the extent of
funding provided by central government.
SOUTH WAIRARAPA DISTRICT COUNCIL‘S LONG TERM PLAN 2015/2025
PART 4: STRATEGIES AND POLICIES 119
POSTPONEMENT OF RATES POLICIES
Introduction
These policies are prepared under section 110 of
the Local Government Act 2002.
Extreme Financial Circumstances
Objective
To assist ratepayers experiencing extreme financial
circumstances which affects their ability to pay
rates.
Conditions and Criteria
Council will consider, on a case by case basis, all
applications received that meet the criteria listed
below.
Criteria
a) The ratepayer(s) is unlikely to have sufficient
funds left over, after the payment of rates, for
normal health care, proper provision of
maintenance of the home and chattels at an
adequate standard as well as making provision
for normal day to day living expenses.
b) The ratepayer(s) must be the current owner of
the rating unit and have owned or resided on
the property or within the District for not less
than five years.
c) The rating unit must be used solely for
residential purposes and the ratepayer(s) must
reside on the property.
d) The ratepayer(s) must not own any other rating
units or investment properties, whether in this
District or another.
Conditions
a) Application must be in writing by the
ratepayer(s) or by an authorised agent.
b) The ratepayer(s) is required to disclose to
Council, all personal circumstances, including
the following factors: age, physical or mental
disability, injury, illness and family
circumstances so that Council can consider
these factors to establish whether extreme
financial hardship exists.
c) Applications for postponement of rates will only
be considered from the beginning of the rating
year in which the application is made. If
Council decides to postpone rates the
ratepayer(s) must first enter into an agreement
with Council to make regular payments for
future rates.
d) Council will charge a postponement fee on the
postponed rates for the period between the due
date and the date they are paid. This fee is
designed to cover the Council‘s administrative
and financial costs and may vary from year to
year. The fee is $50.00.
e) Any postponed rates will be postponed until;
1. The death of the ratepayer(s); or
2. Until the ratepayer(s) ceases to be the
owner or occupier of the rating unit; or
3. Until the ratepayer(s) ceases to use the
property as their residence; or
4. until a date specified by the Council as
determined by Council in any particular
case.
f) Postponed rates or any part thereof may be
paid at any time. The applicant may elect to
postpone the payment of a lesser sum than
that which they would be entitled to have
postponed pursuant to this policy.
g) Postponed rates will be registered as a
statutory land charge on the rating unit under
the Statutory Land Charges Registration Act
1928 and no dealing with the land may be
registered by the ratepayer while the charge is
registered except with the consent of Council.
Delegation
Council delegates the authority to approve
applications for rate postponement to the Chief
Executive Officer.
Ratepayers Aged 65 Years and Over
Objective
To give ratepayers a choice between paying rates
now or later subject to the full cost of
postponement being met by the ratepayer and
Council being satisfied that the risk of loss in any
case is minimal.
General Approach
Only rating units defined as residential and used for
personal residential purposes by the applicant(s) as
their sole or principal residence will be eligible for
consideration of rates postponement under the
criteria and conditions of this policy.
Current and all future rates may be postponed
indefinitely if at least one ratepayer (or, if the
ratepayer is a family trust, at least one named
occupier) is 65 years of age or older.
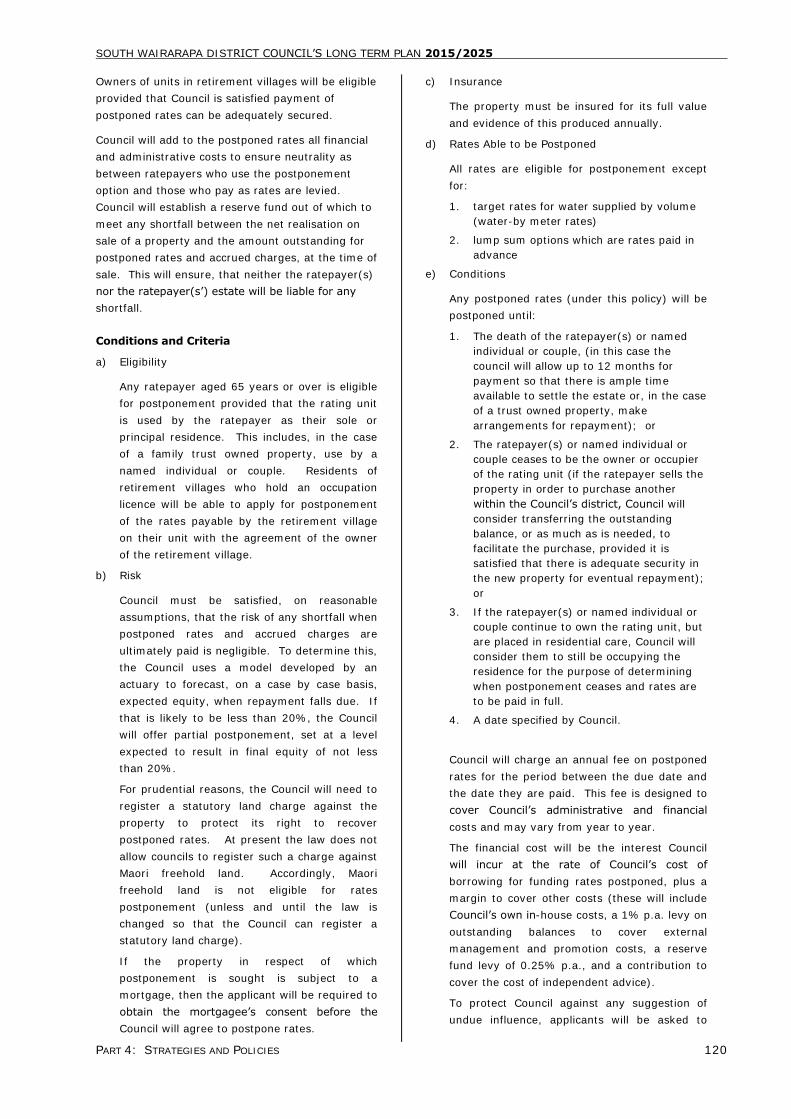
SOUTH WAIRARAPA DISTRICT COUNCIL‘S LONG TERM PLAN 2015/2025
PART 4: STRATEGIES AND POLICIES 120
Owners of units in retirement villages will be eligible
provided that Council is satisfied payment of
postponed rates can be adequately secured.
Council will add to the postponed rates all financial
and administrative costs to ensure neutrality as
between ratepayers who use the postponement
option and those who pay as rates are levied.
Council will establish a reserve fund out of which to
meet any shortfall between the net realisation on
sale of a property and the amount outstanding for
postponed rates and accrued charges, at the time of
sale. This will ensure, that neither the ratepayer(s)
nor the ratepayer(s‘) estate will be liable for any
shortfall.
Conditions and Criteria
a) Eligibility
Any ratepayer aged 65 years or over is eligible
for postponement provided that the rating unit
is used by the ratepayer as their sole or
principal residence. This includes, in the case
of a family trust owned property, use by a
named individual or couple. Residents of
retirement villages who hold an occupation
licence will be able to apply for postponement
of the rates payable by the retirement village
on their unit with the agreement of the owner
of the retirement village.
b) Risk
Council must be satisfied, on reasonable
assumptions, that the risk of any shortfall when
postponed rates and accrued charges are
ultimately paid is negligible. To determine this,
the Council uses a model developed by an
actuary to forecast, on a case by case basis,
expected equity, when repayment falls due. If
that is likely to be less than 20%, the Council
will offer partial postponement, set at a level
expected to result in final equity of not less
than 20%.
For prudential reasons, the Council will need to
register a statutory land charge against the
property to protect its right to recover
postponed rates. At present the law does not
allow councils to register such a charge against
Maori freehold land. Accordingly, Maori
freehold land is not eligible for rates
postponement (unless and until the law is
changed so that the Council can register a
statutory land charge).
If the property in respect of which
postponement is sought is subject to a
mortgage, then the applicant will be required to
obtain the mortgagee‘s consent before the
Council will agree to postpone rates.
c) Insurance
The property must be insured for its full value
and evidence of this produced annually.
d) Rates Able to be Postponed
All rates are eligible for postponement except
for:
1. target rates for water supplied by volume
(water-by meter rates)
2. lump sum options which are rates paid in
advance
e) Conditions
Any postponed rates (under this policy) will be
postponed until:
1. The death of the ratepayer(s) or named
individual or couple, (in this case the
council will allow up to 12 months for
payment so that there is ample time
available to settle the estate or, in the case
of a trust owned property, make
arrangements for repayment); or
2. The ratepayer(s) or named individual or
couple ceases to be the owner or occupier
of the rating unit (if the ratepayer sells the
property in order to purchase another
within the Council‘s district, Council will
consider transferring the outstanding
balance, or as much as is needed, to
facilitate the purchase, provided it is
satisfied that there is adequate security in
the new property for eventual repayment);
or
3. If the ratepayer(s) or named individual or
couple continue to own the rating unit, but
are placed in residential care, Council will
consider them to still be occupying the
residence for the purpose of determining
when postponement ceases and rates are
to be paid in full.
4. A date specified by Council.
Council will charge an annual fee on postponed
rates for the period between the due date and
the date they are paid. This fee is designed to
cover Council‘s administrative and financial
costs and may vary from year to year.
The financial cost will be the interest Council
will incur at the rate of Council‘s cost of
borrowing for funding rates postponed, plus a
margin to cover other costs (these will include
Council‘s own in-house costs, a 1% p.a. levy on
outstanding balances to cover external
management and promotion costs, a reserve
fund levy of 0.25% p.a., and a contribution to
cover the cost of independent advice).
To protect Council against any suggestion of
undue influence, applicants will be asked to
SOUTH WAIRARAPA DISTRICT COUNCIL‘S LONG TERM PLAN 2015/2025
PART 4: STRATEGIES AND POLICIES 121
obtain advice from an appropriately qualified
and trained independent person. A certificate
confirming this will be required before
postponement is granted. Council has made
arrangements with a reputable and
appropriately qualified non-government
organisation to provide this service. The
postponed rates or any part thereof may be
paid at any time. The applicant may elect to
postpone the payment of a lesser sum than
that which they would be entitled to have
postponed pursuant to this policy. Postponed
rates will be registered as a statutory land
charge on the rating unit title. This means that
Council will have first call on the proceeds of
any revenue from the sale or lease of the rating
unit.
f) Review of Suspension of Policy
This policy is in place indefinitely and can be
reviewed subject to the requirements of the
Local Government Act 2002 at any time. Any
resulting modifications will not change the
entitlement of people already in the scheme to
continued postponement of all future rates.
Council reserves the right not to postpone any
further rates once the total of postponed rates
and accrued charges exceeds 80% of the
ratable value of the property as recorded in
Council‘s rating information database. This will
require the ratepayer(s) for that property to
pay all future rates but will not require any
payment in respect of rates postponed up to
that time. These will remain due for payment
on death or sale.
The policy consciously acknowledges that
future changes in policy could include
withdrawal of the postponement option.
g) Procedures
Applications must be on the required form
which will be available from any Council office.
The policy will apply from the beginning of the
rating year in which the application is made.
This policy was implemented effective from 1 July
2006.
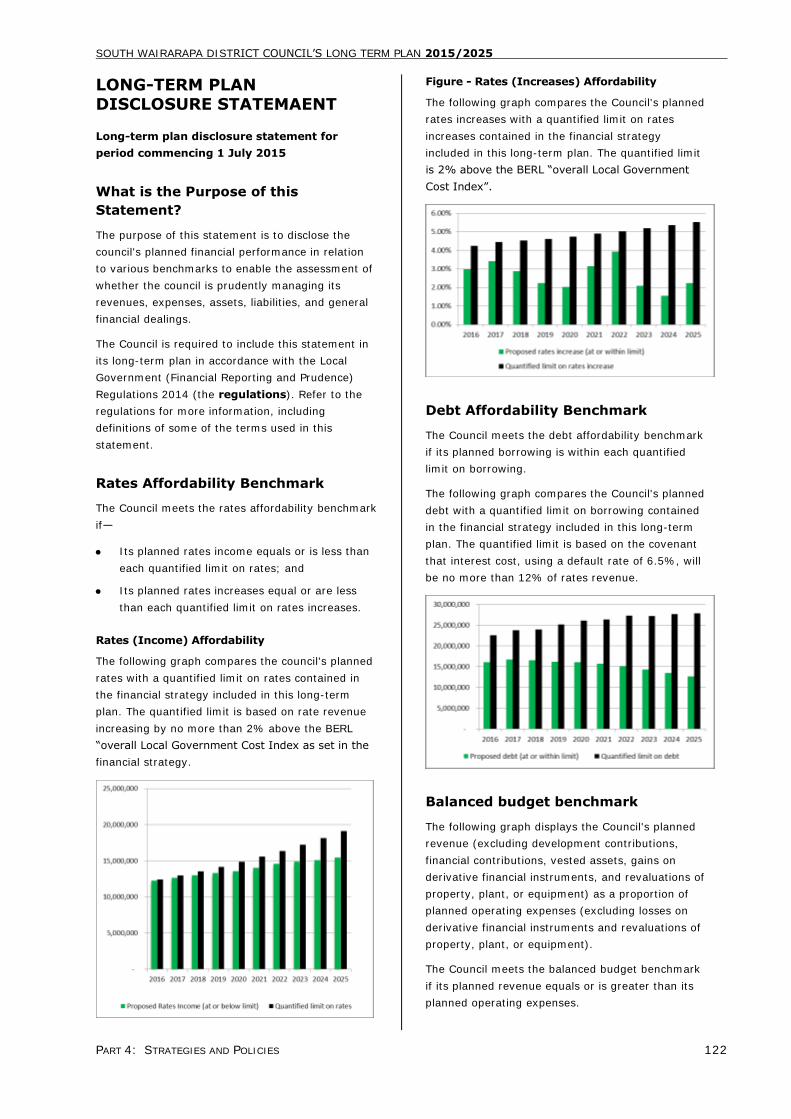
SOUTH WAIRARAPA DISTRICT COUNCIL‘S LONG TERM PLAN 2015/2025
PART 4: STRATEGIES AND POLICIES 122
LONG-TERM PLAN DISCLOSURE STATEMAENT
Long-term plan disclosure statement for
period commencing 1 July 2015
What is the Purpose of this
Statement?
The purpose of this statement is to disclose the
council's planned financial performance in relation
to various benchmarks to enable the assessment of
whether the council is prudently managing its
revenues, expenses, assets, liabilities, and general
financial dealings.
The Council is required to include this statement in
its long-term plan in accordance with the Local
Government (Financial Reporting and Prudence)
Regulations 2014 (the regulations). Refer to the
regulations for more information, including
definitions of some of the terms used in this
statement.
Rates Affordability Benchmark
The Council meets the rates affordability benchmark
if—
Its planned rates income equals or is less than
each quantified limit on rates; and
Its planned rates increases equal or are less
than each quantified limit on rates increases.
Rates (Income) Affordability
The following graph compares the council's planned
rates with a quantified limit on rates contained in
the financial strategy included in this long-term
plan. The quantified limit is based on rate revenue
increasing by no more than 2% above the BERL
―overall Local Government Cost Index as set in the
financial strategy.
Figure - Rates (Increases) Affordability
The following graph compares the Council's planned
rates increases with a quantified limit on rates
increases contained in the financial strategy
included in this long-term plan. The quantified limit
is 2% above the BERL ―overall Local Government
Cost Index‖.
Debt Affordability Benchmark
The Council meets the debt affordability benchmark
if its planned borrowing is within each quantified
limit on borrowing.
The following graph compares the Council's planned
debt with a quantified limit on borrowing contained
in the financial strategy included in this long-term
plan. The quantified limit is based on the covenant
that interest cost, using a default rate of 6.5%, will
be no more than 12% of rates revenue.
Balanced budget benchmark
The following graph displays the Council's planned
revenue (excluding development contributions,
financial contributions, vested assets, gains on
derivative financial instruments, and revaluations of
property, plant, or equipment) as a proportion of
planned operating expenses (excluding losses on
derivative financial instruments and revaluations of
property, plant, or equipment).
The Council meets the balanced budget benchmark
if its planned revenue equals or is greater than its
planned operating expenses.
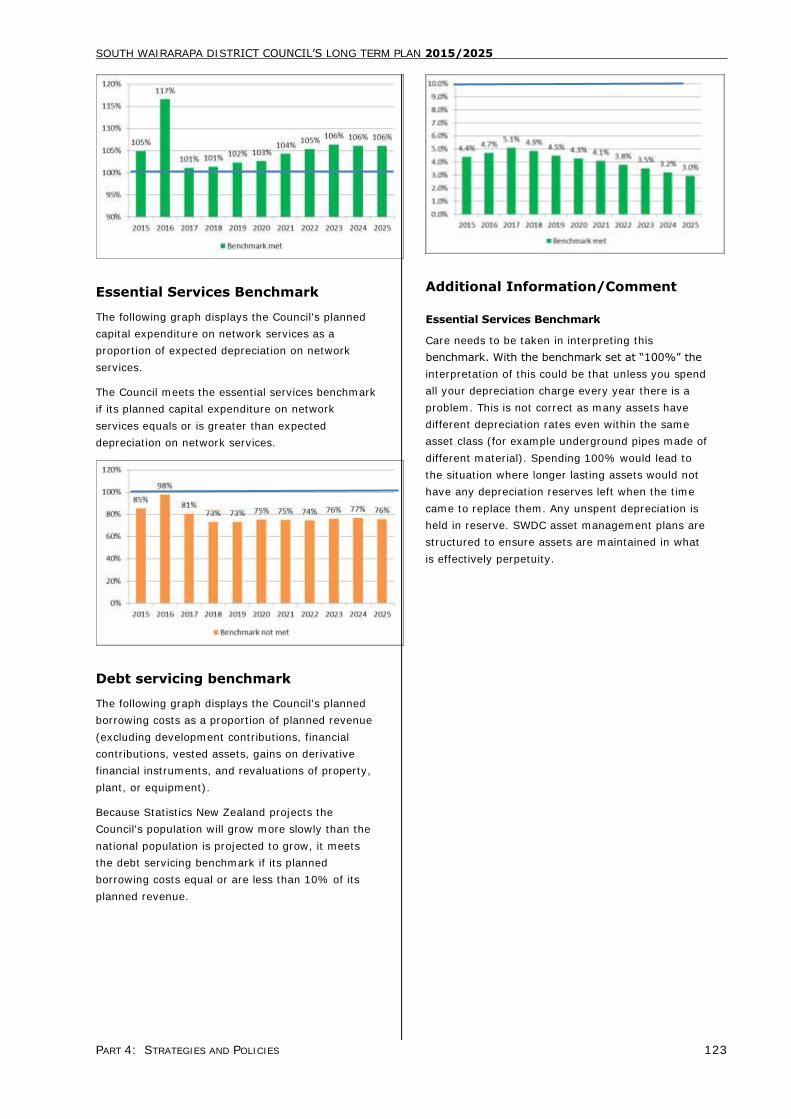
SOUTH WAIRARAPA DISTRICT COUNCIL‘S LONG TERM PLAN 2015/2025
PART 4: STRATEGIES AND POLICIES 123
Essential Services Benchmark
The following graph displays the Council's planned
capital expenditure on network services as a
proportion of expected depreciation on network
services.
The Council meets the essential services benchmark
if its planned capital expenditure on network
services equals or is greater than expected
depreciation on network services.
Debt servicing benchmark
The following graph displays the Council's planned
borrowing costs as a proportion of planned revenue
(excluding development contributions, financial
contributions, vested assets, gains on derivative
financial instruments, and revaluations of property,
plant, or equipment).
Because Statistics New Zealand projects the
Council's population will grow more slowly than the
national population is projected to grow, it meets
the debt servicing benchmark if its planned
borrowing costs equal or are less than 10% of its
planned revenue.
Additional Information/Comment
Essential Services Benchmark
Care needs to be taken in interpreting this
benchmark. With the benchmark set at ―100%‖ the
interpretation of this could be that unless you spend
all your depreciation charge every year there is a
problem. This is not correct as many assets have
different depreciation rates even within the same
asset class (for example underground pipes made of
different material). Spending 100% would lead to
the situation where longer lasting assets would not
have any depreciation reserves left when the time
came to replace them. Any unspent depreciation is
held in reserve. SWDC asset management plans are
structured to ensure assets are maintained in what
is effectively perpetuity.
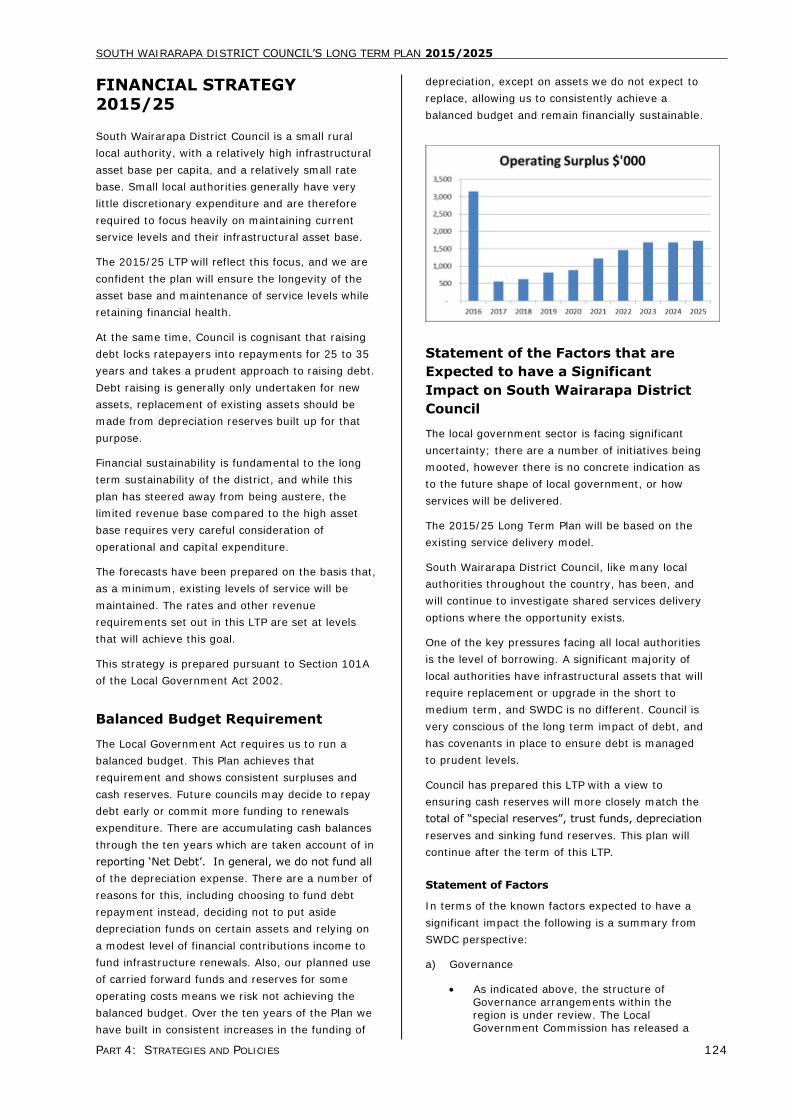
SOUTH WAIRARAPA DISTRICT COUNCIL‘S LONG TERM PLAN 2015/2025
PART 4: STRATEGIES AND POLICIES 124
FINANCIAL STRATEGY 2015/25
South Wairarapa District Council is a small rural
local authority, with a relatively high infrastructural
asset base per capita, and a relatively small rate
base. Small local authorities generally have very
little discretionary expenditure and are therefore
required to focus heavily on maintaining current
service levels and their infrastructural asset base.
The 2015/25 LTP will reflect this focus, and we are
confident the plan will ensure the longevity of the
asset base and maintenance of service levels while
retaining financial health.
At the same time, Council is cognisant that raising
debt locks ratepayers into repayments for 25 to 35
years and takes a prudent approach to raising debt.
Debt raising is generally only undertaken for new
assets, replacement of existing assets should be
made from depreciation reserves built up for that
purpose.
Financial sustainability is fundamental to the long
term sustainability of the district, and while this
plan has steered away from being austere, the
limited revenue base compared to the high asset
base requires very careful consideration of
operational and capital expenditure.
The forecasts have been prepared on the basis that,
as a minimum, existing levels of service will be
maintained. The rates and other revenue
requirements set out in this LTP are set at levels
that will achieve this goal.
This strategy is prepared pursuant to Section 101A
of the Local Government Act 2002.
Balanced Budget Requirement
The Local Government Act requires us to run a
balanced budget. This Plan achieves that
requirement and shows consistent surpluses and
cash reserves. Future councils may decide to repay
debt early or commit more funding to renewals
expenditure. There are accumulating cash balances
through the ten years which are taken account of in
reporting ‗Net Debt‘. In general, we do not fund all
of the depreciation expense. There are a number of
reasons for this, including choosing to fund debt
repayment instead, deciding not to put aside
depreciation funds on certain assets and relying on
a modest level of financial contributions income to
fund infrastructure renewals. Also, our planned use
of carried forward funds and reserves for some
operating costs means we risk not achieving the
balanced budget. Over the ten years of the Plan we
have built in consistent increases in the funding of
depreciation, except on assets we do not expect to
replace, allowing us to consistently achieve a
balanced budget and remain financially sustainable.
Statement of the Factors that are
Expected to have a Significant
Impact on South Wairarapa District
Council
The local government sector is facing significant
uncertainty; there are a number of initiatives being
mooted, however there is no concrete indication as
to the future shape of local government, or how
services will be delivered.
The 2015/25 Long Term Plan will be based on the
existing service delivery model.
South Wairarapa District Council, like many local
authorities throughout the country, has been, and
will continue to investigate shared services delivery
options where the opportunity exists.
One of the key pressures facing all local authorities
is the level of borrowing. A significant majority of
local authorities have infrastructural assets that will
require replacement or upgrade in the short to
medium term, and SWDC is no different. Council is
very conscious of the long term impact of debt, and
has covenants in place to ensure debt is managed
to prudent levels.
Council has prepared this LTP with a view to
ensuring cash reserves will more closely match the
total of ―special reserves‖, trust funds, depreciation
reserves and sinking fund reserves. This plan will
continue after the term of this LTP.
Statement of Factors
In terms of the known factors expected to have a
significant impact the following is a summary from
SWDC perspective:
a) Governance
As indicated above, the structure of Governance arrangements within the region is under review. The Local Government Commission has released a
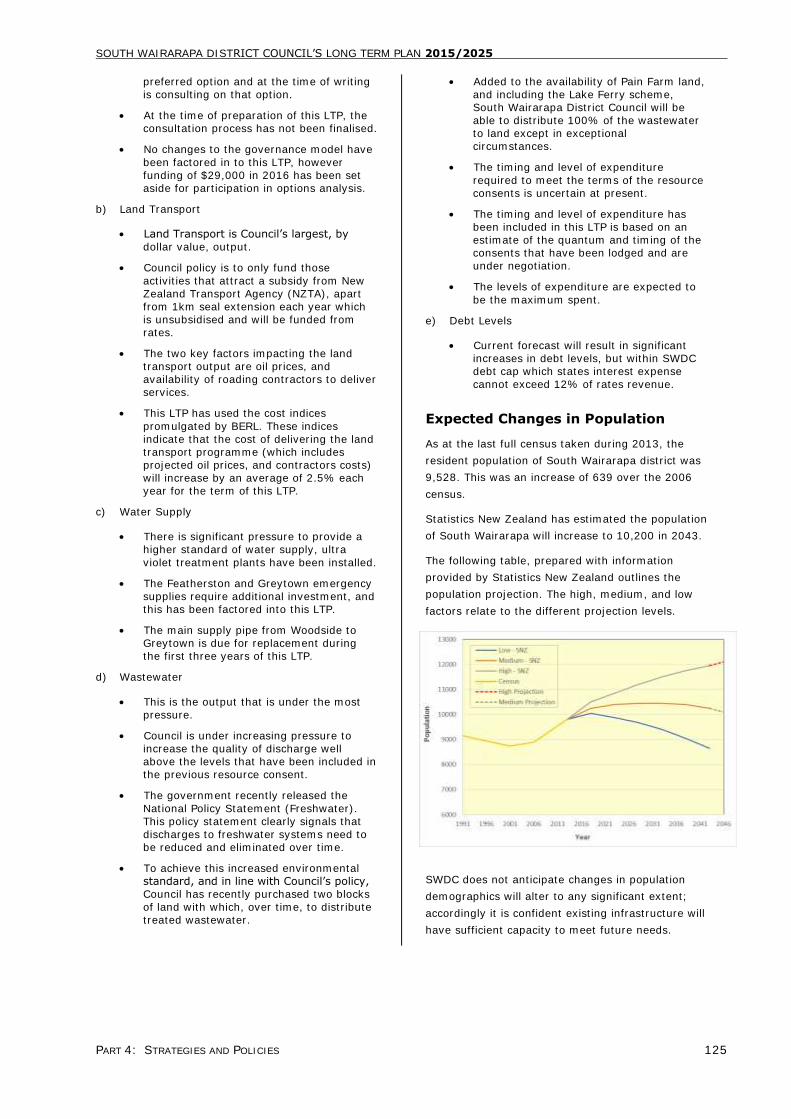
SOUTH WAIRARAPA DISTRICT COUNCIL‘S LONG TERM PLAN 2015/2025
PART 4: STRATEGIES AND POLICIES 125
preferred option and at the time of writing is consulting on that option.
At the time of preparation of this LTP, the consultation process has not been finalised.
No changes to the governance model have
been factored in to this LTP, however funding of $29,000 in 2016 has been set aside for participation in options analysis.
b) Land Transport
Land Transport is Council‘s largest, by dollar value, output.
Council policy is to only fund those
activities that attract a subsidy from New Zealand Transport Agency (NZTA), apart from 1km seal extension each year which is unsubsidised and will be funded from rates.
The two key factors impacting the land transport output are oil prices, and availability of roading contractors to deliver services.
This LTP has used the cost indices
promulgated by BERL. These indices indicate that the cost of delivering the land transport programme (which includes projected oil prices, and contractors costs) will increase by an average of 2.5% each year for the term of this LTP.
c) Water Supply
There is significant pressure to provide a higher standard of water supply, ultra
violet treatment plants have been installed.
The Featherston and Greytown emergency supplies require additional investment, and this has been factored into this LTP.
The main supply pipe from Woodside to Greytown is due for replacement during the first three years of this LTP.
d) Wastewater
This is the output that is under the most pressure.
Council is under increasing pressure to increase the quality of discharge well above the levels that have been included in the previous resource consent.
The government recently released the
National Policy Statement (Freshwater). This policy statement clearly signals that discharges to freshwater systems need to be reduced and eliminated over time.
To achieve this increased environmental standard, and in line with Council‘s policy, Council has recently purchased two blocks of land with which, over time, to distribute treated wastewater.
Added to the availability of Pain Farm land, and including the Lake Ferry scheme, South Wairarapa District Council will be able to distribute 100% of the wastewater to land except in exceptional circumstances.
The timing and level of expenditure
required to meet the terms of the resource consents is uncertain at present.
The timing and level of expenditure has been included in this LTP is based on an estimate of the quantum and timing of the consents that have been lodged and are under negotiation.
The levels of expenditure are expected to
be the maximum spent.
e) Debt Levels
Current forecast will result in significant increases in debt levels, but within SWDC debt cap which states interest expense cannot exceed 12% of rates revenue.
Expected Changes in Population
As at the last full census taken during 2013, the
resident population of South Wairarapa district was
9,528. This was an increase of 639 over the 2006
census.
Statistics New Zealand has estimated the population
of South Wairarapa will increase to 10,200 in 2043.
The following table, prepared with information
provided by Statistics New Zealand outlines the
population projection. The high, medium, and low
factors relate to the different projection levels.
SWDC does not anticipate changes in population
demographics will alter to any significant extent;
accordingly it is confident existing infrastructure will
have sufficient capacity to meet future needs.

SOUTH WAIRARAPA DISTRICT COUNCIL‘S LONG TERM PLAN 2015/2025
PART 4: STRATEGIES AND POLICIES 126
Capital Costs of Providing for Those Changes
As SWDC does not anticipate population growth will
exceed existing infrastructure capacity, no
allowance has been made for capital to build
additional capacity.
Operating Costs of Providing for Those changes
As SWDC does not anticipate population growth will
exceed existing infrastructure capacity, no
allowance has been made for additional operating
costs, apart from normal inflation.
Expected Changes in Use of Land
The following table summarises the numbers of
rateable units by land type identified by Quotable
Value.
LAND CATEGORY ASSESSMENTS
2011 2014
Arable 0 0
Commercial 205 198
Dairy 241 240
Forestry 19 24
Horticulture 142 137
Industrial 130 131
Lifestyle 975 1065
Minings 2 2
Other/Utilities 412 431
Pastoral 604 604
Residential 3948 4038
Specialist Livestock 7 7
Historical changes in land use have been relatively
low, and it is anticipated this low rate of change will
continue.
Existing budget and infrastructural levels have been
adequate to meet the historical land use changes
without the need for substantial investment.
There are two areas of change in land use that put
pressure on infrastructure and cost, these are dairy
conversions, and rural subdivisions.
While dairy conversions result in a significant
increase in vehicle movements, the rate of these
conversions has slowed considerably and current
levels of expenditure are sufficient to maintain
serviceability of the infrastructure.
Rural subdivisions and ‗urban sprawl‖ creates
pressure for seal extensions. As this activity no
longer attracts New Zealand Transport Authority
(NZTA) subsidy, the full cost of any extensions fall
on the ratepayer. However in mitigation of these
pressures, expenditure on seal extensions is
entirely discretionary.
In summary, it is not anticipated land use will
change to the extent that additional expenditure is
required.
SWDC existing infrastructure levels have sufficient
capacity to meet anticipated future growth levels.
Capital Costs of Providing for Those Changes
As SWDC does not anticipate significant change in
land use, no allowance has been made for capital to
build additional capacity. The majority of capital
works required for subdivisional activity is funded
from financial contributions by the subdivider.
Operating Costs of Providing for Those Changes
As SWDC does not anticipate significant change in
land use, no allowance has been made for increased
operating costs to cover land use changes.
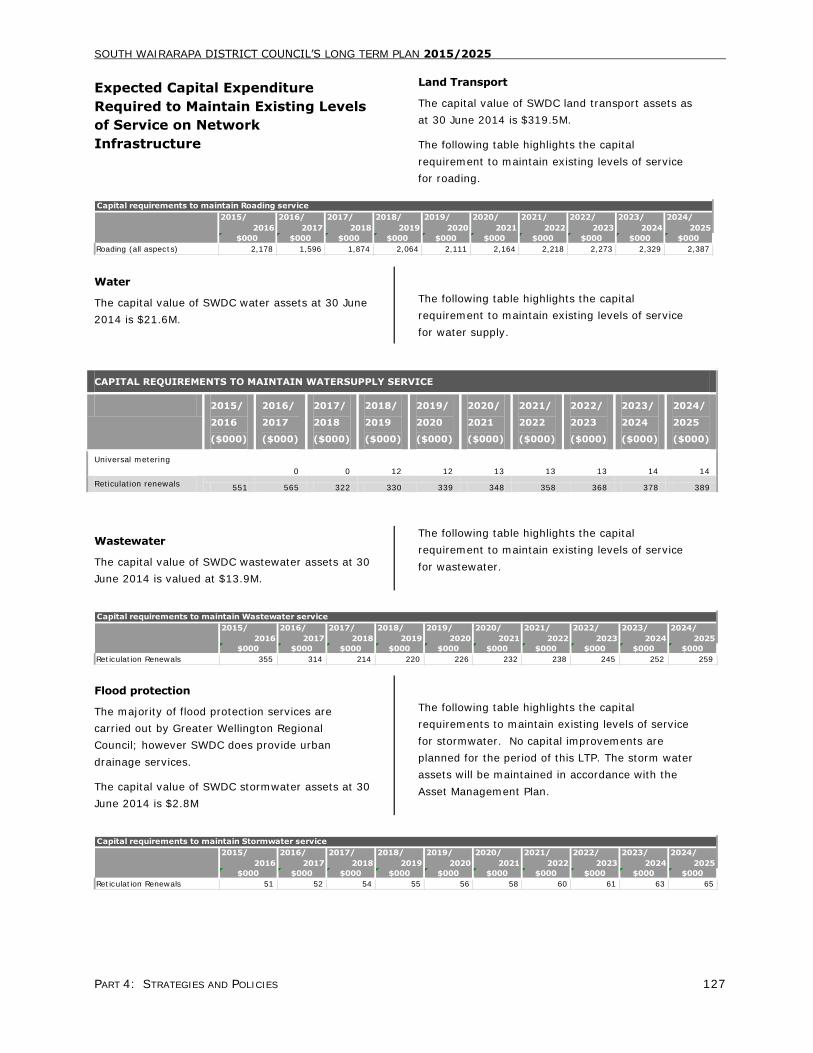
SOUTH WAIRARAPA DISTRICT COUNCIL‘S LONG TERM PLAN 2015/2025
PART 4: STRATEGIES AND POLICIES 127
Expected Capital Expenditure
Required to Maintain Existing Levels
of Service on Network
Infrastructure
Land Transport
The capital value of SWDC land transport assets as
at 30 June 2014 is $319.5M.
The following table highlights the capital
requirement to maintain existing levels of service
for roading.
2015/ 2016/ 2017/ 2018/ 2019/ 2020/ 2021/ 2022/ 2023/ 2024/
2016 2017 2018 2019 2020 2021 2022 2023 2024 2025
$000 $000 $000 $000 $000 $000 $000 $000 $000 $000
Roading (all aspects) 2,178 1,596 1,874 2,064 2,111 2,164 2,218 2,273 2,329 2,387
Capital requirements to maintain Roading service
Water
The capital value of SWDC water assets at 30 June
2014 is $21.6M.
The following table highlights the capital
requirement to maintain existing levels of service
for water supply.
CAPITAL REQUIREMENTS TO MAINTAIN WATERSUPPLY SERVICE
2015/
2016
($000)
2016/
2017
($000)
2017/
2018
($000)
2018/
2019
($000)
2019/
2020
($000)
2020/
2021
($000)
2021/
2022
($000)
2022/
2023
($000)
2023/
2024
($000)
2024/
2025
($000)
Universal metering
0 0 12 12 13 13 13 14 14
Reticulation renewals 551 565 322 330 339 348 358 368 378 389
Wastewater
The capital value of SWDC wastewater assets at 30
June 2014 is valued at $13.9M.
The following table highlights the capital
requirement to maintain existing levels of service
for wastewater.
2015/ 2016/ 2017/ 2018/ 2019/ 2020/ 2021/ 2022/ 2023/ 2024/
2016 2017 2018 2019 2020 2021 2022 2023 2024 2025
$000 $000 $000 $000 $000 $000 $000 $000 $000 $000
Reticulation Renewals 355 314 214 220 226 232 238 245 252 259
Capital requirements to maintain Wastewater service
Flood protection
The majority of flood protection services are
carried out by Greater Wellington Regional
Council; however SWDC does provide urban
drainage services.
The capital value of SWDC stormwater assets at 30
June 2014 is $2.8M
The following table highlights the capital
requirements to maintain existing levels of service
for stormwater. No capital improvements are
planned for the period of this LTP. The storm water
assets will be maintained in accordance with the
Asset Management Plan.
2015/ 2016/ 2017/ 2018/ 2019/ 2020/ 2021/ 2022/ 2023/ 2024/
2016 2017 2018 2019 2020 2021 2022 2023 2024 2025
$000 $000 $000 $000 $000 $000 $000 $000 $000 $000
Reticulation Renewals 51 52 54 55 56 58 60 61 63 65
Capital requirements to maintain Stormwater service
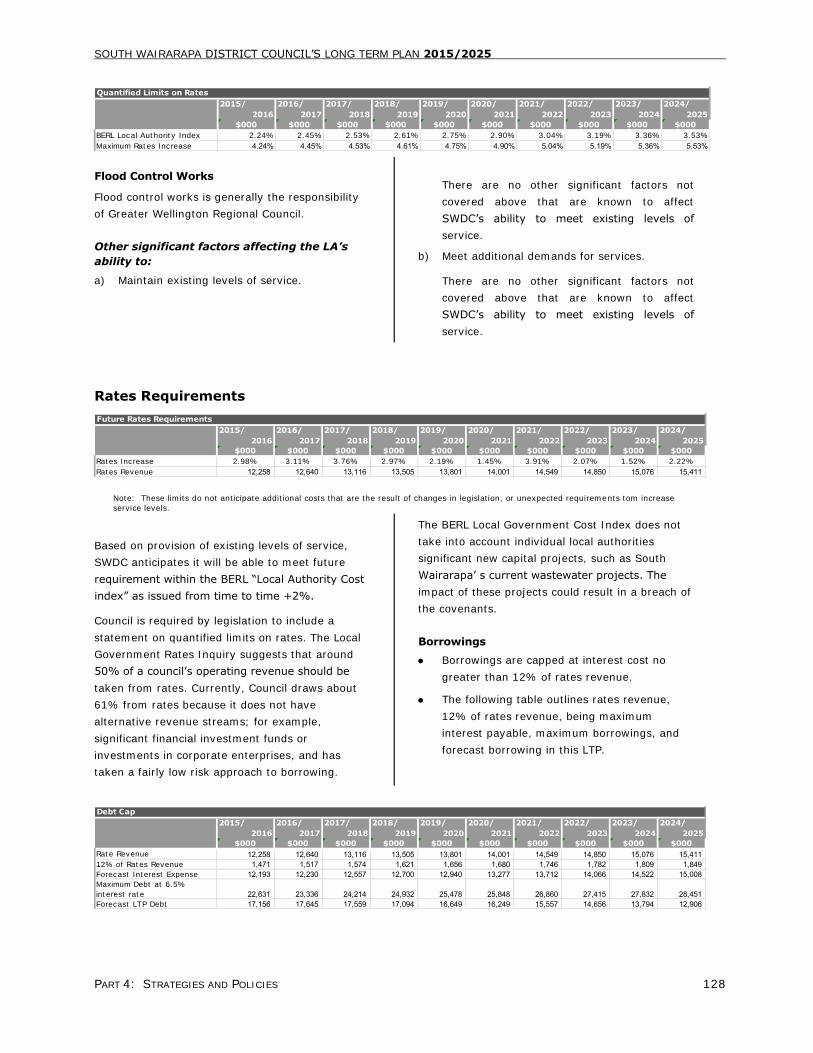
SOUTH WAIRARAPA DISTRICT COUNCIL‘S LONG TERM PLAN 2015/2025
PART 4: STRATEGIES AND POLICIES 128
2015/ 2016/ 2017/ 2018/ 2019/ 2020/ 2021/ 2022/ 2023/ 2024/
2016 2017 2018 2019 2020 2021 2022 2023 2024 2025
$000 $000 $000 $000 $000 $000 $000 $000 $000 $000
BERL Local Authority Index 2.24% 2.45% 2.53% 2.61% 2.75% 2.90% 3.04% 3.19% 3.36% 3.53%
Maximum Rates Increase 4.24% 4.45% 4.53% 4.61% 4.75% 4.90% 5.04% 5.19% 5.36% 5.53%
Quantified Limits on Rates
Flood Control Works
Flood control works is generally the responsibility
of Greater Wellington Regional Council.
Other significant factors affecting the LA’s
ability to:
a) Maintain existing levels of service.
There are no other significant factors not
covered above that are known to affect
SWDC‘s ability to meet existing levels of
service.
b) Meet additional demands for services.
There are no other significant factors not
covered above that are known to affect
SWDC‘s ability to meet existing levels of
service.
Rates Requirements
2015/ 2016/ 2017/ 2018/ 2019/ 2020/ 2021/ 2022/ 2023/ 2024/
2016 2017 2018 2019 2020 2021 2022 2023 2024 2025
$000 $000 $000 $000 $000 $000 $000 $000 $000 $000
Rates Increase 2.98% 3.11% 3.76% 2.97% 2.19% 1.45% 3.91% 2.07% 1.52% 2.22%
Rates Revenue 12,258 12,640 13,116 13,505 13,801 14,001 14,549 14,850 15,076 15,411
Future Rates Requirements
Note: These limits do not anticipate additional costs that are the result of changes in legislation, or unexpected requirements tom increase
service levels.
Based on provision of existing levels of service,
SWDC anticipates it will be able to meet future
requirement within the BERL ―Local Authority Cost
index‖ as issued from time to time +2%.
Council is required by legislation to include a
statement on quantified limits on rates. The Local
Government Rates Inquiry suggests that around
50% of a council‘s operating revenue should be
taken from rates. Currently, Council draws about
61% from rates because it does not have
alternative revenue streams; for example,
significant financial investment funds or
investments in corporate enterprises, and has
taken a fairly low risk approach to borrowing.
The BERL Local Government Cost Index does not
take into account individual local authorities
significant new capital projects, such as South
Wairarapa‘ s current wastewater projects. The
impact of these projects could result in a breach of
the covenants.
Borrowings
Borrowings are capped at interest cost no
greater than 12% of rates revenue.
The following table outlines rates revenue,
12% of rates revenue, being maximum
interest payable, maximum borrowings, and
forecast borrowing in this LTP.
2015/ 2016/ 2017/ 2018/ 2019/ 2020/ 2021/ 2022/ 2023/ 2024/
2016 2017 2018 2019 2020 2021 2022 2023 2024 2025
$000 $000 $000 $000 $000 $000 $000 $000 $000 $000
Rate Revenue 12,258 12,640 13,116 13,505 13,801 14,001 14,549 14,850 15,076 15,411 12% of Rates Revenue 1,471 1,517 1,574 1,621 1,656 1,680 1,746 1,782 1,809 1,849 Forecast Interest Expense 12,193 12,230 12,557 12,700 12,940 13,277 13,712 14,066 14,522 15,008 Maximum Debt at 6.5%
interest rate 22,631 23,336 24,214 24,932 25,478 25,848 26,860 27,415 27,832 28,451 Forecast LTP Debt 17,156 17,645 17,559 17,094 16,649 16,249 15,557 14,656 13,794 12,906
Debt Cap
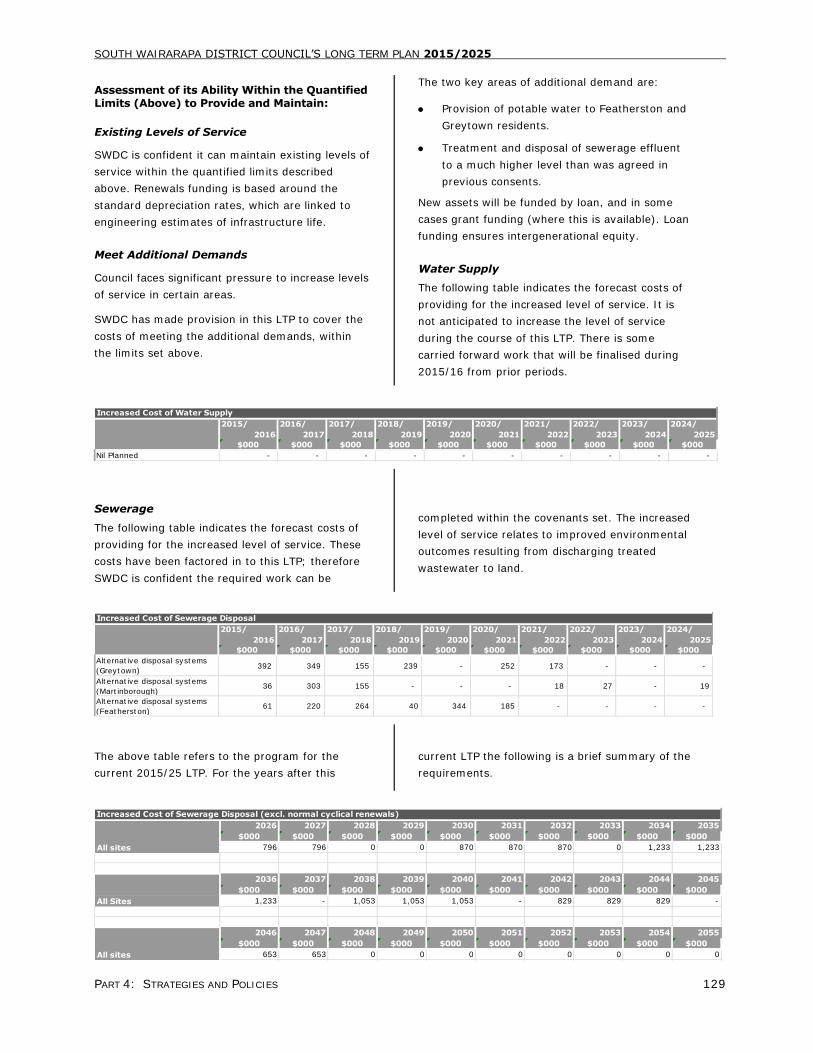
SOUTH WAIRARAPA DISTRICT COUNCIL‘S LONG TERM PLAN 2015/2025
PART 4: STRATEGIES AND POLICIES 129
Assessment of its Ability Within the Quantified
Limits (Above) to Provide and Maintain:
Existing Levels of Service
SWDC is confident it can maintain existing levels of
service within the quantified limits described
above. Renewals funding is based around the
standard depreciation rates, which are linked to
engineering estimates of infrastructure life.
Meet Additional Demands
Council faces significant pressure to increase levels
of service in certain areas.
SWDC has made provision in this LTP to cover the
costs of meeting the additional demands, within
the limits set above.
The two key areas of additional demand are:
Provision of potable water to Featherston and
Greytown residents.
Treatment and disposal of sewerage effluent
to a much higher level than was agreed in
previous consents.
New assets will be funded by loan, and in some
cases grant funding (where this is available). Loan
funding ensures intergenerational equity.
Water Supply
The following table indicates the forecast costs of
providing for the increased level of service. It is
not anticipated to increase the level of service
during the course of this LTP. There is some
carried forward work that will be finalised during
2015/16 from prior periods.
2015/ 2016/ 2017/ 2018/ 2019/ 2020/ 2021/ 2022/ 2023/ 2024/
2016 2017 2018 2019 2020 2021 2022 2023 2024 2025
$000 $000 $000 $000 $000 $000 $000 $000 $000 $000
Nil Planned - - - - - - - - - -
Increased Cost of Water Supply
Sewerage
The following table indicates the forecast costs of
providing for the increased level of service. These
costs have been factored in to this LTP; therefore
SWDC is confident the required work can be
completed within the covenants set. The increased
level of service relates to improved environmental
outcomes resulting from discharging treated
wastewater to land.
2015/ 2016/ 2017/ 2018/ 2019/ 2020/ 2021/ 2022/ 2023/ 2024/
2016 2017 2018 2019 2020 2021 2022 2023 2024 2025
$000 $000 $000 $000 $000 $000 $000 $000 $000 $000
Alternative disposal systems
(Greytown) 392 349 155 239 - 252 173 - - -
Alternative disposal systems
(Martinborough) 36 303 155 - - - 18 27 - 19
Alternative disposal systems
(Featherston) 61 220 264 40 344 185 - - - -
Increased Cost of Sewerage Disposal
The above table refers to the program for the
current 2015/25 LTP. For the years after this
current LTP the following is a brief summary of the
requirements.
2026 2027 2028 2029 2030 2031 2032 2033 2034 2035
$000 $000 $000 $000 $000 $000 $000 $000 $000 $000
796 796 0 0 870 870 870 0 1,233 1,233
2036 2037 2038 2039 2040 2041 2042 2043 2044 2045
$000 $000 $000 $000 $000 $000 $000 $000 $000 $000
1,233 - 1,053 1,053 1,053 - 829 829 829 -
2046 2047 2048 2049 2050 2051 2052 2053 2054 2055
$000 $000 $000 $000 $000 $000 $000 $000 $000 $000
653 653 0 0 0 0 0 0 0 0
All Sites
All sites
Increased Cost of Sewerage Disposal (excl. normal cyclical renewals)
All sites
SOUTH WAIRARAPA DISTRICT COUNCIL‘S LONG TERM PLAN 2015/2025
PART 4: STRATEGIES AND POLICIES 130
In proportionate terms, the most significant capital
expenditure has been made, that is the purchase
of land. The remaining cost is around the irrigation
infrastructure, and the on-going inflow and
infiltration issues and maintenance.
The rest of the project includes:
Complete the irrigation aspect to get as close
to 100% discharge to land.
Complete remaining high priority/high-benefit
reticulation inflow & infiltration works.
Investigate storage.
This expenditure is for new assets; accordingly
these assets are required to be loan funded.
SWDC Policy on the Giving of Securities for its
Borrowing
Council does not offer assets as security for
borrowings.
SWDC Objectives for Holding and Managing
a) Financial investments.
Refer to Councils investment policy for the
objectives for holding and managing financial
investments.
b) The quantified targets for returns on financial
investments.
The Council‘s long term special funds will be
retained in their present form throughout the
Plan. Additions and withdrawals from the
funds have been accounted for each year
through the Plan where identified and
required. A range of 3.6% to 4.6% has been
assumed for the return on the special funds
investment.
c) Equity securities.
Council holds a very limited portfolio of equity
investments. These are held for strategic
purposes only and are not held for specific
investment.
d) The quantified targets for returns on equity
securities.
There is no quantified target for equity
investments for the reasons outlined above.
SOUTH WAIRARAPA DISTRICT COUNCIL’S LONG TERM PLAN 2015/2025
PART 4: STRATEGIES AND POLICIES 131
Purpose
Infrastructure accounts for half of the Council’s operating expenditure and 70% of the Council’s capital expenditure.
The role of infrastructure is to support, promote and achieve the Council’s Community Outcomes therefore providing
the foundations on which the South Wairarapa District Council community is built. It is essential to health, safety,
and community sustainability and has a significant impact on the physical environment. Infrastructure enables
businesses and communities to flourish. Getting infrastructure spending right is a prerequisite to economic
performance and determining how much the council can spend on other services that enhance the quality of life and
attract people to live in SWDC.
The purpose of the infrastructure strategy, as prescribed by the Local Government Act, is to identify the significant
infrastructure issues for SWDC over the next 30 years, and to identify the principal options for managing those issues
and the implications of those options.
The strategy provides guidance for:
Retain current Levels of Service across all assets.
Meet statutory requirements.
Keep cost increases to a minimum.
The main goals of the strategy are to:
Balance adequate infrastructural capacity to meet current and future demand whilst being affordable to the
community.
Increase the reliability and resilience of the existing and future infrastructure.
Ensure sustainable use of resources and protect the environment.
Ensure assets are utilised for their full lifecycle and maintained in perpetuity.
Ensure agreed levels of service are met.
Ensure infrastructure enables our district to develop and be prosperous.
Ensure our services enable a healthy community and environment.
Monitor and manage the infrastructure risks.
Predict, monitor and mitigate unauthorised discharges to the environment.
Utilise public education to assist with demand management and effective systems.
The strategy outlines the most likely infrastructure assets management scenario for South Wairarapa District Council
over the next 30 years:
Significant infrastructure issues and the actions required to address the gaps in both the short and long term.
Options and associated expenditures.
Service delivery implications and targets.
The associated risks.
The Council’s current preferred scenario.
INFRASTRUCTURE STRATEGY 2015-2045
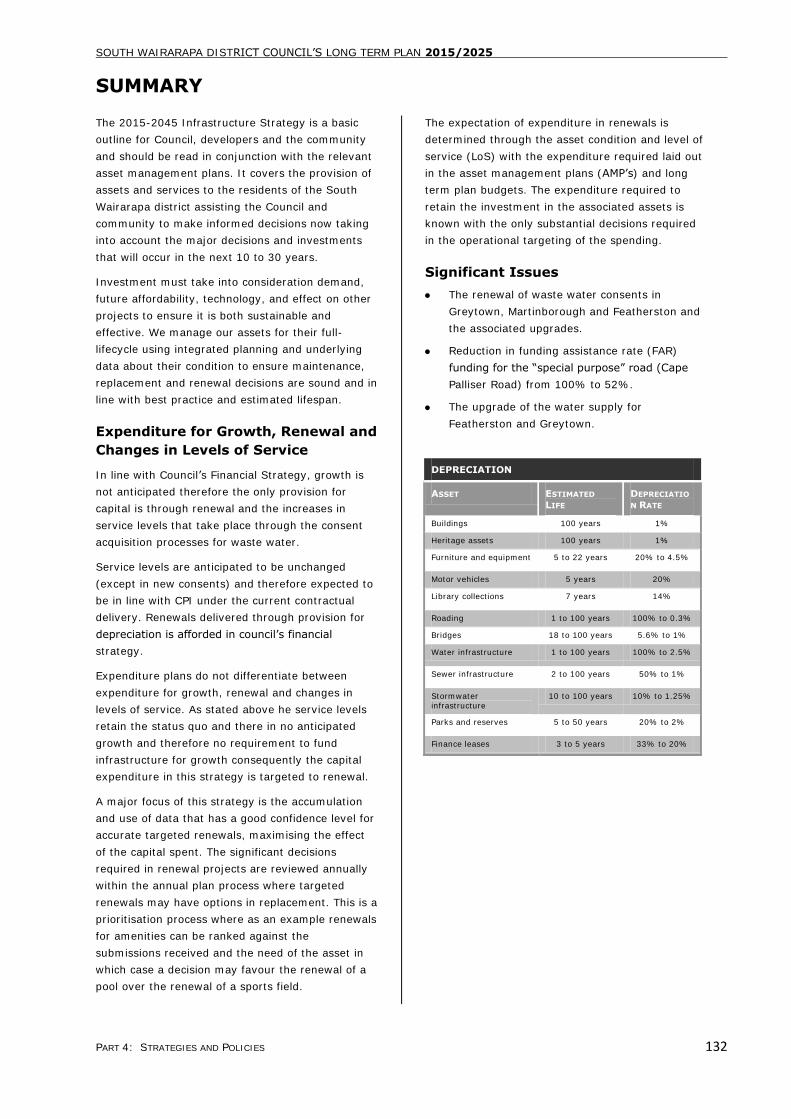
SOUTH WAIRARAPA DISTRICT COUNCIL’S LONG TERM PLAN 2015/2025
PART 4: STRATEGIES AND POLICIES 132
SUMMARY
The 2015-2045 Infrastructure Strategy is a basic
outline for Council, developers and the community
and should be read in conjunction with the relevant
asset management plans. It covers the provision of
assets and services to the residents of the South
Wairarapa district assisting the Council and
community to make informed decisions now taking
into account the major decisions and investments
that will occur in the next 10 to 30 years.
Investment must take into consideration demand,
future affordability, technology, and effect on other
projects to ensure it is both sustainable and
effective. We manage our assets for their full-
lifecycle using integrated planning and underlying
data about their condition to ensure maintenance,
replacement and renewal decisions are sound and in
line with best practice and estimated lifespan.
Expenditure for Growth, Renewal and
Changes in Levels of Service
In line with Council’s Financial Strategy, growth is
not anticipated therefore the only provision for
capital is through renewal and the increases in
service levels that take place through the consent
acquisition processes for waste water.
Service levels are anticipated to be unchanged
(except in new consents) and therefore expected to
be in line with CPI under the current contractual
delivery. Renewals delivered through provision for
depreciation is afforded in council’s financial
strategy.
Expenditure plans do not differentiate between
expenditure for growth, renewal and changes in
levels of service. As stated above he service levels
retain the status quo and there in no anticipated
growth and therefore no requirement to fund
infrastructure for growth consequently the capital
expenditure in this strategy is targeted to renewal.
A major focus of this strategy is the accumulation
and use of data that has a good confidence level for
accurate targeted renewals, maximising the effect
of the capital spent. The significant decisions
required in renewal projects are reviewed annually
within the annual plan process where targeted
renewals may have options in replacement. This is a
prioritisation process where as an example renewals
for amenities can be ranked against the
submissions received and the need of the asset in
which case a decision may favour the renewal of a
pool over the renewal of a sports field.
The expectation of expenditure in renewals is
determined through the asset condition and level of
service (LoS) with the expenditure required laid out
in the asset management plans (AMP’s) and long
term plan budgets. The expenditure required to
retain the investment in the associated assets is
known with the only substantial decisions required
in the operational targeting of the spending.
Significant Issues
The renewal of waste water consents in
Greytown, Martinborough and Featherston and
the associated upgrades.
Reduction in funding assistance rate (FAR)
funding for the “special purpose” road (Cape
Palliser Road) from 100% to 52%.
The upgrade of the water supply for
Featherston and Greytown.
DEPRECIATION
ASSET ESTIMATED
LIFE
DEPRECIATIO
N RATE
Buildings 100 years 1%
Heritage assets 100 years 1%
Furniture and equipment 5 to 22 years 20% to 4.5%
Motor vehicles 5 years 20%
Library collections 7 years 14%
Roading 1 to 100 years 100% to 0.3%
Bridges 18 to 100 years 5.6% to 1%
Water infrastructure 1 to 100 years 100% to 2.5%
Sewer infrastructure 2 to 100 years 50% to 1%
Stormwater infrastructure
10 to 100 years 10% to 1.25%
Parks and reserves 5 to 50 years 20% to 2%
Finance leases 3 to 5 years 33% to 20%
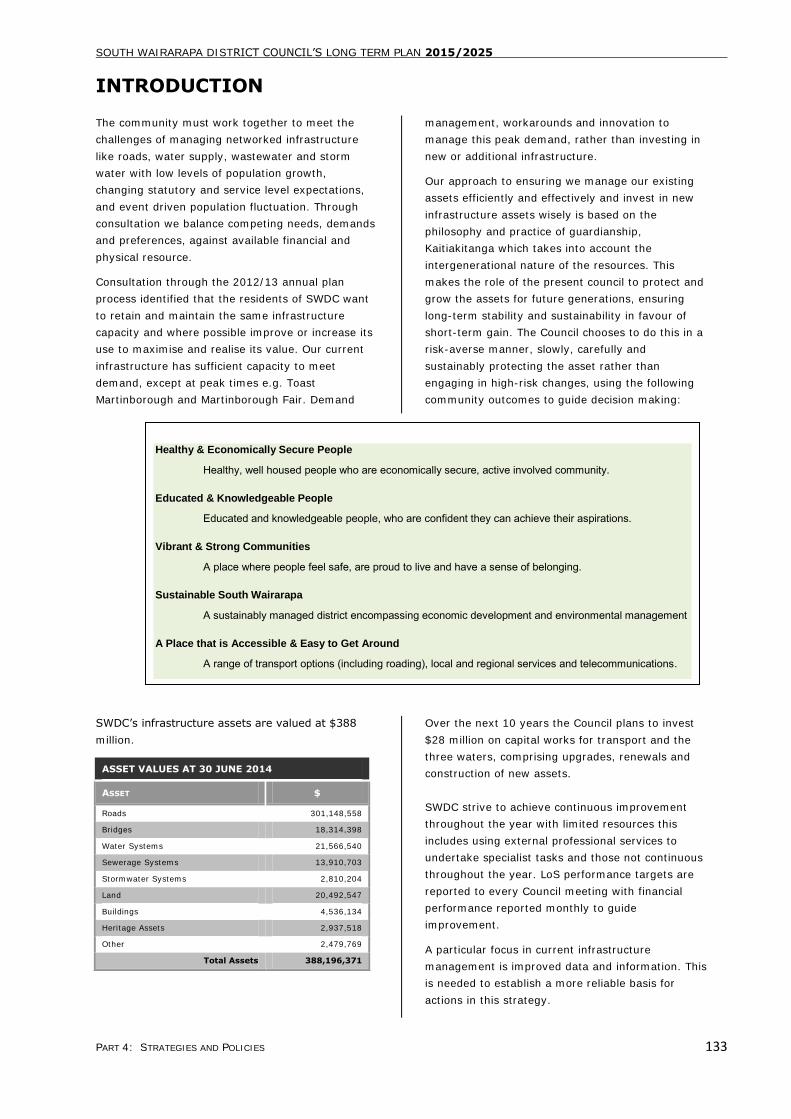
SOUTH WAIRARAPA DISTRICT COUNCIL’S LONG TERM PLAN 2015/2025
PART 4: STRATEGIES AND POLICIES 133
INTRODUCTION
The community must work together to meet the
challenges of managing networked infrastructure
like roads, water supply, wastewater and storm
water with low levels of population growth,
changing statutory and service level expectations,
and event driven population fluctuation. Through
consultation we balance competing needs, demands
and preferences, against available financial and
physical resource.
Consultation through the 2012/13 annual plan
process identified that the residents of SWDC want
to retain and maintain the same infrastructure
capacity and where possible improve or increase its
use to maximise and realise its value. Our current
infrastructure has sufficient capacity to meet
demand, except at peak times e.g. Toast
Martinborough and Martinborough Fair. Demand
management, workarounds and innovation to
manage this peak demand, rather than investing in
new or additional infrastructure.
Our approach to ensuring we manage our existing
assets efficiently and effectively and invest in new
infrastructure assets wisely is based on the
philosophy and practice of guardianship,
Kaitiakitanga which takes into account the
intergenerational nature of the resources. This
makes the role of the present council to protect and
grow the assets for future generations, ensuring
long-term stability and sustainability in favour of
short-term gain. The Council chooses to do this in a
risk-averse manner, slowly, carefully and
sustainably protecting the asset rather than
engaging in high-risk changes, using the following
community outcomes to guide decision making:
SWDC’s infrastructure assets are valued at $388
million.
ASSET VALUES AT 30 JUNE 2014
ASSET $
Roads 301,148,558
Bridges 18,314,398
Water Systems 21,566,540
Sewerage Systems 13,910,703
Stormwater Systems 2,810,204
Land 20,492,547
Buildings 4,536,134
Heritage Assets 2,937,518
Other 2,479,769
Total Assets 388,196,371
Over the next 10 years the Council plans to invest
$28 million on capital works for transport and the
three waters, comprising upgrades, renewals and
construction of new assets.
SWDC strive to achieve continuous improvement
throughout the year with limited resources this
includes using external professional services to
undertake specialist tasks and those not continuous
throughout the year. LoS performance targets are
reported to every Council meeting with financial
performance reported monthly to guide
improvement.
A particular focus in current infrastructure
management is improved data and information. This
is needed to establish a more reliable basis for
actions in this strategy.
Healthy & Economically Secure People
Healthy, well housed people who are economically secure, active involved community.
Educated & Knowledgeable People
Educated and knowledgeable people, who are confident they can achieve their aspirations.
Vibrant & Strong Communities
A place where people feel safe, are proud to live and have a sense of belonging.
Sustainable South Wairarapa
A sustainably managed district encompassing economic development and environmental management
A Place that is Accessible & Easy to Get Around
A range of transport options (including roading), local and regional services and telecommunications.
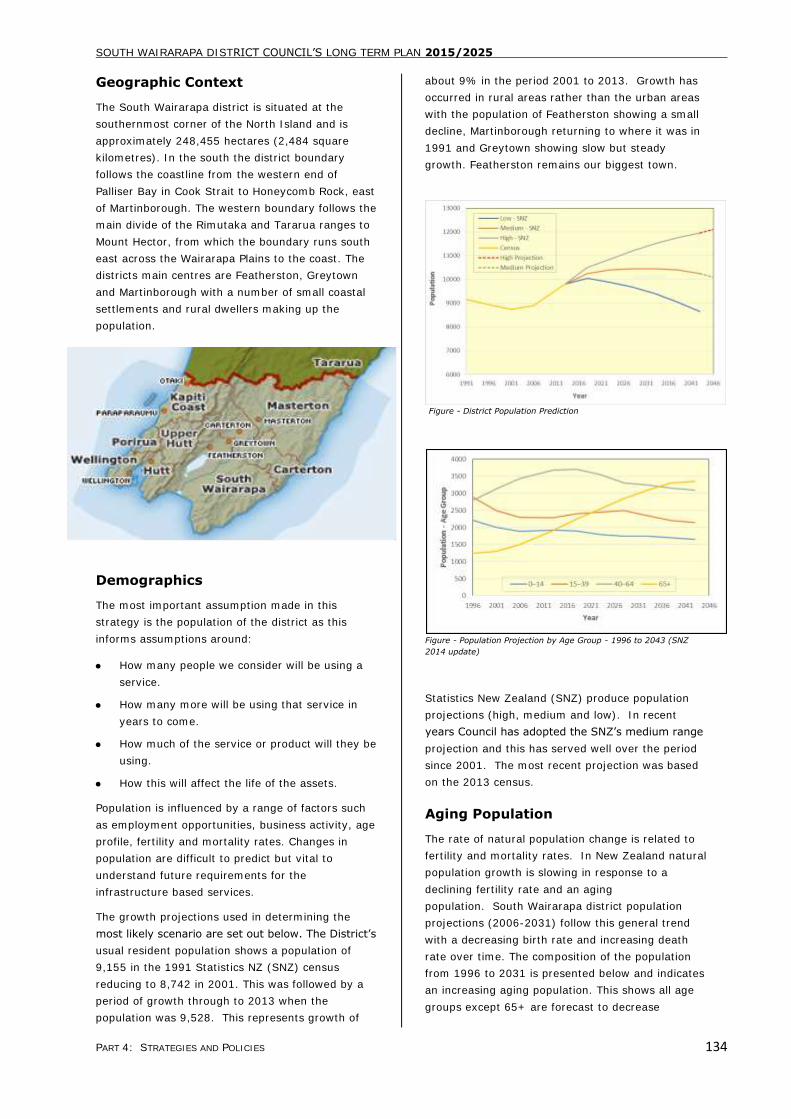
SOUTH WAIRARAPA DISTRICT COUNCIL’S LONG TERM PLAN 2015/2025
PART 4: STRATEGIES AND POLICIES 134
Geographic Context
The South Wairarapa district is situated at the
southernmost corner of the North Island and is
approximately 248,455 hectares (2,484 square
kilometres). In the south the district boundary
follows the coastline from the western end of
Palliser Bay in Cook Strait to Honeycomb Rock, east
of Martinborough. The western boundary follows the
main divide of the Rimutaka and Tararua ranges to
Mount Hector, from which the boundary runs south
east across the Wairarapa Plains to the coast. The
districts main centres are Featherston, Greytown
and Martinborough with a number of small coastal
settlements and rural dwellers making up the
population.
Demographics
The most important assumption made in this
strategy is the population of the district as this
informs assumptions around:
How many people we consider will be using a
service.
How many more will be using that service in
years to come.
How much of the service or product will they be
using.
How this will affect the life of the assets.
Population is influenced by a range of factors such
as employment opportunities, business activity, age
profile, fertility and mortality rates. Changes in
population are difficult to predict but vital to
understand future requirements for the
infrastructure based services.
The growth projections used in determining the
most likely scenario are set out below. The District’s
usual resident population shows a population of
9,155 in the 1991 Statistics NZ (SNZ) census
reducing to 8,742 in 2001. This was followed by a
period of growth through to 2013 when the
population was 9,528. This represents growth of
about 9% in the period 2001 to 2013. Growth has
occurred in rural areas rather than the urban areas
with the population of Featherston showing a small
decline, Martinborough returning to where it was in
1991 and Greytown showing slow but steady
growth. Featherston remains our biggest town.
Figure - District Population Prediction
Figure - Population Projection by Age Group - 1996 to 2043 (SNZ
2014 update)
Statistics New Zealand (SNZ) produce population
projections (high, medium and low). In recent
years Council has adopted the SNZ’s medium range
projection and this has served well over the period
since 2001. The most recent projection was based
on the 2013 census.
Aging Population
The rate of natural population change is related to
fertility and mortality rates. In New Zealand natural
population growth is slowing in response to a
declining fertility rate and an aging
population. South Wairarapa district population
projections (2006-2031) follow this general trend
with a decreasing birth rate and increasing death
rate over time. The composition of the population
from 1996 to 2031 is presented below and indicates
an increasing aging population. This shows all age
groups except 65+ are forecast to decrease
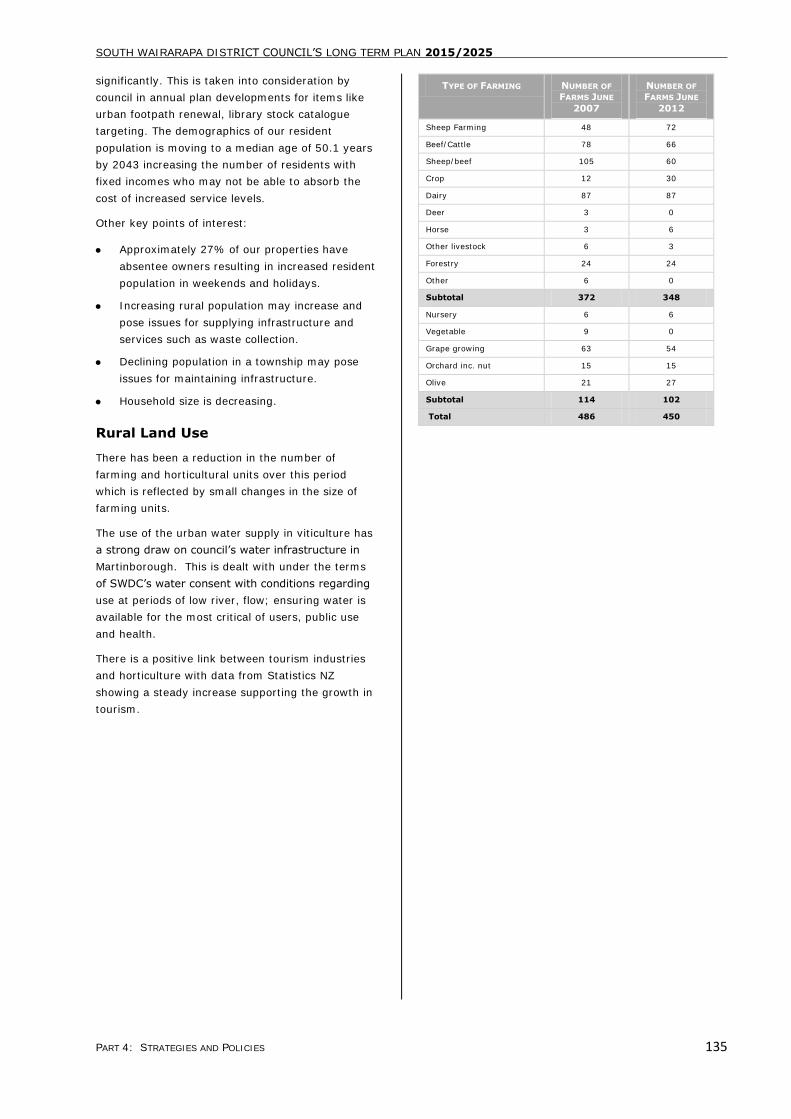
SOUTH WAIRARAPA DISTRICT COUNCIL’S LONG TERM PLAN 2015/2025
PART 4: STRATEGIES AND POLICIES 135
significantly. This is taken into consideration by
council in annual plan developments for items like
urban footpath renewal, library stock catalogue
targeting. The demographics of our resident
population is moving to a median age of 50.1 years
by 2043 increasing the number of residents with
fixed incomes who may not be able to absorb the
cost of increased service levels.
Other key points of interest:
Approximately 27% of our properties have
absentee owners resulting in increased resident
population in weekends and holidays.
Increasing rural population may increase and
pose issues for supplying infrastructure and
services such as waste collection.
Declining population in a township may pose
issues for maintaining infrastructure.
Household size is decreasing.
Rural Land Use
There has been a reduction in the number of
farming and horticultural units over this period
which is reflected by small changes in the size of
farming units.
The use of the urban water supply in viticulture has
a strong draw on council’s water infrastructure in
Martinborough. This is dealt with under the terms
of SWDC’s water consent with conditions regarding
use at periods of low river, flow; ensuring water is
available for the most critical of users, public use
and health.
There is a positive link between tourism industries
and horticulture with data from Statistics NZ
showing a steady increase supporting the growth in
tourism.
TYPE OF FARMING NUMBER OF
FARMS JUNE
2007
NUMBER OF
FARMS JUNE
2012
Sheep Farming 48 72
Beef/Cattle 78 66
Sheep/beef 105 60
Crop 12 30
Dairy 87 87
Deer 3 0
Horse 3 6
Other livestock 6 3
Forestry 24 24
Other 6 0
Subtotal 372 348
Nursery 6 6
Vegetable 9 0
Grape growing 63 54
Orchard inc. nut 15 15
Olive 21 27
Subtotal 114 102
Total 486 450
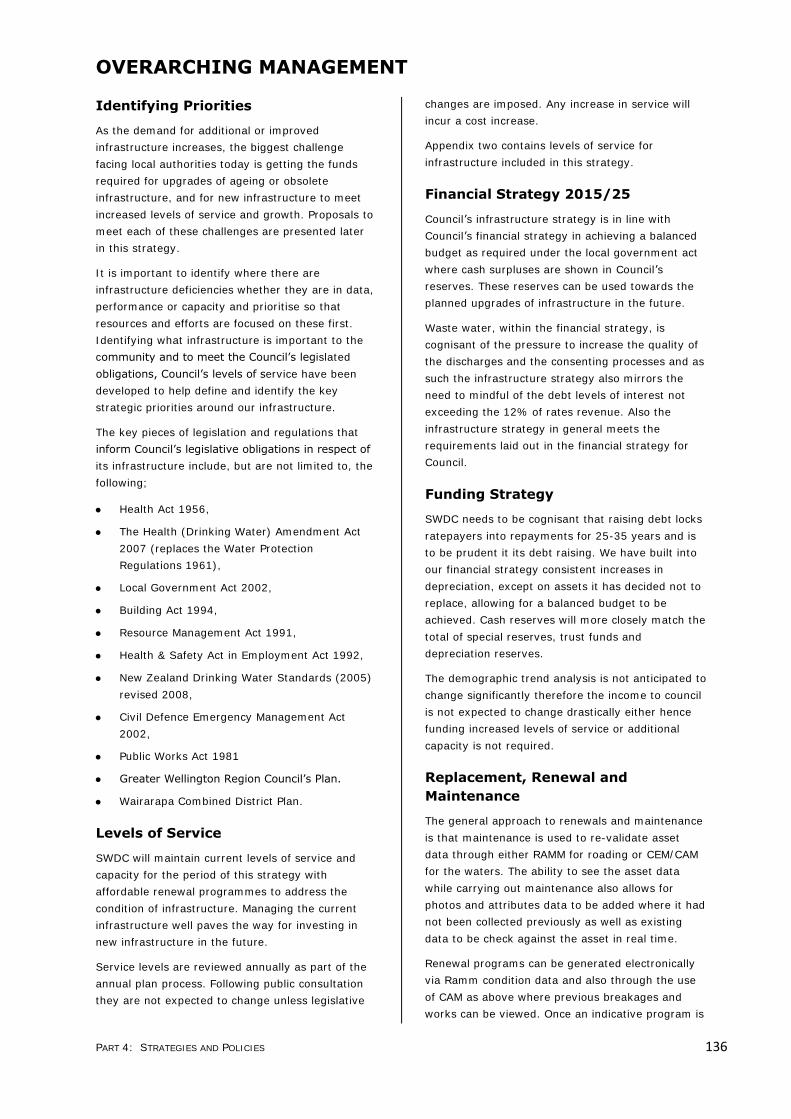
PART 4: STRATEGIES AND POLICIES 136
OVERARCHING MANAGEMENT
Identifying Priorities
As the demand for additional or improved
infrastructure increases, the biggest challenge
facing local authorities today is getting the funds
required for upgrades of ageing or obsolete
infrastructure, and for new infrastructure to meet
increased levels of service and growth. Proposals to
meet each of these challenges are presented later
in this strategy.
It is important to identify where there are
infrastructure deficiencies whether they are in data,
performance or capacity and prioritise so that
resources and efforts are focused on these first.
Identifying what infrastructure is important to the
community and to meet the Council’s legislated
obligations, Council’s levels of service have been
developed to help define and identify the key
strategic priorities around our infrastructure.
The key pieces of legislation and regulations that
inform Council’s legislative obligations in respect of
its infrastructure include, but are not limited to, the
following;
Health Act 1956,
The Health (Drinking Water) Amendment Act
2007 (replaces the Water Protection
Regulations 1961),
Local Government Act 2002,
Building Act 1994,
Resource Management Act 1991,
Health & Safety Act in Employment Act 1992,
New Zealand Drinking Water Standards (2005)
revised 2008,
Civil Defence Emergency Management Act
2002,
Public Works Act 1981
Greater Wellington Region Council’s Plan.
Wairarapa Combined District Plan.
Levels of Service
SWDC will maintain current levels of service and
capacity for the period of this strategy with
affordable renewal programmes to address the
condition of infrastructure. Managing the current
infrastructure well paves the way for investing in
new infrastructure in the future.
Service levels are reviewed annually as part of the
annual plan process. Following public consultation
they are not expected to change unless legislative
changes are imposed. Any increase in service will
incur a cost increase.
Appendix two contains levels of service for
infrastructure included in this strategy.
Financial Strategy 2015/25
Council’s infrastructure strategy is in line with
Council’s financial strategy in achieving a balanced
budget as required under the local government act
where cash surpluses are shown in Council’s
reserves. These reserves can be used towards the
planned upgrades of infrastructure in the future.
Waste water, within the financial strategy, is
cognisant of the pressure to increase the quality of
the discharges and the consenting processes and as
such the infrastructure strategy also mirrors the
need to mindful of the debt levels of interest not
exceeding the 12% of rates revenue. Also the
infrastructure strategy in general meets the
requirements laid out in the financial strategy for
Council.
Funding Strategy
SWDC needs to be cognisant that raising debt locks
ratepayers into repayments for 25-35 years and is
to be prudent it its debt raising. We have built into
our financial strategy consistent increases in
depreciation, except on assets it has decided not to
replace, allowing for a balanced budget to be
achieved. Cash reserves will more closely match the
total of special reserves, trust funds and
depreciation reserves.
The demographic trend analysis is not anticipated to
change significantly therefore the income to council
is not expected to change drastically either hence
funding increased levels of service or additional
capacity is not required.
Replacement, Renewal and
Maintenance
The general approach to renewals and maintenance
is that maintenance is used to re-validate asset
data through either RAMM for roading or CEM/CAM
for the waters. The ability to see the asset data
while carrying out maintenance also allows for
photos and attributes data to be added where it had
not been collected previously as well as existing
data to be check against the asset in real time.
Renewal programs can be generated electronically
via Ramm condition data and also through the use
of CAM as above where previous breakages and
works can be viewed. Once an indicative program is
SOUTH WAIRARAPA DISTRICT COUNCIL’S LONG TERM PLAN 2015/2025
PART 4: STRATEGIES AND POLICIES 137
produced for renewals the sites can be then
validated via site inspections.
Council can:
Invest in new systems for data capture and
use.
Bring in external resources to capture all data
in a single snapshot.
Review and clean historical data for input into
the CEM/CAM system.
Due to the relatively small size of SWDC’s assets
review on site is easy to achieve to ensure renewal
programs are accurate and correct, allowing assets
to be replaced following inspection not on a cyclical
basis.
New Investment
New infrastructure assets may be commissioned
due to:
Rising environmental expectation.
Climate change.
Earthquake resilience.
Raise Level of Service.
At or in avoidance of failure.
Commissioning of new assets is to be kept on an as
needs basis or when serendipity provides
opportunities for funding. Community consultation
in line with the Council’s Significance and
engagement policy will take place in these
situations. This is seen in the water upgrades that
match the rising water heath standards and Ministry
of Health funding available.
Sustainability
It is also critically important that infrastructure
decisions and the actions taken to achieve them are
sustainable to strengthen quality of life. For
infrastructure decisions and actions to be
sustainable they should:
Promote the efficient and effective use of
resources.
Deliver equity for the present and future
generations.
Avoid, mitigate and remedy any adverse effect
on the environment.
Promote the creation of liveable communities
with a sense of place and identity.
The questions taken into consideration to help
ensure sustainable outcomes are:
Will the type of infrastructure built or being
maintained, continue to serve the community
into the future?
Can the infrastructure be maintained or
renewed given the limited resources available
to the community?
Does the infrastructure create effects or
impacts that erode the quality of our natural
environment?
Does the method of maintaining or constructing
this infrastructure have local or global impacts
environmentally, socially or economically?
In the actions outlined later in this plan, Council will
strive to act sustainably in all decisions, actions and
practices throughout the life cycle of assets.
Risks to infrastructure and continued resilience are
provided for in design, funding and management.
Roads infrastructure is developed through the use
of resilience projects and funding based on NPV and
whole of life calculations through the NZTA funding
process. Examples of this in funding and design can
be seen in the preventive maintenance work carried
out on the Cape Palliser road decreasing the
incidence of closure (greater resilience). Resilience
is also managed through processes to minimise
fragility, vulnerability and weakness and well as
minimise impacts. Increased inspections and faster
interventions through better knowledge and data is
also a strategic way SWDC increases resilience on
roads.
Water infrastructure resilience is dealt with several
ways with the primary worst case scenario through
the CDEM planning where households are
encourages to have at least 3 days’ supply
available. Council also support the dissemination of
CDEM rain water harvesting tanks for residents and
has the availability of a fresh water tank for
communities as a last resort. Resilience is also
supported through demand management plans and
the renewal planning based around condition of the
networks.
Risks
Risk is defined as the effect of uncertainty on
objectives e.g. deviation from the plan. Risk
management is the coordinated activities to direct
and control an organisation with regard to risk.
Council has a responsibility to assess risks in order
to best manage assets with the resources available
to avoid and mitigate the effects of any negative
outcome.

SOUTH WAIRARAPA DISTRICT COUNCIL’S LONG TERM PLAN 2015/2025
PART 4: STRATEGIES AND POLICIES 138
Risks that sit across all assets are:
Continued servicing of all facilities in a possible
declining or aging population.
The adoption of higher level of service and the
associated cost implications.
Insurance (what are the risks).
A disaster recovery plan for assets has not yet
been prepared though the Wairarapa
Emergency Lifeline Association (WELA) report
sets a good foundation for the development of
the plan.
For natural and man-made disaster events the
initial response to events and the priority order
of inspection of assets also needs to be
documented.
A company risk management plan is being
established.
Public Health
Public health is very important to South Wairarapa
District Council with compliance to potable water,
disposal of waste and storm water. We will continue
to meet current requirements and adopt improved
and new health and environmental standards as
they arise.
The focus of public health intervention is to improve
health and quality of life through prevention and
treatment of disease and other health conditions.
This is done through surveillance of cases
and health indicators, and through promotion of
healthy behaviours. The interventions can range
from advocacy against psychoactive substances to
meeting quality water standards and cover a broad
range of issues and facilitation, negotiation as well
as physical works and services.
The South Wairarapa District Council promotes the
“active rural lifestyle” as a general principal in all its
undertakings and acknowledges that the dimensions
of health can encompass "a state of complete
physical, mental and social well-being and not
merely the absence of disease or infirmity.
New technologies such and modern transportation
can also cause reduced physical activity and the
introduction of a planned cycle strategy and
increased active recreational activities. SWDC
believes that behaviour is more effectively changed
by taking development and motivations into
consideration instead of only presenting information
about health effects and lifestyle.
Some programs and policies associated with public
health promotion and prevention can be
controversial and council works diligently to avoid
this. The linked up nature of the social programs
assisting public health for example free swimming
passes given out through reading programs by
surreptitiousness and discretion targets areas of the
community where assistance can be given
as health problems can be due to maladaptive
personal behaviours.
Through the community safety and resilience
working party health resilience is a key focus
beyond the empirical measurement of heath
indicators.
Maori Contribution
The Local Government Act 2002 requires territorial
authorities to maintain and improve the ability of
Maori contribute to local government decision-
making. Council is required to have regard to the
relationship between Maori and their ancestral
lands, water, sites, wahi tapu and other taonga of
national importance. These relationships must be
recognised and provided for by decision makers.
For many reasons, the Treaty of Waitangi
considerations and the Resource Management Act
(RMA) 1991 have a direct impact for long term
infrastructure management. This includes
consultation required as part of the resource
consent process as well as consulting with Maori on
the provision of infrastructure, relating to the likes
of discharge of waste to land, or extraction of
water.
The Council has a strong link with iwi through the
Maori Standing Committee.
Climate Change
In the long term it is predicted that climate change
will have two principle impacts upon the South
Wairarapa district of an increased risk from severe
natural hazards, and a gradual change in
environmental conditions such as rainfall and tide
levels.
Within the lower North Island it is expected that
over the next 40 years the average temperatures
will rise by between 0.2oC and 2.2oC, evaporation
will increase, enhanced westerly winds will occur.
Heavy rain/storms will become more frequent
requiring council to consider the level of flood
protection and the capacity of the three town’s
storm water drainage system.
More frequent droughts may affect the security of
water supply to all three towns. Currently the
council relies on adequate water flows from bores
and direct from Waiohine River and only has

SOUTH WAIRARAPA DISTRICT COUNCIL’S LONG TERM PLAN 2015/2025
PART 4: STRATEGIES AND POLICIES 139
reservoirs to buffer daily demand; there are no
stored water facilities for a prolonged drought.
The Ministry for the Environment predicts mean sea
level rise of at least 0.8m relative to the 1980–1999
average for periods up until 2090. Sea level rise
may generate additional issues along coastal roads
from rising tides and coastal erosion from storm
surge. The assessed impact on infrastructure from
coastal change is negligible in the 30 year horizon
and there is no immediate response to these risk
presented in this Strategy. However Council will
keep abreast reports on these issues.
We will look to align our approach to that currently
being developed by Greater Wellington Regional
Council.
Natural Disasters
South Wairarapa District Council recognise natural
disasters will occur but has not set aside funds.
Should a natural disaster occur in this time frame it
is envisaged damage will be fixed through the
maintenance budget, insurance, reserves and loans.
The council currently has no redundancy in the form
of back-up systems.
Flooding is the most frequently experienced natural
hazard in the district, and the likelihood of a major
flood occurring in any year is high. The other
natural hazards occur less frequently, but have the
potential to cause significant adverse effects and
pose a risk to people and property.
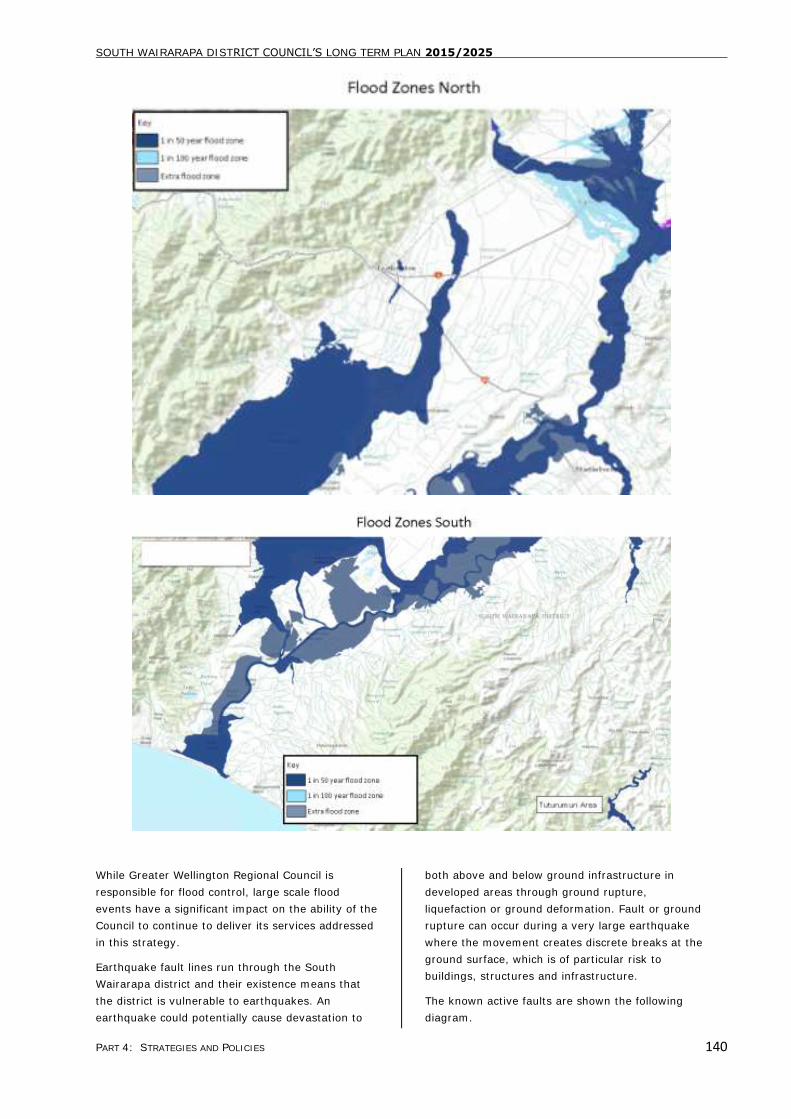
SOUTH WAIRARAPA DISTRICT COUNCIL’S LONG TERM PLAN 2015/2025
PART 4: STRATEGIES AND POLICIES 140
While Greater Wellington Regional Council is
responsible for flood control, large scale flood
events have a significant impact on the ability of the
Council to continue to deliver its services addressed
in this strategy.
Earthquake fault lines run through the South
Wairarapa district and their existence means that
the district is vulnerable to earthquakes. An
earthquake could potentially cause devastation to
both above and below ground infrastructure in
developed areas through ground rupture,
liquefaction or ground deformation. Fault or ground
rupture can occur during a very large earthquake
where the movement creates discrete breaks at the
ground surface, which is of particular risk to
buildings, structures and infrastructure.
The known active faults are shown the following
diagram.
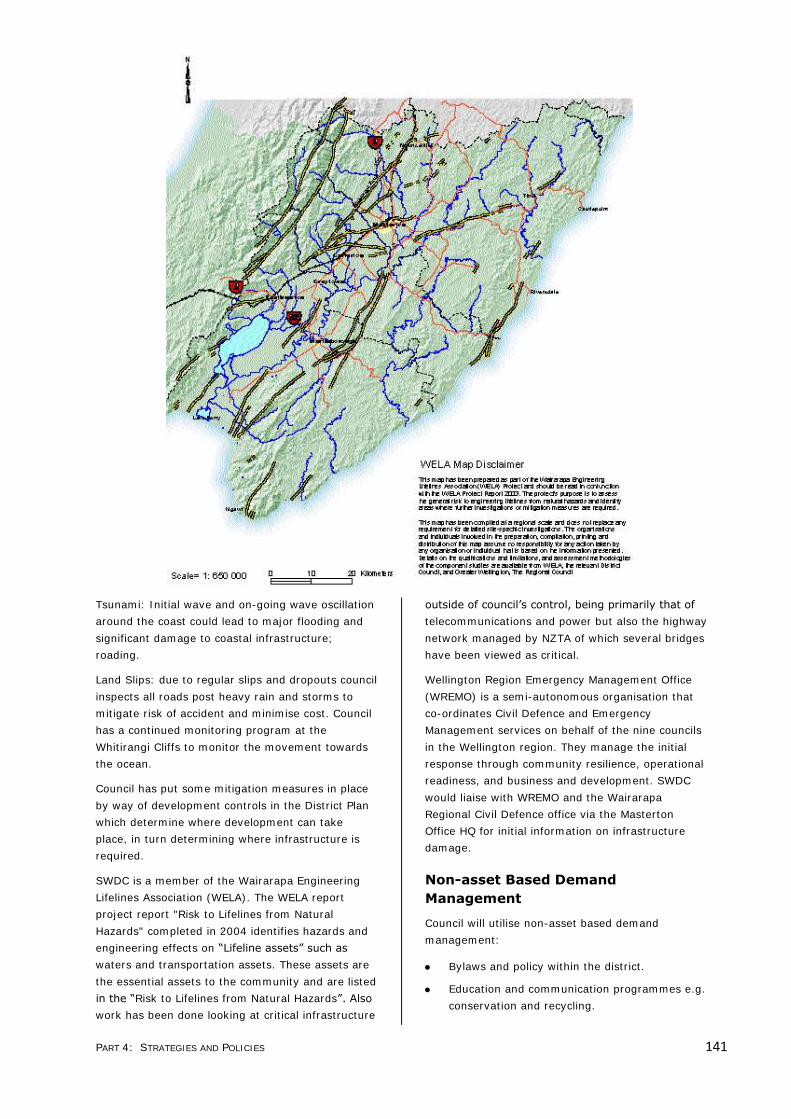
PART 4: STRATEGIES AND POLICIES 141
Tsunami: Initial wave and on-going wave oscillation
around the coast could lead to major flooding and
significant damage to coastal infrastructure;
roading.
Land Slips: due to regular slips and dropouts council
inspects all roads post heavy rain and storms to
mitigate risk of accident and minimise cost. Council
has a continued monitoring program at the
Whitirangi Cliffs to monitor the movement towards
the ocean.
Council has put some mitigation measures in place
by way of development controls in the District Plan
which determine where development can take
place, in turn determining where infrastructure is
required.
SWDC is a member of the Wairarapa Engineering
Lifelines Association (WELA). The WELA report
project report "Risk to Lifelines from Natural
Hazards" completed in 2004 identifies hazards and
engineering effects on “Lifeline assets” such as
waters and transportation assets. These assets are
the essential assets to the community and are listed
in the “Risk to Lifelines from Natural Hazards”. Also
work has been done looking at critical infrastructure
outside of council’s control, being primarily that of
telecommunications and power but also the highway
network managed by NZTA of which several bridges
have been viewed as critical.
Wellington Region Emergency Management Office
(WREMO) is a semi-autonomous organisation that
co-ordinates Civil Defence and Emergency
Management services on behalf of the nine councils
in the Wellington region. They manage the initial
response through community resilience, operational
readiness, and business and development. SWDC
would liaise with WREMO and the Wairarapa
Regional Civil Defence office via the Masterton
Office HQ for initial information on infrastructure
damage.
Non-asset Based Demand
Management
Council will utilise non-asset based demand
management:
Bylaws and policy within the district.
Education and communication programmes e.g.
conservation and recycling.
SOUTH WAIRARAPA DISTRICT COUNCIL’S LONG TERM PLAN 2015/2025
PART 4: STRATEGIES AND POLICIES 142
The District Plan preventing or restricting
development with substandard infrastructure
The use of development impact fees.
Asset Condition & Monitoring
The Council uses ArcView GIS system. The three
Wairarapa councils have shared service agreement
for a range of spatial information on a shared
platform, powered by ESRI GIS application
providing a new public, viewable, web-based
mapping application. The new website shows
information about the region’s properties, district
planning zones, streets/roads and geographic
features, transport networks, civil defence centres,
water and sewer pipes, water races fault lines,
tsunami and flood risks. It includes recent aerial
photography.
Condition surveys are not completed for all assets.
The plan is to complete the review over the next 4
years at 20% per year in line with 20% completed
this year. Contractors are obligated to collect and
report back asset condition data as they work on
the network. Critical parts of the network (service
large numbers, essential services and businesses)
will be prioritised.
Currently indicative condition is assessed from
maintenance records and frequency of complaints.
Individual asset condition surveys are carried out
through renewal programs and assessed impending
failure. Following this process works are prioritized
and funds allocated over time or grants sought.
Council reviews complaints received on a regular
basis. The use of real-time asset maintenance
allows for just-in-time renewals based on real faults
recorded and scrutinized against criticality.
Asset Valuation
The Council engages Opus International
Consultants Ltd to undertake a valuation of the
roading network and two waters every three
years.
The most recent valuation report values the
assets as at 30 June 2012.
Valuation Methodology
Every recorded component is valued in terms of its
replacement and depreciated replacement value.
The valuation has been carried out in accordance
with the following standards:
The NZ equivalent to the International Financial
Reporting Standard 16, Accounting for
Property, Plant and Equipment (IAS 16).
New Zealand Infrastructure Valuation and
Depreciation Guidelines, issued by the National
Asset Management Steering Group (NAMS) of
IPWEA.
A number of assumptions are used in the valuation
process. These are derived from the best available
information at the time by a suitably experienced
and competent person. The Valuation Report holds
a detailed account of the key assumptions derived
for each asset group and the basis for and use of
these assumptions.
No assets have been identified as surplus.
Insurance
Local Authority Public Protection Scheme (LAPP)
insure 40% of the value of underground assets with
the government underwriting the remaining 60% is
underwritten by government. Above ground utilities
are insured through brokers Jardines.
Roads are not insured so SWDC would use the 52%
NZTA funding along with some of the maintenance
budget and borrowing to deal with issues that arise.
Inflation
The financial forecasts for the first 10 years of this
strategy are adjusted for projected inflation based
on the BERL local government cost index. The
financial forecasts for years 11 to 30 use the long
run average of BERL in years 11-30.
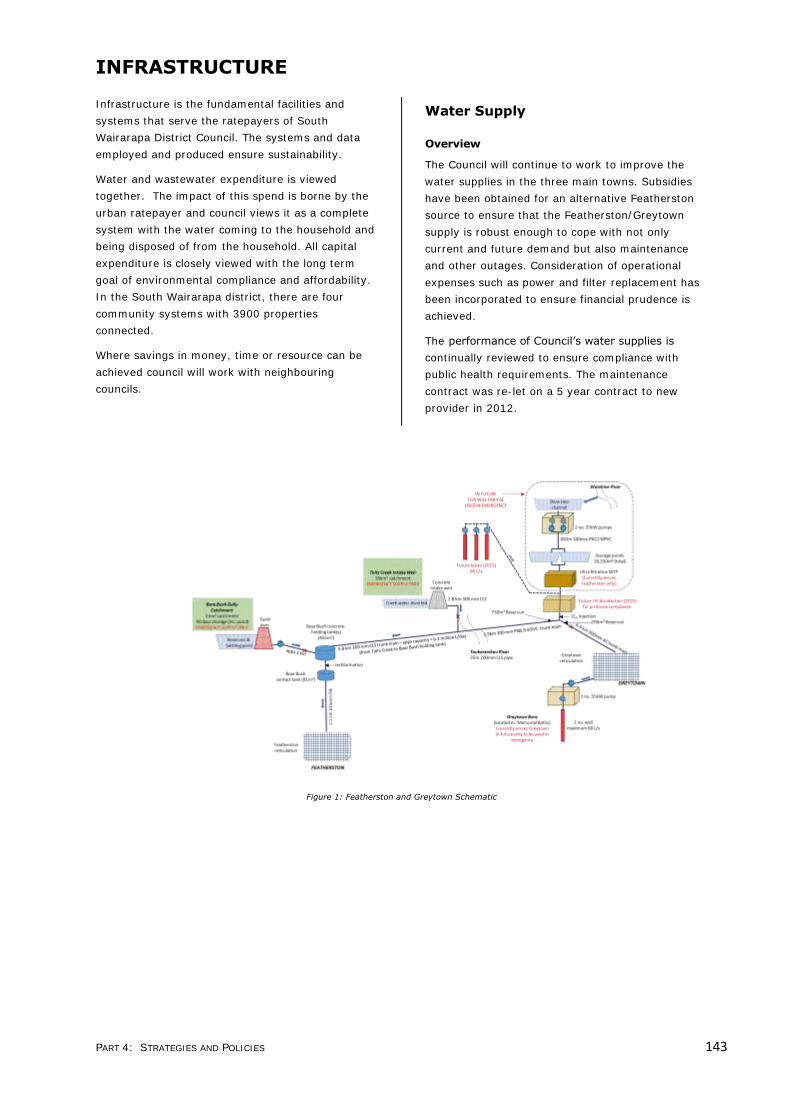
PART 4: STRATEGIES AND POLICIES 143
INFRASTRUCTURE
Infrastructure is the fundamental facilities and
systems that serve the ratepayers of South
Wairarapa District Council. The systems and data
employed and produced ensure sustainability.
Water and wastewater expenditure is viewed
together. The impact of this spend is borne by the
urban ratepayer and council views it as a complete
system with the water coming to the household and
being disposed of from the household. All capital
expenditure is closely viewed with the long term
goal of environmental compliance and affordability.
In the South Wairarapa district, there are four
community systems with 3900 properties
connected.
Where savings in money, time or resource can be
achieved council will work with neighbouring
councils.
Water Supply
Overview
The Council will continue to work to improve the
water supplies in the three main towns. Subsidies
have been obtained for an alternative Featherston
source to ensure that the Featherston/Greytown
supply is robust enough to cope with not only
current and future demand but also maintenance
and other outages. Consideration of operational
expenses such as power and filter replacement has
been incorporated to ensure financial prudence is
achieved.
The performance of Council’s water supplies is
continually reviewed to ensure compliance with
public health requirements. The maintenance
contract was re-let on a 5 year contract to new
provider in 2012.
Figure 1: Featherston and Greytown Schematic
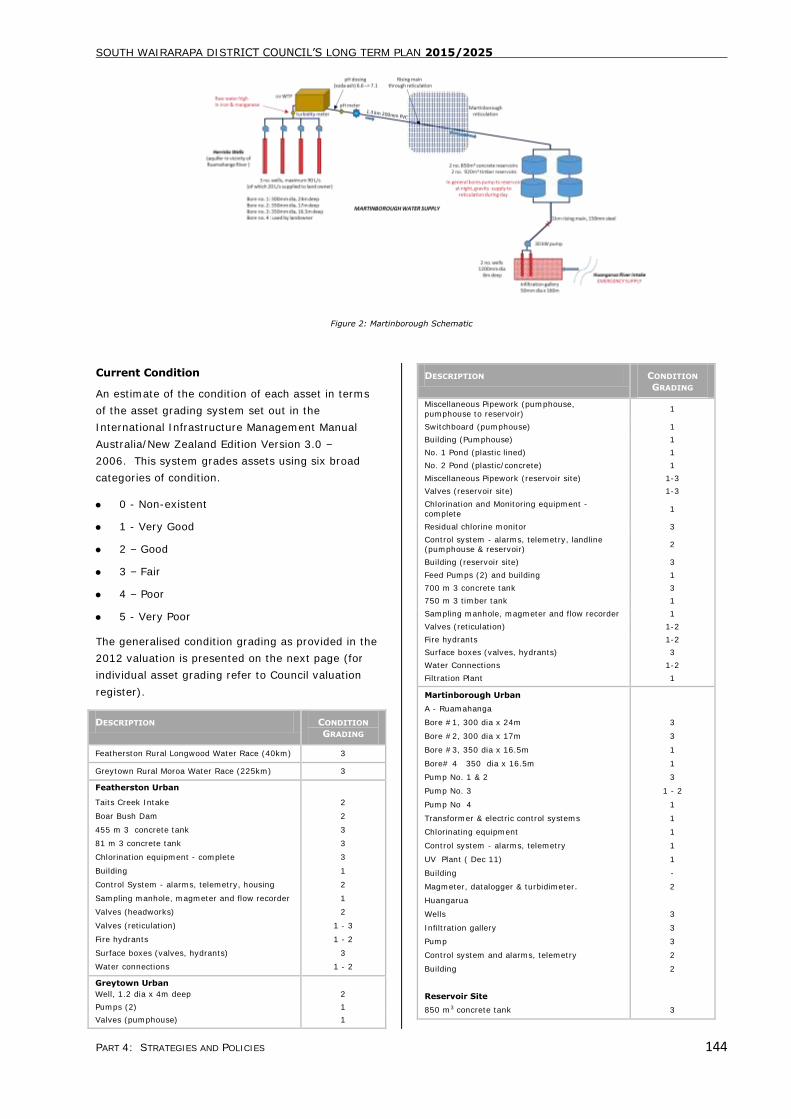
SOUTH WAIRARAPA DISTRICT COUNCIL’S LONG TERM PLAN 2015/2025
PART 4: STRATEGIES AND POLICIES 144
Figure 2: Martinborough Schematic
Current Condition
An estimate of the condition of each asset in terms
of the asset grading system set out in the
International Infrastructure Management Manual
Australia/New Zealand Edition Version 3.0 –
2006. This system grades assets using six broad
categories of condition.
0 - Non-existent
1 - Very Good
2 – Good
3 – Fair
4 – Poor
5 - Very Poor
The generalised condition grading as provided in the
2012 valuation is presented on the next page (for
individual asset grading refer to Council valuation
register).
DESCRIPTION CONDITION
GRADING
Featherston Rural Longwood Water Race (40km) 3
Greytown Rural Moroa Water Race (225km) 3
Featherston Urban
Taits Creek Intake
Boar Bush Dam
455 m 3 concrete tank
81 m 3 concrete tank
Chlorination equipment - complete
Building
Control System - alarms, telemetry, housing
Sampling manhole, magmeter and flow recorder
Valves (headworks)
Valves (reticulation)
Fire hydrants
Surface boxes (valves, hydrants)
Water connections
2
2
3
3
3
1
2
1
2
1 - 3
1 - 2
3
1 - 2
Greytown Urban
Well, 1.2 dia x 4m deep 2
Pumps (2) 1
Valves (pumphouse) 1
DESCRIPTION CONDITION
GRADING
Miscellaneous Pipework (pumphouse,
pumphouse to reservoir) 1
Switchboard (pumphouse) 1
Building (Pumphouse) 1
No. 1 Pond (plastic lined) 1
No. 2 Pond (plastic/concrete) 1
Miscellaneous Pipework (reservoir site) 1-3
Valves (reservoir site) 1-3
Chlorination and Monitoring equipment -
complete 1
Residual chlorine monitor 3
Control system - alarms, telemetry, landline (pumphouse & reservoir)
2
Building (reservoir site) 3
Feed Pumps (2) and building 1
700 m 3 concrete tank 3
750 m 3 timber tank 1
Sampling manhole, magmeter and flow recorder 1
Valves (reticulation) 1-2
Fire hydrants 1-2
Surface boxes (valves, hydrants) 3
Water Connections 1-2
Filtration Plant 1
Martinborough Urban
A - Ruamahanga
Bore #1, 300 dia x 24m
Bore #2, 300 dia x 17m
Bore #3, 350 dia x 16.5m
Bore# 4 350 dia x 16.5m
Pump No. 1 & 2
Pump No. 3
Pump No 4
Transformer & electric control systems
Chlorinating equipment
Control system - alarms, telemetry
UV Plant ( Dec 11)
Building
Magmeter, datalogger & turbidimeter.
Huangarua
Wells
Infiltration gallery
Pump
Control system and alarms, telemetry
Building
Reservoir Site
850 m3 concrete tank
3
3
1
1
3
1 - 2
1
1
1
1
1
-
2
3
3
3
2
2
3
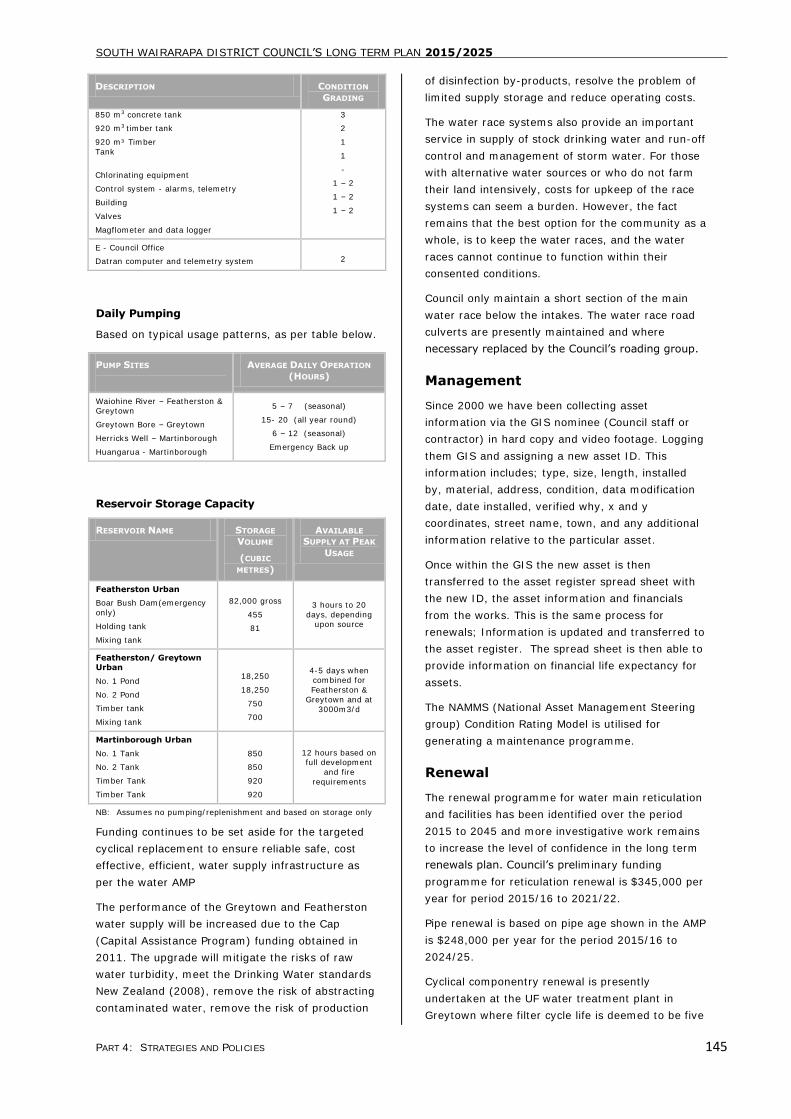
SOUTH WAIRARAPA DISTRICT COUNCIL’S LONG TERM PLAN 2015/2025
PART 4: STRATEGIES AND POLICIES 145
DESCRIPTION CONDITION
GRADING
850 m3 concrete tank
920 m3 timber tank
920 m³ Timber
Tank
Chlorinating equipment
Control system - alarms, telemetry
Building
Valves
Magflometer and data logger
3
2
1
1
-
1 – 2
1 – 2
1 – 2
E - Council Office
Datran computer and telemetry system 2
Daily Pumping
Based on typical usage patterns, as per table below.
PUMP SITES
AVERAGE DAILY OPERATION
(HOURS)
Waiohine River – Featherston & Greytown
Greytown Bore – Greytown
Herricks Well – Martinborough
Huangarua - Martinborough
5 – 7 (seasonal)
15- 20 (all year round)
6 – 12 (seasonal)
Emergency Back up
Reservoir Storage Capacity
RESERVOIR NAME STORAGE
VOLUME
(CUBIC
METRES)
AVAILABLE
SUPPLY AT PEAK
USAGE
Featherston Urban
Boar Bush Dam(emergency
only)
Holding tank
Mixing tank
82,000 gross
455
81
3 hours to 20
days, depending upon source
Featherston/ Greytown Urban
No. 1 Pond
No. 2 Pond
Timber tank
Mixing tank
18,250
18,250
750
700
4-5 days when combined for
Featherston &
Greytown and at
3000m3/d
Martinborough Urban
No. 1 Tank
No. 2 Tank
Timber Tank
Timber Tank
850
850
920
920
12 hours based on full development
and fire
requirements
NB: Assumes no pumping/replenishment and based on storage only
Funding continues to be set aside for the targeted
cyclical replacement to ensure reliable safe, cost
effective, efficient, water supply infrastructure as
per the water AMP
The performance of the Greytown and Featherston
water supply will be increased due to the Cap
(Capital Assistance Program) funding obtained in
2011. The upgrade will mitigate the risks of raw
water turbidity, meet the Drinking Water standards
New Zealand (2008), remove the risk of abstracting
contaminated water, remove the risk of production
of disinfection by-products, resolve the problem of
limited supply storage and reduce operating costs.
The water race systems also provide an important
service in supply of stock drinking water and run-off
control and management of storm water. For those
with alternative water sources or who do not farm
their land intensively, costs for upkeep of the race
systems can seem a burden. However, the fact
remains that the best option for the community as a
whole, is to keep the water races, and the water
races cannot continue to function within their
consented conditions.
Council only maintain a short section of the main
water race below the intakes. The water race road
culverts are presently maintained and where
necessary replaced by the Council’s roading group.
Management
Since 2000 we have been collecting asset
information via the GIS nominee (Council staff or
contractor) in hard copy and video footage. Logging
them GIS and assigning a new asset ID. This
information includes; type, size, length, installed
by, material, address, condition, data modification
date, date installed, verified why, x and y
coordinates, street name, town, and any additional
information relative to the particular asset.
Once within the GIS the new asset is then
transferred to the asset register spread sheet with
the new ID, the asset information and financials
from the works. This is the same process for
renewals; Information is updated and transferred to
the asset register. The spread sheet is then able to
provide information on financial life expectancy for
assets.
The NAMMS (National Asset Management Steering
group) Condition Rating Model is utilised for
generating a maintenance programme.
Renewal
The renewal programme for water main reticulation
and facilities has been identified over the period
2015 to 2045 and more investigative work remains
to increase the level of confidence in the long term
renewals plan. Council’s preliminary funding
programme for reticulation renewal is $345,000 per
year for period 2015/16 to 2021/22.
Pipe renewal is based on pipe age shown in the AMP
is $248,000 per year for the period 2015/16 to
2024/25.
Cyclical componentry renewal is presently
undertaken at the UF water treatment plant in
Greytown where filter cycle life is deemed to be five
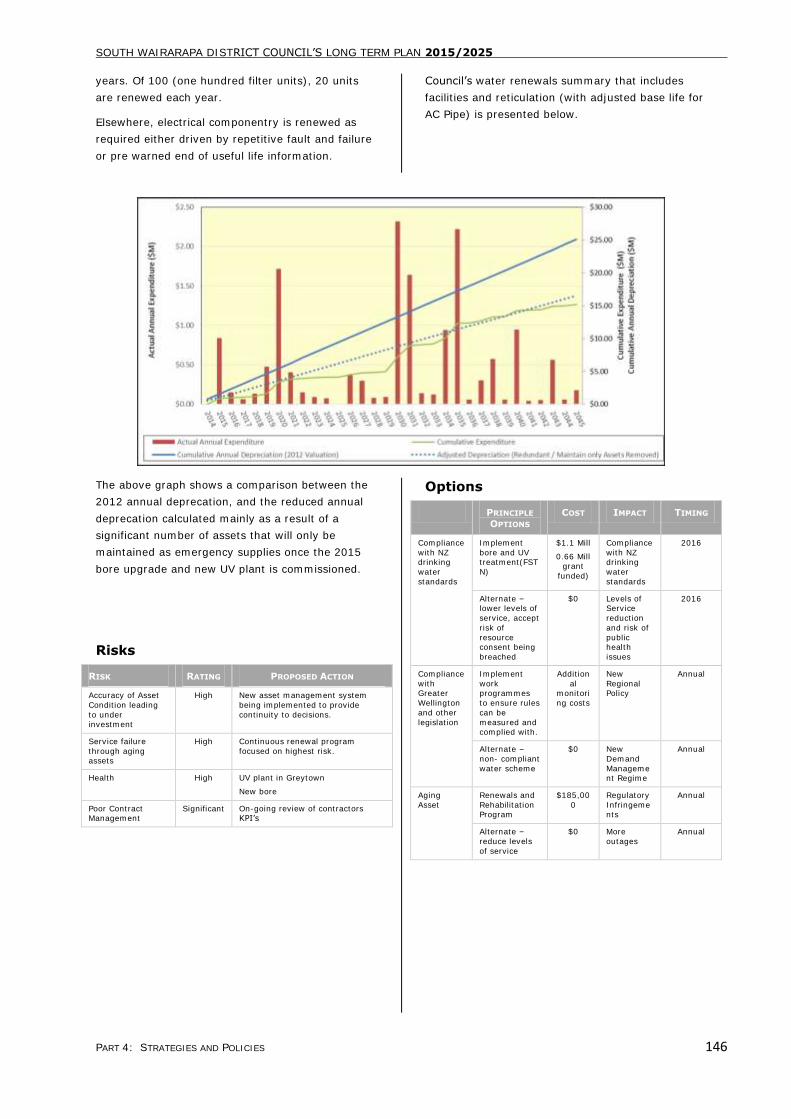
SOUTH WAIRARAPA DISTRICT COUNCIL’S LONG TERM PLAN 2015/2025
PART 4: STRATEGIES AND POLICIES 146
years. Of 100 (one hundred filter units), 20 units
are renewed each year.
Elsewhere, electrical componentry is renewed as
required either driven by repetitive fault and failure
or pre warned end of useful life information.
Council’s water renewals summary that includes
facilities and reticulation (with adjusted base life for
AC Pipe) is presented below.
The above graph shows a comparison between the
2012 annual deprecation, and the reduced annual
deprecation calculated mainly as a result of a
significant number of assets that will only be
maintained as emergency supplies once the 2015
bore upgrade and new UV plant is commissioned.
Risks
RISK RATING PROPOSED ACTION
Accuracy of Asset
Condition leading
to under investment
High
New asset management system
being implemented to provide
continuity to decisions.
Service failure
through aging assets
High Continuous renewal program
focused on highest risk.
Health High UV plant in Greytown
New bore
Poor Contract Management
Significant On-going review of contractors KPI’s
Options
PRINCIPLE
OPTIONS
COST IMPACT TIMING
Compliance
with NZ drinking
water
standards
Implement
bore and UV treatment(FST
N)
$1.1 Mill
0.66 Mill grant
funded)
Compliance
with NZ drinking
water
standards
2016
Alternate – lower levels of
service, accept
risk of
resource consent being
breached
$0 Levels of Service
reduction
and risk of
public health
issues
2016
Compliance
with Greater
Wellington
and other
legislation
Implement
work programmes
to ensure rules
can be
measured and complied with.
Addition
al monitori
ng costs
New
Regional Policy
Annual
Alternate –
non- compliant
water scheme
$0 New
Demand
Management Regime
Annual
Aging
Asset
Renewals and
Rehabilitation Program
$185,00
0
Regulatory
Infringements
Annual
Alternate –
reduce levels
of service
$0 More
outages
Annual
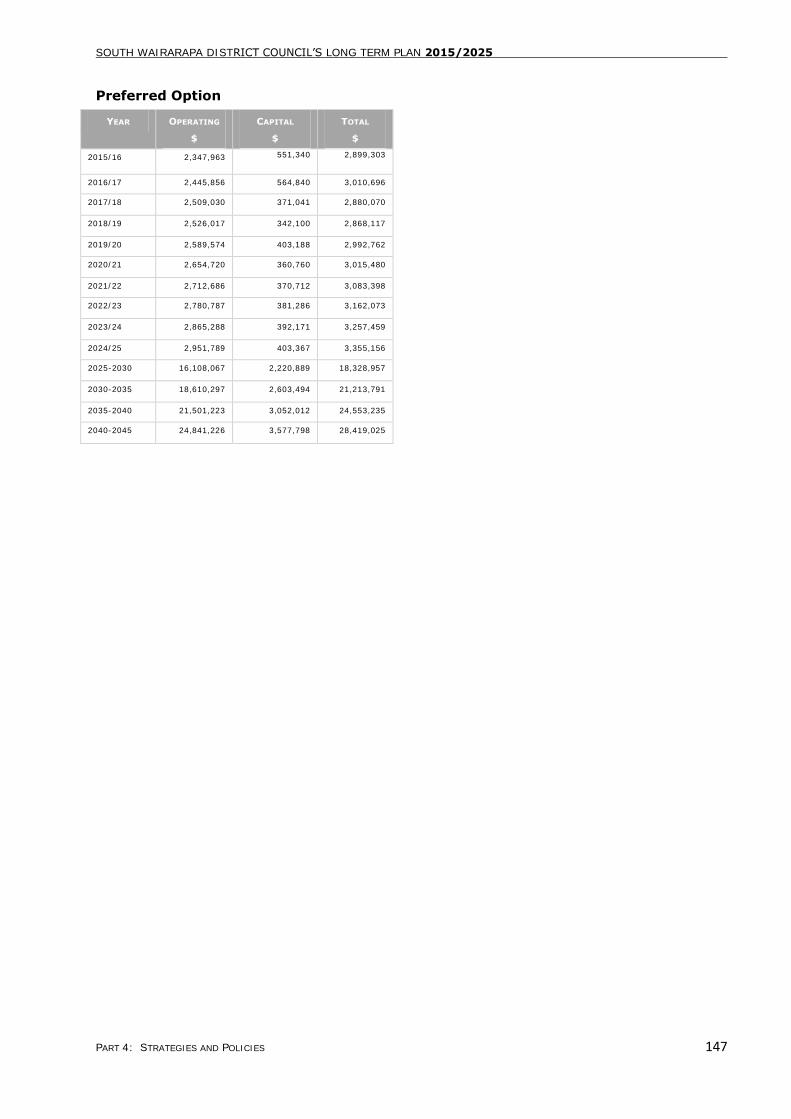
SOUTH WAIRARAPA DISTRICT COUNCIL’S LONG TERM PLAN 2015/2025
PART 4: STRATEGIES AND POLICIES 147
Preferred Option
YEAR OPERATING
$
CAPITAL
$
TOTAL
$
2015/16 2,347,963 551,340 2,899,303
2016/17 2,445,856 564,840 3,010,696
2017/18 2,509,030 371,041 2,880,070
2018/19 2,526,017 342,100 2,868,117
2019/20 2,589,574 403,188 2,992,762
2020/21 2,654,720 360,760 3,015,480
2021/22 2,712,686 370,712 3,083,398
2022/23 2,780,787 381,286 3,162,073
2023/24 2,865,288 392,171 3,257,459
2024/25 2,951,789 403,367 3,355,156
2025-2030 16,108,067 2,220,889 18,328,957
2030-2035 18,610,297 2,603,494 21,213,791
2035-2040 21,501,223 3,052,012 24,553,235
2040-2045 24,841,226 3,577,798 28,419,025
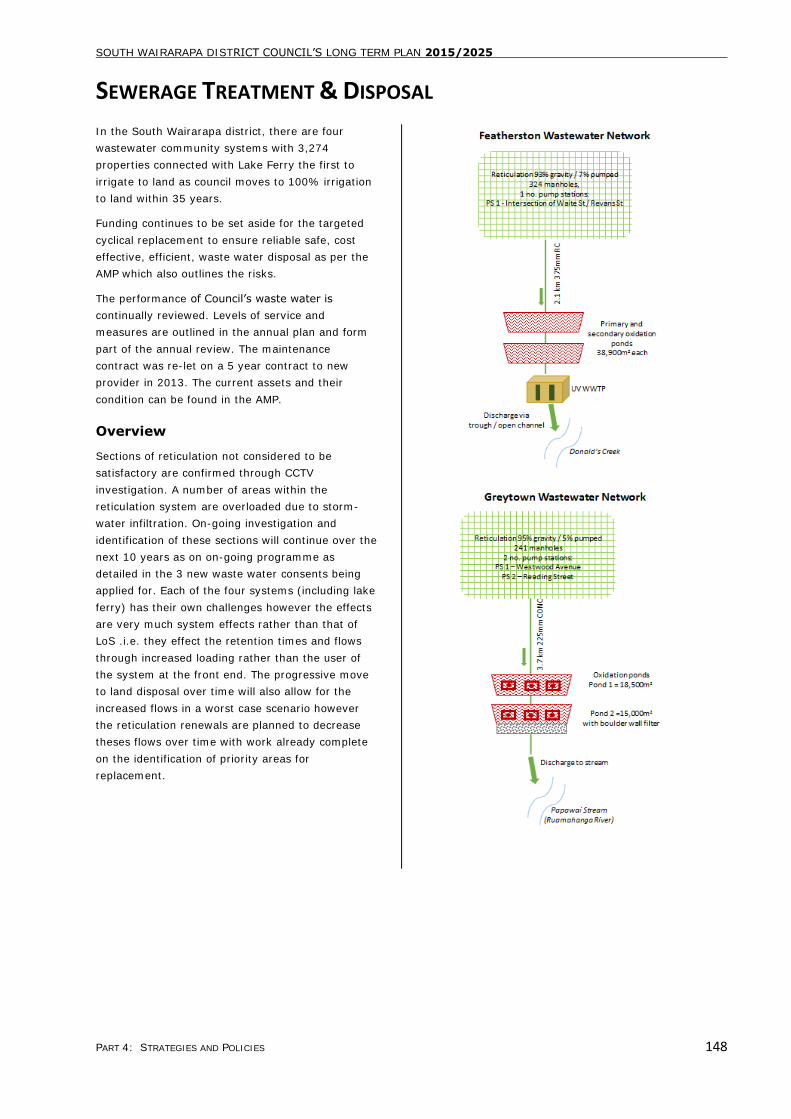
SOUTH WAIRARAPA DISTRICT COUNCIL’S LONG TERM PLAN 2015/2025
PART 4: STRATEGIES AND POLICIES 148
SEWERAGE TREATMENT & DISPOSAL
In the South Wairarapa district, there are four
wastewater community systems with 3,274
properties connected with Lake Ferry the first to
irrigate to land as council moves to 100% irrigation
to land within 35 years.
Funding continues to be set aside for the targeted
cyclical replacement to ensure reliable safe, cost
effective, efficient, waste water disposal as per the
AMP which also outlines the risks.
The performance of Council’s waste water is
continually reviewed. Levels of service and
measures are outlined in the annual plan and form
part of the annual review. The maintenance
contract was re-let on a 5 year contract to new
provider in 2013. The current assets and their
condition can be found in the AMP.
Overview
Sections of reticulation not considered to be
satisfactory are confirmed through CCTV
investigation. A number of areas within the
reticulation system are overloaded due to storm-
water infiltration. On-going investigation and
identification of these sections will continue over the
next 10 years as on on-going programme as
detailed in the 3 new waste water consents being
applied for. Each of the four systems (including lake
ferry) has their own challenges however the effects
are very much system effects rather than that of
LoS .i.e. they effect the retention times and flows
through increased loading rather than the user of
the system at the front end. The progressive move
to land disposal over time will also allow for the
increased flows in a worst case scenario however
the reticulation renewals are planned to decrease
theses flows over time with work already complete
on the identification of priority areas for
replacement.
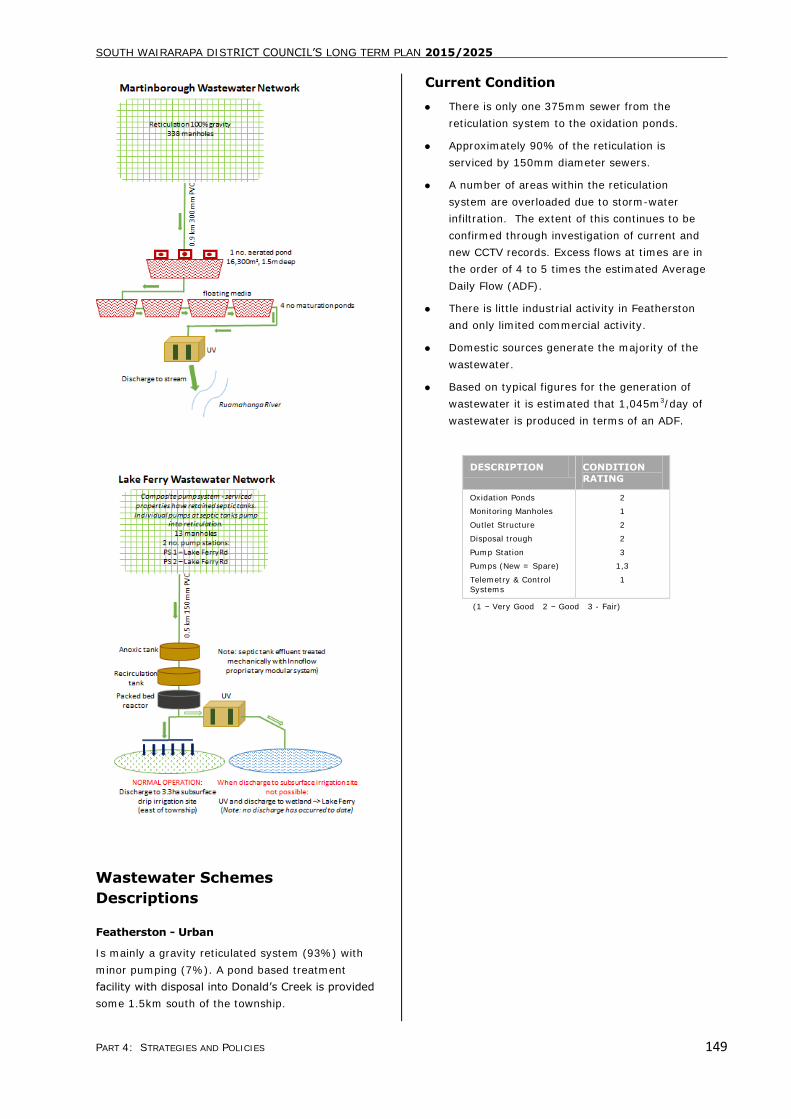
SOUTH WAIRARAPA DISTRICT COUNCIL’S LONG TERM PLAN 2015/2025
PART 4: STRATEGIES AND POLICIES 149
Wastewater Schemes
Descriptions
Featherston - Urban
Is mainly a gravity reticulated system (93%) with
minor pumping (7%). A pond based treatment
facility with disposal into Donald’s Creek is provided
some 1.5km south of the township.
Current Condition
There is only one 375mm sewer from the
reticulation system to the oxidation ponds.
Approximately 90% of the reticulation is
serviced by 150mm diameter sewers.
A number of areas within the reticulation
system are overloaded due to storm-water
infiltration. The extent of this continues to be
confirmed through investigation of current and
new CCTV records. Excess flows at times are in
the order of 4 to 5 times the estimated Average
Daily Flow (ADF).
There is little industrial activity in Featherston
and only limited commercial activity.
Domestic sources generate the majority of the
wastewater.
Based on typical figures for the generation of
wastewater it is estimated that 1,045m3/day of
wastewater is produced in terms of an ADF.
DESCRIPTION CONDITION
RATING
Oxidation Ponds
Monitoring Manholes
Outlet Structure
Disposal trough
Pump Station
Pumps (New = Spare)
Telemetry & Control
Systems
2
1
2
2
3
1,3
1
(1 – Very Good 2 – Good 3 - Fair)
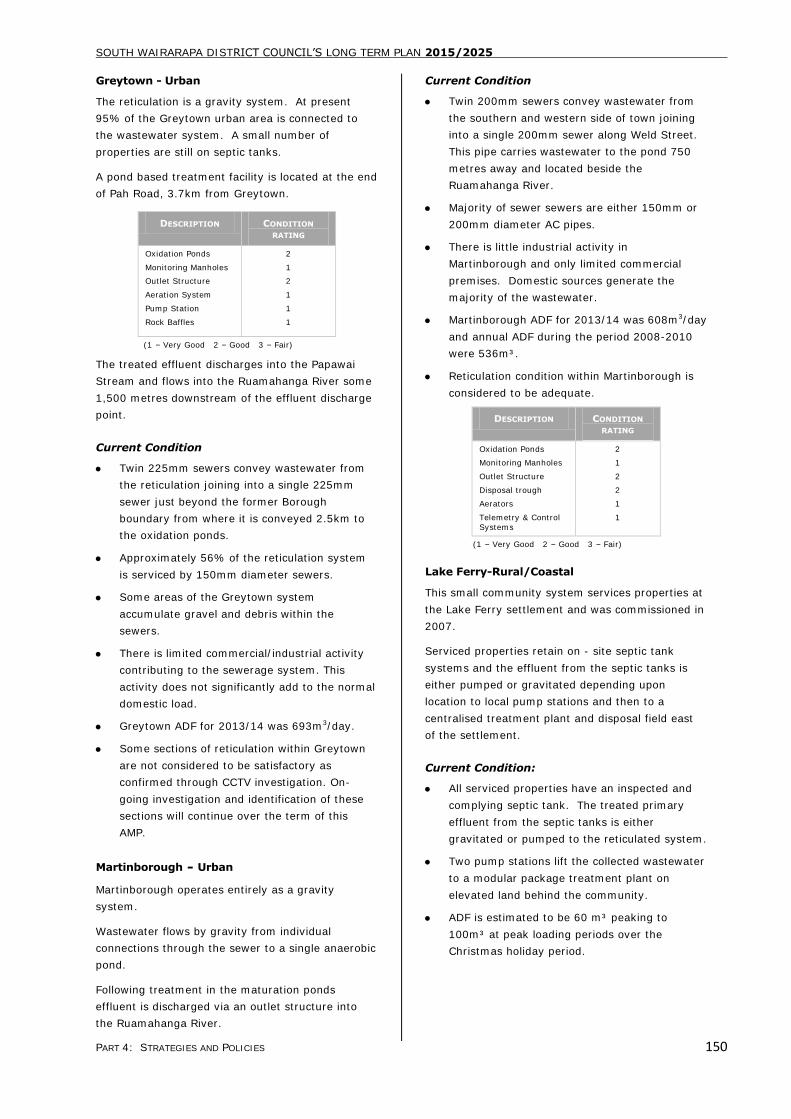
SOUTH WAIRARAPA DISTRICT COUNCIL’S LONG TERM PLAN 2015/2025
PART 4: STRATEGIES AND POLICIES 150
Greytown - Urban
The reticulation is a gravity system. At present
95% of the Greytown urban area is connected to
the wastewater system. A small number of
properties are still on septic tanks.
A pond based treatment facility is located at the end
of Pah Road, 3.7km from Greytown.
DESCRIPTION CONDITION
RATING
Oxidation Ponds
Monitoring Manholes
Outlet Structure
Aeration System
Pump Station
Rock Baffles
2
1
2
1
1
1
(1 – Very Good 2 – Good 3 – Fair)
The treated effluent discharges into the Papawai
Stream and flows into the Ruamahanga River some
1,500 metres downstream of the effluent discharge
point.
Current Condition
Twin 225mm sewers convey wastewater from
the reticulation joining into a single 225mm
sewer just beyond the former Borough
boundary from where it is conveyed 2.5km to
the oxidation ponds.
Approximately 56% of the reticulation system
is serviced by 150mm diameter sewers.
Some areas of the Greytown system
accumulate gravel and debris within the
sewers.
There is limited commercial/industrial activity
contributing to the sewerage system. This
activity does not significantly add to the normal
domestic load.
Greytown ADF for 2013/14 was 693m3/day.
Some sections of reticulation within Greytown
are not considered to be satisfactory as
confirmed through CCTV investigation. On-
going investigation and identification of these
sections will continue over the term of this
AMP.
Martinborough - Urban
Martinborough operates entirely as a gravity
system.
Wastewater flows by gravity from individual
connections through the sewer to a single anaerobic
pond.
Following treatment in the maturation ponds
effluent is discharged via an outlet structure into
the Ruamahanga River.
Current Condition
Twin 200mm sewers convey wastewater from
the southern and western side of town joining
into a single 200mm sewer along Weld Street.
This pipe carries wastewater to the pond 750
metres away and located beside the
Ruamahanga River.
Majority of sewer sewers are either 150mm or
200mm diameter AC pipes.
There is little industrial activity in
Martinborough and only limited commercial
premises. Domestic sources generate the
majority of the wastewater.
Martinborough ADF for 2013/14 was 608m3/day
and annual ADF during the period 2008-2010
were 536m³.
Reticulation condition within Martinborough is
considered to be adequate.
DESCRIPTION CONDITION
RATING
Oxidation Ponds
Monitoring Manholes
Outlet Structure
Disposal trough
Aerators
Telemetry & Control
Systems
2
1
2
2
1
1
(1 – Very Good 2 – Good 3 – Fair)
Lake Ferry-Rural/Coastal
This small community system services properties at
the Lake Ferry settlement and was commissioned in
2007.
Serviced properties retain on - site septic tank
systems and the effluent from the septic tanks is
either pumped or gravitated depending upon
location to local pump stations and then to a
centralised treatment plant and disposal field east
of the settlement.
Current Condition:
All serviced properties have an inspected and
complying septic tank. The treated primary
effluent from the septic tanks is either
gravitated or pumped to the reticulated system.
Two pump stations lift the collected wastewater
to a modular package treatment plant on
elevated land behind the community.
ADF is estimated to be 60 m³ peaking to
100m³ at peak loading periods over the
Christmas holiday period.
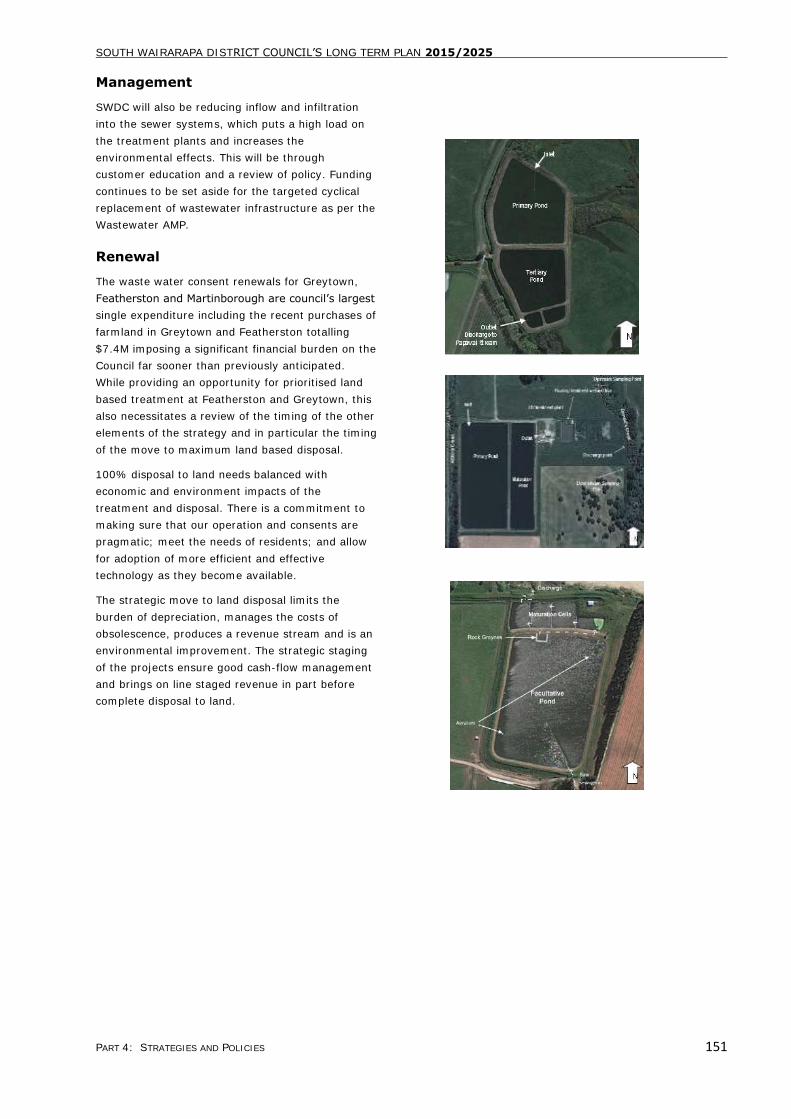
SOUTH WAIRARAPA DISTRICT COUNCIL’S LONG TERM PLAN 2015/2025
PART 4: STRATEGIES AND POLICIES 151
Management
SWDC will also be reducing inflow and infiltration
into the sewer systems, which puts a high load on
the treatment plants and increases the
environmental effects. This will be through
customer education and a review of policy. Funding
continues to be set aside for the targeted cyclical
replacement of wastewater infrastructure as per the
Wastewater AMP.
Renewal
The waste water consent renewals for Greytown,
Featherston and Martinborough are council’s largest
single expenditure including the recent purchases of
farmland in Greytown and Featherston totalling
$7.4M imposing a significant financial burden on the
Council far sooner than previously anticipated.
While providing an opportunity for prioritised land
based treatment at Featherston and Greytown, this
also necessitates a review of the timing of the other
elements of the strategy and in particular the timing
of the move to maximum land based disposal.
100% disposal to land needs balanced with
economic and environment impacts of the
treatment and disposal. There is a commitment to
making sure that our operation and consents are
pragmatic; meet the needs of residents; and allow
for adoption of more efficient and effective
technology as they become available.
The strategic move to land disposal limits the
burden of depreciation, manages the costs of
obsolescence, produces a revenue stream and is an
environmental improvement. The strategic staging
of the projects ensure good cash-flow management
and brings on line staged revenue in part before
complete disposal to land.
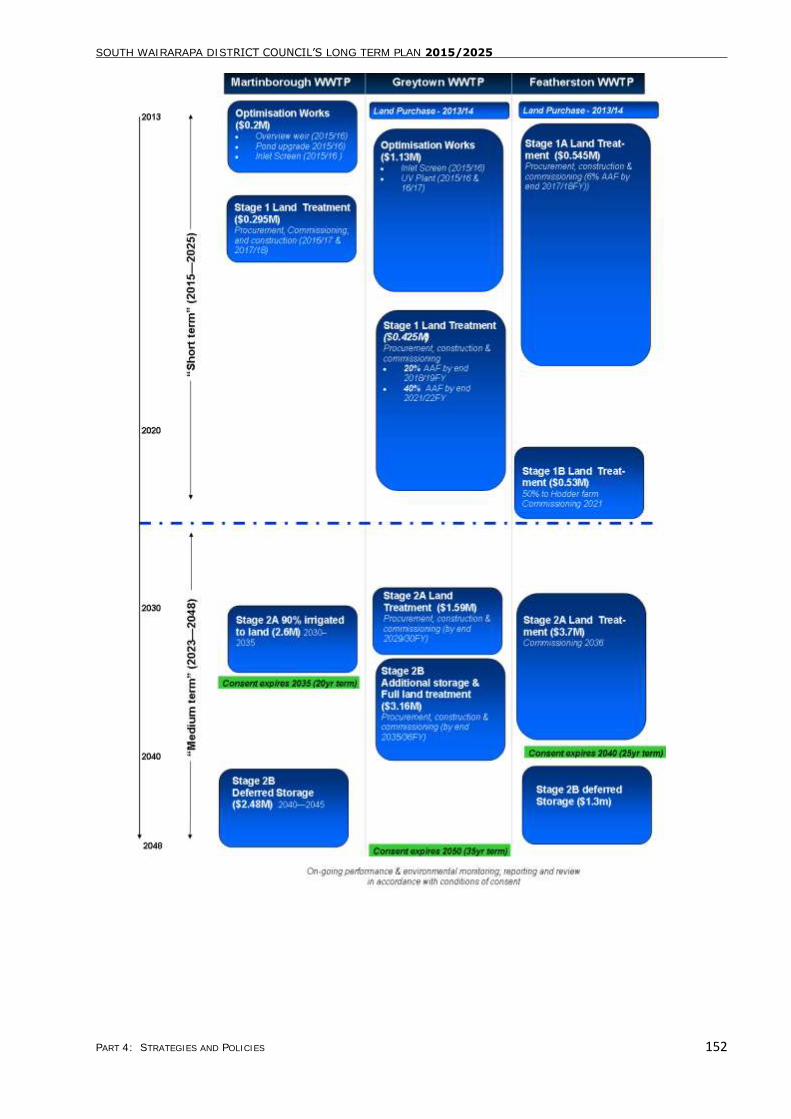
SOUTH WAIRARAPA DISTRICT COUNCIL’S LONG TERM PLAN 2015/2025
PART 4: STRATEGIES AND POLICIES 152
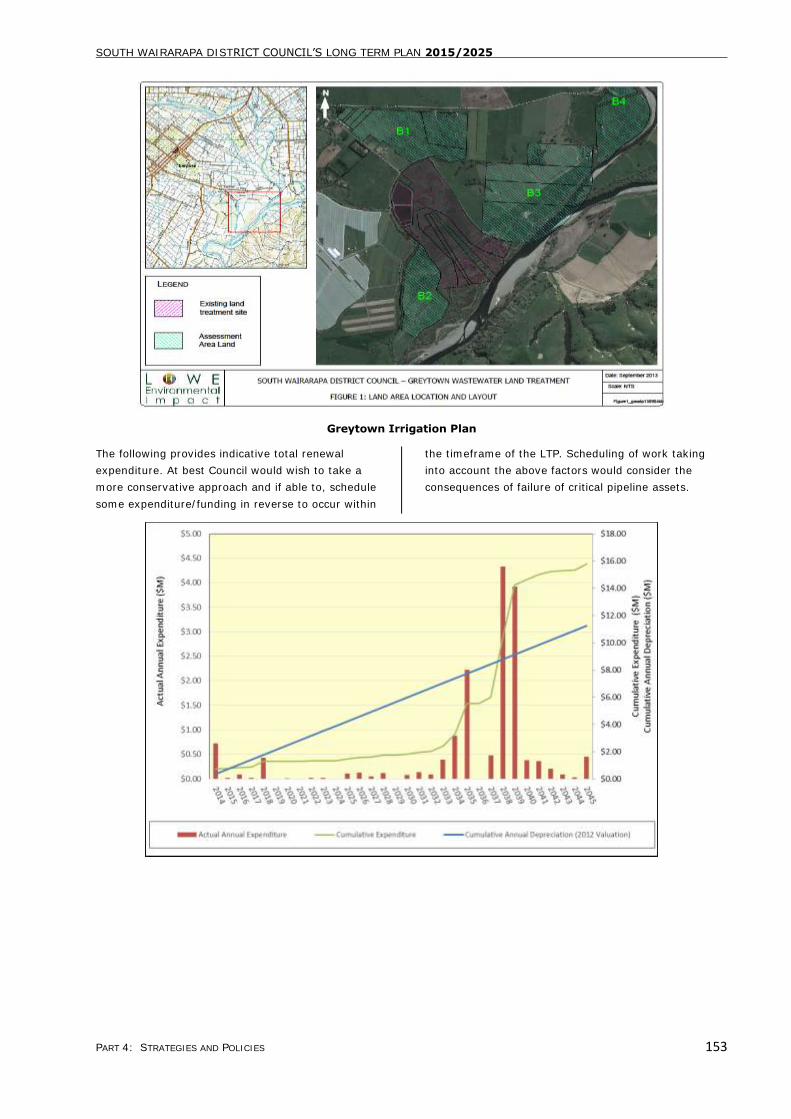
SOUTH WAIRARAPA DISTRICT COUNCIL’S LONG TERM PLAN 2015/2025
PART 4: STRATEGIES AND POLICIES 153
Greytown Irrigation Plan
The following provides indicative total renewal
expenditure. At best Council would wish to take a
more conservative approach and if able to, schedule
some expenditure/funding in reverse to occur within
the timeframe of the LTP. Scheduling of work taking
into account the above factors would consider the
consequences of failure of critical pipeline assets.
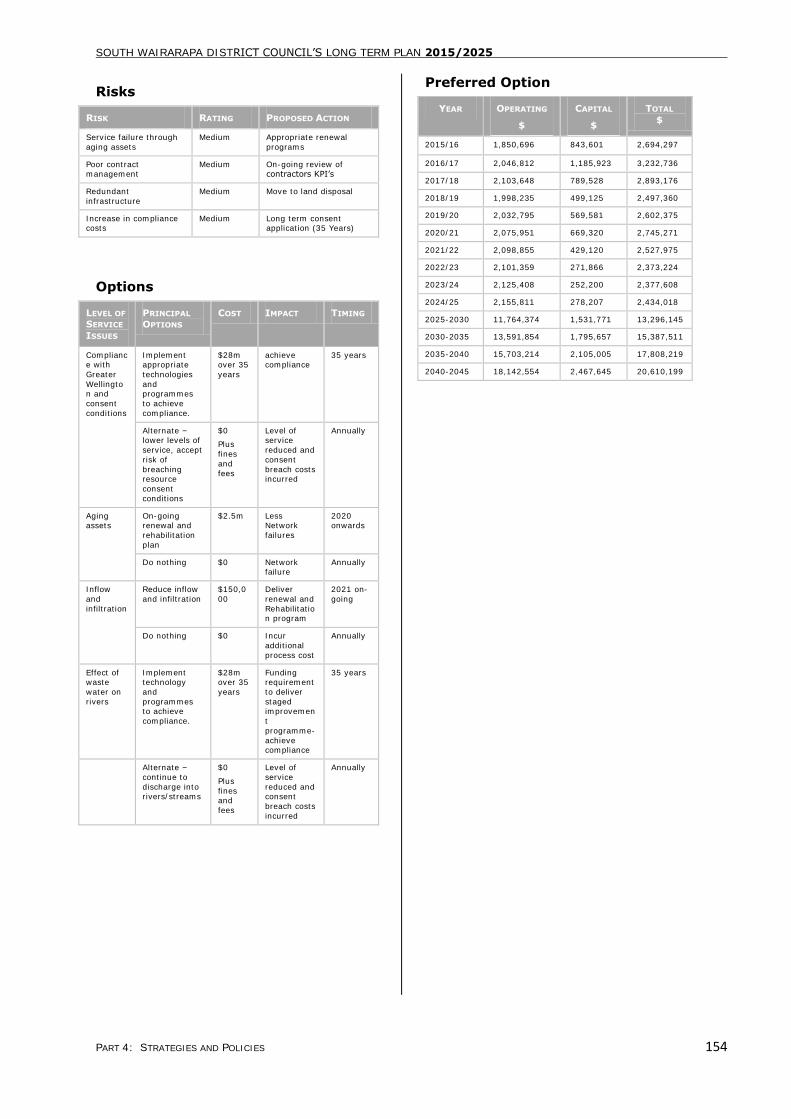
SOUTH WAIRARAPA DISTRICT COUNCIL’S LONG TERM PLAN 2015/2025
PART 4: STRATEGIES AND POLICIES 154
Risks
RISK RATING PROPOSED ACTION
Service failure through
aging assets
Medium Appropriate renewal
programs
Poor contract management
Medium On-going review of contractors KPI’s
Redundant
infrastructure
Medium Move to land disposal
Increase in compliance costs
Medium Long term consent application (35 Years)
Options
LEVEL OF
SERVICE
ISSUES
PRINCIPAL
OPTIONS
COST IMPACT TIMING
Compliance with
Greater
Wellington and
consent
conditions
Implement appropriate
technologies
and programmes
to achieve
compliance.
$28m over 35
years
achieve compliance
35 years
Alternate – lower levels of
service, accept
risk of
breaching resource
consent
conditions
$0
Plus
fines
and
fees
Level of service
reduced and
consent
breach costs incurred
Annually
Aging assets
On-going renewal and
rehabilitation
plan
$2.5m Less Network
failures
2020 onwards
Do nothing $0 Network failure
Annually
Inflow
and
infiltration
Reduce inflow
and infiltration
$150,0
00
Deliver
renewal and
Rehabilitation program
2021 on-
going
Do nothing $0 Incur
additional
process cost
Annually
Effect of waste
water on
rivers
Implement technology
and
programmes to achieve
compliance.
$28m over 35
years
Funding requirement
to deliver
staged improvemen
t
programme-
achieve compliance
35 years
Alternate –
continue to
discharge into rivers/streams
$0
Plus
fines and
fees
Level of
service
reduced and consent
breach costs
incurred
Annually
Preferred Option
YEAR OPERATING
$
CAPITAL
$
TOTAL
$
2015/16 1,850,696 843,601 2,694,297
2016/17 2,046,812 1,185,923 3,232,736
2017/18 2,103,648 789,528 2,893,176
2018/19 1,998,235 499,125 2,497,360
2019/20 2,032,795 569,581 2,602,375
2020/21 2,075,951 669,320 2,745,271
2021/22 2,098,855 429,120 2,527,975
2022/23 2,101,359 271,866 2,373,224
2023/24 2,125,408 252,200 2,377,608
2024/25 2,155,811 278,207 2,434,018
2025-2030 11,764,374 1,531,771 13,296,145
2030-2035 13,591,854 1,795,657 15,387,511
2035-2040 15,703,214 2,105,005 17,808,219
2040-2045 18,142,554 2,467,645 20,610,199
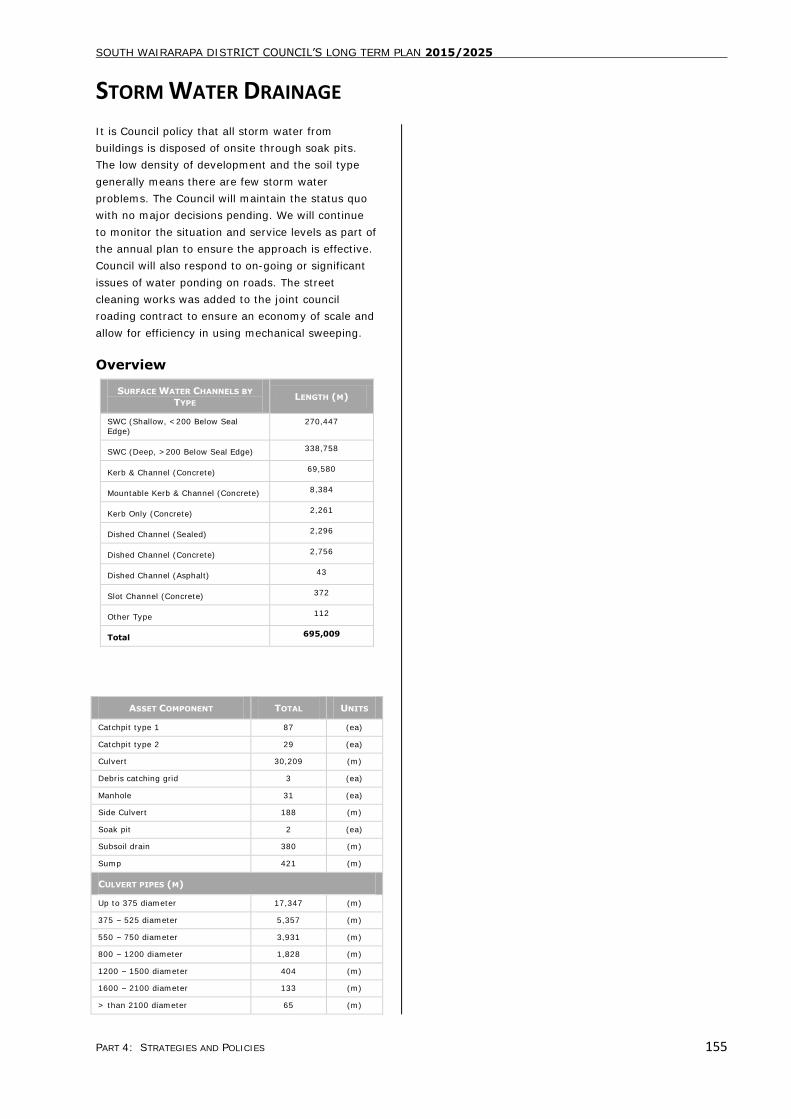
SOUTH WAIRARAPA DISTRICT COUNCIL’S LONG TERM PLAN 2015/2025
PART 4: STRATEGIES AND POLICIES 155
STORM WATER DRAINAGE
It is Council policy that all storm water from
buildings is disposed of onsite through soak pits.
The low density of development and the soil type
generally means there are few storm water
problems. The Council will maintain the status quo
with no major decisions pending. We will continue
to monitor the situation and service levels as part of
the annual plan to ensure the approach is effective.
Council will also respond to on-going or significant
issues of water ponding on roads. The street
cleaning works was added to the joint council
roading contract to ensure an economy of scale and
allow for efficiency in using mechanical sweeping.
Overview
SURFACE WATER CHANNELS BY
TYPE LENGTH (M)
SWC (Shallow, <200 Below Seal
Edge)
270,447
SWC (Deep, >200 Below Seal Edge) 338,758
Kerb & Channel (Concrete) 69,580
Mountable Kerb & Channel (Concrete) 8,384
Kerb Only (Concrete) 2,261
Dished Channel (Sealed) 2,296
Dished Channel (Concrete) 2,756
Dished Channel (Asphalt) 43
Slot Channel (Concrete) 372
Other Type 112
Total 695,009
ASSET COMPONENT TOTAL UNITS
Catchpit type 1 87 (ea)
Catchpit type 2 29 (ea)
Culvert 30,209 (m)
Debris catching grid 3 (ea)
Manhole 31 (ea)
Side Culvert 188 (m)
Soak pit 2 (ea)
Subsoil drain 380 (m)
Sump 421 (m)
CULVERT PIPES (M)
Up to 375 diameter 17,347 (m)
375 – 525 diameter 5,357 (m)
550 – 750 diameter 3,931 (m)
800 – 1200 diameter 1,828 (m)
1200 – 1500 diameter 404 (m)
1600 – 2100 diameter 133 (m)
> than 2100 diameter 65 (m)
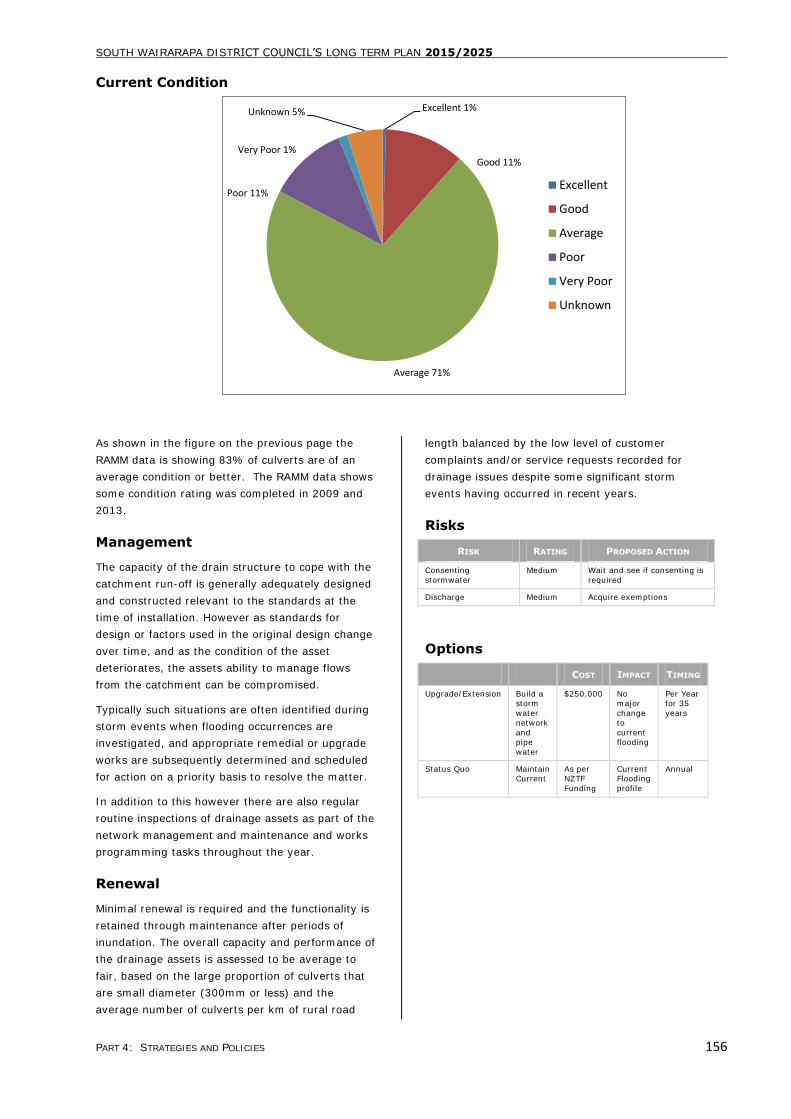
SOUTH WAIRARAPA DISTRICT COUNCIL’S LONG TERM PLAN 2015/2025
PART 4: STRATEGIES AND POLICIES 156
Current Condition
As shown in the figure on the previous page the
RAMM data is showing 83% of culverts are of an
average condition or better. The RAMM data shows
some condition rating was completed in 2009 and
2013.
Management
The capacity of the drain structure to cope with the
catchment run-off is generally adequately designed
and constructed relevant to the standards at the
time of installation. However as standards for
design or factors used in the original design change
over time, and as the condition of the asset
deteriorates, the assets ability to manage flows
from the catchment can be compromised.
Typically such situations are often identified during
storm events when flooding occurrences are
investigated, and appropriate remedial or upgrade
works are subsequently determined and scheduled
for action on a priority basis to resolve the matter.
In addition to this however there are also regular
routine inspections of drainage assets as part of the
network management and maintenance and works
programming tasks throughout the year.
Renewal
Minimal renewal is required and the functionality is
retained through maintenance after periods of
inundation. The overall capacity and performance of
the drainage assets is assessed to be average to
fair, based on the large proportion of culverts that
are small diameter (300mm or less) and the
average number of culverts per km of rural road
length balanced by the low level of customer
complaints and/or service requests recorded for
drainage issues despite some significant storm
events having occurred in recent years.
Risks
RISK RATING PROPOSED ACTION
Consenting
stormwater
Medium Wait and see if consenting is
required
Discharge Medium Acquire exemptions
Options
COST IMPACT TIMING
Upgrade/Extension Build a storm
water
network
and pipe
water
$250,000 No major
change
to
current flooding
Per Year for 35
years
Status Quo Maintain Current
As per NZTF
Funding
Current Flooding
profile
Annual
Excellent 1%
Good 11%
Average 71%
Poor 11%
Very Poor 1%
Unknown 5%
Excellent
Good
Average
Poor
Very Poor
Unknown
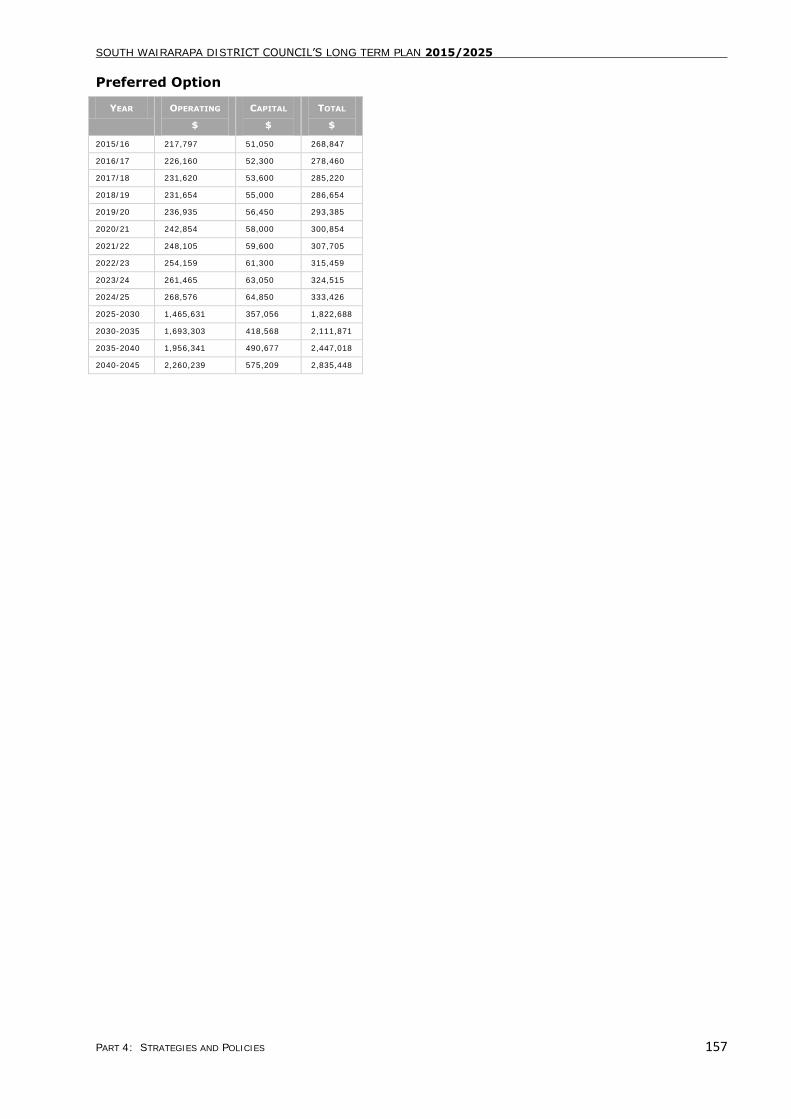
SOUTH WAIRARAPA DISTRICT COUNCIL’S LONG TERM PLAN 2015/2025
PART 4: STRATEGIES AND POLICIES 157
Preferred Option
YEAR OPERATING
$
CAPITAL
$
TOTAL
$
2015/16 217,797 51,050 268,847
2016/17 226,160 52,300 278,460
2017/18 231,620 53,600 285,220
2018/19 231,654 55,000 286,654
2019/20 236,935 56,450 293,385
2020/21 242,854 58,000 300,854
2021/22 248,105 59,600 307,705
2022/23 254,159 61,300 315,459
2023/24 261,465 63,050 324,515
2024/25 268,576 64,850 333,426
2025-2030 1,465,631 357,056 1,822,688
2030-2035 1,693,303 418,568 2,111,871
2035-2040 1,956,341 490,677 2,447,018
2040-2045 2,260,239 575,209 2,835,448
SOUTH WAIRARAPA DISTRICT COUNCIL’S LONG TERM PLAN 2015/2025
PART 4: STRATEGIES AND POLICIES 158
PROVISION OF ROADS & FOOTPATHS
Roading is a vital element to enable social and
economic development. With 381.9km sealed and
271km unsealed road network and limited funds,
consideration needs to be given to sustainability of
maintaining roads over the long term. Council will
continue to focus on applying to attract maximum
subsidies in the areas of drainage, bridging, road
safety and maintenance.
Transport in the highest projected capital spend and
has historically been so therefore no change is
expected. The robust processes around the
development of projects and the whole of life costs
involved in attracting funding ensures that
expenditure is in line with sustainability and
affordability.
The greater reliance on “Better Business Case”
development for funding ensures SWDC is looking
at the whole of life implications on maintenance,
renewal and capital expenditure ensures there is
less risk in this asset group. The Auditing by NZTA
on expenditure, quality and standards as well as
review of its Transport AMP ensures an independent
third party review of council’s largest asset spend
Land Transport NZ has removed the seal extension
subsidy indefinitely on all road classes, including
Special Purpose Roads. Future changes to the
Funding Assistance Rates (FAR) and removal of
funding for the SPR is outlined in Transport AMP.
Overview Council has 49.2 km of footpaths across the 3 main
towns. They are constructed predominately in
concrete and when in need of repairs are overlaid
with asphalt. Council’s strategic approach is to have
a footpath on one side of the street emanating
concentrically from the town centre. New paths are
constructed in line with the strategic approach to
lead to the town centre but also to link community
infrastructure such as pools or medical centres. The
renewal of footpaths takes priority over the
construction of new paths as there is greater risk in
the use of a path with an existing hazard to that of
a path not constructed. Paths can be renewed
(repaired) in single points through replacing the
affected slab or in longer sections by overlaying a
length.
Council understands the need to improve pedestrian
and cycle access across the district as walking and
cycling is beneficial for individuals, easy on our
environment and is supported by the SWDC. We
have seen the success of the first stages of the
Greytown rail trail in attracting and fostering
cycling, and to a lesser extent walking, as means of
transport walking and cycling also helps the wider
promotion and development of the district. A strategy will be developed over the 2015/18 LTP
period. This strategy is intended to guide the people
and Council as they make walking and cycling an
integral part of their daily lives and the Wairarapa a
more pedestrian and cycle friendly district. While it
will focus on the Council’s projects, it is also
intended to help guide other organisations in their
efforts to improve conditions for walking and cycling
for transport and recreation. This has currently been
developed in isolation with private and public trails
being developed currently.
Current Condition
At present the roading network is in a generally
good condition though knowledge of the assets
could be improved significantly to improve
confidence. At present no changes in LoS have been
proposed. There are a large number of
requirements that are imposed on the Council that
need to be added to or incorporated into the
existing LoS targets and monitoring for The ONRC.
While some are not specifically LoS the reporting on
them annually becomes a LoS target by default.
The NRB Communitrak Survey results suggest some
possible areas for additional LoS including the
amount of seal extension and new footpaths,
maintenance response times and improved
supervision of trenching etc. Most of the other
issues raised by the survey respondents are
covered by the existing LoS though in technical
roading measures rather than something the
ratepayers would readily understand.
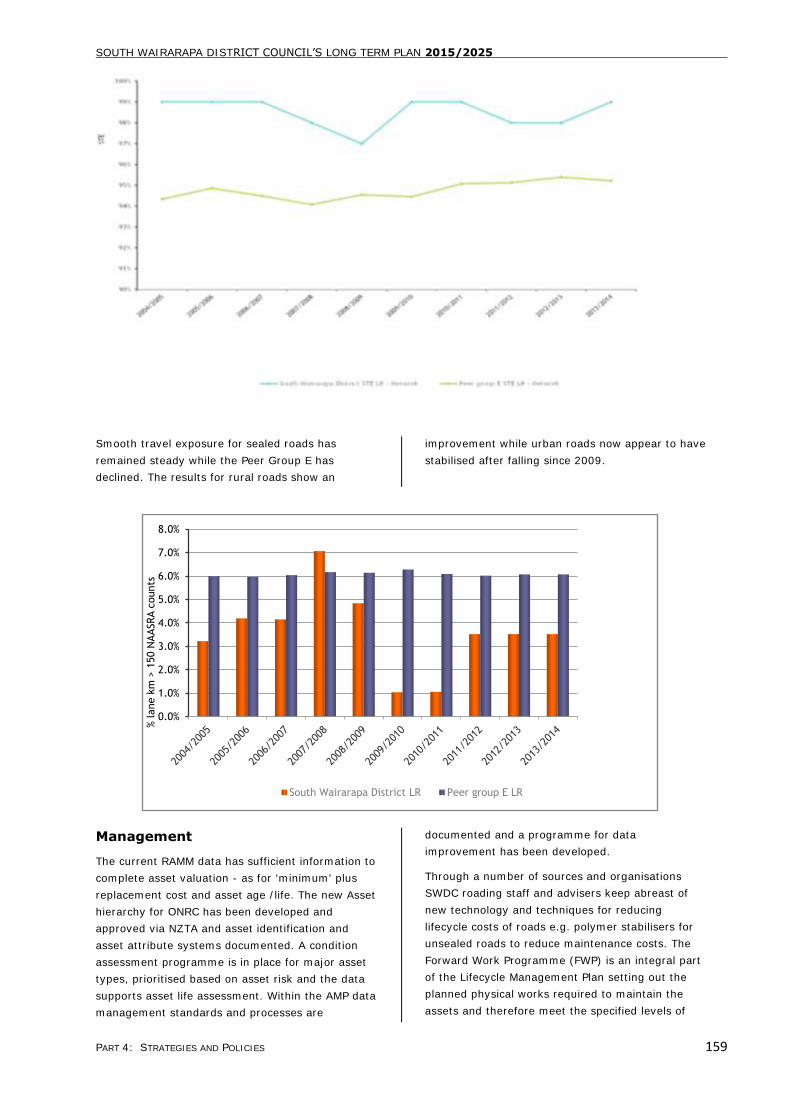
SOUTH WAIRARAPA DISTRICT COUNCIL’S LONG TERM PLAN 2015/2025
PART 4: STRATEGIES AND POLICIES 159
Smooth travel exposure for sealed roads has
remained steady while the Peer Group E has
declined. The results for rural roads show an
improvement while urban roads now appear to have
stabilised after falling since 2009.
Management
The current RAMM data has sufficient information to
complete asset valuation - as for 'minimum' plus
replacement cost and asset age /life. The new Asset
hierarchy for ONRC has been developed and
approved via NZTA and asset identification and
asset attribute systems documented. A condition
assessment programme is in place for major asset
types, prioritised based on asset risk and the data
supports asset life assessment. Within the AMP data
management standards and processes are
documented and a programme for data
improvement has been developed.
Through a number of sources and organisations
SWDC roading staff and advisers keep abreast of
new technology and techniques for reducing
lifecycle costs of roads e.g. polymer stabilisers for
unsealed roads to reduce maintenance costs. The
Forward Work Programme (FWP) is an integral part
of the Lifecycle Management Plan setting out the
planned physical works required to maintain the
assets and therefore meet the specified levels of
0.0%
1.0%
2.0%
3.0%
4.0%
5.0%
6.0%
7.0%
8.0%
% lane k
m >
150 N
AASRA c
ounts
South Wairarapa District LR Peer group E LR
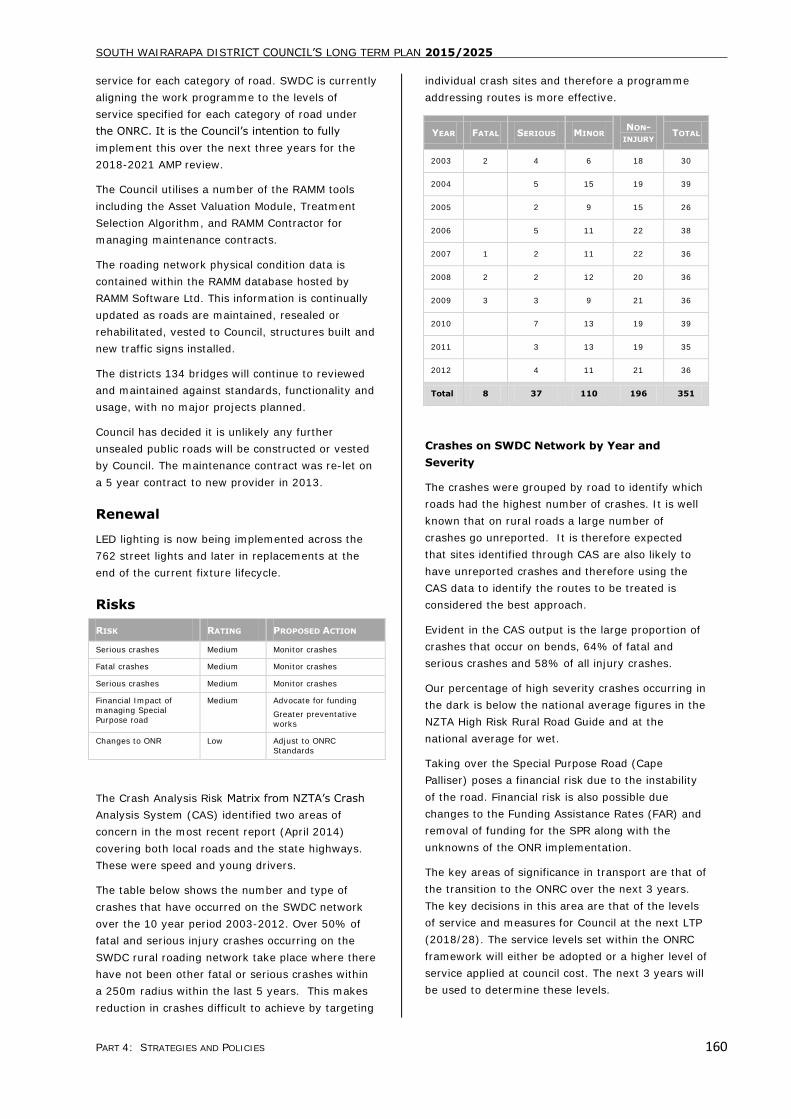
SOUTH WAIRARAPA DISTRICT COUNCIL’S LONG TERM PLAN 2015/2025
PART 4: STRATEGIES AND POLICIES 160
service for each category of road. SWDC is currently
aligning the work programme to the levels of
service specified for each category of road under
the ONRC. It is the Council’s intention to fully
implement this over the next three years for the
2018-2021 AMP review.
The Council utilises a number of the RAMM tools
including the Asset Valuation Module, Treatment
Selection Algorithm, and RAMM Contractor for
managing maintenance contracts.
The roading network physical condition data is
contained within the RAMM database hosted by
RAMM Software Ltd. This information is continually
updated as roads are maintained, resealed or
rehabilitated, vested to Council, structures built and
new traffic signs installed.
The districts 134 bridges will continue to reviewed
and maintained against standards, functionality and
usage, with no major projects planned.
Council has decided it is unlikely any further
unsealed public roads will be constructed or vested
by Council. The maintenance contract was re-let on
a 5 year contract to new provider in 2013.
Renewal
LED lighting is now being implemented across the
762 street lights and later in replacements at the
end of the current fixture lifecycle.
Risks
RISK RATING PROPOSED ACTION
Serious crashes Medium Monitor crashes
Fatal crashes Medium Monitor crashes
Serious crashes Medium Monitor crashes
Financial Impact of
managing Special
Purpose road
Medium Advocate for funding
Greater preventative
works
Changes to ONR Low Adjust to ONRC
Standards
The Crash Analysis Risk Matrix from NZTA’s Crash
Analysis System (CAS) identified two areas of
concern in the most recent report (April 2014)
covering both local roads and the state highways.
These were speed and young drivers.
The table below shows the number and type of
crashes that have occurred on the SWDC network
over the 10 year period 2003-2012. Over 50% of
fatal and serious injury crashes occurring on the
SWDC rural roading network take place where there
have not been other fatal or serious crashes within
a 250m radius within the last 5 years. This makes
reduction in crashes difficult to achieve by targeting
individual crash sites and therefore a programme
addressing routes is more effective.
YEAR FATAL SERIOUS MINOR NON-
INJURY TOTAL
2003 2 4 6 18 30
2004 5 15 19 39
2005 2 9 15 26
2006 5 11 22 38
2007 1 2 11 22 36
2008 2 2 12 20 36
2009 3 3 9 21 36
2010 7 13 19 39
2011 3 13 19 35
2012 4 11 21 36
Total 8 37 110 196 351
Crashes on SWDC Network by Year and
Severity
The crashes were grouped by road to identify which
roads had the highest number of crashes. It is well
known that on rural roads a large number of
crashes go unreported. It is therefore expected
that sites identified through CAS are also likely to
have unreported crashes and therefore using the
CAS data to identify the routes to be treated is
considered the best approach.
Evident in the CAS output is the large proportion of
crashes that occur on bends, 64% of fatal and
serious crashes and 58% of all injury crashes.
Our percentage of high severity crashes occurring in
the dark is below the national average figures in the
NZTA High Risk Rural Road Guide and at the
national average for wet.
Taking over the Special Purpose Road (Cape
Palliser) poses a financial risk due to the instability
of the road. Financial risk is also possible due
changes to the Funding Assistance Rates (FAR) and
removal of funding for the SPR along with the
unknowns of the ONR implementation.
The key areas of significance in transport are that of
the transition to the ONRC over the next 3 years.
The key decisions in this area are that of the levels
of service and measures for Council at the next LTP
(2018/28). The service levels set within the ONRC
framework will either be adopted or a higher level of
service applied at council cost. The next 3 years will
be used to determine these levels.

SOUTH WAIRARAPA DISTRICT COUNCIL’S LONG TERM PLAN 2015/2025
PART 4: STRATEGIES AND POLICIES 161
The move from 100% funding of the SPR to the
52% FAR will require a transition timeframe that is
currently unknown. Historically NZTA have applied
an incremental change of 1% per year however this
may be far longer than aspired for by NZTA. This
unknown transition is a major factor for SWDC and
will have active lobbying to ensure minimal effect.
SOUTH WAIRARAPA DISTRICT COUNCIL’S LONG TERM PLAN 2015/2025
PART 4: STRATEGIES AND POLICIES 162
Options
SWDC do not have a target measure for roughness.
Comparing the SWDC roads with Peer Group E
(Small provincial towns, low traffic volumes
population less than 20,000 and/or rural crashes
greater than 55%) there is a lower percentage with
roads with NAASRA roughness greater than 150
counts.
Preferred Option
YEAR OPERATING
$
CAPITAL
$
TOTAL
$
2015/16 5,238,952 2,298,199 7,537,151
2016/17 5,177,900 1,719,174 6,897,074
2017/18 5,254,422 2,000,081 7,254,502
2018/19 5,273,946 2,192,409 7,466,355
2019/20 5,331,996 2,243,138 7,575,134
2020/21 5,403,543 2,299,529 7,703,071
2021/22 5,606,507 2,355,892 7,962,399
2022/23 5,669,677 2,414,190 8,083,867
2023/24 5,757,351 2,474,376 8,231,728
2024/25 5,993,255 2,535,513 8,528,768
2025-2030 32,705,499 13,960,225 46,665,725
2030-2035 37,785,976 16,365,228 54,151,205
2035-2040 43,655,656 19,184,554 62,840,209
2040-2045 50,437,131 22,489,580 72,926,711
LEVEL OF
SERVICE ISSUE
PRINCIPAL OPTIONS COST IMPACT TIME
ONRC changing standards
Improving the Classification of roads vz ONRC Increased unsubsidised
Roads costs
Initial classification complete and being moderated by NZTA.
2019 onwards
Understanding implications of the ONRC on the District Plan
$0 2019 onwards
Identifying gaps in performance (measures) or
network outcomes between current practice
and the ONRC and getting stakeholder agreement to remedy any gaps
Unknown Programme to be established in conjunction
with elected members
2016-2019
NZTA monitoring
requirements for ONRC
Designing and implementing performance
monitoring programmes
$0 Belter use of existing systems 2017-18
financial year
ONRC measures Implementing the measures and building them
into service contracts
.$0 Service contracts are not due for renewal
until 2017-18 financial years
2017 onwards
Planning investment (and dis-investment) programmes to address gaps in time for the
development of the 2018/28 NLTP
$25,000 Programme to be established in conjunction with NZTA elected members. June 2018
2018
Addressing gaps through negotiation between the Council and NZTA
June 2018 Programme to be established in conjunction with NZTA and Calibre consultants
2017
LED Lighting Cost neutral
over 15 years
A program of replacing only when assets
are at the end of life
2016-2045
Seal Extensions $120,000 tangible benefits (removal of dust nuisance, creation of alternative routes and protection
of sensitive crops and increased usage)
increase future maintenance costs in
Annually
$0 Don’t do them Annually
Footpath extensions Maximum
$95,000
Increased amenity of urban areas Annual decision
$0 Don’t do any Annually
SOUTH WAIRARAPA DISTRICT COUNCIL’S LONG TERM PLAN 2015/2025
PART 4: STRATEGIES AND POLICIES 163
SWDC IN 2045
Sustainable practices adapting to the changing
environment and societal needs will still be the
focus.
From Where we are Now it is
Envisaged
More people will be walking and cycling in the
future, both for exercise as part of a healthy
lifestyle and as an inexpensive and convenient form
of transport. The popularity of the district’s
walkways and cycle ways is likely to continue and
could be supplemented by further facilities in
available space. The vast nature of our district
however and lack of public transport choices means
that the motor vehicle will still be the predominant
method of transport in our communities for the
foreseeable future.
The district will be more sustainable and economical
having:
Developed eco-friendly ways to use water and
dispose of wastewater as per our long term
consents, including producing crops from the
wastewater.
Water sensitive urban design.
Better storm water management practices the
district will be more sustainable and economic.
All ratepayers will be recycling.
E-recycling.
The Wairarapa Water Use Project may have
developed greater storage and supply of agricultural
grade water adding to the economic growth of the
area and intensifying the production from land use.
Climate change will impact the environment globally
and locally. Changes in wind and weather patterns,
sea level rises, increased flood risk and frequency of
extreme weather events are predicted. Climate
change is not expected to create new hazards but
may change the frequency and intensity of existing
hazards. Council is responsible for a range of
functions that may be affected by climate change.
These include resource management, land use
planning, civil defence and the provision of
infrastructure such as storm water drainage, water
supply and roads.
SOUTH WAIRARAPA DISTRICT COUNCIL’S LONG TERM PLAN 2015/2025
PART 4: STRATEGIES AND POLICIES 164
OTHER LINKED DOCUMENTS
This strategy is a key component of the Council
planning process, linking with the following Council
plans and documents: SWDC Long Term Plan.
SWDC Annual Plan.
SWDC Finance Policies.
SWDC Finance Strategy.
Significance and Engagement Policy.
SWDC Rick Management Plan.
AMPs for Council infrastructure.
SWDC bylaws.
Combined Wairarapa District Plan.
There are linkages to other local and national
planning documents as follows:
Government Policy Statement on Land
Transport Funding.
National Policy Statement on freshwater.
NZTA manuals and procedures.
National Land Transport Plan.
Regional Land Transport Strategy.
Regional Land Transport Programme.
Regional Road Safety Plan.
Wairarapa Life Lines Study.
Regional Walking Plan.
Regional Cycling Plan.
Regional Plans (Freshwater, Discharges,
Coastal, Policy).
SOUTH WAIRARAPA DISTRICT COUNCIL’S LONG TERM PLAN 2015/2025
PART 4: STRATEGIES AND POLICIES 165
APPENDIX ONE: SUPPORTING ASSUMPTIONS
Population
With relatively flat population growth
projections, we will plan for and build major
asset renewals or new infrastructure with little
redundant capacity.
It will be difficult to reduce costs in future if
population actually declines and an increased
number of households with lower fixed incomes
lead to affordability issues.
The median age will rise to approximately 50
by 2043.
Finance
In the AMP’s:
Asset information will continue to be acquired
to complete a full understanding of the
community reticulation networks condition.
The external regulatory environment will
remain significantly the same for the next ten
years.
Council and its service community will maintain
a similar level of expectation in relation to
service levels.
Where data is not available the knowledge of
the practitioners directly providing this activity,
both on a day-to-day basis and historically, has
been relied upon. These practitioners include
Council’s staff, consultants, and staff of the
various physical works contractors.
There will be an on-going requirement/demand
for the provision of these activities.
Renewal and Capital costs are preliminary cost
estimates not final costs and will be further
researched and refined on a project by project
basis as part of development.
In the financial forecasts:
NZTA will continue to provide subsidised
funding to Council for the roading network.
Council will continue to fund the current levels
of service.
The Total Useful Life and Residual Useful Lives
of the assets in relation to the asset valuation
are deemed equal.
The asset data provided is reliable and fit for
the purpose of developing the long term
financial forecasts.
Service Levels
This Strategy assumes that all Levels of Service
targets will be unchanged in the future.
Where Level of Service capital expenditure is
proposed (largely in the Water and Wastewater
Activities), this is to meet mandatory Levels of
Service that are not currently being met and
will be implemented. For waste water Service
levels will remain unchanged though register a
positive effect on the environment.
Where there are land use changes in the
District Plan, some areas may be entitled to an
altered Level of Service. It is assumed that
there will be no impact from land use changes
in the District Plan in terms of ability to meet
these Level of Service changes.
All Levels of Service are tabled in the Annual
Plan.
The impact of ONRC is unknown and therefore
not included.
Ownership
Council currently owns and operates the
infrastructure assets outlined in this Strategy.
Although most of the field works are undertaken by
private contractors, the overall responsibility for
service delivery rests with Council. This Strategy
assumes that the current ownership/operating
model in use by the Council will continue through
the next 30 years.
Demand
Overall quantity and quality demand will remain
constant. Evaluation of change will take place
on an as required/provided basis resulting in
progressive development.
The age demographic change will result in
greater demand in levels of service in one area
with a corresponding decrease in another.
Statutory Change
Meet all current and new statutory obligations,
assuming cost of compliance will be in line with
current operational and project budgets.
Life Cycle
All assets will be utilised for their full lifecycle and
maintained in perpetuity.
SOUTH WAIRARAPA DISTRICT COUNCIL’S LONG TERM PLAN 2015/2025
PART 4: STRATEGIES AND POLICIES 166
Design
All design will meet current industry standards and
adhere to best practice.
Obsolescence/Disposal
No components of the district’s assets are
obsolete or will be in the term of the strategy.
Under this strategy there is no requirement for
decommissioned Asset Disposal.
Any forced obsolescence through consenting
requirements and community expectations will
be accounted for through the consenting
processes.
Natural Disasters
Commentators say “There will be an increased
frequency and severity of storm events and or
flooding due to climate change.”
Sea levels will rise.
No funds have been attributed to this activity
and will be funded from reserves, insurance
and loans if it occurs.
Earthquake strengthening will be completed.
Flood protection and control works are the
responsibility of Greater wellington Regional
Council.
Technology
Current engineering will remain unchanged and
lower cost options will continue to be made
available.
Asset data and information will
Be collated into a single repository.
Have a full process for tracking maintenance
costs.
Be accurately collect, validate and record data
staff and contractors.
Complete asset condition assessment and
performance monitoring.
Allow for complete asset capacity and utilisation
assessment.
Update and refine the required renewal
expenditure based upon the improved data as it
becomes available.
Due to the following we are reasonably certain of
the assumptions used in the collation of this report
and those feeding into it:
Relatively static population over the period.
Long-term infrastructure investment to be
maintained in perpetuity.
No asset replacement bubbles.

Part 5Our Future
Introduction
Key Issues
Promoting Our District
How our District Looks in the Future (20+ Years)
SOUTH WAIRARAPA
DISTRICT COUNCIL

SOUTH WAIRARAPA DISTRICT COUNCIL‟S LONG TERM PLAN 2015/2025
PART 5: OUR FUTURE 167
OUR FUTURE
Introduction
Workshops with various industry stakeholders have been held over the last two long term plan processes to get
input on current and long term issues as well as current or potential Council projects. The following are the
stakeholder groups that we sought input from before the Draft LTP was prepared and the key issues identified by
these stakeholder groups as they were presented. Many of the key issues were consistent with the projects
currently being undertaken and priority will be given to ensure projects align to the community vision.
Business stakeholders
Sports stakeholders
Rural stakeholders
Youth
Youth workers
Martinborough Community Board
Featherston Community Board
Greytown Community Board
Maori Standing Committee and Wairarapa iwi
Senior citizens
Service users
Community organisations
SOUTH WAIRARAPA DISTRICT COUNCIL‟S LONG TERM PLAN 2015/2025
PART 5: OUR FUTURE 171
Our Community Likes
Weather/Climate
Country living
Not confined (space per person/free & open)
Moving ahead
Hub of events
Proximity to Wellington
Lots to do
Beautiful
Impact of the wine industry
Well maintained roads
Attractive tidy towns and rural areas
Martinborough Square
Good public toilets
Sportsgrounds, playgrounds, libraries
Enforcement of tree trimming
Accessible
Variety of sports
Transport network
Community values
Easy access to banks, doctors, supermarkets
etc.
Greytown bike trail
Dog parks
Small vibrant towns
Martinborough Square
Towns with a point of difference
Lake/Parks & reserves/rivers
Ecology
Coast/trees/bush/hills/rivers
Cycle friendly
Strong business groups
Summer reading program
Great events
Passive & active recreation
Nice/welcoming
Active people
Strong communities
Great for young families
Good people
Mix of people
Fabulous people
Our Community Would
Like
Following are the issues as identified by our
stakeholders. Not all the issues presented come
under Council‟s jurisdiction; however they are still
included for completeness.
Think district and regionally wide
Recognisable change
Aging population: growth projection required,
additional Council housing may be required in
the future
Correct ad-hoc subdivision development
Preserve areas of best land use: growth on to
high value land
Limited development in infrastructure
Economic development forum: look for
businesses to move into Featherston/South
Wairarapa
Big industry to Featherston, e.g. build sawmill
Target certain types of businesses to open in
South Wairarapa
Resource consent and building consent
processes easier: Streamline Council processes.
Ease of doing business with Council
Lack of buildings in South Wairarapa: how to
facilitate growth
Amenities in all three towns - loose spirit of
community if only one
Grow out of town owners or decrease out of
town owners
Working from home needs to be enabled –
broadband, business hubs
Look at sustainable sewerage and grey water
options for new builds
Ban 1080 poison: consider using the
unemployed to kill possums
Encourage utilisation of the district pools (some
are under utilised); pools are cold and have
limited opening hours
Encourage greater sports participation
On-line sport and recreation information for the
whole district
Card Reserve Development Plan
Combined Sports and Leisure Society
Accessible sports equipment
Full sized gym
SOUTH WAIRARAPA DISTRICT COUNCIL‟S LONG TERM PLAN 2015/2025
PART 5: OUR FUTURE 172
Indoor pool
Make South Wairarapa sports teams
competitive in Wairarapa/Wellington by
providing better sporting facilities i.e. heating
pools, creating turf‟s with lights, supporting
gyms (bigger)
More cycle (inc. BMX and mountain) and
walking tracks
Sailing and archery clubs
Feasibility study on current facilities
Camping growth
Provide a greater variety of recreation including
passive
Cater to the rural population as well as town.
Work with GWRC to provide better public
transport options
Have a dedicated Council employee for leisure
Centralisation of facilities
Investigate why facilities under-utilised and
correct
Lack of awareness of district facilities
Promote facilities on Council website
Continue water quality improvements
Continue waste water improvements
Water races need improving
Amalgamation concerns: District issues may
get overlooked but savings may be made
Subdivisions: Impacts on current owners,
buyers must be aware they are buying into a
rural area
Promote/protect primary industry
Road quality (width, height, loose metal etc)
not suitable for today‟s conditions and traffic
volumes
Impact of new activities on traffic volumes
Provide greater visibility to how the rates are
split between outputs in plans and reports
High impact of urban “outputs” on rural sector
Farming wind constrained by network capacity:
What is District Council‟s role in promoting this?
Council to lobby for rural broadband in the
district
Review contract verse in house
Footpath extensions and maintenance
More road signs
Road edging, parking and footpath
Seal extensions South Featherston School
addressed
More jobs for youth
Youth after school and weekend.
activities/events (music/triathlon/pool BBQ)
Enhance Featherston Main Street
Fix rubbish day
Libraries open between Christmas and new
year
Digitised building files
Wairarapa wide interpretation of regulations
On-line consents (not post)
Historical trees common name included
Irrigate Martinborough Square to maintain
purpose
Review Wairarapa District Plan – subdivisions,
signage, heritage trees and buildings etc
Control weeds and broom
Improve access to Wairarapa Moana
Link change to community outcomes
Combined Business Association
Consider how we can assist with improved air
travel
Adapt for technology
SOUTH WAIRARAPA DISTRICT COUNCIL‟S LONG TERM PLAN 2015/2025
PART 5: OUR FUTURE 173
Promoting Our District
Following are ideas our stakeholders have given us
about promoting our district. Currently promotion
of the district is undertaken by Destination
Wairarapa on our behalf.
Promote existing attractions
Ensure Destination Wairarapa provides a value
for money service
Liaise with business sector regarding correct
promoting of Wairarapa brands
Piggyback promotion on already scheduled
events
Ensure a collective South Wairarapa promotions
approach
Understand current economic climate and
funding pressures on businesses
Develop strategic partnerships
Creation/promotion of more events
Promotion of Wellington as a resource
Lack of community volunteers for sporting
administration
Community has lost the „bring a plate‟ thinking
Promote the distinct town
Promote South Wairarapa as a place to live
because of easy access to Wellington, low cost
of living
Promote/protect primary industry
Promotion of Wairarapa Moana
Target cruise ship visitors
How our District Looks in
the Future (30+ years)
A more prosperous South Wairarapa
Young people want to stay in the south
Greytown Trust Lands Trust remains
South Wairarapa is achieving environmental
excellence
Our district has clean rivers and high water
quality
South Wairarapa town centres are excellent
South Wairarapa towns have free Wi-Fi
Nga Haerenga – New Zealand Cycle Trail is
operational
Council infrastructure and facilities are well
maintained and improved over time and better
utilised
State Highways through our district are well
maintained and new bridges have been built on
State Highway 2 and State Highway 53
District libraries are networked with other NZ
libraries
Community activity where people can
participate is greater than infrastructure
The district has a sport and leisure coordinator
There is centralised administration and
promotion of sports clubs and activities
There is open and good communication
between sports groups and the community
about what‟s available
„Learn to Swim‟ lessons are available at our
pools
More lifestyle blocks are created encouraging
families to move to our district
South Wairarapa Council has a district wide
focus (as opposed to towns only)
Youth are encouraged to participate in
decisions of local government
A good and reliable network of public transport
is available around the wider region
A community feel is maintained in our district
even with growth and potential local
government changes
Our towns retain their individual facilities
Sports and other clubs are well supported and
have the required resources
Services and clubs of Featherston are
centralised to Card Reserve
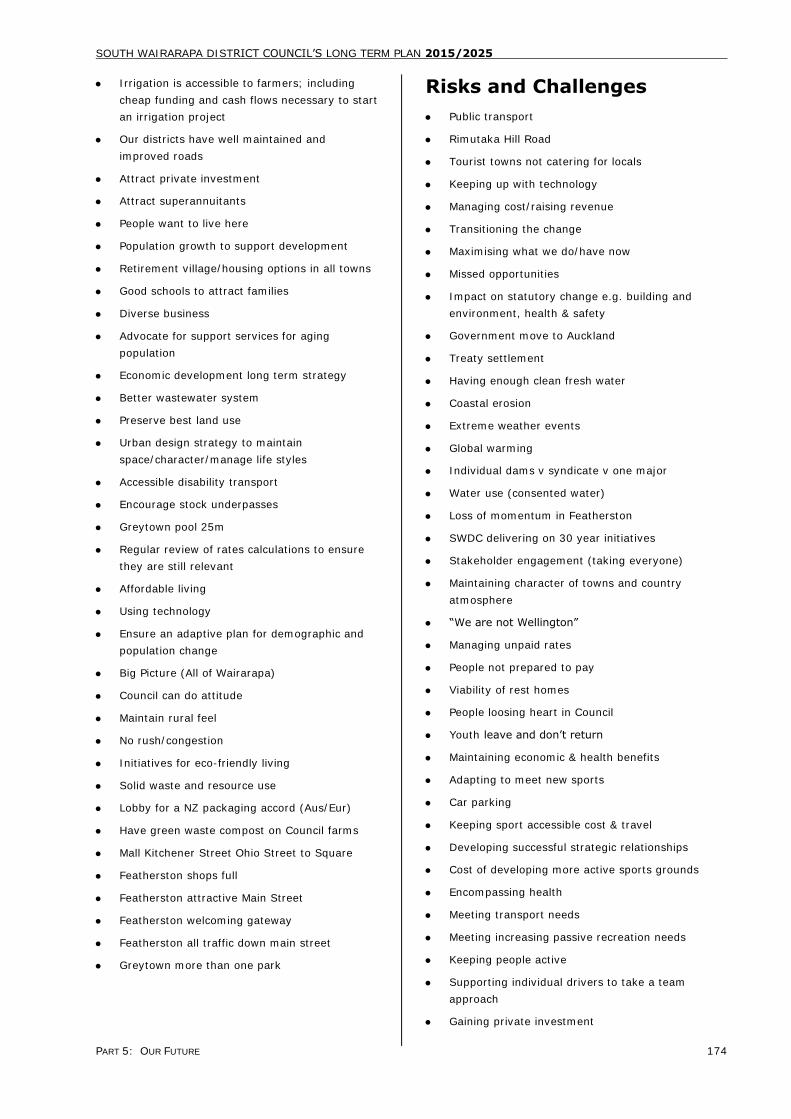
SOUTH WAIRARAPA DISTRICT COUNCIL‟S LONG TERM PLAN 2015/2025
PART 5: OUR FUTURE 174
Irrigation is accessible to farmers; including
cheap funding and cash flows necessary to start
an irrigation project
Our districts have well maintained and
improved roads
Attract private investment
Attract superannuitants
People want to live here
Population growth to support development
Retirement village/housing options in all towns
Good schools to attract families
Diverse business
Advocate for support services for aging
population
Economic development long term strategy
Better wastewater system
Preserve best land use
Urban design strategy to maintain
space/character/manage life styles
Accessible disability transport
Encourage stock underpasses
Greytown pool 25m
Regular review of rates calculations to ensure
they are still relevant
Affordable living
Using technology
Ensure an adaptive plan for demographic and
population change
Big Picture (All of Wairarapa)
Council can do attitude
Maintain rural feel
No rush/congestion
Initiatives for eco-friendly living
Solid waste and resource use
Lobby for a NZ packaging accord (Aus/Eur)
Have green waste compost on Council farms
Mall Kitchener Street Ohio Street to Square
Featherston shops full
Featherston attractive Main Street
Featherston welcoming gateway
Featherston all traffic down main street
Greytown more than one park
Risks and Challenges
Public transport
Rimutaka Hill Road
Tourist towns not catering for locals
Keeping up with technology
Managing cost/raising revenue
Transitioning the change
Maximising what we do/have now
Missed opportunities
Impact on statutory change e.g. building and
environment, health & safety
Government move to Auckland
Treaty settlement
Having enough clean fresh water
Coastal erosion
Extreme weather events
Global warming
Individual dams v syndicate v one major
Water use (consented water)
Loss of momentum in Featherston
SWDC delivering on 30 year initiatives
Stakeholder engagement (taking everyone)
Maintaining character of towns and country
atmosphere
“We are not Wellington”
Managing unpaid rates
People not prepared to pay
Viability of rest homes
People loosing heart in Council
Youth leave and don‟t return
Maintaining economic & health benefits
Adapting to meet new sports
Car parking
Keeping sport accessible cost & travel
Developing successful strategic relationships
Cost of developing more active sports grounds
Encompassing health
Meeting transport needs
Meeting increasing passive recreation needs
Keeping people active
Supporting individual drivers to take a team
approach
Gaining private investment
SOUTH WAIRARAPA DISTRICT COUNCIL‟S LONG TERM PLAN 2015/2025
PART 5: OUR FUTURE 175
Lack of sport/recreation volunteers
Supporting local schools esp. Kuranui
Earthquake prone buildings
GWRC flood mapping
Cell phone reception
Technology life
Uneconomic services due to population
Pest control
Ensuring more efficiency
Lack of buildings to facilitate growth
Broadband – Hinakura/Whiterock
Lack of employment opportunities
#‟s not economies get the money
Part 6Appendices
Appendices
2015-16 Schedule of Fees and Charges
Elected Member Contacts
Non-elected Member Contacts
Council Directory
Glossary
SOUTH WAIRARAPA
DISTRICT COUNCIL


SOUTH WAIRARAPA DISTRICT COUNCIL’S LONG TERM PLAN 2015/2025
PART 6: APPENDICES 176
APPENDICES
2015/2016 SCHEDULE OF FEES
AND CHARGES
Fees shown are inclusive of GST.
COMMUNITY SERVICES FEES
$
Council Office Opening Hours
Monday to Friday 8:00am-4.30pm
Rubbish Bags (bundle of 10) 8.00
Photocopying:
Black and white (per copy)
Single sided A4 .30c
Single sided A3 .50c
Double sided A4 .40c
Double sided A3 .60c
Photocopying:
Colour (per copy)
Single sided A4 3.00 Single sided A3 5.00
Double sided A4 4.00
Double sided A3 6.00
Street Index – with rates 127.00
Photocopy plans etc:
Time involved to retrieve and/or photocopy plans
(per 10 minutes)
10.00
Any other services not covered elsewhere (per
hr)
75.00
LIBRARY/SERVICE CENTRES FEES
$
Featherston
Opening Hours
Monday to Friday 9.30am-5pm
Saturday 10am-12pm
Greytown
Opening Hours
Monday to Friday 9.30am-5pm
Saturday 10am-12pm
Martinborough
Opening Hours
Monday to Friday 9.30am-5pm
Saturday 10am-12pm
Rental Books .50c
Magazines No Charge
Premium Magazine Range .50c
Music CD’s 2.00
Reservation of Books .50c
Replacement Cards (Lost) 2.00
Theft or Worn Out No Charge
Inter-loan Items: Books 5.00
Audio Books 2.00
Book Covering: Paperback 50c
Hardback 1.00
Large 2.00
Internet No charge
Printouts (per page) 20c
DVD/Video Hire (one week) 2.00
Laminating A3
A4
3.00
2.00
Fax Service: Per page 50c
Australia per page 2.00
Rest of World per page 5.00
POOLS FEES
$
Featherston
Opening Hours During School Term
Monday – Friday 2pm - 5:15pm
Saturday - Sunday 1pm - 5.30pm
Opening Hours During School & Public Holidays:
Everyday 1pm - 5.15pm
Greytown
Opening Hours During School Term Monday – Friday 2pm - 5:30pm
Saturday - Sunday 11am - 5.30pm
Opening Hours During School & Public Holidays:
Everyday 11am - 5.30pm
Martinborough
Opening Hours During School Term
Monday – Friday 2pm - 5:30pm
Saturday - Sunday 1pm - 5.30pm
Opening Hours During School & Public Holidays:
Everyday 1pm - 5.30pm
Charges (All towns)
Adults 3.00
College Students 2.00
Children 12 yrs and under 2.00
Adults accompanying children under 8yrs and not
swimming
No Charge
10 Swim Tickets (Adult) 15.00
10 Swim Tickets (Child) 10.00
COMMUNITY BUILDINGS FEES
$
Fees and Charges – All venues (in addition to hire
charges)
Deposit (required to confirm booking) 204.00
Bond if alcohol to be served 300.00
Cleaning fee per hour (if required)
- Small & medium venues min 1 hr, large
venues min 2 hrs
35.00
Custodian Call-out – per hour (if required) 25.00
Access to Kitchen Facilities 20.00
Refreshment Service – Setting out/cleaning up 51.00
SMALL VENUES
ANZAC HALL COMMITTEE ROOM
GREYTOWN UPSTAIRS ROOMS MARTINBOROUGH COUNCIL CHAMBERS
FEES
$
Schools or Free Admission to General Public
Weekday (morning or afternoon) 25.00
Monday to Friday – full day or part morning /
part afternoon
50.00
Monday to Thursday evening 25.00
Friday evening, Saturday, Sunday, Public Holidays
75.00
Private Use or Admission Charged
Weekday (morning or afternoon) 30.00
Monday to Friday – full day or part morning / part afternoon
60.00
Monday to Thursday evening 30.00
Friday evening, Saturday, Sunday, Public
Holidays
120.00
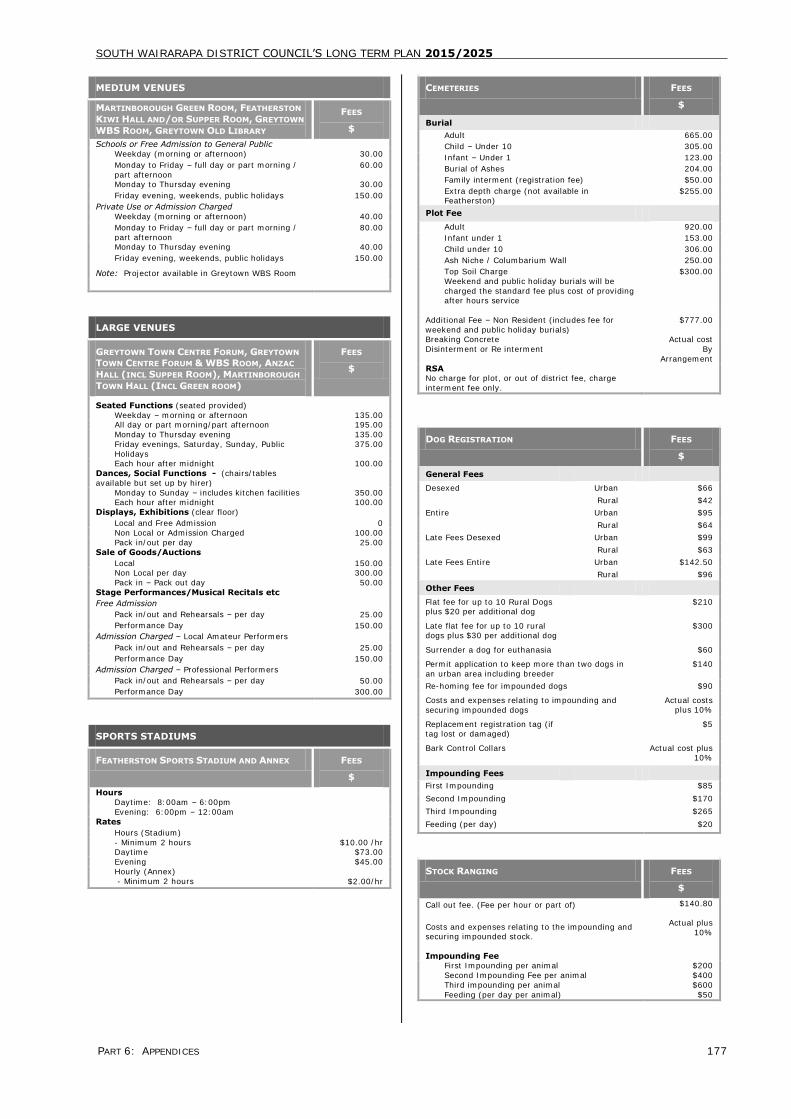
SOUTH WAIRARAPA DISTRICT COUNCIL’S LONG TERM PLAN 2015/2025
PART 6: APPENDICES 177
MEDIUM VENUES
MARTINBOROUGH GREEN ROOM, FEATHERSTON
KIWI HALL AND/OR SUPPER ROOM, GREYTOWN
WBS ROOM, GREYTOWN OLD LIBRARY
FEES
$
Schools or Free Admission to General Public
Weekday (morning or afternoon) 30.00
Monday to Friday – full day or part morning /
part afternoon
60.00
Monday to Thursday evening 30.00
Friday evening, weekends, public holidays 150.00
Private Use or Admission Charged
Weekday (morning or afternoon) 40.00
Monday to Friday – full day or part morning /
part afternoon
80.00
Monday to Thursday evening 40.00
Friday evening, weekends, public holidays 150.00
Note: Projector available in Greytown WBS Room
LARGE VENUES
GREYTOWN TOWN CENTRE FORUM, GREYTOWN
TOWN CENTRE FORUM & WBS ROOM, ANZAC
HALL (INCL SUPPER ROOM), MARTINBOROUGH
TOWN HALL (INCL GREEN ROOM)
FEES
$
Seated Functions (seated provided)
Weekday – morning or afternoon 135.00 All day or part morning/part afternoon 195.00
Monday to Thursday evening 135.00
Friday evenings, Saturday, Sunday, Public
Holidays
375.00
Each hour after midnight 100.00
Dances, Social Functions - (chairs/tables
available but set up by hirer)
Monday to Sunday – includes kitchen facilities 350.00 Each hour after midnight 100.00
Displays, Exhibitions (clear floor)
Local and Free Admission 0
Non Local or Admission Charged 100.00
Pack in/out per day 25.00
Sale of Goods/Auctions
Local 150.00 Non Local per day 300.00
Pack in – Pack out day 50.00
Stage Performances/Musical Recitals etc
Free Admission
Pack in/out and Rehearsals – per day 25.00
Performance Day 150.00
Admission Charged – Local Amateur Performers
Pack in/out and Rehearsals – per day 25.00
Performance Day 150.00
Admission Charged – Professional Performers
Pack in/out and Rehearsals – per day 50.00
Performance Day 300.00
SPORTS STADIUMS
FEATHERSTON SPORTS STADIUM AND ANNEX FEES
$
Hours
Daytime: 8:00am – 6:00pm
Evening: 6:00pm – 12:00am
Rates
Hours (Stadium)
- Minimum 2 hours $10.00 /hr Daytime $73.00
Evening $45.00
Hourly (Annex)
- Minimum 2 hours $2.00/hr
CEMETERIES FEES
$
Burial
Adult 665.00
Child – Under 10 305.00
Infant – Under 1 123.00
Burial of Ashes 204.00
Family interment (registration fee) $50.00
Extra depth charge (not available in Featherston)
$255.00
Plot Fee
Adult 920.00
Infant under 1 153.00
Child under 10 306.00
Ash Niche / Columbarium Wall 250.00
Top Soil Charge $300.00
Weekend and public holiday burials will be
charged the standard fee plus cost of providing after hours service
Additional Fee – Non Resident (includes fee for
weekend and public holiday burials)
$777.00
Breaking Concrete Actual cost
Disinterment or Re interment By
Arrangement
RSA No charge for plot, or out of district fee, charge
interment fee only.
DOG REGISTRATION FEES
$
General Fees
Desexed Urban $66
Rural $42
Entire Urban $95
Rural $64
Late Fees Desexed Urban $99
Rural $63
Late Fees Entire Urban $142.50
Rural $96
Other Fees
Flat fee for up to 10 Rural Dogs plus $20 per additional dog
$210
Late flat fee for up to 10 rural dogs plus $30 per additional dog
$300
Surrender a dog for euthanasia $60
Permit application to keep more than two dogs in
an urban area including breeder
$140
Re-homing fee for impounded dogs $90
Costs and expenses relating to impounding and
securing impounded dogs
Actual costs plus 10%
Replacement registration tag (if tag lost or damaged)
$5
Bark Control Collars Actual cost plus 10%
Impounding Fees
First Impounding $85
Second Impounding $170
Third Impounding $265
Feeding (per day) $20
STOCK RANGING FEES
$
Call out fee. (Fee per hour or part of)
Costs and expenses relating to the impounding and securing impounded stock.
Impounding Fee
$140.80
Actual plus
10%
First Impounding per animal $200
Second Impounding Fee per animal
Third impounding per animal
Feeding (per day per animal)
$400
$600
$50

SOUTH WAIRARAPA DISTRICT COUNCIL’S LONG TERM PLAN 2015/2025
PART 6: APPENDICES 178
HEALTH LICENSING FEES
$
Note: Food premises operating under an approved
Food Control Plan and will be charged according to
the food hygiene registration fees until new
regulations come into effect.
New Food Premises 255.00
Annual Registration of Food Premises 250.00
Minor Food Processing (limited sale) 125.00
Inspection Fee 140.00
Camping Ground (per annum) 150.00
Hairdressers Registration (per annum) 250.00
Offensive Trade Registration (per annum) 250.00
Hawkers licence (per annum) 150.00
Mobile shop licence – involving food per annum 150.00
Transfer of registration 130.00
Itinerant trader per annum 240.00
Street stall – large 150.00
Street stall – small 20.00
Food stall (Minimum) 150.00
Registration of event 150.00
Amusement gallery (per annum) 150.00
Amusement Devices – for one device, for the first seven days of proposed operation or part thereof
11.50
Additional Device – first week (or part week) 2.30
Additional Weeks (or part week) per device 1.15
Noise Control
Noise control charges (seizure) - per callout to property
350.00
Return of seized equipment –administration and
return fee per property, PLUS
100.00
Burglar alarm disconnection (if required)
Electrician/
Service Callout charges plus
10%
Bylaws
Advertising Sign permit
Hoarding permit
Abandoned vehicles removal and disposal
Long grass removal
Removal of over-hanging vegetation public places
150.00
150.00
Actual + 10%
Actual + 10%
Actual + 10%
Gambling
Venue and gaming machine per consent $350
LIQUOR LICENSING FEES
$
Licence Applications
Managers Certificates
Refer to the Sale and Supply of Alcohol Act 2012
As per Act
As per Act
RESOURCE MANAGEMENT FEES
$
Non-Notified Land Use
Controlled 550.00
Restricted discretionary-minor 350.00
Restricted discretionary-other 650.00
Discretionary 750.00
Non-complying 1,530.00
Limited Notified Land Use
Controlled 765.00
Restricted discretionary 765.00
Discretionary 1,071.00
Non-complying 1,887.00
Non-Notified Subdivision
Controlled 800.00
Restricted discretionary 900.00
Discretionary 1,000.00
Non-complying 1,730.00
Limited Notified Subdivision
Controlled 1,000.00
RESOURCE MANAGEMENT FEES
$
Restricted discretionary 1,100.00
Discretionary 1,200.00
Non-complying 2,000.00
Publicly Notified
Controlled 1,122.00
Restricted discretionary 1,122.00
Discretionary 1,428.00
Non-complying 2,244.00
Plan Change and Resource Consents
All fees are a deposit only. Where the costs for processing an application exceed the fee deposit,
the additional cost will be payable.
Staff time (per hour) 96.00
Plan change 5,500.00
Additional Charges
Site Inspection
Pre-hearing
140.80
510.00
Hearing 1,200.00
Hourly Rate above deposit 96.00
External consultancy Actual cost
+ 10%
Heritage Items (including notable trees)
*Fees will not be charged for applications relating
to
a)modifying or removing trees listed in appendix 1.4 (Notable trees) of the Wairarapa Combined
district plan.
b) additions and alterations to buildings listed at
Appendix 1.7 (Heritage items) of the Combined District Plan
c) located within a Historic Heritage Precinct
Appendix 1.8 of the District Plan.
This only applies where no other aspect of the
proposal requires resource consent; e.g. a yard encroachment.
No charge to
applicant
Certification
223 Certificate
224 Certificate
255.00
320.00
S226 Certificate
S243 Approval
S348 of LGA approvals
Certificate of Compliance
Planning Certificate (SSOA)
Request to vary condition of consent
Objection to condition of consent
320.00
320.00
320.00
320.00
320.00
350.00
350.00
LIM – Urgent (5 working days) includes GST 450.00
LIM – Standard (10 working days), includes GST 250.00
Certification of Title Searches includes GST 25.00
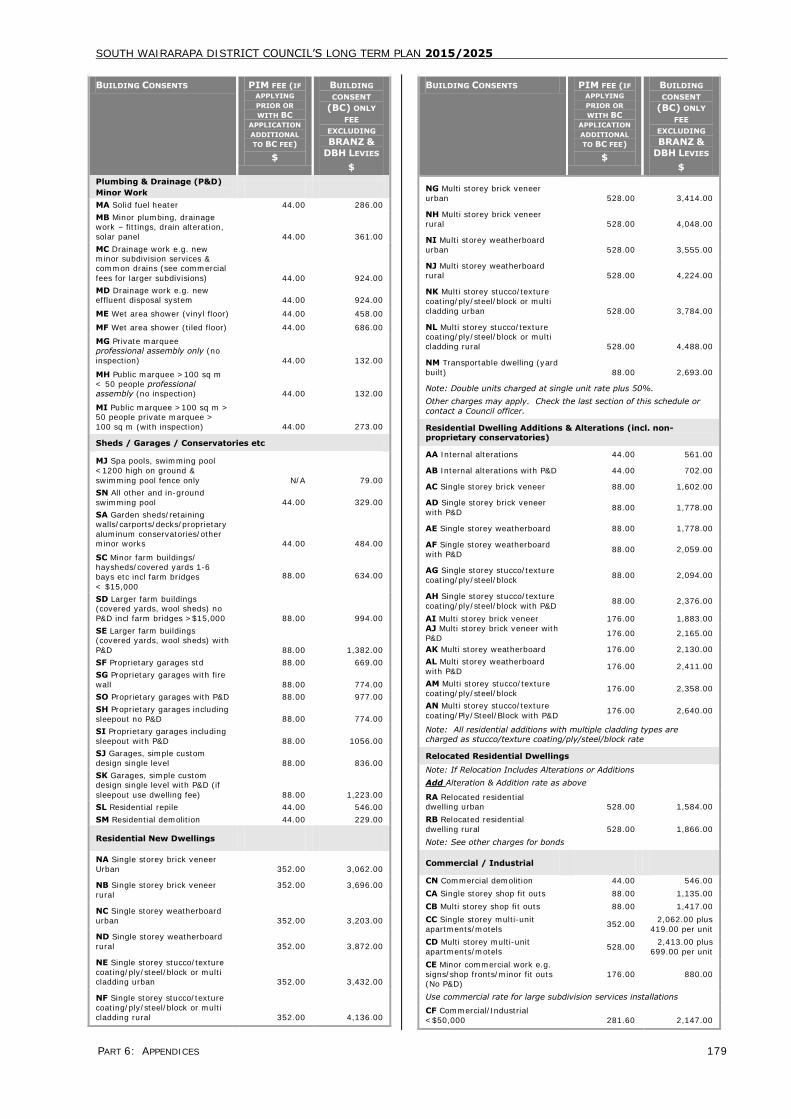
SOUTH WAIRARAPA DISTRICT COUNCIL’S LONG TERM PLAN 2015/2025
PART 6: APPENDICES 179
BUILDING CONSENTS PIM FEE (IF
APPLYING
PRIOR OR
WITH BC
APPLICATION
ADDITIONAL
TO BC FEE)
$
BUILDING
CONSENT
(BC) ONLY
FEE
EXCLUDING
BRANZ &
DBH LEVIES
$
Plumbing & Drainage (P&D)
Minor Work
MA Solid fuel heater 44.00 286.00
MB Minor plumbing, drainage work – fittings, drain alteration,
solar panel 44.00 361.00
MC Drainage work e.g. new minor subdivision services & common drains (see commercial
fees for larger subdivisions) 44.00 924.00
MD Drainage work e.g. new effluent disposal system 44.00 924.00
ME Wet area shower (vinyl floor) 44.00 458.00
MF Wet area shower (tiled floor) 44.00 686.00
MG Private marquee professional assembly only (no
inspection) 44.00 132.00
MH Public marquee >100 sq m < 50 people professional assembly (no inspection) 44.00 132.00
MI Public marquee >100 sq m > 50 people private marquee >
100 sq m (with inspection) 44.00 273.00
Sheds / Garages / Conservatories etc
MJ Spa pools, swimming pool
<1200 high on ground &
swimming pool fence only N/A 79.00
SN All other and in-ground
swimming pool 44.00 329.00
SA Garden sheds/retaining walls/carports/decks/proprietary
aluminum conservatories/other minor works 44.00 484.00
SC Minor farm buildings/ haysheds/covered yards 1-6
bays etc incl farm bridges
< $15,000
88.00
634.00
SD Larger farm buildings (covered yards, wool sheds) no
P&D incl farm bridges >$15,000
88.00
994.00
SE Larger farm buildings (covered yards, wool sheds) with
P&D 88.00 1,382.00
SF Proprietary garages std 88.00 669.00
SG Proprietary garages with fire
wall 88.00 774.00
SO Proprietary garages with P&D 88.00 977.00
SH Proprietary garages including
sleepout no P&D 88.00 774.00
SI Proprietary garages including
sleepout with P&D 88.00 1056.00
SJ Garages, simple custom
design single level 88.00 836.00
SK Garages, simple custom design single level with P&D (if
sleepout use dwelling fee) 88.00 1,223.00
SL Residential repile 44.00 546.00
SM Residential demolition 44.00 229.00
Residential New Dwellings
NA Single storey brick veneer
Urban 352.00 3,062.00
NB Single storey brick veneer
rural
352.00 3,696.00
NC Single storey weatherboard
urban 352.00 3,203.00
ND Single storey weatherboard
rural 352.00 3,872.00
NE Single storey stucco/texture
coating/ply/steel/block or multi cladding urban 352.00 3,432.00
NF Single storey stucco/texture
coating/ply/steel/block or multi
cladding rural 352.00 4,136.00
BUILDING CONSENTS PIM FEE (IF
APPLYING
PRIOR OR
WITH BC
APPLICATION
ADDITIONAL
TO BC FEE)
$
BUILDING
CONSENT
(BC) ONLY
FEE
EXCLUDING
BRANZ &
DBH LEVIES
$
NG Multi storey brick veneer
urban
528.00
3,414.00
NH Multi storey brick veneer rural 528.00 4,048.00
NI Multi storey weatherboard
urban 528.00 3,555.00
NJ Multi storey weatherboard rural 528.00 4,224.00
NK Multi storey stucco/texture
coating/ply/steel/block or multi
cladding urban 528.00 3,784.00
NL Multi storey stucco/texture coating/ply/steel/block or multi
cladding rural 528.00 4,488.00
NM Transportable dwelling (yard
built) 88.00 2,693.00
Note: Double units charged at single unit rate plus 50%.
Other charges may apply. Check the last section of this schedule or
contact a Council officer.
Residential Dwelling Additions & Alterations (incl. non-proprietary conservatories)
AA Internal alterations 44.00 561.00
AB Internal alterations with P&D 44.00 702.00
AC Single storey brick veneer 88.00 1,602.00
AD Single storey brick veneer
with P&D 88.00 1,778.00
AE Single storey weatherboard 88.00 1,778.00
AF Single storey weatherboard
with P&D 88.00 2,059.00
AG Single storey stucco/texture
coating/ply/steel/block 88.00 2,094.00
AH Single storey stucco/texture
coating/ply/steel/block with P&D 88.00 2,376.00
AI Multi storey brick veneer 176.00 1,883.00
AJ Multi storey brick veneer with
P&D 176.00 2,165.00
AK Multi storey weatherboard 176.00 2,130.00
AL Multi storey weatherboard
with P&D 176.00 2,411.00
AM Multi storey stucco/texture
coating/ply/steel/block 176.00 2,358.00
AN Multi storey stucco/texture
coating/Ply/Steel/Block with P&D 176.00 2,640.00
Note: All residential additions with multiple cladding types are charged as stucco/texture coating/ply/steel/block rate
Relocated Residential Dwellings
Note: If Relocation Includes Alterations or Additions
Add Alteration & Addition rate as above
RA Relocated residential dwelling urban 528.00 1,584.00
RB Relocated residential
dwelling rural 528.00 1,866.00
Note: See other charges for bonds
Commercial / Industrial
CN Commercial demolition 44.00 546.00
CA Single storey shop fit outs 88.00 1,135.00
CB Multi storey shop fit outs 88.00 1,417.00
CC Single storey multi-unit
apartments/motels 352.00
2,062.00 plus
419.00 per unit
CD Multi storey multi-unit
apartments/motels 528.00
2,413.00 plus
699.00 per unit
CE Minor commercial work e.g.
signs/shop fronts/minor fit outs (No P&D)
176.00 880.00
Use commercial rate for large subdivision services installations
CF Commercial/Industrial
<$50,000 281.60 2,147.00
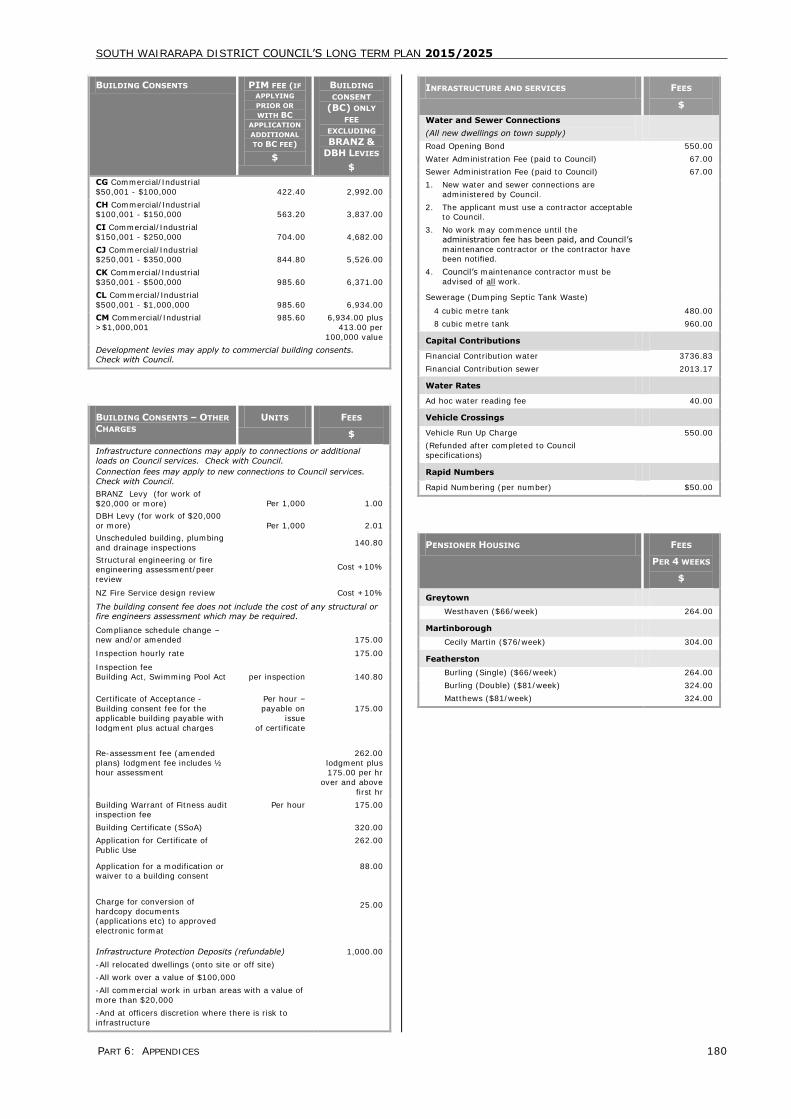
SOUTH WAIRARAPA DISTRICT COUNCIL’S LONG TERM PLAN 2015/2025
PART 6: APPENDICES 180
BUILDING CONSENTS PIM FEE (IF
APPLYING
PRIOR OR
WITH BC
APPLICATION
ADDITIONAL
TO BC FEE)
$
BUILDING
CONSENT
(BC) ONLY
FEE
EXCLUDING
BRANZ &
DBH LEVIES
$
CG Commercial/Industrial
$50,001 - $100,000 422.40 2,992.00
CH Commercial/Industrial $100,001 - $150,000 563.20 3,837.00
CI Commercial/Industrial
$150,001 - $250,000 704.00 4,682.00
CJ Commercial/Industrial $250,001 - $350,000 844.80 5,526.00
CK Commercial/Industrial
$350,001 - $500,000 985.60 6,371.00
CL Commercial/Industrial
$500,001 - $1,000,000 985.60 6,934.00
CM Commercial/Industrial
>$1,000,001
985.60 6,934.00 plus
413.00 per
100,000 value
Development levies may apply to commercial building consents. Check with Council.
BUILDING CONSENTS – OTHER
CHARGES
UNITS FEES
$
Infrastructure connections may apply to connections or additional
loads on Council services. Check with Council.
Connection fees may apply to new connections to Council services.
Check with Council.
BRANZ Levy (for work of
$20,000 or more) Per 1,000 1.00
DBH Levy (for work of $20,000
or more) Per 1,000 2.01
Unscheduled building, plumbing
and drainage inspections 140.80
Structural engineering or fire engineering assessment/peer
review
Cost +10%
NZ Fire Service design review Cost +10%
The building consent fee does not include the cost of any structural or fire engineers assessment which may be required.
Compliance schedule change – new and/or amended 175.00
Inspection hourly rate 175.00
Inspection fee Building Act, Swimming Pool Act per inspection 140.80
Certificate of Acceptance -
Building consent fee for the
applicable building payable with
lodgment plus actual charges
Per hour –
payable on
issue
of certificate
175.00
Re-assessment fee (amended
plans) lodgment fee includes ½ hour assessment
262.00
lodgment plus 175.00 per hr
over and above
first hr
Building Warrant of Fitness audit inspection fee
Per hour 175.00
Building Certificate (SSoA)
Application for Certificate of
Public Use
320.00
262.00
Application for a modification or waiver to a building consent
Charge for conversion of
hardcopy documents (applications etc) to approved
electronic format
88.00
25.00
Infrastructure Protection Deposits (refundable)
-All relocated dwellings (onto site or off site)
-All work over a value of $100,000
-All commercial work in urban areas with a value of
more than $20,000
-And at officers discretion where there is risk to
infrastructure
1,000.00
INFRASTRUCTURE AND SERVICES FEES
$
Water and Sewer Connections
(All new dwellings on town supply)
Road Opening Bond 550.00
Water Administration Fee (paid to Council) 67.00
Sewer Administration Fee (paid to Council) 67.00
1. New water and sewer connections are
administered by Council.
2. The applicant must use a contractor acceptable to Council.
3. No work may commence until the
administration fee has been paid, and Council’s
maintenance contractor or the contractor have been notified.
4. Council’s maintenance contractor must be
advised of all work.
Sewerage (Dumping Septic Tank Waste)
4 cubic metre tank
8 cubic metre tank
480.00
960.00
Capital Contributions
Financial Contribution water
Financial Contribution sewer
3736.83
2013.17
Water Rates
Ad hoc water reading fee 40.00
Vehicle Crossings
Vehicle Run Up Charge 550.00
(Refunded after completed to Council
specifications)
Rapid Numbers
Rapid Numbering (per number) $50.00
PENSIONER HOUSING FEES
PER 4 WEEKS
$
Greytown
Westhaven ($66/week) 264.00
Martinborough
Cecily Martin ($76/week) 304.00
Featherston
Burling (Single) ($66/week) 264.00
Burling (Double) ($81/week) 324.00
Matthews ($81/week) 324.00
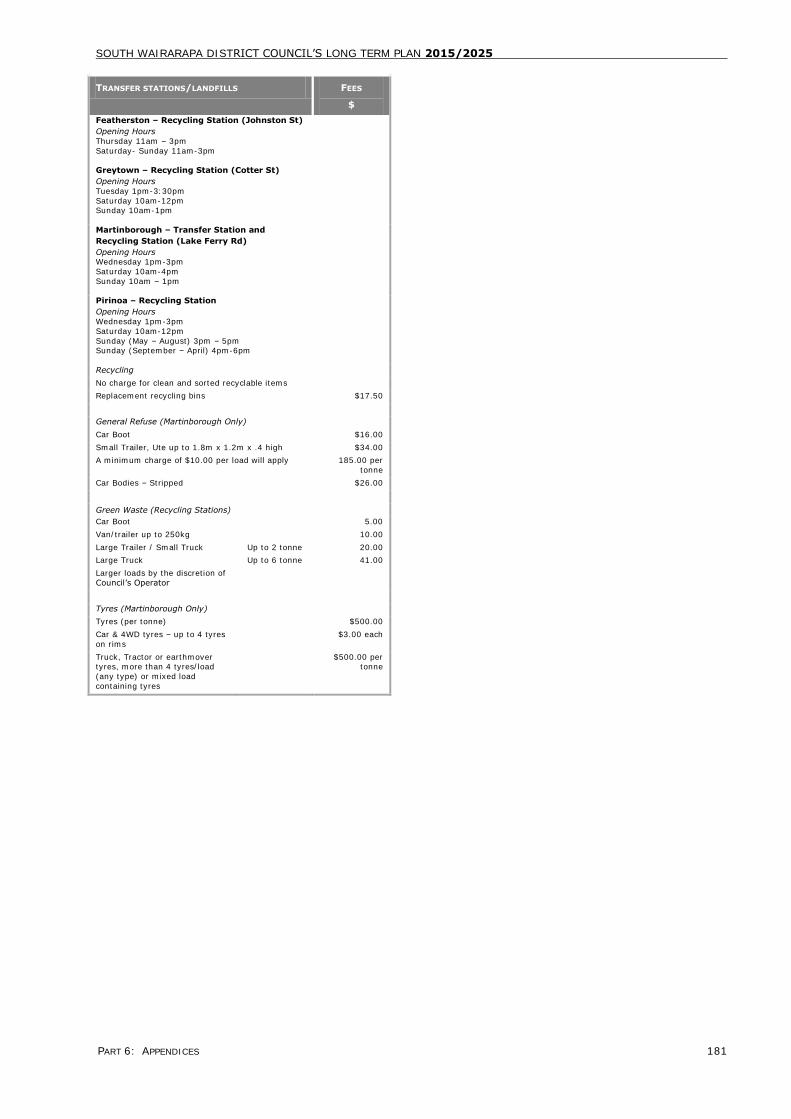
SOUTH WAIRARAPA DISTRICT COUNCIL’S LONG TERM PLAN 2015/2025
PART 6: APPENDICES 181
TRANSFER STATIONS/LANDFILLS FEES
$
Featherston – Recycling Station (Johnston St)
Opening Hours
Thursday 11am – 3pm
Saturday- Sunday 11am-3pm
Greytown – Recycling Station (Cotter St)
Opening Hours
Tuesday 1pm-3:30pm
Saturday 10am-12pm Sunday 10am-1pm
Martinborough – Transfer Station and
Recycling Station (Lake Ferry Rd)
Opening Hours Wednesday 1pm-3pm
Saturday 10am-4pm
Sunday 10am – 1pm
Pirinoa – Recycling Station
Opening Hours
Wednesday 1pm-3pm
Saturday 10am-12pm
Sunday (May – August) 3pm – 5pm Sunday (September – April) 4pm-6pm
Recycling
No charge for clean and sorted recyclable items
Replacement recycling bins $17.50
General Refuse (Martinborough Only)
Car Boot
$16.00
Small Trailer, Ute up to 1.8m x 1.2m x .4 high $34.00
A minimum charge of $10.00 per load will apply 185.00 per
tonne
Car Bodies – Stripped $26.00
Green Waste (Recycling Stations)
Car Boot 5.00
Van/trailer up to 250kg 10.00
Large Trailer / Small Truck Up to 2 tonne 20.00
Large Truck
Larger loads by the discretion of
Council’s Operator
Up to 6 tonne 41.00
Tyres (Martinborough Only)
Tyres (per tonne) $500.00
Car & 4WD tyres – up to 4 tyres
on rims
$3.00 each
Truck, Tractor or earthmover tyres, more than 4 tyres/load
(any type) or mixed load
containing tyres
$500.00 per tonne
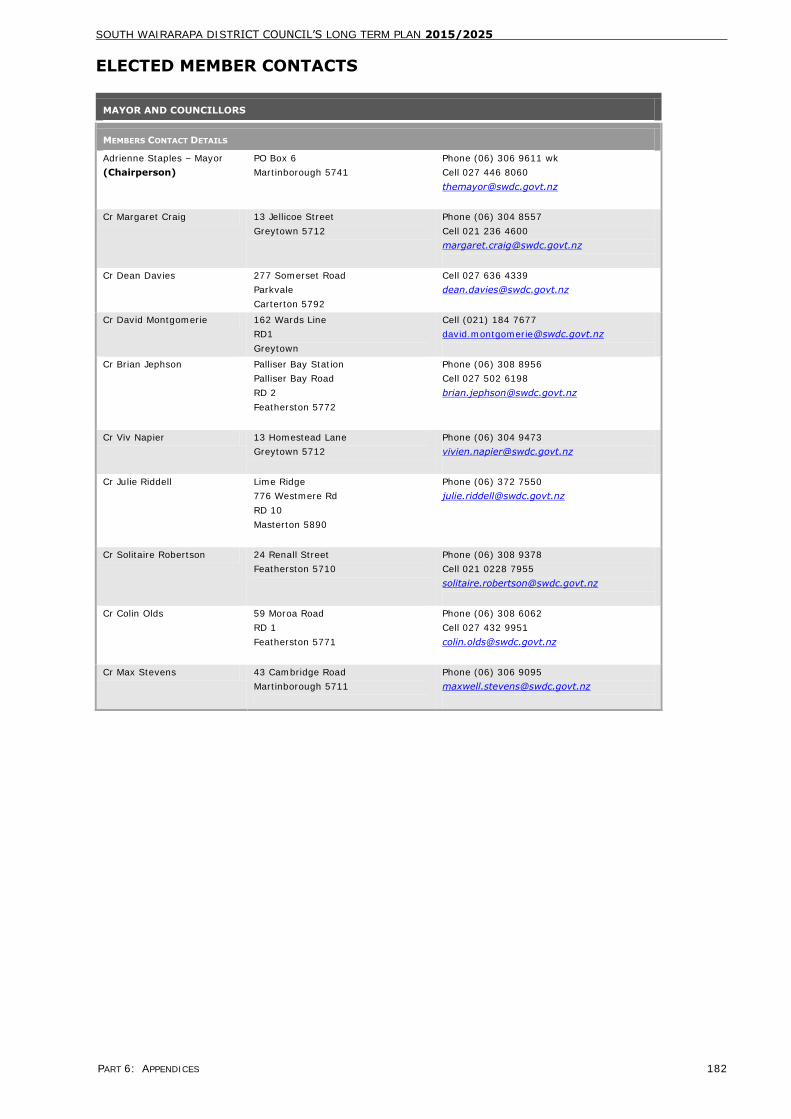
SOUTH WAIRARAPA DISTRICT COUNCIL’S LONG TERM PLAN 2015/2025
PART 6: APPENDICES 182
ELECTED MEMBER CONTACTS
MAYOR AND COUNCILLORS
MEMBERS CONTACT DETAILS
Adrienne Staples – Mayor
(Chairperson)
PO Box 6
Martinborough 5741
Phone (06) 306 9611 wk
Cell 027 446 8060
Cr Margaret Craig 13 Jellicoe Street
Greytown 5712
Phone (06) 304 8557
Cell 021 236 4600
Cr Dean Davies 277 Somerset Road
Parkvale
Carterton 5792
Cell 027 636 4339
Cr David Montgomerie 162 Wards Line
RD1
Greytown
Cell (021) 184 7677
Cr Brian Jephson Palliser Bay Station
Palliser Bay Road
RD 2
Featherston 5772
Phone (06) 308 8956
Cell 027 502 6198
Cr Viv Napier 13 Homestead Lane
Greytown 5712
Phone (06) 304 9473
Cr Julie Riddell Lime Ridge
776 Westmere Rd
RD 10
Masterton 5890
Phone (06) 372 7550
Cr Solitaire Robertson 24 Renall Street
Featherston 5710
Phone (06) 308 9378
Cell 021 0228 7955
Cr Colin Olds 59 Moroa Road
RD 1
Featherston 5771
Phone (06) 308 6062
Cell 027 432 9951
Cr Max Stevens 43 Cambridge Road
Martinborough 5711
Phone (06) 306 9095
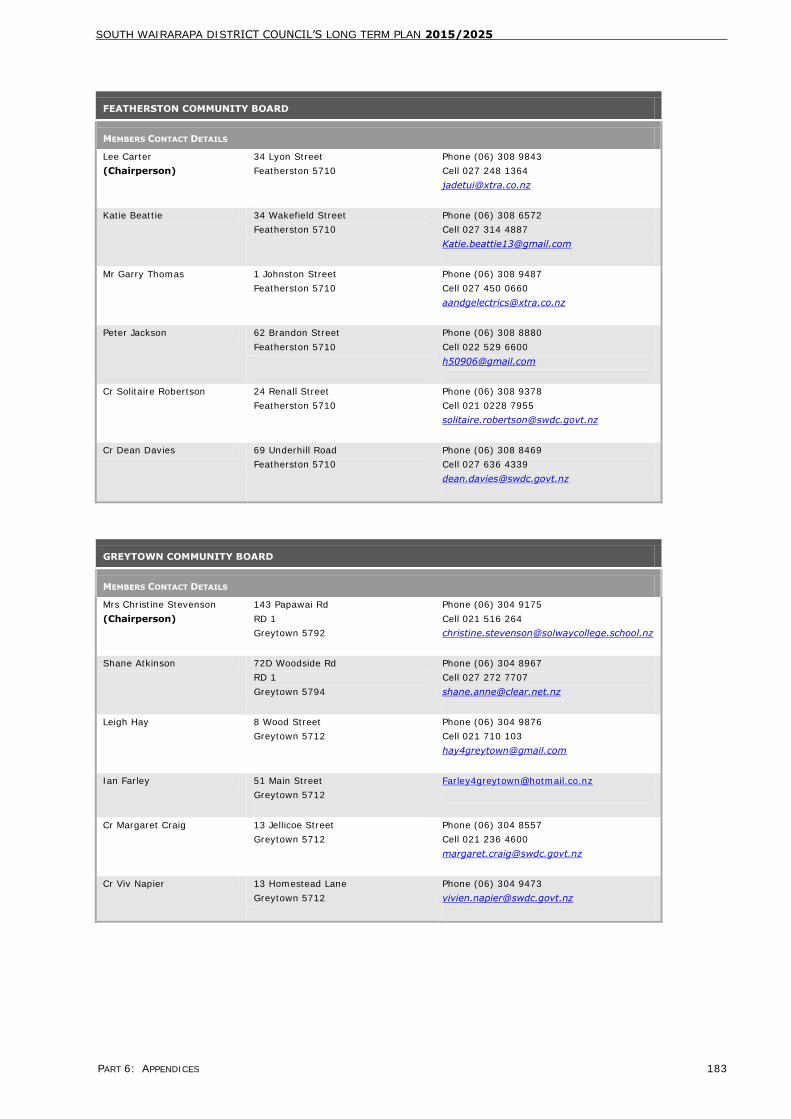
SOUTH WAIRARAPA DISTRICT COUNCIL’S LONG TERM PLAN 2015/2025
PART 6: APPENDICES 183
FEATHERSTON COMMUNITY BOARD
MEMBERS CONTACT DETAILS
Lee Carter
(Chairperson)
34 Lyon Street
Featherston 5710
Phone (06) 308 9843
Cell 027 248 1364
Katie Beattie 34 Wakefield Street
Featherston 5710
Phone (06) 308 6572
Cell 027 314 4887
Mr Garry Thomas
1 Johnston Street
Featherston 5710
Phone (06) 308 9487
Cell 027 450 0660
Peter Jackson 62 Brandon Street
Featherston 5710
Phone (06) 308 8880
Cell 022 529 6600
Cr Solitaire Robertson 24 Renall Street
Featherston 5710
Phone (06) 308 9378
Cell 021 0228 7955
Cr Dean Davies 69 Underhill Road
Featherston 5710
Phone (06) 308 8469
Cell 027 636 4339
GREYTOWN COMMUNITY BOARD
MEMBERS CONTACT DETAILS
Mrs Christine Stevenson
(Chairperson)
143 Papawai Rd
RD 1
Greytown 5792
Phone (06) 304 9175
Cell 021 516 264
Shane Atkinson 72D Woodside Rd
RD 1
Greytown 5794
Phone (06) 304 8967
Cell 027 272 7707
Leigh Hay 8 Wood Street
Greytown 5712
Phone (06) 304 9876
Cell 021 710 103
Ian Farley 51 Main Street
Greytown 5712
Cr Margaret Craig 13 Jellicoe Street
Greytown 5712
Phone (06) 304 8557
Cell 021 236 4600
Cr Viv Napier 13 Homestead Lane
Greytown 5712
Phone (06) 304 9473
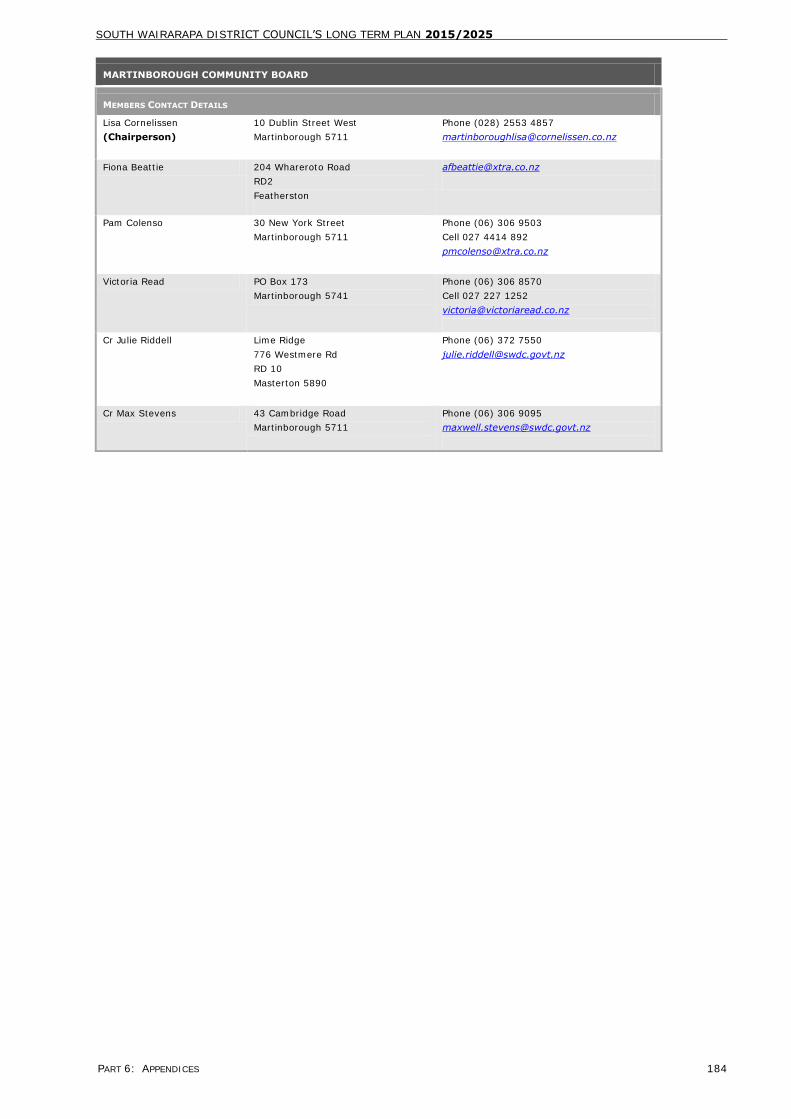
SOUTH WAIRARAPA DISTRICT COUNCIL’S LONG TERM PLAN 2015/2025
PART 6: APPENDICES 184
MARTINBOROUGH COMMUNITY BOARD
MEMBERS CONTACT DETAILS
Lisa Cornelissen
(Chairperson)
10 Dublin Street West
Martinborough 5711
Phone (028) 2553 4857
Fiona Beattie 204 Whareroto Road
RD2
Featherston
Pam Colenso
30 New York Street
Martinborough 5711
Phone (06) 306 9503
Cell 027 4414 892
Victoria Read PO Box 173
Martinborough 5741
Phone (06) 306 8570
Cell 027 227 1252
Cr Julie Riddell Lime Ridge
776 Westmere Rd
RD 10
Masterton 5890
Phone (06) 372 7550
Cr Max Stevens 43 Cambridge Road
Martinborough 5711
Phone (06) 306 9095
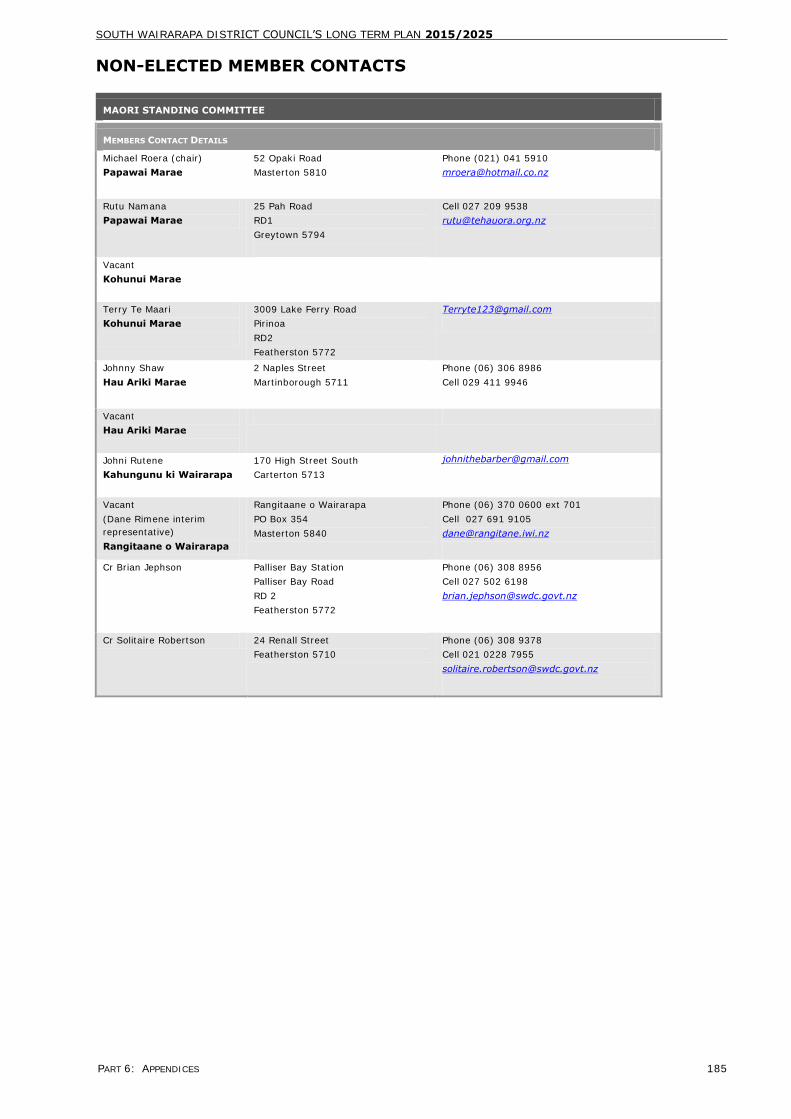
SOUTH WAIRARAPA DISTRICT COUNCIL’S LONG TERM PLAN 2015/2025
PART 6: APPENDICES 185
NON-ELECTED MEMBER CONTACTS
MAORI STANDING COMMITTEE
MEMBERS CONTACT DETAILS
Michael Roera (chair)
Papawai Marae
52 Opaki Road
Masterton 5810
Phone (021) 041 5910
Rutu Namana
Papawai Marae
25 Pah Road
RD1
Greytown 5794
Cell 027 209 9538
Vacant
Kohunui Marae
Terry Te Maari
Kohunui Marae
3009 Lake Ferry Road
Pirinoa
RD2
Featherston 5772
Johnny Shaw
Hau Ariki Marae
2 Naples Street
Martinborough 5711
Phone (06) 306 8986
Cell 029 411 9946
Vacant
Hau Ariki Marae
Johni Rutene
Kahungunu ki Wairarapa
170 High Street South
Carterton 5713
Vacant
(Dane Rimene interim
representative)
Rangitaane o Wairarapa
Rangitaane o Wairarapa
PO Box 354
Masterton 5840
Phone (06) 370 0600 ext 701
Cell 027 691 9105
Cr Brian Jephson Palliser Bay Station
Palliser Bay Road
RD 2
Featherston 5772
Phone (06) 308 8956
Cell 027 502 6198
Cr Solitaire Robertson 24 Renall Street
Featherston 5710
Phone (06) 308 9378
Cell 021 0228 7955
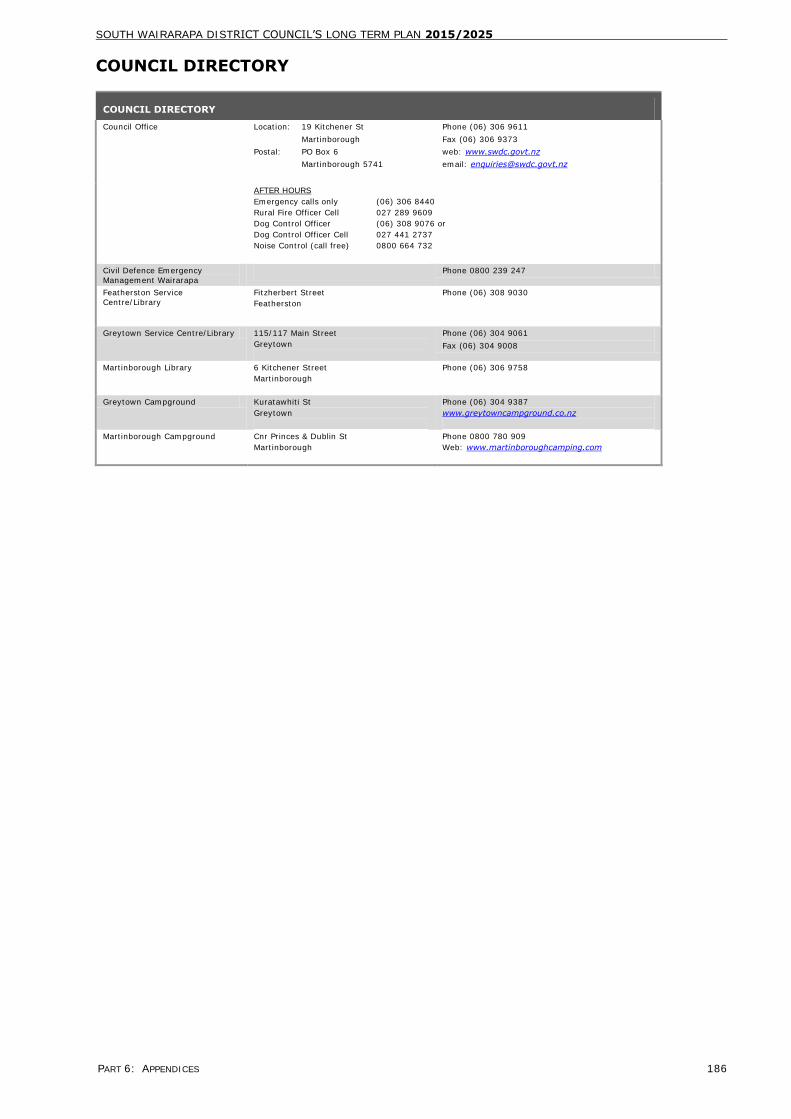
SOUTH WAIRARAPA DISTRICT COUNCIL’S LONG TERM PLAN 2015/2025
PART 6: APPENDICES 186
COUNCIL DIRECTORY
COUNCIL DIRECTORY
Council Office Location: 19 Kitchener St
Martinborough
Postal: PO Box 6
Martinborough 5741
Phone (06) 306 9611
Fax (06) 306 9373
web: www.swdc.govt.nz
email: [email protected]
AFTER HOURS
Emergency calls only (06) 306 8440
Rural Fire Officer Cell 027 289 9609
Dog Control Officer (06) 308 9076 or
Dog Control Officer Cell 027 441 2737
Noise Control (call free) 0800 664 732
Civil Defence Emergency
Management Wairarapa Phone 0800 239 247
Featherston Service
Centre/Library
Fitzherbert Street
Featherston
Phone (06) 308 9030
Greytown Service Centre/Library 115/117 Main Street
Greytown
Phone (06) 304 9061
Fax (06) 304 9008
Martinborough Library 6 Kitchener Street
Martinborough
Phone (06) 306 9758
Greytown Campground Kuratawhiti St
Greytown
Phone (06) 304 9387
www.greytowncampground.co.nz
Martinborough Campground Cnr Princes & Dublin St
Martinborough
Phone 0800 780 909
Web: www.martinboroughcamping.com

PART 6: APPENDICES 187
GLOSSARY
GLOSSARY
AEE - Assessment of Environmental Effects
AMP - Asset Management Plan
BERL - Business and Economic Research Limited
BCA - Building Consent Authority
CDEMG - Civil Defence Emergency Management Group
DOC - Department of Conservation
DV - Depreciated Value
EEO - Equal Employment Opportunities
ETS - Emissions Trading Scheme
FRS - Financial Reporting Standard
GST - Goods and Services Tax
IFRS - International Financial Reporting Standards
LAPP - Local Authorities Protection Programme
LGA - Local Government Act
LCFA - Local Government Funding Authority
LTP - Long Term Plan (replaces LTCCP from 2012/2013)
MOU - Memorandum of Understanding
NAASRA - National Association of Australia State Roading Authorities
NZTA - New Zealand Transport Agency (formerly Transfund, Land Transport Safety Authority and Transit NZ)
NEW CAPITAL - Capital Expenditure on New Infrastructure Assets
NMuA - National Multi-use Approval. Applies to building structures that are constructed to a standard and
repetitive design
NRB - National Research Bureau
RAMM - Road Asset Maintenance Management
RENEWAL
CAPITAL
- Capital Expenditure on Renewal of Infrastructure Assets e.g. Sewer or Water Pipes
RLTC - Regional Land Transport Committee
RLTS - Regional Land Transport Strategy
RMA - Resource Management Act
SL - Straight Line
SPR - Special Purpose Road
SUIP - Separately Used or Inhabited Part. Applies to the levying of targeted rates and includes any portion of any separate rating unit used or inhabited by any person, other than the ratepayer (as defined by
Clause 11 of the Local Government (Rating) Act 2002) having the right to use or inhabit that portion by
virtue of a tenancy, lease, license or other agreement.
SWCCP - South Wairarapa Council Community Plan
UAC
- Uniform Annual Charge – a charge made on each property, but to which a differential can be applied, e.g.
70% urban 30% rural.
UAGC - Uniform Annual General Charge – a charge made equally to each property.
VESTED
CAPITAL
- Capital Expenditure on Assets by Others with Ownership Vested in Council.
WLS - Wairarapa Library Service


