Embed Size (px)
Citation preview

PAPG/SPE ANNUAL TECHNICAL CONFERENCE 2010November 10-11, 2010 Islamabad
ABSTRACT
Since the last three decades, AVO analysis has been applied as fluid discriminator and direct hydrocarbon indicator. However, the conventional AVO analysis does not give good results in reservoirs with low gas saturations. The analysis reveals that the P-wave velocity of a fluid saturated rock is over-estimated by the conventional models. These conventional models ignore the heat and mass transfers between the liquid and gas phases, which are caused by pore pressure perturbations. These transfers do have very significant effects on the seismic parameters of reservoir rocks with low gas saturation. Therefore, these effects need to be accounted for during the interpretation of the seismic events and during forward modeling in these reservoir rocks with low gas saturation. The conventional model is therefore corrected by considering the thermodynamic properties of the fluid phases. This adjusted model is then applied on a producing field located in the North Sea. It shows that the AVO response is highly affected by pressure related changes in fluid properties. The results show that a velocity push down effect appears, as the free gas saturation generates stronger AVO response than obtained by a conventional AVO model. Therefore, it is proposed that such response is a helpful method to detect primary leakage of gas from geological structures, to model free gas effects on seismic attributes, and to distinguish areas with low gas saturation from areas with higher and possibly commercial gas saturation.
INTRODUCTION
Many techniques have been used to differentiate pore fluid types and their saturation. These techniques are, for example, velocity modeling [1], amplitude attenuation [2], amplitude variation with offset (AVO) analysis [3], elastic inversion for shear and compressional impedances [4], fluid factor [5], and several other attributes. Interestingly, all these techniques depend on three fundamental parameters of saturated rocks: bulk density (ρ ), shear velocity (V ) ρ S
and compressional velocity (V ). Only V and ρ are P P
directly analogous to the fluid properties (density, pf and modulus of incompressibility, K ). The fluid f
modulus or inverse of the compressibility of the fluid has no impact on V , even so, V depends on the fluid S S
density to a certain extent. The effect of fluid viscosity, rock permeability and mixing inhomogenities are additional parameters influencing the seismic velocities but are outside the scope of this paper.
Since the last three decades, AVO analysis has become a prominent and useful technique in the direct detection of hydrocarbons [6] and in reducing dry holes risk [7]. AVO is an effective approach to predict fluid effects on the seismic properties of saturated rocks. It also helps to delineate fluid contacts and reservoir facies [3]. AVO signatures are depth and rock age dependent because physical properties (density, velocity) of rocks vary with depth and age [8]. Generally, AVO concept is not applicable for deep and old reservoirs [8]. However, it is quite difficult to define explicitly the minimum effective depth that is applicable to collect AVO signal on seismic data. For instance, in North Sea Reservoirs, the AVO anomalies in Jurassic plays and in the European Chalk Formation (Cretaceous-Paleocene) are reported [9] in depth range ~2.5- 4Km. On seismic time sections, we can expect AVO anomalies around 2.0 - 3.0 in these reservoirs. The reflected P-wave reflection coefficient (R ) is PP
simply defined as
The quantitative description of low-gas saturation effects on seismic properties is one of the most important challenges in seismic exploration and time-lapse (4D) monitoring. The apparition of a free gas phase in a reservoir formation filled with oil or water has for effect to considerably decrease V as depicted inP
1, which often produces a high impedance contrast with overlying rock layer. Nevertheless, this contrast appears to be poorly sensitive to the gas saturation in the gas-bearing layer. The saturated V P
exhibits a very characteristic saturation dependent
,
Figure
ρ
125
LOW GAS-SATURATION EFFECT ON AVO RESPONSE1
Perveiz Khalid 2 3, Farrukh Qayyum and Daniel Broseta
,, SPPP VVfR (1)
1University of Pau, France,
2dGB Earth Sciences Enschede, The Netherlands.

behavior at in-situ temperature and pressure conditions and with burial depth ( 1). If liquid is replaced by gas, V decreases sharply and continuously in a narrow P
interval of S (5 10%) to minimum value. Then it g
increases linearly but very slowly with further increase in S up to the dry value. In shallow reservoir g
conditions with high difference between bulk moduli -2of water and gas (e.g., K /K < 10 where K and K g l l g
stand respectively for bulk modulus of liquid and gas phase), the point of minimum is shifted towards low gas saturation. However, in case of deep gas reservoirs with small difference in liquid and gas bulk moduli this minimum is shifted to higher gas saturation. Reference [10] also showed the same trend of V with saturation P
and depth. This behavior of V is less pronounced when P
the density of gas phase is comparable to the density of liquid phase, e.g., for deep reservoirs, or when the phase distribution is spatially heterogeneous (patchy) at the scale of seismic wavelength [11].
Figure
-
This poor sensitivity of V to S is generally modeled P g
by using a poroelastic model, for example Gassmmann [12] under the adiabatic condition (i.e., no transfer of heat between fluid and rock-forming minerals at the passage of seismic waves). We have investigated that this adiabatic condition is not valid in surface seismic frequency band [13]. Nevertheless, the exact measurements of the low-gas saturation effects on seismic attributes remain questionable.
The exploration industry needs to have a reliable method to estimate the effective bulk modulus and the density of the multi-phase (oil and gas or water and gas) pore fluids due to very strong influence of the pore fluid properties on seismic response. This is true in particular when pore pressure (P) drops below the bubble point pressure of the fluid (P ) at any b
temperature (T) where dissolved gases come out of solution and appear as free gas. Although Batzle and Wang [14] proposed a set of empirical correlations for this purpose, which is widely used in industry, these correlations are unable to properly account for the fluid bulk modulus when small gas appears as free gas.
In last publication [15], we proposed a simple rigorous method to estimate two-phase fluid bulk modulus. It has been successfully applied to different types of reservoir fluids including gas-water, CO -water, gas-2
oil and gas condensates. The method described in [15] is based on thermodynamic principle and follows the black oil simulation with proper account of heat and mass transfers between the phases during pressure perturbations [16]. In this paper, we extend this method to estimate AVO response. The focus of this work is on low gas-saturated reservoirs because of the practical problems related to low gas-saturation such as fizz water [7].
This paper is organized as follows. The next section is a brief description of gas-saturation effects on multi-phase fluid properties. Then we present the conventional method for prediction of AVO response to gas saturation and compare it with our proposed method. In the last section, before conclusions, we will apply both conventional and modified methods on real data set taken from a gas producing field of the North Sea to analyze the effectiveness of the our method. Our modified method will be helpful to resolve one of the most practical problems related to fizz water, 4D-seismic monitoring of producing hydrocarbon reservoirs and CO geological storage in deep aquifers.2
126
Fig. 1. Typical effect of gas (or liquid) saturation on P-velocity of a saturated rock. At shallow conditions, minimum value of VP is attained at
-3S =7% (K /K ≈8×10 ). At deep conditions minimum g g l
value of V is shifted to high gas saturation S =13% P g-2(K /K ≈5×10 ).g l
GAS SATURATION EFFECTS ON SEISMIC PROPERTIES OF MULTI-PHASE FLUIDS
The bulk properties of saturated rocks are sensitive to the properties of fluids present within the pores of these rocks. If pores are saturated with different fluids such as water and gas or oil and gas of very different elastic properties, the bulk properties depend strongly on the fluid saturation pattern. Two saturation patterns homogeneous saturation and patchy saturation are considered into the pores. The bulk modulus of the saturated rock (K ) and V depend on the spatial size of sat P
the fluid patches. If the wavelength of seismic wave is much larger than gas or liquid patch size, the seismic properties of saturated rocks follow the Gassmann low frequency bound. Contrary to this, if the wavelength of seismic wave is much smaller than the patch size, the saturated properties follow the Hashin-Shtrikman upper bound [17]. Therefore, exact modeling of fluid saturation distribution is very important in AVO analysis and seismic monitoring.
Seismic Properties of Gases
Seismic properties of pure gases are much different than those of the various gas mixtures. Reservoir
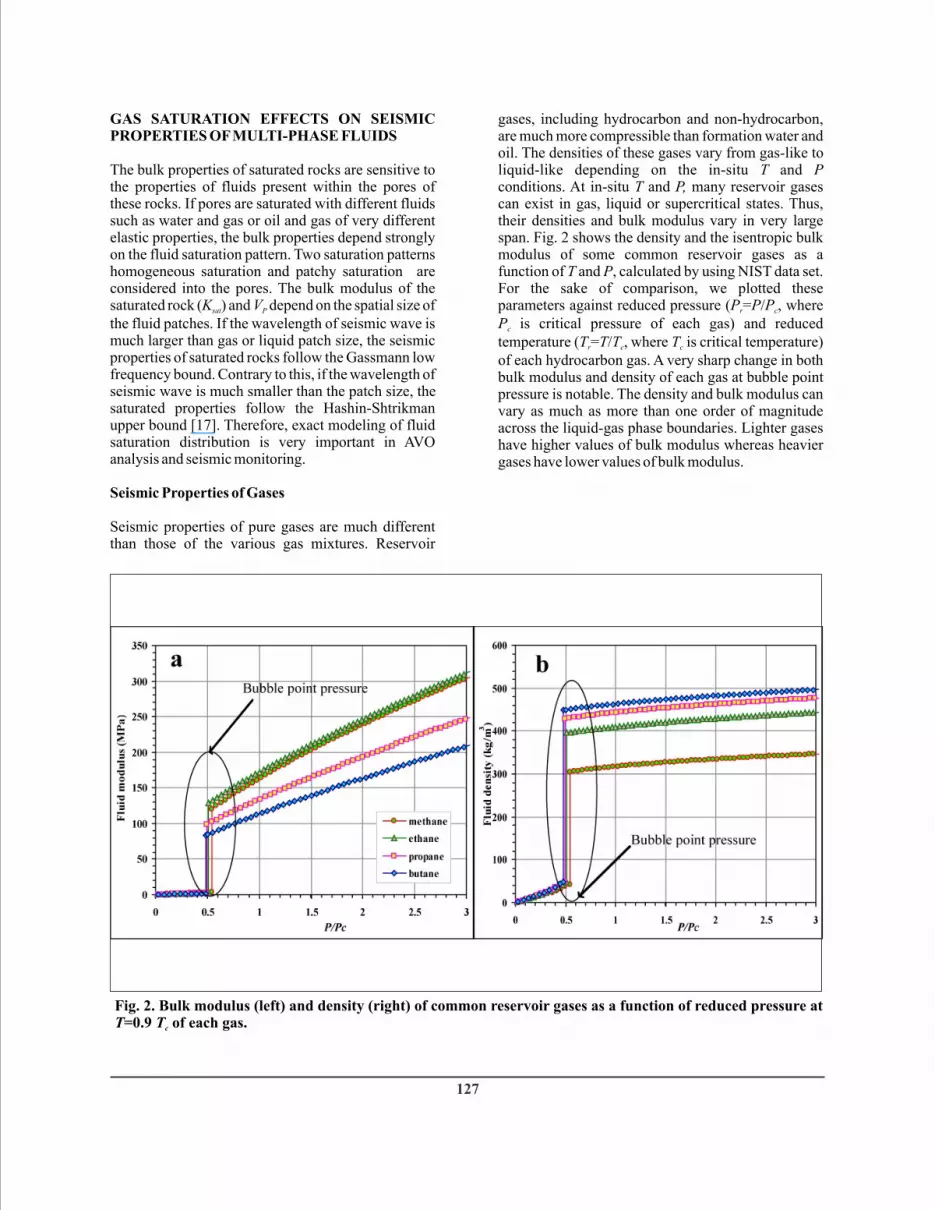
gases, including hydrocarbon and non-hydrocarbon, are much more compressible than formation water and oil. The densities of these gases vary from gas-like to liquid-like depending on the in-situ T and P conditions. At in-situ T and P, many reservoir gases can exist in gas, liquid or supercritical states. Thus, their densities and bulk modulus vary in very large span. Fig. 2 shows the density and the isentropic bulk modulus of some common reservoir gases as a function of T and P, calculated by using NIST data set. For the sake of comparison, we plotted these parameters against reduced pressure (P =P/P , where r c
P is critical pressure of each gas) and reduced c
temperature (T =T/T , where T is critical temperature) r c c
of each hydrocarbon gas. A very sharp change in both bulk modulus and density of each gas at bubble point pressure is notable. The density and bulk modulus can vary as much as more than one order of magnitude across the liquid-gas phase boundaries. Lighter gases have higher values of bulk modulus whereas heavier gases have lower values of bulk modulus.
127
Fig. 2. Bulk modulus (left) and density (right) of common reservoir gases as a function of reduced pressure at T=0.9 T of each gas.c

Where, K is the isothermal bulk modulus in GPa, T
routinely measured in PVT measurements and black oil simulations. C is the apparent total heat capacity in P
J/kg/K, is the thermal expansion coefficient at P-1constant pressure in Pa , V is the total volume of liquid
3and gas phases at in-situ conditions in m /mol and T is the formation temperature in Kelvin. Relaxed and unrelaxed moduli, calculated by (4) and (3) respectively, differ strongly from each other, especially in low gas-saturation as shown in Figure 3. A very large difference between (3) and (4) appears when dissolved gas starts to come out of solution.
(4) 12
1
P
PTf
C
TVKK
128
Seismic Properties of Reservoir Fluid Mixtures
If measurements of density and acoustic velocity in formation fluid are available, the isentropic bulk modulus of fluid is conventionally calculated by Newton-Laplace equation
Where
is the fluid density and V is the acoustic velocity into P
the fluid in the absence of rock. The above measurements are rarely available for formation fluids under in-situ conditions. In the best of our knowledge no such measurements are available for multi-phase fluids.
Wood Isostress Average: The modeling of seismic properties of rocks saturated with a mixture of water and gas treats the water and gas as two separate phases. Thus, the effective modulus of the mixture is taken as the isostress average of the phase moduli weighted by their volume fraction. This isotress volume average is known as Wood's volume average equation [18] and is equal to the harmonic average of phase's bulk moduli:
Wood's approximation holds if two essential assumptions are satisfied. First, the liquid and the gas phases are homogeneously distributed at microscopic scale within the pore space. This saturation state is referred to as uniform saturation. The second assumption is that the liquid and the gas phases remain frozen or unrelaxed at the passage of the seismic wave [16]. The term frozen means no heat and mass transfer between liquid and gas phases at the passage of low frequency seismic waves. When there is a large contrast between K and K , the average in (3) is close l g
to the K over a large range of saturations, and it varies g
rapidly but continuously only in a narrow interval of low gas saturations S smaller than 5 10 %. g
Thermodynamic Approach: Some workers showed clearly that (3) over-estimates the adiabatic modulus [15]. We proposed a new method to calculate two-phase adiabatic bulk modulus in quasi-static or relaxed limit [15], [16], [19] with the consideration of heat and mass transfer effects between liquid and gas phases i.e.,
- -
(2) 2Pff VK
ggllf SS
Fig. 3. Effective fluid modulus of a gas-oil mixture at T=344 K and P =29.8 MPa. Double arrow shows the big b
d i s c o n t i n u i t y b e t w e e n Wo o d ' s v a l u e a n d thermodynamics.
AVO MODELING
For AVO analysis of an isotropic and homogeneous elastic media, the exact Zoeppritz equations or their approximations are widely used. The Aki & Richards' approximation [20] is more appealing because of its three terms forms: the first involving V , the second P
involving , and the third involving V . All Zeoppritz S
equations approximations generally assumed small impedance contrast and are limited to small incident angles (<30°). The exact Zoeppritz equations are used because the terms for far offsets or large angles contain
1//
ggllf KSKSK (3)

fluid saturation information. The following main steps are involved in the prediction of AVO behavior under an arbitrary reservoir conditio
Geophysical Observations from Field Data
With the help of core analysis, well logs and other available data, we interpret the geological structures on a seismic cross-section. Then we specify a zone of interest and define its geometry.
Define Local Geophysical Parameters
The spatial distribution of petrophysical parameters such as porosity, permeability, pore pressure, temperature, fluid composition and geophysical parameters such as densities, bulk moduli, velocities etc. of each lithology present in the zone of interest are required for further analysis. After the confirmation of geological structure and locating a zone of interest, we assign the local pertophysical parameters with the help of well logs and core analysis.
Fluid Substitution Models
The next step is to select an appropriate fluid substitution model. It is an important part of rock physics study, seismic interpretation, AVO analysis and 4D modeling, which make easy to distinguish fluid nature and its quantity in reservoirs. Conventionally, for low frequency seismic modeling, Gassmann [12] fluid substitution model is frequently used to express the relationship between the bulk modulus of the fluid-saturated rock (K ), the bulk modulus of the drained sat
(or dry) rock (K ), the rock-forming mineral (K ) and dry m
to the adiabatic bulk modulus of the saturating fluid (K ) without referring to any specific pores geometry. f
When a compression (rarefaction) of a seismic wave passes through a porous media pore pressure is increased (decreased) which resists the compression (rarefaction) and therefore stiffens (softens) the rock. For low frequency, Gassmann's relation gives the resulting increase in K . Gassmann derived K under sat sat
quasi-static assumption in the simplest form is:
where α=1 K /K is the Biot's coefficient or dry m
coefficient of effective stress and is always less than 1 in real porous media. It is a complex function of porosity, clay content, pore geometry, grain size, mineral composition etc. [3], [21]. The modulus Is defined as the pressure needed to force fluid into formation without changing volume and is rock porosity. In
n.
reality, solid mineral is incompressible, that is, K → ∞ mndor K >> K , therefore, the 2 term of (6), is much m f
stsmaller than the 1 term, thus can be neglected. This leads to a linear form of (5).The linear approximation of K valid for high porosities (>15%) [22], [23] issat
The fluid contribution in effective bulk modulus of ndsaturated rock is represented by 2 term of right hand
side, known as pore modulus and is controlled by 2porosity. The term α / , called gain function, is an
increment of bulk modulus because of fluid saturation. The value of this gain function for different sands is in the range of 1.8 3.0. The important discovery of the Gassmann's equations is that the rock shear modulus is independent of the nature and amount of saturating pore fluid, thus
However, (8) does not hold for carbonate rocks [24]. The seismic velocities in saturated porous rocks are
Where
is the effective density of the saturated rock (ρ and ρ m f
being the mineral and fluid densities, respectively).
Seismic velocities are estimated by the following two approaches:
Gassmann-Wood (GW) approach:The seismic properties of two-phase fluid saturated rocks under frozen phases assumption or unrelaxed state are modeled conventionally by using Gassmann-Wood (GW) approach. In Gassmann fluid substitution equations, the effective bulk modulus of the two-phase (liquid and gas) fluid is approximated by the saturation-weighted harmonic average of the liquid
129
(7)
f
2
drysat Kα
KK
12drysat MαKK (5)
(6)
mf KKM
(8) drysat
(9)
2/1
3/4
eff
satP
KV
2/1/ effSV (10)
(11) fmeff )1(

and gas bulk moduli as given in (3).
Gassmann-Thermodynamics (GT) approach: Our current understanding is that heat and mass transfer take place between the different fluid phases when pressure varies at the passage of the seismic wave or during production stages, thus liquid and gas phases are in relaxed state [16]. At very low frequency, pore pressure has sufficient time to equilibrate the transition effects after the passage of seismic waves, therefore, the fluid and rock frame may consider in relaxed state. The effective fluid modulus is then calculated by using (4) [15] and injected in (5).
Synthetic AVO Modeling: The distribution of seismic velocities provides the basic input required for the AVO studies of the pore fluids at various fluid saturations. The changes in seismic velocities and bulk densities with appearance of free gas associated with changes in reservoir conditions must influence the propagation of the seismic wave field. With an appropriate velocity values describing the cap rock and the reservoir interval, the zero-offset and AVO response of the main boundaries is modeled.
CASE STUDY
A well log data of a known gas field is selected, which is located in the Dutch sector of North Sea. The sonic, density, gamma ray, resistivity and porosity logs are acquired for this well. Based on gamma ray log, density and sonic logs, the interval 4095 m 4176 m is marked as reservoir (Fig 4). The reservoir is mainly sandy in character with average porosity ≈0.20. The top of the reservoir is marked as shale-sand contact whereas the base of the reservoir is marked as sand-shale contact. The seismic parameters of the cap rock
3are: V =4685 m/s, V = 2340 m/s, =2250 kg/m . P S
Because of the non-availability of shear sonic log data, Vs is derived using the empirical relations [25]. The gas distribution is homogeneous in water at pore scale at T=402 K and P=31.2 Mpa.
Rock Physics Parameters
-ure
130
Table 1: Density and bulk modulus of rock components used
quartz
water gas
density (kg/m3)
2650
1000
180
modulus (GPa) 37 2.25 0.06
The rock physics parameters (elastic modulus and densities) of rock components used in this study are given in Table 1. K and μ for well-consolidated rocks can be measured dry
Fig. 4. Density, sonic, gamma ray logs of a well in known gas field of North Sea.
in lab. However, in case of unconsolidated rocks these measurements turn more complicated due to non-linearity in elasticity and time-dependent properties [26]. In the presence of well log data, K and μ can be dry dry
easily deduced from (5) and (9). The K and are dry
estimated from those parts of sonic log data where there is full water-saturation.
Effective Fluid Modulus
The effective fluid moduli of this water-gas mixture in unrelaxed and relaxed states are calculated by using (3) and (4), respectively and are shown in Figure 5a as a function of S . The percentage difference in K l f
computed by both approaches ( K ) is plotted in Fig. f
5b at various values of S . At P>P , gas is fully l b
dissolved into water, and relaxed and unrelaxed K are f
identical. However, when dissolved gas starts to appear as a free gas, at the crossing of P , the relaxed K b f
decreases dramatically (up to 40% that of the single phase liquid). On the other hand, unrelaxed values vary much more smoothly and continuously with pressure or liquid saturation. The difference between relaxed and unrelaxed fluid moduli is important at low gas saturations. At high gas-saturation, K is large in f
percentage but the values of K are very small as f
compared to K and will have negligible effect on dry
saturated rock properties.Seismic Velocities
131
The V , V and of saturated sands are computed as P S eff
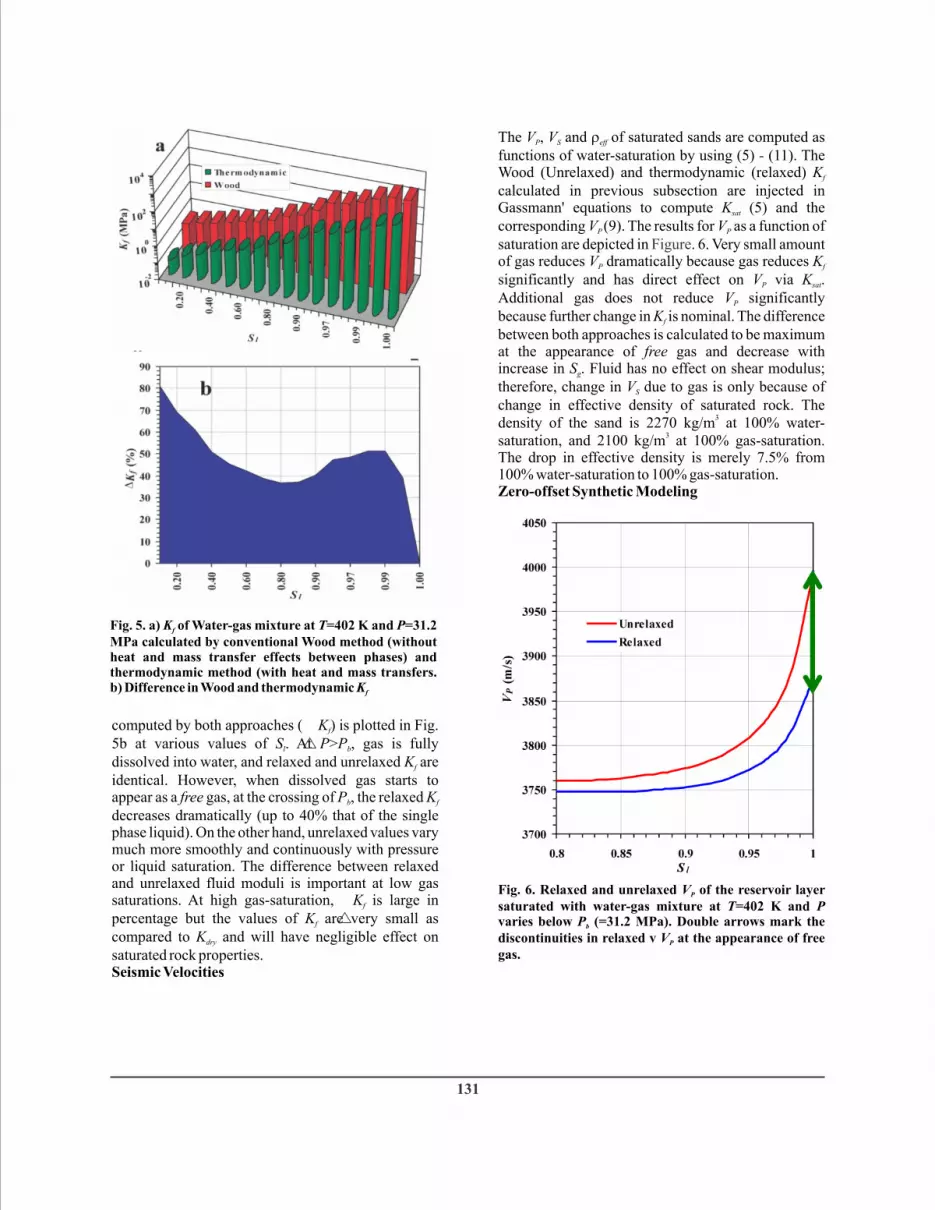
functions of water-saturation by using (5) (11). The Wood (Unrelaxed) and thermodynamic (relaxed) K fcalculated in previous subsection are injected in Gassmann' equations to compute K (5) and the sat
corresponding V (9). The results for V as a function of P P
saturation are depicted in . 6. Very small amount of gas reduces V dramatically because gas reduces K P f
significantly and has direct effect on V via K . P sat
Additional gas does not reduce V significantly P
because further change in K is nominal. The difference f
between both approaches is calculated to be maximum at the appearance of free gas and decrease with increase in S . Fluid has no effect on shear modulus; g
therefore, change in V due to gas is only because of S
change in effective density of saturated rock. The 3density of the sand is 2270 kg/m at 100% water-
3saturation, and 2100 kg/m at 100% gas-saturation. The drop in effective density is merely 7.5% from 100% water-saturation to 100% gas-saturation. Zero-offset Synthetic Modeling
-
Figure
Fig. 5. a) K of Water-gas mixture at T=402 K and P=31.2 f
MPa calculated by conventional Wood method (without heat and mass transfer effects between phases) and thermodynamic method (with heat and mass transfers. b) Difference in Wood and thermodynamic Kf
Fig. 6. Relaxed and unrelaxed V of the reservoir layer P
saturated with water-gas mixture at T=402 K and P varies below P (=31.2 MPa). Double arrows mark the b
discontinuities in relaxed v V at the appearance of free P
gas.

Model A B water -0.0745 -0.1394 Low gas
conventional
-0.0915
-0.1676
modified
-0.1032
-0.1559 High gas
-0.1289
-0.1624
It is important to asses how phase transition and transfer affect seismic signatures processes (heat and mass) into two-phase fluid. The normal (zero-offset) seismic traces are known to be most sensitive to V and P
. Zero-offset synthetic seismograms are generated eff
for sands with 100% water saturation (background sands), low gas saturation (S =1%) and gas sand g
(S =70%) by convolving reflectivity series with a zero-g
phase Ricker wavelet of 50 Hz dominant frequency. Note that at deep reservoir conditions, high frequencies attenuate quickly and low frequencies remain in seismic data. We used slightly higher frequency to display purpose to distinguish reflection from top and bottom of the reservoir. Depending on whether GW or GT method is used for velocity or impedance modeling, very different seismograms are expected for the same gas-saturations. The changes anticipated in normal seismic reflectivity are plotted in
7 with the vertical profiles of P-wave impedances at various gas-saturations. Clearly reflection amplitudes at reservoir boundaries are larger when calculated by using GT velocity model instead of GW model, especially at low gas-saturation (S =1%). g
The reflection amplitudes calculated by GW model at low gas-saturation look identical to those of background sand. Another interesting feature is the velocity pushdown effect at the bottom reservoir interface obtained when using the GT model instead of GW velocity model.Gas Effect on AVO Response
Figure
132
VP VS
eff
GT GW Background sand 4000 4000 2475 2270
low gas 3780 3870 2476 2267
high gas
3810 3812
2552
2135
Using the calculated velocities and densities, we calculate the expected AVO response of low gas saturated reservoir. We use the exact Zoeppritz equations to compute R as a function of incident PP
angle for background sand, low gas-saturation and high gas-saturation. Further, we estimated the AVO intercept (A) and gradient (B) also. The input V , V P S
and values at various gas saturations are listed in eff
Table 2. AVO curves for given gas-saturation are plotted in Fig. 8 by using GW and GT velocity models as input. It is clear that R increases with increase in PP
offset and behaves as class III reservoir. The intercept A changes from -0.0745 to -0.1342 and gradient B changes from -0.1394 to -0.1581 when water is replaced by gas. AVO intercept and gradient show effective attributes to distinguish gas saturation (Table 3).
The amplitude changes going from low gas-saturation to high gas-saturation state, associated with velocity and density changes create promising AVO anomalies. From Table 3 it is clear that the slope or gradient yields some additional information about gas saturation beyond that given by normal reflectivity.DISCUSSION AND CONCLUSIONS
Table 2: Seismic velocities and densities used for synthetic AVO modeling.
Fig. 7. P-wave reflection coefficient versus incident angle for background sand, low gas-saturation and high gas-saturation computed on the base of GW and GT velocity models.
Table 3: AVO intercept and gradient attributes to discriminate gas saturation.
The seismic properties of reservoir gases are changed by changes in reservoir temperature and pressure conditions. The influence of gas saturation and the liquid/gas phase transition effects on the seismic properties of saturated sand were determined.

gas-saturation effects. The success of the AVO is subject to correct description of seismic properties of multi-phase fluid mixtures. The heat and mass diffusion associated with the phase transitions (from single-phase liquid to two-phase liquid and gas) have significant effects on seismic and elastic parameters in terms of sharp decrease in bulk modulus and compressional wave velocity of fluid saturated rocks. Thermodynamic phase transition effects on saturated bulk modulus and V are much larger at low gas P
saturation than at high gas saturation. An appropriate account of these effects shows that a small amount of free gas appears when pore pressure drops below the
133
Gassmann fluid substitution equations were used with combination of Wood's or thermodynamic approaches to estimate fluid modulus in relaxed and unrelaxed states when pore pressure is below bubble point pressure of the formation fluid. V is commonly used to P
interpret fluid saturation and fluid types in reservoirs. The abrupt reduction in V with first few percent of gas P
saturation controls the seismic response, and makes it difficult to distinguish gas-saturated sand from low gas saturation. AVO analysis is a promising technique to detect low
Fig. 8. P-wave reflection coefficient versus incident angle for background sand, low gas-saturation and high gas-saturation computed on the base of GW and GT velocity models.
bubble point pressure of the reservoir fluid, giving rise to very large AVO anomalies. The AVO analysis, based on conventional seismic velocities models, does not give good results in reservoirs with low gas saturations.
The analysis for the North Sea gas-producing field reveals that the saturated P-wave velocity is over-estimated by the conventional Gassmann-Wood's approach because of ignoring the transfers. The conventional model is therefore corrected by considering the thermodynamic properties of the fluid phases. Modified (GT based) AVO enhanced the visibility of the calculated reflectivity almost by order of 2 than the conventional (GW based) AVO at the same gas saturation. Gassmann-thermodynamic velocities generate stronger AVO responses than those obtained by a conventional AVO model. These enhanced AVO anomalies will be very helpful to interpret seismic events, reservoir monitoring, to detect primary leakage of gases from geological structures such as CO sequestration, and to model free 2
gas effects on seismic attributes.
AVO anomalies have been interpreted as DHI. According to reference [27], different reservoir classes have positive or negative AVO intercept and gradient, thus polarity changes. In case of class III gas sands of high impedance, AVO anomalies fall in IV quadrant having negative intercept and gradient (Table 3). Consequently, these may have normal polarity.
Variation in normal reflectivity at the top and bottom of a reservoir and the variation in travel time at the bottom of the reservoir before and after the appearance of free gas are two physically meaningful attributes that are observable directly on seismic sections and can provide information about fluid saturation. The results show that a velocity pushdown on seismogram, generated based on Gassmann-thermodynamic models is an indicator of the appearance of the free gas but this velocity pushdown is not as enhanced as we expected to become a low and high gas saturation discriminator (V ≈210 m/s at low S and V ≈250 m/s P g P
at high S ). Therefore, it is quite difficult to distinguish g
low gas saturation (fizz water) from high gas-saturation by using P-wave reflectivity data only. We suggest performing complete AVO analysis of P-converted-S (PS) velocities, as the far-offset PS data may be helpful to distinguish low and high gas saturations.
ACKNOWLEDGEMENT

The authors are thankful to NLOG Netherlands Oil and Gas Portal (www.nlog.nl) for granting the permission to use and to publish their data. We are also thankful and pay our gratitude to Mr. Iftikhar Abbasi, Chief Geophysicist, OMV (YEMEN) and Mr. Nasir Ahmad Exploration Manager, ENI (Pakistan) for the review of this paper.
REFERENCES
[1] Wang, Z., M.L. Batzle, and A.M. Nur, 1990, Effects of different pore fluids on seismic velocities in rocks. Canadian Journal of Exploration Geophysics, Vol. 26, Nos. ½, p. 104 -112.
[2] Cadoret, T., G. Mavko, and B. Zinszner, 1998, Fluid distribution effect on sonic attenuation in partially saturated limestones. Geophysics, Vol. 63, No. 1, p. 154 - 160.
[3] Hilterman, 2001, Seismic amplitude interpretation: SEG Distinguished Instructor Short Course.
[4] Gonzaléz, E.F., 2006, Physical and quantitative interpretation of seismic attributes for rock and fluids identification. Ph.D. Dissertation, Stanford University.
[5] Smith, G.C., and P.M. Gidlow, 1987, Weighted stacking for rock property estimation and detection of gas. Geophysical Prospecting, Vol. 35, p. 993 - 1014.[6] Batzle, M., and D. Han, 2001, Optimal hydrocarbon indicators. SEG Expanded Abstracts Vol. 20, p. 1697 1700.
[7] Han, D., and M. Batzle, 2002, Fizz water and low gas-saturated reservoirs. The Leading Edge, Vol. 21, p. 395 - 398.
[8] Brown, A.R., 2003, Interpretation of three-thdimensional seismic data. 6 Ed., AAPG Memoir 42,
SEG Investigations in Geophysics, No. 9.
[9] Anderson, J.K., 1999, The Capabilities and Challenges of the Seismic Method in Chalk Exploration. Petroleum Geology of Northwest Europe: Proceedings of the 5th Ed., Vol. 2. SD Burley, Geological Society of London.
[10] Domenico, S.N., 1974, Effect of water saturation on seismic reflectivity of sand reservoir encased in shales. Geophysics, Vol. 39, p. 759 - 769.
[11] Cadoret, T., Marion,D., and Zinszner, B., 1995,
134
Influence of frequency and fluid distribution on elastic wave velocities in partially saturated limestones: J. Geophys. Res., Vol. 100, p. 9789 - 9803.
[12] Gassmann, F., 1951, Uber die Elastizitat poroser Medien: Vierteljahrsschrift der Naturforschenden Gesellschaft in Zurich Vol. 96, p. 1 - 23.
[13] What is the fluid effective compressibility in Gassmann's equation? (in press)
[14] Batzle, M., and Z. Wang, 1992, Seismic properties of pore fluids. Geophysics, Vol. 57, No. 11, p. 1396 - 1408.
[15] Nichita D.V., P. Khalid, and D. Broseta, 2010, Calculation of isentropic compressibility and sound velocity in two-phase fluids. Fluid Phase Equilibria 291, 95 - 102.
[16] Broseta D., P. Khalid, D.V. Nichita, C. N. Favretto, and J. Blanco. 2009, A new look at seismic properties of low gas-saturated reservoirs. Extended
stAbstract. 71 EAGE Conference & Exhibition Amsterdam, The Netherlands, 8 - 11 June 2009.
[17] Toms, J., T.M. Müller, R. Ciz, and B. Gurevich, 2006, Comparative review of theoretical models for elastic wave attenuation and dispersion in partially saturated rocks. Soil Dynamics and Earthquake Engineering, Vol., 26, p. 548 - 565.
[18] Wood, A. W., 1930 A Textbook of Sound, 1st ed.: MacMillan, New York.
[19] Khalid, P., D. Broseta, D.V. Nichita, G. Galliero, C. N. Favretto, and J. Blanco. 2009, Vitesses sismiques en milieu poreux faiblement saturé en gaz. Extended Abstract. 19th Congrès Français de Mécanique, Marseille, France, 24 - 28 Aug. 2009.
[20] Aki K, and P.G. Richards, 1980, Quantative seismology; theory and methods. W.H. Freeman & Co.[21] Russell, B. R., K. Hedlin, F. J. Hilterman, and L. R. Lines, 2003, Fluid-property discrimination with AVO: A Biot-Gassmann perspective. Geophysics, Vol. 68, No. 1, p. 29 - 39.
[22] Zinszner, B., and F.M. Pellerin, 2007, A geoscientist's guide to petrophysics. Technip, Paris.
[23] Han, D., and M. Batzle, 2004, Gassmann's equation and fluid-saturation effects on seismic velocities. Geophysics, Vol. 69, p. 398 - 405.

135
[25] Han, D., 1986, Effects of porosity and clay content on acoustic properties of sandstones and unconsolidated sediments. Ph.D. Dissertation, Stanford University.
[26] Gardner, G.H. F., M.R.J. Wyllie, and D. M. Droschak, 1965, Hysteresis in the velocity pressure characteristics of rocks. Geophysics, Vol. 30, p. 111 116.
[27] Rutherford, S.R., and R.H. Williams, 1989, Amplitude-versus-offset variations in gas sands. Geophysics, Vol. 54, p. 680 688.
-
-
Farrukh Qayyum
F a r r u k h Q a y y u m I s a Geoscientist in dGB Earth Sciences since 2008. He is i n v o l v e d i n s e q u e n c e stratigraphic interpretations, seismic object detection, reservoir prediction, reservoir characterization, and seismic interpretation studies. He started his career in 2006 as a mud logger in Baker Hughes
Inteq, Pakistan. After that he worked as G&G Specialist for Schlumberger-SIS, Pakistan. He is also an author and co-author of numerous articles. He holds M.Sc. in Geophysics and M.Phil. with a specialization in sequence stratigraphy and reservoir characterization from Quaid-i-Azam University, Pakistan.
Perveiz Khalid
Perveiz Khalid received MSc degree in Geophysics from Quaid-i-Azam university, Pakistan in 2004. He joind BGP as a Field Geophysicist after completing his MSc. In 2007, he d i d M S i n P e t r o l e u m E n g i n e e r i n g f r o m t h e University of Pau, France. Since 2007, he is working on the CO injection project in the 2
Laboratory of Complex Fluids Pau as a research associate. He has also submitted his Ph.D. Dissertation in Geophysics in the university of Pau. He is (co-)author of His areas of interest are reservoir modeling, rock physics, and thermodynamics of petroleum fluids.
Daniel Broseta
Daniel Broseta was awarded in 1987 a Ph.D. in Physics from the University of Paris VI. In 1989, he completed a post-doc at AT&T Bell Labs, U.S.A., and then worked for fifteen years with the French Petroleum Institute (IFP). Currently he is a full professor in the University of Pau, France. His areas of i n t e r e s t a r e : t h e
thermodynamics of petroleum fluids, rock physics, CO 2
geological storage, and gas hydrates. He is author of numerous international publications. numerous international publications.
ABOUT THE AUTHORS
136