Embed Size (px)
Citation preview

arX
iv:0
706.
0131
v1 [
phys
ics.
data
-an]
1 J
un 2
007
Luminosity determination at HERA-B
I. Abt24, M. Adams11, M. Agari14, H. Albrecht13, A. Aleksandrov30,V. Amaral9, A. Amorim9, S. J. Aplin13, V. Aushev17, Y. Bagaturia13,37,V. Balagura23, M. Bargiotti6, O. Barsukova12, J. Bastos9, J. Batista9,C. Bauer14, Th. S. Bauer1, A. Belkov12,†, Ar. Belkov12, I. Belotelov12,A. Bertin6, B. Bobchenko23, M. Bocker27, A. Bogatyrev23, G. Bohm30,M. Brauer14, M. Bruinsma29,1, M. Bruschi6, P. Buchholz27, T. Buran25,J. Carvalho9, P. Conde2,13, C. Cruse11, M. Dam10, K. M. Danielsen25,M. Danilov23, S. De Castro6, H. Deppe15, X. Dong3, H. B. Dreis15,
V. Egorytchev13, K. Ehret11, F. Eisele15, D. Emeliyanov13, S. Essenov23,L. Fabbri6, P. Faccioli6, M. Feuerstack-Raible15, J. Flammer13,
B. Fominykh23, M. Funcke11, Ll. Garrido2, A. Gellrich30, B. Giacobbe6,J. Glaß21, D. Goloubkov13,34, Y. Golubkov13,35, A. Golutvin23, I. Golutvin12,
I. Gorbounov13,27, A. Gorisek18, O. Gouchtchine23, D. C. Goulart8,S. Gradl15, W. Gradl15, F. Grimaldi6, J. Groth-Jensen10, Yu. Guilitsky23,36,
J. D. Hansen10, J. M. Hernandez30, W. Hofmann14, M. Hohlmann13,T. Hott15, W. Hulsbergen1, U. Husemann27, O. Igonkina23, M. Ispiryan16,
T. Jagla14, C. Jiang3, H. Kapitza13, S. Karabekyan26, N. Karpenko12,S. Keller27, J. Kessler15, F. Khasanov23, Yu. Kiryushin12, I. Kisel24,
E. Klinkby10, K. T. Knopfle14, H. Kolanoski5, S. Korpar22,18, C. Krauss15,P. Kreuzer13,20, P. Krizan19,18, D. Krucker5, S. Kupper18, T. Kvaratskheliia23,
A. Lanyov12, K. Lau16, B. Lewendel13, T. Lohse5, B. Lomonosov13,33,R. Manner21, R. Mankel30, S. Masciocchi13, I. Massa6, I. Matchikhilian23,G. Medin5, M. Medinnis13, M. Mevius13, A. Michetti13, Yu. Mikhailov23,36,
R. Mizuk23, R. Muresan10, M. zur Nedden5, M. Negodaev13,33,M. Norenberg13, S. Nowak30, M. T. Nunez Pardo de Vera13, M. Ouchrif29,1,F. Ould-Saada25, C. Padilla13, D. Peralta2, R. Pernack26, R. Pestotnik18,B. AA. Petersen10, M. Piccinini6, M. A. Pleier14, M. Poli6,32, V. Popov23,D. Pose12,15, S. Prystupa17, V. Pugatch17, Y. Pylypchenko25, J. Pyrlik16,
K. Reeves14, D. Reßing13, H. Rick15, I. Riu13, P. Robmann31,I. Rostovtseva23, V. Rybnikov13, F. Sanchez14, A. Sbrizzi1, M. Schmelling14,B. Schmidt13, A. Schreiner30, H. Schroder26, U. Schwanke30, A. J. Schwartz8,
A. S. Schwarz13, B. Schwenninger11, B. Schwingenheuer14, F. Sciacca14,N. Semprini-Cesari6, S. Shuvalov23,5, L. Silva9, L. Sozuer13, S. Solunin12,A. Somov13, S. Somov13,34, J. Spengler13, R. Spighi6, A. Spiridonov30,23,
A. Stanovnik19,18, M. Staric18, C. Stegmann5, H. S. Subramania16,M. Symalla13,11, I. Tikhomirov23, M. Titov23, I. Tsakov28, U. Uwer15,
C. van Eldik13,11, Yu. Vassiliev17, M. Villa6, A. Vitale6,7, I. Vukotic5,30,H. Wahlberg29, A. H. Walenta27, M. Walter30, J. J. Wang4, D. Wegener11,U. Werthenbach27, H. Wolters9, R. Wurth13, A. Wurz21, S. Xella-Hansen10,
Yu. Zaitsev23, M. Zavertyaev13,14,33, T. Zeuner13,27, A. Zhelezov23, Z. Zheng3,
Preprint submitted to Elsevier Science 9 October 2013

R. Zimmermann26, T. Zivko18, A. Zoccoli6
1NIKHEF, 1009 DB Amsterdam, The Netherlands a
2Department ECM, Faculty of Physics, University of Barcelona, E-08028Barcelona, Spain b
3Institute for High Energy Physics, Beijing 100039, P.R. China4Institute of Engineering Physics, Tsinghua University, Beijing 100084, P.R.
China5Institut fur Physik, Humboldt-Universitat zu Berlin, D-12489 Berlin,
Germany c,d
6Dipartimento di Fisica dell’ Universita di Bologna and INFN Sezione diBologna, I-40126 Bologna, Italy
7also from Fondazione Giuseppe Occhialini, I-61034 Fossombrone(PesaroUrbino), Italy
8Department of Physics, University of Cincinnati, Cincinnati, Ohio 45221,USA e
9LIP Coimbra, P-3004-516 Coimbra, Portugal f
10Niels Bohr Institutet, DK 2100 Copenhagen, Denmark g
11Institut fur Physik, Universitat Dortmund, D-44221 Dortmund, Germany d
12Joint Institute for Nuclear Research Dubna, 141980 Dubna, Moscowregion, Russia
13DESY, D-22603 Hamburg, Germany14Max-Planck-Institut fur Kernphysik, D-69117 Heidelberg, Germany d
15Physikalisches Institut, Universitat Heidelberg, D-69120 Heidelberg,Germany d
16Department of Physics, University of Houston, Houston, TX 77204, USA e
17Institute for Nuclear Research, Ukrainian Academy of Science, 03680 Kiev,Ukraine h
18J. Stefan Institute, 1001 Ljubljana, Slovenia i
19University of Ljubljana, 1001 Ljubljana, Slovenia20University of California, Los Angeles, CA 90024, USA j
21Lehrstuhl fur Informatik V, Universitat Mannheim, D-68131 Mannheim,Germany
22University of Maribor, 2000 Maribor, Slovenia23Institute of Theoretical and Experimental Physics, 117218 Moscow,
Russia k
24Max-Planck-Institut fur Physik, Werner-Heisenberg-Institut, D-80805Munchen, Germany d
25Dept. of Physics, University of Oslo, N-0316 Oslo, Norway l
26Fachbereich Physik, Universitat Rostock, D-18051 Rostock, Germany d
27Fachbereich Physik, Universitat Siegen, D-57068 Siegen, Germany d
28Institute for Nuclear Research, INRNE-BAS, Sofia, Bulgaria29Universiteit Utrecht/NIKHEF, 3584 CB Utrecht, The Netherlands a
30DESY, D-15738 Zeuthen, Germany
2

31Physik-Institut, Universitat Zurich, CH-8057 Zurich, Switzerland m
32visitor from Dipartimento di Energetica dell’ Universita di Firenze andINFN Sezione di Bologna, Italy
33visitor from P.N. Lebedev Physical Institute, 117924 Moscow B-333, Russia34visitor from Moscow Physical Engineering Institute, 115409 Moscow,
Russia35visitor from Moscow State University, 119992 Moscow, Russia
36visitor from Institute for High Energy Physics, Protvino, Russia37visitor from High Energy Physics Institute, 380086 Tbilisi, Georgia
†deceased
a supported by the Foundation for Fundamental Research on Matter (FOM),3502 GA Utrecht, The Netherlands
b supported by the CICYT contract AEN99-0483c supported by the German Research Foundation, Graduate College GRK
271/3d supported by the Bundesministerium fur Bildung und Forschung, FRG,
under contract numbers 05-7BU35I, 05-7DO55P, 05-HB1HRA, 05-HB1KHA,05-HB1PEA, 05-HB1PSA, 05-HB1VHA, 05-HB9HRA, 05-7HD15I,
05-7MP25I, 05-7SI75Ie supported by the U.S. Department of Energy (DOE)
f supported by the Portuguese Fundacao para a Ciencia e Tecnologia underthe program POCTI
g supported by the Danish Natural Science Research Councilh supported by the National Academy of Science and the Ministry of
Education and Science of Ukrainei supported by the Ministry of Education, Science and Sport of the Republic
of Slovenia under contracts number P1-135 and J1-6584-0106j supported by the U.S. National Science Foundation Grant PHY-9986703
k supported by the Russian Ministry of Education and Science, grantSS-1722.2003.2, and the BMBF via the Max Planck Research Award
l supported by the Norwegian Research Councilm supported by the Swiss National Science Foundation
3

Abstract
A detailed description of an original method used to measure the luminosityaccumulated by the HERA-B experiment for a data sample taken during the 2002-2003 HERA running period is reported. We show that, with this method, a totalluminosity measurement can be achieved with a typical precision, including overallsystematic uncertainties, at a level of 5% or better. We also report evidence for thedetection of δ-rays generated in the target and comment on the possible use of suchdelta rays to measure luminosity.
1 Introduction
A precise determination of the luminosity is required for the measurementof absolute cross sections. The integrated luminosity (L) is defined by
L =NP
σP
(1)
where NP is the number of events of a given process and σP is the correspond-ing cross section. In the case of HERA-B, which is a forward spectrometer [1,2]experiment, operated at the 920 GeV proton beam of the HERA acceleratorat the DESY Laboratory in Hamburg, the proton beam is bunched and in-teracts with a nuclear target placed on the halo of the beam. The numberof proton-nucleus (pA) interactions per bunch crossing is subject to statisti-cal fluctuations. For HERA-B, as for all other experiments having a bunchedbeam, the luminosity can be expressed as:
L =NBX · λ
σ(2)
where λ is the average number of interactions per bunch crossing BX, NBX isthe number of beam bunches crossing the apparatus and σ is the interactioncross section (for a more detailed discussion, see Sections 4 and 5). As aconsequence, given the cross section of proton-nucleus interactions, the lumi-nosity can be measured by determining λ and NBX . The average number ofinteractions per BX can be obtained from a fully unbiased sample of events invarious ways: by looking at inclusive quantities which are proportional to thenumber of interactions in one event (such as the number of tracks or the en-ergy released in a calorimeter), by counting the number of primary vertices orby counting the number of empty events. The first method has the advantageof entailing only a rather straightforward analysis of the data, but the signal
Corresponding Author: [email protected]
4

corresponding to a single interaction must be evaluated precisely and detectorstability becomes a relatively critical issue. In the second method, the vertexreconstruction efficiencies must be known precisely as well as the probabilityof erroneously merging or splitting primary vertices during reconstruction. Inthe third method, the distribution of the number of interactions per bunchcrossing must be either known or assumed and the efficiency for detectingnon-empty events and the impact of noise events must be evaluated.After careful studies the HERA-B Collaboration has decided to exploit themethod based on counting events with evidence of at least one interaction(which is equivalent to the third method listed above), since this methodminimizes the systematic error on the luminosity determination allowing toachieve a final precision of about 5%.The paper is organized in the following way. In Sections 2 and 3 the mainfeatures of the HERA accelerator relevant for this analysis and the HERA-B detector are briefly described. Section 4 summarizes all of the publishedproton-nucleus cross section measurements which are used for the luminositydetermination. In Section 5 and 6, the relevant relations for the determinationof the luminosity are described. In Section 7 we discuss the systematic uncer-tainties and comment on delta ray production, while in Section 8 we reportthe results obtained for the interaction trigger (defined below) data sample.
2 The HERA accelerator and the target
HERA is a double storage ring designed for colliding a 920 GeV proton beamwith a 26 GeV electron beam. Four interaction regions exist: two of themhouse the general purpose ep detectors H1 and ZEUS, while the other twoaccommodate the fixed target experiments HERA-B and HERMES. In thefollowing we describe the beam parameters and the filling scheme used duringthe HERA-B data taking period 2002-2003.
The typical proton current is 80 mA, distributed over 180 bunches with atypical bunch length of 1-2 ns. The proton bunches are organized into 3x6trains of 10 consecutive bunches each, separated by one empty RF bucket. Thedetailed filling scheme is shown in Fig. 1. In total there are 220 RF bucketswith a spacing of 96 ns including a gap of 15 empty buckets at the end toprovide for a secure beam dump. The average rate of filled bunch crossings is8.52 MHz.
The target system [3] consists of two stations of four wires each. The wires arepositioned above, below, and on either side of the beam and are made fromvarious materials including carbon, titanium and tungsten. Both titaniumand tungsten targets are wires with a diameter of 50 µm, whereas the carbontarget is a flat ribbon, 100 µm perpendicular and 500 µm along the proton
5

Proton fill:
20 40 60 80 100 120 140 160 180 2000Bunch number
15x96 ns gap2x480 ns gap1x1440 ns gap
180 filled buckets (dark), including 6 pilot bunches (bright)
220
Fig. 1. Schematic representation of the bunch structure of a HERA proton-ring fill.
beam. The stations are separated by 40 mm along the beam direction. Thewires are positioned individually in the halo of the stored proton beam andthe interaction rate for each inserted wire is adjusted independently. Anynumber of wires can be operated simultaneously. The luminosity measurementdescribed herein applies exclusively to single wire runs.
The steering of the target wires requires a fast and reliable system to provide acounting rate proportional to the interaction rate up to the highest interactionrates envisaged in the HERA-B design (40 MHz). This is achieved by limitingthe acceptance of the scintillation counters used to detect interactions to ∼10−2. Stepping motors with a nominal step-size of 50 nm controlled by a 10 Hzsteering loop provide a stable interaction rate.
One additional complication is that a fraction (typically a few percent) ofinteractions not correlated to any bunch [4] was present. These interactionsare due to so-called coasting beam protons which have left the separatrix,but are still circulating inside the machine, forming a component of the beamhalo. Based on test measurements, the coasting beam can be regarded asa DC-current. The fraction of coasting beam depends on the position of thetarget and the history of the individual proton fill, thus requiring an individualcorrection for each run. As described in Section 7.6, the relevant informationcan be derived from events triggered by a pseudo-random generator.
3 The HERA-B detector and the data sample
The HERA-B experiment is a forward magnetic spectrometer with an accep-tance extending from 15 to 220 mrad horizontally and to 160 mrad vertically.This large angular coverage allows studies in kinematic regions not accessibleto previous fixed-target high energy experiments. A top view of the detectoris shown in Fig. 2. The first part of the spectrometer is devoted to tracking
6

Ring Imaging Cherenkov Counter
250 mrad
220 mrad
Magnet
Si-Strip VertexDetector
Calorimeter
TRD
Muon Detector
TargetWires
0 m 5 10 15 20
ProtonBeam
ElectronBeam
Vertex Vessel
Inner / Outer Tracker
high-pt
Al BeamPipe
x
z
Fig. 2. Top view of the HERA-B detector.
and vertex measurements and consists of the target, a silicon vertex detector,a magnet and a tracking system. The second part is focused on particle identi-fication and includes a Ring Imaging Cherenkov detector, an electromagneticcalorimeter and a muon detector.The vertex detector (VDS) [5] is placed between the target and the magnetand divided in 8 stations. Each station consists of four “quadrants” equippedwith two double-sided silicon microstrip detectors (50×70 mm2, 50 µm pitch)each. This system provides a primary vertex resolution of σz ∼ 500 µm alongthe beam direction and σx,y ∼ 50 µm in the transverse plane.A dipole magnet with a 2.13 Tm field-integral is positioned before themain tracking system. Each tracking station consists of several planes ofMSGC/GEM chambers placed near the beam pipe (Inner Tracker, ITR) [6]and several planes of Honeycomb Drift chambers which cover the rest of theacceptance (Outer Tracker, OTR) [7]. The detector segmentation is designedto cope with the particle flux variation with the distance from the beam pipe.Typical momentum resolutions of δp/p ∼ 1% are achieved.The particle identification of charged tracks (protons, kaons, etc.) is providedby a Cherenkov detector (RICH) installed downstream of the magnet. A β ∼ 1particle traversing the RICH detector produces an average of about 33 hits [8].The electromagnetic calorimeter (ECAL) [9], which provides electron pretrig-ger seeds and e/π separation, is installed after the RICH and the trackingsystem. The ECAL is a Shashlik sampling calorimeter with Pb or W as ab-sorber and scintillator as active material. In order to follow the steep radialdependence of the particle density, the calorimeter has been structured in threesections (Inner, Middle and Outer) with differing granularities. The Muon de-tector (MUON) [10] provides the muon pretrigger seeds and the muon identifi-cation, and is located in the most downstream part of the detector. It consistsof four superlayers embedded in an iron loaded concrete absorber. The sen-sitive area close to the beam pipe is covered by pixel chambers, while in therest of the acceptance, tube chambers are used.The flexibility of the trigger system [11] allows the implementation of a large
7

variety of trigger configurations. The methods described in this paper havebeen used to determine the integrated luminosity of the interaction trigger(IA) data sample. The IA trigger selects events with at least one inelasticinteraction in the target, by requiring either that the RICH has more than aminimum number of hits (20) or that the ECAL has more than a minimum(1 GeV) energy deposition. The total collected statistics is about 220 millionevents, with an average data acquisition (DAQ) rate larger than 1000 Hz.During the data acquisition a sample of randomly trigger events (Zero-Bias)was acquired in parallel to the IA trigger at a rate of few Hz, allowing the pos-sibility to check the trigger acceptance and stability. Moreover the Zero-Biasevent sample has been extensively used in the luminosity determination. Dueto the fact that the same data stream was used both for the various physicsanalyses and for the determination of the recorded luminosity, the dead timeof the DAQ system cancels exactly and can thus be ignored.
4 The cross sections
The total pA cross section σtot can be divided into elastic (σel) and inelastic(σinel) contributions:
σtot = σel + σinel = σel + σmb + σtsd + σbsd + σdd . (3)
In this context, the cross section σel is regarded as the sum of the elastic(pA → pA) and quasielastic contribution (pA → pA∗). The inelastic crosssection includes a minimum bias part (mb) and a diffractive part which canbe further subdivided into target single diffractive (tsd, pA → pY ), beamsingle diffractive (bsd, pA → XA) and double diffractive (dd, pA → XY )contributions.
The values for the total and inelastic cross sections reported in Table 1 wereobtained using the method of [12] with one exception: in order to minimize apossible systematic bias, we do not apply the Aα scaling law adopted there.Instead we use the experimental results on carbon and tungsten nuclei forthe total cross section of [13] and for the inelastic cross sections of [14,15,16].All of these measurements were obtained at beam momenta ranging from180 to 400 GeV/c and have to be scaled to 920 GeV/c with the prescriptiongiven in [17]. Due to the absence of data on titanium, the Aα scaling lawis applied only to interpolate the Al and Fe data of the experiments quoted.The elastic cross sections are obtained using Equation 3. The single diffractivecross sections are taken from [12]. The experimental results can be comparedto a theoretical calculation performed in the framework of the Glauber-Gribovtheory [18]. Both total and inelastic cross sections agree well within 5%, whilethe diffractive contributions exhibit larger discrepancies. As suggested by [19],
8
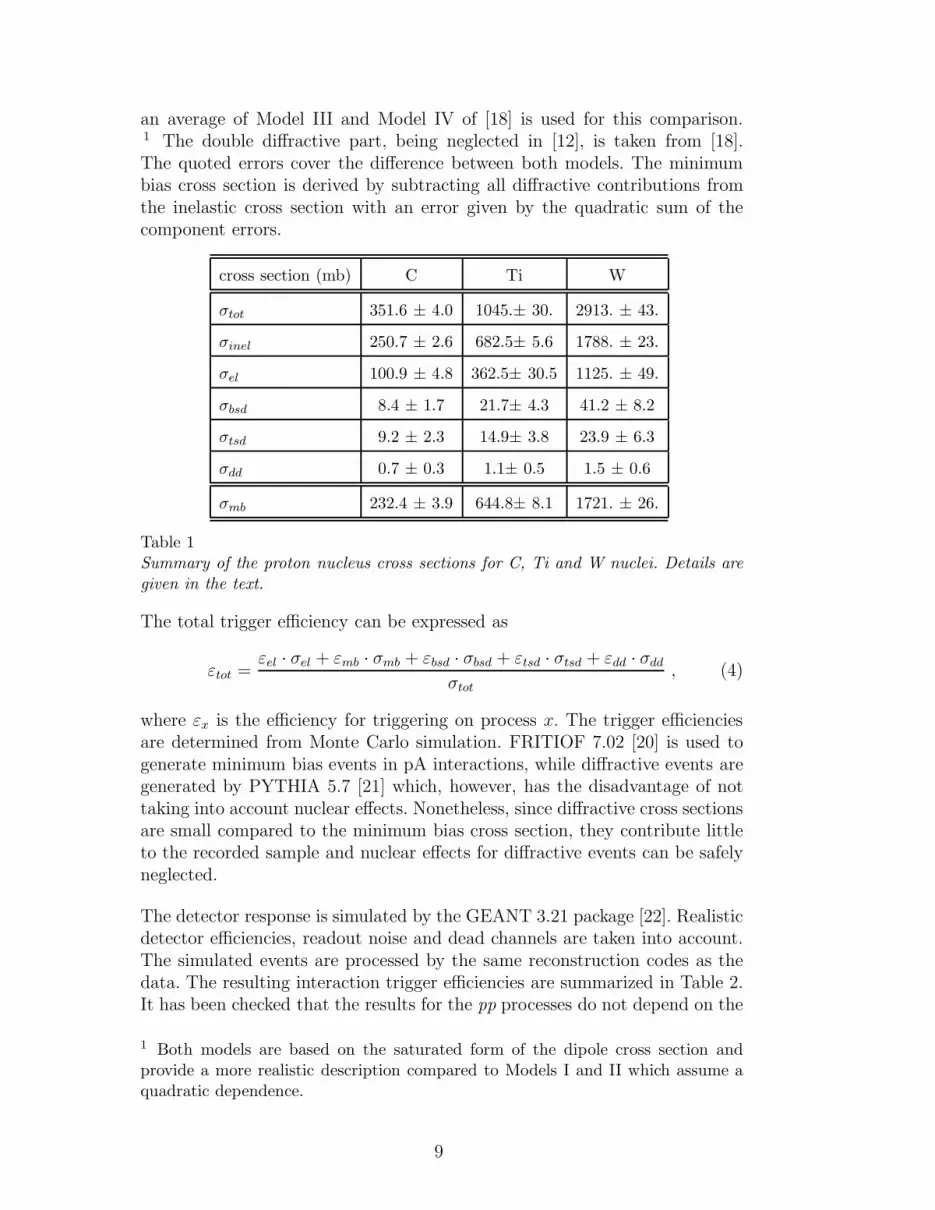
an average of Model III and Model IV of [18] is used for this comparison.1 The double diffractive part, being neglected in [12], is taken from [18].The quoted errors cover the difference between both models. The minimumbias cross section is derived by subtracting all diffractive contributions fromthe inelastic cross section with an error given by the quadratic sum of thecomponent errors.
cross section (mb) C Ti W
σtot 351.6 ± 4.0 1045.± 30. 2913. ± 43.
σinel 250.7 ± 2.6 682.5± 5.6 1788. ± 23.
σel 100.9 ± 4.8 362.5± 30.5 1125. ± 49.
σbsd 8.4 ± 1.7 21.7± 4.3 41.2 ± 8.2
σtsd 9.2 ± 2.3 14.9± 3.8 23.9 ± 6.3
σdd 0.7 ± 0.3 1.1± 0.5 1.5 ± 0.6
σmb 232.4 ± 3.9 644.8± 8.1 1721. ± 26.
Table 1Summary of the proton nucleus cross sections for C, Ti and W nuclei. Details aregiven in the text.
The total trigger efficiency can be expressed as
εtot =εel · σel + εmb · σmb + εbsd · σbsd + εtsd · σtsd + εdd · σdd
σtot
, (4)
where εx is the efficiency for triggering on process x. The trigger efficienciesare determined from Monte Carlo simulation. FRITIOF 7.02 [20] is used togenerate minimum bias events in pA interactions, while diffractive events aregenerated by PYTHIA 5.7 [21] which, however, has the disadvantage of nottaking into account nuclear effects. Nonetheless, since diffractive cross sectionsare small compared to the minimum bias cross section, they contribute littleto the recorded sample and nuclear effects for diffractive events can be safelyneglected.
The detector response is simulated by the GEANT 3.21 package [22]. Realisticdetector efficiencies, readout noise and dead channels are taken into account.The simulated events are processed by the same reconstruction codes as thedata. The resulting interaction trigger efficiencies are summarized in Table 2.It has been checked that the results for the pp processes do not depend on the
1 Both models are based on the saturated form of the dipole cross section andprovide a more realistic description compared to Models I and II which assume aquadratic dependence.
9

wire position. The small increase of the minimum bias efficiency with increas-ing atomic mass number is correlated to the increasing track multiplicity.
Process Generator pp C Ti W
εel PYTHIA 0.003
εbsd PYTHIA 0.583
εtsd PYTHIA 0.370
εdd PYTHIA 0.578
εmb PYTHIA 0.941
εmb FRITIOF 0.933 0.953 0.970
εtot Eq. 4 0.642 0.607 0.586
KA Eq. 5 0.960 0.969 0.978
Table 2IA trigger efficiencies for the various processes. KA is defined in Equation 5.
From these numbers we can conclude that the elastic contribution is negligi-ble and that the diffractive processes are suppressed. The dominance of theminimum bias part can be illustrated by calculating its detectable fraction KA
KA =σmb · εmb
σtot · εtot
(5)
given in Table 2. The impact of the uncertainties on luminosities and triggerefficiencies will be discussed in Section 7.2.
5 General remarks on the luminosity determination
In the following, the luminosity given by Equation 2 will be expressed in termsof the total number of events satisfying the IA trigger (NIA), the averagenumber of interactions per bunch crossing (λtot), the trigger efficiency persingle interaction (ǫtot) and the total hadronic cross section (σtot). In order todo this, two assumptions are made:
• the number of interactions per filled bunch can be described by a singlePoisson distribution P (n, λtot), for all bunch crossings in a given data run:
P (n, λtot) =λn
tote−λtot
n!, (6)
10

• the trigger efficiency for n interactions, (εtot)n, is given by:
(εtot)n = 1 − (1 − εtot)n (7)
where εtot is the trigger efficiency for single interaction.
A test of the validity of the first assumption is discussed in Section 7.4, whilethe second assumption has been checked in Monte Carlo studies and by check-ing the dependence of the measured λtot with interaction rate as measured bythe target steering scintillator hodoscopes (see Section 7.5).
With these assumptions, the total number of recorded triggers resulting frominteractions in the target, NIA, is given by:
NIA = NBX ·∞∑
n=0
(P (n, λtot) · (εtot)n) = NBX ·(
1 − e−εtot·λtot
)
(8)
where NBX is the total number of BXs considered. From this equation, giventhe general relationship of Equation 2, we finally obtain
Ltot =NIA · λtot
(1 − e−εtot·λtot) · σtot
. (9)
Because the product ε · λ is typically ≈ 10% for our data taking conditions,the measured luminosity is, to first order, inversely proportional to the triggerefficiency and the cross section, while the average number of interactions, λtot,enters only as a second order correction.
In Equation 9, NIA can be expressed as a function of the number of recordedtriggers (Ntape) and of the number of background events (Nbkg):
NIA = Ntape − Nbkg = Ntape · (1 − fbkg) (10)
where fbkg is the fraction of background events in the sample (see Section 7.6).
Since, as discussed in Section 4, the recorded event sample is dominated byminimum bias interactions, the luminosity can be expressed as a function ofminimum bias quantities
Ltot =Ntape · (1 − fbkg) · λmb
(1 − e−εmbλmb) · σmb
· KA, (11)
where KA is defined in Section 4 and λmb is defined in Section 6. This is thefinal expression which will be used to determine the luminosity for each run.
11
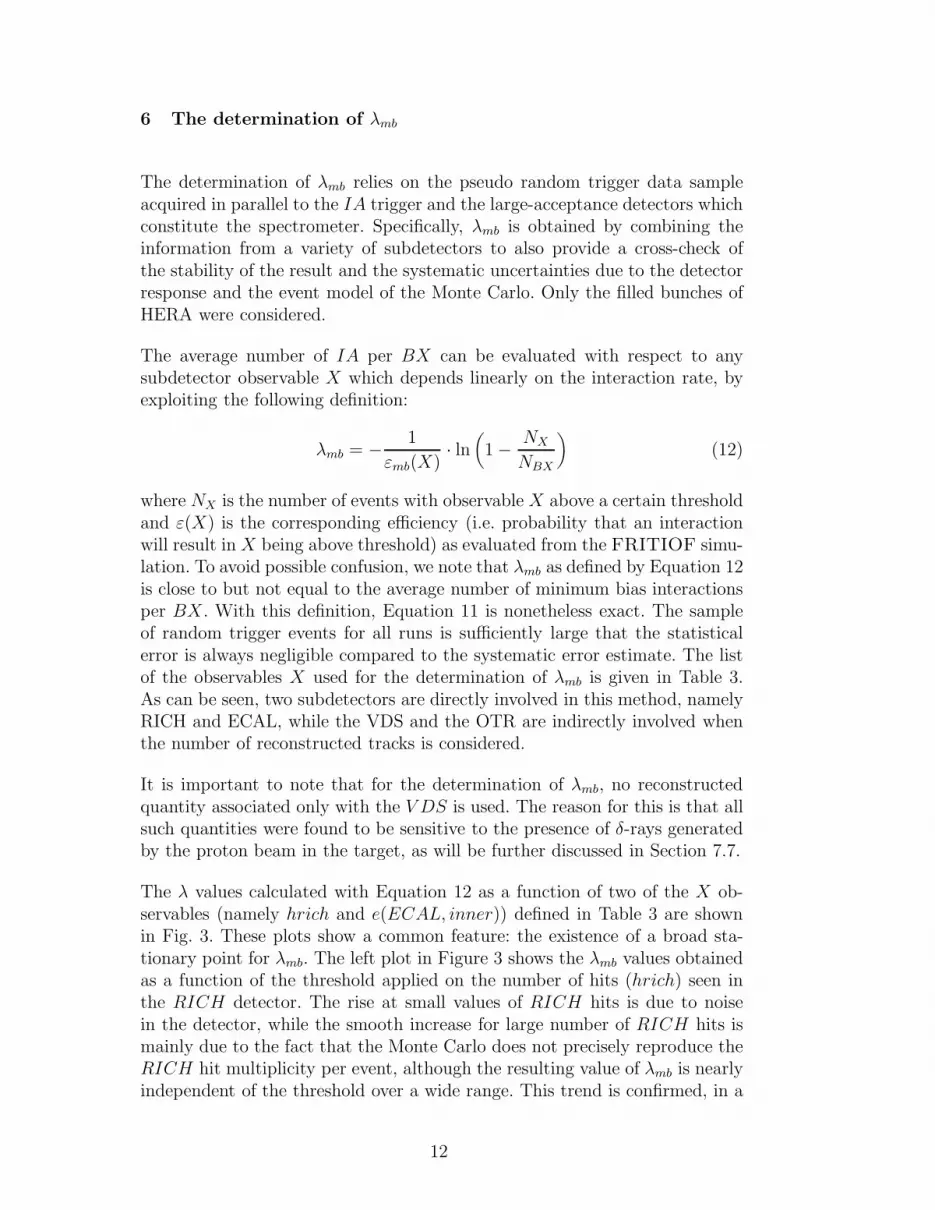
6 The determination of λmb
The determination of λmb relies on the pseudo random trigger data sampleacquired in parallel to the IA trigger and the large-acceptance detectors whichconstitute the spectrometer. Specifically, λmb is obtained by combining theinformation from a variety of subdetectors to also provide a cross-check ofthe stability of the result and the systematic uncertainties due to the detectorresponse and the event model of the Monte Carlo. Only the filled bunches ofHERA were considered.
The average number of IA per BX can be evaluated with respect to anysubdetector observable X which depends linearly on the interaction rate, byexploiting the following definition:
λmb = − 1
εmb(X)· ln
(
1 − NX
NBX
)
(12)
where NX is the number of events with observable X above a certain thresholdand ε(X) is the corresponding efficiency (i.e. probability that an interactionwill result in X being above threshold) as evaluated from the FRITIOF simu-lation. To avoid possible confusion, we note that λmb as defined by Equation 12is close to but not equal to the average number of minimum bias interactionsper BX. With this definition, Equation 11 is nonetheless exact. The sampleof random trigger events for all runs is sufficiently large that the statisticalerror is always negligible compared to the systematic error estimate. The listof the observables X used for the determination of λmb is given in Table 3.As can be seen, two subdetectors are directly involved in this method, namelyRICH and ECAL, while the VDS and the OTR are indirectly involved whenthe number of reconstructed tracks is considered.
It is important to note that for the determination of λmb, no reconstructedquantity associated only with the V DS is used. The reason for this is that allsuch quantities were found to be sensitive to the presence of δ-rays generatedby the proton beam in the target, as will be further discussed in Section 7.7.
The λ values calculated with Equation 12 as a function of two of the X ob-servables (namely hrich and e(ECAL, inner)) defined in Table 3 are shownin Fig. 3. These plots show a common feature: the existence of a broad sta-tionary point for λmb. The left plot in Figure 3 shows the λmb values obtainedas a function of the threshold applied on the number of hits (hrich) seen inthe RICH detector. The rise at small values of RICH hits is due to noisein the detector, while the smooth increase for large number of RICH hits ismainly due to the fact that the Monte Carlo does not precisely reproduce theRICH hit multiplicity per event, although the resulting value of λmb is nearlyindependent of the threshold over a wide range. This trend is confirmed, in a
12

X DESCRIPTION
hrich number of reconstructed hits in the RICH detector
e(ECAL,inner) total energy deposition in the ECAL inner section (GeV)
e(ECAL,middle) total energy deposition in the ECAL middle section (GeV)
e(ECAL,outer) total energy deposition in the ECAL outer section (GeV)
e(ECAL,ECAL) total energy deposition in full ECAL (GeV)
nclus(ECAL) number of reconstructed electromagnetic clusters in ECAL
hecal number of hit towers in ECAL
ntra number of reconstructed tracks (VDS+OTR)
Table 3Description of the eight X quantities used to determine λmb.
Fig. 3. Two typical distributions for the measured average number of interactionsper bunch crossing as a function of the cut on different reconstructed quantities forthe tungsten target wire. The distributions for RICH (number of reconstructed hitsper event , -hrich-), ECAL (total energy released per event in the inner section ofthe calorimeter, -e(ECAL, inner)-) are shown.
more or less pronounced way (see e.g. the right plot of the same Figure), alsofor the other variables listed in Table 3.As a consequence, for each observable, as the best estimate of λmb the value(λmin(X)) is taken to be its minimum value. The best evaluation of λmb isthen defined as:
λmb =∑
X=1,8
λmin(X)
8(13)
The values of λmin(X) obtained from all are in good agreement and theirspread is used as a measure of the systematic uncertainty.
13

7 Systematic uncertainties and checks
7.1 General Considerations
According to Equation 11 and the assumption on which Equation 6 is based,the following systematic uncertainties must be taken into account:
• the uncertainty on KA, arising from the Monte Carlo (MC ) event modeland the poorly known observation probability of diffractive processes;
• the uncertainty on the determination of λmb;• the uncertainty associated with deviations of the interaction probability
distribution from the assumed Poisson distribution (e.g. due to the unevenfilling of bunches);
• the uncertainty associated with possible out-of-time interactions (i.e. coast-ing beam interactions) and fake triggers from detector noise.
No systematic uncertainty due to reconstruction efficiency appears on thislist since possible systematic biases due to reconstruction are included in thesystematic uncertainty assigned to λmb.
The determination of Ltot could, however, be biased if the on-line trigger doesnot operate according to expectations. Possible triggering errors are checkedfor by using special bits written into the event record to indicate the triggerdecision. The online trigger requirements are imposed offline on the sample ofrandom trigger events taken with each IA trigger run and compared to thethe online decision. It is found that there is no significant inefficiency from theonline trigger while the percentage of spurious triggers due to electronic mis-behavior is typically at level of a few per thousand. Some additional maskingof noisy channels is found to be necessary, although the effect on the triggeracceptance is negligible. We conclude that the trigger performed according toexpectations and introduces no additional biases on the measurement of Ltot.
The general expression for the squared relative uncertainty on the luminosityfollows from Equation 11:
(
δLtot
Ltot
)2
=δKA
KA
⊕ δλmb
λmb
⊕(
δLL
)
bkg
⊕(
δLL
)
Pois
, (14)
which is the quadratic sum of the relative systematic uncertainties on KA (seeSection 7.2), on λmb (see Section 7.3), on the background and on the Poissonassumption (see Equation 6). The last two sources of systematic uncertaintywill be discussed in Sections 7.4 and 7.6 respectively. Finally, to separate themeasurement uncertainties from the uncertainties on the present knowledge ofthe total cross section (KA term), the following quantity (which will be used
14

in Section 8) is defined:
(
δLtot
Ltot
)2
det
=δλmb
λmb
⊕(
δLL
)
bkg
⊕(
δLL
)
Pois
. (15)
7.2 Uncertainty on KA
The relative uncertainty ( δKA
KA) on the detectable fraction KA (defined in Equa-
tion 5) depends on the uncertainties of the cross sections, quoted in Table 1,and on the trigger efficiencies of the various production processes. Given thepoor knowledge of the structure of final states produced by diffractive pro-cesses, the trigger efficiencies are assumed to be fully unknown but limited tothe range from 0 to 1. Thus, an error of σεbsd
= σεtsd= σεdd
= 1√12
is assigned.The error on εmb is not included here as discussed in Section 7.1. The resultinguncertainties are summarized in Table 4.
KAδKA
KA
C 0.960 0.023
Ti 0.969 0.018
W 0.978 0.016
Table 4Detectable fractions and their relative uncertainty for carbon, titanium and tungsten.
7.3 Uncertainty on λmb
The method used to determine λmb is influenced by the Monte Carlo descrip-tion of the HERA-B detector as well as the event model of the event generator.The resulting uncertainty on λmb is taken to be the rms spread of the λmb
values calculated with Equation 13. The typical values obtained are
δλmb
λmb
≃ 0.04 , (16)
or better, depending on the target material.Possible sources of systematic uncertainty related to the way λmb is determinedhave been investigated. For example, examination of the observables given inTable 3 shows that six of them involve ECAL and are thus possibly subjectto correlated systematic effects while RICH and VDS+OTR appear only with
15

one variable each. For this reason an alternative quantity λ′mb is defined as:
λ′
mb =
λopt (1) +∑
X=2,7
λopt(X)6
+ λopt (8)
3. (17)
The relative discrepancy of λmb and λ′mb is given by:
(
δλmb
λmb
)
method
=λmb − λ′
mb
λmb
. (18)
The mean value of the distribution of this quantity is found to be statisticallycompatible with zero and its rms width is ≈ 0.006 or better, depending ontarget material. The smallness of this term, compared to the overall systematicuncertainty on λmb (see Equation 16), shows that the calculation of λmb isinsensitive to the relative weights given to the various methods.
7.4 Uncertainty on the distribution of the number of IA per BX
One important assumption is that the number of interactions per HERA ma-chine bunch follows a Poisson distribution (see Equation 6). In order to eval-uate the systematic uncertainty associated to the non-Poisson behavior of theBX population, the total luminosity can alternatively be measured for eachrun, also as a sum over all the BX contributions, i.e.:
(Ltot)BX =KA
σmb
·180∑
i=1
NIAi· λmbi
(
1 − e−εmbλmbi
) . (19)
The quantity (Ltot)BX is then compared with the total luminosity calculatedaccording to the basic procedure (see Equation 11). In this way, we can definethe systematic uncertainty due to the non Poisson behavior of the beam as:
(
δLL
)
Pois
=Ltot − (Ltot)BX
Ltot
. (20)
The mean of the distribution of this quantity for all the runs with more than3 · 105 events shows a slight shift (≈ 0.4%) toward negative values. The rmsof the distribution is ≈ 0.009 or better, depending on target material.
16

7.5 The dependence of λmb on the target interaction rate
The dependence of λmb, as determined by the method of Section 6, on thetarget steering hodoscope rate (Rhod) was checked. In general the dependenceshould be linear at sufficiently low interaction rate.
For each of the three target materials (C, Ti and W), λmb was determined forhodoscope interaction rates of 0.3, 0.5, 1, 3, 5 and 10 MHz. For each target,the resulting λmb values, excluding the 10 MHz point, were fit to a straightline. The results of the fit for carbon and tungsten target wires are shown inFig. 4. The 10 MHz point lies below the fit line indicating possible saturationof the hodoscopes or possibly a breakdown of the Poisson assumption at highinteraction rates. The normalized χ2 of the linear fit is about one or better(for all three set of runs) and indicates a linear relation between interactionrates measured by two very different techniques for rates up to 5 MHz. Thisin turn supports the two assumptions made in Section 5 since the hodoscoperates do not rely on the Poisson assumption and compensating non–linearitiesin the two methods are unlikely.
Fig. 4. Test of linear dependence of the λmb values determined with the methoddescribed in Section 6 with respect to the target interaction rate measured by thescintillator hodoscope system for the carbon (left plot) and tungsten (right plot)target wires.
7.6 Background estimate
As shown in Equation 10, the number of recorded events must be corrected forbackground events either from fake triggers (e.g. electronic noise in the RICH)or from coasting beam interactions (beam-gas interactions and background
17

from interactions upstream of the target are negligible). The best method todetermine the fraction of background events is to compare empty and filledbunches using the random trigger events. For this purpose the interactiontrigger requirements are applied offline to the random trigger events whichare equally distributed over all 220 bunches. Normalizing to the 180 filledbunches, we obtain
f ′bkg =
180
40×(
Ntape(empty BX)
Ntape(filled BX)
)
. (21)
A small (approximately 5%) correction is made to account for “in-time” coast-ing beam interactions which are well synchronized in time with the detector’sintegration gates and thus are no different from ordinary interactions frombunched beam protons.
The resulting values for fbkg from the random trigger sample are summarizedin Table 5 and used in Equation 11. To estimate the uncertainty on fbkg,the software trigger thresholds are varied over a wide range. The uncertainty,δLbkg, is obtained by dividing the difference of the extreme values by
√12. The
uncertainties due to the in-time coasting beam correction discussed above arenegligible compared to the uncertainties given in the Table.
fbkg
(
δLL)
bkg
C 0.031 0.018
Ti 0.057 0.023
W 0.026 0.019
Table 5The fraction of background events fbkg for each target wire and the relative system-atic uncertainty.
7.7 Production of δ-rays in the target
The presence of δ-rays in the data sample (see Section 6) is both a nuisance,since it compromises the VDS based methods, and an opportunity for a sys-tematic check of the luminosity calculation, since the luminosity can be esti-mated from the observed rate of δ-ray production. The results of a study ofδ-ray production applied to a run taken with the carbon target sample arepresented and compared to the luminosity estimates given in Section 6. Withfurther development, the techniques presented here could be used for a preciseluminosity determination in experiments using thin targets.
18

The luminosity for a fixed-target experiment in a proton beam is proportionalto the sum of target path lengths of all protons (Ntot) which traverse thetarget:
L =ρNA
A·
Ntot∑
i=1
zi (22)
where A is the atomic mass of the target material, NA is Avogadro’s number,ρ is the target density in (g/cm3) and zi is the length of the target traversedby the ith proton.
The number of δ-rays (Nδ,prod) produced in a kinetic energy (T ) interval fromTmin to Tmax is proportional to the same summed target length [17]:
Nδ,prod = 0.154Z
Aρ
Ntot∑
i=1
zi ·∫ Tmax
Tmin
dT
T 2≈ 0.154
Z
A
ρ
Tmin
Ntot∑
i=1
zi (23)
where Z, A, and ρ are the atomic number, atomic mass and density (in g/cm3)of the target and T is in MeV. Tmax is approximately 475GeV for 920GeVincident protons.
Combining Equation 22 and Equation 23 results in the following equation re-lating luminosity to the number of produced δ-rays:
L =NATmin
0.154Z· Nδ,prod =
NATmin
0.154Z· Nδ,obs
εδ
, (24)
where Nδ,obs is the number of observed δ-rays and εδ is the average probabilitythat the δ-ray escapes the target and is reconstructed.
The δ-ray detection efficiency (εδ) is evaluated by Monte Carlo. The δ-raysare generated according to Equations 27.5 and 27.6 of [17] with a minimumkinetic energy threshold of 1MeV and tracked through the target and de-tector using the GEANT3-based [22] HERA-B simulation program. Sincethe VDS has acceptance for tracks from the target in the polar angularinterval 0.01 . θ . 0.7 rad, corresponding to a δ-ray momentum range of1.88 . pδ . 10220 MeV/c (see Equation 27.6 of [17]), the 1MeV kinetic energythreshold corresponds to δ-rays which are well outside the detector acceptance.The generated Monte Carlo events are subjected to the same reconstructionand analysis code (see below) used for the data.
An average efficiency of ≈ 7% after all cuts is found. We estimate a 15%relative systematic uncertainty on this number coming from uncertainties inthe material distribution in the vertex detector and from sensitivity to MonteCarlo parameters, in particular to the minimum kinetic energy cutoff for track-ing by GEANT, nominally set to 30 keV. (These sources of systematic errorcould in principle be greatly reduced by a more precise inventory of detector
19

materials and by a more thorough study of the tracking of very low momentumelectrons.)
Candidate δ-rays are reconstructed using the standard HERA-B VDS recon-struction software applied to a pseudo-random-triggered carbon target run andthen searched for in events from filled bunch crossings which do not pass theIA trigger condition. Distributions of track parameters and derived quantitiesfrom the δ-ray Monte Carlo and data are found to be in close agreement whensegments which extrapolate to near the average vertex position of hadronic in-teractions are removed. Such tracks are typically high momentum tracks fromhadronic pN interactions.
We define the impact parameter of a track as the difference between the aver-age position of vertices from hadronic interactions (and therefore the averageimpact point of the beam on the wire target) and the track’s position whenextrapolated to the Z-position of the target. Figure 5(a) shows the X-viewimpact parameter (Xip) distribution of reconstructed VDS segments in non-IA events which contain a single reconstructed segment with |Xip| > 1 mmwhich originates in the first VDS layer. The cut on Xip removes a signal fromhigh-momentum tracks from hadronic pN interactions (approximately 1/4 ofthe removed tracks form a narrow peak above the relatively broad distributionshown in the figure). The data, indicated by the histogram, and the MonteCarlo, indicated by the points with error bars, are in good agreement. Notethat the width of the Xip distribution is largely determined by multiple scatter-ing in the VDS and therefore depends on the momentum of the reconstructedtracks. The close match between data and Monte Carlo implies that the mo-mentum spectra of reconstructed tracks in data and the δ-ray Monte Carloare similar. Figure 5(b), showing the distribution of the X-view impact pointsof the same tracks used in Figure 5(a) at the first VDS layer, also illustratesthe good agreement between data and Monte Carlo. The corresponding distri-butions in the Y -view also agree well with each other as do the distributionsof track polar angles. The overall close agreement strongly suggests that theobserved tracks are indeed caused by δ-rays originating in the target. Furtherevidence that the observed tracks are associated with beam protons traversingthe target comes from the greatly reduced rate of such tracks in empty bunchcrossings: ≈ 3% of the rate in filled bunch crossings.
The observed rate of δ-ray candidates is 0.068±0.003 per BX. When the sameevent and track selection criteria are applied to the minimum bias MonteCarlo, a rate of 5 · 10−4 candidates per interaction is observed, or approxi-mately 10−4 candidates per BX for the analyzed run. The rate of target singlediffractive events (0.004 per BX, see Table 1) is also small compared to the ob-served rate. We conclude that the observed tracks cannot be due to hadronicinteractions.
20

b)
X(cm)
a)
Xip(cm)
Fig. 5. a) The distribution of Xip for selected tracks (see text). b) The distributionof X-view impact points on the first VDS detector layer, for the same tracks usedin part a. In both cases, the data is indicated by the histogram and the Monte Carloby the points with error bars.
Assuming that the observed tracks are indeed δ-rays, Equation 24 gives a lu-minosity estimate of 633 ± 28 ± 95 mb−1 per BX, to be compared with theluminosity estimate of 688 ± 35 mb−1 computed using the method describedin Section 6. The agreement within errors lends further credence to the hy-pothesis that the tracks described in this section are δ-rays from the targetand also serves as a cross-check of the method of Section 6.
8 Summary and conclusions
As previously noted the uncertainties affecting the total luminosity measure-ment are dominated by the systematic contribution, since each IA trigger runcontains enough random trigger events to make the contribution from statis-tics negligible. In Table 6 we summarize the overall relative uncertainty on thetotal luminosity calculation
(
δLtot
Ltot
)
. In the second column the uncertainty onKA is given. This contribution depends on the present knowledge of the crosssections (see Table 1) and can in principle be improved in the future. Thefollowing three columns list individual contributions to the systematic uncer-tainty on detection which are combined according to Equation 15 to give thetotal detection uncertainties shown in the sixth column.
When the method described in this paper is applied to the 2002 HERA-Bminimum bias data taking period, the following integrated luminosities areobtained for each of the three target materials:
Ltot,C = 405.8 ± 9.3 ± 17.9 µb−1
Ltot,T i = 30.9 ± 0.6 ± 1.5 µb−1
Ltot,W = 38.3 ± 0.6 ± 1.5 µb−1
where the first error corresponds to the uncertainty on KA and second sum-marizes the remaining uncertainty mainly due to the HERA-B experimental
21

δKA
KA
δλmb
λmb
(
δLL)
Pois
(
δLL)
bkg
(
δLtot
Ltot
)
det
δLtot
Ltot
(
δLtot
Ltot
)
uc
C 0.023 0.039 0.009 0.018 0.044 0.050 0.039
Ti 0.018 0.042 0.009 0.023 0.049 0.052 0.042
W 0.016 0.032 0.010 0.019 0.039 0.042 0.029
Table 6Values of the contributions to the relative systematic uncertainty and overall relativesystematic uncertainty on the total luminosity calculation ( δLtot
Ltot). The uncorrelated
part(
δLtot
Ltot
)
ucis given in the last column.
conditions. The overall systematic uncertainty can then be obtained as thequadratic combinations of these two terms.
The method for luminosity measurement described in this paper is based onthe determination of the average number of interactions per bunch crossing, λ,and on the knowledge of the total interaction cross section σ (see Equation 2).The availability of a small fraction (few percent) of events acquired in parallelto the main stream of data with a completely unbiased trigger (pseudo-randomtrigger) was used to evaluate λ on run by run basis.
The measurement of λ has been performed by exploiting the information froma variety of subdetectors, without the use of any dedicated device. This strat-egy allowed to perform consistency checks and to obtain a conservative deter-mination of the systematic uncertainties of the measurement.
In case the three data sets will be combined to determine the A-dependenceof a cross section, possible correlations between the systematic errors have tobe taken into account. The correlated error is dominated by the uncertaintyon λmb and the background correction and is estimated to be ∼ 3%. Thecorrelation coefficients vary between 0.90 and 0.92 for pairs of wires. 2 Theuncorrelated part of the systematic uncertainty
(
δLtot
Ltot
)
uccan be found in the
last column of Table 6.
The same strategy could be applied in future experiments such as those underconstruction at the LHC at CERN in Geneva, once the corresponding crosssections have been measured.
2 At the time of publication of [23,24], the correlated error was estimated to be2%, rather than the updated and more accurate value (3%) presented here. A re-calculation of the values and errors reported in [23,24] using this updated estimateresults in negligable changes.
22

9 Acknowledgments
We are grateful to the DESY laboratory and to the DESY accelerator groupfor their strong support since the conception of the HERA-B experiment. TheHERA-B experiment would not have been possible without the enormouseffort and commitment of our technical and administrative staff.
References
[1] E. Hartouni et al., An Experiment to Study CP Violation in the B System Usingan Internal Target at the HERA Proton Ring, Design Report, DESY-PRC 95/01(1995).
[2] The HERA B Collaboration, Report on Status and prospects, DESY-PRC 00/04(October 2000).
[3] K. Ehret, Nucl. Instr. Meth. A 446 (2000) 190.
[4] K. Ehret et al., Nucl. Instr. Meth. A 456 (2001) 206.
[5] C. Bauer et al., Nucl. Instr. Meth. A 501 (2003) 39.
[6] T. Zeuner et al., Nucl. Instr. Meth. A 446 (2000) 324;Y. Bagaturia et al., Nucl. Instr. Meth. A 490 (2002) 223.
[7] H. Albrecht et al., Nucl. Instr. Meth. A 541 (2005) 610;H. Albrecht et al., Nucl. Instr. Meth. A 555 (2005) 310.
[8] I. Arino et al., Nucl. Instr. Meth. A 516 (2004) 445.
[9] A. Zoccoli et al., Nucl. Instr. Meth. A 446 (2000) 246;G. Avoni et al., Nucl. Instr. Meth. A 461 (2001) 332.
[10] V. Eiges et al., Nucl. Instr. Meth. A 461 (2001) 104.
[11] V. Balagura et al., Nucl. Instr. Meth. A 494 (2002) 526;T. Nunez et al., Nucl. Phys. B Proc. Suppl.120 (2003) 166;M. Dam et al., Nucl. Instr. Meth. A 525 (2004) 566.
[12] J. Carvalho, Nuclear Physics A725 (2003) 269.
[13] P.V.R. Murthy, et al., Nucl. Phys. B92 (1975) 269.
[14] A.S. Carroll, et al., Phys. Lett. B80 (1979) 319.
[15] F. Fumuro, et al., Nucl. Phys. B152 (1979) 376.
[16] T.J. Roberts, et al., Nucl. Phys. B159 (1979) 56.
[17] W.-M. Yao et al., Review of Particle Physics, Journ. of Phys. G 33 (2006) 1.
23

[18] B.Z. Kopeliovich, I.K.Potashnikova and I. Schmidt, Phys. Rev. C 73 (2006)034901.
[19] B.Z. Kopeliovich, private communication.
[20] H. Pi, Comp. Phys. Comm. 71 (1992) 173.
[21] T. Sjostrand, Comp. Phys. Comm. 82 (1994) 74.
[22] R. Brun et al., GEANT3, Internal Report CERN-DD/EE/84-1, CERN (1987).
[23] I. Abt et al. (HERA-B collaboration), Phys. Lett. B638, (2006) 407.
[24] I. Abt et al. (HERA-B collaboration), Eur. Phys. J. C 50, (2007) 315.
24


