Embed Size (px)
Citation preview

M2D2 Freight Logistics Workshop
Welcome & Introduction

Michigan State University Advancing Knowledge, Transforming Lives
• More than 50,000 students each year have access to more than 200 undergraduate and graduate programs in 17 degree-‐gran;ng colleges including the affiliated MSU College of Law.
• U.S. News and World Report recently ranked 24 different academic programs at MSU in the top 25 in the na;on.
• MSU has a prolific record of genera;ng na;onal award winning students, with more Rhodes Scholars than any other Big Ten university in the last genera;on.
• The university is a na;onal leader in sending students to study abroad, with a quarter of all students par;cipa;ng.
• Faculty and students have conducted groundbreaking research in top-‐rated programs like Bio-‐Physical Sciences, Packaging, and Supply Chain Management that advances knowledge and transforms lives.

The Eli Broad College of Business Spartans Will. Make Business Happen.
• Home to nearly 5,000 undergraduate students and more than 700 graduate students each year.
• Consistently ranked among the top business schools by na;onal recruiters and alumni.
• Houses six departments of study, eight undergraduate concentra;ons, nine Masters-‐level programs, five Ph.D. programs and a number of dynamic execu;ve development programs.
• Broad College alumni hold prominent posi;ons as execu;ves and consultants for Fortune 500 companies all over the world.
• Broad College aspires to be the leader in crea;ng knowledge and developing transforma;onal thinkers and doers who make business happen.

Department of Supply Chain Management Nationally Recognized
Supply Chain/Logistics Programs #1 Massachusetts Institute of Tech. (Sloan) #2 Michigan State University (Broad) #3 Arizona State University (Carey) #4 Carnegie Mellon University (Tepper) #5 Stanford
Supply Chain/Logistics Programs #1 Michigan State University (Broad) #2 Massachusetts Institute of Tech. (Sloan) #3 Arizona State University (Carey) #4 Ohio State University (Fisher) #5 Penn State University (Smeal)
M2D2 Freight Logistics Workshop
• Name • Title, position and/or organization • Primary responsibilities • What do you hope to learn from today’s
session?
BRIEF INTRODUCTIONS

OBJECTIVES
• Broaden understanding of today’s commercial mul;-‐modal supply chains, including the freight logis;cs system; and
• Encourage discussion of the benefits of becoming a transporta;on facilitator, including the role of safety, modal choice, etc.
STRUCTURE
• Supply chain management overview
• Role of supply chain decisions in firm strategy
• How do firms make supply chain decisions
• Industry applica;ons/examples
Program Objectives and Structure


Trade Facts
• US/Canadian trade totaled $616 billion in 2012. That value is greater than the GDP of all but the largest 20 countries in the world based on IMF’s 2011 GDP ranking
Poland Belgium Argentina

Larger Ships, Changing Landscape

Strategy Attributes
• Business Focused • Collaboration • Leverage our Assets

Regional Strategy
• Michigan • Great Lakes States • Ontario • Port Cities

Great Lakes MEGA Region

Multi-Modal
• Surface- Truck and Rail • Air and Ship • Intermodal Hubs • International Border Crossings

Strategy Focus
• Lower Cost
• Reduce Time
• Remove Risk

Competitive Advantages
Infrastructure Loca;on
Industry Supply Chain Capability

Strategy Actions
• Infrastructure
• Business Development

Michigan Logistics & Supply Chain Strategy
• Truck • Rail • Air • Ship • Intermodal Hubs • International Boarder
Crossing
Multi-Modal

Implementation Acceleration Launched October 1, 2013
2013 – 2020 Strategy Actions
Michigan Logistics & Supply Chain Strategy
Construct the New International Trade Crossing between Detroit and Windsor
Develop, improve and connect intermodal freight hubs at strategic locations in Michigan
Support the development and improvement of air cargo facilities at strategic airports
Identify and deliver infrastructure enhancements that capitalize on and support the growth of core Michigan industries
Identify and promote competitive transportation freight corridors
Develop a targeted marketing campaign Promote and develop logistics and supply
chain talent Identify niche market opportunities Identify and develop innovative supply chain
solutions and tools Develop a permanent organizational structure
to coordinate business, government and academia

Questions
• www.michiganbusiness.org/lsc

M2D2 Freight Logistics Workshop
Overview of Freight at FDOT
M2D2 Freight Logistics Workshop
Supply Chain Management Overview

EXAMPLE DEFINITIONS
The design and management of seamless, value-added process across organizational boundaries to meet the real needs of the end customer
Institute for Supply Management
Managing supply and demand, sourcing raw materials and parts, manufacturing and assembly, warehousing and inventory tracking, order entry and order management, distribution across all channels, and delivery to the customer
The Supply Chain Council
What is Supply Chain Management

Supply Chain Management encompasses the planning and management of all ac;vi;es involved in sourcing and procurement, conversion, and all Logis;cs Management ac;vi;es. Importantly, it also includes coordina;on and collabora;on with channel partners, which can be suppliers, intermediaries, third-‐party service providers, and customers. In essence, Supply Chain Management integrates supply and demand management within and across companies.
Council of Supply Chain Management Professionals
The On Demand Supply Chain is a supply chain-‐integrated end-‐to-‐end across the en;re opera;ons of a company and with key partners, suppliers, and clients, from opportunity to cash -‐-‐ that can sense and respond with flexibility and speed to any client demand, market opportunity, or change in the market place -‐-‐ no maYer how frequent or sudden.
IBM Corpora<on
What is Supply Chain Management

• Focus on end-consumer
• Integration within the firm and across supply chain partners
• Requires execution of sequence of functions
• Operates within resource constraints
Common Definition Themes

What is Supply Chain Management
• Old paradigm - Firm gained synergy as a vertically integrated organization encompassing the ownership and coordination of several supply chain activities.
• New paradigm - Firm in a supply chain focuses activities in its area of specialization and enters into voluntary and trust-based relationships with supplier and customer firms (need to consider internal and external relationships).

Product
Order processing and information
costs
Inventory carrying costs
Place/customer service levels
Order processing and information
costs Price
Lot quantity costs
Warehousing costs
Transportation costs
LOG
ISTI
CS
MA
RK
ETING
Figure 5-4, Stock and Lambert text
Cost Trade-Offs in Marketing and Logistics

• Supply-chain generally accounts for between 60% and 90% of all company costs1
• A 2% improvement in process efficiency for supply-chain processes has 30,000% - 50,000% the impact of a 2% improvement in efficiency for… IT… HR… Finance1… Sales…
• Any surprise most Process Methodologies or techniques had their origin primarily in Supply-Chain Management?
– Six-Sigma Lean BPR ERP ISO MRP-II TQM…
Fortune-10 Company Supply-Chain Cost % Total Costs2
GM Ford Conoco Wal-Mart Chevron IBM Exxon GE Citi1 AIG1
94% 93% 90% 90% 88% 77% 75% 63% 0% 0%
1 Exclusive of Financial Services companies 2 Source: Hoovers 2006 Financial Data, Supply-‐Chain Council 2006 SCM Benchmark data on SCM cost for discrete & process industries
Where the Money Is

SUPPLY NETWORK
Informa<on, Product, Service, Financial and Knowledge Flows
M A T E R I A L S
Capacity, Information, Core Competencies, Capital and Human Resources
Relationship Management
Procurement
Manufacturing
CONSUMERS
INTEGRATED ENTERPRISE MARKET
DISTRIBUTION NETWORK
Logis;cs
Order Administration
The Integrated Supply Chain Model

Rank Company Comp. Score
Rank Company Comp. Score
Rank Company Comp. Score
1 Apple 8.85 9 Colgate-‐Palmolive
4.22 17 Starbucks 3.06
2 McDonald’s 6.25 10 Coca-Cola 4.03 18 3M 3.05
3 Amazon.com 6.08 11 Inditex 3.99 19 Qualcomm 2.95
4 Unilever 5.32 12 Nike 3.89 20 Seagate Technology
2.75
5 Procter & Gamble
5.20 13 H&M 3.83 21 Kimberly-Clark
2.65
6 Samsung Electronics
5.13 14 Wal-Mart 3.52 22 Johnson & Johnson
2.65
7 Cisco Systems
4.57 15 Pepsico 3.37 23 Caterpillar 2.43
8 Intel 4.51 16 Lenovo 3.14 24 Cummins 2.34
25 Nestle 2.30
Source: hYp://www.gartner.com
Gartner’s Top 25 Supply Chains for 2014
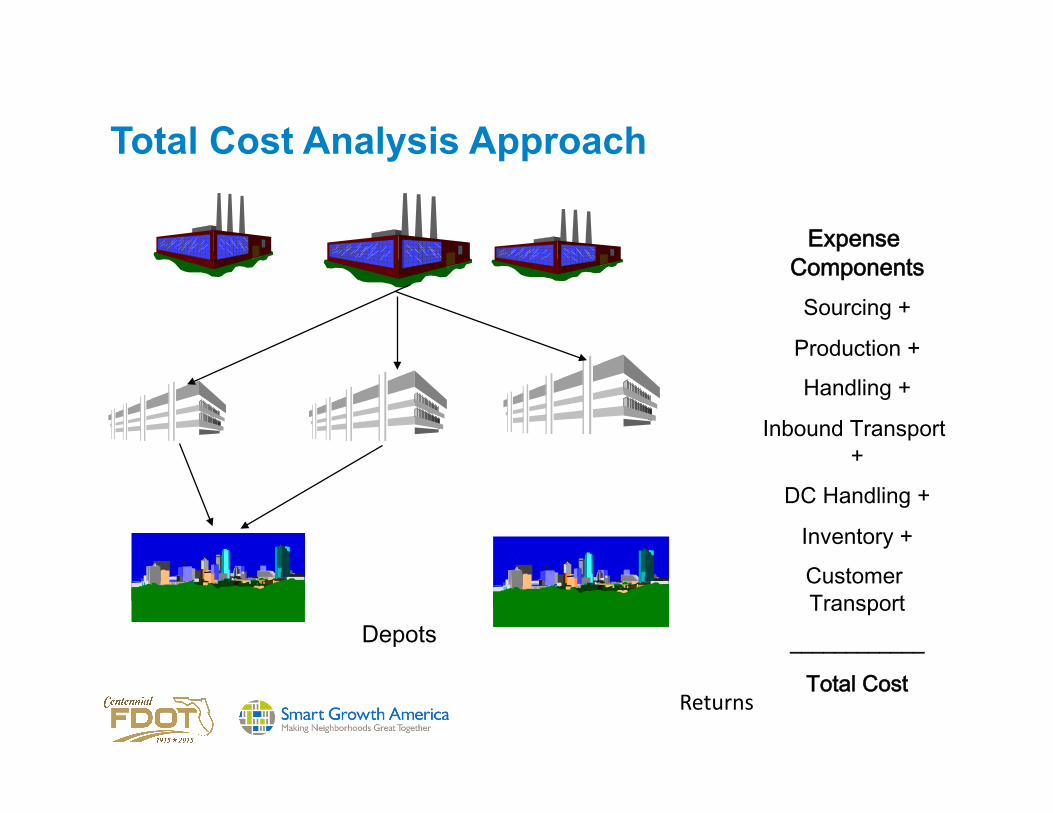
Expense Components
Sourcing +
Production +
Handling +
Inbound Transport +
DC Handling +
Inventory +
Customer Transport
____________
Total Cost
Depots
Returns
Total Cost Analysis Approach

FARM INPUTS
ANIMAL PRODUCTION
CROP PRODUCTION
FARM PRODUCT
ASSEMBLERS
INGREDIENT PROCESSORS
END-‐PRODUCT PROCESSORS
WHOLESALERS
RETAILERS
CONSUMERS
seed feed
fer;lizer pes;cides
meat & poultry dairy
fish & seafood eggs
grains oil seeds
fruits vegetables
grain elevators shippers feed lots
milling slaughtering
crushing starches
flavorings
fresh products prepared products
general home specialty products food service
supermarkets convenience stores
co-‐op restaurants
hotels schools
hospitals military bases
vending farmer’s markets
community feeding
T
T
T
T
T
T T
T
T
T Transporta;on of products between stages in the system.
MULTIPLE FARM SOURCES
MULTIPLE FARM SOURCES
STORAGE
T
T
Adapted from Bruce Hope, (April 13, 2005), “Iden;fying Research Needs for Risk Assessment of U.S. Food Supply Security,” Society of Toxicology -‐ Risk Assessment Specialty Sec=on (RASS) Monthly Teleconference.
Food System Supply Chain

Prepared by Shaun Kennedy – Do Not Reproduce Without Permission
Food System Supply Chain

baking soda wheat gluten calcium propionate enzymes
bleached wheat flour mono-‐ and diglycerides malted barley flour diacetyl tartaric acid esters thiamine ethanol riboflavin sorbitol Niacin polysorbate 20 folic acid potassium propionate reduced iron sodium stearoyl lactylate water corn starch corn syrup ammonium chloride sesame seeds ammonium sulfate soybean oil calcium peroxide yeast ascorbic acid salt azodicarbonamide calcium sulfate calcium carbonate calcium silicate soy flour
USDA inspected beef
Milk milkfat Water cream sodium citrate salt sodium phosphate sorbic acid ar;ficial color cheese culture ace;c acid soy lecithin Enzymes starch Special Sauce Soybean oil pickles dis;lled vinegar water egg yolks HF corn syrup sugar onion powder corn syrup spice spice extrac;ves salt xanthan gum mustard flour prop. glycol alginate sodium benzoate potassium sorbate mustard bran garlic powder hydrolyzed proteins caramel color paprika Turmeric calcium disodium EDTA
Cucumbers water Vinegar Salt calcium chloride Alum natural flavorings polysorbate 80 turmeric
Grill Seasoning Salt Pepper coYonseed oil soybean oil leYuce dehydrated onions
Prepared by Shaun Kennedy – Do Not Reproduce Without Permission
Food System Supply Chain Complexity One Burger Contains…

• Range from 20-60 percent of revenue
• Majority of firms in range of 20 percent
• Includes
- Procurement
- Logistics
- Planning
• Sometimes includes
- Manufacturing
Supply Chain Costs

• Reduced operating cost
• Increased revenue - Fill rate - Extended offerings
• Location • Mix
- Product/Service/Solution - Customization - New product introduction
• Asset utilization - Facilities - Production - Transportation
Supply Chain Value Adds

Effec<veness Relevancy
Efficiency
Sustainability
Value Creation
How Does Supply Chain Create Value EERS Value Diamond

What are the Key Drivers of Success
• Customer service, satisfaction and success • Segmental supply chains • Minimize landed cost • Asset utilization

Success
Satisfaction
Basic Service
Achieve internal standards (e.g., specified performance cycle of fill rate)
Meet customer expectations (e.g., arrive on time with right product as measured by the customer)
Customers of choice achieve their objectives (e.g., logistics operation can provide product and service in a manner that ensures long term customer viability)
Three Levels of Customer Focus

Customers Have Different Objectives, Requirements and Expectations
V.A. Services
On Time
Order Fill
Information
Tech Services
V.A. Services
Accuracy
Information
On Time
Order Fill
Customer A Customer B

• Minimum total cost assignment
• Threshold service capability
• Cost revenue impact strategies
• From science to art – managing short cuts
Total Cost-Service Integration

Supply Chain Design Criteria
• Design to minimize landed cost
• Design to maximize asset utilization
• Design to maximize competitive positioning (relevancy)
• Design to minimize risk
• Design to maximize control

Logistics System Design Requirements
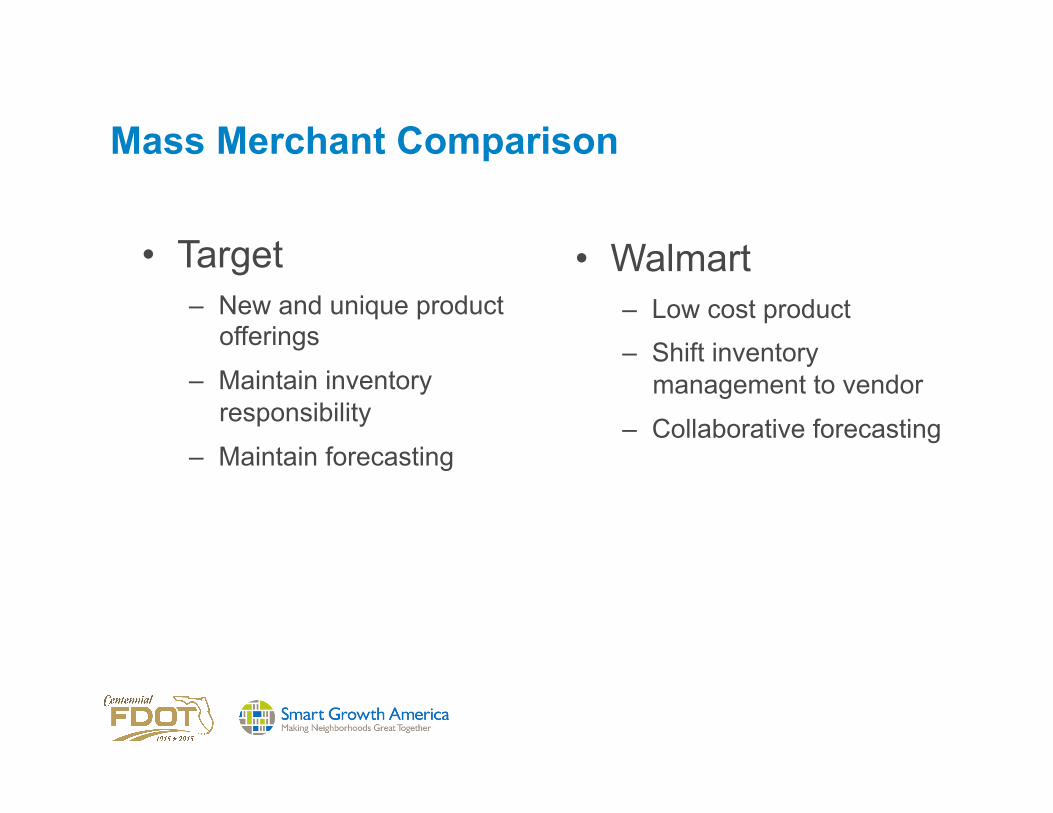
Mass Merchant Comparison
• Target – New and unique product
offerings
– Maintain inventory responsibility
– Maintain forecasting
• Walmart – Low cost product – Shift inventory
management to vendor
– Collaborative forecasting

Minimize Landed Cost Supply Chain Cost Primary Driver
Transporta;on (Inbound/Outbound) • Distance • Economies of scale • Mode
Procurement • Materials • Source • Compe;;ve environment
Produc;on • Labor content • Technology environment
Inventory carrying cost • Value of inventory • Risks • Taxes
Handling • Mechaniza;on • Labor rates
Packaging • Consumer vs. industrial

Financial Perspec;ve
Economic Profit
NOPAT
Revenue Drivers Customer relationships Product availability Perfect order Tailored logistics
Expense Drivers Production Inventory Transportation Purchasing
Capital Charge
Capital
Working Capital Drivers Inventory turnover Days of payments Days of receivables
Fixed Asset Drivers Network optimization Throughput Selective outsourcing
Cost of Capital
Supply Chain Financing
Supply Chain Management

Economic Profit
NOPAT
Revenue Drivers Customer relationships Product availability Perfect order Tailored logistics
Expense Drivers Production Inventory Transportation Purchasing
Capital Charge
Capital
Working Capital Drivers Inventory turnover Days of payments Days of receivables
Fixed Asset Drivers Network optimization Throughput Selective outsourcing
Cost of Capital
Supply Chain Financing
Financial Perspec;ve
Supply Chain Management

QUESTIONS?

M2D2 Freight Logistics Workshop
Role of Supply Chain Decisions in Firm Strategy

Functional vs. Innovative Products: Differences in Demand

Physically Efficient vs. Market Responsive Supply Chains

Matching Supply Chains with Products

Process Description Demand Planning Responsiveness The assessment of demand and strategic design to
achieve maximum responsiveness to customer requirements.
Customer Relationship Collaboration The development and administration of relationships with customers to facilitate strategic information sharing, joint planning, and integrated operations.
Order Fulfillment/Service Delivery The ability to execute superior and sustainable order to delivery performance and related essential services.
Product/Service Development Launch The participation in product service development and lean launch.
Manufacturing Customization The support of manufacturing strategy and facilitation of postponement throughout the supply chain.
Supplier Relationship Collaboration The development and administration of relationships with suppliers to facilitate strategic information sharing, joint planning, and integrated operations.
Life Cycle Support The repair and support of products during their life cycle. Includes warranty, maintenance, and repair.
Reverse Logistics The return and disposition of inventories in a cost effective, secure, and responsible manner.
Customer Related Supply Chain Processes

Supply Chain Management Cost Decisions
Customer Service
Planning Sourcing Produc;on Distribu;on
• Order taking • Order inquiry • Customer
management
• Forecas;ng • Promo;onal
planning • Planning and
scheduling • Capacity
management • Expedi;ng
• Design • Supplier
iden;fica;on • Nego;a;on • Contrac;ng • Receiving • Payables • Raw material
management • Supplier
management
• Produc;on scheduling
• Direct and indirect labor
• Equipment maintenance
• WIP inventory management
• FG inventory management
• Transporta;on • Warehousing • Packaging
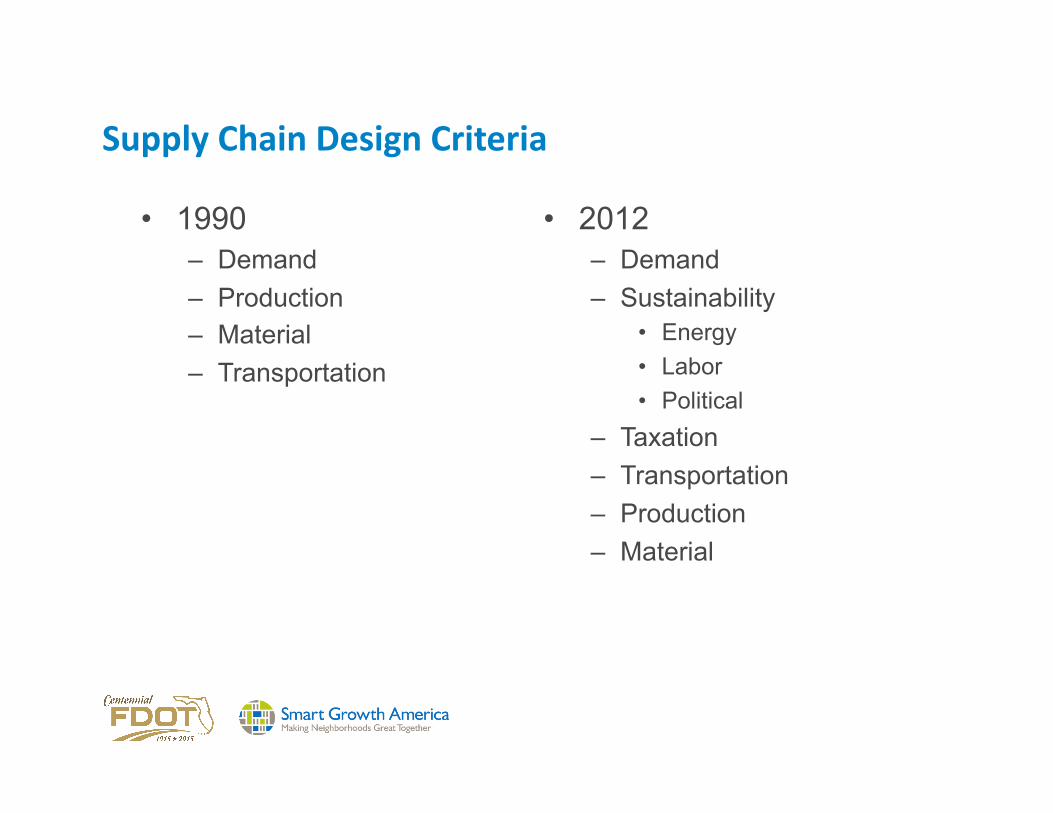
Supply Chain Design Criteria
• 1990 – Demand – Production – Material – Transportation
• 2012 – Demand – Sustainability
• Energy • Labor • Political
– Taxation – Transportation – Production – Material

Supply Chain Design Criteria
• 1990 – Demand – Production – Material – Transportation
• 2015 – Demand – Sustainability
• Energy • Labor • Political/Community impact • Water • Environmental impact • Debtors • Regulatory • Compliance • Supplier relationships • Commodity availability • Cross-sale requirements
– Taxation (TASC) – Transportation – Production – Material

Supply Chain Dynamics are Changing
• Firms looking for more balance between scale and reliability
• Infrastructure congestion is becoming increasingly problematic
• Increased energy cost will shift supply chain mode selection and design
• Increasing importance of being able to quantify the value proposition related to supply chain changes

$/unit
Economies of Scale
Cost of transport
Decentralized Centralized
A
Changing Dynamics of Supply Chain Design

$/unit
Economies of Scale
Cost of transport
Decentralized Centralized
Result of increased fuel cost
A B
Changing Dynamics of Supply Chain Design

$/unit
Economies of Scale
Cost of transport
Decentralized Centralized
Result of increased fuel cost
A B C
Result of increase risk
Changing Dynamics of Supply Chain Design

QUESTIONS?

M2D2 Freight Logistics Workshop
How do Firms Make Supply Chain Decisions?

Supply Chain Design
• Supply chain network analysis • Supply chain integration

Principles of General Systems Theory
• Total system performance is singularly important
• Individual components don’t need to be optimized
– Emphasis is on the integrated relationship between components
• A functional relationship exists between components called a trade-off – May enhance or hinder total system performance
• Components linked together in a balanced system will produce greater end results than possible through individual performance
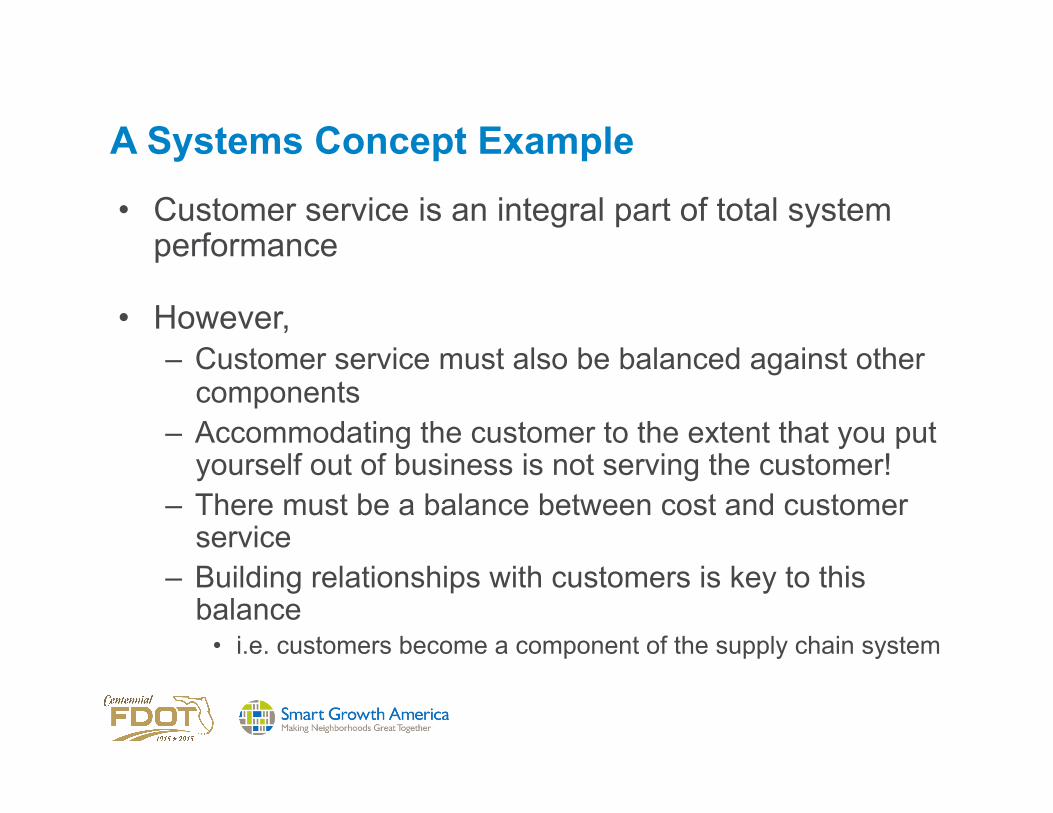
A Systems Concept Example
• Customer service is an integral part of total system performance
• However, – Customer service must also be balanced against other
components – Accommodating the customer to the extent that you put
yourself out of business is not serving the customer! – There must be a balance between cost and customer
service – Building relationships with customers is key to this
balance • i.e. customers become a component of the supply chain system

Total Cost Integration
• Initial network of facilities are driven by economic factors – Transportation economics – Inventory economics
• Cost trade-offs of these individual functions are identified, but – A system analysis approach (i.e. total cost
integration) is used to identify the least-total-cost for the combined facility network

Transportation Cost Integration (Spatial)
• Basic economies – Economy of size (quantity discount) – Economy of distance (tapering principle)
• Activity based cost – Loading and unloading – Movement – Information
• Generalized relationship

Transport Cost
Number of Distribution Locations
Outbound
Inbound
Total Transport
Transportation Cost as a Function of Distribution Locations

Network Transportation Cost Minimization
Figure 12.2 Transporta<on Cost as a Func<on of the Number of Warehouse Loca<ons

Service-Based Warehouse Justification
• Inventory consists of – Base stock – Safety stock – In-transit stock
• What is the impact of adding warehouses to each of these inventories? – Base stock is independent of number of market
facing warehouses – What about in-transit stock?

Expense Components
Sourcing +
Production +
Handling +
Inbound Transport +
DC Handling +
Inventory +
Customer Transport
____________
Total Cost Returns
Total Cost Analysis Approach

What About the Impact on Safety Stock? • Safety stock is needed to protect against unplanned
stockouts during inventory replenishment
• Uncertainty in network is impacted by adding warehouses – Performance cycle days are reduced – Number of performance cycles increases
• Prevents aggregation of uncertainty across market areas
• Serving the same market area by adding warehouses will increase uncertainty since each facility has its own replenishment cycle – Therefore, more safety stock is needed

Inventory Summary
• Base stock determination is independent of number of market facing warehouses
• In-transit stock will typically decrease with the addition of warehouses to the network
• Safety stock increases with number of warehouses added to the network – New performance cycle requires additional safety stock

Network Inventory Cost Minimization
Figure 13.5 Average Inventory as a Func<on of Number of Warehouse Loca<ons

Total Cost of the Network
• Lowest cost points on each curve – For total transportation cost between 7 and 8 facilities
– For inventory cost it would be a single warehouse
– For total cost of network it is 6 locations
• Trade-off relationships – Minimal total cost point for the system is not at the
point of least cost for either transportation or inventory

Illustration of Total Cost Concept for the Overall Logistical System
Figure 12.6 Least-‐Total-‐Cost Network

• Minimum total cost assignment
• Threshold service capability
• Cost revenue impact strategies
• From science to art – managing short cuts
Total Cost-Service Integration

Supply Chain Design Criteria
• Design to minimize landed cost
• Design to maximize asset utilization
• Design to maximize competitive positioning (relevancy)
• Design to minimize risk
• Design to maximize control

Supply Chain Design
• Make vs. buy of products, services or solutions • Global optimization • Technology advances • Strategic profit model

Cost Produc;on Capacity
Supply Chain Design

Cost
Quality Control
Proprietary Technology
Limited Suppliers
Excess Capacity
Having Control
Assurance of
Con;nual Supply
Industry Drivers
Produc;on Capacity
Operationally Favoring a Make Decision

Cost
Mul;-‐Source Policy
Lack of Exper;se
Supplier Compe-‐tencies
Small Volumes
Inventory Planning
Brand preference
Non-‐Essen;al Item
Produc;on Capacity
Operationally Favoring a Buy Decision

• The strategic profit model framework • ROA as a key measure • Understanding the composition of ROA
Profit Margin x Asset Turnover = Return on Assets
Profit Sales Profit Sales x Assets = Assets
100 2000 100 2000 x 1000 = 1000
5% x 2 times = 10%
Strategic Profit Model

Illustration of Strategic Profit Model with Example Data

Example Showing ROA Improvement If Inventory Cost Is Reduced To $300

QUESTIONS?

M2D2 Freight Logistics Workshop
Scenario Discussions

Scenario Discussions
• What would be the appropriate response under a variety of different business scenarios?
• How does freight interact with other users of the transportation system? How might that interaction be optimized?
• How does FDOT interact with the industry? What FDOT standards, practices and guidance are used in that interaction? What elements might be ripe for revision/augmentation?

Scenario #1 - Electronics
• An existing Florida business is looking to expand by building a new electronics manufacturing facility at a location to be determined. How does the logistics and transportation infrastructure impact this decision? What could FDOT do to help support this location decision?
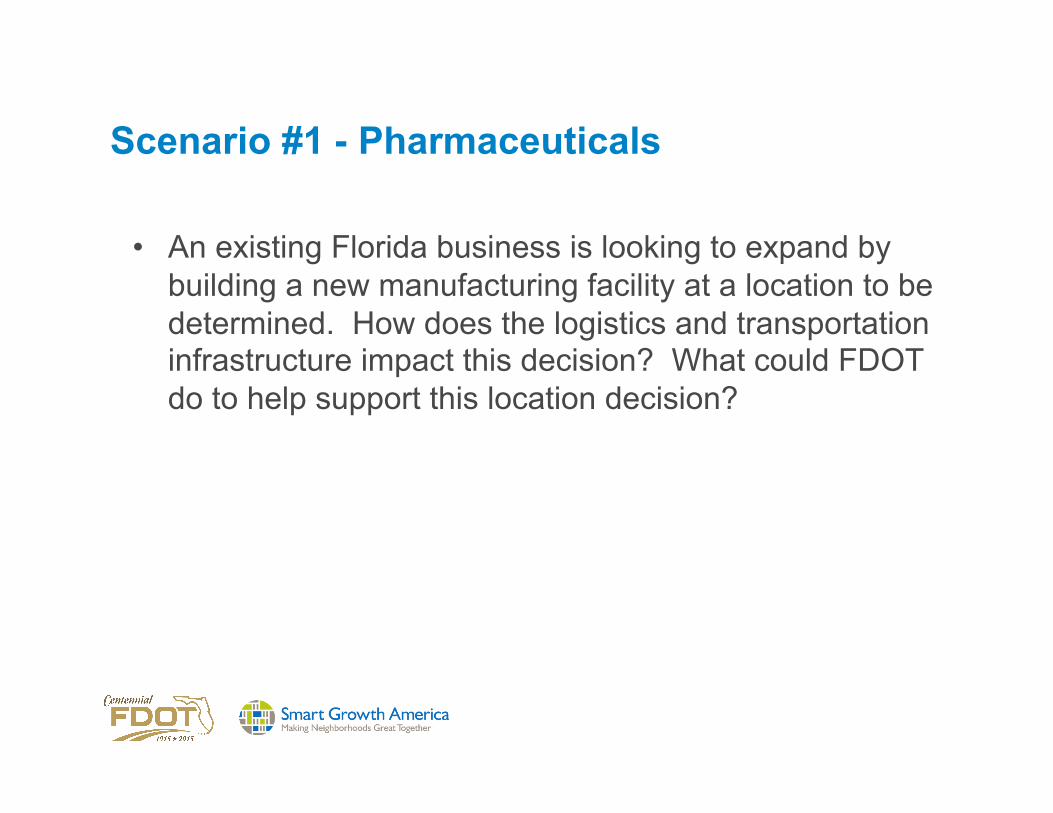
Scenario #1 - Pharmaceuticals
• An existing Florida business is looking to expand by building a new manufacturing facility at a location to be determined. How does the logistics and transportation infrastructure impact this decision? What could FDOT do to help support this location decision?

Scenario #1 – Medical Equipment
• An existing Florida business is looking to expand by building a new chemical manufacturing facility at a location to be determined. How does the logistics and transportation infrastructure impact this decision? What could FDOT do to help support this location decision?

Scenario #2
• A food processor is looking to source more local produce from Florida. How does the logistics and transportation infrastructure impact this decision? What could FDOT do to help support this sourcing decision?

Scenario #3
• A regional manufacturer is looking to capitalize on the “Made in America” trend by using more local production or local sources. How does the logistics and transportation infrastructure impact this decision? What could FDOT do to help support this location decision?

M2D2 Freight Logistics Workshop
Conclusions & Implications

Multimodal Development and Delivery (M2D2) is a partnership between the Florida Department of Transportation (FDOT) and Smart Growth America to identify modifications
to FDOT policies, guidance, manuals, procedures and general practices needed to implement FDOT’s Complete Streets policy in order to promotes safety, quality of life, and
economic development in Florida.
www.smartgrowthamerica.org


