Embed Size (px)
Citation preview
Macular Atrophy in Birdshot Retinochoroidopathy: An OpticalCoherence Tomography and Multifocal ElectroretinographyAnalysis
David G. Birch1,2, Patrick D. Williams2,3, David Callanan2,3, Robert Wang2,3, Kirsten G.Locke1, and Donald C. Hood41 The Retina Foundation of the Southwest, Dallas, TX2 University of Texas Southwestern Medical Center, Dallas, TX3 Texas Retina Associates, Arlington, TX4 Departments of Psychology and Ophthalmology, Columbia University, New York, NY
IntroductionBirdshot retinochoroidopathy is an uncommon intraocular inflammatory disorder (uveitis)comprised of depigmented spots in the choroid along with vitreous cells [1,2]. Anteriorinflammation may be present, and the disease is typically bilateral and symmetric. Retinalcapillary hyperpermeability and resultant cystoid macular edema are common [3].
Some reports have suggested stability of visual acuity after an initial inflammatory stage [4,5]. Others, however, have described a chronic and unrelenting course [1,2,6–8]. Serialelectroretinograms and visual fields support progressive deterioration of retinal function, evenin cases not considered to have active inflammation [6,8]. Although retinal atrophy has beenmentioned in birdshot retinochoroidopathy [6,7], there is only one case report specificallydescribing macular atrophy [9]. Autofluorescence imaging has demonstrated the extent ofretinal pigment epithelium (RPE) atrophy, even in regions without hypopigmented birdshotlesions [10]. Histopathology has been performed in birdshot retinochoroidopathy, but withoutmention of retinal thickness away from the fovea or retinal atrophy [11].
Optical coherence tomography (OCT) of birdshot retinochoroidopathy has revealed featuresof the choroidal lesions [9,12]. OCT and retinal thickness analysis were used to evaluatesystemic steroid treatment in birdshot retinochoroidopathy in a case report, but retinal thicknesswas normal away from the fovea [12].
Recent advances in electroretinography and optical imaging allow for more detailed analysisof the macula than previously possible. The multifocal (mf) ERG produces a detailedtopographical map of retinal function, while frequency domain (fd) OCT provides a preciseanalysis of layer-by-layer structure within the macula. The purpose of this study is to evaluatemacular atrophy by fdOCT in patients with birdshot retinochoroidopathy and to compare theresulting thickness measures with visual acuity and mfERG.
Corresponding author: David G. Birch, Retina Foundation of the Southwest, 9900 North Central Expressway, Dallas, TX 75231 phone:214-363-3911, [email protected].
NIH Public AccessAuthor ManuscriptRetina. Author manuscript; available in PMC 2011 June 1.
Published in final edited form as:Retina. 2010 June ; 30(6): 930–937. doi:10.1097/IAE.0b013e3181c720b4.
NIH
-PA Author Manuscript
NIH
-PA Author Manuscript
NIH
-PA Author Manuscript
MethodsSeven patients with previous OCT-3 (Zeiss Stratus OCT-3) consented to participate in thisstudy after all procedures were explained. Inclusion criteria included a diagnosis of birdshotretinochoroidopathy, a positive HLA-A29 serotype, myopia < 5.00 diopters, and clear ocularmedia. The clinical charts of these patients were reviewed for demographic information, lengthof time with a diagnosis of birdshot retinochoroidopathy, previous treatments, and ocularhistory. Macular thinning was defined from the OCT-3 as a foveal thickness less than 160 μmand a macular volume less than 6 mm3.
Following informed consent, mfERGs were obtained with the Veris Science 5.1 system usingthe fundus camera display system [13] and followed ISCEV guidelines [14]. The stimulusconfiguration consisted of 103 hexagonal elements scaled for retinal eccentricity andmodulated in luminance according to a pre-determined pseudo-random sequence. Themaximum luminance of the display was 200 cd/m2 and the minimum was 2 cd/m2. Allresponses were measured as trough to peak amplitude density (nV/deg2). Normal values werederived from 20 volunteers ages 21–65 years with normal visual acuity and normal eye exams.
To determine which layers of the retina were primarily responsible for macular thinning, eachpatient was asked to return for fdOCT (Spectralis HRA+OCT; Heidelberg Engineering,Heidelberg, Germany). The confocal scanning laser ophthalmoscope (cSLO) system providesinfrared reflectance(IR; 820 nm) imaging. Optical resolution is approximately 10 μm. ThefdOCT runs simultaneously with the cSLO imaging system, using a second, independent pairof scanning mirrors. The wavelength of the fdOCT imaging system is 870 nm. Opticalresolution is approximately 7 μm in depth and 14 μm transversely. The scans included at leastone 9 mm horizontal scan through the midline and peripapillary scans using the 3.4 mm circlescan of the fdOCT. Results from the seven patients were compared to segmented data from 23normals [15].
Segmentation of retinal layers was done by hand with software included with the Spectralissystem. The operator measured the thickness of each retinal layer at 6 locations along thehorizontal midline (fovea, 3° and 9° nasal retina, 3°, 9° and 15° temporal retina). Fiveboundaries, labeled A through E in Fig. 1, were identified and labeled. These were chosenbecause there appears to be general consensus on their identification [16–19].
A. Vitreous/RNFL: the inner limiting membrane (i.e. the boundary between the vitreousand the RNFL).
B. RFNL/GCL: the boundary between the RFNL and the ganglion cell layer (GCL).
C. IPL/INL: the boundary between the inner plexiform layer (IPL) and the inner nuclearlayer (INL).
D. INL/OPL: the border between the INL and the outer plexiform layer (OPL).
E. BM/choroid: the boundary between Bruch’s membrane (BM) and the choroid.
Using the locations of these boundaries, we defined 4 retinal regions/layers for comparingpatients to controls:
1. Total Retinal thickness (Total) is the distance between A and E.
2. Retinal nerve fiber layer thickness (RFNL) is the distance between A and B.
3. Inner nuclear layer thickness (INL) is the distance between C and D.
4. Outer plexiform layer, photoreceptor and RPE thickness (REC+) is the distancebetween D and E.
Birch et al. Page 2
Retina. Author manuscript; available in PMC 2011 June 1.
NIH
-PA Author Manuscript
NIH
-PA Author Manuscript
NIH
-PA Author Manuscript
Statistical comparisons (t-tests and Pearson r) were performed with Statistica version 7.1(StatSoft, Tulsa OK). All procedures relating to human subjects conformed to the Declarationof Helsinki and were approved by the Institutional review board of UT Southwestern MedicalCenter.
ResultsDemographic data are presented in Table 1. The duration since the initial diagnosis of birdshotchorioretinopathy ranged from 2 to 16 years. Previous treatments for vitritis and cystoidmacular edema included periocular and intraocular triamcinolone as well as oral azathioprine,mycophenolate, acetazolamide, and prednisone. Four eyes were treated with flucinoloneimplants (Retisert™, Bausch & Lomb, St. Louis, MO). Of these, three developed secondaryglaucoma, and two required tube-shunt placement. No eyes had appreciable iritis or vitritisduring the time of examination. Also, no optic nerve pallor was documented in any eyes. Alleyes exhibited typical choroidal birdshot lesions.
As shown in Table 2, eyes were separated based on the presence of anatomic thinning onOCT-3. Visual acuities are shown with the results of electrophysiologic testing in Table 3.Eyes with anatomic thinning are highlighted in bold. All eyes with history of birdshot forgreater than 10 years, including those without anatomic thinning, had below average mfERGresults based on both the fovea and on the mean response density derived from all six rings.
Mean Snellen acuity, mean foveal thickness, mean macular volume, mean foveal ERGresponse density and mean overall mfERG response density of eyes (n= 6) with anatomicthinning on OCT-3 were compared to the values for eyes (n = 8) without anatomic thinning(Table 4). There was a significance difference (p < 0.01) between eyes with anatomic thinningand eyes without anatomic thinning on all measures. Across all eyes, there were significantcorrelations between foveal ERG response density and logMAR visual acuity (r = − 0.71, p <0.05) and between OCT-3 foveal thickness and both logMAR visual acuity (r = −0.76, p <0.05) and foveal ERG response density (r = 0.62, p < 0.05). The duration since initial diagnosiswas correlated with both foveal ERG response density (r = −0.67, p < 0.05) and mean mfERGresponse density (r = −0.55, p < 0.05).
Left eye fdOCT midline scans from a normal subject and patient #1 are shown in Figure 1.Segmentation lines are added to highlight optical boundaries that were used to distinguishretinal layers. Right eye fdOCT midline scans of all seven patients are shown in Figure 2. Alsoshown are mfERG responses and 3-dimensional plots from the central 40 degrees. Clearly,there is a qualitative correspondence between the mfERG and fdOCT data. Patients #1 and #3showed thinning of the photoreceptor layer across the midline and borderline detectablemfERGs. The small mfERG from the fovea in patient #3 corresponds to the approximately 500micron diameter patch of preserved photoreceptors in the fovea. Patients #4 and #6 had thethickest receptor layers and almost normal mfERG patterns. Patients #2, #5 and #7 wereintermediate, with patchy areas of photoreceptor thinning and regional loss of mfERGresponses. Note that #7 has abnormal mfERG timing from the fovea, presumably related towhat appears to be a foveal neurosensory detachment.
To determine whether the RFNL was of normal thickness in these patients, peripapillary scanswere obtained from all eyes with the fdOCT 3.4 mm circular scan. With the exception of patient#1, all eyes had normal peripapillary scans. Patient #1 was below machine normal limits in thesuperior-nasal and inferior-nasal quadrants of both eyes, consistent with reduced numbers ofarcuate nerve fibers. RNFL thickness was also measured from scans along the horizontalmeridian (Figure 1) at a location 2.5 nasal to the fovea. For the 23 normal subjects, the meanRNFL thichness at this location was 45.1 mm (95% confidence interval = 30.9 – 59.3 mm).
Birch et al. Page 3
Retina. Author manuscript; available in PMC 2011 June 1.
NIH
-PA Author Manuscript
NIH
-PA Author Manuscript
NIH
-PA Author Manuscript
For the patients with birdshot chorioretinopathy, 8 of 14 had RNFL thickness within the normalrange, while 6 of 14 had RNFL thickness slightly greater than normal.
Total retinal thickness (Total), outer plexiform layer, photoreceptor and RPE thickness (Rec+) and inner nuclear layer thickness are shown for measures from the horizontal meridian inall 14 eyes from the 7 patients in Figure 3. Mean thickness for 23 normal subjects is shown asthe bold curve in each plot; ± 2 standard deviations are shown as the shaded area. For totalretinal thickness (top), all eyes were below mean normal in thickness at all locations and manywere reduced by greater than 2 standard deviations. As shown in the middle plot, the reductionin retinal thickness was associated with a reduction in Rec+, the segment extending from theproximal border of the outer plexiform layer to the Bruch’s membrane/choroid interface. Thissegment thus reflects photoreceptor cells and RPE. The inner retinal layer thickness (bottomplot) was within normal limits at most eccentricities in most patients; the exceptions were inthe regions of cystic swelling in patients #1, and #2.
DiscussionBased on the results of this study, anatomic macular thinning is associated with severe visionloss in patients with birdshot retinochoroidopathy. All patients with atrophy had an extensivehistory of birdshot retinochoroidopathy with the minimum time from diagnosis being ten years.Macular and chorioretinal atrophy in longstanding birdshot retinochoroidopathy has beenmentioned in the literature, although without specific evaluation [6,7,9]. In these reports,permanent vision loss is well described. The present study corroborates the long-term visualprognosis in patients with birdshot retinochoroidopathy and provides further evidence that thedecline is due to progressive deterioration of the photoreceptors, RPE, and choroid.
Optic atrophy could, hypothetically, account for retinal thinning with loss of the ganglion celllayer and nerve fiber layer. Optic atrophy has been described in birdshot retinochoroidopathy[20,21]. However, none of the patients in the present study had any optic pallor. PeripapillaryRNFL scans were normal in all but one patient, and RNFL thickness measured adjacent to theoptic disk was within normal limits or slightly greater than normal in all eyes.
The fdOCT measures provide direct evidence that the major cause of macular thinning inbirdshot is thinning of the outer retina. As shown in Figure 3, most patients showed normalinner nuclear layer thickness. The two exceptions were patients 1 and 2, both of whom hadmacula edema. Virtually all patients, however, showed significant thinning in the extendedphotoreceptor component (Rec+), which included the outer plexiform layer, the photoreceptornuclei, inner and outer segments and the RPE. The only exception was the right eye of patient7, where a neurosensory retinal detachment in the fovea complicated the measure of REC+.
The exact etiology of the macular thinning is unknown, although it suggests retinal cell death,either by direct or indirect means. A possible confounding effect is the association of outerretinal atrophy with long-term steroid use [22,23]. Given the limited exposure in these patients,however, macular thinning is more likely to be due to retinal autoimmunity specific to birdshotretinochoroidopathy. Although the striking clinical features of birdshot retinochoroidopathyare the choroidal lesions, retinal S-antigen has been found as a potential basis for autoimmunity[24]. Alternatively, non-specific chronic inflammation may induce apoptosis within the retinaand choroid, leading to eventual structural atrophy and functional decline [25].
Asymmetric retinal degeneration was observed in this study. Two of the seven patients hadunilateral retinal thinning (patients 2 and 5) and two had bilateral thinning (patients 1 and 3).For patient 2, visual acuity in the unaffected eye was only one line better than the affected eye.For patient 5, the eye with thinning had much poorer acuity than the eye without thinning.Patients 1 and 2 had some retinal thickening temporal to the fovea, demonstrating the possibility
Birch et al. Page 4
Retina. Author manuscript; available in PMC 2011 June 1.
NIH
-PA Author Manuscript
NIH
-PA Author Manuscript
NIH
-PA Author Manuscript
of diffuse macular atrophy and concomitant intraretinal cysts. This intraretinal swelling mayhave confounded functional examinations as well.
In addition to structural changes seen on fdOCT, there were also functional changes. ThemfERGs were significantly altered in most eyes with macular atrophy. The correlation ofmfERG results with OCT findings and visual acuity was clearly evident in patients with severeanatomic atrophy, but was less consistent in patients with mild changes in vision, OCT, orERG. Even in patients without anatomic thinning, the mfERG results were below average. Alongitudinal study would be required to assess the predictive value of mfERG in birdshotpatients. A decline in mfERG may precede severe acuity decline and assist the clinician indeciding which patients require additional treatment.
Earlier reports of full-field electroretinography of eyes with birdshot retinochoroidopathy havedemonstrated an initial decreased amplitude and increased latency of the b-wave as well asloss of oscillatory potentials, suggesting dysfunction of the inner retina [6,26]. As the diseaseprogressed, the electroretinographic dysfunction became evident in both the inner and outerretina. Loss of visual acuity appeared to lag behind electroretinographic dysfunction. Thisphenomenon might explain the preservation of visual acuity in some of the eyes in this study.
The results of this study suggest that both fdOCT and mfERG may serve as useful adjuncts inthe evaluation of birdshot retinochoroidopathy, not only to assess macular edema but also toassess retinal atrophy and early decline. Further study is required to detail the true etiology ofretinal atrophy on OCT in patients with birdshot retinochoroidopathy, whether OCT or mfERGhas prognostic value in these patients, and whether treatment of associated uveitis may preventeventual retinal atrophy.
AcknowledgmentsAcknowledgments/Disclosure
a. Supported by 1 R01 EY09076
b. see attached sheets for full author disclosures
c. see attached sheet for full author contributions
d. Informed consent was obtained from all patients. IRB approval was obtained from the University of TexasSouthwestern Medical School. The Declaration of Helsinki and all applicable laws were followed.
References1. Ryan SJ, Maumenee AE. Birdshot retinochoroidopathy. Am J Ophthalmol 1980;89:31–45. [PubMed:
7356785]2. Kaplan HJ, Aaberg TM. Birdshot retinochoroidopathy. Am J Ophthalmol 1980;90:773–782. [PubMed:
7446664]3. Thorne JE, et al. Birdshot retinochoroidopathy: ocular complications and visual impairment. Am J
Ophthalmol 2005;140:45–51. [PubMed: 16038650]4. Preim HA, Oosterhuis JA. Birdshot chorioretinopathy: Clinical characteristics and evolution. Br J
Ophthalmol 1988;72:646–659. [PubMed: 2460128]5. Gass JD. Vitiliginous chorioretinitis. Arch Ophthalmol 1981:1778–1787. [PubMed: 7295126]6. Oh KT, Christmas NJ, Folk JC. Birdshot retinochoroiditis: Long term follow-up of a chronically
progressive disease. Am J Ophthalmol 2002;133:622–629. [PubMed: 11992859]7. Rothova A, et al. Birdshot chorioretinopathy: long-term manifestations and visual prognosis.
Ophthalmology 2004;111:954–9. [PubMed: 15121374]8. Thorne JE, et al. Loss of visual field among patients with birdshot chorioretinopathy. Amer J
Ophthalmol 2008;145:23–28. [PubMed: 17997394]
Birch et al. Page 5
Retina. Author manuscript; available in PMC 2011 June 1.
NIH
-PA Author Manuscript
NIH
-PA Author Manuscript
NIH
-PA Author Manuscript
9. Witkin AJ, et al. Ultrahigh resolution optical coherence tomography of birdshot retinochoroidopathy.Br J Ophthalmol 2005;89:1660–1671. [PubMed: 16299151]
10. Koizumi H, Pozzoni MC, Spaide RF. Fundus autofluorescence in birdshot chorioretinopathy.Ophthalmology 2008;115:15–20.
11. Gaudio PA, Kaye DB, Crawford JB. Histopathology of birdshot retinochoroidopathy. Br JOphthalmol 2002;86:1439–41. [PubMed: 12446382]
12. De Geronimo F, et al. Birdshot retinochoroidopathy: measurement of the posterior fundus spots andmacular edema using a retinal thickness analyzer, before and after treatment. Eur J Ophthalmol2000;10:338–40. [PubMed: 11192845]
13. Birch, DG. Focal and multifocal electroretinography. In: Fishman, GA., et al., editors.Electrophysiologic Testing. American Academy of Ophthalmology; San Francisco: 2001. p.177-195.
14. Hood DC, et al. ISCEV guidelines for clinical multifocal electroretinography (2007 edition). DocOphthalmol 2008;116(1):1–11. [PubMed: 17972125]
15. Hood DC, et al. Thickness of receptor and post-receptor retinal layers in patients with retinitispigmentosa measured with frequency-domain optical coherence tomography (fdOCT). InvestOphthalmol Vis Sci. 2008 Epub ahead of print.
16. Srinivasan V, et al. Characterization of outer retinal morphology with high-speed, ultrahigh-resolutionoptical coherence tomography. Invest Ophthalmol Vis Sci 2008;49(4):1571–1579. [PubMed:18385077]
17. Chen T, et al. Spectral Domain Optical Coherence Tomography: ultra-high speed, ultra-highresolution ophthalmic imaging. Arch Ophthalmol 2005;123:1715–1720. [PubMed: 16344444]
18. Drexler W, Fujimoto JG. State-of-the-art retinal optical coherence tomography. Prog Retin Eye Res2008;27(1):45–88. [PubMed: 18036865]
19. Witkin AJ, et al. Ultra-high resolution optical coherence tomography assessment of photoreceptorsin retinitis pigmentosa and related diseases. Am J Ophthalmol 2006;142(6):945–52. [PubMed:17157580]
20. Willermain F, Greiner K, Forrester JV. Atypical end-stage birdshot retinochoroidopathy. OculImmunol Inflamm 2003;11:305–307. [PubMed: 14704902]
21. Caballero-Presencia A, Diaz-Guia E, Lopez-Lopez JM. Acute anterior ischemic optic neuropathy inbirdshot retinochoroidopathy. Ophthalmologica 1988;196:87–91. [PubMed: 3362511]
22. Loo JL, Lee SY, Ang CL. Can long-term corticosteroids lead to blindness? A case series of centralserous chorioretinopathy induced by corticosteroids. Annals Academy of Medicine 2006;35:497–499.
23. Tittl MK, et al. Systemic findings associated with central serous chorioretinopathy. Amer JOphthalmol 1999;12(81):63–68. [PubMed: 10482095]
24. Nussenblatt RB, et al. Birdshot retinochoroidopathy associated with HLA-A29 antigen and immuneresponsiveness to retinal S-antigen. Am J Ophthalmol 1982;94:147–158. [PubMed: 6956239]
25. Chan CC, et al. Apoptosis in patients with posterior uveitis. Arch Ophthalmol 1997;115:1559–1567.[PubMed: 9400790]
26. Zacks DN, et al. Electroretinograms as an indicator of disease activity in birdshot retinochoroidopathy.Graefes Arch Clin Exp Ophthalmol 2002:601–607. [PubMed: 12192452]
Birch et al. Page 6
Retina. Author manuscript; available in PMC 2011 June 1.
NIH
-PA Author Manuscript
NIH
-PA Author Manuscript
NIH
-PA Author Manuscript
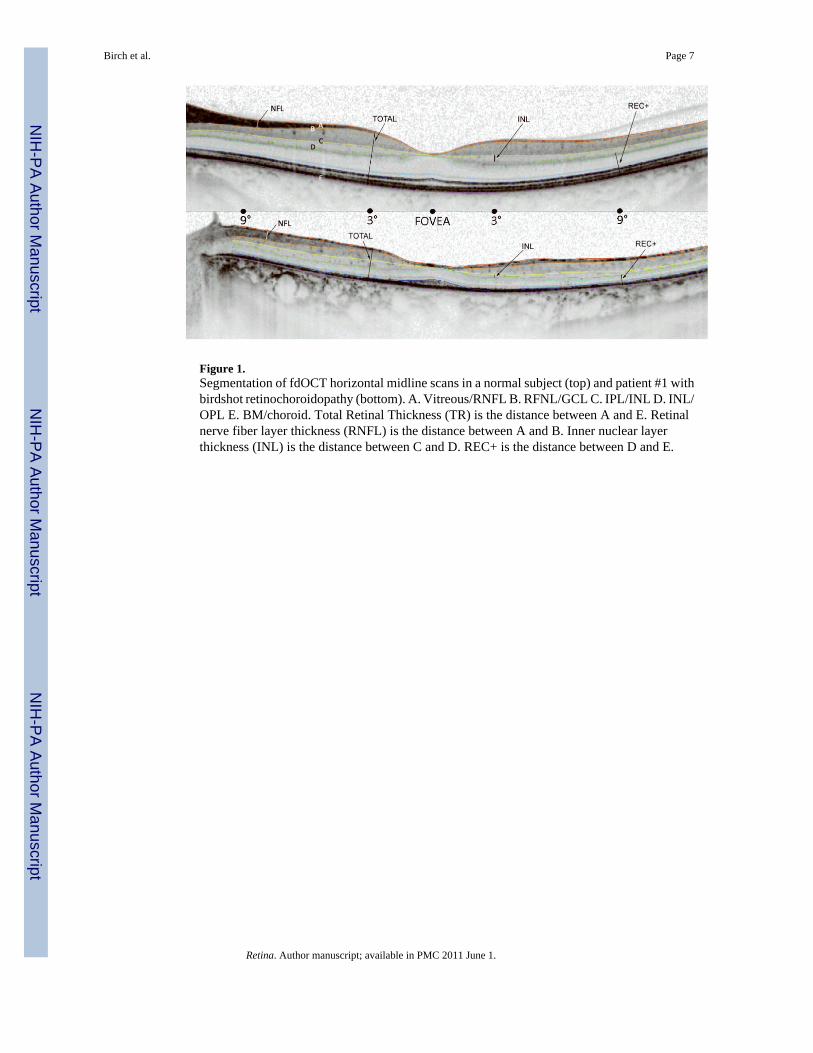
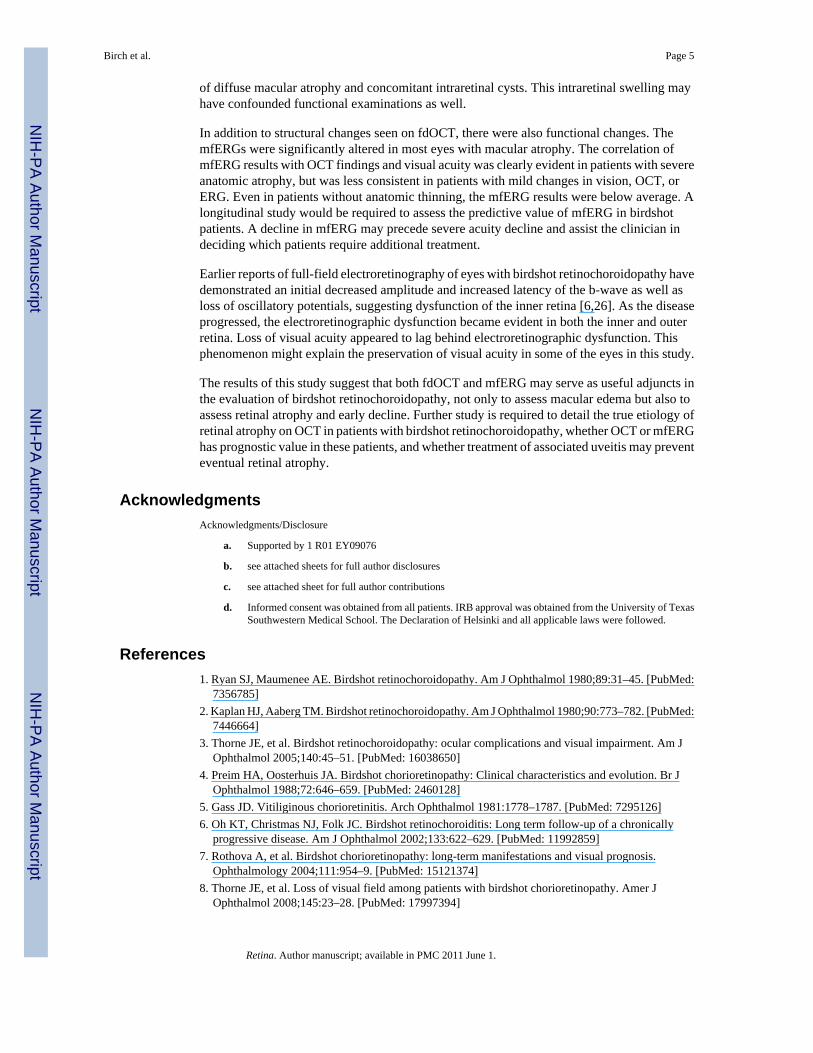
Figure 1.Segmentation of fdOCT horizontal midline scans in a normal subject (top) and patient #1 withbirdshot retinochoroidopathy (bottom). A. Vitreous/RNFL B. RFNL/GCL C. IPL/INL D. INL/OPL E. BM/choroid. Total Retinal Thickness (TR) is the distance between A and E. Retinalnerve fiber layer thickness (RNFL) is the distance between A and B. Inner nuclear layerthickness (INL) is the distance between C and D. REC+ is the distance between D and E.
Birch et al. Page 7
Retina. Author manuscript; available in PMC 2011 June 1.
NIH
-PA Author Manuscript
NIH
-PA Author Manuscript
NIH
-PA Author Manuscript
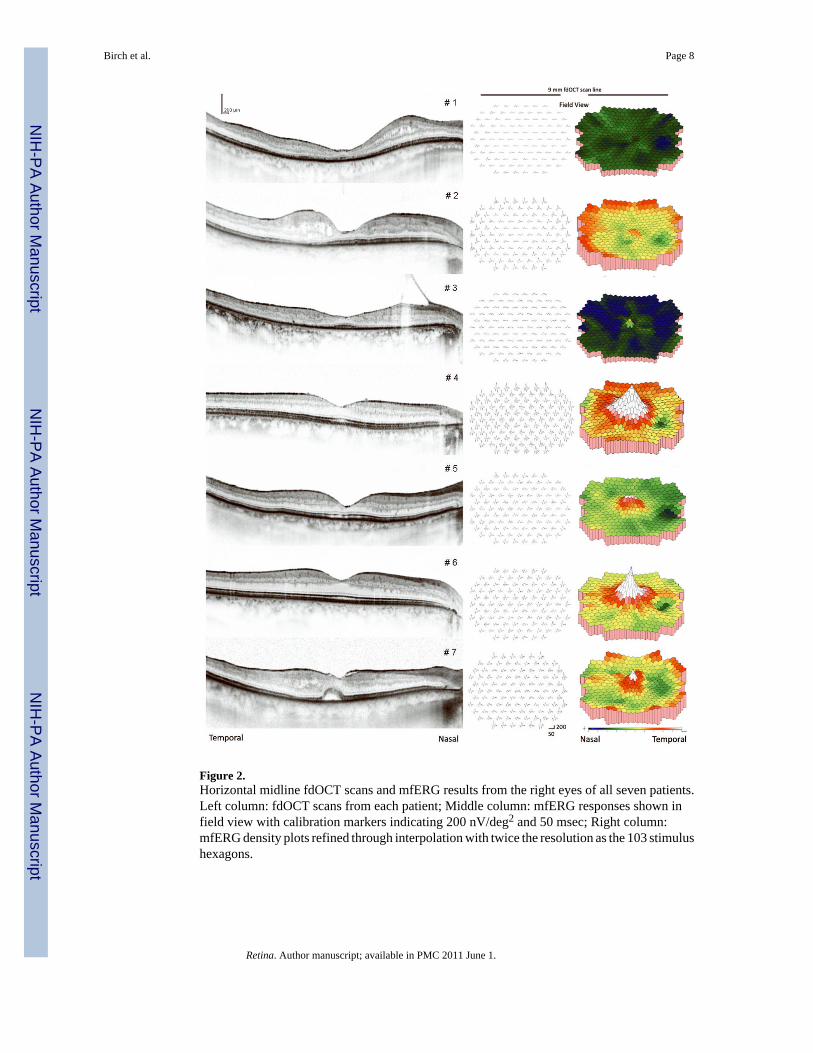
Figure 2.Horizontal midline fdOCT scans and mfERG results from the right eyes of all seven patients.Left column: fdOCT scans from each patient; Middle column: mfERG responses shown infield view with calibration markers indicating 200 nV/deg2 and 50 msec; Right column:mfERG density plots refined through interpolation with twice the resolution as the 103 stimulushexagons.
Birch et al. Page 8
Retina. Author manuscript; available in PMC 2011 June 1.
NIH
-PA Author Manuscript
NIH
-PA Author Manuscript
NIH
-PA Author Manuscript
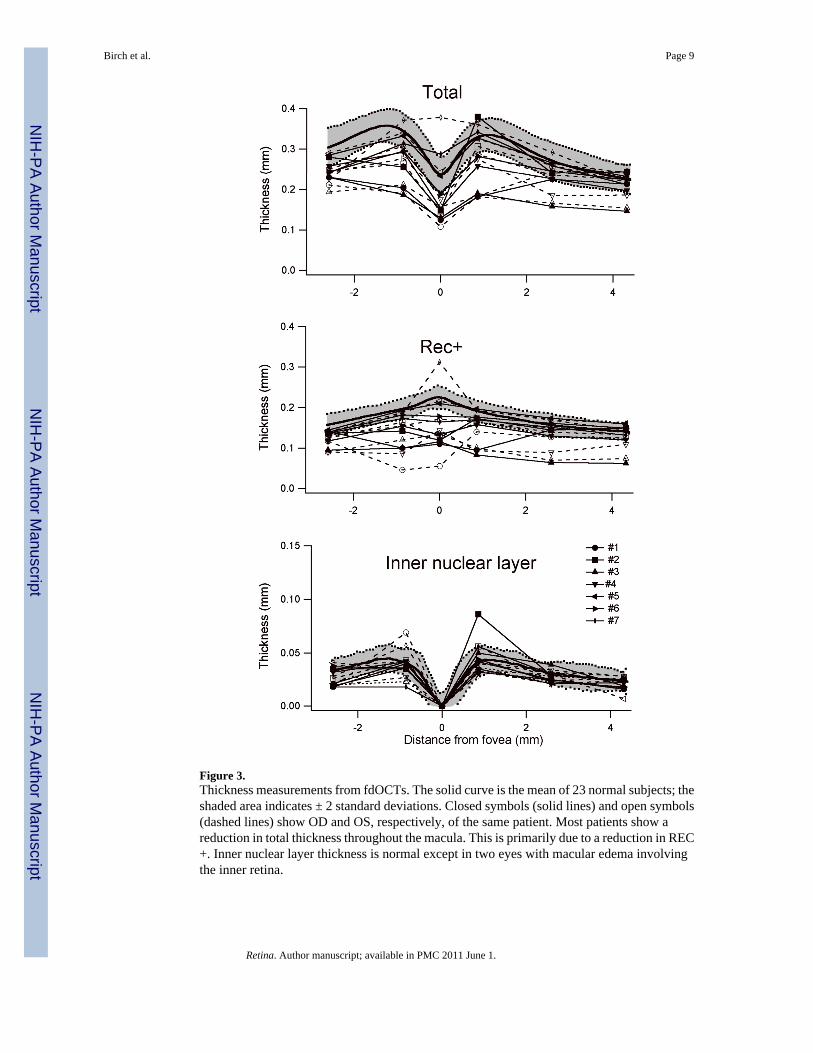
Figure 3.Thickness measurements from fdOCTs. The solid curve is the mean of 23 normal subjects; theshaded area indicates ± 2 standard deviations. Closed symbols (solid lines) and open symbols(dashed lines) show OD and OS, respectively, of the same patient. Most patients show areduction in total thickness throughout the macula. This is primarily due to a reduction in REC+. Inner nuclear layer thickness is normal except in two eyes with macular edema involvingthe inner retina.
Birch et al. Page 9
Retina. Author manuscript; available in PMC 2011 June 1.
NIH
-PA Author Manuscript
NIH
-PA Author Manuscript
NIH
-PA Author Manuscript

NIH
-PA Author Manuscript
NIH
-PA Author Manuscript
NIH
-PA Author Manuscript
Birch et al. Page 10
Tabl
e 1
Dem
ogra
phic
and
clin
ical
dat
a
Patie
ntR
FSW
ID#
Age
Gen
der
Tim
e w
ith D
iagn
osis
(yrs
)T
reat
men
tsL
ens
176
8961
M10
pred
niso
ne, a
zath
iopr
ine,
ace
tazo
lam
ide,
cyc
losp
orin
e, tr
iam
cino
lone
, flu
cino
lone
impl
ant (
OS)
, 2nd
glau
com
a (O
S)IO
L (O
D)
IOL
(OS)
247
6457
F13
fluci
nolo
ne im
plan
t (O
D),
pred
niso
ne, a
ceta
zola
mid
e, d
iclo
fena
c dro
ps, g
lauc
oma t
ube (
OD
), 2nd
gla
ucom
a(O
D)
IOL
(OD
)IO
L (O
S)
350
2672
F13
dicl
ofen
ac d
rops
+1 n
ucle
ar (O
S)+2
nuc
lear
(OD
)
479
8654
M6
cycl
ospo
rine,
acy
clov
ir, c
ellc
ept
+1 n
ucle
ar (O
D)
IOL
(OS)
547
7180
M13
pred
niso
ne, a
ceta
zola
mid
e, c
yclo
spor
ine,
tria
mci
nolo
ne, f
luci
nolo
ne im
plan
t (O
S), 2
nd g
lauc
oma
(OS)
clea
r (O
D)
clea
r (O
S)
677
5847
M2
myc
ophe
nola
te, t
riam
cino
lone
, flu
cino
lone
impl
ant (
OD
)cl
ear (
OD
)cl
ear (
OS)
737
8959
M16
pred
niso
ne, d
iam
oxcl
ear (
OD
)cl
ear (
OS)
Retina. Author manuscript; available in PMC 2011 June 1.

NIH
-PA Author Manuscript
NIH
-PA Author Manuscript
NIH
-PA Author Manuscript
Birch et al. Page 11
Tabl
e 2
Snel
len
visu
al a
cuity
and
OC
T-3
data
Patie
nt#
Eye
Snel
len
Acu
ityO
CT
Fov
eal T
hick
ness
(μM
)O
CT
Mac
ular
Vol
ume
(mm
3 )T
hin?
Mac
ular
Ede
ma?
1O
D20
/200
117
5.34
6Y
Y
OS
20/2
0013
95.
965
YY
2O
D20
/50
128
5.30
2Y
Y
OS
20/4
018
88.
270
NY
3O
D20
/50
140
4.91
9Y
N
OS
20/5
013
35.
027
YN
4O
D20
/20
171
5.46
NN
OS
20/2
516
35.
71N
N
5O
D20
/30
253
6.39
NN
OS
20/2
0015
25.
32Y
N
6O
D20
/30
203
6.51
0N
N
OS
20/2
521
36.
290
NN
7O
D20
/25
248
6.93
NY
OS
20/3
033
37.
28N
Y
Retina. Author manuscript; available in PMC 2011 June 1.

NIH
-PA Author Manuscript
NIH
-PA Author Manuscript
NIH
-PA Author Manuscript
Birch et al. Page 12
Tabl
e 3
ETD
RS
visu
al a
cuity
and
ele
ctro
retin
ogra
phy
resu
lts
Pt #
Eye
VA
logM
AR
OC
T T
hin?
mfE
RG
fove
al n
V/d
eg2
mfE
RG
rin
g 2
nV/d
eg2
mfE
RG
rin
g 3
nV/d
eg2
mfE
RG
rin
g 4
nV/d
eg2
mfE
RG
rin
g 5
nV/d
eg2
mfE
RG
rin
g 6
nV/d
eg2
Mea
n m
fER
G n
V/d
eg2
Mea
n no
rmal
val
ue10
5.7
61.6
41.9
33.4
27.4
28.6
49.8
1O
D1
Y14
.110
.911
.310
.310
.212
.311
.1
1O
S1
Y10
.510
.410
.710
.19.
910
.110
.4
2O
D0.
4Y
26.7
23.7
23.7
24.4
23.8
28.9
25.2
2O
S0.
3N
20.7
19.1
20.6
18.0
16.4
18.7
18.9
3O
D0.
4Y
10.0
8.1
6.3
5.8
6.4
9.4
7.7
3O
S0.
4Y
25.9
17.5
15.7
16.3
15.3
13.8
17.4
4O
D0
N10
2.9
72.8
55.8
40.2
33.8
37.6
57.1
4O
S0.
1N
89.9
48.6
36.3
29.4
21.3
21.6
41.2
5O
D0.
2N
33.1
29.6
23.6
18.6
14.3
15.9
22.5
5O
S1.
0Y
5.2
13.5
12.5
9.5
10.0
12.1
10.5
6O
D0.
2N
92.3
58.0
36.6
29.2
22.0
22.8
43.5
6O
S0.
1N
54.7
31.1
23.4
18.0
13.4
12.1
25.5
7O
D0.
1N
50.1
30.0
28.6
20.1
19.4
24.7
28.8
7O
S0.
2N
31.4
27.7
20.1
15.3
14.5
20.9
21.7
Retina. Author manuscript; available in PMC 2011 June 1.

NIH
-PA Author Manuscript
NIH
-PA Author Manuscript
NIH
-PA Author Manuscript
Birch et al. Page 13
Tabl
e 4
Snel
len
acui
ty, O
CT-
3, a
nd m
fER
G re
sults
for p
atie
nts w
ith a
nd w
ithou
t ana
tom
ic th
inni
ng
Eye
s With
Ana
tom
ic T
hinn
ing
n =
6E
yes W
ithou
t Ana
tom
ic T
hinn
ing
n =
8p
Mea
n Sn
elle
n ac
uity
(log
MA
R)
0.7
± 0.
330.
15 ±
0.0
90.
0006
Mea
n fo
veal
thic
knes
s (μM
)13
4.8
± 11
.922
1.5
± 55
.60.
003
Mea
n m
acul
ar v
olum
e (m
m3 )
5.3
± 0.
396.
6 ±
0.9
0.00
6
Mea
n fo
veal
ER
G (n
V/d
eg2 )
15.4
± 8
.959
.4 ±
31.
60.
006
Mea
n m
fER
G (n
V/d
eg2 )
13.7
± 6
.532
.4 ±
13.
40.
009
Retina. Author manuscript; available in PMC 2011 June 1.


