Embed Size (px)
Citation preview
For updated information, please visit www.ibef.org March 2020
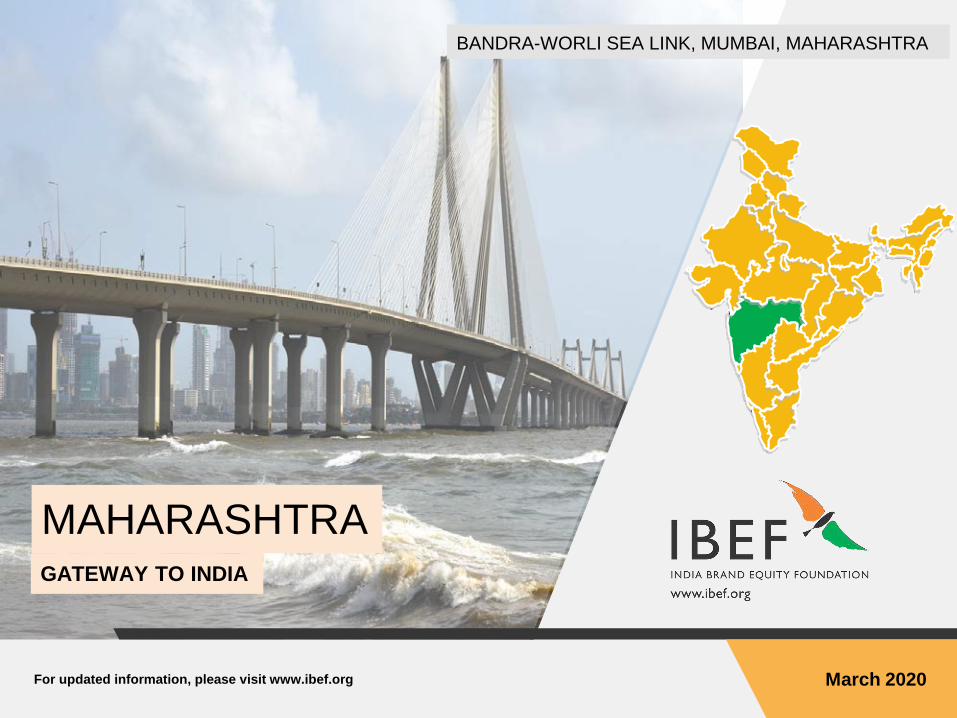
MAHARASHTRAGATEWAY TO INDIA
BANDRA-WORLI SEA LINK, MUMBAI, MAHARASHTRA
Table of Content
Executive Summary……………..……….….3
Introduction…..…………………..…………..4
Economic Snapshot…….……………….…..9
Physical Infrastructure………………….….15
Social Infrastructure……….…………..…...24
Industrial Infrastructure…….......................27
Key Sectors………….…….…..…….......…32
Key Procedures and Policies……..……….43
Annexure…….………........................…….56
For updated information, please visit www.ibef.orgMAHARASHTRA3
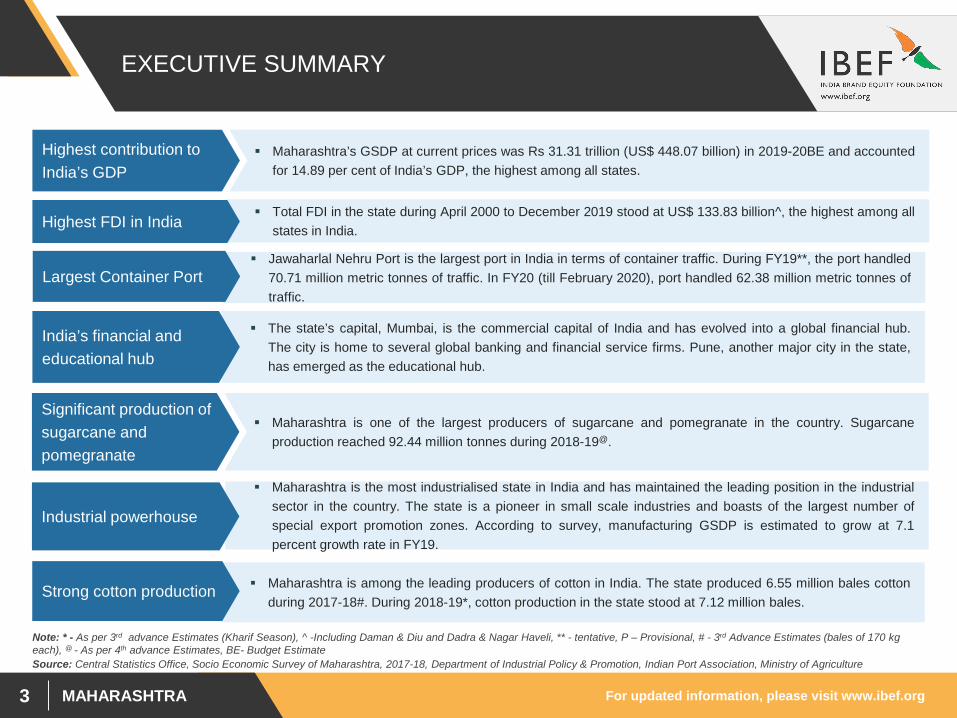
EXECUTIVE SUMMARY
Maharashtra’s GSDP at current prices was Rs 31.31 trillion (US$ 448.07 billion) in 2019-20BE and accountedfor 14.89 per cent of India’s GDP, the highest among all states.
Highest contribution to India’s GDP
Source: Central Statistics Office, Socio Economic Survey of Maharashtra, 2017-18, Department of Industrial Policy & Promotion, Indian Port Association, Ministry of Agriculture
Total FDI in the state during April 2000 to December 2019 stood at US$ 133.83 billion^, the highest among allstates in India.Highest FDI in India
The state’s capital, Mumbai, is the commercial capital of India and has evolved into a global financial hub.The city is home to several global banking and financial service firms. Pune, another major city in the state,has emerged as the educational hub.
India’s financial and educational hub
Jawaharlal Nehru Port is the largest port in India in terms of container traffic. During FY19**, the port handled70.71 million metric tonnes of traffic. In FY20 (till February 2020), port handled 62.38 million metric tonnes oftraffic.
Largest Container Port
Maharashtra is one of the largest producers of sugarcane and pomegranate in the country. Sugarcaneproduction reached 92.44 million tonnes during 2018-19@.
Significant production of sugarcane and pomegranate
Maharashtra is the most industrialised state in India and has maintained the leading position in the industrialsector in the country. The state is a pioneer in small scale industries and boasts of the largest number ofspecial export promotion zones. According to survey, manufacturing GSDP is estimated to grow at 7.1percent growth rate in FY19.
Industrial powerhouse
Maharashtra is among the leading producers of cotton in India. The state produced 6.55 million bales cottonduring 2017-18#. During 2018-19*, cotton production in the state stood at 7.12 million bales.
Strong cotton production
Note: * - As per 3rd advance Estimates (Kharif Season), ^ -Including Daman & Diu and Dadra & Nagar Haveli, ** - tentative, P – Provisional, # - 3rd Advance Estimates (bales of 170 kg each), @ - As per 4th advance Estimates, BE- Budget Estimate
MAHARASHTRA
INTRODUCTION
For updated information, please visit www.ibef.orgMAHARASHTRA5
MAHARASHTRA FACT FILE
Source: National Portal of India, Economic Survey 2015-16, Economic Survey 2016-17
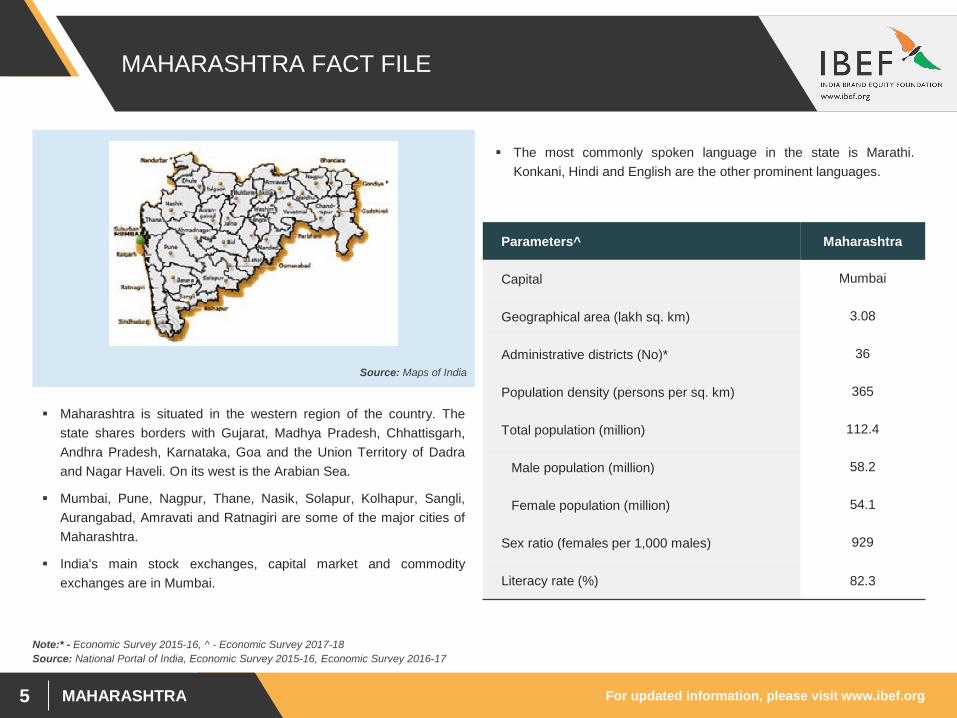
Maharashtra is situated in the western region of the country. Thestate shares borders with Gujarat, Madhya Pradesh, Chhattisgarh,Andhra Pradesh, Karnataka, Goa and the Union Territory of Dadraand Nagar Haveli. On its west is the Arabian Sea.
Mumbai, Pune, Nagpur, Thane, Nasik, Solapur, Kolhapur, Sangli,Aurangabad, Amravati and Ratnagiri are some of the major cities ofMaharashtra.
India's main stock exchanges, capital market and commodityexchanges are in Mumbai.
The most commonly spoken language in the state is Marathi.Konkani, Hindi and English are the other prominent languages.
Source: Maps of India
Parameters^ Maharashtra
Capital Mumbai
Geographical area (lakh sq. km) 3.08
Administrative districts (No)* 36
Population density (persons per sq. km) 365
Total population (million) 112.4
Male population (million) 58.2
Female population (million) 54.1
Sex ratio (females per 1,000 males) 929
Literacy rate (%) 82.3
Note:* - Economic Survey 2015-16, ^ - Economic Survey 2017-18
For updated information, please visit www.ibef.orgMAHARASHTRA6
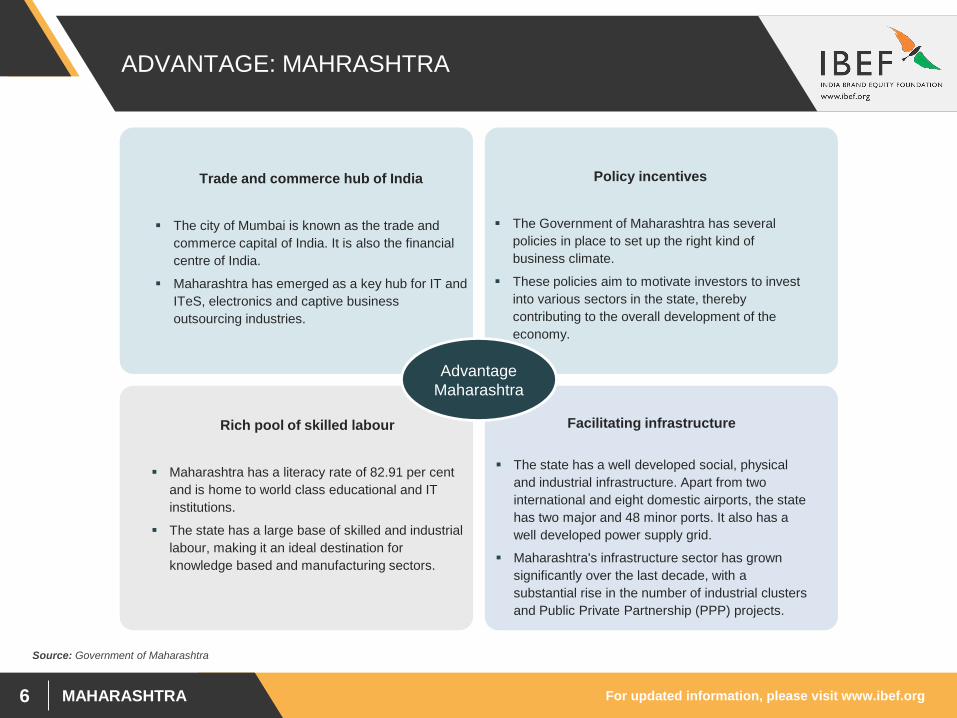
ADVANTAGE: MAHRASHTRA
Policy incentives
The Government of Maharashtra has several policies in place to set up the right kind of business climate.
These policies aim to motivate investors to invest into various sectors in the state, thereby contributing to the overall development of the economy.
Facilitating infrastructure
The state has a well developed social, physical and industrial infrastructure. Apart from two international and eight domestic airports, the state has two major and 48 minor ports. It also has a well developed power supply grid.
Maharashtra's infrastructure sector has grown significantly over the last decade, with a substantial rise in the number of industrial clusters and Public Private Partnership (PPP) projects.
Rich pool of skilled labour
Maharashtra has a literacy rate of 82.91 per cent and is home to world class educational and IT institutions.
The state has a large base of skilled and industrial labour, making it an ideal destination for knowledge based and manufacturing sectors.
AdvantageMaharashtra
Trade and commerce hub of India
The city of Mumbai is known as the trade and commerce capital of India. It is also the financial centre of India.
Maharashtra has emerged as a key hub for IT and ITeS, electronics and captive business outsourcing industries.
Source: Government of Maharashtra
For updated information, please visit www.ibef.orgMAHARASHTRA7
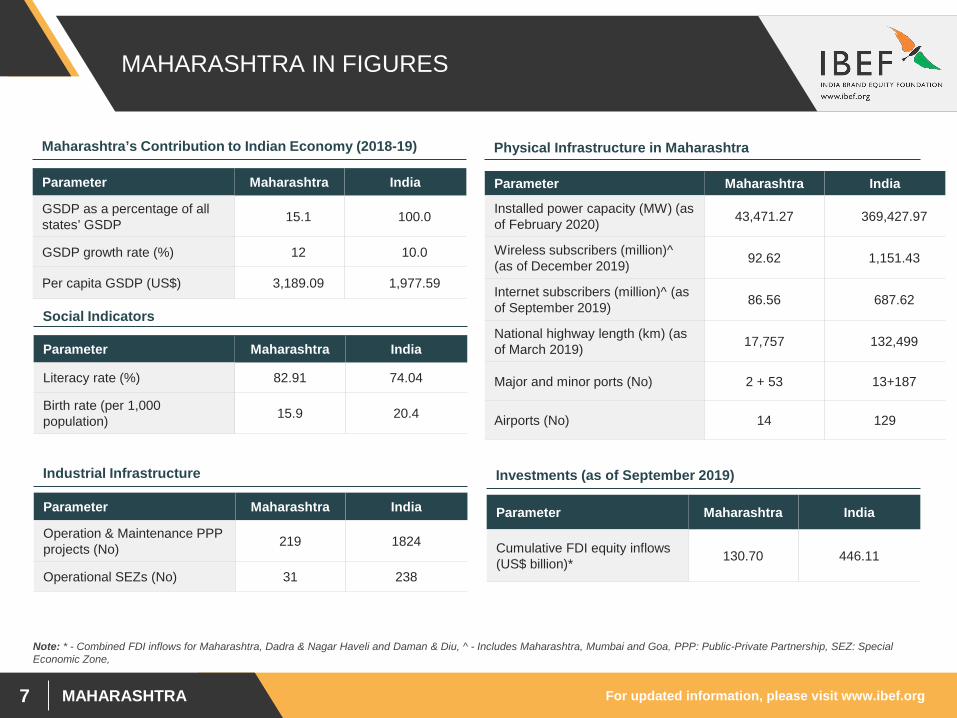
MAHARASHTRA IN FIGURES
Parameter Maharashtra India
GSDP as a percentage of all states’ GSDP 15.1 100.0
GSDP growth rate (%) 12 10.0
Per capita GSDP (US$) 3,189.09 1,977.59
Maharashtra’s Contribution to Indian Economy (2018-19)
Parameter Maharashtra India
Installed power capacity (MW) (as of February 2020) 43,471.27 369,427.97
Wireless subscribers (million)^ (as of December 2019) 92.62 1,151.43
Internet subscribers (million)^ (as of September 2019) 86.56 687.62
National highway length (km) (as of March 2019) 17,757 132,499
Major and minor ports (No) 2 + 53 13+187
Airports (No) 14 129
Physical Infrastructure in Maharashtra
Parameter Maharashtra India
Literacy rate (%) 82.91 74.04
Birth rate (per 1,000 population) 15.9 20.4
Social Indicators
Parameter Maharashtra India
Operation & Maintenance PPP projects (No) 219 1824
Operational SEZs (No) 31 238
Industrial Infrastructure
Parameter Maharashtra India
Cumulative FDI equity inflows (US$ billion)* 130.70 446.11
Investments (as of September 2019)
Note: * - Combined FDI inflows for Maharashtra, Dadra & Nagar Haveli and Daman & Diu, ^ - Includes Maharashtra, Mumbai and Goa, PPP: Public-Private Partnership, SEZ: Special Economic Zone,
For updated information, please visit www.ibef.orgMAHARASHTRA8
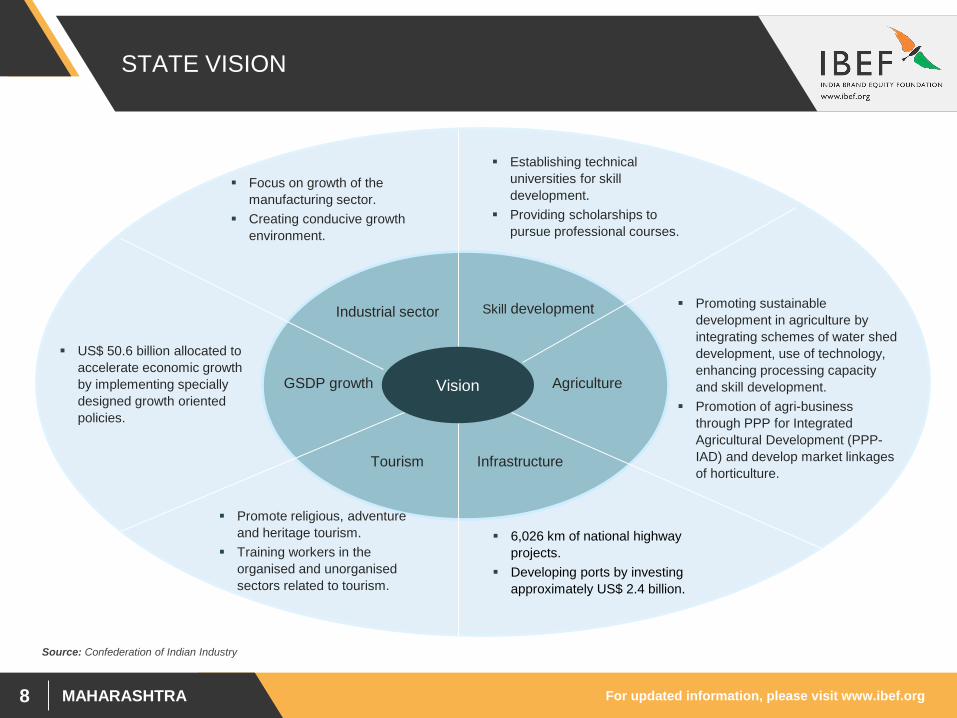
STATE VISION
Source: Confederation of Indian Industry
GSDP growth
US$ 50.6 billion allocated to accelerate economic growth by implementing specially designed growth oriented policies.
Skill development
Establishing technical universities for skill development.
Providing scholarships to pursue professional courses.
Agriculture
Promoting sustainable development in agriculture by integrating schemes of water shed development, use of technology, enhancing processing capacity and skill development.
Promotion of agri-business through PPP for Integrated Agricultural Development (PPP-IAD) and develop market linkages of horticulture.
Industrial sector
Focus on growth of the manufacturing sector.
Creating conducive growth environment.
InfrastructureTourism
Promote religious, adventure and heritage tourism.
Training workers in the organised and unorganised sectors related to tourism.
6,026 km of national highway projects.
Developing ports by investing approximately US$ 2.4 billion.
Vision
MAHARASHTRA
ECONOMIC SNAPSHOT
For updated information, please visit www.ibef.orgMAHARASHTRA10
ECONOMIC SNAPSHOT – GSDP
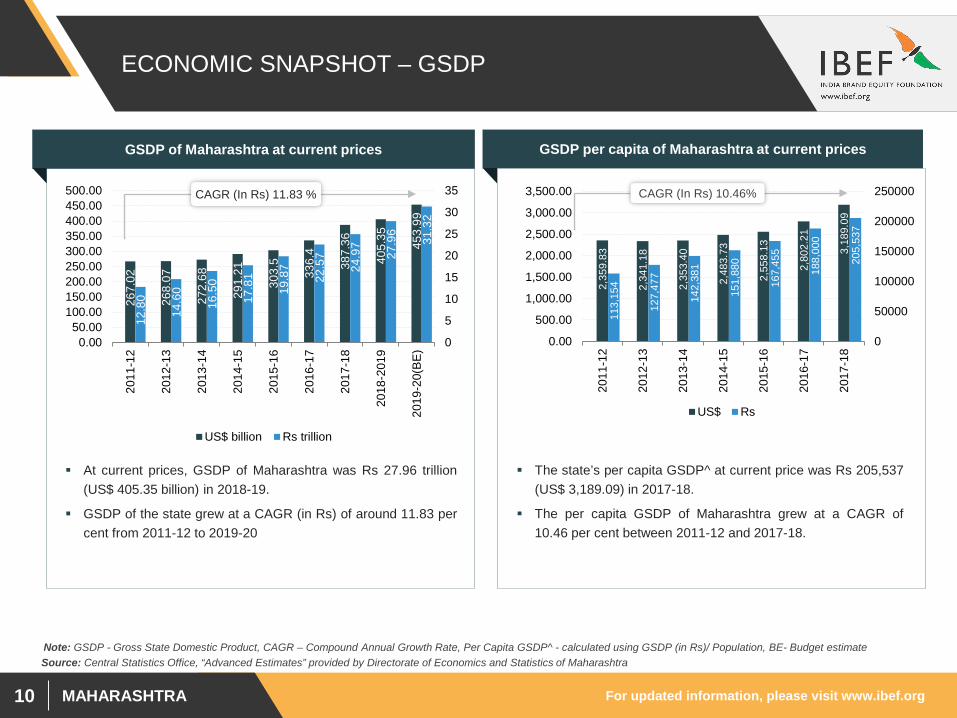
GSDP of Maharashtra at current prices
At current prices, GSDP of Maharashtra was Rs 27.96 trillion(US$ 405.35 billion) in 2018-19.
GSDP of the state grew at a CAGR (in Rs) of around 11.83 percent from 2011-12 to 2019-20
Source: Central Statistics Office, “Advanced Estimates” provided by Directorate of Economics and Statistics of Maharashtra
267.
02
268.
07
272.
68
291.
21
303.
5
336.
4
387.
36
405.
35
453.
99
12.8
0
14.6
0
16.5
0
17.8
1
19.8
7
22.5
7
24.9
7
27.9
6
31.3
2
0
5
10
15
20
25
30
35
0.0050.00
100.00150.00200.00250.00300.00350.00400.00450.00500.00
2011
-12
2012
-13
2013
-14
2014
-15
2015
-16
2016
-17
2017
-18
2018
-201
9
2019
-20(
BE)
US$ billion Rs trillion
CAGR (In Rs) 11.83 %
GSDP per capita of Maharashtra at current prices
The state’s per capita GSDP^ at current price was Rs 205,537(US$ 3,189.09) in 2017-18.
The per capita GSDP of Maharashtra grew at a CAGR of10.46 per cent between 2011-12 and 2017-18.
Note: GSDP - Gross State Domestic Product, CAGR – Compound Annual Growth Rate, Per Capita GSDP^ - calculated using GSDP (in Rs)/ Population, BE- Budget estimate
2,35
9.83
2,34
1.18
2,35
3.40
2,48
3.73
2,55
8.13
2,80
2.21
3,18
9.09
113,
154
127,
477
142,
381
151,
880
167,
455
188,
000
205,
537
0
50000
100000
150000
200000
250000
0.00
500.00
1,000.00
1,500.00
2,000.00
2,500.00
3,000.00
3,500.00
2011
-12
2012
-13
2013
-14
2014
-15
2015
-16
2016
-17
2017
-18
US$ Rs
CAGR (In Rs) 10.46%

For updated information, please visit www.ibef.orgMAHARASHTRA11
ECONOMIC SNAPSHOT – NSDP
NSDP of Maharashtra at current prices
Source: Central Statistics Office, Based on “Advanced Estimates” provided by Directorate of Economics and Statistics of Maharashtra, Socio Economic Survey of Maharashtra, 2017-18.
At current prices, NSDP of Maharashtra was Rs 21.94 trillion(US$ 340.41 billion) in 2017-18.
Maharashtra’s NSDP grew at a CAGR of around 11.75 per centfrom 2011-12 to 2017-18.
At current price, the state’s per capita NSDP was Rs 180,596(US$ 2,802.11) in 2017-18.
The per capita NSDP of Maharashtra grew at a CAGR of10.43 per cent between 2011-12 and 2016-17.
NSDP per capita of Maharashtra at current prices
Note: NSDP - Net State Domestic Product, CAGR – Compound Annual Growth Rate
234.
95
235.
48
239.
47
254.
26
267.
53
296.
14 340.
41
11.2
7
12.8
2
14.4
9
15.5
5
17.5
1
19.8
7
21.9
4
0
5
10
15
20
25
0.0050.00
100.00150.00200.00250.00300.00350.00400.00
2011
-12
2012
-13
2013
-14
2014
-15
2015
-16
2016
-17
2017
-18
US$ billion Rs trillion
CAGR (In Rs) 11.75%
2,07
6.41
2,05
6.57
2,06
6.76
2,16
8.62
2,25
4.96
2,46
6.70
2,80
2.11
99,5
64
111,
980
125,
039
132,
611
147,
610
165,
491
180,
596
020000400006000080000100000120000140000160000180000200000
0.00
500.00
1,000.00
1,500.00
2,000.00
2,500.00
3,000.00
2011
-12
2012
-13
2013
-14
2014
-15
2015
-16
2016
-17
2017
-18
US$ Rs
CAGR (In Rs) 10.43%
For updated information, please visit www.ibef.orgMAHARASHTRA12
ECONOMIC SNAPSHOT – PERCENTAGE DISTRIBUTION OF GSDP
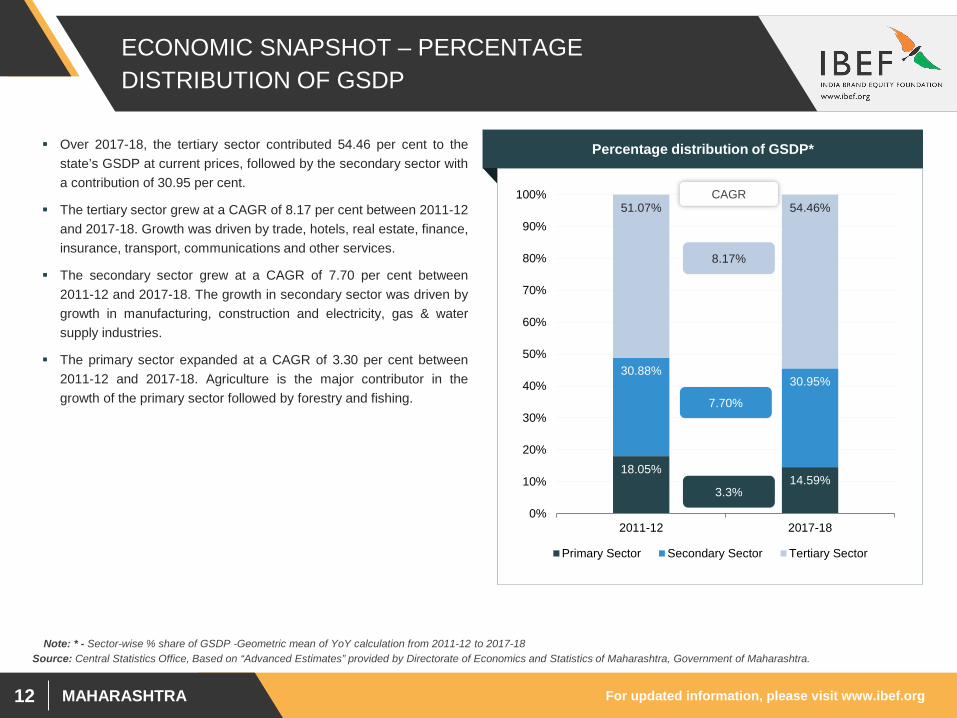
Over 2017-18, the tertiary sector contributed 54.46 per cent to thestate’s GSDP at current prices, followed by the secondary sector witha contribution of 30.95 per cent.
The tertiary sector grew at a CAGR of 8.17 per cent between 2011-12and 2017-18. Growth was driven by trade, hotels, real estate, finance,insurance, transport, communications and other services.
The secondary sector grew at a CAGR of 7.70 per cent between2011-12 and 2017-18. The growth in secondary sector was driven bygrowth in manufacturing, construction and electricity, gas & watersupply industries.
The primary sector expanded at a CAGR of 3.30 per cent between2011-12 and 2017-18. Agriculture is the major contributor in thegrowth of the primary sector followed by forestry and fishing.
Percentage distribution of GSDP*
18.05%14.59%
30.88%30.95%
51.07% 54.46%
0%
10%
20%
30%
40%
50%
60%
70%
80%
90%
100%
2011-12 2017-18
Primary Sector Secondary Sector Tertiary Sector
3.3%
8.17%
7.70%
CAGR
Source: Central Statistics Office, Based on “Advanced Estimates” provided by Directorate of Economics and Statistics of Maharashtra, Government of Maharashtra.Note: * - Sector-wise % share of GSDP -Geometric mean of YoY calculation from 2011-12 to 2017-18
For updated information, please visit www.ibef.orgMAHARASHTRA13
45.07 9.55
8.723.42
6.36
9.51
19.65
13.42
11.386.74
133.83
20
40
60
80
100
120
140
FY01
-11
FY12
FY13
FY14
FY15
FY16
FY17
FY18
FY19
FY20
FY01
-19
ECONOMIC SNAPSHOT – FDI INFLOWS & INVESTMENTS
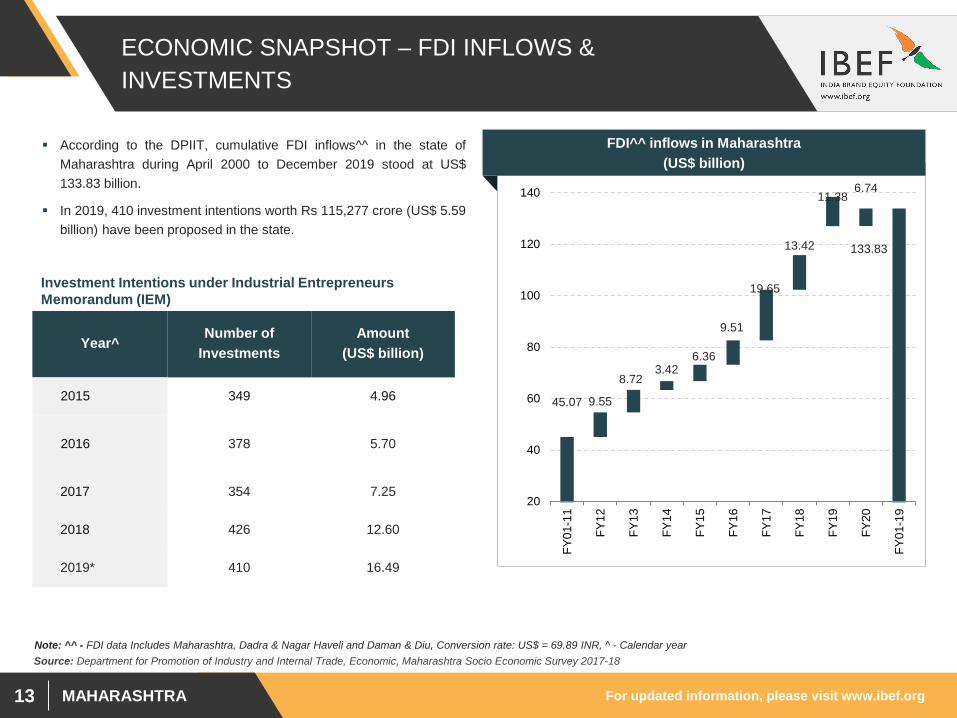
According to the DPIIT, cumulative FDI inflows^^ in the state ofMaharashtra during April 2000 to December 2019 stood at US$133.83 billion.
In 2019, 410 investment intentions worth Rs 115,277 crore (US$ 5.59billion) have been proposed in the state.
FDI^^ inflows in Maharashtra (US$ billion)
Source: Department for Promotion of Industry and Internal Trade, Economic, Maharashtra Socio Economic Survey 2017-18
Year^ Number of
InvestmentsAmount
(US$ billion)
2015 349 4.96
2016 378 5.70
2017 354 7.25
2018 426 12.60
2019* 410 16.49
Investment Intentions under Industrial Entrepreneurs Memorandum (IEM)
Note: ^^ - FDI data Includes Maharashtra, Dadra & Nagar Haveli and Daman & Diu, Conversion rate: US$ = 69.89 INR, ^ - Calendar year
For updated information, please visit www.ibef.orgMAHARASHTRA14
ECONOMIC SNAPSHOT – MAHARASHTRA’S EXPORT TRENDS
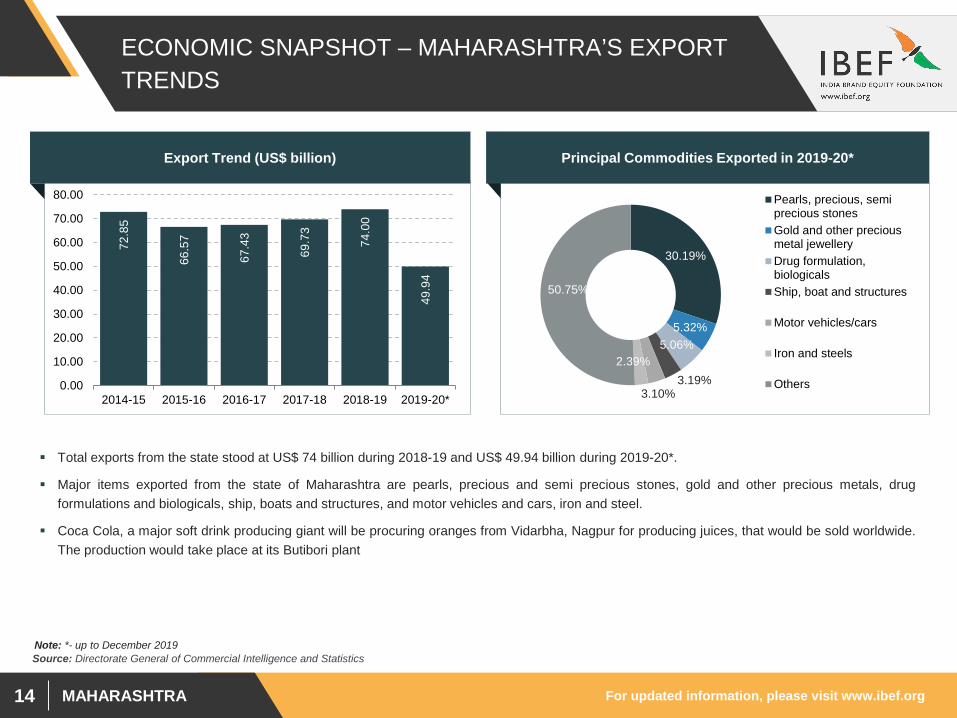
Total exports from the state stood at US$ 74 billion during 2018-19 and US$ 49.94 billion during 2019-20*.
Major items exported from the state of Maharashtra are pearls, precious and semi precious stones, gold and other precious metals, drugformulations and biologicals, ship, boats and structures, and motor vehicles and cars, iron and steel.
Coca Cola, a major soft drink producing giant will be procuring oranges from Vidarbha, Nagpur for producing juices, that would be sold worldwide.The production would take place at its Butibori plant
Source: Directorate General of Commercial Intelligence and Statistics
Export Trend (US$ billion)
72.8
5
66.5
7
67.4
3
69.7
3
74.0
0
49.9
4
0.00
10.00
20.00
30.00
40.00
50.00
60.00
70.00
80.00
2014-15 2015-16 2016-17 2017-18 2018-19 2019-20*
Principal Commodities Exported in 2019-20*
30.19%
5.32%5.06%
3.19%3.10%
2.39%
50.75%
Pearls, precious, semiprecious stonesGold and other preciousmetal jewelleryDrug formulation,biologicalsShip, boat and structures
Motor vehicles/cars
Iron and steels
Others
Note: *- up to December 2019

MAHARASHTRA
PHYSICAL INFRASTRUCTURE
For updated information, please visit www.ibef.orgMAHARASHTRA16
PHYSICAL INFRASTRUCTURE – ROADS
Source: Socio Economic Survey of Maharashtra, 2019-20, NHAI, News Articles
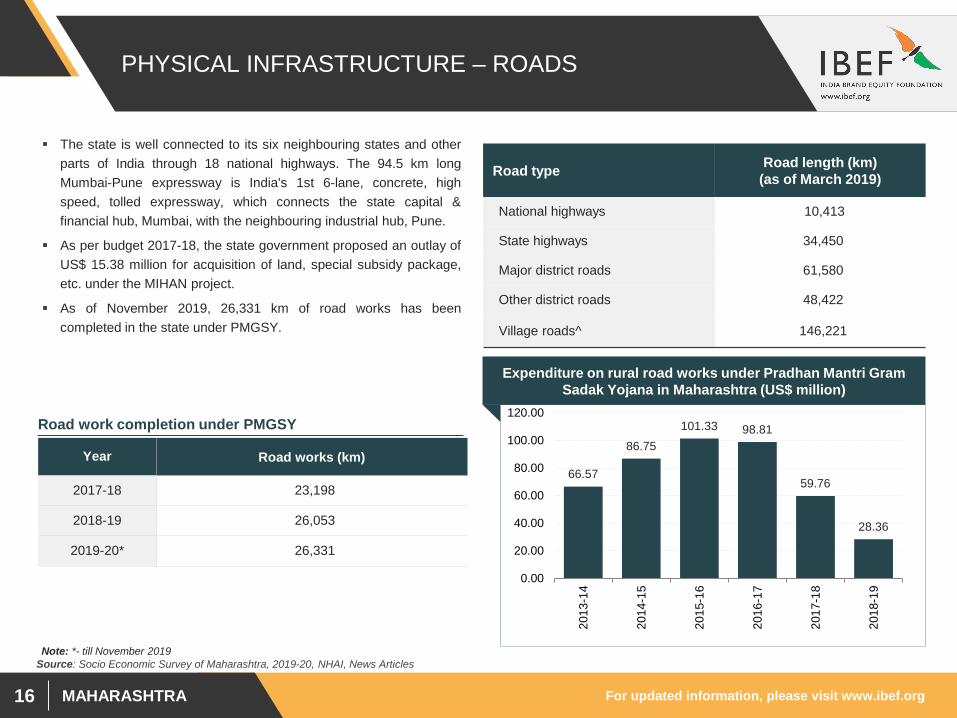
The state is well connected to its six neighbouring states and otherparts of India through 18 national highways. The 94.5 km longMumbai-Pune expressway is India's 1st 6-lane, concrete, highspeed, tolled expressway, which connects the state capital &financial hub, Mumbai, with the neighbouring industrial hub, Pune.
As per budget 2017-18, the state government proposed an outlay ofUS$ 15.38 million for acquisition of land, special subsidy package,etc. under the MIHAN project.
As of November 2019, 26,331 km of road works has beencompleted in the state under PMGSY.
Road type Road length (km) (as of March 2019)
National highways 10,413
State highways 34,450
Major district roads 61,580
Other district roads 48,422
Village roads^ 146,221
Expenditure on rural road works under Pradhan Mantri Gram Sadak Yojana in Maharashtra (US$ million)
66.57
86.75101.33 98.81
59.76
28.36
0.00
20.00
40.00
60.00
80.00
100.00
120.00
2013
-14
2014
-15
2015
-16
2016
-17
2017
-18
2018
-19
Year Road works (km)
2017-18 23,198
2018-19 26,053
2019-20* 26,331
Road work completion under PMGSY
Note: *- till November 2019
For updated information, please visit www.ibef.orgMAHARASHTRA17
PHYSICAL INFRASTRUCTURE – RAILWAYS
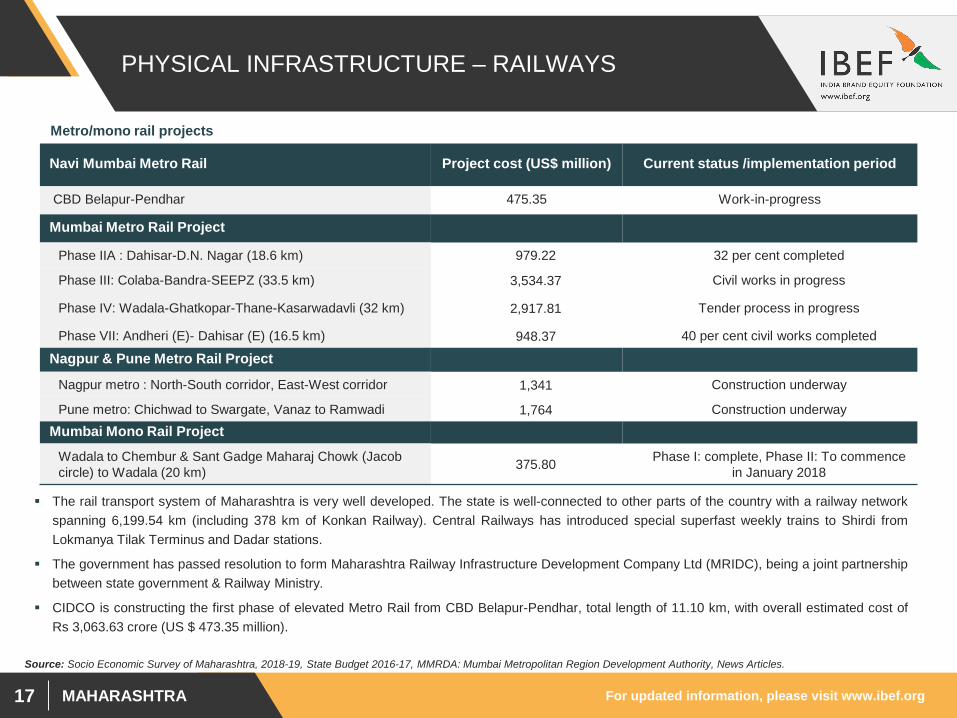
The rail transport system of Maharashtra is very well developed. The state is well-connected to other parts of the country with a railway networkspanning 6,199.54 km (including 378 km of Konkan Railway). Central Railways has introduced special superfast weekly trains to Shirdi fromLokmanya Tilak Terminus and Dadar stations.
The government has passed resolution to form Maharashtra Railway Infrastructure Development Company Ltd (MRIDC), being a joint partnershipbetween state government & Railway Ministry.
CIDCO is constructing the first phase of elevated Metro Rail from CBD Belapur-Pendhar, total length of 11.10 km, with overall estimated cost ofRs 3,063.63 crore (US $ 473.35 million).
Source: Socio Economic Survey of Maharashtra, 2018-19, State Budget 2016-17, MMRDA: Mumbai Metropolitan Region Development Authority, News Articles.
Navi Mumbai Metro Rail Project cost (US$ million) Current status /implementation period
CBD Belapur-Pendhar 475.35 Work-in-progress
Mumbai Metro Rail Project
Phase IIA : Dahisar-D.N. Nagar (18.6 km) 979.22 32 per cent completed
Phase III: Colaba-Bandra-SEEPZ (33.5 km) 3,534.37 Civil works in progress
Phase IV: Wadala-Ghatkopar-Thane-Kasarwadavli (32 km) 2,917.81 Tender process in progress
Phase VII: Andheri (E)- Dahisar (E) (16.5 km) 948.37 40 per cent civil works completed
Nagpur & Pune Metro Rail Project
Nagpur metro : North-South corridor, East-West corridor 1,341 Construction underway
Pune metro: Chichwad to Swargate, Vanaz to Ramwadi 1,764 Construction underwayMumbai Mono Rail Project
Wadala to Chembur & Sant Gadge Maharaj Chowk (Jacobcircle) to Wadala (20 km) 375.80 Phase I: complete, Phase II: To commence
in January 2018
Metro/mono rail projects
For updated information, please visit www.ibef.orgMAHARASHTRA18
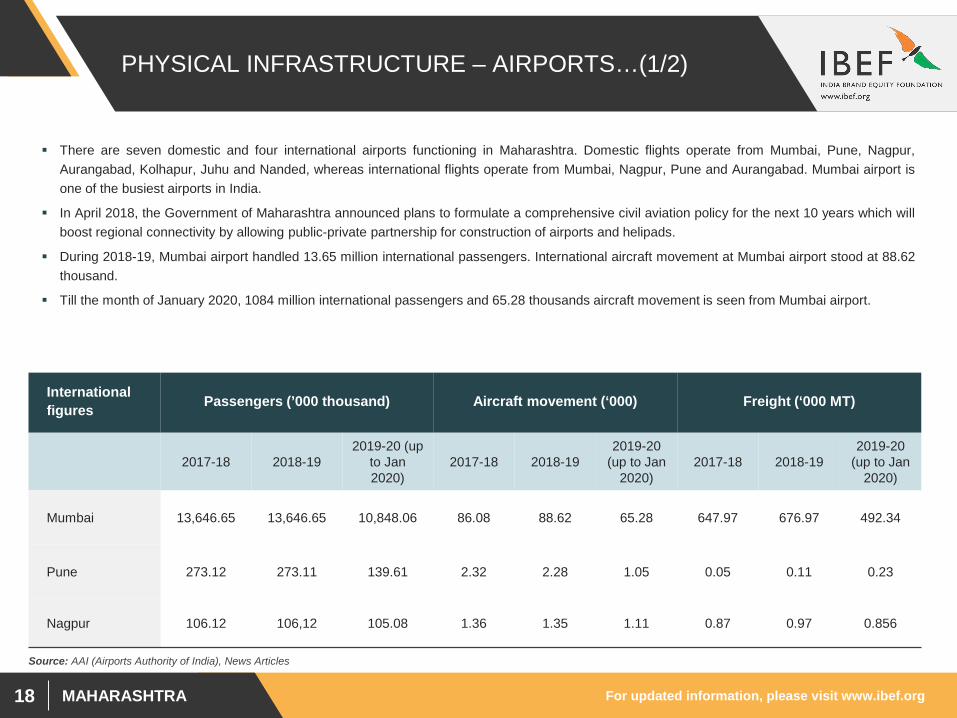
There are seven domestic and four international airports functioning in Maharashtra. Domestic flights operate from Mumbai, Pune, Nagpur,Aurangabad, Kolhapur, Juhu and Nanded, whereas international flights operate from Mumbai, Nagpur, Pune and Aurangabad. Mumbai airport isone of the busiest airports in India.
In April 2018, the Government of Maharashtra announced plans to formulate a comprehensive civil aviation policy for the next 10 years which willboost regional connectivity by allowing public-private partnership for construction of airports and helipads.
During 2018-19, Mumbai airport handled 13.65 million international passengers. International aircraft movement at Mumbai airport stood at 88.62thousand.
Till the month of January 2020, 1084 million international passengers and 65.28 thousands aircraft movement is seen from Mumbai airport.
PHYSICAL INFRASTRUCTURE – AIRPORTS…(1/2)
International figures Passengers (’000 thousand) Aircraft movement (‘000) Freight (‘000 MT)
2017-18 2018-192019-20 (up
to Jan 2020)
2017-18 2018-192019-20
(up to Jan 2020)
2017-18 2018-192019-20
(up to Jan 2020)
Mumbai 13,646.65 13,646.65 10,848.06 86.08 88.62 65.28 647.97 676.97 492.34
Pune 273.12 273.11 139.61 2.32 2.28 1.05 0.05 0.11 0.23
Nagpur 106.12 106,12 105.08 1.36 1.35 1.11 0.87 0.97 0.856
Source: AAI (Airports Authority of India), News Articles
For updated information, please visit www.ibef.orgMAHARASHTRA19
PHYSICAL INFRASTRUCTURE – AIRPORTS…(2/2)
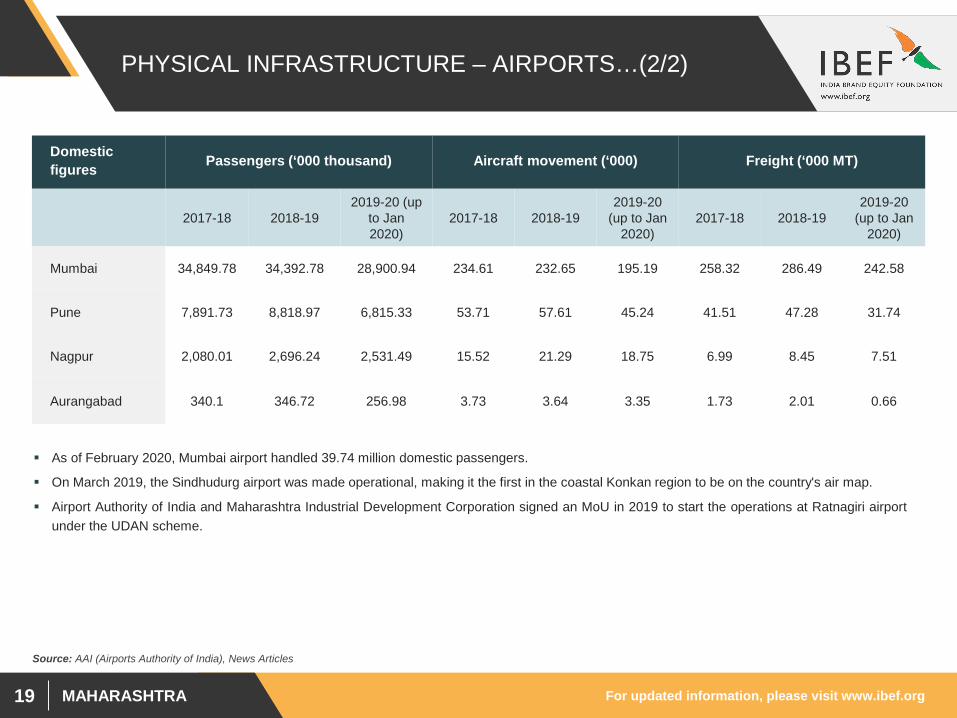
Domestic figures Passengers (‘000 thousand) Aircraft movement (‘000) Freight (‘000 MT)
2017-18 2018-192019-20 (up
to Jan 2020)
2017-18 2018-192019-20
(up to Jan 2020)
2017-18 2018-192019-20
(up to Jan 2020)
Mumbai 34,849.78 34,392.78 28,900.94 234.61 232.65 195.19 258.32 286.49 242.58
Pune 7,891.73 8,818.97 6,815.33 53.71 57.61 45.24 41.51 47.28 31.74
Nagpur 2,080.01 2,696.24 2,531.49 15.52 21.29 18.75 6.99 8.45 7.51
Aurangabad 340.1 346.72 256.98 3.73 3.64 3.35 1.73 2.01 0.66
Source: AAI (Airports Authority of India), News Articles
As of February 2020, Mumbai airport handled 39.74 million domestic passengers.
On March 2019, the Sindhudurg airport was made operational, making it the first in the coastal Konkan region to be on the country's air map.
Airport Authority of India and Maharashtra Industrial Development Corporation signed an MoU in 2019 to start the operations at Ratnagiri airportunder the UDAN scheme.
For updated information, please visit www.ibef.orgMAHARASHTRA20
PHYSICAL INFRASTRUCTURE – PORTS
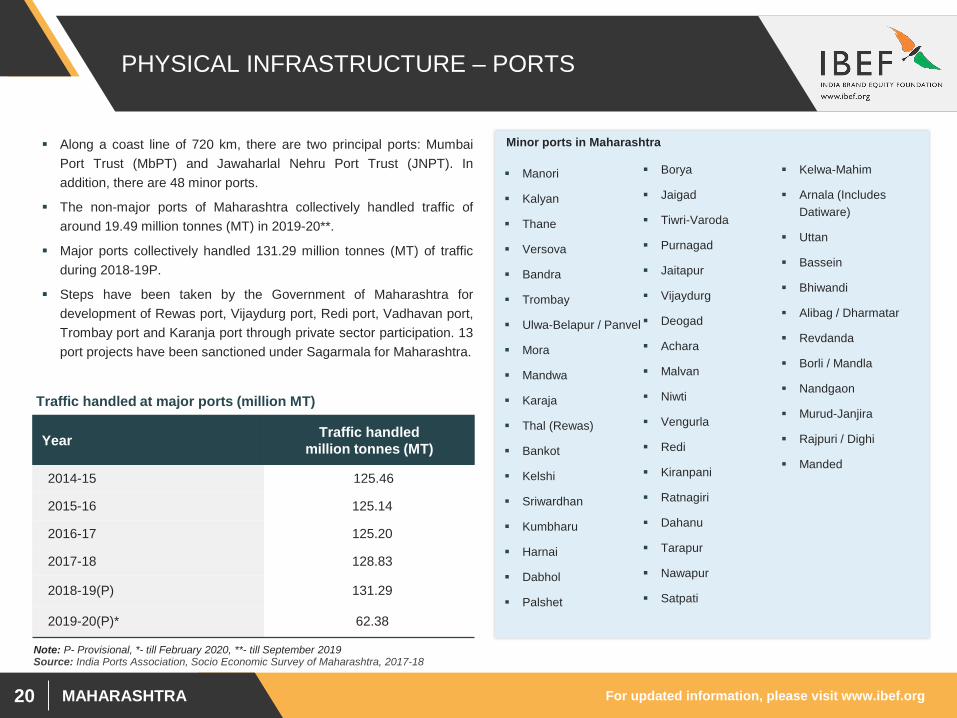
Along a coast line of 720 km, there are two principal ports: MumbaiPort Trust (MbPT) and Jawaharlal Nehru Port Trust (JNPT). Inaddition, there are 48 minor ports.
The non-major ports of Maharashtra collectively handled traffic ofaround 19.49 million tonnes (MT) in 2019-20**.
Major ports collectively handled 131.29 million tonnes (MT) of trafficduring 2018-19P.
Steps have been taken by the Government of Maharashtra fordevelopment of Rewas port, Vijaydurg port, Redi port, Vadhavan port,Trombay port and Karanja port through private sector participation. 13port projects have been sanctioned under Sagarmala for Maharashtra.
Traffic handled at major ports (million MT)
Manori
Kalyan
Thane
Versova
Bandra
Trombay
Ulwa-Belapur / Panvel
Mora
Mandwa
Karaja
Thal (Rewas)
Bankot
Kelshi
Sriwardhan
Kumbharu
Harnai
Dabhol
Palshet
Borya
Jaigad
Tiwri-Varoda
Purnagad
Jaitapur
Vijaydurg
Deogad
Achara
Malvan
Niwti
Vengurla
Redi
Kiranpani
Ratnagiri
Dahanu
Tarapur
Nawapur
Satpati
Kelwa-Mahim
Arnala (Includes Datiware)
Uttan
Bassein
Bhiwandi
Alibag / Dharmatar
Revdanda
Borli / Mandla
Nandgaon
Murud-Janjira
Rajpuri / Dighi
Manded
Minor ports in Maharashtra
Source: India Ports Association, Socio Economic Survey of Maharashtra, 2017-18Note: P- Provisional, *- till February 2020, **- till September 2019
Year Traffic handled million tonnes (MT)
2014-15 125.46
2015-16 125.14
2016-17 125.20
2017-18 128.83
2018-19(P) 131.29
2019-20(P)* 62.38
For updated information, please visit www.ibef.orgMAHARASHTRA21
PHYSICAL INFRASTRUCTURE – POWER
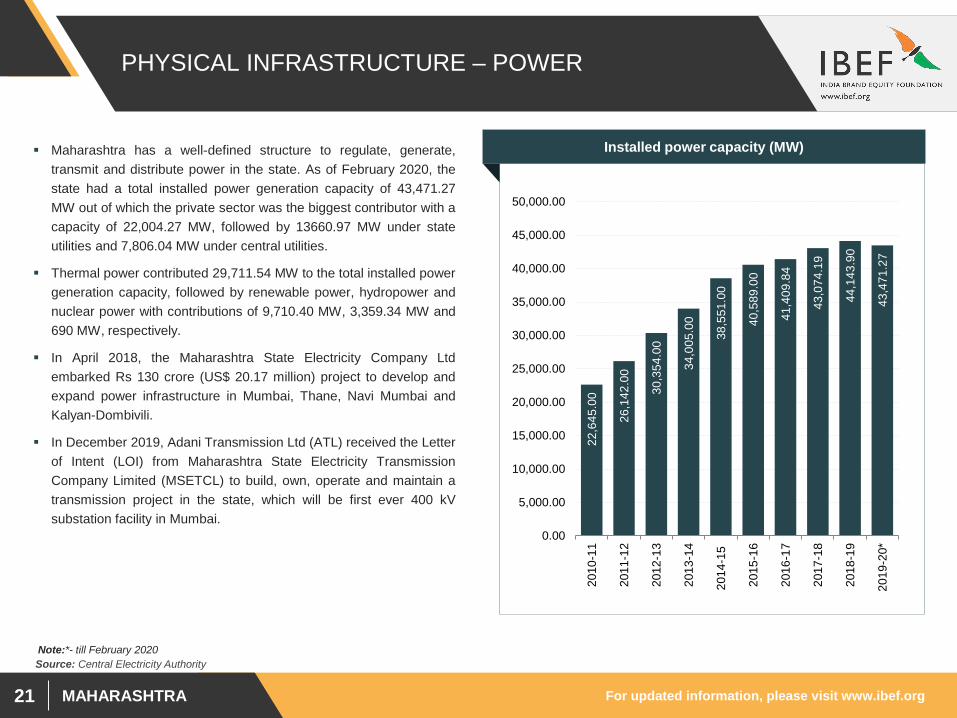
Maharashtra has a well-defined structure to regulate, generate,transmit and distribute power in the state. As of February 2020, thestate had a total installed power generation capacity of 43,471.27MW out of which the private sector was the biggest contributor with acapacity of 22,004.27 MW, followed by 13660.97 MW under stateutilities and 7,806.04 MW under central utilities.
Thermal power contributed 29,711.54 MW to the total installed powergeneration capacity, followed by renewable power, hydropower andnuclear power with contributions of 9,710.40 MW, 3,359.34 MW and690 MW, respectively.
In April 2018, the Maharashtra State Electricity Company Ltdembarked Rs 130 crore (US$ 20.17 million) project to develop andexpand power infrastructure in Mumbai, Thane, Navi Mumbai andKalyan-Dombivili.
In December 2019, Adani Transmission Ltd (ATL) received the Letterof Intent (LOI) from Maharashtra State Electricity TransmissionCompany Limited (MSETCL) to build, own, operate and maintain atransmission project in the state, which will be first ever 400 kVsubstation facility in Mumbai.
Installed power capacity (MW)
Source: Central Electricity Authority
22,6
45.0
0
26,1
42.0
0
30,3
54.0
0
34,0
05.0
0
38,5
51.0
0
40,5
89.0
0
41,4
09.8
4
43,0
74.1
9
44,1
43.9
0
43,4
71.2
7
0.00
5,000.00
10,000.00
15,000.00
20,000.00
25,000.00
30,000.00
35,000.00
40,000.00
45,000.00
50,000.00
2010
-11
2011
-12
2012
-13
2013
-14
2014
-15
2015
-16
2016
-17
2017
-18
2018
-19
2019
-20*
Note:*- till February 2020
For updated information, please visit www.ibef.orgMAHARASHTRA22
PHYSICAL INFRASTRUCTURE – TELECOM
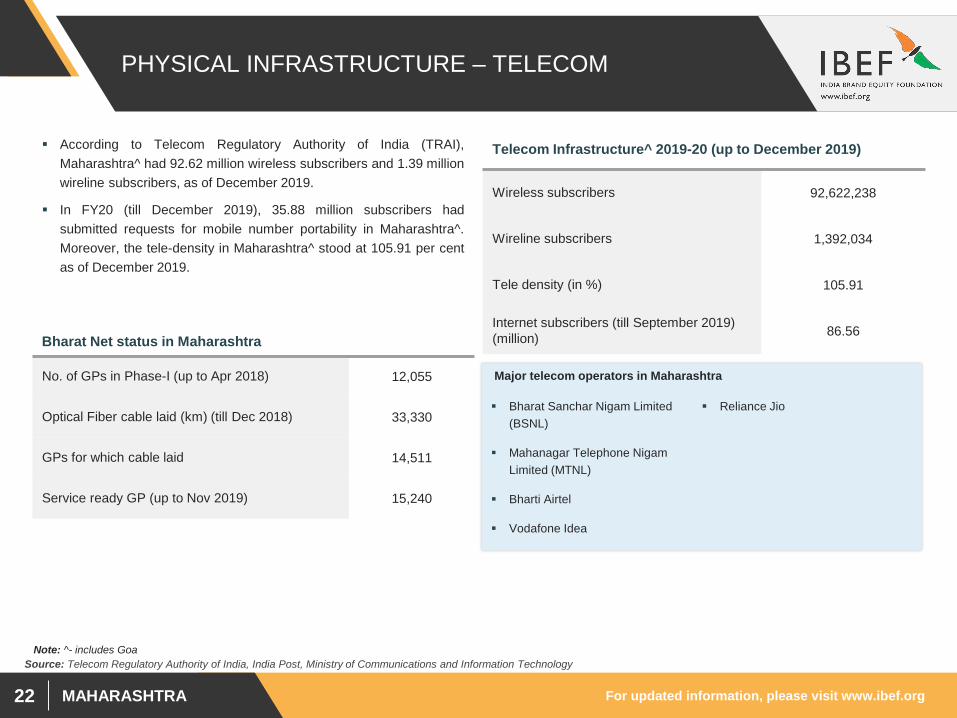
According to Telecom Regulatory Authority of India (TRAI),Maharashtra^ had 92.62 million wireless subscribers and 1.39 millionwireline subscribers, as of December 2019.
In FY20 (till December 2019), 35.88 million subscribers hadsubmitted requests for mobile number portability in Maharashtra^.Moreover, the tele-density in Maharashtra^ stood at 105.91 per centas of December 2019.
Wireless subscribers 92,622,238
Wireline subscribers 1,392,034
Tele density (in %) 105.91
Internet subscribers (till September 2019)(million) 86.56
No. of GPs in Phase-I (up to Apr 2018) 12,055
Optical Fiber cable laid (km) (till Dec 2018) 33,330
GPs for which cable laid 14,511
Service ready GP (up to Nov 2019) 15,240
Telecom Infrastructure^ 2019-20 (up to December 2019)
Bharat Net status in Maharashtra
Bharat Sanchar Nigam Limited (BSNL)
Mahanagar Telephone Nigam Limited (MTNL)
Bharti Airtel
Vodafone Idea
Reliance Jio
Major telecom operators in Maharashtra
Source: Telecom Regulatory Authority of India, India Post, Ministry of Communications and Information TechnologyNote: ^- includes Goa
For updated information, please visit www.ibef.orgMAHARASHTRA23
PHYSICAL INFRASTRUCTURE – URBAN DEVELOPMENT
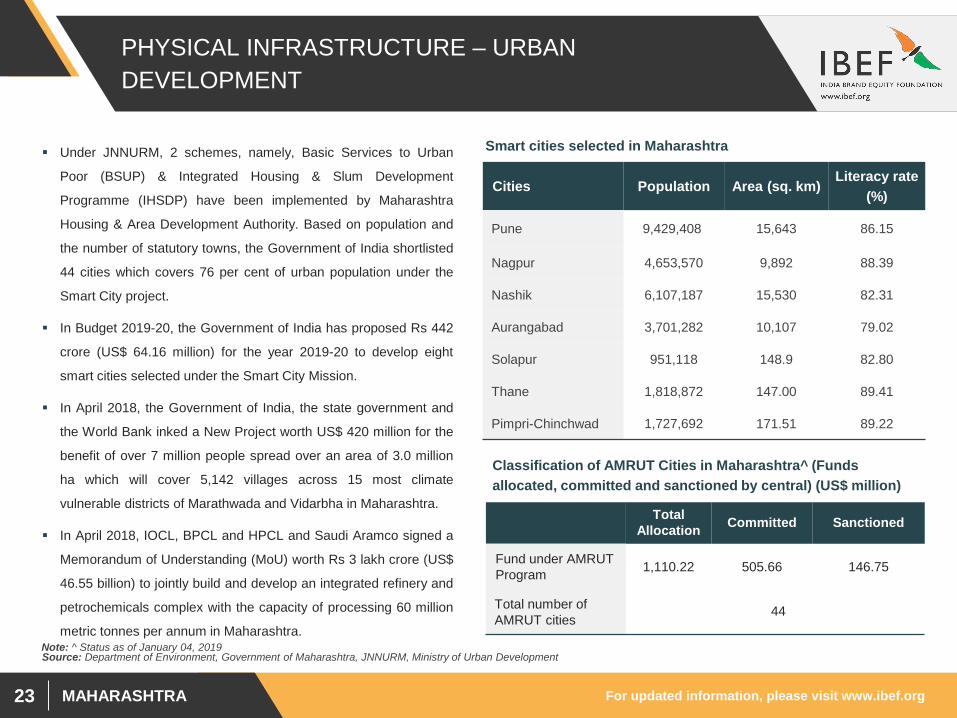
Under JNNURM, 2 schemes, namely, Basic Services to Urban
Poor (BSUP) & Integrated Housing & Slum Development
Programme (IHSDP) have been implemented by Maharashtra
Housing & Area Development Authority. Based on population and
the number of statutory towns, the Government of India shortlisted
44 cities which covers 76 per cent of urban population under the
Smart City project.
In Budget 2019-20, the Government of India has proposed Rs 442
crore (US$ 64.16 million) for the year 2019-20 to develop eight
smart cities selected under the Smart City Mission.
In April 2018, the Government of India, the state government and
the World Bank inked a New Project worth US$ 420 million for the
benefit of over 7 million people spread over an area of 3.0 million
ha which will cover 5,142 villages across 15 most climate
vulnerable districts of Marathwada and Vidarbha in Maharashtra.
In April 2018, IOCL, BPCL and HPCL and Saudi Aramco signed a
Memorandum of Understanding (MoU) worth Rs 3 lakh crore (US$
46.55 billion) to jointly build and develop an integrated refinery and
petrochemicals complex with the capacity of processing 60 million
metric tonnes per annum in Maharashtra.
Source: Department of Environment, Government of Maharashtra, JNNURM, Ministry of Urban Development
Cities Population Area (sq. km)Literacy rate
(%)
Pune 9,429,408 15,643 86.15
Nagpur 4,653,570 9,892 88.39
Nashik 6,107,187 15,530 82.31
Aurangabad 3,701,282 10,107 79.02
Solapur 951,118 148.9 82.80
Thane 1,818,872 147.00 89.41
Pimpri-Chinchwad 1,727,692 171.51 89.22
Smart cities selected in Maharashtra
Classification of AMRUT Cities in Maharashtra^ (Funds allocated, committed and sanctioned by central) (US$ million)
Total Allocation Committed Sanctioned
Fund under AMRUT Program 1,110.22 505.66 146.75
Total number of AMRUT cities 44
Note: ^ Status as of January 04, 2019
MAHARASHTRA
SOCIALINFRASTRUCTURE
For updated information, please visit www.ibef.orgMAHARASHTRA25
SOCIAL INFRASTRUCTURE – EDUCATION
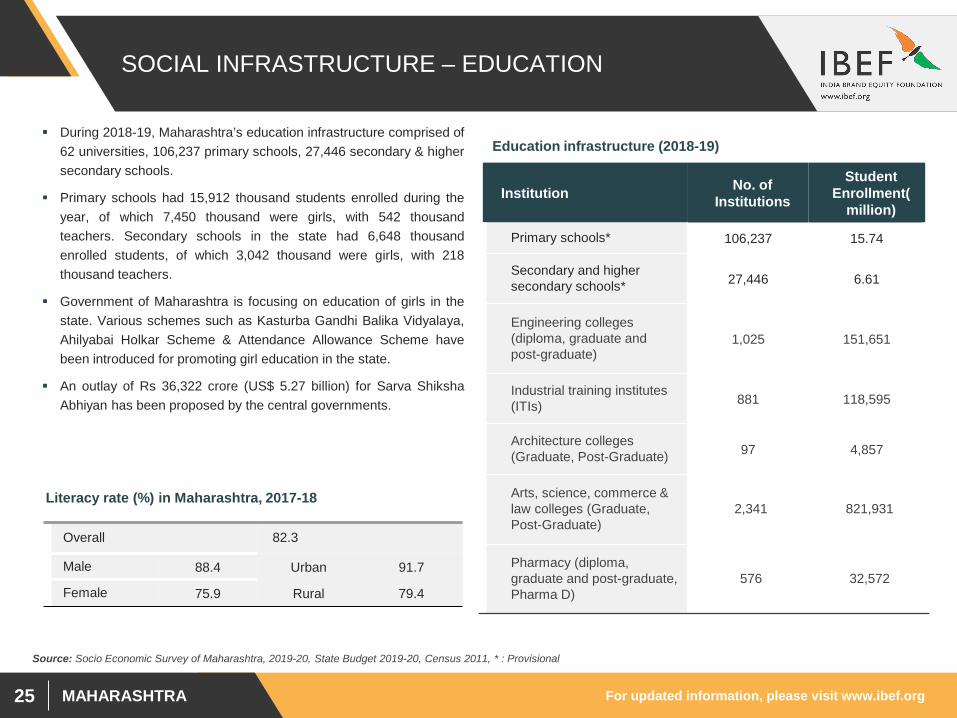
During 2018-19, Maharashtra’s education infrastructure comprised of62 universities, 106,237 primary schools, 27,446 secondary & highersecondary schools.
Primary schools had 15,912 thousand students enrolled during theyear, of which 7,450 thousand were girls, with 542 thousandteachers. Secondary schools in the state had 6,648 thousandenrolled students, of which 3,042 thousand were girls, with 218thousand teachers.
Government of Maharashtra is focusing on education of girls in thestate. Various schemes such as Kasturba Gandhi Balika Vidyalaya,Ahilyabai Holkar Scheme & Attendance Allowance Scheme havebeen introduced for promoting girl education in the state.
An outlay of Rs 36,322 crore (US$ 5.27 billion) for Sarva ShikshaAbhiyan has been proposed by the central governments.
Source: Socio Economic Survey of Maharashtra, 2019-20, State Budget 2019-20, Census 2011, * : Provisional
Institution No. of Institutions
Student Enrollment(
million)
Primary schools* 106,237 15.74
Secondary and higher secondary schools* 27,446 6.61
Engineering colleges (diploma, graduate and post-graduate)
1,025 151,651
Industrial training institutes (ITIs) 881 118,595
Architecture colleges (Graduate, Post-Graduate) 97 4,857
Arts, science, commerce & law colleges (Graduate, Post-Graduate)
2,341 821,931
Pharmacy (diploma, graduate and post-graduate, Pharma D)
576 32,572
Education infrastructure (2018-19)
Overall 82.3
Male 88.4 Urban 91.7
Female 75.9 Rural 79.4
Literacy rate (%) in Maharashtra, 2017-18
For updated information, please visit www.ibef.orgMAHARASHTRA26
SOCIAL INFRASTRUCTURE – HEALTH
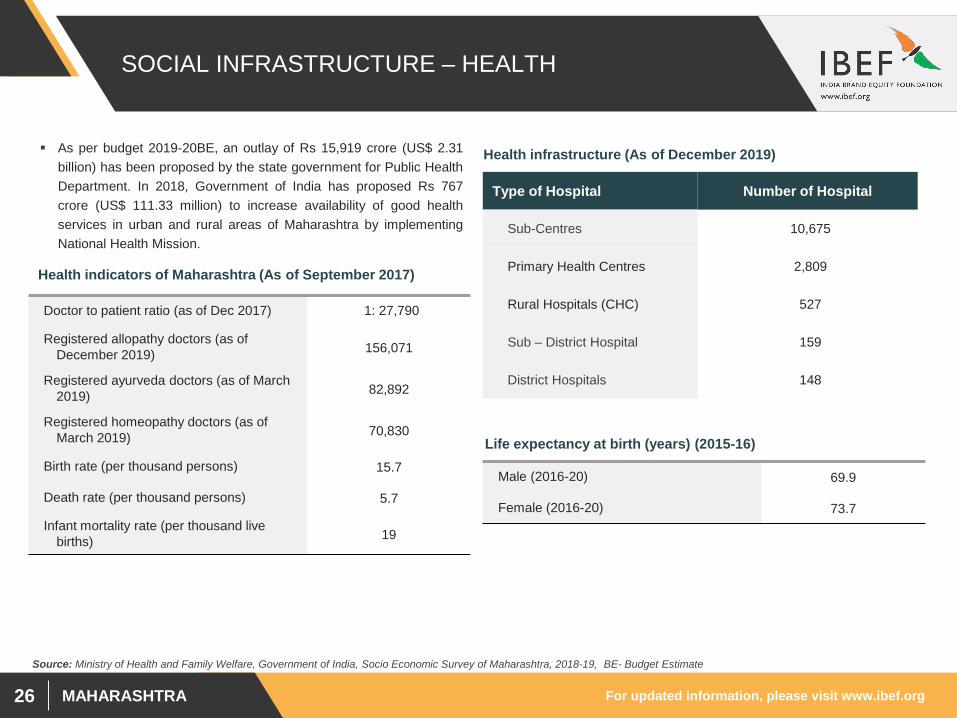
As per budget 2019-20BE, an outlay of Rs 15,919 crore (US$ 2.31billion) has been proposed by the state government for Public HealthDepartment. In 2018, Government of India has proposed Rs 767crore (US$ 111.33 million) to increase availability of good healthservices in urban and rural areas of Maharashtra by implementingNational Health Mission.
Source: Ministry of Health and Family Welfare, Government of India, Socio Economic Survey of Maharashtra, 2018-19, BE- Budget Estimate
Doctor to patient ratio (as of Dec 2017) 1: 27,790
Registered allopathy doctors (as of December 2019) 156,071
Registered ayurveda doctors (as of March 2019) 82,892
Registered homeopathy doctors (as of March 2019) 70,830
Birth rate (per thousand persons) 15.7
Death rate (per thousand persons) 5.7
Infant mortality rate (per thousand live births) 19
Health indicators of Maharashtra (As of September 2017)
Male (2016-20) 69.9
Female (2016-20) 73.7
Life expectancy at birth (years) (2015-16)
Health infrastructure (As of December 2019)
Type of Hospital Number of Hospital
Sub-Centres 10,675
Primary Health Centres 2,809
Rural Hospitals (CHC) 527
Sub – District Hospital 159
District Hospitals 148
MAHARASHTRA
INDUSTRIALINFRASTRUCTURE
For updated information, please visit www.ibef.orgMAHARASHTRA28
SPECIAL ECONOMIC ZONES… (1/2)
Source: Ministry of Commerce & Industry, Department of Commerce, SEZ: Special Economic Zone, Socio Economic Survey of Maharashtra, 2019-20
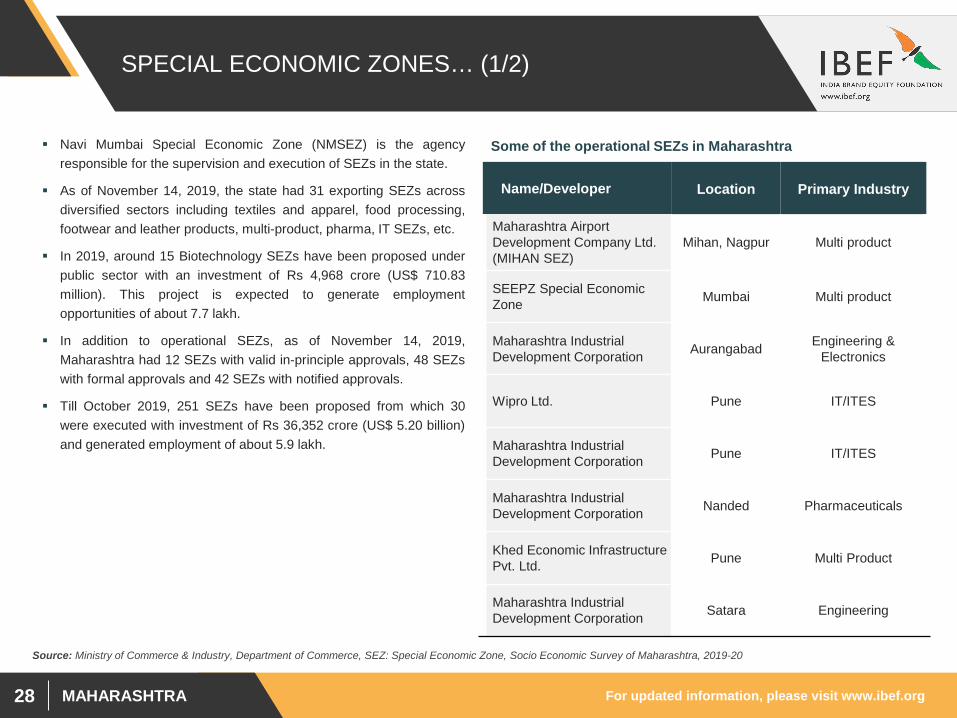
Navi Mumbai Special Economic Zone (NMSEZ) is the agencyresponsible for the supervision and execution of SEZs in the state.
As of November 14, 2019, the state had 31 exporting SEZs acrossdiversified sectors including textiles and apparel, food processing,footwear and leather products, multi-product, pharma, IT SEZs, etc.
In 2019, around 15 Biotechnology SEZs have been proposed underpublic sector with an investment of Rs 4,968 crore (US$ 710.83million). This project is expected to generate employmentopportunities of about 7.7 lakh.
In addition to operational SEZs, as of November 14, 2019,Maharashtra had 12 SEZs with valid in-principle approvals, 48 SEZswith formal approvals and 42 SEZs with notified approvals.
Till October 2019, 251 SEZs have been proposed from which 30were executed with investment of Rs 36,352 crore (US$ 5.20 billion)and generated employment of about 5.9 lakh.
Name/Developer Location Primary Industry
Maharashtra Airport Development Company Ltd. (MIHAN SEZ)
Mihan, Nagpur Multi product
SEEPZ Special Economic Zone Mumbai Multi product
Maharashtra Industrial Development Corporation Aurangabad Engineering &
Electronics
Wipro Ltd. Pune IT/ITES
Maharashtra Industrial Development Corporation Pune IT/ITES
Maharashtra Industrial Development Corporation Nanded Pharmaceuticals
Khed Economic Infrastructure Pvt. Ltd. Pune Multi Product
Maharashtra Industrial Development Corporation Satara Engineering
Some of the operational SEZs in Maharashtra
For updated information, please visit www.ibef.orgMAHARASHTRA29
SPECIAL ECONOMIC ZONES… (2/2)
Source: Ministry of Commerce & Industry, Department of Commerce, SEZ: Special Economic Zone
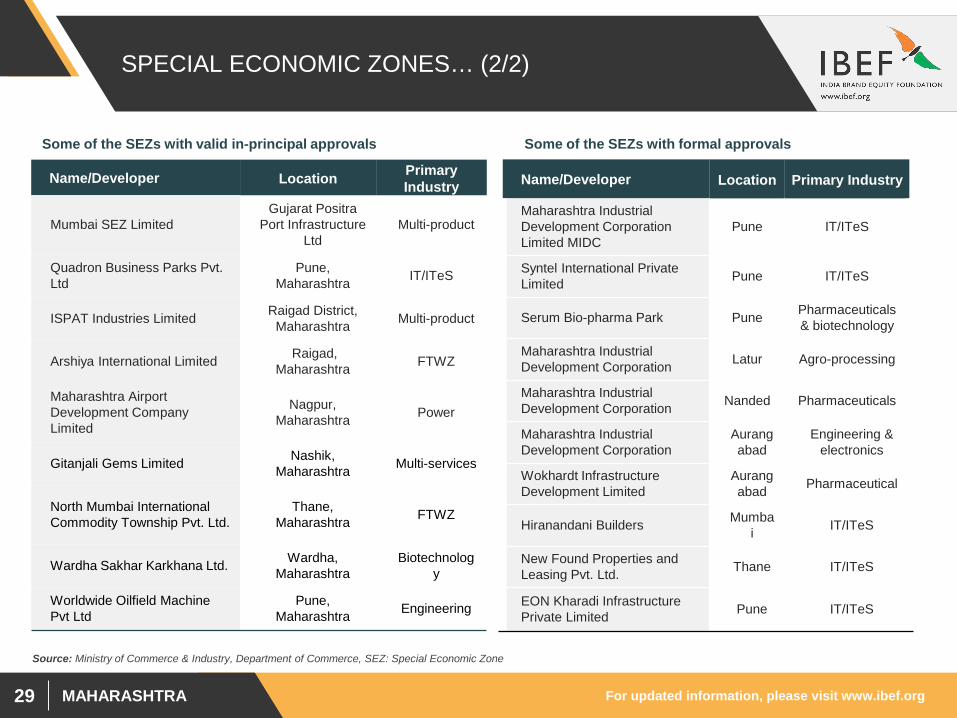
Name/Developer Location Primary Industry
Maharashtra Industrial Development Corporation Limited MIDC
Pune IT/ITeS
Syntel International Private Limited Pune IT/ITeS
Serum Bio-pharma Park Pune Pharmaceuticals & biotechnology
Maharashtra Industrial Development Corporation Latur Agro-processing
Maharashtra Industrial Development Corporation Nanded Pharmaceuticals
Maharashtra Industrial Development Corporation
Aurangabad
Engineering & electronics
Wokhardt Infrastructure Development Limited
Aurangabad Pharmaceutical
Hiranandani Builders Mumbai IT/ITeS
New Found Properties and Leasing Pvt. Ltd. Thane IT/ITeS
EON Kharadi Infrastructure Private Limited Pune IT/ITeS
Some of the SEZs with formal approvals
Name/Developer Location Primary Industry
Mumbai SEZ LimitedGujarat Positra
Port Infrastructure Ltd
Multi-product
Quadron Business Parks Pvt.Ltd
Pune, Maharashtra IT/ITeS
ISPAT Industries Limited Raigad District, Maharashtra Multi-product
Arshiya International Limited Raigad, Maharashtra FTWZ
Maharashtra Airport Development Company Limited
Nagpur, Maharashtra Power
Gitanjali Gems Limited Nashik, Maharashtra Multi-services
North Mumbai International Commodity Township Pvt. Ltd.
Thane,Maharashtra FTWZ
Wardha Sakhar Karkhana Ltd. Wardha,Maharashtra
Biotechnology
Worldwide Oilfield Machine Pvt Ltd
Pune, Maharashtra Engineering
Some of the SEZs with valid in-principal approvals
For updated information, please visit www.ibef.orgMAHARASHTRA30
MUMBAI AS FINANCIAL HUB OF INDIA…(1/2)
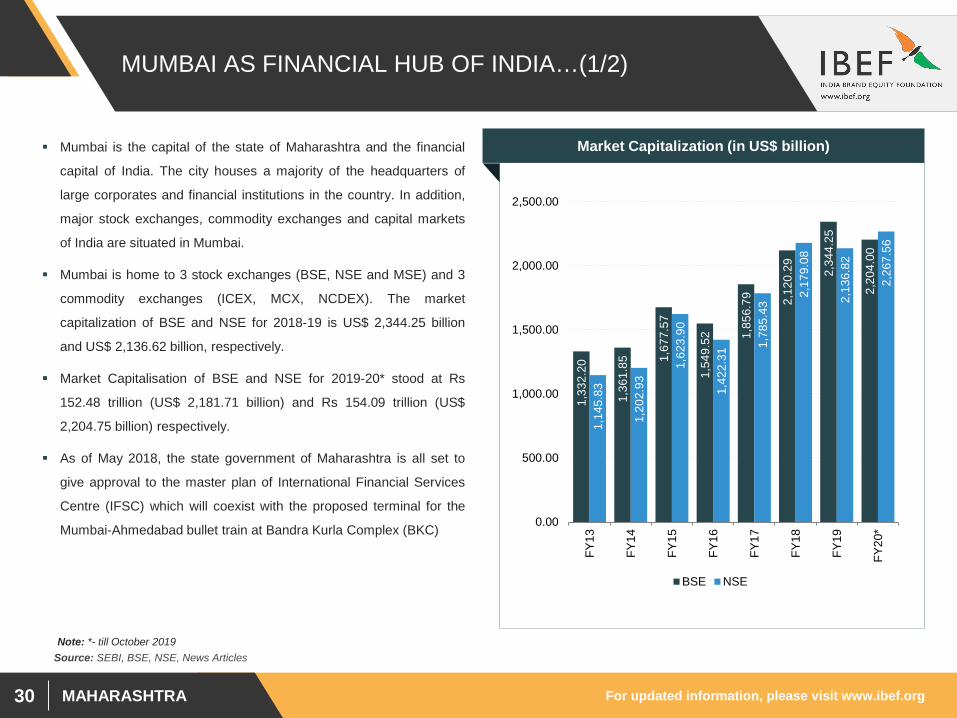
Mumbai is the capital of the state of Maharashtra and the financial
capital of India. The city houses a majority of the headquarters of
large corporates and financial institutions in the country. In addition,
major stock exchanges, commodity exchanges and capital markets
of India are situated in Mumbai.
Mumbai is home to 3 stock exchanges (BSE, NSE and MSE) and 3
commodity exchanges (ICEX, MCX, NCDEX). The market
capitalization of BSE and NSE for 2018-19 is US$ 2,344.25 billion
and US$ 2,136.62 billion, respectively.
Market Capitalisation of BSE and NSE for 2019-20* stood at Rs
152.48 trillion (US$ 2,181.71 billion) and Rs 154.09 trillion (US$
2,204.75 billion) respectively.
As of May 2018, the state government of Maharashtra is all set to
give approval to the master plan of International Financial Services
Centre (IFSC) which will coexist with the proposed terminal for the
Mumbai-Ahmedabad bullet train at Bandra Kurla Complex (BKC)
Source: SEBI, BSE, NSE, News Articles
Market Capitalization (in US$ billion)
1,33
2.20
1,36
1.85 1,
677.
57
1,54
9.52 1,
856.
79 2,12
0.29 2,34
4.25
2,20
4.00
1,14
5.83
1,20
2.93
1,62
3.90
1,42
2.31
1,78
5.43
2,17
9.08
2,13
6.82
2,26
7.56
0.00
500.00
1,000.00
1,500.00
2,000.00
2,500.00
FY13
FY14
FY15
FY16
FY17
FY18
FY19
FY20
*
BSE NSE
Note: *- till October 2019
For updated information, please visit www.ibef.orgMAHARASHTRA31
MUMBAI AS FINANCIAL HUB OF INDIA…(2/2)
The Government has completed the master planning of Delhi-
Mumbai Industrial Corridor (DMIC) and the preliminary engineering
od Phase-I has been undertaken. Aurangabad Industrial City
(AURIC), is being developed on a 10,000 acres land as a well –
planned and Greenfeild smart industrial city which is a part of DIMC.
Preliminary work is in progress for the Mumbai Trans – Harbour link
and Multi-Modal Corridor from Virar to Alibaug. Work on the projects
commenced in 2011 & 2010 and are expected to be completed by
2021 & 2019, respectively.
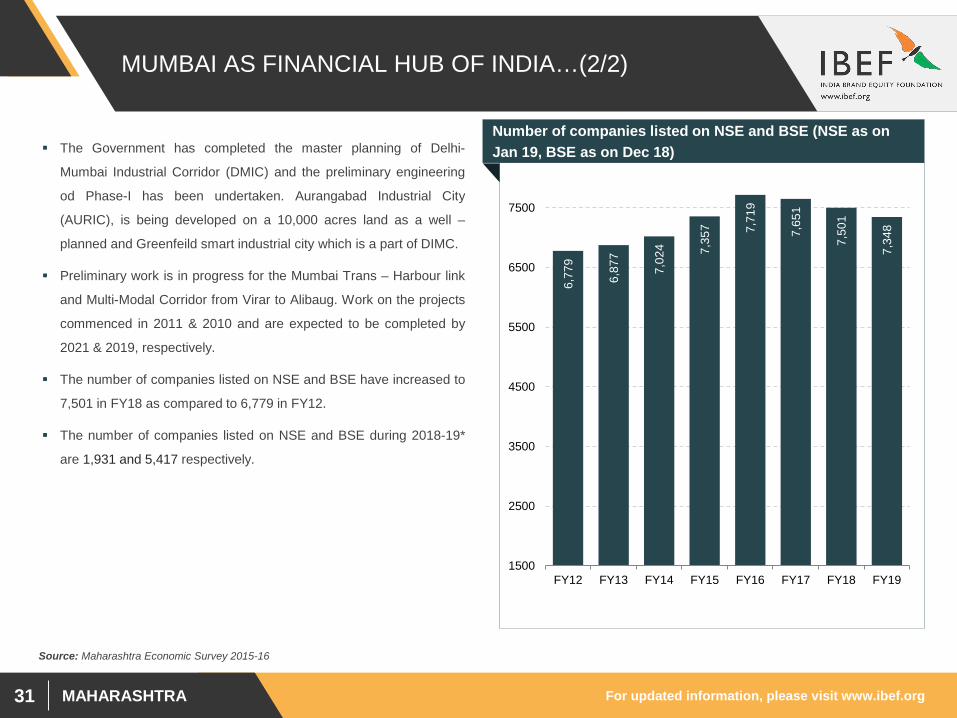
The number of companies listed on NSE and BSE have increased to
7,501 in FY18 as compared to 6,779 in FY12.
The number of companies listed on NSE and BSE during 2018-19*
are 1,931 and 5,417 respectively.
Source: Maharashtra Economic Survey 2015-16
Number of companies listed on NSE and BSE (NSE as on Jan 19, BSE as on Dec 18)
6,77
9
6,87
7
7,02
4 7,35
7 7,71
9
7,65
1
7,50
1
7,34
8
1500
2500
3500
4500
5500
6500
7500
FY12 FY13 FY14 FY15 FY16 FY17 FY18 FY19
MAHARASHTRA
KEY SECTORS
Finance
IT/ITes and Electronics
Textiles
Auto and Auto Components
Gems and Jewellery
Tourism
For updated information, please visit www.ibef.orgMAHARASHTRA33
KEY SECTORS - FINANCE … (1/2)
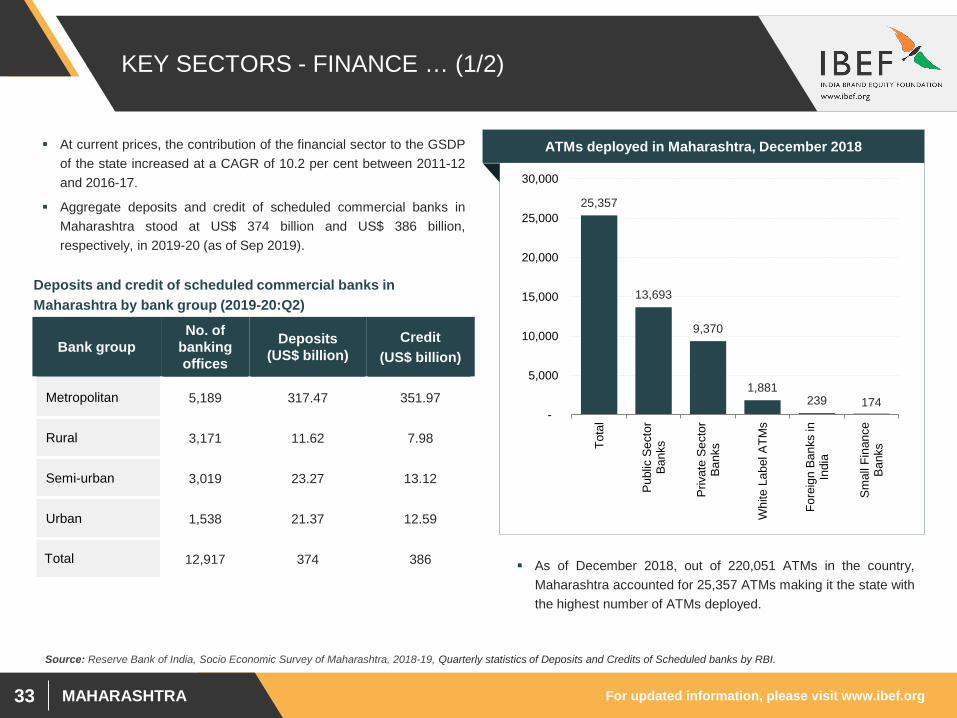
At current prices, the contribution of the financial sector to the GSDPof the state increased at a CAGR of 10.2 per cent between 2011-12and 2016-17.
Aggregate deposits and credit of scheduled commercial banks inMaharashtra stood at US$ 374 billion and US$ 386 billion,respectively, in 2019-20 (as of Sep 2019).
Source: Reserve Bank of India, Socio Economic Survey of Maharashtra, 2018-19, Quarterly statistics of Deposits and Credits of Scheduled banks by RBI.
Bank group No. of
banking offices
Deposits (US$ billion)
Credit (US$ billion)
Metropolitan 5,189 317.47 351.97
Rural 3,171 11.62 7.98
Semi-urban 3,019 23.27 13.12
Urban 1,538 21.37 12.59
Total 12,917 374 386
Deposits and credit of scheduled commercial banks in Maharashtra by bank group (2019-20:Q2)
ATMs deployed in Maharashtra, December 2018
25,357
13,693
9,370
1,881239 174
-
5,000
10,000
15,000
20,000
25,000
30,000
Tota
l
Publ
ic S
ecto
rBa
nks
Priv
ate
Sect
orBa
nks
Whi
te L
abel
ATM
s
Fore
ign
Bank
s in
Indi
a
Smal
l Fin
ance
Bank
s
As of December 2018, out of 220,051 ATMs in the country,Maharashtra accounted for 25,357 ATMs making it the state withthe highest number of ATMs deployed.
For updated information, please visit www.ibef.orgMAHARASHTRA34
KEY SECTORS - FINANCE … (2/2)
State Bank of India
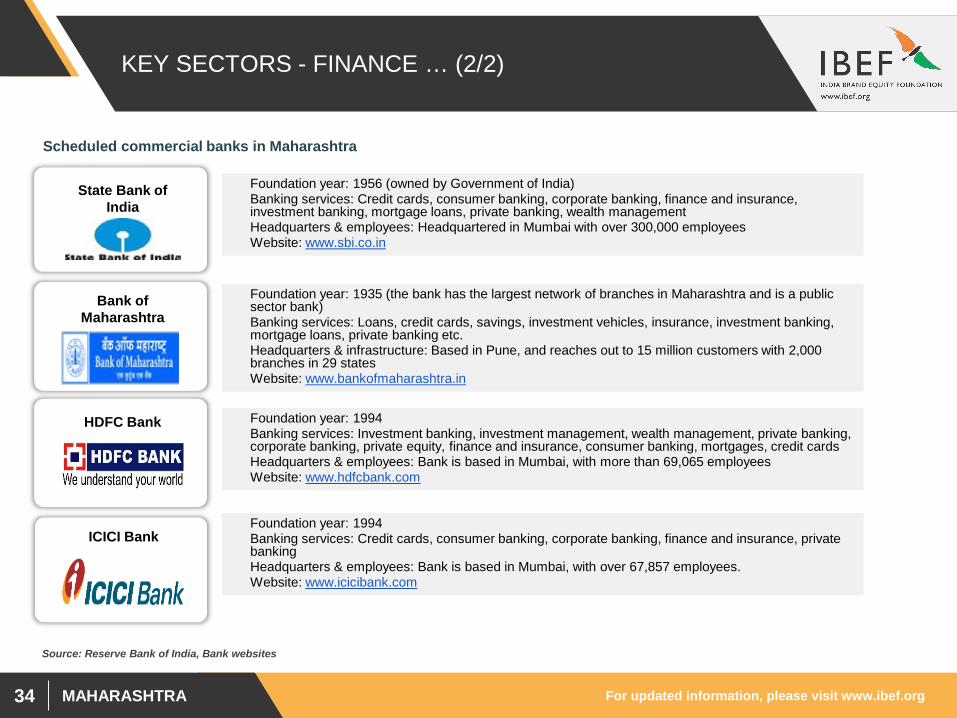
Foundation year: 1956 (owned by Government of India)Banking services: Credit cards, consumer banking, corporate banking, finance and insurance, investment banking, mortgage loans, private banking, wealth managementHeadquarters & employees: Headquartered in Mumbai with over 300,000 employeesWebsite: www.sbi.co.in
Source: Reserve Bank of India, Bank websites
Scheduled commercial banks in Maharashtra
Bank of Maharashtra
Foundation year: 1935 (the bank has the largest network of branches in Maharashtra and is a public sector bank)Banking services: Loans, credit cards, savings, investment vehicles, insurance, investment banking, mortgage loans, private banking etc.Headquarters & infrastructure: Based in Pune, and reaches out to 15 million customers with 2,000 branches in 29 statesWebsite: www.bankofmaharashtra.in
HDFC Bank Foundation year: 1994Banking services: Investment banking, investment management, wealth management, private banking, corporate banking, private equity, finance and insurance, consumer banking, mortgages, credit cardsHeadquarters & employees: Bank is based in Mumbai, with more than 69,065 employeesWebsite: www.hdfcbank.com
ICICI BankFoundation year: 1994Banking services: Credit cards, consumer banking, corporate banking, finance and insurance, private bankingHeadquarters & employees: Bank is based in Mumbai, with over 67,857 employees. Website: www.icicibank.com
For updated information, please visit www.ibef.orgMAHARASHTRA35
KEY SECTORS – IT/ITeS AND ELECTRONICS … (1/2)
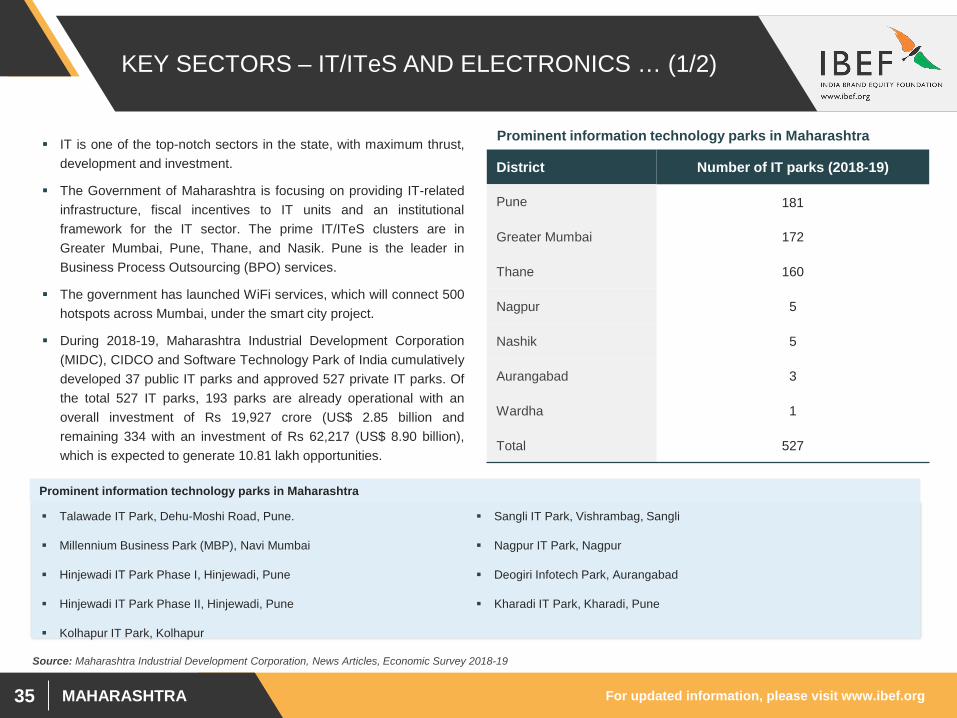
IT is one of the top-notch sectors in the state, with maximum thrust,development and investment.
The Government of Maharashtra is focusing on providing IT-relatedinfrastructure, fiscal incentives to IT units and an institutionalframework for the IT sector. The prime IT/ITeS clusters are inGreater Mumbai, Pune, Thane, and Nasik. Pune is the leader inBusiness Process Outsourcing (BPO) services.
The government has launched WiFi services, which will connect 500hotspots across Mumbai, under the smart city project.
During 2018-19, Maharashtra Industrial Development Corporation(MIDC), CIDCO and Software Technology Park of India cumulativelydeveloped 37 public IT parks and approved 527 private IT parks. Ofthe total 527 IT parks, 193 parks are already operational with anoverall investment of Rs 19,927 crore (US$ 2.85 billion andremaining 334 with an investment of Rs 62,217 (US$ 8.90 billion),which is expected to generate 10.81 lakh opportunities.
Source: Maharashtra Industrial Development Corporation, News Articles, Economic Survey 2018-19
District Number of IT parks (2018-19)
Pune 181
Greater Mumbai 172
Thane 160
Nagpur 5
Nashik 5
Aurangabad 3
Wardha 1
Total 527
Prominent information technology parks in Maharashtra
Talawade IT Park, Dehu-Moshi Road, Pune.
Millennium Business Park (MBP), Navi Mumbai
Hinjewadi IT Park Phase I, Hinjewadi, Pune
Hinjewadi IT Park Phase II, Hinjewadi, Pune
Kolhapur IT Park, Kolhapur
Sangli IT Park, Vishrambag, Sangli
Nagpur IT Park, Nagpur
Deogiri Infotech Park, Aurangabad
Kharadi IT Park, Kharadi, Pune
Prominent information technology parks in Maharashtra
For updated information, please visit www.ibef.orgMAHARASHTRA36
KEY SECTORS – IT/ITeS AND ELECTRONICS … (2/2)
Accenture is a global management consulting, technology services and outsourcing company, with around259,000 people serving clients in more than 120 countries. The company has several development centresacross India.
It has major operating centres in Mumbai and Pune.
IBM is one of the biggest IT solutions and product firms having presence across the globe.
The company has a significant presence in India, with centres in Pune.
Capgemini is a global IT major headquartered in Paris, France, and operates in more than 40 countries.The company generated revenues of US$ 7.38 billion in H1 2017. The company provides solutions acrossall verticals in the industry. It has software centres in Mumbai, Navi Mumbai and Pune. In February 2014,the company opened a new facility at Pune with a seating capacity of 2,800 persons, adding to the 4,000people it employs at its Pune campus. It is also looking to increase its workforce in the state.
Infosys is a well-known IT giant, with development centres across India. The company has a developmentcentre at Wakad, Pune, and also a BPO centre in the city.
Infosys had been allotted land in Mihan-SEZ, Nagpur,and was expected to start construction work in July2014. In the first phase the company will invest US$ 78.8 million to accommodate 5,000 softwareprofessionals.
Accenture
IBM
Capgemini
Infosys Technologies Ltd
Key Players
For updated information, please visit www.ibef.orgMAHARASHTRA37
KEY SECTORS – TEXTILES … (1/2)
Source: Central Silk Board, Economic Survey, 2015-16, 2016-17, News Articles.
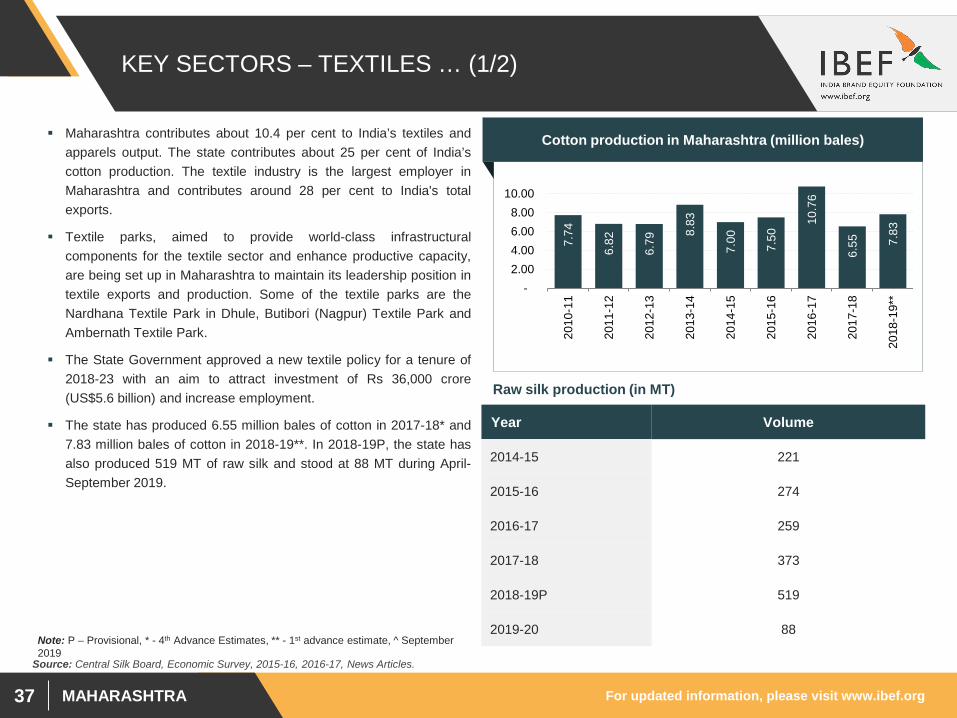
Maharashtra contributes about 10.4 per cent to India’s textiles andapparels output. The state contributes about 25 per cent of India’scotton production. The textile industry is the largest employer inMaharashtra and contributes around 28 per cent to India's totalexports.
Textile parks, aimed to provide world-class infrastructuralcomponents for the textile sector and enhance productive capacity,are being set up in Maharashtra to maintain its leadership position intextile exports and production. Some of the textile parks are theNardhana Textile Park in Dhule, Butibori (Nagpur) Textile Park andAmbernath Textile Park.
The State Government approved a new textile policy for a tenure of2018-23 with an aim to attract investment of Rs 36,000 crore(US$5.6 billion) and increase employment.
The state has produced 6.55 million bales of cotton in 2017-18* and7.83 million bales of cotton in 2018-19**. In 2018-19P, the state hasalso produced 519 MT of raw silk and stood at 88 MT during April-September 2019.
Cotton production in Maharashtra (million bales)
7.74
6.82
6.79
8.83
7.00
7.50
10.7
6
6.55
7.83
- 2.00 4.00 6.00 8.00
10.00
2010
-11
2011
-12
2012
-13
2013
-14
2014
-15
2015
-16
2016
-17
2017
-18
2018
-19*
*
Year Volume
2014-15 221
2015-16 274
2016-17 259
2017-18 373
2018-19P 519
2019-20 88
Raw silk production (in MT)
Note: P – Provisional, * - 4th Advance Estimates, ** - 1st advance estimate, ^ September 2019
For updated information, please visit www.ibef.orgMAHARASHTRA38
KEY SECTORS – TEXTILES … (2/2)
Raymond was incorporated in 1925 and is a leading Indian textile major. The company is part of globalconglomerate Raymond Group.
Raymond was the first in 1959 to introduce a polywool blend in India to creating the world's finest suitingfabric – the Super 240s – made from superfine 11.6 micron wool.
The Bombay Dyeing and Manufacturing Company Limited’s textile products include bedding range,bedding accessories, bath linen, hotel linen and industrial fabrics.
Product range also consists of bed sheets, bed covers, quilts, duvet covers, dohars, bed in bag sets,blankets, pillow cases, cushion covers, shams, cushions, pillows and bed decor sets, pool towels, bathtowels, hand towels and face towels.
S. Kumars’ is one of India's leading textile and apparel companies. With expertise in multi-fibremanufacturing, the company has extended its presence in multiple product categories from fabrics toapparels and home textiles. Its brands include Reid & Taylor, Belmonte, S.Kumars, Uniformity ByBelmonte, Carmichael House and Stephens Brothers.
Siyaram Silk Mills, incorporated in 1978, is a leading producer of blended fabrics in India.
The company is one of the most renowned vertically integrated textile companies in the country. Itoperates the widest range of latest machinery in its eco-friendly plants at Tarapur, Daman and Mumbai.
Raymond
Bombay Dyeing
S. Kumars’
Siyaram’s
Key Players
For updated information, please visit www.ibef.orgMAHARASHTRA39
KEY SECTORS – AUTO AND AUTO COMPONENTS … (1/2)
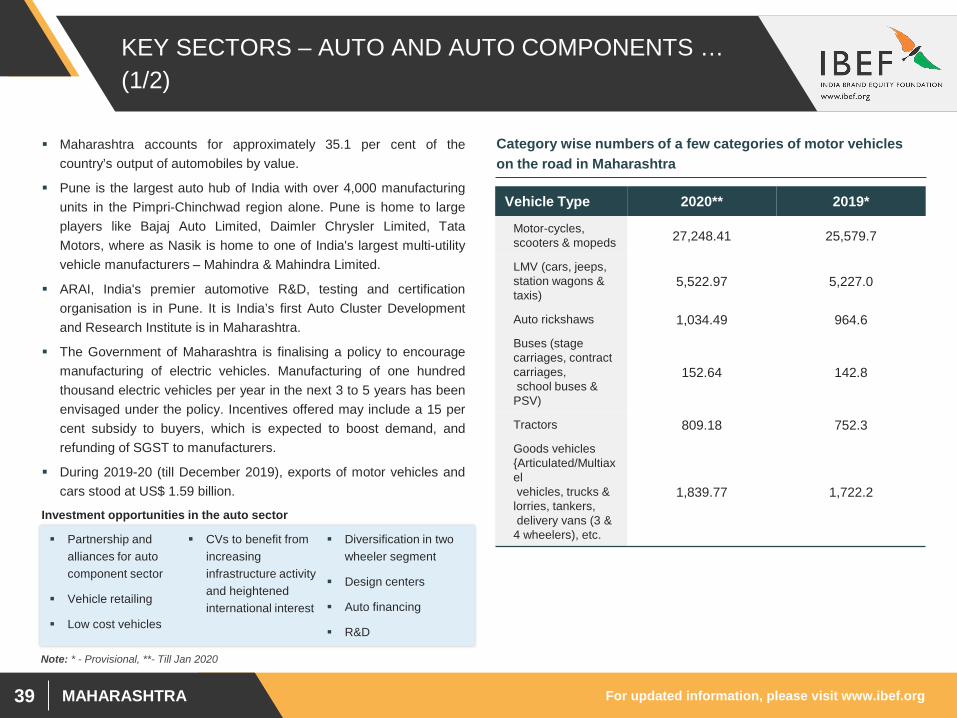
Maharashtra accounts for approximately 35.1 per cent of thecountry’s output of automobiles by value.
Pune is the largest auto hub of India with over 4,000 manufacturingunits in the Pimpri-Chinchwad region alone. Pune is home to largeplayers like Bajaj Auto Limited, Daimler Chrysler Limited, TataMotors, where as Nasik is home to one of India's largest multi-utilityvehicle manufacturers – Mahindra & Mahindra Limited.
ARAI, India's premier automotive R&D, testing and certificationorganisation is in Pune. It is India’s first Auto Cluster Developmentand Research Institute is in Maharashtra.
The Government of Maharashtra is finalising a policy to encouragemanufacturing of electric vehicles. Manufacturing of one hundredthousand electric vehicles per year in the next 3 to 5 years has beenenvisaged under the policy. Incentives offered may include a 15 percent subsidy to buyers, which is expected to boost demand, andrefunding of SGST to manufacturers.
During 2019-20 (till December 2019), exports of motor vehicles andcars stood at US$ 1.59 billion.
Partnership and alliances for auto component sector
Vehicle retailing
Low cost vehicles
CVs to benefit from increasing infrastructure activity and heightened international interest
Diversification in two wheeler segment
Design centers
Auto financing
R&D
Investment opportunities in the auto sector
Vehicle Type 2020** 2019*
Motor-cycles, scooters & mopeds 27,248.41 25,579.7
LMV (cars, jeeps, station wagons & taxis)
5,522.97 5,227.0
Auto rickshaws 1,034.49 964.6
Buses (stage carriages, contract carriages,school buses &
PSV)
152.64 142.8
Tractors 809.18 752.3
Goods vehicles {Articulated/Multiaxelvehicles, trucks &
lorries, tankers,delivery vans (3 &
4 wheelers), etc.
1,839.77 1,722.2
Category wise numbers of a few categories of motor vehicles on the road in Maharashtra
Note: * - Provisional, **- Till Jan 2020
For updated information, please visit www.ibef.orgMAHARASHTRA40
KEY SECTORS – AUTO AND AUTO COMPONENTS … (2/2)
Bajaj Auto is a major Indian automobile manufacturer. The company is the world's fourth-largest two- andthree-wheeler manufacturer. The company manufactures and exports scooters, motorcycles and autorickshaws. The company is based in Pune with a regional office at Akurdi and manufacturing plants inChakan (Pune, manufactures motorcycles) and Waluj (near Aurangabad, manufactures motorcycles andthree-wheelers).
Tata Motors Limited is a multinational corporation headquartered in Mumbai, India. It acquired Britishautomotive brands Jaguar and Land Rover in 2008. The company is the world’s fourth-largest truck andbus manufacturer.
The company has an auto manufacturing and assembly unit at Pune. The Pune unit is spread over twogeographical regions – Pimpri (800 acres) and Chinchwad (130 acres).
Ashok Leyland is an Indian automobile company. It is owned by the Hinduja Group. Founded in 1948, it isthe second largest commercial vehicle manufacturer in India, fourth largest manufacturer of buses in theworld and 10th largest manufacturer of trucks globally.
The company has an integrated transmission manufacturing plant in Bhandara Plant, Maharashtra since1982. The 232-acre (112 acre built up area) facility is also equipped for vehicle assembly.
Mahindra and Mahindra is one of the major auto manufacturers of India. The company’s products includetractors, SUVs and LCVs. It has manufacturing facilities at Mumbai, Pune, Nagpur and Nasik.
Bajaj Auto Ltd
Tata Motors Ltd
Ashok LeylandLtd
Mahindra and MahindraLtd
Key Players
For updated information, please visit www.ibef.orgMAHARASHTRA41
KEY SECTORS – GEMS AND JEWELLERY
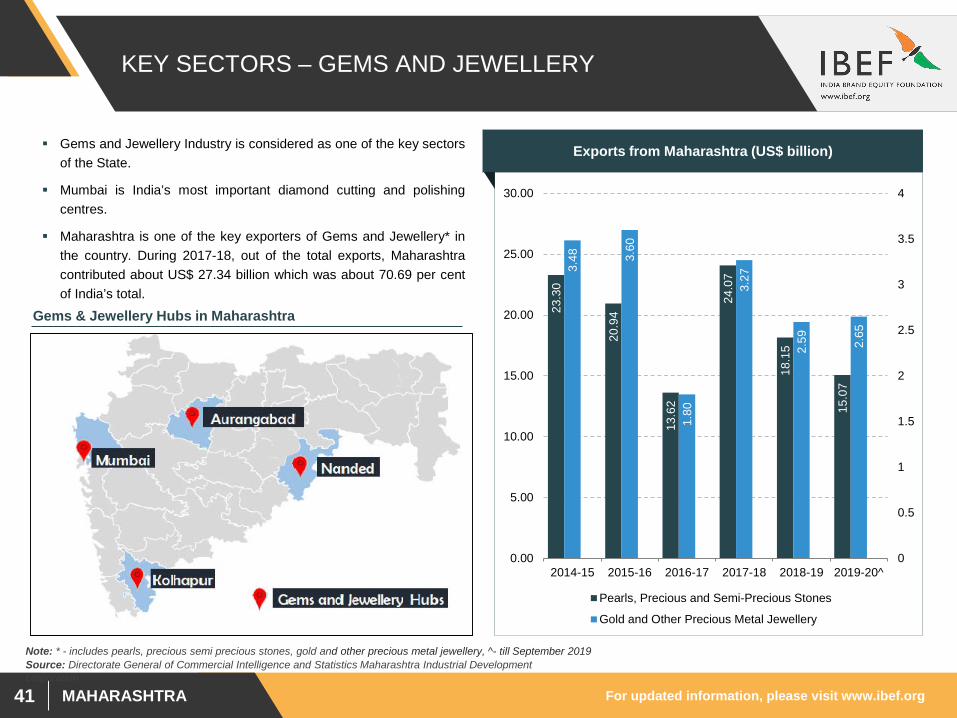
Exports from Maharashtra (US$ billion)
23.3
0
20.9
4
13.6
2
24.0
7
18.1
5
15.0
7
3.48 3.
60
1.80
3.27
2.59 2.65
0
0.5
1
1.5
2
2.5
3
3.5
4
0.00
5.00
10.00
15.00
20.00
25.00
30.00
2014-15 2015-16 2016-17 2017-18 2018-19 2019-20^
Pearls, Precious and Semi-Precious Stones
Gold and Other Precious Metal Jewellery
Gems and Jewellery Industry is considered as one of the key sectorsof the State.
Mumbai is India’s most important diamond cutting and polishingcentres.
Maharashtra is one of the key exporters of Gems and Jewellery* inthe country. During 2017-18, out of the total exports, Maharashtracontributed about US$ 27.34 billion which was about 70.69 per centof India’s total.
Gems & Jewellery Hubs in Maharashtra
Source: Directorate General of Commercial Intelligence and Statistics Maharashtra Industrial Development corporation
Note: * - includes pearls, precious semi precious stones, gold and other precious metal jewellery, ^- till September 2019
For updated information, please visit www.ibef.orgMAHARASHTRA42
KEY SECTORS – TOURISM
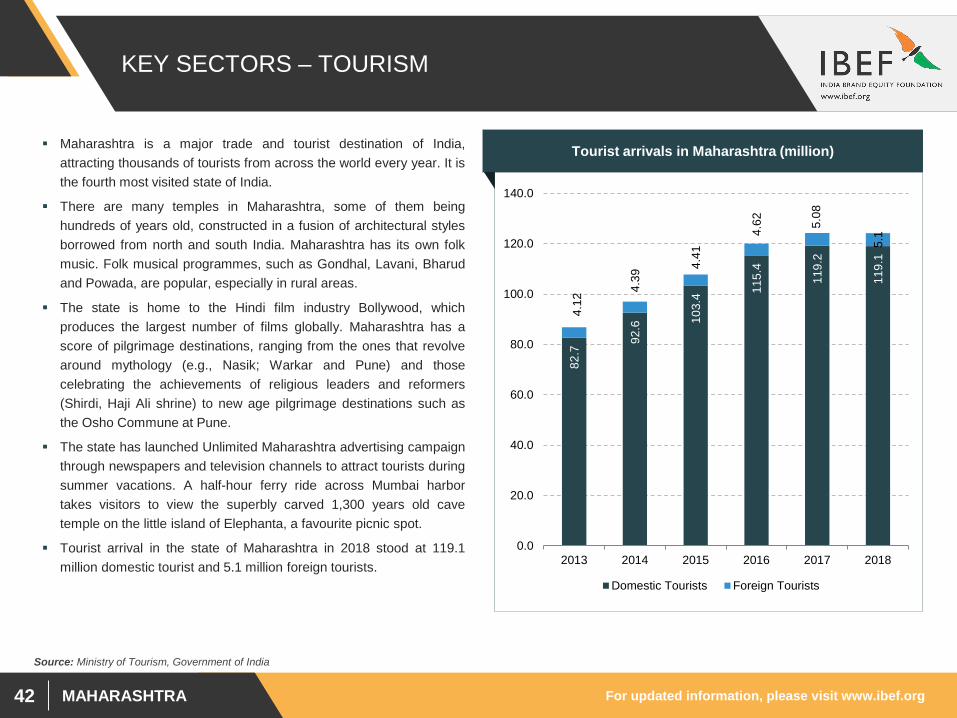
Maharashtra is a major trade and tourist destination of India,attracting thousands of tourists from across the world every year. It isthe fourth most visited state of India.
There are many temples in Maharashtra, some of them beinghundreds of years old, constructed in a fusion of architectural stylesborrowed from north and south India. Maharashtra has its own folkmusic. Folk musical programmes, such as Gondhal, Lavani, Bharudand Powada, are popular, especially in rural areas.
The state is home to the Hindi film industry Bollywood, whichproduces the largest number of films globally. Maharashtra has ascore of pilgrimage destinations, ranging from the ones that revolvearound mythology (e.g., Nasik; Warkar and Pune) and thosecelebrating the achievements of religious leaders and reformers(Shirdi, Haji Ali shrine) to new age pilgrimage destinations such asthe Osho Commune at Pune.
The state has launched Unlimited Maharashtra advertising campaignthrough newspapers and television channels to attract tourists duringsummer vacations. A half-hour ferry ride across Mumbai harbortakes visitors to view the superbly carved 1,300 years old cavetemple on the little island of Elephanta, a favourite picnic spot.
Tourist arrival in the state of Maharashtra in 2018 stood at 119.1million domestic tourist and 5.1 million foreign tourists.
Tourist arrivals in Maharashtra (million)
Source: Ministry of Tourism, Government of India
82.7
92.6 10
3.4 11
5.4
119.
2
119.
1
4.12
4.39
4.41
4.62 5.
08
5.1
0.0
20.0
40.0
60.0
80.0
100.0
120.0
140.0
2013 2014 2015 2016 2017 2018
Domestic Tourists Foreign Tourists
MAHARASHTRA
KEY PROCEDURES & POLICIES
For updated information, please visit www.ibef.orgMAHARASHTRA44
SINGLE-WINDOW CLEARANCE MECHANISM … (1/3)
The Government of Maharashtra provides single-window clearance to all units to reduce the average time required for establishment of such unitsand issue various clearances required for setting up of industries at a single point. The government has taken following steps for setting upcommittees at various levels:
• District-level committee under the chairmanship of the District Collector for proposals from SSI units.
• State-level committee under the chairmanship of Development Commissioner (Industries) for MSI/LSI units.
• Mega projects committee under the chairmanship of Secretary (Industries) for mega projects and FDI proposals.
A Common Application Form (CAF) to be evolved for every applicant seeking to set up an industry and/or expansion unit and development ofinformation system/software to process such applications online.
Representatives of the concerned departments from whom the clearances are required to be the members of or invitees on the district, state andmega projects committees. The final decision will be given as far as possible within 30 days of receipt of dully filled CAFs.
In order to provide the people of state with one stop portal for information, services and consents electronically under Industrial Policy 2013, thegovernment is focussing on provisions for SWC system.
For updated information, please visit www.ibef.orgMAHARASHTRA45
SINGLE-WINDOW CLEARANCE MECHANISM … (2/3)
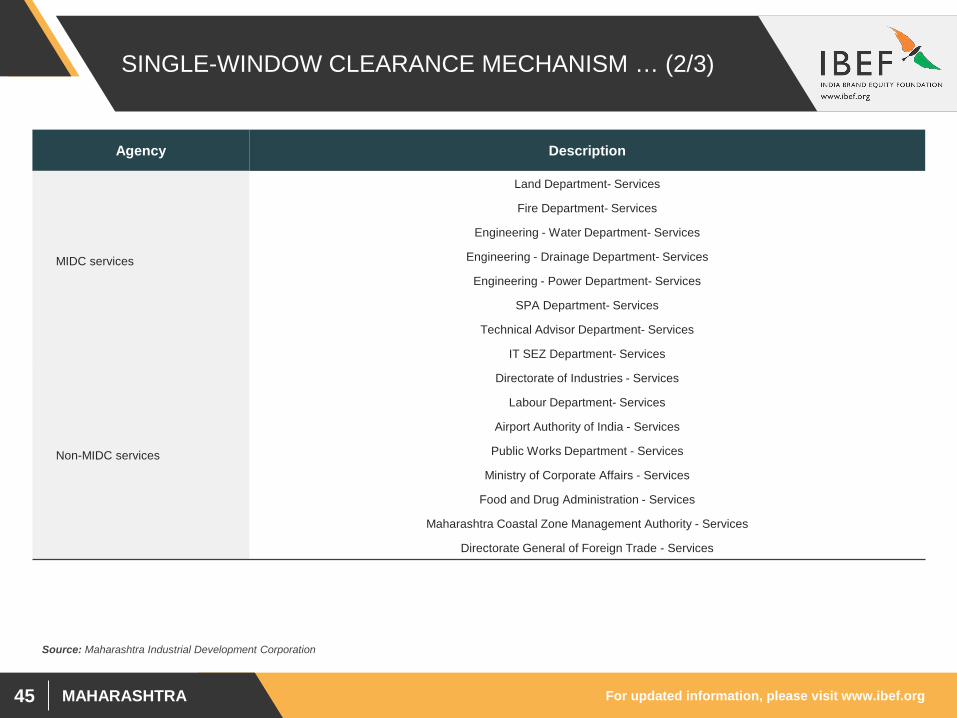
Agency Description
MIDC services
Land Department- Services
Fire Department- Services
Engineering - Water Department- Services
Engineering - Drainage Department- Services
Engineering - Power Department- Services
SPA Department- Services
Technical Advisor Department- Services
IT SEZ Department- Services
Non-MIDC services
Directorate of Industries - Services
Labour Department- Services
Airport Authority of India - Services
Public Works Department - Services
Ministry of Corporate Affairs - Services
Food and Drug Administration - Services
Maharashtra Coastal Zone Management Authority - Services
Directorate General of Foreign Trade - Services
Source: Maharashtra Industrial Development Corporation
For updated information, please visit www.ibef.orgMAHARASHTRA46
SINGLE-WINDOW CLEARANCE MECHANISM … (3/3)
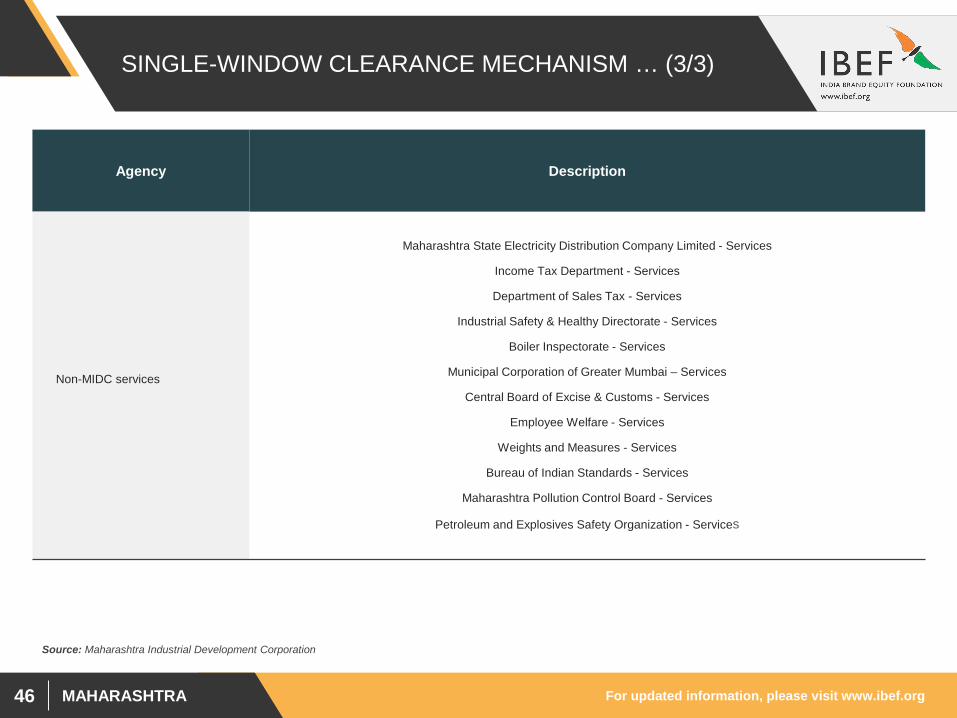
Agency Description
Non-MIDC services
Maharashtra State Electricity Distribution Company Limited - Services
Income Tax Department - Services
Department of Sales Tax - Services
Industrial Safety & Healthy Directorate - Services
Boiler Inspectorate - Services
Municipal Corporation of Greater Mumbai – Services
Central Board of Excise & Customs - Services
Employee Welfare - Services
Weights and Measures - Services
Bureau of Indian Standards - Services
Maharashtra Pollution Control Board - Services
Petroleum and Explosives Safety Organization - Services
Source: Maharashtra Industrial Development Corporation
For updated information, please visit www.ibef.orgMAHARASHTRA47
KEY INVESTMENT PROMOTION OFFICES … (1/3)
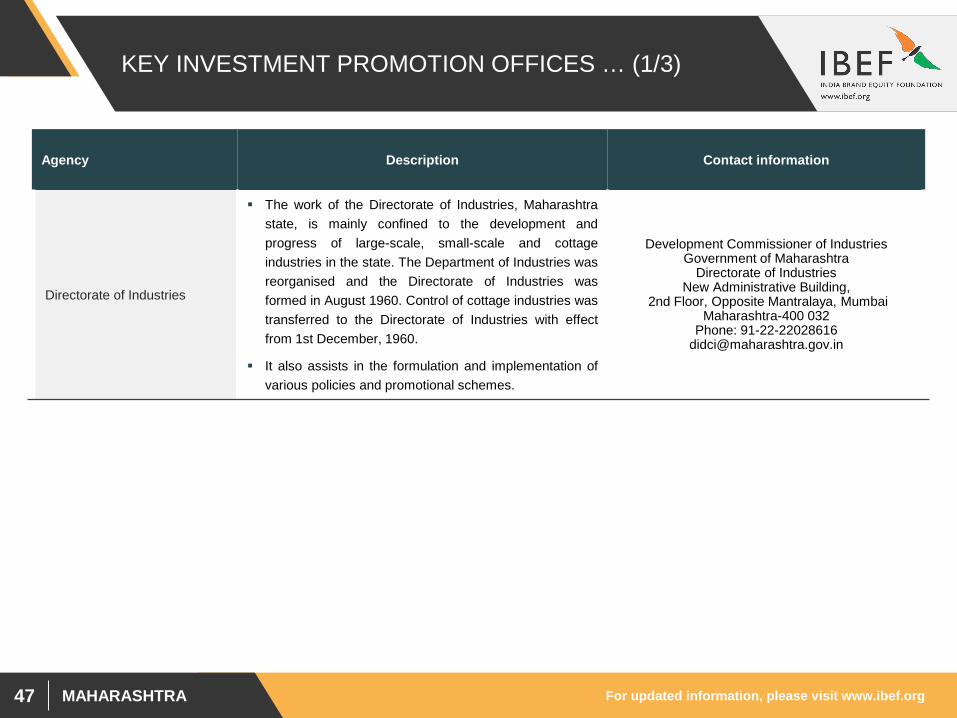
Agency Description Contact information
Directorate of Industries
The work of the Directorate of Industries, Maharashtrastate, is mainly confined to the development andprogress of large-scale, small-scale and cottageindustries in the state. The Department of Industries wasreorganised and the Directorate of Industries wasformed in August 1960. Control of cottage industries wastransferred to the Directorate of Industries with effectfrom 1st December, 1960.
It also assists in the formulation and implementation ofvarious policies and promotional schemes.
Development Commissioner of IndustriesGovernment of Maharashtra
Directorate of IndustriesNew Administrative Building,
2nd Floor, Opposite Mantralaya, MumbaiMaharashtra-400 032
Phone: [email protected]
For updated information, please visit www.ibef.orgMAHARASHTRA48
KEY INVESTMENT PROMOTION OFFICES … (2/3)
Agency Description Contact information
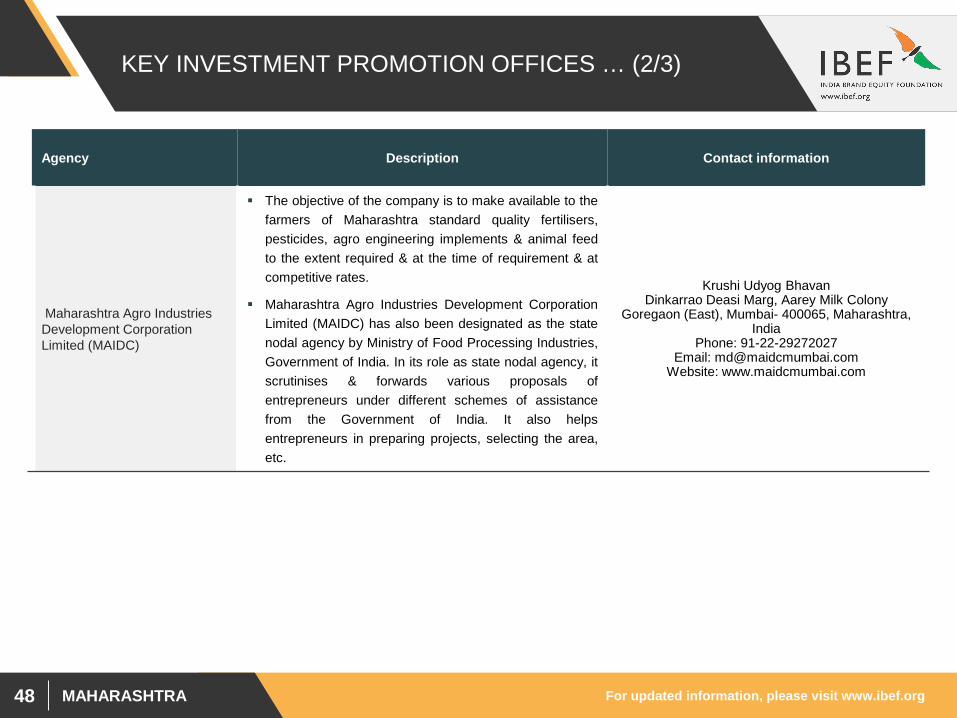
Maharashtra Agro Industries Development Corporation Limited (MAIDC)
The objective of the company is to make available to thefarmers of Maharashtra standard quality fertilisers,pesticides, agro engineering implements & animal feedto the extent required & at the time of requirement & atcompetitive rates.
Maharashtra Agro Industries Development CorporationLimited (MAIDC) has also been designated as the statenodal agency by Ministry of Food Processing Industries,Government of India. In its role as state nodal agency, itscrutinises & forwards various proposals ofentrepreneurs under different schemes of assistancefrom the Government of India. It also helpsentrepreneurs in preparing projects, selecting the area,etc.
Krushi Udyog BhavanDinkarrao Deasi Marg, Aarey Milk Colony
Goregaon (East), Mumbai- 400065, Maharashtra, India
Phone: 91-22-29272027Email: [email protected]
Website: www.maidcmumbai.com
For updated information, please visit www.ibef.orgMAHARASHTRA49
KEY INVESTMENT PROMOTION OFFICES … (3/3)
Agency Description Contact information
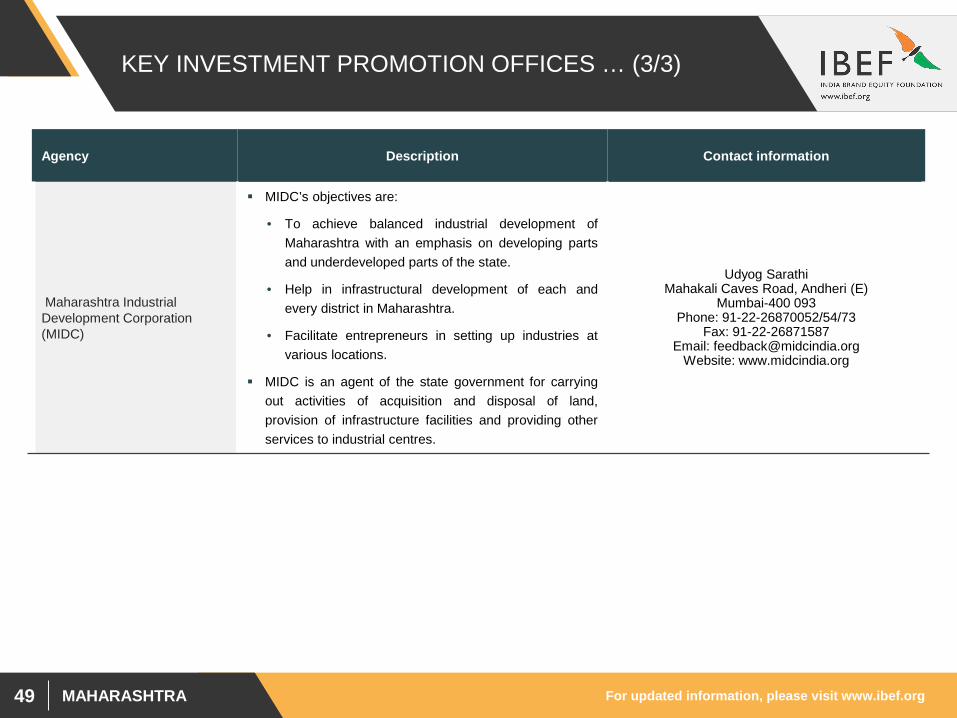
Maharashtra Industrial Development Corporation (MIDC)
MIDC’s objectives are:
• To achieve balanced industrial development ofMaharashtra with an emphasis on developing partsand underdeveloped parts of the state.
• Help in infrastructural development of each andevery district in Maharashtra.
• Facilitate entrepreneurs in setting up industries atvarious locations.
MIDC is an agent of the state government for carryingout activities of acquisition and disposal of land,provision of infrastructure facilities and providing otherservices to industrial centres.
Udyog SarathiMahakali Caves Road, Andheri (E)
Mumbai-400 093Phone: 91-22-26870052/54/73
Fax: 91-22-26871587Email: [email protected]
Website: www.midcindia.org
For updated information, please visit www.ibef.orgMAHARASHTRA50
KEY APPROVALS REQUIRED … (1/2)
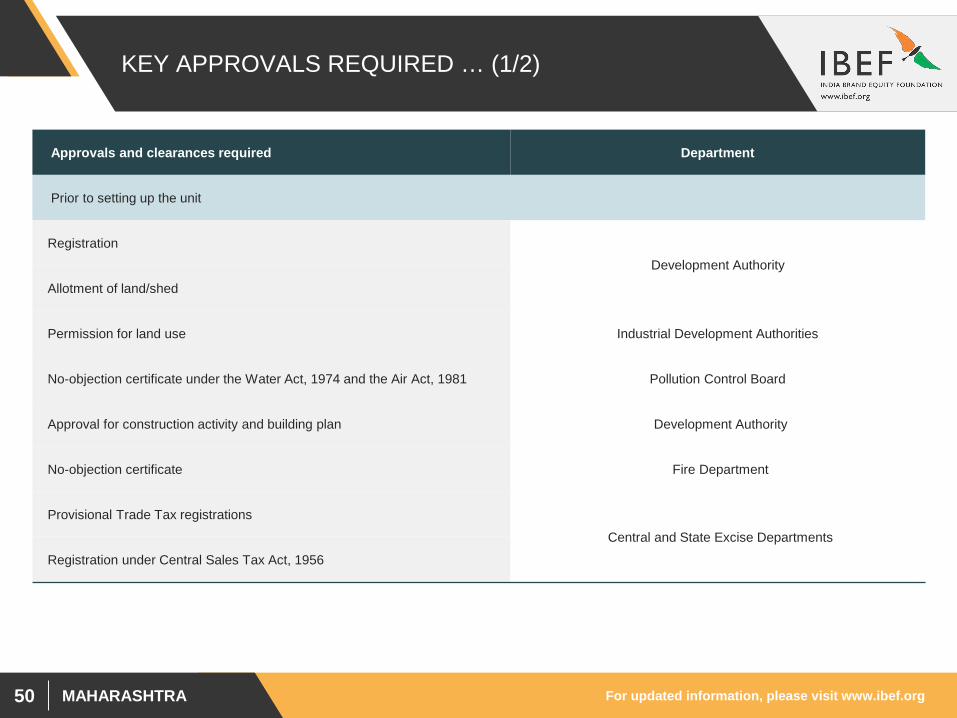
Approvals and clearances required Department
Prior to setting up the unit
RegistrationDevelopment Authority
Allotment of land/shed
Permission for land use Industrial Development Authorities
No-objection certificate under the Water Act, 1974 and the Air Act, 1981 Pollution Control Board
Approval for construction activity and building plan Development Authority
No-objection certificate Fire Department
Provisional Trade Tax registrations
Central and State Excise Departments
Registration under Central Sales Tax Act, 1956
For updated information, please visit www.ibef.orgMAHARASHTRA51
KEY APPROVALS REQUIRED … (2/2)
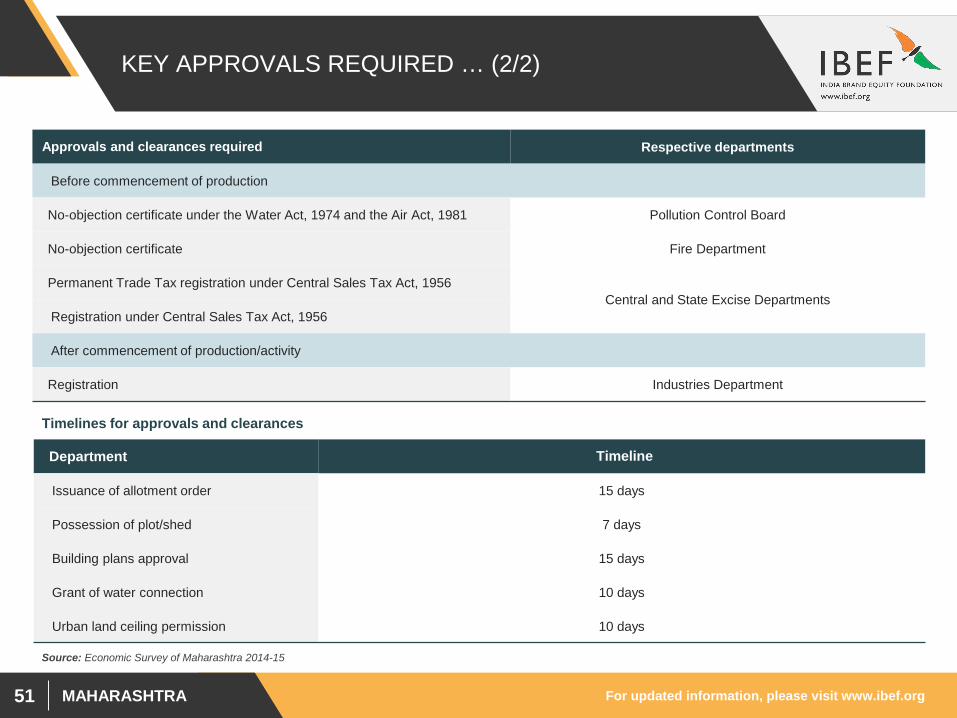
Approvals and clearances required Respective departments
Before commencement of production
No-objection certificate under the Water Act, 1974 and the Air Act, 1981 Pollution Control Board
No-objection certificate Fire Department
Permanent Trade Tax registration under Central Sales Tax Act, 1956Central and State Excise Departments
Registration under Central Sales Tax Act, 1956
After commencement of production/activity
Registration Industries Department
Department Timeline
Issuance of allotment order 15 days
Possession of plot/shed 7 days
Building plans approval 15 days
Grant of water connection 10 days
Urban land ceiling permission 10 days
Timelines for approvals and clearances
Source: Economic Survey of Maharashtra 2014-15
For updated information, please visit www.ibef.orgMAHARASHTRA52
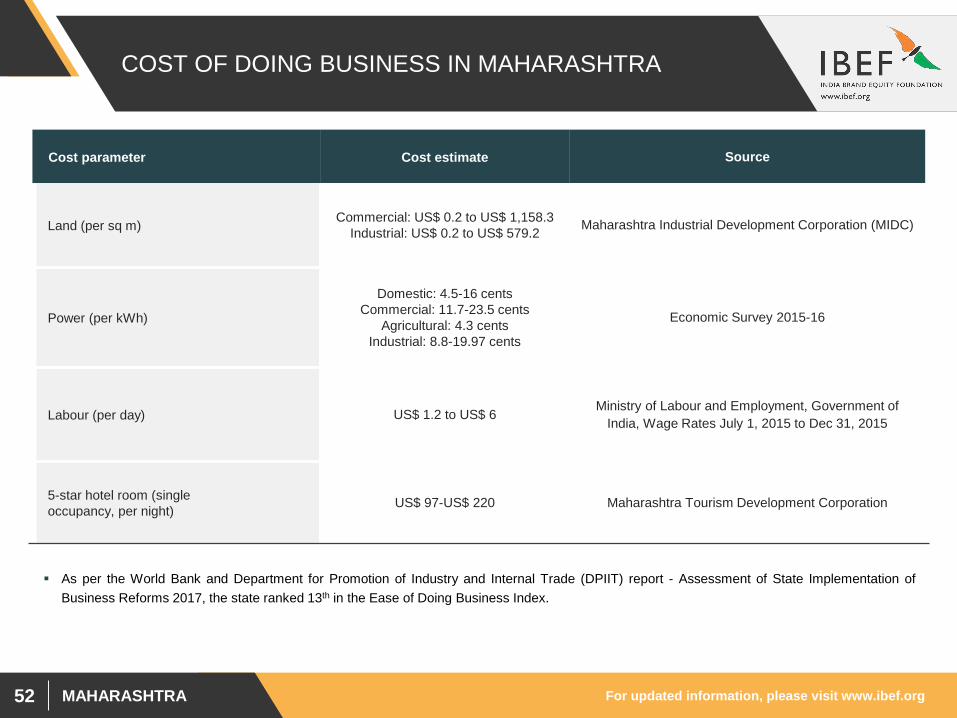
COST OF DOING BUSINESS IN MAHARASHTRA
Cost parameter Cost estimate Source
Land (per sq m) Commercial: US$ 0.2 to US$ 1,158.3Industrial: US$ 0.2 to US$ 579.2 Maharashtra Industrial Development Corporation (MIDC)
Power (per kWh)
Domestic: 4.5-16 centsCommercial: 11.7-23.5 cents
Agricultural: 4.3 centsIndustrial: 8.8-19.97 cents
Economic Survey 2015-16
Labour (per day) US$ 1.2 to US$ 6 Ministry of Labour and Employment, Government of India, Wage Rates July 1, 2015 to Dec 31, 2015
5-star hotel room (singleoccupancy, per night) US$ 97-US$ 220 Maharashtra Tourism Development Corporation
As per the World Bank and Department for Promotion of Industry and Internal Trade (DPIIT) report - Assessment of State Implementation ofBusiness Reforms 2017, the state ranked 13th in the Ease of Doing Business Index.

For updated information, please visit www.ibef.orgMAHARASHTRA53
STATE ACTS & POLICIES … (1/4)
Objectives
To attract investment of US$ 1.43 trillion by 2023-24 and create 4 million job opportunities
To attain manufacturing sector growth rate of 12 per cent to 13 per cent to reach GSDP share of 25 per cent by2023-24.
Industrial Policy of Maharashtra 2019
Read more
Water Policy 2019 To focus on optimal use of water resources coupled with sustainable development, in order to provide economicand social benefits to the people of the state. Read more
Maharashtra Public Cloud Policy 2018
To create a US$ 2 billion opportunity for the industry as every single State government department uses datastorage based on physical devices. Read more
Maharashtra State
Innovative and Start-up
Policy 2018
To provide a platform and nurture entrepreneurial aspirations among the citizens of Maharashtra
Empower startups to contribute significantly to Maharashtra's economic growth and create employmentopportunities for all sections of society
To attract Rs 5,000 crore (US$ 715.41 million) investment in the development of incubation and start-ups.Read more
To generate low income housing by making it mandatory for private developers, with residential plot sizes of 4,000square metres and above, to reserve 20 per cent of the land for low income groups
The reserved land or constructed flats would be handed over to the state housing agency, Maharashtra Housingand Area Development Authority (MHADA)
Housing Policy 2013-2018
Read more
Textile Policy of Maharashtra, 2018–23
Encourage setting up of Fiber to Fashion value chain
Generate 10 lakh new employments in the textile sector.Read more
For updated information, please visit www.ibef.orgMAHARASHTRA54
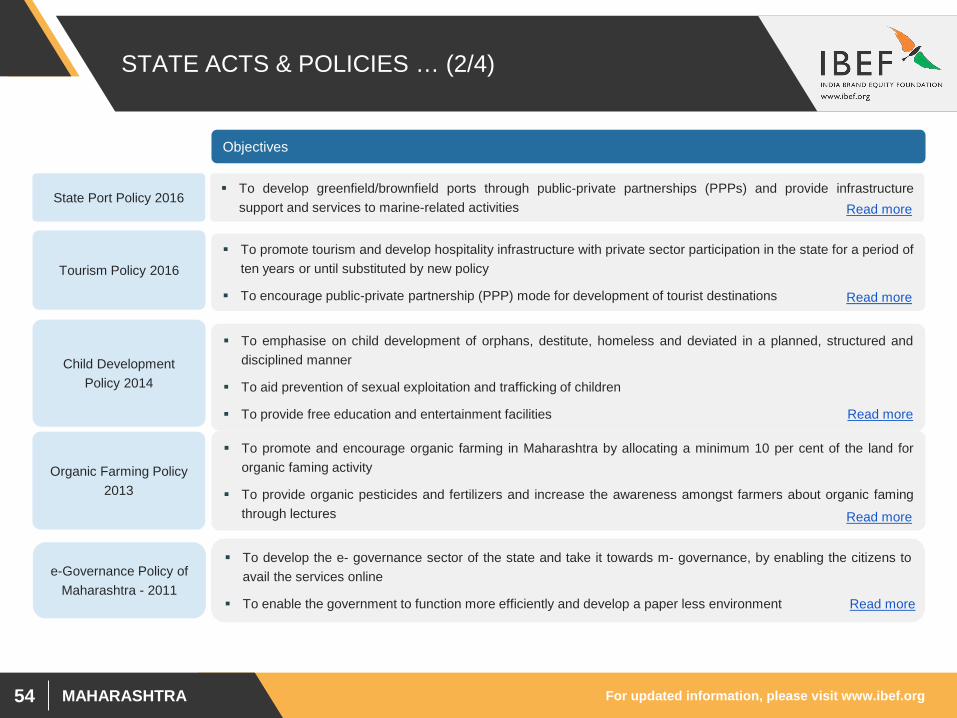
STATE ACTS & POLICIES … (2/4)
Objectives
Organic Farming Policy 2013
To promote and encourage organic farming in Maharashtra by allocating a minimum 10 per cent of the land fororganic faming activity
To provide organic pesticides and fertilizers and increase the awareness amongst farmers about organic famingthrough lectures Read more
To develop the e- governance sector of the state and take it towards m- governance, by enabling the citizens toavail the services online
To enable the government to function more efficiently and develop a paper less environment
e-Governance Policy of Maharashtra - 2011
Read more
To develop greenfield/brownfield ports through public-private partnerships (PPPs) and provide infrastructuresupport and services to marine-related activities
State Port Policy 2016
Tourism Policy 2016 To promote tourism and develop hospitality infrastructure with private sector participation in the state for a period of
ten years or until substituted by new policy
To encourage public-private partnership (PPP) mode for development of tourist destinations Read more
Read more
To emphasise on child development of orphans, destitute, homeless and deviated in a planned, structured anddisciplined manner
To aid prevention of sexual exploitation and trafficking of children
To provide free education and entertainment facilities
Child Development Policy 2014
Read more
For updated information, please visit www.ibef.orgMAHARASHTRA55
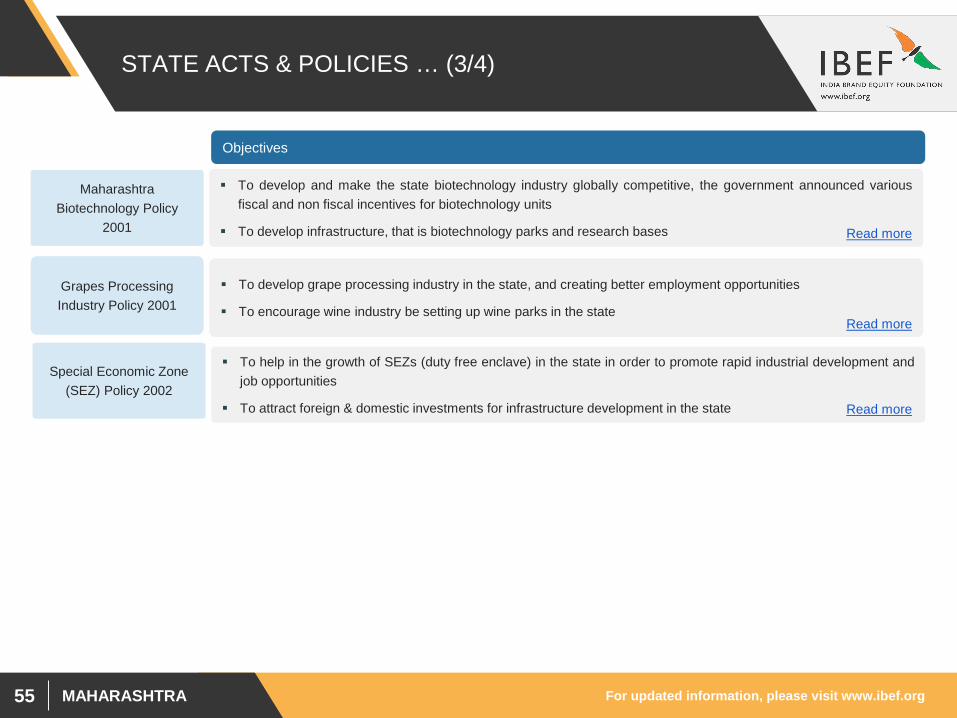
STATE ACTS & POLICIES … (3/4)
Objectives
To help in the growth of SEZs (duty free enclave) in the state in order to promote rapid industrial development andjob opportunities
To attract foreign & domestic investments for infrastructure development in the state
Special Economic Zone (SEZ) Policy 2002
Read more
To develop and make the state biotechnology industry globally competitive, the government announced variousfiscal and non fiscal incentives for biotechnology units
To develop infrastructure, that is biotechnology parks and research bases
Maharashtra Biotechnology Policy
2001
To develop grape processing industry in the state, and creating better employment opportunities
To encourage wine industry be setting up wine parks in the state
Grapes Processing Industry Policy 2001
Read more
Read more
MAHARASHTRA
ANNEXURE
For updated information, please visit www.ibef.orgMAHARASHTRA57
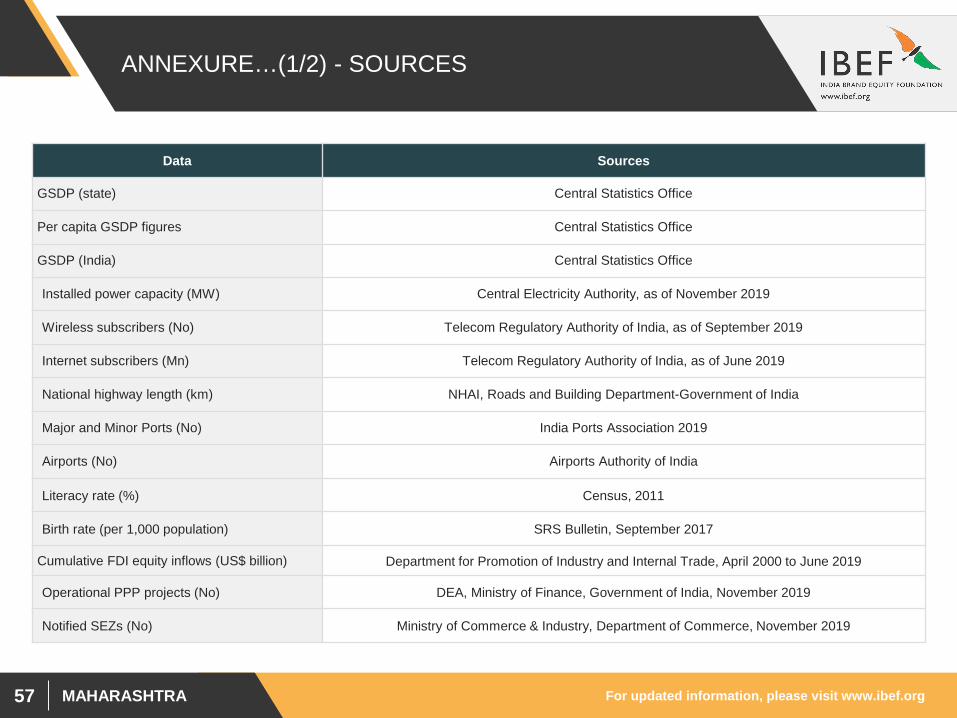
ANNEXURE…(1/2) - SOURCES
Data Sources
GSDP (state) Central Statistics Office
Per capita GSDP figures Central Statistics Office
GSDP (India) Central Statistics Office
Installed power capacity (MW) Central Electricity Authority, as of November 2019
Wireless subscribers (No) Telecom Regulatory Authority of India, as of September 2019
Internet subscribers (Mn) Telecom Regulatory Authority of India, as of June 2019
National highway length (km) NHAI, Roads and Building Department-Government of India
Major and Minor Ports (No) India Ports Association 2019
Airports (No) Airports Authority of India
Literacy rate (%) Census, 2011
Birth rate (per 1,000 population) SRS Bulletin, September 2017
Cumulative FDI equity inflows (US$ billion) Department for Promotion of Industry and Internal Trade, April 2000 to June 2019
Operational PPP projects (No) DEA, Ministry of Finance, Government of India, November 2019
Notified SEZs (No) Ministry of Commerce & Industry, Department of Commerce, November 2019
For updated information, please visit www.ibef.orgMAHARASHTRA58
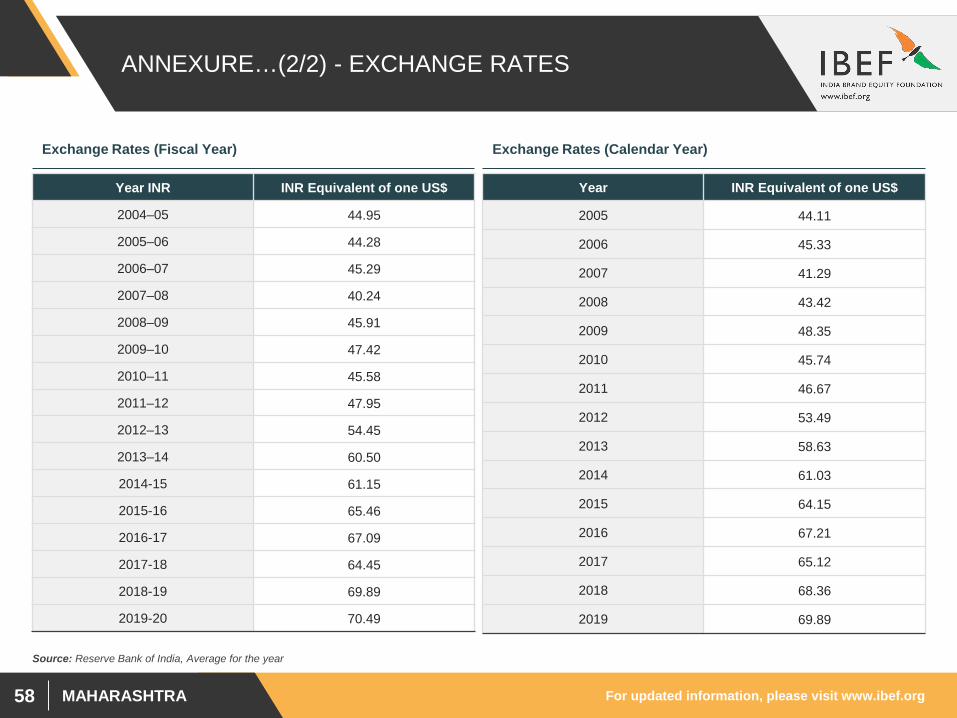
ANNEXURE…(2/2) - EXCHANGE RATES
Exchange Rates (Fiscal Year) Exchange Rates (Calendar Year)
Year INR INR Equivalent of one US$
2004–05 44.95
2005–06 44.28
2006–07 45.29
2007–08 40.24
2008–09 45.91
2009–10 47.42
2010–11 45.58
2011–12 47.95
2012–13 54.45
2013–14 60.50
2014-15 61.15
2015-16 65.46
2016-17 67.09
2017-18 64.45
2018-19 69.89
2019-20 70.49
Year INR Equivalent of one US$
2005 44.11
2006 45.33
2007 41.29
2008 43.42
2009 48.35
2010 45.74
2011 46.67
2012 53.49
2013 58.63
2014 61.03
2015 64.15
2016 67.21
2017 65.12
2018 68.36
2019 69.89
Source: Reserve Bank of India, Average for the year
For updated information, please visit www.ibef.orgMAHARASHTRA59
DISCLAIMER
India Brand Equity Foundation (IBEF) engaged Techsci Research to prepare this presentation and the same has been prepared by TechsciResearch in consultation with IBEF.
All rights reserved. All copyright in this presentation and related works is solely and exclusively owned by IBEF. The same may not be reproduced,wholly or in part in any material form (including photocopying or storing it in any medium by electronic means and whether or not transiently orincidentally to some other use of this presentation), modified or in any manner communicated to any third party except with the written approval ofIBEF.
This presentation is for information purposes only. While due care has been taken during the compilation of this presentation to ensure that theinformation is accurate to the best of Techsci Research and IBEF’s knowledge and belief, the content is not to be construed in any mannerwhatsoever as a substitute for professional advice.
Techsci Research and IBEF neither recommend nor endorse any specific products or services that may have been mentioned in this presentationand nor do they assume any liability or responsibility for the outcome of decisions taken as a result of any reliance placed on this presentation.
Neither Techsci Research nor IBEF shall be liable for any direct or indirect damages that may arise due to any act or omission on the part of the userdue to any reliance placed or guidance taken from any portion of this presentation.